FASTENAL CO
10-Ks and 10-Qs
|
|
|
|
|
|
|
|
|
|
|
|
|
|
|
|
|
|
|
|
|
|
|
|
|
|
|
|
|
|
|
|
|
|
|
|
|
|
|
|
|
|
|
|
|
|
|
|
|
|
|
|
|
|
|
|
UNITED STATES
SECURITIES AND EXCHANGE COMMISSION
WASHINGTON, D.C. 20549
____________________________________________________________
FORM 10-K
(Mark One)
|
x
|
Annual report pursuant to Section 13 or 15(d) of the Securities Exchange Act of 1934
|
|
For the fiscal year ended December 31, 2018
|
|
or
|
o
|
Transition report pursuant to Section 13 or 15(d) of the Securities Exchange Act of 1934
|
|
For the transition period from
to
|
|
Commission file number 0-16125
FASTENAL COMPANY
(Exact name of registrant as specified in its charter)
|
Minnesota
|
41-0948415
|
|
(State or other jurisdiction of
incorporation or organization)
|
(I.R.S. Employer
Identification No.)
|
|
2001 Theurer Boulevard
Winona, Minnesota
|
55987-0978
|
|
(Address of principal executive offices)
|
(Zip Code)
|
(Registrant's telephone number, including area code)
Securities registered pursuant to Section 12(b) of the Act:
|
Title of Each Class
|
Name of Each Exchange on Which Registered
|
|
Common Stock, par value $.01 per share
|
The Nasdaq Stock Market
|
None
____________________________________________________________
Indicate by check mark if the registrant is a well-known seasoned issuer, as defined in Rule 405 of the Securities Act Yes
x
No
o
Indicate by check mark if the registrant is not required to file reports pursuant to Section 13 or Section 15(d) of the Exchange Act Yes
o
No
x
Indicate by check mark whether the registrant: (1) has filed all reports required to be filed by Section 13 or 15(d) of the Securities Exchange Act of 1934 during the preceding 12 months (or for such shorter period that the registrant was required to file such reports), and (2) has been subject to such filing requirements for the past 90 days. Yes
x
No
o
Indicate by check mark whether the registrant has submitted electronically every Interactive Data File required to be submitted pursuant to Rule 405 of Regulation S-T (§ 232.405 of this chapter) during the preceding 12 months (or for such shorter period that the registrant was required to submit such files). Yes
x
No
o
Indicate by check mark if disclosure of delinquent filers pursuant to Item 405 of Regulation S-K is not contained herein, and will not be contained, to the best of the registrant's knowledge, in definitive proxy or information statements incorporated by reference in Part III of this Form 10-K or any amendment to this Form 10-K.
x
Indicate by check mark whether the registrant is a large accelerated filer, an accelerated filer, a non-accelerated filer, a smaller reporting company, or an emerging growth company. See definition of "large accelerated filer", "accelerated filer", "smaller reporting company", and "emerging growth company" in Rule 12b-2 of the Exchange Act.
|
Large Accelerated Filer
|
x
|
Accelerated Filer
|
o
|
|
Non-accelerated Filer
|
o
|
Smaller Reporting Company
|
o
|
|
Emerging Growth Company
|
o
|
||
If an emerging growth company, indicate by check mark if the registrant has elected not to use the extended transition period for complying with any new or revised financial accounting standards provided pursuant to Section 13(a) of the Exchange Act.
o
Indicate by check mark whether the registrant is a shell company (as defined in Rule 12b-2 of the Exchange Act).
Yes
o
No
x
The aggregate market value of the Common Stock held by non-affiliates of the registrant as of June 30,
2018
, the last business day of the registrant's most recently completed second fiscal quarter, was
$13,762,835,828
, based on the closing sale price of the Common Stock on that date. For purposes of determining this number, all executive officers and directors of the registrant as of June 30,
2018
are considered to be affiliates of the registrant. This number is provided only for the purposes of this report on Form 10-K and does not represent an admission by either the registrant or any such person as to the status of such person.
As of
January 18, 2019
, the registrant had
285,931,529
shares of Common Stock issued and outstanding.
FASTENAL COMPANY
ANNUAL REPORT ON FORM 10-K
TABLE OF CONTENTS
|
Page
|
|||
|
Item 1.
|
|||
|
Item 1A.
|
|||
|
Item 1B.
|
|||
|
Item 2.
|
|||
|
Item 3.
|
|||
|
Item 4.
|
|||
|
Item 5.
|
|||
|
Item 6.
|
|||
|
Item 7.
|
|||
|
Item 7A.
|
|||
|
Item 8.
|
|||
|
Item 9.
|
|||
|
Item 9A.
|
|||
|
Item 9B.
|
|||
|
Item 10.
|
|||
|
Item 11.
|
|||
|
Item 12.
|
|||
|
Item 13.
|
|||
|
Item 14.
|
|||
|
Item 15.
|
|||
|
Item 16.
|
|||
DOCUMENTS INCORPORATED BY REFERENCE
Portions of our Proxy Statement for the annual meeting of shareholders to be held Tuesday,
April 23, 2019
('Proxy Statement') are incorporated by reference in Part III. Portions of our
2018
Annual Report to Shareholders are incorporated by reference in Part II.
FORWARD-LOOKING STATEMENTS
Certain statements contained in this Form 10-K, or in other reports of the company and other written and oral statements made from time to time by the company, do not relate strictly to historical or current facts. As such, they are considered 'forward-looking statements' that provide current expectations or forecasts of future events. These forward-looking statements are made pursuant to the safe harbor provisions of the Private Securities Litigation Reform Act of 1995. Such statements can be identified by the use of terminology such as anticipate, believe, should, estimate, expect, intend, may, will, plan, goal, project, hope, trend, target, opportunity, and similar words or expressions, or by references to typical outcomes. Any statement that is not a purely historical fact, including estimates, projections, trends, and the outcome of events that have not yet occurred, is a forward-looking statement. Our forward-looking statements generally relate to our expectations regarding the business environment in which we operate, our projections of future performance, our perceived marketplace opportunities, our strategies, goals, mission and vision, and our expectations related to the impact of tax reform. You should understand that forward-looking statements involve a variety of risks and uncertainties, known and unknown, and may be affected by inaccurate assumptions. Consequently, no forward-looking statement can be guaranteed and actual results may vary materially. Factors that could cause our actual results to differ from those discussed in the forward-looking statements include, but are not limited to, economic downturns, weakness in the manufacturing or commercial construction industries, competitive pressure on selling prices, changes in trade policies or tariffs, changes in our current mix of products, customers, or geographic locations, changes in our average branch size, changes in our purchasing patterns, changes in customer needs, changes in fuel or commodity prices, inclement weather, changes in foreign currency exchange rates, difficulty in adapting our business model to different foreign business environments, failure to accurately predict the market potential of our business strategies, the introduction or expansion of new business strategies, increased competition in industrial vending or Onsite, difficulty in maintaining installation quality as our industrial vending business expands, the leasing to customers of a significant number of additional industrial vending devices, the failure to meet our goals and expectations regarding branch openings, branch closings, or expansion of our industrial vending or Onsite operations, changes in the implementation objectives of our business strategies, difficulty in hiring, relocating, training, or retaining qualified personnel, difficulty in controlling operating expenses, difficulty in collecting receivables or accurately predicting future inventory needs, dramatic changes in sales trends, changes in supplier production lead times, changes in our cash position or our need to make capital expenditures, credit market volatility, changes in tax law or the impact of any such changes on future tax rates, changes in the availability or price of commercial real estate, changes in the nature, price, or availability of distribution, supply chain, or other technology (including software licensed from third parties) and services related to that technology, cyber-security incidents, potential liability and reputational damage that can arise if our products are defective, and other risks and uncertainties detailed in this Form 10-K under the heading 'Item 1A. Risk Factors'. Each forward-looking statement speaks only as of the date on which such statement is made, and we undertake no obligation to update any such statement to reflect events or circumstances arising after such date.
1
PRESENTATION OF DOLLAR AMOUNTS
All dollar amounts in this Form 10-K are presented in millions, except for share and per share amounts or where otherwise noted. Throughout this document, percentage and dollar change calculations, which are based on non-rounded dollar values, may not be able to be recalculated using the dollar values in this document due to the rounding of those dollar values.
STOCK SPLIT
All information contained in this Form 10-K reflects the two-for-one stock split in 2011.
2
PART I
|
ITEM 1.
|
BUSINESS
|
Note – Information in this section is as of year end unless otherwise noted. The year end is December 31,
2018
unless additional years are included or noted.
Overview
Fastenal Company (together with our subsidiaries, hereinafter referred to as 'Fastenal' or the company or by terms such as we, our, or us) began as a partnership in 1967, and was incorporated under the laws of Minnesota in 1968. We opened our first branch in 1967 in Winona, Minnesota, a city with a population today of approximately 27,000. We began with a marketing strategy of supplying threaded fasteners to customers in small, medium-sized, and, in subsequent years, large cities. Over time, that mandate has expanded to a broader range of industrial and construction supplies spanning more than nine major product lines (described later in this document). The large majority of our transactions are business-to-business, though we also have some walk-in retail business. At the end of 2018, we had
3,121
in-market locations (defined in the table below) in 26 countries supported by 14 distribution centers in North America (11 in the United States, two in Canada, and one in Mexico), and we employed
21,644
people. We believe our success can be attributed to the high quality of our employees and their convenient proximity to our customers, and our ability to offer customers a full range of products and services to reduce their total cost of procurement.
The following table shows our consolidated net sales for each fiscal year as well as the number of public branches, Onsite locations, and total in-market locations at the end of each of the last ten years:
|
2018
|
2017
|
2016
|
2015
|
2014
|
2013
|
2012
|
2011
|
2010
|
2009
|
||||||||||||
|
Net sales
|
$
|
4,965.1
|
|
4,390.5
|
|
3,962.0
|
|
3,869.2
|
|
3,733.5
|
|
3,326.1
|
|
3,133.6
|
|
2,766.9
|
|
2,269.5
|
|
1,930.3
|
|
|
Public branches
|
2,227
|
|
2,383
|
|
2,503
|
|
2,622
|
|
2,637
|
|
2,687
|
|
2,652
|
|
2,585
|
|
2,490
|
|
2,369
|
|
|
|
Onsite locations
(1)
|
894
|
|
605
|
|
401
|
|
264
|
|
214
|
|
|||||||||||
|
Total in-market locations
(2)
|
3,121
|
|
2,988
|
|
2,904
|
|
2,886
|
|
2,851
|
|
2,687
|
|
2,652
|
|
2,585
|
|
2,490
|
|
2,369
|
|
|
(1)
Onsite location information prior to 2014 is intentionally omitted. While such locations have existed since 1992, we did not specifically track their number until we identified our Onsite program as a growth driver in 2014.
(2)
'In-market locations' is defined as the sum of the total number of public branches and the total number of Onsite locations.
One of Fastenal's guiding principles since inception is that we can improve our service by getting closer to the customer. Through much of our history, this was achieved by opening branches, and today we believe there are few companies that offer our North American branch coverage. In 2018, roughly 54% of our sales and 52% of our branches were in major Metropolitan Statistical Areas ('MSAs'; populations greater than 500,000 people), while 19% of our sales and 16% of our branches were in small MSAs (populations under 500,000 people), and 27% of our sales and 32% of our branches were not in a MSA. In our view, this has proved to be an efficient means of providing customers with a broad range of products and services on a timely basis. These branches have represented, and continue to represent, the foundation of our service approach. However, we are constantly evaluating the efficacy of our branch network, and in recent years, we have developed additional models that get us still closer to the customer, including vending, bin stocks, and Onsite locations.
We currently have several versions of selling locations: (1) a 'traditional (or public) branch' services a wide variety of customers and stocks a wide selection of products we offer, (2) an 'overseas branch' focuses on manufacturing customers and our fastener product line and is the format we typically deploy outside the United States and Canada, (3) a 'strategic account branch' is a unique location that sells to multiple large accounts in a market, (4) a 'strategic account site' is similar to a strategic account branch, but typically operates out of an existing branch rather than from a unique location, and (5) an 'Onsite location' provides dedicated sales and service from within, or in close proximity to, the customer's facility.
Traditional, overseas, and strategic account branches sell to multiple customers, and together comprise our total branch count. Our strategic account sites are considered an extension of the branch from which it operates, and are not included separately in our total branch counts. Onsite locations, which serve a single customer, are similarly not included in our total branch counts. However, outside of the fact that they serve a single customer, we believe the function and operation of an Onsite location is similar to that of a branch. This model also represents a meaningful portion of the company's total revenue, and we expect that share to grow materially over time. As a result, we refer to our network in terms of in-market locations, which includes our total branches and Onsite locations, and we refer to strategic account sites as non-in-market locations.
Branch locations
are selected primarily based on their proximity to our distribution network, population statistics, and employment data for manufacturing and non-residential construction companies. We stock all branches with inventory drawn from all of our product lines, and over time, where appropriate, our district and branch personnel may tailor the inventory
3
offering to the needs of the local customer base. Since Fastenal's founding and through 2013, branch openings were a primary growth driver for the company, and we experienced net openings each year over that time span. We have long maintained that marketplace demographics could support a North American network of 3,500 traditional branches. However, since establishing this figure, new growth drivers and business models (Onsite, vending, digital solutions) have emerged and diminished the direct role of traditional branch openings in our growth. It is now unlikely that we will operate the total traditional branch locations we previously believed would be the potential of North America. We will continue to open traditional branches as the company sees fit. However, in each year since 2013, the company has experienced a net decline in its total branch count including net declines of 156 branches in 2018, 120 branches in 2017, and 119 branches in 2016.
We first went international when we opened a branch in Canada in 1994. Since then, we have continued to expand our global footprint and at the end of 2018, we operated in 25 countries outside of the United States. Canada and Mexico are the largest of these, representing approximately 11% of total sales collectively, and we also operate in Europe, Asia, Southeast Asia, and Central and South America. This remaining international business is approximately 3% of total sales. Our go-to-market strategy in countries outside of North America, focuses primarily on servicing large, national account customers. From a product perspective, these customers are more heavily oriented toward planned fastener spend. Though in recent years the international business has been growing faster than the U.S. business, we are not as well recognized in many of our foreign locations as we are in the U.S. and, to a lesser extent, Canada. However, our ability to provide a consistent service model, including vending, bin stocks, and Onsites, on a global basis is attractive to our foreign customer base, much of which are the foreign operations of U.S.-based companies. Our international subsidiaries now have over 450 in-market locations, including over 150 Onsite locations, have over 9,600 vending devices installed, and employ over 3,300 people from around the world.
The following table provides a summary of the traditional, overseas, and strategic account branch locations we operated at the end of each year, as well as the openings, closings, and conversions during each year:
|
North America
|
Outside North America
|
||||||||||||||||||||||
|
United States
|
Canada
|
Mexico
|
Puerto Rico and Dominican Republic
|
Subtotal
|
Central & South America
(1) |
Asia
(2) |
Southeast Asia
(3) |
Europe
(4) |
Africa
(5) |
Total
|
|||||||||||||
|
Total as of
December 31, 2016
|
2,194
|
|
198
|
|
52
|
|
8
|
|
2,452
|
|
8
|
|
10
|
|
7
|
|
24
|
|
2
|
|
2,503
|
|
|
|
Opened branches
|
5
|
|
3
|
|
2
|
|
—
|
|
10
|
|
1
|
|
—
|
|
—
|
|
7
|
|
—
|
|
18
|
|
|
|
Closed branches
|
(118
|
)
|
(6
|
)
|
(1
|
)
|
—
|
|
(125
|
)
|
(2
|
)
|
(2
|
)
|
—
|
|
(1
|
)
|
—
|
|
(130
|
)
|
|
|
Converted branches
(6)
|
(5
|
)
|
—
|
|
—
|
|
—
|
|
(5
|
)
|
(1
|
)
|
(1
|
)
|
—
|
|
(1
|
)
|
—
|
|
(8
|
)
|
|
|
Total as of
December 31, 2017
|
2,076
|
|
195
|
|
53
|
|
8
|
|
2,332
|
|
6
|
|
7
|
|
7
|
|
29
|
|
2
|
|
2,383
|
|
|
|
Opened branches
|
2
|
|
1
|
|
—
|
|
—
|
|
3
|
|
—
|
|
—
|
|
—
|
|
8
|
|
—
|
|
11
|
|
|
|
Closed branches
|
(145
|
)
|
(10
|
)
|
—
|
|
—
|
|
(155
|
)
|
—
|
|
—
|
|
—
|
|
—
|
|
(2
|
)
|
(157
|
)
|
|
|
Converted branches
(6)
|
(9
|
)
|
—
|
|
(1
|
)
|
—
|
|
(10
|
)
|
—
|
|
—
|
|
—
|
|
—
|
|
—
|
|
(10
|
)
|
|
|
Total as of
December 31, 2018
|
1,924
|
|
186
|
|
52
|
|
8
|
|
2,170
|
|
6
|
|
7
|
|
7
|
|
37
|
|
—
|
|
2,227
|
|
|
(1)
Panama, Brazil, Colombia, and Chile
(2)
China
(3)
Singapore, Malaysia, and Thailand
(4)
The Netherlands, Hungary, United Kingdom, Germany, Czech Republic, Italy, Romania, Sweden, Poland, Austria, Ireland, Spain, and France
(5)
South Africa
(6)
Converted locations are sites converted from traditional branches to Onsite locations or non-in-market locations, net of sites converted from non-in-market locations or Onsite locations to traditional branches.
Onsite
locations
may influence the trend in total branch count over time. The Onsite concept is not new, in that we entered into the first such arrangement in 1992. However, we identified it as a growth driver in 2014 and have made substantial investments toward accelerating its traction in the marketplace since 2015. In this model, we service a customer from a location that is physically within the customer's facility (or, in some cases, at a strategically placed off-site location), with inventory that is specific to the customer's needs. In many cases, we are shifting revenue with the customer from an existing branch. The model is best suited to larger companies, though we believe we can provide a higher degree of service at a lower level of revenue than most of our competitors. It has been our experience that gross profit percentages at Onsite locations tend to be lower than at branches, but we gain significant revenue with the customer and our cost to serve is materially lower. We have identified over 15,000 customer locations with potential to implement the Onsite service model. These include customers with which we have
4
an existing national account relationship today, as well as potential customers we are aware of due to our local market presence. We expect revenues from Onsite arrangements to increase meaningfully over time. We experienced net increases of 289, 204, and 137 Onsite locations in 2018, 2017, and 2016, respectively. We had 894 Onsite locations as of December 31, 2018, and anticipate signing 375 to 400 new Onsite locations in 2019.
The following table provides a summary of the new Onsite customer locations signed and the total Onsite locations we operated at the end of each year, as well as the Onsite openings and closings during each year:
|
New Onsite Customer Locations Signed
|
Total Active Onsite Locations
|
|||
|
Total as of December 31, 2016
|
176
|
|
401
|
|
|
Opened Onsite locations
|
218
|
|
||
|
Closed Onsite locations
|
(14
|
)
|
||
|
Total as of December 31, 2017
|
270
|
|
605
|
|
|
Opened Onsite locations
|
318
|
|
||
|
Closed Onsite locations
|
(29
|
)
|
||
|
Total as of December 31, 2018
|
336
|
|
894
|
|
In 1995, we developed a
national accounts
program aimed at making our products and services more competitive with customers that operate multiple facilities. These customers tend to have more complex supply chains and structures for managing the original equipment manufacturing (OEM) and maintenance, repair, and operations (MRO) products we provide while at the same time, by virtue of their size and opportunity, have more negotiating power. We believe our local presence as part of a national, and increasingly international, footprint, our ability to provide a consistent level of high-touch service and broad product availability, and our ancillary capabilities around manufacturing, quality control, and product knowledge, are attractive to these larger customers. We believe our advantage with these customers has only been strengthened as we have added other channels, such as industrial vending, Onsite, Fastenal Managed Inventory ('FMI
®
'), digital solutions, and resources to serve these customers' unique demands. As a result, in 2018, national accounts represented 51.2% of our net sales, compared to 48.7% and 47.4% in 2017 and 2016, respectively. We believe we will continue to perform well with these customers.
We introduced
industrial vending
in 2008. Vending provides our customers the benefits of reduced consumption, reduced purchase orders, reduced product handling, and 24-hour product availability, and we believe our company has a market advantage by virtue of our extensive in-market network. For these reasons, the initiative began to gain significant traction in 2011 and we finished 2018 with over 96,000 devices in the field (81,000 generating product revenue and 15,000 in a locker lease program). Our discussion generally focuses on the 81,000 product revenue devices. We believe vending has proven its effectiveness in strengthening our relationships with customers and helped to streamline the supply chain where it has been utilized. We also believe there remains considerable room to grow our current installed base before it begins to approach the number of units we believe the market can support. We estimate the market could support as many as 1.7 million industrial vending devices, and as a result we anticipate continued growth in installed devices over time. We anticipate signing 23,000 to 25,000 new devices in 2019.
Our industrial vending portfolio consists of 23 different vending devices, with 15 of these being in either a helix or locker format. Our most utilized models include the helix-based FAST 5000, which is approximately 40% of our installed base of devices, and our 12- and 18-door lockers, which combined are approximately 35% of our installed base of devices. The lockers are available in multiple configurations and the helix format is configurable to accommodate the various sizes and forms of products that will be dispensed to match the unique needs of our customer. Target monthly revenues per device typically range from under $1,000 to in excess of $3,000, depending on the type of device and products dispensed. The following two tables provide two views of our data: (1) actual device count regardless of the type of device and (2) 'machine equivalent' count based on the weighted target monthly revenue of each device (compared to the FAST 5000 device, which has a $2,000 monthly revenue target). For example, the 12-door locker, with target monthly revenue of $750, would be counted as '0.375 machine equivalent' (0.375 = $750/$2,000).
5
The industrial vending (product revenue devices) information related to contracts signed during each period was as follows:
|
Q1
|
Q2
|
Q3
|
Q4
|
Annual
|
||||||||||||
|
Device count signed during the period
|
2018
|
5,679
|
|
5,537
|
|
5,877
|
|
4,980
|
|
22,073
|
|
|||||
|
2017
|
5,437
|
|
4,881
|
|
4,771
|
|
4,266
|
|
19,355
|
|
||||||
|
2016
|
4,647
|
|
4,869
|
|
4,783
|
|
3,760
|
|
18,059
|
|
||||||
|
'Machine equivalent' count signed during the period
|
2018
|
5,271
|
|
5,250
|
|
5,251
|
|
4,610
|
|
20,382
|
|
|||||
|
2017
|
4,476
|
|
4,032
|
|
4,010
|
|
3,640
|
|
16,158
|
|
||||||
|
2016
|
3,696
|
|
3,941
|
|
3,520
|
|
2,951
|
|
14,108
|
|
||||||
The industrial vending (product revenue devices) information related to installed devices at the end of each period was as follows:
|
Q1
|
Q2
|
Q3
|
Q4
|
||||||||||||
|
Device count installed at the end of the period
|
2018
|
73,561
|
|
76,069
|
|
78,706
|
|
81,137
|
|
||||||
|
2017
|
64,430
|
|
66,577
|
|
69,058
|
|
71,421
|
|
|||||||
|
2016
|
56,889
|
|
58,346
|
|
60,400
|
|
62,822
|
|
|||||||
|
'Machine equivalent' count installed at the end of the period
|
2018
|
58,571
|
|
61,405
|
|
64,205
|
|
66,784
|
|
||||||
|
|
2017
|
49,921
|
|
51,950
|
|
54,215
|
|
56,436
|
|
||||||
|
2016
|
43,329
|
|
44,707
|
|
46,399
|
|
48,399
|
|
|||||||
In addition to industrial vending noted above, which primarily relates to our non-fastener business, we also provide
Fastenal Managed Inventory ('FMI')
programs, (also known as 'keep fill' or 'bin stock' programs in the industry) to numerous customers. This business relates to both our maintenance customers (MRO fasteners and non-fasteners) and original equipment manufacturers (OEM fasteners). FMI is like our industrial vending business in that it involves moving product closer to the point of customer use within their facilities. However, the device is typically an open bin which is clustered with other bins in a racking system, each of which holds OEM fasteners, MRO fasteners, and/or non-fastener products that are consumed in the customer's operations. These bins utilize a variety of technologies. For instance, some bins are set up with the latest scanning technologies to determine when product is at a minimum desired level and requires refill, while others utilize scales to measure the volume of a bin's content by its weight. We believe our fully integrated distribution network allows us to manage the supply chain for all sizes of customers. FMI programs tend to generate a higher frequency of business transactions and, coupled with our fully integrated distribution network that allows us to manage these programs for all sizes of customers, foster a strong relationship with customers, as we are often their preferred supplier.
We also invest in
digital solutions
that aim to deliver strategic value for our customers, leverage local inventory for same-day solutions, and provide efficient service. These solutions take many forms. For instance, the above noted technologies (vending and FMI), provide locational data that we can utilize to provide strategic value to our customers. An example of this is FAST 360, which surfaces data around our managed services, providing our customers with one central source of information as we manage their OEM and MRO products. We also provide eProcurement Solutions (Electronic Data Interface, or 'EDI' and 'punchouts'). These provide system-to-system exchange of documents (such as purchase orders, advance shipping notices, and invoices for direct and indirect spend) through a direct integration into our customer's Enterprise Resource Planning (ERP) systems or through a third party procurement network or marketplace. This creates an efficient, accurate, and streamlined procure-to-pay process. We also have an e-commerce offering that allows us to provide same-day solutions for online orders. We believe our integrated physical and virtual model, when paired with our national (and increasingly international) scope, represents a unique capability in industrial distribution when compared to e-commerce as an independent sales channel. One of our web solutions, Fastenal EXPRESS, guides our customers to products that are locally stocked, capitalizing on our existing location footprint, in order to provide same-day service for online orders. This positions us to outperform what is more typically a 24 to 48 hour fulfillment expectation for MRO and unplanned transactions. We expect to continue to build out and develop our digital solutions over time.
We believe our current growth drivers – Onsite locations, national accounts, industrial vending, FMI, and digital solutions – represent alternative means to address the requirements of certain customer groups. They get us closer to the customer and to where the product is actually consumed. This is consistent with our strategy and offers significant value by providing differentiated and 'sticky' service. Combined with ongoing strategic investments in end market initiatives (such as our Customer Service Project ('CSP') initiatives which expand inventory placement at our branches to enhance same-day capabilities) as well
6
as selling (in-market and otherwise) and non-selling (engineering, product specialists, manufacturing, etc.) employees, we offer a range of capabilities that is difficult for large and small competitors to replicate.
We remain committed to a large, robust service network, including traditional branches; it remains the indispensable foundation of our business. In any given year, it is difficult to predict whether our total branch count will rise or fall. However, with the growth we anticipate in Onsite locations, we believe our total in-market locations will increase over time.
It has been our experience that our profitability is affected by the average revenue produced by each branch. While certain costs related to growth at a branch are at least partly variable, such as employee-related expenses, others, like rent and utility costs, tend to be fixed. As a result, it has been shown that as a branch increases its sales base over time it typically will achieve a higher operating profit margin. This ability to increase our average revenue per branch is influenced by: (1) general growth based on end market expansion and/or market share gains, (2) the age of the branch base (new branches tend to be less profitable due to start-up costs and the time necessary to generate a customer base; however, when these new branches mature and increase their sales base, their profitability similarly increases), and (3) rationalization actions – in the past several years the company has seen a net decline in its branch base. There are many reasons why local or regional management might decide to close a branch. Key customers may have migrated to a different part of the market or transitioned to our Onsite model, factories may have closed, or our own supply chain capabilities in a market may have evolved to allow us to service some areas with fewer traditional branches. In the short term, the Onsite program can hurt the profitability of our existing branch network as it can pull established revenue away from an existing branch.
We operate 11 regional distribution centers in the United States – Minnesota, Indiana, Ohio, Pennsylvania, Texas, Georgia, Washington, California, Utah, North Carolina, and Kansas – and three outside the United States – Ontario, Canada; Alberta, Canada; and Nuevo Leon, Mexico. These 14 distribution centers give us approximately 3.9 million square feet of distribution capacity. These distribution centers are located so as to permit deliveries of two to five times per week to our in-market locations using our trucks and overnight delivery by surface common carrier, with approximately 84% of our North American in-market locations receiving service four to five times per week. The distribution center in Indiana also serves as a 'master' hub, with those in California, North Carolina, and Kansas serving as 'secondary' hubs to support the needs of the in-market locations in their geographic regions as well as provide a broader selection of products for the in-market locations serviced by the other distribution centers.
We currently operate our Minnesota, Indiana, Ohio, Pennsylvania, Texas, Georgia, California, North Carolina, Kansas, and Ontario, Canada distribution centers with automated storage and retrieval systems (ASRS). These ten distribution centers operate with greater speed and efficiency, and currently handle approximately 94% of our picking activity. The Indiana facility also contains our centralized replenishment facility for a portion of our industrial vending business. This operation is also highly automated. Construction of a new distribution center in Washington, which will include ASRS technology, began in 2018, and we expect this project to be completed in the fourth quarter of 2019. Construction of a new distribution center in Mississippi also began in 2018, and we expect this project to be completed in the third quarter of 2019. We would expect to add and/or expand new distribution centers over time as our scale and the number of our in-market locations increases.
Our information systems department develops, implements, and maintains the computer based technology used to support business functions within Fastenal. Corporate, digital, distribution center, and vending systems are primarily supported from central locations, while each selling location uses a locally installed Point-Of-Sale (POS) system. The systems consist of both customized, purchased, and licensed software. A dedicated Wide Area Network (WAN) is used to provide connectivity between systems and authorized users.
Trademarks and Service Marks
We conduct business under various trademarks and service marks, and we utilize a variety of designs and tag lines in connection with each of these marks, including
Growth Through Customer Service
®
.
Although we do not believe our operations are substantially dependent upon any of our trademarks or service marks, we consider the 'Fastenal' name and our other trademarks and service marks to be valuable to our business.
Products
Fastenal was founded as a distributor of fasteners and related industrial and construction supplies. This includes threaded fasteners, which represent approximately 84% of total fastener sales and includes bolts, nuts, screws, studs, and related washers, as well as miscellaneous supplies and hardware, such as pins, machinery keys, concrete anchors, metal framing systems, wire rope, strut, rivets, and related accessories. Our fastener product line, which is primarily sold under the Fastenal product name, represented 34.9%, 35.6%, and 36.6% of our consolidated net sales in 2018, 2017, and 2016, respectively. Of this, threaded fasteners represented approximately 29%, 30%, and 33% of our consolidated net sales in 2018, 2017, and 2016, respectively.
Fastener distribution is complex. In most cases, the product has low per unit value but high per unit weight. This presents challenges in moving product from suppliers, most of whom are outside of North America, to our distribution centers, as well
7
as from our distribution centers to our branch, Onsite, and customer locations. At the same time, fasteners are ubiquitous in manufactured products, construction projects, and maintenance and repair while at the same time exhibiting great geometric variability based on use and application. In many cases, a fastener is a critical part in machine uptime and/or effective use. These features have greatly influenced our logistical development, training and educational programs, support capabilities, and inventory decisions, which we believe would be difficult for competitors to replicate.
In 1993, we began to aggressively add additional product lines, and these represented 65.1%, 64.4%, and 63.4% of our consolidated sales in 2018, 2017, and 2016, respectively. These products, which we refer to as non-fastener product lines, tend to move through the same distribution channel, get used by the same customers, and utilize the same logistical capabilities as the original fastener product line. This logic is as true today as it was when we first began to diversify our product offering. However, over time, the supply chain for these product lines has evolved in ways independent of the fastener line. For instance, non-fastener product lines benefit disproportionately from our development of industrial vending.
The most significant category of non-fastener products is our safety supplies product line, which accounted for 17.2%, 16.3%, and 16.0% of our consolidated sales in 2018, 2017, and 2016, respectively. This product line has enjoyed dramatic sales growth in the last ten years (nearly tripling as a percentage of sales over that ten-year time frame). This is directly related to our success in industrial vending. Our tools product line now accounts for 10% of consolidated net sales, representing 10.0%, 10.1%, and 9.9% in 2018, 2017, and 2016, respectively. Also, in the last several years we added 'private label' brands (often referred to as 'Fastenal brands') to our offering, and these represented approximately 13%, 12%, and 12% of our consolidated net sales in 2018, 2017, and 2016, respectively.
We plan to continue to add other product lines in the future.
Detailed information about our sales by product line is provided in Note 2 of the Notes to Consolidated Financial Statements included later in this Form 10-K. Each product line may contain multiple product categories.
Inventory Control
Our inventory stocking levels are determined using our computer systems, by our sales personnel at in-market locations, by our district and regional leadership, and by our product managers. The data used for this determination is derived from sales activity from all of our selling locations, from individual selling locations, and from different geographic areas. It is also derived from supplier information and from customer demographic information. The computer system monitors the inventory level for all stock items and triggers replenishment, or prompts a buyer to purchase, as necessary, based on an established minimum-maximum level. All branches stock a base inventory and may expand beyond preset inventory levels as deemed appropriate by the district and branch personnel. Non-branch selling locations (primarily Onsites) stock inventory based on customer-specific arrangements. Inventories in distribution centers are established from computerized data for the selling locations served by the respective distribution center. Inventory quantities are continuously re-balanced utilizing an automated transfer mechanism we call 'inventory re-distribution'.
Inventory held at our selling locations, close to customers and available on a same-day basis, accounted for approximately 61%, 65%, and 64% of our total inventory at the end of 2018, 2017, and 2016, respectively. Inventory held at our distribution centers and manufacturing locations accounted for approximately 39%, 35%, and 36% of our total inventory at the end of 2018, 2017, and 2016, respectively. The distribution center and manufacturing location inventory, when combined with our trucking network, allows for fast, next-day service at a very competitive cost.
Manufacturing and Support Services Operations
In
2018
, approximately 96% of our consolidated net sales were attributable to products manufactured by other companies to industry standards or to customer specific requirements. The remaining 4% related to products manufactured, modified or repaired by our manufacturing businesses or our support services. The manufactured products consist primarily of non-standard sizes of threaded fasteners made to customers' specifications or standard sizes manufactured under our Holo-Krome
®
and Cardinal Fasteners
®
product lines. The services provided by the support services group include, but are not limited to, the repair of tools and hoists, the fabrication of chain sling and hose, band saw blade welding, and other light manufacturing and fabrication. We may add additional services in the future. However, we engage in these activities primarily as a service to our customers and expect them to continue to contribute in the range of 4% to 6% of our consolidated net sales in the future.
Sources of Supply
We use a large number of suppliers for the standard stock items we distribute. Most items distributed by our network can be purchased from several sources, although preferred sourcing is used for some stock items to facilitate quality control. No single supplier accounted for more than 5% of our inventory purchases in
2018
.
8
Beyond inventory, we have some concentration of purchasing activity. For example, we utilize a limited number of suppliers for distribution equipment, two main suppliers for our vehicle fleet, and primarily one supplier for our industrial vending equipment. However, we believe there are viable alternatives to each of these, if necessary.
Customers and Marketing
We believe our success can be attributed to our ability to offer customers a full line of quality products, our convenient locations and diverse methods of providing those products, and the superior service orientation and expertise of our employees. Most of our customers are in the manufacturing and non-residential construction markets. The manufacturing market includes both OEM and MRO customers. The non-residential construction market includes general, electrical, plumbing, sheet metal, and road contractors. Other users of our products include farmers, truckers, railroads, oil exploration, production, and refinement companies, mining companies, federal, state, and local governmental entities, schools, and certain retail trades.
During the fourth quarter of
2018
, our total number of active customer accounts (defined as accounts having purchase activity totaling at least $100 within the last 90 days) was approximately 256,000, while our total 'core accounts' (defined as the average number of accounts with purchase activity of at least $500 per month within the last 90 days) was approximately 80,000. In 2018, we changed our definitions of active customer accounts and 'core accounts' and the figures below are the comparable figures in 2017, which reflects those changes. In 2017, an active account was defined as having spend in the preceding 90 days of $1 (versus the new $100) while 'core accounts' was defined as the average number of accounts with spend in the preceding 90 days of $250 (versus the new $500). Applying the same definitions to 2017 as we now apply to 2018, our active customer accounts would have been 263,000 and our 'core accounts' would have been 77,000 during the fourth quarter of 2017. In addition to providing information externally about the size of our customer base, the concepts of active customer accounts and core accounts are used internally to understand customer size and potential. As our business generally has gotten larger and national accounts have grown in the mix, our historical definitions of these customers has become less informative. The changes in definition were intended to realign our customer base into size categories that more closely align with the profile of our company today. In
2018
, no one customer accounted for more than 5% of our sales.
Based on our customer profile being oriented toward manufacturing and non-residential construction, our business has historically been cyclical. However, we believe our model has certain protections that moderate the volatility of our results around cyclical changes. First, we have a large number of customers that serve a wide range of segments within the broader manufacturing and non-residential construction market, although slumps in one industry served by us can rapidly spread to other, interrelated industries, locally or globally. However, we still believe this customer and market segment diversity provides some insulation from economic changes that are not across multiple industries and geographic regions. In addition, a meaningful part of our revenue is derived from products that are incorporated into final products. However, we also have a significant portion of revenue that is derived from products used to maintain facilities, and while this revenue tends to be directly influenced by cyclical changes, its rate of change tends to be less dramatic.
Direct marketing continues to be the backbone of our business through our local in-market selling personnel, as well as our non-branch selling personnel. We support our sales team with multi-channel marketing including direct mail and digital marketing, print and radio advertising, catalogs, promotional flyers, events, and branch signage. In recent years, our national advertising has been focused on a NASCAR
®
sponsorship through our partnership with Roush Fenway Racing
®
as the primary sponsor of Ricky Stenhouse Jr.'s No. 17 car in the Monster Energy
®
NASCAR
®
Cup Series.
Seasonality
Seasonality has some impact on our sales. The first and fourth quarters are typically our lowest volume periods, given their overlap with winter months in North America during which our sales to customers in the non-residential construction market typically slow due to inclement weather. The fourth quarter also tends to be more greatly affected by the Thanksgiving (October in Canada and November in the United States), Christmas, and New Year holiday periods, due to plant shut downs. In contrast, the second and third quarters typically have higher revenues due to stronger non-residential construction activity and relatively fewer holidays (although Good Friday will sometimes fall in the second quarter and the 4th of July will always fall in the second quarter).
Competition
Our business is highly competitive, and includes large competitors located primarily in large cities and smaller distributors located in many of the same smaller markets in which we have branches. We believe the principal competitive factors affecting the markets for our products, in no particular order, are customer service, price, convenience, product availability, and cost saving solutions.
Market strategies in industrial distribution are varied. Where products are concerned, while many larger distributors have trended toward a broad-line offering over time, they are often still closely associated with a specific product that can influence their ability to capture market share. This association with a specific product line is often even more pronounced among smaller competitors, though many smaller competitors do deploy a broad-line model. Means of serving the customer are even more
9
diverse. For instance, many competitors maintain a local, branch-based presence in their markets, while others use vans to sell products in markets away from their main warehouses, while still others rely on catalogs or telemarketing sales. Recent years have seen the emergence of e-commerce solutions, such as websites, and while this channel has been embraced by many traditional distributors it also has introduced non-traditional, web-based competitors into the marketplace. The diversity of product and service models supported in the marketplace is a reflection of the equally diverse product and service needs of the customer base. The large majority of our customers utilize multiple channels, from a single distributor where they are offered or from a range of distributors, to procure the products they need in their operations.
We believe that better service, and a competitive selling advantage, can be provided by maintaining a physical presence closer to the customer's location(s). As a result, we maintain branches in small, medium, and large markets, each offering a wide variety of products. The convenience of a large number of branches in a given area, combined with our ability to provide frequent deliveries to such branches from centrally located distribution centers, facilitates the prompt and efficient distribution of products. We also believe our industrial vending and bin stock solutions, supported from an in-market (branch or Onsite) location, provides a unique way to provide our customers convenient access to products and cost saving solutions using a business model not easily replicated by our competitors. Having trained personnel at each in-market location also enhances our ability to compete (see 'Employees' below).
Our Onsite service model provides us with a strategic advantage with our larger customers. Building on our core business strategy of the local branch, the Onsite model provides value to our customers through customized service while giving us a competitive advantage through stronger relationships with those customers, all with a relatively low investment given the existing branch and distribution structure.
Employees
At the end of 2018, we employed 21,644 full and part-time employees. Of these, approximately 73% held an in-market or non-branch selling role. We characterize these personnel as follows:
|
2018
|
2017
|
|||
|
In-market locations
|
14,015
|
|
13,424
|
|
|
Non-branch selling
|
1,772
|
|
1,711
|
|
|
Selling subtotal
|
15,787
|
|
15,135
|
|
|
Distribution
|
3,830
|
|
3,575
|
|
|
Manufacturing
|
736
|
|
652
|
|
|
Administrative
|
1,291
|
|
1,203
|
|
|
Non-selling subtotal
|
5,857
|
|
5,430
|
|
|
Total
|
21,644
|
|
20,565
|
|
Note – In materials released on January 17, 2019 related to our fourth quarter and full year 2018 earnings results, we undercounted our total employees by 25. We corrected this in the table above, and throughout this document, and as a result some of the figures will not match the comparable figures in our previously published fourth quarter and full year 2018 earnings results.
We believe the quality of our employees is critical to our ability to compete successfully in the markets we currently serve and to our ability to develop new markets and customer relationships. We foster the growth and education of skilled employees throughout the organization by operating training programs and by decentralizing decision-making. Wherever possible, our goal is to 'promote from within'. For example, most new branch and Onsite managers are promoted from an outside sales position and district managers (who supervise a number of in-market locations) are usually former branch managers.
The Fastenal School of Business (our internal corporate university program, known as FSB) develops and delivers a comprehensive array of industry and company-specific training and development programs that are offered to our employees. The programs are offered through a combination of both classroom training and online learning. FSB provides core curricula focused on key competencies determined to be critical to the success of our employees' performance. In addition, we provide specialized educational tracks within various institutes of learning. These institutes of learning are advanced levels that provide specific concentrations of education and development and have been designed to focus on critical aspects of our business, such as leadership, effective branch best practices, sales and marketing, product education, and distribution.
Our selling personnel are compensated with a base salary and an incentive bonus arrangement that places emphasis on achieving increased sales on a branch, Onsite, district, regional, and national account basis, while still attaining targeted levels of, among other things, gross profit and trade accounts receivable collections. As a result, a significant portion of our total employment cost varies with sales volume. We also pay incentive bonuses to our leadership personnel based on one or more of
10
the following factors: sales growth, earnings growth (before and after taxes), profitability, and return on assets improvement, and to our other personnel for achieving predetermined departmental, project, and cost-containment goals.
Our employees are not subject to any collective bargaining agreements and we have experienced no work stoppages. We believe our employee relations are good.
Available Information
Our Internet address for corporate and investor information is www.fastenal.com. The information contained on our website or connected to our website is not incorporated by reference into this annual report on Form 10-K and should not be considered part of this report.
Our annual reports on Form 10-K, quarterly reports on Form 10-Q, current reports on Form 8-K, and amendments to those reports filed or furnished pursuant to Section 13(a) or 15(d) of the Securities Exchange Act are available free of charge on or through our website at www.fastenal.com as soon as reasonably practicable after such reports have been filed with or furnished to the SEC.
11
|
ITEM 1A.
|
RISK FACTORS
|
In addition to the other information in this Form 10-K, the following factors should be considered in evaluating our business. Our operating results depend upon many factors and are subject to various risks and uncertainties. The most significant risks and uncertainties known to us which may cause our operating results to vary from anticipated results or which may negatively affect our operating results and profitability are as follows:
Company Risks
Products that we sell may expose us to potential material liability for property damage, environmental damage, personal injury, or death linked to the use of those products by our customers.
Some of our customers operate in challenging industries where there is a material risk of catastrophic events. We are actively seeking to expand our sales to certain categories of customers, some of whose businesses may entail heightened levels of such risk. If any of these events are linked to the use by our customers of any of our products, claims could be brought against us by those customers, by governmental authorities, and by third parties who are injured or damaged as a result of such events. In addition, our reputation could be adversely affected by negative publicity surrounding such events regardless of whether or not claims against us are successful. While we maintain insurance coverage to mitigate a portion of this risk and may have recourse against our suppliers for losses arising out of defects in products procured from them, we could experience significant losses as a result of claims made against us to the extent adequate insurance is not in place, the products are manufactured by us or legal recourse against our suppliers is otherwise not available, or our insurers or suppliers are unwilling or unable to satisfy their obligations to us.
Interruptions in the proper functioning of information systems or the inability to maintain or upgrade our information systems, or convert to alternate systems in a timely and efficient manner, could disrupt operations, cause unanticipated increases in costs and/or decreases in revenues, and result in less efficient operations.
The proper functioning of our information systems is critical to many aspects of our business and we could be adversely affected if we experience a disruption or data loss relating to our information systems and are unable to recover in a timely manner. Our information systems are protected with robust backup systems and processes, including physical and software safeguards and remote processing capabilities. Still, information systems are vulnerable to natural disasters, power losses, unauthorized access, telecommunication failures, and other problems. In addition, certain software used by us is licensed from, and certain services related to our information systems are provided by, third parties who could choose to discontinue their products or services or their relationship with us. It is also possible that we are unable to improve, upgrade, maintain, and expand our information systems. Our ability to process orders, maintain proper levels of inventories, collect accounts receivable, pay expenses, and maintain the security of company and customer data, as well as the success of our growth drivers, is dependent in varying degrees on the effective and timely operation and support of our information technology systems. If critical information systems fail or these systems or related software or services are otherwise unavailable, or if we experience extended delays or unexpected expenses in securing, developing, and otherwise implementing technology solutions to support our growth and operations, it could adversely affect our profitability and/or ability to grow.
In the event of a cyber security incident, we could experience certain operational interruptions, incur substantial additional costs, become subject to legal or regulatory proceedings, or suffer damage to our reputation in the marketplace.
The nature of our business requires us to receive, retain, and transmit certain personally identifying information that our customers provide to purchase products or services, register on our websites, or otherwise communicate and interact with us. While we have taken and continue to undertake significant steps to protect our customer and confidential information, a compromise of our data security systems or those of businesses we interact with could result in information related to our customers or business being obtained by unauthorized persons. We develop and update processes and maintain systems in an effort to try to prevent this from occurring and have established and maintained disclosure controls and procedures that would permit us to make accurate and timely disclosures of any material event, including any cyber security event, but the development and maintenance of these processes and systems are costly and require ongoing monitoring and updating as technologies change and efforts to overcome security measures become more sophisticated. Consequently, despite our efforts, the possibility of cyber security incidents cannot be eliminated entirely. We have not encountered any meaningful incidents but there can be no assurance that we will not experience a cyber security incident that may materially impact our consolidated financial statements. While we also seek to obtain assurances that third parties we interact with will protect confidential information, there is a risk the confidentiality of data held or accessed by third parties may be compromised. If a compromise of our data security were to occur, it could interrupt our operations, subject us to additional legal, regulatory, and operating costs, and damage our reputation in the marketplace.
We may be unable to meet our goals regarding the growth drivers of our business.
Our sales growth is dependent primarily on our ability to attract new customers and increase our activity with existing customers. Historically, the most effective way to attract new customers has been opening new branches. In recent years, however, we have devoted increased resources to other growth drivers, including our industrial vending business, our Onsite business, our national accounts team, and our international operations. While we have taken steps to build momentum in the growth drivers of our business, we cannot assure you those steps will lead to additional sales growth. Failure to achieve any of our goals regarding industrial vending, FMI,
12
Onsite locations, national accounts signings, digital solutions, international operations, or other growth drivers could negatively impact our long-term sales growth. Further, failure to identify appropriate targets for our Onsite and industrial vending businesses or failure to find suitable locations for them once appropriate targets are identified may adversely impact our goals regarding the number of new Onsite locations we are able to open or the number of industrial vending devices we are able to deploy.
Changes in customer or product mix, downward pressure on sales prices, and changes in volume of orders could cause our gross profit percentage to fluctuate or decline in the future.
Changes in our customer or product mix could cause our gross profit percentage to fluctuate or decline. For example, the portion of our sales attributable to fasteners has been decreasing in recent years. That has adversely affected our gross profit percentage as our non-fastener products generally carry lower gross profit margins than our fastener products. Similarly, in recent years, revenues from national accounts customers, which typically have lower gross profit margins by virtue of their scale and available business, have tended to grow faster than revenues from smaller customers. This factor has become more significant as revenues from Onsite locations has grown in the mix. If our customer or product mix continues to change, our gross profit percentage may decline further. Downward pressure on sales prices and changes in the volume of our orders could also cause our gross profit percentage to fluctuate or decline. We can experience downward pressure on sales prices as a result of deflation, pressure from customers to reduce costs, or increased competition. Reductions in our volume of purchases can adversely impact gross profit by reducing supplier volume allowances. Customer and product mix have contributed to the decline in our gross profit percentage over time, including in 2018 and 2017,
and will likely continue to affect our gross profit percentage in 2019 and beyond. However, whether this adverse mix impact will result in a decline of our gross profit percentage in any given year will depend on the extent to which they are, or are not, offset by positive impacts to gross profit margin during such year.
Our operating and administrative expenses could grow more rapidly than net sales which could result in failure to achieve our goals related to leveraging revenue growth into higher net earnings.
Over time, we have generally experienced an increase in our operating and administrative expenses, including costs related to payroll, occupancy, freight, and information technology, among others, as our net sales have grown. However, historically, a portion of these expenses has not increased at the same rates as net sales, allowing us to leverage our growth and sustain or expand our operating profit margins. There are various scenarios where we may not be able to continue to achieve this leverage as we have been able to do in the past. For instance, it is typical that when demand declines, most commonly from cyclical factors (though it could be due to customer losses or some other company-specific event), our operating and administrative expenses do not fall as quickly as net sales. It is also possible that in the future we will elect to make investments in operating and administrative expenses that would result in costs growing faster than net sales. In addition, market variables, such as labor rates, energy costs, and legal costs, could move in such a way as to cause us to not be able to manage our operating and administrative expenses in a way that would enable us to leverage our revenue growth into higher net earnings. Should any of these scenarios, or a combination of them, occur in the future, it is possible that our operating and pre-tax profit margins could decline even if we are able to grow revenue.
Our competitive advantage in our industrial vending business could be eliminated and the loss of key suppliers of equipment and services for that business could be disruptive and could result in failure to deploy devices.
We believe we have a competitive advantage in industrial vending due to our vending hardware and software, our local branch presence (allowing us to service devices more rapidly), our 'vendible' product depth, and in North America, our distribution strength. These advantages have developed over time; however, other competitors could respond to our expanding industrial vending business with highly competitive platforms of their own. Such competition could negatively impact our ability to expand our industrial vending business or negatively impact the economics of that business. In addition, we currently rely on a limited number of suppliers for the vending devices used in, and certain software and services needed to operate, our industrial vending business. While these devices, software, and services can be obtained from other sources, loss of our current suppliers could be disruptive and could result in us failing to meet our goals related to the number of devices we are able to deploy in the next twelve to eighteen months.
The ability to identify new products and product lines, and integrate them into our selling locations and distribution network, may impact our ability to compete, our ability to generate additional sales, and our profit margins.
Our success depends in part on our ability to develop product expertise at the selling location level and identify future products and product lines that complement existing products and product lines and that respond to our customers' needs. We may not be able to compete effectively unless our product selection keeps up with trends in the markets in which we compete or trends in new products. In addition, our ability to integrate new products and product lines into our branches and distribution network could impact sales and profit margins.
Our ability to successfully attract and retain qualified personnel to staff our selling locations could impact labor costs, sales at existing selling locations, and the successful execution of our growth drivers.
Our success depends in part on our ability to attract, motivate, and retain a sufficient number of qualified employees, including inside and outside branch associates, Onsite managers, national account sales representatives, and support personnel, who understand and appreciate our culture and are able to adequately represent this culture to our customers. Qualified individuals of the requisite caliber and number needed to fill these positions may be in short supply in some areas, and the turnover rate in the industry is high. If we are unable to hire
13
and retain personnel capable of consistently providing a high level of customer service, as demonstrated by their enthusiasm for our culture and product knowledge, our sales could be materially adversely affected. Additionally, competition for qualified employees could require us to pay higher wages to attract a sufficient number of employees. An inability to recruit and retain a sufficient number of qualified individuals in the future may also delay the planned expansion of our various selling channels.
Our inability to attract or transition key executive officers may divert the attention of other members of our senior leadership and adversely impact our existing operations.
Our success depends on the efforts and abilities of our key executive officers and senior leadership. In the event of voluntary or involuntary vacancies in our executive team in the future, the extent to which there is disruption in the oversight and/or leadership of our business will depend on our ability to either transition internal, talented individuals or recruit suitable replacements to serve in these roles. In addition, difficulties in smoothly implementing any transition to new members of our executive team, or recruiting suitable replacements, could divert the attention of other members of our senior leadership team from our existing operations.
We may not be able to compete effectively against traditional or non-traditional competitors, which could cause us to lose market share or erode our operating income profit and/or percentage.
The industrial, construction, and maintenance supply industry, although slowly consolidating, still remains a large, fragmented, and highly competitive industry. Our current or future competitors may include companies with similar or greater market presence, name recognition, and financial, marketing, technological, and other resources, and we believe they will continue to challenge us with their product selection, financial resources, technological advancements, and services. Increased competition from brick-and-mortar retailers could cause us to lose market share or reduce our prices or increase our spending. Similarly, the emergence of on-line retailers, whether as extensions of our traditional competition or in the form of major, non-traditional competitors, could result in easier and quicker price discovery and the adoption of aggressive pricing strategies and sales methods. These pressures could have the effect of eroding our operating income profit and/or percentage over time.
Our business is subject to a wide array of operating laws and regulations in every jurisdiction where we operate. Compliance with these laws and regulations increases the cost of doing business and failure to comply could result in the imposition of fines or penalties and the termination of contracts.
We are subject to a variety of laws and regulations including without limitation; import and export requirements, anti-bribery and corruption laws, product compliance laws, environmental laws, foreign exchange controls and cash repatriation restrictions, advertising regulations, data privacy and cyber security requirements, regulations on suppliers regarding the sources of supplies or products, labor and employment laws, and anti-competition regulations. In addition, as a supplier to federal, state, and local government agencies, we must comply with certain laws and regulations relating specifically to the formation, administration, and performance of our governmental contracts. We are also subject to governmental audits and inquiries in the normal course of business. Ongoing audit activity and changes to the legal and regulatory environments could increase the cost of doing business, and such costs may increase in the future as a result of changes in these laws and regulations or in their interpretation. While we have implemented policies and procedures designed to facilitate compliance with these laws and regulations, there can be no assurance that our employees, contractors, or agents will not violate such laws and regulations, or our policies. Any such violations could result in the imposition of fines and penalties, damage to our reputation, and, in the case of laws and regulations relating specifically to governmental contracts, the loss of those contracts.
Tax laws and regulations require compliance efforts that can increase our cost of doing business and changes to these laws and regulations could impact financial results.
We are subject to a variety of tax laws and regulations in the jurisdictions in which we operate. Maintaining compliance with these laws can increase our cost of doing business and failure to comply could result in audits or the imposition of fines or penalties. Further, our future effective tax rates in any of these jurisdictions could be affected, positively or negatively, by changing tax priorities, changes in statutory rates, or changes in tax laws or the interpretation thereof. The most significant recent example of this is the comprehensive tax legislation commonly referred to as the Tax Cuts and Jobs Act (the 'Tax Act'), which was enacted in the United States in December 2017. The Tax Act reduced the U.S. federal corporate income tax rate, included a one-time tax on accumulated offshore earnings, eliminated certain deductions for which we had previously qualified, requires a current inclusion in U.S. federal income of certain earnings of controlled foreign corporations, allows a domestic corporation an immediate deduction in U.S. taxable income for a portion of its foreign-derived intangible income, and introduced a base erosion anti-abuse tax. There is also a longer term risk that the beneficial aspects of the Tax Act on our business could be reversed depending on changes in future fiscal or political priorities.
We may not be successful in integrating acquisitions and achieving intended benefits and synergies.
We have completed several acquisitions of businesses in recent years. We expect to continue to pursue strategic acquisitions that we believe will either expand or complement our business in new or existing markets or further enhance the value and offerings we are able to provide to our existing or future potential customers. Acquisitions involve numerous risks and challenges, including, among others, a risk of potential loss of key employees of an acquired business, inability to achieve identified operating and financial synergies anticipated to result from an acquisition, diversion of our capital and our management's attention from other business issues, and risks related to the integration of the acquired business including unanticipated changes in our business, our industry, or general economic conditions that affect the assumptions underlying the acquisition. Any one or more of these factors could cause us to not realize the benefits anticipated to result from the acquisitions.
14
Industry and General Economic Risks
A downturn in the economy or in the principal markets served by us and other factors may affect customer spending, which could harm our operating results.
In general, our sales represent spending on discretionary items or consumption needs by our customers. This spending is affected by many factors, including, among others:
|
•
|
general business conditions,
|
|
•
|
business conditions in our principal markets,
|
|
•
|
interest rates,
|
|
•
|
inflation,
|
|
•
|
liquidity in credit markets,
|
|
•
|
taxation,
|
|
•
|
government regulations and actions, including around trade policy,
|
|
•
|
energy and fuel prices and electrical power rates,
|
|
•
|
unemployment trends,
|
|
•
|
terrorist attacks and acts of war,
|
|
•
|
weather conditions, and
|
|
•
|
other matters that influence customer confidence and spending.
|
A downturn in either the national or local economy where we operate, or in the principal markets served by us, or changes in any of the other factors described above, could negatively impact sales at our in-market locations, sales through our other selling channels, and the level of profitability of those in-market locations and other selling channels.
This risk was most recently demonstrated in 2015 and 2016. We have significant exposure to companies involved in the manufacture of capital goods and heavy equipment. In 2015, our business was impacted by lower commodity prices, including oil, lower corporate capital spending, and a strong U.S. dollar. These variables resulted in some of our customers exhibiting a reduced level of business activity and confidence. When this happens, these customers tend to cut back on spending which yields a slowdown in our business with these customers. These same dynamics carried into 2016. In 2017, these conditions mostly reversed. Certain commodity prices recovered and corporate investment improved, leading to better capital spending trends among our customers. This improvement in customer spending helped to improve our net sales and sales growth in 2017
and throughout 2018.
New trade policies could make sourcing product from overseas more difficult and/or more costly, and could adversely impact our operating profit percentage.
We source a significant amount of the products we sell from outside of the United States, primarily Asia. We have made significant structural investments over time to be able to source both directly from Asia through our wholly-owned, Asia-based subsidiary, FASTCO Trading Co., Ltd. and indirectly from suppliers that procure product from international sources. This was initially necessary due to the absence of significant domestic fastener production, but over time we have expanded our non-fastener sourcing as well, and at this time it may be difficult to adjust our sourcing in the short term. In light of this, changes in trade policies could affect our sourcing operations, our ability to secure sufficient product to serve our customers and/or impact the cost or price of our products, with potentially adverse impacts on our gross and operating profit percentages and financial results. These risks are particularly acute currently in light of an increase in tariffs, either directly on products we trade in or indirectly on industries we sell into, between the United States and its trading partners, as well as greater uncertainty around regional and global trade agreements generally. China and Canada represent significant sources of product and Canada and Mexico represent our two largest markets in terms of revenue generation after the United States, and each of these countries are currently and/or have been previously subject to disruption due to historical trade policies. There can be no assurances that these disruptions will not continue or increase in the future, with the previously mentioned countries or additional countries with which we do business. The degree to which these changes in the global marketplace affect our financial results will be influenced by the specific details of the changes in trade policies, their timing and duration, and our effectiveness in deploying tools to address these issues. In particular, the tariffs levied on certain products originating in China, including many that we source and sell, that went into effect on September 24, 2018, have caused us to review and implement potential solutions to the increase in our product costs with our customers. However, it is too early to determine the ultimate impact and effectiveness of these discussions.
New trade policies could have an adverse impact on industries we sell into, negatively affecting our net sales and profits.
Considerable political uncertainty in the United States may result in changes to trade policies that could create disruption in geographic demand trends. To the extent that the United States government enacts tariffs or taxes that penalize imports to benefit domestic manufacturing, we may improve our domestic sales which may have an overall positive impact on us given that 86% of our total revenue is derived from the United States. However, any such action may adversely impact our foreign sales, which may, in turn, adversely impact our ability to expand our overseas branches in the future. In addition, should a foreign government engage in its own trade protection, independent of or in response to another nation's action, it could have a negative direct or, more likely, indirect effect on our net sales and profits by reducing demand for exports by United States companies. Such changes could adversely affect our financial results.
15
Products manufactured in foreign countries may cease to be available for reasons unrelated to trade policy, which could adversely affect our inventory levels and operating results.
We obtain certain of our products, and our suppliers obtain certain of their products, from China, Taiwan, South Korea, Mexico, and other foreign countries. Our suppliers could discontinue selling products manufactured in foreign countries at any time for reasons that may or may not be in our control or our suppliers' control, including foreign government regulations, domestic government regulations, political unrest, war, disruption or delays in shipments, or changes in local economic conditions. Additionally, the shipment of goods from foreign countries could be delayed by container shipping companies encountering financial or other difficulties. Our operating results and inventory levels could suffer if we are unable to promptly replace a supplier or shipper who is unwilling or unable to satisfy our requirements with another supplier or shipper providing equally appealing products and services.
Changes in energy costs and the cost of raw materials used in our products could impact our net sales, cost of sales, gross profit percentage, distribution expenses, and occupancy expenses, which may result in lower operating income.
Costs of raw materials used in our products (e.g., steel) and energy costs can fluctuate significantly over time. Increases in these costs result in increased production costs for our suppliers. These suppliers typically look to pass their increased costs along to us through price increases. The fuel costs of our distribution and branch operations have fluctuated as well. While we typically try to pass higher supplier prices and fuel costs through to our customers or to modify our activities to mitigate the impact, we may not be successful, particularly if supplier prices or fuel costs rise rapidly. Failure to fully pass any such increased prices and costs through to our customers or to modify our activities to mitigate the impact would have an adverse effect on our operating income. While increases in the cost of fuel or raw materials could be damaging to us, decreases in those costs, particularly if severe, could also adversely impact us by creating deflation in selling prices, which could cause our gross profit to deteriorate, or by negatively impacting customers in certain industries, which could cause our sales to those customers to decline.
The industrial, construction, and maintenance supply industry is consolidating, which could cause it to become more competitive and could negatively impact our market share, gross profit, and operating income.
The industrial, construction, and maintenance supply industry in North America is consolidating. This consolidation is being driven by customer needs and supplier capabilities, which could cause the industry to become more competitive as greater economies of scale are achieved by suppliers, or as competitors with new business models are willing and able to operate with lower gross profit on select products. Customers are increasingly aware of the total costs of fulfillment and of the need to have consistent sources of supply at multiple locations. We believe these customer needs could result in fewer suppliers as the remaining suppliers become larger and capable of being a consistent source of supply.
There can be no assurance we will be able in the future to take effective advantage of the trend toward consolidation. The trend in our industry toward consolidation could make it more difficult for us to maintain our current gross profit and operating income. Furthermore, as our industrial customers face increased foreign competition, and potentially lose business to foreign competitors or shift their operations overseas in an effort to reduce expenses, we may face increased difficulty in growing and maintaining our market share.
Inclement weather and other disruptions to the transportation network could adversely impact our distribution system and demand for our products.
Our ability to provide efficient distribution of core business products to our branch network is an integral component of our overall business strategy. Disruptions at distribution centers or shipping ports may affect our ability to both maintain core products in inventory and deliver products to our customers on a timely basis, which may in turn adversely affect our results of operations. In addition, severe weather conditions could adversely affect demand for our products in particularly hard hit regions. In August and September 2017, we experienced temporary disruptions in our distribution network in our Gulf Coast, Florida, Georgia, and Puerto Rico regions due to hurricanes Harvey, Irma, and Maria. These storms adversely impacted our product demand and revenues, as well as our gross and operating profit percentages, due to an increase in demand for storm-related products which have a lower gross profit margin, and inefficiencies in delivery services in the immediate aftermath of the storms. In September 2018, hurricane Florence had a similar impact in our Carolinas region.
Our current estimates of total market potential as well as the market potential of our business strategies could be incorrect.
We believe we have a significant opportunity for growth based on our belief that North American market demand for the products we sell is estimated to exceed $140 billion. This figure is not derived from an independent organization or data source that aggregates and publishes widely agreed-upon demand and market share statistics. Instead, we have identified this figure based on our own experience in the marketplace for our products and by evaluating estimates from other sources. If we have overestimated the size of our market, and in doing so, underestimated our current share of it, the size of our opportunity for growth may not be as significant as we currently believe. Similarly, we have provided estimates of the opportunities we have with some of our specific growth strategies, such as industrial vending and Onsite locations. We believe the potential market opportunity for industrial vending is approximately 1.7 million devices and we have identified over 15,000 customer locations with the potential to implement our Onsite service model. Similar to the case for total market size, we use our own experience and data to arrive at the size of these potential opportunities and not independent sources. These estimates are based on our business model today, and the introduction or expansion of other business strategies, such as on-line retailing, could cause them to change. In addition, the market potential of a particular business strategy may vary from expectations due to a change in the marketplace (such as changes in customer concentration or needs), a change in the nature of that business strategy, or weaker
16
than anticipated acceptance by customers of that business strategy. We cannot guarantee that our market potential estimates are accurate or that we will ultimately decide to expand our industrial vending or Onsite service models as we anticipate to reach the full market opportunity.
We are exposed to foreign currency exchange rate risk, and changes in foreign exchange rates could increase the cost of purchasing products and impact our foreign sales.
Because the functional currency related to most of our foreign operations is the applicable local currency, we are exposed to foreign currency exchange rate risk arising from transactions in the normal course of business. Fluctuations in the relative strength of foreign economies and their related currencies could adversely impact our ability to procure products overseas at competitive prices and our foreign sales. Historically, our primary exchange rate exposure has been with the Canadian dollar. There can be no assurance that currency exchange rate fluctuations with the Canadian dollar and other foreign currencies will not adversely affect our results of operations, financial condition, and cash flows. While the use of currency hedging instruments may provide us with protection from adverse fluctuations in currency exchange rates, we are not currently using these instruments and we have not historically hedged this exposure. If we decide to do so in the future, we could potentially forego the benefits that might result from favorable fluctuations in currency exchange rates.
Tight credit markets could impact our ability to obtain financing on reasonable terms or increase the cost of existing or future financing and interest rate fluctuations could adversely impact our results.
As of
December 31, 2018
, we had
$500.0
of outstanding debt obligations, including loans outstanding under our revolving credit facility (the 'Credit Facility') of
$365.0
and senior unsecured promissory notes issued under our master note agreement (the 'Master Note Agreement') in the aggregate principal amount of
$135.0
. Loans under the Credit Facility bear interest at a rate per annum based on the London Interbank Offered Rate ('LIBOR') and mature on November 30, 2023. The notes issued under our Master Note Agreement consist of three series. The first is in an aggregate principal amount of $40.0, bears interest at a fixed rate of 2.00% per annum, and is due and payable on July 20, 2021. The second is in an aggregate principal amount of $35.0, bears interest at a fixed rate of 2.45% per annum, and is due and payable on July 20, 2022. The third is in an aggregate principal amount of $60.0, bears interest at a fixed rate of 3.22% per annum, and is due and payable on March 1, 2024. Our aggregate borrowing capacity under the Credit Facility is $700.0. Our aggregate borrowing capacity under the Master Note Agreement is $600.0; however, none of the institutional investors that are parties to that agreement are committed to purchase notes thereunder.
During periods of volatility and disruption in the United States credit markets, financing may become more costly and more difficult to obtain. Although the credit market turmoil of 2008 and 2009 did not have a significant adverse impact on our liquidity or borrowing costs given our low level of indebtedness at that time, the availability of funds tightened and credit spreads on corporate debt increased. Our indebtedness has increased since 2009 and we have the capacity under our Credit Facility and Master Note Agreement to increase borrowings in the future. If credit market volatility were to return or if interest rates continue to rise, the cost of servicing our existing debt could increase due to the LIBOR-based interest rate provided for under our Credit Facility. In addition, borrowing additional amounts to finance stock purchases, dividends, capital expenditures, and other liquidity needs or to refinance our existing indebtedness could be difficult and the cost of doing so could be high.
Investment Risk
There can be no assurance that our stock price will continue to reflect the current multiple of earnings over time.
Stock prices, including ours, are commonly thought to be a function of earnings multiplied by a multiple. Historically, investors have given our earnings a higher multiple, or premium, than is typical of the broader industrial sector of which we are typically associated. We believe we have earned this premium by virtue of a long history of superior growth, profitability, and returns. However, to the extent that we fail to successfully execute our growth strategies and/or poorly navigate the risks that surround our business, including those described throughout this section, or to the extent our industry (industrial distribution, or industrial stocks in general) loses favor in the marketplace, there can be no assurance that investors will continue to afford a premium multiple to our earnings which could adversely affect our stock price.
We cannot provide any guaranty of future dividend payments or that we will continue to purchase shares of our common stock pursuant to our share purchase program.
Although our board of directors has historically authorized the payment of quarterly cash dividends on our common stock and indicated an intention to do so in the future, there are no assurances that we will continue to pay dividends in the future or continue to increase dividends at historic rates. In addition, although our board of directors has authorized share purchase programs and we purchased shares in 2018, 2017 and prior years through these programs, we may discontinue doing so at any time. Any decision to continue to pay quarterly dividends on our common stock, to increase those dividends, or to purchase our common stock in the future will be based upon our financial condition and results of operations, the price of our common stock, credit conditions, and such other factors as are deemed relevant by our board of directors.
|
ITEM 1B.
|
UNRESOLVED STAFF COMMENTS
|
None.
17
|
ITEM 2.
|
PROPERTIES
|
Note – Information in this section is as of December 31, 2018, unless otherwise noted.
We own the following facilities in Winona, Minnesota:
|
Purpose
|
Tote Locations (ASRS)
(1)
|
Approximate
Square Feet
|
||||
|
Distribution center and home office
(2)
|
246,000
|
|
259,000
|
|
||
|
Manufacturing facility
|
100,000
|
|
||||
|
Computer support center
|
13,000
|
|
||||
|
Winona branch
|
15,000
|
|
||||
|
Winona product support facility
|
55,000
|
|
||||
|
Rack and shelving storage
|
42,000
|
|
||||
|
Multi-building complex which houses certain operations of the distribution group, the support services group, and the home office support group
|
30,000
|
|
||||
|
Customer support center
|
100,000
|
|
||||
(1)
Total number of tote locations for small parts storage included in facilities with an ASRS.
(2)
During 2018, we acquired land for future expansion of our home office.
We own the following facilities, excluding selling locations, outside of Winona, Minnesota:
|
Purpose
|
Location
|
Tote Locations (ASRS)
(1)
|
Approximate
Square Feet
|
|||
|
Distribution center
|
Indianapolis, Indiana
|
561,000
|
|
(2)
|
1,039,000
|
|
|
Manufacturing facility
|
Indianapolis, Indiana
|
|
220,000
|
|
||
|
Distribution center
|
Akron, Ohio
|
103,000
|
|
182,000
|
|
|
|
Distribution center
|
Scranton, Pennsylvania
|
104,000
|
|
189,000
|
|
|
|
Distribution center
|
Denton, Texas
|
41,000
|
|
(3)
|
176,000
|
|
|
Distribution center
|
Atlanta, Georgia
|
77,000
|
|
198,000
|
|
|
|
Distribution center
(4)
|
Seattle, Washington
|
—
|
|
—
|
|
|
|
Distribution center and manufacturing facility
|
Modesto, California
|
69,000
|
|
328,000
|
|
|
|
Distribution center
|
High Point, North Carolina
|
132,000
|
|
301,000
|
|
|
|
Distribution center
(5)
|
High Point, North Carolina
|
—
|
|
350,000
|
|
|
|
Distribution center
|
Kansas City, Kansas
|
170,000
|
|
300,000
|
|
|
|
Distribution center
|
Kitchener, Ontario, Canada
|
128,000
|
|
142,000
|
|
|
|
Distribution center
(6)
|
Jackson, Mississippi
|
—
|
|
—
|
|
|
|
Manufacturing facility
|
Wallingford, Connecticut
|
|
187,000
|
|
||
|
Manufacturing facility
|
Rockford, Illinois
|
|
100,000
|
|
||
|
Local re-distribution center and manufacturing facility
|
Johor, Malaysia
|
|
27,000
|
|
||
(1)
Total number of tote locations for small parts storage included in facilities with an ASRS.
(2)
This property contains an ASRS with capacity of 52,000 pallet locations, in addition to the 561,000 tote locations for small parts; 105,000 of these small part tote locations are located in the industrial vending automated replenishment facility, which is also located on this property.
(3)
This facility contains an ASRS with capacity of 14,000 pallet locations, in addition to the 41,000 tote locations for small parts.
(4)
Construction of a new distribution center in Washington, which will include ASRS technology, began in 2018 and we expect this to be completed in the fourth quarter of 2019.
(5)
In late December 2018, we purchased an additional distribution center in High Point, North Carolina with approximately 750,000 total square feet. Approximately 400,000 square feet will continue to be leased by the previous owner for three years. We began utilizing approximately 350,000 square feet for distribution activities in early 2019.
(6)
Construction of a new distribution center in Mississippi began in 2018, and we expect this project to be complete in the third quarter of 2019.
18
In addition, we own 172 buildings that house our in-market locations in various cities throughout North America.
All other buildings we occupy are leased. Leased branches range from approximately 3,000 to 10,000 square feet, with lease terms of up to 60 months (most initial lease terms are for 36 to 48 months). In addition to our leased branch locations, we also lease the following facilities:
|
Purpose
|
Location
|
Approximate
Square Feet
|
Lease Expiration
Date
|
Remaining
Lease
Renewal
Options
|
||||
|
Distribution center
|
Seattle, Washington
(1)
|
100,000
|
|
April 2022
|
None
|
|||
|
Distribution center
|
Salt Lake City, Utah
|
74,000
|
|
July 2019
|
One
|
|||
|
Distribution center and packaging facility
|
Salt Lake City, Utah
|
26,000
|
|
July 2019
|
One
|
|||
|
Distribution center and manufacturing facility
|
Edmonton, Alberta, Canada
|
45,000
|
|
July 2020
|
None
|
|||
|
Distribution center
|
Apodaca, Nuevo Leon, Mexico
|
46,000
|
|
March 2020
|
Three
|
|||
|
Manufacturing facility
|
Houston, Texas
|
21,000
|
|
July 2019
|
None
|
|||
|
Local re-distribution center and manufacturing facility
|
Modrice, Czech Republic
|
15,000
|
|
April 2022
|
None
|
|||
(1)
We currently own land in the Seattle, Washington area for the construction of a new distribution center, which began in 2018, and when completed, will replace the current leased facility.
We currently own land for future distribution center expansion and development. If economic conditions are suitable in the future, we will consider purchasing branch locations to house our older branches. It is anticipated the majority of new branch locations will continue to be leased. It is our policy to negotiate relatively short lease terms to facilitate relocation of particular branch operations, when desirable. Our experience has been that there is sufficient space suitable for our needs and available for leasing.
|
ITEM 3.
|
LEGAL PROCEEDINGS
|
A description of our legal proceedings, if any, is contained in Note 10 of the Notes to Consolidated Financial Statements.
|
ITEM 4.
|
MINE SAFETY DISCLOSURES
|
Not applicable.
19
PART II
|
ITEM 5.
|
MARKET FOR REGISTRANT'S COMMON EQUITY, RELATED STOCKHOLDER MATTERS, AND ISSUER PURCHASES OF EQUITY SECURITIES
|
Common Stock Data
Dollar amounts in this section are stated in whole numbers.
Our shares are traded on The Nasdaq Stock Market under the symbol 'FAST'. As of
January 18, 2019
, there were approximately 1,100 record holders of our common stock, which includes nominees or broker dealers holding stock on behalf of an estimated 283,000 beneficial owners.
Issuer Purchases of Equity Securities
The table below sets forth information regarding purchases of our common stock during each of the last three months of
2018
:
|
(a)
|
(b)
|
(c)
|
(d)
|
||||||
|
Period
|
Total Number of Shares
Purchased
|
Average Price
Paid per Share
|
Total Number of
Shares Purchased
as Part of Publicly
Announced Plans
or Programs (1)
|
Maximum Number (or
Approximate Dollar
Value) of Shares that May Yet Be Purchased Under the Plans or Programs (1)
|
|||||
|
October 1-31, 2018
|
1,200,000
|
$52.16
|
0
|
2,400,000
|
|||||
|
November 1-30, 2018
|
0
|
—
|
|
0
|
2,400,000
|
||||
|
December 1-31, 2018
|
0
|
—
|
|
0
|
2,400,000
|
||||
|
Total
|
1,200,000
|
$52.16
|
0
|
2,400,000
|
|||||
(1)
On July 11, 2017, our board of directors established a new authorization for us to repurchase up to 5,000,000 shares of our common stock. As of December 31, 2018, we had remaining authority to repurchase 2,400,000 shares under this authorization.
Purchases of shares of our common stock throughout
2018
are described later in this Form 10-K under the heading 'Item 7. Management's Discussion and Analysis of Financial Condition and Results of Operations'.
20
Fastenal Company Common Stock Comparative Performance Graph
Set forth below is a graph comparing, for the five years ended December 31,
2018
, the yearly cumulative total shareholder return on our common stock with the yearly cumulative total shareholder return of the S&P 500 Index and the Dow Jones US Industrial Suppliers Index.
The comparison of total shareholder returns in the performance graph assumes that $100 was invested on December 31, 2013 in Fastenal Company, the S&P 500 Index, and the Dow Jones US Industrial Suppliers Index, and that dividends were reinvested when and as paid.
Comparison of Five-Year Cumulative Total Return Among Fastenal Company, the S&P 500 Index, and the Dow Jones US Industrial Suppliers Index
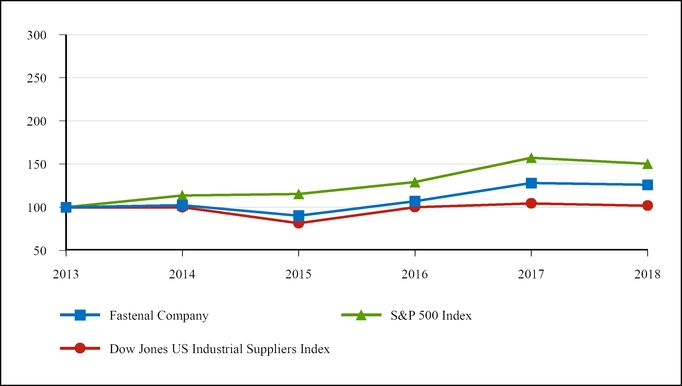
|
2013
|
2014
|
2015
|
2016
|
2017
|
2018
|
|||||||
|
Fastenal Company
|
$
|
100.00
|
102.36
|
90.26
|
106.97
|
128.01
|
126.01
|
|||||
|
S&P 500 Index
|
100.00
|
113.69
|
115.26
|
129.05
|
157.22
|
150.33
|
||||||
|
Dow Jones US Industrial Suppliers Index
|
100.00
|
99.94
|
81.47
|
100.08
|
104.35
|
101.83
|
||||||
Note - The graph and index table above were obtained from Zachs SEC Compliance Services Group.
|
ITEM 6.
|
SELECTED FINANCIAL DATA
|
Incorporated herein by reference is Ten-Year Selected Financial Data on pages 4 and 5 of Fastenal's
2018
Annual Report to Shareholders of which this Form 10-K forms a part, a portion of which is filed as Exhibit 13 to this annual report on
Form 10-K.
21
|
ITEM 7.
|
MANAGEMENT'S DISCUSSION AND ANALYSIS OF FINANCIAL CONDITION AND RESULTS OF OPERATIONS
|
The following is management's discussion and analysis of certain significant factors which have affected our financial position and operating results during the periods included in the accompanying consolidated financial statements.
Business and Operational Overview
Fastenal is a North American leader in the wholesale distribution of industrial and construction supplies. We distribute these supplies through a network of approximately
3,100
in-market locations. Most of our customers are in the manufacturing and non-residential construction markets. The manufacturing market includes both OEM and MRO customers. The non-residential construction market includes general, electrical, plumbing, sheet metal, and road contractors. Other users of our products include farmers, truckers, railroads, oil exploration, production and refinement companies, mining companies, federal, state, and local governmental entities, schools, and certain retail trades. Geographically, our branches and customers are primarily located in North America.
It is helpful to appreciate several aspects of our marketplace: (1) It's big. We estimate the North American marketplace for industrial supplies is in excess of $140 billion per year (and we have expanded beyond North America) and no company has a significant portion of this market. (2) Many of the products we sell are individually inexpensive, but the cost and time to manage, procure, and transport these products can be quite meaningful. (3) Purchasing professionals often expend disproportionate effort managing the high SKU count of low-volume, low value MRO supplies which is better allocated to their higher volume, higher value OEM supplies. (4) Many customers prefer to reduce their number of suppliers to simplify their business, while also utilizing various technologies and models (including our local branches when they need something quickly or unexpectedly) to improve availability and reduce waste. (5) We believe the markets are efficient. To us, this means we can grow our market share if we provide the greatest value to our customer.
Our approach to addressing these aspects of our marketplace is captured in our motto
Growth through Customer Service
. The concept of growth is simple: find more customers every day and increase our activity with them. However, execution is hard work. First, we recruit service-minded individuals to support our customers and their business. Second, we operate in a decentralized fashion to help identify the greatest value for our customers. Third, we have a great team behind our customer-facing resources to operate efficiently and to help identify new business solutions. Fourth, we strive to generate strong profits, which produce the cash flow necessary to fund our growth and to support the needs of our customers. Lastly, we identify drivers that allow us to get closer to our customers and gain market share.
We believe our ability to grow is amplified if we can serve our customers at the closest economic point of contact. At one point, the closest economic point of contact was the local branch. Today, in some cases, we have moved the branch inside the customer's facility. We also are frequently positioned right at the point of consumption within customers' facilities through our industrial vending or FMI capabilities. Therefore, our focus centers on understanding our customers' day, their opportunities, and their obstacles. By doing these things every day, Fastenal remains a growth-centric organization.
Executive Overview
Net sales increas
ed $574.6, or 13.1%, in 2018
relative to 2017. Our gross profit as a percentage of net sal
es declined to 48.3% in 2018 from 49.3% in
2017. Our operating income as a percentage of net sal
es in 2018 was comparable to 2017 at 20.1% in both years.
Our net earnings in 2018 were $751.9, an increase of 29.9% when compared to 2017. Our diluted net earnings per share were $2.62 in 2018 compared to $2.01 in 2017, an increase of 30.5%. Both periods included discrete tax items, primarily related to the Tax Act. Excluding these discrete items (a benefit of $7.1 in 2018 and a benefit of $24.4 in 2017), our net earnings in 2018 would have been $744.8, an increase of 34.4% when compared to 2017. Further, our diluted net earnings per share would have been $2.59 in 2018 compared to $1.92 in 2017, an increase of 34.9%. A portion of this increase relates to a lower tax rate in 2018 that is a feature of the Tax Act.
We continued to focus on our growth drivers in 2018. We si
gned 152 new national account contracts (defined as new customer accounts with a multi-site contract) and our national accounts revenues grew 18.1% in the period. Additionally, we signed 336 new O
nsite customer locations
(defined as dedicated sales and service provided from within, or in close proximity to, the customer's facility) and 22,073 new industria
l vending devices. Sales growth in 2018 exceeded 20% through both our vending devices and our Onsite locations (excluding sales transferred from a branch).
22
The table below summarizes our total employee headcount, our investments in in-market locations (defined as the sum of the total number of public branch locations and the total number of active Onsite locations), and industrial vending devices at the end of the periods presented and the percentage change compared to the end of the prior period.
|
Q4
2018
|
Q4
2017 |
Twelve-month
% Change
|
||||||
|
In-market locations - absolute employee headcount
|
14,015
|
|
13,424
|
|
4.4
|
%
|
||
|
Total absolute employee headcount
|
21,644
|
|
20,565
|
|
5.2
|
%
|
||
|
Number of public branch locations
|
2,227
|
|
2,383
|
|
-6.5
|
%
|
||
|
Number of active Onsite locations
|
894
|
|
605
|
|
47.8
|
%
|
||
|
Number of in-market locations
|
3,121
|
|
2,988
|
|
4.5
|
%
|
||
|
Industrial vending devices (installed count)
(1)
|
81,137
|
|
71,421
|
|
13.6
|
%
|
||
|
Ratio of industrial vending devices to in-market locations
|
26:1
|
|
24:1
|
|
||||
(1)
This number primarily represents devices which principally dispense product and produce product revenues, and excludes approximately 15,000 devices that are part of a locker lease program where the devices are principally used for the check-in/check-out of equipment.
During the last twelve months, we increased our absolute employee headcount by 591 people in our in-market locations and 1,079 people in total. This increase is mostly a function of additions we have made to support customer growth in the field as well as investments in our growth drivers.
We opened 11 branches and closed 157 branches in 2018. Additionally, ten branches were converted from public branches to non-public locations. Our in-market network forms the foundation of our business strategy, and we will continue to open or close locations as is deemed necessary to sustain and improve our network and support our growth drivers.
Results of Operations
The following sets forth consolidated statements of earnings information (as a percentage of net sales) for the periods ended December 31:
|
|
2018
|
2017
|
2016
|
||||||
|
Net sales
|
100.0
|
%
|
100.0
|
%
|
100.0
|
%
|
|||
|
Gross profit
|
48.3
|
%
|
49.3
|
%
|
49.6
|
%
|
|||
|
Operating and administrative expenses
|
28.2
|
%
|
29.2
|
%
|
29.5
|
%
|
|||
|
Gain on sale of property and equipment
|
0.0
|
%
|
0.0
|
%
|
0.0
|
%
|
|||
|
Operating income
|
20.1
|
%
|
20.1
|
%
|
20.1
|
%
|
|||
|
Net interest expense
|
-0.3
|
%
|
-0.2
|
%
|
-0.2
|
%
|
|||
|
Earnings before income taxes
|
19.9
|
%
|
19.9
|
%
|
19.9
|
%
|
|||
|
Note – Amounts may not foot due to rounding difference.
|
|||||||||
Net Sales
Note – Daily sales are defined as the total net sales for the period divided by the number of business days (in the United States) in the period. The table below sets forth net sales and daily sales for the periods ended December 31, and changes in such sales from the prior period to the more recent period:
|
2018
|
2017
|
2016
|
|||||||
|
Net sales
|
$
|
4,965.1
|
|
4,390.5
|
|
3,962.0
|
|
||
|
Percentage change
|
13.1
|
%
|
10.8
|
%
|
2.4
|
%
|
|||
|
Business days
|
254
|
|
254
|
|
255
|
|
|||
|
Daily sales
|
$
|
19.5
|
|
17.3
|
|
15.5
|
|
||
|
Percentage change
|
13.1
|
%
|
11.3
|
%
|
2.0
|
%
|
|||
|
Daily sales impact of currency fluctuations
|
0.1
|
%
|
0.1
|
%
|
-0.4
|
%
|
|||
|
Daily sales impact of acquisitions
|
0.4
|
%
|
1.0
|
%
|
0.6
|
%
|
|||
23
The increase in net sales noted above for 2018 was a result of higher unit sales and, to a lesser degree, higher prices. Higher product prices were realized throughout 2018 as a result of actions (beginning initially in late 2017) taken to offset increases in product costs, and we believe these increases contributed 0.7% to 0.8% to growth for the year. The increases in net sales for 2017 and 2016 were driven primarily by higher unit sales. Price increases were not a material factor in 2017 or 2016.
The higher unit sales in 2018 and 2017 resulted primarily from two sources. The first is improvement in underlying market demand. We believe the improvement in general business activity is reflected in a number of metrics. For instance, the U.S. Purchasing Managers Index, published by the Institute for Supply Chain Management, averaged 58.8 in 2018 and 57.6 in 2017. Readings above 50 are indicative of growing demand, and we believe the levels described above were consistent with favorable business conditions and consistent with an increase in our sales growth rates. This was reflected as well in daily sales of fasteners, our most cyclical product line, which grew 11.2% and 8.4% in 2018 and 2017, respectively. We also experienced growth in sales to 84 of our top 100 customers in 2018, which compares to growth in sales to 79 of our top 100 customers in 2017.
The second source is success within our growth initiatives. We signed 22,073 industrial vending devices during 2018, an increase of 14.0% over 2017. In addition to an increase in our installed base, we achieved a low-single digit increase in average sales per device. These variables combined to generate sales growth through our vending devices in excess of 20% in 2018. We signed 336 new Onsite locations in 2018, an increase of 24.4% over 2017, and had 894 active sites on December 31, 2018, an increase of 47.8% over December 31, 2017. We signed 152 new national account contracts in 2018. The contribution of these new contracts and strong penetration of existing national account customers resulted in daily sales from our national account customers growing 18.1% in 2018 compared to 2017.
We signed 19,355 industrial vending devices during 2017, an increase of 7.2% over 2016. In addition to an increase in our installed base, we were also more efficient with the existing base, resulting in a modest increase in average sales per device and a decrease in our device removals of 3.8%. Combined sales through our vending devices accelerated throughout 2017, finishing with growth in the high teens. We signed 270 new Onsite locations in 2017, an increase of 53.4% over 2016, and had 605 active sites on December 31, 2017, an increase of 50.9% over December 31, 2016. We signed 168 new national account contracts in 2017. The contribution of these new contracts and strong penetration of existing national account customers resulted in daily sales from our national account customers growing 14.5% in 2017 compared to 2016.
In 2016, we saw relative weakness from non-residential construction and heavy manufacturing customers and in demand for our fastener products, speaking to the sustained softness in heavy and general industrial markets. Business with our largest customers was also relatively weak, with sales to our top 100 customers rising modestly in the first half of 2016 and falling modestly in the second half of 2016. While these trends were representative of conditions in the United States and Canada, total sales outside of these geographic areas were relatively strong and improved over the course of 2016. Net sales in 2016 were also impacted by slight inflationary price changes in our non-fastener products and some price deflation in our fastener products, with the net impact being a slight drag on growth. We experienced success with our growth initiatives in 2016, similar to 2017 and 2018; however, their impact to our net sales growth in 2016 was largely offset by a weaker economic environment.
Sales by Product Line
The approximate mix of sales from the fastener product line and from the other product lines was as follows:
|
2018
|
2017
|
2016
|
|||
|
Fastener product line
|
34.9%
|
35.6%
|
36.6%
|
||
|
Other product lines
|
65.1%
|
64.4%
|
63.4%
|
||
The decrease in our fastener sales as a percentage of total sales arises from two factors. First, we believe non-fastener products represent a larger market opportunity than fasteners, and that we are relatively under-represented in this market. Over time, this has led to faster growth in the non-fastener product lines, a trend amplified by the growth of our industrial vending program through which we sell primarily non-fastener products. We believe this factor impacted each year shown and will continue to promote a lower mix of fasteners in our total sales over time. Second, a weak industrial production environment has a disproportionately negative effect on fastener sales relative to non-fastener sales (which relates more to plant operations than production). This weakness is more of a cyclical factor than a structural one, and as such was relevant in 2016, but not in 2017 or 2018 when a better economic environment at least partially mitigated the first factor discussed.
24
Annual Sales Changes, Sequential Trends, and End Market Performance
This section focuses on three distinct views of our business – annual sales changes by month, sequential trends, and end market performance. The first discussion regarding sales changes by month provides a good mechanical view of our business. The second discussion provides a framework for understanding the sequential trends (that is, comparing a month to the immediately preceding month, and also looking at the cumulative change from an earlier benchmark month) in our business. Finally, we believe the third discussion regarding end market performance provides insight into activities with our various types of customers.
Annual Sales Changes, by Month
During the months noted below, all of our selling locations, when combined, had daily sales growth rates of (compared to the same month in the preceding year):
|
|
Jan.
|
Feb.
|
Mar.
|
Apr.
|
May
|
June
|
July
|
Aug.
|
Sept.
|
Oct.
|
Nov.
|
Dec.
|
|||||||||||||||||||||||
|
2018
|
12.0
|
%
|
14.8
|
%
|
13.1
|
%
|
13.4
|
%
|
12.5
|
%
|
13.5
|
%
|
12.0
|
%
|
13.7
|
%
|
13.5
|
%
|
12.4
|
%
|
12.3
|
%
|
14.5
|
%
|
|||||||||||
|
2017
|
3.8
|
%
|
6.1
|
%
|
8.4
|
%
|
8.9
|
%
|
9.7
|
%
|
13.0
|
%
|
12.9
|
%
|
12.8
|
%
|
15.3
|
%
|
13.8
|
%
|
15.4
|
%
|
14.7
|
%
|
|||||||||||
|
2016
|
3.3
|
%
|
2.6
|
%
|
0.0
|
%
|
3.8
|
%
|
1.1
|
%
|
0.0
|
%
|
2.1
|
%
|
0.3
|
%
|
2.8
|
%
|
3.9
|
%
|
1.2
|
%
|
3.2
|
%
|
|||||||||||
Sequential Trends
We find it helpful to think about the monthly sequential changes in our business using the analogy of climbing a stairway –
This stairway has several predictable landings where there is a pause in the sequential gain (i.e. April, July, and October to December), but generally speaking, climbs from January to October. The October landing then establishes the benchmark for the start of the next year.
History has identified these landings in our business cycle. They generally relate to months where certain holidays impair business days and/or seasons impact certain end markets, particularly non-residential construction. The first landing centers on Easter and the Good Friday holiday that precedes it, which alternates between March and April (Good Friday occurred in March 2018, April 2017, and March 2016, and will fall in April in 2019), the second landing centers on July 4th, and the third landing centers on the approach of winter with its seasonal impact on primarily our non-residential construction business and with the Christmas/New Year holidays. The holidays we noted impact the trends because they either move from month-to-month or because they move around during the week.
The table below shows the pattern to the sequential change in our daily sales. The line labeled 'Benchmark' is an historical average of our sequential daily sales change for the trailing five year average (2013-2017). We believe this time frame serves to show the historical pattern and could serve as a benchmark for current performance. The '2018', '2017', and '2016' lines represent our actual sequential daily sales changes. The '18Delta', '17Delta', and '16Delta' lines indicate the difference between the 'Benchmark' and the actual results in the respective year.
It is important to note that these benchmarks are historical averages. In a year where demand is strong, our daily sales growth rates will tend to have more months that exceed the benchmark than fall below it. In a year where demand is weak, we will tend to have more months that fall short of the benchmark than exceed it. In both cases, there is a random element that makes it difficult to know how any single month will perform.
|
|
Jan.
(1)
|
Feb.
|
Mar.
|
Apr.
|
May
|
June
|
July
|
Aug.
|
Sept.
|
Oct.
|
Cumulative Change from Jan. to Oct.
|
|||||||||||||||||||||
|
Benchmark
|
-1.0
|
%
|
1.1
|
%
|
3.9
|
%
|
-0.6
|
%
|
2.1
|
%
|
1.9
|
%
|
-3.7
|
%
|
4.0
|
%
|
1.7
|
%
|
-1.9
|
%
|
8.6
|
%
|
||||||||||
|
2018
|
-1.3
|
%
|
4.0
|
%
|
2.1
|
%
|
2.4
|
%
|
0.6
|
%
|
3.7
|
%
|
-3.6
|
%
|
3.8
|
%
|
3.6
|
%
|
-3.0
|
%
|
13.9
|
%
|
||||||||||
|
18Delta
|
-0.4
|
%
|
2.9
|
%
|
-1.9
|
%
|
3.1
|
%
|
-1.5
|
%
|
1.9
|
%
|
0.0
|
%
|
-0.2
|
%
|
1.9
|
%
|
-1.2
|
%
|
5.3
|
%
|
||||||||||
|
2017
|
0.2
|
%
|
1.5
|
%
|
3.6
|
%
|
2.2
|
%
|
1.4
|
%
|
2.8
|
%
|
-2.4
|
%
|
2.2
|
%
|
3.8
|
%
|
-2.1
|
%
|
13.5
|
%
|
||||||||||
|
17Delta
|
1.2
|
%
|
0.4
|
%
|
-0.4
|
%
|
2.8
|
%
|
-0.7
|
%
|
1.0
|
%
|
1.3
|
%
|
-1.8
|
%
|
2.1
|
%
|
-0.3
|
%
|
4.9
|
%
|
||||||||||
|
2016
|
0.4
|
%
|
-0.8
|
%
|
1.5
|
%
|
1.7
|
%
|
0.6
|
%
|
-0.2
|
%
|
-2.3
|
%
|
2.4
|
%
|
1.5
|
%
|
-0.9
|
%
|
3.6
|
%
|
||||||||||
|
16Delta
|
1.3
|
%
|
-1.9
|
%
|
-2.5
|
%
|
2.3
|
%
|
-1.5
|
%
|
-2.0
|
%
|
1.4
|
%
|
-1.7
|
%
|
-0.1
|
%
|
1.0
|
%
|
-5.1
|
%
|
||||||||||
(1)
The January figures represent the percentage change from the previous October, whereas the remaining figures represent the percentage change from the previous month.
Note – Amounts may not foot due to rounding difference.
25
A graph of the sequential daily sales change patterns discussed above, starting with a base of '100' in the previous October and ending with the next October, would be as follows:
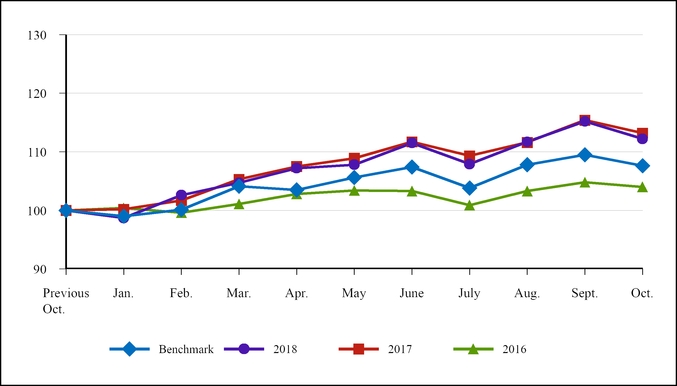
End Market Performance
The sequential trends noted above were directly linked to fluctuations in our end markets. To place this in perspective – we estimate approximately 65% of our business has historically been with customers engaged in some type of manufacturing, a significant subset of which finds its way into the heavy equipment market. The daily sales growth rates to these manufacturing customers, when compared to the same period in the prior year, were as follows
(1)
:
|
|
Q1
|
Q2
|
Q3
|
Q4
|
Annual
|
|||||||||
|
2018
|
14.3
|
%
|
13.3
|
%
|
13.0
|
%
|
13.3
|
%
|
13.5
|
%
|
||||
|
2017
|
6.2
|
%
|
11.5
|
%
|
15.3
|
%
|
16.6
|
%
|
12.3
|
%
|
||||
|
2016
|
1.3
|
%
|
1.4
|
%
|
1.1
|
%
|
2.8
|
%
|
1.6
|
%
|
||||
(1)
In July 2017, we reclassified certain end market designations. The daily sales growth rates in the above table for all periods through the second quarter of 2017 differ from prior disclosures.
Our manufacturing business consists of two subsets: the industrial production business (this is business where we supply products that become part of the finished goods produced by our customers and is sometimes referred to as OEM - original equipment manufacturing) and the maintenance portion (this is business where we supply products that maintain the facility or the equipment of our customers engaged in manufacturing and is sometimes referred to as MRO - maintenance, repair, and operations). The industrial business is more fastener centered, while the maintenance portion is represented by all product categories.
The best way to understand the change in our industrial production business is to examine the results in our fastener product line (approximately 35% of our business) which is heavily influenced by changes in our business with heavy equipment manufacturers. From a company perspective, daily sales growth rates of fasteners, when compared to the same period in the prior year, were as follows (note: this information includes
all
end markets):
|
Q1
|
Q2
|
Q3
|
Q4
|
Annual
|
||||||||||
|
2018
|
11.8
|
%
|
11.1
|
%
|
10.8
|
%
|
11.3
|
%
|
11.2
|
%
|
||||
|
2017
|
0.8
|
%
|
7.9
|
%
|
12.1
|
%
|
13.4
|
%
|
8.4
|
%
|
||||
|
2016
|
-1.7
|
%
|
-2.4
|
%
|
-2.9
|
%
|
-2.4
|
%
|
-2.3
|
%
|
||||
26
The daily sales growth rates of fasteners noted in the table above for first quarter of 2018, and the second, third, and fourth quarters of 2017, include 3.7, 3.6, 3.8, and 3.9 percentage points, respectively, attributable to Mansco (acquired on March 31, 2017).
By contrast, the best way to understand the change in the maintenance portion of the manufacturing business is to examine the results in our non-fastener product lines. From a company perspective, daily sales growth rates of non-fasteners, when compared to the same period in the prior year, were as follows (note: this information includes
all
end markets):
|
Q1
|
Q2
|
Q3
|
Q4
|
Annual
|
||||||||||
|
2018
|
14.5
|
%
|
14.8
|
%
|
14.9
|
%
|
14.6
|
%
|
14.7
|
%
|
||||
|
2017
|
9.4
|
%
|
12.2
|
%
|
14.6
|
%
|
16.1
|
%
|
13.1
|
%
|
||||
|
2016
|
4.7
|
%
|
4.7
|
%
|
4.9
|
%
|
5.9
|
%
|
5.0
|
%
|
||||
The non-fastener business has enjoyed superior growth in the strong 2018 and 2017 periods when compared to our fastener business and to the distribution industry in general. Further, while not immune to the impact of a weak industrial environment as was experienced in 2016, our non-fastener business did demonstrate greater relative resilience when compared to our fastener business and to the distribution industry in general. We believe this is due to both the growth of our vending business and our lower penetration of the non-fastener marketplace relative to our penetration of the fastener marketplace.
Our non-residential construction and reseller customers have historically represented 20% to 25% of our business. The daily sales growth rates to these customers, when compared to the same period in the prior year, were as follows
(1)
:
|
|
Q1
|
Q2
|
Q3
|
Q4
|
Annual
|
|||||||||
|
2018
|
11.7
|
%
|
17.6
|
%
|
19.2
|
%
|
16.4
|
%
|
16.3
|
%
|
||||
|
2017
|
6.9
|
%
|
8.8
|
%
|
9.4
|
%
|
11.6
|
%
|
9.1
|
%
|
||||
|
2016
|
1.6
|
%
|
0.5
|
%
|
2.8
|
%
|
2.6
|
%
|
1.8
|
%
|
||||
(1)
In July 2017, we reclassified certain end market designations. The daily sales growth rates in the above table for all periods through the second quarter of 2017 differ from prior disclosures.
Our non-residential construction and reseller business is heavily influenced by the manufacturing economy as well as infrastructure spending. In 2018 and 2017, improving trends for commodities such as metals and energy, industrial capital spending, and the state of the broader economy contributed to an improvement in growth for these end markets. In 2016, volatility and weakness in commodity markets, particularly energy, and lower industrial capital spending contributed to slower growth.
Gross Profit
The gross profit percentage during each period was as follows:
|
|
Q1
|
Q2
|
Q3
|
Q4
|
Annual
|
|||||||||
|
2018
|
48.7
|
%
|
48.7
|
%
|
48.1
|
%
|
47.7
|
%
|
48.3
|
%
|
||||
|
2017
|
49.4
|
%
|
49.8
|
%
|
49.1
|
%
|
48.8
|
%
|
49.3
|
%
|
||||
|
2016
|
49.8
|
%
|
49.5
|
%
|
49.3
|
%
|
49.8
|
%
|
49.6
|
%
|
||||
Our gross profit, as a percentage of net sales, was 48.3% in 2018 and 49.3% in 2017. The gross profit percentage for 2018 declined by 100 basis points based on three elements. (1) A change in product and customer mix. Fasteners are our largest and highest gross profit margin product line due to the high transaction cost surrounding the sourcing and supply of the product for customers. Our fastener product line declined to 34.9% of sales in 2018 from 35.6% of sales in 2017. Larger customers (for which national accounts are a good proxy), whose more focused buying patterns allow us to offer them better pricing, also influence the gross profit margin. Sales to our national account customers increased to 51.2% in 2018 from 48.7% of sales in 2017. The combination of relatively slower growth in our fastener product line and relatively faster growth in sales to our largest customers contributed to the decline in our overall gross profit margin in 2018. (2) Rising costs related to transporting products, particularly shipping fees, driver wages, and fuel, caused our freight expense to rise faster than sales, hurting our gross profit margin. Since we operate our own fleet of trucks for moving product between suppliers, our distribution centers, and our in-market locations, rising transportation costs adversely impact our gross profit margin and have the effect of reducing our gross profit, particularly if we are unable to pass these costs to our customers. (3) We have experienced inflation that has caused the cost of many of the products we purchase to rise. We have instituted price increases aimed at mitigating the effects of these cost increases, but we believe these actions have lagged in their ability to offset rising costs for our products, particularly fasteners, in 2018.
27
During 2017 and 2016, our gross profit, as a percentage of net sales, decreased when compared to the prior year. In each year, the decrease was primarily caused by the changes in product and customer mix noted above, as well as the acquisition of Mansco in 2017. Mansco's customer mix is more heavily oriented toward larger customers and its product mix tends to carry a lower gross profit product mix than the company's other products.
Operating and Administrative Expenses
Our operating and administrative expenses (including the gain on sales of property and equipment), as a percentage of net sales, improved to 28.2% in 2018 from 29.2% in 2017. This improvement was a function of the growth in employee-related, occupancy-related, and all other operating and administrative expenses being more modest than the growth in sales. Each of these reduced the ratio of operating and administrative expenses as a percentage of sales by approximately 30 to 40 basis points in 2018 from 2017.
The growth in employee-related, occupancy-related, and all other operating and administrative expenses compared to the same periods in the preceding year, is outlined in the table below.
|
Approximate Percentage of Total Operating and Administrative Expenses
|
Twelve-month Period
|
||||||||
|
2018
|
2017
|
2016
|
|||||||
|
Employee-related expenses
|
65% to 70%
|
11.1
|
%
|
10.2
|
%
|
2.7
|
%
|
||
|
Occupancy-related expenses
|
15% to 20%
|
5.0
|
%
|
1.3
|
%
|
10.1
|
%
|
||
|
All other operating and administrative expenses
|
15% to 20%
|
5.2
|
%
|
21.4
|
%
|
4.0
|
%
|
||
Employee-related expenses include: (1) payroll (which includes cash compensation, stock option expense, and profit sharing), (2) health care, (3) personnel development, and (4) social taxes. Our employee-related expenses increased in 2018. This was related to: (1) an increase in full-time equivalent ('FTE') headcount related to efforts to support growth in our business, (2) higher performance bonuses and commissions due to growth in net sales and net earnings, (3) an increase in our profit sharing contribution, (4) increases in hourly base wages, and (5) increased health care costs. The increase in 2017, when compared to 2016, was related to: (1) an increase in FTE headcount related to efforts to support growth in our business, (2) higher performance bonuses and commissions due to growth in net sales and net earnings, as well as regulatory driven incremental compensation, (3) an increase in our profit sharing contribution and options awards, (4) increased health care costs, and (5) the inclusion of Mansco personnel. The increase in 2016, when compared to 2015, was caused by increases in average annual FTE headcount and an increase in health care costs, which were partially offset by a contraction in our performance bonuses and commissions and in our profit sharing contribution, primarily due to lower sales growth, gross profit, and operating income (both on a dollar basis and on a relative basis).
The table below summarizes the percentage change in our FTE headcount at the end of the periods presented compared to the end of the prior period:
|
Twelve-month Period
|
||||||||
|
2018
|
2017
|
2016
|
||||||
|
In-market locations
|
5.7
|
%
|
7.0
|
%
|
-5.6
|
%
|
||
|
Total selling (includes in-market locations)
|
5.4
|
%
|
7.3
|
%
|
-4.9
|
%
|
||
|
Distribution
|
12.2
|
%
|
8.4
|
%
|
-0.7
|
%
|
||
|
Manufacturing
|
12.0
|
%
|
8.4
|
%
|
-9.1
|
%
|
||
|
Administrative
|
7.3
|
%
|
10.7
|
%
|
0.3
|
%
|
||
|
Total
|
6.8
|
%
|
7.7
|
%
|
-4.1
|
%
|
||
Occupancy-related expenses include: (1) building rent and depreciation, (2) building utility costs, (3) equipment related to our branches and distribution locations, and (4) industrial vending equipment (we consider the vending equipment, excluding leased locker equipment, to be a logical extension of our in-market operations and classify the depreciation and repair costs as occupancy expense). The increase in occupancy-related expenses in 2018, when compared to 2017 was mainly driven by increases related to industrial vending equipment and non-branch occupancy and utility costs, only partly offset by a slight decline in branch occupancy costs from a lower public branch count. The slight increase in 2017, when compared to 2016, was mainly driven by increases in costs related to industrial vending equipment, FMI bins, and automation equipment at our distribution centers. The most significant components of our occupancy-related expenses, facility costs and utility expenses, were mostly flat in 2017, when compared to 2016 due to a reduction in our number of public branches. The increase in 2016, when compared to 2015, was mainly driven by an increase in the amount of industrial vending equipment and, to a lesser degree, an increase in occupancy expense related to rent.
28
All other operating and administrative expenses include: (1) selling-related transportation, (2) information technology (IT) expenses, and (3) general corporate expenses, which consists of legal expenses, general insurance expenses, travel and marketing expenses, etc. All other operating and administrative expenses increased in 2018 when compared to 2017, due to an increase in selling-related transportation expenses, consisting of both higher vehicle movement and fuel costs, as well as higher IT spending. General corporate expenses were slightly down. All other operating and administrative expenses increased in 2017 when compared to 2016. This was driven by increases in selling-related transportation, including higher vehicle movement and fuel costs, IT spending, and general corporate expenses. All other operating and administrative expenses increased in 2016 when compared to 2015. This was driven by primarily by higher IT spending, while selling-related transportation expenses rose modestly and general corporate expenses were relatively flat.
Net Interest Expense
Our net interest expense was $12.3 in 2018 compared to $8.7 in 2017, and $6.1 in 2016. The increase in 2018, when compared to 2017, was mainly caused by higher average interest rates and a higher average debt balance during the period. The increase in 2017, when compared to 2016, was mainly caused by higher average interest rates and a slightly higher average debt balance during the period.
Income Taxes
We recorded income tax expense of $235.1 in 2018, or 23.8% of earnings before income taxes. The effective income tax rate was significantly impacted by the following two items: (1) The lower corporate tax rate provided by the Tax Act resulted in a lower tax rate beginning in the first quarter of 2018. The effective income tax rate includes the immaterial impact of the U.S. tax on certain offshore earnings referred to as Global Intangible Low-Taxed Income (GILTI), a new deduction for Foreign Derived Intangible Income (FDII), and the new alternative U.S. tax on certain Base Erosion Anti-Avoidance (BEAT) payments from a U.S. company to any foreign related party. (2) Discrete income tax items to adjust our transition tax liability, reflect the impacts of accelerating depreciation for certain physical assets, and remeasure the impact of the U.S. tax rate on certain inter-company transactions. These discrete items resulted in approximately
$7.1
of income tax benefit during 2018. The accounting for the income tax effects of the Tax Act is complete as of December 31, 2018.
We recorded a provisional income tax expense of $294.5 in 2017, or 33.7% of earnings before income taxes. This amount reflects a provisional estimate for the reduction in our deferred income tax liabilities of $30.8 as a result of the income tax rate decrease included in the Tax Act, partially offset by an estimated increase in income tax payable in the amount of $6.5 as a result of the transition tax on cash and cash equivalent balances related to accumulated earnings associated with our international operations, also included in the Tax Act. The decrease in our income tax rate from 2016 to 2017 was also related to changes in our reserve for uncertain tax positions and the adoption of the Financial Accounting Standards Board ('FASB') Accounting Standard Update ('ASU') 2016-09,
Improvements to Employee Share-Based Payment Accounting
, in the first quarter of 2017.
Income taxes, as a percentage of earnings before income taxes, were approximately 36.8% for
2016
. The decrease in our income tax rate from 2015 to 2016 was caused by a slight change in jurisdictional income and changes in the reserve for uncertain tax positions. As our international business and profits grew the past several years, the lower income tax rates in those jurisdictions, relative to the United States, lowered our effective tax rate.
29
Net Earnings
Net earnings, net earnings per share (EPS), the percentage change in net earnings, and the percentage change in EPS, were as follows:
|
Dollar Amounts
|
2018
(1)
|
2017
(2)
|
2016
|
||||||
|
Net earnings
|
$
|
751.9
|
|
578.6
|
|
499.4
|
|
||
|
Basic EPS
|
2.62
|
|
2.01
|
|
1.73
|
|
|||
|
Diluted EPS
|
2.62
|
|
2.01
|
|
1.73
|
|
|||
|
Percentage Change
|
2018
(1)
|
2017
(2)
|
2016
|
||||||
|
Net earnings
|
29.9
|
%
|
15.8
|
%
|
-3.3
|
%
|
|||
|
Basic EPS
|
30.5
|
%
|
16.1
|
%
|
-2.3
|
%
|
|||
|
Diluted EPS
|
30.5
|
%
|
16.2
|
%
|
-2.3
|
%
|
|||
(1)
Absent the impact of the Tax Act, our net earnings for 2018 would have been $625.2, an increase of 12.8% when compared to 2017, and our basic and diluted earnings per share would have each been $2.18, an increase of 13.3%.
(2)
Absent the impact of the Tax Act, our net earnings for 2017 would have been $554.2, an increase of 11.0% when compared to 2016, and our basic and diluted earnings per share would have each been $1.92, an increase of 11.2% and 11.3%, respectively.
During 2018, net earnings increased, primarily due to stronger sales and operating profits combined with a reduction in income tax expense. The increase in basic and diluted earnings per share also reflected the purchase of our shares of common stock in 2018. During 2017, net earnings increased, primarily due to stronger sales and operating profits combined with a reduction in income tax expense. The slightly higher increase in basic and diluted earnings per share was primarily due to the purchase of our shares of common stock in 2017. During 2016, net earnings decreased, despite our nominal sales growth, primarily due to the reduction in the gross profit percent realized and an increase in operating and administrative expenses. The contraction of basic and diluted earnings per share was smaller due primarily to the purchase of our shares of common stock in 2015 and early 2016.
Liquidity and Capital Resources
Net Cash Provided by Operating Activities
Net cash provided by operating activities in dollars and as a percentage of net earnings were as follows:
|
2018
|
2017
|
2016
|
|||||||
|
Net cash provided
|
$
|
674.2
|
|
585.2
|
|
519.9
|
|
||
|
% of net earnings
|
89.7
|
%
|
101.1
|
%
|
104.1
|
%
|
|||
In 2018, the increase in net cash provided by operating activities was primarily due to our net earnings growth, which resulted from higher earnings growth and a lower tax rate as a result of the Tax Act. The decline in our operating cash flow as a percentage of net earnings largely reflects working capital trends, as further described below. In 2017, the increase in net cash provided by operating activities was primarily due to our net earnings growth. The decline in our operating cash flow as a percentage of net earnings largely reflects working capital trends, and specifically accounts receivable. In 2016, the slight contraction in the net cash provided by operating activities was driven by our initiative to add additional products into branch inventory under our CSP 16 format, and an increase in net accounts receivable growth. This decrease was partially offset by a reduction in net cash paid for income taxes.
30
Operational Working Capital
Operational working capital, which we define as accounts receivable, net and inventories, is highlighted below. The annual dollar change and the annual percentage change were as follows:
|
Dollar change
|
2018
|
2017
|
||||
|
Accounts receivable, net
|
$
|
106.4
|
|
108.1
|
|
|
|
Inventories
|
185.8
|
|
99.9
|
|
||
|
Operational working capital
|
$
|
292.2
|
|
208.1
|
|
|
|
Annual percentage change
|
2018
|
2017
|
||||
|
Accounts receivable, net
|
17.5
|
%
|
21.6
|
%
|
||
|
Inventories
|
17.0
|
%
|
10.1
|
%
|
||
|
Operational working capital
|
17.2
|
%
|
13.9
|
%
|
||
Note – Amounts may not foot due to rounding difference.
In 2018, the annual growth in net accounts receivable reflects accelerating growth in sales throughout the course of the year combined with relatively stronger growth of our national accounts and international business. In addition, two trends emerged among our customer base that increased our net accounts receivable. The first was a push from our customers to contractually increase the period between when they are invoiced and when payment is due. The second was customers delaying payments beyond the end of the applicable quarter. We saw these behaviors intensify throughout 2018. In 2017, the annual growth in net accounts receivable reflects accelerating growth in sales throughout the course of the year combined with relatively stronger growth of our national accounts and international business. Growth in accounts receivable continued in the fourth quarter of 2017, with the timing of the Christmas and New Year holidays affecting the timing of these customers' payments. Currency fluctuations also impacted accounts receivable in 2017.
Our growth in inventory balances over time does not have as tight a relationship to our monthly sales patterns as does our growth in accounts receivable. One reason for this is cyclical. The lead time for inventory procurement is typically longer than the visibility we have into future monthly sales patterns, so economic downturns can cause a spike in inventory levels, as was seen in the dramatic economic slowdown in late 2008 and early 2009. Inventories may also fluctuate independent of monthly sales patterns based on strategic decisions. For instance, at various times we have increased our relative inventory levels based on new branch openings, expanded stocking breadth at distribution centers and/or individual branches (e.g., CSP), expanded direct sourcing, and expanded Fastenal brands. Our growth drivers, including industrial vending solutions, national accounts, and Onsite and international locations, have also required significant investments in inventory. In 2018, our inventories increased as a result of growth in general demand and successful execution of our growth drivers. Inflation had an increasing impact in the second half of 2018, and our decision to accelerate shipments of product to the U.S. from overseas ahead of potential tariffs resulted in extra inventory of approximately $12.0 in the fourth quarter of 2018. In 2017, the most significant contributor to the increase in inventories was improving business activity and the growth of our Onsite business.
The approximate percentage mix of inventory stocked at our selling locations versus our distribution center and manufacturing locations was as follows at year end:
|
2018
|
2017
|
2016
|
||||||
|
Selling locations
|
61
|
%
|
65
|
%
|
64
|
%
|
||
|
Distribution center and manufacturing locations
|
39
|
%
|
35
|
%
|
36
|
%
|
||
|
Total
|
100
|
%
|
100
|
%
|
100
|
%
|
||
Net Cash Used in Investing Activities
Net cash used in investing activities in dollars and as a percentage of net earnings were as follows:
|
2018
|
2017
|
2016
|
|||||||
|
Net cash used
|
$
|
173.9
|
|
179.3
|
|
188.1
|
|
||
|
% of net earnings
|
23.1
|
%
|
31.0
|
%
|
37.7
|
%
|
|||
The changes in net cash used in investing activities were primarily related to changes in our net capital expenditures as discussed below for each period and cash paid for acquisitions in 2017.
31
Net capital expenditures (purchases of property and equipment, less proceeds from the sale of property and equipment) in dollars and as a percentage of net earnings were as follows:
|
2018
|
2017
|
2016
|
|||||||
|
Net capital expenditures
|
$
|
166.8
|
|
112.5
|
|
183.0
|
|
||
|
% of net earnings
|
22.2
|
%
|
19.4
|
%
|
36.6
|
%
|
|||
Note – A reconciliation of net capital expenditures is outlined in the table below.
Our net capital expenditures increased in 2018, when compared to 2017, primarily due to increased spending on hub property and equipment, both to expand current capacity and for potential future expansion, as well as vending devices to support the growth of our industrial vending program. Our net capital expenditures decreased in 2017, when compared to 2016, primarily due to lower spending in 2017 related to: (1) the absence of spending on vending equipment that occurred in 2016 related to the leased locker rollout, (2) the absence of spending on shelving and signage that occurred in 2016 for the CSP 16 initiative, and (3) timing associated with the addition of pick-up trucks. Our net capital expenditures increased in 2016 primarily due to the purchase of industrial vending devices related to the leased locker program we signed in February 2016 and spending on automation in certain distribution centers.
Property and equipment expenditures in
2018
,
2017
, and
2016
consisted of: (1) the purchase of software and hardware for our information processing systems, (2) the addition of fleet vehicles, (3) the purchase of signage, shelving, and other fixed assets related to branch openings and our CSP 16 initiative, (4) the addition of manufacturing and warehouse equipment, (5) the expansion or improvement of certain owned or leased branch properties, (6) purchases related to industrial vending, and (7) costs related to enhancements to distribution centers including automated systems equipment. Disposals of property and equipment consisted of the planned disposition of certain pick-up trucks, distribution vehicles and trailers in the normal course of business, and the disposition of real estate relating to several branch locations.
Set forth below is a recap of our
2018
,
2017
, and
2016
net capital expenditures.
|
2018
|
2017
|
2016
|
||||||
|
Manufacturing, warehouse and packaging equipment, industrial vending equipment, and facilities
|
110.7
|
|
66.2
|
|
131.8
|
|
||
|
Shelving and related supplies for branch openings and for product expansion at existing branches
|
9.6
|
|
8.3
|
|
14.1
|
|
||
|
Data processing software and equipment
|
30.9
|
|
23.2
|
|
18.0
|
|
||
|
Real estate and improvements to branch locations
|
12.9
|
|
6.2
|
|
5.5
|
|
||
|
Vehicles
|
12.2
|
|
16.0
|
|
20.1
|
|
||
|
Purchases of property and equipment
|
176.3
|
|
119.9
|
|
189.5
|
|
||
|
Proceeds from sale of property and equipment
|
(9.5
|
)
|
(7.4
|
)
|
(6.5
|
)
|
||
|
Net capital expenditures
|
166.8
|
|
112.5
|
|
183.0
|
|
||
We expect our net capital expenditures in 2019 to be within a range of $195.0 to $225.0. This increase is a result of higher spending for property and equipment to expand our hub capacity, vending devices, and hub vehicles, with our investments in hub capacity likely to be the primary determinant of where we fall within our range. We anticipate funding our capital expenditure needs with cash generated from operations, from available cash and cash equivalents, and from our borrowing capacity.
Net Cash Used in Financing Activities
Net cash used in financing activities in dollars and as a percentage of net earnings were as follows:
|
2018
|
2017
|
2016
|
|||||||
|
Net cash used
|
$
|
446.5
|
|
407.2
|
|
346.8
|
|
||
|
% of net earnings
|
59.4
|
%
|
70.4
|
%
|
69.4
|
%
|
|||
32
The fluctuations in net cash used in financing activities are due to changes in the level of our dividend payments and in the level of common stock purchases. These amounts were partially offset by the exercise of stock options and net proceeds from debt obligations. These items in dollars and as a percentage of earnings were as follows:
|
2018
|
2017
|
2016
|
|||||||
|
Dividends paid
|
$
|
441.9
|
|
369.1
|
|
346.6
|
|
||
|
% of net earnings
|
58.8
|
%
|
63.8
|
%
|
69.4
|
%
|
|||
|
Common stock purchases
|
103.0
|
|
82.6
|
|
59.5
|
|
|||
|
% of net earnings
|
13.7
|
%
|
14.3
|
%
|
11.9
|
%
|
|||
|
Total returned to shareholders
|
$
|
544.9
|
|
451.7
|
|
406.1
|
|
||
|
% of net earnings
|
72.5
|
%
|
78.1
|
%
|
81.3
|
%
|
|||
|
Proceeds from the exercise of stock options
|
$
|
(13.4
|
)
|
(9.5
|
)
|
(29.3
|
)
|
||
|
% of net earnings
|
-1.8
|
%
|
-1.6
|
%
|
-5.9
|
%
|
|||
|
Cash borrowings, net
|
$
|
(85.0
|
)
|
(35.0
|
)
|
(30.0
|
)
|
||
|
% of net earnings
|
-11.3
|
%
|
-6.0
|
%
|
-6.0
|
%
|
|||
|
Net cash used
|
$
|
446.5
|
|
407.2
|
|
346.8
|
|
||
|
% of net earnings
|
59.4
|
%
|
70.4
|
%
|
69.4
|
%
|
|||
Stock Purchases
In 2018, we purchased 2,000,000 shares of our common stock at an average price of approximately $51.50 per share, in 2017, we purchased 1,900,000 shares at an average price of approximately $43.43 per share, and in 2016, we purchased 1,600,000 shares at an average price of approximately $37.15 per share.
Dividends
We declared a quarterly dividend of
$0.43
per share on
January 16, 2019
. We paid aggregate annual dividends per share of
$1.54
, $
1.28
, and $
1.20
in
2018
,
2017
, and
2016
, respectively.
Debt
In order to fund the considerable cash needed to expand our industrial vending business, to increase the use of automation in our distribution centers, to purchase our common stock and pay dividends, and to fund the acquisition of Mansco on March 31, 2017, we have borrowed under our Credit Facility and our Master Note Agreement in recent periods.
Our borrowings under the Credit Facility peaked during each quarter of 2018 and 2017 as follows:
|
Peak borrowings
|
2018
|
2017
|
||||
|
First quarter
|
$
|
335.0
|
|
325.0
|
|
|
|
Second quarter
|
360.0
|
|
365.0
|
|
||
|
Third quarter
|
330.0
|
|
365.0
|
|
||
|
Fourth quarter
|
435.0
|
|
325.0
|
|
||
As of December 31, 2018, we had loans outstanding under the Credit Facility of
$365.0
and contingent obligations from letters of credit outstanding under the Credit Facility in an aggregate face amount of
$36.3
. As of
December 31, 2018
, we also had loans outstanding under the Master Note Agreement of
$135.0
. Descriptions of our Credit Facility and Master Note Agreement are contained in Note 9 of the Notes to Consolidated Financial Statements.
Unremitted Foreign Earnings
Approximately $118.4 of cash and cash equivalents are held by non-U.S. subsidiaries. These funds may create foreign currency translation gains or losses depending on the functional currency of the entity holding the cash. We have considered the financial requirements of each foreign subsidiary and our parent company and will continue to reinvest these funds to support our expansion activities outside the U.S., even after taking into consideration the deemed repatriation and transition tax under the
33
Tax Act. The income tax impact of repatriating cash associated with investments in foreign subsidiaries is discussed in Note 7 of the Notes to Consolidated Financial Statements.
Effects of Inflation
Throughout 2018, we experienced increasing product cost inflation for non-fastener and, especially, fastener products. We took actions in the latter part of 2017 and throughout 2018, including pricing adjustments, to offset this inflation. While we succeeded in raising prices through the year, we were not able to do so at the same rate that our costs rose which negatively affected our profit margins and earnings in 2018. Apart from generalized inflation, tariffs were instituted on certain products that we source from China, but this occurred later in the year and did not have a meaningful impact on sales or profits in 2018. Throughout 2017, we experienced increasing product cost inflation, particularly in our fastener products. We were able to take actions during the period, including pricing adjustments, to mostly offset this inflation. In the aggregate, the overall impact of inflation and pricing on sales and profits was not material in 2017. During the first half of 2016, we experienced some deflation in our fastener products, which was largely offset by some inflation in the latter half of the year, and minimal price movements in our non-fastener products.
Critical Accounting Policies and Estimates
In preparing our consolidated financial statements in conformity with U.S. GAAP, we must make decisions that impact the reported amounts of assets, liabilities, revenues and expenses, and the related disclosures. Such decisions include the selection of the appropriate accounting principles to be applied and the assumptions on which to base accounting estimates. In reaching such decisions, we apply judgments based on our understanding and analysis of relevant circumstances, historical experience, and actuarial valuations. Actual amounts could differ from those estimated at the time the consolidated financial statements are prepared.
Our most significant accounting policies, including Revenue Recognition and Inventories, are described in Note 1 of the Notes to Consolidated Financial Statements. Some of those significant accounting policies require us to make difficult, subjective, or complex judgments, or estimates. An accounting estimate is considered to be critical if it meets both of the following criteria: (i) the estimate requires assumptions about matters that are highly uncertain at the time the accounting estimate is made, and (ii) different estimates reasonably could have been used, or changes in the estimate that are reasonably likely to occur from period to period may have a material impact on the presentation of our financial condition, changes in financial condition, or results of operations. Our most critical accounting estimates include the following:
Allowance for doubtful accounts
– This reserve is for accounts receivable balances that are potentially uncollectible. The reserve is based on an analysis of customer accounts and our historical experience with accounts receivable write-offs. Our methodology for estimating this reserve includes ongoing reviews of the aging of accounts receivable, the financial condition of a customer or industry, and general economic conditions. If business or economic conditions change, our estimates and assumptions may be adjusted as deemed appropriate. Historically, actual required reserves have not varied materially from estimated amounts.
Inventory obsolescence reserves
– These reserves are based on an analysis of inventory trends including reviews of inventory levels, sales information, and the on-hand quantities relative to the sales history for the product. Our methodology for estimating these reserves is continually evaluated for factors that could require changes to the reserves including significant changes in product demand, market conditions, condition of the inventory, or liquidation value. If business or economic conditions change, our estimates and assumptions may be adjusted as deemed appropriate. Historically, actual required reserves have not varied materially from estimated amounts.
General insurance reserves
– These reserves are for general claims related to workers' compensation, property and casualty losses, and other general liability self-insured losses. The reserves are based on an analysis of reported claims and claims incurred but not yet reported related to our historical claim trends. We perform ongoing reviews of our insured and uninsured risks and use this information to establish appropriate reserve levels. We analyze historical trends, claims experience, and loss development patterns to ensure the appropriate loss development factors are applied to the incurred costs associated with the claims made. Historically, actual required reserves have not varied materially from estimated amounts.
New Accounting Pronouncements
A description of new accounting pronouncements is contained in Note 1 of the Notes to Consolidated Financial Statements.
Geographic Information
Information regarding our revenues and long-lived assets by geographic area is contained in Note 2 and Note 3 of the Notes to Consolidated Financial Statements. Risks related to our foreign operations are described earlier in this Form 10-K under the heading 'Forward-Looking Statements' and 'Item 1A. Risk Factors'.
34
Certain Contractual Obligations
As of December 31, 2018, we had outstanding long-term debt and facilities, equipment, and vehicles leased under operating leases. Our future obligations to pay principal of and interest on such long-term debt and to make minimum lease payments under such operating leases are as follows:
|
Total
|
2019
|
2020 and 2021
|
2022 and 2023
|
After 2023
|
|||||||||||
|
Principal of long-term debt
|
$
|
500.0
|
|
3.0
|
|
40.0
|
|
397.0
|
|
60.0
|
|
||||
|
Interest on long-term debt
(1)
|
80.6
|
|
16.9
|
|
33.5
|
|
29.9
|
|
0.3
|
|
|||||
|
Operating leases
|
309.5
|
|
124.1
|
|
148.3
|
|
33.4
|
|
3.7
|
|
|||||
|
Total
|
$
|
890.1
|
|
144.0
|
|
221.8
|
|
460.3
|
|
64.0
|
|
||||
(1)
Interest on the long-term debt outstanding under our Credit Facility was calculated using the interest rates and balances at December 31, 2018.
Purchase orders and contracts for the purchase of inventory and other goods and services are not included in the table above. Our purchase orders are based on current distribution needs and are fulfilled by our suppliers within short time horizons. We do not have significant agreements for the purchase of inventory or other goods or services specifying minimum order quantities.
Liabilities for uncertain tax positions have been excluded from the table above due to the uncertainty surrounding the ultimate settlement and timing of these liabilities, which we believe will be immaterial. A discussion of income taxes is contained in Note 7 of the Notes to Consolidated Financial Statements.
Non-GAAP Financial Measures
On December 22, 2017, the Tax Act was signed into law. The financial information included in this Form 10-K reflects the impact of the enactment of the Tax Act. Our net earnings and basic and diluted net earnings per share for 2017 and 2018 excluding the impact of the Tax Act or certain discrete tax items related to the Tax Act, are non-GAAP financial measures. Management believes reporting these measures will help investors understand the effect of tax reform on comparable reported results, and the comparable GAAP measure without these adjustments precedes any disclosure that excludes the impact of the Tax Act or certain discrete items related to the Tax Act.
35
|
ITEM 7A.
|
QUANTITATIVE AND QUALITATIVE DISCLOSURES ABOUT MARKET RISKS
|
We are exposed to certain market risks from changes in foreign currency exchange rates, commodity steel pricing, commodity energy prices, and interest rates. Changes in these factors cause fluctuations in our earnings and cash flows. We evaluate and manage exposure to these market risks as follows:
Foreign currency exchange rates
– Foreign currency fluctuations can affect our net investments, our operations in countries other than the U.S., and earnings denominated in foreign currencies. Historically, our primary exchange rate exposure has been with the Canadian dollar against the United States dollar. Our estimated net earnings exposure for foreign currency exchange rates was not material at year end. We have not historically hedged our foreign currency risk given that exposure to date has not been material.
Commodity steel pricing
– We buy and sell various types of steel products; these products consist primarily of different types of threaded fasteners. During 2018, we experienced inflation in the cost of steel products. During 2017, we experienced some inflation in the cost of steel products. During the first half of 2016, we experienced some deflation in the cost of steel products. This deflation was largely offset by some inflation in the latter half of the year. We are exposed to the impacts of commodity steel pricing and our related ability to pass through the impacts to our end customers.
Commodity energy prices
– We have market risk for changes in prices of gasoline, diesel fuel, natural gas, and electricity.
Prices for these commodities began to ease late in the year, but for most of 2018, we saw rising costs for these commodities, and that resulted in increases in fuel costs for our hub and field-based vehicles and utility costs for our in-market locations, distribution centers, and manufacturing facilities. Fossil fuels are also often a key feedstock for chemicals and plastics that comprise a key raw material for many products that we sell. As a result, rising costs for these commodities in recent months are resulting in higher costs for many of these products. We believe that over time these risks are mitigated in part by our ability to pass freight and product costs to our customers, the efficiency of our trucking distribution network, and the ability, over time, to manage our occupancy costs related to the heating and cooling of our facilities through better efficiency.
Interest rates
- Loans under our Credit Facility bear interest at floating rates tied to LIBOR (or, if LIBOR is no longer available, at a replacement rate to be determined by the administrative agent for the Credit Facility and consented to by us). As a result, changes in LIBOR can affect our operating results and liquidity to the extent we do not have effective interest rate swap arrangements in place. We have not historically used interest rate swap arrangements to hedge the variable interest rates under our Credit Facility. A one percentage point increase in LIBOR in 2018 would have resulted in approximately $3.0 of additional interest expense. A description of our Credit Facility is contained in Note 9 of the Notes to Consolidated Financial Statements.
36
|
ITEM 8.
|
FINANCIAL STATEMENTS AND SUPPLEMENTARY DATA
|
REPORT OF INDEPENDENT REGISTERED PUBLIC ACCOUNTING FIRM
To the shareholders and board of directors of
Fastenal Company:
Opinions on the Consolidated Financial Statements and Internal Control Over Financial Reporting
We have audited the accompanying consolidated balance sheets of Fastenal Company and subsidiaries (the 'Company') as of December 31, 2018 and 2017, the related consolidated statements of earnings, comprehensive income, stockholders’ equity, and cash flows for each of the years in the three-year period ended December 31, 2018, and the related notes and financial statement schedule listed in the table of contents at Item 15 (collectively, the 'consolidated financial statements'). We also have audited the Company's internal control over financial reporting as of December 31, 2018, based on criteria established in
Internal Control - Integrated Framework
(2013)
issued by the Committee of Sponsoring Organizations of the Treadway Commission.
In our opinion, the consolidated financial statements referred to above present fairly, in all material respects, the financial position of the Company as of December 31, 2018 and 2017, and the results of its operations and its cash flows for each of the years in the three-year period ended December 31, 2018, in conformity with U.S. generally accepted accounting principles. Also in our opinion, the Company maintained, in all material respects, effective internal control over financial reporting as of December 31, 2018, based on criteria established in
Internal Control - Integrated Framework (2013)
issued by the Committee of Sponsoring Organizations of the Treadway Commission.
Basis for Opinions
The Company's management is responsible for these consolidated financial statements, for maintaining effective internal control over financial reporting, and for its assessment of the effectiveness of internal control over financial reporting, included in the accompanying Management's Report on Internal Control Over Financial Reporting. Our responsibility is to express an opinion on the Company's consolidated financial statements and an opinion on the Company's internal control over financial reporting based on our audits. We are a public accounting firm registered with the Public Company Accounting Oversight Board (United States) ('PCAOB') and are required to be independent with respect to the Company in accordance with the U.S. federal securities laws and the applicable rules and regulations of the Securities and Exchange Commission and the PCAOB.
We conducted our audits in accordance with the standards of the PCAOB. Those standards require that we plan and perform the audits to obtain reasonable assurance about whether the consolidated financial statements are free of material misstatement, whether due to error or fraud, and whether effective internal control over financial reporting was maintained in all material respects.
Our audits of the consolidated financial statements included performing procedures to assess the risks of material misstatement of the consolidated financial statements, whether due to error or fraud, and performing procedures that respond to those risks. Such procedures included examining, on a test basis, evidence regarding the amounts and disclosures in the consolidated financial statements. Our audits also included evaluating the accounting principles used and significant estimates made by management, as well as evaluating the overall presentation of the consolidated financial statements. Our audit of internal control over financial reporting included obtaining an understanding of internal control over financial reporting, assessing the risk that a material weakness exists, and testing and evaluating the design and operating effectiveness of internal control based on the assessed risk. Our audits also included performing such other procedures as we considered necessary in the circumstances. We believe that our audits provide a reasonable basis for our opinions.
Definition and Limitations of Internal Control Over Financial Reporting
A company's internal control over financial reporting is a process designed to provide reasonable assurance regarding the reliability of financial reporting and the preparation of financial statements for external purposes in accordance with generally accepted accounting principles. A company's internal control over financial reporting includes those policies and procedures that (1) pertain to the maintenance of records that, in reasonable detail, accurately and fairly reflect the transactions and dispositions of the assets of the company; (2) provide reasonable assurance that transactions are recorded as necessary to permit preparation of financial statements in accordance with generally accepted accounting principles, and that receipts and expenditures of the company are being made only in accordance with authorizations of management and directors of the company; and (3) provide reasonable assurance regarding prevention or timely detection of unauthorized acquisition, use, or disposition of the company’s assets that could have a material effect on the financial statements.
37
Because of its inherent limitations, internal control over financial reporting may not prevent or detect misstatements. Also, projections of any evaluation of effectiveness to future periods are subject to the risk that controls may become inadequate because of changes in conditions, or that the degree of compliance with the policies or procedures may deteriorate.
/s/ KPMG LLP
We have served as the Company’s auditor since 1987.
Minneapolis, Minnesota
February 6, 2019
38
FASTENAL COMPANY AND SUBSIDIARIES
Consolidated Balance Sheets
(Amounts in millions except share information)
|
|
December 31
|
|||||
|
|
2018
|
2017
|
||||
|
Assets
|
||||||
|
Current assets:
|
||||||
|
Cash and cash equivalents
|
$
|
167.2
|
|
116.9
|
|
|
|
Trade accounts receivable, net of allowance for doubtful accounts of $12.8 and $11.9, respectively
|
714.3
|
|
607.8
|
|
||
|
Inventories
|
1,278.7
|
|
1,092.9
|
|
||
|
Prepaid income taxes
|
9.0
|
|
—
|
|
||
|
Other current assets
|
147.0
|
|
118.1
|
|
||
|
Total current assets
|
2,316.2
|
|
1,935.7
|
|
||
|
Property and equipment, net
|
924.8
|
|
893.6
|
|
||
|
Other assets
|
80.5
|
|
81.2
|
|
||
|
Total assets
|
$
|
3,321.5
|
|
2,910.5
|
|
|
|
Liabilities and Stockholders' Equity
|
||||||
|
Current liabilities:
|
||||||
|
Current portion of debt
|
$
|
3.0
|
|
3.0
|
|
|
|
Accounts payable
|
193.6
|
|
147.5
|
|
||
|
Accrued expenses
|
240.8
|
|
194.0
|
|
||
|
Income taxes payable
|
—
|
|
6.5
|
|
||
|
Total current liabilities
|
437.4
|
|
351.0
|
|
||
|
Long-term debt
|
497.0
|
|
412.0
|
|
||
|
Deferred income taxes
|
84.4
|
|
50.6
|
|
||
|
Commitments and contingencies (Notes 5, 8, 9, and 10)
|
|
|
||||
|
Stockholders’ equity:
|
||||||
|
Preferred stock: $0.01 par value, 5,000,000 shares authorized, no shares issued or outstanding
|
—
|
|
—
|
|
||
|
Common stock: $0.01 par value, 400,000,000 shares authorized, 285,901,919 and 287,591,536 shares issued and outstanding, respectively
|
2.9
|
|
2.9
|
|
||
|
Additional paid-in capital
|
3.0
|
|
8.5
|
|
||
|
Retained earnings
|
2,341.6
|
|
2,110.6
|
|
||
|
Accumulated other comprehensive loss
|
(44.8
|
)
|
(25.1
|
)
|
||
|
Total stockholders’ equity
|
2,302.7
|
|
2,096.9
|
|
||
|
Total liabilities and stockholders’ equity
|
$
|
3,321.5
|
|
2,910.5
|
|
|
See accompanying Notes to Consolidated Financial Statements.
39
FASTENAL COMPANY AND SUBSIDIARIES
Consolidated Statements of Earnings
(Amounts in millions except earnings per share)
For the year ended December 31
|
2018
|
2017
|
2016
|
|||||||
|
Net sales
|
$
|
4,965.1
|
|
4,390.5
|
|
3,962.0
|
|
||
|
Cost of sales
|
2,566.2
|
|
2,226.9
|
|
1,997.2
|
|
|||
|
Gross profit
|
2,398.9
|
|
2,163.6
|
|
1,964.8
|
|
|||
|
Operating and administrative expenses
|
1,400.2
|
|
1,282.8
|
|
1,169.5
|
|
|||
|
Gain on sale of property and equipment
|
(0.5
|
)
|
(1.0
|
)
|
(0.5
|
)
|
|||
|
Operating income
|
999.2
|
|
881.8
|
|
795.8
|
|
|||
|
Interest income
|
0.4
|
|
0.4
|
|
0.4
|
|
|||
|
Interest expense
|
(12.6
|
)
|
(9.1
|
)
|
(6.5
|
)
|
|||
|
Earnings before income taxes
|
987.0
|
|
873.1
|
|
789.7
|
|
|||
|
Income tax expense
|
235.1
|
|
294.5
|
|
290.3
|
|
|||
|
Net earnings
|
$
|
751.9
|
|
578.6
|
|
499.4
|
|
||
|
Basic net earnings per share
|
$
|
2.62
|
|
2.01
|
|
1.73
|
|
||
|
Diluted net earnings per share
|
$
|
2.62
|
|
2.01
|
|
1.73
|
|
||
|
Basic weighted average shares outstanding
|
287.0
|
|
288.2
|
|
288.9
|
|
|||
|
Diluted weighted average shares outstanding
|
287.2
|
|
288.3
|
|
289.2
|
|
|||
See accompanying Notes to Consolidated Financial Statements.
40
FASTENAL COMPANY AND SUBSIDIARIES
Consolidated Statements of Comprehensive Income
(Amounts in millions)
For the year ended December 31
|
2018
|
2017
|
2016
|
|||||||
|
Net earnings
|
$
|
751.9
|
|
578.6
|
|
499.4
|
|
||
|
Other comprehensive income (loss), net of tax:
|
|||||||||
|
Foreign currency translation adjustments (net of tax of $0.0 in 2018, 2017, and 2016)
|
(19.7
|
)
|
22.2
|
|
(0.9
|
)
|
|||
|
Comprehensive income
|
$
|
732.2
|
|
600.8
|
|
498.5
|
|
||
See accompanying Notes to Consolidated Financial Statements.
41
FASTENAL COMPANY AND SUBSIDIARIES
Consolidated Statements of Stockholders' Equity
(Amounts in millions)
|
|
Common Stock
|
|
|
|
|
|||||||||||||
|
|
Shares
|
Amount
|
Additional
Paid-in
Capital
|
Retained
Earnings
|
Accumulated
Other
Comprehensive
Income (Loss)
|
Total
Stockholders' Equity |
||||||||||||
|
Balance as of December 31, 2015
|
289.6
|
|
$
|
2.9
|
|
2.0
|
|
1,842.9
|
|
(46.4
|
)
|
1,801.4
|
|
|||||
|
Dividends paid in cash
|
—
|
|
—
|
|
—
|
|
(346.6
|
)
|
—
|
|
(346.6
|
)
|
||||||
|
Purchases of common stock
|
(1.6
|
)
|
—
|
|
(3.9
|
)
|
(55.6
|
)
|
—
|
|
(59.5
|
)
|
||||||
|
Stock options exercised
|
1.2
|
|
—
|
|
29.3
|
|
—
|
|
—
|
|
29.3
|
|
||||||
|
Stock-based compensation
|
—
|
|
—
|
|
4.1
|
|
—
|
|
—
|
|
4.1
|
|
||||||
|
Excess tax benefits from stock-based compensation
|
—
|
|
—
|
|
5.9
|
|
—
|
|
—
|
|
5.9
|
|
||||||
|
Net earnings
|
—
|
|
—
|
|
—
|
|
499.4
|
|
—
|
|
499.4
|
|
||||||
|
Other comprehensive income (loss)
|
—
|
|
—
|
|
—
|
|
—
|
|
(0.9
|
)
|
(0.9
|
)
|
||||||
|
Balance as of December 31, 2016
|
289.2
|
|
$
|
2.9
|
|
37.4
|
|
1,940.1
|
|
(47.3
|
)
|
1,933.1
|
|
|||||
|
Dividends paid in cash
|
—
|
|
—
|
|
—
|
|
(369.1
|
)
|
—
|
|
(369.1
|
)
|
||||||
|
Purchases of common stock
|
(1.9
|
)
|
—
|
|
(43.6
|
)
|
(39.0
|
)
|
—
|
|
(82.6
|
)
|
||||||
|
Stock options exercised
|
0.3
|
|
—
|
|
9.5
|
|
—
|
|
—
|
|
9.5
|
|
||||||
|
Stock-based compensation
|
—
|
|
—
|
|
5.2
|
|
—
|
|
—
|
|
5.2
|
|
||||||
|
Net earnings
|
—
|
|
—
|
|
—
|
|
578.6
|
|
—
|
|
578.6
|
|
||||||
|
Other comprehensive income (loss)
|
—
|
|
—
|
|
—
|
|
—
|
|
22.2
|
|
22.2
|
|
||||||
|
Balance as of December 31, 2017
|
287.6
|
|
$
|
2.9
|
|
8.5
|
|
2,110.6
|
|
(25.1
|
)
|
2,096.9
|
|
|||||
|
Dividends paid in cash
|
—
|
|
—
|
|
—
|
|
(441.9
|
)
|
—
|
|
(441.9
|
)
|
||||||
|
Purchases of common stock
|
(2.0
|
)
|
—
|
|
(24.0
|
)
|
(79.0
|
)
|
—
|
|
(103.0
|
)
|
||||||
|
Stock options exercised
|
0.3
|
|
—
|
|
13.4
|
|
—
|
|
—
|
|
13.4
|
|
||||||
|
Stock-based compensation
|
—
|
|
—
|
|
5.1
|
|
—
|
|
—
|
|
5.1
|
|
||||||
|
Net earnings
|
—
|
|
—
|
|
—
|
|
751.9
|
|
—
|
|
751.9
|
|
||||||
|
Other comprehensive income (loss)
|
—
|
|
—
|
|
—
|
|
—
|
|
(19.7
|
)
|
(19.7
|
)
|
||||||
|
Balance as of December 31, 2018
|
285.9
|
|
$
|
2.9
|
|
3.0
|
|
2,341.6
|
|
(44.8
|
)
|
2,302.7
|
|
|||||
See accompanying Notes to Consolidated Financial Statements.
42
FASTENAL COMPANY AND SUBSIDIARIES
Consolidated Statements of Cash Flows
(Amounts in millions)
For the year ended December 31
|
2018
|
2017
|
2016
|
|||||||
|
Cash flows from operating activities:
|
|||||||||
|
Net earnings
|
$
|
751.9
|
|
578.6
|
|
499.4
|
|
||
|
Adjustments to reconcile net earnings to net cash provided by operating activities, net of acquisitions:
|
|||||||||
|
Depreciation of property and equipment
|
134.1
|
|
123.6
|
|
103.5
|
|
|||
|
Gain on sale of property and equipment
|
(0.5
|
)
|
(1.0
|
)
|
(0.5
|
)
|
|||
|
Bad debt expense
|
8.1
|
|
8.2
|
|
8.6
|
|
|||
|
Deferred income taxes
|
33.8
|
|
(30.0
|
)
|
25.6
|
|
|||
|
Stock-based compensation
|
5.1
|
|
5.2
|
|
4.1
|
|
|||
|
Amortization of intangible assets
|
4.1
|
|
3.8
|
|
0.5
|
|
|||
|
Changes in operating assets and liabilities, net of acquisitions:
|
|||||||||
|
Trade accounts receivable
|
(120.3
|
)
|
(103.7
|
)
|
(40.5
|
)
|
|||
|
Inventories
|
(193.3
|
)
|
(76.3
|
)
|
(80.9
|
)
|
|||
|
Other current assets
|
(28.9
|
)
|
(15.6
|
)
|
29.1
|
|
|||
|
Accounts payable
|
46.1
|
|
36.3
|
|
(17.2
|
)
|
|||
|
Accrued expenses
|
46.8
|
|
37.6
|
|
(28.6
|
)
|
|||
|
Income taxes
|
(15.5
|
)
|
19.4
|
|
15.5
|
|
|||
|
Other
|
2.7
|
|
(0.9
|
)
|
1.3
|
|
|||
|
Net cash provided by operating activities
|
674.2
|
|
585.2
|
|
519.9
|
|
|||
|
Cash flows from investing activities:
|
|||||||||
|
Purchases of property and equipment
|
(176.3
|
)
|
(119.9
|
)
|
(189.5
|
)
|
|||
|
Proceeds from sale of property and equipment
|
9.5
|
|
7.4
|
|
6.5
|
|
|||
|
Cash paid for acquisitions
|
(3.7
|
)
|
(58.7
|
)
|
—
|
|
|||
|
Other
|
(3.4
|
)
|
(8.1
|
)
|
(5.1
|
)
|
|||
|
Net cash used in investing activities
|
(173.9
|
)
|
(179.3
|
)
|
(188.1
|
)
|
|||
|
Cash flows from financing activities:
|
|||||||||
|
Proceeds from debt obligations
|
980.0
|
|
1,015.0
|
|
950.0
|
|
|||
|
Payments against debt obligations
|
(895.0
|
)
|
(980.0
|
)
|
(920.0
|
)
|
|||
|
Proceeds from exercise of stock options
|
13.4
|
|
9.5
|
|
29.3
|
|
|||
|
Purchases of common stock
|
(103.0
|
)
|
(82.6
|
)
|
(59.5
|
)
|
|||
|
Payments of dividends
|
(441.9
|
)
|
(369.1
|
)
|
(346.6
|
)
|
|||
|
Net cash used in financing activities
|
(446.5
|
)
|
(407.2
|
)
|
(346.8
|
)
|
|||
|
Effect of exchange rate changes on cash and cash equivalents
|
(3.5
|
)
|
5.5
|
|
(1.3
|
)
|
|||
|
Net increase (decrease) in cash and cash equivalents
|
50.3
|
|
4.2
|
|
(16.3
|
)
|
|||
|
Cash and cash equivalents at beginning of year
|
116.9
|
|
112.7
|
|
129.0
|
|
|||
|
Cash and cash equivalents at end of year
|
$
|
167.2
|
|
116.9
|
|
112.7
|
|
||
|
Supplemental disclosure of cash flow information:
|
|||||||||
|
Cash paid for interest
|
$
|
12.6
|
|
8.7
|
|
6.2
|
|
||
|
Net cash paid for income taxes
|
$
|
215.3
|
|
304.1
|
|
248.3
|
|
||
See accompanying Notes to Consolidated Financial Statements.
43
Fastenal Company and Subsidiaries
Notes to Consolidated Financial Statements
Note 1. Business Overview and Summary of Significant Accounting Policies
Business Overview
Fastenal is a leader in the wholesale distribution of industrial and construction supplies operating a branch-based business (with an increasing number of Onsite locations). Collectively we refer to our branches and Onsite locations as in-market locations. We have approximately
3,100
in-market locations located primarily in North America.
Principles of Consolidation
The consolidated financial statements include the accounts of Fastenal Company and its subsidiaries (collectively referred to as 'Fastenal' or by terms such as 'we', 'our', or 'us'). All material intercompany balances and transactions have been eliminated in consolidation.
Revenue Recognition
Net sales include products and shipping and handling charges, net of estimates for product returns and any related sales
incentives. Revenue is measured as the amount of consideration we expect to receive in exchange for transferring products. All
revenue is recognized when we satisfy our performance obligations under the contract. We recognize revenue by transferring
the promised products to the customer, with the majority of revenue recognized at the point in time the customer obtains control
of the products. We recognize revenue for shipping and handling charges at the time the products are delivered to or picked up
by the customer. We estimate product returns based on historical return rates. Using probability assessments, we estimate sales
incentives expected to be paid over the term of the contract. The majority of our contracts have a single performance obligation
and are short term in nature. Sales taxes and value added taxes in foreign jurisdictions that are collected from customers and
remitted to governmental authorities are accounted for on a net basis and therefore are excluded from net sales.
Accounts Receivable
Credit is extended based upon an evaluation of the customer's financial condition. Accounts receivable are stated at their
estimated net realizable value. The allowance for doubtful accounts is based on an analysis of customer accounts and our
historical experience with accounts receivable write-offs.
Foreign Currency Translation and Transactions
The functional currency of our foreign operations is typically the applicable local currency. The functional currency is translated into United States dollars for balance sheet accounts, except retained earnings, using current exchange rates as of the balance sheet date, for retained earnings at historical exchange rates, and for revenue and expense accounts using a weighted average exchange rate during the applicable period. The translation adjustments are deferred as a separate component of stockholders' equity captioned accumulated other comprehensive income (loss). Gains or losses resulting from transactions denominated in foreign currencies are included in cost of sales or operating and administrative expenses.
Cash and Cash Equivalents
We consider all investments purchased with original maturities of three months or less to be cash equivalents.
Inventories
Inventories, consisting of finished goods merchandise held for resale, are stated at the lower of cost (first in, first out method) or net realizable value. We establish a reserve for excess, slow-moving, and obsolete inventory that is equal to the difference between the cost and estimated net realizable value for that inventory. These reserves are based on a review and comparison of the current inventory levels to projected and historical sales of inventory.
Property and Equipment
Property and equipment are stated at cost. Depreciation on property and equipment is provided for using the straight-line method over the anticipated economic useful lives of the related property. Long-lived assets are reviewed for impairment whenever events or changes in circumstances indicate that the carrying amount of an asset may not be recoverable. If circumstances require a long-lived asset or asset group be tested for possible impairment, we first compare undiscounted cash flows expected to be generated by the asset or asset group to its carrying value. If the carrying value of the long-lived asset or
44
Fastenal Company and Subsidiaries
Notes to Consolidated Financial Statements—Continued
asset group is not recoverable on an undiscounted cash flow basis, an impairment is recognized to the extent the carrying value exceeds its fair value. Fair value is determined through various valuation techniques including discounted cash flow models, quoted market values, and third-party independent appraisals, as considered necessary. There were
no
impairments recorded during any of the three years reported in these consolidated financial statements.
Leases
We lease space under operating leases for certain distribution centers, branches, and manufacturing locations. These leases do not have significant rent escalation holidays, concessions, leasehold improvement incentives, or other build-out clauses. Any such terms are recognized as rent expense over the term of the lease. Further, the leases do not contain contingent rent provisions. Leasehold improvements on operating leases are amortized over their estimated service lives on a straight-line basis, or the remaining lease term, whichever is shorter. We lease certain semi-tractors, pick-ups, and equipment under operating leases.
Other Long-Lived Assets
Other assets consist of prepaid deposits, goodwill, and other definite-lived intangible assets. Goodwill represents the excess of the purchase price over the fair value of net assets acquired. Goodwill is reviewed for impairment annually. The identifiable intangible assets are amortized on a straight-line basis over their estimated life.
Accounting Estimates
The preparation of the consolidated financial statements in conformity with U.S. generally accepted accounting principles (GAAP) requires us to make estimates and assumptions that affect the reported amounts of assets and liabilities, revenues and expenses, and the disclosure of contingent liabilities. Actual results could differ from those estimates.
Insurance Reserves
We are self-insured for certain losses relating to workers' compensation, automobile, health, and general liability costs. Specific stop-loss coverage is provided for catastrophic claims in order to limit exposure to significant claims. Self-insurance liabilities are based on our estimate of reported claims and claims incurred but not yet reported.
Product Warranties
We offer a basic limited warranty for certain of our products. The specific terms and conditions of those warranties vary depending upon the product sold. We typically recoup these costs through product warranties we hold with the original equipment manufacturers. Our warranty expense has historically been minimal.
Stock-Based Compensation
We estimate the value of stock option grants using a Black-Scholes valuation model. Stock-based compensation expense is recognized on a straight-line basis over the vesting period. Our stock-based compensation expense is recorded in operating and administrative expenses.
Income Taxes
We account for income taxes under the asset and liability method. Under this method, deferred tax assets and liabilities are recognized for the future tax consequences attributable to differences between the financial statement carrying amounts of existing assets and liabilities and their respective tax bases. Deferred tax assets and liabilities are measured using enacted tax rates expected to apply to taxable income in the years in which those temporary differences are expected to be recovered or settled. The effect on deferred tax assets and liabilities of a change in tax rates is recognized in income in the period that includes the enactment date.
We recognize the effect of income tax positions only if those positions are more likely than not to be sustained. Recognized income tax positions are measured at the largest amount that is greater than 50% likely of being realized. Changes in recognition or measurement are reflected in the period in which the change in judgment occurs. We record interest and penalties related to unrecognized tax benefits in income tax expense.
45
Fastenal Company and Subsidiaries
Notes to Consolidated Financial Statements—Continued
Earnings Per Share
Basic net earnings per share is calculated using net earnings available to common stockholders divided by the weighted average number of shares of common stock outstanding during the year. Diluted net earnings per share is similar to basic net earnings per share except that the weighted average number of shares of common stock outstanding includes the incremental shares assumed to be issued upon the exercise of stock options considered to be 'in-the-money' (i.e., when the market price of our stock is greater than the exercise price of our outstanding stock options).
Segment Reporting
We have determined that for our North American operations we meet the aggregation criteria outlined in the accounting standards as our various operations have similar (1) economic characteristics, (2) products and services, (3) customers, (4) distribution channels, and (5) regulatory environments. Considering the insignificance of our operations outside of North America, we report as a single business segment.
Recently Adopted Accounting Pronouncements
Effective January 1, 2018, we adopted the Financial Accounting Standards Board ('FASB') Accounting Standards Update
('ASU') 2014-09,
Revenue from Contracts with Customers (Topic 606)
, and ASU 2015-14,
Revenue from Contracts with
Customers (Topic 606): Deferral of Effective Date,
which deferred the effective date of ASU 2014-09 by one year. ASU
2014-09 supersedes the revenue recognition requirements in ASC 605,
Revenue Recognition
, and is based on the principle that
revenue is recognized to depict the transfer of goods or services to customers in an amount that reflects the consideration to
which the entity expects to be entitled in exchange for those goods or services. It also requires additional disclosure about the
nature, amount, timing, and uncertainty of revenue, cash flows arising from customer contracts, including significant judgments
and changes in judgments, and assets recognized from costs incurred to obtain or fulfill a contract. The adoption of ASU
2014-09, using the modified retrospective approach, had no significant impact on our results of operations, cash flows, or
financial position. Revenue continues to be recognized at a point in time for our product sales when products are delivered to or
picked up by the customer and revenue for shipping and handling charges continues to be recognized when products are
delivered to or picked up by the customer. We continue to reduce revenue for estimates of sales incentives based on probability
estimates and for product returns based on historical return rates. Additional information and disclosures required by this new
standard are contained in Note 2, '
Revenue
'.
In March 2018, we adopted FASB ASU 2018-05,
Income Taxes (Topic 740)
:
Amendments to SEC Paragraphs Pursuant to SEC
Staff Accounting Bulletin No. 118
, which updates the income tax accounting in U.S. GAAP to reflect the Securities and
Exchange Commission ('SEC') interpretive guidance released on December 22, 2017, when the Tax Cuts and Jobs Act (the 'Tax
Act') was signed into law. Additional information regarding the adoption of this standard is contained in Note 7, '
Income Taxes
'.
Recently Issued Accounting Pronouncements
In February 2016, the FASB issued ASU 2016-02,
Leases
, which introduces the recognition of lease assets and lease liabilities by lessees for those leases classified as operating leases under previous guidance. The update is effective for annual reporting periods beginning after December 15, 2018, including interim periods within those reporting periods, with early adoption permitted. The original guidance required application on a modified retrospective basis with the earliest period presented. In August 2018, the FASB issued ASU 2018-11,
Targeted Improvements to ASC 842
, which includes an option to not restate comparative periods in transition and elect to use the effective date of ASC 842,
Leases
, as the date of initial application of transition. Based on the effective date, this guidance will apply and we will adopt this ASU beginning on January 1, 2019 and plan to elect the transition option provided under ASU 2018-11. We expect this standard will have a material effect on our Consolidated Balance Sheets with the recognition of new right of use assets and lease liabilities for all operating leases, except pick-up truck leases where we expect to elect the short-term lease recognition exemption, as these leases typically have a non-cancelable lease term of approximately one year. Upon adoption, we estimate both assets and liabilities on our Consolidated Balance Sheets will increase by approximately $
250.0
. Changes in our lease population or changes in incremental borrowing rates may alter this estimate. We will expand our consolidated financial statement disclosures upon adoption of this standard.
46
Fastenal Company and Subsidiaries
Notes to Consolidated Financial Statements—Continued
Note 2. Revenue
Disaggregation of Revenue
The accounting policies of the operations in the various geographic areas are the same as those described in the summary of significant accounting policies. Revenues are attributed to countries based on the location of the branch from which the sale occurred. In each of the years presented in the tables below,
no
single customer represented 5% or more of our consolidated net sales.
Our revenues related to the following geographic areas were as follows for the periods ended December 31:
|
Twelve-month period
|
|||||||||
|
2018
|
2017
|
2016
|
|||||||
|
United States
|
$
|
4,285.5
|
|
3,842.9
|
|
3,493.5
|
|
||
|
All foreign countries
|
679.6
|
|
547.6
|
|
468.5
|
|
|||
|
Total revenues
|
$
|
4,965.1
|
|
4,390.5
|
|
3,962.0
|
|
||
The percentages of our sales by end market were as follows for the periods ended December 31:
|
Twelve-month period
|
||||||||
|
2018
|
2017
|
2016
|
||||||
|
Manufacturing
|
66.7
|
%
|
66.5
|
%
|
65.9
|
%
|
||
|
Non-residential construction
|
13.1
|
%
|
13.0
|
%
|
13.6
|
%
|
||
|
Other
|
20.2
|
%
|
20.5
|
%
|
20.5
|
%
|
||
|
100.0
|
%
|
100.0
|
%
|
100.0
|
%
|
|||
The percentages of our sales by product line were as follows for the periods ended December 31
(1)
:
|
Twelve-month Period
|
||||||||||
|
Type
|
Introduced
|
2018
|
2017
|
2016
|
||||||
|
Fasteners
(2)
|
1967
|
34.9
|
%
|
35.6
|
%
|
36.6
|
%
|
|||
|
Tools
|
1993
|
10.0
|
%
|
10.1
|
%
|
9.9
|
%
|
|||
|
Cutting tools
|
1996
|
5.7
|
%
|
5.8
|
%
|
5.7
|
%
|
|||
|
Hydraulics & pneumatics
|
1996
|
6.8
|
%
|
6.8
|
%
|
6.9
|
%
|
|||
|
Material handling
|
1996
|
5.8
|
%
|
5.9
|
%
|
6.0
|
%
|
|||
|
Janitorial supplies
|
1996
|
7.6
|
%
|
7.3
|
%
|
7.3
|
%
|
|||
|
Electrical supplies
|
1997
|
4.7
|
%
|
4.9
|
%
|
4.8
|
%
|
|||
|
Welding supplies
|
1997
|
4.1
|
%
|
4.2
|
%
|
4.2
|
%
|
|||
|
Safety supplies
|
1999
|
17.2
|
%
|
16.3
|
%
|
16.0
|
%
|
|||
|
Other
|
3.2
|
%
|
3.1
|
%
|
2.6
|
%
|
||||
|
100.0
|
%
|
100.0
|
%
|
100.0
|
%
|
|||||
(1)
In 2018, we reclassified certain product category designations and have conformed the prior period percentages to the current year presentation.
(2)
The fastener product line represents fasteners and miscellaneous supplies.
47
Fastenal Company and Subsidiaries
Notes to Consolidated Financial Statements—Continued
Note 3. Long-Lived Assets
The accounting policies of the operations in the various geographic areas are the same as those described in the summary of significant accounting policies. Long-lived assets consist of net property and equipment, deposits, goodwill, and other net intangibles.
Property and equipment at year end consisted of the following:
|
Depreciable Life
in Years
|
2018
|
2017
|
|||||||
|
Land
|
—
|
|
$
|
36.3
|
|
38.2
|
|
||
|
Buildings and improvements
|
15 to 40
|
|
323.1
|
|
308.2
|
|
|||
|
Automated distribution and warehouse equipment
|
5 to 30
|
|
229.1
|
|
220.0
|
|
|||
|
Shelving, industrial vending, and equipment
|
3 to 10
|
|
927.6
|
|
812.9
|
|
|||
|
Transportation equipment
|
3 to 5
|
|
77.9
|
|
76.3
|
|
|||
|
Construction in progress
|
—
|
|
152.2
|
|
149.3
|
|
|||
|
1,746.2
|
|
1,604.9
|
|
||||||
|
Less accumulated depreciation
|
(821.4
|
)
|
(711.3
|
)
|
|||||
|
Property and equipment, net
|
$
|
924.8
|
|
893.6
|
|
||||
Our long-lived assets related to the following geographic areas:
|
2018
|
2017
|
2016
|
|||||||
|
United States
|
$
|
947.7
|
|
919.5
|
|
899.1
|
|
||
|
All foreign countries
|
57.6
|
|
55.3
|
|
49.0
|
|
|||
|
Total long-lived assets
|
$
|
1,005.3
|
|
974.8
|
|
948.1
|
|
||
Note 4. Accrued Expenses
Accrued expenses at year end consisted of the following:
|
2018
|
2017
|
|||||
|
Employee payroll and related taxes
|
$
|
27.6
|
|
26.0
|
|
|
|
Employee bonuses and commissions
|
22.8
|
|
19.8
|
|
||
|
Profit sharing contribution
|
13.0
|
|
10.6
|
|
||
|
Insurance reserves
|
37.6
|
|
39.0
|
|
||
|
Indirect taxes
|
63.6
|
|
51.1
|
|
||
|
Customer promotions and marketing
|
50.9
|
|
36.6
|
|
||
|
Other
|
25.3
|
|
10.9
|
|
||
|
Accrued expenses
|
$
|
240.8
|
|
194.0
|
|
|
48
Fastenal Company and Subsidiaries
Notes to Consolidated Financial Statements—Continued
Note 5. Stockholders' Equity
Dividends
On
January 16, 2019
, our board of directors declared a quarterly dividend of
$0.43
per share of common stock to be paid in cash on
February 27, 2019
to shareholders of record at the close of business on
January 31, 2019
. We paid aggregate annual dividends per share of
$1.54
,
$1.28
, and
$1.20
in
2018
,
2017
, and
2016
, respectively.
Stock Options
Effective January 2, 2019, the compensation committee of our board of directors granted to our employees options to purchase a total of
643,957
shares of our common stock at an exercise strike price of
$52.00
per share. The closing stock price on the effective date of the grant was
$51.41
per share. On the same date, certain of our non-employee directors elected to forgo all or a portion of the 2019 annual cash retainer in exchange for options to acquire a total of
14,505
shares of our common stock at an exercise price of
$52.00
per share.
The following tables summarize the details of options granted under our stock option plans that were still outstanding as of December 31, 2018, and the assumptions used to value those grants. All such grants were effective at the close of business on the date of grant.
|
Options
Granted
|
Option Exercise
(Strike) Price
|
Closing Stock
Price on Date
of Grant
|
December 31, 2018
|
|||||||||||||
|
Date of Grant
|
Options
Outstanding
|
Options
Exercisable
|
||||||||||||||
|
January 2, 2018
|
543,968
|
|
$
|
55.00
|
|
$
|
54.54
|
|
524,256
|
|
21,185
|
|
||||
|
January 3, 2017
|
764,789
|
|
$
|
47.00
|
|
$
|
46.95
|
|
679,700
|
|
—
|
|
||||
|
April 19, 2016
|
845,440
|
|
$
|
46.00
|
|
$
|
45.74
|
|
683,889
|
|
194,672
|
|
||||
|
April 21, 2015
|
893,220
|
|
$
|
42.00
|
|
$
|
41.26
|
|
622,301
|
|
185,528
|
|
||||
|
April 22, 2014
|
955,000
|
|
$
|
56.00
|
|
$
|
50.53
|
|
511,250
|
|
332,250
|
|
||||
|
April 16, 2013
|
205,000
|
|
$
|
54.00
|
|
$
|
49.25
|
|
88,123
|
|
54,380
|
|
||||
|
April 17, 2012
|
1,235,000
|
|
$
|
54.00
|
|
$
|
49.01
|
|
812,063
|
|
700,813
|
|
||||
|
April 19, 2011
|
410,000
|
|
$
|
35.00
|
|
$
|
31.78
|
|
49,650
|
|
37,150
|
|
||||
|
April 20, 2010
|
530,000
|
|
$
|
30.00
|
|
$
|
27.13
|
|
28,400
|
|
28,400
|
|
||||
|
Total
|
6,382,417
|
|
3,999,632
|
|
1,554,378
|
|
||||||||||
|
Date of Grant
|
Risk-free
Interest Rate
|
Expected Life
of Option in
Years
|
Expected
Dividend
Yield
|
Expected
Stock
Volatility
|
Estimated Fair
Value of Stock
Option
|
|||||||||
|
January 2, 2018
|
2.2
|
%
|
5.00
|
2.3
|
%
|
23.45
|
%
|
$
|
10.03
|
|
||||
|
January 3, 2017
|
1.9
|
%
|
5.00
|
2.6
|
%
|
24.49
|
%
|
$
|
8.40
|
|
||||
|
April 19, 2016
|
1.3
|
%
|
5.00
|
2.6
|
%
|
26.34
|
%
|
$
|
8.18
|
|
||||
|
April 21, 2015
|
1.3
|
%
|
5.00
|
2.7
|
%
|
26.84
|
%
|
$
|
7.35
|
|
||||
|
April 22, 2014
|
1.8
|
%
|
5.00
|
2.0
|
%
|
28.55
|
%
|
$
|
9.57
|
|
||||
|
April 16, 2013
|
0.7
|
%
|
5.00
|
1.6
|
%
|
37.42
|
%
|
$
|
12.66
|
|
||||
|
April 17, 2012
|
0.9
|
%
|
5.00
|
1.4
|
%
|
39.25
|
%
|
$
|
13.69
|
|
||||
|
April 19, 2011
|
2.1
|
%
|
5.00
|
1.6
|
%
|
39.33
|
%
|
$
|
11.20
|
|
||||
|
April 20, 2010
|
2.6
|
%
|
5.00
|
1.5
|
%
|
39.10
|
%
|
$
|
8.14
|
|
||||
All of the options in the tables above vest and become exercisable over a period of up to
eight years
. Generally, each option will terminate approximately
nine years
after the grant date.
The fair value of each share-based option is estimated on the date of grant using a Black-Scholes valuation method that uses the assumptions listed above. The risk-free interest rate is based on the U.S. Treasury rate over the expected life of the option at the time of grant. The expected life is the average length of time over which we expect the employee groups will exercise their options, which is based on historical experience with similar grants. The dividend yield is estimated over the expected life of the option based on our current dividend payout, historical dividends paid, and expected future cash dividends. Expected stock
49
Fastenal Company and Subsidiaries
Notes to Consolidated Financial Statements—Continued
volatilities are based on the movement of our stock price over the most recent historical period equivalent to the expected life of the option.
A summary of activities under our stock option plans consisted of the following:
|
Options
Outstanding
|
Exercise
Price
(1)
|
Remaining
Life
(2)
|
||||||
|
Outstanding as of January 1, 2018
|
3,948,908
|
|
$
|
48.28
|
|
5.89
|
||
|
Granted
|
543,968
|
|
$
|
55.00
|
|
9.00
|
||
|
Exercised
|
(310,383
|
)
|
$
|
43.31
|
|
|||
|
Cancelled/forfeited
|
(182,861
|
)
|
$
|
48.86
|
|
|||
|
Outstanding as of December 31, 2018
|
3,999,632
|
|
$
|
49.53
|
|
5.61
|
||
|
Exercisable as of December 31, 2018
|
1,554,378
|
|
$
|
51.06
|
|
3.69
|
||
|
Options
Outstanding
|
Exercise
Price (1) |
Remaining
Life
(2)
|
||||||
|
Outstanding as of January 1, 2017
|
3,757,947
|
|
$
|
46.81
|
|
5.85
|
||
|
Granted
|
764,789
|
|
$
|
47.00
|
|
9.00
|
||
|
Exercised
|
(329,612
|
)
|
$
|
28.59
|
|
|||
|
Cancelled/forfeited
|
(244,216
|
)
|
$
|
48.22
|
|
|||
|
Outstanding as of December 31, 2017
|
3,948,908
|
|
$
|
48.28
|
|
5.89
|
||
|
Exercisable as of December 31, 2017
|
1,280,499
|
|
$
|
50.07
|
|
3.78
|
||
(1)
Weighted average exercise price.
(2)
Weighted average remaining contractual life in years.
The total intrinsic value of stock options exercised during the years ended
December 31, 2018
,
2017
, and
2016
was
$4.2
,
$6.9
, and
$23.2
, respectively. The intrinsic value represents the difference between the exercise price and fair value of the underlying shares at the date of exercise.
At
December 31, 2018
, there was
$13.7
of total unrecognized stock-based compensation expense related to outstanding unvested stock options granted under the employee stock option plan. This expense is expected to be recognized over a weighted average period of
3.89
years. Any future change in estimated forfeitures will impact this amount. The total grant date fair value of stock options vested under our employee stock option plan during
2018
,
2017
, and
2016
was
$5.3
,
$4.2
, and
$7.1
, respectively.
Total stock-based compensation expense related to our employee stock option plan was
$5.1
,
$5.2
, and
$4.1
for
2018
,
2017
, and
2016
, respectively.
Earnings Per Share
The following tables present a reconciliation of the denominators used in the computation of basic and diluted earnings per share and a summary of the options to purchase shares of common stock which were excluded from the diluted earnings calculation because they were anti-dilutive:
|
Reconciliation
|
2018
|
2017
|
2016
|
|||||
|
Basic weighted average shares outstanding
|
286,966,917
|
|
288,208,435
|
|
288,949,525
|
|
||
|
Weighted shares assumed upon exercise of stock options
|
195,847
|
|
134,298
|
|
207,998
|
|
||
|
Diluted weighted average shares outstanding
|
287,162,764
|
|
288,342,733
|
|
289,157,523
|
|
||
|
Summary of Anti-dilutive Options Excluded
|
2018
|
2017
|
2016
|
||||||
|
Options to purchase shares of common stock
|
1,579,757
|
|
3,524,401
|
|
3,095,343
|
|
|||
|
Weighted average exercise prices of options
|
$
|
55.02
|
|
49.85
|
|
50.09
|
|
||
Any dilutive impact summarized above related to periods when the average market price of our stock exceeded the exercise price of the potentially dilutive stock options then outstanding.
50
Fastenal Company and Subsidiaries
Notes to Consolidated Financial Statements—Continued
Note 6. Retirement Savings Plan
The Fastenal Company and Subsidiaries 401(k) and Employee Stock Ownership Plan covers all of our employees in the United States. Our employees in Canada may participate in a Registered Retirement Savings Plan. The general purpose of both of these plans is to provide additional financial security during retirement by providing employees with an incentive to make regular savings contributions. In addition to the participation of our employees, we make annual profit sharing contributions based on an established formula. The expense recorded under this profit sharing formula was approximately
$13.0
,
$10.6
, and
$8.7
for
2018
,
2017
, and
2016
, respectively.
Note 7. Income Taxes
Earnings before income taxes were derived from the following sources:
|
2018
|
2017
|
2016
|
|||||||
|
Domestic
|
$
|
905.0
|
|
809.4
|
|
739.4
|
|
||
|
Foreign
|
82.0
|
|
63.7
|
|
50.3
|
|
|||
|
Earnings before income taxes
|
$
|
987.0
|
|
873.1
|
|
789.7
|
|
||
Components of income tax expense (benefit) were as follows:
|
2018:
|
Current
|
Deferred
|
Total
|
||||||
|
Federal
|
$
|
143.8
|
|
27.4
|
|
171.2
|
|
||
|
State
|
38.8
|
|
0.2
|
|
39.0
|
|
|||
|
Foreign
|
24.1
|
|
0.8
|
|
24.9
|
|
|||
|
Income tax expense
|
$
|
206.7
|
|
28.4
|
|
235.1
|
|
||
|
2017:
|
Current
|
Deferred
|
Total
|
||||||
|
Federal
|
$
|
270.6
|
|
(33.1
|
)
|
237.5
|
|
||
|
State
|
33.2
|
|
3.3
|
|
36.5
|
|
|||
|
Foreign
|
20.5
|
|
—
|
|
20.5
|
|
|||
|
Income tax expense
|
$
|
324.3
|
|
(29.8
|
)
|
294.5
|
|
||
|
2016:
|
Current
|
Deferred
|
Total
|
||||||
|
Federal
|
$
|
223.9
|
|
23.2
|
|
247.1
|
|
||
|
State
|
28.2
|
|
1.2
|
|
29.4
|
|
|||
|
Foreign
|
12.6
|
|
1.2
|
|
13.8
|
|
|||
|
Income tax expense
|
$
|
264.7
|
|
25.6
|
|
290.3
|
|
||
Income tax expense in the accompanying consolidated financial statements differed from the expected expense as follows:
|
2018
|
2017
|
2016
|
|||||||
|
U.S. federal statutory income tax rate
|
21.0
|
%
|
35.0
|
%
|
35.0
|
%
|
|||
|
U.S. federal income tax expense at statutory rate
|
$
|
207.3
|
|
305.6
|
|
276.4
|
|
||
|
Increase (decrease) attributed to:
|
|||||||||
|
State income taxes, net of federal benefit
|
30.2
|
|
21.5
|
|
20.0
|
|
|||
|
Transition tax
|
1.2
|
|
6.5
|
|
—
|
|
|||
|
Remeasurement of deferred taxes for Tax Act
|
(11.5
|
)
|
(30.8
|
)
|
—
|
|
|||
|
Other, net
|
7.9
|
|
(8.3
|
)
|
(6.1
|
)
|
|||
|
Total income tax expense
|
$
|
235.1
|
|
294.5
|
|
290.3
|
|
||
|
Effective income tax rate
|
23.8
|
%
|
33.7
|
%
|
36.8
|
%
|
|||
51
Fastenal Company and Subsidiaries
Notes to Consolidated Financial Statements—Continued
The tax effects of temporary differences that give rise to deferred income tax assets and liabilities at year end consisted of the following:
|
2018
|
2017
|
|||||
|
Deferred income tax assets (liabilities):
|
||||||
|
Inventory costing and valuation methods
|
$
|
4.2
|
|
3.6
|
|
|
|
Allowance for doubtful accounts
|
3.2
|
|
3.0
|
|
||
|
Insurance reserves
|
8.1
|
|
8.4
|
|
||
|
Customer promotions
|
1.9
|
|
1.3
|
|
||
|
Stock-based compensation
|
5.6
|
|
5.2
|
|
||
|
Federal and state benefit of uncertain tax positions
|
0.8
|
|
0.9
|
|
||
|
Foreign net operating loss and credit carryforwards
|
3.2
|
|
4.2
|
|
||
|
Foreign valuation allowances
|
(2.7
|
)
|
(2.8
|
)
|
||
|
Other, net
|
1.3
|
|
0.8
|
|
||
|
Total deferred income tax assets
|
25.6
|
|
24.6
|
|
||
|
Property and equipment
|
(104.7
|
)
|
(75.2
|
)
|
||
|
Total deferred income tax liabilities
|
(104.7
|
)
|
(75.2
|
)
|
||
|
Deferred income tax liabilities
|
$
|
(79.1
|
)
|
(50.6
|
)
|
|
A reconciliation of the beginning and ending amount of total gross unrecognized tax benefits was as follows:
|
2018
|
2017
|
|||||
|
Balance at beginning of year:
|
$
|
4.4
|
|
5.4
|
|
|
|
Increase related to prior year tax positions
|
1.8
|
|
0.4
|
|
||
|
Decrease related to prior year tax positions
|
(0.6
|
)
|
(0.5
|
)
|
||
|
Increase related to current year tax positions
|
0.7
|
|
0.7
|
|
||
|
Decrease related to statute of limitation lapses
|
(0.9
|
)
|
(1.1
|
)
|
||
|
Settlements
|
(0.1
|
)
|
(0.5
|
)
|
||
|
Balance at end of year:
|
$
|
5.3
|
|
4.4
|
|
|
Included in the liability for gross unrecognized tax benefits is an immaterial amount for interest and penalties, both of which we classify as a component of income tax expense. The amount of gross unrecognized tax benefits that would favorably impact the effective tax rate, if recognized, is not material. We do not anticipate significant changes in total unrecognized tax benefits during the next twelve months. The 2018 liability is included in deferred income taxes and the 2017 liability is included in income taxes payable on the Consolidated Balance Sheets.
We file income tax returns in the United States federal jurisdiction, all states, and various local and foreign jurisdictions. With limited exceptions, we are no longer subject to income tax examinations by taxing authorities for taxable years before 2016 in the case of United States federal examinations, and 2014 in the case of foreign, state, and local examinations.
On December 22, 2017, the Tax Act was signed into law. The Tax Act made broad and complex changes to the U.S. tax code which include: a lowering of the U.S. federal corporate income tax rate from 35% to 21% effective January 1, 2018, accelerated expensing of qualified capital investments for a specific period, and a transition from a worldwide to a territorial tax system which requires companies to pay a one-time transition tax on certain unrepatriated earnings from foreign subsidiaries.
ASC 740 requires a company to record the effects of a tax law change in the period of enactment which, for us, was fiscal 2017. ASU 2018-05 provides guidance on the application of the Tax Act which includes allowing a company to record a provisional amount during the measurement period for the impacts when the necessary information is not available, prepared, or analyzed in reasonable detail to complete its accounting for the change in the tax law. The measurement period ends when the company has obtained, prepared and analyzed the information necessary to finalize its accounting, but cannot extend beyond one year.
We recorded income tax expense of
$235.1
in 2018, or
23.8%
of earnings before income taxes. The effective income tax rate was significantly impacted by the following two items: (1) The lower corporate tax rate provided by the Tax Act resulted in a lower tax rate beginning in the first quarter of 2018. The effective income tax rate includes the immaterial impact of the U.S.
52
Fastenal Company and Subsidiaries
Notes to Consolidated Financial Statements—Continued
tax rate on certain offshore earnings referred to as GILTI, a new deduction for FDII, and the new alternative U.S. tax on certain BEAT payments from a U.S. company to any foreign related party. (2) Discrete income tax items to adjust our transition tax liability, reflect the impacts of accelerating depreciation for certain physical assets, and remeasure the impact of the U.S. tax rate on certain inter-company transactions. These discrete items resulted in approximately
$7.1
of income tax benefit during 2018. The accounting for the income tax effects of the Tax Act is complete as of December 31, 2018.
In general, it is our practice and intention to permanently reinvest the earnings of our foreign subsidiaries and repatriate earnings only when the tax impact is zero or very minimal and that position has not changed subsequent to the one-time transition tax under the Tax Act. Accordingly, no deferred taxes have been provided for withholding taxes or other taxes that would result upon repatriation of our approximately
$248.0
of undistributed earnings from foreign subsidiaries to the U.S. as those earnings continue to be permanently reinvested.
Note 8. Operating Leases
We lease space under non-cancelable operating leases for several distribution centers, several manufacturing locations, and certain branch locations. These leases do not have significant rent escalation holidays, concessions, leasehold improvement incentives, or other build-out clauses. Any such terms are recognized as rent expense over the term of the lease. Further, the leases do not contain contingent rent provisions. The net book value of leasehold improvements at
December 31, 2018
was
$2.3
. We lease certain semi-tractors and pick-ups under operating leases. Our pick-up leases typically have a non-cancelable lease term of
one year
, with renewal options for up to
72 months
. Our average lease term for pick-ups is typically
39 months
to
45 months
. Future minimum lease payments for all operating leases are as follows:
|
Leased
Facilities and Equipment
|
Leased
Vehicles
|
Total
|
|||||||
|
2019
|
$
|
84.1
|
|
40.0
|
|
124.1
|
|
||
|
2020
|
69.1
|
|
25.5
|
|
94.6
|
|
|||
|
2021
|
42.8
|
|
10.9
|
|
53.7
|
|
|||
|
2022
|
21.8
|
|
1.9
|
|
23.7
|
|
|||
|
2023
|
9.7
|
|
—
|
|
9.7
|
|
|||
|
2024 and thereafter
|
3.7
|
|
—
|
|
3.7
|
|
|||
|
Total minimum lease payments
|
$
|
231.2
|
|
78.3
|
|
309.5
|
|
||
Rent expense under all operating leases was as follows:
|
Leased
Facilities and Equipment
|
Leased
Vehicles
|
Total
|
|||||||
|
2018
|
$
|
110.7
|
|
47.5
|
|
158.2
|
|
||
|
2017
|
$
|
109.5
|
|
45.8
|
|
155.3
|
|
||
|
2016
|
$
|
110.1
|
|
42.7
|
|
152.8
|
|
||
Certain operating leases for pick-up trucks contain residual value guarantee provisions which would generally become due at the expiration of the operating lease agreement if the fair value of the leased vehicles is less than the guaranteed residual value. The aggregate residual value guarantee related to these leases was approximately
$80.8
. We believe the likelihood of funding the guarantee obligation under any provision of the operating lease agreements is remote. To the extent our fleet contains vehicles we estimate will settle at a gain, such gains on these vehicles will be recognized when we sell the vehicle.
53
Fastenal Company and Subsidiaries
Notes to Consolidated Financial Statements—Continued
Note 9. Debt Commitments
Credit Facility, Notes Payable, and Commitments
Debt obligations and letters of credit outstanding at year end consisted of the following:
|
2018
|
2017
|
|||||
|
Outstanding loans under unsecured revolving credit facility
|
$
|
365.0
|
|
280.0
|
|
|
|
2.00% Senior unsecured promissory note payable
|
40.0
|
|
40.0
|
|
||
|
2.45% Senior unsecured promissory note payable
|
35.0
|
|
35.0
|
|
||
|
3.22% Senior unsecured promissory note payable
|
60.0
|
|
60.0
|
|
||
|
Total debt
|
500.0
|
|
415.0
|
|
||
|
Less: Current portion of debt
|
(3.0
|
)
|
(3.0
|
)
|
||
|
Long-term debt
|
$
|
497.0
|
|
412.0
|
|
|
|
Outstanding letters of credit under unsecured revolving credit facility - contingent obligation
|
$
|
36.3
|
|
36.3
|
|
|
Unsecured Revolving Credit Facility
We have a
$700.0
committed unsecured revolving credit facility ('Credit Facility'). The Credit Facility includes a committed letter of credit subfacility of
$55.0
. The commitments under the Credit Facility will expire (and any borrowings outstanding under the Credit Facility will become due and payable) on
November 30, 2023
. In the next twelve months, we have the ability and intent to repay a portion of the outstanding loans using cash; therefore, we have classified this portion as a current liability. The Credit Facility contains certain financial and other covenants, and our right to borrow under the Credit Facility is conditioned upon, among other things, our compliance with these covenants. We are currently in compliance with these covenants.
Borrowings under the Credit Facility generally bear interest at a rate per annum equal to the London Interbank Offered Rate ('LIBOR') for interest periods of various lengths selected by us, plus
0.95%
. Based on the interest periods we have chosen, our weighted per annum interest rate at
December 31, 2018
was approximately
3.5%
. We pay a commitment fee for the unused portion of the Credit Facility. This fee is either
0.10%
or
0.125%
per annum based on our usage of the Credit Facility.
Senior Unsecured Promissory Notes Payable
We have issued senior unsecured promissory notes under our master note agreement (the 'Master Note Agreement') in the aggregate principal amount of
$135.0
. Our aggregate borrowing capacity under the Master Note Agreement is
$600.0
; however, none of the institutional investors party to that agreement are committed to purchase notes thereunder.
The notes currently issued under our Master Note Agreement consist of
three
series. The first is in an aggregate principal amount of
$40.0
, bears interest at a fixed rate of
2.00%
per annum, and is due and payable on July 20, 2021. The second is in an aggregate principal amount of
$35.0
, bears interest at a fixed rate of
2.45%
per annum, and is due and payable on July 20, 2022. The third is in an aggregate principal amount of
$60.0
, bears interest at a fixed rate of
3.22%
per annum, and is due and payable on March 1, 2024. There is no amortization of these notes prior to their maturity date and interest is payable quarterly.
Note 10. Legal Contingencies
We are involved in certain legal actions. The outcomes of these legal actions are not within our complete control and may not be known for prolonged periods of time. In some actions, the claimants seek damages, as well as other relief, that could require significant expenditures or result in lost revenues. We record a liability for these legal actions when a loss is known or considered probable and the amount can be reasonably estimated. If the reasonable estimate of a known or probable loss is a range, and no amount within the range is a better estimate than any other, the minimum amount of the range is accrued. If a loss is reasonably possible but not known or probable, and can be reasonably estimated, the estimated loss or range of loss is disclosed. In most cases, significant judgment is required to estimate the amount and timing of a loss to be recorded. As of
December 31, 2018
, there were no litigation matters that we consider to be probable or reasonably possible to have a material adverse outcome.
Note 11. Subsequent Events
We evaluated all subsequent event activity and concluded that no subsequent events have occurred that would require recognition in the consolidated financial statements or disclosure in the Notes to Consolidated Financial Statements, with the exception of the dividend declaration and stock option activities disclosed in Note 5.
54
Fastenal Company and Subsidiaries
Notes to Consolidated Financial Statements—Continued
Note 12. Selected Quarterly Financial Data (Unaudited)
(Amounts in millions except per share information)
|
2018:
|
Net Sales
|
Gross
Profit
|
Pre-tax
Earnings
|
Net
Earnings
|
(1)
|
Basic Net
Earnings per Share |
(1), (2)
|
Diluted Net Earnings per Share
|
(1), (2)
|
||||||||||
|
First quarter
|
$
|
1,185.8
|
|
577.6
|
|
231.9
|
|
174.3
|
|
0.61
|
|
0.61
|
|
||||||
|
Second quarter
|
1,267.9
|
|
617.7
|
|
265.9
|
|
211.2
|
|
0.74
|
|
0.74
|
|
|||||||
|
Third quarter
|
1,279.8
|
|
615.8
|
|
259.4
|
|
197.6
|
|
0.69
|
|
0.69
|
|
|||||||
|
Fourth quarter
|
1,231.6
|
|
587.8
|
|
229.8
|
|
168.8
|
|
0.59
|
|
0.59
|
|
|||||||
|
Total
|
$
|
4,965.1
|
|
2,398.9
|
|
987.0
|
|
751.9
|
|
2.62
|
|
2.62
|
|
||||||
|
2017:
|
Net Sales
|
Gross
Profit
|
Pre-tax
Earnings
|
Net
Earnings
|
Basic Net
Earnings per Share |
(2)
|
Diluted Net Earnings per Share
|
(2)
|
|||||||||||
|
First quarter
|
$
|
1,047.7
|
|
518.0
|
|
210.9
|
|
134.2
|
|
0.46
|
|
0.46
|
|
||||||
|
Second quarter
|
1,121.5
|
|
558.5
|
|
235.4
|
|
148.9
|
|
0.52
|
|
0.52
|
|
|||||||
|
Third quarter
|
1,132.8
|
|
555.9
|
|
226.0
|
|
143.1
|
|
0.50
|
|
0.50
|
|
|||||||
|
Fourth quarter
|
1,088.5
|
|
531.2
|
|
200.8
|
|
152.4
|
|
(3)
|
0.53
|
|
(3)
|
0.53
|
|
(3)
|
||||
|
Total
|
$
|
4,390.5
|
|
2,163.6
|
|
873.1
|
|
578.6
|
|
(3)
|
2.01
|
|
(3)
|
2.01
|
|
(3)
|
|||
(1)
Absent the impact of the Tax Act, our net earnings for the first, second, third, and fourth quarters would have been
$147.0
,
$168.7
,
$164.3
, and
$145.2
, respectively, and
$625.2
for the full year. Our basic and diluted net earnings per share would have each been
$0.51
,
$0.59
,
$0.57
, and
$0.51
, respectively, and
$2.18
for the full year.
(2)
Amounts may not foot due to rounding difference.
(3)
Absent the impact of the Tax Act, our net earnings for the fourth quarter of 2017 would have been approximately
$128.1
and
$554.2
for the full year. Our basic and diluted net earnings per share would have each been
$0.45
for the fourth quarter and
$1.92
for the full year.
***End of Notes to Consolidated Financial Statements***
55
|
ITEM 9.
|
CHANGES IN AND DISAGREEMENTS WITH ACCOUNTANTS ON ACCOUNTING AND FINANCIAL DISCLOSURE
|
None.
|
ITEM 9A.
|
CONTROLS AND PROCEDURES
|
Disclosure Controls and Procedures
As of the end of the period covered by this report, we conducted an evaluation, under the supervision and with the participation of our principal executive officer and principal financial officer, of our disclosure controls and procedures (as defined in Rules 13a-15(e) and 15d-15(e) under the Securities Exchange Act of 1934 (the 'Securities Exchange Act')). Based on this evaluation, the principal executive officer and principal financial officer concluded that our disclosure controls and procedures are effective to ensure that information required to be disclosed by us in reports that we file or submit under the Securities Exchange Act is recorded, processed, summarized, and reported within the time periods specified in SEC rules and forms, and is accumulated and communicated to our management, including the principal executive officer and principal financial officer, to allow for timely decisions regarding required disclosure.
Attestation Report of Independent Registered Public Accounting Firm
The attestation report required under this item is contained earlier in this Form 10-K under the heading 'Item 8, Financial Statements and Supplementary Data'.
Management's Annual Report on Internal Control Over Financial Reporting
Our management is responsible for establishing and maintaining adequate internal control over financial reporting as defined in Rules 13a-15(f) and 15d-15(f) under the Securities Exchange Act. The company's internal control over financial reporting is designed to provide reasonable assurance regarding the reliability of financial reporting and the preparation of financial statements for external purposes in accordance with U.S. generally accepted accounting principles. The company's internal control over financial reporting includes those policies and procedures that:
|
(i)
|
pertain to the maintenance of records that, in reasonable detail, accurately and fairly reflect the transactions and dispositions of the assets of the company;
|
|
(ii)
|
provide reasonable assurance that the transactions are recorded as necessary to permit preparation of financial statements in accordance with U.S. generally accepted accounting principles, and that receipts and expenditures of the company are being made only in accordance with authorizations of management and directors of the company; and
|
|
(iii)
|
provide reasonable assurance regarding prevention or timely detection of unauthorized acquisition, use or disposition of the company's assets that could have a material effect on the financial statements.
|
Because of its inherent limitations, internal control over financial reporting may not prevent or detect misstatements. Also, projections of any evaluation of effectiveness to future periods are subject to the risk that controls may become inadequate because of changes in conditions, or that the degree of compliance with the policies or procedures may deteriorate.
Under the supervision of our principal executive officer and our principal financial officer, we conducted an evaluation of the effectiveness of our internal control over financial reporting based on the framework in
Internal Control – Integrated Framework (2013)
issued by the Committee of Sponsoring Organizations of the Treadway Commission. Based on our assessment and those criteria, management believes that the company maintained effective internal control over financial reporting as of December 31,
2018
. There was no change in the company's internal control over financial reporting during the company's most recently completed fiscal quarter that has materially affected, or is reasonably likely to materially affect, the company's internal control over financial reporting.
|
/s/ Daniel L. Florness
|
/s/ Holden Lewis
|
|
|
Daniel L. Florness
|
Holden Lewis
|
|
|
President and Chief Executive Officer
|
Executive Vice President and Chief Financial Officer
|
|
|
Winona, Minnesota
|
||
|
February 6, 2019
|
||
56
|
ITEM 9B.
|
OTHER INFORMATION
|
None.
PART III
|
ITEM 10.
|
DIRECTORS, EXECUTIVE OFFICERS, AND CORPORATE GOVERNANCE
|
Incorporated herein by reference is the information appearing under the headings 'Proposal #1—Election of Directors', 'Corporate Governance and Director Compensation—Board Leadership Structure and Committee Membership', 'Corporate Governance and Director Compensation—Audit Committee', and 'Corporate Governance and Director Compensation—Section 16(a) Beneficial Ownership Reporting Compliance' in the Proxy Statement.
There have been no material changes to the procedures by which security holders may recommend nominees to the board of directors since our last report.
In January 2004, our board of directors adopted a supplement to our existing standards of conduct designed to qualify the standards of conduct as a code of ethics within the meaning of Item 406(b) of Regulation S-K promulgated by the SEC ('Code of Ethics'). The standards of conduct, as supplemented, apply to all of our directors, officers, and employees, including without limitation our chief executive officer, chief financial officer, principal accounting officer, and controller (if any), and persons performing similar functions ('Senior Financial Officers'). Those portions of the standards of conduct, as supplemented, that constitute a required element of a Code of Ethics are available without charge by submitting a request to us pursuant to the directions detailed under 'Does Fastenal have a Code of Conduct?' on the 'Investor FAQs' page of the 'Investor Relations' section of our website at www.fastenal.com. In the event we amend or waive any portion of the standards of conduct, as supplemented, that constitutes a required element of a Code of Ethics and such amendment or waiver applies to any of our Senior Financial Officers, we intend to post on our website at www.fastenal.com, within four business days after the date of such amendment or waiver, a brief description of such amendment or waiver, the name of each Senior Financial Officer to whom the amendment or waiver applies, and the date of the amendment or waiver.
The executive officers of Fastenal Company are:
|
Name
|
Employee of
Fastenal
Since
|
Age
|
Position
|
||
|
Daniel L. Florness
|
1996
|
55
|
President, Chief Executive Officer, and Director
|
||
|
William J. Drazkowski
|
1995
|
47
|
Executive Vice President – National Accounts Sales
|
||
|
Leland J. Hein
|
1985
|
58
|
Senior Executive Vice President – Sales
|
||
|
James C. Jansen
|
1992
|
48
|
Executive Vice President – Manufacturing
|
||
|
Holden Lewis
|
2016
|
49
|
Executive Vice President and Chief Financial Officer
|
||
|
Sheryl A. Lisowski
|
1994
|
51
|
Controller, Chief Accounting Officer, and Treasurer
|
||
|
Nicholas J. Lundquist
|
1979
|
61
|
Senior Executive Vice President – Operations
|
||
|
Charles S. Miller
|
1999
|
44
|
Executive Vice President – Sales
|
||
|
Terry M. Owen
|
1999
|
50
|
Senior Executive Vice President – Sales Operations
|
||
|
John L. Soderberg
|
1993
|
47
|
Executive Vice President – Information Technology
|
||
|
Jeffery M. Watts
|
1996
|
47
|
Executive Vice President – International Sales
|
||
|
Reyne K. Wisecup
|
1988
|
55
|
Senior Executive Vice President – Human Resources and Director
|
||
Mr. Florness has been our president and chief executive officer since January 2016. From December 2002 to December 2015, Mr. Florness was an executive vice president and our chief financial officer. From June 1996 to November 2002, Mr. Florness was our chief financial officer. During his time as chief financial officer, Mr. Florness' responsibilities expanded beyond finance, including leadership of a portion of our manufacturing division, our product development and procurement, and the company's national accounts business. Mr. Florness has served as one of our directors since January 2016.
Mr. Drazkowski has been our executive vice president – national accounts sales since December 2016. From October 2014 to December 2016, Mr. Drazkowski was our vice president – national accounts sales. From September 2013 to September 2014, he served as regional vice president of our Minnesota based region, and from November 2007 to August 2013, he served as one of our district managers. Prior to November 2007, Mr. Drazkowski served in various sales leadership roles at our company.
Mr. Hein has been our senior executive vice president – sales since January 2016. Mr. Hein's responsibilities include sales and operational oversight of our Western United States business, which spans from Ohio to the West Coast. From July 2015 to December 2015, Mr. Hein was our chief operating officer. Mr. Hein was our president and chief executive officer from January 2015 to July 2015, and our president from July 2012 to December 2014. From November 2007 to July 2012, Mr. Hein was one
57
of our executive vice presidents – sales. Prior to November 2007, Mr. Hein served in various sales leadership roles at our company.
Mr. Jansen has been our executive vice president – manufacturing since January 2016. Mr. Jansen's responsibilities include oversight of our industrial services, quality assurance, aerospace, and manufacturing operations. From December 2010 to December 2015, Mr. Jansen was our executive vice president - operations. From November 2007 to December 2010, Mr. Jansen was our executive vice president – internal operations. From May 2005 to November 2007, Mr. Jansen served as our leader of systems development (this role encompassed both information systems and distribution systems development). From April 2000 to April 2005, Mr. Jansen served as regional vice president of our Texas based region.
Mr. Lewis has been our executive vice president and chief financial officer since August 2016. From April 2016 to July 2016, Mr. Lewis was a senior vice president/equity research-industrial technology with FBR Capital Markets & Co. (a full-service investment bank). From September 2014 to January 2016, Mr. Lewis was a managing director/equity research-industrial technology with Oppenheimer & Co Inc. (a full-service investment bank). From August 2002 to August 2014, Mr. Lewis was a managing director/equity research-industrial manufacturing & distribution with BB&T Capital Markets, a division of BB&T Securities LLC (a full-service investment bank). Prior to August 2002, Mr. Lewis held similar roles with various other organizations since 1994. In each of Mr. Lewis' positions prior to joining Fastenal, he was responsible for studying the strategic and financial direction of companies for the purpose of making investment recommendations to institutional clients.
Ms. Lisowski has been our controller, chief accounting officer, and treasurer since August 2016. Ms. Lisowski was our controller and chief accounting officer from October 2013 to August 2016, and also served as our interim chief financial officer from January 2016 to August 2016. From March 2007 to October 2013, Ms. Lisowski served as our controller – accounting operations. Ms. Lisowski joined Fastenal in 1994 and, prior to March 2007, served in various roles of increasing responsibility within our finance and accounting team.
Mr. Lundquist has been our senior executive vice president – operations since December 2016. Mr. Lundquist's responsibilities include distribution development, product development, supplier development, and supply chain. From July 2012 to December 2016, Mr. Lundquist was our executive vice president – operations. From November 2007 to July 2012, he was one of our executive vice presidents – sales, and from December 2002 to November 2007, he was our executive vice president and chief operating officer.
Mr. Miller has been our executive vice president – sales since November 2015. Mr. Miller's responsibilities include sales and operational oversight of our business which spans the East Coast of, and Southern and Southwestern areas of, the United States. From January 2009 to October 2015, Mr. Miller served as regional vice president of our southeast central region based primarily in Tennessee and Kentucky. Prior to January 2009, Mr. Miller served in various sales leadership roles at our company.
Mr. Owen has been our senior executive vice president – sales operations since January 2016. Mr. Owen's responsibilities include oversight of our information technology, e-commerce, marketing, international sales, national accounts, government sales, FAST Solutions
®
, our Mansco division, and manufacturing operations. From July 2015 to December 2015, Mr. Owen was one of our executive vice president – sales. From May 2014 to June 2015, Mr. Owen served as our executive vice president – e-business, and from December 2007 to May 2014, Mr. Owen was regional vice president of our Texas based and Mexico regions. Prior to December 2007, Mr. Owen served in various distribution center leadership roles at our company.
Mr. Soderberg has been our executive vice president – information technology since May 2016. From May 2014 to May 2016, Mr. Soderberg served as our executive vice president – sales operations and support. From April 2010 to May 2014, Mr. Soderberg was one of our vice presidents – sales. From April 2005 to April 2010, Mr. Soderberg served as regional vice president of our Seattle, Washington based region. Prior to April 2005, Mr. Soderberg served in various sales leadership roles in the mid-Atlantic area of our company.
Mr. Watts has been our executive vice president – international sales since December 2016. From March 2015 to December 2016, Mr. Watts was our vice president – international sales. From June 2005 to February 2015, he served as regional vice president of our Canadian region. Prior to June 2005, Mr. Watts served in various sales leadership roles at our company.
Ms. Wisecup has been our senior executive vice president – human resources since December 2016. From November 2007 to December 2016, Ms. Wisecup was our executive vice president – human resources. Prior to November 2007, she served in various support roles, including director of employee development. Ms. Wisecup has also served as one of our directors since 2000.
The executive officers are elected by our board of directors for a term of one year and serve until their successors are elected and qualified. None of our executive officers is related to any other such executive officer or to any of our directors.
58
|
ITEM 11.
|
EXECUTIVE COMPENSATION
|
Incorporated herein by reference is the information appearing under the headings 'Corporate Governance and Director Compensation—Compensation Committee Interlocks and Insider Participation', 'Executive Compensation', and 'Corporate Governance and Director Compensation—Compensation of our Directors' in the Proxy Statement.
|
ITEM 12.
|
SECURITY OWNERSHIP OF CERTAIN BENEFICIAL OWNERS AND MANAGEMENT AND RELATED STOCKHOLDER MATTERS
|
Incorporated herein by reference is the information appearing under the heading 'Security Ownership of Principal Shareholders and Management' in the Proxy Statement.
Equity Compensation Plan Information
|
Plan Category
|
Number of Securities to
be Issued Upon Exercise
of Outstanding Options,
Warrants, and Rights
|
Weighted-Average Exercise
Price of Outstanding
Options, Warrants,
and Rights
|
Number of Securities
Remaining Available for
Future Issuance Under
Equity Compensation
Plans (Excluding
Securities Reflected in
Column (a))
|
||||||
|
(a)
|
(b)
|
(c)
|
|||||||
|
Equity compensation plans approved by security holders
(1)
|
3,999,632
|
|
$
|
49.53
|
|
7,314,063
|
|
||
|
Equity compensation plans not approved by security holders
|
—
|
|
—
|
|
—
|
|
|||
|
Total
|
3,999,632
|
|
7,314,063
|
|
|||||
|
(1)
|
Reflects stock option awards issued and issuable in the future under our Fastenal Company Stock Option Plan and our Fastenal Company Non-Employee Director Stock Option Plan.
|
|
ITEM 13.
|
CERTAIN RELATIONSHIPS AND RELATED TRANSACTIONS, AND DIRECTOR INDEPENDENCE
|
Incorporated herein by reference is the information appearing under the headings 'Corporate Governance and Director Compensation—Director Independence and Other Board Matters', 'Corporate Governance and Director Compensation—Related Person Transaction Approval Policy', and 'Corporate Governance and Director Compensation—Transactions with Related Persons' in the Proxy Statement.
|
ITEM 14.
|
PRINCIPAL ACCOUNTANT FEES AND SERVICES
|
Incorporated herein by reference is the information appearing under the heading 'Audit and Related Matters—Audit and Related Fees' and 'Audit and Related Matters—Pre-Approval of Services' in the Proxy Statement.
59
PART IV
|
ITEM 15.
|
EXHIBITS AND FINANCIAL STATEMENT SCHEDULES
|
|
a)
|
1. Financial Statements:
|
Consolidated Balance Sheets as of December 31,
2018
and
2017
Consolidated Statements of Earnings for the years ended December 31,
2018
,
2017
, and
2016
Consolidated Statements of Comprehensive Income for the years ended December 31,
2018
,
2017
, and
2016
Consolidated Statements of Stockholders' Equity for the years ended December 31,
2018
,
2017
, and
2016
Consolidated Statements of Cash Flows for the years ended December 31,
2018
,
2017
, and
2016
Notes to Consolidated Financial Statements
Report of Independent Registered Public Accounting Firm
2. Financial Statement Schedules:
Schedule II—Valuation and Qualifying Accounts
3. Exhibits:
INDEX TO EXHIBITS
|
Exhibit Number
|
Description of Document
|
|
3.1
|
|
|
3.2
|
|
|
4.1
|
|
|
4.2
|
|
|
4.3
|
|
|
10.1
|
|
|
10.2
|
|
|
10.3
|
|
|
10.4
|
|
|
10.5
|
|
|
10.6
|
|
|
10.7
|
|
|
10.8
|
|
60
|
Exhibit Number
|
Description of Document
|
|
10.9
|
|
|
10.10
|
|
|
13
|
|
|
21
|
|
|
23
|
|
|
31
|
|
|
32
|
|
|
101.INS
|
XBRL Instance Document
|
|
101.SCH
|
XBRL Taxonomy Extension Schema Document
|
|
101.CAL
|
XBRL Taxonomy Calculation Linkbase Document
|
|
101.DEF
|
XBRL Taxonomy Definition Linkbase Document
|
|
101.LAB
|
XBRL Taxonomy Label Linkbase Document
|
|
101.PRE
|
XBRL Taxonomy Presentation Linkbase Document
|
* Management contract or compensatory plan or arrangement required to be filed as an exhibit to this Form 10-K pursuant to Item 15(b).
|
ITEM 16.
|
FORM 10-K SUMMARY
|
Not applicable.
61
FASTENAL COMPANY
Schedule II—Valuation and Qualifying Accounts
Years ended December 31,
2018
,
2017
, and
2016
(Amounts in millions)
|
Description
|
Balance at
Beginning
of Year
|
"Additions"
Charged to
Costs and
Expenses
|
|
"Other"
Additions
(Deductions)
|
"Less"
Deductions
|
|
Balance
at End
of Year
|
||||||||
|
Year ended December 31, 2018
|
|||||||||||||||
|
Allowance for doubtful accounts
|
$
|
11.9
|
|
8.1
|
|
—
|
|
7.2
|
|
12.8
|
|
||||
|
Insurance reserves
|
$
|
39.0
|
|
66.9
|
|
(1)
|
—
|
|
68.3
|
|
(2)
|
37.6
|
|
||
|
Year ended December 31, 2017
|
|||||||||||||||
|
Allowance for doubtful accounts
|
$
|
11.2
|
|
8.2
|
|
—
|
|
7.5
|
|
11.9
|
|
||||
|
Insurance reserves
|
$
|
34.6
|
|
68.2
|
|
(1)
|
—
|
|
63.8
|
|
(2)
|
39.0
|
|
||
|
Year ended December 31, 2016
|
|||||||||||||||
|
Allowance for doubtful accounts
|
$
|
11.7
|
|
8.5
|
|
—
|
|
9.0
|
|
11.2
|
|
||||
|
Insurance reserves
|
$
|
31.8
|
|
62.3
|
|
(1)
|
—
|
|
59.5
|
|
(2)
|
34.6
|
|
||
(1)
Includes costs and expenses incurred for premiums and claims related to health and general insurance.
(2)
Includes costs and expenses paid for premiums and claims related to health and general insurance.
See accompanying Report of Independent Registered Public Accounting Firm incorporated herein by reference.
62
SIGNATURES
Pursuant to the requirements of Section 13 or 15(d) of the Securities Exchange Act of 1934, the registrant has duly caused this report to be signed on its behalf by the undersigned, thereunto duly authorized.
|
Date:
|
February 6, 2019
|
|
|
FASTENAL COMPANY
|
||
|
By
|
/s/ Daniel L. Florness
|
|
|
Daniel L. Florness, President and Chief Executive Officer
|
||
Pursuant to the requirements of the Securities Exchange Act of 1934, this report has been signed below by the following persons on behalf of the registrant and in the capacities and on the date indicated.
|
Date:
|
February 6, 2019
|
|
|
/s/ Daniel L. Florness
|
/s/ Holden Lewis
|
||
|
Daniel L. Florness, President and Chief Executive Officer (Principal Executive Officer), and Director
|
Holden Lewis, Executive Vice President and Chief Financial Officer (Principal Financial Officer)
|
||
|
/s/ Sheryl A. Lisowski
|
|||
|
Sheryl A. Lisowski, Controller, Chief Accounting Officer, and Treasurer (Principal Accounting Officer)
|
|||
|
/s/ Willard D. Oberton
|
/s/ Darren R. Jackson
|
||
|
Willard D. Oberton, Director (Chairman)
|
Darren R. Jackson, Director
|
||
|
/s/ Michael J. Ancius
|
/s/ Daniel L. Johnson
|
||
|
Michael J. Ancius, Director
|
Daniel L. Johnson, Director
|
||
|
/s/ Michael J. Dolan
|
/s/ Scott A. Satterlee
|
||
|
Michael J. Dolan, Director
|
Scott A. Satterlee, Director
|
||
|
/s/ Stephen L. Eastman
|
/s/ Reyne K. Wisecup
|
||
|
Stephen L. Eastman, Director
|
Reyne K. Wisecup, Director
|
||
|
/s/ Rita J. Heise
|
|||
|
Rita J. Heise, Director
|
|||
63
TABLE OF CONTENTS
Part IItem 1. BusinessItem 1A. Risk FactorsItem 1B. Unresolved Staff CommentsItem 2. PropertiesItem 3. Legal ProceedingsItem 4. Mine Safety DisclosuresPart IIItem 5. Market For Registrant's Common Equity, Related Stockholder Matters, and Issuer Purchases Of Equity SecuritiesItem 6. Selected Financial DataItem 7. Management's Discussion and Analysis Of Financial Condition and Results Of OperationsItem 7A. Quantitative and Qualitative Disclosures About Market RisksItem 8. Financial Statements and Supplementary DataNote 1. Business Overview and Summary Of Significant Accounting PoliciesNote 2. RevenueNote 3. Long-lived AssetsNote 4. Accrued ExpensesNote 5. Stockholders' EquityNote 6. Retirement Savings PlanNote 7. Income TaxesNote 8. Operating LeasesNote 9. Debt CommitmentsNote 10. Legal ContingenciesNote 11. Subsequent EventsNote 12. Selected Quarterly Financial Data (unaudited)Item 9. Changes in and Disagreements with Accountants on Accounting and Financial DisclosureItem 9A. Controls and ProceduresItem 9B. Other InformationPart IIIItem 10. Directors, Executive Officers, and Corporate GovernanceItem 11. Executive CompensationItem 12. Security Ownership Of Certain Beneficial Owners and Management and Related Stockholder MattersItem 13. Certain Relationships and Related Transactions, and Director IndependenceItem 14. Principal Accountant Fees and ServicesPart IVItem 15. Exhibits and Financial Statement SchedulesItem 16. Form 10-k Summary