FASTENAL CO
10-Ks and 10-Qs
|
|
|
|
|
|
|
|
|
|
|
|
|
|
|
|
|
|
|
|
|
|
|
|
|
|
|
|
|
|
|
|
|
|
|
|
|
|
|
|
|
|
|
|
|
|
|
|
|
|
|
|
|
|
|
|
WASHINGTON, D.C. 20549
FORM 10-Q
(Mark One)
|
ý
|
Quarterly report pursuant to Section 13 or 15(d) of the Securities Exchange Act of 1934
|
For the quarterly period ended
March 31, 2013
, or
|
¨
|
Transition report pursuant to Section 13 or 15(d) of the Securities Exchange Act of 1934
|
For the transition period from to
Commission file number 0-16125
FASTENAL COMPANY
(Exact name of registrant as specified in its charter)
|
Minnesota
|
|
41-0948415
|
|
(State or other jurisdiction of
incorporation or organization)
|
|
(I.R.S. Employer
Identification No.)
|
|
2001 Theurer Boulevard
Winona, Minnesota
|
|
55987-0978
|
|
(Address of principal executive offices)
|
|
(Zip Code)
|
(507) 454-5374
(Registrant’s telephone number, including area code)
Not Applicable
(Former name, former address and former fiscal year, if changed since last report)
Indicate by check mark whether the registrant: (1) has filed all reports required to be filed by Section 13 or 15(d) of the Securities Exchange Act of 1934 during the preceding 12 months (or for such shorter period that the registrant was required to file such reports), and (2) has been subject to such filing requirements for the past 90 days. Yes
ý
No
¨
Indicate by check mark whether the registrant has submitted electronically and posted on its corporate Web site, if any, every Interactive Data File required to be submitted and posted pursuant to Rule 405 of Regulation S-T (§ 232.405 of this chapter) during the preceding 12 months (or for such shorter period that the registrant was required to submit and post such files.) Yes
ý
No
¨
Indicate by check mark whether the registrant is a large accelerated filer, an accelerated filer, a non-accelerated filer, or a smaller reporting company. See definition of “large accelerated filer”, “accelerated filer”, and “smaller reporting company" in Rule 12b-2 of the Exchange Act.
|
Large Accelerated Filer
|
|
ý
|
|
Accelerated Filer
|
|
¨
|
|
Non-accelerated Filer
|
|
¨
(Do not check if a smaller reporting company)
|
|
Smaller Reporting Company
|
|
¨
|
Indicate by check mark whether the registrant is a shell company (as defined in Rule 12b-2 of the Exchange Act). Yes
¨
No
ý
Indicate the number of shares outstanding of each of the issuer’s classes of common stock, as of the last practicable date.
|
Class
|
|
Outstanding at April 9, 2013
|
|
Common Stock, par value $.01 per share
|
|
296,686,927
|
FASTENAL COMPANY
INDEX
|
|
Page No.
|
FASTENAL COMPANY AND SUBSIDIARIES
Consolidated Balance Sheets
(Amounts in thousands except share information)
|
(Unaudited)
|
||||||
|
Assets
|
March 31, 2013
|
December 31, 2012
|
||||
|
Current assets:
|
||||||
|
Cash and cash equivalents
|
$
|
159,240
|
|
79,611
|
|
|
|
Marketable securities
|
417
|
|
354
|
|
||
|
Trade accounts receivable, net of allowance for doubtful accounts of $6,728
|
418,733
|
|
372,159
|
|
||
|
Inventories
|
700,484
|
|
715,383
|
|
||
|
Deferred income tax assets
|
14,079
|
|
14,420
|
|
||
|
Other current assets
|
83,883
|
|
97,361
|
|
||
|
Prepaid income taxes
|
—
|
|
7,368
|
|
||
|
Total current assets
|
1,376,836
|
|
1,286,656
|
|
||
|
Property and equipment, less accumulated depreciation
|
555,734
|
|
516,427
|
|
||
|
Other assets, net
|
12,726
|
|
12,749
|
|
||
|
Total assets
|
$
|
1,945,296
|
|
1,815,832
|
|
|
|
Liabilities and Stockholders’ Equity
|
||||||
|
Current liabilities:
|
||||||
|
Accounts payable
|
$
|
75,327
|
|
78,019
|
|
|
|
Accrued expenses
|
126,091
|
|
126,155
|
|
||
|
Income taxes payable
|
51,679
|
|
—
|
|
||
|
Total current liabilities
|
253,097
|
|
204,174
|
|
||
|
Deferred income tax liabilities
|
51,336
|
|
51,298
|
|
||
|
Stockholders' equity:
|
||||||
|
Preferred stock, 5,000,000 shares authorized
|
—
|
|
—
|
|
||
|
Common stock, 400,000,000 shares authorized, 296,686,427 and 296,564,382 shares issued and outstanding, respectively
|
2,967
|
|
2,966
|
|
||
|
Additional paid-in capital
|
66,560
|
|
61,436
|
|
||
|
Retained earnings
|
1,556,987
|
|
1,477,601
|
|
||
|
Accumulated other comprehensive income
|
14,349
|
|
18,357
|
|
||
|
Total stockholders' equity
|
1,640,863
|
|
1,560,360
|
|
||
|
Total liabilities and stockholders' equity
|
$
|
1,945,296
|
|
1,815,832
|
|
|
The accompanying notes are an integral part of the consolidated financial statements.
1
FASTENAL COMPANY AND SUBSIDIARIES
Consolidated Statements of Earnings
(Amounts in thousands except earnings per share)
|
(Unaudited)
|
||||||
|
|
Three months ended
March 31, |
|||||
|
|
2013
|
2012
|
||||
|
Net sales
|
$
|
806,326
|
|
768,875
|
|
|
|
Cost of sales
|
384,446
|
|
374,698
|
|
||
|
Gross profit
|
421,880
|
|
394,177
|
|
||
|
Operating and administrative expenses
|
247,334
|
|
232,970
|
|
||
|
(Gain) loss on sale of property and equipment
|
(213
|
)
|
174
|
|
||
|
Operating income
|
174,759
|
|
161,033
|
|
||
|
Interest income
|
447
|
|
96
|
|
||
|
Interest expense
|
(34
|
)
|
—
|
|
||
|
Earnings before income taxes
|
175,172
|
|
161,129
|
|
||
|
Income tax expense
|
66,124
|
|
60,935
|
|
||
|
Net earnings
|
$
|
109,048
|
|
100,194
|
|
|
|
Basic net earnings per share
|
$
|
0.37
|
|
0.34
|
|
|
|
Diluted net earnings per share
|
$
|
0.37
|
|
0.34
|
|
|
|
Basic weighted average shares outstanding
|
296,643
|
|
295,538
|
|
||
|
Diluted weighted average shares outstanding
|
297,652
|
|
296,927
|
|
||
The accompanying notes are an integral part of the consolidated financial statements.
2
FASTENAL COMPANY AND SUBSIDIARIES
Consolidated Statements of Comprehensive Income
(Amounts in thousands)
|
(Unaudited)
|
|||||||
|
|
Three months ended
March 31, |
||||||
|
|
2013
|
2012
|
|||||
|
Net earnings
|
$
|
109,048
|
|
100,194
|
|
||
|
Other comprehensive income (loss), net of tax:
|
|||||||
|
Foreign currency translation adjustments (net of tax of $0 in 2013 and 2012)
|
(4,072
|
)
|
2,940
|
|
|||
|
Change in marketable securities (net of tax of $0 in 2013 and 2012)
|
63
|
|
23
|
|
|||
|
Comprehensive income
|
$
|
105,039
|
|
103,157
|
|
||
The accompanying notes are an integral part of the consolidated financial statements.
3
FASTENAL COMPANY AND SUBSIDIARIES
Consolidated Statements of Cash Flows
(Amounts in thousands)
|
(Unaudited)
|
||||||
|
|
Three months ended
March 31, |
|||||
|
|
2013
|
2012
|
||||
|
Cash flows from operating activities:
|
||||||
|
Net earnings
|
$
|
109,048
|
|
100,194
|
|
|
|
Adjustments to reconcile net earnings to net cash provided by operating activities:
|
||||||
|
Depreciation of property and equipment
|
15,152
|
|
12,415
|
|
||
|
(Gain) loss on sale of property and equipment
|
(213
|
)
|
174
|
|
||
|
Bad debt expense
|
2,045
|
|
2,329
|
|
||
|
Deferred income taxes
|
379
|
|
1,863
|
|
||
|
Stock based compensation
|
1,350
|
|
1,050
|
|
||
|
Excess tax benefits from stock based compensation
|
(954
|
)
|
—
|
|
||
|
Amortization of non-compete agreements
|
26
|
|
148
|
|
||
|
Changes in operating assets and liabilities:
|
||||||
|
Trade accounts receivable
|
(48,619
|
)
|
(50,617
|
)
|
||
|
Inventories
|
14,899
|
|
(1,734
|
)
|
||
|
Other current assets
|
13,478
|
|
15,536
|
|
||
|
Accounts payable
|
(2,692
|
)
|
2,334
|
|
||
|
Accrued expenses
|
(64
|
)
|
1,134
|
|
||
|
Income taxes
|
60,001
|
|
44,941
|
|
||
|
Other
|
(3,592
|
)
|
2,421
|
|
||
|
Net cash provided by operating activities
|
160,244
|
|
132,188
|
|
||
|
Cash flows from investing activities:
|
||||||
|
Purchase of property and equipment
|
(55,513
|
)
|
(28,212
|
)
|
||
|
Proceeds from sale of property and equipment
|
1,267
|
|
985
|
|
||
|
Net increase in marketable securities
|
(63
|
)
|
(29
|
)
|
||
|
Increase in other assets
|
(3
|
)
|
(57
|
)
|
||
|
Net cash used in investing activities
|
(54,312
|
)
|
(27,313
|
)
|
||
|
Cash flows from financing activities:
|
||||||
|
Borrowings under line of credit
|
20,000
|
|
—
|
|
||
|
Payments against line of credit
|
(20,000
|
)
|
—
|
|
||
|
Proceeds from exercise of stock options
|
2,821
|
|
18,285
|
|
||
|
Excess tax benefits from stock based compensation
|
954
|
|
7,697
|
|
||
|
Payment of dividends
|
(29,662
|
)
|
(50,197
|
)
|
||
|
Net cash used in financing activities
|
(25,887
|
)
|
(24,215
|
)
|
||
|
Effect of exchange rate changes on cash
|
(416
|
)
|
542
|
|
||
|
Net increase in cash and cash equivalents
|
79,629
|
|
81,202
|
|
||
|
Cash and cash equivalents at beginning of period
|
79,611
|
|
117,676
|
|
||
|
Cash and cash equivalents at end of period
|
$
|
159,240
|
|
198,878
|
|
|
|
Supplemental disclosure of cash flow information:
|
||||||
|
Cash paid during each period for interest
|
$
|
34
|
|
—
|
|
|
|
Cash paid during each period for income taxes
|
$
|
6,502
|
|
21,828
|
|
|
The accompanying notes are an integral part of the consolidated financial statements.
4
FASTENAL COMPANY AND SUBSIDIARIES
NOTES TO CONSOLIDATED FINANCIAL STATEMENTS
(Amounts in thousands except share and per share information and where otherwise noted)
March 31, 2013 and 2012
(Unaudited)
(1) Basis of Presentation
The accompanying unaudited consolidated financial statements of Fastenal Company and subsidiaries (collectively referred to as the Company, Fastenal, or by terms such as we, our, or us) have been prepared in accordance with United States generally accepted accounting principles for interim financial information. They do not include all information and footnotes required by United States generally accepted accounting principles for complete financial statements. However, except as described herein, there has been no material change in the information disclosed in the notes to consolidated financial statements included in our consolidated financial statements as of and for the year ended December 31, 2012. In the opinion of management, all adjustments (consisting of normal recurring accruals) considered necessary for a fair presentation have been included.
(2) Marketable Securities
We follow a fair value hierarchy that prioritizes the inputs to valuation techniques used to measure fair value. The hierarchy gives the highest priority to unadjusted quoted prices in active markets for identical assets and liabilities (Level 1) and the lowest priority to measurements involving unobservable inputs (Level 3). The three levels of the fair value hierarchy are as follows:
|
•
|
Level 1 inputs are observable inputs that reflect quoted prices (unadjusted) for identical assets or liabilities in active markets.
|
|
•
|
Level 2 inputs include other inputs that are directly or indirectly observable in the marketplace.
|
|
•
|
Level 3 inputs are unobservable inputs which are supported by little or no market activity.
|
The level in the fair value hierarchy within which a fair value measurement falls is based on the lowest level input that is significant to the fair value measurement in its entirety.
The following table presents the placement in the fair value hierarchy of assets that are measured at fair value on a recurring basis:
|
March 31, 2013:
|
Total
|
Level 1
|
Level 2
|
Level 3
|
||||||||
|
Common stock
|
$
|
417
|
|
417
|
|
—
|
|
—
|
|
|||
|
Total available-for-sale securities
|
$
|
417
|
|
417
|
|
—
|
|
—
|
|
|||
|
December 31, 2012:
|
Total
|
Level 1
|
Level 2
|
Level 3
|
||||||||
|
Common stock
|
$
|
354
|
|
354
|
|
—
|
|
—
|
|
|||
|
Total available-for-sale securities
|
$
|
354
|
|
354
|
|
—
|
|
—
|
|
|||
|
March 31, 2012:
|
Total
|
Level 1
|
Level 2
|
Level 3
|
||||||||
|
Common stock
|
$
|
347
|
|
347
|
|
—
|
|
—
|
|
|||
|
Government and agency securities
|
26,847
|
|
26,847
|
|
—
|
|
—
|
|
||||
|
Total available-for-sale securities
|
$
|
27,194
|
|
27,194
|
|
—
|
|
—
|
|
|||
There were no transfers between levels during the
three
month periods ended
March 31, 2013
and
2012
.
As of
March 31, 2013
,
December 31, 2012
, and
March 31, 2012
, our financial assets that are measured at fair value on a recurring basis consisted of common stock and debt securities.
5
FASTENAL COMPANY AND SUBSIDIARIES
NOTES TO CONSOLIDATED FINANCIAL STATEMENTS
(Amounts in thousands except share and per share information and where otherwise noted)
March 31, 2013 and 2012
(Unaudited)
Marketable securities, all treated as available-for-sale securities, consist of the following:
|
March 31, 2013:
|
Amortized
cost |
Gross
unrealized gains |
Gross
unrealized losses |
Fair value
|
||||||||
|
Common stock
|
$
|
197
|
|
220
|
|
—
|
|
417
|
|
|||
|
Total available-for-sale securities
|
$
|
197
|
|
220
|
|
—
|
|
417
|
|
|||
|
December 31, 2012:
|
Amortized
cost |
Gross
unrealized gains |
Gross
unrealized losses |
Fair value
|
||||||||
|
Common stock
|
$
|
197
|
|
157
|
|
—
|
|
354
|
|
|||
|
Total available-for-sale securities
|
$
|
197
|
|
157
|
|
—
|
|
354
|
|
|||
|
March 31, 2012:
|
Amortized
cost |
Gross
unrealized gains |
Gross
unrealized losses |
Fair value
|
||||||||
|
Common stock
|
$
|
197
|
|
150
|
|
—
|
|
347
|
|
|||
|
Government and agency securities
|
26,857
|
|
—
|
|
(10
|
)
|
26,847
|
|
||||
|
Total available-for-sale securities
|
$
|
27,054
|
|
150
|
|
(10
|
)
|
27,194
|
|
|||
The unrealized gains and losses recorded in accumulated other comprehensive income and the realized gains and losses recorded in earnings were immaterial during the periods reported in these consolidated financial statements.
Future maturities of our available-for-sale securities consist of the following:
|
|
Less than 12 months
|
Greater than 12 months
|
||||||||||
|
March 31, 2013:
|
Amortized
cost |
Fair
value |
Amortized
cost |
Fair
value |
||||||||
|
Common stock
|
$
|
197
|
|
417
|
|
—
|
|
—
|
|
|||
|
Total available-for-sale securities
|
$
|
197
|
|
417
|
|
—
|
|
—
|
|
|||
6
FASTENAL COMPANY AND SUBSIDIARIES
NOTES TO CONSOLIDATED FINANCIAL STATEMENTS
(Amounts in thousands except share and per share information and where otherwise noted)
March 31, 2013 and 2012
(Unaudited)
(3) Stockholders’ Equity
Our authorized, issued, and outstanding shares (share amounts stated in whole numbers) consist of the following:
|
Par Value
|
March 31,
2013 |
December 31,
2012 |
March 31,
2012 |
||||||||
|
Preferred Stock
|
$.01
|
/share
|
|||||||||
|
Shares authorized
|
5,000,000
|
|
5,000,000
|
|
5,000,000
|
|
|||||
|
Shares issued and outstanding
|
—
|
|
—
|
|
—
|
|
|||||
|
Common Stock
|
$.01
|
/share
|
|||||||||
|
Shares authorized
|
400,000,000
|
|
400,000,000
|
|
400,000,000
|
|
|||||
|
Shares issued and outstanding
|
296,686,427
|
|
296,564,382
|
|
296,071,374
|
|
|||||
Dividends
On
April 9, 2013
, our board of directors declared a dividend of
$0.20
per share of common stock. This dividend is to be paid in cash on
May 30, 2013
to shareholders of record at the close of business on
May 2, 2013
. Since 2011 we have paid quarterly dividends and, in 2012, we paid a supplemental dividend late in the year. Our board of directors expect to continue paying quarterly dividends, provided the future determination as to payment of dividends will depend on the financial needs of the Company and such other factors as deemed relevant by the board of directors.
The following table presents the dividends either paid previously or declared by our board of directors for future payment:
|
2013
|
2012
|
|||||
|
First quarter
|
$
|
0.10
|
|
0.17
|
|
|
|
Second quarter
|
$
|
0.20
|
|
0.17
|
|
|
|
Third quarter
|
|
|
0.19
|
|
||
|
Fourth quarter
|
|
|
0.21
|
|
||
|
Supplemental
|
|
|
0.50
|
|
||
|
Total
|
$
|
0.30
|
|
1.24
|
|
|
7
FASTENAL COMPANY AND SUBSIDIARIES
NOTES TO CONSOLIDATED FINANCIAL STATEMENTS
(Amounts in thousands except share and per share information and where otherwise noted)
March 31, 2013 and 2012
(Unaudited)
Stock Options
The following tables summarize the details of grants made under our stock option plan of options that have been granted and are outstanding, and the assumptions used to value these options. All options granted were effective at the close of business on the date of grant.
|
Option
|
Closing
|
|||||||||||||||
|
|
|
exercise
|
stock price
|
March 31, 2013
|
||||||||||||
|
|
Options
|
(strike)
|
on date
|
Options
|
Options
|
|||||||||||
|
Date of grant
|
granted
|
price
|
of grant
|
outstanding
|
vested
|
|||||||||||
|
April 17, 2012
|
1,235,000
|
|
$
|
54.00
|
|
$
|
49.01
|
|
1,152,500
|
|
—
|
|
||||
|
April 19, 2011
|
410,000
|
|
$
|
35.00
|
|
$
|
31.78
|
|
370,000
|
|
—
|
|
||||
|
April 20, 2010
|
530,000
|
|
$
|
30.00
|
|
$
|
27.13
|
|
330,000
|
|
—
|
|
||||
|
April 21, 2009
|
790,000
|
|
$
|
27.00
|
|
$
|
17.61
|
|
520,000
|
|
—
|
|
||||
|
April 15, 2008
|
550,000
|
|
$
|
27.00
|
|
$
|
24.35
|
|
254,417
|
|
99,417
|
|
||||
|
April 17, 2007
|
4,380,000
|
|
$
|
22.50
|
|
$
|
20.15
|
|
1,963,080
|
|
947,330
|
|
||||
|
Total
|
7,895,000
|
|
4,589,997
|
|
1,046,747
|
|
||||||||||
|
Date of grant
|
Risk-free
interest rate
|
Expected life of
option in years
|
Expected
dividend
yield
|
Expected
stock
volatility
|
Estimated fair
value of stock
option
|
|||||||||
|
April 17, 2012
|
0.9
|
%
|
5.00
|
1.4
|
%
|
39.25
|
%
|
$
|
13.69
|
|
||||
|
April 19, 2011
|
2.1
|
%
|
5.00
|
1.6
|
%
|
39.33
|
%
|
$
|
11.20
|
|
||||
|
April 20, 2010
|
2.6
|
%
|
5.00
|
1.5
|
%
|
39.10
|
%
|
$
|
8.14
|
|
||||
|
April 21, 2009
|
1.9
|
%
|
5.00
|
1.0
|
%
|
38.80
|
%
|
$
|
3.64
|
|
||||
|
April 15, 2008
|
2.7
|
%
|
5.00
|
1.0
|
%
|
30.93
|
%
|
$
|
7.75
|
|
||||
|
April 17, 2007
|
4.6
|
%
|
4.85
|
1.0
|
%
|
31.59
|
%
|
$
|
5.63
|
|
||||
All of the options in the tables above vest and become exercisable over a period of up to
eight years
. Each option will terminate, to the extent not previously exercised,
13 months
after the end of the relevant vesting period.
The fair value of each share-based option is estimated on the date of grant using a Black-Scholes valuation method that uses the assumptions listed above. The expected life is the average length of time over which we expect the employee groups will exercise their options, which is based on historical experience with similar grants. Expected volatilities are based on the movement of our stock over the most recent historical period equivalent to the expected life of the option. The risk-free interest rate is based on the U.S. Treasury rate over the expected life at the time of grant. The dividend yield is estimated over the expected life based on our current dividend payout, historical dividends paid, and expected future cash dividends.
Compensation expense equal to the grant date fair value is recognized for all of these awards over the vesting period. The stock-based compensation expense for the
three
month periods ended
March 31, 2013
and
2012
was
$1,350
and
$1,050
, respectively. Unrecognized compensation expense related to outstanding stock options as of
March 31, 2013
was
$18,337
and is expected to be recognized over a weighted average period of
4.50 years
. Any future changes in estimated forfeitures will impact this amount.
8
FASTENAL COMPANY AND SUBSIDIARIES
NOTES TO CONSOLIDATED FINANCIAL STATEMENTS
(Amounts in thousands except share and per share information and where otherwise noted)
March 31, 2013 and 2012
(Unaudited)
Earnings Per Share
The following tables present a reconciliation of the denominators used in the computation of basic and diluted earnings per share and a summary of the options to purchase shares of common stock which were excluded from the diluted earnings calculation because they were anti-dilutive:
|
|
Three-month period
|
||||
|
Reconciliation
|
2013
|
2012
|
|||
|
Basic weighted average shares outstanding
|
296,643,014
|
|
295,538,402
|
|
|
|
Weighted shares assumed upon exercise of stock options
|
1,008,946
|
|
1,388,821
|
|
|
|
Diluted weighted average shares outstanding
|
297,651,960
|
|
296,927,223
|
|
|
|
|
Three-month period
|
||||
|
Summary of anti-dilutive options excluded
|
2013
|
2012
|
|||
|
Options to purchase shares of common stock
|
1,168,083
|
|
—
|
|
|
|
Weighted average exercise price of options
|
$54.00
|
$0.00
|
|||
Any dilutive impact summarized above would relate to periods when the average market price of our stock exceeded the exercise price of the potentially dilutive option securities then outstanding.
(4) Income Taxes
Fastenal, or one of its subsidiaries, files income tax returns in the United States federal jurisdiction, numerous states, and various local and foreign jurisdictions. With limited exceptions, we are no longer subject to income tax examinations by taxing authorities for taxable years before 2009 in the case of United States federal and non-United States examinations and 2008 in the case of state and local examinations.
As of
March 31, 2013
and
2012
, the Company had
$7,661
and
$5,517
, respectively, of liabilities recorded related to unrecognized tax benefits. Included in this liability for unrecognized tax benefits is an immaterial amount for interest and penalties, both of which we classify as a component of income tax expense. The Company does not anticipate its total unrecognized tax benefits will change significantly during the next 12 months.
(5) Operating Leases
We lease certain pick-up trucks under operating leases. These leases have a non-cancellable lease term of
one
year, with renewal options for up to
72
months. The pick-up truck leases include an early buy out clause we generally exercise, thereby giving the leases an effective term of
28
-
36
months. Certain operating leases for vehicles contain residual value guarantee provisions which would become due at the expiration of the operating lease agreement if the fair value of the leased vehicles is less than the guaranteed residual value. The aggregate residual value guarantee related to these leases is approximately
$49,433
.
We believe the likelihood of funding the guarantee obligation under any provision of the operating lease agreements is remote, except for
a
$137
los
s on disposal reserve provided at
March 31, 2013
. Our fleet also contains vehicles we estimate will settle at a gain. Gains on these vehicles will be recognized when we sell or dispose of the vehicle or at the end of the lease term.
9
FASTENAL COMPANY AND SUBSIDIARIES
NOTES TO CONSOLIDATED FINANCIAL STATEMENTS
(Amounts in thousands except share and per share information and where otherwise noted)
March 31, 2013 and 2012
(Unaudited)
(6) Contingencies
As of March 31, 2013 there were no material litigation matters that we consider to be probable or reasonably estimable.
(7) Subsequent Events
On
April 9, 2013
, our board of directors declared a dividend of
$0.20
per share. This dividend is discussed in footnote (3)
'Stockholders' Equity'
.
10
The following is management’s discussion and analysis of certain significant factors which have affected our financial position and operating results during the periods included in the accompanying consolidated financial statements. (Dollar amounts are stated in thousands except for per share amounts and where otherwise noted.)
BUSINESS AND OPERATIONAL OVERVIEW:
Fastenal is a North American leader in the wholesale distribution of industrial and construction supplies. We distribute these supplies through a network of approximately 2,700 company owned stores. Most of our customers are in the manufacturing and non-residential construction markets. The manufacturing market includes both original equipment manufacturers (OEM) and maintenance and repair operations (MRO). The non-residential construction market includes general, electrical, plumbing, sheet metal, and road contractors. Other users of our product include farmers, ranchers, truckers, railroads, mining companies, federal, state, and local governmental entities, schools, and certain retail trades. Geographically, our stores and customers are primarily located in North America.
In the past decade, we have experienced periods of inflation and deflation related to steel prices (this is meaningful to our business because approximately 45% of our sales consist of some type of fastener – nuts, bolts, screws, etc. – most of which are made of steel). In the period from 2003 to the fall of 2008, we experienced inflation in steel prices, this was most pronounced in 2008. In the fourth quarter of 2008, and throughout much of 2009, we experienced deflation in steel prices. When the swings are dramatic, this can hurt our gross margins because we are selling expensive inventory on the shelf at declining prices. This hurt our gross margins in 2009. The drop in energy costs (this is meaningful to our business because we are a store based distributor with a large trucking fleet) over the same period provided some relief, but it was small in comparison to the impact of the steel deflation. The deflation of 2009 ended and these conditions normalized and allowed our gross margins to recover into a more normal range beginning in 2010. (See later discussion on gross margins.)
Similar to previous quarters, we have included comments regarding several aspects of our business:
|
1.
|
Monthly sales changes, sequential trends, and end market performance
– a recap of our recent sales trends and some insight into the activities with different end markets.
|
|
2.
|
Growth drivers of our business
– a recap of how we grow our business.
|
|
3.
|
Profit drivers of our business
– a recap of how we increase our profits.
|
|
4.
|
|
|
5.
|
|
While reading these items, it is helpful to appreciate several aspects of our marketplace: (1) it's big, the North American marketplace for industrial supplies is estimated to be in excess of $160 billion per year (and we have expanded beyond North America), (2) no company has a significant portion of this market, (3) many of the products we sell are individually inexpensive, (4) when our customer needs something quickly or unexpectedly our local store is a quick source, (5) the cost to manage and procure these products can be significant, and (6) the cost to move these products, many of which are bulky, can also be significant.
Our motto is
Growth through Customer Service
. This is important given the points noted above. We believe in efficient markets – to us, this means we can grow our market share if we provide the greatest value to the customer. We believe our ability to grow is amplified if we can service our customer at the closest economic point of contact.
The concept of growth is simple
–
find more customers every day and increase your activity with them. However, execution is hard work. First, we recruit service minded individuals to support our customers and their business. Second, we operate in a decentralized fashion to help identify the greatest value for our customers. Third, we build a great machine behind the store to operate efficiently and to help identify new business solutions. Fourth, we do these things every day. Finally, we strive to generate strong profits; these profits produce the cash flow necessary to fund the growth and to support the needs of our customers.
11
SALES GROWTH:
Net sales and growth rates in net sales were as follows:
|
|
Three-month period
|
|||||
|
|
2013
|
2012
|
||||
|
Net sales
|
$
|
806,326
|
|
768,875
|
|
|
|
Percentage change
|
4.9
|
%
|
20.0
|
%
|
||
The increase in net sales in the first
three
months of
2013
and
2012
came primarily from higher unit sales. Our growth in net sales was impacted by inflationary price changes in our non-fastener products and some price deflation in our fastener products, but the net impacts were limited. Our growth in net sales was not meaningfully impacted by the introduction of new products or services, with one exception, our FAST Solutions
SM
(industrial vending) initiative did stimulate faster growth (discussed later in this document). The higher unit sales resulted primarily from increases in sales at older store locations (discussed below and again later in this document) and to a lesser degree the opening of new store locations in the last several years. The growth in net sales at the older store locations was due to the growth drivers of our business (discussed later in this document), and, in the case of
2012
, the moderating impacts of the recessionary environment. The change in currencies in foreign countries (primarily Canada) relative to the United States dollar lowered our daily sales growth rate by 0.1% in the first
three
months of
2013
and
2012
.
Our sales growth of 4.9% in the
first
quarter of
2013
was impacted by the loss of one business day versus the prior year (63 days versus 64). Our sales growth adjusted to a daily basis was 6.5% in the
first
quarter of
2013
; the calendar change also impacted the sales by store age shown in the table below. We believe our sales growth was held back partially due to the global economic policy uncertainty.
The stores opened greater than two years represent a consistent ‘same store’ view of our business (store sites opened as follows: 2013 group – opened 2011 and earlier, and 2012 group – opened 2010 and earlier). However, the impact of the economy is best reflected in the growth performance of our stores opened greater than five years (store sites opened as follows: 2013 group – opened 2008 and earlier, and 2012 group – opened 2007 and earlier) and opened greater than ten years (store sites opened as follows: 2013 group – opened 2003 and earlier, and 2012 group – opened 2002 and earlier). These two groups of stores are more cyclical due to the increased market share they enjoy in their local markets. The daily sales change for each of these groups was as follows:
|
|
Three-month period
|
||||
|
|
2013
|
2012
|
|||
|
Store Age
|
|||||
|
Opened greater than 2 years
|
4.8
|
%
|
17.4
|
%
|
|
|
Opened greater than 5 years
|
3.6
|
%
|
16.2
|
%
|
|
|
Opened greater than 10 years
|
1.9
|
%
|
14.4
|
%
|
|
Note: The age groups above are measured as of the last day of each respective calendar year.
SALES BY PRODUCT LINE:
The mix of sales from the original fastener product line and from the other product lines was as follows:
|
|
Three-month period
|
||||
|
|
2013
|
2012
|
|||
|
Fastener product line
|
43.0
|
%
|
45.5
|
%
|
|
|
Other product lines
|
57.0
|
%
|
54.5
|
%
|
|
|
100.0
|
%
|
100.0
|
%
|
||
12
MONTHLY SALES CHANGES, SEQUENTIAL TRENDS, AND END MARKET PERFORMANCE
Note – Daily sales are defined as the sales for the period divided by the number of business days (in the United States) in the period.
This section focuses on three distinct views of our business – monthly sales changes, sequential trends, and end market performance. The first discussion regarding
monthly sales changes
provides a good mechanical view of our business based on the age of our stores. The second discussion provides a framework for understanding the
sequential trends
(that is, comparing a period to the immediately preceding period) in our business. Finally, we believe the third discussion regarding
end market performance
provides insight into activities with our various types of customers.
MONTHLY SALES CHANGES:
All company sales –
During the months in 2013, 2012, and 2011, all of our selling locations, when combined, had daily sales growth rates of (compared to the same month in the preceding year):
|
|
Jan.
|
Feb.
|
Mar.
|
Apr.
|
May
|
June
|
July
|
Aug.
|
Sept.
|
Oct.
|
Nov.
|
Dec.
|
|||||||||||||||||||||||
|
2013
|
6.7
|
%
|
8.2
|
%
|
5.1
|
%
|
|
|
|
|
|
|
|
|
|
|
|
|
|
|
|
|
|
|
|||||||||||
|
2012
|
21.3
|
%
|
20.0
|
%
|
19.3
|
%
|
17.3
|
%
|
13.1
|
%
|
14.0
|
%
|
12.1
|
%
|
12.0
|
%
|
12.9
|
%
|
6.8
|
%
|
8.2
|
%
|
9.7
|
%
|
|||||||||||
|
2011
|
18.8
|
%
|
21.5
|
%
|
22.8
|
%
|
23.2
|
%
|
22.6
|
%
|
22.5
|
%
|
22.4
|
%
|
20.0
|
%
|
18.8
|
%
|
21.4
|
%
|
22.2
|
%
|
21.2
|
%
|
|||||||||||
Stores opened greater than
two
years –
Our stores opened greater than two years (store sites opened as follows: 2013 group – opened 2011 and earlier, 2012 group – opened 2010 and earlier, and 2011 group – opened 2009 and earlier) represent a consistent 'same-store' view of our business. During the months in 2013, 2012, and 2011, the stores opened greater than two years had daily sales growth rates of (compared to the same month in the preceding year):
|
|
Jan.
|
Feb.
|
Mar.
|
Apr.
|
May
|
June
|
July
|
Aug.
|
Sept.
|
Oct.
|
Nov.
|
Dec.
|
|||||||||||||||||||||||
|
2013
|
5.0
|
%
|
6.5
|
%
|
3.4
|
%
|
|
|
|
|
|
|
|
|
|
|
|
|
|
|
|
|
|
|
|||||||||||
|
2012
|
18.8
|
%
|
17.1
|
%
|
16.8
|
%
|
14.5
|
%
|
10.1
|
%
|
11.1
|
%
|
9.1
|
%
|
8.6
|
%
|
9.8
|
%
|
3.8
|
%
|
5.1
|
%
|
6.6
|
%
|
|||||||||||
|
2011
|
16.0
|
%
|
18.4
|
%
|
19.4
|
%
|
19.6
|
%
|
19.2
|
%
|
19.1
|
%
|
18.7
|
%
|
16.5
|
%
|
15.2
|
%
|
18.0
|
%
|
18.5
|
%
|
17.5
|
%
|
|||||||||||
Stores opened greater than
five
years –
The impact of the economy, over time, is best reflected in the growth performance of our stores opened greater than five years (store sites opened as follows: 2013 group – opened 2008 and earlier, 2012 group – opened 2007 and earlier, and 2011 group – opened 2006 and earlier). This group is more cyclical due to the increased market share they enjoy in their local markets. During the months in 2013, 2012, and 2011, the stores opened greater than five years had daily sales growth rates of (compared to the same month in the preceding year):
|
|
Jan.
|
Feb.
|
Mar.
|
Apr.
|
May
|
June
|
July
|
Aug.
|
Sept.
|
Oct.
|
Nov.
|
Dec.
|
|||||||||||||||||||||||
|
2013
|
3.2
|
%
|
5.6
|
%
|
2.3
|
%
|
|
|
|
|
|
|
|
|
|
|
|
|
|
|
|
|
|
|
|||||||||||
|
2012
|
17.4
|
%
|
15.8
|
%
|
15.7
|
%
|
13.7
|
%
|
9.0
|
%
|
10.2
|
%
|
8.3
|
%
|
7.9
|
%
|
8.5
|
%
|
2.6
|
%
|
4.6
|
%
|
5.6
|
%
|
|||||||||||
|
2011
|
15.3
|
%
|
17.9
|
%
|
19.2
|
%
|
19.1
|
%
|
17.9
|
%
|
18.2
|
%
|
17.3
|
%
|
15.2
|
%
|
14.5
|
%
|
17.0
|
%
|
17.4
|
%
|
16.9
|
%
|
|||||||||||
There are three distinct influences to our growth: (1) execution, (2) currency fluctuations, and (3) economic fluctuations. This discussion centers on (2) and (3). First off, currency – the change in currencies in foreign countries (primarily Canada) relative to the United States dollar impacted our growth over the last several years. During 2011 it lifted our growth by 0.7%, in 2012 it lowered our growth by 0.1% (by quarter the impact was down 0.1%, 0.4%, and 0.2% in the first, second, and third quarters, respectively, and then up in the fourth quarter by 0.2%) and in the first quarter of 2013 it lowered our growth by 0.1%.
Regarding economic fluctuations, in 2011 we enjoyed strong growth. This reflected the strengthening economic environment being experienced by our customers. While the strength did not apply to all customers and to all geographies we serve, it was strong enough to produce acceptable results. During 2012, the growth in the first three and a half months generally continued the relative strength we saw in 2011. Then we experienced two distinct economic slowdowns. The first occurred in the late April/May time frame, and then moderated until September. The second occurred in the October/November time frame. This was exaggerated by an unusual business day comparison in October (23 days in 2012 versus 21 days in 2011 - the maintenance portion of our business is often linked to monthly spend patterns, which are not as business day dependent, this can dilute the daily growth picture given the change in business day divisor) and the impact of Hurricane Sandy. During the first three months of 2013, the weakness has continued. Both January and February experienced some negative impact from weather, and January experienced a very weak start due to extended holiday shutdown. However, with the benefit of hindsight, we believe the economic activity of our customers slowed from January to February and slowed further from February to March. This is evident in the two and five year comparisons above.
13
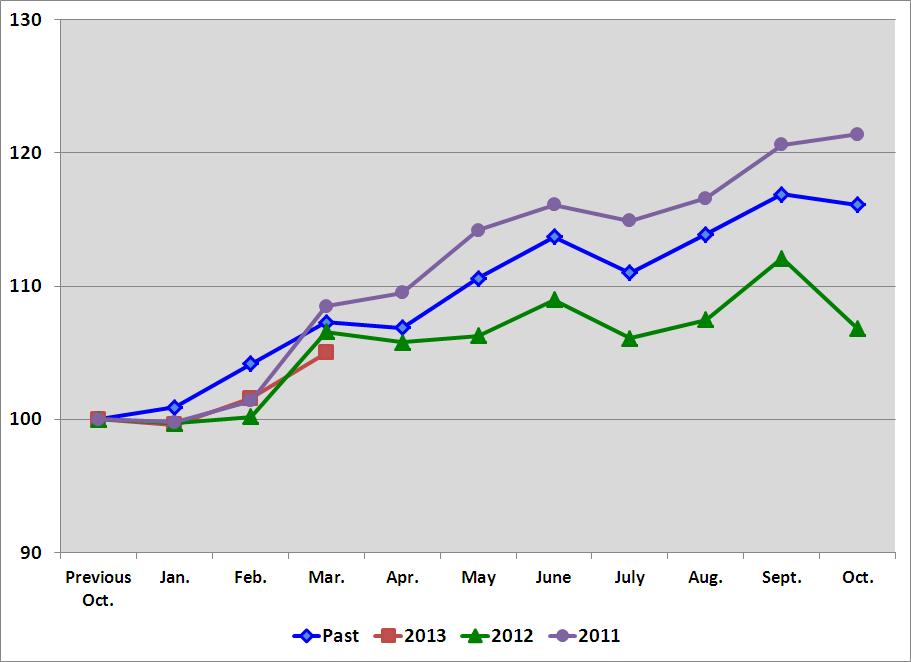
SEQUENTIAL TRENDS:
We find it helpful to think about the monthly sequential changes in our business using the analogy of climbing a stairway –
This stairway has several predictable landings where there is a pause in the sequential gain (i.e. April, July, and October to December), but generally speaking, climbs from January to October. The October landing then establishes the benchmark for the start of the next year.
History has identified these landings in our business cycle. They generally relate to months with impaired business days (certain holidays). The first landing centers on Easter, which alternates between March and April (Easter occurred in March in 2013, and in April in 2012 and 2011), the second landing centers on July 4
th
, and the third landing centers on the approach of winter with its seasonal impact on primarily our construction business and with the Christmas / New Year holidays. The holidays we noted impact the trends because they either move from month-to-month or because they move around during the week.
The table below shows the pattern to our sequential change in our daily sales. The line labeled 'Past' is an historical average of our sequential daily sales change for the period 1998 to 2003. We chose this time frame because it had similar characteristics, a weaker industrial economy in North America, and could serve as a benchmark for a possible trend line. The '2013', '2012', and '2011' lines represent our actual sequential daily sales changes. The '13Delta', '12Delta', and '11Delta' lines indicate the difference between the 'Past' and the actual results in the respective year.
|
|
Jan.(1)
|
Feb.
|
Mar.
|
Apr.
|
May
|
June
|
July
|
Aug.
|
Sept.
|
Oct.
|
Cumulative change
from Jan. to Mar.
|
|||||||||||||||||||||
|
Past
|
0.9
|
%
|
3.3
|
%
|
2.9
|
%
|
-0.3
|
%
|
3.4
|
%
|
2.8
|
%
|
-2.3
|
%
|
2.6
|
%
|
2.6
|
%
|
-0.7
|
%
|
6.2
|
%
|
||||||||||
|
2013
|
-0.4
|
%
|
2.0
|
%
|
3.4
|
%
|
5.4
|
%
|
||||||||||||||||||||||||
|
13Delta
|
-1.3
|
%
|
-1.3
|
%
|
0.5
|
%
|
-0.8
|
%
|
||||||||||||||||||||||||
|
2012
|
-0.3
|
%
|
0.5
|
%
|
6.4
|
%
|
-0.8
|
%
|
0.5
|
%
|
2.5
|
%
|
-2.7
|
%
|
1.3
|
%
|
4.3
|
%
|
-4.8
|
%
|
7.0
|
%
|
||||||||||
|
12Delta
|
-1.2
|
%
|
-2.8
|
%
|
3.5
|
%
|
-0.5
|
%
|
-2.9
|
%
|
-0.3
|
%
|
-0.4
|
%
|
-1.3
|
%
|
1.7
|
%
|
-4.1
|
%
|
0.8
|
%
|
||||||||||
|
2011
|
-0.2
|
%
|
1.6
|
%
|
7.0
|
%
|
0.9
|
%
|
4.3
|
%
|
1.7
|
%
|
-1.0
|
%
|
1.4
|
%
|
3.4
|
%
|
0.7
|
%
|
8.7
|
%
|
||||||||||
|
11Delta
|
-1.1
|
%
|
-1.7
|
%
|
4.1
|
%
|
1.2
|
%
|
0.9
|
%
|
-1.1
|
%
|
1.3
|
%
|
-1.2
|
%
|
0.8
|
%
|
1.4
|
%
|
2.5
|
%
|
||||||||||
|
(1)
|
The January figures represent the percentage change from the previous October, whereas the remaining figures represent the percentage change from the previous month.
|
A graph of the sequential daily sales change pattern discussed above, starting with a base of '100' in the previous October and ending with the next October, would be as follows:
14
END MARKET PERFORMANCE:
Fluctuations in end market business –
The sequential trends noted above were directly linked to fluctuations in our end markets. To place this in perspective – approximately 50% of our business has historically been with customers engaged in some type of manufacturing. The daily sales to these customers grew, when compared to the same period in the prior year, as follows:
|
|
Q1
|
Q2
|
Q3
|
Q4
|
Annual
|
|||||||||
|
2013
|
7.0
|
%
|
||||||||||||
|
2012
|
20.3
|
%
|
15.8
|
%
|
14.0
|
%
|
9.7
|
%
|
14.9
|
%
|
||||
|
2011
|
15.5
|
%
|
18.5
|
%
|
18.3
|
%
|
21.0
|
%
|
20.0
|
%
|
||||
Our manufacturing business consists of two subsets: the industrial production business (this is business where we supply products that become part of the finished goods produced by our customers) and the maintenance portion (this is business where we supply products that maintain the facility or the equipment of our customers engaged in manufacturing). The industrial business is more fastener centered, while the maintenance portion is represented by all product categories.
The best way to understand the change in our industrial production business is to examine the results in our fastener product line. From a company perspective, sales of fasteners grew, when compared to the same period in the prior year, as follows (note: this information includes
all
end markets):
|
Q1
|
Q2
|
Q3
|
Q4
|
Annual
|
||||||||||
|
2013
|
1.7
|
%
|
||||||||||||
|
2012
|
15.4
|
%
|
8.0
|
%
|
6.0
|
%
|
2.6
|
%
|
7.8
|
%
|
||||
|
2011
|
15.4
|
%
|
18.1
|
%
|
13.6
|
%
|
15.9
|
%
|
15.7
|
%
|
||||
By contrast, the best way to understand the change in the maintenance portion of the manufacturing business is to examine the results in our non-fastener product lines. From a company perspective, sales of non-fasteners grew, when compared to the same period in the prior year, as follows (note: this information includes
all
end markets):
|
Q1
|
Q2
|
Q3
|
Q4
|
Annual
|
||||||||||
|
2013
|
10.8
|
%
|
||||||||||||
|
2012
|
25.1
|
%
|
21.1
|
%
|
18.0
|
%
|
13.6
|
%
|
19.2
|
%
|
||||
|
2011
|
26.5
|
%
|
27.3
|
%
|
26.9
|
%
|
27.4
|
%
|
27.0
|
%
|
||||
The non-fastener business demonstrated greater relative resilience when compared to our fastener business and to the distribution industry in general, due to our strong FAST Solutions
SM
(industrial vending) program; this is discussed in greater detail later in this document. However, this business has not been immune to the impact of a weakening industrial environment.
The patterns related to the industrial production business, as noted above, are influenced by the movements noted in the Purchasing Manufacturers Index ('PMI') published by the Institute for Supply Management (http://www.ism.ws/), which is a composite index of economic activity in the manufacturing sector. The PMI in 2013, 2012, and 2011 was as follows:
|
|
Jan.
|
Feb.
|
Mar.
|
Apr.
|
May
|
June
|
July
|
Aug.
|
Sept.
|
Oct.
|
Nov.
|
Dec.
|
|||||||||||||||||||||||
|
2013
|
53.1
|
|
54.2
|
|
51.3
|
|
|||||||||||||||||||||||||||||
|
2012
|
53.7
|
|
51.9
|
|
53.3
|
|
54.1
|
|
52.5
|
|
50.2
|
|
50.5
|
|
50.7
|
|
51.6
|
|
51.7
|
|
49.9
|
|
50.2
|
|
|||||||||||
|
2011
|
59.2
|
|
59.6
|
|
59.3
|
|
59.4
|
|
53.5
|
|
55.8
|
|
52.3
|
|
53.2
|
|
53.2
|
|
51.5
|
|
52.3
|
|
52.9
|
|
|||||||||||
For background to readers not familiar with the PMI index, it is a monthly indicator of the economic health of the manufacturing sector. Five major indicators that influence the PMI index are new orders, inventory levels, productions, supplier deliveries, and the employment environment. When a PMI of 50 or higher is reported, this indicates expansion in the manufacturing industry compared to the previous month. If the PMI is below 50, this represents a contraction in the manufacturing sector. (Note – the Institute for Supply Management made annual adjustments to reflect seasonal factors for the PMI index effective for the January 2013 report. This table represents the updated PMI index.)
15
Our non-residential construction customers have historically represented 20% to 25% of our business. The daily sales to these customers grew, when compared to the same period in the prior year, as follows:
|
|
Q1
|
Q2
|
Q3
|
Q4
|
Annual
|
|||||||||
|
2013
|
2.9
|
%
|
||||||||||||
|
2012
|
17.1
|
%
|
12.7
|
%
|
8.2
|
%
|
4.2
|
%
|
10.3
|
%
|
||||
|
2011
|
17.7
|
%
|
15.8
|
%
|
15.8
|
%
|
17.4
|
%
|
17.1
|
%
|
||||
We believe the weakness in the economy in the fourth quarter of 2012 and the first quarter of 2013, particularly in the non-residential construction market, was amplified by the economic policy uncertainty in the United States.
A graph of the sequential daily sales trends to these two end markets in 2013, 2012, and 2011, starting with a base of '100' in the previous October and ending with the next October, would be as follows:
Manufacturing
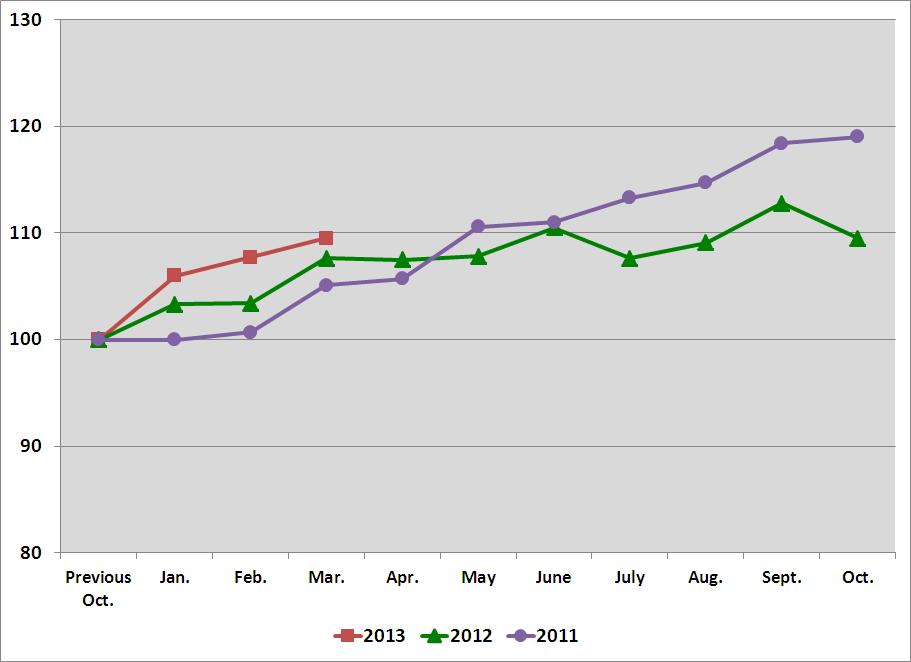
Non-Residential Construction
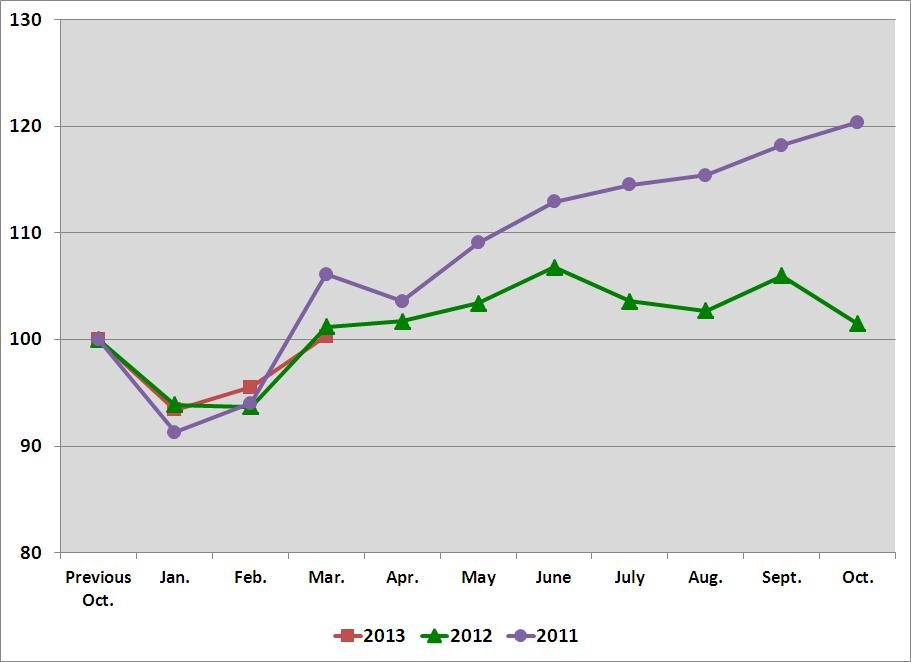
16
GROWTH DRIVERS OF OUR BUSINESS
We grow by continuously adding customers and by increasing the activity with each customer. We believe this growth is enhanced by our close proximity to our customers, which allows us to provide a range of services and product availability that our competitors can't easily match. Historically, we expanded our reach by opening stores at a very fast pace. These openings were initially in the United States, but expanded beyond the United States beginning in the mid 1990's.
In our first ten years of being public (1987 to 1997), we opened stores at a rate approaching 30% per year. In the next ten years, we opened stores at an annual rate of approximately 10% to 15% and, over the last five years, at a rate of approximately 3% to 8% (we currently expect to open approximately 65 to 80 stores in 2013, or approximately 2.5% to 3.0%). As we gained proximity to more customers, we continued to diversify our growth drivers. This was done to provide existing store personnel with more tools to grow their business organically, and the results of this are reflected in our earlier discussion on sales growth at stores opened greater than five years. In the early 1990's, we began to expand our product lines, and we added new product knowledge to our bench. This was our first big effort to diversify our growth drivers. The next step began in the mid to late 1990's when we began to add sales personnel with certain specialties or focus. This began with our National Accounts group in 1995, and, over time, has expanded to include individuals dedicated to: (1) sales related to our internal manufacturing division, (2) government sales, (3) internet sales, (4) specific products (most recently metalworking), and (5) FAST Solutions
SM
(industrial vending). Another step occurred at our sales locations (this includes Fastenal stores as well as strategic account stores and in-plant locations) and at our distribution centers, and began with a targeted merchandising and inventory placement strategy that included our 'Customer Service Project' approximately ten years ago and our 'Master Stocking Hub' initiative approximately five years ago. This strategy allowed us to better target where to stock certain products (local store, regional distribution center, master stocking hub, or supplier) and allowed us to improve our fulfillment, lower our freight costs, and improve our ability to serve a broader range of customers. During 2013, we intend to expand our store based inventory around select industries (with an emphasis on fasteners and safety products).
Our FAST Solutions
SM
(industrial vending) operation is a rapidly expanding component of our business.
We believe industrial vending is the next logical chapter in the Fastenal story; we also believe it has the potential to be transformative to industrial distribution, and that we have a 'first mover' advantage. We are investing aggressively to maximize this advantage. At our investor day in May 2011, we discussed our progress with industrial vending. In addition to our discussion regarding progress, we discussed our goals with the rollout of the industrial vending machines. One of the goals we identified related to our rate of 'machine signings' (the first category below) – our goal was simple, sign 2,500+ machines per quarter (or an annualized run rate of 10,000 machines). In 2012, we hit our annual goal of 10,000 machines during July, and the momentum has continued as we finished the year. We intend to continue our aggressive push with FAST Solutions
SM
(industrial vending) and, to this end, established an internal goal to sign 30,000 machines in 2013, or 2,500 per month rather than per quarter. This is an aggressive goal, but we believe we can hit this run rate during 2013. In addition, during 2012 we developed plans to (1) reinvigorate our fastener growth and (2) improve the performance (i.e. sales growth) at under-performing locations. These plans centered on expanding our sales team for our industrial production business, improving our delivery systems for our other fastener business, and expanding the team that supports under-performing stores and districts.
During 2013 we have several distribution initiatives. The first centers on a multi-year initiative to add significant automation. Currently, our facilities in Indianapolis, IN, Denton, TX, and Winona, MN contain the most extensive automation. In addition, we have plans to begin utilizing a new 'highly automated' distribution facility adjacent
to our existing Indianapolis facility for replenishing our industrial vending machines. It may seem odd to see these initiatives listed under the category of 'growth drivers' versus 'efficiency or profit drivers'; however, we see these changes as
enhancing
our fill rates and as freeing up time at the store, both of which help drive sales growth.
17
The following table includes some statistics regarding our industrial vending business.
|
Q1
|
Q2
|
Q3
|
Q4
|
Annual
|
||||||||||||
|
Number of vending machines in
|
2013
|
5,728
|
|
|
||||||||||||
|
contracts signed during the period
1
|
2012
|
4,568
|
|
4,669
|
|
5,334
|
|
5,591
|
|
20,162
|
|
|||||
|
|
2011
|
1,405
|
|
2,107
|
|
2,246
|
|
2,084
|
|
7,842
|
|
|||||
|
Cumulative machines installed
2
|
2013
|
25,447
|
|
|||||||||||||
|
|
2012
|
9,798
|
|
13,036
|
|
17,013
|
|
21,095
|
|
|||||||
|
|
2011
|
2,659
|
|
3,867
|
|
5,642
|
|
7,453
|
|
|||||||
|
Percent of installed machines that are a FAST 5000
|
2013
|
54.3
|
%
|
|||||||||||||
|
(our most common helix vending machine)
3
|
2012
|
70.1
|
%
|
66.2
|
%
|
60.2
|
%
|
57.2
|
%
|
|||||||
|
2011
|
78.6
|
%
|
76.0
|
%
|
74.7
|
%
|
72.8
|
%
|
||||||||
|
Percent of total net sales to
|
2013
|
27.5
|
%
|
|||||||||||||
|
customers with vending machines
4
|
2012
|
17.8
|
%
|
20.8
|
%
|
23.2
|
%
|
25.8
|
%
|
|||||||
|
|
2011
|
8.9
|
%
|
10.5
|
%
|
13.1
|
%
|
15.7
|
%
|
|||||||
|
Daily sales growth to customers
|
2013
|
23.9
|
%
|
|||||||||||||
|
with vending machines
5
|
2012
|
33.9
|
%
|
34.3
|
%
|
32.9
|
%
|
28.6
|
%
|
|||||||
|
|
2011
|
50.6
|
%
|
43.9
|
%
|
42.5
|
%
|
40.7
|
%
|
|||||||
|
1
|
This represents the gross number of machines signed during the quarter, not the number of contracts.
|
|
2
|
This represents the number of machines installed and dispensing product on the last day of the quarter.
|
|
3
|
This information is intended to highlight the mix change in the machines deployed as our business expands beyond the flagship FAST 5000 machine.
|
|
4
|
The percentage of total sales (vended and traditional) to customers currently using a vending solution.
|
|
5
|
The growth in total sales (vended and traditional) to customers currently using a vending solution compared to the same period in the preceding year.
|
18
PROFIT DRIVERS OF OUR BUSINESS
We grow our profits by continuously working to grow sales and to improve our relative profitability. We also grow our profits by allowing our inherent profitability to shine through – we refer to this as the 'pathway to profit'. The distinction is important.
We achieve improvements in our relative profitability by increasing our gross margin, by structurally lowering our operating expenses, or both. We advance on the 'pathway to profit' by increasing the average store size (measured in terms of monthly sales), and by allowing the changing store mix to improve our profits. This is best explained by comparing the varying profitability of our 'traditional' stores in the table below. The average store size for the group, and the average age, number of stores, and pre-tax earnings data by store size for the
first
quarter of 2013, 2012, and 2011, respectively, were as follows:
|
Sales per Month
|
Average
Age
(Years)
|
Number of
Stores
|
Percentage
of Stores
|
Pre-Tax
Earnings
Percentage
|
|||||||
|
Three months ended March 31, 2013
|
|
|
|
Average store sales = $88,267
|
|||||||
|
$0 to $30,000
|
5.4
|
|
261
|
|
9.8
|
%
|
-11.6
|
%
|
|||
|
$30,001 to $60,000
|
8.2
|
|
771
|
|
29.0
|
%
|
13.9
|
%
|
|||
|
$60,001 to $100,000
|
10.9
|
|
765
|
|
28.8
|
%
|
22.5
|
%
|
|||
|
$100,001 to $150,000
|
12.8
|
|
437
|
|
16.4
|
%
|
25.5
|
%
|
|||
|
Over $150,000
|
16.0
|
|
305
|
|
11.5
|
%
|
29.0
|
%
|
|||
|
Strategic Account/Overseas Store
|
121
|
|
4.5
|
%
|
|
|
|||||
|
Company Total
|
|
2,660
|
|
100.0
|
%
|
21.7
|
%
|
||||
|
Three months ended March 31, 2012
|
|
|
|
Average store sales = $86,449
|
|||||||
|
$0 to $30,000
|
4.4
|
|
289
|
|
11.1
|
%
|
-17.4
|
%
|
|||
|
$30,001 to $60,000
|
7.6
|
|
795
|
|
30.4
|
%
|
11.9
|
%
|
|||
|
$60,001 to $100,000
|
9.9
|
|
719
|
|
27.5
|
%
|
21.5
|
%
|
|||
|
$100,001 to $150,000
|
12.5
|
|
419
|
|
16.0
|
%
|
24.9
|
%
|
|||
|
Over $150,000
|
15.6
|
|
287
|
|
11.0
|
%
|
28.4
|
%
|
|||
|
Strategic Account/Overseas Store
|
|
|
102
|
|
3.9
|
%
|
|
|
|||
|
Company Total
|
|
2,611
|
|
100.0
|
%
|
21.0
|
%
|
||||
|
Three months ended March 31, 2011
|
|
|
|
Average store sales = $74,421
|
|||||||
|
$0 to $30,000
|
4.2
|
|
397
|
|
15.7
|
%
|
-12.2
|
%
|
|||
|
$30,001 to $60,000
|
7.5
|
|
874
|
|
34.7
|
%
|
12.6
|
%
|
|||
|
$60,001 to $100,000
|
10.2
|
|
668
|
|
26.5
|
%
|
22.2
|
%
|
|||
|
$100,001 to $150,000
|
12.4
|
|
310
|
|
12.3
|
%
|
25.5
|
%
|
|||
|
Over $150,000
|
15.7
|
|
193
|
|
7.7
|
%
|
27.5
|
%
|
|||
|
Strategic Account/Overseas Store
|
|
|
80
|
|
3.2
|
%
|
|
|
|||
|
Company Total
|
|
2,522
|
|
100.0
|
%
|
20.1
|
%
|
||||
Note – Amounts may not foot due to rounding difference.
When we originally announced the 'pathway to profit' strategy in 2007, our goal was to increase our pre-tax earnings, as a percentage of sales, from 18% to 23%. This goal was to be accomplished by slowly moving the mix from the first three categories ($0 to $30,000, $30,001 to $60,000, and $60,001 to $100,000, these groups represented 76.5% of our store base in the first three months of 2007, the last quarter before we announced the 'pathway to profit') to the last three categories ($60,001 to $100,000, $100,001 to $150,000, and over $150,000, these groups represented 56.7% of our store base in the
first
quarter of 2013) and by increasing the average store sales to approximately $125,000 per month. The weak economic environment in 2009 caused our average store size to decrease, and consequently lowered our level of profitability; however, subsequent to this period we improved our gross margin and structurally lowered our operating expenses. This improvement allowed us to amplify the 'pathway to profit' and effectively lowered the average store size required to hit our 23% goal. Today we believe we can accomplish our 'pathway to profit' goal with average store sales of approximately $100,000 to $110,000 per month.
Note – Dollar amounts in this section are presented in whole dollars, not thousands.
19
Store Count and Full-Time Equivalent (FTE) Headcount –
The table below highlights certain impacts on our business of the 'pathway to profit' since its introduction in 2007. Under the 'pathway to profit' we increased both our store count and our store FTE headcount during 2007 and 2008. However, the rate of increase in store locations slowed and our FTE headcount for all types of personnel was reduced when the economy weakened late in 2008. In the table that follows, we refer to our 'store' net sales, locations, and personnel. When we discuss 'store' net sales, locations, and personnel, we are referring to (1) 'Fastenal' stores and (2) strategic account stores. 'Fastenal' stores are either a 'traditional' store, the typical format in the United States or Canada, or an 'overseas' store, which is the typical format outside the United States and Canada. This is discussed in greater detail in our 2012 annual report on Form 10-K. Strategic account stores are stores that are focused on selling to a group of large customers in a limited geographic market. The sales, outside of our 'store' group, relate to either (1) our in-plant locations, (2) the portion of our internally manufactured product that is sold directly to a customer and not through a store (including our Holo-Krome business acquired in December 2009), or (3) our direct import business.
The breakdown of our sales, the average monthly sales per store, the number of stores at quarter end, the average headcount at our stores during a quarter, the average FTE headcount during a quarter, and the percentage change were as follows for the first quarter of 2007 (the last completed quarter before we began the 'pathway to profit'), for the third quarter of 2008 (our peak quarter before the economy weakened), and for each of the last five quarters:
|
Q1
2007 |
Q3
2008 |
Q1
2012 |
Q2
2012 |
Q3
2012 |
Q4 2012
|
Q1 2013
|
||||||||||||||
|
Total net sales reported
|
$489,157
|
$625,037
|
$768,875
|
$804,890
|
$802,577
|
$757,235
|
$806,326
|
|||||||||||||
|
Less: Non-store sales (approximate)
|
40,891
|
57,267
|
92,459
|
98,735
|
100,124
|
95,951
|
101,624
|
|||||||||||||
|
Store net sales (approximate)
|
$448,266
|
$567,770
|
$676,416
|
$706,155
|
$702,453
|
$661,284
|
$704,702
|
|||||||||||||
|
% change since Q1 2007
|
|
26.7
|
%
|
50.9
|
%
|
57.5
|
%
|
56.7
|
%
|
47.5
|
%
|
57.2
|
%
|
|||||||
|
% change (twelve months)
|
|
17.5
|
%
|
20.2
|
%
|
14.6
|
%
|
10.1
|
%
|
8.2
|
%
|
4.2
|
%
|
|||||||
|
Percentage of sales through a store
|
92
|
%
|
91
|
%
|
88
|
%
|
88
|
%
|
88
|
%
|
87
|
%
|
87
|
%
|
||||||
|
Average monthly sales per store
|
$72
|
$82
|
$86
|
$89
|
$88
|
$83
|
$88
|
|||||||||||||
|
(using ending store count)
|
|
|
|
|
|
|
|
|
|
|
|
|
|
|
||||||
|
% change since Q1 2007
|
|
|
13.9
|
%
|
19.4
|
%
|
23.6
|
%
|
22.2
|
%
|
15.3
|
%
|
22.2
|
%
|
||||||
|
% change (twelve months)
|
|
|
9.3
|
%
|
16.2
|
%
|
11.3
|
%
|
6.0
|
%
|
5.1
|
%
|
2.3
|
%
|
||||||
20
|
Q1
2007 |
Q3
2008 |
Q1
2012 |
Q2
2012 |
Q3
2012 |
Q4 2012
|
Q1 2013
|
||||||||||||||
|
Store locations - quarter end count
|
2,073
|
2,300
|
2,611
|
2,635
|
2,650
|
2,652
|
2,660
|
|||||||||||||
|
% change since Q1 2007
|
|
11.0
|
%
|
26.0
|
%
|
27.1
|
%
|
27.8
|
%
|
27.9
|
%
|
28.3
|
%
|
|||||||
|
% change (twelve months)
|
|
7.2
|
%
|
3.5
|
%
|
3.0
|
%
|
3.3
|
%
|
2.6
|
%
|
1.9
|
%
|
|||||||
|
Store personnel - absolute headcount
|
6,849
|
9,123
|
10,486
|
10,637
|
10,604
|
10,347
|
10,108
|
|||||||||||||
|
% change since Q1 2007
|
|
33.2
|
%
|
53.1
|
%
|
55.3
|
%
|
54.8
|
%
|
51.1
|
%
|
47.6
|
%
|
|||||||
|
% change (twelve months)
|
|
17.9
|
%
|
12.2
|
%
|
9.3
|
%
|
5.4
|
%
|
0.2
|
%
|
-3.6
|
%
|
|||||||
|
Store personnel - FTE
|
6,383
|
8,280
|
8,900
|
9,126
|
9,244
|
9,035
|
8,875
|
|||||||||||||
|
Non-store selling personnel - FTE
|
616
|
599
|
998
|
1,054
|
1,066
|
1,070
|
1,121
|
|||||||||||||
|
Sub-total of all sales personnel - FTE
|
6,999
|
8,879
|
9,898
|
10,180
|
10,310
|
10,105
|
9,996
|
|||||||||||||
|
Distribution personnel-FTE
|
1,646
|
1,904
|
1,815
|
1,881
|
1,887
|
1,872
|
1,819
|
|||||||||||||
|
Manufacturing personnel - FTE
1
|
316
|
340
|
527
|
545
|
544
|
544
|
565
|
|||||||||||||
|
Administrative personnel-FTE
|
767
|
805
|
796
|
794
|
808
|
811
|
832
|
|||||||||||||
|
Sub-total of non-sales personnel - FTE
|
2,729
|
3,049
|
3,138
|
3,220
|
3,239
|
3,227
|
3,216
|
|||||||||||||
|
Total - average FTE headcount
|
9,728
|
11,928
|
13,036
|
13,400
|
13,549
|
13,332
|
13,212
|
|||||||||||||
|
% change since Q1 2007
|
|
|
|
|
|
|
|
|
|
|
|
|
|
|
||||||
|
Store personnel - FTE
|
|
29.7
|
%
|
39.4
|
%
|
43.0
|
%
|
44.8
|
%
|
41.5
|
%
|
39.0
|
%
|
|||||||
|
Non-store selling personnel - FTE
|
|
-2.8
|
%
|
62.0
|
%
|
71.1
|
%
|
73.1
|
%
|
73.7
|
%
|
82.0
|
%
|
|||||||
|
Sub-total of all sales personnel - FTE
|
26.9
|
%
|
41.4
|
%
|
45.4
|
%
|
47.3
|
%
|
44.4
|
%
|
42.8
|
%
|
||||||||
|
Distribution personnel-FTE
|
|
15.7
|
%
|
10.3
|
%
|
14.3
|
%
|
14.6
|
%
|
13.7
|
%
|
10.5
|
%
|
|||||||
|
Manufacturing personnel-FTE
1
|
|
7.6
|
%
|
66.8
|
%
|
72.5
|
%
|
72.2
|
%
|
72.2
|
%
|
78.8
|
%
|
|||||||
|
Administrative personnel-FTE
|
|
5.0
|
%
|
3.8
|
%
|
3.5
|
%
|
5.3
|
%
|
5.7
|
%
|
8.5
|
%
|
|||||||
|
Sub-total of non-sales personnel - FTE
|
11.7
|
%
|
15.0
|
%
|
18.0
|
%
|
18.7
|
%
|
18.2
|
%
|
17.8
|
%
|
||||||||
|
Total - average FTE headcount
|
|
|
22.6
|
%
|
34.0
|
%
|
37.7
|
%
|
39.3
|
%
|
37.0
|
%
|
35.8
|
%
|
||||||
|
% change (twelve months)
|
|
|
|
|
|
|
|
|
|
|
|
|
|
|||||||
|
Store personnel - FTE
|
|
15.2
|
%
|
13.7
|
%
|
10.6
|
%
|
7.1
|
%
|
4.0
|
%
|
-0.3
|
%
|
|||||||
|
Non-store selling personnel - FTE
|
|
-2.4
|
%
|
28.1
|
%
|
24.0
|
%
|
15.9
|
%
|
12.3
|
%
|
12.3
|
%
|
|||||||
|
Sub-total of all sales personnel - FTE
|
13.8
|
%
|
15.0
|
%
|
11.8
|
%
|
8.0
|
%
|
4.9
|
%
|
1.0
|
%
|
||||||||
|
Distribution personnel-FTE
|
|
6.0
|
%
|
12.9
|
%
|
7.1
|
%
|
3.1
|
%
|
2.9
|
%
|
0.2
|
%
|
|||||||
|
Manufacturing personnel - FTE
1
|
|
1.8
|
%
|
14.3
|
%
|
10.8
|
%
|
6.0
|
%
|
5.4
|
%
|
7.2
|
%
|
|||||||
|
Administrative personnel - FTE
|
|
7.9
|
%
|
4.7
|
%
|
1.4
|
%
|
-0.4
|
%
|
1.9
|
%
|
4.5
|
%
|
|||||||
|
Sub-total of non-sales personnel - FTE
|
6.0
|
%
|
10.9
|
%
|
6.2
|
%
|
2.7
|
%
|
3.0
|
%
|
2.5
|
%
|
||||||||
|
Total - average FTE headcount
|
|
11.7
|
%
|
14.0
|
%
|
10.4
|
%
|
6.7
|
%
|
4.4
|
%
|
1.4
|
%
|
|||||||
|
1
|
The manufacturing headcount was impacted by the addition of 92 employees with the acquisition of Holo-Krome in December 2009.
|
21
|
STATEMENT OF EARNINGS INFORMATION (percentage of net sales)
for the periods ended March 31:
|
|||||
|
Three-month period
|
|||||
|
|
2013
|
2012
|
|||
|
Net sales
|
100.0
|
%
|
100.0
|
%
|
|
|
Gross profit
|
52.3
|
%
|
51.3
|
%
|
|
|
Operating and administrative expenses
|
30.7
|
%
|
30.3
|
%
|
|
|
(Gain) loss on sale of property and equipment
|
0.0
|
%
|
0.0
|
%
|
|
|
Operating income
|
21.7
|
%
|
20.9
|
%
|
|
|
Interest income/expense (net)
|
0.0
|
%
|
0.0
|
%
|
|
|
Earnings before income taxes
|
21.7
|
%
|
21.0
|
%
|
|
|
Note – Amounts may not foot due to rounding difference.
|
|||||
Gross profit –
percentage for the first quarter of 2013 increased from the same period in 2012. Sequentially, the gross profit percentage increased from the fourth quarter of 2012.
The gross profit percentage in the first, second, third, and fourth quarters was as follows:
|
|
Q1
|
Q2
|
Q3
|
Q4
|
|||||||
|
2013
|
52.3
|
%
|
|||||||||
|
2012
|
51.3
|
%
|
51.6
|
%
|
51.6
|
%
|
51.6
|
%
|
|||
|
2011
|
52.0
|
%
|
52.2
|
%
|
51.9
|
%
|
51.2
|
%
|
|||
The fluctuations in our gross profit percentages are typically driven by changes in: (1) transactional gross profit, (2) organizational gross profit, and (3) vendor incentive gross profit. The transactional gross profit represents the gross profit realized from the day-to-day fluctuations in customer pricing relative to product and freight costs. The organizational gross profit represents the component of gross profit we attribute to buying scale and efficiency gains. The third component relates to vendor volume allowances. In the short-term, periods of inflation or deflation can influence the first two categories, while sudden changes in business volume can influence the third.
We believe a normal gross profit percentage range for our business is 51% to 53%. This is based on our current mix of products, geographies, end markets, and end market uses (such as industrial production business versus maintenance business). The following narrative may be more detail than you want; however, we believe it is an important recap to understanding the dynamics surrounding our gross margin patterns. Our business operated below our expected gross profit range at the end of 2009, and expanded into the low end of this range during 2010. In the second quarter of 2010, we moved into the middle of the range as the three components of gross profit improved, the contribution being split fairly evenly between the three components. We remained in the middle of the range until the fourth quarter of 2011. In the fourth quarter of 2011, our gross margin felt pressure and dropped to the lower end of the range. This drop was primarily due to changes in our transactional margin (primarily due to changes in product and customer mix), lower vendor incentive gross profit, and lower freight utilization. The latter two items created half of the gross margin drop and are more of a seasonal issue. In the first quarter of 2012, our gross margin improved nominally over the previous quarter. This was primarily caused by the seasonal improvement of vendor volume allowances as rising fuel prices offset our improvements in freight utilization. In the second, third, and fourth quarters of 2012, our gross margin improved when compared to the first quarter. Most of this improvement related to improvements in our transactional gross margin. The improvement was partially offset by the weakening of our selling prices in certain foreign markets due to changes in the exchange rate. One item of note, in the fourth quarter of 2012 we experienced a drop off in the freight component of our gross margin due to lower freight utilization, a typical pattern due to the seasonal drop off in business; this gross margin decline was offset by an improvement in the remaining portion of our transactional gross margin that centers on product transactional cost and customer pricing. The first quarter of 2013 experienced a strong improvement in gross margin. A piece of this related to the seasonal impact of improving freight utilization, but this improvement was constrained due to the weak sales growth. The real driver of improvement related to improved pricing habits largely resulting from store personnel exercising great judgment that is guided by better information in our newly implemented price guidance system.
Operating and administrative expenses
- increased as a percentage of sales in the
first
quarter of 2013 versus the first quarter of 2012. This was primarily a function of slowing sales growth versus our original expectations.
22
Historically, our two largest components to operating and administrative expenses have consisted of employee related expenses (approximately 65% to 70%) and occupancy related expenses (approximately 15% to 20%). The remaining expenses cover a variety of items with selling transportation typically being the largest.
The three largest components of operating and administrative expenses grew as follows for the periods ended
March 31
(compared to the same quarter in the preceding year):
|
|
Three-month period
|
||||
|
|
2013
|
2012
|
|||
|
Employee related expenses
|
5.5
|
%
|
14.9
|
%
|
|
|
Occupancy related expenses
|
13.6
|
%
|
0.3
|
%
|
|
|
Selling transportation costs
|
0.9
|
%
|
19.3
|
%
|
|
Employee related expenses include: (1) payroll (which includes cash compensation, stock option expense, and profit sharing), (2) health care, (3) personnel development, and (4) social taxes. Performance bonuses were down in the first quarter of 2013; however, this decrease was offset by increases related to the following factors: (1) average employee headcount, measured on a full-time equivalent basis, grew 1.4% (2) sales commissions grew due to the gross profit improvement, (3) bonus amounts related to our growth drivers grew (this includes items such as industrial vending bonuses which grew due to the strength in the vending rollout), (4) our profit sharing contribution grew, and (5) our health care costs grew. The latter two items drove 21% of the increase. The increase in the first quarter of 2012 was driven by the following factors: (1) average employee headcount, measured on a full-time equivalent basis, grew 14.0%, (2) sales commissions grew, (3) bonus amounts related to our growth drivers grew (this includes items such as industrial vending bonuses and manager minimum pay adjustments), and (4) our profit sharing contribution grew.
Occupancy related expenses include: (1) building rent and depreciation, (2) building utility costs, (3) equipment related to our stores and distribution locations, and (4) FAST Solutions
SM
(industrial vending) equipment (we consider the vending equipment to be a logical extension of our store operation and classify the expense as occupancy). The increase in the first quarter of 2013 was driven by (1) a dramatic increase in the amount of FAST Solutions
SM
(industrial vending) equipment as discussed earlier in this document, (2) an increase in the number of locations, and (3) an increased investment in our distribution infrastructure over the last several years. In the first quarter of 2013, the industrial vending component represented 62% of the increase and utilities represented 18% of the increase. The utility increase was due to a more severe winter and increases in natural gas prices during the heating season. Almost all of our occupancy increase in the first quarter of 2012 related to the increase in the amount of FAST Solutions
SM
(industrial vending) equipment, as our energy savings offset most of the increase relating to items (1) and (3). The energy savings were driven by our efforts to lower energy consumption, a mild winter, and a drop in natural gas prices during the heating season.
Our selling transportation costs consist primarily of our store fleet as most of the distribution fleet costs are included in the cost of sales. Selling transportation costs included in operating and administrative expenses increased in the first quarter of 2013; however, they increased at a rate much less than sales growth. The increase in the first quarter of 2012 was primarily related to the increase in per gallon fuel costs discussed below and the expansion of our fleet related to additions to our non-store sales personnel, particularly FAST Solutions
SM
(industrial vending) vehicles.
23
The last several years have seen some variation in the cost of diesel fuel and gasoline –
During the first quarter of 2013, our total vehicle fuel costs were approximately $10.6 million. During the first, second, third, and fourth quarters of 2012, our total vehicle fuel costs were approximately $10.6, $10.8, $10.8, and $10.3 million, respectively. The changes resulted from variations in fuel costs, variations in the service levels provided to our stores from our distribution centers, changes in the number of vehicles at our store locations, and changes in the number of other sales centered vehicles as a result of store openings and the expansion of our non-store sales force. These fuel costs include the fuel utilized in our distribution vehicles (semi-tractors, straight trucks, and sprinter trucks) which is recorded in cost of sales and the fuel utilized in our store delivery and other sales centered vehicles which is included in operating and administrative expenses (the split in the last several years has been approximately 50:50 between distribution and store and other sales centered use).
The average per gallon fuel costs (in actual dollars) and the percentage change (on a year-over-year basis) for the last three years was as follows:
|
Per gallon average price
|
Q1
|
Q2
|
Q3
|
Q4
|
Annual
Average
1
|
|||||||||||
|
2013 price
|
|
|
|
|
|
|||||||||||
|
Diesel fuel
|
$
|
4.02
|
|
|
|
|
|
|||||||||
|
Gasoline
|
$
|
3.51
|
|
|
|
|
|
|||||||||
|
2012 price
|
|
|
|
|
|
|
|
|
|
|
||||||
|
Diesel fuel
|
$
|
3.92
|
|
3.98
|
|
3.88
|
|
4.05
|
|
3.96
|
|
|||||
|
Gasoline
|
$
|
3.53
|
|
3.73
|
|
3.61
|
|
3.53
|
|
3.60
|
|
|||||
|
2011 price
|
|
|
|
|
|
|
|
|
|
|
||||||
|
Diesel fuel
|
$
|
3.60
|
|
4.04
|
|
3.90
|
|
3.87
|
|
3.85
|
|
|||||
|
Gasoline
|
$
|
3.22
|
|
3.78
|
|
3.62
|
|
3.37
|
|
3.50
|
|
|||||
|
Per gallon price change
|
Q1
|
Q2
|
Q3
|
Q4
|
Annual
1
|
|||||||||||
|
2013 change
|
|
|
|
|
|
|||||||||||
|
Diesel fuel
|
2.6
|
%
|
|
|
|
|
|
|
|
|
||||||
|
Gasoline
|
-0.6
|
%
|
|
|
|
|
|
|
|
|
||||||
|
2012 change
|
|
|
|
|
|
|
|
|
|
|
||||||
|
Diesel fuel
|
8.9
|
%
|
-1.5
|
%
|
-0.5
|
%
|
4.7
|
%
|
2.9
|
%
|
||||||
|
Gasoline
|
9.6
|
%
|
-1.3
|
%
|
-0.3
|
%
|
4.7
|
%
|
2.9
|
%
|
||||||
|
1
|
Average of the four quarterly figures contained in the table.
|
Income taxes
–
Incomes taxes, as a percentage of earnings before income taxes, were approximately 37.8% for the first quarter of 2013 and 2012. As our international business and profits grow over time, the lower income tax rates in those jurisdictions, relative to the United States, have begun to lower our effective tax rate.
24
OPERATIONAL WORKING CAPITAL:
The year-over-year comparison and the related dollar and percentage changes related to accounts receivable and inventories were as follows:
|
|
Balance at March 31:
|
Twelve Month Dollar Change
|
Twelve Month Percentage Change
|
|||||||||||||||||||
|
|
2013
|
2012
|
2011
|
2013
|
2012
|
2013
|
2012
|
|||||||||||||||
|
Accounts receivable, net
|
$
|
418,733
|
|
386,882
|
|
325,685
|
|
31,851
|
|
61,197
|
|
8.2
|
%
|
18.8
|
%
|
|||||||
|
Inventories
|
$
|
700,484
|
|
647,886
|
|
576,451
|
|
52,598
|
|
71,435
|
|
8.1
|
%
|
12.4
|
%
|
|||||||
|
Operational working capital
1
|
$
|
1,119,217
|
|
1,034,768
|
|
902,136
|
|
84,449
|
|
132,632
|
|
8.2
|
%
|
14.7
|
%
|
|||||||
|
Sales in last two months
|
$
|
531,460
|
|
522,905
|
|
437,773
|
|
8,555
|
|
85,132
|
|
1.6
|
%
|
19.4
|
%
|
|||||||
1
For purposes of this discussion, we are defining operational working capital as accounts receivable, net and inventories.
The growth in accounts receivable noted above was driven by our sales growth in the final two months of the period. The strong growth in recent years of our international business and of our large customer accounts has created meaningful difficulty with managing the growth of accounts receivable relative to the growth in sales. The timing of month end and the Easter holiday in late March also impacted normal payment patterns.
Our growth in inventory balances over time does not have as direct a relationship to our monthly sales patterns as does our growth in accounts receivable. This is impacted by other aspects of our business. For example, the dramatic economic slowdown in late 2008 and early 2009 caused our inventory to spike. This occurred because the lead time for inventory procurement is typically longer than the visibility we have into future monthly sales patterns. Over the last decade, we increased our relative inventory levels due to the following: (1) new store openings, (2) expanded stocking breadth at individual stores, (3) expanded stocking breadth at our distribution centers (for example, our master stocking hub in Indianapolis expanded its product breadth over six fold from 2005 to 2011), (4) expanded direct sourcing, (5) expanded exclusive brands (private label), and (6) expanded industrial vending solutions. Items (4), (5), and (6) created most of our inventory growth in the first quarter of both 2013 and 2012.
BALANCE SHEET AND CASH FLOW:
Our balance sheet continues to be very strong and our operations have good cash generating characteristics. During the
first
quarter of 2013, we generated $160,244 (or 146.9% of net earnings) of operating cash flow. Our first quarter typically has stronger cash flow characteristics due to the timing of tax payments; this benefit reverses itself in the second, third, and fourth quarters as income tax payments go out in April, June, September, and December. The remaining amounts of cash flow from operating activities are largely linked to the pure dynamics of a distribution business and its strong correlation to working capital as discussed above.
25
STOCK REPURCHASE:
We did not purchase any stock in the first quarter of 2013. We currently have authority to purchase up to 1,800,000 shares of our common stock.
CRITICAL ACCOUNTING POLICIES:
A discussion of the critical accounting policies related to accounting estimates is contained in our 2012 annual report on Form 10-K.
LIQUIDITY AND CAPITAL RESOURCES:
Cash flow activity in dollars and as a percentage of net earnings was as follows:
|
|
Three-month period
|
|||||
|
|
2013
|
2012
|
||||
|
Net cash provided by operating activities
|
$
|
160,244
|
|
132,188
|
|
|
|
Net cash used in investing activities
|
$
|
54,312
|
|
27,313
|
|
|
|
Net cash used in financing activities
|
$
|
25,887
|
|
24,215
|
|
|
|
Net cash provided by operating activities
|
146.9
|
%
|
131.9
|
%
|
||
|
Net cash used in investing activities
|
49.8
|
%
|
27.3
|
%
|
||
|
Net cash used in financing activities
|
23.7
|
%
|
24.2
|
%
|
||
Net cash provided by operating activities
increased from the prior year. This increase was driven by the expansion of both our absolute and relative profitability from
2012
to
2013
. The increase was also driven by a slower growth in the cash required to fund our working capital growth. These include: accounts receivable changes, inventory, and related accounts payable changes.
Net cash used in investing activities
changed primarily due to changes in capital expenditures. Property and equipment expenditures in the first
three
months of
2013
and
2012
consisted of: (1) the purchase of software and hardware for Fastenal’s information processing systems, (2) the addition of certain pickup trucks, (3) the purchase of signage, shelving, and other fixed assets related to store openings, (4) the addition of manufacturing and warehouse equipment, (5) the expansion or improvement of certain owned or leased store properties, (6) the expansion of Fastenal’s distribution/trucking fleet, (7) the expansion of our Winona, Minnesota distribution center (primarily a 2012 item), (8) purchases related to FAST Solutions
SM
(industrial vending), and (9) the expansion of distribution capabilities related to automation (including with respect to vending, which is primarily a 2013 item). Of these factors, the items related to industrial vending or distribution automation created the greatest impact to our capital expenditures in
2013
and
2012
. Disposals of property and equipment in both periods consisted of the planned disposition of certain pickup trucks, semi-tractors, and trailers in the normal course of business and the disposition of real estate relating to several store locations.
Cash requirements for property and equipment expenditures were satisfied from net earnings, cash on hand, and the proceeds of disposals. We anticipate funding our current expansion plans with cash generated from operations, from available cash and cash equivalents, and from our borrowing capacity.
Net cash used in financing activities
consisted of the payment of dividends, with some offset related to the exercise of stock options.
A discussion of the nature and amount of future cash commitments is contained in our 2012 annual report on Form 10-K.
Certain Risks and Uncertainties –
This report contains statements that are not historical in nature and that are intended to be, and are hereby identified as, “forward-looking statements” under the Private Securities Litigation Reform Act of 1995, including statements regarding (1) the goals of our long-term growth strategy, 'pathway to profit', including the growth in average store sales and profitability expected to result from that strategy (including our belief that we can achieve targeted profitability due to an improvement in our gross margins and a lowering of our operating expenses even if our average store sales do not grow as originally expected), (2) the expected rate of new store openings, (3) our belief in the transformative nature of FAST Solutions
SM
(industrial vending) and our advantage as a first mover in this area, and our expectations regarding expansion of that business, including our goals regarding our rate of 'machine signings', (4) our expected gross profit range, (5) our intention to expand store based inventory around certain industries, (6) our plans to reinvigorate our fastener growth and improve sales at under-performing locations, (7) our expectation that total unrecognized tax benefits will not change significantly during the next twelve months, (8) the expected unrecognized compensation expense related to stock options, and (9) our ability to mitigate the effect of rising fuel prices by passing freight costs on to our customers. The following factors are
26
among those that could cause the Company’s actual results to differ materially from those predicted in such forward-looking statements: (1) a downturn or continued weakness in the economy or in the manufacturing or commercial construction industries, changes in the expected rate of new store openings, difficulties in successfully attracting and retaining additional qualified sales personnel, an inability to realize or sustain improvements in our gross margins and savings from lowering our operating expenses, and difficulties in changing our sales process could adversely impact our ability to achieve the goals of our 'pathway to profit' initiative, (2) a downturn or continued weakness in the economy or in the manufacturing or commercial construction industries, a change from that projected in the number of North American markets able to support stores, or an inability to recruit and retain qualified employees could cause the rate of new store openings to change from that expected, (3) a weaker level of industry acceptance or adoption of the vending technology from what we are currently experiencing could cause us to fail to meet our goals from industrial vending business including those regarding our rate of 'machine signings', or cause industrial vending to be less transformative than expected, (4) our competitors could choose, over time, to open additional locations and to develop their own vending platform which could allow our competitors to replicate our local storefront combined with industrial vending business model mitigating our first mover advantage, (5) a downturn or continued weakness in the economy or in the manufacturing or commercial construction industries, a change in our current mix of products, customers, or geographic locations, a change in our purchasing patterns, a significant change in commodity prices, or increased competitive pressure on our selling prices could impact our ability to achieve gross margins within the range we expect, (6) changes in customer mix could cause us to alter our plans to expand store based inventory around certain industries, (7) difficulties in hiring, relocating, or training qualified personnel could adversely impact our ability to reinvigorate our fastener growth and improve sales at under-performing locations, (8) changes in tax law or changes in the interpretation of tax law at the federal, state or local level could impact our expectation about total unrecognized tax benefits during the next twelve months, (9) an unexpected change in forfeiture rates due to demotion or turnover could impact the unrecognized compensation expense related to stock options, and (10) our ability to pass freight costs on to our customers could be adversely impacted by, in the short term, changes in fuel prices and by competitive selling pressures. A discussion of other risks and uncertainties which could cause our operating results to vary from anticipated results or which could materially adversely effect our business, financial condition, or operating results is included in our 2012 annual report on Form 10-K under the sections captioned
Certain Risks and Uncertainties
and
Item 1A – Risk Factors.
We assume no obligation to update any forward-looking statements or any discussions of risks and uncertainties.
27
We are exposed to certain market risks from changes in interest rates, foreign currency exchange rates, commodity steel pricing, and commodity fuel prices. Changes in these factors cause fluctuations in our earnings and cash flows. We evaluate and manage exposure to these market risks as follows:
Interest Rates –
We have a credit facility totaling $125 million which expires December 13, 2015. This facility includes a $40 million letter of credit subfacility. Loans under the facility bear interest at a rate per annum equal to LIBOR plus 0.875%, we pay a commitment fee of 0.10% to 0.125% per annum (depending on usage), and we pay a fee of 0.875% per annum and, subject to certain exceptions, an issuance fee of 0.075% of the face amount for outstanding letters of credit. During the quarter ended March 31, 2013, we received loan advances under the credit facility and repaid all advances during the quarter. On March 31, 2013, there were no loan advances outstanding and there was one undrawn letter of credit outstanding under the letter of credit subfacility for $29,250.
Foreign Currency Exchange Rates –
Foreign currency fluctuations can affect our net investments and earnings denominated in foreign currencies. Our primary exchange rate exposure is with the Canadian dollar against the United States dollar. Our estimated net earnings exposure for foreign currency exchange rates was not material at
March 31, 2013
.
Commodity Steel Pricing –
We buy and sell various types of steel products; these products consist primarily of different types of threaded fasteners. During the last decade, there has been nominal movement in overall steel pricing, with some deflation occurring in the wake of the economic crisis of the Far East markets that occurred in the late 1990’s. This trend reversed to inflation in the period from late 2003 to the early part of 2005 and again from mid 2007 to the fall of 2008. In the first half of 2009, we noted meaningful deflation. Since 2009, we have noted minimal price changes except for stainless steel which tends to fluctuate over time. Stainless steel products represent approximately 5% of our sales. We are exposed to the impacts of commodity steel pricing and our related ability to pass through the impacts to our end customers.
Commodity Fuel Prices –
We have market risk for changes in gasoline and diesel fuel costs, related to our trucking fleet as well as natural gas costs related to our numerous locations and to our heat treating operations. Historically the risk related to our trucking fleet has been mitigated over time by our ability to pass freight costs to our customers and the efficiency of our trucking distribution network. We also have market risk for energy costs outside of transportation. This is primarily related to energy utilized in the production of products we sell (see also commodity steel pricing discussion above) and the energy needed to heat or cool our extensive store network.
Evaluation of Disclosure Controls and Procedures –
As of the end of the period covered by this report, we conducted an evaluation, under the supervision and with the participation of the principal executive officer and principal financial officer of Fastenal, of our disclosure controls and procedures (as defined in Rules 13a-15(e) and 15d-15(e) under the Securities Exchange Act of 1934 (the 'Exchange Act')). Based on this evaluation, the principal executive officer and principal financial officer concluded that our disclosure controls and procedures are effective to ensure that information required to be disclosed by us in reports that we file or submit under the Exchange Act is recorded, processed, summarized and reported within the time periods specified in SEC rules and forms and is accumulated and communicated to our management, including the principal executive officer and principal financial officer, to allow for timely decisions regarding disclosure. There was no change in our internal control over financial reporting during our most recently completed fiscal quarter that has materially affected, or is reasonably likely to materially affect, our internal control over financial reporting.
28
A description of our legal proceedings, if any, is contained in Note 6 to the 'Notes to Consolidated Financial Statements'. The description of legal proceedings, if any, in Note 6 is incorporated herein by reference.
We are affected by risks specific to us as well as factors that affect all businesses operating in a global market. The significant factors known to us that could materially adversely affect our business, financial condition, or operating results are described in Item 2 of Part I above and in our most recently filed annual report on Form 10-K under
Certain Risks and Uncertainties
and
Item 1A – Risk Factors
. There has been no material change in those risk factors.
|
3.1
|
Restated Articles of Incorporation of Fastenal Company, as amended effective as of April 17, 2012 (incorporated by reference to Exhibit 3.1 to Fastenal Company’s Form 10-Q for the quarter ended March 31, 2012)
|
|
3.2
|
Restated By-Laws of Fastenal Company (incorporated by reference to Exhibit 3.2 to Fastenal Company’s Form 8-K dated as of October 15, 2010)
|
|
31
|
Certifications under Section 302 of the Sarbanes-Oxley Act of 2002
|
|
32
|
Certification under Section 906 of the Sarbanes-Oxley Act of 2002
|
|
101
|
The following financial statements from Fastenal Company’s Quarterly Report on Form 10-Q for the quarter ended March 31. 2013, filed on April 15, 2013, formatted in Extensible Business Reporting Language (XBRL): (i) Consolidated Statements of Earnings, (ii) Consolidated Statements of Comprehensive Income, (iii) Consolidated Balance Sheets, (iv) Consolidated Statements of Cash Flows, and (v) the Notes to Consolidated Financial Statements.
|
29
SIGNATURES
Pursuant to the requirements of the Securities Exchange Act of 1934, the registrant has duly caused this report to be signed on its behalf by the undersigned thereunto duly authorized.
|
|
|
FASTENAL COMPANY
|
|
|
/s/ Willard D. Oberton
|
|
|
|
(Willard D. Oberton, Chief Executive Officer)
|
|
|
|
(Duly Authorized Officer)
|
|
|
Date April 15, 2013
|
|
/s/ Daniel L. Florness
|
|
|
(Daniel L. Florness, Chief Financial Officer)
|
|
|
|
(Principal Financial Officer)
|
|
30
INDEX TO EXHIBITS
|
3.1
|
Restated Articles of Incorporation of Fastenal Company, as amended effective as of April 17, 2012
|
(Incorporated by reference)
|
|
|
3.2
|
Restated By-Laws of Fastenal Company
|
(Incorporated by reference)
|
|
|
31
|
Certifications under Section 302 of the Sarbanes-Oxley Act of 2002
|
Electronically Filed
|
|
|
32
|
Certification under Section 906 of the Sarbanes-Oxley Act of 2002
|
Electronically Filed
|
|
|
101.INS
|
XBRL Instance Document
|
Electronically Filed
|
|
|
101.SCH
|
XBRL Taxonomy Extension Schema Document
|
Electronically Filed
|
|
|
101.CAL
|
XBRL Taxonomy Extension Calculation Linkbase Document
|
Electronically Filed
|
|
|
101.DEF
|
XBRL Taxonomy Extension Definition Linkbase Document
|
Electronically Filed
|
|
|
101.LAB
|
XBRL Taxonomy Extension Label Linkbase Document
|
Electronically Filed
|
|
|
101.PRE
|
XBRL Taxonomy Extension Presentation Linkbase Document
|
Electronically Filed
|
|
31
TABLE OF CONTENTS
Part I Financial InformationItem 1 Financial StatementsItem 2 Management's Discussion and Analysis Of Financial Condition and Results Of OperationsItem 1A Risk FactorsItem 3 Quantitative and Qualitative Disclosures About Market RiskItem 4 Controls and ProceduresPart II Other InformationItem 1 Legal ProceedingsItem 6 Exhibits