FRANKLIN COVEY CO
10-Ks and 10-Qs
|
|
|
|
|
|
|
|
|
|
|
|
|
|
|
|
|
|
|
|
|
|
|
|
|
|
|
|
|
|
|
|
|
|
|
|
|
|
|
|
|
|
|
|
|
|
|
|
|
|
|
|
|
UNITED STATES
SECURITIES AND EXCHANGE COMMISSION
Washington, D.C. 20549
Form 10-K
|
þ
|
ANNUAL REPORT PURSUANT TO SECTION 13 OR 15(d) OF THE SECURITIES EXCHANGE ACT OF 1934 FOR THE FISCAL YEAR ENDED AUGUST 31, 2012
|
|
OR
|
|
|
¨
|
TRANSITION REPORT PURSUANT TO SECTION 13 OR 15(d) OF THE SECURITIES EXCHANGE ACT OF 1934 FOR THE TRANSITION PERIOD FROM ___ TO ___
|

Franklin Covey Co.
(Exact name of registrant as specified in its charter)
|
Utah
|
1-11107
|
87-0401551
|
||
|
(State or other jurisdiction of incorporation or organization)
|
(Commission File No.)
|
(IRS Employer Identification No.)
|
2200 West Parkway Boulevard
Salt Lake City, Utah 84119-2331
(Address of principal executive offices, including zip code)
Registrant's telephone number, including area code: (801) 817-1776
Securities registered pursuant to Section 12(b) of the Act:
|
Title of Each Class
|
Name of Each Exchange on Which Registered
|
|
|
Common Stock, $.05 Par Value
|
New York Stock Exchange
|
Securities registered pursuant to Section 12(g) of the Act:
None
Indicate by check mark if the registrant is a well-known seasoned issuer, as defined in Rule 405 of the Securities Act. Yes
o
No
þ
Indicate by check mark if the registrant is not required to file reports pursuant to Section 13 or Section 15(d) of the Act. Yes
o
No
þ
Indicate by check mark whether the Registrant (1) has filed all reports required to be filed by Section 13 or 15(d) of the Securities Exchange Act of 1934 during the preceding 12 months (or for such shorter period that the Registrant was required to file such reports), and (2) has been subject to such filing requirements for the past 90 days. Yes
þ
No
o
Indicate by check mark whether the registrant has submitted electronically and posted on its corporate Website, if any, every Interactive Data File required to be submitted and posted pursuant to Rule 405 of Regulation S-T (§232.405 of this chapter) during the preceding 12 months (or for such shorter period that the registrant was required to submit and post such files). Yes
þ
No
o
Indicate by check mark if disclosure of delinquent filers pursuant to Item 405 of Regulation S-K (§229.405 of this chapter) is not contained herein, and will not be contained, to the best of Registrant's knowledge, in definitive proxy or information statements incorporated by reference in Part III of this Form 10-K or any amendment to this Form 10-K.
o
Indicate by check mark whether the registrant is a large accelerated filer, an accelerated filer, a non-accelerated filer, or a smaller reporting company. See definitions of “large accelerated filer,” “accelerated filer” and “smaller reporting company” in Rule 12b-2 of the Exchange Act. (Check one):
|
Large accelerated filer
|
£
|
Accelerated filer
|
þ
|
|
Non-accelerated filer
|
£
|
(Do not check if a smaller reporting company)
|
Smaller reporting company
|
£
|
Indicate by check mark whether the registrant is a shell company (as defined in Rule 12b-2 of the Exchange Act). Yes
o
No
þ
As of February 24, 2012, the aggregate market value of the Registrant's Common Stock held by non-affiliates of the Registrant was approximately $127.5 million, which was based upon the closing price of $9.16 per share as reported by the New York Stock Exchange.
As of October 31, 2012, the Registrant had 18,071,010 shares of Common Stock outstanding.
DOCUMENTS INCORPORATED BY REFERENCE
Parts of the Registrant's Definitive Proxy Statement for the Annual Meeting of Shareholders, which is scheduled to be held on January 25, 2013, are incorporated by reference in Part III of this Form 10-K.
|
FranklinCovey Co.
|
|||
|
|
|||
|
Business
|
2 | ||
|
Risk Factors
|
14 | ||
|
Unresolved Staff Comments
|
24 | ||
|
Properties
|
25 | ||
|
Legal Proceedings
|
25 | ||
|
Mine Safety Disclosures
|
26 | ||
| 26 | |||
|
Market for the Registrant’s Common Equity, Related Shareholder Matters, and Issuer Purchases of Equity Securities
|
26 | ||
|
Selected Financial Data
|
28 | ||
|
Management’s Discussion and Analysis of Financial Condition and Results of Operations
|
29 | ||
|
Quantitative and Qualitative Disclosures About Market Risk
|
46 | ||
|
Financial Statements and Supplementary Data
|
48 | ||
|
Changes in and Disagreements With Accountants on Accounting and Financial Disclosure
|
91 | ||
|
Controls and Procedures
|
91 | ||
|
Other Information
|
92 | ||
| 93 | |||
|
Directors, Executive Officers and Corporate Governance
|
93 | ||
|
Executive Compensation
|
93 | ||
|
Security Ownership of Certain Beneficial Owners and Management and Related Stockholder Matters
|
93 | ||
|
Certain Relationships and Related Transactions, and Director Independence
|
94 | ||
|
Principal Accountant Fees and Services
|
94 | ||
| 95 | |||
|
Exhibits and Financial Statement Schedules
|
95 | ||
Disclosure Regarding Forward-Looking Statements
This Annual Report on Form 10-K contains forward-looking statements within the meaning of Section 27A of the Securities Act of 1933 and Section 21E of the Securities Exchange Act of 1934, as amended, relating to our operations, results of operations, and other matters that are based on our current expectations, estimates, assumptions, and projections. Words such as “may,” “will,” “should,” “likely,” “anticipates,” “expects,” “intends,” “plans,” “projects,” “believes,” “estimates,” and similar expressions are used to identify these forward-looking statements. These statements are not guarantees of future performance and involve risks, uncertainties, and assumptions that are difficult to predict. Forward-looking statements are based upon assumptions as to future events that might not prove to be accurate. Actual outcomes and results could differ materially from what is expressed or forecast in these forward-looking statements. Risks, uncertainties, and other factors that might cause such differences, some of which could be material, include, but are not limited to, the factors discussed under the section of this report entitled “Risk Factors.”
General
Franklin Covey Co. (we, us, our, the Company, or FranklinCovey) is a leading global provider of training and consulting solutions with over 630 employees worldwide delivering principle-based curriculums and effectiveness tools to our customers. Our consolidated net sales for the fiscal year ended August 31, 2012 totaled $170.5 million and our shares of common stock are traded on the New York Stock Exchange (NYSE) under the ticker symbol “FC.”
We operate globally with one common brand and business model designed to enable us to provide clients around the world with the same high level of service. To achieve this level of service we operate four regional sales offices in the United States; an office that specializes in sales to governmental entities; wholly owned subsidiaries in Australia, Japan, and the United Kingdom; and contract with licensee partners who deliver our curriculums and provide services in over 140 other countries and territories around the world.
Our business-to-business service utilizes our expertise in training, consulting, and technology that is designed to help our clients define great performance and execute at the highest levels. We also provide clients with training in management skills, relationship skills, and individual effectiveness, and can provide personal-effectiveness literature and electronic educational solutions to our clients as needed.
Our fiscal year ends on August 31 of each year.
Unless otherwise noted, references to fiscal years apply to the 12 months ended August 31 of the specified year.
During fiscal 2010, we sold the product sales component of our wholly owned subsidiary in Japan to an unrelated Japan-based paper products company. The sale closed on June 1, 2010 and the total sale price was JPY 305.0 million, or approximately $3.4 million. In addition, the sale agreement provides for a three percent passive royalty on annual sales, which is not significant to our operations. The sale of this division was designed to align our Japanese operations with our overall strategic focus on training and consulting sales. As a consequence of the sale, we determined that the operating results of the Japan product sales component qualified for discontinued operations presentation and we have presented the operating results of the Japan product sales component as discontinued operations for fiscal 2010.
Services Overview
Our mission is to “enable greatness in people and organizations everywhere,” and we believe that we are experts at solving seven pervasive, intractable problems, each of which requires a change in human behavior. As we deliver our solutions to these problems, we believe there are four important characteristics that distinguish us from our competitors.
|
1.
|
World Class Content
– Our content is principle centered and based on natural laws of human behavior and effectiveness. Our content is designed to build new skillsets, establish new mindsets, and provide enabling toolsets.
|
|
2.
|
Breadth and Scalability of Delivery Options
– We have a wide range of content delivery options, including: on-site training, training led through certified facilitators, on-line learning, blended learning, intellectual property licenses, and organization-wide transformational processes, including consulting and coaching.
|
|
3.
|
Global Capability
– We operate four regional sales offices in the United States; wholly owned subsidiaries in Australia, Japan, and the United Kingdom; and contract with licensee partners who deliver our curriculum and provide services in over 140 other countries and territories around the world.
|
|
4.
|
Transformational Impact and Reach
– We hold ourselves responsible for and measure ourselves by our clients’ achievement of transformational results.
|
Our content, tools, and methodologies are organized into key practice areas or product lines, each offering targeted solutions that are designed to drive these four outcomes. We have divided our curriculums into the following seven major practices:
|
1.
|
Leadership
|
|
2.
|
Productivity
|
|
3.
|
Trust
|
|
4.
|
Execution
|
|
5.
|
Sales Performance
|
|
6.
|
Education
|
|
7.
|
Customer Loyalty
|
Our practices are designed to provide world-class content and delivery, including best-selling books and audio, innovative and widely recognized thought leadership, multiple delivery and teaching methods, a practice-centric focused sales force, and practice-specific marketing support. These elements allow us to offer our clients training and consulting solutions that are designed to improve individual and organizational behaviors, deliver content that adapts to an organization’s unique needs, and provide meaningful improvements in our client’s business performance.
The following description of our practices and associated curriculums describes what our offerings are designed to provide to our clients. The description should not be viewed as a warranty or guarantee of results. Further information about our curriculums and services can be found on our website at
www.franklincovey.com
. However, the information contained in, or that can be accessed through, our website does not constitute a part of this annual report.
|
1.
|
Leadership
|
Leadership has a profound impact on performance, and is a key lever that mobilizes teams to produce results.
We help organizations develop leaders who build great teams through these 4 imperatives:
|
1.
|
Inspiring Trust
®
:
Build credibility as a leader so that people will contribute their highest efforts.
|
|
2.
|
Clarifying Your Team’s Purpose and Strategy
®
:
Define a clear and compelling purpose that motivates people to offer their best to achieve the organizational goals.
|
|
3.
|
Align Systems:
Create systems of success that support the purpose and goals of the organization, enable people to do their best work, operate independently of management, and sustain superior performance over time.
|
|
4.
|
Unleashing Talent
®
:
Develop a winning team, where people’s unique talents are leveraged against clear performance expectations in a way that encourages responsibility and growth.
|
Effective organizations are characterized by highly effective individuals—individuals who take initiative, set and achieve important goals, manage themselves well and are highly productive, work well with others, solve problems, and create new and valuable ideas.
Individual effectiveness and resilience are particularly valuable in a difficult economic environment. In such an environment, we believe that our approaches to personal and interpersonal effectiveness are perhaps more critical than ever.
The 7 Habits of Highly Effective People
®
—Signature Program
Based on the principles found in Dr. Stephen R. Covey’s best-selling business book,
The 7 Habits of Highly Effective People
, this program is designed to drive organizational success by helping participants adopt the paradigms and behaviors of effective people. Participants gain hands-on experience, applying principles that are designed to yield greater productivity, improve communication, strengthen relationships, increase influence, and focus on critical priorities. Participants learn how to take initiative, identify and balance key priorities, improve interpersonal communication, leverage creative collaboration and problem solving, and build their personal resilience and capability.
The 7 Habits for Managers
®
FranklinCovey’s
The 7 Habits for Managers
solution teaches the fundamentals of leading today’s mobile knowledge worker. Both new and experienced managers acquire a set of tools to help them meet today’s management challenges, including conflict resolution, prioritization, performance management, accountability and trust, execution, collaboration, and team and employee development.
The 7 Habits of Highly Effective People
®
: Introductory Workshop for Associates
This workshop for employees at all levels is designed to tap the best they have to give. We help employees become empowered with new knowledge, skills, and tools to confront issues, work as a team, increase accountability, and raise the bar on what they can achieve. Participants discover how to maximize performance by avoiding dependence on others, gaining appropriate independence, and moving on to where real success lies—being successfully interdependent and collaborative with others.
Leadership: Great Leaders, Great Teams, Great Results™
This comprehensive offering contains the entire core content of FranklinCovey’s Leadership practice. During the program, leaders learn the
4 Imperatives of Great Leaders
and take specific actions to carry them out. The workshop features videos that present the latest on our own research and thinking, along with the best thinking of other leadership experts including:
|
·
|
Jack Welch,
Winning
|
|
·
|
Fred Reichheld,
The Ultimate Question
|
|
·
|
Clayton Christensen,
The Innovator’s Solution
|
|
·
|
Stephen R. Covey,
The 8th Habit
|
|
·
|
Stephen M. R. Covey,
The Speed of Trust
|
|
·
|
Ram Charan,
What the CEO Wants You to Know
|
Leadership Foundations™
Our
Leadership Foundations
workshop is designed to prepare emerging leaders to take on significant roles and responsibilities in the future. Participants gain skills to improve trust and influence with peers and superiors, link their work to a clear and compelling team purpose, implement a system for executing critical priorities, and leverage the talents of peers and co-workers to achieve unprecedented results.
Leadership Modular Series
Drawn from the content of our leadership-development program, the
Leadership Modular Series
comprises seven stand-alone modules that teach imperatives leaders can apply to create a work environment that addresses the needs of the knowledge worker. For leaders who cannot attend
multiple days of training, the
Leadership Modular Series
lets them focus on one specific leadership competency, three to four hours at a time.
Executive Coaching
We offer senior executives a coaching experience created in partnership with Columbia University, which includes methodologies approved by the International Coach Federation (ICF). We leverage content, methodology, and tools to guide leaders in discovering and unleashing the potential they already possess. In one-on-one or team sessions, our executive coaches help senior-level executives work through complex issues, helping them establish initiatives that are clear, defined, and actionable, and provide supportive accountability until their goals are reached. We also offer one-on-one executive coaching in leadership development, strategy, goal execution, and personal work/life areas.
|
2.
|
Productivity
|
In today’s world of “doing more with less,” workforce productivity and engagement can be a competitive advantage. Today’s workers and leaders are required to make more decisions every day than ever before while their attention is under unprecedented attack. Over 350,000 survey respondents report on average that 40 percent of their time is spent on irrelevant activities creating enormous opportunity to improve “human productivity” without increasing human resources.
The 5 Choices to Extraordinary Productivity™
Our new flagship productivity course,
The 5 Choices to Extraordinary Productivity
, which was launched in the fall of 2011, is designed to provide the in-depth skills, knowledge and attitudes that allow individual contributors, teams and organizations to be able to identify, validate, and act on what’s most important. Instead of trying to get everything done, participants focus on how to get the right things done. This discernment enables them to make wiser decisions, harness technology to enhance workflow, and put their finest attention and energy on executing what matters most.
Supported by science and years of experience, this new program is designed to not only produce a measurable increase in productivity, but to also provide a renewed sense of engagement.
Project Management
Our project management workshop teaches a four-step process for skillfully managing projects large or small. This proven approach helps project managers and their teams craft and deliver high-quality projects on time and within budget. If developed and applied effectively, we believe that skillful project management can mean the difference between mediocre and phenomenal results.
Writing Advantage
®
The FranklinCovey
Writing Advantage
program teaches participants how to set quality writing standards that help people increase productivity, resolve issues, avoid errors, and heighten credibility. Participants learn a four-step process to improve their writing skills. They learn how to write faster with more clarity, and gain skills for revising and fine-tuning every style of document.
Technical Writing Advantage™
FranklinCovey’s
Technical Writing Advantage
program teaches participants the skills to improve the quality, clarity, structure, and expected results of their technical communication. This program teaches participants to take complex ideas and make them understandable and memorable in written form.
Presentation Advantage
®
With our
Presentation Advantage
solution, participants learn how to craft presentations around essential objectives, present key concepts and ideas with power and enthusiasm, design and present effective visuals, and employ techniques for polishing and mastering presentation delivery.
Meeting Advantage™
The FranklinCovey
Meeting Advantage
solution teaches participants to plan effectively by frontloading before a meeting, focusing productively during the meeting, and following through successfully after the meeting.
|
3.
|
Trust
|
We believe that trust is the hallmark of effective leaders, teams, and organizations. Trust-related problems like bureaucracy, fraud, and excessive turnover discourage productivity, divert resources, and chip away at a company’s brand. On the other hand, leaders who make building trust an explicit goal of their job gain strategic advantages—accelerating growth, enhancing innovation, improving collaboration and execution, and increasing shareholder value. Our Trust practice is built on
The New York Times
best-selling book,
The Speed of Trust
by Stephen M. R. Covey, and includes offerings to help leaders and team members develop the competencies to make trust a strategic advantage.
Leading at the Speed of Trust
®
This program engages leaders at all levels in identifying and closing the trust gaps in their organization. Instead of paying “trust taxes,” organizations can begin to realize “trust dividends.” We believe that doing business at the “speed of trust” lowers costs, speeds up results, and increases profits and influence.
Working at the Speed of Trust
®
—For Associates
This workshop helps individual contributors identify and address “trust gaps” in their personal credibility and in their relationships at work. Using examples from their work and focusing on real-world issues, participants discover how to communicate transparently with peers and managers, improve their track record of keeping commitments, focus on improving internal “customer service” with others who depend on their work, and much more.
|
4.
|
Execution
|
Execution remains one of the toughest challenges organizations face today. We believe that our Execution practice addresses these challenges. We work directly with leadership teams to help them clarify the “wildly important goals” that their strategy requires, identify key measures that lead to the achievement of these goals, create clear and compelling scoreboards, and build a culture and cadence of accountability so that the goals are achieved. Our key execution offerings include:
The 4 Disciplines of Execution
®
: Manager Certification
The purpose of
Manager Certification
includes helping managers not only develop specific skills, but to also create actual work plans. We help managers leave the session with clearly identified goals and measures, a draft scoreboard for their team, and an accountability plan to help everyone move forward on the goals.
The 4 Disciplines of Execution
®
: Skills Workshop and Team Work Session
The purpose of the one- or two-day work session is to help teams understand the methods and develop the skills of consistent execution. We help teams clarify their goals, refine key measures, and generate new and better ways of achieving the goals through peer-to-peer accountability.
Execution Quotient™ (xQ
®
) Assessment
This offering allows organizations to measure their overall ability to execute their most important goals. The xQ is a culture-wide assessment based on factors that contribute to consistent and successful execution. This assessment helps leaders identify areas where their goals may be at risk.
What the CEO Wants You to Know: Building Business Acumen™
This training supports the Execution disciplines by helping individuals and teams better understand the financial engine of their business and how they can positively affect it. The material is based on the popular book
What the CEO Wants You to Know,
by leading CEO and executive coach Ram Charan.
|
5.
|
Sales Performance
|
We believe that sales performance is about helping clients succeed. FranklinCovey provides an approach that delivers the “what to do” and “how to do” for mutual seller/buyer benefits. Through
consulting, training, and coaching, our
Sales Performance
practice helps sales leaders and salespeople act as genuine trusted business advisors who create value and help clients succeed.
Helping Clients Succeed
®
is a mind-set, skill-set, and tool-set for becoming client-centered. It is a way of thinking, being, and behaving. We believe that it removes the stigmas that come with sales, and we believe that it removes the adversarial interplay between sellers and buyers. It is also a process for creating candid dialogue, fresh thinking, innovative collaboration, insightful decision making, and robust execution—with clients and within an organization.
The acronym INORDER represents the underlying sales methodology we use in
Helping Clients Succeed
. Each module in the methodology represents a different stage in the sales process, starting from the front end with Initiating New Opportunities (INO) and Qualifying Opportunities (ORD), then closing at the back end with Winning and Growing Opportunities (ER). With our suite of consultative sales-training solutions, we believe clients can transform their salespeople into trusted business advisors who focus on helping their clients succeed, resulting in increased sales, shortened sales cycles, improved margins, and satisfied clients.
|
6.
|
Education
|
The FranklinCovey
Education
practice is dedicated to helping educational organizations build the culture that will produce great results. Our offerings address all grade levels and help faculty and students develop the critical leadership and effectiveness skills they will need to succeed in a knowledge-based, networked world.
Primary Education Solutions: The Leader in Me
®
The Leader in Me
process is designed to be integrated into a school’s core curriculum and everyday language. The methodology is designed to become part of the culture, gain momentum, and help to produce improved results year after year. We believe the methodology benefits schools and students in the following ways:
|
·
|
Develops students who have the skills and self-confidence to succeed as leaders in the 21st century.
|
|
·
|
Decreases discipline referrals.
|
|
·
|
Teaches and develops character and leadership through existing core curriculum.
|
|
·
|
Improves academic achievement.
|
|
·
|
Raises levels of accountability and engagement among both parents and staff.
|
The Leader in Me
process is also designed to help create a common language within a school, built on principle-based leadership skills found in Dr. Stephen R. Covey’s best-selling book
The 7 Habits of Highly Effective People
, and is designed to produce a holistic school-wide experience for primary school teachers and their classrooms.
Secondary Education Solutions: The 7 Habits of Highly Effective Teens
®
The
Introduction to The 7 Habits of Highly Effective Teens
® workshop from FranklinCovey, based on the best-selling book of the same name by Sean Covey and the No. 1 best-selling business book
The 7 Habits of Highly Effective People
, gives young people a set of tools to deal with life’s challenges. The training is a means for educators, administrators, and superintendents to help improve student performance; reduce conflicts, disciplinary problems, and truancy; and enhance cooperation and teamwork among parents, teens, and teachers.
The 7 Habits of Highly Effective Teens
are essentially seven characteristics that many happy and successful teens the world over have in common. The training provides students with a step-by-step framework for boosting self-image, building friendships, resisting peer pressure, achieving goals, improving communication and relationships with parents, and much more. The habits build upon each other and foster behavioral change and improvement from the inside out.
We also offer a workshop built around the book
The 6 Most Important Decisions You’ll Ever Make
, also by Sean Covey. This book helps students work through important and life-changing questions. This workshop is designed to be flexible so it can fit a classroom or school-wide schedule.
Higher Education Solutions: Introduction to the 7 Habits of Highly Effective College Students™
We believe that undergraduates who start their freshman year with a plan are more likely to complete their education and have successful careers.
The 7 Habits of Highly Effective College Students
helps students succeed by discovering their personal mission, setting goals, prioritizing tasks, and teaming with others.
This workshop contains eight hours of instructional material, which can be taught in a one day or modular format. Facilitators lead programs through instruction, multimedia presentations, and activities that provide students with a forum in which to reflect individually, apply the content, and get to know each other. Clients can become licensed to train their own students onsite, or have our facilitators present a custom program on their campus.
|
7.
|
Winning Customer Loyalty®
|
Our
Winning Customer Loyalty
practice helps leaders of multiunit organizations create a culture where employees are engaged and equipped to deliver great customer experiences. To do this, customer loyalty specialists draw from an array of offerings to craft a solution that works with each company’s culture, operating environment, and strategic vision. A typical solution includes these components:
|
·
|
Customer scores.
Customer-satisfaction and loyalty scores for every unit, every month.
|
|
·
|
Employee scores
. A targeted employee survey that gauges each unit’s “Execution Quotient” (xQ), or the conditions required for an engaged and focused workforce.
|
|
·
|
Loyalty portal.
A Web-based dashboard that allows every unit to see their scores, reach out to customers, and manage their team’s focus on the key activities that drive customer loyalty.
|
|
·
|
“Lead measure” identification.
Our most senior consultants guide the senior team through a “lead measure” identification process where, through a combination of best practices and strategic assessments, key activities are identified that become the drivers of a memorable customer experience.
|
|
·
|
Systems alignment.
We help the senior team to align compensation, training, and other systems around the most critical goals and remove operational barriers to execution.
|
|
·
|
Manager certification.
Unit-level managers are certified to engage their teams around their scores, lead measures, and key activities.
|
|
·
|
Frontline training.
We provide training in key areas such as scoreboarding, focus and execution, leadership, and creating a culture of service. Much of this training, as well as supportive tools, is delivered to each unit through the Loyalty Portal.
|
Delivery Methods
We have multiple methods to deliver our world-class content to our clients that are designed to provide our customers with a learning environment that suits their needs. Our primary delivery methods include the following:
|
·
|
Onsite Presentations
|
|
·
|
Facilitators
|
|
·
|
International Licensees
|
|
·
|
E-Learning
|
|
·
|
Public Workshops
|
|
·
|
Custom Solutions
|
|
·
|
Intellectual Property Licenses
|
|
·
|
Media Publishing
|
Onsite Presentations
We employ highly talented consultants and presenters to deliver our curriculums in person at client locations. Based around the world, our consultants represent diverse, global industry experience and can tailor their delivery to meet a client’s precise needs. Whether the need is for consulting, training, or customized keynote speeches, our consultants can deliver our curriculums to any level of an organization, from the C-suite to a team or department. We believe that our delivery consultants provide high quality services and are a competitive advantage in the marketplace.
Facilitators
For organizations seeking cost-effective ways to implement solutions involving large populations of managers and frontline workers, FranklinCovey certifies on-site client facilitators to teach our content and adapt it to our client’s organizational needs. We have over 45,000 client facilitators world-wide who are certified to teach in 41 different content areas. In order to become a client facilitator, an individual must become certified to teach our curriculums through a two-step process that is designed to ensure that these trained personnel can deliver our content in a professional and meaningful manner.
International Licensees
In foreign countries where we do not have an office, our training and consulting services are delivered through independent licensees, which may translate and adapt our curriculums to local preferences and customs, if necessary. Our licensee partners deliver our curriculums and provide services in over 140 other countries and territories around the world. These licensee partners allow us to deliver the same high quality content to clients that have multinational operations or in countries that have specific cultural requirements. Our licensee partners pay us a royalty based on the programs and content delivered.
|
E-Learning
|
Our E-Learning capabilities bring FranklinCovey to clients in innovative ways that transcend traditional E-learning solutions. Our primary E-learning platforms are comprised of the following:
FranklinCovey InSights™
– We believe that some of the best development happens when leaders teach their own teams. FranklinCovey InSights represents a paradigm of “Teach to Learn” leadership. This library of bite-sized, Web-based learning modules is built around our award-winning video presentations that leaders can use to motivate their teams to improve performance. Designed to address generational learning styles, the modules teach people to see and do things differently, enabling teams to produce better results and make changes over time.
LiveClicks™
– This is our webinar delivery platform that allows clients to reach more people at less cost with high-quality live training.
LiveClicks
webinar workshops utilize our award-winning videos, interactive activities, and live instruction.
LiveClick
webinars are offered to the public with our consultants and client facilitators, who can also become certified to teach
LiveClicks
webinars inside their organizations. The
LiveClicks
platform allows clients to train more people, reach remote workers, and attract a new generation of workers.
FranklinCovey Excelerators™
– Excelerators are self-paced courses for employees and managers looking to increase business and leadership skills but whom can't be away from the office. Excelerators offer content-based instruction through videos, animation, interactive quizzes and assessments, PDF guidebooks as well as other resources and tools.
LiveClicks Encore
– These courses are FranklinCovey's webinar workshops on demand. These self-paced online modules are designed for employees, managers and leaders looking to increase the most important skills needed to maximize performance. LiveClicks Encore webinars are an ideal solution for employees who can't attend regularly scheduled live training due to distance, cost, or time away from the office.
The 7 Habits Interactive™ Edition
– The award-winning
7 Habits of Highly Effective People—Interactive Edition
helps employees, regardless of work location, to increase their effectiveness and productivity and feel a stronger sense of cohesion.
The 7 Habits Interactive Edition
heightens learning by helping participants to apply principles that are designed to yield greater productivity, improved communication, strengthened relationships, increased influence, and an improved focus on critical priorities. During the three-hour online instruction, participants engage in interactive exercises that illustrate how to use the 7 Habits in real work situations.
Public Workshops
Each year, we offer a number of training events, primarily in the United States and Canada, which are open to the public. Prior to the event, we advertise in the geographic region where the event will be held and participants may register for the events in advance. Interested persons may also search for upcoming workshops based on the desired curriculum and register for these workshops through our website at
www.franklincovey.com
. In addition, our curriculums are also taught by certain professional training firms that also offer events to the public.
|
Custom Solutions
|
Whether clients need a program customized, or require a new product developed for their organization, our custom solutions department has the process to build the solution. Customization builds upon our existing content and clients’ unique content by using a specific process to deliver results. Our five-step process (diagnose, design, develop, deliver, and learn) lowers development costs and strives to improve our clients’ return on investment.
Intellectual Property Licenses
For clients that want to utilize our curriculums in their internal training environments, we offer intellectual property licenses to allow further customization of our content to specific client needs.
|
Media Publishing
|
Our Media Publishing practice extends our influence into both traditional publishing and new media channels. FranklinCovey Media Publishing offers books, e-books, audio products, downloadable and paper-based tools, and content-rich software applications for smart phones and other handheld devices (like the Apple® iPhone®) to consumer and corporate markets.
Industry Information
According to the
Training
Magazine 2012 Training Industry Survey, the total size of the U.S. training industry is estimated to be $55.8 billion, which is a seven percent decline from the prior year. One of our competitive advantages in this highly fragmented industry stems from our fully integrated training curriculums, measurement methodologies, and implementation tools to help organizations and individuals measurably improve their effectiveness. This advantage allows us to deliver not only training to both corporations and individuals, but also to implement the training through the use of powerful behavior changing tools with the capability to then measure the impact of the delivered training and tools.
Over our history, we have provided products and services to 97 of the Fortune 100 companies and more than 75 percent of the Fortune 500 companies. We also provide products and services to a number of U.S. and foreign governmental agencies, as well as numerous educational institutions. In addition, we provide training curricula, measurement services and implementation tools internationally, either through directly operated offices, or through independent licensed providers.
Segment Information
Our sales are primarily comprised of training and consulting sales and related products. Based on the consistent nature of our services and products and the types of customers for these services, we
function as a single operating segment. However, to improve comparability with previous periods, operating information for our U.S./Canada, international, and corporate services operations is presented below. Our U.S./Canada operations are responsible for the sale and delivery of our training and consulting services in the United States and Canada. Our international sales group includes the financial results of our foreign offices and royalty revenues from licensees. Our corporate services information includes leasing income and certain corporate operating expenses (in thousands).
|
YEAR ENDED
AUGUST 31,
|
2012
|
Percent change from prior year
|
2011
|
Percent change from prior year
|
2010
|
|||||||||||||||
|
U.S./Canada
|
$ | 125,183 | 6 | $ | 118,420 | 20 | $ | 98,344 | ||||||||||||
|
International
|
42,052 | 5 | 40,011 | 13 | 35,309 | |||||||||||||||
|
Total
|
167,235 | 6 | 158,431 | 19 | 133,653 | |||||||||||||||
|
Corporate services
|
3,221 | 36 | 2,373 | (26 | ) | 3,221 | ||||||||||||||
|
Consolidated
|
$ | 170,456 | 6 | $ | 160,804 | 17 | $ | 136,874 | ||||||||||||
Additional financial information related to our operating segments, as well as geographical information can be found in the notes to our consolidated financial statements (Note 17).
Clients
We have a relatively broad base of organizational and individual clients. Worldwide, we have more than 4,200 organizational clients consisting of corporations, governmental agencies, educational institutions, and other organizations. We have additional organizational clients throughout the world, and we believe that our products, workshops, and seminars encourage strong client loyalty. Employees in each of our domestic and international distribution channels focus on providing timely and courteous responses to client requests and inquiries. Due to the nature of our business, we do not have a significant backlog of firm orders.
During fiscal 2011, we recognized $16.8 million in sales from our contracts with a division of the United States federal government, which is more than ten percent of our consolidated revenues for the year. During fiscal years 2012 and 2010, none of our clients was responsible for more than ten percent of our consolidated revenues.
Competition
We operate in a highly competitive and rapidly changing global marketplace and compete with a variety of organizations that offer services comparable with those that we offer. Competition in the performance skills training and education industry is highly fragmented with few large competitors. Based upon our fiscal 2012 consolidated sales of
$170.5
million, we believe that we are a leading competitor in the organizational training and education market. Other significant comparative companies in the training and consulting market are Development Dimensions International, CRA International, Inc., Learning Tree International Inc., GP Strategies Corp., American Management Association, Wilson Learning, Forum Corporation, Corporate Executive Board Co., and the Center for Creative Leadership.
We derive our revenues from a variety of companies with a broad range of sales volumes, governments, educational institutions, and other institutions. We believe that the principal competitive factors in the industry in which we compete include the following:
|
·
|
Quality of services and solutions
|
|
·
|
Skills and capabilities of people
|
|
·
|
Innovative training and consulting services combined with effective products
|
|
·
|
Ability to add value to client operations
|
|
·
|
Reputation and client references
|
|
·
|
Price
|
|
·
|
Availability of appropriate resources
|
|
·
|
Global reach and scale
|
Given the relative ease of entry in our training market, the number of our competitors could increase, many of whom may imitate existing methods of distribution, or could offer similar products and seminars at lower prices. Some of these competitors may have greater financial and other resources than us. However, we believe our curriculum based upon best-selling books, which encompasses relevant high-quality video segments, has become a competitive advantage. This advantage is strengthened and enhanced by our ability to easily train individuals within organizations to become client facilitators who in turn can effectively relay our curriculums throughout their organization. Moreover, we believe that we are a market leader in the United States in execution, leadership, and individual effectiveness training, consulting, and products. Increased competition from existing and future competitors could, however, have a material adverse effect on our sales and profitability.
Seasonality
Our quarterly results of operations reflect minor seasonal trends primarily because of the timing of corporate training, which is not typically scheduled as heavily during holiday and certain vacation periods. Our fourth fiscal quarter generally has higher sales and income from operations than other fiscal quarters primarily due to increased facilitator sales that occur during that quarter.
Quarterly fluctuations may also be affected by other factors including the introduction of new offerings, the addition of new organizational customers, and the elimination of underperforming offerings.
Manufacturing and Distribution
We do not manufacture any of our products. We purchase our training materials and related products from various vendors and suppliers located both domestically and internationally, and we are not dependent upon any one vendor for the production of our training and related materials as the raw materials for these products are readily available. We currently believe that we have good relationships with our suppliers and contractors.
During fiscal 2001, we entered into a long-term contract with HP Enterprise Services (HP) to provide warehousing and distribution services for our training products and related accessories. Our materials are primarily warehoused and distributed from an HP facility located in Des Moines, Iowa.
Trademarks, Copyrights, and Intellectual Property
Our success has resulted in part from our proprietary curriculum, methodologies, and other intellectual property rights. We seek to protect our intellectual property through a combination of trademarks, copyrights, and confidentiality agreements. We claim rights for over 450 trademarks in the United States and foreign countries, and we have obtained registration in the United States and many foreign countries for many of our trademarks including
FranklinCovey, The 7 Habits of Highly Effective People, Principle–Centered Leadership
,
The 4 Disciplines of Execution
, and
The 7 Habits
. We consider our trademarks and other proprietary rights to be important and material to our business.
We own sole or joint copyrights on our planning systems, books, manuals, text and other printed information provided in our training seminars and other electronic media products, including audio tapes and video tapes. We license, rather than sell, facilitator workbooks and other seminar and training materials in order to protect our intellectual property rights therein. We place trademark and copyright notices on our instructional, marketing, and advertising materials. In order to maintain the proprietary nature of our product information, we enter into written confidentiality agreements with certain executives, product developers, sales professionals, training consultants, other employees, and licensees. Although we believe the protective measures with respect to our proprietary rights are important, there can be no assurance that such measures will provide significant protection from competitors.
Employees
One of our most important assets is our people. The diverse and global makeup of our workforce allows us to serve a variety of clients on a worldwide basis. We are committed to attracting, developing, and retaining quality personnel and actively strive to reinforce our employees’ commitments to our clients, culture, and values through creation of a motivational and rewarding work environment.
At August 31, 2012, we had approximately 630 associates located in the United States of America, Canada, Japan, the United Kingdom, and Australia. During fiscal 2001, we outsourced a significant part of our information technology services, customer service, distribution and warehousing operations to HP. A number of our former employees involved in these operations are now employed by HP to provide those services to FranklinCovey. None of our associates are represented by a union or other collective bargaining group. Management believes that its relations with its associates are good and we do not currently foresee a shortage in qualified personnel needed to operate our business.
Available Information
Our principal executive offices are located at 2200 West Parkway Boulevard, Salt Lake City, Utah 84119-2331, and our telephone number is (801) 817-1776.
We regularly file reports with the Securities Exchange Commission (SEC). These reports include, but are not limited to, Annual Reports on Form 10-K, Quarterly Reports on Form 10-Q, Current Reports on Form 8-K, and security transaction reports on Forms 3, 4, or 5. The public may read and copy any materials that the Company files with the SEC at the SEC’s Public Reference Room located at 100 F Street, NE, Washington, DC 20549. The public may obtain information on the operation of the Public Reference Room by calling the SEC at 1-800-SEC-0330. The SEC also maintains electronic versions of the Company’s reports, proxy and information statements, and other information that the Company files with the SEC on its website at
www.sec.gov
.
The Company makes our Annual Report on Form 10-K, Quarterly Reports on Form 10-Q, current reports on Form 8-K, and other reports filed or furnished with the SEC available to the public, free of charge, through our website at
www.franklincovey.com
. These reports are provided through our website as soon as is reasonably practicable after we file or furnish these reports with the SEC.
Our business environment, current domestic and international economic conditions, and other specific risks may affect our future business decisions and financial performance. The matters discussed below may cause our future results to differ from past results or those described in forward-looking statements and could have a material adverse effect on our business, financial condition, liquidity, results of operations, and stock price, and should be considered in evaluating our Company.
The risks included here are not exhaustive. Other sections of this report may include additional risk factors which could adversely affect our business and financial performance. Moreover, we operate in a very competitive and rapidly changing global environment. New risk factors emerge from time to time and it is not possible for management to predict all such risk factors, nor can we assess the impact of all such risk factors on our business or the extent to which any factor, or combination of factors, may cause actual results to differ materially from those contained in any forward-looking statements. Given these risks and uncertainties, investors should not place undue reliance on forward-looking statements as a prediction of actual results.
We operate in an intensely competitive industry and our competitors may develop courses that adversely affect our ability to sell our offerings.
The training and consulting services industry is intensely competitive with relatively easy entry. Competitors continually introduce new programs and services that may compete directly with our offerings or that may make our offerings uncompetitive or obsolete. Larger and better capitalized competitors may have superior abilities to compete for clients and skilled professionals, reducing our ability to deliver quality work to our clients. In addition, one or more of our competitors may develop and implement training courses or methodologies that may adversely affect our ability to sell our curriculums and products to new clients. Any one of these circumstances could have an adverse effect on our ability to obtain new business and successfully deliver our services.
Our results of operations could be adversely affected by economic and political conditions and the effects of these conditions on our clients’ businesses and their levels of business activity.
Global economic and political conditions affect our clients’ businesses and the markets in which they operate. Our financial results are somewhat dependent on the amount that current and prospective clients budget for training. A serious and/or prolonged economic downturn (or continued slow recovery) combined with a negative or uncertain political climate could adversely affect our clients’ financial condition and the amount budgeted for training by our clients. These conditions may reduce the demand for our services or depress the pricing of those services and have an adverse impact on our results of operations. Changes in global economic conditions may also shift demand to services for which we do not have competitive advantages, and this could negatively affect the amount of business that we are able to obtain. Such economic, political, and client spending conditions are influenced by a wide range of factors that are beyond our control and that we have no comparative advantage in forecasting. If we are unable to successfully anticipate these changing conditions, we may be unable to effectively plan for and respond to those changes, and our business could be adversely affected.
Our business success also depends in part upon continued growth in the use of training and consulting services and the renewal of existing contracts by our clients. In challenging economic environments, our clients may reduce or defer their spending on new services and consulting solutions in order to focus on other priorities. At the same time, many
companies have already invested substantial resources in their current means of conducting their business and they may be reluctant or slow to adopt new approaches that could disrupt existing personnel and/or processes. If the growth in the general use of training and consulting services in business or our clients’ spending on these items declines, or if we cannot convince our clients or potential clients to embrace new services and solutions, our results of operations could be adversely affected.
In addition, our business tends to lag behind economic cycles and, consequently, the benefits of an economic recovery following a period of economic downturn may take longer for us to realize than other segments of the economy.
Our results of operations may be negatively affected if we cannot expand and develop our services and solutions in response to client demand or if newly developed or acquired services have increased costs.
Our success depends upon our ability to develop and deliver services and consulting solutions that respond to rapid and continuing changes in client needs. We may not be successful in anticipating or responding to these developments on a timely basis, and our offerings may not be successful in the marketplace. The implementation, acquisition, and introduction of new programs and solutions may reduce sales of our other existing programs and services and may entail more risk than supplying existing offerings to our clients. Newly developed or acquired solutions may also require increased royalty payments or carry significant development costs that must be expensed. Any one of these circumstances may have an adverse impact upon our business and results of operations.
Our results of operations and cash flows may be adversely affected if FC Organizational Products LLC is unable to pay the working capital settlement, reimbursable acquisition costs, or reimbursable operating expenses.
According to the terms of the agreements associated with the sale of the consumer solutions business unit (CSBU) assets to FC Organizational Products, LLC (FCOP and formerly Franklin Covey Products) that closed in the fourth quarter of fiscal 2008, and an entity in which we own 19.5 percent, we were entitled to receive a $1.2 million payment for working capital delivered on the closing date of the sale and to receive $2.3 million as reimbursement for specified costs necessary to complete the transaction. Payment for these costs was originally due in January 2009, but we extended the due date of the payment at FC Organizational Products’ request and obtained a promissory note from FCOP for the amount owed, plus accrued interest. At the time we received the promissory note from FCOP, we believed that we could obtain payment for the amounts owed, based on prior year performance and forecasted financial performance in 2009. However, the financial position of FCOP deteriorated significantly late in fiscal 2009 and the deterioration accelerated subsequent to August 31, 2009 and throughout fiscal 2010. As a result of its deteriorating financial position, we reassessed the collectability of the promissory note. Based on revised expected cash flows and other operational issues, we recorded a $3.6 million impaired asset charge against these receivables.
We also receive reimbursement from FCOP for certain operating costs, such as warehousing and distribution costs, which are billed to us by third party providers, and although not required by governing documents or our ownership interest, we have provided working capital and other advances to FCOP in 2012. At August 31, 2012 and 2011 we had $7.1 million and $5.7 million receivable from FCOP, which are recorded as assets on our consolidated balance sheets. We owed FCOP $0.1 million and $1.2 million at August 31, 2012 and 2011 for items purchased in the ordinary course of business. These liabilities
were classified in accounts payable in our consolidated balance sheets. Although the receivable from FCOP increased during fiscal 2012, we believe that we will obtain payment from FCOP for these receivables. However, if FCOP fails to reimburse us for these costs, and we fail to obtain payment on the promissory note, our future cash flows and results of operations will be adversely affected.
Our results of operations and cash flows may be adversely affected if FC Organizational Products LLC is unable to pay its retail store leases.
Based on the terms of the agreements associated with the sale of the CSBU assets, we assigned the benefits and obligations relating to the leases of our retail stores to FCOP. However, we remain secondarily liable for these leases and may have to fulfill the obligations contained in the lease agreements, including making lease payments, if FCOP is unable to fulfill its obligations pursuant to the terms of the lease agreements. At August 31, 2012 the remaining potential liability to us under these leases totaled $0.3 million, the majority of which will be paid by February 2013. Any default by FCOP in its lease payment obligations could provide us with certain remedies against FCOP. If FCOP is unable to satisfy the obligations contained in the lease agreements and we are unable to obtain adequate remedies, our results of operations and cash flows may be adversely affected.
Our global operations pose complex management, foreign currency, legal, tax, and economic risks, which we may not adequately address.
We have offices in Australia, Japan, and the United Kingdom. We also have licensed operations in numerous other foreign countries. As a result of these foreign operations and their impact upon our results of operations, we are subject to a number of risks, including:
|
·
|
Restrictions on the movement of cash
|
|
·
|
Burdens of complying with a wide variety of national and local laws
|
|
·
|
The absence in some jurisdictions of effective laws to protect our intellectual property rights
|
|
·
|
Political instability
|
|
·
|
Currency exchange rate fluctuations
|
|
·
|
Longer payment cycles
|
|
·
|
Price controls or restrictions on exchange of foreign currencies
|
We may experience foreign currency gains and losses.
Our sales outside of the United States totaled $49.1 million, or 29 percent of total sales, for the year ended August 31, 2012. If our international operations grow and become a larger component of our overall financial results, our revenues and operating results may be significantly adversely affected when the dollar strengthens relative to other currencies and may be favorably affected when the dollar weakens. In order to manage a portion of our foreign currency risk, we may make limited use of foreign currency derivative contracts to hedge certain transactions and translation exposure. However, there can be no guarantee that our foreign currency risk management strategy will be effective in reducing the risks associated with foreign currency transactions and translation.
Our global operations expose us to numerous and sometimes conflicting legal and regulatory requirements, and violation of these regulations could harm our business.
Because we provide services to clients in many countries, we are subject to numerous, and sometimes conflicting, regulations on matters as diverse as import/export controls, content requirements, trade restrictions, tariffs, taxation, sanctions, government affairs, internal and disclosure control obligations, data privacy, and labor relations. Violations of these regulations in the conduct of our business could result in fines, criminal sanctions against us or our officers, prohibitions on doing business, and damage to our reputation. Violations of these regulations in connection with the performance of our obligations to our clients also could result in liability for monetary damages, fines and/or criminal prosecution, unfavorable publicity, restrictions on our ability to process information, and allegations by our clients that we have not performed our contractual obligations. Due to the varying degrees of development of the legal systems of the countries in which we operate, local laws may be insufficient to protect our rights.
In many parts of the world, including countries in which we operate, practices in the local business community might not conform to international business standards and could violate anticorruption regulations, including the United States Foreign Corrupt Practices Act, which prohibits giving anything of value intended to influence the awarding of government contracts. Although we have policies and procedures to ensure legal and regulatory compliance, our employees, licensee operators, and agents could take actions that violate these requirements. Violations of these regulations could subject us to criminal or civil enforcement actions, including fines and suspension or disqualification from United States federal procurement contracting, any of which could have an adverse effect on our business.
Our work with governmental clients exposes us to additional risks that are inherent in the government contracting process.
Our clients include national, provincial, state, and local governmental entities, and our work with these governmental entities has various risks inherent in the governmental contracting process. These risks include, but are not limited to, the following:
|
·
|
Governmental entities typically fund projects through appropriated monies. While these projects are often planned and executed as multi-year projects, the governmental entities usually reserve the right to change the scope of or terminate these projects for lack of approved funding and at their discretion. Changes in governmental priorities or other political developments could result in changes in the scope of, or in termination of, our existing contracts.
|
|
·
|
Governmental entities often reserve the right to audit our contract costs, including allocated indirect costs, and conduct inquiries and investigations of our business practices with respect to our government contracts. If the governmental entity finds that the costs are not reimbursable, then we will not be allowed to bill for those costs or the cost must be refunded to the client if it has already been paid to us. Findings from an audit also may result in our being required to prospectively adjust previously agreed upon rates for our work, which may affect our future margins.
|
|
·
|
If a governmental client discovers improper activities in the course of audits or investigations, we may become subject to various civil and criminal penalties and administrative sanctions, which may include termination of contracts, forfeiture of profits, suspension of payments, fines and suspensions or debarment from doing
|
business with other agencies of that government. The inherent limitations of internal controls may not prevent or detect all improper or illegal activities, regardless of their adequacy.
|
·
|
Political and economic factors such as pending elections, revisions to governmental tax policies and reduced tax revenues can affect the number and terms of new governmental contracts signed.
|
The occurrences or conditions described above could affect not only our business with the particular governmental agency involved, but also our business with other agencies of the same or other governmental entities. Additionally, because of their visibility and political nature, governmental projects may present a heightened risk to our reputation. Any of these factors could have an adverse effect on our business or our results of operations.
We are the creditor for a management common stock loan program that may not be fully collectible.
We are the creditor for a loan program that provided the capital to allow certain management personnel the opportunity to purchase shares of our common stock. For further information regarding our management common stock loan program, refer to the notes to our consolidated financial statements as found in Item 8 of this Annual Report on Form 10-K. Our inability to collect all, or a portion, of these receivables could have an adverse impact upon our financial position and cash flows compared to full collection of the loans.
We could have liability or our reputation could be damaged if we do not protect client data or if our information systems are breached.
We are dependent on information technology networks and systems to process, transmit, and store electronic information and to communicate among our locations around the world and with our clients. Security breaches of this infrastructure could lead to shutdowns or disruptions of our systems and potential unauthorized disclosure of confidential information. We are also required at times to manage, utilize, and store sensitive or confidential client or employee data. As a result, we are subject to numerous U.S. and foreign jurisdiction laws and regulations designed to protect this information, such as the various U.S. federal and state laws governing the protection of individually identifiable information. If any person, including any of our associates, negligently disregards or intentionally breaches our established controls with respect to such data or otherwise mismanages or misappropriates that data, we could be subject to monetary damages, fines, and/or criminal prosecution. Unauthorized disclosure of sensitive or confidential client or employee data, whether through systems failure, employee negligence, fraud, or misappropriation could damage our reputation and cause us to lose clients.
Our business could be adversely affected if our clients are not satisfied with our services.
The success of our business model depends significantly on our ability to attract new work from our base of existing clients, as well as new work from prospective clients. Our business model also depends on the relationships our senior executives and sales personnel develop with our clients so that we can understand our clients’ needs and deliver services and solutions that are specifically tailored to address those needs. If a client is not satisfied with the quality of work performed by us, or with the type of services or solutions delivered, then we may incur additional costs to remediate the situation, the profitability of that work might be decreased, and the client’s dissatisfaction with our services could damage our ability to obtain additional work from that client. In particular, clients that are not satisfied might seek to terminate existing contracts prior to their scheduled expiration
date and could direct future business to our competitors. In addition, negative publicity related to our client relationships, regardless of its accuracy, may further damage our business by affecting our ability to compete for new contracts with current and prospective clients.
Our profitability could suffer if we are unable to control our operating costs.
Our future success and profitability depend in part on our ability to achieve an appropriate cost structure and to improve our efficiency in the highly competitive services industry in which we compete. We regularly monitor our operating costs and develop initiatives and business models that are designed to improve our profitability. Our recent initiatives have included revisions to existing processes and procedures, asset sales, headcount reductions, exiting non-core businesses, and other internal initiatives designed to reduce our operating costs. If we are unable to achieve targeted business model cost levels and effectively manage our costs, our competitiveness and profitability may decrease.
Our future quarterly operating results are subject to factors that can cause fluctuations in our stock price.
Historically, our stock price has experienced significant volatility. We expect that our stock price may continue to experience volatility in the future due to a variety of potential factors that may include the following:
|
·
|
Fluctuations in our quarterly results of operations and cash flows
|
|
·
|
Increased overall market volatility
|
|
·
|
Variations between our actual financial results and market expectations
|
|
·
|
Changes in our key balances, such as cash and cash equivalents
|
|
·
|
Currency exchange rate fluctuations
|
|
·
|
Unexpected asset impairment charges
|
|
·
|
Lack of, or increased, analyst coverage
|
In addition, the stock market has recently experienced substantial price and volume fluctuations that have impacted our stock and other equity issues in the market. These factors, as well as general investor concerns regarding the credibility of corporate financial statements, may have an adverse effect upon our stock price in the future.
We may fail to meet analyst expectations, which could cause the price of our stock to decline.
Our common stock is publicly traded on the New York Stock Exchange, and at any given time various securities analysts follow our financial results and issue reports on us. These periodic reports include information about our historical financial results as well as the analysts’ estimates of our future performance. The analysts’ estimates are based on their own opinions and are often different from our estimates or expectations. If our operating results are below the estimates or expectations of public market analysts and investors, our stock price could decline. If our stock price is volatile, we may become involved in securities litigation following a decline in prices. Any litigation could result in substantial costs and a diversion of management’s attention and resources that are needed to successfully run our business.
Our profitability will suffer if we are not able to maintain our pricing and utilization rates.
The profit margin on our services is largely a function of the rates we are able to recover for our services and the utilization, or chargeability, of our trainers, client partners, and consultants. Accordingly, if we are unable to maintain sufficient pricing for our services or an appropriate utilization rate for our training professionals without corresponding cost reductions, our profit margin and overall profitability will suffer. The rates that we are able to recover for our services are affected by a number of factors that we may be unable to control, including:
|
·
|
Our clients’ perceptions of our ability to add value through our programs and products
|
|
·
|
Competition
|
|
·
|
General economic conditions
|
|
·
|
Introduction of new programs or services by us or our competitors
|
|
·
|
Our ability to accurately estimate, attain, and sustain engagement sales, margins, and cash flows over longer contract periods
|
Our utilization rates are also affected by a number of factors, including:
|
·
|
Seasonal trends, primarily as a result of scheduled training
|
|
·
|
Our ability to forecast demand for our products and services and thereby maintain an appropriate headcount in our employee base
|
|
·
|
Our ability to manage attrition
|
During recently completed periods we have maintained favorable utilization rates. However, there can be no assurance that we will be able to maintain favorable utilization rates in future periods. Additionally, we may not achieve a utilization rate that is optimal for us. If our utilization rate is too high, it could have an adverse effect on employee engagement and attrition. If our utilization rate is too low, our profit margin and profitability may suffer.
If we are unable to attract, retain, and motivate high-quality employees, including training consultants and other key training representatives, we will not be able to compete effectively and will not be able to grow our business.
Our success and ability to grow are dependent, in part, on our ability to hire, retain, and motivate sufficient numbers of talented people with the increasingly diverse skills needed to serve our clients and grow our business. Competition for skilled personnel is intense at all levels of experience and seniority. To address this competition, we may need to further adjust our compensation practices, which could put upward pressure on our costs and adversely affect our profit margins. At the same time, the profitability of our business model is partially dependent on our ability to effectively utilize personnel with the right mix of skills and experience to effectively deliver our programs and content. There is a risk that at certain points in time and in certain geographical regions, we will find it difficult to hire and retain a sufficient number of employees with the skills or backgrounds we require, or that it will prove difficult to retain them in a competitive labor market. If we are unable to hire and retain talented employees with the skills, and in the locations, we require, we might not be able to deliver our content and services. If we need to re-assign personnel from other areas, it could increase our costs and adversely affect our profit margins.
In order to retain key personnel, we continue to offer a variable component of compensation, the payment of which is dependent upon our sales performance and
profitability. We adjust our compensation levels and have adopted different methods of compensation in order to attract and retain appropriate numbers of employees with the necessary skills to serve our clients and grow our business. We may also use share-based performance incentives as a component of our executives’ compensation, which may affect amounts of cash compensation. Variations in any of these areas of compensation may adversely impact our operating performance.
We depend on key personnel, the loss of whom could harm our business.
Our future success will depend, in part, on the continued service of key executive officers and personnel. The loss of the services of any key individuals could harm our business. Our future success also depends on our ability to identify, attract, and retain additional qualified senior personnel. Competition for such individuals in our industry is intense, and we may not be successful in attracting and retaining such personnel.
We may need additional capital in the future, and this capital may not be available to us on favorable terms or at all.
We may need to raise additional funds through public or private debt offerings or equity financings in order to:
|
·
|
Develop new services, programs, or offerings
|
|
·
|
Take advantage of opportunities, including expansion of the business
|
|
·
|
Respond to competitive pressures
|
Going forward, we will continue to incur costs necessary for the day-to-day operation and potential growth of the business and may use our available Revolving Loan and other financing alternatives, if necessary, for these expenditures. We extended the maturity date on our Revolving Loan during fiscal 2012 to March 2015 and expect to renew the Revolving Loan on an annual basis to maintain the three-year availability of this credit facility. Additional potential sources of liquidity available to us include factoring receivables, issuance of additional equity, or issuance of debt from public or private sources. If necessary, we will evaluate all of these options and select one or more of them depending on overall capital needs and the associated cost of capital.
Any additional capital raised through the sale of equity could dilute current shareholders’ ownership percentage in us. Furthermore, we may be unable to obtain the necessary capital on terms or conditions that are favorable to us, or at all.
We have only a limited ability to protect our intellectual property rights, which are important to our success.
Our financial success depends, in part, upon our ability to protect our proprietary curriculums and other intellectual property. The existing laws of some countries in which we provide services might offer only limited protection of our intellectual property rights. To protect our intellectual property, we rely upon a combination of confidentiality policies, nondisclosure and other contractual arrangements, as well as patent, copyright, and trademark laws. The steps we take in this regard may not be adequate to prevent or deter infringement or other misappropriation of our intellectual property, and we might not be able to detect unauthorized use of, or take appropriate and timely steps to enforce, our intellectual property rights, especially in foreign jurisdictions.
The loss of proprietary curriculums or the unauthorized use of our intellectual property may create greater competition, loss of revenue, adverse publicity, and may limit our ability to reuse that intellectual property for other clients. Any limitation on our ability to provide a service or solution could cause us to lose revenue-generating opportunities and require us to incur additional expenses to develop new or modified solutions for future engagements.
If we are unable to collect our accounts receivable on a timely basis, our results of operations and cash flows could be adversely affected.
Our business depends on our ability to successfully obtain payment from our clients of the amounts they owe us for services performed. We evaluate the financial condition of our clients and usually bill and collect on relatively short cycles. We maintain allowances against our receivables and unbilled services that we believe are adequate to reserve for potentially uncollectible amounts. However, actual losses on client balances could differ from those that we currently anticipate and, as a result, we might need to adjust our allowances. In addition, there is no guarantee that we will accurately assess the creditworthiness of our clients. Macroeconomic conditions could also result in financial difficulties for our clients, and as a result could cause clients to delay payments to us, request modifications to their payment arrangements that could increase our receivables balance, or not pay their obligations to us. Timely collection of client balances also depends on our ability to complete our contractual commitments and bill and collect our invoiced revenues. If we are unable to meet our contractual requirements, we might experience delays in collection of and/or be unable to collect our client balances, and if this occurs, our results of operations and cash flows may be adversely affected.
The Company’s use of accounting estimates involves judgment and could impact our financial results.
Our most critical accounting estimates are described in Management’s Discussion and Analysis found in Item 7 of this report under the section entitled “Use of Estimates and Critical Accounting Policies.” In addition, as discussed in various footnotes to our financial statements as found in Item 8, we make certain estimates for loss contingencies, including decisions related to legal proceedings and reserves. Because, by definition, these estimates and assumptions involve the use of judgment, our actual financial results may differ from these estimates.
Our strategy of outsourcing certain functions and operations may fail to reduce our costs for these services and may increase our risks.
We have an outsourcing contract with HP Enterprise Systems (HP and formerly Electronic Data Systems) to provide warehousing, distribution, and information system operations. Under the terms of the outsourcing contract and its addendums, HP provides warehousing and distribution services and supports our various information systems. Due to the nature of our outsourced operations, we are unable to exercise the same level of control over outsourced functions and the actions of HP employees in outsourced roles as our own employees. As a result, the inherent risks associated with these outsourced areas of operation may be increased.
Our outsourcing contracts with HP also contain early termination provisions that we may exercise under certain conditions. However, in order to exercise the early termination provisions, we would have to pay specified penalties to HP depending upon the circumstances of the contract termination.
We have significant intangible asset, goodwill, and long-term asset balances that may be impaired if cash flows from related activities decline.
At August 31, 2012 we had $59.2 million of intangible assets, which were primarily generated from the fiscal 1997 merger with the Covey Leadership Center, and $9.2 million of goodwill, which was generated by the fiscal 2009 acquisition of CoveyLink Worldwide LLC and the payment of subsequent contingent earnout payments. Our intangible assets are evaluated for impairment based qualitative factors or upon cash flows (definite-lived intangible assets) and estimated royalties from revenue streams (indefinite-lived intangible assets) if necessary. Our goodwill is evaluated through qualitative factors and by comparing the fair value of the reporting unit to the carrying value of the goodwill balance if necessary. Our intangible assets, goodwill, and other long-term assets may become impaired if the corresponding cash flows associated with these assets declines in future periods or if our market capitalization declines significantly in future periods. Although our current sales, cash flows, and market capitalization are sufficient to support the carrying basis of these long-lived assets, if our sales, cash flows, or common stock price decline, we may be faced with significant asset impairment charges that would have an adverse impact upon our results of operations.
Our business could be negatively affected if we incur legal liability in connection with providing our solutions and services.
If we fail to meet our contractual obligations, fail to disclose our financial or other arrangements with our business partners, or otherwise breach obligations to clients, we could be subject to legal liability. We may enter into non-standard agreements because we perceive an important economic opportunity or because our personnel did not adequately adhere to our guidelines. We may also find ourselves committed to providing services that we are unable to deliver or whose delivery will cause us financial loss. If we cannot, or do not, perform our obligations, we could face legal liability, and our contracts might not always protect us adequately through limitations on the scope of our potential liability. If we cannot meet our contractual obligations to provide services, and if our exposure is not adequately limited through the terms of our agreements, then we might face significant legal liability, and our business could be adversely affected.
Failure to comply with the terms and conditions of our credit facility may have an adverse effect upon our business and operations.
Our line of credit facility requires us to be in compliance with customary non-financial terms and conditions as well as specified financial ratios. Failure to comply with these terms and conditions or maintain adequate financial performance to comply with specific financial ratios entitles the lender to certain remedies, including the right to immediately call due any amounts outstanding on the line of credit or term loan. Such events would have an adverse effect upon our business and operations as there can be no assurance that we may be able to obtain other forms of financing or raise additional capital on terms that would be acceptable to us.
We may have exposure to additional tax liabilities.
As a multinational company, we are subject to income taxes as well as non-income based taxes in both the United States and various foreign tax jurisdictions. Significant judgment is required in determining our worldwide provision for income taxes and other tax liabilities. In the normal course of a global business, there are many intercompany transactions and calculations where the ultimate tax determination is uncertain. As a result, we are routinely subject to audits by various taxing authorities. Although we believe that our tax estimates
are reasonable, we cannot guarantee that the final determination of these tax audits will not be different from what is reflected in our historical income tax provisions and accruals.
We are also subject to non-income taxes such as payroll, sales, use, value-added, and property taxes in both the United States and various foreign jurisdictions. We are routinely audited by tax authorities with respect to these non-income taxes and may have exposure from additional non-income tax liabilities.
International hostilities, terrorist activities, and natural disasters may prevent us from effectively serving our clients and thus adversely affect our operating results.
Acts of terrorist violence, armed regional and international hostilities, and international responses to these hostilities, natural disasters, global health risks or pandemics, or the threat of or perceived potential for these events, could have a negative impact on our directly owned or licensee operations. These events could adversely affect our clients’ levels of business activity and precipitate sudden significant changes in regional and global economic conditions and cycles. These events also pose significant risks to our people and to physical facilities and operations around the world, whether the facilities are ours or those of our alliance partners or clients. By disrupting communications and travel and increasing the difficulty of obtaining and retaining highly skilled and qualified personnel, these events could make it difficult or impossible for us or our licensee partners to deliver services to clients. Extended disruptions of electricity, other public utilities, or network services at our facilities, as well as system failures at, or security breaches in, our facilities or systems, could also adversely affect our ability to serve our clients. While we plan and prepare to defend against each of these occurrences, we might be unable to protect our people, facilities, and systems against all such occurrences. We generally do not have insurance for losses and interruptions caused by terrorist attacks, conflicts, and wars. If these disruptions prevent us from effectively serving our clients, our operating results could be adversely affected.
Ineffective internal controls could impact our business and operating results.
Our internal control over financial reporting may not prevent or detect misstatements because of its inherent limitations, including the possibility of human error, the circumvention or overriding of controls, or fraud. Even effective internal controls can provide only reasonable assurance with respect to the preparation and fair presentation of financial statements. If we fail to maintain the adequacy of our internal controls, including any failure to implement required new or improved controls, or if we experience difficulties in their implementation, our business and operating results may be harmed and we could fail to meet our financial reporting obligations.
New or more stringent governmental regulations could adversely affect our business.
Increased government regulations to limit carbon dioxide and other greenhouse gas emissions as a result of concern over climate change may result in increased compliance costs and other financial obligations for us. We rely on the ability of our consultants and salespeople to travel to client destinations using automobiles and jet aircraft, which use fossil fuels. Legislation, regulation, or additional taxes affecting the cost of these inputs could adversely affect our profitability.
None.
Our principal executive offices are located in Salt Lake City, Utah and as of August 31, 2012, all of the facilities used in our operations are leased. Our leased facilities primarily consist of sales and administrative offices both in the United States and various countries around the world. We also lease warehouse and distribution space at independent facilities in certain foreign countries. Our corporate headquarters lease is accounted for as a financing arrangement and all other facility lease agreements are accounted for as operating leases that expire at various dates through the year 2025.
Corporate Facilities
Corporate Headquarters and Administrative Offices:
Salt Lake City, Utah (7 buildings)
U.S./Canada Sales Offices
Regional Sales Offices:
United States (4 locations)
Administrative Offices:
United States (2 locations)
International Facilities
International Administrative/Sales Offices:
Australia (3 locations)
England (1 location)
Japan (1 location)
International Distribution Facilities:
Australia (1 location)
England (1 location)
Japan (1 location)
During fiscal 2012, there were no significant changes to the properties used for our operations. We consider our existing facilities to be in good condition and suitable for our current and anticipated level of operations in the upcoming fiscal year and in future periods.
A significant portion of our corporate headquarters campus located in Salt Lake City, Utah is subleased to multiple unrelated entities.
On April 20, 2010, Moore Wallace North America, Inc. doing business as TOPS filed a complaint against FC Organizational Products, LLC (FCOP) in the Circuit Court of Cook County, Illinois, for breach of contract. The complaint also named us as a defendant and alleged that we should be liable for FCOP’s debts under the doctrine of alter ego or fraudulent transfer. On December 23, 2011, Moore Wallace North America, Inc., FCOP, and the Company entered into a settlement agreement and mutual release. Under the terms of this agreement, FCOP paid Moore Wallace North America, Inc. a specified sum to settle the complaint and reimbursed us for legal fees incurred in defense of the allegations.
The Company is also the subject of certain other legal actions, which we consider routine to our business activities. At August 31, 2012, we believe that, after consultation with legal counsel, any potential liability to the Company under these other actions will not materially affect our financial position, liquidity, or results of operations.
Not applicable.
|
ITE
M 5.
|
MARKET FOR REGISTRANT’S COMMON EQUITY, RELATED STOCKHOLDER MATTERS AND ISSUER PURCHASES OF EQUITY SECURITIES
|
Our common stock is listed and traded on the New York Stock Exchange (NYSE) under the symbol “FC.” The following table sets forth the high and low sale prices per share for our common stock, as reported by the NYSE, for the fiscal years ended August 31, 2012 and 2011.
|
High
|
Low
|
|||||||
|
Fiscal Year Ended August 31, 2012:
|
||||||||
|
Fourth Quarter
|
$ | 10.79 | $ | 8.92 | ||||
|
Third Quarter
|
9.85 | 8.07 | ||||||
|
Second Quarter
|
9.97 | 8.02 | ||||||
|
First Quarter
|
10.00 | 6.25 | ||||||
|
Fiscal Year Ended August 31, 2011:
|
||||||||
|
Fourth Quarter
|
$ | 12.15 | $ | 7.56 | ||||
|
Third Quarter
|
9.50 | 6.91 | ||||||
|
Second Quarter
|
9.55 | 7.26 | ||||||
|
First Quarter
|
9.30 | 6.06 | ||||||
We did not pay or declare dividends on our common stock during the fiscal years ended August 31, 2012 or 2011. We currently anticipate that we will retain all available funds to repay our loan obligations, finance future growth and business opportunities, and to purchase outstanding shares of our common stock.
As of October 31, 2012, the Company had 18,071,010 shares of common stock outstanding, which were held by 697 shareholders of record.
Purchases of Common Stock
The following table summarizes the purchases of our common stock during the fiscal quarter ended August 31, 2012:
|
Period
|
Total Number of Shares Purchased
|
Average Price Paid Per Share
|
Total Number of Shares Purchased as Part of Publicly Announced Plans or Programs
|
Maximum Dollar Value of Shares That May Yet Be Purchased Under the Plans or Programs
(in thousands)
|
||||||||||||
|
May 27, 2012 to June 30, 2012
|
- | $ | - |
none
|
$ | 10,000 | ||||||||||
|
July 1, 2012 to July 28, 2012
|
23,754 | 9.50 | 13,002 | 9,876 | ||||||||||||
|
July 29, 2012 to August 31, 2012
|
48,394 | 10.46 | 28,083 | 9,582 | (1) | |||||||||||
|
Total Common Shares
|
72,148 | (2) | $ | 10.14 | 41,085 | |||||||||||
|
(1)
|
During the quarter ended May 26, 2012, our Board of Directors approved a plan to purchase up to $10.0 million of the Company’s outstanding common stock. We intend to use available cash in excess of $10.0 million to make the purchases. All previously existing common stock repurchase plans were canceled and the new common share repurchase plan does not have an expiration date. Following the approval of this common stock purchase plan, we have purchased a total of 41,085 shares of our common stock for $0.4 million through August 31, 2012.
|
|
(2)
|
Total includes 31,063 shares acquired from management stock loan participants who declared bankruptcy and the shares were released to the Company from the bankruptcy court. The shares were valued at the closing price of the Company’s common shares on the date received and do not count against the $10.0 million plan authorized in fiscal 2012 described above.
|
Performance Graph
The following graph shows a comparison of cumulative total shareholder return indexed to August 31, 2007, calculated on a dividend reinvested basis, for the five fiscal years ended August 31, 2012 for Franklin Covey Co. common stock, the S&P SmallCap 600 Index, and the S&P Commercial & Professional Services Index. We were previously included in the S&P 600 SmallCap Index and were assigned to the S&P Diversified Commercial and Professional Services Index within the S&P 600 SmallCap Index. However, during fiscal 2009, the Diversified Commercial Services Index was discontinued, and we have determined that the S&P 600 Commercial & Professional Services Index is appropriate for comparative purposes. We are no longer a part of the S&P 600 SmallCap Index, but we believe that the S&P 600 SmallCap Index and the Commercial and Professional Services Index continue to provide appropriate benchmarks with which to compare our stock performance.
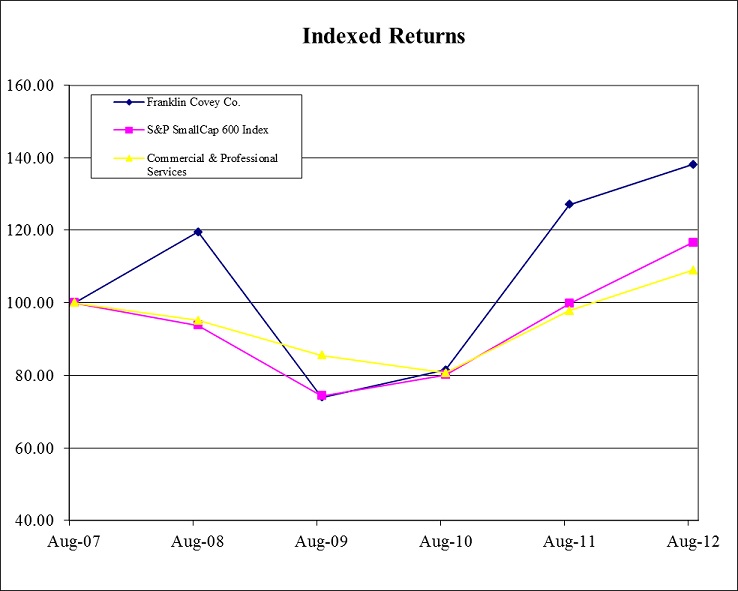
The selected consolidated financial data presented below should be read in conjunction with our consolidated financial statements and related footnotes as found in Item 8 of this report on Form 10-K.
In the fourth quarter of fiscal 2010, we sold the product sales component of our wholly owned subsidiary in Japan to an unrelated Japan-based paper products company. We determined that the operating results of the Japan product sales component qualified for discontinued operations presentation and we have presented the operating results of the Japan product sales component as discontinued operations for all periods prior to fiscal 2011 that are presented in this report and have adjusted the financial statement information presented below to be consistent with the discontinued operations presentation.
During fiscal 2008, we sold substantially all of the assets of our CSBU, which was primarily responsible for the sale of our products to consumers, to FC Organizational Products, LLC (formerly Franklin Covey Products). Based upon applicable accounting guidance, the operations of the CSBU did not qualify for discontinued operations presentation, and therefore, no prior periods were adjusted to reflect the sale of the CSBU assets.
|
August 31,
|
2012
|
2011
|
2010
|
2009
|
2008
|
|||||||||||||||
|
In thousands, except per share data
|
||||||||||||||||||||
|
Income Statement Data:
|
||||||||||||||||||||
|
Net sales
|
$ | 170,456 | $ | 160,804 | $ | 136,874 | $ | 123,134 | $ | 252,074 | ||||||||||
|
Income (loss) from operations
|
17,580 | 11,112 | 4,038 | (11,840 | ) | 14,204 | ||||||||||||||
|
Net income (loss) from continuing operations before income taxes
|
13,747 | 8,446 | 1,180 | (14,862 | ) | 11,278 | ||||||||||||||
|
Income tax benefit (provision)
|
(5,906 | ) | (3,639 | ) | (2,484 | ) | 3,814 | (6,738 | ) | |||||||||||
|
Income (loss) from continuing operations
|
7,841 | 4,807 | (1,304 | ) | (11,048 | ) | 4,540 | |||||||||||||
|
Income from discontinued operations, net of tax
|
- | - | 548 | 216 | 987 | |||||||||||||||
|
Gain on sale of discontinued operations, net of tax
|
- | - | 238 | - | - | |||||||||||||||
|
Net income (loss)
|
7,841 | 4,807 | (518 | ) | (10,832 | ) | 5,527 | |||||||||||||
|
Earnings (loss) per share:
|
||||||||||||||||||||
|
Basic
|
$ | .44 | $ | .28 | $ | (.04 | ) | $ | (.81 | ) | $ | .28 | ||||||||
|
Diluted
|
.43 | .27 | (.04 | ) | (.81 | ) | .28 | |||||||||||||
|
Balance Sheet Data:
|
||||||||||||||||||||
|
Total current assets
|
$ | 64,195 | $ | 52,056 | $ | 50,278 | $ | 40,142 | $ | 66,661 | ||||||||||
|
Other long-term assets
|
9,534 | 9,353 | 9,396 | 11,608 | 11,768 | |||||||||||||||
|
Total assets
|
164,080 | 151,427 | 149,005 | 143,878 | 177,677 | |||||||||||||||
|
Long-term obligations
|
40,368 | 39,859 | 32,988 | 32,191 | 38,762 | |||||||||||||||
|
Total liabilities
|
73,525 | 72,111 | 77,970 | 74,874 | 99,500 | |||||||||||||||
|
Shareholders’ equity
|
90,555 | 79,316 | 71,035 | 69,004 | 78,177 | |||||||||||||||
The following management’s discussion and analysis is intended to provide a summary of the principal factors affecting the results of operations, liquidity and capital resources, contractual obligations, and the critical accounting policies of Franklin Covey Co. (also referred to as the Company, we, us, our, and Franklin Covey) and subsidiaries. This discussion and analysis should be read together with our consolidated financial statements and related notes, which contain additional information regarding the accounting policies and estimates underlying our financial statements. Our consolidated financial statements and related notes are presented in Item 8 of this report on Form 10-K.
EXECUTIVE SUMMARY
Franklin Covey Co. is a global content and intellectual property company focused on individual and organizational performance. Our mission is to “enable greatness in people and organizations everywhere,” and we believe that we are experts at solving seven pervasive, intractable problems, each of which requires a change in human behavior. Our approximately 630 employees worldwide are organized to address these seven problems, which include the following: Leadership, Execution, Productivity, Trust, Loyalty, Sales Performance, and Education. As we deliver our solutions to these problems, we believe there are four important characteristics that distinguish us from our competitors.
|
1.
|
World Class Content
– Our content is principle centered and based on natural laws of human behavior and effectiveness. Our content is designed to build new skillsets, establish new mindsets, and provide enabling toolsets.
|
|
2.
|
Breadth and Scalability of Delivery Options
– We have a wide range of content delivery options, including: on-site training, training led through certified facilitators, on-line learning, blended learning, intellectual property licenses, and organization-wide transformational processes, including consulting and coaching.
|
|
3.
|
Global Capability
– We operate four regional sales offices in the United States; wholly owned subsidiaries in Australia, Japan, and the United Kingdom; and contract with licensee partners who deliver our curriculum and provide services in over 140 other countries and territories around the world.
|
|
4.
|
Transformational Impact and Reach
– We hold ourselves responsible for and measure ourselves by our clients’ achievement of transformational results.
|
Our offerings are described in further detail at
www.franklincovey.com
. The information contained in, or that can be accessed through, our website does not constitute a part of this annual report. These descriptions should not be viewed as a warranty or guarantee of results. We have some of the best-known offerings in the training industry, including a suite of individual-effectiveness and leadership-development training products based on the best-selling book,
The 7 Habits of Highly Effective People
and its execution process,
The 4 Disciplines of Execution
.
Our results for the fiscal year ended August 31, 2012 reflect continued momentum in the marketplace as we experienced improved operating results and strengthened our liquidity position during the fiscal year. Our sales increased to $170.5 million compared with $160.8 million in fiscal 2011 and $136.9 million in fiscal 2010. Our fiscal 2012 sales represent 6 percent growth compared with fiscal 2011 and 25 percent growth compared with fiscal 2010. Fiscal 2012 fourth quarter sales were $51.0 million, which represents the strongest quarterly sales performance ever under our current business model. Sales growth was generally broad based across our primary delivery channels and course offerings during the year. The following table sets forth sales data from our continuing operations by category and by our primary delivery channels (in thousands):
|
YEAR ENDED
AUGUST 31,
|
2012
|
Percent change
|
2011
|
Percent change
|
2010
|
|||||||||||||||
|
Sales by Category:
|
||||||||||||||||||||
|
Training and consulting services
|
$ | 158,779 | 5 | $ | 150,976 | 17 | $ | 129,462 | ||||||||||||
|
Products
|
8,456 | 13 | 7,455 | 76 | 4,226 | |||||||||||||||
|
Leasing
|
3,221 | 36 | 2,373 | (26 | ) | 3,186 | ||||||||||||||
| $ | 170,456 | 6 | $ | 160,804 | 17 | $ | 136,874 | |||||||||||||
|
Sales by Channel:
|
||||||||||||||||||||
|
U.S./Canada direct
|
$ | 86,698 | 2 | $ | 85,397 | 24 | $ | 68,695 | ||||||||||||
|
International direct
|
28,773 | 5 | 27,464 | 13 | 24,228 | |||||||||||||||
|
International licensees
|
14,301 | 14 | 12,590 | 14 | 11,092 | |||||||||||||||
|
National account practices
|
27,367 | 20 | 22,780 | 17 | 19,447 | |||||||||||||||
|
Self-funded marketing
|
8,368 | (7 | ) | 9,013 | 12 | 8,075 | ||||||||||||||
|
Other
|
4,949 | 39 | 3,560 | (33 | ) | 5,337 | ||||||||||||||
| $ | 170,456 | 6 | $ | 160,804 | 17 | $ | 136,874 | |||||||||||||
Nearly all of our major practices and content groups had increased sales and we believe that our ongoing investments in curriculum development and increasing the size of our sales force will help us maintain this favorable sales growth momentum.
Our gross profit for fiscal 2012 increased to $112.7 million compared with $103.5 million in fiscal 2011 primarily due to increased sales. Our gross margin, which is gross profit as a percent of sales, increased to 66.1 percent compared with 64.3 percent in fiscal 2011 primarily due to increased international licensee royalty revenues and increased facilitator sales.
Our operating expenses increased $2.7 million primarily due to a $4.2 million increase in selling, general, and administrative expenses that was partially offset by a $0.4 million decrease in depreciation expense and a $1.0 million decrease in amortization expense.
Increased sales and improved operating margins combined to increase our income from operations to $17.6 million compared with $11.1 million in fiscal 2011. Our net income increased 63 percent to $7.8 million ($.43 per diluted share) in fiscal 2012 compared with $4.8 million ($.27 per diluted share) in the prior year.
Further details regarding these items can be found in the comparative analysis of fiscal 2012 to fiscal 2011 as discussed within this management’s discussion and analysis.
Our liquidity position strengthened significantly during fiscal 2012 and we had $11.0 million of cash and cash equivalents at August 31, 2012 compared with $3.0 million at August 31, 2011. Our working capital (current assets minus current liabilities) increased to $27.5 million at August 31, 2012 compared with
$16.7 million at the end of fiscal 2011. For further information regarding our cash flows and liquidity refer to the Liquidity and Capital Resources discussion found later in this management’s discussion and analysis.
Business Overview
We believe that our internal, or organic, growth and continued innovation with respect to our content and curriculums are the foundation of our long-term strategic growth plan. Each year we invest significantly in the development and enhancement of our existing content and to develop new services, features, and products. We expect to continue the introduction of new or refreshed content and delivery methods and consider them key to our long-term success.
Other key factors that influence our operating results include the number of organizations that are active customers; the number of people trained within those organizations; the continuation or renewal of
existing services contracts; the availability of budgeted training spending at our clients and prospective clients, which is significantly influenced by general economic conditions; and our ability to manage operating costs necessary to develop and provide meaningful training and related products and services to our clients. For a further discussion of risk factors that may influence our results of operations and financial position, refer to Item 1A - Business Risks as contained in this report on Form 10-K.
Our fiscal year ends on August 31, and unless otherwise indicated, fiscal 2012, fiscal 2011, and fiscal 2010 refer to the twelve-month periods ended August 31, 2012, 2011, and 2010 and so forth.
RESULTS OF OPERATIONS
The following table sets forth, for the fiscal years indicated, the percentage of total sales represented by the line items through income from continuing operations before income taxes in our consolidated statements of operations. This table should be read in conjunction with the following discussion and analysis and the consolidated financial statements, including the related notes to the consolidated financial statements:
|
YEAR ENDED
AUGUST 31,
|
2012
|
2011
|
2010
|
|||||||||
|
Sales:
|
||||||||||||
|
Training and consulting services
|
93.1 | % | 93.9 | % | 94.6 | % | ||||||
|
Products
|
5.0 | 4.6 | 3.1 | |||||||||
|
Leasing
|
1.9 | 1.5 | 2.3 | |||||||||
|
Total sales
|
100.0 | 100.0 | 100.0 | |||||||||
|
Cost of sales:
|
||||||||||||
|
Training and consulting services
|
30.6 | 32.3 | 32.1 | |||||||||
|
Products
|
2.3 | 2.3 | 1.6 | |||||||||
|
Leasing
|
1.0 | 1.1 | 1.2 | |||||||||
|
Total cost of sales
|
33.9 | 35.7 | 34.9 | |||||||||
|
Gross profit
|
66.1 | 64.3 | 65.1 | |||||||||
|
Selling, general, and administrative
|
52.5 | 53.0 | 56.7 | |||||||||
|
Depreciation
|
1.8 | 2.2 | 2.7 | |||||||||
|
Amortization
|
1.5 | 2.2 | 2.7 | |||||||||
|
Total operating expenses
|
55.8 | 57.4 | 62.1 | |||||||||
|
Income from operations
|
10.3 | 6.9 | 3.0 | |||||||||
|
Interest income
|
0.0 | 0.0 | 0.0 | |||||||||
|
Interest expense
|
(1.4 | ) | (1.6 | ) | (2.1 | ) | ||||||
|
Discount on related party receivable
|
(0.8 | ) | - | - | ||||||||
|
Income from continuing operations before income taxes
|
8.1 | % | 5.3 | % | 0.9 | % | ||||||
FISCAL 2012 COMPARED TO FISCAL 2011
Sales
We offer a variety of training courses, consulting services, and training-related products that are focused on leadership, execution, productivity, trust, loyalty, sales performance, and education that are provided both domestically and internationally through our sales force, certified client facilitators, international licensee partners, or through the Internet in on-line presentations. For the fiscal year ended August 31, 2012, our consolidated sales increased by $9.7 million to $170.5 million. The following sales analysis for the fiscal year ended August 31, 2012 is based on activity through our primary sales channels:
U.S./Canada Direct
– This channel includes our four regional field offices that serve clients in the United States and Canada and our government services group. During fiscal 2012, sales through our four regional offices increased by $4.7 million, or 8 percent, compared to the prior year. We believe that our strategy of additional sales personnel, increased events, and focus on our practice groups were key drivers of increased sales at our regional sales offices during the year. Partially offsetting increased regional office sales were expected reductions from contracts with a governmental agency that included more revenue in the initial phases (which occurred primarily in fiscal 2011) of the contracts than in subsequent periods. As a result, sales through our government services group decreased $3.4 million compared with fiscal 2011. However, during the third quarter of fiscal 2012 we won a renewal of these contracts with the governmental agency and we expect to continue to deliver training and consulting services throughout the life of these contracts, which includes the first three quarters of fiscal 2013, at similar levels to those delivered in the corresponding periods of fiscal 2012. We believe that we will be successful in renewing these contracts in fiscal 2013, but we cannot guarantee a successful outcome as many of the aspects of renewal are out of our control. Our sales through the U.S./Canada direct channel in future periods will be sensitive to general economic conditions and renewal of the existing contracts, such as the government services contracts described above. However, we remain optimistic about future growth and looking forward, our pipeline of booked days and awarded revenue continues to be strong and at August 31, 2012 exceeded the prior year.
Subsequent to August 31, 2012 the northeastern region of the United States suffered significant infrastructure damage from Hurricane Sandy and other storms that followed. As a result of these storms, many of our clients were unable to operate their businesses for a period of time. Although we expect our clients to reschedule postponed programs in future periods, we anticipate that storm related cancelations may adversely impact our first quarter sales in fiscal 2013 by approximately $0.3 million to $0.4 million.
International Direct –
Our three international offices are located in Australia, Japan, and the United Kingdom. The improvement in international direct sales was primarily due to increased sales in Japan, which increased $2.2 million compared with fiscal 2011. The sales growth in Japan was primarily due to the recovery of the Japanese economy from the effects of the devastating earthquake and tsunami that struck northern Japan during March 2011. Sales were also up $0.2 million at our office in the United Kingdom during fiscal 2012. However, these increases were partially offset by a $1.1 million decrease in sales at our office in Australia, which were primarily attributable to sales force performance issues that we have addressed and we expect improvement in Australia in future periods. During fiscal 2012, the translation sales from foreign currencies to United States dollars had a $0.7 million favorable impact on our international office sales.
International Licensees –
In countries or foreign locations where we do not have an office, our training and consulting services are delivered through independent licensees, which may translate and adapt our curriculums to local preferences and customs, if necessary. Our licensee sales increased $1.7 million compared with the prior year as many of our licensees reported strengthening sales in their countries during the year, which resulted in increased royalties. However, continued civil unrest and economic uncertainty in some of the countries where our licensees operate may have adverse effects on certain licensees’ performance in future periods.
National Account Practices –
Our national account practices are comprised of programs that are not typically offered in our regional field offices and include
The Leader In Me
curriculum designed for students from our education practice,
Helping Clients Succeed
from the sales performance group, and
Winning Customer Loyalty
from our customer loyalty practice. During fiscal 2012, our national account practice sales increased due to a $4.2 million increase in education practice sales resulting from a general increase in demand for these school-based services as
The Leader In Me
program continues to generate favorable results at schools in the United States and in other countries. Our sales performance practice also increased sales by $0.9 million over the prior year as this group obtained new contracts during the fiscal year. These increases were partially offset by a $0.5 million decrease in customer loyalty practice sales primarily resulting from the completion of a large contract in fiscal 2012.
Self-Funded Marketing –
This group includes our public programs, book and audio sales, and speeches through our speakers’ bureau. The decrease in sales was due to reduced public speaking revenues resulting primarily from the retirement of Dr. Stephen R. Covey from public speaking events in late fiscal 2011. Decreased speakers’ bureau sales were partially offset by a $0.5 million increase in book and audio product sales resulting primarily from the release of new publications during the year. We expect to continue to release new publications in future periods and believe that these new publications will continue to show strong performance in the marketplace.
Other –
Our other sales are comprised primarily of leasing sales and shipping and handling revenues. The increase in other sales was primarily due to improved leasing revenues resulting from new lease contracts at our corporate headquarters. We continue to have vacant space available for lease at our corporate headquarters campus and we are actively seeking new tenants for this available property.
Gross Profit
Gross profit consists of net sales less the cost of services provided or the cost of goods sold. Our cost of sales includes the direct costs of conducting seminars, including presenter costs, materials used in the production of training products and related accessories, assembly and manufacturing labor costs, freight, and certain other overhead costs. Gross profit may be affected by, among other things, the mix of training and consulting courses sold to clients, prices of materials, labor rates, changes in product discount levels, and freight costs.
Our consolidated gross profit for the fiscal year ended August 31, 2012 increased to $112.7 million compared with $103.5 million in the prior fiscal year. The increase was primarily due to significantly improved sales in fiscal 2012 over fiscal 2011. Our consolidated gross margin increased to 66.1 percent of sales in fiscal 2012 compared with 64.3 percent in the prior year. The improvement in gross margin was primarily due to increased international licensee royalty revenues, increased facilitator sales, and increased intellectual property license sales, all of which have higher gross margins than the majority of our other programs and services.
Operating Expenses
Selling, General and Administrative
–
Our selling, general, and administrative (SG&A) expenses in fiscal 2012 increased $4.2 million compared with fiscal 2011. However, as a percent of sales, SG&A expenses declined to 52.5 percent of sales compared to 53.0 percent in the prior year. The increase in SG&A expenses was primarily due to 1) a $3.2 million increase in associate costs resulting from increased sales commissions and bonuses resulting from improved sales and operating results, and the addition of new personnel; 2) a $2.4 million increase in advertising and promotional costs that were primarily related to the launch of our new productivity offering
The 5 Choices to Extraordinary Productivity
and the launch of new strategic marketing initiatives that we believe had a favorable impact on overall fiscal 2012 sales; and 3) a $1.0 million increase in non-cash share-based compensation costs, primarily resulting from performance awards granted in the fourth quarter of fiscal 2011. These increases were partially offset by 1) a $1.0 million decrease in rent and utilities expenses primarily the result of reduced rent expense at our Japan office and reduced telephone and communication expenses; 2) a $0.7 million decrease in legal expenses resulting primarily from the settlement of certain litigation and the reimbursement of previously expensed legal costs; 3) $0.4 million of decreased professional services costs compared to the prior year; and 4) a $0.2 million reduction in outsourced services charges resulting primarily from a reduction in outsourced information technology support costs.
Depreciation
–
Depreciation expense decreased by $0.4 million compared to fiscal 2011 primarily due to the full depreciation of certain capital assets during the latter half of fiscal 2012. Based upon anticipated capital asset acquisitions in fiscal 2013 and previous depreciation expense levels, we currently expect depreciation expense to decline compared with fiscal 2012 amounts and to total approximately $2.8 million during fiscal 2013.
Amortization –
Amortization expense from definite-lived intangible assets decreased $1.0 million due to the full amortization of certain intangible assets in late fiscal 2011. As a result, we currently expect that intangible asset amortization expense will remain consistent with fiscal 2012 levels and to total approximately $2.5 million in fiscal 2013.
Discount on Related Party Receivable
Due to the settlement of litigation during fiscal 2012, with a required settlement payment by FC Organizational Products (FCOP), the amount of cash we received from FCOP was reduced from previous forecasts and our receivable balance from FCOP increased during fiscal 2012. In the fourth quarter of fiscal 2012, we received revised information from FCOP regarding scheduled payments to us and we reclassified a portion of the FCOP receivable to long-term assets and recorded a discount charge of $1.4 million to reduce the long-term receivable to its estimated present value at August 31, 2012. We discounted the long-term portion of the receivable based on forecasted repayments at a discount rate of 15 percent, which was the estimated risk-adjusted borrowing rate of FCOP at August 31, 2012. This rate was based on a variety factors including, but not limited to, current market interest rates for various qualities of comparable debt, discussions with FCOP’s lenders, and an evaluation of the realizability FCOP’s future cash flows. Based on improved operating results at FCOP during calendar 2012 and their forecasted cash flows in future periods, we believe that we will collect amounts receivable from FCOP and the discount will be recovered as interest income in future periods. However, the failure of FCOP to pay us for these receivables may have an adverse impact on our liquidity, financial position, and cash flows in future periods.
Income Taxes
Our effective tax rate for fiscal 2012 was 43 percent and remained consistent with fiscal 2011. Our effective income tax rate was higher than statutory combined rates primarily due to taxable interest income on outstanding management common stock loans and uncertain tax positions. These increases in our effective rate were partially offset by the benefit of foreign tax credits in excess of the tax on income taxed by both U.S. and foreign jurisdictions. The effective tax rate for fiscal 2012 and fiscal 2011 includes the benefit of foreign tax credits to be claimed on our U.S. federal income tax returns.
We anticipate that our cash paid for income taxes will remain significantly less than our income tax provision during the foreseeable future as we utilize domestic net operating loss carryforwards and other deferred income tax assets. For instance, during fiscal 2012 we paid $2.3 million of cash for income taxes. After our domestic net operating loss carryforwards are utilized, we will be able to utilize our foreign tax credits, which will reduce our income tax liability in future periods. After utilization of these deferred tax assets, we expect our cash paid for income taxes to increase and match more closely a normalized provision for income taxes.
FISCAL 2011 COMPARED TO FISCAL 2010
Sales
The following analysis of our sales performance for the fiscal year ended August 31, 2011 is based on activity through our primary delivery channels as defined above.
U.S./Canada Direct
– During fiscal 2011 we had increased sales at all of our offices in this channel, including our government services group. Sales through our regional sales offices increased by $8.4 million compared with fiscal 2010. These sales increases were broad based across nearly all of our practices and training programs offered. Sales through our government services group increased $8.3 million primarily due to contracts with a division of the federal government obtained during the third and fourth quarters of fiscal 2010. We recognized $16.8 million from these government services contracts during fiscal 2011, which is more than ten percent of our consolidated revenues for the year.
International Direct –
The improvement in international direct sales was primarily due to increased sales in Japan, which increased $3.3 million (on a continuing operations basis) compared to fiscal 2010. Despite the effects of the devastating earthquake and tsunami that struck northern Japan during March 2011 and caused our office to be closed for two weeks, we were able to recognize improved sales primarily due to increased publishing sales and the favorable impact of translating Yen-denominated sales to U.S. dollars. Although the natural disaster produced increased cancelations during the fiscal year, training and consulting sales remained flat compared to the prior year. Sales were also up $0.5 million at our office in Australia, and decreased by $0.6 million at our office in the United Kingdom.
International Licensees –
During fiscal 2011, the majority of our larger foreign licensees had increased sales compared to the prior year, which resulted in a $1.4 million increase in licensee royalty revenues.
National Account Practices –
During 2011, we had increased sales in each of the national account practices, which was led by a $1.6 million increase from our education practice.
Self-Funded Marketing –
The increase in sales was primarily attributable to royalties related to new books. However, with the retirement of Dr. Stephen R. Covey from public speaking engagements during late fiscal 2011, overall speaking presentation revenues are expected to decline in future periods.
Other –
The decrease in other sales was primarily due to reduced leasing revenues as certain lease contracts at our corporate headquarters expired in prior periods.
Gross Profit
Our consolidated gross profit increased to $103.5 million in fiscal 2011 compared to $89.1 million in the prior fiscal year. This increase was due to significantly improved sales during fiscal 2011. Our consolidated gross margin was 64.3 percent of sales in fiscal 2011 compared to 65.1 percent in the prior year. The slight decrease in gross margin percentage was primarily due to margins on a government services contract sale that included intellectual property that occurred in the fourth quarter of fiscal 2010 that did not repeat in the current year, increased sales of training programs that have higher costs, and decreased facilitator sales. These factors were partially offset by increased international licensee royalty revenues in fiscal 2011.
Operating Expenses
Selling, General and Administrative
–
Our SG&A expenses increased $7.7 million in fiscal 2011 compared with fiscal 2010. However, as a percent of sales, SG&A expenses declined to 53.0 percent compared to 56.7 percent of sales in the prior year. The increase in SG&A expenses was primarily due to 1) a $2.4 million increase in commissions and bonuses resulting from improved sales and financial results compared to the prior year; 2) a $2.3 million increase in salaries and related costs resulting primarily from the addition of new personnel; 3) a $1.7 million increase in share-based compensation costs primarily from awards granted during the fourth quarter of fiscal 2011; 4) a $0.9 million increase in conference costs from our sales and delivery conference, which has been previously held on a smaller scale; 5) a $0.8 million increase in travel expenses; and a 6) $0.3 million increase in research and development costs related to the maintenance and development of training programs and curriculum. These increases were partially offset by reductions in costs resulting from the prior year reimbursement of airfare costs previously paid by our CEO for business travel pursuant to a change in policy approved by the Board of Directors, and bonuses for the income tax consequences resulting from the forgiveness of certain management stock loans. These costs, which totaled $1.0 million, did not repeat during fiscal 2011.
Amortization –
Amortization expense from definite-lived intangible assets decreased $0.2 million due to the full amortization of certain intangible assets in the fourth quarter of fiscal 2011.
Income Taxes
Our effective tax rate for fiscal 2011 of approximately 43 percent was somewhat higher than statutory combined rates primarily due to taxable interest income on outstanding management common stock loans and the effects of uncertain tax positions. These increases in our effective rate were partially offset by the benefit of foreign tax credits in excess of the tax on income taxed both by U.S. and foreign jurisdictions.
We paid significant amounts of withholding tax on foreign royalties during fiscal 2011 and fiscal 2010. We also recognized taxable income on repatriated earnings from foreign income that are taxed in both foreign and domestic jurisdictions. During fiscal 2011, we concluded that domestic foreign tax credits will be available to offset our fiscal 2011 foreign withholding taxes and taxes on foreign dividends. However, for fiscal 2010 we concluded that domestic foreign tax credits were not available to offset such taxes.
SEGMENT REVIEW
Our sales are primarily comprised of training and consulting sales and related products. Based on the consistent nature of our services and products and the types of customers for these services, we function as a single operating segment. However, to improve comparability with previous periods, operating information for our U.S./Canada, international, and corporate services operations is presented below. Our U.S./Canada operations are responsible for the sale and delivery of our training and consulting services in the United States and Canada. Our international sales group includes the financial results of our foreign offices and royalty revenues from licensees. Our corporate services information includes leasing income and certain corporate operating expenses.
The following table sets forth sales data by these operations for the periods indicated. For further information regarding our reporting segments and geographic information, refer to Note 17 to our consolidated financial statements as found in Item 8 of this report on Form 10-K (in thousands).
|
YEAR ENDED
AUGUST 31,
|
2012
|
Percent change
|
2011
|
Percent change
|
2010
|
|||||||||||||
|
U.S./Canada
|
$ | 125,183 | 6 | $ | 118,420 | 20 | $ | 98,344 | ||||||||||
|
International
|
42,052 | 5 | 40,011 | 13 | 35,309 | |||||||||||||
|
Total
|
167,235 | 6 | 158,431 | 19 | 133,653 | |||||||||||||
|
Corporate and eliminations
|
3,221 | 36 | 2,373 | (26 | ) | 3,221 | ||||||||||||
|
Consolidated
|
$ | 170,456 | 6 | $ | 160,804 | 17 | $ | 136,874 | ||||||||||
QUARTERLY RESULTS
The following tables set forth selected unaudited quarterly consolidated financial data for the years ended August 31, 2012 and 2011. The quarterly consolidated financial data reflects, in the opinion of management, all adjustments necessary to fairly present the results of operations for such periods. We utilize a modified 52/53-week fiscal year that ends on August 31 of each year. Corresponding quarterly periods generally consist of 13-week periods during the fiscal year. Results of any one or more quarters are not necessarily indicative of continuing trends (in thousands, except for per-share amounts).
|
YEAR ENDED AUGUST 31, 2012 (unaudited)
|
||||||||||||||||
|
November 26
|
February 25
|
May 26
|
August 31
|
|||||||||||||
|
Net sales
|
$ | 39,540 | $ | 38,627 | $ | 41,274 | $ | 51,015 | ||||||||
|
Gross profit
|
26,542 | 24,981 | 26,144 | 35,016 | ||||||||||||
|
Selling, general, and administrative
|
21,373 | 20,714 | 21,448 | 25,927 | ||||||||||||
|
Depreciation
|
834 | 860 | 680 | 768 | ||||||||||||
|
Amortization
|
631 | 626 | 622 | 620 | ||||||||||||
|
Income from operations
|
3,704 | 2,781 | 3,394 | 7,701 | ||||||||||||
|
Discount on related party receivable
|
- | - | - | (1,369 | ) | |||||||||||
|
Income from operations before income taxes
|
3,074 | 2,159 | 2,783 | 5,732 | ||||||||||||
|
Net income
|
1,662 | 1,162 | 1,617 | 3,399 | ||||||||||||
|
Net income per share:
|
||||||||||||||||
|
Basic
|
$ | .09 | $ | .07 | $ | .09 | $ | .19 | ||||||||
|
Diluted
|
.09 | .06 | .09 | .18 | ||||||||||||
|
YEAR ENDED AUGUST 31, 2011 (unaudited)
|
||||||||||||||||
|
November 27
|
February 26
|
May 28
|
August 31
|
|||||||||||||
|
Net sales
|
$ | 39,416 | $ | 35,478 | $ | 40,897 | $ | 45,013 | ||||||||
|
Gross profit
|
25,076 | 23,111 | 25,781 | 29,506 | ||||||||||||
|
Selling, general, and administrative
|
19,789 | 19,915 | 21,009 | 24,542 | ||||||||||||
|
Depreciation
|
910 | 788 | 997 | 872 | ||||||||||||
|
Amortization
|
929 | 920 | 916 | 775 | ||||||||||||
|
Income from operations
|
3,448 | 1,488 | 2,859 | 3,317 | ||||||||||||
|
Income from operations before income taxes
|
2,741 | 852 | 2,195 | 2,658 | ||||||||||||
|
Net income
|
794 | 305 | 724 | 2,984 | ||||||||||||
|
Net income per share:
|
||||||||||||||||
|
Basic
|
$ | .05 | $ | .02 | $ | .04 | $ | .17 | ||||||||
|
Diluted
|
.05 | .02 | .04 | .16 | ||||||||||||
Training sales are moderately seasonal because of the timing of corporate training, which is not typically scheduled as heavily during holiday and certain vacation periods. Our fourth fiscal quarter generally has higher sales and income from operations than other fiscal quarters primarily due to increased facilitator sales that occur during that quarter. Quarterly fluctuations may also be affected by other factors including the introduction of new offerings, the addition of new organizational customers, and the elimination of underperforming offerings.
LIQUIDITY AND CAPITAL RESOURCES
Summary
During fiscal 2012 our liquidity position continued to strengthen and was favorably affected by improved income from operations and reduced cash used for investing and financing activities. At August 31, 2012 we had $11.0 million of cash and cash equivalents compared with $3.0 million at August 31, 2011 and our net working capital (current assets less current liabilities) increased significantly to $27.5 million compared with $16.7 million at August 31, 2011. Of our $11.0 million in cash and cash equivalents at August 31, 2012, $3.5 million was held at our foreign subsidiaries. We routinely repatriate cash from our foreign subsidiaries and consider foreign cash a key component of our overall liquidity position. Our primary sources of liquidity are cash flows from the sale of services in the normal course of business and proceeds from our available $10.0 million revolving line of credit. Our primary uses of liquidity include payments for operating activities, capital expenditures, working capital expansion, potential acquisition earn outs, and debt repayment.
On March 13, 2012, we entered into the First Modification Agreement to our previously existing amended and restated secured credit agreement (the Restated Credit Agreement) with our existing lender. The
primary purpose of the First Modification Agreement was to extend the maturity date of the Restated Credit Agreement, which originally expired on March 14, 2012.
On June 15, 2012, we entered into the Second Modification Agreement to the Restated Credit Agreement. The primary purpose of the Second Modification Agreement was to extend the maturity date of the credit facility from March 31, 2013 to March 31, 2015. We wanted to ensure the availability of our line of credit facility over the next three years so that we can use excess cash to pursue special initiatives, such as the potential repurchase of shares of our common stock, and for other growth opportunities.
The Second Modification Agreement continues to provide a revolving line of credit facility (the Revolving Loan) with a maximum borrowing amount of $10.0 million and with interest continuing at LIBOR plus 2.50 percent. The other terms and conditions in the Second Modification Agreement are substantially the same as those defined in the Restated Credit Agreement.
The Restated Credit Agreement also provided a term loan (the Term Loan) that allowed us to borrow $5.0 million for general business purposes. The amount borrowed on the Term Loan is being repaid in 24 equal monthly installments that commenced on October 1, 2011 and will conclude on September 1, 2013. The interest rate on the Term Loan is LIBOR plus 2.65% per annum.
At August 31, 2012, we had $2.7 million remaining on the Term Loan and a zero balance on our Revolving Loan. During the majority of fiscal 2012 we did not draw on our available Revolving Loan. At August 31, 2012, the effective interest rate on the Term Loan was 2.9 percent and the effective interest rate on our Revolving Loan was 2.7 percent.
The Second Modification Agreement requires us to be in compliance with specified financial covenants, including (a) a funded debt to EBITDAR (earnings before interest, taxes, depreciation, amortization, and rental expense) ratio of less than 3.00 to 1.00; (b) a fixed charge coverage ratio greater than 1.5 to 1.0; and (c) an annual limit on capital expenditures (not including capitalized curriculum development) of $8.0 million. The previously existing minimum net worth covenant was eliminated. In the event of noncompliance with the financial covenants and other defined events of default, the lender is entitled to certain remedies, including acceleration of the repayment of amounts outstanding on the Term Loan and the Revolving Loan. At August 31, 2012, we believe that we were in compliance with the terms and financial covenants applicable to the Restated Credit Agreement and its subsequent modifications. We expect to continue to be in compliance with our debt covenants in the foreseeable future.
In addition to our $10.0 million Revolving Loan and Term Loan obligation, we have a long-term lease on our corporate campus that expires in 2025 and is accounted for as a long-term financing obligation.
The following table summarizes our cash flows from operating, investing, and financing activities for the past three years (in thousands):
|
YEAR ENDED AUGUST 31,
|
2012
|
2011
|
2010
|
|||||||||
|
Total cash provided by (used for):
|
||||||||||||
|
Operating activities
|
$ | 15,562 | $ | 15,643 | $ | 7,024 | ||||||
|
Investing activities
|
(4,392 | ) | (10,834 | ) | (2,002 | ) | ||||||
|
Financing activities
|
(3,192 | ) | (5,095 | ) | (3,617 | ) | ||||||
|
Effect of exchange rates on cash
|
17 | (182 | ) | 391 | ||||||||
|
Increase (decrease) in cash and cash equivalents
|
$ | 7,995 | $ | (468 | ) | $ | 1,796 | |||||
Cash Flows from Operating Activities
Our cash provided by operating activities remained generally consistent with the prior year and totaled $15.6 million for the fiscal year ended August 31, 2012. The slight decrease was primarily due to the use
of cash to support working capital needs, including a significant increase in accounts receivable resulting from increased sales during August 2012. The use of cash for working capital needs was partially offset by improved operating results during fiscal 2012 compared with the prior year. Our primary source of cash from operating activities in fiscal 2012 was the sale of goods and services to our customers in the normal course of business. The primary uses of cash for operating activities were payments to suppliers for materials used in products sold, payments for direct costs necessary to conduct training programs, and payments for selling, general, and administrative expenses.
Cash Flows from Investing Activities and Capital Expenditures
Our business is not generally considered capital intensive and we do not own or operate any manufacturing facilities. Our uses of cash for investing activities include the purchases of computer hardware, software, and other equipment used in the normal course of business, curriculum development, and potential contingent earnout payments resulting from the acquisition of other business entities. During fiscal 2012 we used $4.4 million of net cash for investing activities. For the fiscal year ending August 31, 2012, we spent $2.3 million on property and equipment, which primarily consisted of computer hardware purchases, leasehold improvements primarily on office space at our corporate campus that we lease to other entities, and computer software purchases. During fiscal 2012 we spent $2.1 million on the development of new curriculums, including our new productivity course,
The 5 Choices to Extraordinary Productivity
, which was launched in the fall of 2011. We were not required to pay a contingent earnout payment in fiscal 2012 related to the acquisition of CoveyLink, but we may need to pay contingent earnout amounts in future periods based on the results of CoveyLink operations.
During fiscal 2013, we expect to spend approximately $2.2 million on purchases of property and equipment and $3.4 million on curriculum development activities. However, actual capital spending is based upon a variety of factors and may differ from these estimates.
Cash Flows from Financing Activities
Net cash used for financing activities during the fiscal year ended August 31, 2012 totaled $3.2 million. Our uses of cash for financing activities primarily consisted of $2.3 million used for payments on our Term Loan obligation, $0.9 million used for principal payments on our financing obligation, and $0.4 million used to purchase shares of our common stock on the open market. These uses of cash were partially offset by $0.4 million of cash received from participants in the employee stock purchase plan to purchase shares of our common stock.
During the third quarter of fiscal 2012 we announced the approval of a plan to repurchase up to $10.0 million of our common stock. We intend to use cash in excess of $10.0 million, provided we have no balance outstanding on our Revolving Loan, for the purchases. During fiscal 2012, we purchased a total of 41,085 shares of our common stock for $0.4 million under this plan. We anticipate that the purchases of our common stock under this approved plan will increase the use of cash for financing activities in future periods provided that we maintain adequate liquidity to allow for the purchases.
Sources of Liquidity
We expect to meet our projected capital expenditures, service our existing financing obligation and Term Loan, and meet other working capital requirements during fiscal 2013 through current cash balances and future cash flows from operating activities. Going forward, we will continue to incur costs necessary for the day-to-day operation and potential growth of the business and may use our available Revolving Loan and other financing alternatives, if necessary, for these expenditures. We extended the maturity date on our Revolving Loan during fiscal 2012 to March 2015 and expect to renew the Revolving Loan on an annual basis to maintain the three-year availability of this credit facility. Additional potential sources of liquidity available to us include factoring receivables, issuance of additional equity, or issuance of debt from public or private sources. If necessary, we will evaluate all of these options and select one or more of them depending on overall capital needs and the associated cost of capital.
Considering the foregoing, we anticipate that our existing capital resources should be adequate to enable us to maintain our operations for at least the upcoming twelve months. However, our ability to maintain adequate capital for our operations in the future is dependent upon a number of factors, including sales trends, macroeconomic activity, our ability to contain costs, levels of capital expenditures, collection of accounts receivable, and other factors. Some of the factors that influence our operations are not within our control, such as general economic conditions and the introduction of new curriculums and technology by our competitors. We will continue to monitor our liquidity position and may pursue additional financing alternatives, as described above, to maintain sufficient resources for future growth and capital requirements. However, there can be no assurance such financing alternatives will be available to us on acceptable terms, or at all.
Contractual Obligations
We have not structured any special purpose entities, or participated in any commodity trading activities, which would expose us to potential undisclosed liabilities or create adverse consequences to our liquidity. Required contractual payments primarily consist of lease payments resulting from the sale of our corporate campus (financing obligation); payments to HP Enterprise Services (HP) for outsourcing services related to information systems, warehousing, and distribution services; minimum operating lease payments primarily for domestic regional and foreign office space; the repayment of our Term Loan obligation, which matures in fiscal 2014; and short-term purchase obligations for inventory items and other products and services used in the ordinary course of business. Our expected payments on these obligations over the next five fiscal years and thereafter are as follows (in thousands):
|
Fiscal
|
Fiscal
|
Fiscal
|
Fiscal
|
Fiscal
|
||||||||||||||||||||||||
|
Contractual Obligations
|
2013
|
2014
|
2015
|
2016
|
2017
|
Thereafter
|
Total
|
|||||||||||||||||||||
|
Required lease payments on corporate campus
|
$ | 3,242 | $ | 3,307 | $ | 3,373 | $ | 3,440 | $ | 3,509 | $ | 29,909 | $ | 46,780 | ||||||||||||||
|
Minimum required payments to HP for outsourcing services
(1)
|
2,232 | 2,232 | 2,232 | 1,382 | - | - | 8,078 | |||||||||||||||||||||
|
Minimum operating lease payments
(2)
|
1,872 | 1,549 | 1,405 | 1,136 | 225 | 688 | 6,875 | |||||||||||||||||||||
|
Term loan
(3)
|
2,539 | 208 | - | - | - | - | 2,747 | |||||||||||||||||||||
|
Purchase obligations
|
4,221 | - | - | - | - | - | 4,221 | |||||||||||||||||||||
|
Total expected contractual
obligation payments
|
$ | 14,106 | $ | 7,296 | $ | 7,010 | $ | 5,958 | $ | 3,734 | $ | 30,597 | $ | 68,701 | ||||||||||||||
|
(1)
|
Our obligation for outsourcing services contains an annual escalation based upon changes in the Employment Cost Index, the impact of which was not estimated in the above table. We are also contractually allowed to collect amounts from FC Organizational Products, the impact of which would reduce the amounts shown in the table above.
|
|
(2)
|
The operating agreement with FC Organizational Products provides for reimbursement of a portion of the warehouse leasing costs, the impact of which would reduce the lease obligations disclosed in the table above.
|
|
(3)
|
Amount includes estimated interest at 2.9 percent, which was the effective rate on the Term Loan at August 31, 2012.
|
Our contractual obligations presented above exclude unrecognized tax benefits of $4.2 million for which we cannot make a reasonably reliable estimate of the amount and period of payment. For further information regarding our unrecognized tax benefits, refer to the notes to our consolidated financial statements as presented in Part II, Item 8 of this report on Form 10-K.
Other Items
FC Organizational Products is contractually obligated to pay us for rented warehouse and office space, a portion of the fixed costs for warehousing and distribution facilities, and is primarily liable for leasing costs at its retail stores. As of August 31, 2012 we remain secondarily liable for $0.3 million of retail store leasing costs, most of which will be paid by February 2013. In the event that FC Organizational Products is unable to pay these items, our liquidity, cash flows, and operating results may be adversely affected.
The Company is the creditor for a loan program that provided the capital to allow certain management personnel the opportunity to purchase shares of our common stock. For further information regarding our management common stock loan program, refer to the notes to our consolidated financial statements as found in Item 8 of this report on Form 10-K. The inability of the Company to collect all, or a portion, of these receivables could have an adverse impact upon our financial position and future cash flows compared to full collection of the loans.
USE OF ESTIMATES AND CRITICAL ACCOUNTING POLICIES
Our consolidated financial statements were prepared in accordance with accounting principles generally accepted in the United States of America. The significant accounting polices that we used to prepare our consolidated financial statements are primarily outlined in note 1 to the consolidated financial statements, which are presented in Part II, Item 8 of this Annual Report on Form 10-K. Some of those accounting policies require us to make assumptions and use judgments that may affect the amounts reported in our consolidated financial statements. Management regularly evaluates its estimates and assumptions and bases those estimates and assumptions on historical experience, factors that are believed to be reasonable under the circumstances, and requirements under accounting principles generally accepted in the United States of America. Actual results may differ from these estimates under different assumptions or conditions, including changes in economic and political conditions and other circumstances that are not in our control, but which may have an impact on these estimates and our actual financial results.
The following items require the most significant judgment and often involve complex estimates:
Revenue Recognition
We derive revenues primarily from the following sources:
|
·
|
Training and Consulting Services
– We provide training and consulting services to both organizations and individuals in leadership, productivity, strategic execution, goal alignment, sales force performance, and communication effectiveness skills.
|
|
·
|
Products
– We sell books, audio media, training accessories, and other related products.
|
We recognize revenue when: 1) persuasive evidence of an agreement exists, 2) delivery of product has occurred or services have been rendered, 3) the price to the customer is fixed or determinable, and 4) collectability is reasonably assured. For training and service sales, these conditions are generally met upon presentation of the training seminar or delivery of the consulting services. For product sales, these conditions are generally met upon shipment of the product to the customer.
Some of our training and consulting contracts contain multiple element deliverables that include training along with other products and services. For transactions that contain more than one element, we recognize revenue in accordance with the guidance for multiple element arrangements using the relative selling price method.
Our international strategy includes the use of licensees in countries where we do not have a wholly-owned operation. Licensee companies are unrelated entities that have been granted a license to translate our content and curriculum, adapt the content and curriculum to the local culture, and sell our training seminars and products in a specific country or region. Licensees are required to pay us royalties based upon a percentage of their sales to clients. We recognize royalty income each period based upon the sales information reported to us from our licensees. International royalty revenue is reported as a component of training and consulting service sales in our consolidated income statements.
Revenue is recognized as the net amount to be received after deducting estimated amounts for discounts and product returns.
Share-Based Compensation
Our shareholders have approved a performance based long-term incentive plan (LTIP) that provides for grants of share-based performance awards to certain managerial personnel and executive management as directed by the Compensation Committee of the Board of Directors. The number of common shares that are vested and issued to LTIP participants is variable and is based entirely upon the achievement of specified financial performance objectives during a defined performance period. Due to the variable number of common shares that may be issued under the LTIP, we reevaluate our LTIP grants on a quarterly basis and adjust the number of shares expected to be awarded based upon actual and estimated financial results of the Company compared to the performance goals set for the award. Adjustments to the number of shares awarded, and to the corresponding compensation expense, are made on a cumulative basis at the adjustment date based upon the estimated probable number of common shares to be awarded.
The analysis of our LTIP awards contains uncertainties because we are required to make assumptions and judgments about the eventual number of shares that will vest in each LTIP grant. The assumptions and judgments that are essential to the analysis include forecasted sales and operating income levels during the LTIP service periods. The evaluation of LTIP performance awards and the corresponding use of estimated amounts may produce additional volatility in our consolidated financial statements as we record cumulative adjustments to the estimated number of common shares to be awarded under the LTIP grants as described above.
During prior fiscal years we have also granted share-based compensation awards that have a share price, or market based, vesting conditions. As a result, we used a Monte Carlo simulation to determine the fair value and expected term of these awards. The Monte Carlo pricing models required the input of subjective assumptions, including items such as the expected term of the options. If factors change, and we use different assumptions for estimating share-based compensation expense related to future awards, our share-based compensation expense may differ materially from that recorded in the current period.
Accounts Receivable Valuation
Trade accounts receivable are recorded at the invoiced amount and do not bear interest. Our allowance for doubtful accounts calculations contain uncertainties because the calculations require us to make assumptions and judgments regarding the collectability of customer accounts, which may be influenced by a number of factors that are not within our control, such as the financial health of each customer. We regularly review the collectability assumptions of our allowance for doubtful accounts calculation and compare them against historical collections. Adjustments to the assumptions may either increase or decrease our total allowance for doubtful accounts. For example, a 10 percent increase to our allowance for doubtful accounts at August 31, 2012 would decrease our reported income from operations by approximately $0.1 million.
For further information regarding the calculation of our allowance for doubtful accounts, refer to the notes to our financial statements as presented in Item 8 of this report on Form 10-K.
Related Party Receivable
At August 31, 2012, we had receivables from FC Organizational Products, an entity in which we own 19.5 percent, for reimbursement of certain operating costs, such as warehousing and distribution costs, which are billed to us by third party providers, and for working capital and other advances that we made during fiscal 2012, even though we are not obligated to provide advances to, or fund the losses of FCOP. We make use of estimates to account for these receivables, including estimates of the collectability of amounts receivable from FCOP in future periods and, based upon revisions to the timing of estimated collections in fiscal 2012, we were required to classify a portion of the receivable from current to long-term at August 31, 2012. In accordance with applicable accounting guidance, we were required to discount the long-term portion of the receivables to its net present value using an estimated effective borrowing rate for FCOP.
We estimated the effective risk-adjusted borrowing rate to discount the long-term portion of the receivable at 15 percent, which was recorded as a discount on a related party receivable in our fiscal 2012 statement of operations. Our estimate of the effective borrowing rate required us to estimate a variety of factors, including the availability of debt financing for FCOP, projected borrowing rates for comparable debt, and the timing and realizability of projected cash flows from FCOP. These estimates were based on information known at the time of the preparation of these financial statements. A change in the assumptions and factors used, including estimated interest rates, may change the amount of discount taken. For instance, a one percent increase in the discount rate would have reduced our income before income taxes by $0.1 million in fiscal 2012.
Our assessments regarding the collectability of the FCOP receivable requires us to make assumptions and judgments regarding the financial health of FCOP and are dependent on projected financial information for FCOP in future periods. Such financial information contains inherent uncertainties, and is subject to factors that are not within our control. Failure to receive projected cash flows from FCOP in future periods may result in adverse consequences to our liquidity, financial position, and results of operations.
For further information regarding our investment in FCOP, refer to the notes to our financial statements as presented in Item 8 of this report on Form 10-K.
Inventory Valuation
Our inventories are primarily comprised of training materials and related accessories. Inventories are reduced to their fair market value through the use of inventory valuation reserves, which are recorded during the normal course of business. Our inventory valuation calculations contain uncertainties because the calculations require us to make assumptions and judgments regarding a number of factors, including future inventory demand requirements and pricing strategies. During the evaluation process we consider historical sales patterns and current sales trends, but these may not be indicative of future inventory losses. While we have not made material changes to our inventory valuation methodology during the past three years, our inventory requirements may change based on projected customer demand, technological and product life cycle changes, longer or shorter than expected usage periods, and other factors that could affect the valuation of our inventories. If our estimates regarding consumer demand and other factors are inaccurate, we may be exposed to losses that may have an adverse impact upon our financial position and results of operations. For example, a 10 percent increase to our inventory valuation reserves at August 31, 2012 would decrease our reported income from operations by $0.1 million.
Indefinite-Lived Intangible Assets and Goodwill
Intangible assets that are deemed to have an indefinite life and goodwill balances are not amortized, but rather are tested for impairment on an annual basis, or more often if events or circumstances indicate that a potential impairment exists. The Covey trade name intangible asset was generated by the merger with the Covey Leadership Center and has been deemed to have an indefinite life. This intangible asset is
quantitatively tested for impairment using the present value of estimated royalties on trade name related revenues, which consist primarily of training seminars and international licensee royalties. Our goodwill at August 31, 2012 was generated by the acquisition of CoveyLink Worldwide, LLC during fiscal 2009 and the subsequent payment of the first two of five possible contingent annual earnout payments as required in the acquisition agreement (due to operating results during the third annual earnout measurement period, no payment was required during fiscal 2012).
Our impairment evaluation calculations for goodwill and the Covey trade name contain uncertainties because they require us to make assumptions and apply judgment in order to qualitatively assess the fair value of these assets, and may require estimated future cash flows, an estimated appropriate royalty rate, and an estimated discount rate that reflects the inherent risk of future cash flows when these assets are evaluated on a quantitative basis. Our quantitative valuation methodology for the Covey trade name has remained unchanged during the past three years. However, if forecasts and assumptions used to support the carrying value of our indefinite-lived intangible asset change in future periods, significant impairment charges could result that would have an adverse effect upon our results of operations and financial condition. The valuation methodologies for both indefinite-lived intangible assets and goodwill are also dependent upon the share price of our common stock and our corresponding market capitalization, which may differ from estimated royalties used in our impairment testing. Based upon the fiscal 2012 evaluation of the Covey trade name and goodwill, our trade-name related revenues, licensee royalties, and overall sales levels would have to suffer significant reductions before we would be required to impair them. However, future declines in our share price may trigger additional impairment testing and may result in impairment charges.
Impairment of Long-Lived Assets
Long-lived tangible assets and definite-lived intangible assets are reviewed for possible impairment whenever events or changes in circumstances indicate that the carrying amount of such assets may not be recoverable. We use an estimate of undiscounted future net cash flows of the assets over their remaining useful lives in determining whether the carrying value of the assets is recoverable. If the carrying values of the assets exceed the anticipated future cash flows of the assets, we calculate an impairment loss. The impairment loss calculation compares the carrying value of the asset to the asset’s estimated fair value, which may be based upon discounted cash flows over the estimated remaining useful life of the asset. If we recognize an impairment loss, the adjusted carrying amount of the asset becomes its new cost basis, which is then depreciated or amortized over the remaining useful life of the asset. Impairment of long-lived assets is assessed at the lowest levels for which there are identifiable cash flows that are independent from other groups of assets.
Our impairment evaluation calculations contain uncertainties because they require us to make assumptions and apply judgment in order to estimate future cash flows, forecast the useful lives of the assets, and select a discount rate that reflects the risk inherent in future cash flows. Although we have not made any material recent changes to our long-lived assets impairment assessment methodology, if forecasts and assumptions used to support the carrying value of our long-lived tangible and definite-lived intangible assets change in the future, significant impairment charges could result that would adversely affect our results of operations and financial condition.
Income Taxes
We regularly evaluate our United States federal and various state and foreign jurisdiction income tax exposures. We account for certain aspects of our income tax provision using the provisions of FASC 740-10-05 (formerly FIN 48), which addresses the determination of whether tax benefits claimed or expected to be claimed on a tax return should be recorded in the financial statements. We may recognize the tax benefit from an uncertain tax position only if it is more likely than not that the tax position will be sustained upon examination by the taxing authorities, based on the technical merits of the position. The tax benefits recognized in the financial statements from such a position are measured based on the largest benefit that has a greater than 50 percent likelihood of being realized upon final settlement. The
provisions of FASC 740-10-05 also provide guidance on de-recognition, classification, interest, and penalties on income taxes, accounting for income taxes in interim periods, and require increased disclosure of various income tax items. Taxes and penalties are components of our overall income tax provision.
We record previously unrecognized tax benefits in the financial statements when it becomes more likely than not (greater than a 50 percent likelihood) that the tax position will be sustained. To assess the probability of sustaining a tax position, we consider all available evidence. In many instances, sufficient positive evidence may not be available until the expiration of the statute of limitations for audits by taxing jurisdictions, at which time the entire benefit will be recognized as a discrete item in the applicable period.
Our unrecognized tax benefits result from uncertain tax positions about which we are required to make assumptions and apply judgment to estimate the exposures associated with our various tax filing positions. The calculation of our income tax provision or benefit, as applicable, requires estimates of future taxable income or losses. During the course of the fiscal year, these estimates are compared to actual financial results and adjustments may be made to our tax provision or benefit to reflect these revised estimates. Our effective income tax rate is also affected by changes in tax law and the results of tax audits by various jurisdictions. Although we believe that our judgments and estimates discussed herein are reasonable, actual results could differ, and we could be exposed to losses or gains that could be material.
We establish valuation allowances for deferred tax assets when we estimate it is more likely than not that the tax assets will not be realized. The determination of whether valuation allowances are needed on our deferred income tax assets contains uncertainties because we must project future income, including the use of tax-planning strategies, by individual tax jurisdictions. Changes in industry and economic conditions and the competitive environment may impact the accuracy of our projections. We regularly assess the likelihood that our deferred tax assets will be realized and determine if adjustments to our valuation allowance are necessary.
REGULATORY COMPLIANCE
The Company is registered in states in which we do business that have a sales tax and collects and remits sales or use tax on sales made in these jurisdictions. Compliance with environmental laws and regulations has not had a material effect on our operations.
INFLATION AND CHANGING PRICES
Inflation has not had a material effect on our operations. However, future inflation may have an impact on the price of materials used in the production of training products and related accessories, including paper and related raw materials. We may not be able to pass on such increased costs to our customers.
SAFE HARBOR STATEMENT UNDER THE PRIVATE SECURITIES LITIGATION REFORM ACT OF 1995
Certain written and oral statements made by us in this report are “forward-looking statements” within the meaning of the Private Securities Litigation Reform Act of 1995 and Section 21E of the Securities Exchange Act of 1934 as amended (the Exchange Act). Forward-looking statements include, without limitation, any statement that may predict, forecast, indicate, or imply future results, performance, or achievements, and may contain words such as “believe,” “anticipate,” “expect,” “estimate,” “project,” or words or phrases of similar meaning. In our reports and filings we may make forward looking statements regarding our expectations about future sales growth, expected introduction of new or refreshed curriculums, future training and consulting sales activity, renewal of existing contracts, the release and success of new publications, anticipated expenses, the adequacy of existing capital resources, projected cost reduction and strategic initiatives, expected levels of depreciation and amortization expense, expectations regarding tangible and intangible asset valuation expenses, the seasonality of future sales, expectations about attracting new tenants to occupy vacant space at our corporate campus, the seasonal fluctuations in cash used for and provided by operating activities, future compliance with the terms and
conditions of our Revolving Loan and Term Loan, the ability to borrow on, and renew, our Revolving Loan, expected repayment of our Term Loan in future periods, expectations regarding income tax expenses as well as tax assets and credits and the amount of cash expected to be paid for income taxes, estimated capital expenditures, and cash flow estimates used to determine the fair value of long-lived assets. These, and other forward-looking statements, are subject to certain risks and uncertainties that may cause actual results to differ materially from the forward-looking statements. These risks and uncertainties are disclosed from time to time in reports filed by us with the SEC, including reports on Forms 8-K, 10-Q, and 10-K. Such risks and uncertainties include, but are not limited to, the matters discussed in Item 1A of this annual report on Form 10-K for the fiscal year ended August 31, 2012, entitled “Risk Factors.” In addition, such risks and uncertainties may include unanticipated developments in any one or more of the following areas: unanticipated costs or capital expenditures; difficulties encountered by HP Enterprise Services in operating and maintaining our information systems and controls, including without limitation, the systems related to demand and supply planning, inventory control, and order fulfillment; delays or unanticipated outcomes relating to our strategic plans; dependence on existing products or services; the rate and consumer acceptance of new product introductions; competition; the number and nature of customers and their product orders, including changes in the timing or mix of product or training orders; pricing of our products and services and those of competitors; adverse publicity; adverse effects on certain licensee’s performance due to civil unrest in some of the countries where our licensees operate; and other factors which may adversely affect our business.
The risks included here are not exhaustive. Other sections of this report may include additional factors that could adversely affect our business and financial performance. Moreover, we operate in a very competitive and rapidly changing environment. New risk factors may emerge and it is not possible for our management to predict all such risk factors, nor can we assess the impact of all such risk factors on our business or the extent to which any single factor, or combination of factors, may cause actual results to differ materially from those contained in forward-looking statements. Given these risks and uncertainties, investors should not rely on forward-looking statements as a prediction of actual results.
The market price of our common stock has been and may remain volatile. In addition, the stock markets in general have experienced increased volatility. Factors such as quarter-to-quarter variations in revenues and earnings or losses and our failure to meet expectations could have a significant impact on the market price of our common stock. In addition, the price of our common stock can change for reasons unrelated to our performance. Due to our low market capitalization, the price of our common stock may also be affected by conditions such as a lack of analyst coverage and fewer potential investors.
Forward-looking statements are based on management’s expectations as of the date made, and the Company does not undertake any responsibility to update any of these statements in the future except as required by law. Actual future performance and results will differ and may differ materially from that contained in or suggested by forward-looking statements as a result of the factors set forth in this Management’s Discussion and Analysis of Financial Condition and Results of Operations and elsewhere in our filings with the SEC.
Market Risk of Financial Instruments
We are exposed to financial instrument market risk primarily through fluctuations in foreign currency exchange rates and interest rates. To manage risks associated with foreign currency exchange and interest rates, we may make limited use of derivative financial instruments. Derivatives are financial instruments that derive their value from one or more underlying financial instruments. As a matter of policy, our derivative instruments are entered into for periods consistent with the related underlying exposures and do not constitute positions that are independent of those exposures. In addition, we do not enter into derivative contracts for trading or speculative purposes, nor are we party to any leveraged derivative instrument. The notional amounts of derivatives do not represent actual amounts exchanged by the parties to the instrument; and thus are not a measure of exposure to us through our use of derivatives.
Additionally, we enter into derivative agreements only with highly rated counterparties and we do not expect to incur any losses resulting from non-performance by other parties.
Foreign Exchange Sensitivity
Due to the global nature of our operations, we are subject to risks associated with transactions that are denominated in currencies other than the United States dollar, as well as the effects of translating amounts denominated in foreign currencies to United States dollars as a normal part of the reporting process. The objective of our foreign currency risk management activities is to reduce foreign currency risk in the consolidated financial statements. In order to manage foreign currency risks, we may make limited use of foreign currency forward contracts and other foreign currency related derivative instruments. Although we cannot eliminate all aspects of our foreign currency risk, we believe that our strategy, which may include the use of derivative instruments, can reduce the impacts of foreign currency related issues on our consolidated financial statements. The following is a description of our use of foreign currency derivative instruments.
Foreign Currency Forward Contracts
–
During the fiscal year ended August 31, 2010 we utilized foreign currency forward contracts to manage the volatility of certain intercompany financing transactions and other transactions that are denominated in foreign currencies. Because these contracts did not meet specific hedge accounting requirements, gains and losses on these contracts, which expired on a quarterly basis, were recognized in current operations and were used to offset a portion of the gains or losses of the related accounts. During fiscal 2010 our losses on these contracts totaled $0.2 million.
We did not have any open derivative instruments outstanding at August 31, 2012.
Interest Rate Sensitivity
At August 31, 2012, our debt obligations consisted primarily of a long-term lease agreement (financing obligation) associated with the sale of our corporate headquarters facility, our Revolving Loan (a variable-rate line of credit arrangement), and a variable rate Term Loan that is payable in monthly installments over 24 months. During fiscal 2012, we benefitted from extraordinarily low interest rates on our Revolving Loan and Term Loan borrowings. Our overall interest rate sensitivity is therefore primarily influenced by amounts borrowed on the Revolving Loan and the Term Loan and the prevailing interest rates on these instruments, which may create additional expense if interest rates increase in future periods. The financing obligation has a payment structure equivalent to a long-term leasing arrangement with a fixed interest rate of 7.7 percent. The Term Loan, on which we borrowed $5.0 million, had an effective interest rate of 2.9 percent at August 31, 2012. Our Revolving Loan had a zero balance at August 31, 2012. At August 31, 2012 borrowing levels, a one percent increase in the interest rate on our variable-rate credit obligations would have an insignificant impact on our interest expense over the next fiscal year.
During the fiscal years ended August 31, 2012, 2011, and 2010, we were not party to any interest rate swap agreements or similar derivative instruments.
Report of Independent Registered Public Accounting Firm
The Board of Directors and Shareholders of
Franklin Covey Co.
We have audited Franklin Covey Co.’s internal control over financial reporting as of August 31, 2012, based on criteria established in Internal Control—Integrated Framework issued by the Committee of Sponsoring Organizations of the Treadway Commission (the COSO criteria). Franklin Covey Co.’s management is responsible for maintaining effective internal control over financial reporting, and for its assessment of the effectiveness of internal control over financial reporting included in the accompanying Management’s Assessment of Internal Control Over Financial Reporting. Our responsibility is to express an opinion on the company’s internal control over financial reporting based on our audit.
We conducted our audit in accordance with the standards of the Public Company Accounting Oversight Board (United States). Those standards require that we plan and perform the audit to obtain reasonable assurance about whether effective internal control over financial reporting was maintained in all material respects. Our audit included obtaining an understanding of internal control over financial reporting, assessing the risk that a material weakness exists, testing and evaluating the design and operating effectiveness of internal control based on the assessed risk, and performing such other procedures as we considered necessary in the circumstances. We believe that our audit provides a reasonable basis for our opinion.
A company’s internal control over financial reporting is a process designed to provide reasonable assurance regarding the reliability of financial reporting and the preparation of financial statements for external purposes in accordance with generally accepted accounting principles. A company’s internal control over financial reporting includes those policies and procedures that (1) pertain to the maintenance of records that, in reasonable detail, accurately and fairly reflect the transactions and dispositions of the assets of the company; (2) provide reasonable assurance that transactions are recorded as necessary to permit preparation of financial statements in accordance with generally accepted accounting principles, and that receipts and expenditures of the company are being made only in accordance with authorizations of management and directors of the company; and (3) provide reasonable assurance regarding prevention or timely detection of unauthorized acquisition, use, or disposition of the company’s assets that could have a material effect on the financial statements.
Because of its inherent limitations, internal control over financial reporting may not prevent or detect misstatements. Also, projections of any evaluation of effectiveness to future periods are subject to the risk that controls may become inadequate because of changes in conditions, or that the degree of compliance with the policies or procedures may deteriorate.
In our opinion, Franklin Covey Co. maintained, in all material respects, effective internal control over financial reporting as of August 31, 2012, based on the COSO criteria.
We also have audited, in accordance with the standards of the Public Company Accounting Oversight Board (United States), the consolidated balance sheets of Franklin Covey Co. as of August 31, 2012 and 2011, and the related consolidated statements of operations and comprehensive income, cash flows, and shareholders’ equity for each of the two years in the period ended August 31, 2012 and our report dated November 14, 2012 expressed an unqualified opinion thereon.
/s/ Ernst & Young LLP
Salt Lake City, Utah
November 14, 2012
Report of Independent Registered Public Accounting Firm
The Board of Directors and Shareholders of
Franklin Covey Co.
We have audited the accompanying consolidated balance sheets of Franklin Covey Co. as of August 31, 2012 and 2011, and the related consolidated statements of operations and comprehensive income, cash flows, and shareholders’ equity for each of the two years in the period ended August 31, 2012. These financial statements are the responsibility of the Company's management. Our responsibility is to express an opinion on these financial statements based on our audits.
We conducted our audits in accordance with the standards of the Public Company Accounting Oversight Board (United States). Those standards require that we plan and perform the audit to obtain reasonable assurance about whether the financial statements are free of material misstatement. An audit includes examining, on a test basis, evidence supporting the amounts and disclosures in the financial statements. An audit also includes assessing the accounting principles used and significant estimates made by management, as well as evaluating the overall financial statement presentation. We believe that our audits provide a reasonable basis for our opinion.
In our opinion, the financial statements referred to above present fairly, in all material respects, the consolidated financial position of Franklin Covey Co. at August 31, 2012 and 2011, and the consolidated results of its operations and its cash flows for each of the two years in the period ended August 31, 2012, in conformity with U.S. generally accepted accounting principles.
We also have audited, in accordance with the standards of the Public Company Accounting Oversight Board (United States), Franklin Covey Co.’s internal control over financial reporting as of August 31, 2012, based on criteria established in Internal Control-Integrated Framework issued by the Committee of Sponsoring Organizations of the Treadway Commission and our report dated November 14, 2012 expressed an unqualified opinion thereon.
/s/ Ernst & Young LLP
Salt Lake City, Utah
November 14, 2012
Report of Independent Registered Public Accounting Firm
The Board of Directors and Shareholders
Franklin Covey Co.:
We have audited the accompanying consolidated statements of operations and comprehensive income, shareholders’ equity, and cash flows of Franklin Covey Co. and subsidiaries for the year ended August 31, 2010. These consolidated financial statements are the responsibility of the Company’s management. Our responsibility is to express an opinion on these consolidated financial statements based on our audit.
We conducted our audit in accordance with the standards of the Public Company Accounting Oversight Board (United States). Those standards require that we plan and perform the audit to obtain reasonable assurance about whether the financial statements are free of material misstatement. An audit includes examining, on a test basis, evidence supporting the amounts and disclosures in the financial statements. An audit also includes assessing the accounting principles used and significant estimates made by management, as well as evaluating the overall financial statement presentation. We believe that our audit provides a reasonable basis for our opinion.
In our opinion, the consolidated financial statements referred to above present fairly, in all material respects, the results of operations and the cash flows of Franklin Covey Co. and subsidiaries for the year ended August 31, 2010, in conformity with U.S. generally accepted accounting principles.
/s/ KPMG LLP
Salt Lake City, Utah
November 12, 2010
FRANKLIN COVEY CO.
CONSOLIDATED BALANCE SHEETS
|
AUGUST 31,
|
2012
|
2011
|
||||||
|
In thousands, except per share data
|
||||||||
|
ASSETS
|
||||||||
|
Current assets:
|
||||||||
|
Cash and cash equivalents
|
$ | 11,011 | $ | 3,016 | ||||
|
Accounts receivable, less allowance for doubtful accounts of $851 and $798
|
38,087 | 32,412 | ||||||
|
Receivable from related party
|
3,588 | 5,717 | ||||||
|
Inventories
|
4,161 | 4,301 | ||||||
|
Deferred income tax assets
|
3,634 | 3,005 | ||||||
|
Prepaid expenses and other current assets
|
3,714 | 3,605 | ||||||
|
Total current assets
|
64,195 | 52,056 | ||||||
|
Property and equipment, net
|
18,496 | 19,143 | ||||||
|
Intangible assets, net
|
59,205 | 61,703 | ||||||
|
Goodwill
|
9,172 | 9,172 | ||||||
|
Long-term receivable from related party
|
3,478 | - | ||||||
|
Other long-term assets
|
9,534 | 9,353 | ||||||
| $ | 164,080 | $ | 151,427 | |||||
|
LIABILITIES AND SHAREHOLDERS’ EQUITY
|
||||||||
|
Current liabilities:
|
||||||||
|
Current portion of financing obligation
|
$ | 992 | $ | 857 | ||||
|
Current portion of bank note payable
|
2,500 | 2,292 | ||||||
|
Accounts payable
|
7,758 | 9,154 | ||||||
|
Income taxes payable
|
869 | 285 | ||||||
|
Accrued liabilities
|
24,530 | 22,813 | ||||||
|
Total current liabilities
|
36,649 | 35,401 | ||||||
|
Financing obligation, less current portion
|
28,515 | 29,507 | ||||||
|
Bank note payable, less current potion
|
208 | 2,708 | ||||||
|
Other liabilities
|
1,152 | 411 | ||||||
|
Deferred income tax liabilities
|
7,001 | 4,084 | ||||||
|
Total liabilities
|
73,525 | 72,111 | ||||||
|
Commitments and contingencies (Notes 7 and 8)
|
||||||||
|
Shareholders’ equity:
|
||||||||
|
Common stock, $.05 par value; 40,000 shares authorized, 27,056 shares issued
|
1,353 | 1,353 | ||||||
|
Additional paid-in capital
|
182,534 | 179,515 | ||||||
|
Common stock warrants
|
5,260 | 5,260 | ||||||
|
Retained earnings
|
26,110 | 18,269 | ||||||
|
Accumulated other comprehensive income
|
3,410 | 3,592 | ||||||
|
Treasury stock at cost, 9,365 shares and 9,386 shares
|
(128,112 | ) | (128,673 | ) | ||||
|
Total shareholders’ equity
|
90,555 | 79,316 | ||||||
| $ | 164,080 | $ | 151,427 | |||||
See accompanying notes to consolidated financial statements.
FRANKLIN COVEY CO.
CONSOLIDATED STATEMENTS OF OPERATIONS AND COMPREHENSIVE INCOME
|
YEAR ENDED AUGUST 31,
|
2012
|
2011
|
2010
|
|||||||||
|
In thousands, except per share amounts
|
||||||||||||
|
Net sales:
|
||||||||||||
|
Training and consulting services
|
$ | 158,779 | $ | 150,976 | $ | 129,462 | ||||||
|
Products
|
8,456 | 7,455 | 4,226 | |||||||||
|
Leasing
|
3,221 | 2,373 | 3,186 | |||||||||
| 170,456 | 160,804 | 136,874 | ||||||||||
|
Cost of sales:
|
||||||||||||
|
Training and consulting services
|
52,161 | 51,942 | 43,945 | |||||||||
|
Products
|
3,839 | 3,674 | 2,226 | |||||||||
|
Leasing
|
1,773 | 1,714 | 1,632 | |||||||||
| 57,773 | 57,330 | 47,803 | ||||||||||
|
Gross profit
|
112,683 | 103,474 | 89,071 | |||||||||
|
Selling, general, and administrative
|
89,462 | 85,255 | 77,604 | |||||||||
|
Depreciation
|
3,142 | 3,567 | 3,669 | |||||||||
|
Amortization
|
2,499 | 3,540 | 3,760 | |||||||||
|
Income from operations
|
17,580 | 11,112 | 4,038 | |||||||||
|
Interest income
|
18 | 21 | 34 | |||||||||
|
Interest expense
|
(2,482 | ) | (2,687 | ) | (2,892 | ) | ||||||
|
Discount on related party note receivable
|
(1,369 | ) | - | - | ||||||||
|
Income from continuing operations before income taxes
|
13,747 | 8,446 | 1,180 | |||||||||
|
Provision for income taxes
|
(5,906 | ) | (3,639 | ) | (2,484 | ) | ||||||
|
Net income (loss) from continuing operations
|
7,841 | 4,807 | (1,304 | ) | ||||||||
|
Income from discontinued operations, net of tax (Note 13)
|
- | - | 548 | |||||||||
|
Gain on sale of discontinued operations, net of tax (Note 13)
|
- | - | 238 | |||||||||
|
Net income (loss)
|
$ | 7,841 | $ | 4,807 | $ | (518 | ) | |||||
|
Income (loss) from continuing operations per share:
|
||||||||||||
|
Basic
|
$ | 0.44 | $ | 0.28 | $ | (0.10 | ) | |||||
|
Diluted
|
0.43 | 0.27 | (0.10 | ) | ||||||||
|
Net income (loss) per share:
|
||||||||||||
|
Basic
|
$ | 0.44 | $ | 0.28 | $ | (0.04 | ) | |||||
|
Diluted
|
0.43 | 0.27 | (0.04 | ) | ||||||||
|
Weighted average number of common shares:
|
||||||||||||
|
Basic
|
17,772 | 17,106 | 13,525 | |||||||||
|
Diluted
|
18,360 | 17,547 | 13,525 | |||||||||
|
COMPREHENSIVE INCOME:
|
||||||||||||
|
Net income (loss)
|
$ | 7,841 | $ | 4,807 | $ | (518 | ) | |||||
|
Foreign currency translation adjustments
|
(182 | ) | 578 | 1,053 | ||||||||
|
Comprehensive income
|
$ | 7,659 | $ | 5,385 | $ | 535 | ||||||
See accompanying notes to consolidated financial statements.
FRANKLIN COVEY CO.
CONSOLIDATED STATEMENTS OF CASH FLOWS
|
YEAR ENDED AUGUST 31,
|
2012
|
2011
|
2010
|
|||||||||
|
In thousands
|
||||||||||||
|
CASH FLOWS FROM OPERATING ACTIVITIES
|
||||||||||||
|
Net income (loss)
|
$ | 7,841 | $ | 4,807 | $ | (518 | ) | |||||
|
Adjustments to reconcile net income (loss) to net cash provided
|
||||||||||||
|
by operating activities:
|
||||||||||||
|
Depreciation and amortization
|
5,698 | 7,107 | 7,429 | |||||||||
|
Amortization of capitalized curriculum costs
|
1,816 | 1,639 | 2,083 | |||||||||
|
Gain on sale of discontinued operation
|
- | - | (1,092 | ) | ||||||||
|
Deferred income taxes
|
2,708 | 2,092 | 2,406 | |||||||||
|
Share-based compensation cost
|
3,835 | 2,788 | 1,099 | |||||||||
|
Loss on disposals of assets
|
36 | 101 | 75 | |||||||||
|
Changes in assets and liabilities, net of effect of acquired business:
|
||||||||||||
|
Increase in accounts receivable, net
|
(5,810 | ) | (1,288 | ) | (7,597 | ) | ||||||
|
Decrease in inventories
|
96 | 382 | 606 | |||||||||
|
Increase in receivable from related party
|
(1,349 | ) | (688 | ) | (3,059 | ) | ||||||
|
Decrease (increase) in prepaid expenses and other assets
|
(39 | ) | 2,128 | (174 | ) | |||||||
|
Increase (decrease) in accounts payable and accrued liabilities
|
(197 | ) | (3,534 | ) | 5,060 | |||||||
|
Increase in income taxes payable/receivable
|
587 | 65 | 699 | |||||||||
|
Increase (decrease) in other long-term liabilities
|
340 | 44 | 7 | |||||||||
|
Net cash provided by operating activities
|
15,562 | 15,643 | 7,024 | |||||||||
|
CASH FLOWS FROM INVESTING ACTIVITIES
|
||||||||||||
|
Purchases of property and equipment
|
(2,279 | ) | (2,326 | ) | (1,384 | ) | ||||||
|
Capitalized curriculum development costs
|
(2,113 | ) | (3,097 | ) | (712 | ) | ||||||
|
Acquisition of business, net of cash acquired
|
- | (5,411 | ) | (3,256 | ) | |||||||
|
Proceeds from sale of discontinued operation
|
- | - | 3,350 | |||||||||
|
Net cash used for investing activities
|
(4,392 | ) | (10,834 | ) | (2,002 | ) | ||||||
|
CASH FLOWS FROM FINANCING ACTIVITIES
|
||||||||||||
|
Proceeds from line of credit borrowings
|
8,523 | 67,462 | 54,705 | |||||||||
|
Payments on line of credit borrowings
|
(8,523 | ) | (76,994 | ) | (58,123 | ) | ||||||
|
Proceeds from notes payable financing
|
- | 5,000 | 1,154 | |||||||||
|
Payments on notes payable financing
|
(2,292 | ) | - | (1,096 | ) | |||||||
|
Principal payments on long-term debt and financing obligation
|
(895 | ) | (673 | ) | (654 | ) | ||||||
|
Purchases of common stock for treasury
|
(440 | ) | (218 | ) | (50 | ) | ||||||
|
Proceeds from sales of common stock held in treasury
|
435 | 328 | 288 | |||||||||
|
Proceeds from management stock loan payments
|
- | - | 159 | |||||||||
|
Net cash used for financing activities
|
(3,192 | ) | (5,095 | ) | (3,617 | ) | ||||||
|
Effect of foreign currency exchange rates on cash and cash equivalents
|
17 | (182 | ) | 391 | ||||||||
|
Net increase (decrease) in cash and cash equivalents
|
7,995 | (468 | ) | 1,796 | ||||||||
|
Cash and cash equivalents at beginning of the year
|
3,016 | 3,484 | 1,688 | |||||||||
|
Cash and cash equivalents at end of the year
|
$ | 11,011 | $ | 3,016 | $ | 3,484 | ||||||
|
Supplemental disclosure of cash flow information:
|
||||||||||||
|
Cash paid for income taxes
|
$ | 2,330 | $ | 1,825 | $ | 428 | ||||||
|
Cash paid for interest
|
2,473 | 2,702 | 2,862 | |||||||||
|
Non-cash investing and financing activities:
|
||||||||||||
|
Purchases of property and equipment financed by accounts payable
|
$ | 481 | $ | 143 | $ | 95 | ||||||
See accompanying notes to consolidated financial statements.
FRANKLIN COVEY CO.
CONSOLIDATED STATEMENTS OF SHAREHOLDERS’ EQUITY
|
Accumulated
|
||||||||||||||||||||||||||||||||
|
Other
|
||||||||||||||||||||||||||||||||
|
Common
|
Common
|
Additional
|
Common
|
Retained
|
Comprehensive
|
Treasury
|
Treasury
|
|||||||||||||||||||||||||
|
Stock Shares
|
Stock Amount
|
Paid-In Capital
|
Stock Warrants
|
Earnings
|
Income
|
Stock Shares
|
Stock Amount
|
|||||||||||||||||||||||||
|
In thousands
|
||||||||||||||||||||||||||||||||
|
Balance at August 31, 2009
|
27,056 | $ | 1,353 | $ | 183,436 | $ | 7,597 | $ | 13,980 | $ | 1,961 | (10,080 | ) | $ | (139,323 | ) | ||||||||||||||||
|
Issuance of common stock from
|
||||||||||||||||||||||||||||||||
|
treasury
|
(495 | ) | 56 | 783 | ||||||||||||||||||||||||||||
|
Purchase of treasury shares
|
(5 | ) | (29 | ) | ||||||||||||||||||||||||||||
|
Unvested share award
|
(850 | ) | 61 | 850 | ||||||||||||||||||||||||||||
|
Share-based compensation
|
1,099 | |||||||||||||||||||||||||||||||
|
Management stock loan
|
||||||||||||||||||||||||||||||||
|
payments
|
664 | (84 | ) | (505 | ) | |||||||||||||||||||||||||||
|
Non-qualified deferred
|
||||||||||||||||||||||||||||||||
|
compensation plan activity
|
(60 | ) | 11 | 39 | ||||||||||||||||||||||||||||
|
Cumulative translation
|
||||||||||||||||||||||||||||||||
|
adjustments
|
1,053 | |||||||||||||||||||||||||||||||
|
Net loss
|
(518 | ) | ||||||||||||||||||||||||||||||
|
Balance at August 31, 2010
|
27,056 | $ | 1,353 | $ | 183,794 | $ | 7,597 | $ | 13,462 | $ | 3,014 | (10,041 | ) | $ | (138,185 | ) | ||||||||||||||||
|
Issuance of common stock from
|
||||||||||||||||||||||||||||||||
|
treasury
|
(1,276 | ) | 117 | 1,604 | ||||||||||||||||||||||||||||
|
Purchase of treasury shares
|
(21 | ) | (218 | ) | ||||||||||||||||||||||||||||
|
Unvested share award
|
(526 | ) | 37 | 526 | ||||||||||||||||||||||||||||
|
Share-based compensation
|
2,788 | |||||||||||||||||||||||||||||||
|
Exercise of common stock
|
||||||||||||||||||||||||||||||||
|
warrants and other warrant
|
||||||||||||||||||||||||||||||||
|
activity
|
(5,894 | ) | (2,337 | ) | 596 | 8,229 | ||||||||||||||||||||||||||
|
Management stock loan
|
||||||||||||||||||||||||||||||||
|
payments
|
637 | (76 | ) | (637 | ) | |||||||||||||||||||||||||||
|
Non-qualified deferred
|
||||||||||||||||||||||||||||||||
|
compensation plan activity
|
(8 | ) | 2 | 8 | ||||||||||||||||||||||||||||
|
Cumulative translation
|
||||||||||||||||||||||||||||||||
|
adjustments
|
578 | |||||||||||||||||||||||||||||||
|
Net income
|
4,807 | |||||||||||||||||||||||||||||||
|
Balance at August 31, 2011
|
27,056 | $ | 1,353 | $ | 179,515 | $ | 5,260 | $ | 18,269 | $ | 3,592 | (9,386 | ) | $ | (128,673 | ) | ||||||||||||||||
|
Issuance of common stock from
|
||||||||||||||||||||||||||||||||
|
treasury
|
(358 | ) | 60 | 800 | ||||||||||||||||||||||||||||
|
Purchase of treasury shares
|
(44 | ) | (440 | ) | ||||||||||||||||||||||||||||
|
Unvested share award
|
(514 | ) | 37 | 514 | ||||||||||||||||||||||||||||
|
Share-based compensation
|
3,835 | |||||||||||||||||||||||||||||||
|
Management stock loan
|
||||||||||||||||||||||||||||||||
|
activity
|
313 | (32 | ) | (313 | ) | |||||||||||||||||||||||||||
|
Repurchase of share-based award
|
(249 | ) | ||||||||||||||||||||||||||||||
|
Cumulative translation
|
||||||||||||||||||||||||||||||||
|
adjustments
|
(182 | ) | ||||||||||||||||||||||||||||||
|
Other
|
(8 | ) | ||||||||||||||||||||||||||||||
|
Net income
|
7,841 | |||||||||||||||||||||||||||||||
|
Balance at August 31, 2012
|
27,056 | $ | 1,353 | $ | 182,534 | $ | 5,260 | $ | 26,110 | $ | 3,410 | (9,365 | ) | $ | (128,112 | ) | ||||||||||||||||
See accompanying notes to consolidated financial statements.
FRANKLIN COVEY CO.
NOTES TO CONSOLIDATED FINANCIAL STATEMENTS
|
1.
|
NATURE OF OPERATIONS AND SUMMARY OF SIGNIFICANT ACCOUNTING POLICIES
|
Franklin Covey Co. (hereafter referred to as us, we, our, or the Company) is a global content and intellectual property company focused on individual and organizational performance. Our mission is to “enable greatness in people and organizations everywhere,” and we believe that we are experts at solving seven pervasive, intractable problems, each of which requires a change in human behavior. We are organized to address these seven problems, which include the following: Leadership, Execution, Productivity, Trust, Loyalty, Sales Performance, and Education. Our offerings are described in further detail at www.franklincovey.com. We have some of the best-known offerings in the training industry, including a suite of individual-effectiveness and leadership-development training products based on the best-selling book,
The 7 Habits of Highly Effective People
and its execution process,
The 4 Disciplines of Execution
. Through our organizational research and curriculum development efforts, we seek to consistently create, develop, and introduce new services and products that will help our clients achieve greatness.
Fiscal Year
The Company utilizes a modified 52/53-week fiscal year that ends on August 31 of each year. Corresponding quarterly periods generally consist of 13-week periods that ended on November 26, 2011, February 25, 2012, and May 26, 2012 during fiscal 2012. Unless otherwise noted, references to fiscal years apply to the 12 months ended August 31 of the specified year.
Basis of Presentation
The accompanying consolidated financial statements include the accounts of the Company and our wholly-owned subsidiaries, which consist of Franklin Development Corp., and our offices in Japan, the United Kingdom, and Australia. Intercompany balances and transactions are eliminated in consolidation.
Pervasiveness of Estimates
The preparation of financial statements in conformity with accounting principles generally accepted in the United States of America requires us to make estimates and assumptions that affect the reported amounts of assets and liabilities and the disclosure of contingent assets and liabilities at the dates of the financial statements, and the reported amounts of revenues and expenses during the reporting periods. Actual results could differ from those estimates.
Reclassifications
Certain reclassifications have been made to prior period financial statements to conform to the current period presentation. These reclassifications did not impact our results of operations or net cash flows in the periods presented.
Cash and Cash Equivalents
Some of our cash is deposited with financial institutions located throughout the United States of America and at banks in foreign countries where we operate subsidiary offices and at times may exceed insured limits. We consider all highly liquid debt instruments with a maturity date of three months or less to be
cash equivalents. We did not hold a significant amount of investments that would be considered cash equivalent instruments at August 31, 2012 or 2011.
Inventories
Inventories are stated at the lower of cost or market, cost being determined using the first-in, first-out method. Elements of cost in inventories generally include raw materials, direct labor, and overhead. Cash flows from the sales of inventory are included in cash flows provided by operating activities in our consolidated statements of cash flows. Our inventories are comprised primarily of training materials, books, and related accessories, and consisted of the following (in thousands):
|
AUGUST 31,
|
2012
|
2011
|
||||||
|
Finished goods
|
$ | 4,028 | $ | 4,158 | ||||
|
Raw materials
|
133 | 143 | ||||||
| $ | 4,161 | $ | 4,301 | |||||
Provision is made to reduce excess and obsolete inventories to their estimated net realizable value. In assessing the realization of inventories, we make judgments regarding future demand requirements and compare these estimates with current and committed inventory levels. Inventory requirements may change based on projected customer demand, training curriculum life-cycle changes, longer- or shorter-than-expected usage periods, and other factors that could affect the valuation of our inventories.
Property and Equipment
Property and equipment are recorded at cost. Depreciation expense, which includes depreciation on our corporate campus that is accounted for as a financing obligation (Note 6), and the amortization of assets recorded under capital lease obligations, is calculated using the straight-line method over the lesser of the expected useful life of the asset or the contracted lease period. We generally use the following depreciable lives for our major classifications of property and equipment:
|
Description
|
Useful Lives
|
|
Buildings
|
20 years
|
|
Machinery and equipment
|
3-7 years
|
|
Computer hardware and software
|
3-5 years
|
|
Furniture, fixtures, and leasehold improvements
|
5-8 years
|
Leasehold improvements are amortized over the lesser of the useful economic life of the asset or the contracted lease period. We expense costs for repairs and maintenance as incurred. Gains and losses resulting from the sale of property and equipment are recorded in current operations.
Impairment of Long-Lived Assets
Long-lived tangible assets and definite-lived intangible assets are reviewed for possible impairment whenever events or changes in circumstances indicate that the carrying amount of such assets may not be recoverable. We use an estimate of undiscounted future net cash flows of the assets over the remaining useful lives in determining whether the carrying value of the assets is recoverable. If the carrying values of the assets exceed the anticipated future cash flows of the assets, we recognize an impairment loss equal to the difference between the carrying values of the assets and their estimated fair values. Impairment of long-lived assets is assessed at the lowest levels for which there are identifiable cash flows that are independent from other groups of assets. The evaluation of long-lived assets requires us to use estimates of future cash flows. If forecasts and assumptions used to support the realizability of our long-lived tangible and definite-lived intangible assets change in the future, significant impairment charges could result that would adversely affect our results of operations and financial condition.
Indefinite-Lived Intangible Assets and Goodwill
Intangible assets that are deemed to have an indefinite life and acquired goodwill are not amortized, but rather are tested for impairment on an annual basis or more often if events or circumstances indicate that a potential impairment exists. The Covey trade name intangible asset (Note 4) has been deemed to have an indefinite life. This intangible asset is tested for impairment using qualitative factors or the present value of estimated royalties on trade name related revenues, which consist primarily of training seminars and work sessions, international licensee sales, and related products. Based on the fiscal 2012 evaluation of the Covey trade name, we believe the fair value of the Covey trade name substantially exceeds its carrying value and no impairment charges were recorded against the Covey trade name during the fiscal year ended August 31, 2012.
Our reported goodwill resulted from the fiscal 2009 acquisition of CoveyLink Worldwide, LLC and the payment of the first two of five annual potential contingent earnout payments. Based on our fiscal 2012 evaluation, we believe the fair value of the reporting unit, which was defined as our consolidated operations, substantially exceeded its carrying value and no impairment charges to goodwill were recorded during the fiscal year ended August 31, 2012.
Capitalized Curriculum Development Costs
During the normal course of business, we develop training courses and related materials that we sell to our clients. Capitalized curriculum development costs include certain expenditures to develop course materials such as video segments, course manuals, and other related materials. Generally, curriculum costs are capitalized when there is a major revision to an existing course that requires a significant re-write of the course materials or curriculum. Costs incurred to maintain existing offerings are expensed when incurred. In addition, development costs incurred in the research and development of new curriculum and software products to be sold, leased, or otherwise marketed are expensed as incurred until economic feasibility has been established.
During fiscal 2012, we capitalized costs incurred for the development of our new productivity offering, as well as for various other courses. Capitalized development costs are generally amortized over a five-year life, which is based on numerous factors, including expected cycles of major changes to curriculum. Capitalized curriculum development costs are reported as a component of other long-term assets in our consolidated balance sheets and totaled $6.7 million and $6.4 million at August 31, 2012 and 2011. Amortization of capitalized curriculum development costs is reported as a component of cost of sales.
Accrued Liabilities
Significant components of our accrued liabilities were as follows (in thousands):
|
AUGUST 31,
|
2012
|
2011
|
||||||
|
Accrued compensation
|
$ | 9,549 | $ | 7,854 | ||||
|
Unearned revenue
|
4,780 | 4,710 | ||||||
|
Intellectual property royalties
|
1,907 | 1,702 | ||||||
|
Customer credits
|
1,421 | 2,341 | ||||||
|
Other accrued liabilities
|
6,873 | 6,206 | ||||||
| $ | 24,530 | $ | 22,813 | |||||
Foreign Currency Translation and Transactions
The functional currencies of our foreign operations are the reported local currencies. Translation adjustments result from translating our foreign subsidiaries’ financial statements into United States dollars. The balance sheet accounts of our foreign subsidiaries are translated into United States dollars using the exchange rate in effect at the balance sheet date. Revenues and expenses are translated using
average exchange rates for each month during the fiscal year. The resulting translation gains or losses were recorded as a component of accumulated other comprehensive income in shareholders’ equity. Foreign currency transaction gains and losses totaled a loss of $0.1 million, a gain of $14,000, and a loss of $0.5 million for the fiscal years ended August 31, 2012, 2011, and 2010, respectively.
Derivative Instruments
During the normal course of business, we are exposed to risks associated with foreign currency exchange rate and interest rate fluctuations. Foreign currency exchange rate exposures result from the Company’s operating results, assets, and liabilities that are denominated in currencies other than the United States dollar. In order to limit our exposure to these elements, we may make limited use of derivative instruments. Each derivative instrument that is designated as a hedge instrument is recorded on the balance sheet at its fair value. Changes in the fair value of derivative instruments that qualify for hedge accounting are recorded in accumulated other comprehensive income, which is a component of shareholders’ equity. Changes in the fair value of derivative instruments that are not designated as hedge instruments are immediately recognized as a component of selling, general, and administrative expense in our consolidated statements of operations.
Sales Taxes
We collect sales tax on qualifying transactions with customers based upon applicable sales tax rates in various jurisdictions. We account for sales taxes collected using the net method; accordingly, we do not include sales taxes in net sales reported in our consolidated statements of operations.
Revenue Recognition
We recognize revenue when: 1) persuasive evidence of an agreement exists, 2) delivery of product has occurred or services have been rendered, 3) the price to the customer is fixed or determinable, and 4) collectability is reasonably assured. For training and service sales, these conditions are generally met upon presentation of the training seminar or delivery of the consulting services. For product sales, these conditions are generally met upon shipment of the product to the customer.
Some of our training and consulting contracts contain multiple element deliverables that include training along with other products and services. For transactions that contain more than one element, we recognize revenue in accordance with the guidance for multiple element arrangements using the relative selling price method.
Our international strategy includes the use of licensees in countries where we do not have a wholly-owned operation. Licensee companies are unrelated entities that have been granted a license to translate our content and curriculum, adapt the content and curriculum to the local culture, and sell our training seminars and products in a specific country or region. Licensees are required to pay us royalties based upon a percentage of their sales to clients. We recognize royalty income each period based upon the sales information reported to us from our licensees. Licensee royalty revenues are included as a component of training sales and totaled $11.8 million, $10.6 million, and $9.2 million for the fiscal years ended August 31, 2012, 2011, and 2010.
Revenue is recognized as the net amount to be received after deducting estimated amounts for discounts and product returns.
Share-Based Compensation
We record the compensation expense for all share based-payments to employees and non-employees, including grants of stock options and the compensatory elements of our employee stock purchase plan, in our consolidated statements of operations based upon their fair values over the requisite service period. For more information on our share-based compensation plans, refer to Note 12.
Shipping and Handling Fees and Costs
All shipping and handling fees billed to customers are recorded as a component of net sales. All costs incurred related to the shipping and handling of products are recorded in cost of sales.
Advertising Costs
Costs for newspaper, television, radio, and other advertising are expensed as incurred or recognized over the period of expected benefit for direct response and catalog advertising. Direct response advertising costs, which consist primarily of printing and mailing costs for seminar mailers, are charged to expense over the period of projected benefit, which ranges from three to 12 months. Advertising costs included in selling, general, and administrative expenses totaled $5.3 million, $3.1 million, and $3.3 million for the fiscal years ended August 31, 2012, 2011, and 2010. Our direct response advertising costs reported in other current assets totaled $0.2 million at August 31, 2012 and 2011.
Income Taxes
Our income tax provision has been determined using the asset and liability approach of accounting for income taxes. Under this approach, deferred income taxes represent the future tax consequences expected to occur when the reported amounts of assets and liabilities are recovered or paid. The income tax provision represents income taxes paid or payable for the current year plus the change in deferred taxes during the year. Deferred income taxes result from differences between the financial and tax bases of our assets and liabilities and are adjusted for tax rates and tax laws when changes are enacted. A valuation allowance is provided against deferred income tax assets when it is more likely than not that all or some portion of the deferred income tax assets will not be realized. Interest and penalties related to uncertain tax positions are recognized as components of income tax expense in our consolidated statements of operations.
We may recognize the tax benefit from an uncertain tax position only if it is more likely than not that the tax position will be sustained on examination by the taxing authorities based on the technical merits of the position. The tax benefits recognized in the financial statements from such a position are measured based on the largest benefit that has a greater than 50 percent likelihood of being realized upon ultimate settlement.
We provide for income taxes, net of applicable foreign tax credits, on temporary differences in our investment in foreign subsidiaries, which consist primarily of unrepatriated earnings.
Comprehensive Income
Comprehensive income includes changes to equity accounts that were not the result of transactions with shareholders. Comprehensive income is comprised of net income or loss and other comprehensive income and loss items. Our other comprehensive income and losses generally consist of changes in the cumulative foreign currency translation adjustment, net of tax.
|
2.
|
TRADE ACCOUNTS RECEIVABLE
|
Trade accounts receivable are recorded at the invoiced amount and do not bear interest. The allowance for doubtful accounts represents our best estimate of the amount of probable credit losses in the existing accounts receivable balance. We determine the allowance for doubtful accounts based upon historical write-off experience and current economic conditions, and we review the adequacy of the allowance for doubtful accounts on a regular basis. Receivable balances past due over 90 days, which exceed a specified dollar amount, are reviewed individually for collectibility. Account balances are charged off against the allowance after all means of collection have been exhausted and the potential for recovery is
considered remote. We do not have any off-balance sheet credit exposure related to our customers nor do we generally require collateral or other security agreements from our customers.
Activity in our allowance for doubtful accounts was comprised of the following for the periods indicated (in thousands):
|
YEAR ENDED
|
||||||||||||
|
AUGUST 31,
|
2012
|
2011
|
2010
|
|||||||||
|
Beginning balance
|
$ | 798 | $ | 718 | $ | 879 | ||||||
|
Charged to costs and expenses
|
224 | 188 | 402 | |||||||||
|
Deductions
|
(171 | ) | (108 | ) | (563 | ) | ||||||
|
Ending balance
|
$ | 851 | $ | 798 | $ | 718 | ||||||
Deductions on the foregoing table represent the write-off of amounts deemed uncollectible during the fiscal year. During fiscal 2012, our recoveries of previously written off accounts totaled approximately $72,000 and was included in amounts charged to costs and expenses in the above table. Recoveries of amounts previously written off were insignificant in fiscal 2011 and fiscal 2010.
|
3.
|
PROPERTY AND EQUIPMENT
|
Our property and equipment were comprised of the following (in thousands):
|
AUGUST 31,
|
2012
|
2011
|
||||||
|
Land and improvements
|
$ | 1,312 | $ | 1,312 | ||||
|
Buildings
|
31,556 | 31,556 | ||||||
|
Machinery and equipment
|
2,295 | 2,184 | ||||||
|
Computer hardware and software
|
19,792 | 18,747 | ||||||
|
Furniture, fixtures, and leasehold
|
||||||||
|
improvements
|
11,635 | 11,408 | ||||||
| 66,590 | 65,207 | |||||||
|
Less accumulated depreciation
|
(48,094 | ) | (46,064 | ) | ||||
| $ | 18,496 | $ | 19,143 | |||||
|
|
|
|
4.
|
INTANGIBLE ASSETS AND GOODWILL
|
Our intangible assets were comprised of the following (in thousands):
|
Gross Carrying
|
Accumulated
|
Net Carrying
|
||||||||||
|
AUGUST 31, 2012
|
Amount
|
Amortization
|
Amount
|
|||||||||
|
Definite-lived intangible assets:
|
||||||||||||
|
License rights
|
$ | 27,000 | $ | (13,041 | ) | $ | 13,959 | |||||
|
Acquired curriculum
|
58,284 | (36,052 | ) | 22,232 | ||||||||
|
Customer lists
|
15,111 | (15,097 | ) | 14 | ||||||||
|
Trade names
|
377 | (377 | ) | - | ||||||||
| 100,772 | (64,567 | ) | 36,205 | |||||||||
|
Indefinite-lived intangible asset:
|
||||||||||||
|
Covey trade name
|
23,000 | - | 23,000 | |||||||||
| $ | 123,772 | $ | (64,567 | ) | $ | 59,205 | ||||||
|
AUGUST 31, 2011
|
||||||||||||
|
Definite-lived intangible assets:
|
||||||||||||
|
License rights
|
$ | 27,000 | $ | (12,103 | ) | $ | 14,897 | |||||
|
Acquired curriculum
|
58,285 | (34,524 | ) | 23,761 | ||||||||
|
Customer lists
|
15,111 | (15,066 | ) | 45 | ||||||||
|
Trade names
|
377 | (377 | ) | - | ||||||||
| 100,773 | (62,070 | ) | 38,703 | |||||||||
|
Indefinite-lived intangible asset:
|
||||||||||||
|
Covey trade name
|
23,000 | - | 23,000 | |||||||||
| $ | 123,773 | $ | (62,070 | ) | $ | 61,703 | ||||||
Our intangible assets are amortized over the estimated useful life of the asset. The range of remaining estimated useful lives and weighted-average amortization period over which we are amortizing the major categories of definite-lived intangible assets at August 31, 2012 were as follows:
|
Category of Intangible Asset
|
Range of Remaining Estimated Useful Lives
|
Weighted Average Amortization Period
|
||
|
License rights
|
14 years
|
30 years
|
||
|
Curriculum
|
2 to 14 years
|
26 years
|
||
|
Customer lists
|
Less than one year
|
14 years
|
During fiscal 2009 we acquired the assets of CoveyLink Worldwide, LLC (CoveyLink). The previous owners of CoveyLink, which includes a son of a former member of our Board of Directors, are also entitled to earn annual contingent payments based upon earnings growth over the next five years. During the fiscal years ended August 31, 2011 and 2010, we paid $5.4 million and $3.3 million, respectively, in cash to the former owners of CoveyLink for the first two contingent payments. There was no payment required in fiscal 2012 for the third contingent payment. These contingent payments were classified as goodwill on our consolidated balance sheets. Our consolidated goodwill changed as follows during fiscal 2012 and 2011 (in thousands):
|
Balance at August 31, 2010
|
$ | 3,761 | ||
|
Contingent earnout payment from
|
||||
|
CoveyLink acquisition
|
5,411 | |||
|
Impairments
|
- | |||
|
Balance at August 31, 2011
|
$ | 9,172 | ||
|
Contingent earnout payment from
|
||||
|
CoveyLink acquisition
|
- | |||
|
Impairments
|
- | |||
|
Balance at August 31, 2012
|
$ | 9,172 | ||
Our aggregate amortization expense from definite-lived intangible assets totaled $2.5 million, $3.5 million, and $3.8 million, for fiscal years 2012, 2011, and 2010. Amortization expense for our intangible assets over the next five years is expected to be as follows (in thousands):
|
YEAR ENDING
|
||||
|
AUGUST 31,
|
||||
|
2013
|
$ | 2,471 | ||
|
2014
|
2,446 | |||
|
2015
|
2,443 | |||
|
2016
|
2,443 | |||
|
2017
|
2,443 | |||
|
5.
|
LINE OF CREDIT AND NOTES PAYABLE
|
|
|
|
During fiscal 2011, we entered into an amended and restated secured credit agreement (the Restated Credit Agreement) with our existing lender. The Restated Credit Agreement provides a revolving line of credit facility (the Revolving Line of Credit) with a maximum borrowing amount of $10.0 million and a term loan (the Term Loan) with maximum available borrowing of up to $5.0 million. Both credit facilities may be used for general business purposes.
|
Revolving Line of Credit
|
|
|
|
On March 13, 2012, we entered into the First Modification Agreement to the existing Restated Credit Agreement. The primary purpose of the First Modification Agreement was to extend the maturity date of the Restated Credit Agreement, which originally expired on March 14, 2012. The First Modification Agreement extended the maturity date of the Restated Credit Agreement to March 31, 2013.
During the fourth quarter of fiscal 2012, we entered into the Second Modification Agreement to the Restated Credit Agreement. The primary purpose of the Second Modification Agreement was to extend the maturity date of the Restated Credit Agreement from March 31, 2013 to March 31, 2015. We entered into the Second Modification Agreement to ensure the availability of our line of credit facility over the next three years so that we may use our excess cash to pursue special initiatives, such as the potential repurchase of shares of our common stock, and for other growth opportunities. The key terms and conditions of the Second Modification Agreement remain substantially the same as the Restated Credit Agreement.
The key terms and conditions of the Revolving Line of Credit under the Second Modification Agreement are as follows:
|
·
|
Available Credit –
The Revolving Line of Credit has a maximum borrowing amount of $10.0 million, which remains unchanged from the Restated Credit Agreement.
|
|
·
|
Maturity Date –
The maturity date of the Revolving Line of Credit is March 31, 2015.
|
|
·
|
Interest Rate –
The effective interest rate continues to be LIBOR plus 2.50 percent per annum. However, the unused credit fee on the facility increased slightly from .25 percent to .33 percent.
|
|
·
|
Financial Covenants –
The Revolving Line of Credit requires us to be in compliance with specified financial covenants, including (a) a funded debt to EBITDAR (earnings before interest, taxes, depreciation, amortization, and rental expense) ratio of less than 3.00 to 1.00; (b) a fixed charge coverage ratio greater than 1.5 to 1.0; and (c) an annual limit on capital expenditures (not including capitalized curriculum development) of $8.0 million. The previously existing minimum net worth covenant was eliminated.
|
In the event of noncompliance with these financial covenants and other defined events of default, the lender is entitled to certain remedies, including acceleration of the repayment of amounts outstanding on the Revolving Line of Credit and the Term Loan. At August 31, 2012, we believe that we were in compliance with the terms and covenants applicable to the Second Modification Agreement. The effective interest rate on our Revolving Line of Credit was 2.7 percent at August 31, 2012 and August 31, 2011.
In connection with the Restated Credit Agreement, we entered into a promissory note, a security agreement, repayment guaranty agreements, and a pledge and security agreement. These agreements pledge substantially all of our assets located in the United States to the lender as collateral for borrowings under the Restated Credit Agreement and subsequent amendments. We had no outstanding borrowings on the line of credit facility at August 31, 2012 or August 31, 2011.
Term Loan Payable
We borrowed $5.0 million on the term loan payable that is being repaid in 24 equal monthly installments, beginning on October 1, 2011 and concluding on September 1, 2013. The effective interest rate on the term loan is LIBOR plus 2.65 percent per annum and was 2.9 percent at August 31, 2012 and August 31, 2011.
|
6.
|
FINANCING OBLIGATION
|
The financing obligation on our corporate campus was comprised of the following (in thousands):
|
AUGUST 31,
|
2012
|
2011
|
||||||
|
Financing obligation payable in
|
||||||||
|
monthly installments of $269 at
|
||||||||
|
August 31, 2012, including
|
||||||||
|
principal and interest, with two
|
||||||||
|
percent annual increases
|
||||||||
|
(imputed interest at 7.7%),
|
||||||||
|
through June 2025
|
$ | 29,507 | $ | 30,364 | ||||
|
Less current portion
|
(992 | ) | (857 | ) | ||||
|
Total financing obligation,
|
||||||||
|
less current portion
|
$ | 28,515 | $ | 29,507 | ||||
Future principal maturities of our financing obligation were as follows at August 31, 2012 (in thousands):
|
YEAR ENDING
|
||||
|
AUGUST 31,
|
||||
|
2013
|
$ | 992 | ||
|
2014
|
1,139 | |||
|
2015
|
1,298 | |||
|
2016
|
1,473 | |||
|
2017
|
1,662 | |||
|
Thereafter
|
22,943 | |||
| $ | 29,507 | |||
In connection with the sale and leaseback of our corporate headquarters facility located in Salt Lake City, Utah, we entered into a 20-year master lease agreement with the purchaser, an unrelated private investment group. The 20-year master lease agreement also contains six five-year renewal options that will allow us to maintain our operations at the current location for up to 50 years. Although the corporate headquarters facility was sold and the Company has no legal ownership of the property, we were prohibited from recording the transaction as a sale since we have subleased a significant portion of the
property that was sold. Accordingly, we accounted for the sale as a financing transaction, which required us to continue reporting the corporate headquarters facility as an asset and to record a financing obligation for the sale price. Our remaining future minimum payments under the financing obligation in the initial 20-year lease term are as follows (in thousands):
|
YEAR ENDING
|
||||
|
AUGUST 31,
|
||||
|
2013
|
$ | 3,242 | ||
|
2014
|
3,307 | |||
|
2015
|
3,373 | |||
|
2016
|
3,440 | |||
|
2017
|
3,509 | |||
|
Thereafter
|
29,909 | |||
|
Total future minimum financing
|
||||
|
obligation payments
|
46,780 | |||
|
Less interest
|
(18,585 | ) | ||
|
Present value of future minimum
|
||||
|
financing obligation payments
|
$ | 28,195 | ||
The $1.3 million difference between the carrying value of the financing obligation and the present value of the future minimum financing obligation payments represents the carrying value of the land sold in the financing transaction, which is not depreciated. At the conclusion of the master lease agreement, the remaining financing obligation and carrying value of the land will be written off of our financial statements.
|
|
|
|
7.
|
OPERATING LEASES
|
Lease Expense
In the normal course of business, we lease office space and warehouse and distribution facilities under non-cancelable operating lease agreements. We rent office space, primarily for international and domestic regional sales administration offices, in commercial office complexes that are conducive to sales and administrative operations. We also rent warehousing and distribution facilities that are designed to provide secure storage and efficient distribution of our training products and accessories. These operating lease agreements generally contain renewal options that may be exercised at our discretion after the completion of the base rental term. In addition, many of the rental agreements provide for regular increases to the base rental rate at specified intervals, which usually occur on an annual basis. At August 31, 2012, we had operating leases that have remaining terms ranging from approximately one year to approximately nine years. Following the sale of our consumer solutions business unit (CSBU) assets, FC Organizational Products is contractually obligated to pay to us a portion of our minimum rental payments on certain warehouse and distribution facilities that they are using, although we are still responsible for the gross required minimum lease payments. The following table summarizes our future minimum lease payments under operating lease agreements and the lease amounts receivable from FC Organizational Products at August 31, 2012 (in thousands):
|
Required
|
Receivable
|
Net Required
|
||||||||||
|
Minimum
|
from FC
|
Minimum
|
||||||||||
|
YEAR ENDING
|
Lease
|
Organizational
|
Lease
|
|||||||||
|
AUGUST 31,
|
Payments
|
Products
|
Payments
|
|||||||||
|
2013
|
$ | 1,872 | $ | (529 | ) | $ | 1,343 | |||||
|
2014
|
1,549 | (584 | ) | 965 | ||||||||
|
2015
|
1,405 | (632 | ) | 773 | ||||||||
|
2016
|
1,136 | (535 | ) | 601 | ||||||||
|
2017
|
225 | - | 225 | |||||||||
|
Thereafter
|
688 | - | 688 | |||||||||
| $ | 6,875 | $ | (2,280 | ) | $ | 4,595 | ||||||
We recognize lease expense on a straight-line basis over the life of the lease agreement. Contingent rent expense is recognized as it is incurred and was insignificant for the periods presented. Total rent expense recorded in selling, general, and administrative expense from operating lease agreements was $2.2 million, $2.7 million, and $3.0 million for the fiscal years ended August 31, 2012, 2011, and 2010.
Lease Income
We have subleased a significant portion of our corporate headquarters campus located in Salt Lake City, Utah to multiple, unrelated tenants as well as to FC Organizational Products. We recognize sublease income on a straight-line basis over the life of the sublease agreement. The cost basis of the office space available for lease was $33.9 million, which had a carrying value of $12.8 million at August 31, 2012. The following future minimum lease payments due to us from our sublease agreements at August 31, 2012 include lease income of approximately $0.8 million per year from FC Organizational Products. All lease income disclosed after fiscal 2017 is from FC Organizational Products (in thousands):
|
YEAR ENDING
|
||||
|
AUGUST 31,
|
||||
|
2013
|
$ | 3,999 | ||
|
2014
|
2,443 | |||
|
2015
|
2,288 | |||
|
2016
|
1,815 | |||
|
2017
|
969 | |||
|
Thereafter
|
6,479 | |||
| $ | 17,993 | |||
Sublease revenue totaled $3.2 million, $2.4 million, and $3.2 million during the fiscal years ended August 31, 2012, 2011, and 2010.
|
|
|
|
8.
|
COMMITMENTS AND CONTINGENCIES
|
Information Systems and Warehouse Outsourcing Contract
We have an outsourcing contract with HP Enterprise Services (HP) to provide information technology system support and product warehousing and distribution services. During late fiscal 2011, we entered into an agreement with HP to modify the minimum required warehouse charges. Under the terms of this agreement, we moved our primary warehouse to an HP distribution facility in Des Moines, Iowa and HP agreed to list the vacated warehouse space in Salt Lake City, Utah for lease. As the warehouse space in Salt Lake City is leased, HP will proportionally reduce our minimum warehouse charge. If the warehouse becomes more than 75 percent leased, the warehouse minimum is contractually reduced to approximately
$0.2 million per year from approximately $2.9 million per year. At August 31, 2012, the Salt Lake City warehouse was approximately 70 percent leased to unrelated parties and our warehouse minimum charge has been reduced accordingly. FC Organizational Products is contractually obligated to pay us a portion of our minimum fixed warehouse charges. The table below has been adjusted to reflect current warehouse minimum payments as well as amounts that we will bill to FC Organizational Products, although we are still responsible for the gross minimum fixed charges. If the current tenants are unable to continue in the warehouse, our required minimum payments may return to higher levels in future periods. The warehouse and distribution fixed charge contains an annual escalation clause based upon changes in the Employment Cost Index.
The following schedule summarizes our estimated minimum information systems support and fixed warehouse and distribution charges, without the effect of estimated escalation charges, to HP for services over the remaining life of the outsourcing contract, and the amounts receivable from FC Organizational Products (in thousands):
|
Estimated
|
Receivable
|
|||||||||||
|
Gross
|
from FC
|
Estimated Net
|
||||||||||
|
YEAR ENDING
|
Minimum and
|
Organizational
|
Minimum and
|
|||||||||
|
AUGUST 31,
|
Fixed Charges
|
Products
|
Fixed Charges
|
|||||||||
|
2013
|
$ | 2,232 | $ | (61 | ) | $ | 2,171 | |||||
|
2014
|
2,232 | (61 | ) | 2,171 | ||||||||
|
2015
|
2,232 | (61 | ) | 2,171 | ||||||||
|
2016
|
1,382 | (51 | ) | 1,331 | ||||||||
|
Thereafter
|
- | - | - | |||||||||
| $ | 8,078 | $ | (234 | ) | $ | 7,844 | ||||||
Our actual payments to HP include a variable charge for certain warehousing and distribution activities and may fluctuate in future periods based upon actual sales and activity levels.
During fiscal years 2012, 2011, and 2010, we expensed $5.0 million, $6.6 million, and $6.2 million for services provided under the terms of the HP outsourcing contract. The total amount expensed each year under the HP contract includes freight charges, which are billed to the Company based upon activity. Freight charges included in our total HP costs totaled $1.8 million, $1.6 million, and $1.5 million during the years ended August 31, 2012, 2011, and 2010.
The outsourcing contracts contain early termination provisions that we may exercise under certain conditions. However, in order to exercise the early termination provisions, we would have to pay specified penalties to HP depending upon the circumstances of the contract termination.
Purchase Commitments
During the normal course of business, we issue purchase orders to various external vendors for products and services. At August 31, 2012, we had open purchase commitments totaling $4.2 million for products and services to be delivered primarily in fiscal 2013. Other purchase commitments for materials, supplies, and other items incidental to the ordinary conduct of business were immaterial, both individually and in aggregate, to the Company’s operations at August 31, 2012.
Legal Matters and Loss Contingencies
On April 20, 2010, Moore Wallace North America, Inc. doing business as TOPS filed a complaint against FC Organizational Products, LLC (FCOP) in the Circuit Court of Cook County, Illinois, for breach of contract. The complaint also named us as a defendant and alleged that we should be liable for FCOP’s debts under the doctrine of alter ego or fraudulent transfer. On December 23, 2011, Moore Wallace
North America, Inc., FCOP, and the Company entered into a settlement agreement and mutual release. Under the terms of this agreement, FCOP paid Moore Wallace North America, Inc. a specified sum to settle the complaint and reimbursed us for legal fees incurred in defense of the allegations.
During fiscal 2012, a former software vendor performed a license review and claimed that we were under licensed for certain software products in prior years. After reviewing the claims from the vendor, we determined that the amounts claimed were not consistent with our previously existing software licensing agreement. We are actively disputing these claims and believe that a settlement is reasonably possible. However, at August 31, 2012 we believe that the amount of such settlement would be immaterial to our consolidated financial statements.
We are also the subject of certain other legal actions, which we consider routine to our business activities. At August 31, 2012, we believe that, after consultation with legal counsel, any potential liability to us under these other actions will not materially affect our financial position, liquidity, or results of operations.
FC Organizational Products Store Leases
According to the terms of the agreements associated with the sale of our CSBU assets that closed in the fourth quarter of fiscal 2008, we assigned the benefits and obligations relating to the leases of most of our retail stores to FC Organizational Products. However, we remain secondarily liable to fulfill the obligations contained in the lease agreements, including making lease payments, if FCOP is unable to fulfill its obligations pursuant to the terms of the lease agreements. At August 31, 2012, the retail store minimum lease payments for which we remain secondarily liable totaled $0.3 million. Any default by FCOP in its lease payment obligations could provide us with certain remedies against FCOP. If FCOP is unable to satisfy the obligations contained in the lease agreements and we are unable to obtain adequate remedies, our results of operations and cash flows may be adversely affected.
|
|
|
|
9.
|
SHAREHOLDERS’ EQUITY
|
Preferred Stock
We have 14.0 million shares of preferred stock authorized for issuance. However, at August 31, 2012, no shares of preferred stock were issued or outstanding.
Common Stock Warrants
Pursuant to the terms of the preferred stock recapitalization plan, in fiscal 2005 we completed a one-to-four forward split of the existing Series A preferred stock and then bifurcated each share of Series A preferred stock into a new share of Series A preferred stock that is no longer convertible into common stock, and a warrant to purchase shares of common stock. Accordingly, we issued 6.2 million common stock warrants with an exercise price of $8.00 per share (subject to customary anti-dilution and exercise features), which will be exercisable over an eight-year term that expires in March 2013. These common stock warrants were recorded in shareholders’ equity at fair value on the date of the recapitalization, as determined by a Black-Scholes valuation methodology, which totaled $7.6 million.
During the fourth quarter of fiscal 2011, Knowledge Capital Investment Group (Knowledge Capital), the holder of a warrant to purchase 5,913,402 shares of common stock, exercised its warrant with respect to 1,913,402 shares on a net settlement basis. As a result of this transaction, we issued 596,116 shares of our common stock to Knowledge Capital from shares held in treasury. In connection with this warrant exercise, we entered into an agreement with Knowledge Capital regarding its remaining warrant to purchase shares of common stock and the shares of common stock currently held by them. Knowledge Capital agreed to the following:
|
1.
|
To exercise its warrant with respect to the remaining 4.0 million shares only on a net settlement basis.
|
|
2.
|
Not to exercise its right to cause the Company to file a registration statement with respect to the resale of any of the shares owned by Knowledge Capital (including the 1,015,000 shares already owned by Knowledge Capital) prior to the earlier of (i) March 8, 2013 (the expiration of the warrant) and (ii) one year after the date on which the warrant has been exercised in full (the Stand-Off Period).
|
|
3.
|
If Knowledge Capital intends to sell any of our common shares (including shares previously owned by Knowledge Capital) in the market during the Stand-Off Period on an unregistered basis, Knowledge Capital will notify us in writing of such intent, including the details surrounding such sale, at least five trading days before commencing such sales, and, if requested by us, will refrain from selling shares of our common stock for up to 120 days after the date Knowledge Capital intended to begin such sales in order to permit us to arrange for an underwritten or other organized sale of these shares. This action includes filing with the Securities and Exchange Commission, if applicable and required, an effective registration statement covering the sale of the shares in the manner proposed by Knowledge Capital or as otherwise agreed to by Knowledge Capital and us.
|
|
4.
|
To discuss with us any proposal by us to purchase such shares during the 120-day period.
|
In exchange for these considerations, we agreed to waive our right to pay cash in lieu of shares upon exercises of the warrant. Two members of our Board of Directors, including our Chief Executive Officer, have an equity interest in Knowledge Capital. This transaction and agreement was approved by members of our Board of Directors who are not affiliated with Knowledge Capital and have no economic interest in the warrant.
Subsequent to August 31, 2012, Knowledge Capital exercised its warrant with respect to 1,000,000 shares on a net settlement basis. Accordingly, we issued 340,877 shares of our common stock to Knowledge Capital from treasury under the terms of the foregoing agreement.
Treasury Stock
During the third quarter of fiscal 2012, our Board of Directors approved a plan to purchase up to $10.0 million of the Company’s outstanding common stock. We intend to use available cash in excess of $10.0 million to make the purchases and all previously existing common stock repurchase plans were canceled. Common stock purchases under this approved plan are made at our discretion based on prevailing market prices and are subject to customary regulatory requirements and considerations. We do not have a timetable for the purchase of these common shares, and the authorization by the Board of Directors does not have an expiration date. We have purchased a total of 41,085 shares of our common stock for $0.4 million through August 31, 2012.
|
10.
|
MANAGEMENT COMMON STOCK LOAN PROGRAM
|
During fiscal 2000, certain of our management personnel borrowed funds from an external lender, on a full-recourse basis, to acquire shares of our common stock. The loan program closed during fiscal 2001 with 3.825 million shares of common stock purchased by the loan participants for a total cost of $33.6 million, which was the market value of the shares acquired and distributed to loan participants. The Company initially participated on these management common stock loans as a guarantor to the lending institution. However, in connection with a new credit facility obtained during fiscal 2001, we acquired the loans from the external lender at fair value and are now the creditor for these loans. The loans in the management stock loan program initially accrued interest at 9.4 percent (compounded quarterly), are full-recourse to the participants, and were originally due in March 2005. Although interest continues to
accrue on the outstanding balance over the life of the loans to the participants, the Company ceased recording interest receivable (and related interest income) related to these loans in fiscal 2002.
In May 2004, our Board of Directors approved modifications to the terms of the management stock loans. While these changes had significant implications for most management stock loan program participants, the Company did not formally amend or modify the stock loan program notes. Rather, the Company chose to forego certain of its rights under the terms of the loans and granted participants the modifications described below in order to potentially improve their ability to pay, and our ability to collect, the outstanding balances of the loans. These modifications to the management stock loan terms applied to all current and former employees whose loans do not fall under the provisions of the Sarbanes-Oxley Act of 2002. Loans to our officers and directors (as defined by the Sarbanes-Oxley Act of 2002) were not affected by the approved modifications and loans held by those persons, which totaled $0.8 million, were repaid on the original due date of March 30, 2005.
The May 2004 modifications to the management stock loan terms included the following:
Waiver of Right to Collect
–
The Company waived its right to collect the outstanding balance of the loans prior to the earlier of (a) March 30, 2008, or (b) the date after March 30, 2005 on which the closing price of the Company’s stock multiplied by the number of shares purchased equals the outstanding principal and accrued interest on the management stock loans (the Breakeven Date).
Lower Interest Rate
–
Effective May 7, 2004, the Company prospectively waived collection of all interest on the loans in excess of 3.16 percent per annum, which was the “Mid-Term Applicable Federal Rate” for May 2004.
Use of the Company’s Common Stock to Pay Loan Balances
–
The Company may consider receiving shares of our common stock as payment on the loans, which were previously only payable in cash.
Elimination of the Prepayment Penalty
–
The Company waived its right to charge or collect any prepayment penalty on the management common stock loans.
These modifications, including the reduction of the loan program interest rate, were not applied retroactively and participants remain obligated to pay interest previously accrued using the original interest rate. Also during fiscal 2005, our Board of Directors approved loan modifications for a former executive officer and a former director substantially similar to loan modifications previously granted to other loan participants in the management stock loan program as described above.
Prior to the May 2004 modifications, we accounted for the loans and the corresponding shares using a loan-based accounting model. However, due to the nature of the May 2004 modifications, we reevaluated the accounting for the management stock loan program. Based upon relevant accounting guidance, we determined that the management common stock loans should be accounted for as non-recourse stock compensation instruments. While this accounting treatment does not alter the legal rights associated with the loans to the employees as described above, the modifications to the terms of the loans were deemed significant enough to adopt the non-recourse accounting model. Accordingly, the remaining carrying value of the notes and interest receivable related to financing common stock purchases by related parties, which totaled $7.6 million prior to the loan term modifications, was reduced to zero with a corresponding reduction in additional paid-in capital. Since the Company was unable to exercise control over the underlying management common stock loan shares, the loan program shares continued to be included in basic earnings per share (EPS) following the May 2004 modifications.
We currently account for the management common stock loans as equity-classified stock option arrangements. According to share-based accounting rules, additional compensation expense will be recognized only if the Company takes action that constitutes a modification which increases the fair value
of the arrangements. This accounting treatment also precludes us from reversing the amounts expensed as additions to the loan loss reserve, totaling $29.7 million, which were recorded in prior periods.
During fiscal 2006, the Company offered participants in the management common stock loan program the opportunity to formally modify the terms of their loans in exchange for placing their shares of common stock purchased through the loan program in an escrow account that allows the Company to have a security interest in the loan program shares. The key modifications to the management common stock loans for the participants accepting the fiscal 2006 offer were as follows:
Modification of Promissory Note
– The management stock loan due date was changed to be the earlier of (a) March 30, 2013, or (b) the Breakeven Date as defined by the May 2004 modifications. The interest rate on the loans increased from 3.16 percent compounded annually to 4.72 percent compounded annually.
Redemption of Management Loan Program Shares
– The Company has the right to redeem the shares on the due date in satisfaction of the promissory notes as follows:
|
·
|
On the Breakeven Date, the Company has the right to purchase and redeem from the loan participants the number of loan program shares necessary to satisfy the participant’s obligation under the promissory note. The redemption price for each such loan program share will be equal to the closing price of our common stock on the Breakeven Date.
|
|
·
|
If our common stock has not closed at or above the breakeven price on or before March 30, 2013, the Company has the right to purchase and redeem from the participants all of their loan program shares at the closing price on that date as partial payment on the participant’s obligation.
|
The fiscal 2006 modifications were intended to give the Company a measure of control over the outstanding loan program shares and to facilitate payment of the loans should the market value of our common stock equal the principal and accrued interest on the management stock loans. If a loan participant declined the offer to modify their management stock loan, their loan will continue to have the same terms and conditions that were previously approved in May 2004 by our Board of Directors, and their loans will be due at the earlier of March 30, 2008 or the Breakeven Date. Consistent with the May 2004 modifications, stock loan participants will be unable to realize a gain on the loan program shares unless they pay cash to satisfy the promissory note obligation prior to the due date. As of the closing date of the extension offer, which was substantially completed in June 2006, management stock loan participants holding approximately 3.5 million shares, or 94 percent of the remaining loan shares, elected to accept the extension offer and placed their management stock loan shares into the escrow account. The Company is currently in the process of collecting amounts due from participants that declined to place their shares in the escrow account during fiscal 2006.
As a result of this modification, we reevaluated the accounting treatment regarding the loan shares and their inclusion in Basic EPS. Since the management stock loan shares held in the escrow account continue to have the same income participation rights as other common shareholders, we determined that the escrowed loan shares are participating securities. As a result, the management loan shares are included in the calculation of basic EPS in periods of net income and excluded from basic EPS in periods of net loss.
During fiscal 2009, the effective interest rate on the management stock loans was reduced to 1.65 percent, compounded annually, which was the “Mid-Term Applicable Federal Rate” on the date of the interest rate change.
M. Sean Covey, David M.R. Covey, and C. Todd Davis were among the approximately 147 participants in our management stock loan program since March 2000 and, under that program, these individuals owed the Company $759,417 (51,970 shares), $270,597 (18,518 shares), and $192,037 (13,142 shares), respectively, in December 2009. To settle the loans, they each surrendered their loan shares, which were
valued at market on the date of surrender, to the Company in partial payment of their loans and we collected or forgave the remaining loan balances. David M.R. Covey paid the remaining balance owing on his management loan in cash during the quarter ended February 27, 2010. To the extent necessary, we also paid the listed persons a bonus to cover the related taxes that were incurred as a result of this action.
Shawn D. Moon was also a participant in our management stock loan program, and under that plan owed the Company $1,126,595 (for 75,865 shares) at November 30, 2010. To settle the loan, he surrendered his loan shares (valued at market) to the Company in partial payment of the loan and we forgave the remaining loan balance.
During the fourth quarter of fiscal 2012 we acquired 31,063 shares of our common stock from management stock loan participants who declared bankruptcy. These shares were released to us by the bankruptcy court and were valued at the closing price of the Company’s common stock on the date received into treasury by our transfer agent.
The inability of the Company to collect all, or a portion, of the management stock loans could have an adverse impact upon our financial position and cash flows compared to full collection of the loans.
|
11.
|
FINANCIAL INSTRUMENTS
|
Fair Value of Financial Instruments
The book value of our financial instruments at August 31, 2012 and 2011 approximated their fair values. The assessment of the fair values of our financial instruments is based on a variety of factors and assumptions. Accordingly, the fair values may not represent the actual values of the financial instruments that could have been realized at August 31, 2012 or 2011, or that will be realized in the future, and do not include expenses that could be incurred in an actual sale or settlement. The following methods and assumptions were used to determine the fair values of our financial instruments, none of which were held for trading or speculative purposes:
Cash, Cash Equivalents, and Accounts Receivable
–
The carrying amounts of cash, cash equivalents, and accounts receivable approximate their fair values due to the liquidity and short-term maturity of these instruments.
Other Assets
–
Our other assets, including notes receivable, were recorded at the net realizable value of estimated future cash flows from these instruments.
Debt Obligations
–
At August 31, 2012, our debt obligations consisted of a variable-rate line of credit and a variable term loan with a one-year remaining maturity. The interest rate on these obligations is variable and is adjusted to reflect current market interest rates that would be available to us for a similar instrument. In addition, the Revolving Line of Credit agreement is renewed on an annual basis and the terms are reflective of current market conditions. As a result, the carrying value of the obligations on the Revolving Line of Credit and Term Loan approximate their fair value.
Derivative Instruments
During the normal course of business, we are exposed to fluctuations in foreign currency exchange rates due to our international operations and interest rates. To manage risks associated with foreign currency exchange and interest rates, we may make limited use of derivative financial instruments. Derivatives are financial instruments that derive their value from one or more underlying financial instruments. As a matter of policy, our derivative instruments are entered into for periods that do not exceed the related underlying exposures and do not constitute positions that are independent of those exposures. In addition, we do not enter into derivative contracts for trading or speculative purposes, nor were we party
to any leveraged derivative instrument. The notional amounts of derivatives do not represent actual amounts exchanged by the parties to the instrument and thus, are not a measure of exposure to the Company through its use of derivatives. Additionally, we enter into derivative agreements only with highly rated counterparties.
Foreign Currency Exposure
– Due to the global nature of our operations, we are subject to risks associated with transactions that are denominated in currencies other than the United States dollar, as well as the effects of translating amounts denominated in foreign currencies to United States dollars as a normal part of the reporting process. The objective of our foreign currency risk management activities is to reduce foreign currency risk in the consolidated financial statements. In order to manage foreign currency risks, we may make limited use of foreign currency forward contracts and other foreign currency related derivative instruments in the normal course of business. Although we cannot eliminate all aspects of our foreign currency risk, we believe that our strategy, which may include the use of derivative instruments, can reduce the impacts of foreign currency related issues on our consolidated financial statements.
During the fiscal year ended August 31, 2010 we utilized foreign currency forward contracts to manage the volatility of certain intercompany financing transactions and other transactions that are denominated in foreign currencies. Because these contracts did not meet specific hedge accounting requirements, gains and losses on these contracts, which expired on a quarterly basis, were recognized in selling, general, and administrative expense, and were used to offset a portion of the gains or losses of the related accounts. We recognized losses totaling $0.2 million from these contracts during fiscal 2010.
Interest Rate Risk Management
–
Due to the limited nature of our current interest rate risk, we do not make regular use of interest rate derivatives, and we were not a party to any interest rate derivative instruments during the fiscal years ended August 31, 2012, 2011, or 2010.
12. SHARE-BASED COMPENSATION PLANS
Overview
We utilize various share-based compensation plans as integral components of our overall compensation and associate retention strategy. Our shareholders have approved various stock incentive plans that permit us to grant performance awards, unvested share awards, stock options, and employee stock purchase plan (ESPP) shares. In addition, our Board of Directors and shareholders may, from time to time, approve fully vested share awards. Our share-based compensation plans are overseen and approved by the Organization and Compensation Committee of the Board of Directors (the Compensation Committee). At August 31, 2012, our stock option incentive plan, which permits the granting of performance awards, unvested stock awards to non-employee members of the Board of Directors and employees, and incentive stock options had approximately 770,000 shares available for granting. Our 2004 ESPP had approximately 615,000 shares remaining for purchase by plan participants as of August 31, 2012. The total cost of our share-based compensation plans for the fiscal years ended August 31, 2012, 2011, and 2010 were as follows (in thousands):
|
YEAR ENDED
|
||||||||||||
|
AUGUST 31,
|
2012
|
2011
|
2010
|
|||||||||
|
Performance awards
|
$ | 3,188 | $ | 827 | $ | 327 | ||||||
|
Unvested share awards
|
340 | 411 | 458 | |||||||||
|
Stock options
|
168 | 820 | 261 | |||||||||
|
Compensation cost of the ESPP
|
77 | 61 | 53 | |||||||||
|
Fully vested share awards
|
62 | 669 | - | |||||||||
| $ | 3,835 | $ | 2,788 | $ | 1,099 | |||||||
The compensation cost of our share-based compensation plans was included in selling, general, and administrative expenses in the accompanying consolidated statements of operations, and no share-based
compensation was capitalized during fiscal years 2012, 2011, or 2010. We issue shares of common stock for our share-based compensation plans from shares held in treasury. The following is a description of our share-based compensation plans.
Performance Awards
Common Stock Price Performance Award
– On July 15, 2011, the Compensation Committee approved a share-based compensation plan that will allow certain members of our management team to receive shares of the Company’s common stock if the price of our common stock averages specified levels over a five-day period. If the price of our common stock achieves the specified levels within three years of the grant date, 100 percent of the awarded shares will vest. If the price of our common stock reaches the specified levels between three and five years from the grant date, only 50 percent of the performance shares will vest. No shares will vest to participants if the specified price targets are met after five years from the grant date. We believe that this award program will increase shareholder value as shares will only be awarded to participants if the Company’s share price significantly increases over a relatively short period of time.
This award was designed to grant approximately one-half of the total award shares in fiscal 2011, approximately one-fourth of the award shares in fiscal 2012, and the remaining approximate one-fourth are expected to be granted in fiscal 2013. We granted performance awards for 177,616 shares in fiscal 2012 and 294,158 shares in fiscal 2011 under this award.
Since this performance award has market-based vesting conditions, the fair value and expected term of the grants under this award were determined using Monte Carlo simulation valuation models. The following assumptions were made in estimating the fair values of the grants made under this market-based performance award:
|
Model Input
|
Fiscal 2012
Grant
|
Fiscal 2011
Grant
|
||||||
|
Grant date share price per share
|
$ | 9.55 | $ | 11.34 | ||||
|
Volatility
|
54.6 | % | 49.83 | % | ||||
|
Dividend yield
|
0.0 | % | 0.0 | % | ||||
|
Risk-free rate
|
0.62 | % | 1.48 | % | ||||
|
Grant date
|
July 19, 2012
|
July 15, 2011
|
||||||
The fair value of the fiscal 2012 performance award was determined to be $1.2 million, which is being amortized over 1.4 years. The fair value of the fiscal 2011 award was $2.6 million, which was amortized over 0.9 years (fully amortized in fiscal 2012). At August 31, 2012, there was $1.0 million of unrecognized compensation cost associated with the fiscal 2012 grant.
Fiscal 2012 Executive Award
- During the first quarter of fiscal 2012, the Compensation Committee granted a new performance based equity award for the Chief Executive Officer (CEO), Chief Financial Officer (CFO), and the Chief People Officer (CPO). A total of 106,101 shares may be issued to the participants based on six individual vesting conditions that are divided into two performance measures, Adjusted EBITDA and Productivity Practice sales. Three tranches of 24,757 shares will immediately vest to the participants when consolidated trailing four-quarter Adjusted EBITDA totals $26.0 million, $33.0 million, and $40.0 million. Another three tranches of 10,610 shares will immediately vest when trailing four-quarter Productivity Practice sales total $20.5 million, $23.5 million, and $26.5 million. These performance awards have a maximum life of six years. Compensation expense is recognized as we determine that it is probable that the shares will vest. Adjustments to compensation expense to reflect the number of shares expected to be awarded will be made on a cumulative basis at the date of the adjustment. As of August 31, 2012, the Company met the first Adjusted EBITDA goal and the first tranche of 24,757 shares vested to the participants. The first tranche of the Productivity Practice sales component of the award is not expected to vest until mid-fiscal 2013.
Fiscal 2011 Executive Award
– During the fourth quarter of fiscal 2011, the Compensation Committee approved a share-based award for three members of our executive team for strong financial performance during the fiscal year. The target award totaled 72,134 shares of which 24,045 shares were approved and granted as performance awards (the remaining shares were issued as fully vested awards—refer to the discussion below). For these shares to vest to the participants, the Company was required to achieve a certain level of earnings, which occurred at August 31, 2011, and the participants were required to complete a one-year service condition that started once the earnings condition was met. The compensation cost of this award totaled $0.3 million, which was recognized over 1.2 years. During the fourth quarter of fiscal 2012, the Compensation Committee allowed the participants in this award to receive cash rather than the shares which would have been awarded at the completion of the service period. This transaction was treated as a repurchase of the original equity award and participants received a cash award equal to the number shares that were to be issued multiplied by our closing common stock price on August 31, 2012, which was less than the share price on the grant date.
Fiscal 2010 Long-Term Incentive Plan Award
– Our shareholders have approved a performance based long-term incentive plan (the LTIP) that provides for grants of share-based performance awards to certain managerial personnel and executive management as directed by the Compensation Committee. The number of common shares that eventually vest and are issued to LTIP participants is variable and is based entirely upon the achievement of specified financial performance objectives during a defined performance period. Due to the variable number of common shares that may be issued under the LTIP, we reevaluate our LTIP grants on a quarterly basis and adjust the number of shares expected to be issued based upon actual and estimated financial results of the Company compared to the performance goals set for the award. Adjustments to the number of shares awarded, and to the corresponding compensation expense, are made on a cumulative basis at the adjustment date based upon the estimated probable number of common shares to be issued.
During fiscal 2010, the Compensation Committee approved the fiscal 2010 LTIP award, which includes the following key terms:
|
·
|
Adjusted Target Number of Shares Expected to Vest at August 31, 2012 – 182,385 shares
|
|
·
|
Vesting Dates – August 31, 2012, February 28, 2013, and August 31, 2013
|
|
·
|
Grant Date Fair Value of Common Stock – $5.28 per share
|
The fiscal 2010 LTIP has a four-year performance period, but has three vesting dates if certain financial measures are achieved during the performance period. Therefore, we record compensation expense based on the estimated number of shares expected to be issued at each of the vesting dates. Based on financial performance for the three-year period ending August 31, 2012, it was determined that plan participants were entitled to receive 94.7% of the target shares, or 172,737 shares, at the first vesting date. Based on projected financial results through the second and third vesting dates, we currently expect to award approximately 40,000 additional shares over the remainder of the fiscal 2010 LTIP award. The cumulative adjustment to the fiscal 2010 LTIP award at August 31, 2012 was immaterial to our financial statements.
Stock Options
We have an incentive stock option plan whereby options to purchase shares of our common stock may be issued to key employees at an exercise price not less than the fair market value of the Company’s common stock on the date of grant. The term, not to exceed ten years, and exercise period of each incentive stock option awarded under the plan are determined by the Compensation Committee.
Information related to our stock option activity during the fiscal year ended August 31, 2012 is presented below:
|
Weighted
|
||||||||||||||||
|
Weighted
|
Average
|
|||||||||||||||
|
Avg. Exercise
|
Remaining
|
Aggregate
|
||||||||||||||
|
Number of
|
Price Per
|
Contractual
|
Intrinsic Value
|
|||||||||||||
|
Stock Options
|
Share
|
Life (Years)
|
(thousands)
|
|||||||||||||
|
Outstanding at August 31, 2011
|
675,000 | $ | 11.25 | |||||||||||||
|
Granted
|
- | - | ||||||||||||||
|
Exercised
|
- | - | ||||||||||||||
|
Forfeited
|
- | - | ||||||||||||||
|
Outstanding at August 31, 2012
|
675,000 | $ | 11.25 | 7.8 | $ | 287 | ||||||||||
|
Options vested and exercisable at
|
||||||||||||||||
|
August 31, 2012
|
- | $ | - | - | $ | - | ||||||||||
Our stock options awarded in fiscal 2011 and fiscal 2010 each have a contractual life of 10 years and are divided into four equal tranches with exercise prices of $9.00 per share, $10.00 per share, $12.00 per share, and $14.00 per share. The options vest upon resolution of the management common stock loan program, subject to Board of Director approval of the resolution, which was determined to be a market vesting condition based upon our common stock price. Accordingly, the fair value of these stock options was determined using a Monte Carlo simulation with an embedded Black-Scholes valuation model. The following assumptions were used to estimate the stated fair value of the stock options awarded during the fiscal years ended August 31, 2011 and 2010 (fair value of the options is stated in thousands):
|
Model Input
|
Fiscal 2011 Stock Options
|
Fiscal 2010 Stock Options
|
||||||
|
Grant date share price per share
|
$ | 8.43 | $ | 5.28 | ||||
|
Volatility
|
59.02 | % | 51.47 | % | ||||
|
Dividend yield
|
0.0 | % | 0.0 | % | ||||
|
Risk-free rate
|
0.7 | % | 1.57 | % | ||||
|
Fair value of award
|
$ | 756 | $ | 493 | ||||
|
Estimated time to vest (years)
|
0.9 | 1.8 | ||||||
At August 31, 2012, there was no remaining unrecognized compensation expense related to our stock options. The following additional information applies to our stock options outstanding at August 31, 2012:
|
Weighted
|
||||||||||||||||||||||
|
Number
|
Average
|
Options
|
||||||||||||||||||||
|
Outstanding
|
Remaining
|
Weighted
|
Exercisable at
|
Weighted
|
||||||||||||||||||
|
at August 31,
|
Contractual
|
Average
|
August 31,
|
Average
|
||||||||||||||||||
|
Exercise Prices
|
2012
|
Life (Years)
|
Exercise Price
|
2012
|
Exercise Price
|
|||||||||||||||||
| $ | 9.00 | 168,750 | 7.8 | $ | 9.00 | - | $ | - | ||||||||||||||
| $ | 10.00 | 168,750 | 7.8 | $ | 10.00 | - | - | |||||||||||||||
| $ | 12.00 | 168,750 | 7.8 | $ | 12.00 | - | - | |||||||||||||||
| $ | 14.00 | 168,750 | 7.8 | $ | 14.00 | - | - | |||||||||||||||
| 675,000 | - | |||||||||||||||||||||
Stock options exercised during fiscal 2011 were settled using the net share method by issuing 4,061 shares of our common stock and we therefore did not receive any proceeds from this transaction. No stock options were exercised during fiscal 2012 or fiscal 2010. The intrinsic value of stock options
exercised was $36,750 for the fiscal year ended August 31, 2011. No stock options vested during the fiscal years ended August 31, 2012, 2011, or 2010.
Unvested Stock Awards
The fair value of our unvested stock awards is calculated by multiplying the number of shares awarded by the closing market price of our common stock on the date of the grant. The corresponding compensation cost of unvested stock awards is amortized to selling, general, and administrative expense on a straight-line basis over the vesting period of the award. The following is a description of our unvested stock awards granted to non-employee members of our Board of Directors.
The annual Board of Director unvested stock award, which is administered under the terms of the Franklin Covey Co. Second Amended and Restated 1992 Stock Incentive Plan, is designed to provide our non-employee directors, who are not eligible to participate in our employee stock incentive plan, an opportunity to obtain an interest in the Company through the acquisition of shares of our common stock. Each eligible director is entitled to receive a whole-share grant equal to $50,000 with a one-year vesting period, which is generally granted in January (following the Annual Shareholders’ Meeting) of each year. Shares granted under the terms of this annual award are ineligible to be voted or participate in any common stock dividends until they are vested.
Under the terms of this award, we issued 37,975 shares, 37,960 shares, and 61,064 shares of our common stock to eligible members of the Board of Directors during the fiscal years ended August 31, 2012, 2011, and 2010. The fair value of the shares awarded to the directors was approximately $0.3 million for each fiscal year as calculated on the grant date of the award. The corresponding compensation cost is being recognized over the vesting period of the awards, which is one year. The cost of the common stock issued from treasury for these awards was $0.5 million, $0.6 million, and $0.9 million in fiscal years 2012, 2011, and 2010.
The following information applies to our unvested stock awards for the fiscal year ended August 31, 2012:
|
Weighted-
|
||||||||
|
Average Grant-
|
||||||||
|
Date Fair
|
||||||||
|
Number of
|
Value Per
|
|||||||
|
Shares
|
Share
|
|||||||
|
Unvested stock awards at
|
||||||||
|
August 31, 2011
|
37,960 | $ | 8.43 | |||||
|
Granted
|
37,975 | 9.39 | ||||||
|
Forfeited
|
- | - | ||||||
|
Vested
|
(37,960 | ) | 8.43 | |||||
|
Unvested stock awards at
|
||||||||
|
August 31, 2012
|
37,975 | $ | 9.39 | |||||
A fiscal 2011 award for 24,045 shares that was previously included in the unvested share award table was subsequently determined to be a performance award. Therefore, discussion of these shares is included in the performance awards section above. There was no impact on the compensation expense recognized for this award. At August 31, 2012, there was $0.1 million of unrecognized compensation cost related to unvested stock awards, which is expected to be recognized over the weighted-average vesting period of approximately three months. The total recognized tax benefit from unvested stock awards totaled $0.1 million, $0.1 million, and $0.2 million for the fiscal years ended August 31, 2012, 2011, and 2010, respectively. The intrinsic value of our unvested stock awards at August 31, 2012 was $0.4 million.
Fully Vested Stock Awards
During fiscal 2011, the Compensation Committee approved two fully vested share awards. The fair value of these fully vested share awards is calculated by multiplying the number of shares awarded by the closing price of the Company’s common share price on the date of grant.
Executive Leadership Award
– During fiscal 2011, the Compensation Committee approved a share-based award for three members of our executive team for strong financial performance during the fiscal year. The target award totaled 72,134 shares of which 48,049 shares were approved and granted as fully vested shares (the remaining shares were issued as unvested awards—refer to the discussion above). The resulting share-based compensation expense of $0.5 million was recorded on the date of grant.
Client Partner and Consultant Award
– During fiscal 2011 we implemented a new fully vested share-based award program that is designed to reward client partners and consultants for exceptional performance. The program grants 2,000 shares of common stock to each client partner or consultant who has sold over $20.0 million in cumulative sales or delivered over 1,500 hours of consulting during their career. For the year ended August 31, 2012, three individuals qualified for the award and 6,000 shares of our common stock were awarded to these individuals. In fiscal 2011, eight individuals qualified for the award and 16,000 shares in total were subsequently issued to these individuals. Accordingly, we expensed $0.1 million of share-based compensation cost for these awards during the fiscal years ended August 31, 2012 and August 31, 2011. We anticipate that only a limited number of client partners or consultants may qualify for this award in future years. Due to the immateriality of expected awards in future periods, we did not record an obligation for future awards at August 31, 2012 or August 31, 2011.
Employee Stock Purchase Plan
The Company has an employee stock purchase plan (ESPP) that offers qualified employees the opportunity to purchase shares of our common stock at a price equal to 85 percent of the average fair market value of our common stock on the last trading day of each quarter. A total of 55,423 shares, 49,962 shares, and 56,475 shares were issued to ESPP participants during the fiscal years ended August 31, 2012, 2011, and 2010, which had a corresponding cost basis of $0.8 million, $0.7 million, and $0.8 million, respectively. The Company received cash proceeds from the ESPP participants totaling $0.4 million in fiscal 2012 and $0.3 million in each of the fiscal years 2011 and 2010.
13. SALE OF JAPAN PRODUCT SALES OPERATION
During fiscal 2010, we sold the product sales component of our wholly owned subsidiary in Japan to Nakabayashi Co. Ltd., an unrelated Japan-based paper products company. The sale included the disposition of inventories, certain intangibles assets (including customer lists), and other current assets, which had an aggregate carrying value of $2.0 million. The sale closed on June 1, 2010 and the total sale price was JPY 305.0 million, or approximately $3.4 million. We recognized a pre-tax gain from the sale totaling $1.1 million after normal transaction costs. In addition, the sale agreement provides for a three percent passive royalty on annual sales, which is insignificant to our operations. The sale of this division was designed to further align our Japanese operations with our overall strategic focus on training and consulting sales. The Japan products sales component was previously reported as a part of our international operations.
We determined that the operating results of the Japan product sales component qualify for discontinued operations presentation and we have presented the operating results of the Japan product sales component as discontinued operations for all periods presented in this report. The income recognized from discontinued operations was comprised of the following in fiscal 2010 (in thousands):
|
AUGUST 31,
|
2010
|
|||
|
Sales
|
$ | 5,097 | ||
|
Gross profit
|
2,230 | |||
|
Income before income taxes
|
988 | |||
|
Income tax provision
|
(440 | ) | ||
|
Income from discontinued
|
||||
|
operations, net of tax
|
548 | |||
|
14.
|
EMPLOYEE BENEFIT PLANS
|
Profit Sharing Plans
We have defined contribution profit sharing plans for our employees that qualify under Section 401(k) of the Internal Revenue Code. These plans provide retirement benefits for employees meeting minimum age and service requirements. Qualified participants may contribute up to 75 percent of their gross wages, subject to certain limitations. These plans also provide for matching contributions to the participants that are paid by the Company. The matching contributions, which were expensed as incurred, totaled $1.2 million, $1.2 million, and $0.9 million during the fiscal years ended August 31, 2012, 2011, and 2010. We do not sponsor or participate in any defined benefit pension plans.
Deferred Compensation Plan
We have a non-qualified deferred compensation (NQDC) plan that provided certain key officers and employees the ability to defer a portion of their compensation until a later date. Deferred compensation amounts used to pay benefits were held in a “rabbi trust,” which invested in insurance contracts, various mutual funds, and shares of our common stock as directed by the plan participants. However, due to legal changes resulting from the American Jobs Creation Act of 2004, we determined to cease compensation deferrals to the NQDC plan after December 31, 2004. Following the cessation of deferrals to the NQDC plan, the number of participants remaining in the plan declined steadily, and our Board of Directors decided to partially terminate the NQDC plan. Following this decision, all of the plan’s assets were liquidated, the plan’s liabilities were paid, and the only remaining items in the NQDC plan are shares of our common stock owned by the remaining plan participants. At August 31, 2012 and 2011, the cost basis of the shares of our common stock held by the rabbi trust was $0.4 million.
|
15.
|
INCOME TAXES
|
The provision (benefit) for income taxes from continuing operations consisted of the following (in thousands):
|
YEAR ENDED
|
||||||||||||
|
AUGUST 31,
|
2012
|
2011
|
2010
|
|||||||||
|
Current:
|
||||||||||||
|
Federal
|
$ | - | $ | - | $ | (454 | ) | |||||
|
State
|
228 | 204 | 16 | |||||||||
|
Foreign
|
2,553 | 1,643 | 1,555 | |||||||||
| 2,781 | 1,847 | 1,117 | ||||||||||
|
Deferred:
|
||||||||||||
|
Federal
|
1,311 | (430 | ) | 1,254 | ||||||||
|
State
|
(3 | ) | (149 | ) | (43 | ) | ||||||
|
Foreign
|
(269 | ) | 45 | (488 | ) | |||||||
|
Benefit of foreign tax credit
|
||||||||||||
|
carryforward
|
(2,677 | ) | (3,788 | ) | - | |||||||
|
Utilization of net loss carryforwards
|
4,763 | 6,012 | 468 | |||||||||
|
Provision resulting from the allocation
|
||||||||||||
|
of certain tax items directly to
|
||||||||||||
|
contributed capital
|
- | 102 | 176 | |||||||||
| 3,125 | 1,792 | 1,367 | ||||||||||
| $ | 5,906 | $ | 3,639 | $ | 2,484 | |||||||
The allocation of total income tax provision (benefit) is as follows (in thousands):
|
YEAR ENDED
|
||||||||||||
|
AUGUST 31,
|
2012
|
2011
|
2010
|
|||||||||
|
Continuing operations
|
$ | 5,906 | $ | 3,639 | $ | 2,484 | ||||||
|
Other comprehensive income
|
(73 | ) | 310 | (229 | ) | |||||||
|
Discontinued operations
|
- | - | 440 | |||||||||
|
Gain on sale of discontinued
|
- | |||||||||||
|
operations
|
- | - | 854 | |||||||||
| $ | 5,833 | $ | 3,949 | $ | 3,549 | |||||||
Income from continuing operations before income taxes consisted of the following (in thousands):
|
YEAR ENDED
|
||||||||||||
|
AUGUST 31,
|
2012
|
2011
|
2010
|
|||||||||
|
United States
|
$ | 11,006 | $ | 7,438 | $ | 1,127 | ||||||
|
Foreign
|
2,741 | 1,008 | 53 | |||||||||
| $ | 13,747 | $ | 8,446 | $ | 1,180 | |||||||
The differences between income taxes at the statutory federal income tax rate and income taxes from continuing operations reported in our consolidated statements of operations were as follows:
|
YEAR ENDED
AUGUST 31,
|
2012
|
2011
|
2010
|
|||||||||
|
Federal statutory income tax rate
|
35.0 | % | 35.0 | % | 35.0 | % | ||||||
|
State income taxes, net of federal effect
|
2.7 | 3.7 | 1.2 | |||||||||
|
Foreign jurisdictions tax differential
|
1.8 | 0.3 | (4.2 | ) | ||||||||
|
Tax differential on income subject to both U.S. and foreign taxes
|
(3.4 | ) | (5.7 | ) | 140.6 | |||||||
|
Uncertain tax positions
|
3.2 | 3.7 | (21.2 | ) | ||||||||
|
Tax on management stock loan interest
|
2.2 | 3.6 | 25.9 | |||||||||
|
Non-deductible executive compensation
|
1.4 | 1.3 | 26.8 | |||||||||
|
Non-deductible meals and entertainment
|
0.9 | 1.5 | 7.4 | |||||||||
|
Other
|
(0.8 | ) | (0.3 | ) | (0.9 | ) | ||||||
| 43.0 | % | 43.1 | % | 210.6 | % | |||||||
We paid significant amounts of withholding tax on foreign royalties during fiscal years 2012, 2011, and 2010. We also recognized taxable income on repatriated earnings from foreign income that are taxed in both foreign and domestic jurisdictions. During fiscal 2012 and fiscal 2011, we concluded that domestic foreign tax credits will be available to offset our foreign withholding taxes and U.S. taxes on foreign dividends for those years. However, for fiscal 2010 we concluded that no domestic foreign tax credits were available to offset the foreign withholding taxes and the U.S. taxes on foreign dividends.
We accrue taxable interest income on outstanding management common stock loans (Note 10). Consistent with the accounting treatment for these loans, we are not recognizing interest income for book purposes, thus resulting in a permanent book versus tax difference.
The significant components of our deferred tax assets and liabilities were comprised of the following (in thousands):
|
YEAR ENDED
|
||||||||
|
AUGUST 31,
|
2012
|
2011
|
||||||
|
Deferred income tax assets:
|
||||||||
|
Sale and financing of corporate
|
||||||||
|
headquarters
|
$ | 10,953 | $ | 11,171 | ||||
|
Foreign income tax credit
|
||||||||
|
carryforward
|
6,205 | 5,946 | ||||||
|
Deferred compensation
|
2,296 | 1,003 | ||||||
|
Bonus and other accruals
|
1,399 | 1,403 | ||||||
|
Unearned revenue
|
1,188 | 784 | ||||||
|
Inventory and bad debt reserves
|
746 | 639 | ||||||
|
Net operating loss carryforward
|
289 | 4,128 | ||||||
|
Alternative minimum tax carryforward
|
392 | 393 | ||||||
|
Investment in FC Organizational
|
||||||||
|
Products
|
275 | 1,466 | ||||||
|
Sales returns and contingencies
|
253 | 248 | ||||||
|
Impairment of FC Organizational
|
||||||||
|
Products note receivable
|
- | 1,653 | ||||||
|
Impairment of investment in Franklin
|
||||||||
|
Covey Coaching, LLC
|
- | 46 | ||||||
|
Other
|
163 | 151 | ||||||
|
Total deferred income tax assets
|
24,159 | 29,031 | ||||||
|
Less: valuation allowance
|
- | (2,159 | ) | |||||
|
Net deferred income tax assets
|
24,159 | 26,872 | ||||||
|
Deferred income tax liabilities:
|
||||||||
|
Intangibles step-ups – indefinite lived
|
(8,667 | ) | (8,597 | ) | ||||
|
Intangibles step-ups – definite lived
|
(8,371 | ) | (8,866 | ) | ||||
|
Property and equipment depreciation
|
(4,822 | ) | (5,430 | ) | ||||
|
Intangible asset impairment and
|
||||||||
|
amortization
|
(4,919 | ) | (4,319 | ) | ||||
|
Unremitted earnings of foreign
|
||||||||
|
subsidiaries
|
(582 | ) | (609 | ) | ||||
|
Other
|
(142 | ) | (114 | ) | ||||
|
Total deferred income tax liabilities
|
(27,503 | ) | (27,935 | ) | ||||
|
Net deferred income taxes
|
$ | (3,344 | ) | $ | (1,063 | ) | ||
Deferred income tax amounts are recorded as follows in our consolidated balance sheets (in thousands):
|
YEAR ENDED
|
||||||||
|
AUGUST 31,
|
2012
|
2011
|
||||||
|
Current assets
|
$ | 3,634 | $ | 3,005 | ||||
|
Long-term assets
|
23 | 16 | ||||||
|
Long-term liabilities
|
(7,001 | ) | (4,084 | ) | ||||
|
Net deferred income tax liability
|
$ | (3,344 | ) | $ | (1,063 | ) | ||
Federal net operating losses of $33.3 million and $21.2 million were generated in fiscal 2003 and 2004, respectively, all of which have been utilized.
In fiscal 2009, a federal net operating loss of $9.7 million was generated. During fiscal 2012, a total of $6.5 million of the fiscal 2009 loss carryforward was utilized, leaving a remaining loss carryforward from fiscal 2009 of $3.2 million, which expires on August 31, 2029. The total loss carryforward of $3.2 million includes $1.6 million of deductions applicable to additional paid-in capital that will be credited once the loss carryforward amounts are utilized.
We also have state net operating loss carryforwards generated in various state jurisdictions that expire primarily between August 31, 2013 and August 31, 2029.
Our U.S. foreign income tax credit carryforward of $2.2 million that was generated during fiscal 2002 expired on August 31, 2012. Our U.S. foreign income tax credit carryforwards generated in fiscal 2012 and fiscal 2011 of $2.7 million and $3.5 million expire on August 31, 2022 and 2021, respectively.
Valuation Allowance on Deferred Tax Assets
The foreign tax credit of $2.2 million that was generated in fiscal 2002 expired in fiscal 2012. Accordingly, the corresponding valuation allowance of $2.2 million previously recorded against the foreign tax credit was reversed in fiscal 2012, leaving no remaining valuation allowance against any of our deferred income tax assets at August 31, 2012. We have determined that projected future taxable income is adequate to allow for realization of all domestic deferred tax assets. We considered sources of taxable income, including future reversals of taxable temporary differences, future taxable income exclusive of reversing temporary differences and carryforwards, and reasonable, practical tax-planning strategies to generate additional taxable income. Based on the factors described above, we concluded that realization of all our domestic deferred tax assets is more likely than not at August 31, 2012.
The table below presents the pre-tax book income, significant book versus tax differences, and taxable income for the years ended August 31, 2012, 2011, and 2010 (in thousands).
|
YEAR ENDED
|
||||||||||||
|
AUGUST 31,
|
2012
|
2011
|
2010
|
|||||||||
|
Domestic pre-tax book income
|
$ | 11,006 | $ | 7,438 | $ | 1,745 | ||||||
|
Share-based compensation
|
3,405 | 1,700 | 359 | |||||||||
|
Actual and deemed foreign dividends
|
2,484 | 5,409 | 2,502 | |||||||||
|
Property and equipment depreciation
|
||||||||||||
|
and dispositions
|
1,664 | 1,766 | 1,482 | |||||||||
|
Unearned revenue
|
1,057 | 37 | 1,534 | |||||||||
|
Interest on management common
|
||||||||||||
|
stock loans
|
870 | 376 | 313 | |||||||||
|
Disallowed executive compensation
|
549 | 537 | 755 | |||||||||
|
Changes in accrued liabilities
|
88 | 1,091 | (724 | ) | ||||||||
|
Impairment of note receivable from
|
||||||||||||
|
FC Organizational Products
|
(4,667 | ) | 390 | 315 | ||||||||
|
Taxable losses from FC Organizational
|
||||||||||||
|
Products
|
(2,916 | ) | (748 | ) | (3,073 | ) | ||||||
|
Amortization/write-off of intangible
|
||||||||||||
|
assets
|
(92 | ) | (1,274 | ) | (617 | ) | ||||||
|
Deduction for foreign income taxes
|
- | - | (1,272 | ) | ||||||||
|
Sale of corporate headquarters campus
|
(822 | ) | (683 | ) | (585 | ) | ||||||
|
Other book versus tax differences
|
(30 | ) | 281 | 232 | ||||||||
| $ | 12,596 | $ | 16,320 | $ | 2,966 | |||||||
Uncertain Tax Positions
A reconciliation of the beginning and ending amount of gross unrecognized tax benefits is as follows (in thousands):
|
YEAR ENDED
|
||||||||||||
|
AUGUST 31,
|
2012
|
2011
|
2010
|
|||||||||
|
Beginning balance
|
$ | 3,703 | $ | 3,940 | $ | 4,225 | ||||||
|
Additions based on tax positions
|
||||||||||||
|
related to the current year
|
297 | 6 | 46 | |||||||||
|
Additions for tax positions in
|
||||||||||||
|
prior years
|
327 | 384 | 173 | |||||||||
|
Reductions for tax positions of prior
|
||||||||||||
|
years resulting from the lapse of
|
||||||||||||
|
applicable statute of limitations
|
- | - | (425 | ) | ||||||||
|
Other reductions for tax positions of
|
||||||||||||
|
prior years
|
(115 | ) | (627 | ) | (79 | ) | ||||||
|
Ending balance
|
$ | 4,212 | $ | 3,703 | $ | 3,940 | ||||||
The total amount of unrecognized tax benefits that, if recognized, would affect the effective tax rate is $3.1 million and $2.8 million at August 31, 2012 and 2011. Included in the ending balance of gross unrecognized tax benefits is $3.2 million related to individual states’ net operating loss carryforwards. Interest and penalties related to uncertain tax positions are recognized as components of income tax expense. The net accruals and reversals of interest and penalties increased income tax expense by $0.1 million in fiscal 2012, increased income tax expense by an insignificant amount in fiscal 2011, and decreased income tax expense by $0.1 million in fiscal 2010. The balance of interest and penalties
included on our consolidated balance sheets at August 31, 2012 and 2011 was $0.2 million and $0.1 million, respectively. We expect an increase of $0.3 million in our unrecognized tax benefits over the next twelve months, primarily related to the utilization of individual states’ net operating loss carryforwards.
We file United States federal income tax returns as well as income tax returns in various states and foreign jurisdictions. The tax years that remain subject to examinations for our major tax jurisdictions are shown below. Additionally, any net operating losses that were generated in prior years and utilized in these years may be subject to examination.
|
2005-2012
|
Canada
|
|
2006-2012
|
Australia
|
|
2007-2012
|
Japan, United Kingdom
|
|
2008-2012
|
United States – state and local income tax
|
|
2009-2012
|
United States – federal income tax
|
|
16.
|
EARNINGS PER SHARE
|
Basic earnings per common share (EPS) is calculated by dividing net income or loss by the weighted-average number of common shares outstanding for the period. Diluted EPS is calculated by dividing net income or loss by the weighted-average number of common shares outstanding plus the assumed exercise of all dilutive securities using the treasury stock method or the “if converted” method, as appropriate. Due to modifications to our management stock loan program in prior periods, we determined that the shares of management stock loan participants that were placed in the escrow account are participating securities because they continue to have equivalent common stock dividend rights. Accordingly, these management stock loan shares are included in our basic EPS calculation during periods of net income and excluded from the basic EPS calculation in periods of net loss. The following table presents the computation of our EPS for the periods indicated (in thousands, except per share amounts):
|
YEAR ENDED
|
||||||||||||
|
AUGUST 31,
|
2012
|
2011
|
2010
|
|||||||||
|
Numerator for basic and
|
||||||||||||
|
diluted earnings per share:
|
||||||||||||
|
Income (loss) from continuing
|
||||||||||||
|
operations
|
$ | 7,841 | $ | 4,807 | $ | (1,304 | ) | |||||
|
Income from discontinued
|
||||||||||||
|
operations, net of tax
|
- | - | 548 | |||||||||
|
Gain on sale of discontinued
|
||||||||||||
|
operations, net of tax
|
- | - | 238 | |||||||||
|
Net income (loss)
|
$ | 7,841 | $ | 4,807 | $ | (518 | ) | |||||
|
Denominator for basic and
|
||||||||||||
|
diluted earnings per share:
|
||||||||||||
|
Basic weighted average shares
|
||||||||||||
|
outstanding
(1)
|
17,772 | 17,106 | 13,525 | |||||||||
|
Effect of dilutive securities:
|
||||||||||||
|
Stock options and other
|
||||||||||||
|
share-based awards
|
71 | 42 | - | |||||||||
|
Common stock warrants
(2)
|
517 | 399 | - | |||||||||
|
Diluted weighted average shares
|
||||||||||||
|
outstanding
|
18,360 | 17,547 | 13,525 | |||||||||
|
EPS Calculations:
|
||||||||||||
|
Income (loss) from continuing
|
||||||||||||
|
operations per share:
|
||||||||||||
|
Basic
|
$ | 0.44 | $ | 0.28 | $ | (0.10 | ) | |||||
|
Diluted
|
0.43 | 0.27 | (0.10 | ) | ||||||||
|
Income from discontinued
|
||||||||||||
|
operations, net of tax, per share:
|
||||||||||||
|
Basic and diluted
|
- | - | 0.04 | |||||||||
|
Gain on sale of discontinued
|
||||||||||||
|
operations, net of tax, per share:
|
||||||||||||
|
Basic and diluted
|
- | - | 0.02 | |||||||||
|
Net income (loss) per share:
|
||||||||||||
|
Basic
|
0.44 | 0.28 | (0.04 | ) | ||||||||
|
Diluted
|
0.43 | 0.27 | (0.04 | ) | ||||||||
|
(1)
|
Since we recognized net income for the fiscal years ended August 31, 2012 and August 31, 2011, basic weighted average shares for those periods includes 3.3 million shares of common stock held by management stock loan participants that were placed in escrow. These shares were excluded from basic weighted-average shares for the fiscal year ended August 31, 2010.
|
|
(2)
|
For the fiscal year ended August 31, 2010, the conversion of 6.2 million common stock warrants is not assumed because such conversion would be anti-dilutive.
|
At August 31, 2012, 2011, and 2010, we had 0.7 million, 0.7 million, and 0.5 million stock options outstanding (Note 12) that were not included in the calculation of diluted weighted average shares outstanding for those periods because the options’ exercise prices were greater than the average market
price of our common stock or the options were otherwise unexerciseable. We also have 4.3 million common stock warrants outstanding at August 31, 2012 that have an exercise price of $8.00 per share (Note 9). These warrants, which expire in March 2013, and unexercisable stock options described above will have a more pronounced dilutive impact on our EPS calculation in future periods if the market price of our common stock increases.
Subsequent to August 31, 2012, Knowledge Capital exercised its warrant with respect to 1,000,000 shares on a net settlement basis. Accordingly, we issued 340,877 shares of our common stock to Knowledge Capital from treasury under the terms of the foregoing agreement. These shares will increase our weighted average outstanding shares in future periods.
|
17.
|
SEGMENT INFORMATION
|
Operating Segment Information
Our sales are primarily comprised of training and consulting sales and related products. Based on the consistent nature of our services and products and the types of customers for these services, we function as a single operating segment. However, to improve comparability with previous periods, operating information for our U.S./Canada, international, and corporate services operations is presented below. Our U.S./Canada operations are responsible for the sale and delivery of our training and consulting services in the United States and Canada. Our international sales group includes the financial results of our foreign offices and royalty revenues from licensees. Our corporate services information includes leasing income and certain corporate operating expenses.
The Company’s chief operating decision maker is the CEO, and the primary measurement tool used in business unit performance analysis is adjusted earnings before interest, taxes, depreciation, and amortization (Adjusted EBITDA), which may not be calculated as similarly titled amounts calculated by other companies. For segment reporting purposes, our consolidated Adjusted EBITDA can be calculated as our income or loss from operations excluding share-based compensation, severance, depreciation expense, amortization expense, and certain other charges.
In the normal course of business, we may make structural and cost allocation revisions to our segment information to reflect new reporting responsibilities within the organization. During the fourth quarter of fiscal 2010, we sold the products division of our wholly owned subsidiary in Japan (Note 13). We determined that the operating results of the Japan products division should be presented as discontinued operations and we have excluded the operating results of this discontinued operation from the following table. All prior period segment information has been revised to conform to the most recent classifications and organizational changes. We account for our segment information on the same basis as the accompanying consolidated financial statements.
ENTERPRISE INFORMATION
|
Sales to
|
||||||||||||||||||||||||||||
|
Fiscal Year Ended
|
External
|
Adjusted
|
Segment
|
Capital
|
||||||||||||||||||||||||
|
August 31, 2012
|
Customers
|
Gross Profit
|
EBITDA
|
Depreciation
|
Amortization
|
Assets
|
Expenditures
|
|||||||||||||||||||||
|
U.S./Canada
|
$ | 125,183 | $ | 78,618 | $ | 15,144 | $ | 1,436 | $ | 2,483 | $ | 74,387 | $ | 3,934 | ||||||||||||||
|
International
|
42,052 | 32,616 | 16,874 | 365 | 16 | 12,436 | 289 | |||||||||||||||||||||
|
Total
|
167,235 | 111,234 | 32,018 | 1,801 | 2,499 | 86,823 | 4,223 | |||||||||||||||||||||
|
Corporate and eliminations
|
3,221 | 1,449 | (4,962 | ) | 1,341 | - | 77,257 | 507 | ||||||||||||||||||||
|
Consolidated
|
$ | 170,456 | $ | 112,683 | $ | 27,056 | $ | 3,142 | $ | 2,499 | $ | 164,080 | $ | 4,730 | ||||||||||||||
|
Fiscal Year Ended
|
||||||||||||||||||||||||||||
|
August 31, 2011
|
||||||||||||||||||||||||||||
|
U.S./Canada
|
$ | 118,420 | $ | 71,782 | $ | 12,947 | $ | 1,722 | $ | 3,525 | $ | 76,152 | $ | 4,020 | ||||||||||||||
|
International
|
40,011 | 31,037 | 15,068 | 436 | 15 | 10,902 | 938 | |||||||||||||||||||||
|
Total
|
158,431 | 102,819 | 28,015 | 2,158 | 3,540 | 87,054 | 4,958 | |||||||||||||||||||||
|
Corporate and eliminations
|
2,373 | 655 | (6,858 | ) | 1,409 | - | 64,373 | 507 | ||||||||||||||||||||
|
Consolidated
|
$ | 160,804 | $ | 103,474 | $ | 21,157 | $ | 3,567 | $ | 3,540 | $ | 151,427 | $ | 5,465 | ||||||||||||||
|
Fiscal Year Ended
|
||||||||||||||||||||||||||||
|
August 31, 2010
|
||||||||||||||||||||||||||||
|
U.S./Canada
|
$ | 98,344 | $ | 60,367 | $ | 7,956 | $ | 1,825 | $ | 3,746 | $ | 74,527 | $ | 1,966 | ||||||||||||||
|
International
|
35,309 | 27,148 | 10,456 | 352 | 14 | 13,205 | 86 | |||||||||||||||||||||
|
Total
|
133,653 | 87,515 | 18,412 | 2,177 | 3,760 | 87,732 | 2,052 | |||||||||||||||||||||
|
Corporate and eliminations
|
3,221 | 1,556 | (3,972 | ) | 1,492 | - | 61,273 | 60 | ||||||||||||||||||||
|
Consolidated
|
$ | 136,874 | $ | 89,071 | $ | 14,440 | $ | 3,669 | $ | 3,760 | $ | 149,005 | $ | 2,112 | ||||||||||||||
Capital expenditures in the U.S./Canada segment include $2.1 million, $3.1 million, and $0.7 million of spending on capitalized curriculum during the fiscal years ended August 31, 2012, 2011 and 2010.
A reconciliation of enterprise Adjusted EBITDA to consolidated income from continuing operations before taxes is provided below (in thousands):
|
YEAR ENDED
|
||||||||||||
|
AUGUST 31,
|
2012
|
2011
|
2010
|
|||||||||
|
Enterprise Adjusted EBITDA
|
$ | 32,018 | $ | 28,015 | $ | 18,412 | ||||||
|
Corporate expenses
|
(4,962 | ) | (6,858 | ) | (3,972 | ) | ||||||
|
Consolidated Adjusted EBITDA
|
27,056 | 21,157 | 14,440 | |||||||||
|
Share-based compensation
|
(3,835 | ) | (2,788 | ) | (1,099 | ) | ||||||
|
Severance costs
|
- | (150 | ) | (920 | ) | |||||||
|
Other
|
- | - | (954 | ) | ||||||||
|
Depreciation
|
(3,142 | ) | (3,567 | ) | (3,669 | ) | ||||||
|
Amortization
|
(2,499 | ) | (3,540 | ) | (3,760 | ) | ||||||
|
Consolidated income from
|
||||||||||||
|
operations
|
17,580 | 11,112 | 4,038 | |||||||||
|
Interest income
|
18 | 21 | 34 | |||||||||
|
Interest expense
|
(2,482 | ) | (2,687 | ) | (2,892 | ) | ||||||
|
Discount on related party receivable
|
(1,369 | ) | - | - | ||||||||
|
Income from continuing operations
|
||||||||||||
|
before income taxes
|
$ | 13,747 | $ | 8,446 | $ | 1,180 | ||||||
Interest expense and interest income are primarily generated at the corporate level and are not allocated. Income taxes are likewise calculated and paid on a corporate level (except for entities that operate in foreign jurisdictions) and are not allocated for analysis purposes.
Corporate assets, such as cash, accounts receivable, and other assets are not generally allocated for business analysis purposes. However, inventories, intangible assets, goodwill, identifiable fixed assets, and certain other assets are allocated for analysis purposes. A reconciliation of enterprise assets to consolidated assets is as follows (in thousands):
|
AUGUST 31,
|
2012
|
2011
|
2010
|
|||||||||
|
Reportable unit assets
|
$ | 86,823 | $ | 87,054 | $ | 87,732 | ||||||
|
Corporate assets
|
77,323 | 64,421 | 61,323 | |||||||||
|
Intercompany accounts receivable
|
(66 | ) | (48 | ) | (50 | ) | ||||||
| $ | 164,080 | $ | 151,427 | $ | 149,005 | |||||||
Enterprise-Wide Information
Our revenues are derived primarily from the United States. However, we also operate wholly-owned offices or contract with licensees to provide products and services in various countries throughout the world. Our consolidated revenues from continuing operations were derived from the following countries (in thousands):
|
YEAR ENDED
|
||||||||||||
|
AUGUST 31,
|
2012
|
2011
|
2010
|
|||||||||
|
United States
|
$ | 121,328 | $ | 115,709 | $ | 97,286 | ||||||
|
Japan
|
19,440 | 17,263 | 13,935 | |||||||||
|
Canada
|
8,574 | 7,080 | 6,157 | |||||||||
|
United Kingdom
|
5,341 | 5,143 | 5,751 | |||||||||
|
Australia
|
3,992 | 5,058 | 4,545 | |||||||||
|
China/Singapore
|
2,512 | 2,185 | 1,900 | |||||||||
|
Mexico/Central America
|
913 | 837 | 590 | |||||||||
|
Indonesia
|
705 | 610 | 461 | |||||||||
|
Thailand
|
693 | 729 | 505 | |||||||||
|
Denmark/Scandanavia
|
660 | 725 | 568 | |||||||||
|
Korea
|
607 | 861 | 1,028 | |||||||||
|
India
|
576 | 515 | 422 | |||||||||
|
Brazil
|
509 | 567 | 460 | |||||||||
|
Malaysia
|
458 | 429 | 362 | |||||||||
|
Others
|
4,148 | 3,093 | 2,904 | |||||||||
| $ | 170,456 | $ | 160,804 | $ | 136,874 | |||||||
During fiscal 2011, we recognized $16.8 million in sales from our contracts with a division of the United States federal government, which was more than ten percent of our consolidated revenues for the year. In fiscal years 2012 and 2010, there were no customers that accounted for more than ten percent of our consolidated revenues. At August 31, 2012 and 2011 we had $7.6 million and $6.9 million receivable from these government contracts that were included in our consolidated accounts receivable.
At August 31, 2012, we had sales offices in Australia, Japan, and the United Kingdom. Our long-lived assets were held in the following locations for the periods indicated (in thousands):
|
AUGUST 31,
|
2012
|
2011
|
2010
|
|||||||||
|
United States/Canada
|
$ | 98,211 | $ | 97,455 | $ | 96,512 | ||||||
|
Japan
|
1,359 | 1,690 | 1,962 | |||||||||
|
United Kingdom
|
199 | 100 | 145 | |||||||||
|
Australia
|
116 | 126 | 108 | |||||||||
| $ | 99,885 | $ | 99,371 | $ | 98,727 | |||||||
Inter-segment sales were immaterial and were eliminated in consolidation.
|
18.
|
RELATED PARTY TRANSACTIONS
|
CoveyLink Acquisition
Effective December 31, 2008, we acquired the assets of CoveyLink Worldwide, LLC (CoveyLink). CoveyLink conducts seminars and training courses and provides consulting based upon the book
The Speed of Trust
by Stephen M.R. Covey, who is the son of our former Vice Chairman of the Board of Directors and the brother of one of our officers.
We accounted for the acquisition of CoveyLink using the guidance found in Statement of Financial Accounting Standards No. 141,
Business Combinations
. The purchase price was $1.0 million in cash plus or minus an adjustment for specified working capital and the costs necessary to complete the transaction, which resulted in a total initial purchase price of $1.2 million. The previous owners of CoveyLink, which includes Stephen M.R. Covey, are also entitled to earn annual contingent payments based upon earnings growth over the next five years.
During the fiscal years ended August 31, 2011 and August 31, 2010, we paid $5.4 million and $3.3 million in cash to the former owners of CoveyLink for the first two of five potential annual contingent payments. The annual contingent payments are based on earnings growth over the specified earnings period and were classified as goodwill in our consolidated balance sheets. Based on the earnings of CoveyLink during the third earnout period, we did not make a contingent earnout payment in fiscal 2012.
Prior to the acquisition date, CoveyLink had granted a non-exclusive license to the Company related to
The Speed of Trust
book and related training courses for which we paid CoveyLink specified royalties. As part of the CoveyLink acquisition, an amended and restated license of intellectual property was signed that granted us an exclusive, perpetual, worldwide, transferable, royalty-bearing license to use, reproduce, display, distribute, sell, prepare derivative works of, and perform the licensed material in any format or medium and through any market or distribution channel. We are required to pay Stephen M.R. Covey royalties for the use of certain intellectual property developed by him. The amount expensed for these royalties totaled $1.2 million, $1.1 million, and $1.1 million during the fiscal years ended August 31, 2012, 2011, and 2010, respectively. As part of the acquisition of CoveyLink, we signed an amended license agreement as well as a speaker services agreement. Based on the provisions of the speakers’ services agreement, we pay the son of the former Vice-Chairman a portion of the speaking revenues received for his presentations. We expensed $0.9 million, $1.0 million, and $0.8 million for payment from these presentations during fiscal years 2012, 2011 and 2010. We had $0.1 million and $0.3 million accrued for these speaking fees at August 31, 2012 and 2011, which were included in accrued liabilities in our consolidated balance sheets.
FC Organizational Products
During the fourth quarter of fiscal 2008, we joined with Peterson Partners to create a new company, FC Organizational Products, LLC (FCOP). This new company purchased substantially all of the assets of our consumer solutions business unit with the objective of expanding the worldwide sales of FCOP as governed by a comprehensive license agreement between us and FCOP. On the date of the sale closing, we invested approximately $1.8 million to purchase a 19.5 percent voting interest in FCOP, and made a $1.0 million priority capital contribution with a 10 percent return. At the time of the transaction, we determined that FCOP was not a variable interest entity.
As a result of FCOP’s structure as a limited liability company with separate owner capital accounts, we determined that our investment in FCOP is more than minor and that we are required to account for our investment in FCOP using the equity method of accounting. Historically, we have recorded our share of FCOP’s profit and loss based upon specified allocations as defined in the associated operating agreement. However, we have not recorded our share of FCOP’s losses in the accompanying consolidated statements of operations because we have impaired and written off investment balances, as defined within the applicable accounting guidance, in previous periods in excess of our share of FCOP’s losses through August 31, 2012.
Based on changes to FCOP’s debt agreements and certain other factors in fiscal 2012, we reconsidered whether FCOP was a variable interest entity as defined under ASC 810, and determined that FCOP was a variable interest entity. Although the changes to the debt agreements did not modify the governing documents of FCOP, the changes were substantial enough to raise doubts regarding the sufficiency of FCOP’s equity investment at risk. We further determined that we are not the primary beneficiary of FCOP because we do not have the ability to direct the activities that most significantly impact FCOP’s economic performance, which primarily consist of the day-to-day sale of planning products and related accessories, and we do not have obligation to absorb losses or the right to receive benefits from FCOP that could potentially be significant. Our voting rights and management board representation approximate our ownership interest and we are unable to exercise control through voting interests or through other means.
Our primary exposures related to FCOP at August 31, 2012 are from amounts owed to us by FCOP. We receive reimbursement from FCOP for certain operating costs, such as warehousing and distribution costs, which are billed to us by third party providers. The operations of FCOP are primarily financed by the sale of planning products and accessories in the normal course of business.
Due to the settlement of litigation during fiscal 2012 (Note 8), the amount of cash we received from FCOP was reduced from previous forecasts and our receivable balance from FCOP increased during fiscal 2012. In addition, while we are not contractually obligated by the governing documents to fund the losses or make advances to FCOP, we have provided working capital and other advances to FCOP during fiscal 2012. We believe that our extension of credit to FCOP will allow them the opportunity to improve operational results and repay amounts owed to us, including amounts that were previously written off. In the fourth quarter of fiscal 2012, we received revised information from FCOP regarding scheduled repayments to us and we reclassified a portion of the FCOP receivable to long-term assets and recorded a discount charge of $1.4 million to reduce the long-term receivable to its estimated present value at August 31, 2012. We discounted the long-term portion of the receivable at 15 percent, which was the estimated risk-adjusted borrowing rate of FCOP at August 31, 2012. This rate was based on a variety factors including, but not limited to, current market interest rates for various qualities of comparable debt, discussions with FCOP’s lenders, and an evaluation of the realizability of FCOP’s future cash flows. Based on improved operating results at FCOP during calendar 2012 and their forecasted cash flows in future periods, we believe that we will collect amounts receivable from FCOP and the discount will be recovered as interest income in future periods. However, the failure of FCOP to pay us for these receivables may have an adverse impact on our liquidity, financial position, and cash flows in future periods.
At August 31, 2012 and 2011, we had $7.1 million and $5.7 million receivable from FCOP, which have been classified in current assets and long-term assets in our consolidated balance sheets based on expected payment dates. We also owed FCOP $0.1 million and $1.2 million at August 31, 2012 and 2011 for items purchased in the ordinary course of business. These liabilities were classified in accounts payable in the accompanying consolidated balance sheets.
Other Related Party Transactions
We paid the former Vice-Chairman of the Board of Directors a percentage of the proceeds received for seminars that he presented. However, the former Vice-Chairman retired from speaking engagements in late fiscal 2011 and did not deliver any speeches during fiscal 2012. During fiscal 2011, we expensed charges totaling $0.9 million. We also paid the former Vice-Chairman a percentage of the royalty
proceeds received from the sale of certain books that were authored by him. During fiscal 2012, 2011, and 2010, we expensed $0.8 million, $0.3 million, and approximately $50,000 for royalties to the former Vice-Chairman under these agreements. At August 31, 2012 and 2011, we had accrued $1.4 million and $1.7 million for payment to the estate of the former Vice-Chairman under the forgoing agreements. These amounts were included as a component of accrued liabilities in our consolidated balance sheets.
We pay a son of the former Vice-Chairman of the Board of Directors, who is also an officer of the Company, a percentage of the royalty proceeds received from the sales of certain books authored by him. During the fiscal years ended August 31, 2012, 2011, and 2010, we expensed $0.2 million, $0.1 million, and $0.2 million for these royalties and had $0.1 million accrued at August 31, 2012 and 2011 as payable under the terms of these arrangements. These amounts are included in accrued liabilities in our consolidated balance sheets.
None.
Evaluation of Disclosure Controls and Procedures
An evaluation was conducted under the supervision and with the participation of our management, including the Chief Executive Officer and Chief Financial Officer, of the effectiveness of the design and operation of our disclosure controls and procedures, as defined in Rules 13a-15(e) and 15d-15(e) of the Exchange Act, as of the end of the period covered by this report.
Based on this evaluation, our Chief Executive Officer and our Chief Financial Officer concluded that, as of the end of the period covered by this report, our disclosure controls and procedures were effective.
Management’s Report on Internal Control Over Financial Reporting
The management of Franklin Covey Co. is responsible for establishing and maintaining adequate internal control over financial reporting for the Company (including its consolidated subsidiaries) and all related information appearing in the Company’s annual report on Form 10-K. The Company’s internal control over financial reporting is designed to provide reasonable assurance regarding the reliability of financial reporting and the preparation of financial statements for external purposes in accordance with accounting principles generally accepted in the United States of America. Internal control over financial reporting includes those policies and procedures that:
|
1.
|
pertain to the maintenance of records that in reasonable detail accurately and fairly reflect the transactions and dispositions of our assets;
|
|
2.
|
provide reasonable assurance that the transactions are recorded as necessary to permit preparation of financial statements in accordance with generally accepted accounting principles, and that our receipts and expenditures are being made only in accordance with the authorization of management and/or of our Board of Directors; and
|
|
3.
|
provide reasonable assurance regarding the prevention or timely detection of any unauthorized acquisition, use or disposition of our assets that could have a material effect on our financial statements.
|
Because of its inherent limitations, internal control over financial reporting may not prevent or detect misstatements. Also, projections of any evaluation of effectiveness in future periods are subject to the risk that controls may become inadequate because of changes in conditions, or that the degree of compliance with the policies or procedures may deteriorate.
Under the supervision and with the participation of our management, including our Chief Executive Officer and Chief Financial Officer, we conducted an evaluation of the effectiveness of our internal control over financial reporting using the criteria set forth in
Internal Control—Integrated Framework
as issued by the Committee of Sponsoring Organizations of the Treadway Commission (COSO). Based upon this evaluation, our management concluded that our internal control over financial reporting was effective as of the end of the period covered by this annual report on Form 10-K.
Our independent registered public accounting firm, Ernst & Young LLP, has audited the consolidated financial statements included in this annual report on Form 10-K and, as part of their audit, has issued an audit report, included herein, on the effectiveness of our internal control over financial reporting. Their report is included in Item 8 of this Report on Form 10-K.
Changes in Internal Control Over Financial Reporting
There were no changes in our internal control over financial reporting (as defined in Rule 13a-15(f) or 15d-15(f)) during the fourth quarter ended August 31, 2012 that materially affected, or are reasonably likely to materially affect, our internal controls over financial reporting.
There was no information to be disclosed in a current Report on Form 8-K during fourth quarter of fiscal 2012 that was not previously reported.
Certain information required by this Item is incorporated by reference to the sections entitled “Nominees for Election to the Board of Directors,” “Executive Officers,” “Section 16(a) Beneficial Ownership Reporting Compliance,” “Corporate Governance,” and “Board of Director Meetings and Committees” in our definitive Proxy Statement for the annual meeting of shareholders, which is scheduled to be held on January 25, 2013. The definitive Proxy Statement will be filed with the Securities and Exchange Commission pursuant to Regulation 14A of the Securities Exchange Act of 1934, as amended.
The Board of Directors has determined that one of the Audit Committee members, Robert Daines, is a “financial expert” as defined in Regulation S-K 407(d)(5) adopted under the Securities Exchange Act of 1934, as amended. Our Board of Directors has determined that Mr. Daines is an “independent director” as defined by the New York Stock Exchange (NYSE).
We have adopted a code of ethics for our senior financial officers that include the Chief Executive Officer, the Chief Financial Officer, and other members of our financial leadership team. This code of ethics is available on our website at
www.franklincovey.com
. We intend to satisfy any disclosure requirements under Item 5.05 of Form 8-K regarding amendment to, or waiver from, a provision of this Code of Business Conduct and Ethics by posting such information on our web site at the address and location specified above.
The information required by this Item is incorporated by reference to the sections entitled “Compensation Discussion and Analysis,” “Compensation Committee Interlocks and Insider Participation,” and “Compensation Committee Report” in our definitive Proxy Statement for the annual meeting of shareholders, which is scheduled to be held on January 25, 2013.
| [a] | [b] | [c] | |||||||
|
Plan Category
|
Number of securities to be issued upon exercise of outstanding options, warrants, and rights
|
Weighted-average exercise price of outstanding options, warrants, and rights
|
Number of securities remaining available for future issuance under equity compensation plans (excluding securities reflected in column [a])
|
||||||
|
(in thousands)
|
(in thousands)
|
||||||||
|
Equity compensation plans approved by security holders
(1)(4)
|
1,466 | (2) | 11.25 | 1,385 | (3) |
|
(1)
|
Excludes 37,975 shares of unvested (restricted) stock awards and stock units that are subject to forfeiture.
|
|
(2)
|
Amount includes 791,371 performance share awards that are expected to be awarded under the terms of Board of Director approved long-term incentive plans. In some of the performance-based plans, the number of shares eventually awarded to participants is variable and based upon the achievement of specified financial performance goals related to cumulative operating income. The weighted average exercise price of outstanding options, warrants, and rights does not include the impact of performance awards. For further information on our share-based compensation plans, refer to the notes to our financial statements as presented in Item 8 of this report.
|
|
(3)
|
Amount is based upon the number of performance-based plan shares expected to be awarded at August 31, 2012 and may change in future periods based upon the achievement of specified goals and revisions to estimates.
|
|
(4)
|
At August 31, 2012, we had approximately 615,000 shares authorized for purchase by participants in our Employee Stock Purchase Plan.
|
The remaining information required by this Item is incorporated by reference to the section entitled “Principal Holders of Voting Securities” in our definitive Proxy Statement for the annual meeting of shareholders, which is scheduled to be held on January 25, 2013.
The information required by this Item is incorporated by reference to the section entitled “Certain Relationships and Related Transactions” and “Corporate Governance” in our definitive Proxy Statement for the annual meeting of shareholders, which is scheduled to be held on January 25, 2013.
The information required by this Item is incorporated by reference to the section entitled “Principal Accountant Fees” in our definitive Proxy Statement for the annual meeting of shareholders, which is scheduled to be held on January 25, 2013.
(a) List of documents filed as part of this report:
|
1.
|
Financial Statements.
The consolidated financial statements of the Company and Report of Independent Registered Public Accounting Firm thereon included in the Annual Report to Shareholders on Form 10-K for the year ended August 31, 2012, are as follows:
|
Report of Independent Registered Public Accounting Firm
Consolidated Balance Sheets at August 31, 2012 and 2011
Consolidated Statements of Operations and Statements of Comprehensive Income for the fiscal years ended August 31, 2012, 2011, and 2010
Consolidated Statements of Cash Flows for the fiscal years ended August 31, 2012, 2011, and 2010
Consolidated Statements of Shareholders’ Equity for the fiscal years ended August 31, 2012, 2011, and 2010
Notes to Consolidated Financial Statements
|
2.
|
Financial Statement Schedules.
|
Other financial statement schedules are omitted because they are not required or applicable, or the required information is shown in the financial statements or notes thereto, or contained in this report.
|
3.
|
Exhibit List.
|
|
Exhibit No.
|
Exhibit
|
Incorporated By Reference
|
Filed Herewith
|
|
2.1
|
Master Asset Purchase Agreement between Franklin Covey Products, LLC and Franklin Covey Co. dated May 22, 2008
|
(11)
|
|
|
2.2
|
Amendment to Master Asset Purchase Agreement between Franklin Covey Products, LLC and Franklin Covey Co. dated May 22, 2008
|
(12)
|
|
|
3.1
|
Articles of Restatement dated March 4, 2005 amending and restating the Company’s Articles of Incorporation
|
(4)
|
|
|
3.2
|
Amendment to Amended and Restated Articles of Incorporation of Franklin Covey (Appendix C)
|
(7)
|
|
|
3.3
|
Amended and Restated Bylaws of Franklin Covey Co.
|
(19)
|
|
|
4.1
|
Specimen Certificate of the Registrant’s Common Stock, par value $.05 per share
|
(2)
|
|
4.2
|
Stockholder Agreements, dated May 11, 1999 and June 2, 1999
|
(3)
|
|
|
4.3
|
Registration Rights Agreement, dated June 2, 1999
|
(3)
|
|
|
4.4
|
Restated Shareholders Agreement, dated as of March 8, 2005, between the Company and Knowledge Capital Investment Group
|
(4)
|
|
|
4.5
|
Restated Registration Rights Agreement, dated as of March 8, 2005, between the Company and Knowledge Capital Investment Group
|
(4)
|
|
|
10.1*
|
Amended and Restated 2004 Employee Stock Purchase Plan
|
(10)
|
|
|
10.2*
|
Forms of Nonstatutory Stock Options
|
(1)
|
|
|
10.3
|
Warrant, dated March 8, 2005, to purchase 5,913,402 shares of Common Stock issued by the Company to Knowledge Capital Investment Group
|
(4)
|
|
|
10.4
|
Form of Warrant to purchase shares of Common Stock to be issued by the Company to holders of Series A Preferred Stock other than Knowledge Capital Investment Group
|
(4)
|
|
|
10.5
|
Master Lease Agreement between Franklin SaltLake LLC (Landlord) and Franklin Development Corporation (Tenant)
|
(5)
|
|
|
10.6
|
Purchase and Sale Agreement and Escrow Instructions between Levy Affiliated Holdings, LLC (Buyer) and Franklin Development Corporation (Seller) and Amendments
|
(5)
|
|
|
10.7
|
Redemption Extension Voting Agreement between Franklin Covey Co. and Knowledge Capital Investment Group, dated October 20, 2005
|
(6)
|
|
|
10.8
|
Agreement for Information Technology Services between each of Franklin Covey Co., Electronic Data Systems Corporation, and EDS Information Services LLC, dated April 1, 2001
|
(8)
|
|
|
10.9
|
Additional Services Addendum No. 1 to Agreement for Information Technology Services between each of Franklin Covey Co., Electronic Data Systems Corporation, and EDS Information Services LLC, dated June 30, 2001
|
(8)
|
|
|
10.10
|
Amendment No. 2 to Agreement for Information Technology Services between each of Franklin Covey Co., Electronic Data Systems Corporation, and EDS Information Services LLC, dated June 30, 2001
|
(8)
|
|
|
10.11
|
Amendment No. 6 to the Agreement for Information Technology Services between each of Franklin Covey Co., Electronic Data Systems Corporation, and EDS Information Services L.L.C. dated April 1, 2006
|
(9)
|
|
|
10.12
|
Master License Agreement between Franklin Covey Co. and Franklin Covey Products, LLC
|
(13)
|
|
|
10.13
|
Supply Agreement between Franklin Covey Products, LLC and Franklin Covey Product Sales, Inc.
|
(13)
|
|
|
10.14
|
Master Shared Services Agreement between The Franklin Covey Products Companies and the Shared Services Companies
|
(13)
|
|
10.15
|
Amended and Restated Operating Agreement of Franklin Covey Products, LLC
|
(13)
|
|
|
10.16
|
Sublease Agreement between Franklin Development Corporation and Franklin Covey Products, LLC
|
(13)
|
|
|
10.17
|
Sub-Sublease Agreement between Franklin Covey Co. and Franklin Covey Products, LLC
|
(13)
|
|
|
10.18
|
General Services Agreement between Franklin Covey Co. and Electronic Data Systems (EDS) dated October 27, 2008
|
(14)
|
|
|
10.19
|
Asset Purchase Agreement by and Among Covey/Link LLC, CoveyLink Worldwide LLC, Franklin Covey Co., and Franklin Covey Client Sales, Inc. dated December 31, 2008
|
(15)
|
|
|
10.20
|
Amended and Restated License of Intellectual Property by and Among Franklin Covey Co. and Covey/Link LLC, dated December 31, 2008
|
(15)
|
|
|
10.21*
|
Franklin Covey Co. Second Amended and Restated 1992 Stock Incentive Plan
|
(16)
|
|
|
10.22
|
Amended and Restated Credit Agreement by and between JPMorgan Chase Bank, N.A. and Franklin Covey Co., dated March 14, 2011
|
(17)
|
|
|
10.23
|
Amended and Restated Security Agreement by and among Franklin Covey Co., Franklin Development Corporation, Franklin Covey Travel Inc., Franklin Covey Client Sales, Inc., and JPMorgan Chase Bank, N.A., dated March 14, 2011
|
(17)
|
|
|
10.24
|
Amended and Restated Repayment Guaranty by and among Franklin Development Corporation, Franklin Covey Travel Inc., Franklin Covey Client Sales, Inc., and JPMorgan Chase Bank, N.A., dated March 14, 2011
|
(17)
|
|
|
10.25
|
Amended and Restated Secured Promissory Note between Franklin Covey Co. and JPMorgan Chase Bank, N.A. for $10.0 million revolving loan, dated March 14, 2011
|
(17)
|
|
|
10.26
|
Amended and Restated Secured Promissory Note between Franklin Covey Co. and JPMorgan Chase Bank, N.A. for $5.0 million term loan, dated March 14, 2011
|
(17)
|
|
|
10.27
|
Agreement dated July 26, 2011, between Franklin Covey Co., and Knowledge Capital Investment Group
|
(18)
|
|
|
10.28
|
First Modification Agreement by and between JPMorgan Chase Bank, N.A. and Franklin Covey Co., dated March 13, 2012
|
(20)
|
|
|
10.29
|
Consent and Agreement of Guarantor by and among Franklin Covey Co., Franklin Development Corporation, Franklin Covey Travel, Inc., Franklin Covey Client Sales, Inc. and JPMorgan Chase Bank, N.A., dated March 13, 2012
|
(20)
|
|
|
10.30
|
Second Modification Agreement by and between JPMorgan Chase Bank, N.A. and Franklin Covey Co., dated June 15, 2012
|
(21)
|
|
|
10.31
|
Consent and Agreement of Guarantor by and among Franklin Covey Co., Franklin Development Corporation, Franklin Covey Travel, Inc., Franklin Covey Client Sales, Inc. and JPMorgan Chase Bank, N.A., dated June 15, 2012
|
(21)
|
|
10.32*
|
Form of Change in Control Severance Agreement
|
(22)
|
|
|
21
|
Subsidiaries of the Registrant
|
éé
|
|
|
23.1
|
Consent of Independent Registered Public Accounting Firm
|
éé
|
|
|
23.2
|
Consent of Independent Registered Public Accounting Firm
|
éé
|
|
|
31.1
|
Rule 13a-14(a) Certification of the Chief Executive Officer
|
éé
|
|
|
31.2
|
Rule 13a-14(a) Certification of the Chief Financial Officer
|
éé
|
|
|
32
|
Section 1350 Certifications
|
éé
|
|
|
101.INS
|
XBRL Instance Document
|
éé
|
|
|
101.SCH
|
XBRL Taxonomy Extension Schema
|
éé
|
|
|
101.CAL
|
XBRL Taxonomy Extension Calculation Linkbase
|
éé
|
|
|
101.DEF
|
XBRL Taxonomy Extension Definition Linkbase
|
éé
|
|
|
101.LAB
|
XBRL Taxonomy Extension Label Linkbase
|
éé
|
|
|
101.PRE
|
XBRL Extension Presentation Linkbase
|
éé
|
|
(1)
|
Incorporated by reference to Registration Statement on Form S-1 filed with the Commission on April 17, 1992, Registration No. 33-47283.
|
|
(2)
|
Incorporated by reference to Amendment No. 1 to Registration Statement on Form S-1 filed with the Commission on May 26, 1992, Registration No. 33-47283.
|
|
(3)
|
Incorporated by reference to Schedule 13D (CUSIP No. 534691090 as filed with the Commission on June 14, 1999). Registration No. 005-43123.
|
|
(4)
|
Incorporated by reference to Report on Form 8-K filed with the Commission on March 10, 2005.**
|
|
(5)
|
Incorporated by reference to Report on Form 8-K filed with the Commission on June 27, 2005.**
|
|
(6)
|
Incorporated by reference to Report on Form 8-K filed with the Commission on October 24, 2005.**
|
|
(7)
|
Incorporated by reference to Definitive Proxy Statement on Form DEF 14A filed with the Commission on December 12, 2005.**
|
|
(8)
|
Incorporated by reference to Report on Form 10-Q filed July 10, 2001, for the quarter ended May 26, 2001.**
|
|
(9)
|
Incorporated by reference to Report on Form 8-K filed with the Commission on April 5, 2006.**
|
|
(10)
|
Incorporated by reference to Definitive Proxy Statement on Form DEF 14A filed with the Commission on February 1, 2005.**
|
|
(11)
|
Incorporated by reference to Report on Form 8-K/A filed with the Commission on May 29, 2008.**
|
|
(12)
|
Incorporated by reference to Report on Form 10-Q filed July 10, 2008, for the Quarter ended May 31, 2008.**
|
|
(13)
|
Incorporated by reference to Report on Form 8-K filed with the Commission on July 11, 2008.**
|
|
(14)
|
Incorporated by reference to Report on Form 10-K filed with the Commission on November 14, 2008.**
|
|
(15)
|
Incorporated by reference to Report on Form 10-Q filed with the Commission on April 9, 2009.**
|
|
(16)
|
Incorporated by reference to Definitive Proxy Statement on Form DEF 14A (Appendix A) filed with the Commission on December 15, 2010.**
|
|
(17)
|
Incorporated by reference to Report on Form 8-K filed with the Commission on March 17, 2011.**
|
|
(18)
|
Incorporated by reference to Report on Form 8-K filed with the Commission on July 28, 2011.**
|
|
(19)
|
Incorporated by reference to Report on Form 8-K filed with the Commission on February 1, 2012.**
|
|
(20)
|
Incorporated by reference to Report on Form 8-K filed with the Commission on March 15, 2012.**
|
|
(21)
|
Incorporated by reference to Report on Form 8-K filed with the Commission on June 19, 2012.**
|
|
(22)
|
Incorporated by reference to Report on Form 8-K filed with the Commission on March 14, 2012.**
|
é
é
Filed herewith and attached to this report.
* Indicates a management contract or compensatory plan or agreement.
** Registration No. 001-11107.
SIGNA
TURES
Pursuant to the requirements of Section 13 or 15(d) of the Securities Exchange Act of 1934, the Registrant has duly caused this report to be signed on its behalf by the undersigned, thereunto duly authorized, on November 14, 2012.
FRANKLIN COVEY CO.
|
By:
|
/s/ Robert A. Whitman
|
|
|
Robert A. Whitman
Chairman and Chief Executive Officer
|
Pursuant to the requirements of the Securities Exchange Act of 1934, this report has been signed below by the following persons on behalf of the Registrant and in the capacities and on the dates indicated.
|
Signature
|
Title
|
Date
|
|
/s/ Robert A. Whitman
|
Chairman of the Board and
Chief Executive Officer
|
November 14, 2012
|
|
Robert A. Whitman
|
||
|
/s/ Stephen D. Young
|
Chief Financial Officer
|
November 14, 2012
|
|
Stephen D. Young
|
||
|
/s/ Clayton M. Christensen
|
Director
|
November 14, 2012
|
|
Clayton M. Christensen
|
||
|
/s/ Robert H. Daines
|
Director
|
November 14, 2012
|
|
Robert H. Daines
|
||
|
/s/ Michael Fung
|
Director
|
November 14, 2012
|
|
Michael Fung
|
||
|
/s/ E.J. “Jake” Garn
|
Director
|
November 14, 2012
|
|
E.J. “Jake” Garn
|
||
|
/s/ Dennis G. Heiner
|
Director
|
November 14, 2012
|
|
Dennis G. Heiner
|
||
|
/s/ Donald J. McNamara
|
Director
|
November 14, 2012
|
|
Donald J. McNamara
|
||
|
/s/ Joel C. Peterson
|
Director
|
November 14, 2012
|
|
Joel C. Peterson
|
||
|
/s/ E. Kay Stepp
|
Director
|
November 14, 2012
|
|
E. Kay Stepp
|
TABLE OF CONTENTS
Part IItem 1. BusinessItem 1A. Risk FactorsItem 1B. Unresolved Staff CommentsItem 2. PropertiesItem 3. Legal ProceedingsItem 4. Mine Safety DisclosuresPart IIItem 5. Market For Registrant S Common Equity, Related Stockholder Matters and Issuer Purchases Of Equity SecuritiesItem 6. Selected Financial DataItem 7. Management S Discussion and Analysis Of Financial Condition and Results Of OperationsItem 7A. Quantitative and Qualitative Disclosures About Market RiskItem 8. Financial Statements and Supplementary DataItem 9. Changes in and Disagreements with Accountants on Accounting and Financial DisclosureItem 9A. Controls and ProceduresItem 9B. Other InformationPart IIIItem 10. Directors, Executive Officers and Corporate GovernanceItem 11. Executive CompensationItem 12. Security Ownership Of Certain Beneficial Owners and Management and Related Stockholder MattersItem 13. Certain Relationships and Related Transactions, and Director IndependenceItem 14. Principal Accountant Fees and ServicesPart IVItem 15. Exhibits and Financial Statement Schedules