FIRST COMMONWEALTH FINANCIAL CORP /PA/
10-Ks and 10-Qs
|
|
|
|
|
|
|
|
|
|
|
|
|
|
|
|
|
|
|
|
|
|
|
|
|
|
|
|
|
|
|
|
|
|
|
|
|
|
|
|
|
|
|
|
|
|
|
|
|
|
|
|
|
|
|
|
UNITED STATES
SECURITIES AND EXCHANGE COMMISSION
WASHINGTON, D.C. 20549
FORM 10-K
|
x
|
ANNUAL REPORT PURSUANT TO SECTION 13 OR 15(d) OF THE SECURITIES EXCHANGE ACT OF 1934
|
For the fiscal year ended
December 31, 2018
OR
|
¨
|
TRANSITION REPORT PURSUANT TO SECTION 13 OR 15(d) OF THE SECURITIES EXCHANGE ACT OF 1934
|
For the transition period from to
Commission file Number
001-11138
FIRST COMMONWEALTH FINANCIAL CORPORATION
(Exact name of registrant as specified in its charter)
|
PENNSYLVANIA
|
25-1428528
|
|
(State or other jurisdiction of incorporation or organization)
|
(I.R.S. Employer Identification No.)
|
|
601 PHILADELPHIA STREET INDIANA, PA
|
15701
|
|
(Address of principal executive offices)
|
(Zip Code)
|
Registrant’s telephone number, including area code:
(724) 349-7220
Securities registered pursuant to Section 12(b) of the Act:
|
Title of each class
|
|
Name of each exchange on which registered
|
|
COMMON STOCK, $1 PAR VALUE
|
|
NEW YORK STOCK EXCHANGE
|
Indicate by check mark if the registrant is a well-known seasoned issuer, as defined in Rule 405 of the Securities Act. Yes
x
No
¨
Indicate by check mark if the registrant is not required to file reports pursuant to Section 13 or Section 15(d) of the Act. Yes
¨
No
x
Note—Checking the box above will not relieve any registrant required to file reports pursuant to Section 13 or 15(d) of the Exchange Act from their obligations under those Sections.
Indicate by check mark whether the registrant (1) has filed all reports required to be filed by Section 13 or 15(d) of the Securities Exchange Act of 1934 during the preceding 12 months (or for such shorter period that the registrant was required to file such reports), and (2) has been subject to such filing requirements for the past 90 days. Yes
x
No
¨
Indicate by check mark whether the registrant has submitted electronically every Interactive Data File required to be submitted and posted pursuant to Rule 405 of Regulation S-T (§232.405 of this chapter) during the preceding 12 months (or for such shorter period that the registrant was required to submit such files). Yes
x
No
¨
Indicate by check mark if disclosure of delinquent filers pursuant to Item 405 of Regulation S-K is not contained herein, and will not be contained, to the best of registrant’s knowledge, in definitive proxy or information statements incorporated by reference in Part III of this Form 10-K or any amendment to this form 10-K.
¨
Indicate by check mark whether the registrant is a large accelerated filer, an accelerated filer, a non-accelerated filer, a smaller reporting company, or an emerging growth company. See the definitions of "large accelerated filer," "accelerated filer," "smaller reporting company," and "emerging growth company" in Rule 12b-2 of the Exchange Act.
Large accelerated filer
x
Accelerated filer
¨
Non-accelerated filer
¨
Smaller reporting company
¨
Emerging growth company
¨
If an emerging growth company, indicate by check mark if the registrant has elected not to use the extended transition period for complying with any new or revised financial accounting standards provided pursuant to Section 13(a) of the Exchange Act.
¨
Indicate by check mark whether the registrant is a shell company (as defined in Rule 12b-2 of the Exchange Act). Yes
¨
No
x
The aggregate market value of the voting and non-voting common stock, par value $1 per share, held by non-affiliates of the registrant (based upon the closing sale price on
June 30, 2018
) was approximately
$1,535,578,640
.
The number of shares outstanding of the registrant’s common stock, $1.00 Par Value as of
February 28, 2019
, was
98,641,110
.
DOCUMENTS INCORPORATED BY REFERENCE
Portions of the definitive Proxy Statement to be filed with the Securities and Exchange Commission in connection with the annual meeting of shareholders to be held April 23, 2019 are incorporated by reference into Part III.
FIRST COMMONWEALTH FINANCIAL CORPORATION AND SUBSIDIARIES
FORM 10-K
INDEX
|
PART I
|
|
PAGE
|
|
ITEM 1.
|
||
|
ITEM 1A.
|
||
|
ITEM 1B.
|
||
|
ITEM 2.
|
||
|
ITEM 3.
|
||
|
ITEM 4.
|
||
|
PART II
|
||
|
ITEM 5.
|
||
|
ITEM 6.
|
||
|
ITEM 7.
|
||
|
ITEM 7A.
|
||
|
ITEM 8.
|
||
|
ITEM 9.
|
||
|
ITEM 9A.
|
||
|
ITEM 9B.
|
||
|
PART III
|
||
|
ITEM 10.
|
||
|
ITEM 11.
|
||
|
ITEM 12.
|
||
|
ITEM 13.
|
||
|
ITEM 14.
|
||
|
PART IV
|
||
|
ITEM 15.
|
||
FORWARD-LOOKING STATEMENTS
Certain statements contained in this Annual Report on Form 10-K that are not statements of historical fact constitute forward-looking statements within the meaning of the Private Securities Litigation Reform Act of 1995 (the “Act”), notwithstanding that such statements are not specifically identified as such. In addition, certain statements may be contained in our future filings with the Securities and Exchange Commission, in press releases, and in oral and written statements made by us or with our approval that are not statements of historical fact and constitute forward-looking statements within the meaning of the Act. Examples of forward-looking statements include, but are not limited to: (i) projections of revenues, expenses, income or loss, earnings or loss per share, the payment or nonpayment of dividends, capital structure and other financial items; (ii) statements of plans, objectives and expectations of First Commonwealth or its management or Board of Directors, including those relating to products, services or operations; (iii) statements of future economic performance; and (iv) statements of assumptions underlying such statements. Words such as “believe,” “anticipate,” “expect,” “intend,” “plan,” “estimate,” or words of similar meaning, or future or conditional verbs such as “will,” “would,” “should,” “could” or “may,” are intended to identify forward-looking statements. Forward-looking statements involve risks and uncertainties that may cause actual results to differ materially from those in such statements. Factors that could cause actual results to differ from those discussed in the forward-looking statements include, but are not limited to:
|
•
|
Local, regional, national and international economic conditions and the impact they may have on us and our customers and our assessment of that impact.
|
|
•
|
Volatility and disruption in national and international financial and commodity markets.
|
|
•
|
Government intervention in the U.S. financial system.
|
|
•
|
Changes in the mix of loan geographies, sectors and types or the level of non-performing assets and charge-offs.
|
|
•
|
Changes in estimates of future reserve requirements based upon the periodic review thereof under relevant regulatory and accounting requirements.
|
|
•
|
The effects of and changes in trade and monetary and fiscal policies and laws, including the interest rate policies of the Federal Reserve Board.
|
|
•
|
Inflation, interest rate, securities market and monetary fluctuations.
|
|
•
|
The effect of changes in laws and regulations (including laws and regulations concerning taxes, banking, securities and insurance) with which we and our subsidiaries must comply.
|
|
•
|
The soundness of other financial institutions.
|
|
•
|
Political instability.
|
|
•
|
Impairment of our goodwill or other intangible assets.
|
|
•
|
Acts of God or of war or terrorism.
|
|
•
|
The timely development and acceptance of new products and services and perceived overall value of these products and services by users.
|
|
•
|
Changes in consumer spending, borrowings and savings habits.
|
|
•
|
Changes in the financial performance and/or condition of our borrowers.
|
|
•
|
Technological changes.
|
|
•
|
The cost and effects of failure, interruption, or breach of security of our systems.
|
|
•
|
Acquisitions and integration of acquired businesses.
|
|
•
|
Our ability to attract and retain qualified employees.
|
|
•
|
Changes in the competitive environment in our markets and among banking organizations and other financial service providers.
|
|
•
|
The effect of changes in accounting policies and practices, as may be adopted by the regulatory agencies, as well as the Public Company Accounting Oversight Board, the Financial Accounting Standards Board and other accounting standard setters.
|
|
•
|
Changes in the reliability of our vendors, internal control systems or information systems.
|
|
•
|
Changes in our liquidity position.
|
|
•
|
Changes in our organization, compensation and benefit plans.
|
|
•
|
The costs and effects of legal and regulatory developments, the resolution of legal proceedings or regulatory or other governmental inquiries, the results of regulatory examinations or reviews and the ability to obtain required regulatory approvals.
|
|
•
|
Greater than expected costs or difficulties related to the integration of new products and lines of business.
|
|
•
|
Our success at managing the risks involved in the foregoing items.
|
|
•
|
The risk factors described in Item 1A of this Annual Report.
|
Forward-looking statements speak only as of the date on which such statements are made. We do not undertake any obligation to update any forward-looking statement to reflect events or circumstances after the date on which such statement is made, or to reflect the occurrence of unanticipated events.
3
PART I
ITEM 1.
Business
Overview
First Commonwealth Financial Corporation (“First Commonwealth,” the “Company” or “we”) is a financial holding company headquartered in Indiana, Pennsylvania. We provide a diversified array of consumer and commercial banking services through our bank subsidiary, First Commonwealth Bank (“FCB” or the “Bank”). We also provide trust and wealth management services and offer insurance products through FCB and our other operating subsidiaries. At
December 31, 2018
, we had total assets of
$7.8 billion
, total loans of
$5.8 billion
, total deposits of
$5.9 billion
and shareholders’ equity of
$975.4 million
. Our principal executive office is located at 601 Philadelphia Street, Indiana, Pennsylvania 15701, and our telephone number is (724) 349-7220.
FCB is a Pennsylvania bank and trust company. At
December 31, 2018
, the Bank operated
137
community banking offices throughout western and central Pennsylvania, and northeasern, central and southwestern Ohio, as well as corporate banking centers in Pittsburgh, Pennsylvania, and Columbus and Cleveland, Ohio, and mortgage banking offices in Wexford, Pennsylvania, and Hudson and Dublin, Ohio. The Bank also operates a network of
150
automated teller machines, or ATMs, at various branch offices and offsite locations. All of our ATMs are part of the NYCE and MasterCard/Cirrus networks, both of which operate nationwide. The Bank is a member of the Allpoint ATM network, which allows surcharge-free access to over 55,000 ATMs. The Bank is also a member of the “Freedom ATM Alliance,” which affords cardholders surcharge-free access to a network of over 670 ATMs in over 50 counties in Pennsylvania, Maryland, New York, and Ohio.
Historical and Recent Developments
FCB began in 1934 as First National Bank of Indiana. First National Bank of Indiana changed its name to National Bank of the Commonwealth in 1971 and became a subsidiary of First Commonwealth in 1983.
Since the formation of the holding company in 1983, we have grown steadily through the acquisition of smaller banks and thrifts in our market area, including Deposit Bank in 1984, Dale National Bank and First National Bank of Leechburg in 1985, Citizens National Bank of Windber in 1986, Peoples Bank and Trust Company in 1990, Central Bank in 1992, Peoples Bank of Western Pennsylvania in 1993, and Unitas National Bank and Reliable Savings Bank in 1994. In 1995, we merged all of our banking subsidiaries (other than Reliable Savings Bank) into Deposit Bank and renamed the resulting institution “First Commonwealth Bank.” We then merged Reliable Savings Bank into FCB in 1997. We acquired Southwest Bank in 1998 and merged it into FCB in 2002.
We expanded our presence in the Pittsburgh market through the acquisitions of Pittsburgh Savings Bank (dba BankPittsburgh) in 2003, Great American Federal in 2004 and Laurel Savings Bank in 2006. These acquisitions added 27 branches in Allegheny and Butler Counties.
We have also focused on organic growth, improving the reach of our franchise and the breadth of our product offering. As part of this strategy, we have opened fourteen de novo branches since 2005, all of which are in the greater Pittsburgh area. As a result of our prior acquisitions and de novo strategy, FCB operates
59
branches and a corporate banking center in the Pittsburgh metropolitan statistical area and currently ranks
tenth
in deposit market share.
In 2015, we expanded into central Ohio through the acquisition of First Community Bank with four branches in the Columbus area. In 2016, we acquired 13 branches from FirstMerit Bank, National Association, in Canton-Massillon and Ashtabula, Ohio and in 2017, we acquired DCB Financial Corp ("DCB") and its banking subsidiary The Delaware County Bank and Trust Company with nine full-service banking offices in the Columbus, Ohio MSA. In 2018, we acquired Garfield Acquisition Corp., and its banking subsidiary Foundation Bank with five full-service banking offices in the Cincinnati, Ohio area. Additionally, since 2014, we have expanded our presence in this Ohio market by opening a corporate loan production office in Columbus and Cleveland, Ohio, and three mortgage loan offices in Hudson, Dublin, and Columbus, Ohio.
Our operating objectives include expansion, diversification within our markets, growth of our fee-based income, and growth internally and through acquisitions of financial institutions, branches, and financial services businesses. We generally seek merger or acquisition partners that are culturally similar and have experienced management and possess either significant market presence or have potential for improved profitability through financial management, economies of scale and expanded services. We regularly evaluate merger and acquisition opportunities and, from time to time, conduct due diligence activities related to possible transactions with other financial institutions and financial services companies. As a result, merger or acquisition discussions and, in some cases, negotiations, may take place and future merger acquisitions involving cash, debt or equity securities may occur. Acquisitions typically involve the payment of a premium over book and market values, and, therefore, some dilution of First Commonwealth’s tangible book value and net income per common share may occur in
4
connection with any future transaction. Our ability to engage in certain merger or acquisition transactions, whether or not any regulatory approval is required, will be dependent upon our bank regulators’ views at the time as to the capital levels, quality of management and our overall condition and their assessment of a variety of other factors. Certain merger or acquisition transactions, including those involving the acquisition of a depository institution or the assumption of the deposits of any depository institution, require formal approval from various bank regulatory authorities, which will be subject to a variety of factors and considerations.
Loan Portfolio
The Company’s loan portfolio includes several categories of loans that are discussed in detail below.
Commercial, Financial, Agricultural and Other
Commercial, financial, agricultural and other loans represent term loans used to acquire business assets or revolving lines of credit used to finance working capital. These loans are generally secured by a first lien position on the borrower’s business assets as a secondary source of repayment. The type and amount of the collateral varies depending on the amount and terms of the loan, but generally may include accounts receivable, inventory, equipment or other assets. Loans also may be supported by personal guarantees from the principals of the commercial loan borrowers.
Commercial loans are underwritten for credit-worthiness based on the borrowers’ financial information, cash flow, net worth, prior loan performance, existing debt levels, type of business and the industry in which it operates. Advance rates on commercial loans are generally collateral-dependent and are determined based on the type of equipment, the mix of inventory and the quality of receivables.
Credit risk for commercial loans can arise from a borrower’s inability or unwillingness to repay the loan, and in the case of secured loans, from a shortfall in the collateral value in relation to the outstanding loan balance in the event of a default and subsequent liquidation of collateral. The Company’s Credit Policy establishes loan concentration limits by borrower, geography and industry.
Commercial Real Estate
Commercial real estate loans represent term loans secured by owner-occupied and non-owner occupied properties. Commercial real estate loans are underwritten based on an evaluation of each borrower’s cash flow as the principal source of loan repayment, and are generally secured by a first lien on the property as a secondary source of repayment. Our underwriting process for non-owner occupied properties evaluates the history of occupancy, quality of tenants, lease terms, operating expenses and cash flow. Commercial real estate loans are subject to the same credit evaluation as previously described for commercial loans. Approximately
18%
, by principal amount, of our commercial real estate loans involve owner-occupied properties.
For loans secured by commercial real estate, at origination the Company obtains current and independent appraisals from licensed or certified appraisers to assess the value of the underlying collateral. The Company’s general policy for commercial real estate loans is to limit the terms of the loans to not more than 10 years with loan-to-value ratios not exceeding 80% on owner-occupied and income producing properties. For non-owner occupied commercial real estate loans, the loan terms are generally aligned with the property’s lease terms and are generally underwritten with a loan-to-value ratio not exceeding 75%.
Credit risk for commercial real estate loans can arise from economic conditions that could impact market demand, rental rates and property vacancy rates and declines in the collateral value in relation to the outstanding loan balance in the event of a default and subsequent liquidation of collateral.
Real Estate Construction
Real estate construction represents financing for real estate development. The underwriting process for these loans is designed to confirm that the project will be economically feasible and financially viable and is generally conducted as though the Company would be providing permanent financing for the project. Development and construction loans are secured by the properties under development or construction, and personal guarantees are typically obtained as a secondary repayment source. The Company considers the financial condition and reputation of the borrower and any guarantors and generally requires a global cash flow analysis in order to assess the overall financial position of the developer.
Construction loans to residential builders are generally made for the construction of residential homes for which a binding sales contract exists and for which the prospective buyers have been pre-qualified for permanent mortgage financing by either third-party lenders or the Company. These loans are generally for a period of time sufficient to complete construction.
5
Residential construction loans to individuals generally provide for the payment of interest only during the construction phase. At the end of the construction phase, substantially all of our loans automatically convert to permanent mortgage loans and can either be retained in our loan portfolio or sold on the secondary market.
Credit risk for real estate construction loans can arise from construction delays, cost overruns, failure of the contractor to complete the project to specifications and economic conditions that could impact demand for or supply of the property being constructed.
Residential Real Estate Loans
Residential real estate loans include first lien mortgages used by the borrower to purchase or refinance a principal residence and home equity loans and lines of credit secured by residential real estate. The Company’s underwriting process for these loans determines credit-worthiness based upon debt-to-income ratios, collateral values and other relevant factors.
Credit risk for residential real estate loans can arise from a borrower’s inability or unwillingness to repay the loan or a shortfall in the value of the residential real estate in relation to the outstanding loan balance in the event of a default and subsequent liquidation of the real estate collateral.
The residential real estate portfolio includes both conforming and non-conforming mortgage loans. Conforming mortgage loans represent loans originated in accordance with underwriting standards set forth by the government-sponsored entities, including the Federal National Mortgage Association, the Federal Home Loan Mortgage Corporation and the Government National Mortgage Association, which serve as the primary purchasers of loans sold in the secondary mortgage market by mortgage lenders. These loans are generally collateralized by one-to-four-family residential real estate, have loan-to-collateral value ratios of 80% or less (or have mortgage insurance to insure down to 80%), and are made to borrowers in good credit standing. Non-conforming mortgage loans represent loans that generally are not saleable in the secondary market to the government-sponsored entities due to factors such as the credit characteristics of the borrower, the underlying documentation, the loan-to-value ratio, or the size of the loan. The Company does not offer “subprime,” “interest-only” or “negative amortization” mortgages.
Home equity lines of credit and other home equity loans are originated by the Company for typically up to 90% of the appraised value, less the amount of any existing prior liens on the property. Additionally, the Company’s credit policy requires borrower FICO scores of not less than 661 and a debt-to-income ratio of not more than 43%.
Loans to Individuals
The Loans to Individuals category includes consumer installment loans, personal lines of credit, consumer credit cards and indirect automobile loans. Credit risk for consumer loans can arise from a borrower’s inability or unwillingness to repay the loan, and in the case of secured loans, by a shortfall in the value of the collateral in relation to the outstanding loan balance in the event of a default and subsequent liquidation of collateral.
The underwriting criteria for automobile loans generally allows for such loans to be made for up to 100% of the purchase price or the retail value of the vehicle as listed by the National Automobile Dealers Association. The terms of the loan are determined by the age and condition of the collateral, and range from 36 to 84 months. Collision insurance policies are required on all automobile loans. The Company also makes other consumer loans, which may or may not be secured. The terms of secured consumer loans generally depend upon the nature of the underlying collateral. Unsecured consumer loans and consumer credit cards usually do not exceed $35 thousand. Unsecured consumer loans usually have a term of no longer than 36 months.
Deposits
Deposits are our primary source of funds to support our revenue-generating assets. We offer traditional deposit products to businesses and other customers with a variety of rates and terms. Deposits at our bank are insured by the FDIC up to statutory limits. We price our deposit products with a view to maximizing our share of each customer’s financial services business and prudently managing our cost of funds. At
December 31, 2018
, we held
$5.9 billion
of total deposits, which consisted of
$1.5 billion
, or
25%
, in non-interest bearing checking accounts,
$3.6 billion
, or
61%
, in interest bearing checking accounts, money market and savings accounts, and
$0.9 billion
, or
14%
, in CDs and IRAs.
Competition
The banking and financial services industry is extremely competitive in our market area. We face vigorous competition for customers, loans and deposits from many companies, including commercial banks, savings and loan associations, finance companies, credit unions, trust companies, mortgage companies, money market mutual funds, insurance companies, and brokerage and investment firms. Many of these competitors are significantly larger than us, have greater resources, higher
6
lending limits and larger branch systems and offer a wider array of financial services than us. In addition, some of these competitors, such as credit unions, are subject to a lesser degree of regulation or taxation than that imposed on us.
Employees
At
December 31, 2018
, First Commonwealth and its subsidiaries employed
1,363
full-time employees and
149
part-time employees.
Supervision and Regulation
The following discussion sets forth the material elements of the regulatory framework applicable to financial holding companies, such as First Commonwealth, and their subsidiaries. The regulatory framework is intended primarily for the protection of depositors, other customers and the federal deposit insurance fund and not for the protection of security holders. The rules governing the regulation of financial institutions and their holding companies are very detailed and technical. Accordingly, the following discussion is general in nature and is not intended to be complete or to describe all the laws and regulations that apply to First Commonwealth and its subsidiaries. A change in applicable statutes, regulations or regulatory policy may have a material adverse effect on our business, financial condition or results of operations.
Bank Holding Company Regulation
First Commonwealth is registered as a financial holding company under the Bank Holding Company Act of 1956, as amended (“BHC Act”), and is subject to supervision and regulation by the Board of Governors of the Federal Reserve System (“FRB”).
Acquisitions.
Under the BHC Act, First Commonwealth is required to obtain the prior approval of the FRB before it can merge or consolidate with any other bank holding company or acquire all or substantially all of the assets of any bank that is not already majority owned by it, or acquire direct or indirect ownership, or control of, any voting shares of any bank that is not already majority owned by it, if after such acquisition it would directly or indirectly own or control more than 5% of the voting shares of such bank. In reviewing applications seeking approval of merger and acquisition transactions, the bank regulatory authorities will consider, among other things, the competitive effect and public benefits of the transactions, the financial, including capital, position of the combined organization, the risks to the stability of the U.S. banking or financial system, the applicant's performance record under the Community Reinvestment Act ("CRA") and its compliance with fair housing and other consumer protection laws and the effectiveness of the subject organizations in combating money laundering activities.
Non-Banking Activities.
In general, the BHC Act limits the business of bank holding companies to banking, managing or controlling banks and other activities that the FRB has determined to be so closely related to banking as to be a proper incident thereto. In addition, bank holding companies that qualify and elect to be financial holding companies such as First Commonwealth may engage in any activity, or acquire and retain the shares of a company engaged in any activity, that is either (i) financial in nature or incidental to such financial activity or (ii) complementary to a financial activity and does not pose a substantial risk to the safety and soundness of depository institutions or the financial system generally, without in either case the prior approval of the FRB. Activities that are financial in nature include securities underwriting and dealing, insurance agency activities and making merchant banking investments.
To maintain financial holding company status, a financial holding company and all of its depository institution subsidiaries must be well capitalized and well managed. A depository institution subsidiary is considered to be well capitalized if it satisfies the requirements for this status discussed in the section below captioned "Prompt Corrective Action". A depository institution subsidiary is considered well managed if it received a composite rating and management rating of at least satisfactory in its most recent examination. A financial holding company’s status will also depend upon maintaining its status as well capitalized and well managed under applicable FRB regulations. If a financial holding company ceases to meet these capital and management requirements, the FRB’s regulations provide that the financial holding company must enter into an agreement with the FRB to comply with all applicable capital and management requirements. Until the financial holding company returns to compliance, the FRB may impose limitations or conditions on the conduct of its activities, and the company may not commence any of the broader financial activities permissible for financial holding companies or acquire a company engaged in such financial activities without prior approval of the FRB. If the company does not return to compliance within 180 days, the FRB may require divestiture of the holding company’s depository institutions.
In order for a financial holding company to commence any new activity permitted by the BHC Act or to acquire a company engaged in any new activity permitted by the BHC Act, each insured depository institution subsidiary of the financial holding company must have received a rating of at least satisfactory in its most recent examination under the CRA.
The FRB has the power to order any bank holding company or its subsidiaries to terminate any activity or to terminate its ownership or control of any subsidiary when the FRB has reasonable grounds to believe that continuation of such activity or
7
such ownership or control constitutes a serious risk to the financial soundness, safety or stability of any bank subsidiary of the bank holding company.
Reporting.
Under the BHC Act, First Commonwealth is subject to examination by the FRB and is required to file periodic reports and other information of its operations with the FRB. In addition, under the Pennsylvania Banking Code of 1965, the Pennsylvania Department of Banking and Securities has the authority to examine the books, records and affairs of any Pennsylvania bank holding company or to require any documentation deemed necessary to ensure compliance with the Pennsylvania Banking Code.
Source of Strength Doctrine.
FRB policy has historically required bank holding companies to act as a source of financial and managerial strength to their subsidiary banks. The Dodd-Frank Wall Street Reform and Consumer Protection Act (the “Dodd-Frank Act”) codifies this policy as a statutory requirement. Under this requirement, First Commonwealth is expected to commit resources to support FCB, including at times when First Commonwealth may not be in a financial position to provide such resources. Any capital loans by a bank holding company to any of its subsidiary banks are subordinate in right of payment to deposits and to certain other indebtedness of such subsidiary banks. In the event of a bank holding company’s bankruptcy, any commitment by the bank holding company to a federal bank regulatory agency to maintain the capital of a subsidiary bank will be assumed by the bankruptcy trustee and entitled to priority of payment.
Affiliate Transactions.
Transactions between FCB, on the one hand, and First Commonwealth and its other subsidiaries, on the other hand, are regulated under federal banking laws. The Federal Reserve Act imposes quantitative and qualitative requirements and collateral requirements on covered transactions by FCB with, or for the benefit of, its affiliates, and generally requires those transactions to be on terms at least as favorable to FCB as if the transaction were conducted with an unaffiliated third party. Covered transactions are defined by statute to include a loan or extension of credit, as well as a purchase of securities issued by an affiliate, a purchase of assets (unless otherwise exempted by the FRB) from the affiliate, certain derivative transactions that create a credit exposure to an affiliate, the acceptance of securities issued by the affiliate as collateral for a loan, and the issuance of a guarantee, acceptance or letter of credit on behalf of an affiliate. In general, any such transaction by FCB (or its subsidiaries) must be limited to certain thresholds on an individual and aggregate basis and, for credit transactions with any affiliate, must be secured by designated amounts of specified collateral.
SEC Regulations.
First Commonwealth is also under the jurisdiction of the Securities and Exchange Commission (“SEC”) and various state securities commissions for matters relating to the offer and sale of its securities and is subject to the SEC rules and regulations relating to periodic reporting, proxy solicitation and insider trading.
Bank Regulation
FCB is a state bank chartered under the Pennsylvania Banking Code and is not a member of the FRB. As such, FCB is subject to the supervision of, and is regularly examined by, both the Federal Deposit Insurance Corporation (“FDIC”) and the Pennsylvania Department of Banking and Securities and is required to furnish quarterly reports to both agencies. The approval of the Pennsylvania Department of Banking and Securities and FDIC is also required for FCB to establish additional branch offices or merge with or acquire another banking institution.
Dividends.
First Commonwealth is a legal entity separate and distinct from its banking and other subsidiaries. As a bank holding company, First Commonwealth is subject to certain restrictions on its ability to pay dividends under applicable banking laws and regulations. Federal bank regulators are authorized to determine under certain circumstances relating to the financial condition of a bank holding company or a bank that the payment of dividends would be an unsafe or unsound practice and to prohibit payment thereof. In particular, federal bank regulators have stated that paying dividends that deplete a banking organization’s capital base to an inadequate level would be an unsafe and unsound banking practice and that banking organizations should generally pay dividends only out of current operating earnings.
A significant portion of our income comes from dividends from our bank, which is also the primary source of our liquidity. In addition to the restrictions discussed above, our bank is subject to limitations under Pennsylvania law regarding the level of dividends that it may pay to us. In general, dividends may be declared and paid only out of accumulated net earnings and may not be declared or paid unless surplus is at least equal to capital. Dividends may not reduce surplus without the prior consent of the Pennsylvania Department of Banking and Securities. FCB has not reduced its surplus through the payment of dividends. As of
December 31, 2018
, FCB could pay dividends to First Commonwealth of
$259.1 million
without reducing its capital levels below "well capitalized" levels and without the approval of the Pennsylvania Department of Banking and Securities.
Community Reinvestment.
Under the Community Reinvestment Act ("CRA") a bank has a continuing and affirmative obligation, consistent with its safe and sound operation, to help meet the credit needs of its entire community, including low and moderate income neighborhoods. The CRA does not establish specific lending requirements or programs for financial institutions nor does it limit an institution’s discretion to develop the types of products and services that it believes are best suited to its particular community, consistent with the CRA. The CRA requires the applicable regulatory agency to assess an
8
institution’s record of meeting the credit needs of its community. The CRA requires public disclosure of an institution’s CRA rating and requires that the applicable regulatory agency provide a written evaluation of an institution’s CRA performance utilizing a four-tiered descriptive rating system. An institution’s CRA rating is considered in determining whether to grant charters, branches and other deposit facilities, relocations, mergers, consolidations and acquisitions. Performance less than satisfactory may be the basis for denying an application. For its most recent examination, FCB received a “satisfactory” rating. In April 2018, the U.S. Department of Treasury issued a memorandum to the federal banking regulators with recommended changes to the CRA’s implementing regulations to reduce their complexity and associated burden on banks. We will continue to evaluate the impact of any changes to the regulations implementing the CRA.
Consumer Financial Protection.
We are subject to a number of federal and state consumer protection laws that extensively govern our relationship with our customers. These laws include the Equal Credit Opportunity Act, the Fair Credit Reporting Act, the Truth in Lending Act, the Truth in Savings Act, the Electronic Fund Transfer Act, the Expedited Funds Availability Act, the Home Mortgage Disclosure Act, the Fair Housing Act, the Real Estate Settlement Procedures Act, the Fair Debt Collection Practices Act, the Service Members Civil Relief Act and these laws’ respective state-law counterparts, as well as state usury laws and laws regarding unfair and deceptive acts and practices. These and other federal laws, among other things, require disclosures of the cost of credit and terms of deposit accounts, provide substantive consumer rights, prohibit discrimination in credit transactions, regulate the use of credit report information, provide financial privacy protections, prohibit unfair, deceptive and abusive practices, restrict our ability to raise interest rates and subject us to substantial regulatory oversight. Violations of applicable consumer protection laws can result in significant potential liability from litigation brought by customers, including actual damages, restitution and attorneys’ fees. Federal bank regulators, state attorneys general and state and local consumer protection agencies may also seek to enforce consumer protection requirements and obtain these and other remedies, including regulatory sanctions, customer rescission rights, action by the state and local attorneys general in each jurisdiction in which we operate and civil money penalties. Failure to comply with consumer protection requirements may also result in our failure to obtain any required bank regulatory approval for merger or acquisition transactions we may wish to pursue or our prohibition from engaging in such transactions even if approval is not required.
The Dodd-Frank Act created a new, independent federal agency, the Consumer Financial Protection Bureau ("CFPB"), which was granted broad rulemaking, supervisory and enforcement powers under various federal consumer financial protection laws. The CFPB is also authorized to engage in consumer financial education, track consumer complaints, request data and promote the availability of financial services to underserved consumers and communities. Although all institutions are subject to rules adopted by the CFPB and examination by the CFPB in conjunction with examinations by the institution’s primary federal regulator, the CFPB has primary examination and enforcement authority over institutions with assets of $10 billion or more. The FDIC has primary responsibility for examination of our bank and enforcement with respect to federal consumer protection laws so long as our bank has total consolidated assets of less than $10 billion, and state authorities are responsible for monitoring our compliance with all state consumer laws. The CFPB also has the authority to require reports from institutions with less than $10 billion in assets, such as our bank, to support the CFPB in implementing federal consumer protection laws, supporting examination activities, and assessing and detecting risks to consumers and financial markets.
The consumer protection provisions of the Dodd-Frank Act and the examination, supervision and enforcement of those laws and implementing regulations by the CFPB have created a more intense and complex environment for consumer finance regulation. The CFPB has significant authority to implement and enforce federal consumer finance laws, including the Truth in Lending Act, the Equal Credit Opportunity Act and new requirements for financial services products provided for in the Dodd-Frank Act, as well as the authority to identify and prohibit unfair, deceptive or abusive acts and practices. The review of products and practices to prevent such acts and practices is a continuing focus of the CFPB, and of banking regulators more broadly. The ultimate impact of this heightened scrutiny is uncertain but could result in changes to pricing, practices, products and procedures. It could also result in increased costs related to regulatory oversight, supervision and examination, additional remediation efforts and possible penalties. In addition, the Dodd-Frank Act provides the CFPB with broad supervisory, examination and enforcement authority over various consumer financial products and services, including the ability to require reimbursements and other payments to customers for alleged legal violations and to impose significant penalties, as well as injunctive relief that prohibits lenders from engaging in allegedly unlawful practices. The CFPB also has the authority to obtain cease and desist orders providing for affirmative relief or monetary penalties. The Dodd-Frank Act does not prevent states from adopting stricter consumer protection standards. State regulation of financial products and potential enforcement actions could also adversely affect our business, financial condition or results of operations.
Deposit Insurance.
Deposits of FCB are insured up to applicable limits by the FDIC and are subject to deposit insurance assessments to maintain the Deposit Insurance Fund (“DIF”). Deposit insurance assessments are based upon average total assets minus average total equity. The insurance assessments are based upon a matrix that takes into account a bank’s capital level and supervisory rating. The FDIC may terminate deposit insurance upon a finding that the institution has engaged in unsafe and unsound practices, is in an unsafe or unsound condition to continue operations, or has violated any applicable law, regulation, rule, order or condition imposed by the FDIC. As an institution with less than $10 billion in assets, FCB’s assessment rates are based on its risk classification (i.e., the level of risk it poses to the FDIC’s deposit insurance fund). For institutions with $10
9
billion or more in assets, assessment rates are calculated using a scorecard that combines the supervisory risk ratings of the institution with certain forward-looking financial measures. These assessment rates are subject to adjustments based upon the insured depository institution’s ratio of long-term unsecured debt to the assessment base, long-term unsecured debt issued by other insured depository institutions to the assessment base, and brokered deposits to the assessment base. However, the adjustments based on brokered deposits to the assessment base will not apply so long as the institution is well capitalized and has a composite CAMELS rating of 1 or 2. The CAMELS rating system is a bank rating system where bank supervisory authorities rate institutions according to six factors: capital adequacy, asset quality, management quality, earnings, liquidity, and sensitivity to market risk. The FDIC may make additional discretionary assessment rate adjustments.
In October 2010, the FDIC adopted a new DIF restoration plan to ensure that the fund reserve ratio reaches 1.35% by September 30, 2020, as required by the Dodd-Frank Act. In August 2016, the FDIC announced that the DIF reserve ratio had surpassed 1.15% as of June 30, 2016. As a result, beginning in the third quarter of 2016, the range of initial assessment ranges for all institutions were adjusted downward such that the initial base deposit insurance assessment rate ranges from 3 to 30 basis points on an annualized basis. After the effect of potential base-rate adjustments, the total base assessment rate could range from 1.5 to 40 basis points on an annualized basis. In March 2016, the FDIC adopted a final rule increasing the reserve ratio for the Deposit Insurance Fund to 1.35% of total insured deposits. The rule imposes a surcharge on the assessments of depository institutions with $10 billion or more in assets beginning the third quarter of 2016 and continuing through the earlier of the quarter that the reserve ratio first reaches or exceeds 1.35% and December 31, 2018. This surcharge does not currently impact FCB.
Repeal Of Federal Prohibitions On Payment Of Interest On Demand Deposits
. The federal prohibition restricting depository institutions from paying interest on demand deposit accounts was repealed effective on July 21, 2011 as part of the Dodd-Frank Act.
Capital Requirements
First Commonwealth and FCB are each required to comply with applicable capital adequacy standards established by the FRB. The current risk-based capital standards applicable to First Commonwealth and FCB are based on the December 2010 final capital framework for strengthening international capital standards, known as Basel III, of the Basel Committee on Banking Supervision (the “Basel Committee”).
Prior to January 1, 2015, the risk-based capital standards applicable to First Commonwealth and FCB were based on the 1988 Capital Accord, known as Basel I, of the Basel Committee. In July 2013, the federal bank regulators approved final rules (the “Basel III Capital Rules”) implementing the Basel III framework as well as certain provisions of the Dodd-Frank Act. The Basel III Capital Rules substantially revised the risk-based capital requirements applicable to bank holding companies and their depository institution subsidiaries, including First Commonwealth and FCB, as compared to the Basel I risk-based capital rules. The Basel III Capital Rules became effective for First Commonwealth and FCB on January 1, 2015 (subject to a phase-in period for certain provisions).
The Basel III Capital Rules, among other things:
|
•
|
introduce a new capital measure called Common Equity Tier 1 (“CET1”);
|
|
•
|
define CET1 narrowly by requiring that most deductions/adjustments to regulatory capital measures be made to CET1 and not to the other components of capital;
|
|
•
|
specify that Tier 1 capital consists of CET1 and “Additional Tier 1 capital” instruments meeting specified requirements; and
|
|
•
|
expand the scope of the deductions/adjustments as compared to existing regulations.
|
Under the Basel III Capital Rules, the initial minimum capital ratios that became effective on January 1, 2015 are as follows:
|
•
|
4.5% CET1 to risk-weighted assets
|
|
•
|
6.0% Tier 1 capital to risk-weighted assets
|
|
•
|
8.0% Total capital to risk-weighted assets
|
|
•
|
4.0% Tier 1 capital to average quarterly assets
|
Since being fully phased-in on January 1, 2019, the Basel III Capital Rules require First Commonwealth and FCB to maintain a 2.5% “capital conservation buffer” over the required ratios of CET1 to risk-weighted assets, Tier 1 capital to risk-weighted assets and Total capital to risk-weighted assets, effectively resulting in minimum ratios of 7.0%, 8.5% and 10.5%, respectively.
Banking institutions with a ratio of CET1 to risk-weighted assets above the minimum but below the conservation buffer will face constraints on dividends, equity repurchases and compensation based on the amount of the shortfall.
10
The Basel III Capital Rules provide for a number of deductions from and adjustments to CET1. These include, for example, the requirement that mortgage servicing rights, deferred tax assets arising from temporary differences that could not be realized through net operating loss carrybacks and significant investments in non-consolidated financial entities be deducted from CET1 to the extent that any one such category exceeds 10% of CET1 or all such categories in the aggregate exceed 15% of CET1. During 2015, First Commonwealth and FCB made a one-time permanent election, as permitted under Basel III Capital Rules, to exclude the effects of accumulated other comprehensive income items for the purposes of determining regulatory capital ratios.
Implementation of the deductions and other adjustments to CET1 began on January 1, 2015 and was phased-in over a four-year period (beginning at 40% on January 1, 2015 and an additional 20% per year thereafter). The implementation of the capital conservation buffer began on January 1, 2016 at the 0.625% level and was phased-in over a four-year period (increasing by that amount on each subsequent January 1, until it reached 2.5% on January 1, 2019).
With respect to FCB, the Basel III Capital Rules also revise the “prompt corrective action” regulations pursuant to Section 38 of the Federal Deposit Insurance Act, as discussed below under “Prompt Corrective Action.” The Basel III Capital Rules prescribe a standardized approach for risk weightings that expand the risk-weighting categories from the four Basel I-derived categories (0%, 20%, 50% and 100%) to a much larger and more risk-sensitive number of categories, depending on the nature of the assets, generally ranging from 0% for U.S. government and agency securities, to 600% for certain equity exposures, and resulting in higher risk weights for a variety of asset categories.
Management believes that, as of
December 31, 2018
, First Commonwealth and FCB has met all capital adequacy requirements under the Basel III Capital Rules on a fully phased-in basis as if such requirements had been in effect as of that date.
Liquidity Requirements
Historically, regulation and monitoring of bank and bank holding company liquidity has been addressed as a supervisory matter, without required formulaic measures. The Basel III final framework requires banks and bank holding companies to measure their liquidity against specific liquidity tests that, although similar in some respects to liquidity measures historically applied by banks and regulators for management and supervisory purposes, going forward will be required by regulation. One such test, referred to as the liquidity coverage ratio (“LCR”), is designed to ensure that the banking entity maintains an adequate level of unencumbered high-quality liquid assets equal to the entity’s expected net cash outflow for a 30-day time horizon (or, if greater, 25% of its expected total cash outflow) under an acute liquidity stress scenario. The other, referred to as the net stable funding ratio (“NSFR”), is designed to promote more medium- and long-term funding of the assets and activities of banking entities over a one-year time horizon. These requirements will incent banking entities to increase their holdings of U.S. Treasury securities and other sovereign debt as a component of assets and increase the use of long-term debt as a funding source. In September 2014, the federal bank regulators approved final rules implementing the LCR for advanced approaches banking organizations (i.e., banking organizations with $250 billion or more in total consolidated assets or $10 billion or more in total on-balance sheet foreign exposure) and a modified version of the LCR for bank holding companies with at least $50 billion in total consolidated assets that are not advanced approach banking organizations, neither of which would apply to First Commonwealth or FCB. While not required, FCB nevertheless utilizes a modified version of the LCR as a helpful tool for monitoring its liquidity position. In the second quarter of 2016, the federal banking regulators issued a proposed rule that would implement the NSFR for certain U.S. banking organizations. The proposed rule would require certain U.S. banking organizations to ensure they have access to stable funding over a one-year time horizon and has an effective date of January 1, 2018. The proposed rule would not apply to U.S. banking organizations with less than $50 billion in total consolidated assets such as First Commonwealth or FCB.
Following the enactment of the Economic Growth, Regulatory Relief and Consumer Protection Act of 2018 (“EGRRCPA”), the Federal Reserve Board stated in July 2018 that it would no longer require bank holding companies with less than $100 billion in total consolidated assets to comply with the modified version of the LCR. In addition, in October 2018, the federal bank regulators proposed to revise their liquidity requirements so that banking organizations that are not global systemically important banks and have less than $250 billion in total consolidated assets and less than $75 billion in each of off-balance-sheet exposure, nonbank assets, cross-jurisdictional activity and short-term wholesale funding would not be subject to any LCR or NSFR requirements.
Prompt Corrective Action
The Federal Deposit Insurance Act, as amended (“FDIA”), requires, among other things, the federal banking agencies to take “prompt corrective action” in respect of depository institutions that do not meet minimum capital requirements. The FDIA includes the following five capital tiers: “well capitalized,” “adequately capitalized,” “undercapitalized,” “significantly undercapitalized” and “critically undercapitalized.” A depository institution’s capital tier will depend upon how its capital levels compare with various relevant capital measures and certain other factors, as established by regulation. The relevant capital measures are the total capital ratio, the CET1 capital ratio (a new ratio requirement under the Basel III Capital Rules), the Tier 1 capital ratio and the leverage ratio.
11
A bank will be (i) “well capitalized” if the institution has a total risk-based capital ratio of 10.0% or greater, a CET1 capital ratio of 6.5% or greater, a Tier 1 risk-based capital ratio of 8.0% or greater, and a leverage ratio of 5.0% or greater, and is not subject to any order or written directive by any such regulatory authority to meet and maintain a specific capital level for any capital measure; (ii) “adequately capitalized” if the institution has a total risk-based capital ratio of 8.0% or greater, a CET1 capital ratio of 4.5% or greater, a Tier 1 risk-based capital ratio of 6.0% or greater, and a leverage ratio of 4.0% or greater and is not “well capitalized”; (iii) “undercapitalized” if the institution has a total risk-based capital ratio that is less than 8.0%, a CET1 capital ratio less than 4.5%, a Tier 1 risk-based capital ratio of less than 6.0% or a leverage ratio of less than 4.0%; (iv) “significantly undercapitalized” if the institution has a total risk-based capital ratio of less than 6.0%, a CET1 capital ratio less than 3%, a Tier 1 risk-based capital ratio of less than 4.0% or a leverage ratio of less than 3.0%; and (v) “critically undercapitalized” if the institution’s tangible equity is equal to or less than 2.0% of average quarterly tangible assets. An institution may be downgraded to, or deemed to be in, a capital category that is lower than indicated by its capital ratios if it is determined to be in an unsafe or unsound condition or if it receives an unsatisfactory examination rating with respect to certain matters. A bank’s capital category is determined solely for the purpose of applying prompt corrective action regulations, and the capital category may not constitute an accurate representation of the bank’s overall financial condition or prospects for other purposes.
The FDIA generally prohibits a depository institution from making any capital distributions (including payment of a dividend) or paying any management fee to its parent holding company if the depository institution would thereafter be “undercapitalized.” “Undercapitalized” institutions are subject to growth limitations and are required to submit a capital restoration plan. The agencies may not accept such a plan without determining, among other things, that the plan is based on realistic assumptions and is likely to succeed in restoring the depository institution’s capital. In addition, for a capital restoration plan to be acceptable, the depository institution’s parent holding company must guarantee that the institution will comply with such capital restoration plan and must also provide appropriate assurances of performance. The aggregate liability of the parent holding company is limited to the lesser of (i) an amount equal to 5.0% of the depository institution’s total assets at the time it became undercapitalized and (ii) the amount which is necessary (or would have been necessary) to bring the institution into compliance with all capital standards applicable with respect to such institution as of the time it fails to comply with the plan. If a depository institution fails to submit an acceptable plan, it is treated as if it is “significantly undercapitalized.”
In addition, the FDIA prohibits an insured depository institution from accepting brokered deposits or offering interest rates on any deposits significantly higher than the prevailing rate in the bank's normal market area or nationally (depending upon where the deposits are solicited), unless it is well capitalized or is adequately capitalized and receives a waiver from the FDIC. A depository institution that is adequately capitalized and accepts brokered deposits under a waiver from the FDIC may not pay an interest rate on any deposit in excess of 75 basis points over certain prevailing market rates.
“Significantly undercapitalized” depository institutions may be subject to a number of requirements and restrictions, including orders to sell sufficient voting stock to become “adequately capitalized,” requirements to reduce total assets, and cessation of receipt of deposits from correspondent banks. “Critically undercapitalized” institutions are subject to the appointment of a receiver or conservator.
The appropriate federal banking agency may, under certain circumstances, reclassify a well-capitalized insured depository institution as adequately capitalized. The FDIA provides that an institution may be reclassified if the appropriate federal banking agency determines (after notice and opportunity for hearing) that the institution is in an unsafe or unsound condition or deems the institution to be engaging in an unsafe or unsound practice.
The appropriate agency is also permitted to require an adequately capitalized or undercapitalized institution to comply with the supervisory provisions as if the institution were in the next lower category (but not treat a significantly undercapitalized institution as critically undercapitalized) based on supervisory information other than the capital levels of the institution.
First Commonwealth believes that, as of
December 31, 2018
, FCB was a “well-capitalized” bank as defined by the FDIA. See Note 26 “Regulatory Restrictions and Capital Adequacy” of Notes to the Consolidated Financial Statements, contained in Item 8, for a table that provides a comparison of First Commonwealth’s and FCB’s risk-based capital ratios and the leverage ratio to minimum regulatory requirements.
The Volcker Rule
The Dodd-Frank Act prohibits banks and their affiliates from engaging in proprietary trading and investing in and sponsoring hedge funds and private equity funds (so called "covered funds"). The statutory provision is commonly called the “Volcker Rule.” Banks with less than $10 billion in total consolidated assets, such as FCB, that do not engage in any covered activities, other than trading in certain government, agency, state or municipal obligations, do not have any significant compliance obligations under the rules implementing the Volcker Rule.
12
Depositor Preference
Under federal law, depositors (including the FDIC with respect to the subrogated claims of insured depositors) and certain claims for administrative expenses of the FDIC as receiver would be afforded a priority over other general unsecured claims against such an institution in the liquidation or other resolution of such an institution by any receiver.
Interchange Fees
Under the Durbin Amendment to the Dodd-Frank Act, the FRB adopted rules establishing standards for assessing whether the interchange fees that may be charged with respect to certain electronic debit transactions are “reasonable and proportional” to the costs incurred by issuers for processing such transactions. Interchange fees, or “swipe” fees, are charges that merchants pay to us and other card-issuing banks for processing electronic payment transactions. Under the final rules, the maximum permissible interchange fee is equal to no more than 21 cents plus 5 basis points of the transaction value for many types of debit interchange transactions. The FRB also adopted a rule to allow a debit card issuer to recover 1 cent per transaction for fraud prevention purposes if the issuer complies with certain fraud-related requirements required by the FRB. The FRB also has rules governing routing and exclusivity that require issuers to offer two unaffiliated networks for routing transactions on each debit or prepaid product.
The Dodd-Frank Act contained an exemption from the interchange fee cap for any debit card issuer that, together with its affiliates, has total assets of less than $10 billion as of the end of the previous calendar year. We currently qualify for this exemption. We earned approximately
$20.2 million
in card related interchange income during the 2018 fiscal year. If we did not qualify for this exemption, we estimate that our interchange income would have been approximately
$11.7 million
, representing a
$8.4 million
reduction due to the cap on interchange fees. We would become subject to the interchange fee cap beginning July 1 of the year following the time when our total assets reaches or exceeds $10 billion.
Enhanced Prudential Standards
The Dodd-Frank Act, as amended by EGRRCPA, which was signed into law on May 24, 2018, directs the Federal Reserve Board to monitor emerging risks to financial stability and enact enhanced supervision and prudential standards applicable to bank holding companies with total consolidated assets of $250 billion or more and non-bank covered companies designated as systemically important by the Financial Stability Oversight Council (often referred to as systemically important financial institutions). The Dodd-Frank Act mandates that certain regulatory requirements applicable to systemically important financial institutions be more stringent than those applicable to other financial institutions. In general, EGRRCPA increased the statutory asset threshold above which the Federal Reserve is required to apply these enhanced prudential standards from $50 billion to $250 billion (subject to certain discretion by the Federal Reserve to apply any enhanced prudential standard requirement to any BHC with between $100 billion and $250 billion in total consolidated assets that would otherwise be exempt under EGRRCPA). BHCs with $250 billion or more in total consolidated assets remain fully subject to the Dodd-Frank Act’s enhanced prudential standards requirements.
In February 2014, the Federal Reserve adopted rules to implement certain of these enhanced prudential standards. Beginning in 2015, the rules require publicly traded bank holding companies with $10 billion or more in total consolidated assets to establish risk committees and require bank holding companies with $50 billion or more in total consolidated assets to comply with enhanced liquidity and overall risk management standards. In October 2018, the Federal Reserve and the other federal bank regulators proposed rules that would tailor the application of the enhanced prudential standards to BHCs and depository institutions pursuant to the EGRRCPA amendments, including by raising the asset threshold for application of many of these standards. For example, all publicly traded bank holding companies with $50 billion or more in total consolidated assets would be required to maintain a risk committee.
Financial Privacy
The federal banking regulators adopted rules that limit the ability of banks and other financial institutions to disclose non-public information about consumers to nonaffiliated third parties. These limitations require disclosure of privacy policies to consumers and, in some circumstances, allow consumers to prevent disclosure of certain personal information to a nonaffiliated third party. These regulations affect how consumer information is transmitted through diversified financial companies and conveyed to outside vendors.
Anti-Money Laundering and the USA Patriot Act
A major focus of governmental policy on financial institutions in recent years has been aimed at combating money laundering and terrorist financing. The USA PATRIOT Act of 2001 (the “USA Patriot Act”) substantially broadened the scope of United States anti-money laundering laws and regulations by imposing significant new compliance and due diligence obligations, creating new crimes and penalties and expanding the extra-territorial jurisdiction of the United States. Financial institutions are
13
also prohibited from entering into specified financial transactions and account relationships and must use enhanced due diligence procedures in their dealings with certain types of high-risk customers and implement a written customer identification program. Financial institutions must take certain steps to assist government agencies in detecting and preventing money laundering and report certain types of suspicious transactions. Regulatory authorities routinely examine financial institutions for compliance with these obligations, and failure of a financial institution to maintain and implement adequate programs to combat money laundering and terrorist financing, or to comply with all of the relevant laws or regulations, could have serious legal and reputational consequences for the institution, including causing applicable bank regulatory authorities not to approve merger or acquisition transactions when regulatory approval is required or to prohibit such transactions even if approval is not required. Regulatory authorities have imposed cease and desist orders and civil money penalties against institutions found to be violating these obligations.
Office of Foreign Assets Control Regulation
The U.S. Treasury Department’s Office of Foreign Assets Control ("OFAC") administers and enforces economic and trade sanctions against targeted foreign countries and regimes, under authority of various laws, including designated foreign countries, nationals and others. OFAC publishes lists of specially designated targets and countries. First Commonwealth is responsible for, among other things, blocking accounts of, and transactions with, such targets and countries, prohibiting unlicensed trade and financial transactions with them and reporting blocked transactions after their occurrence. Failure to comply with these sanctions could have serious legal and reputational consequences, including causing applicable bank regulatory authorities not to approve merger or acquisition transactions when regulatory approval is required or to prohibit such transactions even if approval is not required.
Cybersecurity
In March 2015, federal regulators issued two related statements regarding cybersecurity. One statement indicates that financial institutions should design multiple layers of security controls to establish lines of defense and to ensure that their risk management processes also address the risk posed by compromised customer credentials, including security measures to reliably authenticate customers accessing internet-based services of the financial institution. The other statement indicates that a financial institution’s management is expected to maintain sufficient business continuity planning processes to ensure the rapid recovery, resumption and maintenance of the institution’s operations after a cyber-attack involving destructive malware. A financial institution is also expected to develop appropriate processes to enable recovery of data and business operations and address rebuilding network capabilities and restoring data if the institution or its critical service providers fall victim to this type of cyber-attack. If we fail to observe the regulatory guidance, we could be subject to various regulatory sanctions, including financial penalties.
State regulators have also been increasingly active in implementing privacy and cybersecurity standards and regulations. Recently, several states have adopted regulations requiring certain financial institutions to implement cybersecurity programs and providing detailed requirements with respect to these programs, including data encryption requirements. Many states have also recently implemented or modified their data breach notification and data privacy requirements. We expect this trend of state-level activity in those areas to continue, and are continually monitoring developments in the states in which our customers are located.
In the ordinary course of business, we rely on electronic communications and information systems to conduct our operations and to store sensitive data. We employ an in-depth, layered, defensive approach that leverages people, processes and technology to manage and maintain cybersecurity controls. We employ a variety of preventative and detective tools to monitor, block, and provide alerts regarding suspicious activity, as well as to report on any suspected advanced persistent threats. Notwithstanding the strength of our defensive measures, the threat from cyber-attacks is severe, attacks are sophisticated and increasing in volume, and attackers respond rapidly to changes in defensive measures. While to date we have not experienced a significant compromise, significant data loss or any material financial losses related to cybersecurity attacks, our systems and those of our customers and third-party service providers are under constant threat and it is possible that we could experience a significant event in the future. Risks and exposures related to cybersecurity attacks are expected to remain high for the foreseeable future due to the rapidly evolving nature and sophistication of these threats, as well as due to the expanding use of internet banking, mobile banking and other technology-based products and services by us and our customers. See Item 1A. Risk Factors for a further discussion of risks related to cybersecurity.
Future Legislation and Regulation
Congress may enact legislation from time to time that affects the regulation of the financial services industry, and state legislatures may enact legislation from time to time affecting the regulation of financial institutions chartered by or operating in those states. Federal and state regulatory agencies also periodically propose and adopt changes to their regulations or change the manner in which existing regulations are applied. The substance or impact of pending or future legislation or regulation, or the application thereof, cannot be predicted, although enactment of the proposed legislation could impact the regulatory structure
14
under which we operate and may significantly increase our costs, impede the efficiency of our internal business processes, require us to increase our regulatory capital and modify our business strategy, and limit our ability to pursue business opportunities in an efficient manner. Our business, financial condition, results of operations or prospects may be adversely affected, perhaps materially, as a result.
Availability of Financial Information
We file annual, quarterly and current reports, proxy statements and other information with the SEC. You may read and copy any document we file at the Securities and Exchange Commission’s Public Reference Room at 100 F Street, N.E., Washington, D.C. 20549. Our SEC filings are also available to the public on the SEC website at www.sec.gov and on our website at www.fcbanking.com.
We also make available on our website, www.fcbanking.com, and in print to any shareholder who requests them, our Corporate Governance Guidelines, the charters for our Audit, Risk, Compensation and Human Resources, and Governance Committees, and the Code of Conduct and Ethics that applies to all of our directors, officers and employees.
Our Chief Executive Officer has certified to the New York Stock Exchange (“NYSE”) that, as of the date of the certification, he was not aware of any violation by First Commonwealth of NYSE’s corporate governance listing standards. In addition, our Chief Executive Officer and Chief Financial Officer have made certain certifications concerning the information contained in this report pursuant to Section 302 of the Sarbanes-Oxley Act. The Section 302 certifications appear as Exhibits 31.1 and 31.2 to this annual report on Form 10-K.
ITEM 1A.
Risk Factors
As a financial services company, we are subject to a number of risks, many of which are outside of our control. These risks include, but are not limited to:
Changes in interest rates could negatively impact our financial condition and results of operations.
Our results of operations depend substantially on net interest income, which is the difference between interest earned on interest-earning assets (such as investments and loans) and interest paid on interest-bearing liabilities (such as deposits and borrowings). Interest rates are highly sensitive to many factors, including governmental monetary policies and domestic and international economic and political conditions. Conditions such as inflation, recession, unemployment, money supply, and other factors beyond our control may also affect interest rates. If our interest-earning assets mature or reprice more quickly than interest-bearing liabilities in a declining interest rate environment, net interest income could be adversely impacted. Likewise, if interest-bearing liabilities mature or reprice more quickly than interest-earnings assets in a rising interest rate environment, net interest income could be adversely impacted.
Changes in interest rates also can affect the value of loans and other assets. An increase in interest rates that adversely affects the ability of borrowers to pay the principal or interest on loans may lead to an increase in nonperforming assets and a reduction of income recognized, which could have a material adverse effect on our results of operations and cash flows.
We are subject to extensive government regulation and supervision.
Banking regulations are primarily intended to protect depositors’ funds, federal deposit insurance funds and the banking system as a whole, not security holders. These regulations affect our lending practices, capital structure, investment practices, dividend policy and growth, among other things. Congress and federal regulatory agencies continually review banking laws, regulations and policies for possible changes. Changes to statutes, regulations or regulatory policies, including changes in interpretation or implementation of statutes, regulations or policies, could affect us in substantial and unpredictable ways. Such changes could subject us to additional costs, limit the types of financial services and products we may offer and/or increase the ability of non-banks to offer competing financial services and products, among other things. Failure to comply with laws, regulations, policies or supervisory guidance could result in enforcement and other legal actions by Federal or state authorities, including criminal and civil penalties, the loss of FDIC insurance, the revocation of a banking charter, other sanctions by regulatory agencies, civil money penalties and/or reputational damage. In this regard, government authorities, including the bank regulatory agencies, are pursuing aggressive enforcement actions with respect compliance and other legal matters involving financial activities, which heightens the risks associated with actual and perceived compliance failures. See “Supervision and Regulation” included in Item 1. Business for a more detailed description of the regulatory requirements applicable to First Commonwealth.
Declines in real estate values could adversely affect our earnings and financial condition.
As of
December 31, 2018
, approximately
70%
of our loans were secured by real estate. These loans consist of residential real estate loans (approximately
27%
of total loans), commercial real estate loans (approximately
37%
of total loans) and real estate construction loans (approximately
6%
of total loans). Declines in real estate values, both within and outside of Pennsylvania,
15
could adversely affect the value of the collateral for these loans, the ability of borrowers to make timely repayment of these loans and our ability to recoup the value of the collateral upon foreclosure, negatively impacting our earnings and financial condition.
Our earnings are significantly affected by general business and economic conditions.
Our operations and profitability are impacted by general business and economic conditions in the United States and abroad. These conditions include short-term and long-term interest rates, inflation, money supply, political issues, legislative and regulatory changes, fluctuations in both debt and equity capital markets, broad trends in industry and finance and the strength of the United States economy, all of which are beyond our control. A deterioration in economic conditions could result in an increase in loan delinquencies and nonperforming assets, decreases in loan collateral values and a decrease in demand for our products and services, among other things, any of which could have a material adverse impact on our financial condition and results of operations.
Our allowance for credit losses may be insufficient.
All borrowers carry the potential to default and our remedies to recover may not fully satisfy money previously loaned. We maintain an allowance for credit losses, which is a reserve established through a provision for credit losses charged to expense, which represents management’s best estimate of probable credit losses that have been incurred within the existing portfolio of loans. The allowance, in the judgment of management, is adequate to reserve for estimated loan losses and risks inherent in the loan portfolio. The level of the allowance for credit losses reflects management’s continuing evaluation of industry concentrations, specific credit risks, loan loss experience, current loan portfolio quality, present economic conditions and unidentified losses in the current loan portfolio. The determination of the appropriate level of the allowance for credit losses inherently involves a high degree of subjectivity and requires us to make significant estimates of current credit risks using existing qualitative and quantitative information, all of which may undergo material changes. Changes in economic conditions affecting borrowers, new information regarding existing loans, identification of additional problem loans and other factors, both within and outside of our control, may require an increase in the allowance for credit losses. In addition, bank regulatory agencies periodically review our allowance for credit losses and may require an increase in the provision for credit losses or the recognition of additional loan charge-offs, based on judgments different than those of management. An increase in the allowance for credit losses results in a decrease in net income or losses, and possibly risk-based capital, and may have a material adverse effect on our financial condition and results of operations.
We may be adversely impacted by the transition from LIBOR as a reference rate.
In 2017, the United Kingdom’s Financial Conduct Authority announced that after 2021 it would no longer compel banks to submit the rates required to calculate the London Interbank Offered Rate (“LIBOR”). This announcement indicates that the continuation of LIBOR on the current basis cannot and will not be guaranteed after 2021. Consequently, at this time, it is not possible to predict whether and to what extent banks will continue to provide submissions for the calculation of LIBOR. Similarly, it is not possible to predict whether LIBOR will continue to be viewed as an acceptable market benchmark, what rate or rates may become accepted alternatives to LIBOR, or what the effect of any such changes in views or alternatives may be on the markets for LIBOR-indexed financial instruments.
We have a significant number of loans, derivative contracts, borrowings and other financial instruments with attributes that are either directly or indirectly dependent on LIBOR. The transition from LIBOR could create considerable costs and additional risk. Since proposed alternative rates are calculated differently, payments under contracts referencing new rates will differ from those referencing LIBOR. The transition will change our market risk profiles, requiring changes to risk and pricing models, valuation tools, product design and hedging strategies. Furthermore, failure to adequately manage this transition process with our customers could adversely impact our reputation. Although we are currently unable to assess what the ultimate impact of the transition from LIBOR will be, failure to adequately manage the transition could have a material adverse effect on our business, financial condition and results of operations.
Acts of cyber-crime may compromise client and company information, disrupt access to our systems or result in loss of client or company assets.
Our business is dependent upon the availability of technology, the Internet and telecommunication systems to enable financial transactions by clients, record and monitor transactions and transmit and receive data to and from clients and third parties. Information security risks have increased significantly due to the use of online, telephone and mobile banking channels by clients and the increased sophistication and activities of organized crime, hackers, terrorists and other external parties. Our technologies, systems, networks and our clients’ devices have been subject to, and are likely to continue to be the target of, cyber-attacks, computer viruses, malicious code, phishing attacks or information security breaches that could result in the unauthorized release, gathering, monitoring, misuse, loss or destruction of our or our clients’ confidential, proprietary and other
16
information, the theft of client assets through fraudulent transactions or disruption of our or our clients’ or other third parties’ business operations. Any of the foregoing could have a material adverse effect on First Commonwealth's business, financial condition and results of operations.
We must evaluate whether any portion of our recorded goodwill is impaired. Impairment testing may result in a material, non-cash write-down of our goodwill assets and could have a material adverse impact on our results of operations.
At
December 31, 2018
, goodwill represented approximately
4%
of our total assets. We have recorded goodwill because we paid more for some of our businesses than the fair market value of the tangible and separately measurable intangible net assets of those businesses. We test our goodwill and other intangible assets with indefinite lives for impairment at least annually (or whenever events occur which may indicate possible impairment). Goodwill impairment is determined by comparing the fair value of a reporting unit to its carrying amount, including goodwill. If the fair value exceeds the carrying amount, goodwill of the reporting unit is not considered impaired. If the fair value of the reporting unit is less than the carrying amount, goodwill is considered impaired. Determining the fair value of our company requires a high degree of subjective management assumptions. Any changes in key assumptions about our business and its prospects, changes in market conditions or other externalities, for impairment testing purposes could result in a non-cash impairment charge and such a charge could have a material adverse effect on our consolidated results of operations. Changes in the economic environment may adversely affect our earnings, the fair value of our assets and liabilities and our stock price, all of which may increase the risk of goodwill impairment.
First Commonwealth relies on dividends from its subsidiaries for most of its revenues.
First Commonwealth is a separate and distinct legal entity from its subsidiaries. It receives substantially all of its revenues from dividends from its subsidiaries. These dividends are the principal source of funds to pay dividends on First Commonwealth’s common stock and interest and principal on First Commonwealth’s debt. Various federal and/or state laws and regulations limit the amount of dividends that FCB and certain non-bank subsidiaries may pay to First Commonwealth. In the event FCB is unable to pay dividends to First Commonwealth, First Commonwealth may not be able to service debt, pay obligations or pay dividends on its common stock. The inability to receive dividends from FCB could have a material adverse effect on First Commonwealth’s business, financial condition and results of operations.
Competition from other financial institutions in originating loans, attracting deposits and providing various financial services may adversely affect our profitability.
FCB faces substantial competition in originating loans and attracting deposits. This competition comes principally from other banks, savings institutions, mortgage banking companies and credit unions, as well as institutions offering uninsured investment alternatives, including money market funds. Many of our competitors enjoy advantages, including greater financial resources and higher lending limits, better brand recognition, a wider geographic presence, more accessible branch office locations, the ability to offer a wider array of services or more favorable pricing alternatives, as well as lower origination and operating costs. These competitors may offer more favorable pricing through lower interest rates on loans or higher interest rates on deposits, which could force us to match competitive rates and thereby reduce our net interest income.
Negative publicity could damage our reputation.
Reputation risk, or the risk to our earnings and capital from negative public opinion, is inherent in our business. Negative public opinion could adversely affect our ability to keep and attract customers and expose us to adverse legal and regulatory consequences. Negative public opinion could result from our actual or alleged conduct in any number of activities, including lending practices, corporate governance, regulatory compliance, mergers and acquisitions, and disclosure, sharing or inadequate protection of customer information, and from actions taken by government regulators and community organizations in response to that conduct. Because we conduct all of our business under the “First Commonwealth” brand, negative public opinion about one business could affect our other businesses.
An interruption to our information systems could adversely impact our operations.
We rely upon our information systems for operating and monitoring all major aspects of our business, including deposit and loan operations, as well as internal management functions. These systems and our operations could be damaged or interrupted by natural disasters, power loss, network failure, improper operation by our employees, security breaches, computer viruses, intentional attacks by third parties or other unexpected events. Any disruption in the operation of our information systems could adversely impact our operations, which may affect our financial condition, results of operations and cash flows.
17
Our controls and procedures may fail or be circumvented.
Our internal controls, disclosure controls and procedures, and corporate governance policies and procedures are based in part on certain assumptions and can provide only reasonable, not absolute, assurances that the objectives of the system are met. Any failure or circumvention of our controls and procedures or failure to comply with regulations related to controls and procedures could have a material adverse effect on First Commonwealth’s business, financial condition and results of operations.
We continually encounter technological change.
The financial services industry is continually undergoing rapid technological change with frequent introductions of new technology-driven products and services. The effective use of technology increases efficiency and enables financial institutions to better serve customers and to reduce costs. Our future success depends, in part, upon our ability to address the needs of our customers by using technology to provide products and services that will satisfy customer demands, as well as to create additional efficiencies in our operations. Many of our competitors have substantially greater resources to invest in technological improvements. We may not be able to effectively implement new technology-driven products and services or be successful in marketing these products and services to its customers. Failure to successfully keep pace with technological change affecting the financial services industry could have a material adverse effect on First Commonwealth’s business, financial condition and results of operations.
We may not be able to attract and retain skilled people.
Our success depends, in large part, on our ability to attract and retain key people. Competition for the best people can be intense and we may not be able to hire people or to retain them. The unexpected loss of services of key personnel could have a material adverse impact on our business, financial condition and results of operations because of their customer relationships, skills, knowledge of our market, years of industry experience and the difficulty of promptly finding qualified replacement personnel.
Our operations rely on external vendors.
We rely on certain vendors to provide products and services necessary to maintain the day-to-day operations of First Commonwealth and FCB. In particular, we contracted with an external vendor for our core processing system used to maintain customer and account records, reflect account transactions and activity, and support our customer relationship management systems for substantially all of our deposit and loan customers. Accordingly, our operations are exposed to risk that these vendors will not perform in accordance with the contracted arrangements under service level agreements. The failure of an external vendor to perform in accordance with the contracted arrangements under service level agreements, because of changes in the vendor’s organizational structure, financial condition, support for existing products and services or strategic focus or for any other reason, could be disruptive to First Commonwealth’s operations and financial reporting, which could have a material adverse effect on First Commonwealth’s business and, in turn, First Commonwealth’s financial condition and results of operations.
We are subject to environmental liability risk associated with lending activities.
A significant portion of FCB's loan portfolio is secured by real property. During the ordinary course of business, FCB may foreclose on and take title to properties securing certain loans. In doing so, there is a risk that hazardous or toxic substances could be found on these properties. If hazardous or toxic substances are found, we may be liable for remediation costs, as well as for personal injury and property damage. Environmental laws may require us to incur substantial expenses and may materially reduce the affected property’s value or limit our ability to use or sell the affected property. In addition, future laws or more stringent interpretations or enforcement policies with respect to existing laws may increase our exposure to environmental liability. Environmental reviews of real property before initiating foreclosure actions may not be sufficient to detect all potential environmental hazards. The remediation costs and any other financial liabilities associated with an environmental hazard could have a material adverse effect on First Commonwealth’s business, financial condition and results of operations.
Severe weather, natural disasters, acts of war or terrorism and other external events could significantly impact our business.
Severe weather, natural disasters, acts of war or terrorism and other adverse external events could have a significant impact on our ability to conduct business. In addition, such events could affect the stability of FCB’s deposit base, impair the ability of borrowers to repay outstanding loans, impair the value of collateral securing loans, cause significant property damage, result in loss of revenue and/or cause us to incur additional expenses. The occurrence of any such event in the future could have a material adverse effect on our business, which, in turn, could have a material adverse effect on First Commonwealth’s financial condition and results of operations.
18
Financial services companies depend on the accuracy and completeness of information about customers and counterparties.
In deciding whether to extend credit or enter into other transactions, we may rely on information furnished by or on behalf of customers and counterparties, including financial statements, credit reports and other financial information. We may also rely on representations of those customers, counterparties or other third parties, such as independent auditors, as to the accuracy and completeness of that information. Reliance on inaccurate or misleading financial statements, credit reports or other financial information could have a material adverse impact on First Commonwealth’s business, financial condition and results of operations.
We may be adversely affected by the soundness of other financial institutions.
Financial services institutions that deal with each other are interconnected as a result of trading, investment, liquidity management, clearing, counterparty and other relationships. Within the financial services industry, loss of public confidence, including through default by any one institution, could lead to liquidity challenges or to defaults by other institutions. Concerns about, or a default by, one institution could lead to significant liquidity problems and losses or defaults by other institutions, as the commercial and financial soundness of many financial institutions is closely related as a result of these credit, trading, clearing and other relationships. Even the perceived lack of creditworthiness of, or questions about, a counterparty may lead to market-wide liquidity problems and losses or defaults by various institutions. This systemic risk may adversely affect financial intermediaries, such as clearing agencies, banks and exchanges with which we interact on a daily basis or key funding providers such as the Federal Home Loan Banks, any of which could have a material adverse effect on our access to liquidity or otherwise have a material adverse effect on our business, financial condition or results of operations.
First Commonwealth’s stock price can be volatile.
Stock price volatility may make it more difficult for you to resell your common stock when you want and at prices you find attractive. First Commonwealth’s stock price can fluctuate significantly in response to a variety of factors including, among other things:
|
•
|
Actual or anticipated variations in quarterly results of operations.
|
|
•
|
Recommendations by securities analysts.
|
|
•
|
Operating and stock price performance of other companies that investors deem comparable to First Commonwealth.
|
|
•
|
News reports relating to trends, concerns and other issues in the financial services industry.
|
|
•
|
Perceptions in the marketplace regarding First Commonwealth and/or its competitors.
|
|
•
|
New technology used, or services offered, by competitors.
|
|
•
|
Significant acquisitions or business combinations, strategic partnerships, joint ventures or capital commitments by or involving First Commonwealth or its competitors.
|
|
•
|
Failure to integrate acquisitions or realize anticipated benefits from acquisitions.
|
|
•
|
Changes in government regulations.
|
|
•
|
Geopolitical conditions such as acts or threats of terrorism or military conflicts.
|
General market fluctuations, including real or anticipated changes in the strength of the economy in Pennsylvania and Ohio; industry factors and general economic and political conditions and events, such as economic slowdowns or recessions; interest rate changes or credit loss trends could also cause First Commonwealth’s stock price to decrease regardless of operating results.
The trading volume in First Commonwealth’s common stock is less than that of other larger financial services companies.
Although First Commonwealth’s common stock is listed for trading on the NYSE, the trading volume in its common stock is less than that of other, larger financial services companies. A public trading market having the desired characteristics of depth, liquidity and orderliness depends on the presence in the marketplace of willing buyers and sellers of First Commonwealth’s common stock at any given time. This presence depends on the individual decisions of investors and general economic and market conditions over which we have no control. Given the lower trading volume of First Commonwealth’s common stock, significant sales of First Commonwealth’s common stock, or the expectation of these sales, could cause First Commonwealth’s stock price to fall.
First Commonwealth may not continue to pay dividends on its common stock in the future.
Holders of First Commonwealth common stock are only entitled to receive such dividends as its board of directors may declare out of funds legally available for such payments. Although First Commonwealth has historically declared cash dividends on its
19
common stock, it is not required to do so and may reduce or eliminate its common stock dividend in the future. This could adversely affect the market price of First Commonwealth’s common stock. Also, First Commonwealth is a bank holding company, and its ability to declare and pay dividends is dependent on certain federal regulatory considerations, including the guidelines of the FRB regarding capital adequacy and dividends.
As more fully discussed in Part II, Item 8, Financial Statements and Supplementary Data-Note 26, Regulatory Restrictions and Capital Adequacy, which is located elsewhere in this report, the ability of First Commonwealth to declare or pay dividends on its common stock may also be subject to certain restrictions in the event that First Commonwealth elects to defer the payment of interest on its junior subordinated debt securities.
An investment in First Commonwealth’s common stock is not an insured deposit.
First Commonwealth’s common stock is not a bank deposit and, therefore, is not insured against loss by the FDIC, any other deposit insurance fund or by any other public or private entity. Investment in First Commonwealth’s common stock is inherently risky for the reasons described in this Risk Factors section and elsewhere in this report and is subject to the same market forces that affect the price of common stock in any company. As a result, if you acquire First Commonwealth’s common stock, you could lose some or all of your investment.
Provisions of our articles of incorporation, bylaws and Pennsylvania law, as well as state and federal banking regulations, could delay or prevent a takeover of us by a third party.
Provisions in our articles of incorporation and bylaws, the corporate law of the Commonwealth of Pennsylvania, and state and federal regulations could delay, defer or prevent a third party from acquiring us, despite the possible benefit to our shareholders, or otherwise adversely affect the price of our common stock. These provisions include, among other things, advance notice requirements for proposing matters that shareholders may act on at shareholder meetings. In addition, under Pennsylvania law, we are prohibited from engaging in a business combination with any interested shareholder for a period of five years from the date the person became an interested shareholder unless certain conditions are met. These provisions may discourage potential takeover attempts, discourage bids for our common stock at a premium over market price or adversely affect the market price of, and the voting and other rights of the holders of, our common stock.
ITEM 1B.
Unresolved Staff Comments
None.
ITEM 2.
Properties
Our principal office is located in the old Indiana County courthouse complex, consisting of the former courthouse building and the former sheriff’s residence and jail building for Indiana County. This certified Pennsylvania and national historic landmark was built in 1870 and restored by us in the early 1970s. We lease the complex from Indiana County pursuant to a lease agreement that was originally signed in 1973 and has a current term that expires in 2048.
The majority of our administrative personnel are also located in two owned buildings in Indiana, Pennsylvania, each of which is in close proximity to our principal office.
First Commonwealth Bank has
137
community banking offices, of which
53
are leased and
84
are owned. We also lease
three
mortgage loan production offices and three corporate loan production offices. During 2018, we acquired
5
leased branches from Garfield Acquisition Corp. in Cincinnati, Ohio.
While these facilities are adequate to meet our current needs, available space is limited and additional facilities may be required to support future expansion. However, we have no significant plans to lease, purchase or construct additional administrative facilities.
ITEM 3.
Legal Proceedings
The information required by this Item is set forth in Part II, Item 8, Note 23, “Contingent Liabilities,” which is incorporated herein by reference in response to this item.
ITEM 4.
Mine Safety Disclosures
Not applicable.
20
Executive Officers of First Commonwealth Financial Corporation
The name, age and principal occupation for each of the executive officers of First Commonwealth Financial Corporation as of
December 31, 2018
is set forth below:
Jane Grebenc, age 60, has served as Executive Vice President and Chief Revenue Officer of First Commonwealth Financial Corporation and President of First Commonwealth Bank since May 31, 2013. Ms. Grebenc's financial services career includes executive leadership roles at a variety of institutions, including Park View Federal Savings Bank, Key Bank, and National City Bank. She was formerly the Executive Vice President in charge of the retail, marketing, IT and operations and the mortgage segments at Park View Federal Savings Bank from 2009 until 2012, the Executive Vice President in charge of the Wealth Segment at Key Bank from 2007 until 2009 and the Executive Vice President / Branch Network at National City Bank prior to 2007.
Brian Karrip, age 58, has served as Executive Vice President and Chief Credit Officer of First Commonwealth Bank since September 2016. Prior to joining First Commonwealth, Mr. Karrip served as Executive Vice President, Specialized Lending for FirstMerit Bank. Prior to joining FirstMerit Bank, Mr. Karrip served as Managing Director and Group Head of Loan Syndications and Sales at KeyBanc Capital Markets. Mr. Karrip’s financial services career also includes 16 years with National City Bank where he held a variety of roles in the commercial lending division and served as Regional President of Michigan and Illinois.
Leonard V. Lombardi, age 59, has served as Executive Vice President and Chief Audit Executive of First Commonwealth Financial Corporation since January 1, 2009. He was formerly Senior Vice President / Loan Review and Audit Manager.
Norman J. Montgomery, age 51, has served as the Executive Vice President of Business Integration of First Commonwealth Bank since May 2011. He oversees First Commonwealth’s product development and assumed oversight of First Commonwealth’s technology and operations functions in July 2012. He served as Senior Vice President/Business Integration of First Commonwealth Bank from September 2007 until May 2011 and previously held positions in the technology, operations, audit and marketing areas.
T. Michael Price, age 56, has served as President and Chief Executive Officer of First Commonwealth Financial Corporation and Chief Executive Officer of First Commonwealth Bank since March 2012. Mr. Price served as President of First Commonwealth Bank from November 2007 to May 2013. From January 1, 2012 to March 7, 2012, he served as Interim President and Chief Executive Officer of First Commonwealth Financial Corporation. He was formerly Chief Executive Officer of the Cincinnati and Northern Kentucky Region of National City Bank from July 2004 to November 2007 and Executive Vice President and Head of Small Business Banking of National City Bank prior to July 2004.
James R. Reske, age 55, joined First Commonwealth Financial Corporation as Executive Vice President, Chief Financial Officer and Treasurer on April 28, 2014. Prior to joining First Commonwealth, Mr. Reske served as Executive Vice President, Chief Financial Officer, and Treasurer at United Community Financial Corporation in Youngstown, Ohio from 2008 until April 2014. Mr. Reske's financial services career includes investment banking roles within the Financial Institutions Groups at Keybanc Capital Markets, Inc. in Cleveland, Ohio and at Morgan Stanley & Company in New York. Mr. Reske also provided expertise and counsel to financial institutions and other organizations on mergers and acquisitions and capital markets activities as an attorney at Wachtell, Lipton, Rosen & Katz, as well as at Sullivan & Cromwell. Earlier in his career, Mr. Reske worked at the Board of Governors of the Federal Reserve System in Washington, DC and at the Federal Reserve Bank of Boston.
Carrie L. Riggle, age 49, has served as Executive Vice President / Human Resources since March 1, 2013. Ms. Riggle has been with First Commonwealth for more than 20 years. Over the course of her tenure, Ms. Riggle has been responsible for the daily operations of the Human Resources function and was actively involved in the establishment and development of a centralized corporate human resources function within the Company.
Matthew C. Tomb, age 42, has served as Executive Vice President, Chief Risk Officer and General Counsel of First Commonwealth Financial Corporation since November 2010. He previously served as Senior Vice President / Legal and Compliance since September 2007. Before joining First Commonwealth, Mr. Tomb practiced law with Sherman & Howard L.L.C. in Denver, Colorado.
21
PART II
ITEM 5.
Market for Registrant’s Common Equity, Related Stockholder Matters and Issuer Purchase of Equity Securities
First Commonwealth is listed on the NYSE under the symbol “FCF.” As of
December 31, 2018
, there were approximately
6,014
holders of record of First Commonwealth’s common stock. The table below sets forth the high and low sales prices per share and cash dividends declared per share for common stock of First Commonwealth for each quarter during the last two fiscal years.
|
Period
|
High Sale
|
Low Sale
|
Cash Dividends
Per Share |
||||||||
|
2018
|
|||||||||||
|
First Quarter
|
$
|
15.14
|
|
$
|
13.59
|
|
$
|
0.08
|
|
||
|
Second Quarter
|
16.30
|
|
13.88
|
|
0.09
|
|
|||||
|
Third Quarter
|
17.72
|
|
15.66
|
|
0.09
|
|
|||||
|
Fourth Quarter
|
16.21
|
|
11.43
|
|
0.09
|
|
|||||
|
Period
|
High Sale
|
Low Sale
|
Cash Dividends
Per Share |
||||||||
|
2017
|
|||||||||||
|
First Quarter
|
$
|
14.59
|
|
$
|
12.81
|
|
$
|
0.08
|
|
||
|
Second Quarter
|
13.46
|
|
12.28
|
|
0.08
|
|
|||||
|
Third Quarter
|
14.13
|
|
12.14
|
|
0.08
|
|
|||||
|
Fourth Quarter
|
15.32
|
|
13.78
|
|
0.08
|
|
|||||
Federal and state regulations contain restrictions on the ability of First Commonwealth to pay dividends. For information regarding restrictions on dividends, see Part I, Item 1 “Business—Supervision and Regulation—Restrictions on Dividends” and Part II, Item 8, “Financial Statements and Supplementary Data—Note 26, Regulatory Restrictions and Capital Adequacy.” In addition, under the terms of the capital securities issued by First Commonwealth Capital Trust II and III, First Commonwealth could not pay dividends on its common stock if First Commonwealth deferred payments on the junior subordinated debt securities that provide the cash flow for the payments on the capital securities.
22
The following five-year performance graph compares the cumulative total shareholder return (assuming reinvestment of dividends) on First Commonwealth’s common stock to the SNL U.S. Bank Index and the Russell 2000 Index. The stock performance graph assumes $100 was invested on
December 31, 2013
, and the cumulative return is measured as of each subsequent fiscal year end.
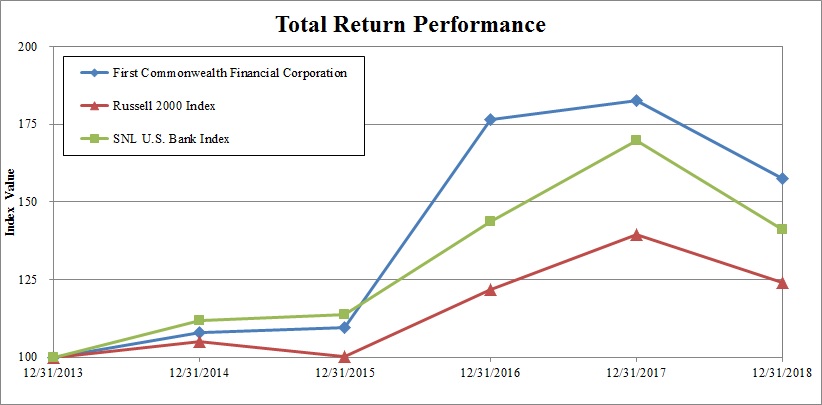
|
|
Period Ending
|
||||||||||||||||
|
Index
|
12/31/2013
|
12/31/2014
|
12/31/2015
|
12/31/2016
|
12/31/2017
|
12/31/2018
|
|||||||||||
|
First Commonwealth Financial Corporation
|
100.00
|
|
107.99
|
|
109.53
|
|
176.54
|
|
182.55
|
|
157.66
|
|
|||||
|
Russell 2000
|
100.00
|
|
104.89
|
|
100.26
|
|
121.63
|
|
139.44
|
|
124.09
|
|
|||||
|
SNL U.S. Bank Index
|
100.00
|
|
111.79
|
|
113.69
|
|
143.65
|
|
169.64
|
|
140.98
|
|
|||||
Unregistered Sales of Equity Securities and Use of Proceeds
The following table details the amount of shares repurchased during the fourth quarter of
2018
.
|
Month Ending:
|
Total Number of
Shares Purchased |
Average Price
Paid per Share (or Unit) |
Total Number of
Shares Purchased as Part of Publicly Announced Plans or Programs |
Maximum Number
of Shares that May Yet Be Purchased Under the Plans or Programs (1) |
||||||||
|
October 31, 2018
|
574,500
|
|
$
|
13.37
|
|
574,500
|
|
1,282,859
|
|
|||
|
November 30, 2018
|
1,268,873
|
|
13.68
|
|
1,268,873
|
|
—
|
|
||||
|
December 31, 2018
|
—
|
|
—
|
|
—
|
|
—
|
|
||||
|
Total
|
1,843,373
|
|
$
|
13.58
|
|
1,843,373
|
|
|||||
|
(1) Remaining number of shares approved under the Plan is based on the market value of the Company's commons stock of $13.50 as of October 31, 2018.
|
||||||||||||
For additional information, please see Part III, Item 12, "Security ownership of Certain Beneficial Owners." Information called for by this item concerning security ownership of certain beneficial owners and security ownership of management will be included in the Proxy Statement under the headings “Security Ownership of Certain Beneficial Owners” and “Securities Owned by Directors and Management,” and is incorporated herein by reference.
23
ITEM 6.
Selected Financial Data
The following selected financial data is not covered by the auditor’s report and should be read in conjunction with Management’s Discussion and Analysis of Financial Condition and Results of Operations, which follows, and with the Consolidated Financial Statements and related notes.
|
|
Periods Ended December 31,
|
||||||||||||||||||
|
|
2018
|
2017
|
2016
|
2015
|
2014
|
||||||||||||||
|
|
(dollars in thousands, except share data)
|
||||||||||||||||||
|
Interest income
|
$
|
292,257
|
|
$
|
250,550
|
|
$
|
217,614
|
|
$
|
204,071
|
|
$
|
202,181
|
|
||||
|
Interest expense
|
40,035
|
|
21,770
|
|
18,579
|
|
15,595
|
|
18,501
|
|
|||||||||
|
Net interest income
|
252,222
|
|
228,780
|
|
199,035
|
|
188,476
|
|
183,680
|
|
|||||||||
|
Provision for credit losses
|
12,531
|
|
5,087
|
|
18,480
|
|
14,948
|
|
11,196
|
|
|||||||||
|
Net interest income after provision for credit losses
|
239,691
|
|
223,693
|
|
180,555
|
|
173,528
|
|
172,484
|
|
|||||||||
|
Net securities gains (losses)
|
8,102
|
|
5,040
|
|
617
|
|
(153
|
)
|
550
|
|
|||||||||
|
Other income
|
80,535
|
|
75,291
|
|
63,982
|
|
61,478
|
|
60,309
|
|
|||||||||
|
Other expenses
|
195,556
|
|
200,298
|
|
159,925
|
|
163,874
|
|
171,210
|
|
|||||||||
|
Income before income taxes
|
132,772
|
|
103,726
|
|
85,229
|
|
70,979
|
|
62,133
|
|
|||||||||
|
Income tax provision
|
25,274
|
|
48,561
|
|
25,639
|
|
20,836
|
|
17,680
|
|
|||||||||
|
Net Income
|
$
|
107,498
|
|
$
|
55,165
|
|
$
|
59,590
|
|
$
|
50,143
|
|
$
|
44,453
|
|
||||
|
Per Share Data—Basic
|
|||||||||||||||||||
|
Net Income
|
$
|
1.09
|
|
$
|
0.58
|
|
$
|
0.67
|
|
$
|
0.56
|
|
$
|
0.48
|
|
||||
|
Dividends declared
|
$
|
0.35
|
|
$
|
0.32
|
|
$
|
0.28
|
|
$
|
0.28
|
|
$
|
0.28
|
|
||||
|
Average shares outstanding
|
99,036,163
|
|
95,220,056
|
|
88,851,573
|
|
89,356,767
|
|
93,114,654
|
|
|||||||||
|
Per Share Data—Diluted
|
|||||||||||||||||||
|
Net Income
|
$
|
1.08
|
|
$
|
0.58
|
|
$
|
0.67
|
|
$
|
0.56
|
|
$
|
0.48
|
|
||||
|
Average shares outstanding
|
99,223,513
|
|
95,331,037
|
|
88,851,573
|
|
89,356,767
|
|
93,114,654
|
|
|||||||||
|
At End of Period
|
|||||||||||||||||||
|
Total assets
|
$
|
7,828,255
|
|
$
|
7,308,539
|
|
$
|
6,684,018
|
|
$
|
6,566,890
|
|
$
|
6,360,285
|
|
||||
|
Investment securities
|
1,335,228
|
|
1,183,291
|
|
1,187,623
|
|
1,333,836
|
|
1,354,364
|
|
|||||||||
|
Loans and leases, net of unearned income
|
5,774,139
|
|
5,407,376
|
|
4,879,347
|
|
4,683,750
|
|
4,457,308
|
|
|||||||||
|
Allowance for credit losses
|
47,764
|
|
48,298
|
|
50,185
|
|
50,812
|
|
52,051
|
|
|||||||||
|
Deposits
|
5,897,992
|
|
5,580,705
|
|
4,947,408
|
|
4,195,894
|
|
4,315,511
|
|
|||||||||
|
Short-term borrowings
|
721,823
|
|
707,466
|
|
867,943
|
|
1,510,825
|
|
1,105,876
|
|
|||||||||
|
Subordinated debentures
|
170,288
|
|
72,167
|
|
72,167
|
|
72,167
|
|
72,167
|
|
|||||||||
|
Other long-term debt
|
7,551
|
|
8,161
|
|
8,749
|
|
9,314
|
|
89,459
|
|
|||||||||
|
Shareholders’ equity
|
975,389
|
|
888,127
|
|
749,929
|
|
719,546
|
|
716,145
|
|
|||||||||
|
Key Ratios
|
|||||||||||||||||||
|
Return on average assets
|
1.42
|
%
|
0.77
|
%
|
0.89
|
%
|
0.78
|
%
|
0.71
|
%
|
|||||||||
|
Return on average equity
|
11.41
|
|
6.45
|
|
8.02
|
|
6.98
|
|
6.18
|
|
|||||||||
|
Net loans to deposits ratio
|
97.09
|
|
96.03
|
|
97.61
|
|
110.42
|
|
102.08
|
|
|||||||||
|
Dividends per share as a percent of net income per share
|
32.11
|
|
55.17
|
|
41.79
|
|
50.00
|
|
58.33
|
|
|||||||||
|
Average equity to average assets ratio
|
12.47
|
|
11.86
|
|
11.15
|
|
11.23
|
|
11.45
|
|
|||||||||
24
ITEM 7.
Management’s Discussion and Analysis of Financial Condition and Results of Operations
The following discussion and analysis represents an overview of the financial condition and the results of operations of First Commonwealth and its subsidiaries, FCB, First Commonwealth Insurance Agency, Inc. (“FCIA”), FRAMAL and First Commonwealth Financial Advisors, Inc. (“FCFA”), as of and for the years ended
December 31, 2018
,
2017
and
2016
. The purpose of this discussion is to focus on information concerning our financial condition and results of operations that is not readily apparent from the Consolidated Financial Statements. In order to obtain a more thorough understanding of this discussion, you should refer to the Consolidated Financial Statements, the notes thereto and other financial information presented in this Annual Report.
Company Overview
First Commonwealth provides a diversified array of consumer and commercial banking services through our bank subsidiary, FCB. We also provide trust and wealth management services through FCB and insurance products through FCIA. At
December 31, 2018
, FCB operated
137
community banking offices throughout western Pennsylvania and northeastern, central and southwestern Ohio, as well as loan production offices in Pittsburgh, Pennsylvania, and Cleveland, Columbus, Dublin and Hudson, Ohio.
Our consumer services include Internet, mobile and telephone banking, an automated teller machine network, personal checking accounts, interest-earning checking accounts, savings accounts, health savings accounts, insured money market accounts, debit cards, investment certificates, fixed and variable rate certificates of deposit, mortgage loans, secured and unsecured installment loans, construction and real estate loans, safe deposit facilities, credit cards, credit lines with overdraft checking protection and IRA accounts. Commercial banking services include commercial lending, small and high-volume business checking accounts, on-line account management services, ACH origination, payroll direct deposit, commercial cash management services and repurchase agreements. We also provide a variety of trust and asset management services and a full complement of auto, home and business insurance as well as term life insurance. We offer annuities, mutual funds and stock and bond brokerage services through an arrangement with a broker-dealer and insurance brokers. Most of our commercial customers are small and mid-sized businesses in Pennsylvania and Ohio.
As a financial institution with a focus on traditional banking activities, we earn the majority of our revenue through net interest income, which is the difference between interest earned on loans and investments and interest paid on deposits and borrowings. Growth in net interest income is dependent upon balance sheet growth and maintaining or increasing our net interest margin, which is net interest income (on a fully taxable-equivalent basis) as a percentage of our average interest-earning assets. We also generate revenue through fees earned on various services and products that we offer to our customers and, less frequently, through sales of assets, such as loans, investments or properties. These revenue sources are offset by provisions for credit losses on loans, operating expenses, income taxes and, less frequently, loss on sale or other-than-temporary impairments on investment securities.
General economic conditions also affect our business by impacting our customers’ need for financing, thus affecting loan growth, as well as impacting the credit strength of existing and potential borrowers.
Critical Accounting Policies and Significant Accounting Estimates
First Commonwealth’s accounting and reporting policies conform to accounting principles generally accepted in the United States of America (“GAAP”) and predominant practice in the banking industry. The preparation of financial statements in accordance with GAAP requires management to make estimates, assumptions and judgments that affect the amounts reported in the financial statements and accompanying notes. Over time, these estimates, assumptions and judgments may prove to be inaccurate or vary from actual results and may significantly affect our reported results and financial position for the period presented or in future periods. We currently view the determination of the allowance for credit losses and income taxes to be critical because they are highly dependent on subjective or complex judgments, assumptions and estimates made by management.
Allowance for Credit Losses
We account for the credit risk associated with our lending activities through the allowance and provision for credit losses. The allowance represents management’s best estimate of probable losses that have been incurred in our existing loan portfolio as of the balance sheet date. The provision is a periodic charge to earnings in an amount necessary to maintain the allowance at a level that is appropriate based on management’s assessment of probable estimated losses. Management determines and reviews
25
with the Board of Directors the adequacy of the allowance on a quarterly basis in accordance with the methodology described below.
|
•
|
Individual loans are selected for review in accordance with Financial Accounting Standards Board (“FASB”) Accounting Standards Codification (“ASC”) Topic 310, “Receivables.” These are generally large balance commercial loans and commercial mortgages that are rated less than “satisfactory” based on our internal credit-rating process.
|
|
•
|
We assess whether the loans identified for review in step one are “impaired,” which means that it is probable that all amounts will not be collected according to the contractual terms of the loan agreement, which generally represents loans that management has placed on nonaccrual status.
|
|
•
|
For impaired loans we calculate the estimated fair value of the loans that are selected for review based on observable market prices, discounted cash flows or the value of the underlying collateral and record an allowance if needed.
|
|
•
|
We then select pools of homogeneous smaller balance loans, having similar risk characteristics, as well as unimpaired larger commercial loans, that have similar risk characteristics, for evaluation collectively under the provisions of FASB ASC Topic 450, “Contingencies.” These smaller balance loans generally include residential mortgages, consumer loans, installment loans and some commercial loans.
|
|
•
|
FASB ASC Topic 450 loans are segmented into groups with similar characteristics and an allowance for credit losses is allocated to each segment based on recent loss history and other relevant information.
|
|
•
|
We then review the results to determine the appropriate balance of the allowance for credit losses. This review includes consideration of additional factors, such as the mix of loans in the portfolio, the balance of the allowance relative to total loans and nonperforming assets, trends in the overall risk profile in the portfolio, trends in delinquencies and nonaccrual loans, and local and national economic information and industry data, including trends in the industries we believe are higher risk.
|
There are many factors affecting the allowance for credit losses; some are quantitative, while others require qualitative judgment. These factors require the use of estimates related to the amount and timing of expected future cash flows, appraised values on impaired loans, estimated losses for each loan category based on historical loss experience by category, loss emergence periods for each loan category and consideration of current economic trends and conditions, all of which may be susceptible to significant judgment and change. To the extent that actual outcomes differ from estimates, additional provisions for credit losses could be required that could adversely affect our earnings or financial position in future periods. The loan portfolio represents the largest asset category on our Consolidated Statements of Financial Condition.
Income Taxes
We estimate income tax expense based on amounts expected to be owed to the tax jurisdictions where we conduct business. On a quarterly basis, management assesses the reasonableness of its effective tax rate based upon its current estimate of the amount and components of net income, tax credits and the applicable statutory tax rates expected for the full year.
Deferred income tax assets and liabilities are determined using the asset and liability method and are reported in the Consolidated Statements of Financial Condition. Under this method, deferred tax assets and liabilities are recognized for the future tax consequences attributable to differences between the financial statement carrying amounts of existing assets and liabilities and their respective tax bases. If current available information raises doubt as to the realization of the deferred tax assets, a valuation allowance is established. Deferred tax assets and liabilities are measured using enacted tax rates expected to be applied to taxable income in the years in which those temporary differences are expected to be recovered or settled. Management assesses all available positive and negative evidence on a quarterly basis to estimate if sufficient future taxable income will be generated to utilize the existing deferred tax assets. The amount of future taxable income used in management’s valuation is based upon management approved forecasts, evaluation of historical earnings levels, proven ability to raise capital to support growth or during times of economic stress and consideration of prudent and feasible potential tax strategies. If future events differ from our current forecasts, a valuation allowance may be required, which could have a material impact on our financial condition and results of operations.
Accrued taxes represent the net estimated amount due to taxing jurisdictions and are reported in other liabilities in the Consolidated Statements of Financial Condition. Management evaluates and assesses the relative risks and appropriate tax treatment of transactions and filing positions after considering statutes, regulations, judicial precedent and other information and maintains tax accruals consistent with its evaluation of these relative risks and merits. Changes to the estimate of accrued taxes occur periodically due to changes in tax rates, interpretations of tax laws, the status of examinations being conducted by taxing authorities and changes to statutory, judicial and regulatory guidance. These changes, when they occur, can affect deferred taxes and accrued taxes, as well as the current period’s income tax expense and can be significant to our operating results.
26
Results of Operations—
2018
Compared to
2017
Net Income
Net income for
2018
was
$107.5 million
, or
$1.08
per diluted share, as compared to net income of
$55.2 million
, or
$0.58
per diluted share, in
2017
. Impacting net income in 2018 was an increase in net interest income of
$23.4 million
, growth in noninterest income of
$8.3 million
and a decline in noninterest expense of
$4.7 million
primarily due to a decrease in merger related expenses.
Also contributing to the increase in 2018 net income was a decline in the statutory Federal tax rate from 35% to 21%. Results in 2017 were negatively impacted by a $16.7 million non-cash charge related to the revaluation of deferred tax assets recorded in connection with the passage of the Tax Cuts and Jobs Act.
Our return on average equity was
11.4%
and our return on average assets was
1.42%
for
2018
, compared to
6.5%
and
0.77%
, respectively, for
2017
. The previously mentioned charge related to the revaluation of deferred tax assets negatively impacted 2017 return on average equity and return on average assets by 195 and 23 basis points, respectively.
Average diluted shares for the year
2018
were
4%
more than the comparable period in
2017
primarily due to the issuance of
2.7 million
shares of common stock as a result of the acquisition of Garfield Acquisition Corporation.
Net Interest Income
Net interest income, which is our primary source of revenue, is the difference between interest income from earning assets (loans and securities) and interest expense paid on liabilities (deposits, short-term borrowings and long-term debt). The amount of net interest income is affected by both changes in the level of interest rates and the amount and composition of interest-earning assets and interest-bearing liabilities. The net interest margin is expressed as the percentage of net interest income, on a fully taxable equivalent basis, to average interest-earning assets. To compare the tax exempt asset yields to taxable yields, amounts are adjusted to the pretax equivalent amounts based on the marginal corporate federal income tax rate of 21% in 2018 and 35% in 2017. The taxable equivalent adjustment to net interest income for
2018
was
$2.0 million
compared to
$4.2 million
in
2017
. Net interest income comprises a majority of our operating revenue (net interest income before provision expense plus noninterest income) at
74%
for the years ended
December 31, 2018
and
2017
.
Net interest income, on a fully taxable equivalent basis, was
$254.2 million
for the year-ended
December 31, 2018
, a
$21.2 million
, or
9%
,
increase
compared to
$233.0 million
for the same period in
2017
. The net interest margin, on a fully taxable equivalent basis, increased
14 basis points
to
3.71%
in
2018
from
3.57%
in
2017
. The net interest margin is affected by both changes in the level of interest rates and the amount and composition of interest-earning assets and interest-bearing liabilities, as well as two basis points attributable to the recognition of previously unrecognized interest income on assets that had previously been impaired.
Growth in both the level of interest-earning assets and the rates earned on those assets contributed to the increase in the net interest margin for the year ended
December 31, 2018
. Average earning assets for the year ended
December 31, 2018
increased
$318.9 million
, or
5%
, compared to the year ended December 31,
2017
. Interest-sensitive assets totaling
$3.6 billion
will either reprice or mature over the next twelve months.
The taxable equivalent yield on interest-earning assets was
4.30%
for the year ended
December 31, 2018
, an increase of
40
basis points from the
3.90%
yield for the same period in
2017
. This increase is largely due to the loan portfolio yield, which improved by
44 basis points
when compared to the prior year. Contributing to this increase was the yield on our adjustable and variable rate commercial loan portfolios, which increased 74 basis points largely due to the Federal Reserve increasing short term interest rates 100 basis points in 2018. In addition, the yield on the investment portfolio increased
15 basis points
in comparison to the prior year. This increase can be attributed to the runoff of lower yielding securities being replaced with higher yielding investment securities. Additionally, two basis points of the increase in the yield on interest-earning assets can be attributed to the recognition of $1.5 million in previously unrecognized interest due to the sale of one previously impaired commercial loan and our pooled trust preferred security portfolio. Investment portfolio purchases during the year ended
December 31, 2018
have been primarily in mortgage-related assets with approximate durations of 30-64 months and corporate securities with durations of approximately five years. The mortgage-related investments have monthly principal payments that will provide for reinvestment opportunities at higher rates if interest rates rise.
Increases in the cost of interest-bearing liabilities partially offset the positive impact of higher yields on interest-earning assets. The cost of interest-bearing liabilities was
0.78%
for the year-ended
December 31, 2018
, compared to
0.44%
for the same period in
2017
. This increase is primarily due to a
25 basis point
increase in the cost of interest-bearing demand deposits, a
73
27
basis point
increase in the cost of short-term borrowings and a
101 basis point
increase in the cost of long-term debt. Contributing to the increase in long term debt was the issuance of $100 million of subordinated debt in the second quarter of 2018. Deposits acquired in our recent acquisitions, along with approximately $50 million of the subordinated debt proceeds and organic growth in consumer checking and savings deposits, contributed to a decline in average short-term borrowings of
$248.4 million
for the year-ended
December 31, 2018
compared to the same period in
2017
. Higher market interest rates resulted in the cost of interest-bearing deposits increasing 26 basis points and short-term borrowings increasing
73 basis points
in comparison to the same period in the prior year. The impact of the subordinated debt on the cost of interest bearing liabilities was three basis points for the year ended December 31, 2018.
Comparing the year ended
December 31, 2018
with the same period in
2017
, changes in rates positively impacted net interest income by
$9.4 million
. The higher yield on interest-earning assets favorably impacted net interest income by
$26.2 million
, while the increase in the cost of interest-bearing liabilities negatively impacted net interest income by $16.8 million.
Changes in the volume of interest-earning assets and interest-bearing liabilities positively increased net interest income by
$11.8 million
in the year ended
December 31, 2018
compared to the same period in
2017
. Higher levels of interest-earning assets resulted in an increase of
$13.3 million
in interest income, and changes in the volume of interest-bearing liabilities increased interest expense by
$1.4 million
, primarily due to an increase in long term borrowings and time deposits. Average earning assets for the year ended December 31, 2018 increased $318.9 million, or 4.9%, compared to the same period in 2017. Average loans for the comparable period increased $304.1 million, or 5.8%.
Positively affecting net interest income was a
$143.2 million
increase in average net free funds at
December 31, 2018
as compared to
December 31, 2017
. Average net free funds are the excess of noninterest-bearing demand deposits, other noninterest-bearing liabilities and shareholders’ equity over noninterest-earning assets. The largest component of the increase in net free funds was a
$78.1 million
increase in average noninterest-bearing demand deposits. Average time deposits for the year ended
December 31, 2018
increased
$171.3 million
, or
30%
, compared to the comparable period in
2017
, while the average rate paid on time deposits increased
48
basis points. Over the next twelve months
$509.2 million
in certificates of deposits either mature or reprice.
The following table reconciles interest income in the Consolidated Statements of Income to net interest income adjusted to a fully taxable equivalent basis for the periods presented:
|
|
For the Years Ended December 31,
|
||||||||||
|
|
2018
|
2017
|
2016
|
||||||||
|
|
(dollars in thousands)
|
||||||||||
|
Interest income per Consolidated Statements of Income
|
$
|
292,257
|
|
$
|
250,550
|
|
$
|
217,614
|
|
||
|
Adjustment to fully taxable equivalent basis
|
1,974
|
|
4,225
|
|
3,846
|
|
|||||
|
Interest income adjusted to fully taxable equivalent basis (non-GAAP)
|
294,231
|
|
254,775
|
|
221,460
|
|
|||||
|
Interest expense
|
40,035
|
|
21,770
|
|
18,579
|
|
|||||
|
Net interest income adjusted to fully taxable equivalent basis (non-GAAP)
|
$
|
254,196
|
|
$
|
233,005
|
|
$
|
202,881
|
|
||
28
The following table provides information regarding the average balances and yields or rates on interest-earning assets and interest-bearing liabilities for the periods ended December 31:
|
|
Average Balance Sheets and Net Interest Analysis
|
|||||||||||||||||||||||||||||||
|
|
2018
|
2017
|
2016
|
|||||||||||||||||||||||||||||
|
|
Average
Balance |
Income /
Expense (a) |
Yield or
Rate |
Average
Balance |
Income /
Expense (a) |
Yield or
Rate |
Average
Balance |
Income /
Expense (a) |
Yield or
Rate |
|||||||||||||||||||||||
|
|
(dollars in thousands)
|
|||||||||||||||||||||||||||||||
|
Assets
|
||||||||||||||||||||||||||||||||
|
Interest-earning assets:
|
||||||||||||||||||||||||||||||||
|
Interest-bearing deposits with banks
|
$
|
5,594
|
|
$
|
172
|
|
3.07
|
%
|
$
|
11,621
|
|
$
|
121
|
|
1.04
|
%
|
$
|
5,799
|
|
$
|
27
|
|
0.46
|
%
|
||||||||
|
Tax-free investment securities
|
67,746
|
|
2,084
|
|
3.08
|
|
67,407
|
|
2,495
|
|
3.70
|
|
62,632
|
|
2,305
|
|
3.68
|
|
||||||||||||||
|
Taxable investment securities
|
1,194,131
|
|
33,123
|
|
2.77
|
|
1,173,711
|
|
30,277
|
|
2.58
|
|
1,221,961
|
|
30,745
|
|
2.52
|
|
||||||||||||||
|
Loans, net of unearned
income (b)(c)(e) |
5,582,651
|
|
258,852
|
|
4.64
|
|
5,278,511
|
|
221,882
|
|
4.20
|
|
4,818,759
|
|
188,383
|
|
3.91
|
|
||||||||||||||
|
Total interest-earning assets
|
6,850,122
|
|
294,231
|
|
4.30
|
|
6,531,250
|
|
254,775
|
|
3.90
|
|
6,109,151
|
|
221,460
|
|
3.63
|
|
||||||||||||||
|
Noninterest-earning assets:
|
||||||||||||||||||||||||||||||||
|
Cash
|
92,729
|
|
90,614
|
|
70,408
|
|
||||||||||||||||||||||||||
|
Allowance for credit losses
|
(52,609
|
)
|
(51,187
|
)
|
(57,253
|
)
|
||||||||||||||||||||||||||
|
Other assets
|
665,114
|
|
639,785
|
|
538,310
|
|
||||||||||||||||||||||||||
|
Total noninterest-earning assets
|
705,234
|
|
679,212
|
|
551,465
|
|
||||||||||||||||||||||||||
|
Total Assets
|
$
|
7,555,356
|
|
$
|
7,210,462
|
|
$
|
6,660,616
|
|
|||||||||||||||||||||||
|
Liabilities and Shareholders’ Equity
|
||||||||||||||||||||||||||||||||
|
Interest-bearing liabilities:
|
||||||||||||||||||||||||||||||||
|
Interest-bearing demand
deposits (d) |
$
|
1,179,439
|
|
$
|
4,615
|
|
0.39
|
%
|
$
|
1,059,840
|
|
$
|
1,466
|
|
0.14
|
%
|
$
|
748,869
|
|
$
|
480
|
|
0.06
|
%
|
||||||||
|
Savings deposits (d)
|
2,441,327
|
|
8,624
|
|
0.35
|
|
2,369,605
|
|
4,207
|
|
0.18
|
|
1,910,333
|
|
3,370
|
|
0.18
|
|
||||||||||||||
|
Time deposits
|
749,408
|
|
8,474
|
|
1.13
|
|
578,158
|
|
3,742
|
|
0.65
|
|
584,429
|
|
3,673
|
|
0.63
|
|
||||||||||||||
|
Short-term borrowings
|
618,957
|
|
10,741
|
|
1.74
|
|
867,391
|
|
8,799
|
|
1.01
|
|
1,387,737
|
|
8,076
|
|
0.58
|
|
||||||||||||||
|
Long-term debt
|
147,915
|
|
7,581
|
|
5.13
|
|
86,391
|
|
3,556
|
|
4.12
|
|
81,197
|
|
2,980
|
|
3.67
|
|
||||||||||||||
|
Total interest-bearing liabilities
|
5,137,046
|
|
40,035
|
|
0.78
|
|
4,961,385
|
|
21,770
|
|
0.44
|
|
4,712,565
|
|
18,579
|
|
0.39
|
|
||||||||||||||
|
Noninterest-bearing liabilities and shareholders’ equity:
|
||||||||||||||||||||||||||||||||
|
Noninterest-bearing demand
deposits (d) |
1,434,233
|
|
1,356,125
|
|
1,146,189
|
|
||||||||||||||||||||||||||
|
Other liabilities
|
41,740
|
|
37,818
|
|
58,918
|
|
||||||||||||||||||||||||||
|
Shareholders’ equity
|
942,337
|
|
855,134
|
|
742,944
|
|
||||||||||||||||||||||||||
|
Total noninterest-bearing funding sources
|
2,418,310
|
|
2,249,077
|
|
1,948,051
|
|
||||||||||||||||||||||||||
|
Total Liabilities and Shareholders’ Equity
|
$
|
7,555,356
|
|
$
|
7,210,462
|
|
$
|
6,660,616
|
|
|||||||||||||||||||||||
|
Net Interest Income and Net Yield on Interest-Earning Assets
|
$
|
254,196
|
|
3.71
|
%
|
$
|
233,005
|
|
3.57
|
%
|
$
|
202,881
|
|
3.32
|
%
|
|||||||||||||||||
|
(a)
|
Income on interest-earning assets has been computed on a fully taxable equivalent basis using the federal income tax statutory rate of 21% for 2018 and 35% for 2017 and 2016.
|
|
(b)
|
Income on nonaccrual loans is accounted for on the cash basis, and the loan balances are included in interest-earning assets.
|
|
(c)
|
Loan income includes loan fees.
|
|
(d)
|
Average balances do not include reallocations from noninterest-bearing demand deposits and interest-bearing demand deposits into savings deposits which were made for regulatory purposes.
|
|
(e)
|
Includes held for sale loans.
|
29
The following table sets forth certain information regarding changes in net interest income attributable to changes in the volume of interest-earning assets and interest-bearing liabilities and changes in the rates for the periods indicated:
|
|
Analysis of Year-to-Year Changes in Net Interest Income
|
||||||||||||||||||||||
|
|
2018 Change from 2017
|
2017 Change from 2016
|
|||||||||||||||||||||
|
|
Total
Change |
Change Due
To Volume |
Change Due
To Rate (a) |
Total
Change |
Change Due
To Volume |
Change Due
To Rate (a) |
|||||||||||||||||
|
|
(dollars in thousands)
|
||||||||||||||||||||||
|
Interest-earning assets:
|
|||||||||||||||||||||||
|
Interest-bearing deposits with banks
|
$
|
51
|
|
$
|
(63
|
)
|
$
|
114
|
|
$
|
94
|
|
$
|
27
|
|
$
|
67
|
|
|||||
|
Tax-free investment securities
|
(411
|
)
|
13
|
|
(424
|
)
|
190
|
|
176
|
|
14
|
|
|||||||||||
|
Taxable investment securities
|
2,846
|
|
527
|
|
2,319
|
|
(468
|
)
|
(1,216
|
)
|
748
|
|
|||||||||||
|
Loans
|
36,970
|
|
12,774
|
|
24,196
|
|
33,499
|
|
17,976
|
|
15,523
|
|
|||||||||||
|
Total interest income (b)
|
39,456
|
|
13,251
|
|
26,205
|
|
33,315
|
|
16,963
|
|
16,352
|
|
|||||||||||
|
Interest-bearing liabilities:
|
|||||||||||||||||||||||
|
Interest-bearing demand deposits
|
3,149
|
|
167
|
|
2,982
|
|
986
|
|
187
|
|
799
|
|
|||||||||||
|
Savings deposits
|
4,417
|
|
129
|
|
4,288
|
|
837
|
|
827
|
|
10
|
|
|||||||||||
|
Time deposits
|
4,732
|
|
1,113
|
|
3,619
|
|
69
|
|
(40
|
)
|
109
|
|
|||||||||||
|
Short-term borrowings
|
1,942
|
|
(2,509
|
)
|
4,451
|
|
723
|
|
(3,018
|
)
|
3,741
|
|
|||||||||||
|
Long-term debt
|
4,025
|
|
2,535
|
|
1,490
|
|
576
|
|
191
|
|
385
|
|
|||||||||||
|
Total interest expense
|
18,265
|
|
1,435
|
|
16,830
|
|
3,191
|
|
(1,853
|
)
|
5,044
|
|
|||||||||||
|
Net interest income
|
$
|
21,191
|
|
$
|
11,816
|
|
$
|
9,375
|
|
$
|
30,124
|
|
$
|
18,816
|
|
$
|
11,308
|
|
|||||
|
(a)
|
Changes in interest income or expense not arising solely as a result of volume or rate variances are allocated to rate variances.
|
|
(b)
|
Changes in interest income have been computed on a fully taxable equivalent basis using the 21% federal income tax statutory rate for 2018, 35% federal income tax statutory rate for prior years.
|
Provision for Credit Losses
The provision for credit losses is determined based on management’s estimates of the appropriate level of the allowance for credit losses needed to absorb probable losses incurred in the loan portfolio, after giving consideration to charge-offs and recoveries for the period. The provision for credit losses is an amount added to the allowance against which credit losses are charged.
The table below provides a breakout of the provision for credit losses by loan category for the years ended December 31:
|
|
2018
|
2017
|
|||||||||||
|
|
Dollars
|
Percentage
|
Dollars
|
Percentage
|
|||||||||
|
|
(dollars in thousands)
|
||||||||||||
|
Commercial, financial, agricultural and other
|
$
|
451
|
|
4
|
%
|
$
|
(9,812
|
)
|
(193
|
)%
|
|||
|
Real estate construction
|
512
|
|
4
|
|
302
|
|
6
|
|
|||||
|
Residential real estate
|
2,162
|
|
17
|
|
1,164
|
|
23
|
|
|||||
|
Commercial real estate
|
4,806
|
|
38
|
|
10,800
|
|
212
|
|
|||||
|
Loans to individuals
|
4,600
|
|
37
|
|
2,633
|
|
52
|
|
|||||
|
Total
|
$
|
12,531
|
|
100
|
%
|
$
|
5,087
|
|
100
|
%
|
|||
The provision for credit losses for the year
2018
totaled
$12.5 million
, an increase of
$7.4 million
, or
146.3%
, compared to the year
2017
. The level of provision expense for the year-ended
December 31, 2018
is primarily a result of net charge-offs taken to resolve certain nonperforming loans. Provision expense for the commercial, financial, agricultural and other category was impacted by net charge-offs of
$4.5 million
, of which $3.3 million related to two commercial borrowers whose loans were sold or paid off during 2018. Also impacting provision expense for the commercial, financial, agricultural and other category is an increase in factors related to the migration analysis, a decrease in the historical loss factor and a decline in factors related to the loss emergence period. The provision expense for the residential real estate category can be attributed to $107.5 million of growth in the portfolio compared to December 31, 2017 and $1.0 million in net charge-offs. The provision expense for the commercial real estate category is primarily due to $3.4 million in charge-offs recorded on three commercial loans which were
30
part of the same relationship and were sold or paid off during 2018. Net charge-offs related to loans to individuals were
$4.0 million
for the year ended
December 31, 2018
, including $2.2 million related to indirect auto loans and $1.1 million related to personal lines of credit.
The level of provision expense for the year-ended
December 31, 2017
is primarily a result of net charge-offs in loans to individuals and commercial, financial, agricultural and other loans, as well as an increase in specific reserves related to nonperforming loans of
$0.6 million
. Net charge-offs related to loans to individuals were $3.7 million for the year ended
December 31, 2017
, including $2.4 million related to indirect auto loans and $0.8 million related to personal lines of credit. Net charge-offs on commercial, financial, agricultural and other loans were $2.7 million for the same period. The level of provision expense in the commercial, financial, agricultural and other category, as well as in the commercial real estate category, was also impacted by the Company's periodic assessment of the allowance for loan methodology, the current lending environment, and associated risks for each portfolio, which resulted in changes to certain qualitative factors, such as collateral recovery rates and vacancy rates.
The allowance for credit losses was
$47.8 million
, or
0.83%
, of total loans outstanding and
0.91%
of total originated loans
at
December 31, 2018
, compared to
$48.3 million
, or
0.89%
, and 0.96%, respectively, at
December 31, 2017
. Nonperforming loans as a percentage of total loans decreased to
0.55%
at
December 31, 2018
from
0.78%
at
December 31, 2017
. The allowance to nonperforming loan ratio was
149.1%
as of
December 31, 2018
and
114.3%
at
December 31, 2017
. Net charge-offs were
$13.1 million
for the year-ended
December 31, 2018
compared to
$7.0 million
for the same period in
2017
.
The provision is a result of management’s assessment of credit quality statistics and other factors that would have an impact on probable losses in the loan portfolio and the methodology used for determination of the adequacy of the allowance for credit losses. The change in the allowance for credit losses is impacted by the estimated losses within the loan portfolio determined by factors including certain loss events, portfolio migration analysis, loss emergence periods, historical loss experience, delinquency trends, deterioration in collateral values and volatility in economic indicators such as growth in GDP, consumer price index, vacancy rates and unemployment levels. Management believes that the allowance for credit losses is at a level deemed sufficient to absorb losses inherent in the loan portfolio at
December 31, 2018
.
31
A detailed analysis of our credit loss experience for the previous five years is shown below:
|
2018
|
2017
|
2016
|
2015
|
2014
|
|||||||||||||||
|
|
(dollars in thousands)
|
||||||||||||||||||
|
Loans outstanding at end of year
|
$
|
5,774,139
|
|
$
|
5,407,376
|
|
$
|
4,879,347
|
|
$
|
4,683,750
|
|
$
|
4,457,308
|
|
||||
|
Average loans outstanding
|
$
|
5,582,651
|
|
$
|
5,278,511
|
|
$
|
4,818,759
|
|
$
|
4,553,634
|
|
$
|
4,356,566
|
|
||||
|
Balance, beginning of year
|
$
|
48,298
|
|
$
|
50,185
|
|
$
|
50,812
|
|
$
|
52,051
|
|
$
|
54,225
|
|
||||
|
Loans charged off:
|
|||||||||||||||||||
|
Commercial, financial, agricultural and other
|
5,294
|
|
6,634
|
|
19,603
|
|
11,429
|
|
8,911
|
|
|||||||||
|
Real estate construction
|
—
|
|
—
|
|
—
|
|
8
|
|
296
|
|
|||||||||
|
Residential real estate
|
1,313
|
|
1,287
|
|
1,189
|
|
1,539
|
|
3,153
|
|
|||||||||
|
Commercial real estate
|
3,930
|
|
340
|
|
570
|
|
1,538
|
|
1,148
|
|
|||||||||
|
Loans to individuals
|
4,576
|
|
4,248
|
|
4,943
|
|
4,354
|
|
3,964
|
|
|||||||||
|
Total loans charged off
|
15,113
|
|
12,509
|
|
26,305
|
|
18,868
|
|
17,472
|
|
|||||||||
|
Recoveries of loans previously charged off:
|
|||||||||||||||||||
|
Commercial, financial, agricultural and other
|
788
|
|
3,901
|
|
4,164
|
|
1,097
|
|
734
|
|
|||||||||
|
Real estate construction
|
141
|
|
470
|
|
562
|
|
84
|
|
1,340
|
|
|||||||||
|
Residential real estate
|
361
|
|
371
|
|
481
|
|
587
|
|
650
|
|
|||||||||
|
Commercial real estate
|
153
|
|
278
|
|
1,522
|
|
229
|
|
612
|
|
|||||||||
|
Loans to individuals
|
605
|
|
515
|
|
469
|
|
684
|
|
766
|
|
|||||||||
|
Total recoveries
|
2,048
|
|
5,535
|
|
7,198
|
|
2,681
|
|
4,102
|
|
|||||||||
|
Net charge-offs
|
13,065
|
|
6,974
|
|
19,107
|
|
16,187
|
|
13,370
|
|
|||||||||
|
Provision charged to expense
|
12,531
|
|
5,087
|
|
18,480
|
|
14,948
|
|
11,196
|
|
|||||||||
|
Balance, end of year
|
$
|
47,764
|
|
$
|
48,298
|
|
$
|
50,185
|
|
$
|
50,812
|
|
$
|
52,051
|
|
||||
|
Ratios:
|
|||||||||||||||||||
|
Net charge-offs as a percentage of average loans outstanding
|
0.23
|
%
|
0.13
|
%
|
0.40
|
%
|
0.36
|
%
|
0.31
|
%
|
|||||||||
|
Allowance for credit losses as a percentage of end-of-period loans outstanding
|
0.83
|
%
|
0.89
|
%
|
1.03
|
%
|
1.08
|
%
|
1.17
|
%
|
|||||||||
32
Noninterest Income
The components of noninterest income for each year in the three-year period ended December 31 are as follows:
|
|
|
|
|
2018 compared to 2017
|
||||||||||||||
|
|
2018
|
2017
|
2016
|
$ Change
|
% Change
|
|||||||||||||
|
|
(dollars in thousands)
|
|||||||||||||||||
|
Noninterest Income:
|
||||||||||||||||||
|
Trust income
|
$
|
7,901
|
|
$
|
7,098
|
|
$
|
5,366
|
|
$
|
803
|
|
11
|
%
|
||||
|
Service charges on deposit accounts
|
18,175
|
|
18,579
|
|
15,869
|
|
(404
|
)
|
(2
|
)
|
||||||||
|
Insurance and retail brokerage commissions
|
7,426
|
|
8,807
|
|
7,964
|
|
(1,381
|
)
|
(16
|
)
|
||||||||
|
Income from bank owned life insurance
|
6,686
|
|
5,699
|
|
5,381
|
|
987
|
|
17
|
|
||||||||
|
Card related interchange income
|
20,187
|
|
18,780
|
|
14,955
|
|
1,407
|
|
7
|
|
||||||||
|
Swap fee income
|
1,874
|
|
2,005
|
|
2,359
|
|
(131
|
)
|
(7
|
)
|
||||||||
|
Other income
|
6,790
|
|
7,677
|
|
6,372
|
|
(887
|
)
|
(12
|
)
|
||||||||
|
Subtotal
|
69,039
|
|
68,645
|
|
58,266
|
|
394
|
|
1
|
|
||||||||
|
Net securities gains
|
8,102
|
|
5,040
|
|
617
|
|
3,062
|
|
61
|
|
||||||||
|
Gain on sale of mortgage loans
|
5,436
|
|
5,366
|
|
4,086
|
|
70
|
|
1
|
|
||||||||
|
Gain on sale of loans and other assets
|
5,273
|
|
1,753
|
|
1,411
|
|
3,520
|
|
201
|
|
||||||||
|
Derivative mark to market
|
787
|
|
(473
|
)
|
219
|
|
1,260
|
|
(266
|
)
|
||||||||
|
Total noninterest income
|
$
|
88,637
|
|
$
|
80,331
|
|
$
|
64,599
|
|
$
|
8,306
|
|
10
|
%
|
||||
Noninterest income, excluding net securities gains, gain on sale of loans and other assets and the derivatives mark to market, increased
$0.4 million
, or
1%
, in
2018
. Card-related interchange income increased
$1.4 million
, due to growth in customer accounts and transactions, including $0.5 million which is attributable to the Garfield and DCB acquisitions. Income from bank owned life insurance increased $1.0 million, primarily due to $0.9 million death claim benefits recognized in the year ended December 31, 2018. Trust income increased
$0.8 million
, of which $0.2 million can be attributed to accounts obtained in the DCB acquisition. Insurance and retail brokerage commissions decreased
$1.4 million
as a result of $2.5 million in producer commission expense that is netted against revenue in 2018 but was included as salary expense in 2017. This change is a result of Topic 606, the new revenue recognition standard that was adopted January 1, 2018. Additionally, other income decreased $0.9 million, all of which is due to certain revenues being netted against expenses as a result of adoption of Topic 606.
Total noninterest income increased
$8.3 million
, or
10%
, in comparison to the year ended
December 31, 2017
. The most significant change, other than the changes noted above, includes a
$3.1 million
increase in net securities gains resulting from the redemption of two of our pooled trust preferred securities and the sale of the remaining pooled trust preferred portfolio, a $3.5 million increase in the gain on sale of loans and other assets primarily due to a $1.2 million gain recognized on the sale of a restructured commercial loan, and a
$1.3 million
increase in the mark to market adjustment on interest rate swaps entered into for our commercial loan customers. This adjustment does not reflect a realized gain on the swaps, but rather relates to a change in fair value due to movements in corporate bond spreads and swap rates.
If the Company's total assets would equal or exceed $10 billion we would no longer qualify for exemption from the interchange fee cap included in the Dodd-Frank Act. The estimated impact of this change would decrease interchange income by
$8.4 million
.
33
Noninterest Expense
The components of noninterest expense for each year in the three-year period ended December 31 are as follows:
|
|
|
|
|
2018 Compared to 2017
|
||||||||||||||
|
|
2018
|
2017
|
2016
|
$ Change
|
% Change
|
|||||||||||||
|
|
(dollars in thousands)
|
|||||||||||||||||
|
Noninterest Expense:
|
||||||||||||||||||
|
Salaries and employee benefits
|
$
|
105,115
|
|
$
|
103,714
|
|
$
|
87,125
|
|
$
|
1,401
|
|
1
|
%
|
||||
|
Net occupancy
|
17,219
|
|
15,648
|
|
13,150
|
|
1,571
|
|
10
|
|
||||||||
|
Furniture and equipment
|
14,247
|
|
13,508
|
|
11,624
|
|
739
|
|
5
|
|
||||||||
|
Data processing
|
10,470
|
|
9,090
|
|
7,429
|
|
1,380
|
|
15
|
|
||||||||
|
Advertising and promotion
|
3,956
|
|
3,786
|
|
2,601
|
|
170
|
|
4
|
|
||||||||
|
Pennsylvania shares tax
|
4,875
|
|
4,209
|
|
3,825
|
|
666
|
|
16
|
|
||||||||
|
Intangible amortization
|
3,217
|
|
3,081
|
|
547
|
|
136
|
|
4
|
|
||||||||
|
Collection and repossession
|
2,762
|
|
1,905
|
|
2,250
|
|
857
|
|
45
|
|
||||||||
|
Other professional fees and services
|
4,473
|
|
4,761
|
|
3,915
|
|
(288
|
)
|
(6
|
)
|
||||||||
|
FDIC insurance
|
2,007
|
|
3,210
|
|
3,903
|
|
(1,203
|
)
|
(37
|
)
|
||||||||
|
Other operating expenses
|
23,336
|
|
23,289
|
|
17,808
|
|
47
|
|
—
|
|
||||||||
|
Subtotal
|
191,677
|
|
186,201
|
|
154,177
|
|
5,476
|
|
3
|
|
||||||||
|
Loss on sale or write-down of assets
|
1,080
|
|
1,834
|
|
1,155
|
|
(754
|
)
|
(41
|
)
|
||||||||
|
Litigation and operational losses
|
1,162
|
|
2,050
|
|
1,420
|
|
(888
|
)
|
(43
|
)
|
||||||||
|
Merger and acquisition related
|
1,637
|
|
10,213
|
|
3,173
|
|
(8,576
|
)
|
(84
|
)
|
||||||||
|
Total noninterest expense
|
$
|
195,556
|
|
$
|
200,298
|
|
$
|
159,925
|
|
$
|
(4,742
|
)
|
(2
|
)%
|
||||
Noninterest expense, excluding the loss on sale or write-down of assets, litigation and operational losses, and merger and acquisition related expense, increased
$5.5 million
, or
3%
, for the year ended
2018
compared to
2017
. Contributing to the
2018
increase is a
$1.4 million
increase in salaries and employee benefits resulting from a higher number of full-time equivalent employees due to the Garfield acquisition and continued expansion of our mortgage and commercial banking businesses. The change in salaries and employee benefits was also impacted by $2.5 million of expense recognized in 2017 for a one-time bonus of $1,500 paid to all full and part-time employees (other than the top five named executive officers) following the passage of the Tax Cuts and Jobs Act. The Garfield and DCB acquisitions accounted for $0.4 million of the
$1.6 million
increase in net occupancy expense, $0.1 million of the increase in furniture and equipment expense and all of the
$0.1 million
increase in intangible amortization.
Data processing expense increased
$1.4
million due to additional volume associated with increased debit cards and card usage, as well as an increase in usage of digital channels. The $1.2 million decrease in FDIC insurance expense was primarily related to a decrease in our base assessment rate.
Merger related expenses totaled
$1.6 million
and
$10.2 million
for the years
2018
and
2017
, respectively. Expenses in
2018
reflect expenses related to the acquisition of Garfield while expenses in
2017
and 2016 reflect expenses related to the acquisition of DCB and 13 FirstMerit branches, respectively.
Income Tax
The provision for income taxes of
$25.3 million
in
2018
reflects a decrease of
$23.3 million
compared to the provision for income taxes in
2017
, despite a $29.0 million increase in the level of income before taxes. The lower provision for income taxes can be attributed to the Tax Cut and Jobs Act passed in December 2017, which decreased the statutory Federal tax rate from 35% to 21%, and a $16.7 million non-cash charge recorded in 2017 for the revaluation of deferred tax assets in connection with the passage of the Tax Cuts and Jobs Act.
The effective tax rate was
19%
and
47%
for tax expense in
2018
and
2017
, respectively. Excluding the $16.7 million charge related to the revaluation of deferred tax assets, the effective tax rate for 2017 would have been 31%. We ordinarily generate an annual effective tax rate that is less than the statutory rate due to benefits resulting from tax-exempt interest and income from bank owned life insurance, which are relatively consistent regardless of the level of pretax income. Additionally, the year ended December 31, 2018 included a $0.6 million further adjustment to the deferred tax asset adjustment recorded in 2017.
34
Financial Condition
First Commonwealth’s total assets increased
$519.7 million
in
2018
. Loans, including loans held for sale, increased
$363.8 million
, or
7%
, while investments increased
$149.6 million
, or 13.1%.
Loan growth in
2018
was impacted by
$184.5 million
of loans acquired as part of the Garfield acquisition, including $5.2 million in commercial, financial, agricultural and other, $6.7 million in real estate construction, $65.6 million in residential real estate, $101.0 million in commercial real estate and $2.9 million in loans to individuals.
During
2018
, approximately
$204.3 million
in investment securities were sold, called or matured. Some of these securities were lower yielding securities in comparison to the total portfolio yield and, as such, their replacement contributed to the increase in the yield earned on the portfolio. In total,
$338.2 million
in mortgage-backed securities,
$5.0 million
in corporate securities and
$2.5 million
in municipal securities were purchased in
2018
to help replace runoff from the portfolio while maintaining a reduced risk profile.
First Commonwealth’s total liabilities increased
$432.5 million
, or
7%
, in
2018
. Deposits increased
$317.3 million
, or
6%
, including
$141.3 million
in deposits obtained as part of the Garfield acquisition. Short-term debt increased
$14.4 million
or
2%
, based on liquidity needs, and long-term debt increased
$97.1 million
, or
110%
, primarily due to the issuance of $100 million in subordinated debt in the second quarter of 2018.
Total shareholders' equity increased
$87.3 million
in
2018
. Growth in shareholders' equity was a result of net income of
$107.5 million
and $41.6 million in common stock issued in relation to the Garfield acquisition and, partially offset by
$34.8 million
in dividends declared, a
$5.2 million
decrease in accumulated other comprehensive income and
$26.2 million
in stock repurchases.
Loan Portfolio
Following is a summary of our loan portfolio as of December 31:
|
|
2018
|
2017
|
2016
|
2015
|
2014
|
|||||||||||||||||||||||||||||
|
|
Amount
|
%
|
Amount
|
%
|
Amount
|
%
|
Amount
|
%
|
Amount
|
%
|
||||||||||||||||||||||||
|
|
(dollars in thousands)
|
|||||||||||||||||||||||||||||||||
|
Commercial, financial,
agricultural and other |
$
|
1,138,473
|
|
20
|
%
|
$
|
1,163,383
|
|
22
|
%
|
$
|
1,139,547
|
|
23
|
%
|
$
|
1,150,906
|
|
25
|
%
|
$
|
1,052,109
|
|
24
|
%
|
|||||||||
|
Real estate construction
|
358,978
|
|
6
|
|
248,868
|
|
5
|
|
219,621
|
|
5
|
|
220,736
|
|
5
|
|
120,785
|
|
3
|
|
||||||||||||||
|
Residential real estate
|
1,562,405
|
|
27
|
|
1,426,370
|
|
26
|
|
1,229,192
|
|
25
|
|
1,224,465
|
|
26
|
|
1,226,344
|
|
27
|
|
||||||||||||||
|
Commercial real estate
|
2,123,544
|
|
37
|
|
2,019,096
|
|
37
|
|
1,742,210
|
|
36
|
|
1,479,000
|
|
31
|
|
1,405,256
|
|
31
|
|
||||||||||||||
|
Loans to individuals
|
590,739
|
|
10
|
|
549,659
|
|
10
|
|
548,777
|
|
11
|
|
608,643
|
|
13
|
|
652,814
|
|
15
|
|
||||||||||||||
|
Total loans and leases net of unearned income
|
$
|
5,774,139
|
|
100
|
%
|
$
|
5,407,376
|
|
100
|
%
|
$
|
4,879,347
|
|
100
|
%
|
$
|
4,683,750
|
|
100
|
%
|
$
|
4,457,308
|
|
100
|
%
|
|||||||||
The loan portfolio totaled
$5.8 billion
as of
December 31, 2018
, reflecting growth of
$366.8 million
, or
7%
, compared to
December 31, 2017
. Loan growth was experienced in all categories, except for commercial, financial, agricultural and other loans, with real estate construction and residential real estate categories providing the majority of the growth. Real estate construction loans increased $110.1 million, or 44.2%, with $94.5 million resulting from growth in commercial construction projects primarily in Pennsylvania and Ohio and $15.6 million due to growth in consumer construction. Commercial real estate loans increased $104.4 million, or 5.2%, of which $101.0 million was acquired as part of the Garfield acquisition. Residential real estate loans increased $136.0 million, or 9.5%, due to growth in our mortgage banking area as well as $65.6 million in mortgage loans acquired from Garfield. Growth in the loans to individuals category was largely due to growth in indirect auto loans. Commercial, financial, agricultural and other loans decreased $24.9 million, or 2.1%, as a result of growth in this category being offset by runoff and prepayments.
The majority of our loan portfolio is with borrowers located in Pennsylvania. The Company expanded into the Ohio market area with the opening of a loan production office in Cleveland, Ohio in 2013, the acquisition of First Community Bank of Columbus, Ohio in the fourth quarter of 2015, the purchase of 13 FirstMerit Bank, NA branches in northern Ohio in December 2016, the acquisition of DCB Financial of Columbus, Ohio in May 2017 and the acquisition of Garfield in Cincinnati, Ohio in May 2018. As of
December 31, 2018
and
2017
, there were no concentrations of loans relating to any industry in excess of 10% of total loans.
35
As of
December 31, 2018
, criticized loans (i.e., loans designated OAEM, substandard, impaired or doubtful) decreased
$2.8 million
, or
2%
, from
December 31, 2017
. Criticized loans totaled
$127.2 million
at
December 31, 2018
and represented
2%
of the total loan portfolio. Additionally, delinquencies on accruing loans
decreased
$2.9 million
, or
22%
, at
December 31, 2018
compared to
December 31, 2017
. As of
December 31, 2018
, nonaccrual loans decreased $
7.4 million
, or
24%
, compared to
December 31, 2017
. However, nonaccrual loan balances as of December 31, 2018 include $6.0 million related to a commercial credit that was paid in full in January 2019.
Final loan maturities and rate sensitivities of the loan portfolio excluding consumer installment and mortgage loans at
December 31, 2018
were as follows:
|
Within
One Year |
One to
5 Years |
After
5 Years |
Total
|
||||||||||||
|
|
(dollars in thousands)
|
||||||||||||||
|
Commercial, financial, agricultural and other
|
$
|
180,467
|
|
$
|
587,766
|
|
$
|
369,426
|
|
$
|
1,137,659
|
|
|||
|
Real estate construction (a)
|
45,215
|
|
187,982
|
|
71,402
|
|
304,599
|
|
|||||||
|
Commercial real estate
|
239,459
|
|
789,654
|
|
1,094,253
|
|
2,123,366
|
|
|||||||
|
Other
|
7,409
|
|
26,617
|
|
111,789
|
|
145,815
|
|
|||||||
|
Totals
|
$
|
472,550
|
|
$
|
1,592,019
|
|
$
|
1,646,870
|
|
$
|
3,711,439
|
|
|||
|
Loans at fixed interest rates
|
544,795
|
|
390,055
|
|
|||||||||||
|
Loans at variable interest rates
|
1,047,224
|
|
1,256,815
|
|
|||||||||||
|
Totals
|
$
|
1,592,019
|
|
$
|
1,646,870
|
|
|||||||||
|
(a)
|
The maturity of real estate construction loans include term commitments that follow the construction period. Loans with these term commitments will be moved to the commercial real estate category when the construction phase of the project is completed.
|
First Commonwealth has a legal lending limit of $
118.1 million
to any one borrower or closely related group of borrowers, but has established lower thresholds for credit risk management.
Nonperforming Loans
Nonperforming loans include nonaccrual loans and restructured loans. Nonaccrual loans represent loans on which interest accruals have been discontinued. Restructured loans are those loans whose terms have been renegotiated to provide a reduction or deferral of principal or interest as a result of the deteriorating financial position of the borrower under terms not available in the market.
We discontinue interest accruals on a loan when, based on current information and events, it is probable that we will be unable to fully collect principal or interest due according to the contractual terms of the loan. Consumer loans are placed in nonaccrual status at 150 days past due. Other types of loans are typically placed in nonaccrual status when there is evidence of a significantly weakened financial condition or principal and interest is 90 days or more delinquent. Interest received on a nonaccrual loan is normally applied as a reduction to loan principal rather than interest income utilizing the cost recovery methodology of revenue recognition.
Nonperforming loans are closely monitored on an ongoing basis as part of our loan review and work-out process. The probable risk of loss on these loans is evaluated by comparing the loan balance to the fair value of any underlying collateral and the present value of projected future cash flows. Losses are recognized when a loss is probable and the amount is reasonably estimable.
36
The following is a comparison of nonperforming and impaired assets and the effects on interest due to nonaccrual loans for the period ended December 31:
|
2018
|
2017
|
2016
|
2015
|
2014
|
|||||||||||||||
|
|
(dollars in thousands)
|
||||||||||||||||||
|
Nonperforming Loans:
|
|||||||||||||||||||
|
Loans on nonaccrual basis
|
$
|
11,509
|
|
$
|
19,455
|
|
$
|
16,454
|
|
$
|
24,345
|
|
$
|
25,715
|
|
||||
|
Troubled debt restructured loans on nonaccrual basis
|
11,761
|
|
11,222
|
|
11,569
|
|
12,360
|
|
16,952
|
|
|||||||||
|
Troubled debt restructured loans on accrual basis
|
8,757
|
|
11,563
|
|
13,790
|
|
14,139
|
|
12,584
|
|
|||||||||
|
Total nonperforming loans
|
$
|
32,027
|
|
$
|
42,240
|
|
$
|
41,813
|
|
$
|
50,844
|
|
$
|
55,251
|
|
||||
|
Loans past due in excess of 90 days and still accruing
|
$
|
1,582
|
|
$
|
1,854
|
|
$
|
2,131
|
|
$
|
2,455
|
|
$
|
2,619
|
|
||||
|
Other real estate owned
|
$
|
3,935
|
|
$
|
2,765
|
|
$
|
6,805
|
|
$
|
9,398
|
|
$
|
7,197
|
|
||||
|
Loans outstanding at end of period
|
$
|
5,774,139
|
|
$
|
5,407,376
|
|
$
|
4,879,347
|
|
$
|
4,683,750
|
|
$
|
4,457,308
|
|
||||
|
Average loans outstanding
|
$
|
5,582,651
|
|
$
|
5,278,511
|
|
$
|
4,818,759
|
|
$
|
4,553,634
|
|
$
|
4,356,566
|
|
||||
|
Nonperforming loans as a percentage of total loans
|
0.55
|
%
|
0.78
|
%
|
0.86
|
%
|
1.09
|
%
|
1.24
|
%
|
|||||||||
|
Provision for credit losses
|
$
|
12,531
|
|
$
|
5,087
|
|
$
|
18,480
|
|
$
|
14,948
|
|
$
|
11,196
|
|
||||
|
Allowance for credit losses
|
$
|
47,764
|
|
$
|
48,298
|
|
$
|
50,185
|
|
$
|
50,812
|
|
$
|
52,051
|
|
||||
|
Net charge-offs
|
$
|
13,065
|
|
$
|
6,974
|
|
$
|
19,107
|
|
$
|
16,187
|
|
$
|
13,370
|
|
||||
|
Net charge-offs as a percentage of average loans outstanding
|
0.23
|
%
|
0.13
|
%
|
0.40
|
%
|
0.36
|
%
|
0.31
|
%
|
|||||||||
|
Provision for credit losses as a percentage of net charge-offs
|
95.91
|
%
|
72.94
|
%
|
96.72
|
%
|
92.35
|
%
|
83.74
|
%
|
|||||||||
|
Allowance for credit losses as a percentage of end-of-period loans outstanding (a)
|
0.83
|
%
|
0.89
|
%
|
1.03
|
%
|
1.08
|
%
|
1.17
|
%
|
|||||||||
|
Allowance for credit losses as a percentage of nonperforming loans (a)
|
149.14
|
%
|
114.34
|
%
|
120.02
|
%
|
99.94
|
%
|
94.21
|
%
|
|||||||||
|
Gross income that would have been recorded at original rates
|
$
|
1,428
|
|
$
|
2,079
|
|
$
|
1,296
|
|
$
|
572
|
|
$
|
784
|
|
||||
|
Interest that was reflected in income
|
256
|
|
783
|
|
533
|
|
—
|
|
—
|
|
|||||||||
|
Net reduction to interest income due to nonaccrual
|
$
|
1,172
|
|
$
|
1,296
|
|
$
|
763
|
|
$
|
572
|
|
$
|
784
|
|
||||
|
(a)
|
End of period loans and nonperforming loans exclude loans held for sale.
|
Nonperforming loans decreased
$10.2 million
to
$32.0 million
at
December 31, 2018
, compared to
$42.2 million
at
December 31, 2017
. Nonperforming loans as a percentage of total loans decreased to
0.6%
from
0.8%
at
December 31, 2018
compared to
December 31, 2017
. Included in nonperforming loans at December 31, 2018, was a $6.0 million loan to a commercial borrower that paid off in full subsequent to December 31, 2018.
Also included in nonperforming loans are troubled debt restructured loans (“TDRs”). TDRs are those loans whose terms have been renegotiated to provide a reduction or deferral of principal or interest as a result of the deteriorating financial position of the borrower under terms not available in the market. TDRs decreased
$2.3 million
during
2018
. For additional information on TDRs please refer to Note 11 “Loans and Allowance for Credit Losses.”
Net charge-offs were
$13.1 million
in
2018
compared to
$7.0 million
for the year
2017
. The most significant credit losses recognized during the year include $3.4 million in charge-offs recognized on one commercial real estate relationship and $3.2 million for a commercial loan that was transferred to held for sale and subsequently sold. Net charge-offs in the loans to individual category totaled
$4.0 million
for
2018
, primarily due to charge-offs of indirect auto loans. Additional detail on credit risk is included in “Management’s Discussion and Analysis of Financial Condition and Results of Operations” under “Provision for Credit Losses,” “Allowance for Credit Losses" and "Credit Risk.”
Provision for credit losses as a percentage of net charge-offs increased to
95.9%
for the year ended
December 31, 2018
from
72.9%
for the year ended
December 31, 2017
.
37
Allowance for Credit Losses
Following is a summary of the allocation of the allowance for credit losses at December 31:
|
|
2018
|
2017
|
2016
|
2015
|
2014
|
|||||||||||||||||||||||||||||
|
|
Allowance
Amount |
%
(a) |
Allowance
Amount |
%
(a) |
Allowance
Amount |
%
(a) |
Allowance
Amount |
%
(a) |
Allowance
Amount |
%
(a) |
||||||||||||||||||||||||
|
|
(dollars in thousands)
|
|||||||||||||||||||||||||||||||||
|
Commercial, financial, agricultural and other
|
$
|
19,374
|
|
20
|
%
|
$
|
23,429
|
|
22
|
%
|
$
|
35,974
|
|
23
|
%
|
$
|
31,035
|
|
25
|
%
|
$
|
29,627
|
|
24
|
%
|
|||||||||
|
Real estate construction
|
2,002
|
|
6
|
|
1,349
|
|
5
|
|
577
|
|
5
|
|
887
|
|
5
|
|
2,063
|
|
3
|
|
||||||||||||||
|
Residential real estate
|
3,969
|
|
27
|
|
2,759
|
|
26
|
|
2,511
|
|
25
|
|
2,606
|
|
26
|
|
3,664
|
|
27
|
|
||||||||||||||
|
Commercial real estate
|
18,386
|
|
37
|
|
17,357
|
|
37
|
|
6,619
|
|
36
|
|
11,924
|
|
31
|
|
11,881
|
|
31
|
|
||||||||||||||
|
Loans to individuals
|
4,033
|
|
10
|
|
3,404
|
|
10
|
|
4,504
|
|
11
|
|
4,360
|
|
13
|
|
4,816
|
|
15
|
|
||||||||||||||
|
Total
|
$
|
47,764
|
|
$
|
48,298
|
|
$
|
50,185
|
|
$
|
50,812
|
|
$
|
52,051
|
|
|||||||||||||||||||
|
Allowance for credit losses as percentage of end-of-period loans outstanding
|
0.83
|
%
|
0.89
|
%
|
1.03
|
%
|
1.08
|
%
|
1.17
|
%
|
||||||||||||||||||||||||
|
(a)
|
Represents the ratio of loans in each category to total loans.
|
The allowance for credit losses decreased
$0.5 million
from
December 31, 2017
to
December 31, 2018
. The allowance for credit losses as a percentage of end-of-period loans outstanding was
0.8%
at
December 31, 2018
compared to
0.9%
at
December 31, 2017
. The allowance for credit losses includes both a general reserve for performing loans and specific reserves for impaired loans. Comparing
December 31, 2018
to
December 31, 2017
, the general reserve for performing loans decreased from
0.83%
to
0.80%
of total performing loans. General reserves as a percentage of non-impaired originated loans were
0.88%
at
December 31, 2018
compared to
0.90%
at
December 31, 2017
. Specific reserves decreased from
8.9%
of nonperforming loans at
December 31, 2017
to
5.1%
of nonperforming loans at
December 31, 2018
. The allowance for credit losses as a percentage of nonperforming loans was
149.1%
and
114.3%
at
December 31, 2018
and
2017
, respectively.
The allowance for credit losses represents management’s estimate of probable losses incurred in the loan portfolio at a specific point in time. This estimate includes losses associated with specifically identified loans, as well as estimated probable credit losses inherent in the remainder of the loan portfolio. Additions are made to the allowance through both periodic provisions charged to income and recoveries of losses previously incurred. Reductions to the allowance occur as loans are charged off. Management evaluates the adequacy of the allowance at least quarterly, and in doing so relies on various factors including, but not limited to, assessment of historical loss experience, delinquency and nonaccrual trends, portfolio growth, net realizable value of collateral and current economic conditions. This evaluation is subjective and requires material estimates that may change over time. For a description of the methodology used to calculate the allowance for credit losses, please refer to “Critical Accounting Policies and Significant Accounting Estimates—Allowance for Credit Losses.”
Management reviews local and national economic information and industry data, including trends in the industries we believe are indicative of higher risk to our portfolio. Factors reviewed by management include employment trends, macroeconomic trends, commercial real estate trends and the overall lending environment.
Investment Portfolio
Marketable securities that we hold in our investment portfolio, which are classified as “securities available for sale,” may be a source of liquidity; however, we do not anticipate liquidating the investments prior to maturity.
38
Following is a detail schedule of the amortized cost of securities available for sale as of December 31:
|
2018
|
2017
|
2016
|
|||||||||
|
|
(dollars in thousands)
|
||||||||||
|
Obligations of U.S. Government Agencies:
|
|||||||||||
|
Mortgage-Backed Securities—Residential
|
$
|
9,011
|
|
$
|
10,556
|
|
$
|
15,143
|
|
||
|
Mortgage-Backed Securities—Commercial
|
169,633
|
|
24,611
|
|
—
|
|
|||||
|
Obligations of U.S. Government-Sponsored Enterprises:
|
|||||||||||
|
Mortgage-Backed Securities—Residential
|
686,906
|
|
632,422
|
|
683,601
|
|
|||||
|
Mortgage-Backed Securities—Commercial
|
—
|
|
—
|
|
1
|
|
|||||
|
Other Government-Sponsored Enterprises
|
10,000
|
|
1,098
|
|
16,700
|
|
|||||
|
Obligations of States and Political Subdivisions
|
27,592
|
|
27,083
|
|
27,075
|
|
|||||
|
Corporate Securities
|
20,912
|
|
15,907
|
|
5,903
|
|
|||||
|
Pooled Trust Preferred Collateralized Debt Obligations
|
—
|
|
27,499
|
|
39,989
|
|
|||||
|
Total Debt Securities
|
924,054
|
|
739,176
|
|
788,412
|
|
|||||
|
Equities
|
—
|
|
1,670
|
|
1,670
|
|
|||||
|
Total Securities Available for Sale
|
$
|
924,054
|
|
$
|
740,846
|
|
$
|
790,082
|
|
||
As of
December 31, 2018
, securities available for sale had a fair value of
$909.2 million
. Gross unrealized gains were
$3.0 million
and gross unrealized losses were
$17.8 million
.
The following is a schedule of the contractual maturity distribution of securities available for sale at
December 31, 2018
.
|
U.S.
Government Agencies and Corporations |
States and
Political Subdivisions |
Other
Securities |
Total
Amortized Cost (a) |
Weighted
Average Yield (b) |
||||||||||||||
|
|
(dollars in thousands)
|
|||||||||||||||||
|
Within 1 year
|
$
|
118
|
|
$
|
—
|
|
$
|
4,000
|
|
$
|
4,118
|
|
2.06
|
%
|
||||
|
After 1 but within 5 years
|
4,111
|
|
2,273
|
|
14,983
|
|
21,367
|
|
3.25
|
|
||||||||
|
After 5 but within 10 years
|
255,938
|
|
25,319
|
|
—
|
|
281,257
|
|
2.19
|
|
||||||||
|
After 10 years
|
615,383
|
|
—
|
|
1,929
|
|
617,312
|
|
2.99
|
|
||||||||
|
Total
|
$
|
875,550
|
|
$
|
27,592
|
|
$
|
20,912
|
|
$
|
924,054
|
|
2.75
|
%
|
||||
|
(a)
|
Equities are excluded from this schedule because they have an indefinite maturity.
|
|
(b)
|
Yields are calculated on a taxable equivalent basis.
|
Mortgage-backed securities, which include mortgage-backed obligations of U.S. Government agencies and obligations of U.S. Government-sponsored enterprises, have contractual maturities ranging from less than one year to approximately 30 years and have anticipated average lives to maturity ranging from less than one year to approximately eight years.
The available for sale investment portfolio increased
$183.2 million
, or
25%
, at
December 31, 2018
compared to
2017
. Available for sale investment purchases of
$332.0 million
were partially offset by the sale, call or maturity of
$156.6 million
in investments. Liquidity provided from sales, calls and maturities was utilized to fund growth in the loan portfolio.
39
Following is a detail schedule of the amortized cost of securities held to maturity as of
December 31
:
|
2018
|
2017
|
2016
|
|||||||||
|
|
(dollars in thousands)
|
||||||||||
|
Obligations of U.S. Government Agencies:
|
|||||||||||
|
Mortgage-Backed Securities—Residential
|
$
|
3,635
|
|
$
|
3,925
|
|
$
|
4,297
|
|
||
|
Mortgage-Backed Securities—Commercial
|
55,221
|
|
58,249
|
|
34,444
|
|
|||||
|
Obligations of U.S. Government-Sponsored Enterprises:
|
|||||||||||
|
Mortgage-Backed Securities—Residential
|
279,109
|
|
305,126
|
|
280,430
|
|
|||||
|
Mortgage-Backed Securities—Commercial
|
13,159
|
|
14,056
|
|
14,675
|
|
|||||
|
Obligations of States and Political Subdivisions
|
42,331
|
|
40,540
|
|
38,667
|
|
|||||
|
Debt Securities Issued by Foreign Governments
|
400
|
|
200
|
|
—
|
|
|||||
|
Total Securities Held to Maturity
|
$
|
393,855
|
|
$
|
422,096
|
|
$
|
372,513
|
|
||
The following is a schedule of the contractual maturity distribution of securities held to maturity at
December 31, 2018
.
|
U.S.
Government Agencies and Corporations |
States and
Political Subdivisions |
Other
Securities |
Total
Amortized Cost |
Weighted
Average Yield |
||||||||||||||
|
|
(dollars in thousands)
|
|||||||||||||||||
|
Within 1 year
|
$
|
—
|
|
$
|
521
|
|
$
|
0
|
|
$
|
521
|
|
1.87
|
%
|
||||
|
After 1 but within 5 years
|
—
|
|
6,818
|
|
400
|
|
7,218
|
|
2.37
|
|
||||||||
|
After 5 but within 10 years
|
13,159
|
|
34,992
|
|
0
|
|
48,151
|
|
2.87
|
|
||||||||
|
After 10 years
|
337,965
|
|
0
|
|
—
|
|
337,965
|
|
2.50
|
|
||||||||
|
Total
|
$
|
351,124
|
|
$
|
42,331
|
|
$
|
400
|
|
$
|
393,855
|
|
2.54
|
%
|
||||
The held to maturity investment portfolio decreased $28.2 million, or 7%, at
December 31, 2018
compared to
2017
. Held to maturity investment purchases of
$20.7 million
were offset by the sale, call or maturity of
$47.6 million
in investments.
See Note 9 “Investment Securities,” Note 10 “Impairment of Investment Securities” and Note 19 “Fair Values of Assets and Liabilities” for additional information related to the investment portfolio.
Deposits
Total deposits increased
$317.3 million
, or
6%
, in
2018
, with
$141.3 million
of the growth resulting from the Garfield acquisition. Growth was experienced in all deposit categories.
Time deposits of $100 thousand or more had remaining maturities as follows as of the end of each year in the three-year period ended December 31:
|
|
2018
|
2017
|
2016
|
|||||||||||||||||
|
|
Amount
|
%
|
Amount
|
%
|
Amount
|
%
|
||||||||||||||
|
|
(dollars in thousands)
|
|||||||||||||||||||
|
3 months or less
|
$
|
51,619
|
|
13
|
%
|
$
|
47,964
|
|
23
|
%
|
$
|
38,366
|
|
26
|
%
|
|||||
|
Over 3 months through 6 months
|
59,201
|
|
15
|
|
22,101
|
|
11
|
|
27,371
|
|
19
|
|
||||||||
|
Over 6 months through 12 months
|
133,285
|
|
35
|
|
68,174
|
|
32
|
|
29,013
|
|
20
|
|
||||||||
|
Over 12 months
|
140,429
|
|
37
|
|
72,142
|
|
34
|
|
50,621
|
|
35
|
|
||||||||
|
Total
|
$
|
384,534
|
|
100
|
%
|
$
|
210,381
|
|
100
|
%
|
$
|
145,371
|
|
100
|
%
|
|||||
40
Short-Term Borrowings and Long-Term Debt
Short-term borrowings increased
$14.4 million
, or
2%
, from
$707.5 million
as of
December 31, 2017
to
$721.8 million
at
December 31, 2018
. Long-term debt increased
$97.1 million
, or
110%
, from
$87.9 million
at
December 31, 2017
to
$185.1 million
at
December 31, 2018
as a result of the issuance of $100 million of subordinated debt in the second quarter of 2018. For additional information concerning our short-term borrowings, subordinated debentures and other long-term debt, please refer to Note 16 “Short-term Borrowings,” Note 17 “Subordinated Debentures” and Note 18 “Other Long-term Debt” of the Consolidated Financial Statements.
Contractual Obligations and Off-Balance Sheet Arrangements
The table below sets forth our contractual obligations to make future payments as of
December 31, 2018
. For a more detailed description of each category of obligation, refer to the note in our Consolidated Financial Statements indicated in the table below.
|
Footnote
Number Reference |
1 Year
or Less |
After 1
But Within 3 Years |
After 3
But Within 5 Years |
After 5
Years |
Total
|
|||||||||||||||||
|
|
(dollars in thousands)
|
|||||||||||||||||||||
|
FHLB advances
|
18
|
|
$
|
631
|
|
$
|
1,336
|
|
$
|
1,443
|
|
$
|
4,141
|
|
$
|
7,551
|
|
|||||
|
Subordinated debentures
|
17
|
|
—
|
|
—
|
|
—
|
|
170,288
|
|
170,288
|
|
||||||||||
|
Operating leases
|
13
|
|
4,945
|
|
9,971
|
|
9,832
|
|
44,777
|
|
69,525
|
|
||||||||||
|
Total contractual obligations
|
$
|
5,576
|
|
$
|
11,307
|
|
$
|
11,275
|
|
$
|
219,206
|
|
$
|
247,364
|
|
|||||||
The table above excludes our cash obligations upon maturity of certificates of deposit, which is set forth in Note 15 “Interest-Bearing Deposits” of the Consolidated Financial Statements.
In addition, see Note 12 “Commitments and Letters of Credit” for detail related to our off-balance sheet commitments to extend credit, financial standby letters of credit, performance standby letters of credit and commercial letters of credit as of
December 31, 2018
. Commitments to extend credit, standby letters of credit and commercial letters of credit do not necessarily represent future cash requirements since it is unknown if the borrower will draw upon these commitments and often these commitments expire without being drawn upon. As of
December 31, 2018
, a reserve for probable losses of
$5.0 million
was recorded for unused commitments and letters of credit.
Liquidity
Liquidity refers to our ability to meet the cash flow requirements of depositors and borrowers as well as our operating cash needs with cost-effective funding. Liquidity risk arises from the possibility that we may not be able to meet our financial obligations and operating cash needs or may become overly reliant upon external funding sources. In order to manage this risk, our Board of Directors has established a Liquidity Policy that identifies primary sources of liquidity, establishes procedures for monitoring and measuring liquidity and quantifies minimum liquidity requirements based on limits approved by our Board of Directors. This policy designates our Asset/Liability Committee (“ALCO”) as the body responsible for meeting these objectives. The ALCO, which includes members of executive management, reviews liquidity on a periodic basis and approves significant changes in strategies that affect balance sheet or cash flow positions. Liquidity is centrally managed on a daily basis by our Treasury Department, which monitors it by using such measures as a 30 day liquidity stress analysis, liquidity gap ratios and noncore funding ratios.
We generate funds to meet our cash flow needs primarily through the core deposit base of FCB and the maturity or repayment of loans and other interest-earning assets, including investments. Core deposits are the most stable source of liquidity a bank can have due to the long-term relationship with a deposit customer. The level of deposits during any period is sometimes influenced by factors outside of management’s control, such as the level of short-term and long-term market interest rates and yields offered on competing investments, such as money market mutual funds. Deposits increased
$317.3 million
, or
6%
, during
2018
, and comprised
86%
of total liabilities at
December 31, 2018
, as compared to
87%
at
December 31, 2017
. Proceeds from the sale, maturity and redemption of investment securities totaled
$204.3 million
during
2018
and provided liquidity to fund loans as well as the purchase of additional investment securities.
We also have available unused wholesale sources of liquidity, including overnight federal funds and repurchase agreements, advances from the Federal Home Loan Bank of Pittsburgh, borrowings through the discount window at the Federal Reserve Bank of Cleveland and access to certificates of deposit through brokers. We have increased our borrowing capacity at the Federal Reserve by establishing a Borrower-in-Custody of Collateral arrangement that enables us to pledge certain loans, not being used as collateral at the Federal Home Loan Bank, as collateral for borrowings at the Federal Reserve. At
December 31,
41
2018
our borrowing capacity at the Federal Reserve related to this program was
$768.7 million
and there were no amounts outstanding. Additionally, as of
December 31, 2018
, our maximum borrowing capacity at the Federal Home Loan Bank of Pittsburgh was
$1.6 billion
and as of that date amounts used against this capacity included
$0.6 billion
in outstanding borrowings.
We participate in the Certificate of Deposit Account Registry Services (“CDARS”) program as part of an ALCO strategy to increase and diversify funding sources. As of
December 31, 2018
, our maximum borrowing capacity under this program was
$1.2 billion
and as of that date there was
$6.7 million
outstanding. We also participate in a reciprocal program which allows our depositors to receive expanded FDIC coverage by placing multiple certificates of deposit at other CDARS member banks. As of
December 31, 2018
, our outstanding certificates of deposits from this program have an average weighted rate of
1.26%
and an average original term of
336
days.
We also have available unused federal funds lines with four correspondent banks. These lines have an aggregate commitment of
$205.0 million
with
$11.0 million
outstanding as of
December 31, 2018
.
The liquidity needs of First Commonwealth on an unconsolidated basis (the "Parent Company") consist primarily of operating expenses, debt service payments and dividend payments to our stockholders, which totaled
$42.6 million
for the year ended
December 31, 2018
, as well as any cash necessary to repurchase our shares, which totaled
$26.2 million
for the year ended
December 31, 2018
. The primary source of liquidity for the Parent Company is dividends from subsidiaries. The Parent Company had
$72.2 million
in junior subordinated debentures and cash and interest-bearing deposits of
$21.5 million
at
December 31, 2018
. At the end of
2018
, the Parent Company had a
$15.0 million
short-term, unsecured revolving line of credit with another financial institution. As of
December 31, 2018
, there were no amounts outstanding under this line. The Parent Company has the ability to enhance its liquidity position by raising capital or incurring debt.
Refer to “Financial Condition” above for additional information concerning our deposits, loan portfolio, investment securities and borrowings.
Market Risk
Market risk refers to potential losses arising from changes in interest rates, foreign exchange rates, equity prices and commodity prices. Our market risk is composed primarily of interest rate risk. Interest rate risk is comprised of repricing risk, basis risk, yield curve risk and options risk. Repricing risk arises from differences in the cash flow or repricing between asset and liability portfolios. Basis risk arises when asset and liability portfolios are related to different market rate indices, which do not always change by the same amount. Yield curve risk arises when asset and liability portfolios are related to different maturities on a given yield curve; when the yield curve changes shape, the risk position is altered. Options risk arises from “embedded options” within asset and liability products as certain borrowers have the option to prepay their loans when rates fall, while certain depositors can redeem or withdraw their deposits early when rates rise.
The process by which we manage our interest rate risk is called asset/liability management. The goals of our asset/liability management are increasing net interest income without taking undue interest rate risk or material loss of net market value of our equity, while maintaining adequate liquidity. Net interest income is increased by growing earning assets and increasing the difference between the rate earned on earning assets and the rate paid on interest-bearing liabilities. Liquidity is measured by the ability to meet both depositors’ and credit customers’ requirements.
We use an asset/liability model to measure our interest rate risk. Interest rate risk measures include earnings simulation and gap analysis. Gap analysis is a static measure that does not incorporate assumptions regarding future events. Gap analysis, while a helpful diagnostic tool, displays cash flows for only a single rate environment. Net interest income simulations explicitly measure the exposure to earnings from changes in market rates of interest. Under simulation analysis, our current financial position is combined with assumptions regarding future business to calculate net interest income under various hypothetical rate scenarios. Our net interest income simulations assume a level balance sheet whereby new volume equals run-off. The ALCO reviews earnings simulations over multiple years under various interest rate scenarios. Reviewing these various measures provides us with a reasonably comprehensive view of our interest rate profile.
The following gap analysis compares the difference between the amount of interest-earning assets and interest-bearing liabilities subject to repricing over a period of time. The ratio of rate sensitive assets to rate sensitive liabilities repricing within a one year period was
0.74
and
0.73
at
December 31, 2018
and
2017
, respectively. A ratio of less than one indicates a higher level of repricing liabilities over repricing assets over the next twelve months. The level of First Commonwealth's ratio is largely driven by the modeling of interest-bearing non-maturity deposits, which are included in the analysis as repricing within one year.
42
Following is the gap analysis as of December 31:
|
|
2018
|
||||||||||||||||||||||
|
|
0-90 Days
|
91-180
Days |
181-365
Days |
Cumulative
0-365 Days |
Over 1 Year
Through 5 Years |
Over 5
Years |
|||||||||||||||||
|
|
(dollars in thousands)
|
||||||||||||||||||||||
|
Loans
|
$
|
2,659,890
|
|
$
|
291,134
|
|
$
|
439,098
|
|
$
|
3,390,122
|
|
$
|
1,802,605
|
|
$
|
569,659
|
|
|||||
|
Investments
|
81,971
|
|
60,654
|
|
99,288
|
|
241,913
|
|
612,407
|
|
468,916
|
|
|||||||||||
|
Other interest-earning assets
|
3,013
|
|
—
|
|
—
|
|
3,013
|
|
—
|
|
—
|
|
|||||||||||
|
Total interest-sensitive assets (ISA)
|
2,744,874
|
|
351,788
|
|
538,386
|
|
3,635,048
|
|
2,415,012
|
|
1,038,575
|
|
|||||||||||
|
Certificates of deposit
|
116,469
|
|
116,664
|
|
276,101
|
|
509,234
|
|
338,148
|
|
2,834
|
|
|||||||||||
|
Other deposits
|
3,581,563
|
|
—
|
|
—
|
|
3,581,563
|
|
—
|
|
—
|
|
|||||||||||
|
Borrowings
|
794,206
|
|
218
|
|
443
|
|
794,867
|
|
54,080
|
|
57,932
|
|
|||||||||||
|
Total interest-sensitive liabilities (ISL)
|
4,492,238
|
|
116,882
|
|
276,544
|
|
4,885,664
|
|
392,228
|
|
60,766
|
|
|||||||||||
|
Gap
|
$
|
(1,747,364
|
)
|
$
|
234,906
|
|
$
|
261,842
|
|
$
|
(1,250,616
|
)
|
$
|
2,022,784
|
|
$
|
977,809
|
|
|||||
|
ISA/ISL
|
0.61
|
|
3.01
|
|
1.95
|
|
0.74
|
|
6.16
|
|
17.09
|
|
|||||||||||
|
Gap/Total assets
|
22.32
|
%
|
3.00
|
%
|
3.34
|
%
|
15.98
|
%
|
25.84
|
%
|
12.49
|
%
|
|||||||||||
|
|
2017
|
||||||||||||||||||||||
|
|
0-90 Days
|
91-180
Days |
181-365
Days |
Cumulative
0-365 Days |
Over 1 Year
Through 5 Years |
Over 5
Years |
|||||||||||||||||
|
|
(dollars in thousands)
|
||||||||||||||||||||||
|
Loans
|
$
|
2,662,906
|
|
$
|
214,139
|
|
$
|
359,790
|
|
$
|
3,236,835
|
|
$
|
1,633,236
|
|
$
|
521,478
|
|
|||||
|
Investments
|
79,484
|
|
45,983
|
|
84,001
|
|
209,468
|
|
525,391
|
|
434,919
|
|
|||||||||||
|
Other interest-earning assets
|
8,668
|
|
—
|
|
—
|
|
8,668
|
|
—
|
|
—
|
|
|||||||||||
|
Total interest-sensitive assets (ISA)
|
2,751,058
|
|
260,122
|
|
443,791
|
|
3,454,971
|
|
2,158,627
|
|
956,397
|
|
|||||||||||
|
Certificates of deposit
|
139,920
|
|
71,178
|
|
165,083
|
|
376,181
|
|
235,037
|
|
3,595
|
|
|||||||||||
|
Other deposits
|
3,549,121
|
|
—
|
|
—
|
|
3,549,121
|
|
—
|
|
—
|
|
|||||||||||
|
Borrowings
|
779,875
|
|
244
|
|
495
|
|
780,614
|
|
4,468
|
|
10,302
|
|
|||||||||||
|
Total interest-sensitive liabilities (ISL)
|
4,468,916
|
|
71,422
|
|
165,578
|
|
4,705,916
|
|
239,505
|
|
13,897
|
|
|||||||||||
|
Gap
|
$
|
(1,717,858
|
)
|
$
|
188,700
|
|
$
|
278,213
|
|
$
|
(1,250,945
|
)
|
$
|
1,919,122
|
|
$
|
942,500
|
|
|||||
|
ISA/ISL
|
0.62
|
|
3.64
|
|
2.68
|
|
0.73
|
|
9.01
|
|
68.82
|
|
|||||||||||
|
Gap/Total assets
|
23.50
|
%
|
2.58
|
%
|
3.81
|
%
|
17.12
|
%
|
26.26
|
%
|
12.90
|
%
|
|||||||||||
Gap analysis has limitations due to the static nature of the model that holds volumes and consumer behaviors constant in all economic and interest rate scenarios. A lower level of rate sensitive assets to rate sensitive liabilities repricing in one year could indicate reduced net interest income in a rising interest rate scenario, and conversely, increased net interest income in a declining interest rate scenario. However, the gap analysis incorporates only the level of interest-earning assets and interest-bearing liabilities and not the sensitivity each has to changes in interest rates. The impact of the sensitivity to changes in interest rates is provided in the table below the gap analysis.
43
The following table presents an analysis of the potential sensitivity of our annual net interest income to gradual changes in interest rates over a 12 month time frame as compared with net interest income if rates remained unchanged and there are no changes in balance sheet categories.
|
|
Net interest income change (12 months)
|
||||||||||||||
|
|
-200
|
-100
|
+100
|
+200
|
|||||||||||
|
|
(dollars in thousands)
|
||||||||||||||
|
December 31, 2018 ($)
|
$
|
(16,914
|
)
|
$
|
(6,442
|
)
|
$
|
1,368
|
|
$
|
2,587
|
|
|||
|
December 31, 2018 (%)
|
(6.32
|
)%
|
(2.41
|
)%
|
0.51
|
%
|
0.97
|
%
|
|||||||
|
December 31, 2017 ($)
|
$
|
(15,810
|
)
|
$
|
(6,181
|
)
|
$
|
5,856
|
|
$
|
11,315
|
|
|||
|
December 31, 2017 (%)
|
(6.51
|
)%
|
(2.55
|
)%
|
2.41
|
%
|
4.66
|
%
|
|||||||
The following table represents the potential sensitivity of our annual net interest income to immediate changes in interest rates versus if rates remained unchanged and there are no changes in balance sheet categories.
|
|
Net interest income change (12 months)
|
||||||||||||||
|
|
-200
|
-100
|
+100
|
+200
|
|||||||||||
|
|
(dollars in thousands)
|
||||||||||||||
|
December 31, 2018 ($)
|
$
|
(37,239
|
)
|
$
|
(14,277
|
)
|
$
|
10,674
|
|
$
|
20,597
|
|
|||
|
December 31, 2018 (%)
|
(13.90
|
)%
|
(5.33
|
)%
|
3.99
|
%
|
7.69
|
%
|
|||||||
|
December 31, 2017 ($)
|
$
|
(33,734
|
)
|
$
|
(16,356
|
)
|
$
|
14,427
|
|
$
|
27,815
|
|
|||
|
December 31, 2017 (%)
|
(13.90
|
)%
|
(6.74
|
)%
|
5.94
|
%
|
11.46
|
%
|
|||||||
The analysis and model used to quantify the sensitivity of our net interest income becomes less meaningful in a decreasing 200 basis point scenario given the current interest rate environment. Results of the 100 and 200 basis point interest rate decline scenario are affected by the fact that many of our interest-bearing liabilities are at rates below 1%, with an assumed floor of zero in the model. For the years
2018
and
2017
, the cost of our interest-bearing liabilities averaged
0.78%
and
0.44%
, respectively, and the yield on our average interest-earning assets, on a fully taxable equivalent basis, averaged
4.30%
and
3.90%
, respectively.
The ALCO is responsible for the identification and management of interest rate risk exposure. As such, the ALCO continuously evaluates strategies to manage our exposure to interest rate fluctuations.
In 2015, the Company entered into a cash flow interest rate swap in which we extended the duration of $65.0 million of the $1.3 billion LIBOR based loans in our loan portfolio at that time into fixed interest rates for a period four years. Please refer to Note 8, "Derivatives," for additional information on interest rate swaps.
Asset/liability models require that certain assumptions be made, such as prepayment rates on earning assets and the impact of pricing on non-maturity deposits, which may differ from actual experience. These business assumptions are based upon our experience, business plans and published industry experience. While management believes such assumptions to be reasonable, there can be no assurance that modeled results will approximate actual results.
Credit Risk
First Commonwealth maintains an allowance for credit losses at a level deemed sufficient for losses inherent in the loan portfolio at the date of each statement of financial condition. Management reviews the adequacy of the allowance on a quarterly basis to ensure that the provision for credit losses has been charged against earnings in an amount necessary to maintain the allowance at a level that is appropriate based on management’s assessment of probable estimated losses.
First Commonwealth’s methodology for assessing the appropriateness of the allowance for credit losses consists of several key elements. These elements include an assessment of individual impaired loans with a balance greater than $0.1 million, loss experience trends and other relevant factors.
First Commonwealth also maintains a reserve for unfunded loan commitments and letters of credit based upon credit risk and probability of funding. The reserve totaled
$5.0 million
at
December 31, 2018
and is classified in “Other liabilities” on the Consolidated Statements of Financial Condition.
44
Nonperforming loans include nonaccrual loans and loans classified as troubled debt restructurings. Nonaccrual loans represent loans on which interest accruals have been discontinued. Troubled debt restructured loans are those loans whose terms have been renegotiated to provide a reduction or deferral of principal or interest as a result of the deteriorating financial position of the borrower, who could not obtain comparable terms from alternate financing sources. In
2018
,
58
loans totaling
$11.3 million
were identified as troubled debt restructurings, requiring
no
additional specific reserves.
We discontinue interest accruals on a loan when, based on current information and events, it is probable that we will be unable to fully collect principal or interest due according to the contractual terms of the loan. A loan is also placed in nonaccrual status when, based on regulatory definitions, the loan is maintained on a “cash basis” due to the weakened financial condition of the borrower. Generally, loans 90 days or more past due are placed on nonaccrual status, except for consumer loans which are placed on nonaccrual status at 150 days past due.
Nonperforming loans are closely monitored on an ongoing basis as part of our loan review and work-out process. The probable risk of loss on these loans is evaluated by comparing the loan balance to the estimated fair value of any underlying collateral or the present value of projected future cash flows. Losses or specifically assigned allowance for credit losses are recognized where appropriate.
The allowance for credit losses was
$47.8 million
at
December 31, 2018
or
0.83%
of loans outstanding, compared to
$48.3 million
or
0.89%
of loans outstanding at
December 31, 2017
. Credit measures as of
December 31, 2018
compared to
December 31, 2017
reflect an increase in the level of criticized loans of
$2.8 million
from
$124.4 million
at
December 31, 2017
to
$127.2 million
at
December 31, 2018
. Classified assets decreased
$32.8 million
from
$73.0 million
at
December 31, 2017
to
$40.2 million
at
December 31, 2018
. Delinquency on accruing loans decreased
$2.9 million
, or
22%
, while the level of nonperforming loans decreased
$10.2 million
for the same period.
The allowance for credit losses as a percentage of nonperforming loans was
149.1%
at
December 31, 2018
and
114.3%
as of
December 31, 2017
. The allowance for credit losses includes specific allocations of
$1.6 million
related to nonperforming loans covering
5%
of the total nonperforming balance at
December 31, 2018
and specific allocations of
$3.7 million
covering
9%
of the total nonperforming balance at
December 31, 2017
. The amount of allowance related to nonperforming loans was determined by using estimated fair values obtained from current appraisals and updated discounted cash flow analyses.
Management believes that the allowance for credit losses is at a level that is sufficient to absorb losses incurred in the loan portfolio at
December 31, 2018
.
The following table provides information on net charge-offs and nonperforming loans by loan category:
|
|
For the Period Ended December 31, 2018
|
As of December 31, 2018
|
|||||||||||||||||
|
|
Net
Charge-offs |
% of
Total Net Charge- offs |
Net
Charge-offs as a % of Average Loans |
Nonperforming
Loans |
% of Total
Nonperforming Loans |
Nonperforming
Loans as a % of Total Loans |
|||||||||||||
|
|
(dollars in thousands)
|
||||||||||||||||||
|
Commercial, financial, agricultural and other
|
$
|
4,506
|
|
34.49
|
%
|
0.08
|
%
|
$
|
11,981
|
|
37.41
|
%
|
0.21
|
%
|
|||||
|
Real estate construction
|
(141
|
)
|
(1.08
|
)
|
—
|
|
—
|
|
—
|
|
—
|
|
|||||||
|
Residential real estate
|
952
|
|
7.29
|
|
0.02
|
|
13,243
|
|
41.35
|
|
0.23
|
|
|||||||
|
Commercial real estate
|
3,777
|
|
28.91
|
|
0.07
|
|
6,507
|
|
20.32
|
|
0.11
|
|
|||||||
|
Loans to individuals
|
3,971
|
|
30.39
|
|
0.07
|
|
296
|
|
0.92
|
|
0.01
|
|
|||||||
|
Total loans, net of unearned income
|
$
|
13,065
|
|
100.00
|
%
|
0.24
|
%
|
$
|
32,027
|
|
100.00
|
%
|
0.56
|
%
|
|||||
As the above table illustrates, commercial, financial, agricultural loans and residential real estate loans were the most significant portions of the nonperforming loans as of
December 31, 2018
. See discussions related to the provision for credit losses and loans for more information.
45
Results of Operations—
2017
Compared to
2016
Summary of
2017
Results
Net income for
2017
was
$55.2 million
, or
$0.58
per diluted share, as compared to a net income of
$59.6 million
, or
$0.67
per diluted share, in
2016
. Net income in
2017
was positively impacted by an increase in net interest income of
$29.7 million
and noninterest income of
$15.7 million
, offset by an increase in noninterest expense of
$40.4 million
and a $16.7 million noncash charge for the revaluation of deferred tax assets recorded in connection with the passage of the Tax Cuts and Jobs Act.
Our return on average equity was
6.45%
and our return on average assets was
0.77%
for
2017
, compared to
8.02%
and
0.89%
, respectively, for
2016
.
Average diluted shares for the year
2017
were
7%
less than the comparable period in
2016
primarily due to the issuance of 8.4 million shares of common stock as a result of the acquisition of DCB Financial.
Net interest income, on a fully taxable equivalent basis, for
2017
was
$30.1 million
, or
15%
, higher than
2016
, primarily due to growth in interest earning assets as well as growth in rates on interest earning assets. Positively affecting net interest income in
2017
was a
$173.3 million
increase in average net free funds. Average net free funds are the excess of demand deposits, other noninterest-bearing liabilities and shareholders’ equity over nonearning assets. The net interest margin, on a fully taxable equivalent basis, was
3.57%
in
2017
compared to
3.32%
in
2016
.
During the year-ended
December 31, 2017
, growth in both the level of interest-earning assets and the rates on those assets positively impacted the net interest margin. Yields and spreads on new loan volumes in
2017
exceeded runoff levels, specifically for variable and adjustable rate commercial loans, home equity loans and indirect auto loans. Average earning assets increased
$422.1 million
, or
7%
, compared to the comparable period in
2016
.
The taxable equivalent yield on interest-earning assets was
3.90%
for the year-ended
December 31, 2017
, an increase of
27
basis points from the
3.63%
yield for the same period in
2016
. This increase can be attributed to higher replacement yields on loan portfolio runoff and maturities as a result of improvements in pricing spreads. Additionally, the investment portfolio yield increased by 7 basis points. This increase can be attributed to the runoff or sale of lower yielding U.S. Agency securities which were replaced with higher yielding investment securities. Reductions in the cost of interest-bearing liabilities partially offset the impact of higher yields on interest-earning assets. The cost of interest-bearing liabilities was
0.44%
for the year-ended
December 31, 2017
, compared to
0.39%
for the same period in
2016
.
Comparing the year-ended
December 31, 2017
with the same period in
2016
, changes in interest rates positively impacted net interest income by
$11.3 million
. The higher yield on interest-earning assets favorably impacted net interest income by
$16.4 million
, while a change in the mix of interest-bearing liabilities and an increase in short-term borrowing rates had a negative impact of
$5.0 million
on net interest income. The growth in net interest income for the year-ended
December 31, 2017
, can be primarily attributed to growth in the loan portfolio and changes in the mix of our investment portfolio.
While changes in rates had a positive impact on the net interest margin, increases in average interest-earning assets had an even larger the effect on net interest income. Changes in the volume of interest-earning assets and interest-bearing liabilities positively impacted net interest income by
$18.8 million
in the year ended
December 31, 2017
compared to the same period in
2016
. Higher levels of interest-earning assets resulted in an increase of
$17.0 million
in interest income, while reductions in time deposits and long-term borrowings, partially offset by increased short-term borrowings, decreased interest expense by
$1.9 million
.
Noninterest income, excluding net securities gains (losses), gains on sale of assets and derivative mark to market, increased
$10.4 million
, or
18%
, in
2017
, largely due to increases in interchange income, service charges on deposits and trust income.
Total noninterest income increased
$15.7 million
, or
24%
, in
2017
in comparison to the year ended
2016
. The most notable change includes a
$1.3 million
increase in gain on the sale of mortgage loans due to continued growth in mortgage loan originations since the Company reentered the secondary mortgage market in 2014. Net securities gains (losses) increased
$4.4 million
, primarily due to the early redemption of two of our pooled trust preferred securities.
Total noninterest expense for the year
2017
increased
$40.4 million
in comparison to the year
2016
. Contributing to the
2017
increase is a
$16.6 million
increase in salaries and employee benefits, primarily due to the increase of 98 full-time equivalent employees at December 31, 2017 compared to December 31, 2016.
Other operating expense increased
$5.5 million
for the year
2017
compared to
2016
, primarily due to a $1.4 million increase in expense related to the reserve for unfunded loan commitments and $1.7 million increase in data processing expenses primarily related to additional volume associated with increased debit cards and card usage as well as an increase in usage by digital channels.
46
Merger related expenses totaled $10.2 million and $3.2 million for the years ended December 31, 2017 and 2016, respectively. Expenses in 2017 reflect expenses related to the acquisition of DCB Financial while expenses in 2016 reflect expenses related to the acquisition of 13 FirstMerit branches.
ITEM 7A.
Quantitative and Qualitative Disclosures About Market Risk
Information appearing in Item 7 of this report under the caption “Market Risk” is incorporated herein by reference in response to this item.
47
ITEM 8.
Financial Statements and Supplementary Data
FIRST COMMONWEALTH FINANCIAL CORPORATION AND SUBSIDIARIES
CONSOLIDATED STATEMENTS OF FINANCIAL CONDITION
|
|
December 31,
|
||||||
|
|
2018
|
2017
|
|||||
|
|
(dollars in thousands, except
share data)
|
||||||
|
Assets
|
|||||||
|
Cash and due from banks
|
$
|
95,934
|
|
$
|
98,624
|
|
|
|
Interest-bearing bank deposits
|
3,013
|
|
8,668
|
|
|||
|
Securities available for sale, at fair value
|
909,247
|
|
731,358
|
|
|||
|
Securities held to maturity, at amortized cost, (Fair value $383,993 at December 31, 2018 and $418,249 at December 31, 2017)
|
393,855
|
|
422,096
|
|
|||
|
Other investments
|
32,126
|
|
29,837
|
|
|||
|
Loans held for sale
|
11,881
|
|
14,850
|
|
|||
|
Loans:
|
|||||||
|
Portfolio loans
|
5,774,139
|
|
5,407,376
|
|
|||
|
Allowance for credit losses
|
(47,764
|
)
|
(48,298
|
)
|
|||
|
Net loans
|
5,726,375
|
|
5,359,078
|
|
|||
|
Premises and equipment, net
|
80,474
|
|
81,339
|
|
|||
|
Other real estate owned
|
3,935
|
|
2,765
|
|
|||
|
Goodwill
|
274,202
|
|
255,353
|
|
|||
|
Amortizing intangibles, net
|
13,038
|
|
15,007
|
|
|||
|
Bank owned life insurance
|
215,766
|
|
212,099
|
|
|||
|
Other assets
|
68,409
|
|
77,465
|
|
|||
|
Total assets
|
$
|
7,828,255
|
|
$
|
7,308,539
|
|
|
|
Liabilities
|
|||||||
|
Deposits (all domestic):
|
|||||||
|
Noninterest-bearing
|
$
|
1,466,213
|
|
$
|
1,416,771
|
|
|
|
Interest-bearing
|
4,431,779
|
|
4,163,934
|
|
|||
|
Total deposits
|
5,897,992
|
|
5,580,705
|
|
|||
|
Short-term borrowings
|
721,823
|
|
707,466
|
|
|||
|
Subordinated debentures
|
170,288
|
|
72,167
|
|
|||
|
Other long-term debt
|
7,551
|
|
8,161
|
|
|||
|
Capital lease obligation
|
7,217
|
|
7,590
|
|
|||
|
Total long-term debt
|
185,056
|
|
87,918
|
|
|||
|
Other liabilities
|
47,995
|
|
44,323
|
|
|||
|
Total liabilities
|
6,852,866
|
|
6,420,412
|
|
|||
|
Shareholders’ Equity
|
|||||||
|
Preferred stock, $1 par value per share, 3,000,000 shares authorized, none issued
|
—
|
|
—
|
|
|||
|
Common stock, $1 par value per share, 200,000,000 shares authorized; 113,914,902 shares issued as of December 31, 2018 and 2017; and 98,518,668 and 97,456,478 shares outstanding at December 31, 2018 and 2017, respectively
|
113,915
|
|
113,915
|
|
|||
|
Additional paid-in capital
|
492,273
|
|
470,123
|
|
|||
|
Retained earnings
|
511,409
|
|
437,416
|
|
|||
|
Accumulated other comprehensive (loss) income, net
|
(11,341
|
)
|
(6,173
|
)
|
|||
|
Treasury stock (15,396,234 and 16,458,424 shares at December 31, 2018 and 2017, respectively)
|
(130,867
|
)
|
(127,154
|
)
|
|||
|
Total shareholders’ equity
|
975,389
|
|
888,127
|
|
|||
|
Total liabilities and shareholders’ equity
|
$
|
7,828,255
|
|
$
|
7,308,539
|
|
|
The accompanying notes are an integral part of these Consolidated Financial Statements.
48
FIRST COMMONWEALTH FINANCIAL CORPORATION AND SUBSIDIARIES
CONSOLIDATED STATEMENTS OF INCOME
|
|
Years Ended December 31,
|
||||||||||
|
|
2018
|
2017
|
2016
|
||||||||
|
|
(dollars in thousands, except share data)
|
||||||||||
|
Interest Income
|
|||||||||||
|
Interest and fees on loans
|
$
|
257,316
|
|
$
|
218,530
|
|
$
|
185,344
|
|
||
|
Interest and dividends on investments:
|
|||||||||||
|
Taxable interest
|
31,264
|
|
28,608
|
|
27,919
|
|
|||||
|
Interest exempt from federal income taxes
|
1,646
|
|
1,622
|
|
1,498
|
|
|||||
|
Dividends
|
1,859
|
|
1,669
|
|
2,826
|
|
|||||
|
Interest on bank deposits
|
172
|
|
121
|
|
27
|
|
|||||
|
Total interest income
|
292,257
|
|
250,550
|
|
217,614
|
|
|||||
|
Interest Expense
|
|||||||||||
|
Interest on deposits
|
21,713
|
|
9,415
|
|
7,523
|
|
|||||
|
Interest on short-term borrowings
|
10,741
|
|
8,799
|
|
8,076
|
|
|||||
|
Interest on subordinated debentures
|
6,987
|
|
3,000
|
|
2,635
|
|
|||||
|
Interest on other long-term debt
|
300
|
|
323
|
|
345
|
|
|||||
|
Interest on capital lease obligation
|
294
|
|
233
|
|
—
|
|
|||||
|
Total interest expense
|
40,035
|
|
21,770
|
|
18,579
|
|
|||||
|
Net Interest Income
|
252,222
|
|
228,780
|
|
199,035
|
|
|||||
|
Provision for credit losses
|
12,531
|
|
5,087
|
|
18,480
|
|
|||||
|
Net Interest Income after Provision for Credit Losses
|
239,691
|
|
223,693
|
|
180,555
|
|
|||||
|
Noninterest Income
|
|||||||||||
|
Net securities gains
|
8,102
|
|
5,040
|
|
617
|
|
|||||
|
Trust income
|
7,901
|
|
7,098
|
|
5,366
|
|
|||||
|
Service charges on deposit accounts
|
18,175
|
|
18,579
|
|
15,869
|
|
|||||
|
Insurance and retail brokerage commissions
|
7,426
|
|
8,807
|
|
7,964
|
|
|||||
|
Income from bank owned life insurance
|
6,686
|
|
5,699
|
|
5,381
|
|
|||||
|
Gain on sale of mortgage loans
|
5,436
|
|
5,366
|
|
4,086
|
|
|||||
|
Gain on sale of other loans and assets
|
5,273
|
|
1,753
|
|
1,411
|
|
|||||
|
Card related interchange income
|
20,187
|
|
18,780
|
|
14,955
|
|
|||||
|
Derivative mark to market
|
787
|
|
(473
|
)
|
219
|
|
|||||
|
Swap fee income
|
1,874
|
|
2,005
|
|
2,359
|
|
|||||
|
Other income
|
6,790
|
|
7,677
|
|
6,372
|
|
|||||
|
Total noninterest income
|
88,637
|
|
80,331
|
|
64,599
|
|
|||||
|
Noninterest Expense
|
|||||||||||
|
Salaries and employee benefits
|
105,115
|
|
103,714
|
|
87,125
|
|
|||||
|
Net occupancy
|
17,219
|
|
15,648
|
|
13,150
|
|
|||||
|
Furniture and equipment
|
14,247
|
|
13,508
|
|
11,624
|
|
|||||
|
Data processing
|
10,470
|
|
9,090
|
|
7,429
|
|
|||||
|
Advertising and promotion
|
3,956
|
|
3,786
|
|
2,601
|
|
|||||
|
Pennsylvania shares tax
|
4,875
|
|
4,209
|
|
3,825
|
|
|||||
|
Intangible amortization
|
3,217
|
|
3,081
|
|
547
|
|
|||||
|
Collection and repossession
|
2,762
|
|
1,905
|
|
2,250
|
|
|||||
|
Other professional fees and services
|
4,473
|
|
4,761
|
|
3,915
|
|
|||||
|
FDIC insurance
|
2,007
|
|
3,210
|
|
3,903
|
|
|||||
|
Loss on sale or write-down of assets
|
1,080
|
|
1,834
|
|
1,155
|
|
|||||
|
Litigation and operational losses
|
1,162
|
|
2,050
|
|
1,420
|
|
|||||
|
Merger and acquisition related
|
1,637
|
|
10,213
|
|
3,173
|
|
|||||
|
Other operating expenses
|
23,336
|
|
23,289
|
|
17,808
|
|
|||||
|
Total noninterest expense
|
195,556
|
|
200,298
|
|
159,925
|
|
|||||
|
Income before income taxes
|
132,772
|
|
103,726
|
|
85,229
|
|
|||||
|
Income tax provision
|
25,274
|
|
48,561
|
|
25,639
|
|
|||||
|
Net Income
|
$
|
107,498
|
|
$
|
55,165
|
|
$
|
59,590
|
|
||
|
Average Shares Outstanding
|
99,036,163
|
|
95,220,056
|
|
88,851,573
|
|
|||||
|
Average Shares Outstanding Assuming Dilution
|
99,223,513
|
|
95,331,037
|
|
88,851,573
|
|
|||||
|
Per Share Data:
|
|||||||||||
|
Basic Earnings Per Share
|
$
|
1.09
|
|
$
|
0.58
|
|
$
|
0.67
|
|
||
|
Diluted Earnings Per Share
|
$
|
1.08
|
|
$
|
0.58
|
|
$
|
0.67
|
|
||
|
Cash Dividends Declared per Common Share
|
$
|
0.35
|
|
$
|
0.32
|
|
$
|
0.28
|
|
||
The accompanying notes are an integral part of these Consolidated Financial Statements.
49
FIRST COMMONWEALTH FINANCIAL CORPORATION AND SUBSIDIARIES
CONSOLIDATED STATEMENTS OF COMPREHENSIVE INCOME
|
|
Years Ended December 31,
|
||||||||||
|
|
2018
|
2017
|
2016
|
||||||||
|
|
(dollars in thousands)
|
||||||||||
|
Net Income
|
$
|
107,498
|
|
$
|
55,165
|
|
$
|
59,590
|
|
||
|
Other comprehensive (loss) income, before tax (benefit) expense:
|
|||||||||||
|
Unrealized holding gains (losses) on securities arising during the period
|
2,783
|
|
7,023
|
|
(6,304
|
)
|
|||||
|
Less: reclassification adjustment for gains on securities included in net income
|
(8,102
|
)
|
(5,040
|
)
|
(617
|
)
|
|||||
|
Unrealized gains (losses) on derivatives:
|
|||||||||||
|
Unrealized holding gains (losses) on derivatives arising during the period
|
326
|
|
(901
|
)
|
(479
|
)
|
|||||
|
Reclassification adjustment for losses on derivatives included in net income
|
10
|
|
119
|
|
(70
|
)
|
|||||
|
Unrealized gains for postretirement obligation:
|
|||||||||||
|
Net gain
|
144
|
|
94
|
|
331
|
|
|||||
|
Total other comprehensive (loss) income, before income tax (benefit) expense
|
(4,839
|
)
|
1,295
|
|
(7,139
|
)
|
|||||
|
Income tax (benefit) expense related to items of other comprehensive (loss) income
|
(1,015
|
)
|
441
|
|
(2,498
|
)
|
|||||
|
Comprehensive Income
|
$
|
103,674
|
|
$
|
56,019
|
|
$
|
54,949
|
|
||
The accompanying notes are an integral part of these Consolidated Financial Statements.
50
FIRST COMMONWEALTH FINANCIAL CORPORATION AND SUBSIDIARIES
CONSOLIDATED STATEMENTS OF CHANGES IN SHAREHOLDERS’ EQUITY
|
Shares
Outstanding
|
Common
Stock
|
Additional
Paid-in-
Capital
|
Retained
Earnings
|
Accumulated
Other
Comprehensive
Income (Loss),
net
|
Treasury
Stock
|
Total
Shareholders’
Equity
|
||||||||||||||||||||
|
|
(dollars in thousands, except per share data)
|
|||||||||||||||||||||||||
|
Balance at December 31, 2017
|
97,456,478
|
|
$
|
113,915
|
|
$
|
470,123
|
|
$
|
437,416
|
|
$
|
(6,173
|
)
|
$
|
(127,154
|
)
|
$
|
888,127
|
|
||||||
|
Cumulative effect of adoption of ASU 2018-02
|
1,344
|
|
(1,344
|
)
|
—
|
|
||||||||||||||||||||
|
January 1, 2018
|
97,456,478
|
|
$
|
113,915
|
|
$
|
470,123
|
|
$
|
438,760
|
|
$
|
(7,517
|
)
|
$
|
(127,154
|
)
|
$
|
888,127
|
|
||||||
|
Net income
|
107,498
|
|
107,498
|
|
||||||||||||||||||||||
|
Total other comprehensive loss
|
(3,824
|
)
|
(3,824
|
)
|
||||||||||||||||||||||
|
Cash dividends declared ($0.35 per share)
|
(34,849
|
)
|
(34,849
|
)
|
||||||||||||||||||||||
|
Treasury stock acquired
|
(1,920,544
|
)
|
(26,189
|
)
|
(26,189
|
)
|
||||||||||||||||||||
|
Treasury stock reissued
|
2,908,234
|
|
21,579
|
|
—
|
|
22,447
|
|
44,026
|
|
||||||||||||||||
|
Restricted stock
|
74,500
|
|
—
|
|
571
|
|
—
|
|
29
|
|
600
|
|
||||||||||||||
|
Balance at December 31, 2018
|
98,518,668
|
|
$
|
113,915
|
|
$
|
492,273
|
|
$
|
511,409
|
|
$
|
(11,341
|
)
|
$
|
(130,867
|
)
|
$
|
975,389
|
|
||||||
|
Shares
Outstanding
|
Common
Stock
|
Additional
Paid-in-
Capital
|
Retained
Earnings
|
Accumulated
Other
Comprehensive
Income (Loss),
net
|
Treasury
Stock
|
Total
Shareholders’
Equity
|
||||||||||||||||||||
|
|
(dollars in thousands, except per share data)
|
|||||||||||||||||||||||||
|
Balance at December 31, 2016
|
89,007,077
|
|
$
|
105,563
|
|
$
|
366,426
|
|
$
|
412,764
|
|
$
|
(7,027
|
)
|
$
|
(127,797
|
)
|
$
|
749,929
|
|
||||||
|
Net income
|
55,165
|
|
55,165
|
|
||||||||||||||||||||||
|
Total other comprehensive income
|
854
|
|
854
|
|
||||||||||||||||||||||
|
Cash dividends declared ($0.32 per share)
|
(30,513
|
)
|
(30,513
|
)
|
||||||||||||||||||||||
|
Treasury stock acquired
|
(104,257
|
)
|
(1,458
|
)
|
(1,458
|
)
|
||||||||||||||||||||
|
Treasury stock reissued
|
181,211
|
|
1,170
|
|
—
|
|
1,387
|
|
2,557
|
|
||||||||||||||||
|
Restricted stock
|
21,000
|
|
—
|
|
138
|
|
—
|
|
714
|
|
852
|
|
||||||||||||||
|
Common stock issued
|
8,351,447
|
|
8,352
|
|
102,389
|
|
|
|
110,741
|
|
||||||||||||||||
|
Balance at December 31, 2017
|
97,456,478
|
|
$
|
113,915
|
|
$
|
470,123
|
|
$
|
437,416
|
|
$
|
(6,173
|
)
|
$
|
(127,154
|
)
|
$
|
888,127
|
|
||||||
|
Shares
Outstanding
|
Common
Stock
|
Additional
Paid-in-
Capital
|
Retained
Earnings
|
Accumulated
Other
Comprehensive
Income (Loss),
net
|
Treasury
Stock
|
Total
Shareholders’
Equity
|
||||||||||||||||||||
|
|
(dollars in thousands, except per share data)
|
|||||||||||||||||||||||||
|
Balance at December 31, 2015
|
88,961,268
|
|
$
|
105,563
|
|
$
|
365,981
|
|
$
|
378,081
|
|
$
|
(2,386
|
)
|
$
|
(127,693
|
)
|
$
|
719,546
|
|
||||||
|
Net income
|
59,590
|
|
59,590
|
|
||||||||||||||||||||||
|
Total other comprehensive loss
|
(4,641
|
)
|
(4,641
|
)
|
||||||||||||||||||||||
|
Cash dividends declared ($0.28 per share)
|
(24,907
|
)
|
(24,907
|
)
|
||||||||||||||||||||||
|
Treasury stock acquired
|
(98,687
|
)
|
(864
|
)
|
(864
|
)
|
||||||||||||||||||||
|
Treasury stock reissued
|
23,148
|
|
39
|
|
—
|
|
177
|
|
216
|
|
||||||||||||||||
|
Restricted stock
|
121,348
|
|
—
|
|
406
|
|
—
|
|
583
|
|
989
|
|
||||||||||||||
|
Balance at December 31, 2016
|
89,007,077
|
|
$
|
105,563
|
|
$
|
366,426
|
|
$
|
412,764
|
|
$
|
(7,027
|
)
|
$
|
(127,797
|
)
|
$
|
749,929
|
|
||||||
The accompanying notes are an integral part of these Consolidated Financial Statements.
51
FIRST COMMONWEALTH FINANCIAL CORPORATION AND SUBSIDIARIES
CONSOLIDATED STATEMENTS OF CASH FLOWS
The accompanying notes are an integral part of these Consolidated Financial Statements.
|
|
Years Ended December 31,
|
||||||||||
|
|
2018
|
2017
|
2016
|
||||||||
|
(dollars in thousands)
|
|||||||||||
|
Operating Activities
|
|||||||||||
|
Net income
|
$
|
107,498
|
|
$
|
55,165
|
|
$
|
59,590
|
|
||
|
Adjustments to reconcile net income to net cash provided by operating activities:
|
|||||||||||
|
Provision for credit losses
|
12,531
|
|
5,087
|
|
18,480
|
|
|||||
|
Deferred tax expense
|
3,473
|
|
20,825
|
|
5,713
|
|
|||||
|
Depreciation and amortization
|
8,046
|
|
8,997
|
|
7,116
|
|
|||||
|
Net gains on securities and other assets
|
(21,540
|
)
|
(9,942
|
)
|
(5,257
|
)
|
|||||
|
Net amortization of premiums and discounts on securities
|
3,083
|
|
3,532
|
|
4,524
|
|
|||||
|
Income from increase in cash surrender value of bank owned life insurance
|
(5,808
|
)
|
(5,699
|
)
|
(5,325
|
)
|
|||||
|
Mortgage loans originated for sale
|
(165,898
|
)
|
(164,212
|
)
|
(133,278
|
)
|
|||||
|
Proceeds from sale of mortgage loans
|
177,287
|
|
163,125
|
|
136,037
|
|
|||||
|
Increase in interest receivable
|
(2,561
|
)
|
(1,314
|
)
|
(577
|
)
|
|||||
|
Increase (decrease) in interest payable
|
383
|
|
426
|
|
(272
|
)
|
|||||
|
(Increase) decrease in income taxes payable
|
(1,926
|
)
|
1,318
|
|
(589
|
)
|
|||||
|
Distribution from unconsolidated subsidiary
|
9,000
|
|
—
|
|
—
|
|
|||||
|
Other—net
|
11,695
|
|
10,997
|
|
3,111
|
|
|||||
|
Net cash provided by operating activities
|
135,263
|
|
88,305
|
|
89,273
|
|
|||||
|
Investing Activities
|
|||||||||||
|
Transactions with securities held to maturity:
|
|||||||||||
|
Proceeds from maturities and redemptions
|
47,614
|
|
51,239
|
|
54,057
|
|
|||||
|
Purchases
|
(20,650
|
)
|
(102,420
|
)
|
(45,188
|
)
|
|||||
|
Transactions with securities available for sale:
|
|||||||||||
|
Proceeds from sales
|
15,939
|
|
143,660
|
|
55,744
|
|
|||||
|
Proceeds from maturities and redemptions
|
140,707
|
|
148,561
|
|
168,237
|
|
|||||
|
Purchases
|
(331,969
|
)
|
(150,892
|
)
|
(128,916
|
)
|
|||||
|
Purchases of FHLB stock
|
(52,107
|
)
|
(45,301
|
)
|
(37,326
|
)
|
|||||
|
Proceeds from the redemption of FHLB stock
|
51,488
|
|
55,212
|
|
63,780
|
|
|||||
|
Proceeds from bank owned life insurance
|
2,140
|
|
898
|
|
467
|
|
|||||
|
Proceeds from the sale of loans
|
40,783
|
|
14,807
|
|
18,612
|
|
|||||
|
Proceeds from sales of other assets
|
4,477
|
|
5,568
|
|
7,765
|
|
|||||
|
Acquisition, net of cash acquired
|
705
|
|
3,188
|
|
479,469
|
|
|||||
|
Net increase in loans
|
(237,276
|
)
|
(165,726
|
)
|
(135,436
|
)
|
|||||
|
Purchases of premises and equipment
|
(9,599
|
)
|
(11,591
|
)
|
(7,491
|
)
|
|||||
|
Net cash (used in) provided by investing activities
|
(347,748
|
)
|
(52,797
|
)
|
493,774
|
|
|||||
|
Financing Activities
|
|||||||||||
|
Net increase (decrease) in federal funds purchased
|
11,000
|
|
—
|
|
(4,000
|
)
|
|||||
|
Net increase (decrease) in other short-term borrowings
|
3,357
|
|
(160,477
|
)
|
(638,882
|
)
|
|||||
|
Net increase in deposits
|
176,558
|
|
149,175
|
|
132,180
|
|
|||||
|
Repayments of other long-term debt
|
(23,598
|
)
|
(588
|
)
|
(565
|
)
|
|||||
|
Proceeds from issuance of long-term debt
|
98,026
|
|
—
|
|
—
|
|
|||||
|
Repayments of capital lease obligations
|
(373
|
)
|
(260
|
)
|
—
|
|
|||||
|
Dividends paid
|
(34,849
|
)
|
(30,513
|
)
|
(24,907
|
)
|
|||||
|
Proceeds from reissuance of treasury stock
|
208
|
|
228
|
|
216
|
|
|||||
|
Purchase of treasury stock
|
(26,189
|
)
|
(1,458
|
)
|
(864
|
)
|
|||||
|
Net cash provided by (used in) financing activities
|
204,140
|
|
(43,893
|
)
|
(536,822
|
)
|
|||||
|
Net decrease in cash and cash equivalents
|
(8,345
|
)
|
(8,385
|
)
|
46,225
|
|
|||||
|
Cash and cash equivalents at January 1
|
107,292
|
|
115,677
|
|
69,452
|
|
|||||
|
Cash and cash equivalents at December 31
|
$
|
98,947
|
|
$
|
107,292
|
|
$
|
115,677
|
|
||
52
NOTES TO THE CONSOLIDATED FINANCIAL STATEMENTS
Note 1—Statement of Accounting Policies
General
The following summary of accounting and reporting policies is presented to aid the reader in obtaining a better understanding of the consolidated financial statements of First Commonwealth Financial Corporation and its subsidiaries (“First Commonwealth”) contained in this report.
The financial information is presented in accordance with generally accepted accounting principles and general practice for financial institutions in the United States of America. In preparing financial statements, management is required to make estimates and assumptions that affect the reported amount of assets and liabilities and disclosure of contingent assets and liabilities at the date of the financial statements. In addition, these estimates and assumptions affect revenues and expenses in the financial statements and as such, actual results could differ from those estimates.
Through its subsidiaries, which include a commercial bank and an insurance agency, First Commonwealth provides a full range of loan, deposit, trust, insurance and personal financial planning services primarily to individuals and small to middle market businesses in
fifteen
counties in central and western Pennsylvania as well as in central and northern Ohio. First Commonwealth has determined that it has
one
business segment.
First Commonwealth is subject to regulations of certain state and federal agencies. These regulatory agencies periodically examine First Commonwealth for adherence to laws and regulations.
Basis of Presentation
The accompanying Consolidated Financial Statements include the accounts of First Commonwealth previously defined above. All material intercompany transactions have been eliminated in consolidation.
Equity investments of less than a majority but at least
20%
ownership are accounted for by the equity method and classified as “Other assets.” Earnings on these investments are reflected in “Other income” on the Consolidated Statements of Income, as appropriate, in the period earned.
Securities
Debt securities that First Commonwealth has the positive intent and ability to hold to maturity are classified as securities held to maturity and are reported at amortized cost adjusted for amortization of premium and accretion of discount on a level yield basis. Debt and equity securities that are bought and held principally for the purpose of selling them in the near term are to be classified as trading securities and reported at fair value, with unrealized gains and losses included in earnings. Debt securities not classified as either held-to-maturity securities or trading securities are classified as securities available for sale and are reported at fair value, with unrealized gains and losses that are not related to impairment excluded from earnings and reported as a component of other comprehensive income, which is included in shareholders’ equity, net of deferred taxes.
First Commonwealth has securities classified as held to maturity and available for sale and does not engage in trading activities. First Commonwealth utilizes the specific identification method to determine the net gain or loss on debt securities and the average cost method to determine the net gain or loss on the equity securities.
First Commonwealth conducts a comprehensive review of the investment portfolio on a quarterly basis to determine whether other-than-temporary impairment has occurred. Issuer-specific securities whose market values have fallen below their book values are initially selected for more in-depth analysis based on the percentage decline in value and duration of the decline. Issuer-specific securities include obligations of U.S. Government agencies and sponsored enterprises, single issue trust preferred securities, corporate debentures and obligations of states and political subdivisions. Further analysis of these securities includes a review of research reports, analysts’ recommendations, credit rating changes, news stories, annual reports, impact of interest rate changes and any other relevant information pertaining to the affected security. Declines in the fair value of individual securities below their cost that are not expected to be recovered will result in write-downs of the individual securities to their fair value. The related write-downs are included in earnings as impairment losses.
Mortgage Loans Held for Sale
Certain residential mortgage loans are originated for sale in the secondary mortgage loan market with the majority sold with servicing rights released. These loans are classified as loans held for sale and are carried at the lower of cost or estimated market value on an aggregate basis. Market value is determined on the basis of rates obtained in the respective secondary market for the type of loan held for sale. Loans are generally sold at a premium or discount from the carrying amount of the
53
loan. Such premium or discount is recognized at the date of sale. Gain or loss on the sale of loans is recorded in non-interest income at the time consideration is received and all other criteria for sales treatment have been met.
Loans
Loans are carried at the principal amount outstanding. Interest is accrued as earned. Loans held for sale are carried at the lower of cost or fair value determined on an individual basis.
First Commonwealth considers a loan to be past due and still accruing interest when payment of interest or principal is contractually past due but the loan is both well secured and in the process of collection. For installment, mortgage, term and other loans with amortizing payments that are scheduled monthly,
90 days
past due is reached when four monthly payments are due and unpaid. For demand, time and other multi-payment obligations with payments scheduled other than monthly, delinquency status is calculated using number of days instead of number of payments. Revolving credit loans, including personal credit lines and home equity lines, are considered to be
90 days
past due when the borrower has not made the minimum payment for four monthly cycles.
A loan is placed in nonaccrual status when, based on current information and events, it is probable that First Commonwealth will be unable to fully collect principal or interest due according to the contractual terms of the loan. A loan is also placed in nonaccrual status when, based on regulatory definitions, the loan is maintained on a “cash basis” due to the weakened financial condition of the borrower. When a determination is made to place a loan in nonaccrual status, all accrued and unpaid interest is reversed. Nonaccrual loans are restored to accrual status when, based on a sustained period of repayment by the borrower in accordance with the contractual terms of the loan, First Commonwealth expects repayment of the remaining contractual principal and interest or when the loan otherwise becomes well-secured and in the process of collection.
First Commonwealth considers a loan to be a troubled debt restructured loan when the loan terms have been renegotiated to provide a reduction or deferral of principal or interest as a result of the financial difficulties experienced by the borrower, who could not obtain comparable terms from alternate financing sources.
A loan is considered to be impaired when, based on current information and events, it is probable that First Commonwealth will be unable to collect principal or interest that is due in accordance with contractual terms of the loan. Impaired loans include nonaccrual loans and troubled debt restructured loans. Loan impairment is measured based on the present value of expected cash flows discounted at the loan’s effective interest rate or, as a practical expedient, at the loan’s observable market price or the fair value of the collateral if the loan is collateral dependent.
For loans other than those that First Commonwealth expects repayment through liquidation of the collateral, when the remaining recorded investment in the impaired loan is less than or equal to the present value of the expected cash flows, income is applied as a reduction to loan principal rather than interest income.
Loans deemed uncollectible are charged off through the allowance for credit losses. Factors considered in assessing ultimate collectability include past due status, financial condition of the borrower, collateral values and debt covenants including secondary sources of repayment by guarantors. Payments received on previously charged off loans are recorded as recoveries in the allowance for credit losses.
Acquired loans are recorded at estimated fair value on the date of acquisition with no carryover of the related allowance for credit losses. The fair value of acquired loans is determined by estimating the principal and interest cash flows expected to be collected on the loans and discounting those cash flows at a market rate of interest. The estimated fair value considers factors such as loan term, internal risk rating, delinquency status, prepayment rates, estimated value of the underlying collateral and the current interest rate environment.
Loan Fees
Loan origination and commitment fees, net of associated direct costs, are deferred and the net amount is amortized as an adjustment to the related loan yield on the interest method, generally over the contractual life of the related loans or commitments.
Other Real Estate Owned
Real estate, other than bank premises, is recorded at fair value less estimated selling costs at the time of acquisition. After that time, other real estate is carried at the lower of cost or fair value less estimated costs to sell. Fair value is determined based on an independent appraisal. Expenses related to holding the property and rental income earned on the property are generally reflected in earnings in the current period. Depreciation is not recorded on the other real estate owned properties.
54
Allowance for Credit Losses
First Commonwealth maintains an allowance for credit losses at a level deemed sufficient to absorb losses that are inherent in the loan portfolio. First Commonwealth’s management determines and reviews with the Board of Directors the adequacy of the allowance on a quarterly basis to ensure that the provision for credit losses has been charged against earnings in an amount necessary to maintain the allowance at a level that is appropriate based on management’s assessment of probable estimated losses. First Commonwealth’s methodology for assessing the appropriateness of the allowance for credit losses consists of several key elements. These elements include an assessment of individual problem loans, delinquency and loss experience trends and other relevant factors, all of which may be susceptible to significant changes.
The major loan classifications used in the allowance for credit losses calculation include pass, other assets especially mentioned (“OAEM”), substandard and doubtful. Additional information related to these credit quality categories is provided in Note 11, "Loans and Allowance for Credit Losses."
First Commonwealth consistently applies the following comprehensive methodology and procedure for determining the allowance for credit losses.
All impaired credits in excess of
$100 thousand
are individually reviewed quarterly. A specific reserve is established for impaired loans in an amount equal to the total amount of probable unconfirmed losses for the impaired loans that are reviewed. Based on this reserve as a percentage of reviewed loan balances, a reserve is also established for the impaired loan balances that are not individually reviewed.
The allowance calculation uses net historical charge-off trends to estimate probable unconfirmed losses for each loan category. A multiplier known as the emergence factor is applied to the historical loss rates for non-criticized loans. The emergence factor is calculated by loan category and represents the average time period from when a loss is incurred until the bank experiences a charge-off against the loan. Before applying the adjusted historical loss experience percentages, loan balances are reduced by the portion of the loan balances which are subject to guarantee by a government agency.
An additional component of the allowance is determined by management based on a qualitative analysis of certain factors related to portfolio risks and economic conditions. Factors considered by management include employment trends, macroeconomic trends, commercial real estate trends, lending practices, ability and experience of the credit staff, the overall lending environment and external factors such as the regulatory environment and competition. Portfolio risks include unusual changes or recent trends in specific portfolios such as unexpected changes in the trends or levels of delinquency. No matter how detailed an analysis of potential credit losses is performed, these estimates are inherently imprecise. Management must make estimates using assumptions and information that is often subjective and changes rapidly.
Loans acquired with evidence of credit deterioration were evaluated and not considered to be significant. The premium or discount estimated through the loan fair value calculation is recognized in interest income on a level yield or straight-line basis over the remaining contractual life of the loans. Additional credit deterioration on acquired loans, in excess of the original credit discount embedded in the fair value determination on the date of acquisition, will be recognized in the allowance for credit losses through the provision for loan losses.
Allowance for Off-Balance Sheet Credit Exposures
First Commonwealth maintains an allowance for off-balance sheet credit exposure at a level deemed sufficient to absorb losses that are inherent to off-balance sheet credit risk. Off-balance sheet credit exposure includes commitments to extend credit, standby letters of credit and commercial letters of credit. Management determines the adequacy of the allowance on a quarterly basis, charging the provision against earnings in an amount necessary to maintain the allowance at a level that is appropriate based on management’s assessment of probable estimated losses. The Company’s methodology for assessing the appropriateness of the allowance for off-balance sheet credit exposure consists of analysis of historical usage trends as well as loss history and probability of default rates related to the off-balance sheet category. The calculation begins with historical usage trends related to lines of credit as well as letters of credit and then utilizes those figures to determine the probable usage of available lines. These values are then adjusted by a determined probability of default as well as a loss given default. This amount is adjusted quarterly and reported as part of other operating expenses on the Consolidated Statements of Income.
55
Bank Owned Life Insurance
First Commonwealth and the banks that First Commonwealth has acquired have purchased insurance on the lives of certain groups of employees. The policies accumulate asset values to meet future liabilities, including the payment of employee benefits such as health care. Increases in the cash surrender value are recorded as non-interest income in the Consolidated Statements of Income. Under some of these policies, the beneficiaries receive a portion of the death benefit. The net present value of the future death benefits scheduled to be paid to the beneficiaries was
$3.8 million
and
$3.9 million
as of
December 31, 2018
and
2017
, respectively, and is reflected in "Other Liabilities" on the Consolidated Statements of Financial Condition.
Premises and Equipment
Premises and equipment are carried at cost less accumulated depreciation on First Commonwealth’s Consolidated Statements of Financial Condition. Depreciation is computed on the straight-line and accelerated methods over the estimated useful life of the asset. A straight-line depreciation method was used for substantially all furniture and equipment. The straight-line depreciation method was used for buildings and improvements. Charges for maintenance and repairs are expensed as incurred. Leasehold improvements are expensed over the term of the lease or the estimated useful life of the improvement, whichever is shorter.
Software costs are amortized on a straight-line basis over a period not to exceed
seven
years.
Business Combinations
Business combinations are accounted for by using the acquisition method of accounting. Under the acquisition method, identifiable assets acquired and liabilities assumed at the acquisition date are measured at their fair values as of that date, and are recognized separately from goodwill. The difference between the purchase price and the fair value of the net assets acquired is recorded as goodwill. Results of operations of the acquired entities are included in the consolidated statement of income from the date of acquisition. Acquisition costs are expensed when incurred.
Goodwill
Intangible assets resulting from acquisitions under the purchase method of accounting consist of goodwill and other intangible assets (see “Other Intangible Assets” section below). Goodwill is not amortized and is subject to at least annual assessments for impairment by applying a fair value based test. First Commonwealth reviews goodwill annually and again at any quarter-end if a material event occurs during the quarter that may affect goodwill. If goodwill testing is required, an assessment of qualitative factors can be completed before performing the two step goodwill impairment test. If an assessment of qualitative factors determines it is more likely than not that the fair value of a reporting unit exceeds its carrying amount, then the two step goodwill impairment test is not required. Goodwill is evaluated for potential impairment by determining if our fair value has fallen below carrying value.
Other Intangible Assets
Other intangible assets consist of core deposits and customer lists obtained through acquisitions. Core deposit intangibles are amortized over their estimated lives using the present value of the benefit of the core deposits and straight-line methods of amortization. Customer list intangibles are amortized over the expected lives using expected cash flows based on retention of the customer base. These intangibles are evaluated for impairment on an annual basis and when events or changes in circumstances indicate that the carrying amount may not be recoverable.
Accounting for the Impairment of Long-Lived Assets
First Commonwealth reviews long-lived assets, such as premises and equipment and intangibles, for impairment whenever events or changes in circumstances indicate that the carrying amount of an asset may not be recoverable. These changes in circumstances may include a significant decrease in the market value of an asset or the extent or manner in which an asset is used. If there is an indication that the carrying amount of an asset may not be recoverable, future undiscounted cash flows expected to result from the use of the asset are estimated. If the sum of the expected cash flows is less than the carrying value of the asset, a loss is recognized for the difference between the carrying value and fair value of the asset. Long-lived assets classified as held for sale are measured at the lower of their carrying amount or fair value less cost to sell. Depreciation or amortization is discontinued on long-lived assets classified as held for sale.
56
Income Taxes
First Commonwealth records taxes in accordance with the asset and liability method of FASB ASC Topic 740, “Income Taxes,” whereby deferred tax assets and liabilities are recognized for the future tax consequences attributable to differences between the financial statement carrying amount of existing assets and liabilities and their respective tax bases given the provisions of the enacted tax laws. Deferred tax assets are reduced, if necessary, by the amount of such benefits that are more likely than not expected to be realized based upon available evidence. In accordance with FASB ASC Topic 740, interest or penalties incurred for taxes will be recorded as a component of noninterest expense.
Comprehensive Income Disclosures
“Other Comprehensive Income” (comprehensive income, excluding net income) includes the after-tax effect of changes in unrealized holding gains and losses on available-for-sale securities, changes in the funded status of defined benefit postretirement plans and changes in the fair value of the effective portion of cash flow hedges. Comprehensive income is reported in the accompanying Consolidated Statements of Comprehensive Income, net of tax.
Cash and Cash Equivalents
For purposes of reporting cash flows, cash and cash equivalents include cash on hand, amounts due from banks, federal funds sold and interest-bearing bank deposits. Generally, federal funds are sold for one-day periods.
Derivatives and Hedging Activities
First Commonwealth accounts for derivative instruments and hedging activities in accordance with FASB ASC Topic 815, “Derivatives and Hedging.” All derivatives are evaluated at inception as to whether or not they are hedging or non-hedging activities, and appropriate documentation is maintained to support the final determination. First Commonwealth recognizes all derivatives as either assets or liabilities on the Consolidated Statements of Financial Condition and measures those instruments at fair value. For derivatives designated as fair value hedges, changes in the fair value of the derivative and the hedged item related to the hedged risk are recognized in earnings. Any hedge ineffectiveness would be recognized in the income statement line item pertaining to the hedged item. For derivatives designated as cash flow hedges, changes in fair value of the effective portion of the cash flow hedges are reported in OCI. When the cash flows associated with the hedged item are realized, the gain or loss included in OCI is recognized in the Consolidated Statement of Income.
When First Commonwealth purchases a portion of a commercial loan that has an existing interest rate swap, it enters a Risk Participation Agreement with the counterparty and assumes the credit risk of the loan customer related to the swap. Any fee paid to First Commonwealth as a result of the risk participation agreement is offset by credit risk of the counterparties and is recognized in the income statement. Credit risk on the risk participation agreements is determined after considering the risk rating, probability of default and loss given default of the counterparties.
Management periodically reviews contracts from various functional areas of First Commonwealth to identify potential derivatives embedded within selected contracts. As of
December 31, 2018
, First Commonwealth has interest rate derivative positions that are designated as hedging instruments and others that are not designated as hedging instruments. See Note 8, “Derivatives,” for a description of these instruments.
Earnings Per Common Share
Basic earnings per share excludes dilution and is computed by dividing income available to common shareholders by the weighted-average number of common shares outstanding for the period.
Diluted earnings per share reflects the potential dilution that could occur if securities or other contracts to issue common stock were exercised or converted into common stock or resulted in the issuance of common stock that then shared in the earnings of the entity. For all periods presented, the dilutive effect on average shares outstanding is the result of unvested restricted stock grants.
Fair Value Measurements
In accordance with FASB ASC Topic 820, “Fair Value Measurements and Disclosures,” First Commonwealth groups financial assets and financial liabilities measured at fair value into three levels, based on the markets in which the assets and liabilities are traded and the reliability of the assumptions used to determine fair value. These levels are:
|
•
|
Level 1—Valuations for assets and liabilities traded in active exchange markets, such as the New York Stock Exchange. Valuations are obtained from readily available pricing sources for market transactions involving identical assets or liabilities.
|
57
|
•
|
Level 2—Valuations for assets and liabilities traded in less active dealer or broker markets. Valuations are obtained for identical or comparable assets or liabilities from alternative pricing sources with reasonable levels of price transparency. Level 2 securities include U.S. Government securities issued by Agencies and Sponsored Enterprises, Obligations of States and Political Subdivisions, certain corporate securities, FHLB stock, loans held for sale, interest rate derivatives that include interest rate swaps, risk participation agreements and foreign currency contracts, certain other real estate owned and certain impaired loans.
|
|
•
|
Level 3—Valuations for assets and liabilities that are derived from other valuation methodologies, including option pricing models, discounted cash flow models and similar techniques, and not based on market exchange, dealer or broker traded transactions. If the inputs used to provide the evaluation are unobservable and/or there is very little, if any, market activity for the security or similar securities, the securities would be considered Level 3 securities. Level 3 valuations incorporate certain assumptions and projections in determining the fair value assigned to such assets or liabilities. The assets included in Level 3 are pooled trust preferred collateralized debt obligations, nonmarketable equity investments, certain other real estate owned and certain impaired loans.
|
In general, fair values of financial instruments are based upon quoted market prices, where available. If such quoted market prices are not available, fair value is based upon pricing models that primarily use, as inputs, observable market-based parameters. Valuation adjustments may be made to ensure that financial instruments are recorded at fair value. These adjustments may include amounts to reflect counterparty credit quality and our creditworthiness, among other things, as well as unobservable parameters. Any such valuation adjustments are applied consistently over time. See Note 19 “Fair Values of Assets and Liabilities” for additional information.
Revenue from Contracts with Customers
First Commonwealth records revenue from contracts with customers in accordance with ASC Topic 606, “Revenue from Contracts with Customers” (“Topic 606”). Under Topic 606, the Company must identify the contract with a customer, identify the performance obligations in the contract, determine the transaction price, allocate the transaction price to the performance obligations in the contract, and recognize revenue when (or as) the Company satisfies a performance obligation.
A significant component of the Company's revenue, net interest earned on financial assets and liabilities, is excluded from the scope of Topic 606. First Commonwealth generally fully satisfies its performance obligations on its contracts with customers as services are rendered and the transaction prices are typically fixed; charged either on a periodic basis or based on activity. Because performance obligations are satisfied as services are rendered and the transaction prices are fixed, the Company has made no significant judgments in applying the revenue guidance prescribed in ASC 606 that affect the determination of the amount and timing of revenue from contracts with customers.
Note 2—New Accounting Pronouncements
In February 2016, the FASB issued ASU No. 2016-02, "Leases (Topic 842)," in order to increase transparency and comparability among organizations by recognizing lease assets and lease liabilities on the balance sheet and disclosing key information about leasing arrangements. Additionally, the FASB issued ASU No. 2018-01, "Leases (Topic 842)" in January 2018, ASU No. 2018-11, "Leases - Targeted Improvements" in July 2018 and ASU 2018-20, "Leases - Narrow-Scope Improvements for Lessors" in December 2018. These ASU's provide certain improvements and optional practical expedients to Topic 842. Under this new guidance, all entities will classify leases to determine how to recognize lease-related revenue and expense. Quantitative and qualitative disclosures will be required by lessees and lessors to meet the objective of enabling users of financial statements to assess the amount, timing, and uncertainty of cash flows arising from leases. The intention is to require enough information to supplement the amounts recorded in the financial statements so that users can understand more about the nature of an entity’s leasing activities. This ASU is effective for fiscal years, and interim periods within those fiscal years, beginning after December 15, 2018. First Commonwealth has elected the transition option provided in ASU No. 2018-11, which provides for the modified retrospective approach to be applied on January 1, 2019. Upon adoption of this standard on January 1, 2019, we expect to recognize right-of-use assets and related lease liabilities totaling $38.8 million and $42.1 million, respectively. Additionally, during the first quarter of 2019, we expect to recognize an additional right-of-use asset and related lease liability totaling approximately $10.0 million in connection with the relocation of leased space that includes a corporate loan production office and some administrative offices. We have elected to apply certain practical expedients provided under the standard including (i) to not apply the requirements in the new standard to short-term leases (ii) to not reassess the lease classification for any expired or existing lease (iii) to account for lease and non-lease components separately (iv) to not reassess initial direct costs for any existing leases. On the date of adoption, this ASU will result in an 8 basis point decrease in the Company's tier 1 capital to risk weighted asset ratio. The initial impact of this standard primarily relates to operating leases of certain real estate properties. First Commonwealth has no material leasing arrangements for which it is the lessor of property or equipment.
58
In June 2016, the FASB issued ASU No. 2016-13, “Financial Instruments – Credit Losses (Topic 326), Measurement of Credit Losses on Financial Instruments,” which amends the guidance for recognizing credit losses from an “incurred loss” methodology that delays recognition of credit losses until it is probable a loss has been incurred to an expected credit loss methodology. The Current Expected Credit Loss ("CECL") methodology requires the use of the modified retrospective transition method by means of a cumulative-effect adjustment to equity as of the beginning of the period in which the guidance is adopted. The standard is effective for the Company as of January 1, 2020. We have established a CECL implementation team, which includes members from the finance and credit areas, with oversight by the Chief Executive Officer, Chief Financial Officer and Chief Credit Officer. During the third quarter of 2018, Management completed the implementation of a third party software to assist with this ASU. During the fourth quarter of 2018, Management engaged a third party to assist with evaluation of data and methodologies related to this standard. Management is currently evaluating the impact of the amended guidance on First Commonwealth’s financial condition or results of operations.
In January 2017, the FASB issued ASU No. 2017-04, "Intangibles-Goodwill and Other (Topic 350), Simplifying the Test for Goodwill Impairment" which simplifies the subsequent measurement of goodwill by eliminating Step 2 from the goodwill impairment test. Under this ASU, an entity should perform its annual, or interim, goodwill impairment test by comparing the fair value of a reporting unit with its carrying amount. Impairment should be recognized for the amount by which the carrying amount exceeds the reporting unit's fair value; however, the loss recognized should not exceed the total amount of goodwill allocated to the reporting unit. Income tax effects from any tax deductible goodwill should be taken into consideration of the carrying amount of the reporting unit when measuring for goodwill impairment, if applicable. An entity still has the option to perform the qualitative assessment for the reporting unit to determine if the quantitative impairment test is necessary. This standard is effective for interim and annual periods for fiscal years beginning after December 15, 2019. The adoption of this ASU is not expected to have a material impact on First Commonwealth’s financial condition or results of operations.
In August 2017, the FASB issued ASU No. 2017-12, "Derivatives and Hedging (Topic 815), Targeted Improvements to Accounting for Hedging Activities" with the objective of improving the financial reporting of hedging relationships to better portray the economic results of risk management activities in its financial statements. The main provisions of this ASU update the hedge accounting model to expand the ability to hedge risk, reduce complexity, and ease certain documentation and assessment requirements. It also eliminates the requirement to separately measure and report hedge ineffectiveness, and generally requires the change in fair value of a hedging instrument to be presented in the same income statement line as the hedged item. The standard is effective for fiscal years beginning after December 15, 2018, including interim periods within that fiscal year. Adoption of this ASU is not expected to have a material impact on First Commonwealth’s financial condition or results of operations.
In February 2018, the FASB issued ASU No. 2018-02, "Income Statement - Reporting Comprehensive Income (Topic 22)" allowing a reclassification from accumulated other comprehensive income to retained earnings for the stranded tax effects resulting from the Tax Cuts and Jobs Act. This amendment also requires certain disclosures about the stranded tax effects, including disclosure of the policy for releasing income tax effects from accumulated other comprehensive income and the impact if the entity elected to reclassify the income tax effects or, if the entity did not elect to reclassify, a statement that the entity did not elect to reclassify. This ASU is effective for fiscal years, and interim periods within those fiscal years, beginning after December 15, 2018. The Company adopted this ASU as of January 1, 2018, electing to reclass the stranded tax effects resulting from the Tax Cut and Jobs Act from accumulated other comprehensive income to retained earnings. Adoption of this ASU did not have a material impact on First Commonwealth's financial condition or results of operations.
In August 2018, the FASB issued ASU No. 2018-13, "Disclosure Framework - Changes to the Disclosure Requirements for Fair Value Measurement." This ASU updates disclosure requirements for fair value measurements, including elimination of the disclosure related to the amount and reason for transfers between Level 1 and Level 2 of the fair value hierarchy. ASU No. 2018-13 is effective for interim and annual reporting periods beginning after December 15, 2019. Adoption of this ASU will not have a material impact on First Commonwealth's financial condition or results of operations, as it relates only to disclosure requirements.
Note 3—Acquisition
Garfield Acquisition Corporation
On May 1, 2018, the Company completed its acquisition of Garfield Acquisition Corporation ("Garfield") and its banking subsidiary, Foundation Bank, for consideration of
$17.4 million
in cash and
2.7 million
shares of the Company's common stock. Through the acquisition, the Company obtained
five
full-service banking offices which are operating under the First Commonwealth name. This acquisition expands the Company's presence into the Cincinnati, Ohio market and added
$184.5 million
in loans and
$141.3 million
in deposits to the Company's balance sheet.
59
The table below summarizes the net assets acquired (at fair value) and consideration transferred in connection with the Garfield acquisition (dollars in thousands):
|
Consideration Paid
|
|||||||
|
Cash paid to shareholders
|
$
|
17,400
|
|
||||
|
Shares issued to shareholders (2,745,098 shares)
|
41,561
|
|
|||||
|
Total consideration paid
|
$
|
58,961
|
|
||||
|
Fair Value of Assets Acquired
|
|||||||
|
Cash and cash equivalents
|
18,105
|
|
|||||
|
FHLB Stock
|
3,261
|
|
|||||
|
Loans
|
184,506
|
|
|||||
|
Premises and other equipment
|
409
|
|
|||||
|
Core deposit intangible
|
1,248
|
|
|||||
|
Other assets
|
1,747
|
|
|||||
|
Total assets acquired
|
209,276
|
|
|||||
|
Fair Value of Liabilities Assumed
|
|||||||
|
Deposits
|
141,281
|
|
|||||
|
Federal Home Loan Bank borrowings
|
22,988
|
|
|||||
|
Other liabilities
|
5,068
|
|
|||||
|
Total liabilities assumed
|
169,337
|
|
|||||
|
Total Fair Value of Identifiable Net Assets
|
39,939
|
|
|||||
|
Goodwill
|
$
|
19,022
|
|
||||
The goodwill of
$19.0 million
arising from the acquisition represents the value of synergies and economies of scale expected from combining the operations of the Company with Garfield Acquisition Corporation.
The Company determined that this acquisition constitutes a business combination as defined in FASB ASC Topic 805, “Business Combinations.” Accordingly, as of the date of the acquisition, the Company recorded the assets acquired and liabilities assumed at fair value. The Company determined fair values in accordance with the guidance provided in FASB ASC Topic 820, “Fair Value Measurements and Disclosures.” Acquired loans were recorded at fair value with no carryover of the related allowance for loan losses. Fair value is established by discounting the expected future cash flows with a market discount rate for like maturities and risk instruments. At the date of acquisition, none of the loans were accounted for under the guidance of ASC Topic 310-30, “Receivables-Loans and Debt Securities Acquired with Deteriorated Credit Quality.” The
$184.5 million
fair value of acquired loans is the result of
$183.7 million
in net loans acquired from Garfield, the recognition of a net combined yield and credit mark adjustment of
$4.3 million
and the
$5.1 million
reversal of Garfield's allowance as well as prior fair value marks recorded by Garfield.
The fair value of the
2,745,098
common shares issued was determined based on the market price of the Company's common shares on the acquisition date.
Costs related to the acquisition totaled
$1.6 million
. These amounts were expensed as incurred and are recorded as a merger and acquisition related expense in the Condensed Consolidated Statements of Income.
As a result of the full integration of the operations of Garfield, it is not practicable to determine revenue or net income included in the Company's operating results relating to Garfield since the date of acquisition as Garfield’s results cannot be separately identified.
DCB Financial Corporation
On April 3, 2017, the Company completed its acquisition of DCB Financial Corporation ("DCB") and its banking subsidiary, The Delaware County Bank and Trust Company, for consideration of
$21.2 million
in cash and
8.4 million
shares of the Company's common stock. Through the acquisition, the Company obtained
nine
full-service banking offices and
four
limited
60
service locations which are operating under the First Commonwealth name. This acquisition expands the Company's presence in the central Ohio market and added
$383.1 million
in loans and
$484.4 million
in deposits to the Company's balance sheet.
The table below summarizes the net assets acquired (at fair value) and consideration transferred in connection with the DCB Financial acquisition (dollars in thousands):
|
Consideration Received
|
|||||||
|
Cash paid to shareholders
|
$
|
21,232
|
|
||||
|
Shares issued to shareholders (8,356,882 shares)
|
110,812
|
|
|||||
|
Total consideration paid
|
$
|
132,044
|
|
||||
|
Fair Value of Assets Acquired
|
|||||||
|
Cash and cash equivalents
|
24,420
|
|
|||||
|
Investment Securities
|
88,986
|
|
|||||
|
FHLB Stock
|
3,250
|
|
|||||
|
Loans
|
383,083
|
|
|||||
|
Premises and other equipment
|
12,113
|
|
|||||
|
Core deposit intangible
|
5,998
|
|
|||||
|
Other real estate
|
68
|
|
|||||
|
Bank owned life insurance
|
20,522
|
|
|||||
|
Other assets
|
16,450
|
|
|||||
|
Total assets acquired
|
554,890
|
|
|||||
|
Fair Value of Liabilities Assumed
|
|||||||
|
Deposits
|
484,366
|
|
|||||
|
Capital lease obligation
|
7,851
|
|
|||||
|
Other liabilities
|
1,182
|
|
|||||
|
Total liabilities assumed
|
493,399
|
|
|||||
|
Total Fair Value of Identifiable Net Assets
|
61,491
|
|
|||||
|
Goodwill
|
$
|
70,553
|
|
||||
The goodwill of
$70.6 million
arising from the acquisition represents the value of synergies and economies of scale expected from combining the operations of the Company with DCB Financial Corporation.
The Company determined that this acquisition constitutes a business combination as defined in FASB ASC Topic 805, “Business Combinations.” Accordingly, as of the date of the acquisition, the Company recorded the assets acquired and liabilities assumed at fair value. The Company determined fair values in accordance with the guidance provided in FASB ASC Topic 820, “Fair Value Measurements and Disclosures.” Acquired loans were recorded at fair value with no carryover of the related allowance for loan losses. Fair value is established by discounting the expected future cash flows with a market discount rate for like maturities and risk instruments. At the date of acquisition, none of the loans were accounted for under the guidance of ASC Topic 310-30, “Receivables-Loans and Debt Securities Acquired with Deteriorated Credit Quality.” We acquired
$390.8 million
in total loans and recognized a net combined yield and credit market adjustment of
$7.7 million
.
The fair value of the
8,356,882
common shares issued was determined based on the market price of the Company's common shares on the acquisition date.
Costs related to the acquisition totaled
$10.2 million
. These amounts were expensed as incurred and are recorded as a merger and acquisition related expense in the Consolidated Statements of Income.
As a result of the full integration of the operations of DCB, it is not practicable to determine revenue or net income included in the Company's operating results relating to DCB since the date of acquisition as DCB’s results cannot be separately identified.
61
Note 4—Supplemental Comprehensive Income Disclosures
The following table identifies the related tax effects allocated to each component of other comprehensive income in the Consolidated Statements of Comprehensive Income as of
December 31
. Reclassification adjustments related to securities available for sale are included in the
“
Net securities gains
”
line in the Consolidated Statements of Income and reclassification adjustments related to losses on derivatives are included in the "Other operating expenses" line in the Consolidated Statements of Income.
|
2018
|
2017
|
2016
|
|||||||||||||||||||||||||||||||||
|
Pretax Amount
|
Tax (Expense) Benefit
|
Net of Tax Amount
|
Pretax Amount
|
Tax (Expense) Benefit
|
Net of Tax Amount
|
Pretax Amount
|
Tax (Expense) Benefit
|
Net of Tax Amount
|
|||||||||||||||||||||||||||
|
(dollars in thousands)
|
|||||||||||||||||||||||||||||||||||
|
Unrealized gains (losses) on securities:
|
|||||||||||||||||||||||||||||||||||
|
Unrealized holding gains (losses) on securities arising during the period
|
$
|
2,783
|
|
$
|
(585
|
)
|
$
|
2,198
|
|
$
|
7,023
|
|
$
|
(2,458
|
)
|
$
|
4,565
|
|
$
|
(6,304
|
)
|
$
|
2,206
|
|
$
|
(4,098
|
)
|
||||||||
|
Reclassification adjustment for gains on securities included in net income
|
(8,102
|
)
|
1,701
|
|
(6,401
|
)
|
(5,040
|
)
|
1,764
|
|
(3,276
|
)
|
(617
|
)
|
216
|
|
(401
|
)
|
|||||||||||||||||
|
Total unrealized (losses) gains on securities
|
(5,319
|
)
|
1,116
|
|
(4,203
|
)
|
1,983
|
|
(694
|
)
|
1,289
|
|
(6,921
|
)
|
2,422
|
|
(4,499
|
)
|
|||||||||||||||||
|
Unrealized gains (losses) on derivatives:
|
|||||||||||||||||||||||||||||||||||
|
Unrealized holding gains (losses) on derivatives arising during the period
|
326
|
|
(68
|
)
|
258
|
|
(901
|
)
|
315
|
|
(586
|
)
|
(479
|
)
|
168
|
|
(311
|
)
|
|||||||||||||||||
|
Reclassification adjustment for losses (gains) on derivatives included in net income
|
10
|
|
(3
|
)
|
7
|
|
119
|
|
(42
|
)
|
77
|
|
(70
|
)
|
24
|
|
(46
|
)
|
|||||||||||||||||
|
Total unrealized gains (losses) on derivatives
|
336
|
|
(71
|
)
|
265
|
|
(782
|
)
|
273
|
|
(509
|
)
|
(549
|
)
|
192
|
|
(357
|
)
|
|||||||||||||||||
|
Unrealized gains for postretirement obligations:
|
|||||||||||||||||||||||||||||||||||
|
Net gain
|
144
|
|
(30
|
)
|
114
|
|
94
|
|
(20
|
)
|
74
|
|
331
|
|
(116
|
)
|
215
|
|
|||||||||||||||||
|
Total unrealized gains for postretirement obligations
|
144
|
|
(30
|
)
|
114
|
|
94
|
|
(20
|
)
|
74
|
|
331
|
|
(116
|
)
|
215
|
|
|||||||||||||||||
|
Total other comprehensive (loss) income
|
$
|
(4,839
|
)
|
$
|
1,015
|
|
$
|
(3,824
|
)
|
$
|
1,295
|
|
$
|
(441
|
)
|
$
|
854
|
|
$
|
(7,139
|
)
|
$
|
2,498
|
|
$
|
(4,641
|
)
|
||||||||
62
The following table details the change in components of OCI for the year-ended December 31:
|
2018
|
|||||||||||||||
|
|
Securities Available for Sale
|
Derivatives
|
Post-Retirement Obligation
|
Accumulated Other Comprehensive Income
|
|||||||||||
|
|
(dollars in thousands)
|
||||||||||||||
|
Balance at December 31
|
$
|
(6,166
|
)
|
$
|
(306
|
)
|
$
|
299
|
|
$
|
(6,173
|
)
|
|||
|
Cumulative effect of adoption of ASU 2018-02
|
(1,328
|
)
|
(64
|
)
|
48
|
|
(1,344
|
)
|
|||||||
|
Balance at January 1
|
(7,494
|
)
|
(370
|
)
|
347
|
|
(7,517
|
)
|
|||||||
|
Other comprehensive income before reclassification adjustment
|
2,198
|
|
258
|
|
2,456
|
|
|||||||||
|
Amounts reclassified from accumulated other comprehensive income (loss)
|
(6,401
|
)
|
7
|
|
(6,394
|
)
|
|||||||||
|
Net gain
|
114
|
|
114
|
|
|||||||||||
|
Net other comprehensive loss during the period
|
(4,203
|
)
|
265
|
|
114
|
|
(3,824
|
)
|
|||||||
|
Balance at December 31
|
$
|
(11,697
|
)
|
$
|
(105
|
)
|
$
|
461
|
|
$
|
(11,341
|
)
|
|||
|
2017
|
|||||||||||||||
|
Securities Available for Sale
|
Derivatives
|
Post-Retirement Obligation
|
Accumulated Other Comprehensive Income
|
||||||||||||
|
(dollars in thousands)
|
|||||||||||||||
|
Balance at January 1
|
$
|
(7,455
|
)
|
$
|
203
|
|
$
|
225
|
|
$
|
(7,027
|
)
|
|||
|
Other comprehensive income before reclassification adjustment
|
4,565
|
|
(586
|
)
|
3,979
|
|
|||||||||
|
Amounts reclassified from accumulated other comprehensive income (loss)
|
(3,276
|
)
|
77
|
|
(3,199
|
)
|
|||||||||
|
Net gain
|
74
|
|
74
|
|
|||||||||||
|
Net other comprehensive income during the period
|
1,289
|
|
(509
|
)
|
74
|
|
854
|
|
|||||||
|
Balance at December 31
|
$
|
(6,166
|
)
|
$
|
(306
|
)
|
$
|
299
|
|
$
|
(6,173
|
)
|
|||
|
2016
|
|||||||||||||||
|
Securities Available for Sale
|
Derivatives
|
Post-Retirement Obligation
|
Accumulated Other Comprehensive Income
|
||||||||||||
|
(dollars in thousands)
|
|||||||||||||||
|
Balance at January 1
|
$
|
(2,956
|
)
|
$
|
560
|
|
$
|
10
|
|
$
|
(2,386
|
)
|
|||
|
Other comprehensive income before reclassification adjustment
|
(4,098
|
)
|
(311
|
)
|
(4,409
|
)
|
|||||||||
|
Amounts reclassified from accumulated other comprehensive income (loss)
|
(401
|
)
|
(46
|
)
|
(447
|
)
|
|||||||||
|
Net gain
|
215
|
|
215
|
|
|||||||||||
|
Net other comprehensive income during the period
|
(4,499
|
)
|
(357
|
)
|
215
|
|
(4,641
|
)
|
|||||||
|
Balance at December 31
|
$
|
(7,455
|
)
|
$
|
203
|
|
$
|
225
|
|
$
|
(7,027
|
)
|
|||
63
Note 5—Supplemental Cash Flow Disclosures
The following table presents information related to cash paid during the year for interest and income taxes as well as detail on non-cash investing and financing activities for the years ended
December 31
:
|
2018
|
2017
|
2016
|
|||||||||
|
(dollars in thousands)
|
|||||||||||
|
Cash paid during the period for:
|
|||||||||||
|
Interest
|
$
|
40,071
|
|
$
|
21,552
|
|
$
|
19,208
|
|
||
|
Income taxes
|
23,826
|
|
27,902
|
|
19,950
|
|
|||||
|
Non-cash investing and financing activities:
|
|||||||||||
|
Loans transferred to other real estate owned and repossessed assets
|
4,334
|
|
3,067
|
|
4,824
|
|
|||||
|
Other real estate sales transferred to loans
|
—
|
|
1,891
|
|
—
|
|
|||||
|
Fair value of loans transferred from held to maturity to available for sale
|
37,367
|
|
15,102
|
|
18,758
|
|
|||||
|
Gross (decrease) increase in market value adjustment to securities available for sale
|
(5,319
|
)
|
1,983
|
|
(6,919
|
)
|
|||||
|
Gross increase (decrease) in market value adjustment to derivatives
|
336
|
|
(783
|
)
|
(549
|
)
|
|||||
|
Investments redeemed, not settled
|
—
|
|
—
|
|
3,769
|
|
|||||
|
Net assets (liabilities) acquired through acquisition
|
21,834
|
|
37,070
|
|
(501,516
|
)
|
|||||
|
Proceeds from death benefit on bank-owned life insurance not received
|
—
|
|
245
|
|
437
|
|
|||||
|
Treasury shares issued
|
2,257
|
|
2,258
|
|
—
|
|
|||||
Note 6—Earnings per Share
The following table summarizes the composition of the weighted-average common shares (denominator) used in the basic and diluted earnings per share computation for the years ending
December 31
:
|
2018
|
2017
|
2016
|
||||||
|
Weighted average common shares issued
|
113,914,902
|
|
111,809,880
|
|
105,563,455
|
|
||
|
Average treasury shares
|
(14,747,687
|
)
|
(16,463,079
|
)
|
(16,605,461
|
)
|
||
|
Average deferred compensation shares
|
(37,411
|
)
|
(37,411
|
)
|
—
|
|
||
|
Average unearned nonvested shares
|
(93,641
|
)
|
(89,334
|
)
|
(106,421
|
)
|
||
|
Weighted average common shares and common stock equivalents used to calculate basic earnings per share
|
99,036,163
|
|
95,220,056
|
|
88,851,573
|
|
||
|
Additional common stock equivalents (nonvested stock) used to calculate diluted earnings per share
|
149,939
|
|
73,570
|
|
—
|
|
||
|
Additional common stock equivalents (deferred compensation) used to calculated diluted earnings per share
|
37,411
|
|
37,411
|
|
—
|
|
||
|
Weighted average common shares and common stock equivalents used to calculate diluted earnings per share
|
99,223,513
|
|
95,331,037
|
|
88,851,573
|
|
||
The following table shows the number of shares and the price per share related to common stock equivalents that were not included in the computation of diluted earnings per share for the years ended
December 31
, because to do so would have been anti-dilutive.
|
12/31/2018
|
12/31/2017
|
12/31/2016
|
||||||||||||||||||||||||||||||
|
Price Range
|
Price Range
|
Price Range
|
||||||||||||||||||||||||||||||
|
Shares
|
From
|
To
|
Shares
|
From
|
To
|
Shares
|
From
|
To
|
||||||||||||||||||||||||
|
Restricted Stock
|
71,560
|
|
$
|
8.84
|
|
$
|
14.49
|
|
18,173
|
|
$
|
8.55
|
|
$
|
13.96
|
|
67,920
|
|
$
|
8.38
|
|
$
|
13.96
|
|
||||||||
64
Note 7—Cash and Due from Banks
Regulations of the Board of Governors of the Federal Reserve System impose uniform reserve requirements on all depository institutions with transaction accounts, such as checking accounts and NOW accounts. Reserves are maintained in the form of vault cash or balances held with the local Federal Reserve Bank. First Commonwealth Bank maintained average balances of
$4.9 million
during
2018
and
$10.3 million
during
2017
with the Federal Reserve Bank of Cleveland.
Note 8—Derivatives
Derivatives Not Designated as Hedging Instruments
First Commonwealth is a party to interest rate derivatives that are not designated as hedging instruments. These derivatives relate to interest rate swaps that First Commonwealth enters into with customers to allow customers to convert variable rate loans to a fixed rate. First Commonwealth pays interest to the customer at a floating rate on the notional amount and receives interest from the customer at a fixed rate for the same notional amount. At the same time the interest rate swap is entered into with the customer, an offsetting interest rate swap is entered into with another financial institution. First Commonwealth pays the other financial institution interest at the same fixed rate on the same notional amount as the swap entered into with the customer, and receives interest from the financial institution for the same floating rate on the same notional amount.
The changes in the fair value of the swaps offset each other, except for the credit risk of the counterparties, which is determined by taking into consideration the risk rating, probability of default and loss given default for all counterparties.
We have
31
risk participation agreements with financial institution counterparties for interest rate swaps related to loans in which we are a participant. The risk participation agreements provide credit protection to the financial institution should the borrower fail to perform on its interest rate derivative contract with the financial institution. We have
ten
risk participation agreements with financial institution counterparties for interest rate swaps related to loans in which we are the lead bank. The risk participation agreement provides credit protection to us should the borrower fail to perform on its interest rate derivative contract with us.
First Commonwealth is also party to interest rate caps that are not designated as hedging instruments. These derivatives relate to contracts that First Commonwealth enters into with loan customers providing a maximum interest rate on their variable rate loan. At the same time the interest rate cap is entered into with the customer, First Commonwealth enters into an offsetting interest rate cap with another financial institution. The notional amount and maximum interest rate on both interest cap contracts are identical.
The fee received, less the estimate of the loss for the credit exposure, was recognized in earnings at the time of the transaction.
Derivatives Designated as Hedging Instruments
The Company has entered into an interest rate swap contract, which was designated as a cash flow hedge. The interest rate swap has a total notional amount of
$65.0 million
with an original maturity of
four years
. The maturity date for this contract is March 4, 2019. The Company's risk management objective for this hedge is to reduce its exposure to variability in expected future cash flows related to interest payments on commercial loans benchmarked to the
1-month LIBOR
rate. Therefore, the interest rate swap convert the interest payments on the first
$65.0 million
of
1-month LIBOR
-based commercial loans into fixed rate payments.
The periodic net settlement of interest rate swaps is recorded as an adjustment to "Interest and fees on loans" in the Consolidated Statement of Income. For the year ended
December 31, 2018
, interest income was decreased by
$0.6 million
and, for the years ended
December 31, 2017
and
2016
, interest income was increased by
$0.5 million
and
$1.6 million
, respectively, as a result of this and other interest rate swaps entered into during the period. Changes in the fair value of the effective portion of cash flow hedges are reported in OCI. When the cash flows associated with the hedged item are realized, the gain or loss included in OCI is recognized in "Interest and fees on loans," the same line item in the Consolidated Statement of Income as the income on the hedged items. The cash flow hedges were highly effective at
December 31, 2018
,
2017
and
2016
and changes in the fair value attributed to hedge ineffectiveness were not material.
The Company also enters into interest rate lock commitments in conjunction with its mortgage origination business. These are commitments to originate loans whereby the interest rate on the loan is determined prior to funding and the customers have locked into that interest rate. The Company locks in the rate with an investor and commits to deliver the loan if settlement occurs (“best efforts”) or commits to deliver the locked loan in a binding (“mandatory”) delivery program with an investor. Loans under mandatory rate lock commitments are covered under forward sales contracts of mortgage-backed securities (“MBS”). Forward sales contracts of MBS are recorded at fair value with changes in fair value recorded in "Other operating expense" in the Consolidated Statements of Income. The impact to noninterest expense for the years ended
December 31, 2018
65
and
2017
was a decrease of
$189 thousand
and
$19 thousand
, respectively. There were no interest rate lock commitments in 2016.
Interest rate lock commitments and commitments to deliver loans to investors are considered derivatives. The market value of interest rate lock commitments and best efforts contracts are not readily ascertainable with precision because they are not actively traded in stand-alone markets. We determine the fair value of rate lock commitments and delivery contracts by measuring the fair value of the underlying asset, which is impacted by current interest rates and taking into consideration the probability that the rate lock commitments will close or will be funded. At
December 31, 2018
, the underlying funded mortgage loan commitments had a carrying value of
$6.9 million
and a fair value of
$7.6 million
, while the underlying unfunded mortgage loan commitments had a notional amount of
$9.9 million
. At
December 31, 2017
, the underlying funded mortgage loan commitments had a carrying value of
$14.3 million
and a fair value of
$14.7 million
, while the underlying unfunded mortgage loan commitments had a notional amount of
$13.8 million
.
In addition, a small amount of interest income on loans is exposed to changes in foreign exchange rates. Several commercial borrowers have a portion of their operations outside of the United States and borrow funds on a short-term basis to fund those operations. In order to reduce the risk related to the translation of foreign denominated transactions into U.S. dollars, the Company enters into foreign exchange forward contracts. These contracts relate principally to the Euro and the Canadian dollar. The contracts are recorded at fair value with changes in fair value recorded in "Other operating expense" in the Consolidated Statements of Income. The impact on other noninterest expense for the year ended
December 31, 2018
totaled
$15 thousand
. At
December 31, 2018
and
December 31, 2017
, the underlying loans had a carrying value of
$1.9 million
and
$10.0 million
, respectively, and a fair value of
$1.9 million
and
$10.1 million
, respectively.
The following table depicts the credit value adjustment recorded related to the notional amount of derivatives outstanding as well as the notional amount of risk participation agreements participated to other banks at
December 31
:
|
2018
|
2017
|
||||||
|
|
(dollars in thousands)
|
||||||
|
Derivatives not Designated as Hedging Instruments
|
|||||||
|
Credit value adjustment
|
$
|
(3
|
)
|
$
|
(791
|
)
|
|
|
Notional Amount:
|
|||||||
|
Interest rate derivatives
|
411,645
|
|
401,304
|
|
|||
|
Interest rate caps
|
36,111
|
|
46,444
|
|
|||
|
Risk participation agreements
|
162,139
|
|
197,660
|
|
|||
|
Sold credit protection on risk participation agreements
|
(59,315
|
)
|
(46,170
|
)
|
|||
|
Interest rate options
|
9,900
|
|
—
|
|
|||
|
Derivatives Designated as Hedging Instruments
|
|||||||
|
Interest rate swaps:
|
|||||||
|
Fair value adjustment
|
(133
|
)
|
459
|
|
|||
|
Notional Amount
|
65,000
|
|
150,000
|
|
|||
|
Interest rate forwards:
|
|||||||
|
Fair value adjustment
|
(170
|
)
|
19
|
|
|||
|
Notional Amount
|
15,000
|
|
17,000
|
|
|||
|
Foreign exchange forwards:
|
|||||||
|
Fair value adjustment
|
(6
|
)
|
(70
|
)
|
|||
|
Notional Amount
|
1,927
|
|
10,077
|
|
|||
66
The table below presents the amount representing the change in the fair value of derivative assets and derivative liabilities attributable to credit risk included in “Other income” on the Consolidated Statements of Income for the years ended
December 31
:
|
|
2018
|
2017
|
2016
|
||||||||
|
|
(dollars in thousands)
|
||||||||||
|
Non-hedging interest rate derivatives:
|
|||||||||||
|
Increase (decrease) in other income
|
$
|
787
|
|
$
|
(473
|
)
|
$
|
219
|
|
||
|
Decrease in other expense
|
(332
|
)
|
—
|
|
—
|
|
|||||
|
Hedging interest rate derivatives:
|
|||||||||||
|
(Decrease) increase in interest income
|
(590
|
)
|
452
|
|
1,627
|
|
|||||
|
Increase in other income
|
10
|
|
119
|
|
70
|
|
|||||
|
Hedging interest rate forwards:
|
|||||||||||
|
Decrease in other expense
|
(189
|
)
|
(19
|
)
|
—
|
|
|||||
|
Hedging interest rate derivatives:
|
|||||||||||
|
Increase (decrease) in other expense
|
15
|
|
4
|
|
(5
|
)
|
|||||
The fair value of our derivatives is included in a table in Note 19, “Fair Values of Assets and Liabilities,” in the line items “Other assets” and “Other liabilities.”
67
Note 9—Investment Securities
Securities Available for Sale
Below is an analysis of the amortized cost and fair values of securities available for sale at
December 31
:
|
|
2018
|
2017
|
|||||||||||||||||||||||||||||
|
|
Amortized
Cost |
Gross
Unrealized Gains |
Gross
Unrealized Losses |
Estimated
Fair Value |
Amortized
Cost |
Gross
Unrealized Gains |
Gross
Unrealized Losses |
Estimated
Fair Value |
|||||||||||||||||||||||
|
|
(dollars in thousands)
|
||||||||||||||||||||||||||||||
|
Obligations of U.S. Government Agencies:
|
|||||||||||||||||||||||||||||||
|
Mortgage-Backed Securities – Residential
|
$
|
9,011
|
|
$
|
479
|
|
$
|
(84
|
)
|
$
|
9,406
|
|
$
|
10,556
|
|
$
|
789
|
|
$
|
(7
|
)
|
$
|
11,338
|
|
|||||||
|
Mortgage-Backed Securities – Commercial
|
169,633
|
|
214
|
|
(2,103
|
)
|
167,744
|
|
24,611
|
|
—
|
|
(462
|
)
|
24,149
|
|
|||||||||||||||
|
Obligations of U.S. Government-Sponsored Enterprises:
|
|||||||||||||||||||||||||||||||
|
Mortgage-Backed Securities – Residential
|
686,906
|
|
1,846
|
|
(15,391
|
)
|
673,361
|
|
632,422
|
|
2,622
|
|
(9,489
|
)
|
625,555
|
|
|||||||||||||||
|
Other Government-Sponsored Enterprises
|
10,000
|
|
12
|
|
—
|
|
10,012
|
|
1,098
|
|
—
|
|
(1
|
)
|
1,097
|
|
|||||||||||||||
|
Obligations of States and Political Subdivisions
|
27,592
|
|
126
|
|
(6
|
)
|
27,712
|
|
27,083
|
|
327
|
|
—
|
|
27,410
|
|
|||||||||||||||
|
Corporate Securities
|
20,912
|
|
321
|
|
(221
|
)
|
21,012
|
|
15,907
|
|
590
|
|
(4
|
)
|
16,493
|
|
|||||||||||||||
|
Pooled Trust Preferred Collateralized Debt Obligations
|
—
|
|
—
|
|
—
|
|
—
|
|
27,499
|
|
526
|
|
(4,379
|
)
|
23,646
|
|
|||||||||||||||
|
Total Debt Securities
|
924,054
|
|
2,998
|
|
(17,805
|
)
|
909,247
|
|
739,176
|
|
4,854
|
|
(14,342
|
)
|
729,688
|
|
|||||||||||||||
|
Equities
|
—
|
|
—
|
|
—
|
|
—
|
|
1,670
|
|
—
|
|
—
|
|
1,670
|
|
|||||||||||||||
|
Total Securities Available for Sale
|
$
|
924,054
|
|
$
|
2,998
|
|
$
|
(17,805
|
)
|
$
|
909,247
|
|
$
|
740,846
|
|
$
|
4,854
|
|
$
|
(14,342
|
)
|
$
|
731,358
|
|
|||||||
Mortgage backed securities include mortgage backed obligations of U.S. Government agencies and obligations of U.S. Government-sponsored enterprises. These obligations have contractual maturities ranging from
less than one year
to approximately
30 years
with lower anticipated lives to maturity due to prepayments. All mortgage backed securities contain a certain amount of risk related to the uncertainty of prepayments of the underlying mortgages. Interest rate changes have a direct impact upon prepayment speeds; therefore, First Commonwealth uses computer simulation models to test the average life and yield volatility of all mortgage backed securities under various interest rate scenarios to monitor the potential impact on earnings and interest rate risk positions.
Expected maturities will differ from contractual maturities because issuers may have the right to call or repay obligations with or without call or prepayment penalties. Other fixed income securities within the portfolio also contain prepayment risk.
68
The amortized cost and estimated fair value of debt securities available for sale at
December 31, 2018
, by contractual maturity, are shown below:
|
Amortized
Cost |
Estimated
Fair Value |
||||||
|
|
(dollars in thousands)
|
||||||
|
Due within 1 year
|
$
|
4,000
|
|
$
|
3,993
|
|
|
|
Due after 1 but within 5 years
|
17,256
|
|
17,045
|
|
|||
|
Due after 5 but within 10 years
|
35,319
|
|
35,448
|
|
|||
|
Due after 10 years
|
1,929
|
|
2,250
|
|
|||
|
58,504
|
|
58,736
|
|
||||
|
Mortgage-Backed Securities (a)
|
865,550
|
|
850,511
|
|
|||
|
Total Debt Securities
|
$
|
924,054
|
|
$
|
909,247
|
|
|
|
(a)
|
Mortgage Backed Securities include an amortized cost of
$178.6 million
and a fair value of
$177.2 million
for Obligations of U.S. Government agencies issued by Ginnie Mae and an amortized cost of
$686.9 million
and a fair value of
$673.4 million
for Obligations of U.S. Government-sponsored enterprises issued by Fannie Mae and Freddie Mac.
|
Proceeds from sales, gross gains (losses) realized on sales, maturities and other-than-temporary impairment charges related to securities available for sale were as follows for the years ended
December 31
:
|
2018
|
2017
|
2016
|
|||||||||
|
|
(dollars in thousands)
|
||||||||||
|
Proceeds from sales
|
$
|
15,939
|
|
$
|
143,660
|
|
$
|
55,744
|
|
||
|
Gross (losses) gains realized:
|
|||||||||||
|
Sales Transactions:
|
|||||||||||
|
Gross gains
|
$
|
4,719
|
|
$
|
359
|
|
$
|
305
|
|
||
|
Gross losses
|
—
|
|
(316
|
)
|
(277
|
)
|
|||||
|
4,719
|
|
43
|
|
28
|
|
||||||
|
Maturities and impairment
|
|||||||||||
|
Gross gains
|
3,383
|
|
5,057
|
|
589
|
|
|||||
|
Gross losses
|
—
|
|
(60
|
)
|
—
|
|
|||||
|
Other-than-temporary impairment
|
—
|
|
—
|
|
—
|
|
|||||
|
3,383
|
|
4,997
|
|
589
|
|
||||||
|
Net gains and impairment
|
$
|
8,102
|
|
$
|
5,040
|
|
$
|
617
|
|
||
Gross gains from sales transactions of
$4.7 million
were recognized in
2018
as a result of the sale of the remaining pooled trust preferred security portfolio. Gross gains from maturities and impairment of
$3.4 million
were recognized in
2018
as a result of successful auction calls on PreSTL XIV and PreSTL IX, two of our pooled trust preferred securities.
During
2017
, proceeds from sales of investments include the liquidation of the DCB investment portfolio as well as the sale of small positions in CMO and MBS investments. Gross gains from maturities and impairments resulted from the early redemption of two pooled trust preferred securities. The successful auction call of PreSTL XIII provided a gain of
$4.3 million
and the liquidation of PreSTL VII by senior note holders resulted in a gain of
$0.7 million
.
Proceeds from the sales of investments in
2016
were related to sales of small positions in CMO's and MBS's. During
2016
, a gain of
$0.6 million
was recognized as a result of the early redemption of a pooled trust preferred security. This security was redeemed due to an election by the senior note holders to liquidate the trust.
Securities available for sale with an approximate fair value of
$636.3 million
and
$569.0 million
were pledged as of
December 31, 2018
and
2017
, respectively, to secure public deposits and for other purposes required or permitted by law.
69
Securities Held to Maturity
Below is an analysis of the amortized cost and fair values of debt securities held to maturity at December 31:.
|
|
2018
|
2017
|
|||||||||||||||||||||||||||||
|
|
Amortized
Cost |
Gross
Unrealized Gains |
Gross
Unrealized Losses |
Estimated
Fair Value |
Amortized
Cost |
Gross
Unrealized Gains |
Gross
Unrealized Losses |
Estimated
Fair Value |
|||||||||||||||||||||||
|
|
(dollars in thousands)
|
||||||||||||||||||||||||||||||
|
Obligations of U.S. Government Agencies:
|
|||||||||||||||||||||||||||||||
|
Mortgage-Backed Securities – Residential
|
$
|
3,635
|
|
$
|
—
|
|
$
|
(97
|
)
|
$
|
3,538
|
|
$
|
3,925
|
|
$
|
—
|
|
$
|
(14
|
)
|
$
|
3,911
|
|
|||||||
|
Mortgage-Backed Securities – Commercial
|
55,221
|
|
—
|
|
(2,327
|
)
|
52,894
|
|
58,249
|
|
—
|
|
(1,394
|
)
|
56,855
|
|
|||||||||||||||
|
Obligations of U.S. Government-Sponsored Enterprises:
|
|||||||||||||||||||||||||||||||
|
Mortgage-Backed Securities – Residential
|
279,109
|
|
212
|
|
(7,254
|
)
|
272,067
|
|
305,126
|
|
10
|
|
(2,552
|
)
|
302,584
|
|
|||||||||||||||
|
Mortgage-Backed Securities – Commercial
|
13,159
|
|
—
|
|
(258
|
)
|
12,901
|
|
14,056
|
|
—
|
|
(71
|
)
|
13,985
|
|
|||||||||||||||
|
Obligations of States and Political Subdivisions
|
42,331
|
|
175
|
|
(313
|
)
|
42,193
|
|
40,540
|
|
335
|
|
(161
|
)
|
40,714
|
|
|||||||||||||||
|
Debt Securities Issued by Foreign Governments
|
400
|
|
—
|
|
—
|
|
400
|
|
200
|
|
—
|
|
—
|
|
200
|
|
|||||||||||||||
|
Total Securities Held to Maturity
|
$
|
393,855
|
|
$
|
387
|
|
$
|
(10,249
|
)
|
$
|
383,993
|
|
$
|
422,096
|
|
$
|
345
|
|
$
|
(4,192
|
)
|
$
|
418,249
|
|
|||||||
The amortized cost and estimated fair value of debt securities held to maturity at
December 31, 2018
, by contractual maturity, are shown below. Expected maturities will differ from contractual maturities because borrowers may have the right to call or repay obligations with or without call or prepayment penalties.
|
Amortized
Cost |
Estimated
Fair Value |
||||||
|
|
(dollars in thousands)
|
||||||
|
Due within 1 year
|
$
|
520
|
|
$
|
519
|
|
|
|
Due after 1 but within 5 years
|
7,218
|
|
7,210
|
|
|||
|
Due after 5 but within 10 years
|
34,993
|
|
34,864
|
|
|||
|
Due after 10 years
|
—
|
|
—
|
|
|||
|
42,731
|
|
42,593
|
|
||||
|
Mortgage-Backed Securities (a)
|
351,124
|
|
341,400
|
|
|||
|
Total Debt Securities
|
$
|
393,855
|
|
$
|
383,993
|
|
|
|
(a)
|
Mortgage Backed Securities include an amortized cost of
$58.9 million
and a fair value of
$56.4 million
for Obligations of U.S. Government agencies issued by Ginnie Mae and an amortized cost of
$292.3 million
and a fair value of
$285.0 million
for Obligations of U.S. Government-sponsored enterprises issued by Fannie Mae and Freddie Mac.
|
Securities held to maturity with an amortized cost of
$250.3 million
and
$338.3 million
were pledged as of
December 31, 2018
and
2017
, respectively, to secure public deposits for other purposes required or permitted by law.
70
Note 10—Impairment of Investment Securities
Securities Available for Sale and Held to Maturity
As required by FASB ASC Topic 320, “Investments—Debt and Equity Securities,” credit related other-than-temporary impairment on debt securities is recognized in earnings while non-credit related other-than-temporary impairment on debt securities not expected to be sold is recognized in other comprehensive income (“OCI”). During the years ended
December 31, 2018
,
2017
and
2016
, no other-than-temporary impairment charges were recognized.
First Commonwealth utilizes the specific identification method to determine the net gain or loss on debt securities and the average cost method to determine the net gain or loss on equity securities.
We review our investment portfolio on a quarterly basis for indications of impairment. This review includes analyzing the length of time and the extent to which the fair value has been lower than the cost, the financial condition and near-term prospects of the issuer, including any specific events which may influence the operations of the issuer and whether we are more likely than not to sell the security. We evaluate whether we are more likely than not to sell debt securities based upon our investment strategy for the particular type of security and our cash flow needs, liquidity position, capital adequacy, tax position and interest rate risk position. In addition, the risk of future other-than-temporary impairment may be influenced by weakness in the U.S. economy or changes in real estate values.
The following table presents the gross unrealized losses and estimated fair values at
December 31, 2018
for both available for sale and held to maturity securities by investment category and time frame for which the securities have been in a continuous unrealized loss position:
|
|
Less Than 12 Months
|
12 Months or More
|
Total
|
||||||||||||||||||||
|
|
Estimated
Fair Value
|
Gross
Unrealized
Losses
|
Estimated
Fair Value
|
Gross
Unrealized
Losses
|
Estimated
Fair Value
|
Gross
Unrealized
Losses
|
|||||||||||||||||
|
|
(dollars in thousands)
|
||||||||||||||||||||||
|
Obligations of U.S. Government Agencies:
|
|||||||||||||||||||||||
|
Mortgage-Backed Securities – Residential
|
$
|
2,289
|
|
$
|
(41
|
)
|
$
|
5,028
|
|
$
|
(140
|
)
|
$
|
7,317
|
|
$
|
(181
|
)
|
|||||
|
Mortgage-Backed Securities – Commercial
|
95,826
|
|
(925
|
)
|
75,959
|
|
(3,505
|
)
|
171,785
|
|
(4,430
|
)
|
|||||||||||
|
Obligations of U.S. Government-Sponsored Enterprises:
|
|||||||||||||||||||||||
|
Mortgage-Backed Securities – Residential
|
156,732
|
|
(1,856
|
)
|
626,003
|
|
(20,789
|
)
|
782,735
|
|
(22,645
|
)
|
|||||||||||
|
Mortgage-Backed Securities – Commercial
|
—
|
|
—
|
|
12,901
|
|
(258
|
)
|
12,901
|
|
(258
|
)
|
|||||||||||
|
Obligations of States and Political Subdivisions
|
8,591
|
|
(85
|
)
|
9,338
|
|
(234
|
)
|
17,929
|
|
(319
|
)
|
|||||||||||
|
Corporate Securities
|
14,769
|
|
(214
|
)
|
3,993
|
|
(7
|
)
|
18,762
|
|
(221
|
)
|
|||||||||||
|
Total Securities
|
$
|
278,207
|
|
$
|
(3,121
|
)
|
$
|
733,222
|
|
$
|
(24,933
|
)
|
$
|
1,011,429
|
|
$
|
(28,054
|
)
|
|||||
At
December 31, 2018
, fixed income securities issued by U.S. Government-sponsored enterprises comprised
82%
of total unrealized losses due to changes in market interest rates. Government agencies account for
16%
of total unrealized losses as a result of changes in market interest rates. At
December 31, 2018
, there were
132
debt securities in an unrealized loss position,
59
of which related to residential mortgage-backed securities with an unrealized loss of 12 months or more. There were
no
equity securities in an unrealized loss position at
December 31, 2018
.
71
The following table presents the gross unrealized losses and estimated fair value at
December 31, 2017
for both available for sale and held to maturity securities by investment category and time frame for which the securities had been in a continuous unrealized loss position:
|
|
Less Than 12 Months
|
|
12 Months or More
|
|
Total
|
||||||||||||||||||
|
|
Estimated
Fair Value
|
Gross
Unrealized
Losses
|
|
Estimated
Fair Value
|
Gross
Unrealized
Losses
|
|
Estimated
Fair Value
|
Gross
Unrealized
Losses
|
|||||||||||||||
|
|
(dollars in thousands)
|
||||||||||||||||||||||
|
Obligations of U.S. Government Agencies:
|
|||||||||||||||||||||||
|
Mortgage-Backed Securities – Residential
|
$
|
5,584
|
|
$
|
(21
|
)
|
$
|
—
|
|
$
|
—
|
|
|
$
|
5,584
|
|
$
|
(21
|
)
|
||||
|
Mortgage-Backed Securities – Commercial
|
48,322
|
|
(962
|
)
|
32,683
|
|
(894
|
)
|
81,005
|
|
(1,856
|
)
|
|||||||||||
|
Obligations of U.S. Government-Sponsored Enterprises:
|
|||||||||||||||||||||||
|
Mortgage-Backed Securities – Residential
|
351,222
|
|
(2,295
|
)
|
400,984
|
|
(9,746
|
)
|
|
752,206
|
|
(12,041
|
)
|
||||||||||
|
Mortgage-Backed Securities – Commercial
|
13,985
|
|
(71
|
)
|
—
|
|
—
|
|
|
13,985
|
|
(71
|
)
|
||||||||||
|
Other Government-Sponsored Enterprises
|
997
|
|
(1
|
)
|
99
|
|
—
|
|
|
1,096
|
|
(1
|
)
|
||||||||||
|
Obligations of States and Political Subdivisions
|
7,144
|
|
(32
|
)
|
3,653
|
|
(129
|
)
|
10,797
|
|
(161
|
)
|
|||||||||||
|
Corporate Securities
|
3,993
|
|
(4
|
)
|
—
|
|
—
|
|
|
3,993
|
|
(4
|
)
|
||||||||||
|
Pooled Trust Preferred Collateralized Debt Obligations
|
—
|
|
—
|
|
19,120
|
|
(4,379
|
)
|
19,120
|
|
(4,379
|
)
|
|||||||||||
|
Total Securities
|
$
|
431,247
|
|
$
|
(3,386
|
)
|
$
|
456,539
|
|
$
|
(15,148
|
)
|
$
|
887,786
|
|
$
|
(18,534
|
)
|
|||||
As of
December 31, 2018
, our corporate securities had an amortized cost and estimated fair value of
$20.9 million
and
$21.0 million
, respectively, and were comprised of debt for large regional banks. At
December 31, 2017
, these securities had an amortized cost of
$15.9 million
and estimated fair value of
$16.5 million
. There were four corporate securities in an unrealized loss position as of
December 31, 2018
and one corporate securities in a loss position as of
December 31, 2017
. When unrealized losses exist, management reviews each of the issuer’s asset quality, earnings trend and capital position, to determine whether issues in an unrealized loss position were other-than-temporarily impaired. All interest payments on the corporate securities are being made as contractually required.
During 2018, all of our pooled trust preferred collateralized debt obligations were liquidated either through a successful auction call or sale. At December 31, 2017, the pooled trust preferred securities had an amortized cost and estimated fair value of
$27.5 million
and
$23.6 million
, respectively. Other-than-temporary impairment charges were recognized on the pooled trust preferred securities in 2008, 2009 and 2010. The following table provides a cumulative roll forward of credit losses recognized in earnings for the trust preferred securities for the years ended December 31:
|
|
2018
|
2017
|
2016
|
||||||||
|
|
(dollars in thousands)
|
||||||||||
|
Balance, beginning (a)
|
$
|
12,208
|
|
$
|
17,056
|
|
$
|
24,851
|
|
||
|
Credit losses on debt securities for which other-than-temporary impairment was not previously recognized
|
—
|
|
—
|
|
—
|
|
|||||
|
Additional credit losses on debt securities for which other-than-temporary impairment was previously recognized
|
—
|
|
—
|
|
—
|
|
|||||
|
Increases in cash flows expected to be collected, recognized over the remaining life of the securities (b)
|
(223
|
)
|
(890
|
)
|
(1,124
|
)
|
|||||
|
Reduction for debt securities sold during the period
|
(9,164
|
)
|
—
|
|
—
|
|
|||||
|
Reduction for debt securities called during the period
|
(2,821
|
)
|
(3,958
|
)
|
(6,671
|
)
|
|||||
|
Balance, ending
|
$
|
—
|
|
$
|
12,208
|
|
$
|
17,056
|
|
||
|
(a)
|
The beginning balance represents credit related losses included in other-than-temporary impairment charges recognized on debt securities in prior periods.
|
|
(b)
|
Represents the increase in cash flows recognized either as principal payments or interest income during the period.
|
For the years ended December 31,
2017
and
2016
, no other-than-temporary impairment charges were recorded on equity securities. There were no equity securities in an unrealized loss position as of
December 31, 2017
.
72
Other Investments
As a member of the Federal Home Loan Bank ("FHLB"), First Commonwealth is required to purchase and hold stock in the FHLB to satisfy membership and borrowing requirements. The level of stock required to be held is dependent on the amount of First Commonwealth's mortgage related assets and outstanding borrowings with the FHLB. This stock is restricted in that it can only be sold to the FHLB or to another member institution, and all sales of FHLB stock must be at par. As a result of these restrictions, FHLB stock is unlike other investment securities insofar as there is no trading market for FHLB stock and the transfer price is determined by FHLB membership rules and not by market participants. As of
December 31, 2018
and
2017
, our FHLB stock totaled
$30.5 million
and
$29.8 million
, respectively and is included in “Other investments” on the Consolidated Statements of Financial Condition.
FHLB stock is held as a long-term investment and its value is determined based on the ultimate recoverability of the par value. First Commonwealth evaluates impairment quarterly and has concluded that the par value of its investment in FHLB stock will be recovered. Accordingly, no impairment charge was recorded on these securities for the year ended
December 31, 2018
.
At December 31, 2018, Other Investments also includes
$1.7 million
in equity securities. These securities do not have a readily determinable fair value and are carried at cost. For the year ended
December 31, 2018
, there were no gains or losses recognized through earnings on equity securities. On a quarterly basis, management evaluates equity securities by reviewing the severity and duration of decline in estimated fair value, research reports, analysts’ recommendations, credit rating changes, news stories, annual reports, regulatory filings, impact of interest rate changes and other relevant information.
Note 11—Loans and Allowance for Credit Losses
The following table provides outstanding balances related to each of our loan types as of
December 31
:
|
2018
|
2017
|
||||||||||||||||||||||
|
Originated Loans
|
Acquired Loans
|
Total Loans
|
Originated Loans
|
Acquired Loans
|
Total Loans
|
||||||||||||||||||
|
|
(dollars in thousands)
|
||||||||||||||||||||||
|
Commercial, financial, agricultural and other
|
$
|
1,100,947
|
|
$
|
37,526
|
|
$
|
1,138,473
|
|
$
|
1,122,741
|
|
$
|
40,642
|
|
$
|
1,163,383
|
|
|||||
|
Real estate construction
|
353,008
|
|
5,970
|
|
358,978
|
|
242,905
|
|
5,963
|
|
248,868
|
|
|||||||||||
|
Residential real estate
|
1,313,645
|
|
248,760
|
|
1,562,405
|
|
1,206,119
|
|
220,251
|
|
1,426,370
|
|
|||||||||||
|
Commercial real estate
|
1,922,349
|
|
201,195
|
|
2,123,544
|
|
1,892,185
|
|
126,911
|
|
2,019,096
|
|
|||||||||||
|
Loans to individuals
|
585,347
|
|
5,392
|
|
590,739
|
|
543,411
|
|
6,248
|
|
549,659
|
|
|||||||||||
|
Total loans
|
$
|
5,275,296
|
|
$
|
498,843
|
|
$
|
5,774,139
|
|
$
|
5,007,361
|
|
$
|
400,015
|
|
$
|
5,407,376
|
|
|||||
73
Credit Quality Information
As part of the on-going monitoring of credit quality within the loan portfolio, the following credit worthiness categories are used in grading our loans:
|
Pass
|
Acceptable levels of risk exist in the relationship. Includes all loans not classified as OAEM, substandard or doubtful.
|
|
|
Other Assets Especially Mentioned (OAEM)
|
Potential weaknesses that deserve management’s close attention. The potential weaknesses may result in deterioration of the repayment prospects or weaken the Bank’s credit position at some future date. The credit risk may be relatively minor, yet constitute an undesirable risk in light of the circumstances surrounding the specific credit. No loss of principal or interest is expected.
|
|
|
Substandard
|
Well-defined weakness or a weakness that jeopardizes the repayment of the debt. A loan may be classified as substandard as a result of deterioration of the borrower’s financial condition and repayment capacity. Loans for which repayment plans have not been met or collateral equity margins do not protect the Company may also be classified as substandard.
|
|
|
Doubtful
|
Loans with the characteristics of substandard loans with the added characteristic that collection or liquidation in full, on the basis of presently existing facts and conditions, is highly improbable.
|
|
The use of creditworthiness categories to grade loans permits management’s use of migration analysis to estimate a portion of credit risk. The Company’s internal creditworthiness grading system provides a measurement of credit risk based primarily on an evaluation of the borrower’s cash flow and collateral. Movements between these rating categories provide a predictive measure of credit losses and therefore assists in determining the appropriate level for the loan loss reserves. Category ratings are reviewed each quarter, at which time management analyzes the results, as well as other external statistics and factors related to loan performance. Loans that migrate towards higher risk rating levels generally have an increased risk of default, whereas loans that migrate toward lower risk ratings generally will result in a lower risk factor being applied to those related loan balances.
The following tables represent our credit risk profile by creditworthiness category for the years ended
December 31
:
|
|
2018
|
||||||||||||||||||||||
|
|
Commercial, financial, agricultural and other
|
Real estate construction
|
Residential real estate
|
Commercial real estate
|
Loans to individuals
|
Total
|
|||||||||||||||||
|
|
(dollars in thousands)
|
||||||||||||||||||||||
|
Originated Loans
|
|||||||||||||||||||||||
|
Pass
|
$
|
1,055,394
|
|
$
|
337,367
|
|
$
|
1,302,912
|
|
$
|
1,880,139
|
|
$
|
585,141
|
|
$
|
5,160,953
|
|
|||||
|
Non-Pass
|
|||||||||||||||||||||||
|
OAEM
|
33,723
|
|
15,641
|
|
1,026
|
|
28,904
|
|
—
|
|
79,294
|
|
|||||||||||
|
Substandard
|
11,830
|
|
—
|
|
9,707
|
|
13,306
|
|
206
|
|
35,049
|
|
|||||||||||
|
Doubtful
|
—
|
|
—
|
|
—
|
|
—
|
|
—
|
|
—
|
|
|||||||||||
|
Total Non-Pass
|
45,553
|
|
15,641
|
|
10,733
|
|
42,210
|
|
206
|
|
114,343
|
|
|||||||||||
|
Total
|
$
|
1,100,947
|
|
$
|
353,008
|
|
$
|
1,313,645
|
|
$
|
1,922,349
|
|
$
|
585,347
|
|
$
|
5,275,296
|
|
|||||
|
Acquired Loans
|
|||||||||||||||||||||||
|
Pass
|
$
|
31,399
|
|
$
|
5,337
|
|
$
|
245,637
|
|
$
|
198,201
|
|
$
|
5,377
|
|
$
|
485,951
|
|
|||||
|
Non-Pass
|
|||||||||||||||||||||||
|
OAEM
|
5,890
|
|
633
|
|
736
|
|
441
|
|
—
|
|
7,700
|
|
|||||||||||
|
Substandard
|
237
|
|
—
|
|
2,387
|
|
2,553
|
|
15
|
|
5,192
|
|
|||||||||||
|
Doubtful
|
—
|
|
—
|
|
—
|
|
—
|
|
—
|
|
—
|
|
|||||||||||
|
Total Non-Pass
|
6,127
|
|
633
|
|
3,123
|
|
2,994
|
|
15
|
|
12,892
|
|
|||||||||||
|
Total
|
$
|
37,526
|
|
$
|
5,970
|
|
$
|
248,760
|
|
$
|
201,195
|
|
$
|
5,392
|
|
$
|
498,843
|
|
|||||
74
|
|
2017
|
||||||||||||||||||||||
|
|
Commercial, financial, agricultural and other
|
Real estate construction
|
Residential real estate
|
Commercial real estate
|
Loans to individuals
|
Total
|
|||||||||||||||||
|
|
(dollars in thousands)
|
||||||||||||||||||||||
|
Originated Loans
|
|||||||||||||||||||||||
|
Pass
|
$
|
1,061,147
|
|
$
|
242,905
|
|
$
|
1,194,352
|
|
$
|
1,855,253
|
|
$
|
543,175
|
|
$
|
4,896,832
|
|
|||||
|
Non-Pass
|
|||||||||||||||||||||||
|
OAEM
|
26,757
|
|
—
|
|
1,435
|
|
13,326
|
|
—
|
|
41,518
|
|
|||||||||||
|
Substandard
|
30,431
|
|
—
|
|
10,332
|
|
23,606
|
|
236
|
|
64,605
|
|
|||||||||||
|
Doubtful
|
4,406
|
|
—
|
|
—
|
|
—
|
|
—
|
|
4,406
|
|
|||||||||||
|
Total Non-Pass
|
61,594
|
|
—
|
|
11,767
|
|
36,932
|
|
236
|
|
110,529
|
|
|||||||||||
|
Total
|
$
|
1,122,741
|
|
$
|
242,905
|
|
$
|
1,206,119
|
|
$
|
1,892,185
|
|
$
|
543,411
|
|
$
|
5,007,361
|
|
|||||
|
Acquired Loans
|
|||||||||||||||||||||||
|
Pass
|
$
|
34,573
|
|
$
|
5,963
|
|
$
|
217,824
|
|
$
|
121,536
|
|
$
|
6,231
|
|
$
|
386,127
|
|
|||||
|
Non-Pass
|
|||||||||||||||||||||||
|
OAEM
|
5,567
|
|
—
|
|
798
|
|
3,517
|
|
—
|
|
9,882
|
|
|||||||||||
|
Substandard
|
502
|
|
—
|
|
1,629
|
|
1,858
|
|
17
|
|
4,006
|
|
|||||||||||
|
Doubtful
|
—
|
|
—
|
|
—
|
|
—
|
|
—
|
|
—
|
|
|||||||||||
|
Total Non-Pass
|
6,069
|
|
—
|
|
2,427
|
|
5,375
|
|
17
|
|
13,888
|
|
|||||||||||
|
Total
|
$
|
40,642
|
|
$
|
5,963
|
|
$
|
220,251
|
|
$
|
126,911
|
|
$
|
6,248
|
|
$
|
400,015
|
|
|||||
Portfolio Risks
The credit quality of our loan portfolio can potentially represent significant risk to our earnings, capital and liquidity. First Commonwealth devotes a substantial amount of resources managing this risk primarily through our credit administration department that develops and administers policies and procedures for underwriting, maintaining, monitoring and collecting loans. Credit administration is independent of lending departments and oversight is provided by the credit committee of the First Commonwealth Board of Directors.
Total gross charge-offs for the years ended
December 31, 2018
and
2017
were
$15.1 million
and
$12.5 million
, respectively.
Criticized loans have been evaluated when determining the appropriateness of the allowance for credit losses, which we believe is adequate to absorb losses inherent to the portfolio as of
December 31, 2018
. However, changes in economic conditions, interest rates, borrower financial condition, delinquency trends or previously established fair values of collateral factors could significantly change those judgmental estimates.
Age Analysis of Past Due Loans by Segment
The following tables delineate the aging analysis of the recorded investments in past due loans as of
December 31
. Also included in these tables are loans that are 90 days or more past due and still accruing because they are well-secured and in the process of collection.
75
|
|
2018
|
||||||||||||||||||||||||||
|
|
30 - 59
days past due |
60 - 89
days past due |
90 days
and greater and still accruing |
Nonaccrual
|
Total past
due and nonaccrual |
Current
|
Total
|
||||||||||||||||||||
|
|
(dollars in thousands)
|
||||||||||||||||||||||||||
|
Originated Loans
|
|||||||||||||||||||||||||||
|
Commercial, financial, agricultural and other
|
$
|
130
|
|
$
|
247
|
|
$
|
92
|
|
$
|
10,223
|
|
$
|
10,692
|
|
$
|
1,090,255
|
|
$
|
1,100,947
|
|
||||||
|
Real estate construction
|
212
|
|
—
|
|
—
|
|
—
|
|
212
|
|
352,796
|
|
353,008
|
|
|||||||||||||
|
Residential real estate
|
3,697
|
|
710
|
|
790
|
|
6,238
|
|
11,435
|
|
1,302,210
|
|
1,313,645
|
|
|||||||||||||
|
Commercial real estate
|
492
|
|
69
|
|
—
|
|
3,437
|
|
3,998
|
|
1,918,351
|
|
1,922,349
|
|
|||||||||||||
|
Loans to individuals
|
2,362
|
|
532
|
|
662
|
|
207
|
|
3,763
|
|
581,584
|
|
585,347
|
|
|||||||||||||
|
Total
|
$
|
6,893
|
|
$
|
1,558
|
|
$
|
1,544
|
|
$
|
20,105
|
|
$
|
30,100
|
|
$
|
5,245,196
|
|
$
|
5,275,296
|
|
||||||
|
Acquired Loans
|
|||||||||||||||||||||||||||
|
Commercial, financial, agricultural and other
|
$
|
1
|
|
$
|
—
|
|
$
|
—
|
|
$
|
204
|
|
$
|
205
|
|
$
|
37,321
|
|
$
|
37,526
|
|
||||||
|
Real estate construction
|
—
|
|
—
|
|
—
|
|
—
|
|
—
|
|
5,970
|
|
5,970
|
|
|||||||||||||
|
Residential real estate
|
226
|
|
24
|
|
27
|
|
1,904
|
|
2,181
|
|
246,579
|
|
248,760
|
|
|||||||||||||
|
Commercial real estate
|
—
|
|
—
|
|
—
|
|
1,042
|
|
1,042
|
|
200,153
|
|
201,195
|
|
|||||||||||||
|
Loans to individuals
|
46
|
|
12
|
|
11
|
|
15
|
|
84
|
|
5,308
|
|
5,392
|
|
|||||||||||||
|
Total
|
$
|
273
|
|
$
|
36
|
|
$
|
38
|
|
$
|
3,165
|
|
$
|
3,512
|
|
$
|
495,331
|
|
$
|
498,843
|
|
||||||
|
|
2017
|
||||||||||||||||||||||||||
|
|
30 - 59
days past due |
60 - 89
days past due |
90 days
and greater and still accruing |
Nonaccrual
|
Total past
due and nonaccrual |
Current
|
Total
|
||||||||||||||||||||
|
|
(dollars in thousands)
|
||||||||||||||||||||||||||
|
Originated Loans
|
|||||||||||||||||||||||||||
|
Commercial, financial, agricultural and other
|
$
|
378
|
|
$
|
61
|
|
$
|
40
|
|
$
|
18,741
|
|
$
|
19,220
|
|
$
|
1,103,521
|
|
$
|
1,122,741
|
|
||||||
|
Real estate construction
|
199
|
|
—
|
|
—
|
|
—
|
|
199
|
|
242,706
|
|
242,905
|
|
|||||||||||||
|
Residential real estate
|
4,618
|
|
1,025
|
|
1,076
|
|
6,225
|
|
12,944
|
|
1,193,175
|
|
1,206,119
|
|
|||||||||||||
|
Commercial real estate
|
2,198
|
|
28
|
|
6
|
|
3,240
|
|
5,472
|
|
1,886,713
|
|
1,892,185
|
|
|||||||||||||
|
Loans to individuals
|
1,899
|
|
769
|
|
623
|
|
236
|
|
3,527
|
|
539,884
|
|
543,411
|
|
|||||||||||||
|
Total
|
$
|
9,292
|
|
$
|
1,883
|
|
$
|
1,745
|
|
$
|
28,442
|
|
$
|
41,362
|
|
$
|
4,965,999
|
|
$
|
5,007,361
|
|
||||||
|
Acquired Loans
|
|||||||||||||||||||||||||||
|
Commercial, financial, agricultural and other
|
$
|
6
|
|
$
|
7
|
|
$
|
—
|
|
$
|
436
|
|
$
|
449
|
|
$
|
40,193
|
|
$
|
40,642
|
|
||||||
|
Real estate construction
|
—
|
|
—
|
|
—
|
|
—
|
|
—
|
|
5,963
|
|
5,963
|
|
|||||||||||||
|
Residential real estate
|
148
|
|
9
|
|
83
|
|
705
|
|
945
|
|
219,306
|
|
220,251
|
|
|||||||||||||
|
Commercial real estate
|
—
|
|
—
|
|
—
|
|
1,077
|
|
1,077
|
|
125,834
|
|
126,911
|
|
|||||||||||||
|
Loans to individuals
|
36
|
|
20
|
|
26
|
|
17
|
|
99
|
|
6,149
|
|
6,248
|
|
|||||||||||||
|
Total
|
$
|
190
|
|
$
|
36
|
|
$
|
109
|
|
$
|
2,235
|
|
$
|
2,570
|
|
$
|
397,445
|
|
$
|
400,015
|
|
||||||
Nonaccrual Loans
The previous tables summarize nonaccrual loans by loan segment. The Company generally places loans on nonaccrual status when the full and timely collection of interest or principal becomes uncertain, when part of the principal balance has been charged off and no restructuring has occurred, or the loans reach a certain number of days past due. Generally, loans
90 days
or
76
more past due are placed on nonaccrual status, except for consumer loans which are placed in nonaccrual status at
150 days
past due.
When a loan is placed on nonaccrual, the accrued unpaid interest receivable is reversed against interest income and all future payments received are applied as a reduction to the loan principal. Generally, the loan is returned to accrual status when (a) all delinquent interest and principal become current under the terms of the loan agreement or (b) the loan is both well-secured and in the process of collection and collectability is no longer in doubt.
Impaired Loans
Management considers loans to be impaired when, based on current information and events, it is determined that the Company will not be able to collect all amounts due according to the loan contract, including scheduled interest payments. Determination of impairment is treated the same across all loan categories. When management identifies a loan as impaired, the impairment is measured based on the present value of expected future cash flows, discounted at the loan’s effective interest rate, except when the sole source or repayment for the loan is the operation or liquidation of collateral. When the loan is collateral dependent, the appraised value less estimated cost to sell is utilized. If management determines the value of the impaired loan is less than the recorded investment in the loan, impairment is recognized through an allowance estimate or a charge-off to the allowance. Troubled debt restructured loans on accrual status are considered to be impaired loans.
When the ultimate collectability of the total principal of an impaired loan is in doubt and the loan is on nonaccrual status, all payments are applied to principal, under the cost recovery method. When the ultimate collectability of the total principal of an impaired loan is not in doubt and the loan is on nonaccrual status, contractual interest is credited to interest income when received under the cash basis method.
There were
no
impaired loans held for sale at
December 31, 2018
and
December 31, 2017
. Total gains of
$1.8 million
and
$21 thousand
were recognized on sales of impaired loans during the years ended
December 31, 2018
and
2017
respectively.
77
The following tables include the recorded investment and unpaid principal balance for impaired loans with the associated allowance amount, if applicable, as of
December 31, 2018
and
2017
. Also presented are the average recorded investment in impaired loans and the related amount of interest recognized while the loan was considered impaired for the years ended
December 31, 2018
,
2017
and
2016
. Average balances are calculated based on month-end balances of the loans for the period reported and are included in the table below based on its period end allowance position.
|
|
2018
|
||||||||||||||||||
|
|
Recorded
investment |
Unpaid
principal balance |
Related
allowance |
Average
recorded investment |
Interest
Income Recognized |
||||||||||||||
|
|
(dollars in thousands)
|
||||||||||||||||||
|
Originated Loans:
|
|||||||||||||||||||
|
With no related allowance recorded:
|
|||||||||||||||||||
|
Commercial, financial, agricultural and other
|
$
|
8,735
|
|
$
|
16,442
|
|
$
|
18,480
|
|
$
|
602
|
|
|||||||
|
Real estate construction
|
—
|
|
—
|
|
—
|
|
—
|
|
|||||||||||
|
Residential real estate
|
10,726
|
|
12,571
|
|
10,651
|
|
271
|
|
|||||||||||
|
Commercial real estate
|
3,599
|
|
3,812
|
|
7,919
|
|
177
|
|
|||||||||||
|
Loans to individuals
|
281
|
|
408
|
|
310
|
|
11
|
|
|||||||||||
|
Subtotal
|
23,341
|
|
33,233
|
|
37,360
|
|
1,061
|
|
|||||||||||
|
With an allowance recorded:
|
|||||||||||||||||||
|
Commercial, financial, agricultural and other
|
3,042
|
|
3,181
|
|
$
|
797
|
|
2,531
|
|
20
|
|
||||||||
|
Real estate construction
|
—
|
|
—
|
|
—
|
|
—
|
|
—
|
|
|||||||||
|
Residential real estate
|
486
|
|
495
|
|
107
|
|
504
|
|
13
|
|
|||||||||
|
Commercial real estate
|
1,866
|
|
1,878
|
|
596
|
|
991
|
|
4
|
|
|||||||||
|
Loans to individuals
|
—
|
|
—
|
|
—
|
|
—
|
|
—
|
|
|||||||||
|
Subtotal
|
5,394
|
|
5,554
|
|
1,500
|
|
4,026
|
|
37
|
|
|||||||||
|
Total
|
$
|
28,735
|
|
$
|
38,787
|
|
$
|
1,500
|
|
$
|
41,386
|
|
$
|
1,098
|
|
||||
|
Acquired Loans:
|
|||||||||||||||||||
|
With no related allowance recorded:
|
|||||||||||||||||||
|
Commercial, financial, agricultural and other
|
$
|
73
|
|
$
|
73
|
|
$
|
214
|
|
$
|
10
|
|
|||||||
|
Real estate construction
|
—
|
|
—
|
|
—
|
|
—
|
|
|||||||||||
|
Residential real estate
|
2,031
|
|
2,604
|
|
1,906
|
|
5
|
|
|||||||||||
|
Commercial real estate
|
1,042
|
|
2,052
|
|
1,565
|
|
—
|
|
|||||||||||
|
Loans to individuals
|
15
|
|
17
|
|
16
|
|
—
|
|
|||||||||||
|
Subtotal
|
3,161
|
|
4,746
|
|
3,701
|
|
15
|
|
|||||||||||
|
With an allowance recorded:
|
|||||||||||||||||||
|
Commercial, financial, agricultural and other
|
131
|
|
131
|
|
$
|
131
|
|
11
|
|
—
|
|
||||||||
|
Real estate construction
|
—
|
|
—
|
|
—
|
|
—
|
|
—
|
|
|||||||||
|
Residential real estate
|
—
|
|
—
|
|
—
|
|
—
|
|
—
|
|
|||||||||
|
Commercial real estate
|
—
|
|
—
|
|
—
|
|
—
|
|
—
|
|
|||||||||
|
Loans to individuals
|
—
|
|
—
|
|
—
|
|
—
|
|
—
|
|
|||||||||
|
Subtotal
|
131
|
|
131
|
|
131
|
|
11
|
|
—
|
|
|||||||||
|
Total
|
$
|
3,292
|
|
$
|
4,877
|
|
$
|
131
|
|
$
|
3,712
|
|
$
|
15
|
|
||||
78
|
|
2017
|
||||||||||||||||||
|
|
Recorded
investment |
Unpaid
principal balance |
Related
allowance |
Average
recorded investment |
Interest
Income Recognized |
||||||||||||||
|
|
(dollars in thousands)
|
||||||||||||||||||
|
Originated Loans:
|
|||||||||||||||||||
|
With no related allowance recorded:
|
|||||||||||||||||||
|
Commercial, financial, agricultural and other
|
$
|
5,548
|
|
$
|
12,153
|
|
$
|
10,282
|
|
$
|
394
|
|
|||||||
|
Real estate construction
|
—
|
|
—
|
|
—
|
|
—
|
|
|||||||||||
|
Residential real estate
|
10,625
|
|
12,470
|
|
11,366
|
|
355
|
|
|||||||||||
|
Commercial real estate
|
5,155
|
|
5,489
|
|
6,469
|
|
583
|
|
|||||||||||
|
Loans to individuals
|
347
|
|
383
|
|
353
|
|
19
|
|
|||||||||||
|
Subtotal
|
21,675
|
|
30,495
|
|
28,470
|
|
1,351
|
|
|||||||||||
|
With an allowance recorded:
|
|||||||||||||||||||
|
Commercial, financial, agricultural and other
|
16,866
|
|
21,094
|
|
$
|
3,478
|
|
9,391
|
|
96
|
|
||||||||
|
Real estate construction
|
—
|
|
—
|
|
—
|
|
—
|
|
—
|
|
|||||||||
|
Residential real estate
|
456
|
|
478
|
|
107
|
|
167
|
|
—
|
|
|||||||||
|
Commercial real estate
|
954
|
|
954
|
|
128
|
|
143
|
|
4
|
|
|||||||||
|
Loans to individuals
|
—
|
|
—
|
|
—
|
|
—
|
|
—
|
|
|||||||||
|
Subtotal
|
18,276
|
|
22,526
|
|
3,713
|
|
9,701
|
|
100
|
|
|||||||||
|
Total
|
$
|
39,951
|
|
$
|
53,021
|
|
$
|
3,713
|
|
$
|
38,171
|
|
$
|
1,451
|
|
||||
|
Acquired Loans:
|
|||||||||||||||||||
|
With no related allowance recorded:
|
|||||||||||||||||||
|
Commercial, financial, agricultural and other
|
$
|
436
|
|
$
|
449
|
|
$
|
476
|
|
$
|
—
|
|
|||||||
|
Real estate construction
|
—
|
|
—
|
|
25
|
|
—
|
|
|||||||||||
|
Residential real estate
|
666
|
|
965
|
|
535
|
|
—
|
|
|||||||||||
|
Commercial real estate
|
940
|
|
1,842
|
|
2,135
|
|
—
|
|
|||||||||||
|
Loans to individuals
|
17
|
|
17
|
|
6
|
|
—
|
|
|||||||||||
|
Subtotal
|
2,059
|
|
3,273
|
|
3,177
|
|
—
|
|
|||||||||||
|
With an allowance recorded:
|
|||||||||||||||||||
|
Commercial, financial, agricultural and other
|
—
|
|
—
|
|
$
|
—
|
|
—
|
|
—
|
|
||||||||
|
Real estate construction
|
—
|
|
—
|
|
—
|
|
—
|
|
—
|
|
|||||||||
|
Residential real estate
|
93
|
|
122
|
|
4
|
|
74
|
|
—
|
|
|||||||||
|
Commercial real estate
|
137
|
|
150
|
|
29
|
|
155
|
|
—
|
|
|||||||||
|
Loans to individuals
|
—
|
|
—
|
|
—
|
|
—
|
|
—
|
|
|||||||||
|
Subtotal
|
230
|
|
272
|
|
33
|
|
229
|
|
—
|
|
|||||||||
|
Total
|
$
|
2,289
|
|
$
|
3,545
|
|
$
|
33
|
|
$
|
3,406
|
|
$
|
—
|
|
||||
79
|
|
2016
|
||||||||||||||
|
Originated
|
Acquired
|
||||||||||||||
|
|
Average
recorded investment |
Interest
Income Recognized |
Average
recorded investment |
Interest
Income Recognized |
|||||||||||
|
|
(dollars in thousands)
|
||||||||||||||
|
With no related allowance recorded:
|
|||||||||||||||
|
Commercial, financial, agricultural and other
|
$
|
23,146
|
|
$
|
576
|
|
$
|
—
|
|
$
|
—
|
|
|||
|
Real estate construction
|
4
|
|
44
|
|
—
|
|
—
|
|
|||||||
|
Residential real estate
|
10,957
|
|
312
|
|
406
|
|
—
|
|
|||||||
|
Commercial real estate
|
6,718
|
|
170
|
|
162
|
|
—
|
|
|||||||
|
Loans to individuals
|
409
|
|
15
|
|
3
|
|
—
|
|
|||||||
|
Subtotal
|
41,234
|
|
1,117
|
|
571
|
|
—
|
|
|||||||
|
With an allowance recorded:
|
|||||||||||||||
|
Commercial, financial, agricultural and other
|
13,885
|
|
99
|
|
—
|
|
—
|
|
|||||||
|
Real estate construction
|
—
|
|
—
|
|
—
|
|
—
|
|
|||||||
|
Residential real estate
|
241
|
|
4
|
|
16
|
|
—
|
|
|||||||
|
Commercial real estate
|
555
|
|
25
|
|
—
|
|
—
|
|
|||||||
|
Loans to individuals
|
—
|
|
—
|
|
—
|
|
—
|
|
|||||||
|
Subtotal
|
14,681
|
|
128
|
|
16
|
|
—
|
|
|||||||
|
Total
|
$
|
55,915
|
|
$
|
1,245
|
|
$
|
587
|
|
$
|
—
|
|
|||
Unfunded commitments related to nonperforming loans were
$1.6 million
and
$2.4 million
at
December 31, 2018
and
2017
, respectively. After considering the collateral related to these commitments, a reserve of
$12 thousand
and
$178 thousand
was established for these off balance sheet exposures at
December 31, 2018
and
2017
, respectively.
Troubled debt restructured loans are those loans whose terms have been renegotiated to provide a reduction or deferral of principal or interest as a result of the financial difficulties experienced by the borrower, who could not obtain comparable terms from alternate financing sources.
The following table provides detail as to the total troubled debt restructured loans and total commitments outstanding on troubled debt restructured loans as of
December 31
:
|
2018
|
2017
|
2016
|
|||||||||
|
|
(dollars in thousands)
|
||||||||||
|
Troubled debt restructured loans
|
|||||||||||
|
Accrual status
|
$
|
8,757
|
|
$
|
11,563
|
|
$
|
13,790
|
|
||
|
Nonaccrual status
|
11,761
|
|
11,222
|
|
11,569
|
|
|||||
|
Total
|
$
|
20,518
|
|
$
|
22,785
|
|
$
|
25,359
|
|
||
|
Commitments
|
|||||||||||
|
Letters of credit
|
$
|
60
|
|
$
|
60
|
|
$
|
—
|
|
||
|
Unused lines of credit
|
1,027
|
|
54
|
|
358
|
|
|||||
|
Total
|
$
|
1,087
|
|
$
|
114
|
|
$
|
358
|
|
||
80
The following tables provide detail, including specific reserve and reasons for modification, related to loans identified as troubled debt restructurings during the years ending
December 31
:
|
|
2018
|
|||||||||||||||||||||||||
|
|
|
Type of Modification
|
|
|
|
|||||||||||||||||||||
|
|
Number
of Contracts |
Extend
Maturity |
Modify
Rate |
Modify
Payments |
Total
Pre-Modification Outstanding Recorded Investment |
Post-
Modification Outstanding Recorded Investment |
Specific
Reserve |
|||||||||||||||||||
|
|
(dollars in thousands)
|
|||||||||||||||||||||||||
|
Commercial, financial, agricultural and other
|
3
|
|
$
|
74
|
|
$
|
—
|
|
$
|
8,250
|
|
$
|
8,324
|
|
$
|
6,104
|
|
$
|
—
|
|
||||||
|
Residential real estate
|
37
|
|
242
|
|
241
|
|
1,316
|
|
1,799
|
|
1,638
|
|
—
|
|
||||||||||||
|
Commercial real estate
|
3
|
|
—
|
|
—
|
|
1,016
|
|
1,016
|
|
975
|
|
—
|
|
||||||||||||
|
Loans to individuals
|
15
|
|
—
|
|
89
|
|
53
|
|
142
|
|
112
|
|
—
|
|
||||||||||||
|
Total
|
58
|
|
$
|
316
|
|
$
|
330
|
|
$
|
10,635
|
|
$
|
11,281
|
|
$
|
8,829
|
|
$
|
—
|
|
||||||
|
|
2017
|
|||||||||||||||||||||||||
|
|
|
Type of Modification
|
|
|
|
|||||||||||||||||||||
|
|
Number
of Contracts |
Extend
Maturity |
Modify
Rate |
Modify
Payments |
Total
Pre-Modification Outstanding Recorded Investment |
Post-
Modification Outstanding Recorded Investment |
Specific
Reserve |
|||||||||||||||||||
|
|
(dollars in thousands)
|
|||||||||||||||||||||||||
|
Commercial, financial, agricultural and other
|
6
|
|
$
|
6,768
|
|
$
|
1,806
|
|
$
|
987
|
|
$
|
9,561
|
|
$
|
6,946
|
|
$
|
566
|
|
||||||
|
Residential real estate
|
20
|
|
134
|
|
261
|
|
573
|
|
968
|
|
851
|
|
1
|
|
||||||||||||
|
Commercial real estate
|
5
|
|
179
|
|
—
|
|
269
|
|
448
|
|
412
|
|
29
|
|
||||||||||||
|
Loans to individuals
|
10
|
|
—
|
|
28
|
|
49
|
|
77
|
|
65
|
|
—
|
|
||||||||||||
|
Total
|
41
|
|
$
|
7,081
|
|
$
|
2,095
|
|
$
|
1,878
|
|
$
|
11,054
|
|
$
|
8,274
|
|
$
|
596
|
|
||||||
|
|
2016
|
|||||||||||||||||||||||||
|
|
|
Type of Modification
|
|
|
|
|||||||||||||||||||||
|
|
Number
of Contracts |
Extend
Maturity |
Modify
Rate |
Modify
Payments |
Total
Pre-Modification Outstanding Recorded Investment |
Post-
Modification Outstanding Recorded Investment |
Specific
Reserve |
|||||||||||||||||||
|
|
(dollars in thousands)
|
|||||||||||||||||||||||||
|
Commercial, financial, agricultural and other
|
5
|
|
$
|
23
|
|
$
|
6,318
|
|
$
|
3,854
|
|
$
|
10,195
|
|
$
|
6,210
|
|
$
|
317
|
|
||||||
|
Residential real estate
|
39
|
|
107
|
|
214
|
|
2,619
|
|
2,940
|
|
2,698
|
|
124
|
|
||||||||||||
|
Commercial real estate
|
8
|
|
1,368
|
|
—
|
|
25
|
|
1,393
|
|
1,271
|
|
59
|
|
||||||||||||
|
Loans to individuals
|
13
|
|
23
|
|
82
|
|
25
|
|
130
|
|
96
|
|
—
|
|
||||||||||||
|
Total
|
65
|
|
$
|
1,521
|
|
$
|
6,614
|
|
$
|
6,523
|
|
$
|
14,658
|
|
$
|
10,275
|
|
$
|
500
|
|
||||||
The troubled debt restructurings included in the above tables are also included in the impaired loan tables provided earlier in this footnote. Loans defined as modified due to a change in rate include loans that were modified for a change in rate as well as a reamortization of the principal and an extension of the maturity. For the years ended
December 31, 2018
,
2017
and
2016
,
$0.3 million
,
$0.3 million
and
$6.6 million
, respectively, of total rate modifications represent loans with modifications to the rate as well as payment due to reamortization.
81
A troubled debt restructuring is considered to be in default when a restructured loan is
90 days
or more past due. The following table provides information related to loans that were restructured within the past twelve months and that were considered to be in default during the year ending
December 31
:
|
|
2018
|
2017
|
2016
|
|||||||||||||||||
|
|
Number of
Contracts |
Recorded
Investment |
Number of
Contracts |
Recorded
Investment |
Number of
Contracts |
Recorded
Investment |
||||||||||||||
|
|
(dollars in thousands)
|
|||||||||||||||||||
|
Residential real estate
|
1
|
|
$
|
49
|
|
—
|
|
$
|
—
|
|
4
|
|
$
|
313
|
|
|||||
|
Loans to individuals
|
—
|
|
—
|
|
1
|
|
2
|
|
—
|
|
—
|
|
||||||||
|
Total
|
1
|
|
$
|
49
|
|
1
|
|
$
|
2
|
|
4
|
|
$
|
313
|
|
|||||
The following tables provide detail related to the allowance for credit losses for the years ended
December 31
.
|
|
2018
|
||||||||||||||||||||||
|
|
Commercial,
financial, agricultural and other |
Real estate
construction |
Residential
real estate |
Commercial
real estate |
Loans to
individuals |
Total
|
|||||||||||||||||
|
|
(dollars in thousands)
|
||||||||||||||||||||||
|
Allowance for credit losses:
|
|||||||||||||||||||||||
|
Originated Loans:
|
|||||||||||||||||||||||
|
Beginning balance
|
$
|
23,418
|
|
$
|
1,349
|
|
$
|
2,753
|
|
$
|
17,328
|
|
$
|
3,404
|
|
$
|
48,252
|
|
|||||
|
Charge-offs
|
(5,201
|
)
|
—
|
|
(1,217
|
)
|
(3,930
|
)
|
(4,554
|
)
|
(14,902
|
)
|
|||||||||||
|
Recoveries
|
746
|
|
135
|
|
233
|
|
153
|
|
579
|
|
1,846
|
|
|||||||||||
|
Provision (credit)
|
272
|
|
518
|
|
2,165
|
|
4,831
|
|
4,604
|
|
12,390
|
|
|||||||||||
|
Ending balance
|
19,235
|
|
2,002
|
|
3,934
|
|
18,382
|
|
4,033
|
|
47,586
|
|
|||||||||||
|
Acquired Loans:
|
|||||||||||||||||||||||
|
Beginning balance
|
$
|
11
|
|
$
|
—
|
|
$
|
6
|
|
$
|
29
|
|
$
|
—
|
|
$
|
46
|
|
|||||
|
Charge-offs
|
(93
|
)
|
—
|
|
(96
|
)
|
—
|
|
(22
|
)
|
(211
|
)
|
|||||||||||
|
Recoveries
|
42
|
|
6
|
|
128
|
|
—
|
|
26
|
|
202
|
|
|||||||||||
|
Provision (credit)
|
179
|
|
(6
|
)
|
(3
|
)
|
(25
|
)
|
(4
|
)
|
141
|
|
|||||||||||
|
Ending balance
|
139
|
|
—
|
|
35
|
|
4
|
|
—
|
|
178
|
|
|||||||||||
|
Total ending balance
|
$
|
19,374
|
|
$
|
2,002
|
|
$
|
3,969
|
|
$
|
18,386
|
|
$
|
4,033
|
|
$
|
47,764
|
|
|||||
|
Ending balance: individually evaluated for impairment
|
$
|
928
|
|
$
|
—
|
|
$
|
107
|
|
$
|
596
|
|
$
|
—
|
|
$
|
1,631
|
|
|||||
|
Ending balance: collectively evaluated for impairment
|
18,446
|
|
2,002
|
|
3,862
|
|
17,790
|
|
4,033
|
|
46,133
|
|
|||||||||||
|
Loans:
|
|||||||||||||||||||||||
|
Ending balance
|
1,138,473
|
|
358,978
|
|
1,562,405
|
|
2,123,544
|
|
590,739
|
|
5,774,139
|
|
|||||||||||
|
Ending balance: individually evaluated for impairment
|
11,631
|
|
—
|
|
3,747
|
|
5,710
|
|
—
|
|
21,088
|
|
|||||||||||
|
Ending balance: collectively evaluated for impairment
|
1,126,842
|
|
358,978
|
|
1,558,658
|
|
2,117,834
|
|
590,739
|
|
5,753,051
|
|
|||||||||||
82
|
|
2017
|
||||||||||||||||||||||
|
|
Commercial,
financial, agricultural and other |
Real estate
construction |
Residential
real estate |
Commercial
real estate |
Loans to
individuals |
Total
|
|||||||||||||||||
|
|
(dollars in thousands)
|
||||||||||||||||||||||
|
Allowance for credit losses:
|
|||||||||||||||||||||||
|
Originated Loans:
|
|||||||||||||||||||||||
|
Beginning balance
|
$
|
35,974
|
|
$
|
577
|
|
$
|
2,492
|
|
$
|
6,619
|
|
$
|
4,504
|
|
$
|
50,166
|
|
|||||
|
Charge-offs
|
(6,176
|
)
|
—
|
|
(1,261
|
)
|
(340
|
)
|
(4,220
|
)
|
(11,997
|
)
|
|||||||||||
|
Recoveries
|
3,900
|
|
465
|
|
304
|
|
274
|
|
460
|
|
5,403
|
|
|||||||||||
|
Provision (credit)
|
(10,280
|
)
|
307
|
|
1,218
|
|
10,775
|
|
2,660
|
|
4,680
|
|
|||||||||||
|
Ending balance
|
23,418
|
|
1,349
|
|
2,753
|
|
17,328
|
|
3,404
|
|
48,252
|
|
|||||||||||
|
Acquired Loans:
|
|||||||||||||||||||||||
|
Beginning balance
|
$
|
—
|
|
$
|
—
|
|
$
|
19
|
|
$
|
—
|
|
$
|
—
|
|
$
|
19
|
|
|||||
|
Charge-offs
|
(458
|
)
|
—
|
|
(26
|
)
|
—
|
|
(28
|
)
|
(512
|
)
|
|||||||||||
|
Recoveries
|
1
|
|
5
|
|
67
|
|
4
|
|
55
|
|
132
|
|
|||||||||||
|
Provision (credit)
|
468
|
|
(5
|
)
|
(54
|
)
|
25
|
|
(27
|
)
|
407
|
|
|||||||||||
|
Ending balance
|
11
|
|
—
|
|
6
|
|
29
|
|
—
|
|
46
|
|
|||||||||||
|
Total ending balance
|
$
|
23,429
|
|
$
|
1,349
|
|
$
|
2,759
|
|
$
|
17,357
|
|
$
|
3,404
|
|
$
|
48,298
|
|
|||||
|
Ending balance: individually evaluated for impairment
|
$
|
3,478
|
|
$
|
—
|
|
$
|
111
|
|
$
|
157
|
|
$
|
—
|
|
$
|
3,746
|
|
|||||
|
Ending balance: collectively evaluated for impairment
|
19,951
|
|
1,349
|
|
2,648
|
|
17,200
|
|
3,404
|
|
44,552
|
|
|||||||||||
|
Loans:
|
|||||||||||||||||||||||
|
Ending balance
|
1,163,383
|
|
248,868
|
|
1,426,370
|
|
2,019,096
|
|
549,659
|
|
5,407,376
|
|
|||||||||||
|
Ending balance: individually evaluated for impairment
|
22,450
|
|
—
|
|
6,698
|
|
6,003
|
|
—
|
|
35,151
|
|
|||||||||||
|
Ending balance: collectively evaluated for impairment
|
1,140,933
|
|
248,868
|
|
1,419,672
|
|
2,013,093
|
|
549,659
|
|
5,372,225
|
|
|||||||||||
|
|
2016
|
||||||||||||||||||||||
|
|
Commercial,
financial, agricultural and other |
Real estate
construction |
Residential
real estate |
Commercial
real estate |
Loans to
individuals |
Total
|
|||||||||||||||||
|
|
(dollars in thousands)
|
||||||||||||||||||||||
|
Allowance for credit losses:
|
|||||||||||||||||||||||
|
Beginning balance
|
$
|
31,035
|
|
$
|
887
|
|
$
|
2,606
|
|
$
|
11,924
|
|
$
|
4,360
|
|
$
|
50,812
|
|
|||||
|
Charge-offs
|
(19,603
|
)
|
—
|
|
(1,189
|
)
|
(570
|
)
|
(4,943
|
)
|
(26,305
|
)
|
|||||||||||
|
Recoveries
|
4,164
|
|
562
|
|
481
|
|
1,522
|
|
469
|
|
7,198
|
|
|||||||||||
|
Provision (credit)
|
20,378
|
|
(872
|
)
|
594
|
|
(6,257
|
)
|
4,618
|
|
18,461
|
|
|||||||||||
|
Ending balance on originated loans
|
35,974
|
|
577
|
|
2,492
|
|
6,619
|
|
4,504
|
|
50,166
|
|
|||||||||||
|
Ending balance on acquired loans (1)
|
—
|
|
—
|
|
19
|
|
—
|
|
—
|
|
19
|
|
|||||||||||
|
Ending balance
|
$
|
35,974
|
|
$
|
577
|
|
$
|
2,511
|
|
$
|
6,619
|
|
$
|
4,504
|
|
$
|
50,185
|
|
|||||
|
Ending balance: individually evaluated for impairment
|
$
|
2,530
|
|
$
|
—
|
|
$
|
180
|
|
$
|
434
|
|
$
|
—
|
|
$
|
3,144
|
|
|||||
|
Ending balance: collectively evaluated for impairment
|
33,444
|
|
577
|
|
2,331
|
|
6,185
|
|
4,504
|
|
47,041
|
|
|||||||||||
|
Loans:
|
|||||||||||||||||||||||
|
Ending balance
|
1,139,547
|
|
219,621
|
|
1,229,192
|
|
1,742,210
|
|
548,777
|
|
4,879,347
|
|
|||||||||||
|
Ending balance: individually evaluated for impairment
|
22,325
|
|
—
|
|
5,875
|
|
5,468
|
|
—
|
|
33,668
|
|
|||||||||||
|
Ending balance: collectively evaluated for impairment
|
1,117,222
|
|
219,621
|
|
1,223,317
|
|
1,736,742
|
|
548,777
|
|
4,845,679
|
|
|||||||||||
(1)
Amount reflects provision expense and ending allowance balance for loans acquired in 2016 as part of the purchase of FirstMerit branches.
83
Note 12—Commitments and Letters of Credit
First Commonwealth is a party to financial instruments with off-balance sheet risk in the normal course of business to meet the financial needs of its customers. These financial instruments include commitments to extend credit, standby letters of credit and commercial letters of credit. Those instruments involve, to varying degrees, elements of credit and interest rate risk in excess of the amount recognized in the Consolidated Statements of Financial Condition. First Commonwealth’s exposure to credit loss in the event of nonperformance by the other party of the financial instrument for commitments to extend credit, standby letters of credit and commercial letters of credit is represented by the contract or notional amount of those instruments. First Commonwealth uses the same credit policies for underwriting all loans, including these commitments and conditional obligations.
As of
December 31, 2018
and
2017
, First Commonwealth did not own or trade other financial instruments with significant off-balance sheet risk including derivatives such as futures, forwards, option contracts and the like, although such instruments may be appropriate to use in the future to manage interest rate risk. See Note 8, “Derivatives,” for a description of interest rate derivatives entered into by First Commonwealth.
Standby letters of credit and commercial letters of credit are conditional commitments issued by First Commonwealth to guarantee the performance of a customer to a third party. The contract or notional amount of these instruments reflects the maximum amount of future payments that First Commonwealth could be required to pay under the guarantees if there were a total default by the guaranteed parties, without consideration for possible recoveries under recourse provisions or from collateral held or pledged. In addition, many of these commitments are expected to expire without being drawn upon; therefore, the total commitment amounts do not necessarily represent future cash requirements.
The following table identifies the notional amount of those instruments at
December 31
:
|
2018
|
2017
|
||||||
|
|
(dollars in thousands)
|
||||||
|
Financial instruments whose contract amounts represent credit risk:
|
|||||||
|
Commitments to extend credit
|
$
|
1,883,914
|
|
$
|
1,840,180
|
|
|
|
Financial standby letters of credit
|
18,298
|
|
17,946
|
|
|||
|
Performance standby letters of credit
|
22,027
|
|
20,472
|
|
|||
|
Commercial letters of credit
|
887
|
|
1,149
|
|
|||
Commitments to extend credit are agreements to lend to a customer as long as there is no violation of any condition established in the contract. Commitments generally have fixed expiration dates or other termination clauses and may require payment of a fee. Since many of the commitments are expected to expire without being drawn upon, the total commitment amounts do not necessarily represent future cash requirements. First Commonwealth evaluates each customer’s creditworthiness on a case-by-case basis. The amount of collateral obtained, if deemed necessary by First Commonwealth upon extension of credit, is based on management’s credit evaluation of the counterparty. Collateral that is held varies but may include accounts receivable, inventory, property, plant and equipment, and residential and income-producing commercial properties.
The notional amounts outstanding at
December 31, 2018
include amounts issued in
2018
of
$1.8 million
in financial standby letters of credit and
$3.2 million
in performance standby letters of credit. There were
no
commercial letters of credit issued during
2018
. A liability of
$0.2 million
has been recorded as of both
December 31, 2018
and
2017
, which represents the estimated fair value of letters of credit issued. The fair value of letters of credit is estimated based on the unrecognized portion of fees received at the time the commitment was issued.
Unused commitments and letters of credit provide exposure to future credit loss in the event of nonperformance by the borrower or guaranteed parties. Management’s evaluation of the credit risk in these commitments resulted in the recording of a liability of
$5.0 million
and
$5.2 million
as of
December 31, 2018
and
2017
, respectively. This liability is reflected in
“
Other liabilities
”
in the Consolidated Statements of Financial Condition. The credit risk evaluation incorporated probability of default, loss given default and estimated utilization for the next twelve months for each loan category and the letters of credit.
84
Note 13—Premises and Equipment
Premises and equipment are described as follows:
|
Estimated Useful Life
|
2018
|
2017
|
|||||||
|
(dollars in thousands)
|
|||||||||
|
Land
|
Indefinite
|
$
|
15,359
|
|
$
|
15,389
|
|
||
|
Buildings and improvements
|
10-50 years
|
78,643
|
|
88,386
|
|
||||
|
Leasehold improvements
|
5-40 years
|
27,573
|
|
17,812
|
|
||||
|
Furniture and equipment
|
3-7 years
|
67,735
|
|
64,609
|
|
||||
|
Software
|
3-7 years
|
38,800
|
|
37,434
|
|
||||
|
Subtotal
|
228,110
|
|
223,630
|
|
|||||
|
Less accumulated depreciation and amortization
|
147,636
|
|
142,291
|
|
|||||
|
Total premises and equipment
|
$
|
80,474
|
|
$
|
81,339
|
|
|||
Depreciation related to premises and equipment included in noninterest expense for the years ended
December 31, 2018
,
2017
and
2016
amounted to
$9.5 million
,
$9.0 million
and
$7.5 million
, respectively.
First Commonwealth leases various premises and assorted equipment under non-cancellable agreements. Total future minimal rental commitments at
December 31, 2018
, were as follows:
|
Premises
|
Equipment
|
||||||
|
(dollars in thousands)
|
|||||||
|
2019
|
$
|
4,871
|
|
$
|
74
|
|
|
|
2020
|
4,965
|
|
28
|
|
|||
|
2021
|
4,965
|
|
13
|
|
|||
|
2022
|
4,899
|
|
5
|
|
|||
|
2023
|
4,928
|
|
—
|
|
|||
|
Thereafter
|
44,777
|
|
—
|
|
|||
|
Total
|
$
|
69,405
|
|
$
|
120
|
|
|
Included in the lease commitments above is
$141 thousand
in lease payments to be paid under a sale-leaseback arrangement. The sale-leaseback transaction occurred in 2005 and resulted in a gain of
$297 thousand
on the sale of a branch that is being recognized over the
15 year
lease term through 2020.
Increases in utilities and taxes that may be passed on to the lessee under the terms of various lease agreements are not reflected in the above table. However, certain lease agreements provide for increases in rental payments based upon historical increases in the consumer price index or the lessor’s cost of operating the facility, and are included in the minimum lease commitments. Additionally, the table above includes rent expense that is recognized for rent holidays and during construction periods. Total lease expense amounted to
$4.1 million
,
$2.7 million
and
$3.7 million
in
2018
,
2017
and
2016
, respectively.
Note 14—Goodwill and Other Amortizing Intangible Assets
FASB ASC Topic 350-20, “Intangibles—Goodwill and Other,” requires an annual valuation of the fair value of a reporting unit that has goodwill and a comparison of the fair value to the book value of equity to determine whether the goodwill has been impaired. Goodwill is also required to be tested on an interim basis if an event or circumstance indicates that it is more likely than not that an impairment loss has been incurred. When triggering events or circumstances indicate goodwill testing is required, an assessment of qualitative factors can be completed before performing the two step goodwill impairment test. ASU 2011-8 provides that if an assessment of qualitative factors determines it is more likely than not that the fair value of a reporting unit exceeds its carrying amount, then the two step goodwill impairment test is not required.
We consider First Commonwealth to be one reporting unit. The carrying amount of goodwill as of
December 31, 2018
and
2017
was
$274.2 million
and
$255.4 million
, respectively. The
$18.8 million
increase in goodwill during the year ended
December 31, 2018
is primarily a result of the Garfield acquisition.
No
impairment charges on goodwill or other intangible assets were incurred in
2018
,
2017
or
2016
.
85
We test goodwill for impairment as of November 30th each year and again at any quarter-end if any material events occur during a quarter that may affect goodwill.
An assessment of qualitative factors was completed as of November 30, 2018 and
December 31, 2018
and indicated that it is more likely than not that the fair value of First Commonwealth's goodwill exceeds its carrying amount; therefore, the two step goodwill impairment test was not considered necessary. The assessment of qualitative factors considered historical and projected financial performance, macroeconomic factors such as the Company's access to capital, the general business climate and changes in the banking industry as well as market considerations such as geographic expansion, new product offerings and the regulatory environment.
As of
December 31, 2018
, goodwill was not considered impaired; however, changing economic conditions that may adversely affect our performance, the fair value of our assets and liabilities, or our stock price could result in impairment, which could adversely affect earnings in future periods. Management will continue to monitor events that could impact this conclusion in the future.
FASB ASC Topic 350, “Intangibles—Other,” also requires that an acquired intangible asset be separately recognized if the benefit of the intangible asset is obtained through contractual or other legal rights, or if the asset can be sold, transferred, licensed, rented or exchanged, regardless of the acquirer’s intent to do so.
The following table summarizes other intangible assets:
|
Gross
Intangible
Assets
|
Accumulated
Amortization
|
Net
Intangible
Assets
|
|||||||||
|
|
(dollars in thousands)
|
||||||||||
|
December 31, 2018
|
|||||||||||
|
Customer deposit intangibles
|
$
|
20,228
|
|
$
|
(8,877
|
)
|
$
|
11,351
|
|
||
|
Customer list intangible
|
2,283
|
|
(1,069
|
)
|
1,214
|
|
|||||
|
Total other intangible assets
|
$
|
22,511
|
|
$
|
(9,946
|
)
|
$
|
12,565
|
|
||
|
December 31, 2017
|
|||||||||||
|
Customer deposit intangibles
|
$
|
19,471
|
|
$
|
(6,071
|
)
|
$
|
13,400
|
|
||
|
Customer list intangible
|
2,283
|
|
(751
|
)
|
1,532
|
|
|||||
|
Total other intangible assets
|
$
|
21,754
|
|
$
|
(6,822
|
)
|
$
|
14,932
|
|
||
Core deposits are amortized over their expected lives using the present value of the benefit of the core deposits and straight-line methods of amortization. The core deposits have a remaining amortization period of
9.3
years and a weighted average amortization period of approximately
8.0
years. The customer list intangible represents the estimated value of the customer base for an insurance agency acquired in 2014 and the wealth management business acquired as part of the DCB acquisition in 2017. These amounts are amortized over their expected lives using expected cash flows based on retention of the customer base. The customer list intangible has a remaining amortization period of
10.7
years and a weighted average amortization period of
8.9
years. In the table above, the change in the gross customer deposit intangible and customer list intangibles from
December 31, 2017
to
December 31, 2018
is due to the Garfield acquisition resulting in
$1.2 million
of core deposit intangibles. In addition to customer deposit intangibles and customer list intangibles, First Commonwealth has mortgage servicing rights of
$0.5 million
and
$0.1 million
as
December 31, 2018
and
2017
, respectively, related to the sale of 1-4 family residential mortgages for which we retain servicing. First Commonwealth recognized amortization expense on other intangible assets of
$3.1 million
,
$3.1 million
, and
$0.5 million
for the years ended
December 31, 2018
,
2017
and
2016
, respectively.
86
The following presents the estimated amortization expense of core deposit and customer list intangibles:
|
|
Core Deposit Intangibles
|
Customer List Intangible
|
Total
|
||||||
|
|
(dollars in thousands)
|
||||||||
|
2019
|
$
|
2,542
|
|
$
|
271
|
|
$
|
2,813
|
|
|
2020
|
2,177
|
|
230
|
|
2,407
|
|
|||
|
2021
|
1,869
|
|
193
|
|
2,062
|
|
|||
|
2022
|
1,560
|
|
159
|
|
1,719
|
|
|||
|
2023
|
1,252
|
|
127
|
|
1,379
|
|
|||
|
Thereafter
|
1,951
|
|
234
|
|
2,185
|
|
|||
|
Total
|
$
|
11,351
|
|
$
|
1,214
|
|
$
|
12,565
|
|
Note 15—Interest-Bearing Deposits
Components of interest-bearing deposits at December 31 were as follows:
|
2018
|
2017
|
||||||
|
|
(dollars in thousands)
|
||||||
|
Interest-bearing demand deposits
|
$
|
180,209
|
|
$
|
187,281
|
|
|
|
Savings deposits
|
3,401,354
|
|
3,361,840
|
|
|||
|
Time deposits
|
850,216
|
|
614,813
|
|
|||
|
Total interest-bearing deposits
|
$
|
4,431,779
|
|
$
|
4,163,934
|
|
|
Interest-bearing deposits at
December 31, 2018
and
2017
, include allocations from interest-bearing demand deposit accounts of
$952.1 million
and
$919.1 million
, respectively, into savings, which includes money market accounts. These reallocations are based on a formula and have been made to reduce First Commonwealth’s reserve requirement in compliance with regulatory guidelines.
Included in time deposits at
December 31, 2018
and
2017
, were certificates of deposit in denominations of
$250 thousand
or more of
$140.2 million
and
$61.5 million
, respectively.
Interest expense related to certificates of deposit in denominations of
$250 thousand
or greater amounted to
$1.6 million
in
2018
,
$0.5 million
in
2017
and
$0.5 million
in
2016
.
Included in time deposits at
December 31, 2018
, were certificates of deposit with the following scheduled maturities (dollars in thousands):
|
2019
|
$
|
509,206
|
|
|
2020
|
198,525
|
|
|
|
2021
|
111,012
|
|
|
|
2022
|
20,135
|
|
|
|
2023 and thereafter
|
11,338
|
|
|
|
Total
|
$
|
850,216
|
|
87
Note 16—Short-term Borrowings
Short-term borrowings at December 31 were as follows:
|
|
2018
|
2017
|
2016
|
|||||||||||||||||||||||||||||
|
|
Ending
Balance |
Average
Balance |
Average
Rate |
Ending
Balance |
Average
Balance |
Average
Rate |
Ending
Balance |
Average
Balance |
Average
Rate |
|||||||||||||||||||||||
|
|
(dollars in thousands)
|
|||||||||||||||||||||||||||||||
|
Federal funds purchased
|
$
|
11,000
|
|
$
|
8,801
|
|
2.05
|
%
|
$
|
—
|
|
$
|
6,225
|
|
1.24
|
%
|
$
|
—
|
|
$
|
6,887
|
|
0.60
|
%
|
||||||||
|
Borrowings from FHLB
|
565,000
|
|
467,594
|
|
2.12
|
|
567,500
|
|
710,932
|
|
1.18
|
|
748,000
|
|
1,265,932
|
|
0.61
|
|
||||||||||||||
|
Securities sold under agreements to repurchase
|
145,823
|
|
142,562
|
|
0.44
|
|
139,966
|
|
150,234
|
|
0.24
|
|
119,943
|
|
114,918
|
|
0.23
|
|
||||||||||||||
|
Total
|
$
|
721,823
|
|
$
|
618,957
|
|
1.74
|
|
$
|
707,466
|
|
$
|
867,391
|
|
1.01
|
|
$
|
867,943
|
|
$
|
1,387,737
|
|
0.58
|
|
||||||||
|
Maximum total at any month-end
|
$
|
811,026
|
|
$
|
967,259
|
|
$
|
1,530,678
|
|
|||||||||||||||||||||||
|
Weighted average rate at year-end
|
2.17
|
%
|
1.27
|
%
|
0.63
|
%
|
||||||||||||||||||||||||||
Interest expense on short-term borrowings for the years ended December 31 is detailed below:
|
2018
|
2017
|
2016
|
|||||||||
|
|
(dollars in thousands)
|
||||||||||
|
Federal funds purchased
|
$
|
180
|
|
$
|
77
|
|
$
|
41
|
|
||
|
Borrowings from FHLB
|
9,929
|
|
8,360
|
|
7,765
|
|
|||||
|
Securities sold under agreements to repurchase
|
632
|
|
362
|
|
270
|
|
|||||
|
Total interest on short-term borrowings
|
$
|
10,741
|
|
$
|
8,799
|
|
$
|
8,076
|
|
||
Note 17—Subordinated Debentures
Subordinated debentures outstanding at December 31 are as follows:
|
|
|
2018
|
2017
|
||||||||||
|
|
Due
|
Amount
|
Rate
|
Amount
|
Rate
|
||||||||
|
|
|
(dollars in thousands)
|
|||||||||||
|
Owed to:
|
|||||||||||||
|
First Commonwealth Bank
|
2028
|
$
|
49,131
|
|
4.875% until June 1, 2023, then LIBOR + 1.845%
|
||||||||
|
First Commonwealth Bank
|
2033
|
$
|
48,990
|
|
5.50% until June 1, 2028,
then LIBOR + 2.37% |
||||||||
|
First Commonwealth Capital Trust II
|
2034
|
$
|
30,929
|
|
LIBOR + 2.85
|
$
|
30,929
|
|
LIBOR + 2.85
|
||||
|
First Commonwealth Capital Trust III
|
2034
|
41,238
|
|
LIBOR + 2.85
|
41,238
|
|
LIBOR + 2.85
|
||||||
|
Total
|
$
|
170,288
|
|
$
|
72,167
|
|
|||||||
On May 21, 2018, First Commonwealth Bank issued ten-year subordinated notes with an aggregate principal amount of
$50.0 million
and a fixed-to-floating rate of
4.875%
. The rate remains fixed until June 1, 2023, then adjusts on a quarterly basis to LIBOR +
1.845%
. The Bank may redeem the notes, beginning with the interest payment due on June 1, 2023, in whole or in part at a redemption price equal to 100% of the principal amount of the subordinated notes, plus accrued and unpaid interest to the date of redemption. Deferred issuance costs of
$0.9 million
are being amortized on a straight-line basis over the term of the notes.
On May 21, 2018, First Commonwealth Bank also issued fifteen-year subordinated notes with an aggregate principal amount of
$50.0 million
and a fixed-to-floating rate of
5.50%
. The rate remains fixed until June 1, 2028, then adjusts on a quarterly basis to LIBOR +
2.37%
. The Bank may redeem the notes, beginning with the interest payment due on June 1, 2028, in whole or in part at a redemption price equal to 100% of the principal amount of the subordinated notes, plus accrued and unpaid interest to the date of redemption. Deferred issuance costs of
$1.1 million
are being amortized on a straight-line basis over the term of the notes.
88
First Commonwealth currently has
two
trusts, First Commonwealth Capital Trust II and First Commonwealth Capital Trust III, of which
100%
of the common equity is owned by First Commonwealth. The trusts were formed for the purpose of issuing company obligated mandatorily redeemable capital securities to third-party investors and investing the proceeds from the sale of the capital securities solely in junior subordinated debt securities (“subordinated debentures”) of First Commonwealth. The subordinated debentures held by each trust are the sole assets of the trust.
Interest on the debentures issued to First Commonwealth Capital Trust III is paid quarterly at a floating rate of LIBOR +
2.85%
which is reset quarterly. Subject to regulatory approval, First Commonwealth may redeem the debentures, in whole or in part, at its option on any interest payment date at a redemption price equal to
100%
of the principal amount of the debentures, plus accrued and unpaid interest to the date of the redemption. Deferred issuance costs of
$630 thousand
are being amortized on a straight-line basis over the term of the securities.
Interest on the debentures issued to First Commonwealth Capital Trust II is paid quarterly at a floating rate of LIBOR +
2.85%
, which is reset quarterly. Subject to regulatory approval, First Commonwealth may redeem the debentures, in whole or in part, at its option at a redemption price equal to
100%
of the principal amount of the debentures, plus accrued and unpaid interest to the date of the redemption. Deferred issuance costs of
$471 thousand
are being amortized on a straight-line basis over the term of the securities.
Note 18—Other Long-term Debt
Other long-term debt at December 31 follows:
|
2018
|
2017
|
||||||||||||
|
Amount
|
Weighted
Average Contractual Rate |
Amount
|
Weighted
Average Contractual Rate |
||||||||||
|
(dollars in thousands)
|
|||||||||||||
|
Borrowings from FHLB due:
|
|||||||||||||
|
2018
|
$
|
607
|
|
3.83
|
%
|
||||||||
|
2019
|
$
|
631
|
|
3.83
|
%
|
631
|
|
3.83
|
|
||||
|
2020
|
655
|
|
3.84
|
|
656
|
|
3.84
|
|
|||||
|
2021
|
681
|
|
3.84
|
|
681
|
|
3.84
|
|
|||||
|
2022
|
708
|
|
3.85
|
|
708
|
|
3.85
|
|
|||||
|
2023
|
735
|
|
3.85
|
|
|||||||||
|
Thereafter
|
4,141
|
|
3.79
|
|
4,878
|
|
3.80
|
|
|||||
|
Total
|
$
|
7,551
|
|
$
|
8,161
|
|
|||||||
The weighted average contractual rate reflects the rate due to creditors. There are no purchase accounting adjustments related to long-term debt in
2018
or
2017
. Therefore, the weighted average effective rate of long-term debt is equal to the weighted average contractual rate of long-term debt.
All of First Commonwealth’s Federal Home Loan Bank stock, along with an interest in mortgage loans and residential mortgage backed securities, has been pledged as collateral with the Federal Home Loan Bank of Pittsburgh.
Capital securities included in total long-term debt on the Consolidated Statements of Financial Condition are excluded from the above, but are described in Note 17, “Subordinated Debentures.”
Note 19—Fair Values of Assets and Liabilities
FASB ASC Topic 820, “Fair Value Measurements and Disclosures,” requires disclosures for non-financial assets and non-financial liabilities, except for items that are recognized or disclosed at fair value in the financial statements on a recurring basis (at least annually). All non-financial assets are included either as a separate line item on the Consolidated Statements of Financial Condition or in the “Other assets” category of the Consolidated Statements of Financial Condition. Currently, First Commonwealth does not have any non-financial liabilities to disclose.
FASB ASC Topic 825, “Financial Instruments,” permits entities to irrevocably elect to measure select financial instruments and certain other items at fair value. The unrealized gains and losses are required to be included in earnings each reporting period
89
for the items that fair value measurement is elected. First Commonwealth has elected not to measure any existing financial instruments at fair value under FASB ASC Topic 825; however, in the future we may elect to adopt this guidance for select financial instruments.
In accordance with FASB ASC Topic 820, First Commonwealth groups financial assets and financial liabilities measured at fair value in three levels, based on the principal markets in which the assets and liabilities are transacted and the observability of the data points used to determine fair value. These levels are:
|
•
|
Level 1—Valuations for assets and liabilities traded in active exchange markets, such as the New York Stock Exchange (“NYSE”). Valuations are obtained from readily available pricing sources for market transactions involving identical assets or liabilities.
|
|
•
|
Level 2—Valuations for assets and liabilities traded in less active dealer or broker markets. Valuations are obtained for identical or comparable assets or liabilities from alternative pricing sources with reasonable levels of price transparency. Level 2 includes Obligations of U.S. Government securities issued by Agencies and Sponsored Enterprises, Obligations of States and Political Subdivisions, certain corporate securities, FHLB stock, loans held for sale, interest rate derivatives (including interest rate swaps, interest rate caps and risk participation agreements), certain other real estate owned and certain impaired loans.
|
Level 2 investment securities are valued by a recognized third party pricing service using observable inputs. The model used by the pricing service varies by asset class and incorporates available market, trade and bid information as well as cash flow information when applicable. Because many fixed-income investment securities do not trade on a daily basis, the model uses available information such as benchmark yield curves, benchmarking of like investment securities, sector groupings and matrix pricing. The model will also use processes such as an option-adjusted spread to assess the impact of interest rates and to develop prepayment estimates. Market inputs normally used in the pricing model include benchmark yields, reported trades, broker/dealer quotes, issuer spreads, two-sided markets, benchmark securities, bids, offers and reference data including market research publications.
Management validates the market values provided by the third party service by having another recognized pricing service price
100%
of the securities on an annual basis and a random sample of securities each quarter, monthly monitoring of variances from prior period pricing and, on a monthly basis, evaluating pricing changes compared to expectations based on changes in the financial markets.
Other Investments include FHLB stock whose estimated fair value is based on its par value. Additional information on FHLB stock is provided in Note 10, “Impairment of Investment Securities.”
Loans held for sale include residential mortgage loans originated for sale in the secondary mortgage market. The estimated fair value for these loans was determined on the basis of rates obtained in the respective secondary market. This category also includes the Small Business Administration guaranteed portion of small business loans. The estimated fair value of these loans is based on the contract with the third party investor.
Interest rate derivatives are reported at estimated fair value utilizing Level 2 inputs and are included in "Other assets" and "Other liabilities" in the Consolidated Statements of Financial Condition. These consist of interest rate swaps where there is no significant deterioration in the counterparties' (loan customers') credit risk since origination of the interest rate swap as well as interest rate caps and risk participation agreements. First Commonwealth values its interest rate swap and cap positions using a yield curve by taking market prices/rates for an appropriate set of instruments. The set of instruments currently used to determine the U.S. Dollar yield curve includes cash LIBOR rates from overnight to one year, Eurodollar futures contracts and swap rates from one year to thirty years. These yield curves determine the valuations of interest rate swaps. Interest rate derivatives are further described in Note 8, “Derivatives.”
For purposes of potential valuation adjustments to our derivative positions, First Commonwealth evaluates the credit risk of its counterparties as well as our own credit risk. Accordingly, we have considered factors such as the likelihood of default, expected loss given default, net exposures and remaining contractual life, among other things, in determining if any estimated fair value adjustments related to credit risk are required. We review our counterparty exposure quarterly, and when necessary, appropriate adjustments are made to reflect the exposure.
We also utilize this approach to estimate our own credit risk on derivative liability positions. In
2018
and
2017
, we have not realized any losses due to a counterparty's inability to pay any net uncollateralized position.
Interest rate derivatives also include interest rate forwards entered into to hedge residential mortgage loans held for sale and the related interest-rate lock commitments. This includes forward commitments to sell mortgage loans. The fair value of these derivative financial instruments are based on derivative market data inputs as of the valuation date and the underlying value of mortgage loans for rate lock commitments.
90
In addition, the Company hedges foreign currency risk through the use of foreign exchange forward contracts. The fair value of foreign exchange forward contracts is based on the differential between the contract price and the market-based forward rate.
The estimated fair value for other real estate owned included in Level 2 is determined by either an independent market based appraisal less estimated costs to sell or an executed sales agreement.
|
•
|
Level 3—Valuations for assets and liabilities that are derived from other valuation methodologies, including option pricing models, discounted cash flow models and similar techniques, and not based on market exchange, dealer or broker traded transactions. If the inputs used to provide the valuation are unobservable and/or there is very little, if any, market activity for the security or similar securities, the securities would be considered Level 3 securities. Level 3 valuations incorporate certain assumptions and projections in determining the fair value assigned to such assets or liabilities. The assets included in Level 3 are pooled trust preferred collateralized debt obligations, non-marketable equity investments, certain interest rate derivatives, certain impaired loans and certain other real estate.
|
Level 3 assets at December 31, 2017 included pooled trust preferred collateralized debt obligations with an estimated fair value of
$23.6 million
. During the first six-months of 2018, the entire portfolio of trust preferred securities were liquidated either by a successful auction call or by sale. These securities were considered level 3 because there was little or no active trading since 2009; therefore, it is more appropriate to determine estimated fair value using a discounted cash flow analysis. When determining the fair value of these securities, the discount rate applied to the cash flows was determined by evaluating the current market yields for comparable corporate and structured credit products along with an evaluation of the risks associated with the cash flows of the comparable security.
The estimated fair value of the other investments included in Level 3 is based on carrying value.
The estimated fair value of limited partnership investments included in Level 3 is based on par value.
In accordance with ASU 2011-4, the following table provides information related to quantitative inputs and assumptions used in Level 3 fair value measurements.
|
Fair Value
(dollars in thousands) |
Valuation Technique
|
Unobservable Inputs
|
Range / (weighted
average) |
|||||
|
Other Investments
|
1,670
|
|
Carrying Value
|
N/A
|
N/A
|
|||
|
Impaired Loans
|
1,104
|
|
(a)
|
Gas Reserve study
|
Discount rate
|
10.00%
|
||
|
Gas per MMBTU
|
$2.81 - $3.35 (b)
|
|||||||
|
Oil per BBL/d
|
$51.59 - $59.55 (b)
|
|||||||
|
3,249
|
|
(a)
|
Discounted Cash Flow
|
Discount Rate
|
1.9% - 9.5%
|
|||
|
Limited Partnership Investments
|
2,696
|
|
Par Value
|
N/A
|
N/A
|
|||
|
(a)
|
the remainder of impaired loans valued using Level 3 inputs are not included in this disclosure as the values of those loans are based on bankruptcy agreement documentation.
|
|
(b)
|
unobservable inputs are defined as follows: MMBTU—one million British thermal units; BBL/d—barrels per day.
|
The discount rate is the significant unobservable input used in the fair value measurement of impaired loans. Significant increases in this rate would result in a decrease in the estimated fair value of the loans, while a decrease in this rate would result in a higher fair value measurement. Other unobservable inputs in the fair value measurement of impaired loans relate to gas, oil and natural gas prices. Increases in these prices would result in an increase in the estimated fair value of the loans, while a decrease in these prices would result in a lower fair value measurement.
91
The tables below present the balances of assets and liabilities measured at fair value on a recurring basis at December 31:
|
|
2018
|
||||||||||||||
|
|
Level 1
|
Level 2
|
Level 3
|
Total
|
|||||||||||
|
|
(dollars in thousands)
|
||||||||||||||
|
Obligations of U.S. Government Agencies:
|
|||||||||||||||
|
Mortgage-Backed Securities—Residential
|
$
|
—
|
|
$
|
9,406
|
|
$
|
—
|
|
$
|
9,406
|
|
|||
|
Mortgage-Backed Securities—Commercial
|
—
|
|
167,744
|
|
—
|
|
167,744
|
|
|||||||
|
Obligations of U.S. Government-Sponsored Enterprises:
|
|||||||||||||||
|
Mortgage-Backed Securities—Residential
|
—
|
|
673,361
|
|
—
|
|
673,361
|
|
|||||||
|
Other Government-Sponsored Enterprises
|
—
|
|
10,012
|
|
—
|
|
10,012
|
|
|||||||
|
Obligations of States and Political Subdivisions
|
—
|
|
27,712
|
|
—
|
|
27,712
|
|
|||||||
|
Corporate Securities
|
—
|
|
21,012
|
|
—
|
|
21,012
|
|
|||||||
|
Total Securities Available for Sale
|
—
|
|
909,247
|
|
—
|
|
909,247
|
|
|||||||
|
Other Investments
|
—
|
|
30,456
|
|
1,670
|
|
32,126
|
|
|||||||
|
Loans Held for Sale
|
—
|
|
11,881
|
|
—
|
|
11,881
|
|
|||||||
|
Other Assets (a)
|
—
|
|
1,769
|
|
2,696
|
|
4,465
|
|
|||||||
|
Total Assets
|
$
|
—
|
|
$
|
953,353
|
|
$
|
4,366
|
|
$
|
957,719
|
|
|||
|
Other Liabilities (a)
|
$
|
—
|
|
$
|
2,081
|
|
$
|
—
|
|
$
|
2,081
|
|
|||
|
Total Liabilities
|
$
|
—
|
|
$
|
2,081
|
|
$
|
—
|
|
$
|
2,081
|
|
|||
|
(a)
|
Hedging and non-hedging interest rate derivatives and limited partnership investments
|
|
|
2017
|
||||||||||||||
|
|
Level 1
|
Level 2
|
Level 3
|
Total
|
|||||||||||
|
|
(dollars in thousands)
|
||||||||||||||
|
Obligations of U.S. Government Agencies:
|
|||||||||||||||
|
Mortgage-Backed Securities—Residential
|
$
|
—
|
|
$
|
11,338
|
|
$
|
—
|
|
$
|
11,338
|
|
|||
|
Mortgage-Backed Securities—Commercial
|
—
|
|
24,149
|
|
—
|
|
24,149
|
|
|||||||
|
Obligations of U.S. Government-Sponsored Enterprises:
|
|||||||||||||||
|
Mortgage-Backed Securities—Residential
|
—
|
|
625,555
|
|
—
|
|
625,555
|
|
|||||||
|
Other Government-Sponsored Enterprises
|
—
|
|
1,097
|
|
—
|
|
1,097
|
|
|||||||
|
Obligations of States and Political Subdivisions
|
—
|
|
27,410
|
|
—
|
|
27,410
|
|
|||||||
|
Corporate Securities
|
—
|
|
16,493
|
|
—
|
|
16,493
|
|
|||||||
|
Pooled Trust Preferred Collateralized Debt Obligations
|
—
|
|
—
|
|
23,646
|
|
23,646
|
|
|||||||
|
Total Debt Securities
|
—
|
|
706,042
|
|
23,646
|
|
729,688
|
|
|||||||
|
Equities
|
—
|
|
—
|
|
1,670
|
|
1,670
|
|
|||||||
|
Total Securities Available for Sale
|
—
|
|
706,042
|
|
25,316
|
|
731,358
|
|
|||||||
|
Other Investments
|
—
|
|
29,837
|
|
—
|
|
29,837
|
|
|||||||
|
Loans Held for Sale
|
—
|
|
14,850
|
|
—
|
|
14,850
|
|
|||||||
|
Other Assets (a)
|
—
|
|
1,778
|
|
2,143
|
|
3,921
|
|
|||||||
|
Total Assets
|
$
|
—
|
|
$
|
752,507
|
|
$
|
27,459
|
|
$
|
779,966
|
|
|||
|
Other Liabilities (a)
|
$
|
—
|
|
$
|
3,079
|
|
$
|
—
|
|
$
|
3,079
|
|
|||
|
Total Liabilities
|
$
|
—
|
|
$
|
3,079
|
|
$
|
—
|
|
$
|
3,079
|
|
|||
|
(a)
|
Hedging and non-hedging interest rate derivatives and limited partnership investments
|
92
The changes in Level 3 assets and liabilities measured at fair value on a recurring basis are summarized as follows for the year ended
December 31, 2018
:
|
Pooled Trust
Preferred Collateralized Debt Obligations |
Other Investments
|
Other
Assets |
Total
|
||||||||||||
|
|
(dollars in thousands)
|
||||||||||||||
|
Balance, beginning of year
|
$
|
23,646
|
|
$
|
1,670
|
|
$
|
2,143
|
|
$
|
27,459
|
|
|||
|
Total gains or losses
|
|||||||||||||||
|
Included in earnings
|
8,102
|
|
—
|
|
—
|
|
8,102
|
|
|||||||
|
Included in other comprehensive income
|
(118
|
)
|
—
|
|
—
|
|
(118
|
)
|
|||||||
|
Purchases, issuances, sales, and settlements
|
|||||||||||||||
|
Purchases
|
—
|
|
—
|
|
601
|
|
601
|
|
|||||||
|
Issuances
|
—
|
|
—
|
|
—
|
|
—
|
|
|||||||
|
Sales
|
(12,289
|
)
|
—
|
|
—
|
|
(12,289
|
)
|
|||||||
|
Settlements
|
(19,341
|
)
|
—
|
|
(48
|
)
|
(19,389
|
)
|
|||||||
|
Transfers from Level 3
|
—
|
|
—
|
|
—
|
|
—
|
|
|||||||
|
Transfers into Level 3
|
—
|
|
—
|
|
—
|
|
—
|
|
|||||||
|
Balance, end of year
|
$
|
—
|
|
$
|
1,670
|
|
$
|
2,696
|
|
$
|
4,366
|
|
|||
There are no gains or losses included in earnings for the period that are attributable to the change in realized gains (losses) relating to assets held at
December 31, 2018
.
During the year ended
December 31, 2018
, there were no transfers between fair value Levels 1, 2 or 3.
The changes in Level 3 assets and liabilities measured at fair value on a recurring basis are summarized as follows for the year ended
December 31, 2017
:
|
Pooled Trust
Preferred Collateralized Debt Obligations |
Equities
|
Other
Assets |
Total
|
|||||||||||||
|
|
(dollars in thousands)
|
|||||||||||||||
|
Balance, beginning of year
|
$
|
33,292
|
|
$
|
1,670
|
|
$
|
930
|
|
$
|
35,892
|
|
||||
|
Total gains or losses
|
||||||||||||||||
|
Included in earnings
|
4,329
|
|
—
|
|
—
|
|
4,329
|
|
||||||||
|
Included in other comprehensive income
|
3,725
|
|
—
|
|
—
|
|
3,725
|
|
||||||||
|
Purchases, issuances, sales, and settlements
|
||||||||||||||||
|
Purchases
|
—
|
|
—
|
|
1,213
|
|
1,213
|
|
||||||||
|
Issuances
|
—
|
|
—
|
|
—
|
|
—
|
|
||||||||
|
Sales
|
—
|
|
—
|
|
—
|
|
—
|
|
||||||||
|
Settlements
|
(17,700
|
)
|
—
|
|
—
|
|
(17,700
|
)
|
||||||||
|
Transfers from Level 3
|
—
|
|
—
|
|
—
|
|
—
|
|
||||||||
|
Transfers into Level 3
|
—
|
|
—
|
|
—
|
|
—
|
|
||||||||
|
Balance, end of year
|
$
|
23,646
|
|
$
|
1,670
|
|
$
|
2,143
|
|
$
|
27,459
|
|
||||
There are no gains or losses included in earnings for the period that are attributable to the change in realized gains (losses) relating to assets held at
December 31, 2017
.
During the year ended
December 31, 2017
, there were no transfers between fair value Levels 1, 2 or 3.
93
The tables below present the balances of assets measured at fair value on a nonrecurring basis at December 31 and total gains and losses realized on these assets during the year ended December 31:
|
|
2018
|
||||||||||||||||||
|
Level 1
|
Level 2
|
Level 3
|
Total
|
Total
Gains (Losses) |
|||||||||||||||
|
|
(dollars in thousands)
|
||||||||||||||||||
|
Impaired loans
|
$
|
—
|
|
$
|
15,076
|
|
$
|
15,320
|
|
$
|
30,396
|
|
$
|
(1,778
|
)
|
||||
|
Other real estate owned
|
—
|
|
4,035
|
|
—
|
|
4,035
|
|
(593
|
)
|
|||||||||
|
Total Assets
|
$
|
—
|
|
$
|
19,111
|
|
$
|
15,320
|
|
$
|
34,431
|
|
$
|
(2,371
|
)
|
||||
|
|
2017
|
||||||||||||||||||
|
|
Level 1
|
Level 2
|
Level 3
|
Total
|
Total
Gains (Losses) |
||||||||||||||
|
|
(dollars in thousands)
|
||||||||||||||||||
|
Impaired loans
|
$
|
—
|
|
$
|
23,249
|
|
$
|
15,245
|
|
$
|
38,494
|
|
$
|
(1,548
|
)
|
||||
|
Other real estate owned
|
—
|
|
3,264
|
|
—
|
|
3,264
|
|
(1,099
|
)
|
|||||||||
|
Total Assets
|
$
|
—
|
|
$
|
26,513
|
|
$
|
15,245
|
|
$
|
41,758
|
|
$
|
(2,647
|
)
|
||||
Impaired loans over
$100 thousand
are individually reviewed to determine the amount of each loan considered to be at risk of noncollection. The fair value for impaired loans that are collateral based is determined by reviewing real property appraisals, equipment valuations, accounts receivable listings and other financial information. A discounted cash flow analysis is performed to determine fair value for impaired loans when an observable market price or a current appraisal is not available. For real estate secured loans, First Commonwealth’s loan policy requires updated appraisals be obtained at least every twelve months on all impaired loans with balances of
$250 thousand
and over. For real estate secured loans with balances under
$250 thousand
, we rely on broker price opinions. For non-real estate secured assets, the Company normally relies on third party valuations specific to the collateral type.
The fair value for other real estate owned, determined by either an independent market based appraisal less estimated costs to sell or an executed sales agreement, is classified as Level 2. The fair value for other real estate owned determined using an internal valuation is classified as Level 3. Other real estate owned has a current carrying value of
$3.9 million
as of
December 31, 2018
and consisted primarily of commercial real estate properties in Pennsylvania. We review whether events and circumstances subsequent to a transfer to other real estate owned have occurred that indicate the balance of those assets may not be recoverable. If events and circumstances indicate further impairment, we will record a charge to the extent that the carrying value of the assets exceed their fair values, less estimated costs to sell, as determined by valuation techniques appropriate in the circumstances.
Certain other assets and liabilities, including goodwill, core deposit intangibles and customer list intangibles are measured at fair value on a nonrecurring basis; that is, the instruments are not measured at fair value on an ongoing basis but are subject to fair value adjustments only in certain circumstances. Additional information related to this measurement is provided in Note 14 “Goodwill and Other Amortizing Intangible Assets.” There were no other assets or liabilities measured at fair value on a nonrecurring basis during
2018
.
FASB ASC Topic 825-10, “Transition Related to FSP FAS 107-1” and APB 28-1, “Interim Disclosures about Fair Value of Financial Instruments,” requires disclosure of the fair value of financial assets and financial liabilities, including those financial assets and financial liabilities that are not measured and reported at fair value on a recurring basis or nonrecurring basis. The methodologies for estimating the fair value of financial assets and financial liabilities that are measured at fair value on a recurring or nonrecurring basis are as discussed above. The methodologies for other financial assets and financial liabilities are discussed below.
Cash and due from banks and interest bearing bank deposits
: The carrying amounts for cash and due from banks and interest-bearing bank deposits approximate the estimated fair values of such assets.
Securities
: Fair values for available for sale and held to maturity securities are based on quoted market prices, if available. If quoted market prices are not available, fair values are based on quoted market prices of comparable instruments. Pooled trust preferred collateralized debt obligation values are derived from other valuation methodologies, including option pricing models, discounted cash flow models and similar techniques, and are not based on market exchange, dealer or broker traded transactions. These valuations incorporate certain assumptions and projections in determining the fair value assigned to each
94
instrument. The carrying value of other investments, which includes FHLB stock, is considered a reasonable estimate of fair value.
Loans held for sale
: The estimated fair value of loans held for sale is based on market bids obtained from potential buyers.
Loans:
The fair values of all loans are estimated by discounting the estimated future cash flows using interest rates currently offered for loans with similar terms to borrowers of similar credit quality adjusted for past due and nonperforming loans.
Off-balance sheet instruments
: Many of First Commonwealth’s off-balance sheet instruments, primarily loan commitments and standby letters of credit, are expected to expire without being drawn upon; therefore, the commitment amounts do not necessarily represent future cash requirements. FASB ASC Topic 460, “Guarantees,” clarified that a guarantor is required to recognize, at the inception of a guarantee, a liability for the fair value of the obligation undertaken in issuing the guarantee. The carrying amount and estimated fair value for standby letters of credit was
$0.2 million
at both
December 31, 2018
and
2017
, See Note 12, “Commitments and Letters of Credit,” for additional information.
Deposit liabilities
: The estimated fair value of demand deposits, savings accounts and money market deposits is the amount payable on demand at the reporting date because of the customers' ability to withdraw funds immediately. The carrying value of variable rate time deposit accounts and certificates of deposit approximate the fair value at the report date. Also, fair values of fixed rate time deposits for both periods are estimated by discounting the future cash flows using interest rates currently being offered and a schedule of aggregated expected maturities.
Short-term borrowings
: The fair values of borrowings from the FHLB were estimated based on the estimated incremental borrowing rate for similar types of borrowings. The carrying amounts of other short-term borrowings, such as federal funds purchased and securities sold under agreement to repurchase, were used to approximate fair value due to the short-term nature of the borrowings.
Subordinated debt, long-term debt and capital lease obligation
: The fair value of long-term debt and subordinated debt is estimated by discounting the future cash flows using First Commonwealth’s estimate of the current market rate for similar types of borrowing arrangements.
95
The following table presents carrying amounts and estimated fair values of First Commonwealth’s financial instruments at December 31:
|
|
2018
|
||||||||||||||||||
|
|
|
Fair Value Measurements Using:
|
|||||||||||||||||
|
|
Carrying
Amount |
Total
|
Level 1
|
Level 2
|
Level 3
|
||||||||||||||
|
|
(dollars in thousands)
|
||||||||||||||||||
|
Financial assets
|
|||||||||||||||||||
|
Cash and due from banks
|
$
|
95,934
|
|
$
|
95,934
|
|
$
|
95,934
|
|
$
|
—
|
|
$
|
—
|
|
||||
|
Interest-bearing deposits
|
3,013
|
|
3,013
|
|
3,013
|
|
—
|
|
—
|
|
|||||||||
|
Securities available for sale
|
909,247
|
|
909,247
|
|
—
|
|
909,247
|
|
—
|
|
|||||||||
|
Securities held to maturity
|
393,855
|
|
383,993
|
|
—
|
|
383,993
|
|
—
|
|
|||||||||
|
Other investments
|
32,126
|
|
32,126
|
|
—
|
|
30,456
|
|
1,670
|
|
|||||||||
|
Loans held for sale
|
11,881
|
|
11,881
|
|
—
|
|
11,881
|
|
—
|
|
|||||||||
|
Loans
|
5,774,139
|
|
5,821,791
|
|
—
|
|
15,076
|
|
5,806,715
|
|
|||||||||
|
Financial liabilities
|
|||||||||||||||||||
|
Deposits
|
5,897,992
|
|
5,904,147
|
|
—
|
|
5,904,147
|
|
—
|
|
|||||||||
|
Short-term borrowings
|
721,823
|
|
721,532
|
|
—
|
|
721,532
|
|
—
|
|
|||||||||
|
Long-term debt
|
7,551
|
|
7,720
|
|
—
|
|
7,720
|
|
—
|
|
|||||||||
|
Subordinated debt
|
170,288
|
|
168,067
|
|
—
|
|
—
|
|
168,067
|
|
|||||||||
|
Capital lease obligation
|
7,217
|
|
7,217
|
|
—
|
|
7,217
|
|
—
|
|
|||||||||
|
|
2017
|
||||||||||||||||||
|
|
|
Fair Value Measurements Using:
|
|||||||||||||||||
|
|
Carrying
Amount |
Total
|
Level 1
|
Level 2
|
Level 3
|
||||||||||||||
|
|
(dollars in thousands)
|
||||||||||||||||||
|
Financial assets
|
|||||||||||||||||||
|
Cash and due from banks
|
$
|
98,624
|
|
$
|
98,624
|
|
$
|
98,624
|
|
$
|
—
|
|
$
|
—
|
|
||||
|
Interest-bearing deposits
|
8,668
|
|
8,668
|
|
8,668
|
|
—
|
|
—
|
|
|||||||||
|
Securities available for sale
|
731,358
|
|
731,358
|
|
—
|
|
706,042
|
|
25,316
|
|
|||||||||
|
Securities held to maturity
|
422,096
|
|
418,249
|
|
—
|
|
418,249
|
|
—
|
|
|||||||||
|
Other investments
|
29,837
|
|
29,837
|
|
—
|
|
29,837
|
|
—
|
|
|||||||||
|
Loans held for sale
|
14,850
|
|
14,850
|
|
—
|
|
14,850
|
|
—
|
|
|||||||||
|
Loans
|
5,407,376
|
|
5,443,434
|
|
—
|
|
23,249
|
|
5,420,185
|
|
|||||||||
|
Financial liabilities
|
|||||||||||||||||||
|
Deposits
|
5,580,705
|
|
5,580,812
|
|
—
|
|
5,580,812
|
|
—
|
|
|||||||||
|
Short-term borrowings
|
707,466
|
|
707,263
|
|
—
|
|
707,263
|
|
—
|
|
|||||||||
|
Long-term debt
|
8,161
|
|
8,548
|
|
—
|
|
8,548
|
|
—
|
|
|||||||||
|
Subordinated debt
|
72,167
|
|
65,785
|
|
—
|
|
—
|
|
65,785
|
|
|||||||||
|
Capital Lease Obligation
|
7,590
|
|
7,590
|
|
—
|
|
7,590
|
|
—
|
|
|||||||||
96
Note 20—Income Taxes
The income tax provision for the years ended December 31 is as follows:
|
2018
|
2017
|
2016
|
|||||||||
|
|
(dollars in thousands)
|
||||||||||
|
Current tax provision
|
|||||||||||
|
Federal
|
$
|
21,330
|
|
$
|
29,071
|
|
$
|
19,879
|
|
||
|
State
|
298
|
|
274
|
|
154
|
|
|||||
|
Total current tax provision
|
21,628
|
|
29,345
|
|
20,033
|
|
|||||
|
Deferred tax provision (benefit):
|
|||||||||||
|
Federal
|
3,666
|
|
19,237
|
|
5,846
|
|
|||||
|
State
|
(20
|
)
|
(21
|
)
|
(240
|
)
|
|||||
|
Total deferred tax provision
|
3,646
|
|
19,216
|
|
5,606
|
|
|||||
|
Total tax provision
|
$
|
25,274
|
|
$
|
48,561
|
|
$
|
25,639
|
|
||
The statutory to effective tax rate reconciliation for the years ended December 31 is as follows:
|
|
2018
|
2017
|
2016
|
|||||||||||||||||
|
|
Amount
|
% of
Pretax Income |
Amount
|
% of
Pretax Income |
Amount
|
% of
Pretax Income |
||||||||||||||
|
|
(dollars in thousands)
|
|||||||||||||||||||
|
Tax at statutory rate
|
$
|
27,882
|
|
21
|
%
|
$
|
36,304
|
|
35
|
%
|
$
|
29,830
|
|
35
|
%
|
|||||
|
Increase (decrease) resulting from:
|
||||||||||||||||||||
|
State income tax, net of federal benefit
|
220
|
|
—
|
|
164
|
|
—
|
|
(56
|
)
|
—
|
|
||||||||
|
Income from bank owned life insurance
|
(1,404
|
)
|
(1
|
)
|
(1,995
|
)
|
(2
|
)
|
(1,883
|
)
|
(2
|
)
|
||||||||
|
Tax-exempt interest income, net
|
(1,473
|
)
|
(1
|
)
|
(2,709
|
)
|
(3
|
)
|
(2,434
|
)
|
(3
|
)
|
||||||||
|
Tax credits
|
(5
|
)
|
—
|
|
(11
|
)
|
—
|
|
—
|
|
—
|
|
||||||||
|
Enactment of federal tax reform
|
(346
|
)
|
—
|
|
16,709
|
|
17
|
|
—
|
|
—
|
|
||||||||
|
Other
|
400
|
|
—
|
|
99
|
|
—
|
|
182
|
|
—
|
|
||||||||
|
Total tax provision
|
$
|
25,274
|
|
19
|
%
|
$
|
48,561
|
|
47
|
%
|
$
|
25,639
|
|
30
|
%
|
|||||
The total tax provision for financial reporting differs from the amount computed by applying the statutory federal income tax rate to income before taxes. First Commonwealth ordinarily generates an annual effective tax rate that is less than the statutory rate of
21%
for the year ending
December 31, 2018
and
35%
for the years ending
December 31, 2017
and
2016
due to benefits resulting from tax-exempt interest, income from bank owned life insurance, and tax benefits associated with low-income housing tax credits. The consistent level of tax benefits that reduce First Commonwealth’s tax rate below the statutory rate produced an annual effective tax rate of
19%
,
47%
and
30%
for the years ended
December 31, 2018
,
2017
and
2016
, respectively. The annual effective tax rate of
47%
for the year ended December 31, 2017, is greater than the
35%
statutory rate due to the enactment of federal tax reform.
On December 22, 2017, H.R.1, commonly known as the Tax Cuts and Jobs Act (the “Act”) was signed into law. The Act reduces the corporate federal tax rate from
35%
to
21%
effective January 1, 2018. As a result we are required to re-measure, through income tax expense, our deferred tax assets and liabilities using the enacted rate at which we expect them to be recovered or settled. The re-measurement of our net deferred tax asset resulted in additional income tax expense of
$16.7 million
in 2017.
Also on December 22, 2017, the U.S. Securities and Exchange Commission (“SEC”) released Staff Accounting Bulletin No. 118 (“SAB 118”) to address any uncertainty or diversity of views in practice in accounting for the income tax effects of the Act in situations where a registrant does not have the necessary information available, prepared, or analyzed in reasonable detail to complete this accounting in the reporting period that includes the enactment date. SAB 118 allows for a measurement period not to extend beyond one year from the Act’s enactment date to complete the necessary accounting.
97
We recorded provisional amounts of deferred income taxes using reasonable estimates in three areas where information necessary to complete the accounting was not available, prepared, or analyzed: 1) our deferred tax liability for temporary differences between the tax and financial reporting bases of fixed assets principally due to the accelerated depreciation under the Act which allows for full expensing of qualified property purchased and placed in service after September 27, 2017; 2) our deferred tax asset for temporary differences associated with accrued compensation will be finalized with payments made on or before March 15, 2018 and deducted on the 2017 income tax returns; and 3) our deferred tax assets and liabilities acquired from DCB Financial are awaiting completion of the final short period tax return from outside preparers, which is necessary to confirm the final acquired temporary differences.
In a fourth area, we made no adjustments to deferred tax assets representing future deductions for accrued compensation that may be subject to new limitations under Internal Revenue Code 162(m) which, generally, limits the annual deduction for certain compensation paid to employees to $1 million. There was uncertainty in applying the newly-enacted rules to existing contracts, and we are seeking further clarifications before completing our analysis.
In accordance with SAB 118, the accounting for income tax effects of the Act has been completed in the year ended
December 31, 2018
. The completion of the accounting resulted in an immaterial change to the previously recorded re-measurement.
The tax effects of temporary differences between the financial statement carrying amounts and the tax bases of assets and liabilities that represent significant portions of the deferred tax assets and liabilities at December 31 are presented below:
|
2018
|
2017
|
||||||
|
|
(dollars in thousands)
|
||||||
|
Deferred tax assets:
|
|||||||
|
Allowance for credit losses
|
$
|
10,116
|
|
$
|
10,223
|
|
|
|
Postretirement benefits other than pensions
|
311
|
|
345
|
|
|||
|
Alternative minimum tax credit carryforward
|
216
|
|
201
|
|
|||
|
Unrealized loss on securities available for sale
|
3,137
|
|
2,091
|
|
|||
|
Net operating loss carryforward
|
3,636
|
|
6,145
|
|
|||
|
Writedown of other real estate owned
|
711
|
|
878
|
|
|||
|
Deferred compensation
|
1,426
|
|
1,514
|
|
|||
|
Accrued interest on nonaccrual loans
|
629
|
|
1,017
|
|
|||
|
Accrued incentives
|
2,477
|
|
1,277
|
|
|||
|
Unfunded loan commitments & other reserves
|
1,064
|
|
1,098
|
|
|||
|
Deferred rent
|
799
|
|
801
|
|
|||
|
Other
|
1,486
|
|
1,224
|
|
|||
|
Total deferred tax assets
|
26,008
|
|
26,814
|
|
|||
|
Deferred tax liabilities:
|
|||||||
|
Income from unconsolidated subsidiary
|
(11
|
)
|
(380
|
)
|
|||
|
Depreciation of assets
|
(1,378
|
)
|
(587
|
)
|
|||
|
Other
|
(1,053
|
)
|
(338
|
)
|
|||
|
Total deferred tax liabilities
|
(2,442
|
)
|
(1,305
|
)
|
|||
|
Net deferred tax asset
|
$
|
23,566
|
|
$
|
25,509
|
|
|
The Company has approximately
$17.0 million
of federal net operating losses and
$0.2 million
of AMT carryforwards which are subject to an annual limitation under IRC Section 382. The net operating losses expire in 2030 and the Company expects to utilize the losses prior to expiration.
Management assesses all available positive and negative evidence to estimate if sufficient future taxable income will be generated to utilize the existing deferred tax assets. Based on our evaluation, as of
December 31, 2018
, management has determined that no valuation allowance is necessary for the deferred tax assets because it is more likely than not that these assets will be realized through future reversals of existing temporary differences and future taxable income.
In accordance with FASB ASC Topic 740-10, “Accounting for Uncertainty in Income Taxes”, the Company has
no
material unrecognized tax benefits or accrued interest and penalties as of
December 31, 2018
. We do not expect the total amount of
98
unrecognized tax benefits to significantly increase in the next twelve months. The Company records interest and penalties on unrecognized tax benefits as a component of noninterest expense.
First Commonwealth is subject to routine audits of our tax returns by the Internal Revenue Service (“IRS”) as well as all states in which we conduct business. Generally, tax years prior to the year ended
December 31, 2015
are no longer open to examination by federal and state taxing authorities.
Note 21—Retirement Plans
First Commonwealth has a savings plan pursuant to the provisions of section 401(k) of the Internal Revenue code. Effective January 1, 2013, a participating employee can receive a maximum matching contribution of
6%
of their compensation. In addition, each participating employee may contribute up to
80%
of their eligible compensation to the plan. The 401(k) plan expense was
$3.2 million
in
2018
,
$2.8 million
in
2017
, and
$2.5 million
in
2016
.
First Commonwealth maintains a Non-Qualified Deferred Compensation Plan (
“
NQDC Plan
”
) to provide deferred compensation for those employees who are in the top 7% of full-time employees, as determined on the basis of base compensation. The NQDC Plan provides participants whose maximum retirement contribution is limited by IRS rules to defer additional compensation.
Participants in the NQDC Plan are eligible to defer (on a pre-tax basis) from
1%
to
25%
of their eligible Plan compensation. Participants are also eligible to defer all or a portion of the Annual Incentive Plan (on a pre-tax basis) from 10% to 100% of their annual cash incentive earned. There was
no
NQDC Plan expense in
2018
,
2017
and
2016
.
Select employees from former acquisitions were covered by postretirement benefit plans which provide medical and life insurance coverage. The measurement date for these plans was December 31.
Postretirement Benefits Other than Pensions from Prior Acquisitions
Net periodic benefit cost of these plans for the years ended December 31, was as follows:
|
2018
|
2017
|
2016
|
|||||||||
|
|
(dollars in thousands)
|
||||||||||
|
Service cost
|
$
|
—
|
|
$
|
—
|
|
$
|
—
|
|
||
|
Interest cost on projected benefit obligation
|
38
|
|
49
|
|
67
|
|
|||||
|
Amortization of transition obligation
|
—
|
|
—
|
|
—
|
|
|||||
|
Gain amortization
|
(35
|
)
|
(21
|
)
|
(7
|
)
|
|||||
|
Net periodic benefit cost
|
$
|
3
|
|
$
|
28
|
|
$
|
60
|
|
||
99
The following table sets forth the change in the benefit obligation and plan assets as of December 31:
|
2018
|
2017
|
||||||
|
|
(dollars in thousands)
|
||||||
|
Change in Benefit Obligation
|
|||||||
|
Benefit obligation at beginning of year
|
$
|
1,188
|
|
$
|
1,394
|
|
|
|
Service cost
|
—
|
|
—
|
|
|||
|
Interest cost
|
38
|
|
49
|
|
|||
|
Amendments
|
—
|
|
—
|
|
|||
|
Actuarial gain
|
(174
|
)
|
(116
|
)
|
|||
|
Net benefits paid
|
(169
|
)
|
(133
|
)
|
|||
|
Benefit obligation at end of year
|
883
|
|
1,194
|
|
|||
|
Change in Plan Assets
|
|||||||
|
Fair value of plan assets at beginning of year
|
—
|
|
—
|
|
|||
|
Actual return on plan assets
|
—
|
|
—
|
|
|||
|
Employer contributions
|
169
|
|
133
|
|
|||
|
Net benefits paid
|
(169
|
)
|
(133
|
)
|
|||
|
Fair value of plan assets at end of year
|
—
|
|
—
|
|
|||
|
Funded Status at End of Year
|
883
|
|
1,194
|
|
|||
|
Unrecognized transition obligation
|
—
|
|
—
|
|
|||
|
Unrecognized net gain
|
584
|
|
440
|
|
|||
|
Amounts recognized in retained earnings
|
$
|
1,467
|
|
$
|
1,634
|
|
|
As of December 31, the funded status of the plan is:
|
2018
|
2017
|
||||||
|
|
(dollars in thousands)
|
||||||
|
Amounts Recognized in the Statement of Financial Condition as Other liabilities
|
$
|
883
|
|
$
|
1,194
|
|
|
The following table sets forth the amounts recognized in accumulated other comprehensive income that have not yet been recognized as components of net periodic benefit costs as of December 31:
|
2018
|
2017
|
2016
|
|||||||||
|
|
(dollars in thousands)
|
||||||||||
|
Amounts recognized in accumulated other comprehensive income, net of tax:
|
|||||||||||
|
Net (gain) loss
|
$
|
(461
|
)
|
$
|
(347
|
)
|
$
|
(225
|
)
|
||
|
Transition obligation
|
—
|
|
—
|
|
—
|
|
|||||
|
Total
|
$
|
(461
|
)
|
$
|
(347
|
)
|
$
|
(225
|
)
|
||
Weighted-average assumptions used to determine the benefit obligation as of December 31 are as follows:
|
2018
|
2017
|
2016
|
||||||
|
Weighted-Average Assumptions
|
||||||||
|
Discount rate
|
4.11
|
%
|
3.37
|
%
|
3.74
|
%
|
||
|
Health care cost trend: Initial
|
6.00
|
%
|
6.00
|
%
|
6.00
|
%
|
||
|
Health care cost trend: Ultimate
|
4.75
|
%
|
4.75
|
%
|
4.75
|
%
|
||
|
Year ultimate reached
|
2024
|
|
2023
|
|
2022
|
|
||
100
Weighted-average assumptions used to determine the net benefit costs as of December 31 are as follows:
|
2018
|
2017
|
2016
|
||||||
|
Weighted-Average Assumptions for Net Periodic Cost
|
||||||||
|
Discount rate
|
3.37
|
%
|
3.74
|
%
|
3.88
|
%
|
||
|
Health care cost trend: Initial
|
6.00
|
%
|
6.00
|
%
|
6.25
|
%
|
||
|
Health care cost trend: Ultimate
|
4.75
|
%
|
4.75
|
%
|
4.75
|
%
|
||
|
Year ultimate reached
|
2023
|
|
2022
|
|
2022
|
|
||
|
Corridor
|
10.00
|
%
|
10.00
|
%
|
10.00
|
%
|
||
|
Recognition period for gains and losses
|
12.1
|
|
11.0
|
|
11.0
|
|
||
The Medicare Prescription Drug, Improvement and Modernization Act of 2003 (the “Act”) introduced a prescription drug benefit under Medicare Part D and a federal subsidy to sponsors of retiree health care benefit plans that provide a prescription drug benefit that is at least actuarially equivalent to Medicare Part D. The postretirement plans of First Commonwealth are provided through insurance coverage; therefore, First Commonwealth will not receive a direct federal subsidy. The preceding measures of the accumulated postretirement benefit cost assume that First Commonwealth will not receive the subsidy due to the relatively small number of retirees.
The health care cost trend rate assumption can have a significant impact on the amounts reported for this plan. A one-percentage-point change in assumed health care cost trend rates would have the following effects:
|
One-Percentage-
Point Increase |
One-Percentage-
Point Decrease |
||||||
|
|
(dollars in thousands)
|
||||||
|
Effect on postretirement benefit obligation
|
$
|
17
|
|
$
|
(15
|
)
|
|
|
Effect on total of service and interest cost components
|
1
|
|
(1
|
)
|
|||
As of
December 31, 2018
, the projected benefit payments for the next ten years are as follows:
|
Projected Benefit
Payments |
|||
|
|
(dollars in thousands)
|
||
|
2019
|
$
|
109
|
|
|
2020
|
102
|
|
|
|
2021
|
97
|
|
|
|
2022
|
90
|
|
|
|
2023
|
84
|
|
|
|
2024 - 2028
|
328
|
|
|
The projected payments were calculated using the same assumptions as those used to calculate the benefit obligations included in this note.
The estimated costs that will be amortized from accumulated other comprehensive income into net periodic cost for
2019
are as follows (dollars in thousands):
|
|
Postretirement
Benefits |
||
|
|
(dollars in thousands)
|
||
|
Net gain
|
$
|
—
|
|
|
Transition obligation
|
(60
|
)
|
|
|
Total
|
$
|
(60
|
)
|
Note 22—Incentive Compensation Plan
On January 20, 2009, the Board of Directors of the Company adopted, with shareholder approval, the First Commonwealth Financial Corporation Incentive Compensation Plan. This plan allows for shares of common stock to be issued to employees, directors, and consultants of the Company and its subsidiaries as an incentive to aid in the financial success of the Company.
101
The shares can be issued as options, stock appreciation rights, performance share or unit awards, dividend or dividend equivalent rights, stock awards, restricted stock awards, or other annual incentive awards. Up to
5,000,000
shares of stock can be awarded under this plan, of which
3,156,378
shares were still eligible for awards as of
December 31, 2018
.
Restricted Stock
The following provides detail on the restricted stock awards which were issued and outstanding in
2018
,
2017
and
2016
in order to retain and attract key employees. The grant date fair value of the restricted stock awards is equal to the price of First Commonwealth’s common stock on grant date.
|
Grant Date
|
Shares issued
|
Grant Price
|
Vesting Date
|
Number of Equal Vesting Periods
|
|||
|
November 26, 2018
|
2,000
|
|
$
|
13.82
|
|
November 26, 2021
|
1
|
|
May 29, 2018
|
3,000
|
|
15.44
|
|
May 29, 2021
|
1
|
|
|
March 26, 2018
|
2,000
|
|
14.08
|
|
March 26, 2021
|
1
|
|
|
February 26, 2018
|
77,500
|
|
14.49
|
|
February 26, 2021
|
1
|
|
|
March 24, 2017
|
5,000
|
|
12.99
|
|
March 24, 2020
|
1
|
|
|
March 24, 2017
|
7,000
|
|
12.99
|
|
August 31, 2017
|
1
|
|
|
March 24, 2017
|
7,000
|
|
12.99
|
|
March 24, 2020
|
1
|
|
|
March 24, 2017
|
7,000
|
|
12.99
|
|
August 31, 2017
|
1
|
|
|
December 19, 2016
|
15,000
|
|
13.96
|
|
December 19, 2019
|
3
|
|
|
September 30, 2016
|
10,000
|
|
10.09
|
|
September 30, 2019
|
1
|
|
|
September 19, 2016
|
33,000
|
|
10.02
|
|
September 19, 2019
|
3
|
|
|
June 7, 2016
|
10,000
|
|
9.34
|
|
June 7, 2019
|
1
|
|
|
March 1, 2016
|
10,000
|
|
8.84
|
|
March 1, 2019
|
1
|
|
|
March 1, 2016
|
5,000
|
|
8.84
|
|
March 1, 2019
|
1
|
|
|
March 1, 2016
|
20,000
|
|
8.84
|
|
August 31, 2017
|
1
|
|
|
February 18, 2016
|
18,348
|
|
8.43
|
|
December 31, 2016
|
1
|
|
|
June 26, 2015
|
1,000
|
|
9.84
|
|
June 26, 2018
|
1
|
|
|
February 20, 2015
|
10,000
|
|
8.45
|
|
August 31, 2017
|
1
|
|
|
February 5, 2015
|
50,000
|
|
8.55
|
|
February 5, 2018
|
1
|
|
|
January 15, 2015
|
20,000
|
|
8.38
|
|
January 15, 2017
|
1
|
|
|
November 17, 2014
|
3,500
|
|
9.26
|
|
November 17, 2017
|
1
|
|
|
April 8, 2014
|
27,500
|
|
8.89
|
|
April 8, 2017
|
3
|
|
|
March 24, 2014
|
46,000
|
|
9.18
|
|
March 24, 2017
|
1
|
|
|
March 4, 2014
|
5,000
|
|
8.75
|
|
March 4, 2017
|
1
|
|
|
August 16, 2013
|
3,000
|
|
7.57
|
|
August 16, 2016
|
1
|
|
|
May 31, 2013
|
45,000
|
|
7.21
|
|
May 31, 2016
|
3
|
|
|
March 1, 2013
|
10,000
|
|
7.35
|
|
March 1, 2016
|
1
|
|
|
January 1, 2012
|
100,000
|
|
5.26
|
|
January 1, 2016
|
4
|
|
|
April 1, 2011
|
25,000
|
|
6.82
|
|
April 1, 2016
|
1
|
|
Compensation expense related to restricted stock was
$2.6 million
,
$3.8 million
and
$3.2 million
in
2018
,
2017
and
2016
, respectively. As of
December 31, 2018
, there was
$2.9 million
of unrecognized compensation cost related to unvested restricted stock awards granted.
102
A summary of the status of First Commonwealth’s unvested service-based restricted stock awards as of December 31 and changes for the years ended on those dates is presented below:
|
|
2018
|
2017
|
2016
|
|||||||||||||||||
|
|
Shares
|
Weighted
Average Grant Date Fair Value |
Shares
|
Weighted
Average Grant Date Fair Value |
Shares
|
Weighted
Average Grant Date Fair Value |
||||||||||||||
|
Outstanding, beginning of the year
|
117,000
|
|
$
|
9.99
|
|
247,668
|
|
$
|
9.34
|
|
231,834
|
|
$
|
8.01
|
|
|||||
|
Granted
|
84,500
|
|
14.50
|
|
26,000
|
|
12.99
|
|
121,348
|
|
9.88
|
|
||||||||
|
Vested
|
(54,000
|
)
|
9.37
|
|
(151,668
|
)
|
9.49
|
|
(105,514
|
)
|
7.04
|
|
||||||||
|
Forfeited
|
(10,000
|
)
|
9.34
|
|
(5,000
|
)
|
8.55
|
|
—
|
|
—
|
|
||||||||
|
Outstanding, end of the year
|
137,500
|
|
13.05
|
|
117,000
|
|
9.99
|
|
247,668
|
|
9.34
|
|
||||||||
The following provides detail on restricted stock awards estimated to be granted on a performance award basis during
2018
,
2017
and
2016
. These plans were previously approved by the Board of Directors.
|
Grant Date
|
Target Share Award
|
Performance Period (years)
|
Award if threshold met
|
Award if targets are met
|
Award if superior met
|
Award if threshold not achieved
|
Vesting After Performance Period (years)
|
Final vesting
|
|||||
|
January 28, 2013
|
128,611
|
|
3
|
40
|
%
|
100
|
%
|
200
|
%
|
—
|
%
|
1
|
December 31, 2016
|
|
January 27, 2014
|
125,000
|
|
3
|
40
|
%
|
100
|
%
|
200
|
%
|
—
|
%
|
0
|
December 31, 2016
|
|
January 26, 2015
|
125,000
|
|
3
|
40
|
%
|
100
|
%
|
200
|
%
|
—
|
%
|
0
|
December 31, 2017
|
|
December 30, 2015
|
60,000
|
|
5
|
0
|
December 31, 2020
|
||||||||
|
February 18, 2016
|
160,650
|
|
3
|
40
|
%
|
100
|
%
|
200
|
%
|
—
|
%
|
0
|
December 31, 2018
|
|
February 23, 2017
|
93,500
|
|
3
|
40
|
%
|
100
|
%
|
200
|
%
|
—
|
%
|
0
|
December 31, 2019
|
|
February 22, 2018
|
102,000
|
|
3
|
40
|
%
|
100
|
%
|
200
|
%
|
—
|
%
|
0
|
December 31, 2020
|
The following table summarizes the estimated unvested target share awards for the Plans as of December 31:
|
|
2018
|
2017
|
2016
|
|||||
|
Outstanding, beginning of the year
|
525,045
|
|
426,596
|
|
320,705
|
|
||
|
Granted
|
130,995
|
|
276,442
|
|
176,936
|
|
||
|
Issued
|
(149,480
|
)
|
(171,637
|
)
|
(18,348
|
)
|
||
|
Forfeited
|
(9,957
|
)
|
(6,356
|
)
|
(52,697
|
)
|
||
|
Outstanding, end of the year
|
496,603
|
|
525,045
|
|
426,596
|
|
||
The unvested target awards for the Plans have an estimated fair value of
$12.08
per share for the February 18, 2016 grant based on the closing price of Company stock as of
December 31, 2018
. The December 30, 2015 grant has a fair value of
$9.18
based the closing stock price when the shares were granted. Based on a Monte Carlo simulation, the February 23, 2017 grant has a fair value of
$13.29
per share for 75% of the grant and
$15.09
per share for 25% of the grant and the February 28, 2018 grant has a fair value of
$14.17
for 50% of the grant,
$13.25
for 25% of the grant and
$15.83
for the remaining 25% of the grant.
103
Note 23—Contingent Liabilities
Legal proceedings
First Commonwealth and its subsidiaries are subject in the normal course of business to various pending and threatened legal proceedings in which claims for monetary damages are asserted. As of
December 31, 2018
, management, after consultation with legal counsel, does not anticipate that the aggregate ultimate liability arising out of litigation pending or threatened against First Commonwealth or its subsidiaries will be material to First Commonwealth’s consolidated financial position. On at least a quarterly basis, First Commonwealth assesses its liabilities and contingencies in connection with such legal proceedings. For those matters where it is probable that First Commonwealth will incur losses and the amounts of the losses can be reasonably estimated, First Commonwealth records an expense and corresponding liability in its consolidated financial statements. To the extent the pending or threatened litigation could result in exposure in excess of that liability, the amount of such excess is not currently estimable. Although not considered probable, the range of reasonably possible losses for such matters in the aggregate, beyond the existing recorded liability (if any), is between
$0
and
$1 million
. Although First Commonwealth does not believe that the outcome of pending litigation will be material to First Commonwealth’s consolidated financial position, it cannot rule out the possibility that such outcomes will be material to the consolidated results of operations and cash flows for a particular reporting period in the future.
Note 24—Revenue Recognition
On January 1, 2018, the Company adopted ASU No. 2014-09 “Revenue from Contracts with Customers” (Topic 606) and all subsequent ASUs that modified Topic 606. The standard’s core principle is that a company will recognize revenue when it transfers promised goods or services to customers in an amount that reflects the consideration to which the company expects to be entitled in exchange for those goods or services. In doing so, First Commonwealth will generally be required to use more judgment and make more estimates than under current guidance. These may include identifying performance obligations in the contract, estimating the amount of variable consideration to include in the transaction price and allocating the transaction price to each separate performance obligation.
The Company adopted ASC 606 using the modified retrospective method applied to all contracts not completed as of January 1, 2018. Results for reporting periods beginning after January 1, 2018 are presented under Topic 606, while prior period amounts were not adjusted and continue to be reported in accordance with our historic accounting under Topic 605. The implementation of the new standard did not have a material impact on the measurement or recognition of revenue, therefore a cumulative effect adjustment to opening retained earnings was not necessary.
In connection with the adoption of Topic 606, First Commonwealth is required to capitalize, and subsequently amortize into expense, certain incremental costs of obtaining a contract with a customer if these costs are expected to be recovered. The incremental costs of obtaining a contract are those costs that an entity incurs to obtain a contract with a customer that it would not have incurred if the contract had not been obtained, for example, sales commission. The Company utilizes the practical expedient which allows entities to immediately expense contract acquisition costs when the asset that would have resulted from capitalizing these costs would have been amortized in one year or less. Upon adoption of Topic 606, the Company did not capitalize any contract acquisition cost.
The Company also evaluated whether it has any significant contract balances. A contract asset balance occurs when an entity performs a service for a customer before the customer pays consideration resulting in a contract receivable or before payment is due resulting in a contract asset. A contract liability balance is an entity’s obligation to transfer a service to a customer for which the Company has already received payment from the customer. First Commonwealth’s noninterest revenue streams are largely based on transactional activity, or standard month-end revenue accruals such as trust income which is based on month-end market values. Consideration is often received immediately or shortly after the Company satisfies its performance obligation and revenue is recognized. The Company does not typically enter into long-term revenue contracts with customers, and therefore, does not experience significant contract balances. As of
December 31, 2018
and
2017
, the Company did not have any significant contract balances.
Topic 606 does not apply to revenue associated with financial instruments, including revenue from loans and securities. In addition, certain noninterest income streams such as fees associated with derivatives are not in scope of the new guidance. Topic 606 is applicable to noninterest revenue streams such as trust income, service charges on deposits, insurance and retail brokerage commissions, card related interchange income and gain (loss) on sale of OREO. The recognition of these revenue streams did not change significantly upon adoption of Topic 606. Substantially all of the Company’s revenue is generated from contracts with customers.
Noninterest revenue streams in-scope of Topic 606 are discussed below:
104
Trust Income
Trust income is primarily comprised of fees earned from the management and administration of trusts and other customer assets. The Company’s performance obligation is generally satisfied over time and the resulting fees are recognized monthly, based upon a tiered scale of market value of the assets under management at month-end. Payment is generally received a few days after month end through a direct charge to customers’ accounts. The Company does not earn performance-based incentives. Optional services such as financial planning or tax return preparation services are also available to trust customers. The Company’s performance obligation for these transactional-based services is generally satisfied and related revenue recognized, at a point in time. Payment is received shortly after services are rendered.
Service Charges on Deposit Accounts
Service charges on deposit accounts consist of fees earned from its deposit customers for transaction-based, account maintenance, overdraft services and account analysis fees. Transaction-based fees, which include services such as ATM use fees, stop payment fees, statement rendering and ACH fees are recognized at the time the transaction is executed which is the point in time the Company fulfills the customer’s request. Monthly account maintenance fees are earned over the course of the month, representing the period over which the Company satisfies the performance obligation. Overdraft fees are recognized at the point in time that the overdraft occurs. The Company’s performance obligation for account analysis fees is generally satisfied, and the related revenue recognized, during the month the service is provided. Payment for service charges on deposit accounts is primarily received immediately or in the following month through a direct charge to customers’ accounts.
Insurance and Retail Brokerage Commissions
Insurance income primarily consists of commissions received from execution of personal, business and health insurance policies when acting as an agent on behalf of insurance carriers. The Company’s performance obligation is generally satisfied upon the issuance of the insurance policy. Because the Company’s contracts with the insurance carriers are generally cancellable by either party, with minimal notice, insurance commissions are recognized during the policy period as received. Also, the majority of insurance commissions are received on a monthly basis during the policy period, however some carriers pay the full annual commission to First Commonwealth at the time of policy issuance or renewal. In these cases, First Commonwealth would be required to refund any commissions it would not be entitled to as a result of cancelled or terminated policies. The Company has established a refund liability for the remaining term of the policies expected to be cancelled. The Company also receives incentive-based contingency fees from the insurance carriers. Contingency fee revenue, which totals approximately
$0.5 million
per year, is recognized as received due to the immaterial amount.
Retail brokerage income primarily consists of commissions received on annuity and investment product sales through a third-party service provider. The Company’s performance obligation is generally satisfied upon the issuance of the annuity policy or the execution of an investment transaction. The Company does not earn a significant amount of trailer fees on annuity sales. However, after considering the factors impacting these trailer fees, such as the uncertainty of investor behavior and changes in the market value of assets, First Commonwealth determined that it would recognize trailing fees as received because it could not reasonably estimate an amount of future trailing commissions for which collection is probable. Commissions from the third-party service provider are received on a monthly basis based upon customer activity for the month. The fees are recognized monthly with a receivable until commissions are received from the third-party service provider the following month. Because the Company acts as an agent in arranging the relationship between the customer and the third-party service provider and does not control the services rendered to the customers, retail brokerage fees are presented net of related costs, including
$2.5 million
in commission expense.
Card Related Interchange Income
Card related interchange income is primarily comprised of debit and credit card income, ATM fees and merchant services income. Debit and credit card income is primarily comprised of interchange fees earned whenever the Company’s debit and credit cards are processed through card payment networks such as Mastercard. ATM fees are primarily generated when a Company cardholder uses a non-Company ATM or a non-Company cardholder uses a Company ATM. Merchant services income mainly represents fees charged to merchants to process their debit and credit card transactions, in addition to account management fees. Card related interchange income is recognized at the point in time as the customer transactions are settled.
105
Other Income
Other income includes service revenue from processing wire transfers, bill pay service, cashier’s checks, and other services. The Company’s performance obligation for these services are largely satisfied, and related revenue recognized, when the services are rendered or upon completion. Payment is typically received immediately or in the following month.
Gains(losses) on sales of OREO
First Commonwealth records a gain or loss from the sale of OREO when control of the property transfers to the buyer, which generally occurs at the time of an executed deed. When First Commonwealth finances the sale of OREO to the buyer, an assessment of whether the buyer is committed to perform their obligations under the contract is completed along with an evaluation of whether collectability of the transaction price is probable. Once these criteria are met, the OREO asset is derecognized and the gain or loss on sale is recorded upon transfer of control of the property to the buyer. In determining the gain or loss on the sale, First Commonwealth adjusts the transaction price and related gain(loss) on sale if a significant financing component is present.
106
The impact on the condensed consolidated statements of income of adopting ASC 606 as of December 31 is outlined below:
|
2018
|
|||||||||||
|
As Reported
|
Under Legacy GAAP
|
Impact of ASC 606
|
|||||||||
|
(dollars in thousands)
|
|||||||||||
|
Noninterest Income
|
|||||||||||
|
Net securities gains
|
$
|
8,102
|
|
$
|
8,102
|
|
$
|
—
|
|
||
|
Trust income
|
7,901
|
|
7,901
|
|
—
|
|
|||||
|
Service charges on deposit accounts
|
18,175
|
|
18,175
|
|
—
|
|
|||||
|
Insurance and retail brokerage commissions
|
7,426
|
|
9,893
|
|
(2,467
|
)
|
|||||
|
Income from bank owned life insurance
|
6,686
|
|
6,686
|
|
—
|
|
|||||
|
Gain on sale of mortgage loans
|
5,436
|
|
5,436
|
|
—
|
|
|||||
|
Gain on sale of other loans and assets
|
5,273
|
|
5,273
|
|
—
|
|
|||||
|
Card-related interchange income
|
20,187
|
|
20,187
|
|
—
|
|
|||||
|
Derivatives mark to market
|
787
|
|
787
|
|
—
|
|
|||||
|
Swap fee income
|
1,874
|
|
1,874
|
|
—
|
|
|||||
|
Other income
|
6,790
|
|
7,693
|
|
(903
|
)
|
|||||
|
Total noninterest income
|
88,637
|
|
92,007
|
|
(3,370
|
)
|
|||||
|
Noninterest Expense
|
|||||||||||
|
Salaries and employee benefits
|
105,115
|
|
107,582
|
|
(2,467
|
)
|
|||||
|
Net occupancy expense
|
17,219
|
|
17,219
|
|
—
|
|
|||||
|
Furniture and equipment expense
|
14,247
|
|
14,247
|
|
—
|
|
|||||
|
Data processing expense
|
10,470
|
|
10,849
|
|
(379
|
)
|
|||||
|
Advertising and promotion expense
|
3,956
|
|
3,956
|
|
—
|
|
|||||
|
Pennsylvania shares tax expense
|
4,875
|
|
4,875
|
|
—
|
|
|||||
|
Intangible amortization
|
3,217
|
|
3,217
|
|
—
|
|
|||||
|
Collection and repossession expense
|
2,762
|
|
2,762
|
|
—
|
|
|||||
|
Other professional fees and services
|
4,473
|
|
4,473
|
|
—
|
|
|||||
|
FDIC insurance
|
2,007
|
|
2,007
|
|
—
|
|
|||||
|
Loss on sale or write-down of assets
|
1,080
|
|
1,080
|
|
—
|
|
|||||
|
Litigation and operational losses
|
1,162
|
|
1,162
|
|
—
|
|
|||||
|
Merger and acquisition related
|
1,637
|
|
1,637
|
|
—
|
|
|||||
|
Other operating expenses
|
23,336
|
|
23,860
|
|
(524
|
)
|
|||||
|
Total noninterest expense
|
$
|
195,556
|
|
$
|
198,926
|
|
(3,370
|
)
|
|||
|
Net Impact
|
$
|
—
|
|
||||||||
107
The following presents noninterest income, segregated by revenue streams in-scope and out-of-scope of Topic 606 for the year ended December 31:
|
|
2018
|
2017
|
2016
|
||||||||
|
|
(dollars in thousands)
|
||||||||||
|
Noninterest Income
|
|||||||||||
|
In-scope of Topic 606:
|
|||||||||||
|
Trust income
|
$
|
7,901
|
|
$
|
7,098
|
|
$
|
5,366
|
|
||
|
Service charges on deposit accounts
|
18,175
|
|
18,579
|
|
15,869
|
|
|||||
|
Insurance and retail brokerage commissions
|
7,426
|
|
8,807
|
|
7,964
|
|
|||||
|
Card-related interchange income
|
20,187
|
|
18,780
|
|
14,955
|
|
|||||
|
Gain on sale of other loans and assets
|
982
|
|
1,005
|
|
1,389
|
|
|||||
|
Other income
|
3,708
|
|
4,328
|
|
3,638
|
|
|||||
|
Noninterest Income (in-scope of Topic 606)
|
58,379
|
|
58,597
|
|
49,181
|
|
|||||
|
Noninterest Income (out-of-scope of Topic 606)
|
30,258
|
|
21,734
|
|
15,418
|
|
|||||
|
Total Noninterest Income
|
$
|
88,637
|
|
$
|
80,331
|
|
$
|
64,599
|
|
||
Note 25—Related Party Transactions
Some of First Commonwealth’s directors, executive officers, principal shareholders and their related interests had transactions with the subsidiary bank in the ordinary course of business. All deposit and loan transactions were made on substantially the same terms, such as collateral and interest rates, as those prevailing at the time for comparable transactions. In the opinion of management, these transactions do not involve more than the normal risk of collectability nor do they present other unfavorable features. It is anticipated that similar transactions will be entered into in the future.
The following is an analysis of loans to related parties (dollars in thousands):
|
December 31, 2017
|
$
|
5,648
|
|
|
Advances
|
14,035
|
|
|
|
Repayments
|
(4,478
|
)
|
|
|
Other
|
433
|
|
|
|
December 31, 2018
|
$
|
15,638
|
|
Note 26—Regulatory Restrictions and Capital Adequacy
The amount of funds available to the parent from its subsidiary bank is limited by restrictions imposed on all depository institutions by banking regulation that restricts and limits the payment of dividends and the ability of depository institutions to engage in transactions, including lending transactions and asset purchases, with affiliates.
First Commonwealth and First Commonwealth Bank are subject to various regulatory capital requirements administered by the federal banking agencies. Failure to meet minimum capital requirements can initiate certain mandatory and possibly additional discretionary actions by regulators which, if undertaken, could have a direct material effect on First Commonwealth’s financial statements. Under capital adequacy guidelines and the regulatory framework for prompt corrective action, First Commonwealth and First Commonwealth Bank must meet specific capital guidelines that involve quantitative measures of First Commonwealth’s assets, liabilities and certain off-balance sheet items as calculated under regulatory accounting practices. First Commonwealth’s capital amounts and classification are also subject to qualitative judgments by the regulators about components, risk weighting and other factors.
Effective January 1, 2015, the Company became subject to new regulatory risk-based capital rules adopted by the federal banking agencies implementing Basel III. The most significant changes include higher minimum capital requirements, as the minimum Tier I capital ratio increased from
4.0%
to
6.0%
, and a new common equity Tier I capital ratio was established with a minimum level of
4.5%
. Additionally, the new rules improve the quality of capital by providing stricter eligibility criteria for regulatory capital instruments and provide for a phase-in, beginning January 1, 2016, of a capital conservation buffer of
2.5%
of risk-weighted assets. This buffer provides a requirement to hold common equity Tier 1 capital above the minimum risk-based
108
capital requirements, resulting in an effective common equity Tier I risk-weighted asset minimum ratio of
7%
on a fully phased-in basis.
The Basel III Rules also permit banking organizations with less than
$15.0 billion
in assets to retain, through a one-time election, the exclusion of accumulated other comprehensive income from regulatory capital. The Company elected to retain this treatment, which reduces the volatility of regulatory capital levels.
During the second quarter of 2018, First Commonwealth Bank, the Company's banking subsidiary, issued
$100 million
in subordinated debt, which under regulatory rules qualifies as Tier II capital. This subordinated debt issuance increased the total risk-based capital ratio by 160 basis points.
109
As of December 31, 2018
and
2017
, First Commonwealth and First Commonwealth Bank met all capital adequacy requirements to which they are subject and was considered well-capitalized under the regulatory rules, all on a fully phased-in basis. To be considered well-capitalized, the Company must maintain minimum Total risk-based capital, Tier I risk-based capital, Tier I leverage ratio and Common equity tier I risk-based capital as set forth in the table below:
|
|
Actual
|
Minimum Capital Required - Basel III Phase-In Schedule
|
Minimum Capital Required - Basel III Fully Phased-In
|
Required to be Considered Well
Capitalized |
|||||||||||||||||||||||
|
|
Capital
Amount |
Ratio
|
Capital
Amount |
Ratio
|
Capital
Amount |
Ratio
|
Capital
Amount |
Ratio
|
|||||||||||||||||||
|
|
(dollars in thousands)
|
||||||||||||||||||||||||||
|
As of December 31, 2018
|
|||||||||||||||||||||||||||
|
Total Capital to Risk Weighted Assets
|
|||||||||||||||||||||||||||
|
First Commonwealth Financial Corporation
|
$
|
918,786
|
|
14.65
|
%
|
$
|
619,173
|
|
9.88
|
%
|
$
|
658,361
|
|
10.50
|
%
|
$
|
627,011
|
|
10.00
|
%
|
|||||||
|
First Commonwealth Bank
|
885,151
|
|
14.14
|
|
618,213
|
|
9.88
|
|
657,341
|
|
10.50
|
|
626,039
|
|
10.00
|
|
|||||||||||
|
Tier I Capital to Risk Weighted Assets
|
|||||||||||||||||||||||||||
|
First Commonwealth Financial Corporation
|
$
|
767,881
|
|
12.25
|
%
|
$
|
493,771
|
|
7.88
|
%
|
$
|
532,959
|
|
8.50
|
%
|
$
|
501,608
|
|
8.00
|
%
|
|||||||
|
First Commonwealth Bank
|
734,246
|
|
11.73
|
|
493,005
|
|
7.88
|
|
532,133
|
|
8.50
|
|
500,831
|
|
8.00
|
|
|||||||||||
|
Tier I Capital to Average Assets
|
|||||||||||||||||||||||||||
|
First Commonwealth Financial Corporation
|
$
|
767,881
|
|
10.28
|
%
|
$
|
298,856
|
|
4.00
|
%
|
$
|
298,856
|
|
4.00
|
%
|
$
|
373,570
|
|
5.00
|
%
|
|||||||
|
First Commonwealth Bank
|
734,246
|
|
9.84
|
|
298,340
|
|
4.00
|
|
298,340
|
|
4.00
|
|
372,926
|
|
5.00
|
|
|||||||||||
|
Common Equity Tier I to Risk Weighted Assets
|
|||||||||||||||||||||||||||
|
First Commonwealth Financial Corporation
|
$
|
697,881
|
|
11.13
|
%
|
$
|
399,719
|
|
6.38
|
%
|
$
|
438,907
|
|
7.00
|
%
|
$
|
407,557
|
|
6.50
|
%
|
|||||||
|
First Commonwealth Bank
|
734,246
|
|
11.73
|
|
399,100
|
|
6.38
|
|
438,227
|
|
7.00
|
|
406,925
|
|
6.50
|
|
|||||||||||
110
|
|
Actual
|
Minimum Capital Required - Basel III Phase-In Schedule
|
Minimum Capital Required - Basel III Fully Phased-In
|
Required to be Considered Well
Capitalized |
|||||||||||||||||||||||
|
|
Capital
Amount |
Ratio
|
Capital
Amount |
Ratio
|
Capital
Amount |
Ratio
|
Capital
Amount |
Ratio
|
|||||||||||||||||||
|
|
(dollars in thousands)
|
||||||||||||||||||||||||||
|
As of December 31, 2017
|
|||||||||||||||||||||||||||
|
Total Capital to Risk Weighted Assets
|
|||||||||||||||||||||||||||
|
First Commonwealth Financial Corporation
|
$
|
745,473
|
|
12.34
|
%
|
$
|
558,728
|
|
9.25
|
%
|
$
|
634,232
|
|
10.50
|
%
|
$
|
604,030
|
|
10.00
|
%
|
|||||||
|
First Commonwealth Bank
|
712,341
|
|
11.83
|
|
556,872
|
|
9.25
|
|
632,124
|
|
10.50
|
|
602,023
|
|
10.00
|
|
|||||||||||
|
Tier I Capital to Risk Weighted Assets
|
|||||||||||||||||||||||||||
|
First Commonwealth Financial Corporation
|
$
|
691,993
|
|
11.46
|
%
|
$
|
437,922
|
|
7.25
|
%
|
$
|
513,426
|
|
8.50
|
%
|
$
|
483,224
|
|
8.00
|
%
|
|||||||
|
First Commonwealth Bank
|
658,861
|
|
10.94
|
|
436,467
|
|
7.25
|
|
511,720
|
|
8.50
|
|
481,619
|
|
8.00
|
|
|||||||||||
|
Tier I Capital to Average Assets
|
|||||||||||||||||||||||||||
|
First Commonwealth Financial Corporation
|
$
|
691,993
|
|
9.74
|
%
|
$
|
284,100
|
|
4.00
|
%
|
$
|
284,100
|
|
4.00
|
%
|
$
|
355,125
|
|
5.00
|
%
|
|||||||
|
First Commonwealth Bank
|
658,861
|
|
9.30
|
|
283,344
|
|
4.00
|
|
283,344
|
|
4.00
|
|
354,180
|
|
5.00
|
|
|||||||||||
|
Common Equity Tier I to Risk Weighted Assets
|
|||||||||||||||||||||||||||
|
First Commonwealth Financial Corporation
|
$
|
623,252
|
|
10.32
|
%
|
$
|
347,317
|
|
5.75
|
%
|
$
|
422,821
|
|
7.00
|
%
|
$
|
392,620
|
|
6.50
|
%
|
|||||||
|
First Commonwealth Bank
|
658,861
|
|
10.94
|
|
346,163
|
|
5.75
|
|
421,416
|
|
7.00
|
|
391,315
|
|
6.50
|
|
|||||||||||
Note 27—Capital
In 2012, First Commonwealth announced a
$50.0 million
common stock repurchase program. Additional share repurchase programs were authorized for up to
$25.0 million
in shares of the Company’s common stock for each year from 2013 to 2016. The repurchase program was suspended in July 2016 as a result of the acquisition of
five
branches in northern Ohio which management believes represents a better use of capital for shareholder. Repurchases under all programs resulted in a total of
16,665,735
shares repurchased at an average price of
$7.55
per share. In 2018, First Commonwealth announced a
$25.0 million
common stock repurchase program. This program was completed prior to the end of 2018 and resulted in a total of
1,843,373
shares repurchased at an average price of
$13.58
.
111
Note 28—Condensed Financial Information of First Commonwealth Financial Corporation (parent company only)
|
Statements of Financial Condition
|
December 31,
|
||||||
|
|
2018
|
2017
|
|||||
|
|
(dollars in thousands)
|
||||||
|
Assets
|
|||||||
|
Cash
|
$
|
21,466
|
|
$
|
16,432
|
|
|
|
Loans
|
14
|
|
17
|
|
|||
|
Investment in subsidiaries
|
1,014,685
|
|
927,765
|
|
|||
|
Investment in unconsolidated subsidiary trusts
|
2,192
|
|
2,186
|
|
|||
|
Investment in jointly-owned company
|
280
|
|
9,191
|
|
|||
|
Premises and equipment, net
|
3,519
|
|
3,715
|
|
|||
|
Dividends receivable from subsidiaries
|
5,444
|
|
—
|
|
|||
|
Other assets
|
5,402
|
|
4,996
|
|
|||
|
Total assets
|
$
|
1,053,002
|
|
$
|
964,302
|
|
|
|
Liabilities and Shareholders’ Equity
|
|||||||
|
Accrued expenses and other liabilities
|
$
|
5,446
|
|
$
|
4,008
|
|
|
|
Subordinated debentures payable
|
72,167
|
|
72,167
|
|
|||
|
Shareholders’ equity
|
975,389
|
|
888,127
|
|
|||
|
Total liabilities and shareholders’ equity
|
$
|
1,053,002
|
|
$
|
964,302
|
|
|
|
Statements of Income
|
For the years ended December 31,
|
||||||||||
|
2018
|
2017
|
2016
|
|||||||||
|
|
(dollars in thousands)
|
||||||||||
|
Interest and dividends
|
$
|
1
|
|
$
|
1
|
|
$
|
1
|
|
||
|
Dividends from subsidiaries
|
81,851
|
|
52,586
|
|
55,510
|
|
|||||
|
Interest expense
|
(3,722
|
)
|
(3,000
|
)
|
(2,635
|
)
|
|||||
|
Other income
|
14
|
|
17
|
|
83
|
|
|||||
|
Operating expense
|
(4,047
|
)
|
(4,767
|
)
|
(4,700
|
)
|
|||||
|
Income before taxes and equity in undistributed earnings of subsidiaries
|
74,097
|
|
44,837
|
|
48,259
|
|
|||||
|
Applicable income tax benefits
|
1,324
|
|
2,557
|
|
2,515
|
|
|||||
|
Income before equity in undistributed earnings of subsidiaries
|
75,421
|
|
47,394
|
|
50,774
|
|
|||||
|
Equity in undistributed earnings of subsidiaries
|
32,077
|
|
7,771
|
|
8,816
|
|
|||||
|
Net income
|
$
|
107,498
|
|
$
|
55,165
|
|
$
|
59,590
|
|
||
112
|
For the years ended December 31,
|
|||||||||||
|
Statements of Cash Flow
|
2018
|
2017
|
2016
|
||||||||
|
|
(dollars in thousands)
|
||||||||||
|
Operating Activities
|
|||||||||||
|
Net income
|
$
|
107,498
|
|
$
|
55,165
|
|
$
|
59,590
|
|
||
|
Adjustments to reconcile net income to net cash provided by operating activities:
|
|||||||||||
|
Depreciation and amortization
|
320
|
|
322
|
|
355
|
|
|||||
|
Net gains on sales of assets
|
(7
|
)
|
(3
|
)
|
—
|
|
|||||
|
Decrease (increase) in prepaid income taxes
|
37
|
|
(550
|
)
|
7,380
|
|
|||||
|
Undistributed equity in subsidiaries
|
(32,077
|
)
|
(7,771
|
)
|
(8,816
|
)
|
|||||
|
Distribution from unconsolidated subsidiary
|
9,000
|
|
—
|
|
—
|
|
|||||
|
Other net
|
(1,628
|
)
|
8,767
|
|
7,759
|
|
|||||
|
Net cash provided by operating activities
|
83,143
|
|
55,930
|
|
66,268
|
|
|||||
|
Investing Activities
|
|||||||||||
|
Net change in loans
|
3
|
|
2
|
|
3
|
|
|||||
|
Purchases of premises and equipment
|
(87
|
)
|
(207
|
)
|
—
|
|
|||||
|
Proceeds from sale of other assets
|
7
|
|
3
|
|
(332
|
)
|
|||||
|
Proceeds from dissolution of subsidiary
|
0
|
|
—
|
|
27,017
|
|
|||||
|
Acquisition of affiliate, net of cash received
|
0
|
|
(250
|
)
|
—
|
|
|||||
|
Investment in subsidiaries
|
(17,202
|
)
|
(37,690
|
)
|
(47,017
|
)
|
|||||
|
Net cash used in by investing activities
|
(17,279
|
)
|
(38,142
|
)
|
(20,329
|
)
|
|||||
|
Financing Activities
|
|||||||||||
|
Dividends paid
|
(34,849
|
)
|
(30,513
|
)
|
(24,907
|
)
|
|||||
|
Proceeds from reissuance of treasury stock
|
208
|
|
228
|
|
216
|
|
|||||
|
Purchase of treasury stock
|
(26,189
|
)
|
(1,458
|
)
|
(864
|
)
|
|||||
|
Net cash used in financing activities
|
(60,830
|
)
|
(31,743
|
)
|
(25,555
|
)
|
|||||
|
Net increase (decrease) in cash
|
5,034
|
|
(13,955
|
)
|
20,384
|
|
|||||
|
Cash at beginning of year
|
16,432
|
|
30,387
|
|
10,003
|
|
|||||
|
Cash at end of year
|
$
|
21,466
|
|
$
|
16,432
|
|
$
|
30,387
|
|
||
Cash dividends declared per common share were
$0.35
for
2018
,
$0.32
in
2017
and
$0.28
in
2016
.
First Commonwealth Financial Corporation has an unsecured
$15.0 million
line of credit with another financial institution. As of December 31,
2018
, there are no amounts outstanding on this line and we are in compliance with all debt covenants related
to the line of credit.
113
Quarterly Summary of Financial Data—Unaudited
The unaudited quarterly results of operations for the years ended December 31 are as follows:
|
|
2018
|
||||||||||||||
|
|
Fourth
Quarter |
Third
Quarter |
Second
Quarter |
First
Quarter |
|||||||||||
|
|
(dollars in thousands, except per share data)
|
||||||||||||||
|
Interest income
|
$
|
77,945
|
|
$
|
74,873
|
|
$
|
72,940
|
|
$
|
66,499
|
|
|||
|
Interest expense
|
12,896
|
|
11,060
|
|
9,265
|
|
6,814
|
|
|||||||
|
Net interest income
|
65,049
|
|
63,813
|
|
63,675
|
|
59,685
|
|
|||||||
|
Provision for credit losses
|
1,499
|
|
2,961
|
|
1,168
|
|
6,903
|
|
|||||||
|
Net interest income after provision for credit losses
|
63,550
|
|
60,852
|
|
62,507
|
|
52,782
|
|
|||||||
|
Net securities gains
|
—
|
|
—
|
|
5,262
|
|
2,840
|
|
|||||||
|
Other noninterest income
|
20,529
|
|
19,757
|
|
21,046
|
|
19,203
|
|
|||||||
|
Other expenses
|
50,024
|
|
49,530
|
|
49,129
|
|
46,873
|
|
|||||||
|
Income before income taxes
|
34,055
|
|
31,079
|
|
39,686
|
|
27,952
|
|
|||||||
|
Income tax provision
|
7,057
|
|
5,930
|
|
7,605
|
|
4,682
|
|
|||||||
|
Net Income
|
$
|
26,998
|
|
$
|
25,149
|
|
$
|
32,081
|
|
$
|
23,270
|
|
|||
|
Basic Earnings Per Share
|
$
|
0.27
|
|
$
|
0.25
|
|
$
|
0.32
|
|
$
|
0.24
|
|
|||
|
Diluted Earnings Per Share
|
0.27
|
|
0.25
|
|
0.32
|
|
0.24
|
|
|||||||
|
Average shares outstanding
|
99,147,933
|
|
100,226,647
|
|
95,305,009
|
|
97,433,137
|
|
|||||||
|
Average shares outstanding assuming dilution
|
99,358,759
|
|
100,490,812
|
|
99,504,409
|
|
97,601,162
|
|
|||||||
|
|
2017
|
||||||||||||||
|
|
Fourth
Quarter |
Third
Quarter |
Second
Quarter |
First
Quarter |
|||||||||||
|
|
(dollars in thousands, except per share data)
|
||||||||||||||
|
Interest income
|
$
|
65,840
|
|
$
|
65,411
|
|
$
|
63,120
|
|
$
|
56,179
|
|
|||
|
Interest expense
|
6,270
|
|
5,848
|
|
5,303
|
|
4,349
|
|
|||||||
|
Net interest income
|
59,570
|
|
59,563
|
|
57,817
|
|
51,830
|
|
|||||||
|
Provision for credit losses
|
2,253
|
|
|
1,214
|
|
(1,609
|
)
|
3,229
|
|
||||||
|
Net interest income after provision for credit losses
|
57,317
|
|
58,349
|
|
59,426
|
|
48,601
|
|
|||||||
|
Net securities gains (losses)
|
4,345
|
|
92
|
|
(49
|
)
|
652
|
|
|||||||
|
Other noninterest income
|
20,360
|
|
19,698
|
|
18,953
|
|
16,280
|
|
|||||||
|
Other expenses
|
51,909
|
|
47,361
|
|
58,263
|
|
42,765
|
|
|||||||
|
Income before income taxes
|
30,113
|
|
30,778
|
|
20,067
|
|
22,768
|
|
|||||||
|
Income tax provision
|
26,132
|
|
9,495
|
|
6,054
|
|
6,880
|
|
|||||||
|
Net Income
|
$
|
3,981
|
|
$
|
21,283
|
|
$
|
14,013
|
|
$
|
15,888
|
|
|||
|
Basic Earnings Per Share
|
$
|
0.04
|
|
$
|
0.22
|
|
$
|
0.14
|
|
$
|
0.18
|
|
|||
|
Diluted Earnings Per Share
|
0.04
|
|
0.22
|
|
0.14
|
|
0.18
|
|
|||||||
|
Average shares outstanding
|
97,363,471
|
|
97,402,816
|
|
97,183,599
|
|
88,929,892
|
|
|||||||
|
Average shares outstanding assuming dilution
|
97,507,465
|
|
97,457,470
|
|
97,232,288
|
|
88,987,671
|
|
|||||||
114
ITEM 9.
Changes in and Disagreements with Accountants on Accounting and Financial Disclosure
None.
ITEM 9A.
Controls and Procedures
Disclosure Controls and Procedures
We carried out an evaluation, under the supervision and with the participation of our management, including our Chief Executive Officer and our Chief Financial Officer, of the effectiveness of the design and operation of our disclosure controls and procedures as of the end of the period covered by this report pursuant to Rule 13a-15 under the Securities Exchange Act of 1934 (the “Exchange Act”). Based upon that evaluation, our Chief Executive Officer and Chief Financial Officer concluded that our disclosure controls and procedures are effective to provide reasonable assurance that the information required to be disclosed in the reports that we file or submit under the Exchange Act is recorded, processed, summarized and reported within the time periods specified in applicable rules and forms of the Securities and Exchange Commission.
Notwithstanding the material weakness described under Changes in Internal Control Over Financial Reporting, our management, including our Chief Executive Officer and Chief Financial Officer, have concluded that the control deficiency did not result in any material misstatement or omission in our consolidated financial statements, and that the Company’s financial statements included in this Form 10-K and as reported for interim periods in 2018 on Forms 10-Q present fairly, in all material respects, the Company’s financial position, results of operations and cash flows for the periods presented in accordance with U.S. generally accepted accounting principles.
Changes in Internal Control Over Financial Reporting
During the fourth quarter of 2018, we identified process level control deficiencies related to changes made to policies and procedures during the third quarter of 2018 related to the determination of the qualitative component of the allowance for credit losses. This was caused by the Company not sufficiently identifying and assessing the implications of the change in methodology and the impact on the allowance for credit losses and related internal controls. Although we identified no misstatement in our third quarter interim financial statements as of and for the three months and nine months ended September 30, 2018, these control deficiencies represented a material weakness in our internal control over financial reporting as of September 30, 2018 because a reasonable possibility existed that a material misstatement of our annual or interim financial statements would not have been prevented or detected on a timely basis.
We took immediate actions to remediate this material weakness during the fourth quarter of 2018. Specifically, we formalized the documentation required to support a change in the allowance for credit losses methodology, we approved changes to the policies and procedures that establish and monitor the determination of the qualitative component of the allowance for credit losses, and these newly approved policies and procedures were applied in the performance of the process level controls that determine the qualitative component of the allowance for credit losses. Based on these actions, we have concluded that this material weakness was remediated in the fourth quarter of 2018 and does not impact Management’s Assessment of Internal Control over Financial Reporting described below. We identified and reported this weakness to both our audit committee and KPMG LLP, our independent registered public accounting firm.
Except as described above, there has been no change to our internal control over financial reporting during the quarter ended December 31, 2018 that has materially affected or is reasonably likely to materially affect our internal control over financial reporting.
115
MANAGEMENT’S ASSESSMENT OF INTERNAL CONTROL OVER FINANCIAL REPORTING
First Commonwealth is responsible for the preparation, the integrity, and the fair presentation of the Consolidated Financial Statements included in this annual report. The Consolidated Financial Statements and notes to the financial statements have been prepared in conformity with generally accepted accounting principles and include some amounts based upon management’s best estimates and judgments.
First Commonwealth’s management is responsible for establishing and maintaining effective internal control over financial reporting, as such term is defined in Exchange Act Rule 13a-15(f), that is designed to produce reliable financial statements in conformity with generally accepted accounting principles and includes those policies and procedures that (1) pertain to the maintenance of records that, in reasonable detail, accurately and fairly reflect the transactions and dispositions of the assets of the Company; (2) provide reasonable assurance that transactions are recorded as necessary to permit preparation of financial statements in accordance with generally accepted accounting principles, and that receipts and expenditures of the Company are being made only in accordance with authorizations of management and directors of the Company; and (3) provide reasonable assurance regarding prevention or timely detection of unauthorized acquisition, use, or disposition of the Company’s assets that could have a material effect on the financial statements. Under the supervision and with the participation of management, including First Commonwealth’s principal executive officer and principal financial officer, First Commonwealth conducted an evaluation of the effectiveness of internal control over financial reporting based on criteria established in
Internal Control-Integrated Framework (2013)
issued by the Committee of Sponsoring Organizations of the Treadway Commission (COSO).
All internal control systems, no matter how well designed, have inherent limitations, including the possibility that a control can be circumvented and that misstatements due to error or fraud may occur without detection. Therefore, even those systems determined to be effective can provide only reasonable assurance with respect to financial statement preparation and presentation.
Based on First Commonwealth’s evaluation based on criteria established in
Internal Control-Integrated Framework (2013)
issued by the Committee of Sponsoring Organizations of the Treadway Commission (COSO), management concluded that internal control over financial reporting was effective as of
December 31, 2018
. The effectiveness of First Commonwealth’s internal control over financial reporting as of
December 31, 2018
has been audited by KPMG LLP, an independent registered public accounting firm, as stated in their attestation report which is included herein.
First Commonwealth Financial Corporation
Indiana, Pennsylvania
March 1, 2019
|
/S/ T. Michael Price
|
|
/S/ James R. Reske
|
|
T. Michael Price
|
James R. Reske
|
|
|
President and Chief Executive Officer
|
Executive Vice President, Chief Financial Officer and Treasurer
|
|
116
Report of Independent Registered Public Accounting Firm
To the Shareholders and the Board of Directors
First Commonwealth Financial Corporation:
Opinion on Internal Control Over Financial Reporting
We have audited First Commonwealth Financial Corporation and subsidiaries’ (the Company) internal control over financial reporting as of
December 31, 2018
, based on criteria established in
Internal Control - Integrated Framework (2013)
issued by the Committee of Sponsoring Organizations of the Treadway Commission. In our opinion, the Company maintained, in all material respects, effective internal control over financial reporting as of
December 31, 2018
, based on criteria established in
Internal Control - Integrated Framework (2013)
issued by the Committee of Sponsoring Organizations of the Treadway Commission.
We also have audited, in accordance with the standards of the Public Company Accounting Oversight Board (United States) (PCAOB), the consolidated statements of financial condition of the Company as of
December 31, 2018
and
2017
, the related consolidated statements of income, comprehensive income, changes in shareholders’ equity, and cash flows for each of the years in the three-year period ended
December 31, 2018
, and the related notes (collectively, the consolidated financial statements), and our report dated
March 1, 2019
expressed an unqualified opinion on those consolidated financial statements.
Basis for Opinion
The Company’s management is responsible for maintaining effective internal control over financial reporting and for its assessment of the effectiveness of internal control over financial reporting, included in the accompanying Management’s Report on Internal Control Over Financial Reporting. Our responsibility is to express an opinion on the Company’s internal control over financial reporting based on our audit. We are a public accounting firm registered with the PCAOB and are required to be independent with respect to the Company in accordance with the U.S. federal securities laws and the applicable rules and regulations of the Securities and Exchange Commission and the PCAOB.
We conducted our audit in accordance with the standards of the PCAOB. Those standards require that we plan and perform the audit to obtain reasonable assurance about whether effective internal control over financial reporting was maintained in all material respects. Our audit of internal control over financial reporting included obtaining an understanding of internal control over financial reporting, assessing the risk that a material weakness exists, and testing and evaluating the design and operating effectiveness of internal control based on the assessed risk. Our audit also included performing such other procedures as we considered necessary in the circumstances. We believe that our audit provides a reasonable basis for our opinion.
Definition and Limitations of Internal Control Over Financial Reporting
A company’s internal control over financial reporting is a process designed to provide reasonable assurance regarding the reliability of financial reporting and the preparation of financial statements for external purposes in accordance with generally accepted accounting principles. A company’s internal control over financial reporting includes those policies and procedures that (1) pertain to the maintenance of records that, in reasonable detail, accurately and fairly reflect the transactions and dispositions of the assets of the company; (2) provide reasonable assurance that transactions are recorded as necessary to permit preparation of financial statements in accordance with generally accepted accounting principles, and that receipts and expenditures of the company are being made only in accordance with authorizations of management and directors of the company; and (3) provide reasonable assurance regarding prevention or timely detection of unauthorized acquisition, use, or disposition of the company’s assets that could have a material effect on the financial statements.
Because of its inherent limitations, internal control over financial reporting may not prevent or detect misstatements. Also, projections of any evaluation of effectiveness to future periods are subject to the risk that controls may become inadequate because of changes in conditions, or that the degree of compliance with the policies or procedures may deteriorate.
/s/ KPMG LLP
Pittsburgh, Pennsylvania
March 1, 2019
117
Report of Independent Registered Public Accounting Firm
To the Shareholders and the Board of Directors
First Commonwealth Financial Corporation:
Opinion on the Consolidated Financial Statements
We have audited the accompanying consolidated statements of financial condition of First Commonwealth Financial Corporation and subsidiaries (the Company) as of
December 31, 2018
and
2017
, the related consolidated statements of income, comprehensive income, changes in shareholders’ equity, and cash flows for each of the years in the three-year period ended
December 31, 2018
, and the related notes (collectively, the consolidated financial statements). In our opinion, the consolidated financial statements present fairly, in all material respects, the financial position of the Company as of
December 31, 2018
and
2017
, and the results of its operations and its cash flows for each of the years in the three-year period ended
December 31, 2018
, in conformity with U.S. generally accepted accounting principles.
We also have audited, in accordance with the standards of the Public Company Accounting Oversight Board (United States) (PCAOB), the Company’s internal control over financial reporting as of
December 31, 2018
, based on criteria established in
Internal Control - Integrated Framework (2013)
issued by the Committee of Sponsoring Organizations of the Treadway Commission, and our report dated
March 1, 2019
expressed an unqualified opinion on the effectiveness of the Company’s internal control over financial reporting.
Basis for Opinion
These consolidated financial statements are the responsibility of the Company’s management. Our responsibility is to express an opinion on these consolidated financial statements based on our audits. We are a public accounting firm registered with the PCAOB and are required to be independent with respect to the Company in accordance with the U.S. federal securities laws and the applicable rules and regulations of the Securities and Exchange Commission and the PCAOB.
We conducted our audits in accordance with the standards of the PCAOB. Those standards require that we plan and perform the audit to obtain reasonable assurance about whether the consolidated financial statements are free of material misstatement, whether due to error or fraud. Our audits included performing procedures to assess the risk of material misstatement of the consolidated financial statements, whether due to error or fraud, and performing procedures that responds to those risks. Such procedures included examining, on a test basis, evidence regarding the amounts and disclosures in the consolidated financial statements. Our audits also included evaluating the accounting principles used and significant estimates made by management, as well as evaluating the overall presentation of the consolidated financial statements. We believe that our audits provide a reasonable basis for our opinion.
/s/ KPMG LLP
We have served as the Company's auditor since 2006.
Pittsburgh, Pennsylvania
March 1, 2019
118
ITEM 9B.
Other Information
None.
119
PART III
ITEM 10.
Directors, Executive Officers and Corporate Governance
Information called for by this item concerning the identification, business experience and qualifications of First Commonwealth’s directors will be included in First Commonwealth’s definitive Proxy Statement to be filed with the Securities and Exchange Commission in connection with the annual meeting of shareholders to be held April 23, 2019 (the “Proxy Statement”), under the heading “Proposal 1—Election of Directors,” and is incorporated herein by reference.
Information called for by this item concerning First Commonwealth’s compliance with section 16(a) of the Exchange Act will be included in the Proxy Statement under the heading “Section 16(a) Beneficial Ownership Reporting Compliance,” and is incorporated herein by reference.
First Commonwealth has adopted a code of conduct and ethics that applies to all employees of the Company, including executive officers. In addition, First Commonwealth has adopted a code of ethics for the Chief Executive Officer and all senior financial officers of the Company. Both of these codes are filed as exhibits to this Annual Report on Form 10-K and are posted on First Commonwealth’s website at http://www.fcbanking.com. Refer to Item 15 of this Annual Report on Form 10-K for a list of exhibits.
Information called for by this item concerning First Commonwealth’s Audit Committee and the identification of “Audit Committee financial experts” will be included in the Proxy Statement under the heading “Corporate Governance,” and is incorporated herein by reference.
Certain information regarding executive officers is included under the caption “Executive Officers of First Commonwealth Financial Corporation” after Part I, Item 4, of this Report.
ITEM 11.
Executive Compensation
Information called for by this item concerning compensation of First Commonwealth’s executive officers and the report of the Compensation and Human Resources Committee will be included in the Proxy Statement under the heading “Executive Compensation,” and is incorporated herein by reference.
Information called for by this item concerning compensation of First Commonwealth’s directors will be included in the Proxy Statement under the heading “Compensation of Directors,” and is incorporated herein by reference.
ITEM 12.
Security Ownership of Certain Beneficial Owners and Management and Related Stockholder Matters
Information called for by this item concerning security ownership of certain beneficial owners and security ownership of management will be included in the Proxy Statement under the headings “Security Ownership of Certain Beneficial Owners” and “Securities Owned by Directors and Management,” and is incorporated herein by reference.
The following table provides information related to our existing equity compensation plans as of
December 31, 2018
:
|
Plan Category
|
Number of
securities to be issued upon exercise of outstanding options, warrants and rights |
Weighted average
exercise price of outstanding options, warrants and rights |
Number of
securities remaining available for future issuance under equity compensation plans |
||||
|
Equity compensation plans approved by security holders
|
496,603
|
|
N/A
|
3,156,378
|
|
||
|
Equity compensation plans not approved by security holders
|
N/A
|
|
N/A
|
N/A
|
|
||
|
Total
|
496,603
|
|
N/A
|
3,156,378
|
|
||
The number of securities to be issued upon exercise of outstanding option, warrants and rights represent the maximum number of shares that may be issued pursuant to outstanding performance units.
120
ITEM 13.
Certain Relationships and Related Transactions, and Director Independence
Information called for by this item concerning transactions with related persons and review, approval or ratification of transactions with related persons will be included in the Proxy Statement under the heading “Related Party Transactions,” and is incorporated herein by reference.
Information called for by this item concerning director independence will be included in the Proxy Statement under the heading “Corporate Governance,” and is incorporated herein by reference.
ITEM 14.
Principal Accountant Fees and Services
Information called for by this item concerning fees paid to First Commonwealth’s principal accountant and First Commonwealth’s pre-approval policies and procedures will be included in the Proxy Statement under the heading “Annual Audit Information,” and is incorporated herein by reference.
121
PART IV
ITEM 15.
Exhibits, Financial Statements and Schedules
(A)
Documents Filed as Part of this Report
(1)
Financial Statements
All financial statements of the registrant as set forth under Item 8 of the Report on Form 10-K.
(2)
Financial Statement Schedules
|
Schedule
Number
|
|
Description
|
Page
|
|
I
|
|
Indebtedness to Related Parties
|
N/A
|
|
II
|
|
Guarantees of Securities of Other Issuers
|
N/A
|
(3)
Exhibits
|
Exhibit
Number
|
|
Description
|
|
Incorporated by Reference to
|
|
3.1
|
|
Amended and Restated Articles of Incorporation of First Commonwealth Financial Corporation
|
|
Exhibit 3.1 to the quarterly report on Form 10-Q for the quarter ended June 30, 2010
|
|
3.2
|
|
Amended and Restated By-Laws of First Commonwealth Financial Corporation
|
|
Exhibit 3.1 to the current report as Form 8-K filed February 1, 2016
|
|
10.1
|
|
Amended and Restated Non-Qualified Deferred Compensation Plan (formerly known as the Supplemental Executive Retirement Plan)
|
|
Exhibit 10.1 to the current report on Form 8-K filed December 21, 2017
|
|
10.2
|
|
Amended and Restated Employment Agreement dated January 1, 2012 entered into among First Commonwealth Financial Corporation, First Commonwealth Bank and T. Michael Price
|
|
Exhibit 10.1 to the current report on Form 8-K filed January 5, 2012
|
|
10.3
|
|
Change of Control Agreement dated December 30, 2011 entered into between FCFC and T. Michael Price
|
|
Exhibit 10.3 to the current report on Form 8-K filed January 5, 2012
|
|
10.4
|
|
First Commonwealth Financial Corporation Incentive Compensation Plan
|
|
Annex I to Proxy Statement filed March 19, 2015 relating to the 2015 Annual Meeting of Shareholders
|
|
10.5
|
|
2018 Annual Incentive Plan
|
|
Exhibit 10.1 to the quarterly report on Form 10-Q filed May 9, 2018
|
|
10.6
|
2016-2018 Long-Term Incentive Plan
|
Exhibit 10.2 to the quarterly report on Form 10-Q filed May 9, 2016
|
||
|
10.7
|
2017-2019 Long-Term Incentive Plan
|
Exhibit 10.2 to the quarterly report on Form 10-Q filed May 9, 2017
|
||
|
10.8
|
2018-2020 Long-Term Incentive Plan
|
Exhibit 10.2 to the quarterly report on Form 10-Q filed May 9, 2018
|
||
|
10.9
|
|
Form of Restricted Stock Agreement for service-based restricted stock
|
|
Exhibit 10.3 to the quarterly report on Form 10-Q filed May 8, 2012
|
|
10.10
|
|
Change of Control Agreement dated December 30, 2011 entered into between FCFC and Leonard V. Lombardi
|
|
Exhibit 10.13 to the annual report on Form 10-K filed March 5, 2012
|
|
10.11
|
|
Change of Control Agreement dated December 30, 2011 entered into between FCFC and Matthew C. Tomb
|
|
Exhibit 10.14 to the annual report on Form 10-K filed March 5, 2012
|
|
10.12
|
Performance Unit Agreement dated December 30, 2015 between First Commonwealth Financial Corporation and T. Michael Price
|
Exhibit 10.13 to the annual report on Form 10-K filed February 29, 2016
|
||
122
|
Exhibit
Number
|
|
Description
|
|
Incorporated by Reference to
|
|
10.13
|
Employment Agreement dated April 10, 2014 between First Commonwealth Financial Corporation and James R. Reske
|
Exhibit 10.1 to the current report on Form
8-K filed April 10, 2014
|
||
|
10.14
|
Change of Control Agreement dated April 10, 2014 between First Commonwealth Financial Corporation and James R. Reske
|
Exhibit 10.3 to the current report on Form
8-K filed April 10, 2014
|
||
|
10.15
|
Restricted Stock Agreement dated April 10, 2014 between First Commonwealth Financial Corporation and James R. Reske
|
Exhibit 10.2 to the current report on Form
8-K filed April 10, 2014
|
||
|
10.16
|
Change of Control Agreement dated March 1, 2013 entered into between FCFC and Norman J. Montgomery
|
Exhibit 10.3 to the quarterly report on Form 10-Q filed May 8, 2013
|
||
|
10.17
|
Change of Control Agreement dated March 1, 2013 entered into between FCFC and Carrie L. Riggle
|
Exhibit 10.4 to the quarterly report on Form 10-Q filed May 8, 2013
|
||
|
10.18
|
Change of Control Agreement dated May 31, 2013 entered into between FCFC and Jane Grebenc
|
Exhibit 10.2 to the quarterly report on Form 10-Q filed August 7, 2013
|
||
|
10.19
|
Employment Agreement dated May 31, 2013 entered into between FCFC and Jane Grebenc
|
Exhibit 10.1 to the quarterly report on Form 10-Q filed August 7, 2013
|
||
|
10.20
|
Employment Agreement dated September 19, 2016 entered into between FCFC and Brian Karrip
|
Exhibit 10.1 to the quarterly report on Form 10-Q filed November 9, 2016
|
||
|
10.21
|
Change of Control Agreement dated September 19, 2016 entered into between FCFC and Brian Karrip
|
Exhibit 10.2 to the quarterly report on Form 10-Q filed November 9, 2016
|
||
|
10.22
|
Restricted Stock Agreement dated September 19, 2016 entered into between FCFC and Brian Karrip
|
Exhibit 10.3 to the quarterly report on Form 10-Q filed November 9, 2016
|
||
|
|
|
Filed herewith
|
||
|
|
|
Filed herewith
|
||
|
|
|
Filed herewith
|
||
|
|
|
Filed herewith
|
||
|
|
|
Filed herewith
|
||
|
|
|
Filed herewith
|
||
|
|
|
Filed herewith
|
||
|
101.00
|
|
The following materials from First Commonwealth Financial Corporation’s Annual Report on Form 10-K for the year ended December 31, 2018, formatted in XBRL (Extensible Business Reporting Language): (i) the Consolidated Balance Sheets at December 31, 2018 and December 31, 2017, (ii) the Consolidated Statements of Income for the years ended December 31, 2018, 2017 and 2016, (iii) the Consolidated Statements of Comprehensive Income for the years ended December 31, 2018, 2017 and 2016, (iv) the Consolidated Statements of Changes in Shareholders’ Equity for the years ended December 31, 2018, 2017 and 2016, (v) the Consolidated Statements of Cash Flows for the years ended December 31, 2018, 2017 and 2016, and (vi) the Notes to Consolidated Financial Statements.
|
|
Filed herewith
|
123
SIGNATURES
Pursuant to the requirements of Section 13 or 15(d) of the Securities Exchange Act of 1934, the Registrant has duly caused this report to be signed on its behalf by the undersigned, thereunto duly authorized, in Indiana, Pennsylvania.
|
FIRST COMMONWEALTH FINANCIAL CORPORATION (Registrant)
|
||
|
By:
|
|
/S/ T. Michael Price
|
|
|
T. Michael Price
President and Chief Executive Officer
|
|
|
|
Dated: March 1, 2019
|
|
Pursuant to the requirements of the Securities Exchange Act of 1934, this Report has been executed below by the following persons on behalf of the Registrant and in the capacities and on the dates indicated.
|
Signature
|
|
Capacity
|
|
Date
|
|
/S/ Julie A. Caponi
|
Director
|
March 1, 2019
|
||
|
Julie A. Caponi
|
||||
|
/S/ Ray T. Charley
|
|
Director
|
|
March 1, 2019
|
|
Ray T. Charley
|
||||
|
/S/ Gary R. Claus
|
|
Director
|
|
March 1, 2019
|
|
Gary R. Claus
|
||||
|
/S/ David S. Dahlmann
|
|
Director, Chairman
|
|
March 1, 2019
|
|
David S. Dahlmann
|
||||
|
/S/ Johnston A. Glass
|
|
Director
|
|
March 1, 2019
|
|
Johnston A. Glass
|
||||
|
|
|
Director
|
|
March 1, 2019
|
|
Jon L. Gorney
|
||||
|
/S/ David W. Greenfield
|
|
Director
|
|
March 1, 2019
|
|
David W. Greenfield
|
||||
|
/S/ Bart E. Johnson
|
|
Director
|
|
March 1, 2019
|
|
Bart E. Johnson
|
||||
|
/S/ Luke A. Latimer
|
|
Director
|
|
March 1, 2019
|
|
Luke A. Latimer
|
||||
|
/S/ T. Michael Price
|
|
President and Chief Executive Officer (Principal Executive Officer)
|
|
March 1, 2019
|
|
T. Michael Price
|
||||
|
/S/ James R. Reske
|
|
Executive Vice President, Chief Financial Officer, and Treasurer
|
|
March 1, 2019
|
|
James R. Reske
|
||||
|
/S/ Laurie S. Singer
|
|
Director
|
|
March 1, 2019
|
|
Laurie S. Singer
|
||||
|
/S/ Robert J. Ventura
|
|
Director
|
|
March 1, 2019
|
|
Robert J. Ventura
|
||||
|
/S/ Stephen A. Wolfe
|
|
Director
|
|
March 1, 2019
|
|
Stephen A. Wolfe
|
||||
124
TABLE OF CONTENTS
Part IItem 1. BusinessItem 1A. Risk FactorsItem 1B. Unresolved Staff CommentsItem 2. PropertiesItem 3. Legal ProceedingsItem 4. Mine Safety DisclosuresPart IIItem 5. Market For Registrant S Common Equity, Related Stockholder Matters and Issuer Purchase Of Equity SecuritiesItem 6. Selected Financial DataItem 7. Management S Discussion and Analysis Of Financial Condition and Results Of OperationsItem 7A. Quantitative and Qualitative Disclosures About Market RiskItem 8. Financial Statements and Supplementary DataNote 1 Statement Of Accounting PoliciesNote 2 New Accounting PronouncementsNote 3 AcquisitionNote 4 Supplemental Comprehensive Income DisclosuresNote 5 Supplemental Cash Flow DisclosuresNote 6 Earnings Per ShareNote 7 Cash and Due From BanksNote 8 DerivativesNote 9 Investment SecuritiesNote 10 Impairment Of Investment SecuritiesNote 11 Loans and Allowance For Credit LossesNote 12 Commitments and Letters Of CreditNote 13 Premises and EquipmentNote 14 Goodwill and Other Amortizing Intangible AssetsNote 15 Interest-bearing DepositsNote 16 Short-term BorrowingsNote 17 Subordinated DebenturesNote 18 Other Long-term DebtNote 19 Fair Values Of Assets and LiabilitiesNote 20 Income TaxesNote 21 Retirement PlansNote 22 Incentive Compensation PlanNote 23 Contingent LiabilitiesNote 24 Revenue RecognitionNote 25 Related Party TransactionsNote 26 Regulatory Restrictions and Capital AdequacyNote 27 CapitalNote 28 Condensed Financial Information Of First Commonwealth Financial Corporation (parent Company Only)Item 9. Changes in and Disagreements with Accountants on Accounting and Financial DisclosureItem 9A. Controls and ProceduresItem 9B. Other InformationPart IIIItem 10. Directors, Executive Officers and Corporate GovernanceItem 11. Executive CompensationItem 12. Security Ownership Of Certain Beneficial Owners and Management and Related Stockholder MattersItem 13. Certain Relationships and Related Transactions, and Director IndependenceItem 14. Principal Accountant Fees and ServicesPart IVItem 15. Exhibits, Financial Statements and Schedules