FIRSTCASH, INC
10-Ks and 10-Qs
|
|
|
|
|
|
|
|
|
|
|
|
|
|
|
|
|
|
|
|
|
|
|
|
|
|
|
|
|
|
|
|
|
|
|
|
|
|
|
|
|
|
|
|
|
|
|
|
|
|
|
|
|
|
|
|
|
|
|
UNITED STATES
SECURITIES AND EXCHANGE COMMISSION
WASHINGTON, D.C. 20549
FORM 10-K
|
[ X ]
|
ANNUAL REPORT PURSUANT TO SECTION 13 OR 15(d) OF THE SECURITIES EXCHANGE ACT OF 1934
|
For the fiscal year ended
December 31, 2015
OR
|
[ ]
|
TRANSITION REPORT PURSUANT TO SECTION 13 OR 15(d) OF THE SECURITIES EXCHANGE ACT OF 1934
|
For the transition period from __________ to ___________
Commission file number 0-19133

FIRST CASH FINANCIAL SERVICES, INC.
(Exact name of registrant as specified in its charter)
|
Delaware
|
75-2237318
|
|
(State or other jurisdiction of incorporation or organization)
|
(I.R.S. Employer Identification No.)
|
|
690 East Lamar Blvd., Suite 400
|
76011
|
|
Arlington, Texas
|
(Zip Code)
|
|
(Address of principal executive offices)
|
|
(817) 460-3947
(Registrant’s telephone number, including area code)
Securities registered pursuant to Section 12(b) of the Act:
|
Title of Each Class
|
Name of Exchange on Which Registered
|
|
Common Stock, par value $.01 per share
|
NASDAQ Global Select Market
|
Securities registered pursuant to Section 12(g) of the Act:
None
Indicate by check mark if the registrant is a well-known seasoned issuer, as defined in Rule 405 of the Securities Act.
x
Yes
o
No
Indicate by check mark if the registrant is not required to file reports pursuant to Section 13 or Section 15(d) of the Act.
o
Yes
x
No
Indicate by check mark whether the registrant (1) has filed all reports required to be filed by Section 13 or 15(d) of the Securities Exchange Act of 1934 during the preceding 12 months (or for such shorter period that the registrant was required to file such reports), and (2) has been subject to such filing requirements for the past 90 days.
x
Yes
o
No
Indicate by check mark whether the registrant has submitted electronically and posted on its corporate Web site, if any, every Interactive Data File required to be submitted and posted pursuant to Rule 405 of Regulation S-T (
§
232.405) during the preceding 12 months (or for such shorter period that the registrant was required to submit and post such files).
x
Yes
o
No
Indicate by check mark if disclosure of delinquent filers pursuant to Item 405 of Regulation S-K (§229.405) is not contained herein, and will not be contained, to the best of registrant's knowledge, in definitive proxy or information statements incorporated by reference in Part III of this Form 10-K or any amendment to this Form 10-K.
x
Indicate by check mark whether the registrant is a large accelerated filer, an accelerated filer, a non-accelerated filer or a smaller reporting company. See the definitions of “large accelerated filer,” “accelerated filer” and “smaller reporting company” in Rule 12b-2 of the Exchange Act.
|
x
Large accelerated filer
|
o
Accelerated filer
|
|
o
Non-accelerated filer (Do not check if a smaller reporting company)
|
o
Smaller reporting company
|
Indicate by check mark whether the registrant is a shell company (as defined in Rule 12b-2 of the Act).
o
Yes
x
No
The aggregate market value of the registrant’s common stock held by non-affiliates of the registrant, based upon the last reported sales price on the NASDAQ Global Select Market on
June 30, 2015
, is
$1,239,130,000
.
As of
February 12, 2016
, there were
28,243,229
shares of common stock outstanding.
DOCUMENTS INCORPORATED BY REFERENCE
Portions of the registrant’s definitive Proxy Statement relating to its
2016
Annual Meeting of Stockholders to be held on or about
June 7, 2016
, is incorporated by reference in Part III, Items 10, 11, 12, 13 and 14 of this Annual Report on Form 10-K.
FIRST CASH FINANCIAL SERVICES, INC.
FORM 10-K
For the Year Ended December 31,
2015
TABLE OF CONTENTS
FORWARD-LOOKING INFORMATION
This annual report contains forward-looking statements about the business, financial condition and prospects of First Cash Financial Services, Inc. and its wholly owned subsidiaries (together, the “Company”). Forward-looking statements, as that term is defined in the Private Securities Litigation Reform Act of 1995, can be identified by the use of forward-looking terminology such as “believes,” “projects,” “expects,” “may,” “estimates,” “should,” “plans,” “targets,” “intends,” “could,” or “anticipates,” or the negative thereof, or other variations thereon, or comparable terminology, or by discussions of strategy or objectives. Forward-looking statements can also be identified by the fact that these statements do not relate strictly to historical or current matters. Rather, forward-looking statements relate to anticipated or expected events, activities, trends or results. Because forward-looking statements relate to matters that have not yet occurred, these statements are inherently subject to risks and uncertainties.
Forward-looking statements in this annual report include, without limitation, the Company’s expectations of earnings per share, earnings growth, expansion strategies, the impact of new or existing regulations, store openings, liquidity (including the availability of capital under existing credit facilities), cash flow, consumer demand for the Company’s products and services, income tax rates, currency exchange rates, future share repurchases and anticipated dividend payments, the price of gold and the impacts thereof, future earnings accretion and related transaction expenses from acquisitions and mergers, the successful completion of expected acquisitions, anticipated debt repayments, the ability to successfully integrate acquisitions and other performance results. These statements are made to provide the public with management’s current assessment of the Company’s business. Although the Company believes the expectations reflected in forward-looking statements are reasonable, there can be no assurances such expectations will prove to be accurate. Security holders are cautioned such forward-looking statements involve risks and uncertainties. Certain factors may cause results to differ materially from those anticipated by the forward-looking statements made in this annual report. Such factors are difficult to predict and many are beyond the control of the Company and may include, without limitation, the following:
|
•
|
changes in foreign currency exchange rates and the U.S. dollar to the Mexican peso and Guatemalan quetzal exchange rates in particular;
|
|
•
|
new federal, state or local legislative initiatives or governmental regulations (or changes to existing laws and regulations) affecting pawn businesses, consumer loan businesses and credit services organizations (in the United States, Mexico, Guatemala and El Salvador), including administrative or legal interpretations thereto;
|
|
•
|
changes in consumer demand, including purchasing, borrowing and repayment behaviors;
|
|
•
|
changes in regional, national or international economic conditions, including inflation rates, unemployment rates and energy prices;
|
|
•
|
changes in pawn forfeiture rates and credit loss provisions;
|
|
•
|
changes in the market value of pawn collateral and merchandise inventories, including gold prices and the value of consumer electronics and other products;
|
|
•
|
changes or increases in competition;
|
|
•
|
the ability to locate, open and staff new stores and successfully integrate acquisitions;
|
|
•
|
the availability or access to sources of used merchandise inventory;
|
|
•
|
changes in credit markets, interest rates and the ability to establish, renew and/or extend the Company’s debt financing;
|
|
•
|
the ability to maintain banking relationships for treasury services and processing of certain consumer lending transactions;
|
|
•
|
the ability to hire and retain key management personnel;
|
|
•
|
risks and uncertainties related to foreign operations in Mexico, Guatemala and El Salvador;
|
|
•
|
changes in import/export regulations and tariffs or duties;
|
|
•
|
changes in banking, anti-money laundering or gun control regulations;
|
|
•
|
unforeseen litigation;
|
|
•
|
changes in tax rates or policies in the U.S., Mexico, Guatemala and El Salvador;
|
|
•
|
inclement weather, natural disasters and public health issues;
|
|
•
|
security breaches, cyber attacks or fraudulent activity;
|
|
•
|
a prolonged interruption in the Company’s operations of its facilities, systems, and business functions, including its information technology and other business systems;
|
|
•
|
the implementation of new, or changes in the interpretation of existing, accounting principles or financial reporting requirements; and
|
|
•
|
future business decisions.
|
These and other risks, uncertainties and regulatory developments are further and more completely described in Part 1, Item 1A, “Risk Factors.” Many of these risks and uncertainties are beyond the ability of the Company to control, nor can the Company predict, in many cases, all of the risks and uncertainties that could cause its actual results to differ materially from those indicated by the forward-looking statements. The forward-looking statements contained in this annual report speak only as of the date of this annual report, and the Company expressly disclaims any obligation or undertaking to report any updates or revisions to any such statement to reflect any change in the Company’s expectations or any change in events, conditions or circumstances on which any such statement is based, except as required by law.
General
The Company is a leading operator of retail-based pawn stores in the United States and Latin America. As of
December 31, 2015
, the Company had
1,075
locations, consisting of
338
stores across
14
U.S. states,
705
stores across
29
states in Mexico and
32
stores in Guatemala.
The Company’s primary business is the operation of full-service pawn stores which make small pawn loans secured by personal property such as consumer electronics, jewelry, power tools, household appliances, sporting goods and musical instruments. These pawn stores generate significant retail sales from the merchandise acquired through collateral forfeitures and over-the-counter purchases from customers. In addition, some of the Company’s pawn stores offer small unsecured consumer loans or credit services products. The Company’s strategy is to focus on growing its full-service pawn operations in the United States and Latin America through new store openings and strategic acquisition opportunities as they arise.
In addition to its pawn stores, the Company operates a small number of stand-alone consumer finance stores in Texas and Mexico. These stores primarily provide consumer financial services products including credit services and small unsecured consumer loans. The Company considers the credit services and consumer loan products to be non-core, non-growth revenue streams, representing
4%
of the Company’s total revenues for the year ended
December 31, 2015
.
Revenue for the year ended
December 31, 2015
was primarily generated from the Company’s pawn operations with
52%
derived from Latin America and
48%
from the United States. For additional historical information on the composition of revenues from the United States and Latin America, see “Item 7. Management’s Discussion and Analysis of Financial Condition and Results of Operations—Results of Continuing Operations.”


The Company was formed as a Texas corporation in July 1988. In April 1991, the Company reincorporated as a Delaware corporation. The Company’s principal executive offices are located at 690 East Lamar Blvd., Suite 400, Arlington, Texas 76011, and its telephone number is (817) 460-3947.
1
Pawn Industry
Pawn stores are neighborhood-based retail stores that buy and sell popular consumer items such as consumer electronics, jewelry, power tools, appliances, sporting goods and musical instruments. Pawn stores also provide a quick and convenient source of small consumer loans to unbanked, under-banked and credit-challenged customers. These consumers are typically not effectively or efficiently served by traditional lenders such as banks, credit unions, credit card providers or other small loan providers. The Company’s pawn stores directly compete in both the specialty retail and consumer finance industries.
United States
The pawn industry in the United States is well established, with the highest concentration of pawn stores located in the Southeast, Midwest and Southwest regions of the country. The operation of pawn stores is governed primarily by state laws and accordingly, states that maintain regulations most conducive to profitable pawn operations have historically seen the greatest concentration of pawn stores. Management believes the U.S. pawn industry, although mature, remains highly fragmented. The three major publicly traded companies in the pawn industry, which includes the Company, currently operate approximately 1,600 of the estimated 10,000 to 15,000 pawn stores in the United States. The Company believes the majority of pawnshops in the United States are owned by individuals operating five or fewer locations.
Mexico and Other Latin American Markets
Most of the Company’s pawn stores in Mexico are full-service stores lending on a wide array of collateral with a retail sales floor. The full-service pawn industry in Mexico is less developed as compared to the U.S. Of the approximately 6,000 to 8,000 total pawn stores in Mexico, most are limited service, jewelry-focused stores. The jewelry-focused pawn stores in Mexico are much smaller than a typical U.S. pawn store and have limited retail operations, typically offering only pawn loans collateralized by gold jewelry or small consumer electronics. Competition in Mexico for the Company’s full-service pawn stores is limited, as the Company believes there are less than 1,500 of these full-service pawn stores. A large percentage of the population in Mexico and other countries in Latin America are unbanked or under-banked and have limited access to consumer credit. The Company believes there is significant opportunity for future expansion in Mexico and other Latin American countries due to the large potential consumer base and limited competition from other large, full-service pawn store operators.
Business Strategy
The Company’s business plan is to expand its operations by opening new (“de novo”) retail pawn locations, by acquiring existing pawnshops in strategic markets and attempting to increase revenue and operating profits in its existing stores. In pursuing its business strategy, the Company seeks to establish clusters of several stores in specific geographic areas in order to achieve certain economies of scale relative to management and supervision, pricing and purchasing, information and accounting systems and marketing.
The Company has opened or acquired 550 pawn stores in the last five fiscal years. Net store additions have grown at a compound annual store growth rate of 13% over this period. In addition, the Company acquired 166 stores in Mexico in January 2016 and 13 stores in El Salvador in February 2016. The Company intends to open additional stores in locations where management believes appropriate demand and other favorable conditions exist. The following table details stores opened and acquired over the five year period ended December 31, 2015:
2
|
Year Ended December 31,
|
||||||||||||||
|
2015
|
2014
|
2013
|
2012
|
2011
|
||||||||||
|
U.S. stores:
|
||||||||||||||
|
New locations opened
|
—
|
|
8
|
|
9
|
|
6
|
|
10
|
|
||||
|
Locations acquired
|
33
|
|
25
|
|
34
|
|
46
|
|
11
|
|
||||
|
Total additions
|
33
|
|
33
|
|
43
|
|
52
|
|
21
|
|
||||
|
Latin America stores:
|
||||||||||||||
|
New locations opened
|
38
|
|
31
|
|
60
|
|
62
|
|
61
|
|
||||
|
Locations acquired
|
32
|
|
47
|
|
8
|
|
29
|
|
—
|
|
||||
|
Total additions
|
70
|
|
78
|
|
68
|
|
91
|
|
61
|
|
||||
|
Total:
|
|
|
|
|
|
|||||||||
|
New locations opened
|
38
|
|
39
|
|
69
|
|
68
|
|
71
|
|
||||
|
Locations acquired
|
65
|
|
72
|
|
42
|
|
75
|
|
11
|
|
||||
|
Total additions
|
103
|
|
111
|
|
111
|
|
143
|
|
82
|
|
||||
For additional information on store count activity, see “—Locations and Operations” below.
New Store Openings
The Company plans to continue opening new pawn stores in both Latin America and the U.S. The Company typically opens new stores in under-developed markets, especially where customer demographics are favorable and competition is limited or restricted. After a suitable location has been identified and a lease and material licenses are obtained, a new store can typically be open for business within six to twelve weeks. The investment required to open a new location includes store operating cash, inventory, funds for pawn and consumer loans, leasehold improvements, store fixtures, security systems, computer equipment and other start-up costs.
Acquisitions
Because of the fragmented nature of the pawn industry, the Company believes attractive acquisition opportunities may arise from time to time. Before making an acquisition, management assesses the demographic characteristics of the surrounding area, considers the number, proximity and size of competing stores, and researches state and local regulatory standards. Specific pawn store acquisition criteria include an evaluation of the volume of merchandise sales and pawn transactions, outstanding customer pawn loan balances, historical pawn yields, retail margins and redemption rates, the condition and quantity of inventory on hand, and location, condition and lease terms of the facility.
Enhance Productivity of Existing and Newly Opened Stores
The primary factors affecting the profitability of the Company’s existing store base are the volume and gross profit of merchandise sales, the volume and yield on customer loans outstanding and store expenses. To encourage customer traffic, which management believes is a key determinant to increasing the stores’ profitability, the Company has taken several steps to distinguish its stores and to make customers feel more comfortable. In addition to a clean and secure physical store facility, the stores’ exteriors typically display attractive and distinctive signage similar to those used by contemporary specialty retailers.
The Company has employee-training programs that promote customer service, productivity and professionalism. The Company utilizes a proprietary computer information system that provides fully-integrated functionality to support point-of-sale retail operations, inventory management, customer recordkeeping and loan processing. Each store is connected on a real-time basis to a data center that houses the centralized databases and operating systems. The information systems provide management with the ability to continuously monitor store transactions and operating results. The Company maintains a well-trained internal audit staff that conducts regular store visits to test compliance of financial and operational controls. Management believes the current operating and financial controls and systems are adequate for the Company’s existing store base and can accommodate reasonably foreseeable growth in the near term.
3
Pawn Merchandise Sales
The Company’s pawn merchandise sales are primarily retail sales to the general public from its pawn stores. The items the Company sells generally consist of pre-owned consumer electronics, jewelry, power tools, household appliances, sporting goods and musical instruments. The Company also melts down certain quantities of scrap jewelry and sells the gold, silver and diamonds in commodity markets. Total merchandise sales accounted for approximately
68%
of the Company’s revenue during fiscal
2015
.
The Company acquires pawn merchandise inventory primarily through forfeited pawn collateral and, to a lesser extent, through purchases of used goods directly from the general public. Merchandise acquired by the Company through forfeited pawn collateral is carried in inventory at the amount of the related pawn loan, exclusive of any accrued service fees. The Company also acquires limited quantities of new or refurbished general merchandise inventories directly from wholesalers and manufacturers.
The Company does not provide direct financing to customers for the purchase of its merchandise, but does permit its customers to purchase merchandise on an interest-free, “layaway” plan. Should the customer fail to make a required payment pursuant to a layaway plan, the item is returned to inventory and previous payments are forfeited to the Company. Interim payments from customers on layaway sales are recorded as deferred revenue and subsequently recorded as income during the period in which final payment is received or when previous payments are forfeited to the Company.
Pawn Lending Activities
The Company’s pawn stores make small secured loans to its customers in order to help them meet short-term cash needs. All pawn loans are collateralized by personal property such as consumer electronics, jewelry, power tools, household appliances, sporting goods and musical instruments. Pawn loans are non-recourse loans and the pledged goods provide the only security to the Company for the repayment of the loan. The Company does not investigate the creditworthiness of the borrower, primarily relying instead on the marketability and sales value of pledged goods as a basis for its credit decision. A customer does not have a legal obligation to repay a pawn loan and the decision to not repay the loan will not affect the customer’s credit score.
At the time a pawn loan transaction is entered into, an agreement, commonly referred to as a “pawn ticket,” is delivered to the borrower for signature that sets forth, among other items, the name and address of the pawnshop, the borrower’s name, the borrower’s identification number from his/her driver’s license or other government issued identification, date, identification and description of the pledged goods, including applicable serial numbers, amount financed, pawn service fee, maturity date, total amount that must be paid to redeem the pledged goods on the maturity date and the annual percentage rate.
Pledged property is held through the term of the loan, unless the loan is paid earlier or renewed. The typical pawn loan term is generally 30 days plus an additional grace period of 15 to 90 days depending on geographical markets and local regulations. Pawn loans may be either paid in full with accrued pawn loan fees and service charges or, where permitted by law, may be renewed or extended by the customer’s payment of accrued pawn loan fees and service charges. If a pawn loan is not repaid prior to the expiration of the automatic extension period, if applicable, the pawn collateral is forfeited to the Company and transferred to inventory at a value equal to the principal amount of the loan, exclusive of accrued interest. The Company does not record pawn loan losses or charge-offs because the amount advanced becomes the carrying cost of the forfeited collateral that is to be recovered through the merchandise sales function described above.
The pawn loan fees are typically calculated as a percentage of the pawn loan amount based on the size and duration of the transaction and generally range from 4% to 25% per month, as permitted by applicable law. As required by applicable law, the amounts of these charges are disclosed to the customer on the pawn ticket. Pawn loan fees accounted for approximately
28%
of the Company’s revenue during fiscal
2015
.
The amount the Company is willing to finance for a pawn loan is primarily based on a percentage of the estimated retail value of the collateral. There are no minimum or maximum pawn to fair market value restrictions in connection with the Company’s lending activities. In order to estimate the value of the collateral, the Company utilizes its integrated proprietary computer information system to recall recent selling prices of similar merchandise in its own stores. The basis for the Company’s determination of the retail value also includes such sources as precious metals spot markets, catalogs, blue books, online auction sites and retailer advertisements. These sources, together with the employees’ experience in selling similar items of merchandise in particular stores, influence the determination of the estimated retail value of such items. The Company does not utilize a standard or mandated percentage of estimated retail value in determining the amount to be financed. Rather, the employee has the authority to set the percentage for a particular item and to determine the ratio of pawn amount to estimated sale value with the expectation that, if the item is forfeited to the pawnshop, its subsequent sale should yield a gross profit margin consistent with the Company’s historical experience. The recovery of the principal and realization of gross profit on sales of inventory is dependent on the Company’s initial assessment of the property’s estimated retail value. Improper assessment of the retail value of the collateral in the lending
4
function can result in reduced marketability of the property resulting in a reduced gross profit margin. As of
December 31, 2015
, the Company’s average pawn loan was approximately
$99
on a consolidated basis, approximately
$169
in the U.S. stores and approximately
$63
in the Latin American stores.
Credit Services and Consumer Loan Activities
The Company has significantly reduced its consumer loan activities, primarily from payday lending, over the past several years. The Company closed 23 consumer loan stores in the U.S. during fiscal
2015
. As of
December 31, 2015
, the Company operated 42 stand-alone consumer loan locations in the U.S. and 28 stand-alone consumer loan locations in Mexico. In addition,
138
pawn locations in the U.S. and
49
pawn locations in Mexico also offer consumer loan products.
The Company offers a fee-based credit services organization program (“CSO Program”) to assist consumers in Texas markets in obtaining extensions of credit. The Company’s consumer loan and pawn stores in Texas offer the CSO Program and credit services are also offered via an internet platform for Texas residents. The Company’s CSO Program in Texas is licensed as a Credit Access Business (“CAB”) under Texas Finance Code Chapter 393 and regulated by the Texas Office of the Consumer Credit Commissioner. Under the CSO Program, the Company assists customers in applying for a short-term extension of credit from an independent, non-bank, consumer lending company (the “Independent Lender”) and issues the Independent Lender a letter of credit to guarantee the repayment of the extension of credit. The Company also offers an automobile title lending product under the CSO Program. Total credit services fees accounted for approximately 3% of the Company’s revenue during fiscal
2015
.
The Company also offers small, unsecured consumer loans to customers in various states within the U.S. and in Mexico. To qualify for a consumer loan, a customer generally must have proof of steady income, residence and valid identification. At maturity, the customer typically returns to the store to pay off the loan and related fee with cash. If the customer fails to repay the loan, the Company initiates collection procedures. These consumer loan fees accounted for less than 1% of the Company’s revenue during fiscal
2015
.
See additional discussion of the credit loss provision and related allowances/accruals in “Item 7. Management’s Discussion and Analysis of Financial Condition and Results of Operations—Critical Accounting Policies.”
Financial Information about Geographic Areas
Financial information regarding the Company’s revenue and long-lived assets by geographic areas is provided in Note
16
of Notes to Consolidated Financial Statements contained herein.
5
Locations and Operations
As of
December 31, 2015
, the Company had
1,075
locations in
14
U.S. states,
29
states in Mexico and Guatemala, which represents a net store count increase of
7%
over the number of stores at
December 31, 2014
.
The following table details store count activity for the twelve months ended
December 31, 2015
:
|
|
Consumer
Loan
Locations (2)
|
Total
Locations
|
||||||
|
Pawn
Locations (1)
|
||||||||
|
U.S.:
|
|
|
|
|||||
|
Total locations, beginning of period
|
266
|
|
65
|
|
331
|
|
||
|
Locations acquired
|
33
|
|
—
|
|
33
|
|
||
|
Locations closed or consolidated
|
(3
|
)
|
(23
|
)
|
(26
|
)
|
||
|
Total locations, end of period
|
296
|
|
42
|
|
338
|
|
||
|
Latin America:
|
|
|
|
|||||
|
Total locations, beginning of period
|
646
|
|
28
|
|
674
|
|
||
|
New locations opened
|
38
|
|
—
|
|
38
|
|
||
|
Locations acquired
|
32
|
|
—
|
|
32
|
|
||
|
Locations closed or consolidated
|
(7
|
)
|
—
|
|
(7
|
)
|
||
|
Total locations, end of period
|
709
|
|
28
|
|
737
|
|
||
|
Total:
|
|
|
|
|||||
|
Total locations, beginning of period
|
912
|
|
93
|
|
1,005
|
|
||
|
New locations opened
|
38
|
|
—
|
|
38
|
|
||
|
Locations acquired
|
65
|
|
—
|
|
65
|
|
||
|
Locations closed or consolidated
|
(10
|
)
|
(23
|
)
|
(33
|
)
|
||
|
Total locations, end of period
|
1,005
|
|
70
|
|
1,075
|
|
||
|
(1)
|
At
December 31, 2015
,
138
of the U.S. pawn stores, which are primarily located in Texas, also offered consumer loans or credit services products, while
49
Mexico pawn stores offer consumer loan products.
|
|
(2)
|
The Company’s U.S. free-standing consumer loan locations offer a credit services product and are all located in Texas. The Mexico locations offer small, short-term consumer loans.
|
The Company maintains its primary administrative offices in Arlington, Texas and Monterrey, Mexico.
6
As of
December 31, 2015
, the Company’s stores were located in the following states:
|
Consumer
Loan
Locations
|
Total Locations
|
|||||||
|
Pawn
Locations
|
||||||||
|
United States:
|
||||||||
|
Texas
|
138
|
|
42
|
|
180
|
|
||
|
Colorado
|
31
|
|
—
|
|
31
|
|
||
|
Maryland
|
29
|
|
—
|
|
29
|
|
||
|
North Carolina
|
24
|
|
—
|
|
24
|
|
||
|
South Carolina
|
21
|
|
—
|
|
21
|
|
||
|
Kentucky
|
15
|
|
—
|
|
15
|
|
||
|
Indiana
|
10
|
|
—
|
|
10
|
|
||
|
Missouri
|
8
|
|
—
|
|
8
|
|
||
|
Virginia
|
6
|
|
—
|
|
6
|
|
||
|
Oklahoma
|
4
|
|
—
|
|
4
|
|
||
|
Tennessee
|
3
|
|
—
|
|
3
|
|
||
|
District of Columbia
|
3
|
|
—
|
|
3
|
|
||
|
Wyoming
|
3
|
|
—
|
|
3
|
|
||
|
Nebraska
|
1
|
|
—
|
|
1
|
|
||
|
296
|
|
42
|
|
338
|
|
|||
|
Mexico:
|
||||||||
|
Estado de. Mexico (State of Mexico)
|
86
|
|
—
|
|
86
|
|
||
|
Baja California
|
68
|
|
3
|
|
71
|
|
||
|
Nuevo Leon
|
59
|
|
2
|
|
61
|
|
||
|
Jalisco
|
54
|
|
4
|
|
58
|
|
||
|
Tamaulipas
|
50
|
|
3
|
|
53
|
|
||
|
Coahuila
|
40
|
|
—
|
|
40
|
|
||
|
Puebla
|
36
|
|
4
|
|
40
|
|
||
|
Chihuahua
|
36
|
|
2
|
|
38
|
|
||
|
Guanajuato
|
28
|
|
6
|
|
34
|
|
||
|
Veracruz
|
33
|
|
—
|
|
33
|
|
||
|
Sonora
|
24
|
|
—
|
|
24
|
|
||
|
Estado de Ciudad de Mexico (State of Mexico City)
|
18
|
|
—
|
|
18
|
|
||
|
Sinaloa
|
16
|
|
—
|
|
16
|
|
||
|
Queretaro
|
12
|
|
1
|
|
13
|
|
||
|
Durango
|
13
|
|
—
|
|
13
|
|
||
|
Guerrero
|
13
|
|
—
|
|
13
|
|
||
|
Aguascalientes
|
10
|
|
3
|
|
13
|
|
||
|
Morelos
|
13
|
|
—
|
|
13
|
|
||
|
San Luis Potosi
|
11
|
|
—
|
|
11
|
|
||
|
Michoacan
|
11
|
|
—
|
|
11
|
|
||
|
Quintana Roo
|
10
|
|
—
|
|
10
|
|
||
|
Hidalgo
|
9
|
|
—
|
|
9
|
|
||
|
Baja California Sur
|
8
|
|
—
|
|
8
|
|
||
|
Zacatecas
|
5
|
|
—
|
|
5
|
|
||
|
Colima
|
5
|
|
—
|
|
5
|
|
||
7
|
Consumer
Loan
Locations
|
Total Locations
|
|||||||
|
Pawn
Locations
|
||||||||
|
Mexico (continued):
|
||||||||
|
Chiapas
|
3
|
|
—
|
|
3
|
|
||
|
Tabasco
|
2
|
|
—
|
|
2
|
|
||
|
Nayarit
|
2
|
|
—
|
|
2
|
|
||
|
Yucatan
|
2
|
|
—
|
|
2
|
|
||
|
677
|
|
28
|
|
705
|
|
|||
|
Guatemala
|
32
|
|
—
|
|
32
|
|
||
|
Total
|
1,005
|
|
70
|
|
1,075
|
|
||
Pawn Store Operations
The typical Company pawn store is a freestanding building or part of a retail shopping center with adequate, well-lit parking. Management has established a standard store design intended to distinguish the Company’s stores from the competition. The design consists of a well-illuminated exterior with distinctive signage and a layout similar to other contemporary specialty retailers. The Company’s stores are typically open six to seven days a week from 9:00 a.m. to between 6:00 p.m. and 9:00 p.m.
The Company attempts to attract customers primarily through the pawn stores’ visibility and neighborhood presence. The Company uses seasonal promotions, special discounts for regular customers, prominent display of impulse purchase items such as consumer electronics, jewelry and power tools, tent and sidewalk sales, and a layaway purchasing plan to attract retail shoppers. The Company attempts to attract and retain pawn customers by lending a competitive percentage of the estimated sale value of items presented for pledge and by providing quick financing, renewal and redemption services in an appealing atmosphere.
Each pawnshop employs a manager, one or two assistant managers, and between one and eight sales personnel, depending upon the size, sales volume and location of the store. The store manager is responsible for supervising personnel and assuring the store is managed in accordance with Company guidelines and established policies and procedures. Each manager reports to an area supervisor, who typically oversees four to seven store managers. Area supervisors typically report to a Regional Market Manager, who in turn reports to a Regional Operations Director. Regional Operations Directors report to a Senior Vice President of Operations.
The Company believes the profitability of its pawnshops is dependent, among other factors, upon its employees’ ability to engage in transactions that achieve optimum pawn yields and merchandise sales margins, to be effective sales people and to provide prompt and courteous service. The Company’s computer system permits a store manager or clerk to rapidly recall the cost of an item in inventory and the date it was purchased, as well as the prior transaction history of a particular customer. It also facilitates the timely valuation of goods by showing values assigned to similar goods in the past. The Company has networked its stores to permit the Company’s headquarters to more efficiently monitor each store’s operations, including merchandise sales, service charge revenue, pawns written and redeemed and changes in inventory.
The Company trains its employees through direct instruction and on-the-job pawn and sales experience. New employees are introduced to the business through an orientation and training program that includes on-the-job training in lending practices, layaways, merchandise valuation and general administration of store operations. Certain experienced employees receive training and an introduction to the fundamentals of management to acquire the skills necessary to advance into management positions within the organization. Management training typically involves exposure to income maximization, recruitment, inventory control and cost efficiency. The Company maintains a performance-based compensation plan for all store employees based on sales, gross profit and other performance criteria.
8
Credit Services and Consumer Loan Operations
Similar to the Company’s pawn store operations, the Company’s credit services and consumer loan locations are typically part of a retail strip shopping center with good visibility from a major street and easy access to parking. Management has established a standard store design intended to distinguish the Company’s stores from the competition, which consists of a well-illuminated exterior with lighted signage. The interiors typically feature an ample lobby separated from employee work areas by glass teller windows. The Company’s credit services and consumer loan locations are typically open six to seven days a week from 9:00 a.m. to between 6:00 p.m. and 9:00 p.m.
Competition
The Company encounters significant competition in connection with all aspects of its business operations. These competitive conditions may adversely affect the Company’s revenue, profitability and ability to expand. The Company believes the primary elements of competition in the businesses in which it operates are store location, the ability to lend competitive amounts on pawn and consumer loans, customer service and management of store employees. In addition, the Company competes with financial institutions, such as banks and consumer finance companies, which generally lend on an unsecured as well as a secured basis. Other lenders may and do lend money on terms more favorable than those offered by the Company. Many of these competitors have greater financial resources than the Company.
The Company’s pawn business competes primarily with other pawn store operators, other specialty consumer finance operators, rent-to-own stores and specialty consumer goods retailers. Management believes the pawn industry remains highly fragmented with an estimated 10,000 to 15,000 total pawnshops in the United States and 6,000 to 8,000 pawnshops in Mexico. There are three large publicly-held, U.S.-based pawnshop operators, two of which have pawn operations in the U.S. and Mexico. The Company had the most pawn stores and the largest market capitalization of the peer group as of
December 31, 2015
, and the Company believes it is the largest public or private operator of full-service pawn stores in Mexico. The pawnshop and other specialty consumer finance industries are characterized by a large number of independent owner-operators, some of whom own and operate multiple locations.
In both its U.S. and Latin American retail pawn operations, the Company’s competitors include numerous retail and wholesale merchants, including jewelry stores, rent-to-own stores, discount retail stores, “second-hand” stores, consumer electronics stores, other specialty retailers, online retailers, online auction sites, online classified advertising sites and other pawnshops. Competitive factors in the Company’s retail operations include the ability to provide the customer with a variety of merchandise items at attractive prices. Many of the retail competitors have significantly greater size and financial resources than the Company.
Intellectual Property
The Company relies on a combination of copyright, trade secret, trademark, and other rights, as well as confidentiality procedures and contractual provisions to protect its proprietary technology, processes and other intellectual property.
The Company’s competitors may develop products that are similar to its technology, such as the Company’s proprietary point of sale software. The Company enters into agreements with its employees, consultants and partners, and through these and other written agreements, the Company attempts to control access to and distribution of its software, documentation and other proprietary technology and information. Despite the Company’s efforts to protect its proprietary rights, third parties may, in an authorized or unauthorized manner, attempt to use, copy or otherwise obtain and market or distribute its intellectual property rights or technology or otherwise develop a product with the same functionality as its solution. Policing all unauthorized use of the Company’s intellectual property rights is nearly impossible. The Company cannot be certain that the steps it has taken or will take in the future will prevent misappropriations of its technology or intellectual property rights.
“First Cash”
and
“First Cash Pawn”
are registered trademarks in the United States. Other significant trade names used by the Company include First Cash Empeno, First Cash Advance, Presta Max, Famous Pawn, Fast Cash Pawn & Gold Center, King Pawn, Mister Money Pawn, Money Man Pawn, Valu + Pawn, Dan’s Discount Jewelry & Pawn, Cash America (in Mexico and Colorado), Quick Cash, Empenos Mexicanos and Realice Empenos.
9
Governmental Regulation
General
The Company is subject to significant regulation of its pawn, consumer lending and general business operations in all of the jurisdictions in which it operates. These regulations are implemented through various laws, ordinances and regulatory pronouncements from federal, state and municipal governmental entities in the United States and Latin America. These regulatory bodies often have broad discretionary authority in the establishment, interpretation and enforcement of such regulations. These regulations are often subject to change, sometimes significantly, as a result of political, economic or social trends, events and media perceptions.
The Company is subject to specific laws, ordinances and regulations primarily concerning its pawn and consumer lending operations. Many statutes and regulations prescribe, among other things, the general terms of the Company’s pawn and consumer loan agreements, including maximum service fees and/or interest rates that may be charged and collected. In many municipal, state and federal jurisdictions, in both the United States and countries in Latin America, the Company must obtain and maintain regulatory operating licenses and comply with regular or frequent regulatory reporting and registration requirements, including reporting and recording of pawn loans, pawned collateral, used merchandise purchased from the general public, retail sales activities, firearm transactions, export, import and transfer of merchandise, and currency transactions, among other things.
In both the United States and Latin America, governmental action to further restrict or even prohibit pawn loans and transactions or small consumer loans, such as payday advances and credit services products, has been advocated over the past few years by elected officials, regulators, consumer advocacy groups and the media. The elected officials, regulators, consumer groups and media typically focus on the aggregated cost to a consumer for pawn and consumer loans, which is typically higher than the interest generally charged by banks, credit unions and credit card issuers to a more creditworthy consumer. They also focus on affordability issues such as the borrower’s ability to repay such loans, real or perceived patterns of sustained or cyclical usage of such lending products and consumer loan collection practices perceived to be unfair or abusive. The elected officials, regulators, consumer groups and media often characterize pawn and payday lending activities as unfair or potentially abusive to consumers. During the last few years, legislation, ordinances and edicts (on federal, state and municipal levels) have been introduced or enacted to prohibit, restrict or further regulate pawn loans and related transactions, including acceptance of pawn collateral, sale of merchandise, payday loans, consumer loans, credit services and related service fees. In addition, public officials and regulatory authorities in various levels of government in the United States and countries in Latin America have and will likely continue to make edicts, proposals or public statements concerning new or expanded regulations that would prohibit or further restrict pawn and consumer lending activities or other related pawn transactions.
The Company is subject to numerous other types of regulations, including but not limited to, regulations related to securities and exchange activities, including financial reporting and internal controls processes, data protection and privacy, tax compliance, labor and employment practices, real estate transactions, electronic banking, credit card transactions, marketing, and advertising and other general business activities.
There can be no assurance that additional local, state or federal statutes, regulations or edicts will not be enacted or that existing laws and regulations will not be amended, decreed or interpreted at some future date that could prohibit or limit the ability of the Company to profitably operate any or all of its services. For example, such regulations could restrict the ability of the Company to offer pawn loans, consumer loans and credit services, significantly decrease the interest rates or service fees for such lending activities, prohibit or more stringently regulate the acceptance of pawn collateral, sale, exportation or importation of pawn merchandise, or processing of consumer loan transactions through the banking system, any of which could have a material adverse effect on the Company’s operations and financial condition. If legislative, regulatory or other arbitrary actions or interpretations are taken at a federal, state or local jurisdiction level in the United States or countries in Latin America which negatively affect the pawn, consumer loan or credit services industries where the Company has a significant number of stores, those actions could have a material adverse effect on the Company’s business operations. There can be no assurance that such regulatory action at any jurisdiction level will not be enacted, or that existing laws and regulations will not be amended, decreed or interpreted in such a way which could have a material adverse effect on the Company’s operations and financial condition.
10
U.S. Federal Regulations
The U.S. government and its agencies have significant regulatory authority over consumer financial services activities. In recent years, additional legislation and regulations have been enacted or proposed which has increased or could continue to increase regulation of the consumer finance industry. These regulations and restrictions are or may be specific to pawn, credit services and consumer loan/payday advance operations.
The Consumer Financial Protection Bureau (the “CFPB”), which was created by Title X of the Dodd Frank Wall Street Reform and Consumer Protection Act of 2010 (the “Dodd-Frank Act”), has broad regulatory, supervisory and enforcement powers over most non-bank providers of consumer credit. The CFPB’s powers include explicit supervisory authority to examine and require registration of providers of consumer financial products and services, including providers of consumer loans, such as the Company, the authority to adopt rules describing specified acts and practices as being “unfair,” “deceptive,” “abusive” and hence “unlawful,” and the authority to impose recordkeeping obligations and promulgate additional compliance requirements.
The CFPB has been systematically gathering data to obtain a complete picture of the consumer loan market and its impact on consumers. The CFPB has also released its
Short-Term, Small-Dollar Lending Procedures
, which is the field guide CFPB examiners use when examining small-dollar lenders like the Company. The CFPB’s examination authority permits CFPB examiners to inspect the Company’s books and records and ask questions about its business and its practices. The examination procedures include, among other things, specific modules for examining marketing activities, loan application and origination activities, payment processing activities and sustained use by consumers, collections and collection practices, defaults, consumer reporting and third-party or vendor relationships.
In addition to the Dodd-Frank Act’s grant of regulatory and supervisory powers to the CFPB, the Dodd-Frank Act gives the CFPB authority to pursue administrative proceedings or litigation for violations of federal consumer laws (including the CFPB’s own rules). In these proceedings, the CFPB can obtain cease and desist orders (which can include orders for redisclosure, restitution or rescission of contracts, as well as affirmative or injunctive relief) and monetary penalties ranging from $5,000 per day for certain violations of federal consumer laws to $25,000 per day for reckless violations, and $1,000,000 per day for knowing or intentional violations. Also, where a company has been found to have violated consumer laws, the Dodd-Frank Act empowers state attorneys general and state regulators to bring civil actions seeking the same equitable relief available to the CFPB. If the CFPB or one or more state officials believe that the Company has violated any of the applicable laws or regulations, they could exercise their enforcement powers in ways that could have a material adverse effect on the Company or its business.
In March 2015, the CFPB published proposed rules significantly affecting payday loans, vehicle title loans, deposit advance products, high-cost installment and open ended loans, lines of credit and other loans (“Proposed Rules”). The Proposed Rules, among other things, would require additional underwriting criteria, cooling-off periods between certain loans and limitations to prevent the sustained use of certain loans. For example, the Proposed Rules would require lenders to analyze whether consumers can afford and repay the loans without incurring increasing costs, cap loan amounts, limit vehicles as collateral, cap the number of rollovers at two (three loans total) and require that the principal decrease with each rollover loan so that it is repaid after the third loan or provide a no-cost “off-ramp” after the third loan. The Proposed Rules would also restrict lenders from attempting to collect payment from consumers’ bank accounts in ways that cause the consumer to incur excessive bank fees. The CFPB published the Proposed Rules under consideration in preparation for convening a Small Business Review Panel to gather feedback from industry experts, small lenders, and the business community which is the next step in the rule-making process. The Proposed Rules are not final and could change significantly. According to the CFPB, the final rules are expected to be released in the first half of 2016.
The Company does not currently anticipate the Proposed Rules will materially affect its pawn lending activities; however, the Company’s consumer loan, credit services and vehicle title loan products could be negatively affected if they are finally adopted as written. It is not possible to accurately fully predict the scope, extent, nature or effect of the Proposed Rules until further guidance is provided by the CFPB. Further, there can be no assurance that the CFPB will not propose or adopt future rules affecting pawn or short-term lending products, such as payday, title lending and credit services products, making them materially less profitable or even impractical to offer. For fiscal
2015
, approximately
48%
of the Company’s total revenue was generated from U.S.-based pawn and consumer lending products, consisting of 44% from U.S. pawn products and 4% from U.S. consumer lending products.
The Military Lending Act (“MLA”) which became effective in October 2007, limits the annual percentage rate charged on most consumer loans made to active military personnel or their dependents to 36%. The Company does not have, nor does it intend to develop, any consumer/payday loan or credit services products bearing an effective interest and fee rate of 36% per annum or less, as the Company believes the losses and servicing costs associated with lending to the Company’s traditional customer base would exceed the revenue produced at that rate. As a result, the Company does not have a consumer loan product to offer active military personnel or their dependents.
11
In July 2015, the Department of Defense published a finalized set of new rules (“New MLA Rules”) under the MLA. The Company believes the New MLA Rules expand the scope of the credit products to include certain loans secured by personal property or vehicles and certain unsecured installment loan products to the extent any of such products have an annual percentage rate greater than 36%. Once the New MLA Rules take effect, the Company may not be able to offer any of its current credit products (including pawn loans) to members of the military or their dependents because current product offerings do not conform to the New MLA Rules. The New MLA Rules are scheduled to become effective on October 3, 2016. Compliance with the New MLA Rules could be complex and increase compliance costs; however, the Company currently has a limited number of stores near military bases and does not expect compliance with the New MLA Rules to have a material adverse impact overall on the Company’s financial condition or operating results once the rules take effect.
In addition to the federal laws and frameworks already governing the financial industry, the United States Justice Department (“DOJ” or “Department of Justice”), in conjunction with federal banking regulators, began an initiative in 2013 (“Operation Choke Point”) which was directed at banks in the United States that do business with payment processors, payday lenders, pawn operators and other companies believed to be at higher risk for fraud and money laundering. It is believed the intent of this initiative was to restrict the ability of banks to provide financial services to companies in the targeted industries. In January 2015, the Federal Deposit Insurance Corporation (the “FDIC”) issued a publication encouraging banks to take a risk-based approach in assessing individual customer relationships, rather than declining to provide banking services to entire categories of customers without regard to the risks presented by an individual customer or the financial institution’s ability to manage the risk. While many believe this publication effectively ended Operation Choke Point, reports of the difficulty in securing new banking services and the termination of existing banking services of legal businesses within targeted industries continue. There can be no assurance that Operation Choke Point will not pose a future threat to the Company’s ability to access credit, maintain bank accounts, process payday lending transactions or obtain other banking services needed to operate efficiently and profitably.
In connection with credit services/consumer loan transactions, the Company must comply with the various disclosure requirements under the Federal Truth in Lending Act (and Federal Reserve Regulation Z promulgated thereunder). These disclosures include, among other things, the total amount of the finance charges and annualized percentage rate of the charges associated with consumer loan and credit services transactions.
The credit services/consumer loan business is also subject to various laws, rules and guidelines relating to the procedures and disclosures needed for debiting a debtor’s checking account for amounts due via an ACH transaction. Additionally, the Company is subject to the Federal Fair Debt Collection Practices Act (“FDCPA”) and applicable state collection laws when conducting its collection activities. Furthermore, with respect to online consumer loans, the Company is subject to various state and federal e-signature rules mandating that certain disclosures be made and certain steps be followed in order to obtain and authenticate e-signatures. In addition, some states restrict the advertising content of marketing materials with respect to consumer loans.
Under the Bank Secrecy Act, the U.S. Department of the Treasury (the “Treasury Department”) regulates transactions involving currency in an amount greater than $10,000 and the purchase of monetary instruments for cash in amounts from $3,000 to $10,000 must be recorded. In general, financial institutions, including the Company, must report each deposit, withdrawal, exchange of currency or other payment or transfer, whether by, through or to the financial institution, that involves currency in an amount greater than $10,000. In addition, multiple currency transactions must be treated as single transactions if the financial institution has knowledge that the transactions are by, or on behalf of, any one person and result in either cash in or cash out totaling more than $10,000 during any one business day.
The Money Laundering Suppression Act of 1994 added a section to the Bank Secrecy Act requiring the registration of “money services businesses” that engage in check cashing, currency exchange, money transmission, or the issuance or redemption of money orders, traveler’s checks and similar instruments. The purpose of the registration is to enable governmental authorities to better enforce laws prohibiting money laundering and other illegal activities. The regulations require money services businesses to register with the Treasury Department by filing a form, adopted by the Financial Crimes Enforcement Network of the Treasury Department (“FinCEN”), and to re-register at least every two years thereafter. The regulations also require that a money services business maintain a list of names and addresses of, and other information about, its agents and that the list be made available to any requesting law enforcement agency (through FinCEN). The agent list must be updated annually. Currently, check cashing is the only product offered by the Company which is subject to such money services regulations.
In March 2000, FinCEN adopted additional regulations, implementing the Bank Secrecy Act that also address money services businesses. These regulations require money services businesses, such as the Company, to report suspicious transactions involving at least $2,000 to FinCEN. The regulations generally describe three classes of reportable suspicious transactions - one or more related transactions that the money services business knows, suspects, or has reason to suspect (1) involve funds derived from illegal activity or are intended to hide or disguise such funds; (2) are designed to evade the requirements of the Bank Secrecy Act; or (3) appear to serve no business or lawful purpose.
12
Under the USA PATRIOT Act passed by Congress in 2001 and revised in 2006, the Company is required to maintain an anti-money laundering compliance program. The program must include (1) the development of internal policies, procedures and controls; (2) the designation of a compliance officer; (3) an ongoing employee-training program; and (4) a review function to test the program.
The Gramm-Leach-Bliley Act requires the Company to generally protect the confidentiality of its customers’ nonpublic personal information and to disclose to its customers its privacy policy and practices, including those regarding sharing the customers’ nonpublic personal information with third parties. Such disclosure must be made to customers at the time the customer relationship is established, at least annually thereafter, and if there is a change in the Company’s privacy policy. In addition, the Company is subject to strict document retention and destruction policies.
The federal Equal Credit Opportunity Act (“ECOA”) prohibits discrimination against any credit applicant on the basis of any protected category, such as race, color, religion, national origin, sex, marital status, or age, and requires the Company to notify credit applicants of any action taken on the individual’s credit application. The Company must provide a loan applicant a Notice of Adverse Action (“NOAA”) when the Company denies an application for credit. The NOAA must inform the applicant of (1) the action taken regarding the credit application; (2) a statement of the ECOA’s prohibition on discrimination; (3) the name and address of both the creditor and the federal agency that monitors compliance with the ECOA; and (4) the applicant’s right to learn
the specific reasons for the denial of credit and the contact information for the parties the applicant can contact to obtain those reasons. The Company provides NOAA letters and maintains records of all such letters as required by the ECOA and its regulations.
The Company’s consumer loan products are subject to the Fair Credit Reporting Act, which requires the Company to provide certain information to customers whose credit applications are not approved on the basis of a report obtained from a consumer reporting agency and to respond to consumers who inquire regarding any adverse reporting submitted by the Company to the consumer reporting agencies.
The federal Fair and Accurate Credit Transactions Act (“FACTA”) requires the Company to adopt written guidance and procedures for detecting, preventing and responding appropriately to mitigate identity theft and to adopt various coworker policies, procedures, and provide coworker training and materials that address the importance of protecting nonpublic personal information and aid the Company in detecting and responding to suspicious activity, including suspicious activity which may suggest a possible identity theft red flag, as appropriate.
The Company is subject to the Foreign Corrupt Practices Act (“FCPA”) and other laws that prohibit improper payments or offers of improper payments to foreign governments and their officials and political parties by U.S. persons and issuers (as defined by the statute) for the purpose of obtaining or retaining business. It is the Company’s policy to maintain safeguards to discourage these practices by its employees and follow Company standards of conduct for its business throughout the U.S. and Latin America, including the prohibition of any direct or indirect payment or transfer of Company funds or assets to suppliers, vendors, or government officials in the form of bribes, kickbacks or other illegal payoffs.
Each pawn store location that handles pawned firearms or buys and sells firearms must comply with the Brady Handgun Violence Prevention Act (the “Brady Act”). The Brady Act requires that federally licensed firearms dealers conduct a background check in connection with any disposition of handguns. In addition, the Company must comply with the regulations of the U.S. Department of Justice-Bureau of Alcohol, Tobacco and Firearms that require each pawn lending location dealing in guns to obtain a Federal Firearm License (“FFL”) and maintain a permanent written record of all receipts and dispositions of firearms. As of December 31,
2015
, the Company had 168 locations in the U.S. with an active FFL.
U.S. State and Local Regulations
The Company operates pawn stores in
14
U.S. states, all of which have licensing and/or fee regulations on pawnshop operations, including Texas, Indiana, Oklahoma, Maryland, Virginia, South Carolina, North Carolina, Washington, D.C., Colorado, Kentucky, Nebraska, Wyoming, Tennessee and Missouri. The Company is licensed in each of the states in which a license is currently required for it to operate as a pawnbroker. Certain jurisdictions restrict or prohibit the Company from transferring and/or relocating its pawn licenses and restrict or prohibit the issuance of new licenses. The Company’s fee structures are at or below the applicable rate ceilings adopted by each of these states. The Company offers its pawn and retail customers an interest free layaway plan which complies with applicable state laws. In addition, the Company is in compliance with the net asset requirements in states where it is required to maintain certain levels of liquid assets for each pawn store it operates in the applicable state.
Under some county and municipal ordinances, pawn stores must provide local law enforcement agencies with reports of all daily transactions involving pawns and over-the-counter merchandise purchases. These daily transaction reports are designed to provide local law enforcement officials with a detailed description of the merchandise involved, including serial numbers, if any, or other
13
specific identifying information, including the name and address of the customer obtained from a valid identification card and photographs of the customers and/or merchandise in certain jurisdictions. Goods held to secure pawns or goods purchased may be subject to mandatory holding periods before they can be resold by the Company. If pawned or purchased merchandise is determined to belong to an owner other than the borrower or seller, it may be subject to confiscation by police for recovery by the rightful owners. Historically, the Company has not found the volume of the confiscations or claims to have a material adverse effect upon results of operations. The Company does not maintain insurance to cover the costs of returning merchandise to its rightful owners but historically has benefited from civil and criminal restitution efforts.
The Company offers a credit services product in the state of Texas and operates as a registered credit services organization as provided under Section 393 of the Texas Finance Code. As a credit services organization, the Company assists customers in applying for a short-term extension of credit from the Independent Lender and issues the Independent Lender a letter of credit to guarantee the repayment of the extension of credit. When a consumer executes a credit services agreement with the Company, the customer agrees to pay a fee to the Company if the Independent Lender approves the extension of credit, and the Company agrees to guarantee the customer’s obligation to repay the extension of credit received by the customer from the Independent Lender if the customer fails to do so. The credit services organization must give a consumer the right to cancel the credit services agreement without penalty within three days after the agreement is signed. In addition, under the provisions of the credit services statute, each credit services location must be registered as a credit services organization and pay a registration fee. In May of 2011, in the state of Texas, legislation was enacted and became effective in 2012 to further regulate credit services businesses in the state, which includes the Company’s CSO Program. The 2011 law creates an expanded regulatory framework under which Credit Access Businesses (“CAB”) may provide credit services products. The regulations provide the CAB be licensed, regulated and audited by the State’s Office of the Consumer Credit Commissioner. The law also provides for enhanced disclosures to customers regarding credit services products.
Primarily as a result of municipal ordinances enacted in several cities in Texas over the past few years which significantly restrict payday and title lending operations, the Company closed 23 stand-alone consumer loan stores during fiscal 2015 and three locations in fiscal 2014. These city ordinances, along with overall deterioration in store-based consumer lending market conditions, have resulted in the Company recording a $7,913,000 goodwill impairment charge during the third quarter of 2015 attributed to its U.S. consumer loan operations reporting unit. As of December 31, 2015, the Company has no remaining goodwill or other intangible assets associated with this reporting unit. During fiscal 2015, the Company’s U.S. consumer and vehicle loan operations represented approximately 4% of the Company’s overall revenues.
It is expected that additional legislation and/or regulations relating to pawn loans, credit services, installment loans and other consumer loan products will be proposed in several state legislatures and/or city councils, including Texas, where the Company has pawn and credit services operations. As an example, the City of Arlington in Texas recently enacted such an ordinance which became effective January 1, 2016. Though the Company cannot accurately predict the scope, extent and nature of future regulations, it is likely that such legislation may address the maximum allowable interest rates on loans, significantly restrict the ability of customers to obtain such loans by limiting the maximum number of consecutive loan transactions that may be provided to a customer, and/or limiting the total loans a customer may have outstanding at any point in time. Any or all of these changes could make offering these products less profitable and could restrict or even eliminate the availability of consumer loan, pawn loan and credit services products in some or all of the states in which the Company offers such products.
Many local government entities also prohibit or restrict pawn and other consumer finance and check cashing activities through zoning ordinances. Such ordinances can significantly prohibit the ability of the Company to move, expand, remodel or relocate store locations, and in some cases cause existing stores to be closed. In some jurisdictions, check cashing companies or money transmission agents are required to meet minimum bonding or capital requirements and are subject to record-keeping requirements.
The Company cannot currently assess the likelihood of any other proposed legislation, regulations or amendments, such as those described above, which could be enacted; however, if such legislation or regulations were enacted in certain jurisdictions, it could have a materially adverse impact on the revenue and profitability of the Company.
Mexico Federal Regulations
Federal law in Mexico provides for administrative regulation of the pawnshop industry by the Federal Consumer Protection Bureau (“PROFECO”), Mexico’s primary federal consumer protection agency, which requires the Company to annually register its pawn stores, locations, loan contracts and disclose the interest rate and fees charged on pawn and consumer loan transactions. In addition, the pawnshop and consumer finance industries in Mexico are subject to various general business regulations in the areas of tax compliance, customs, consumer protections, money laundering, public safety and employment matters, among others, by various federal, state and local governmental agencies.
14
PROFECO regulates the form and terms of pawn loan contracts and defines certain operating standards and procedures for pawnshops, including retail operations, consumer disclosures and establishes reporting requirements. In January 2013, federal legislation conveyed additional regulatory authority to PROFECO regarding the pawn industry and national registration process. The 2013 legislation requires all pawn businesses to register annually with and be approved by PROFECO in order to legally operate. In addition, all operators must comply with additional customer notice and disclosure provisions, bonding requirements to insure against loss or insolvency, reporting of certain types of suspicious transactions, and reporting to state law enforcement officials of certain transactions (or series of transactions) or suspicious transactions. PROFECO continues to implement its process and procedures regarding its registration requirements and the Company has complied and complies in all material respects with this process and registration requirements as administered by PROFECO. There are significant fines and sanctions, including operating suspensions for failure to register and/or comply with PROFECO’s rules and regulations. While there can be no assurance as to the ultimate outcome from the full and final implementation of the 2013 legislation, the Company believes it complies with the rules and regulations, as currently administered, and believes that when fully implemented, these registration requirements should have limited impact on its operations or profitability. In fiscal
2015
, approximately
52%
of the Company’s revenue was derived from its Mexican operations.
Effective in November 2013, the federal government of Mexico enacted new anti-money laundering regulations, The Federal Law for the Prevention and Identification of Transactions with Funds From Illegal Sources (“Anti-Money Laundering Law”),
which requires reporting of certain transactions (or series of transactions) exceeding certain monetary limits, imposed stricter maintenance of customer identification records and controls, and requires reporting of all foreign (non-Mexican) customer transactions. This law affects all industries in Mexico and is intended to detect commercial activities arising from illicit or ill-gotten means though bilateral cooperation between Mexico’s Ministry of Finance and Public Credit (SAT or Hacienda), and Mexico’s Attorney General’s Office (PGR). This law restricts the use of cash in certain transactions associated with high-value assets, and limits, to the extent possible, money laundering activities protected by the anonymity that cash transactions provide. The law empowers Hacienda to oversee and enforce this regime and to follow up on the information received from other agencies in Mexico and abroad. Relevant aspects of the law specifically affecting the pawn industry include monthly reporting by the Company to Hacienda and the PGR on “vulnerable activities,” which encompass pawn transactions (of cash or credit) exceeding $103,000 Mexican pesos, retail transactions of precious metals exceeding $52,000 Mexican pesos, and retail transactions of precious metals exceeding $207,000 Mexican pesos are prohibited. There are significant fines and sanctions for failure to comply with the Anti-Money Laundering Law regulations.
In January 2012, new terms of the Federal Personal Information Protection Act (“Privacy Law”) went into effect, which require companies to protect their customers’ personal information. Specifically, the Privacy Law requires that the Company inform its customers whether the Company shares the customer’s personal information with third parties or transfers personal information to third parties. It also requires public posting (both on-line and in-store) of the Company’s privacy policy, which includes a process for the customer to revoke any previous consent granted to the Company for the use of the customer’s personal information, or limit the use or disclosure of such information.
Mexico State and Local Regulations
Certain state and local governmental entities in Mexico also regulate pawn, other consumer finance and retail businesses through state laws and local zoning and permitting ordinances. For example, the states of Estado de Mexico, Tabasco, Guanajuato, Coahuila, Nuevo Leon, Colima, and Puebla, where the Company operates 268 stores, have enacted legislation which require items such as special operating permits for pawn stores, certification of pawn employees trained in valuation of merchandise, stricter customer identification controls and/or detailed and specified transactional reporting of customers and operations. Additionally, certain municipalities in Mexico have tried to curtail the operation of new and existing pawn stores through additional local business licensing, permitting, and reporting requirements. State and local agencies, including local and state police officials, often have unlimited and discretionary authority to suspend store operations pending an investigation of suspicious pawn transactions or resolution of actual or alleged regulatory, licensing and permitting issues.
Other Latin American Federal and Local Regulations
Similar to Mexico, certain federal, state and local governmental entities in Guatemala and El Salvador also regulate pawn, other consumer finance, including consumer lending and disclosures, and retail businesses. Certain federal laws and local zoning and permitting ordinances require basic commercial business licenses and signage permits. Operating in these countries also subjects the Company to other types of regulations, including but not limited to, regulations related to financial reporting, data protection and privacy, tax compliance, labor and employment practices, real estate transactions, anti-money laundering, commercial and electronic banking restrictions, credit card transactions, marketing, advertising and other general business activities.
15
As the scope of the Company’s international operations increases, the Company may face additional administrative and regulatory costs in managing its business. In addition, unexpected changes, arbitrary or adverse court decisions, administrative interpretations of federal or local requirements or legislation, or public remarks by elected officials could negatively impact the Company’s operations and profitability.
Employees
The Company had approximately 8,600 employees as of
December 31, 2015
, including approximately 500 persons employed in executive, supervisory, administrative and accounting functions. None of the Company’s employees are covered by collective bargaining agreements. The Company considers its employee relations to be satisfactory.
Insurance
The Company maintains property all-risk coverage and liability insurance for each of its locations in amounts management believes to be adequate. The Company maintains workers’ compensation insurance in Maryland, Missouri, Virginia, South Carolina, Washington, D.C., Oklahoma, Indiana, Wyoming, Nebraska, Kentucky, Tennessee, Colorado and North Carolina. The Company is a non-subscriber under the Texas Workers’ Compensation Act, and therefore maintains employer’s indemnification insurance in Texas.
First Cash Website
The Company’s primary website is at
www.firstcash.com
. The Company makes available, free of charge, at its corporate website, its annual report on Form 10-K, quarterly reports on Form 10-Q, current reports on Form 8-K and amendments to those reports filed or furnished pursuant to Section 13(a) or 15(d) of the Securities Exchange Act of 1934, as amended (the “Exchange Act”), as soon as reasonably practicable after they are electronically filed with the Securities and Exchange Commission (“SEC”). The SEC maintains an internet site that contains reports, proxy and information statements, and other information regarding issuers that file electronically with the SEC at
www.sec.gov
.
Important risk factors that could cause results or events to differ from current expectations are described below. These factors are not intended to be an all-encompassing list of risks and uncertainties that may affect the operations, performance, development and results of the Company’s business.
The Company’s financial position and results of operations may fluctuate significantly due to fluctuations in currency exchange rates in Latin American Markets.
The Company derives significant revenue, earnings and cash flow from operations in Latin America, where business operations are transacted in Mexican pesos and Guatemalan quetzales. The Company’s
exposure to currency exchange rate fluctuations results primarily from the translation exposure associated with the preparation of the Company’s consolidated financial statements, as well as from transaction exposure associated with transactions and assets and liabilities denominated in currencies other than the respective subsidiary’s functional currency. While the Company’s consolidated financial statements are reported in U.S. dollars, the financial statements of the Company’s Latin American subsidiaries are prepared using their respective functional currency and translated into U.S. dollars by applying appropriate exchange rates. As a result, fluctuations in the exchange rate of the U.S. dollar relative to the Latin American currencies could cause significant fluctuations in the value of the Company’s assets, liabilities, stockholders’ equity and operating results. In addition, while expenses with respect to foreign operations are generally denominated in the same currency as corresponding sales, the Company has transaction exposure to the extent expenditures are incurred in currencies other than the respective subsidiary’s functional currency. The costs of doing business in foreign jurisdictions also may increase as a result of adverse currency rate fluctuations. In addition, changes in currency rates could negatively affect customer demand, especially in Latin America and in U.S. stores located along the Mexican border. The average value of the Mexican peso to the U.S. dollar exchange rate for fiscal 2015 was 15.8 to 1, compared to 13.3 to 1 in fiscal 2014 and 12.8 to 1 in fiscal 2013. In fiscal 2016, through
February 12, 2016
, the average exchange rate was 18.1 to 1, which equates to a 15% decline as compared to the average value for fiscal 2015 of 15.8 to 1. For the year ended December 31,
2015
, the Company’s Latin American revenues and net income would have been approximately $68,106,000 and $9,500,000 higher, respectively, had foreign currency exchange rates remained consistent with those for the year ended December 31,
2014
.
16
The Company’s products and services are subject to extensive regulation and supervision under various federal, state and local laws, ordinances and regulations in both the United States and Latin America. If changes in regulations affecting the Company’s pawn, credit services and consumer loan businesses create increased restrictions, or have the effect of prohibiting loans in the jurisdictions where the Company offers these products, such regulations could materially impair or reduce the Company’s pawn, credit services and consumer loan businesses and limit its expansion into new markets.
The Company’s products and services are subject to extensive regulation and supervision under various federal, state and local laws, ordinances and regulations in both the United States and Latin America. The Company faces the risk that restrictions or limitations on loan products, loan amounts, loan yields, loan fees and customer acceptance of loan products resulting from the enactment, change, or interpretation of laws and regulations in the United States or Latin America could have a negative effect on the Company’s business activities. Both consumer loans and, to a lesser extent, pawn loans, have come under increased scrutiny and increasingly restrictive regulation in recent years. Other enacted or recently proposed regulatory activity may limit the number of loans that customers may receive or have outstanding and require the Company to offer an extended payment plan to its customers, and regulations adopted by some states require that all borrowers of certain loan products be listed on a database, limit the yield on pawn or consumer loans and limit the number of such loans borrowers may have outstanding. Certain consumer advocacy groups and federal and state legislators have also asserted that laws and regulations should be tightened so as to severely limit, if not eliminate, the availability of pawn loans, consumer loans and credit services products to consumers. It is difficult to assess the likelihood of the enactment of any unfavorable federal or state legislation, and there can be no assurance that additional legislative or regulatory initiatives will not be enacted that would severely restrict, prohibit, or eliminate the Company’s ability to offer certain consumer loan products.
In Latin America, restrictions and regulations affecting the pawn and consumer loan industries, including licensing restrictions, customer identification requirements, suspicious activity reporting, disclosure requirements and limits on interest rates and/or loan service fees, have been and continue to be proposed from time to time. Adoption of such federal, state or local regulation or legislation in the United States and Latin America could restrict, or even eliminate, the availability of pawn and consumer finance at some or all of the Company’s locations, which would adversely affect the Company’s operations and financial condition.
The extent of the impact of any future legislative or regulatory changes will depend on the nature of the legislative or regulatory change, the jurisdictions to which the new or modified laws would apply, and the amount of business the Company does in that jurisdiction. Moreover, similar actions by states or foreign countries in which the Company does not currently operate could limit its opportunities to pursue its growth strategies. A more detailed discussion of the regulatory environment and current developments and risks to the Company is provided in “Business—Governmental Regulation.”
Media reports, statements made by regulators and elected officials and public perception in general of pawnshop operations, consumer loans, such as payday advances or pawn loans, as being predatory or abusive could materially adversely affect the Company’s pawn, consumer loan and credit services businesses. In recent years, consumer advocacy groups and some media reports, in both the United States and Latin America, have advocated governmental action to prohibit or place severe restrictions on consumer loans, including payday advances and pawn loans.
Reports and statements made by consumer advocacy groups, members of the media, regulators and elected officials often focus on the cost to a consumer of consumer loans and pawn loans, which are generally higher than the interest typically charged by banks to consumers with better credit histories. These reports and statements typically characterize pawn and/or consumer loans as predatory or abusive despite the large customer demand for payday advances or pawn loans. If the negative characterization of these types of loans becomes increasingly accepted by consumers, demand for pawn and/or consumer loan products could significantly decrease, which could materially affect the Company’s results of operations and financial condition. Additionally, if the negative characterization of these types of loans becomes increasingly accepted by legislators and regulators, the Company could become subject to more restrictive laws and regulations that could have a material adverse effect on the Company’s financial condition and results of operations.
17
The CFPB has broad regulatory, supervisory and enforcement powers over non-bank providers of consumer credit such as the Company. Such exercise of power over the Company could be burdensome and expensive to the Company and could force the Company to modify or terminate some of its pawn or consumer lending products in the U.S.
When the Dodd-Frank Act created the CFPB, it granted the CFPB explicit supervisory authority to examine and require registration of non-bank providers of consumer financial products and services, including providers of consumer loans such as the Company, the authority to adopt rules describing specified acts and practices as being “unfair,” “deceptive” or “abusive” and hence “unlawful,” and the authority to impose recordkeeping obligations. Since its inception, the CFPB has aggressively pursued public enforcement actions against a wide range of consumer financial services providers. These actions have resulted in stipulated judgments, settlements or consent orders, including civil and monetary penalties, equitable monetary relief, disgorgement and other equitable damages such as restitution to affected consumers, and limits on activities or functions of the financial institutions’ business. In the past, these penalties have ranged up to almost $500 million, exclusive of customer refunds, with an average civil penalty over $13 million. The CFPB’s enforcement history shows that it is exercising its new regulatory and enforcement powers assertively, and it will continue to expand the industries it targets, the laws it invokes and the remedies in its enforcement powers.
The CFPB will and has exercised full regulatory, supervisory and enforcement powers over all aspects of certain non-bank providers of consumer financial products and services such as the Company. In that regard, the CFPB continues to gather data via its examinations of the consumer loan market and its impact on consumers, and has announced several public enforcement actions against several non-bank providers of consumer financial products, and published its own internal information gathering guide. The CFPB’s
Short-Term, Small-Dollar Lending Procedures
is the field guide examiners use when examining small-dollar lenders such as the Company, to aid in the data gathering process. The CFPB’s guide and examination powers permit its examiners to inspect a Company’s books and records and ask questions about its business, including its marketing activities, loan application and origination activities, payment processing activities and sustained use by consumers, collections, defaults and consumer reporting and third-party relationships. As a result of its examination efforts, the CFPB issued a report entitled “Payday Loans and Deposit Advance Products: A White Paper of Initial Findings” on April 24, 2013. The report discussed the initial findings of the CFPB regarding short-term payday loans and deposit account advance loans. While the CFPB’s study stated that “these products may work for some consumers for whom an expense needs to be deferred for a short period of time,” the CFPB also noted that its “findings raised substantial consumer protection concerns” related to the sustained use of payday loans, e.g. “debt traps,” and deposit account advances.
In March 2015, the CFPB announced the Proposed Rules for small dollar consumer loans, and published an outline of the rules in preparation for Small Business Review Panel (“SBRP”) that must be held as the next step in the rule-making process. Such rules would apply to payday loans, vehicle title loans, deposit advance products, and certain high-cost installment loans and open-end loans. The Proposed Rules are intended to end so-called “debt traps” by requiring lenders to take steps to make sure consumers can repay their loans. The proposals under consideration would also restrict lenders from attempting to collect payment from consumers’ bank accounts in ways that tend to cause excessive fees. The Proposed Rules provide two different approaches to eliminating “debt traps” – prevention and protection. Under the prevention requirements, lenders would have to determine at the outset of each loan that the consumer is not taking on unaffordable debt. Under the protection requirements, lenders would have to comply with various restrictions designed to ensure that consumers can affordably repay their debt. Lenders could choose which set of requirements to follow.
It’s likely the Proposed Rules will have a significant economic impact on a substantial number of small businesses. In that regard, the Small Business Regulatory Enforcement Fairness Act of 1996 (“SBREFA”) requires that the CFPB convene a SBRP to consider the impact of the Proposed Rules and obtain feedback from representatives of lenders and other small businesses that would be subject to the Proposed Rules. Sixty days after the SBRP convenes, a report will be issued, and the CFPB will issue formal notice of proposed rule-making. The CFPB generally provides 90 days to comment on formal notice of the proposed rules. The final rules are expected in the first half of 2016 with an expected effective date one year from the issuance of the final rules. If there is no delaying litigation, the final rules are likely to become effective in the summer of 2017.
In addition to the Dodd-Frank Act’s grant of regulatory and supervisory powers to the CFPB, the Dodd-Frank Act gives the CFPB authority to pursue administrative proceedings, civil investigative demands, or other litigation for violations of federal consumer financial laws (including the CFPB’s own rules). For instance, the CFPB is granted primary supervisory, regulatory and enforcement authority over Unfair Deceptive, or Abusive Acts or Practices, Fair Credit Reporting Act, Fair Debt Collection Practices, and Truth in Lending issues, among other federal laws. It is not clear how the CFPB will exercise its supervisory, regulatory and enforcement authority for federal consumer financial, privacy and disclosure laws, and it is possible that the CFPB’s approach may differ from the approach previously taken by other regulators. In these proceedings, the CFPB can obtain cease and desist orders (which can include orders for restitution or rescission of contracts, as well as other kinds of affirmative and injunctive relief) and monetary penalties ranging from $5,000 per day for ordinary violations of federal consumer financial laws to $25,000 per day for reckless violations, and $1,000,000 per day for knowing or intentional violations. Also, if a company has been found to have violated
18
certain federal consumer laws, the Dodd-Frank Act empowers state attorneys general and state regulators to bring civil actions for the kind of cease and desist orders available to the CFPB. If the CFPB or one or more state officials believe that the Company has violated any of the applicable laws or regulations, they could exercise their enforcement powers in ways that could have a material adverse effect on the Company or its business.
Although the CFPB does not have the authority to regulate fees or interest rates, it is possible that at some time in the future the CFPB could propose and adopt rules making short-term consumer lending products and services materially less profitable or even impractical to offer, which could force the Company to modify or terminate certain of its product offerings in the United States. The CFPB could also adopt rules imposing new and potentially burdensome requirements and limitations with respect to other consumer loan products and services, including pawn loans. Any such rules could have a material adverse effect on the Company’s business, results of operations and financial condition or could make the continuance of all or part of the Company’s current U.S. business impractical or unprofitable.
PROFECO’s regulatory, supervisory and enforcement powers over pawn and consumer credit operators such as the Company could be burdensome and expensive to the Company and could force the Company to modify or terminate some of its pawn shop operations in Mexico.
Federal law in Mexico provides for administrative regulation of the pawnshop industry by PROFECO, Mexico’s primary federal consumer protection agency. PROFECO requires all pawn operators like the Company to register its pawn stores, locations, loan contracts and to disclose the interest rate and fees charged on pawn and consumer loan transactions. PROFECO also regulates the form and terms of pawn loan contracts and defines certain operating standards and procedures for pawnshops, including the retail operations, disclosure requirements, and establishes reporting requirements.
In January 2013, federal legislation conveyed additional regulatory authority to PROFECO regarding the pawn industry and national registration process. The 2013 legislation requires all pawn businesses to annually register with and be approved by PROFECO in order to legally operate. In addition, all operators must comply with additional customer notice and disclosure provisions, bonding requirements to insure against loss or insolvency, reporting of certain types of suspicious transactions, and reporting to state law enforcement officials of certain transactions (or series of transactions) or suspicious transactions. There are significant fines and sanctions, including operating suspensions for failure to register and/or comply with PROFECO’s rules and regulations. PROFECO continues to implement its process regarding its registration requirements, and the Company has complied in all material respects with this ongoing process and registration requirements as administered by PROFECO. There are significant fines and sanctions, including operating suspensions for failure to register and/or comply with PROFECO’s rules and regulations. There can be no assurance as to the ultimate outcome from the full and final implementation of the 2013 legislation.
Adverse gold market fluctuations could negatively affect the Company’s profits.
The Company’s profitability could be adversely impacted by gold market fluctuations. Approximately
37%
of the Company’s pawn loans were collateralized with jewelry, which is primarily gold, and
31%
of its inventories, also primarily gold, as of
December 31, 2015
, and the Company sells significant quantities of gold and other precious metals acquired through collateral forfeitures or direct purchases from customers. In addition to normal market risks associated with accepting gold as loan collateral and buying and selling gold, current global economic conditions have increased the volatility of commodity markets such as those for gold and other precious metals. A significant and sustained decline in gold and/or other precious metal prices could result in decreased merchandise sales and related margins, decreased inventory valuations and sub-standard collateralization of outstanding pawn loans. In addition, a significant decline in market prices could result in a lower balance of pawn loans outstanding for the Company, as customers would receive lower loan amounts for individual pieces of jewelry or other gold items. For a detailed discussion of the impact of a decline in market prices on wholesale scrap jewelry sales, see “Item 7. Management’s Discussion and Analysis of Financial Condition and Results of Operations.”
Risks and uncertainties related to the Company’s foreign operations could negatively impact the Company’s operating results.
As of
December 31, 2015
, the Company had
737
store locations in Latin America, including 705 in Mexico and 32 in Guatemala. Subsequently in 2016, the Company purchased 166 additional stores in Mexico and 13 stores in El Salvador. All of these are countries in which there are potential risks related to geo-political events, political instability, corruption, economic volatility, drug cartel and gang-related violence, social and ethnic unrest, enforcement of property rights, governmental regulations, public safety and security and import/export regulations among others. As in many developing markets, there are also uncertainties as to how both local law and U.S. federal law is applied, including areas involving commercial transactions and foreign investment. As a result, actions or events could occur in Mexico, Guatemala or El Salvador that are beyond the Company’s control, which could restrict or eliminate the Company’s ability to operate some or all of its locations in these countries or significantly reduce customer traffic, product demand and the expected profitability of such operations.
19
The Company’s allowance for credit losses for credit services and consumer loans may not be sufficient to cover actual credit losses, which could adversely affect its financial condition and operating results.
The Company’s consumer loan and pawn stores in Texas offer a fee-based CSO Program through which the Company assists customers in applying for short-term extensions of credit from an Independent Lender. When an extension of credit is granted, the Company issues the Independent Lender a letter of credit to guarantee the repayment of the customer’s extension of credit. The Company is required to recognize a liability for the fair value of the obligation undertaken by issuing the letters of credit. The Company records the estimated fair value of the liability under the letters of credit in accrued liabilities. The Company also has customer loans arising from its consumer loan operations. The Company is required to recognize losses resulting from the inability of credit services and consumer loan customers and/or borrowers to repay such receivables or loans. The Company maintains an allowance for credit losses in an attempt to cover credit losses inherent in its consumer loan operations. Additional credit losses will likely occur in the future and may occur at a rate greater than the Company has experienced to date. The allowance for credit losses is based primarily upon historical credit loss experience, with consideration given to delinquency levels, collateral values, economic conditions and underwriting and collection practices. This evaluation is inherently subjective, as it requires estimates of material factors that may be susceptible to significant change, especially in the event of a change in the governmental regulations that affect the Company’s ability to generate new loans or collect outstanding loans. If the Company’s assumptions and judgments prove to be incorrect, its current allowance may not be sufficient and adjustments may be necessary to allow for different economic conditions or adverse developments in its loan portfolio, which could adversely affect its financial condition and operating results
.
The failure or inability of third-parties who provide products, services or support to the Company to maintain their products, services or support could disrupt Company operations or result in a loss of revenue.
The
Company’s credit services operations depend, in part, on the willingness and ability of the Independent Lender to make extensions of credit to its customers. The loss of the relationship with this lender, and an inability to replace it with a new lender or lenders, or the failure of the lender to fund new extensions of credit and to maintain volumes, quality and consistency in its loan programs could cause the Company to lose customers and substantially decrease the revenue and earnings of the Company’s credit services business. In addition, the Company’s lending, pawn retail, scrap jewelry and cash management operations are dependent upon the Company’s ability to maintain retail banking relationships with commercial banks. Recent actions by federal regulators have caused certain commercial banks, including certain banks used by the Company, to cease offering such services to the Company and other companies in the Company’s industry. The Company also relies significantly on outside vendors to provide services such as financial transaction processing (including foreign exchange), utilities, store security, armored transport, precious metal smelting, data and voice networks, and other information technology products and services. The failure or inability of any of these third-party lenders, financial institutions or vendors to provide such services could limit the Company’s ability to grow its business and could increase the Company’s costs of doing business, which could adversely affect the Company’s operations if the Company is unable to timely replace them with comparable service providers at a comparable cost.
An inability to disburse consumer loan proceeds or collect consumer loan payments through the Automated Clearing House (“ACH”) system would materially adversely affect the Company’s consumer loan business.
When making consumer loans, the Company’s online consumer loan business in Texas uses the ACH system to deposit loan proceeds into its customers’ bank accounts, and both the Company’s online and storefront consumer loan businesses, including loans made through the CSO Program, depend all or in part on the ACH system to collect amounts due to the Company by withdrawing funds from its customers’ bank accounts when the Company has obtained written authorization to do so from its customers. The Company’s ACH transactions are processed by banks, and if these banks cease to provide ACH processing services to the Company, the Company would have to materially alter, or possibly discontinue, some or all of its consumer loan business if alternative ACH processors are not available.
It was reported that actions by the Department of Justice, the FDIC and certain state regulators appear to be discouraging banks, non-bank providers, and ACH payment processors from providing access to the ACH system (e.g. debiting/crediting consumer accounts) for certain short-term consumer loan providers that they believe are operating illegally. According to published reports, the Department of Justice has issued subpoenas to banks and payment processors relating to ACH practices. The FDIC and other regulators were said to be using bank oversight examinations to discourage banks from providing access to the ACH system to certain online lenders. For example, the Department of Financial Services of the State of New York (the “NY DFS”), sent letters to approximately 35 online short-term consumer loan companies (that did not include the Company as the Company does not offer consumer loans in New York) demanding they cease and desist offering illegal payday loans to New York consumers and also sent letters to over 100 banks, as well as the National Automated Clearing House Association (“NACHA”) (which oversees the ACH network), requesting they work with the NY DFS to cut off ACH system access to New York customer accounts for illegal payday lenders. NACHA, in turn, has requested that its participants review origination activity for these 35 online short-term consumer loan companies and to advise NACHA whether it has terminated these lenders’ access to the ACH system or, if not, the
20
basis for not doing so. NACHA also requested that participants review ACH origination activities related to other online loan companies and to terminate any ACH system access that would violate NACHA rules, which would include, according to NACHA, any authorizations to use the ACH system to pay illegal loans that are unenforceable under state law. Maryland’s Division of Financial Regulation also has been reported to have taken steps to stop banks in Maryland from processing illegal payday loans in its state, and the California Department of Business Oversight similarly directed state-licensed banks and credit unions to monitor transactions with any unlicensed lenders.
The heightened regulatory scrutiny by the Department of Justice, the FDIC and other state and federal regulators has the potential to cause banks and ACH payment processors to cease doing business with consumer lenders who are operating legally, without regard to whether that lender is complying with applicable laws, simply to avoid the risk of heightened scrutiny or even unwarranted litigation. In addition, the NACHA has adopted certain operating rules that govern the use of the ACH system (“Rules”). Changes to the Rules are or will be effective in 2015 and 2016. For example, some of the Rules add more options for which NACHA may begin an initial investigation or enforcement proceeding when an entity originates an excessive number of unauthorized entries. This could result in increased investigations of originator activity, and could ultimately result in fines passed on to those originators. The aim is to address improvement in ACH network quality by reducing the incidence of debit return entries. Other Rules address a third party sender’s existing obligation to monitor, assess and enforce limitations on their customer's origination and return activities in the same manner as the Originating Depository Financial Institution (“ODFI”) currently does. The Rules also require that a third party service provider or third party sender provide proof of completion of its Rules compliance audit to its ODFI upon request, in order to fulfill a request from NACHA. Failure to comply with this requirement may result in a NACHA Class II Rules violation, and fines up to $100,000 per month until resolved. Other portions of the Rules establish acceptable guidelines for certain returns of an originator. Return rates that exceed these guidelines may trigger an inquiry and review process by NACHA and the engagement of an industry review panel to evaluate the facts behind an originator's ACH activity. The evaluation could also result in a Rules violation or a Rules enforcement proceeding. Lastly, the NACHA Rules now formally define the types of entries that may be reinitiated, and those that are prohibited from reinitiation, among other notable changes in the Rules.
There can be no assurance the Company’s access to the ACH system will not be impaired as a result of this heightened scrutiny or the NACHA rule amendments. If this access is impaired, the Company’s consumer loan business could be materially adversely affected and the Company may find it difficult or impossible to continue some or all of its consumer loan business, which could have a material adverse effect on the Company’s business, prospects and results of operations and financial condition.
Increased competition from banks, credit unions, internet-based lenders, other short-term consumer lenders, and other entities offering similar financial services, as well as retail businesses that offer products and services offered by the Company, could adversely affect the Company’s results of operations.
The Company’s principal competitors are other pawnshops, consumer loan companies, internet-based lenders, consumer finance companies, rent-to-own stores, retail finance programs, payroll lenders, banks, credit unions and other financial institutions that serve the Company’s primary customer base. Many other financial institutions or other businesses that do not now offer products or services directed toward the Company’s traditional customer base, many of whom may be much larger than the Company, could begin doing so. Significant increases in the number and size of competitors for the Company’s business could result in a decrease in the number of consumer loans or pawn loans that the Company writes, resulting in lower levels of revenue and earnings in these categories. Furthermore, the Company has many competitors to its retail operations, such as retailers of new merchandise, retailers of pre-owned merchandise, other pawnshops, thrift shops, online retailers, online classified advertising sites and online auction sites. Increased competition or aggressive marketing and pricing practices by these competitors could result in decreased revenue, margins and turnover rates in the Company’s retail operations. In Mexico, the Company competes directly with certain pawn stores owned by government affiliated or sponsored non-profit foundations. The government could take actions that would harm the Company’s ability to compete in the Mexico market.
A sustained deterioration of economic conditions or an economic crisis could reduce demand or profitability for the Company’s products and services and increase credit losses which would result in reduced earnings.
The Company’s business and financial results may be adversely impacted by sustained unfavorable economic conditions or unfavorable economic conditions associated with a global or regional economic crisis which, in either case, include adverse changes in interest or tax rates, effects of government initiatives to manage economic conditions and increased volatility of commodity markets and foreign currency exchange rates. Specifically, a sustained or rapid deterioration in the economy could cause deterioration in the performance of the Company’s loan portfolios and in consumer or market demand for pre-owned merchandise or gold such as that sold in the Company’s pawnshops. A sustained deterioration in the economy could reduce the demand and resale value of pre-owned merchandise and reduce the amount that the Company could effectively lend on an item of collateral. Such reductions could adversely affect pawn loan balances, pawn loan redemption rates, inventory balances, inventory mixes, sales volumes and gross profit margins. An economic slowdown also could result in a decrease in loan demand and an increase in loan
21
defaults on consumer loan and credit services products. During such a slowdown, the Company could be required to tighten its underwriting standards, which would reduce consumer loan balances and related revenue and credit services fees, and could face more difficulty in collecting defaulted consumer loans, which could lead to an increase in loan losses. As consumer loans and credit services customers generally have to be employed to qualify for a loan or extension of credit, an increase in the unemployment rate would reduce the number of potential customers.
A decrease in demand for the Company’s products and services and the failure of the Company to adapt to such decreases could adversely affect the Company’s results of operations.
Although the Company’s products and services are a staple of its customer base, the demand for a particular product or service may decrease due to a variety of factors, such as the availability and pricing of competing products, changes in customers’ financial conditions as a result of changes in unemployment levels, fuel prices or other events, real or perceived loss of consumer confidence or regulatory restrictions that increase or reduce customer access to particular products. Should the Company fail to adapt to a significant change in its customers’ demand for, or regulatory access to, its products, the Company’s revenue could decrease significantly. Even if the Company does make adaptations, customers may resist or may reject products whose adaptations make them less attractive or less available. In any event, the effect of any product change on the results of the Company’s business may not be fully ascertainable until the change has been in effect for some time. In particular, the Company has changed, and will continue to change, some of the consumer loan products and services it offers due to regulatory developments. Demand may also fluctuate by geographic region. The current geographic concentration of the Company’s stores creates exposure to local economies and regional downturns. As of
December 31, 2015
, the Company had significant store concentration in Mexico, Guatemala, Texas, Colorado, Maryland, North Carolina and South Carolina. As a result, the business is currently more susceptible to regional conditions than the operations of more geographically diversified competitors, and the Company is vulnerable to economic downturns in those regions. Any unforeseen events or circumstances that negatively affect these areas could materially adversely affect the Company’s revenues and profitability.
Changes in the capital markets or the Company’s financial condition could reduce available capital.
The Company has, in the past, accessed the debt capital markets to refinance existing debt obligations and to obtain capital to finance growth. Efficient access to these markets is critical to the Company’s ongoing financial success; however, the Company’s future access to the debt capital markets could become restricted due to a variety of factors, including a deterioration of the Company’s earnings, cash flows, balance sheet quality, regulatory restrictions or overall business or industry prospects, a significant deterioration in the state of the capital markets or a negative bias toward the Company’s industry by market participants. Inability to access the credit markets on acceptable terms, if at all, would have a material adverse effect on the Company’s financial condition.
The Company's existing and future levels of indebtedness could adversely affect its financial health, its ability to obtain financing in the future, its ability to react to changes in its business and its ability to fulfill its obligations under such indebtedness.
As of
December 31, 2015
, including the Company's 6.75% senior notes issued in March 2014 (“Notes”) and the Company’s two current credit facilities, the Company had outstanding indebtedness of
$258,000,000
and availability of
$162,000,000
under its credit facilities. The Company's level of indebtedness could:
|
•
|
make it more difficult for it to satisfy its obligations with respect to the Notes and its other indebtedness, resulting in possible defaults on and acceleration of such indebtedness;
|
|
•
|
require it to dedicate a substantial portion of its cash flow from operations to the payment of principal and interest on its indebtedness, thereby reducing the availability of such cash flows to fund working capital, acquisitions, new store openings, capital expenditures and other general corporate purposes;
|
|
•
|
limit its ability to obtain additional financing for working capital, acquisitions, new store openings, capital expenditures, debt service requirements and other general corporate purposes;
|
|
•
|
limit its ability to refinance indebtedness or cause the associated costs of such refinancing to increase;
|
|
•
|
restrict the ability of its subsidiaries to pay dividends or otherwise transfer assets to the Company, which could limit its ability to, among other things, make required payments on its debt;
|
|
•
|
increase the Company's vulnerability to general adverse economic and industry conditions, including interest rate fluctuations (because a portion of its borrowings are at variable rates of interest); and
|
|
•
|
place the Company at a competitive disadvantage compared to other companies with proportionately less debt or comparable debt at more favorable interest rates who, as a result, may be better positioned to withstand economic downturns.
|
Any of the foregoing impacts of the Company's level of indebtedness could have a material adverse effect on its business, financial condition and results of operations.
22
The Company’s business depends on the uninterrupted operation of the Company’s facilities, systems and business functions, including its information technology and other business systems.
The Company’s business depends highly upon its employees’ ability to perform, in an efficient and uninterrupted fashion, necessary business functions such as operating, managing and securing its retail locations, technical support centers, call centers, security monitoring, treasury and accounting functions and other administrative support functions. Additionally, the Company’s storefront operations depend on the efficiency and reliability of the Company’s point-of-sale system. A shut-down of or inability to access the facilities in which the Company’s online operations, storefront point-of-sale and loan management system and other technology infrastructure are based, such as due to a power outage, a security breach, a failure of one or more of its information technology, telecommunications or other systems, or sustained or repeated disruptions of such systems could significantly impair its ability to perform such functions on a timely basis and could result in a deterioration of the Company’s ability to perform efficient storefront lending and merchandise disposition activities, provide customer service, perform collection activities, or perform other necessary business functions.
Security breaches, cyber attacks or fraudulent activity could result in damage to the Company’s operations or lead to reputational damage.
A security breach of the Company’s computer systems could interrupt or damage its operations or harm its reputation. In addition, the Company could be subject to liability if confidential customer or employee information is misappropriated from its computer systems. Any compromise of security, including security breaches perpetrated on persons with whom the Company has commercial relationships, that result in the unauthorized release of its users’ personal information or the unauthorized access of confidential Company information, could result in a violation of applicable privacy and other laws, significant legal and financial exposure, damage to the Company’s reputation, and a loss of confidence in the Company’s security measures, which could harm its business. Any compromise of security could deter people from entering into transactions that involve transmitting confidential information to the Company’s systems and could harm relationships with the Company’s suppliers, which could have a material adverse effect on the Company’s business. Actual or anticipated cyber attacks may cause the Company to incur increasing costs, including costs to deploy additional personnel and protection technologies, train employees and engage third-party experts and consultants. Despite the implementation of significant security measures, these systems may still be vulnerable to physical break-ins, computer viruses, programming errors, attacks by third parties or similar disruptive problems. The Company may not have the resources or technical sophistication to anticipate or prevent rapidly evolving types of cyber attacks.
Most of the Company’s customers provide personal information in three ways: (1) when conducting a pawn transaction; (2) during a consumer loan transaction (bank account information is necessary for this transaction); and (3) when conducting a retail purchase whereby a customer’s payment method is via a credit card. The Company relies on encryption and authentication technology to provide security and authentication to effectively secure transmission of confidential information, including customer bank account and other personal information. Advances in computer capabilities, new discoveries in the field of cryptography or other developments may result in the technology used by the Company to protect transaction data being breached or compromised.
In addition, many of the third parties who provide products, services, or support to the Company could also experience any of the above cyber risks or security breaches, which could impact the Company’s customers and its business and could result in a loss of customers, suppliers or revenue.
Judicial or administrative decisions, CFPB rule-making or amendments to the Federal Arbitration Act (the “FAA”) could render the arbitration agreements the Company uses illegal or unenforceable.
The Company includes dispute arbitration provisions in many of its customer loan agreements. These provisions are designed to allow the Company to resolve any customer disputes through individual arbitration rather than in court. The Company’s arbitration provisions explicitly provide that all arbitrations will be conducted on an individual and not on a class basis. Thus, the Company’s arbitration agreements, if enforced, have the effect of mitigating class and collective action liability. The Company’s arbitration agreements do not have any impact on regulatory enforcement proceedings. The Company takes the position that the FAA requires enforcement, in accordance with the terms of its arbitration agreements, of class and collective action waivers of the type the Company uses.
In the past, a number of courts, including the California and Nevada Supreme Courts, and the National Labor Relations Board concluded that arbitration agreements with class action waivers are “unconscionable” and hence unenforceable, particularly where a small dollar amount is in controversy on an individual basis. Additionally, the CFPB announced in October 2015, that it is considering proposing rules that would prohibit consumer financial services companies from using class action waivers in consumer arbitration clauses.
23
In April 2011, however, the U.S. Supreme Court ruled in a 5-4 decision in
AT&T Mobility v. Concepcion
that the FAA preempts state laws that would otherwise invalidate consumer arbitration agreements with class action waivers. More recently, in December 2015, the Supreme Court in a 6-3 decision in
DIRECTV, Inc. v. Imburgia
upheld DIRECTV’s service agreement that included a binding arbitration provision with a class action waiver, and declared that the arbitration clause at issue was governed by the FAA.
The Company’s arbitration agreements differ in some respects from the agreement at issue in
Concepcion
and
DIRECTV
and some courts have continued in the aftermath of
Concepcion
to find reasons to find arbitration agreements unenforceable. Thus, it is possible that one or more courts concerned with the use of such agreements in financial services contracts and/or to pre-dispute mandatory consumer arbitration agreements could use the differences between the Company’s arbitration agreements and the agreement at issue in
Concepcion
and
DIRECTV
, or some other reason, as a basis for a refusal to enforce the Company’s arbitration agreements. Additionally, Congress has considered legislation that would generally limit or prohibit mandatory dispute arbitration in consumer contracts, and it has adopted such prohibitions with respect to certain mortgage loans and certain consumer loans to active-duty members of the military and their dependents. Under the Dodd-Frank Act, any CFPB rule prohibiting or limiting arbitration of disputes would apply to arbitration agreements entered into more than six months after the final rule becomes effective (and not to prior arbitration agreements).
The CFPB has published an outline of its proposals in preparation for convening a Small Business Review Panel to gather feedback from small industry stakeholders. This is the first step in the process of a potential rulemaking on this issue. The proposals would ban companies from including arbitration clauses that block class actions in their consumer contracts. This would apply to most consumer financial products and services that the CFPB oversees, including credit cards, checking and deposit accounts, prepaid cards, money transfer services, certain auto loans, auto title loans, small dollar or payday loans, private student loans and installment loans. The proposals would not ban arbitration clauses in their entirety; however, for companies still willing to offer arbitration for individual cases, the clauses would have to say explicitly that they do not apply to cases filed as class actions unless and until class certification is denied by the court or the class claims are dismissed in court. Companies would be permitted to give the consumer a choice of bringing a class proceeding in arbitration or in court. The proposals would also require companies that choose to use arbitration clauses for individual disputes submit to the CFPB the arbitration claims filed and awards issued so that the bureau can monitor the fairness of the process. The CFPB is also considering publishing the claims and awards on its website so that the public can monitor them.
Any judicial or administrative decisions, federal legislation or CFPB rule that would impair the Company’s ability to enter into and enforce dispute consumer arbitration agreements with class action waivers could significantly increase the Company’s exposure to class action litigation as well as litigation in plaintiff‑friendly jurisdictions. Such litigation could have a material adverse effect on the Company’s business, results of operations and financial condition.
The Company is subject to goodwill impairment risk.
At
December 31, 2015
, the Company had
$295,609,000
of goodwill on its consolidated balance sheet, all of which represents assets capitalized in connection with the Company’s acquisitions and business combinations. Accounting for goodwill requires significant management estimates and judgment. Management performs periodic reviews of the carrying values of goodwill to determine whether events and circumstances indicate that an impairment in value may have occurred. A variety of factors could cause the carrying value of goodwill to become impaired. A write-down of the carrying value of goodwill could result in a non-cash charge, which could have an adverse effect on the Company’s results of operations.
Due primarily to the impacts of recently enacted and additional proposed local, state and federal regulatory restrictions affecting short-term and long-term profitability expectations for payday and title lending products, the Company’s long-term ongoing strategy to reduce non-core consumer lending operations along with significant deterioration in payday lending market conditions, the Company recorded a
$7,913,000
goodwill impairment charge during fiscal 2015 related to the U.S. consumer loan operations reporting unit. As of December 31, 2015, the Company has no remaining goodwill or other intangible assets associated with its U.S. consumer loan operations reporting unit.
The Company depends on its senior management and may not be able to retain those employees or recruit additional qualified personnel.
The Company depends on its senior management. The loss of services of any of the members of the Company’s senior management could adversely affect the Company’s business until a suitable replacement can be found. There may be a limited number of persons with the requisite skills to serve in these positions, and the Company cannot ensure that it would be able to identify or employ such qualified personnel on acceptable terms.
24
The inability to successfully integrate acquisitions could adversely affect results.
The Company has historically grown, in part, through strategic acquisitions, including the acquisition of
65
stores during
2015
and an additional 179 stores through
February 12, 2016
. The Company’s strategy is to continue to pursue attractive acquisition opportunities if and when they become available. The success of an acquisition is subject to numerous internal and external factors, such as the ability to consolidate information technology and accounting functions, the management of additional sales, administrative, operations and management personnel, overall management of a larger organization, competitive market forces, and general economic factors. It is possible that the integration process could result in the loss of key employees, the disruption of ongoing businesses, tax costs or inefficiencies, or inconsistencies in standards, controls, information technology systems, procedures and policies, any of which could adversely affect the Company’s ability to maintain relationships with customers, employees, or other third-parties or the Company’s ability to achieve the anticipated benefits of such acquisitions and could harm its financial performance. Failure to successfully integrate an acquisition could have an adverse effect on the Company’s business, results of operations and financial condition. Additionally, any acquisition has the risk that the Company may not realize a return on the acquisition or the Company’s investment.
Current and future litigation or regulatory proceedings, both in the U.S. and Latin America, could have a material adverse effect on the Company’s business, prospects, results of operations and financial condition.
The Company or its subsidiaries has been or may be involved in future lawsuits, claims or regulatory or administrative proceedings, examinations or investigations arising in the ordinary course of business, including those related to federal or state wage and hour laws, product liability, consumer protection, employment, personal injury and other matters that could cause it to incur substantial expenditures and generate adverse publicity. In particular, the Company may be involved in lawsuits related to employment, marketing and other matters, including class action lawsuits brought against it for alleged violations of the Fair Labor Standards Act, state wage and hour laws, state or federal advertising laws, consumer protection, lending and other laws. The consequences of an adverse ruling in any current or future litigation, judicial or administrative proceeding could cause the Company to have to refund fees and/or interest collected, refund the principal amount of advances, pay treble or other multiple damages, pay monetary penalties, fines, and/or modify or terminate the Company’s operations in particular states. Defense of any lawsuit, or administrative proceeding, even if successful, could require substantial time and attention of the Company’s management and could require the expenditure of significant amounts for legal fees and other related costs. Settlement of lawsuits or administrative proceedings may also result in significant payments and modifications to the Company’s operations. Due to the inherent uncertainties of litigation, administrative proceedings and other claims, the Company cannot accurately predict the ultimate outcome of any such matters.
Adverse court interpretations of the various laws and regulations under which the Company operates could require the Company to alter the products that it offers or cease doing business in the jurisdiction where the court interpretation is applicable. The Company is also subject to regulatory proceedings, and the Company could suffer losses from interpretations of state or federal laws in those regulatory proceedings, even if it is not a party to those proceedings. Any of these events could have a material adverse effect on the Company’s business, prospects, results of operations and financial condition and could impair the Company’s ability to continue current operations. Besides regulation specific to consumer lending, which is discussed previously, the Company’s pawn, credit services and consumer loan businesses are subject to other federal, state and local regulations, tax laws and import/export laws, including but not limited to the Dodd-Frank Act, Unfair Deceptive or Abusive Acts and Practices, Federal Truth in Lending Act and Regulation Z adopted thereunder, Fair Debt Collections Practices Act, Military Lending Act, Bank Secrecy Act, Money Laundering Suppression Act of 1994, USA PATRIOT Act, Gramm-Leach-Bliley Act, Equal Credit Opportunity Act, Fair Credit Reporting Act, Electronic Funds Transfer Act, Fair and Accurate Credit Transactions Act, Foreign Corrupt Practices Act and the Brady Handgun Violence Prevention Act. In addition, the Company’s marketing efforts and the representations the Company makes about its products and services are subject to federal and state unfair and deceptive practice statutes, including the Federal Trade Commission Act and analogous state statutes under which the Federal Trade Commission, state attorneys general or private plaintiffs may bring legal actions. If the Company is found to have engaged in an unfair and deceptive practice, it could have a material adverse effect on its business, prospects, results of operations and financial condition.
The Company sells products manufactured by third parties, some of which may be defective. Many such products are manufactured overseas in countries which may utilize quality control standards that vary from those legally allowed or commonly accepted in the U.S., which may increase the Company’s risk that such products may be defective. If any products that the Company sells were to cause physical injury or injury to property, the injured party or parties could bring claims against the Company as the retailer of the products based upon strict product liability. In addition, the Company’s products are subject to the federal Consumer Product Safety Act and the Consumer Product Safety Improvement Act, which empower the Consumer Product Safety Commission to protect consumers from hazardous products. The Consumer Product Safety Commission has the authority to exclude from the market and recall certain consumer products that are found to be hazardous. Similar laws exist in some states and cities in the U.S. If the Company fails to comply with government and industry safety standards, the Company may be subject to claims, lawsuits,
25
product recalls, fines and negative publicity that could have a material adverse effect on its business, prospects, results of operations and financial condition.
Some of the Company’s U.S. stores sell firearms, ammunition and certain related accessories, which may be associated with an increased risk of injury and related lawsuits. The Company may incur losses due to lawsuits relating to its performance of background checks on firearms purchases as mandated by state and federal law or the improper use of firearms sold by the Company, including lawsuits by individuals, municipalities or other organizations attempting to recover damages or costs from firearms retailers relating to the misuse of firearms. Commencement of such lawsuits against the Company could have a material adverse effect on its business, prospects, results of operations and financial condition.
The Company is also subject to similar applicable laws and regulations in Mexico. For example, Mexico’s Anti-Money Laundering Law (effective in November 2013), which requires reporting of certain transactions (or series of transactions) exceeding monetary limits, and require stricter maintenance of customer identification records and controls, and reporting of all foreign (non-Mexican) customer transactions. The Company is also subject to the terms and enforcement of the Federal Personal Information Protection Act (“Privacy Law”) (effective January 2012), which requires companies to protect their customers’ personal information, among other things such as mandatory disclosures.
Certain state and local governmental entities in Latin America also regulate pawn, other consumer finance and retail businesses through state laws and local zoning and permitting ordinances. State and local agencies, including local police authorities often have unlimited, broad and discretionary authority to suspend store operations pending investigation of suspicious pawn transactions and resolution of actual or alleged regulatory, licensing and permitting issues.
Compliance with applicable laws and regulations is costly and can affect operating results and may result in operational restrictions. The Company’s failure to comply with applicable laws and regulations could subject it to regulatory enforcement actions, result in the assessment against the Company of civil, monetary, criminal or other penalties, require the Company to refund interest or fees, result in a determination that certain loans are not collectible, result in a revocation of licenses, or cause damage to its reputation, brands and customer relationships, any of which could have a material adverse effect on the Company’s business, prospects, results of operations and financial condition.
The sale and ownership of firearms, ammunition and certain related accessories is subject to current and potential regulation, which could have a material adverse effect on the Company’s business, prospects, results of operations and financial condition.
Because the Company sells firearms, ammunition and certain related accessories, the Company is required to comply with federal, state and local laws and regulations pertaining to the purchase, storage, transfer and sale of such products. These laws and regulations require the Company, among other things, to ensure that each pawn location offering firearms has its FFL, that all purchasers of firearms are subjected to a pre-sale background check, to record the details of each firearm sale on appropriate government-issued forms, to record each receipt or transfer of a firearm and to maintain these records for a specified period of time. The Company is also required to timely respond to traces of firearms by law enforcement agencies. Over the past several years, the purchase, sale and ownership of firearms, ammunition and certain related accessories has been the subject of increased federal, state and local regulation. These regulatory efforts are likely to continue in the Company’s current markets and other markets into which the Company may expand. If enacted, new laws and regulations could limit the types of licenses, firearms, ammunition and certain related accessories that the Company is permitted to purchase and sell and could impose new restrictions and requirements on the manner in which the Company offers, purchases and sells these products. If the Company fails to comply with existing or newly enacted laws and regulations relating to the purchase and sale of firearms, ammunition and certain related accessories, its licenses to sell or maintain inventory of firearms at its stores may be suspended or revoked, which could have a material adverse effect on the Company’s business, prospects, results of operations and financial condition. In addition, new laws and regulations impacting the ownership of firearms and ammunition could cause a decline in the demand for and sales of the Company’s products, which could materially adversely impact its revenue and profitability. Complying with increased regulation relating to the sale of firearms, ammunition and certain related accessories could be costly.
The Company is subject to the FCPA and other anti-corruption laws, and the Company’s failure to comply with these anti-corruption laws could result in penalties that could have a material adverse effect on its business, results of operations and financial condition.
The Company is subject to the FCPA, which generally prohibits companies and their agents or intermediaries from making improper payments to foreign officials for the purpose of obtaining or keeping business and/or other benefits. Although the Company has policies and procedures designed to ensure that it, its employees, agents, and intermediaries comply with the FCPA and other anti-corruption laws, there can be no assurance that such policies or procedures will work effectively all of the time or protect the Company against liability for actions taken by its employees, agents, and intermediaries with respect to its business or any businesses
26
that it may acquire. In the event the Company believes, or has reason to believe, its employees, agents, or intermediaries have or may have violated applicable anti-corruption laws, including the FCPA, the Company may be required to investigate or have a third party investigate the relevant facts and circumstances, which can be expensive and require significant time and attention from senior management. The Company’s continued operation and expansion outside the United States, especially in Latin America, could increase the risk, perceived or otherwise, of such violations in the future. If the Company violates the FCPA or other laws governing the conduct of business with government entities (including local laws), the Company may be subject to criminal and civil penalties and other remedial measures, which could have an adverse effect on its business, results of operations, and financial condition. Investigation of any potential or perceived violations of the FCPA or other anti-corruption laws by U.S. or foreign authorities could harm the Company’s reputation and could have a material adverse effect on its business, results of operations and financial condition.
Failure to maintain certain criteria required by state and local regulatory bodies could result in fines or the loss of the Company’s licenses to conduct business.
Most states and many local jurisdictions both in the United States and in Latin America in which the Company operates, as well as the federal governments in Latin America, require registration and licenses to conduct the Company’s business. These states or their respective regulatory bodies have established criteria the Company must meet in order to obtain, maintain, and renew those licenses. For example, many of the states in which the Company operates require it to meet or exceed certain operational, advertising, disclosure, collection, and recordkeeping requirements and to maintain a minimum amount of net worth or equity. From time to time, the Company is subject to audits in these states to ensure it is meeting the applicable requirements to maintain these licenses. Failure to meet these requirements could result in various fines and penalties or store closures, which could include temporary suspension of operations, the revocation of existing licenses or the denial of new and renewal licensing requests. The Company cannot guarantee future license applications or renewals will be granted. If the Company were to lose any of its licenses to conduct its business, it could result in the temporary or permanent closure of stores and online activities, which could adversely affect the Company’s business, results of operations and cash flows.
The complexity of the political and regulatory environment in which the Company operates and the related cost of compliance are both increasing due to changing political landscape, and additional legal and regulatory requirements, the Company’s ongoing expansion into new markets and the fact that foreign laws occasionally conflict with domestic laws. In addition to potential damage to the Company’s reputation and brand, failure to comply with applicable federal, state and local laws and regulations such as those outlined above may result in the Company being subject to claims, lawsuits, fines and adverse publicity that could have a material adverse effect on its business, results of operations and financial condition.
Adverse real estate market fluctuations and/or the inability to renew and extend store operating leases could affect the Company’s profits.
The Company leases most of its locations. A significant rise in real estate prices or real property taxes could result in an increase in store lease costs as the Company opens new locations and renews leases for existing locations, thereby negatively impacting the Company’s results of operations. The Company also owns certain developed and undeveloped real estate, which could be impacted by adverse market fluctuations. In addition, the inability of the Company to renew, extend or replace expiring store leases could have an adverse effect on the Company’s results of operations.
The Company’s lending business is somewhat seasonal, which causes the Company’s revenues and operating cash flows to fluctuate and may adversely affect the Company’s ability to service its debt obligations.
The Company’s U.S. lending business typically experiences reduced demand in the first and second quarters as a result of its customers’ receipt of federal tax refund checks typically in February of each year. Demand for the Company’s U.S. lending services is generally greatest during the third and fourth quarters. Also, retail sales are seasonally higher in the fourth quarter associated with holiday shopping. Typically, the Company experiences seasonal growth of service fees in the third and fourth quarter of each year due to loan balance growth. Service fees generally decline in the first and second quarter of each year after the heavy repayment period of pawn loans in Latin America associated with statutory bonuses received by customers in the fourth quarter. This seasonality requires the Company to manage its cash flows over the course of the year. If a governmental authority were to pursue economic stimulus actions or issue additional tax refunds, tax credits or other statutory payments at other times during the year, such actions could have a material adverse effect on the Company’s business, prospects, results of operations and financial condition during these periods. If the Company’s revenues were to fall substantially below what it would normally expect during certain periods, the Company’s annual financial results and its ability to service its debt obligations could be adversely affected.
27
Inclement weather or natural disasters can adversely impact the Company’s operating results.
The occurrence of weather events such as rain, cold weather, snow, wind, storms, hurricanes, or other natural disasters adversely affecting consumer traffic and loan origination or collection activities at the Company’s stores could have an adverse effect on the Company’s results of operations. In addition, the Company may incur property, casualty or other losses not covered by insurance. The Company maintains a program of insurance coverage for various types of property, casualty and other risks. The types and amounts of insurance that the Company obtains vary from time to time, depending on availability, cost and management’s decisions with respect to risk retention. The Company’s insurance policies are subject to deductibles and exclusions that result in the Company’s retention of a level of risk on a self-insurance basis. Losses not covered by insurance could be substantial and may increase the Company’s expenses, which could harm the Company’s results of operations and financial condition.
The Company’s growth is subject to external factors and other circumstances over which it has limited control or that are beyond its control. These factors and circumstances could adversely affect the Company’s ability to grow through the opening of new store locations.
The success of the Company’s expansion strategy is subject to numerous external factors, such as the availability of sites with favorable customer demographics, limited competition, acceptable regulatory restrictions, political or community acceptance, suitable lease terms, its ability to attract, train and retain qualified associates and management personnel and the ability to obtain required government permits and licenses. Some of these factors are beyond the Company’s control. The failure to execute the Company’s expansion strategy would adversely affect the Company’s ability to expand its business and could materially adversely affect its business, prospects, results of operations and financial condition.
The Company’s reported results require the judgment of management, and the Company could be subject to risks associated with these judgments or could be adversely affected by the implementation of new, or changes in the interpretation of existing, accounting principles or financial reporting requirements.
The preparation of the Company’s financial statements requires management to make estimates and assumptions that affect the reported amounts of assets and liabilities, and disclosure of contingent assets and liabilities, at the dates of the consolidated financial statements and the reported amounts of revenue and expenses during the reporting periods. In addition, the Company prepares its financial statements in accordance with generally accepted accounting principles (“GAAP”), and GAAP and its interpretations are subject to change over time. If new rules or interpretations of existing rules require the Company to change its financial reporting, the Company’s results of operations and financial condition could be materially adversely affected, and the Company could be required to restate historical financial reporting.
Unexpected changes in both domestic and foreign tax rates could negatively impact the Company’s operating results.
The Company’s financial results may be negatively impacted should tax rates or changes to tax laws in the U.S. and in Latin America be increased or otherwise affected by changes in allowable expense deductions, or as a result of the imposition of new withholding requirements on repatriation of foreign earnings.
Certain tax positions taken by the Company require the judgment of management and could be challenged by federal taxing authorities in the United States and Latin America.
Management’s judgment is required in determining the provision for income taxes, the deferred tax assets and liabilities and any valuation allowance recorded against deferred tax assets. Management’s judgment is also required in evaluating whether tax benefits meet the more-likely-than-not threshold for recognition under ASC 740-10-25,
Income Taxes
.
The international scope of the Company’s operations may contribute to increased costs and complexities and negatively impact its operations.
Because international operations increase the complexity of an organization, the Company may face additional administrative costs in managing its business. In addition, most countries typically impose additional burdens on non-domestic companies through the use of local regulations, tariffs, labor controls and other federal or state requirements or legislation. There are also complexities involved with accounting for international operations, such as foreign currency transactions and translation adjustments, foreign income taxes and intercompany transactions between domestic and foreign subsidiaries. Unexpected changes in regulations and arbitrary or adverse court or administrative interpretations of the foregoing could negatively impact the Company’s operations.
28
The impairment of other financial institutions could adversely affect the Company.
The Company has exposure to financial institutions used as depositories of its corporate cash balances. If the Company’s counterparties and financial institutions become impaired or insolvent, this could have serious consequences to the Company’s financial condition and results of operations.
The Company’s business may be impacted by the outbreak of certain public health issues, including epidemics, pandemics and other contagious diseases.
In the event of an outbreak of epidemics, pandemics or other contagious diseases, regulatory and/or public health officials could restrict store operating hours, product offerings and/or the number of customers allowed in a store at one time, which could adversely affect the Company’s financial results. In addition, to the extent that the Company’s customers become infected by such diseases, or feel uncomfortable visiting public locations due to a perceived risk of exposure to contagious diseases, the Company could experience a reduction in customer traffic, which could have an adverse effect on the Company’s results of operations.
If the Company is unable to protect its intellectual property rights, its ability to compete could be negatively impacted.
The success of the Company’s business depends to a certain extent upon the value associated with its intellectual property rights. The Company uses the trademarks “First Cash” and “First Cash Pawn” along with numerous other trade names as described herein. The Company has also developed a proprietary point of sale system for use in its stores. The Company relies on a combination of copyright, trade secret, trademark, and other rights, as well as confidentiality procedures and contractual provisions to protect its proprietary technology, processes and other intellectual property. While the Company intends to vigorously protect its trademarks and proprietary point of sale systems against infringement, it may not be successful. In addition, the laws of certain foreign countries may not protect intellectual property rights to the same extent as the laws of the U.S. The costs required to protect the Company’s intellectual property rights and trademarks could be substantial.
Because the Company maintains a significant supply of cash, loan collateral and inventories in its stores, the Company may be subject to employee and third-party robberies, burglaries and thefts. The Company also may be subject to liability as a result of crimes at its stores.
The Company’s business requires it to maintain a significant supply of cash, loan collateral and inventories in most of its stores. As a result, the Company is subject to the risk of robberies, burglaries and thefts. Although the Company has implemented various programs in an effort to reduce these risks, maintains insurance coverage for robberies, burglaries and thefts and utilizes various security measures at its facilities, there can be no assurance that robberies, burglaries and thefts will not occur. The extent of the Company’s cash, loan collateral and inventory, losses or shortages could increase as it expands the nature and scope of its products and services. Robberies, burglaries and thefts could lead to losses and shortages and could adversely affect the Company’s business, prospects, results of operations and financial condition. It is also possible that violent crimes such as armed robberies may be committed at the Company’s stores. The Company could experience liability or adverse publicity arising from such crimes. For example, the Company may be liable if an employee, customer, guard or bystander suffers bodily injury or other harm. Any such event may have a material adverse effect on the Company’s business, prospects, results of operations and financial condition.
A discussion of certain market risks is covered in “Item 7A. Quantitative and Qualitative Disclosures About Market Risk.”
None.
As of
December 31, 2015
, the Company owned the real estate and buildings for 31 of its pawn stores and owned five other parcels of real estate. The Company’s strategy is generally to lease, rather than purchase, space for its pawnshop and consumer loan locations, unless the Company finds what it believes is a superior location at an attractive price. As of
December 31, 2015
, the Company leased 1,076 store locations that were open or were in the process of opening. Leased facilities are generally leased for a term of three to five years with one or more options to renew. A majority of the store leases can be terminated early upon an adverse change in law which negatively affects the store’s profitability. The Company’s leases expire on dates ranging between 2016 and 2045. All store leases provide for specified periodic rental payments ranging from approximately $900 to $25,000 per month as of
December 31, 2015
. For more information about the Company’s pawn store locations, see “—Item 1. Business—Locations and Operations.”
29
The Company leases approximately 18,000 square feet of office space in Arlington, Texas for its corporate offices. The lease, which expires on May 31, 2020, provides for monthly rental payments of approximately $25,000. The Company leases approximately 15,000 square feet of office space in Monterrey, Mexico for its Mexico administrative offices. The lease, which expires on December 31, 2019, provides for monthly rental payments of approximately $16,000. The Company also leases approximately 12,000 square feet of office space in Euless, Texas for administrative operations. The lease, which expires on February 28, 2018, provides for monthly rental payments of approximately $6,500. The Company leases other administrative office space which is not significant.
Most leases require the Company to maintain the property and pay the cost of insurance and property taxes. The Company believes termination of any particular lease would not have a material adverse effect on the Company’s operations. The Company believes the facilities currently owned and leased by it as pawn stores and consumer loan stores are suitable for such purposes. The Company considers its equipment, furniture and fixtures to be in good condition.
The Company is from time to time a defendant (actual or threatened) in certain lawsuits and arbitration claims encountered in the ordinary course of its business, the resolution of which, in the opinion of management, should not have a material adverse effect on the Company’s financial position, results of operations, or cash flows.
Not Applicable.
General Market Information
The Company’s common stock is quoted on the NASDAQ Global Select Market under the symbol “FCFS.” The following table sets forth the quarterly high and low sales prices per share for the common stock during fiscal
2014
and
2015
, as reported by the NASDAQ Global Select Market:
|
First Quarter
|
Second Quarter
|
Third Quarter
|
Fourth Quarter
|
||||||||||||
|
2015
|
|||||||||||||||
|
High
|
$
|
55.96
|
|
$
|
50.90
|
|
$
|
48.78
|
|
$
|
44.19
|
|
|||
|
Low
|
46.28
|
|
44.88
|
|
36.55
|
|
35.82
|
|
|||||||
|
2014
|
|||||||||||||||
|
High
|
$
|
63.93
|
|
$
|
57.91
|
|
$
|
59.15
|
|
$
|
59.90
|
|
|||
|
Low
|
46.77
|
|
46.01
|
|
54.44
|
|
52.76
|
|
|||||||
On
February 12, 2016
, there were approximately 42 stockholders of record of the Company’s common stock.
No cash dividends have been paid by the Company on its common stock during fiscal
2014
and
2015
. The dividend and earnings retention policies are reviewed by the Board of Directors of the Company from time to time in light of, among other things, the Company’s earnings, cash flows, and financial position. The Company’s senior unsecured notes and revolving credit facilities contain provisions that allow the Company to pay cash dividends within certain parameters. On January 27, 2016, the Board of Directors approved a dividend program to pay common shareholders an annual cash dividend of $0.50 per share paid quarterly. The first quarterly $0.125 dividend will be paid on March 15, 2016 to stockholders of record on March 1, 2016.
30
Recent Issuances of Common Stock
During the period from
January 1, 2015
through
December 31, 2015
, the Company issued
575,000
shares of common stock, net of 80,000 shares net-settled, relating to the exercise of outstanding stock options for an aggregate exercise price of
$13,908,000
(including income tax benefit). During fiscal
2015
, the Company granted a total of
45,000
nonvested shares of restricted common stock to certain executives of the Company. A total of
5,000
previously granted restricted shares vested and were issued during fiscal
2015
.
The transactions set forth in the above paragraph were completed pursuant to Section 4(2) of the Securities Act of 1933 (the “Securities Act”), did not involve a public offering and were sold to a limited group of persons. Each recipient either received adequate information about the Company or had access, through employment or other relationships, to such information, and the Company determined that each recipient had such knowledge and experience in financial and business matters that they were able to evaluate the merits and risks of an investment in the Company. All sales of the Company’s securities were made by officers of the Company who received no commission or other remuneration for the solicitation of any person in connection with the respective sales of securities described above.
Issuer Purchases of Equity Securities
In January 2015, the Company’s Board of Directors authorized a repurchase program for up to 2,000,000 shares of the Company’s outstanding common stock. During fiscal
2015
, the Company repurchased
852,000
shares of its common stock at an aggregate cost of
$39,974,000
with an average price of
$46.94
per share and
1,148,000
shares remain available for repurchase under the repurchase program. Under its share repurchase program, the Company can purchase common stock in open market transactions, block or privately negotiated transactions, and may from time to time purchase shares pursuant to a trading plan in accordance with Rule 10b5-1 and Rule 10b-18 under the Exchange Act, or by any combination of such methods. The number of shares to be purchased and the timing of the purchases are based on a variety of factors, including, but not limited to, the level of cash balances, credit availability, debt covenant restrictions, general business conditions, regulatory requirements, the market price of the Company's stock and the availability of alternative investment opportunities. No time limit was set for completion of repurchases under the authorization and the program may be suspended or discontinued at any time.
The following table provides information with respect to purchases made by the Company of shares of its common stock during each month that the repurchase program was in effect during fiscal
2015
:
|
Total
Number
Of Shares
Purchased
|
Average
Price
Paid
Per Share
|
Total Number Of
Shares Purchased
As Part Of Publicly
Announced Plans
|
Maximum Number
Of Shares That May
Yet Be Purchased
Under The Plans
|
||||||||||
|
January 1 through January 31, 2015
|
79,600
|
|
$
|
49.94
|
|
79,600
|
|
1,920,400
|
|
||||
|
February 1 through February 28, 2015
|
256,002
|
|
50.78
|
|
256,002
|
|
1,664,398
|
|
|||||
|
March 1 through March 31, 2015
|
—
|
|
—
|
|
—
|
|
1,664,398
|
|
|||||
|
April 1 through April 30, 2015
|
127,115
|
|
47.20
|
|
127,115
|
|
1,537,283
|
|
|||||
|
May 1 through May 31, 2015
|
—
|
|
—
|
|
—
|
|
1,537,283
|
|
|||||
|
June 1 through June 30, 2015
|
—
|
|
—
|
|
—
|
|
1,537,283
|
|
|||||
|
July 1 through July 31, 2015
|
198,373
|
|
45.37
|
|
198,373
|
|
1,338,910
|
|
|||||
|
August 1 through August 31, 2015
|
—
|
|
—
|
|
—
|
|
1,338,910
|
|
|||||
|
September 1 through September 30, 2015
|
—
|
|
—
|
|
—
|
|
1,338,910
|
|
|||||
|
October 1 through October 31, 2015
|
190,579
|
|
41.98
|
|
190,579
|
|
1,148,331
|
|
|||||
|
November 1 through November 30, 2015
|
—
|
|
—
|
|
—
|
|
1,148,331
|
|
|||||
|
December 1 through December 31, 2015
|
—
|
|
—
|
|
—
|
|
1,148,331
|
|
|||||
|
Total
|
851,669
|
|
$
|
46.94
|
|
851,669
|
|
|
|||||
31
Performance Graph
The graph set forth below compares the cumulative total stockholder return on the common stock of the Company for the period from December 31, 2010 through December 31, 2015, with the cumulative total return on the NASDAQ Composite Index and a peer group index (whose returns are weighted according to their respective market capitalizations) over the same period (assuming the investment of $100 in the Company’s common stock, the NASDAQ Composite Index, and the peer group on December 31, 2010 and assuming the reinvestment of all dividends on the date paid). The 2015 peer group selected by the Company includes Cash America International, Inc., EZCORP, Inc., World Acceptance Corporation, Rent-A-Center, Inc., and Aaron Rents, Inc.
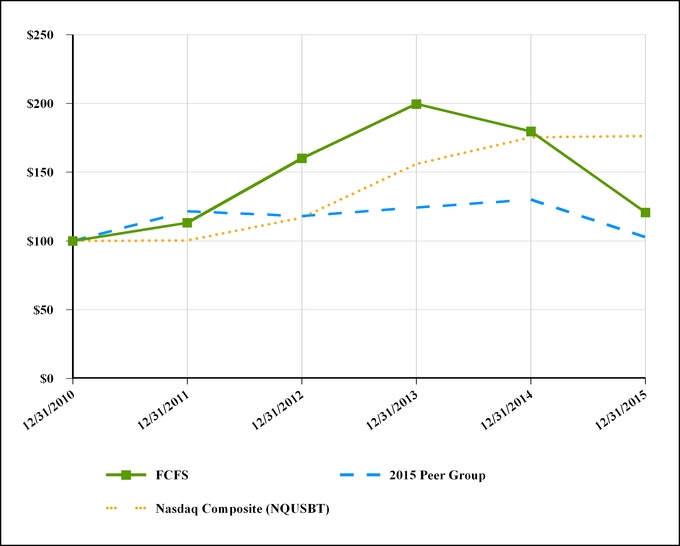
32
The information below should be read in conjunction with “Item 7. Management’s Discussion and Analysis of Financial Condition and Results of Operations” and the Company’s consolidated financial statements and related notes thereto in “Item 8. Financial Statements and Supplementary Data.” The information below is derived from and qualified by reference to the Company’s audited financial statements for each of the five years ended December 31,
2015
.
|
Year Ended December 31,
|
|||||||||||||||||||
|
2015
|
2014
|
2013
|
2012
|
2011
|
|||||||||||||||
|
(in thousands, except per share amounts and certain operating data)
|
|||||||||||||||||||
|
Income Statement Data (1):
|
|||||||||||||||||||
|
Revenue:
|
|||||||||||||||||||
|
Retail merchandise sales
|
$
|
449,296
|
|
$
|
428,182
|
|
$
|
367,187
|
|
$
|
287,456
|
|
$
|
236,797
|
|
||||
|
Pawn loan fees
|
195,448
|
|
199,357
|
|
181,555
|
|
152,237
|
|
122,320
|
|
|||||||||
|
Consumer loan and credit services fees
|
27,803
|
|
36,749
|
|
43,781
|
|
48,692
|
|
46,876
|
|
|||||||||
|
Wholesale scrap jewelry revenue
|
32,055
|
|
48,589
|
|
68,325
|
|
103,706
|
|
108,004
|
|
|||||||||
|
Total revenue
|
704,602
|
|
712,877
|
|
660,848
|
|
592,091
|
|
513,997
|
|
|||||||||
|
Cost of revenue:
|
|||||||||||||||||||
|
Cost of retail merchandise sold
|
278,631
|
|
261,673
|
|
221,361
|
|
167,144
|
|
142,106
|
|
|||||||||
|
Consumer loan and credit services loss provision
|
7,159
|
|
9,287
|
|
11,368
|
|
12,556
|
|
11,331
|
|
|||||||||
|
Cost of wholesale scrap jewelry sold
|
27,628
|
|
41,044
|
|
58,545
|
|
76,853
|
|
71,305
|
|
|||||||||
|
Total cost of revenue
|
313,418
|
|
312,004
|
|
291,274
|
|
256,553
|
|
224,742
|
|
|||||||||
|
Net revenue
|
391,184
|
|
400,873
|
|
369,574
|
|
335,538
|
|
289,255
|
|
|||||||||
|
Expenses and other income:
|
|||||||||||||||||||
|
Store operating expenses
|
207,572
|
|
198,986
|
|
181,321
|
|
148,879
|
|
126,107
|
|
|||||||||
|
Administrative expenses
|
54,758
|
|
54,586
|
|
49,530
|
|
50,211
|
|
45,259
|
|
|||||||||
|
Depreciation and amortization
|
17,939
|
|
17,476
|
|
15,361
|
|
12,939
|
|
10,944
|
|
|||||||||
|
Goodwill impairment - U.S. consumer loan operations
|
7,913
|
|
—
|
|
—
|
|
—
|
|
—
|
|
|||||||||
|
Interest expense, net
|
15,321
|
|
12,845
|
|
3,170
|
|
1,272
|
|
(142
|
)
|
|||||||||
|
Total expenses and other income
|
303,503
|
|
283,893
|
|
249,382
|
|
213,301
|
|
182,168
|
|
|||||||||
|
Income from continuing operations before income taxes
|
87,681
|
|
116,980
|
|
120,192
|
|
122,237
|
|
107,087
|
|
|||||||||
|
Provision for income taxes
|
26,971
|
|
31,542
|
|
35,713
|
|
41,375
|
|
36,950
|
|
|||||||||
|
Income from continuing operations
|
60,710
|
|
85,438
|
|
84,479
|
|
80,862
|
|
70,137
|
|
|||||||||
|
Income (loss) from discontinued operations, net of tax
|
—
|
|
(272
|
)
|
(633
|
)
|
(503
|
)
|
7,645
|
|
|||||||||
|
Net income
|
$
|
60,710
|
|
$
|
85,166
|
|
$
|
83,846
|
|
$
|
80,359
|
|
$
|
77,782
|
|
||||
33
|
Year Ended December 31,
|
|||||||||||||||||||
|
2015
|
2014
|
2013
|
2012
|
2011
|
|||||||||||||||
|
Income Statement Data (Continued) (1):
|
|||||||||||||||||||
|
Net income per share:
|
|||||||||||||||||||
|
Basic:
|
|||||||||||||||||||
|
Income from continuing operations
|
$
|
2.16
|
|
$
|
2.98
|
|
$
|
2.91
|
|
$
|
2.80
|
|
$
|
2.29
|
|
||||
|
Net income
|
2.16
|
|
2.97
|
|
2.89
|
|
2.78
|
|
2.53
|
|
|||||||||
|
Diluted:
|
|||||||||||||||||||
|
Income from continuing operations
|
2.14
|
|
2.94
|
|
2.86
|
|
2.72
|
|
2.23
|
|
|||||||||
|
Net income
|
2.14
|
|
2.93
|
|
2.84
|
|
2.70
|
|
2.47
|
|
|||||||||
|
Balance Sheet Data:
|
|||||||||||||||||||
|
Inventories
|
$
|
93,458
|
|
$
|
91,088
|
|
$
|
77,793
|
|
$
|
65,345
|
|
$
|
44,412
|
|
||||
|
Pawn loans
|
117,601
|
|
118,536
|
|
115,234
|
|
103,181
|
|
73,287
|
|
|||||||||
|
Net working capital (2)
|
279,259
|
|
258,194
|
|
236,417
|
|
209,132
|
|
173,995
|
|
|||||||||
|
Total assets (2)
|
757,021
|
|
716,623
|
|
660,999
|
|
506,544
|
|
356,018
|
|
|||||||||
|
Long-term liabilities (2)
|
279,464
|
|
239,623
|
|
201,889
|
|
122,978
|
|
5,241
|
|
|||||||||
|
Total liabilities (2)
|
325,639
|
|
282,182
|
|
250,650
|
|
154,128
|
|
40,646
|
|
|||||||||
|
Stockholders’ equity (2)
|
431,382
|
|
434,441
|
|
410,349
|
|
352,416
|
|
315,372
|
|
|||||||||
|
Statement of Cash Flows Data:
|
|||||||||||||||||||
|
Net cash flows provided by (used in):
|
|||||||||||||||||||
|
Operating activities
|
$
|
92,749
|
|
$
|
97,679
|
|
$
|
106,718
|
|
$
|
88,792
|
|
$
|
80,375
|
|
||||
|
Investing activities
|
(71,676
|
)
|
(85,366
|
)
|
(140,726
|
)
|
(159,904
|
)
|
(22,104
|
)
|
|||||||||
|
Financing activities
|
9,127
|
|
(9,098
|
)
|
54,644
|
|
49,525
|
|
(52,593
|
)
|
|||||||||
|
Other Financial Data (3):
|
|||||||||||||||||||
|
EBITDA
|
$
|
120,448
|
|
$
|
147,029
|
|
$
|
138,090
|
|
$
|
135,945
|
|
$
|
125,534
|
|
||||
|
Free cash flow
|
$
|
67,960
|
|
$
|
71,255
|
|
$
|
79,635
|
|
$
|
49,626
|
|
$
|
46,193
|
|
||||
|
Pawn store annualized inventory turnover
|
3.4x
|
|
3.6x
|
|
3.6x
|
|
4.2x
|
|
4.2x
|
|
|||||||||
|
Location Counts:
|
|||||||||||||||||||
|
Pawn stores
|
1,005
|
|
912
|
|
821
|
|
715
|
|
570
|
|
|||||||||
|
Credit services/consumer loan stores
|
70
|
|
93
|
|
85
|
|
99
|
|
101
|
|
|||||||||
|
1,075
|
|
1,005
|
|
906
|
|
814
|
|
671
|
|
||||||||||
|
(1)
|
See “Management’s Discussion and Analysis of Financial Condition and Results of Operations —Non-GAAP Financial Information—Adjusted Net Income and Adjusted Net Income Per Share” for additional information about certain 2015, 2014 and 2013 income and expense items that affected the Company’s consolidated income from operations, income before income taxes, net income and net income per share.
|
|
(2)
|
Prior year amounts have been revised or reclassified. See Note
2
of Notes to Consolidated Financial Statements for further information.
|
|
(3)
|
See “Management’s Discussion and Analysis of Financial Condition and Results of Operations—Non-GAAP Financial Information” for additional information about EBITDA and free cash flow and a reconciliation of EBITDA and free cash flow to the most comparable GAAP measures.
|
34
General
The Company is a leading operator of retail-based pawn stores in the United States and Latin America. The Company’s pawn stores generate significant retail sales primarily from the merchandise acquired through collateral forfeitures and over-the-counter purchases from customers. The Company’s pawn stores are also a convenient source for small consumer loans to help customers meet their short-term cash needs. Personal property such as consumer electronics, jewelry, power tools, household appliances, sporting goods and musical instruments are pledged as collateral for the loans. In addition, some of the Company’s pawn stores offer consumer loans or credit services products. The Company’s strategy is to focus on growing its retail-based pawn operations in the United States and Latin America through new store openings and strategic acquisition opportunities as they arise. Pawn operations accounted for approximately
96%
of the Company’s consolidated revenue during fiscal
2015
compared to
95%
during fiscal
2014
.
The Company accrues pawn loan fee revenue on a constant-yield basis over the life of the pawn loan for all pawn loans that the Company deems collection to be probable based on historical redemption statistics. If a pawn loan is not repaid prior to the expiration of the loan term, including any automatic extension period, if applicable, the property is forfeited to the Company and transferred to inventory at a value equal to the principal amount of the loan, exclusive of accrued interest. The Company records merchandise sales revenue at the time of the sale. The Company presents merchandise sales net of any sales or value-added taxes collected. The Company does not provide direct financing to customers for the purchase of its merchandise, but does permit its customers to purchase merchandise on an interest-free layaway plan. Should the customer fail to make a required payment pursuant to a layaway plan, the previous payments are typically forfeited to the Company. Interim payments from customers on layaway sales are recorded as deferred revenue and subsequently recorded as income during the period in which final payment is received or when previous payments are forfeited to the Company. Some jewelry is melted at a third-party facility and the precious metal content is sold at either prevailing market commodity prices or a previously agreed upon price with a commodity buyer. The Company records revenue from these transactions when a price has been agreed upon and the Company ships the jewelry to the buyer.
The Company operates a small number of stand-alone consumer finance stores in Texas and Mexico. These stores provide consumer financial services products including credit services, consumer loans and check cashing. Certain of the Company’s pawn stores also offer credit services and/or consumer loans as an ancillary product. Consumer loan and credit services revenue accounted for approximately
4%
of consolidated revenue for fiscal
2015
compared to
5%
during fiscal
2014
.
The Company recognizes service fee income on consumer loans and credit services transactions on a constant-yield basis over the life of the loan or credit extension, which is generally 180 days or less. The net defaults on consumer loans and credit services transactions and changes in the valuation reserve are charged to the consumer loan credit loss provision. The credit loss provision associated with the Company’s CSO Program and consumer loans are based primarily upon historical credit loss experience, with consideration given to recent credit loss trends, delinquency rates, economic conditions and management’s expectations of future credit losses. For an additional discussion of the credit loss provision and related allowances and accruals, see “—Results of Continuing Operations.”
Stores included in the same-store calculations presented in this annual report are those stores that were opened prior to the beginning of the prior-year comparative fiscal period and remained open through the end of the measurement period. Also included are stores that were relocated during the year within a specified distance serving the same market where there is not a significant change in store size and where there is not a significant overlap or gap in timing between the opening of the new store and the closing of the existing store.
Operating expenses consist of all items directly related to the operation of the Company’s stores, including salaries and related payroll costs, rent, utilities, facilities maintenance, advertising, property taxes, licenses, supplies and security. Administrative expenses consist of items relating to the operation of the corporate offices, including the compensation and benefit costs of corporate management, area supervisors and other operations management personnel, collection operations and personnel, accounting and administrative costs, information technology costs, liability and casualty insurance, outside legal and accounting fees and stockholder-related expenses.
35
|
Year Ended December 31,
|
||||||||
|
2015
|
2014
|
2013
|
||||||
|
Income statement items as a percent of total revenue:
|
||||||||
|
Revenue:
|
||||||||
|
Retail merchandise sales
|
63.8
|
%
|
60.0
|
%
|
55.6
|
%
|
||
|
Pawn loan fees
|
27.7
|
|
28.0
|
|
27.4
|
|
||
|
Consumer loan and credit services fees
|
4.0
|
|
5.2
|
|
6.7
|
|
||
|
Wholesale scrap jewelry revenue
|
4.5
|
|
6.8
|
|
10.3
|
|
||
|
Cost of revenue:
|
||||||||
|
Cost of retail merchandise sold
|
39.6
|
|
36.7
|
|
33.5
|
|
||
|
Consumer loan and credit services loss provision
|
1.0
|
|
1.3
|
|
1.7
|
|
||
|
Cost of wholesale scrap jewelry sold
|
3.9
|
|
5.8
|
|
8.9
|
|
||
|
Net revenues
|
55.5
|
|
56.2
|
|
55.9
|
|
||
|
Expenses and other income:
|
||||||||
|
Store operating expenses
|
29.5
|
|
27.9
|
|
27.4
|
|
||
|
Administrative expenses
|
7.8
|
|
7.7
|
|
7.5
|
|
||
|
Depreciation and amortization
|
2.5
|
|
2.4
|
|
2.3
|
|
||
|
Goodwill impairment - U.S. consumer loan operations
|
1.1
|
|
—
|
|
—
|
|
||
|
Interest expense, net
|
2.2
|
|
1.8
|
|
0.5
|
|
||
|
Income from continuing operations before income taxes
|
12.4
|
|
16.4
|
|
18.2
|
|
||
|
Provision for income taxes
|
3.8
|
|
4.4
|
|
5.4
|
|
||
|
Income from continuing operations
|
8.6
|
|
12.0
|
|
12.8
|
|
||
|
Retail merchandise sales gross profit margin
|
38.0
|
%
|
38.9
|
%
|
39.7
|
%
|
||
|
Store operating profit margin (1)
|
23.9
|
|
26.3
|
|
26.6
|
|
||
(1) Store operating profit is an amount equal to net revenues less store operating expenses less depreciation expense.
Discontinued Operations
During fiscal 2014, the Company discontinued Cash & Go, Ltd., which owned and operated
37
check cashing and financial services kiosks located inside convenience stores in the state of Texas. Cash & Go, Ltd. was a joint venture in which the Company owned a 50% interest. The Company recorded an after-tax loss upon the liquidation of Cash & Go, Ltd. of $272,000, or $0.01 per share, in fiscal 2014, which was reported as a loss from discontinued operations. In fiscal 2013, the Company recorded a charge of $844,000, net of tax, or $0.03 per share, and the after-tax earnings from operations for Cash & Go, Ltd. were $211,000, or $0.01 per share.
All revenue, expenses and income reported in these consolidated financial statements have been adjusted to reflect reclassification of these discontinued operations. There were no assets or liabilities for discontinued operations as of December 31, 2015 and 2014.
36
Critical Accounting Policies
The preparation of financial statements in conformity with GAAP requires management to make estimates, assumptions and judgments that affect the reported amounts of assets and liabilities, related revenue and expenses, and disclosure of gain and loss contingencies at the date of the financial statements. Such estimates, assumptions and judgments are subject to a number of risks and uncertainties, which may cause actual results to differ materially from the Company’s estimates. The significant accounting policies that the Company believes are the most critical to aid in fully understanding and evaluating its reported financial results include the following:
Customer loans and revenue recognition
- Receivables on the balance sheet consist of pawn loans and consumer loans. Pawn loans are collateralized by pledged tangible personal property. The Company accrues pawn loan fee revenue on a constant-yield basis over the life of the pawn for all pawns for which the Company deems collection to be probable based on historical pawn redemption statistics. The typical pawn loan term is generally 30 days plus an additional grace period of 15 to 90 days depending on geographical markets and local regulations. Pawn loans may be either paid in full with accrued pawn loan fees and service charges or, where permitted by law, may be renewed or extended by the customer’s payment of accrued pawn loan fees and service charges. If the pawn is not repaid, the principal amount loaned becomes the carrying value of the forfeited collateral, which is recovered through sales to other customers at prices above the carrying value.
The Company’s pawn merchandise sales are primarily retail sales to the general public in its pawn stores. The Company acquires pawn merchandise inventory through forfeited pawns and through purchases of used goods directly from the general public. The Company also retails limited quantities of new or refurbished merchandise obtained directly from wholesalers and manufacturers. The Company records sales revenue at the time of the sale. The Company presents merchandise sales net of any sales or value-added taxes collected. The Company does not provide direct financing to customers for the purchase of its merchandise, but does permit its customers to purchase merchandise on an interest-free layaway plan. Should the customer fail to make a required payment pursuant to a layaway plan, the previous payments are forfeited to the Company. Interim payments from customers on layaway sales are recorded as deferred revenue and subsequently recorded as income during the period in which final payment is received or when previous payments are forfeited to the Company. Some jewelry is melted at a third-party facility and the precious metal content is sold at either prevailing market commodity prices or a previously agreed upon price with a commodity buyer. The Company records revenue from these transactions when a price has been agreed upon and the Company ships the precious metals to the buyer.
The Company recognizes credit services fees ratably over the life of the extension of credit made by the Independent Lender. The extensions of credit made by the Independent Lender to credit services customers have terms of
7
to
180
days. The Company accrues consumer loan service fees on a constant-yield basis over the term of the consumer loan. Consumer loans have terms that range from 7 to 365 days.
Credit loss provisions
- The Company has determined that no allowance related to credit losses on pawn loans is required, as the fair value of the collateral is significantly in excess of the pawn loan amount. Under the CSO Program, letters of credit issued by the Company to the Independent Lender constitute a guarantee for which the Company is required to recognize, at the inception of the guarantee, a liability for the fair value of the obligation undertaken by issuing the letters of credit. The Independent Lender may present the letter of credit to the Company for payment if the customer fails to repay the full amount of the extension of credit and accrued interest after the due date of the extension of credit. Each letter of credit expires approximately
30 days
after the due date of the extension of credit. The Company’s maximum loss exposure under all of the outstanding letters of credit issued on behalf of its customers to the Independent Lender as of
December 31, 2015
was
$8,192,000
. According to the letter of credit, if the borrower defaults on the extension of credit, the Company will pay the Independent Lender the principal, accrued interest, insufficient funds fee, and late fee, all of which the Company records in the consumer loan and credit services loss provision. The Company is entitled to seek recovery directly from its customers for amounts it pays the Independent Lender in performing under the letters of credit. The Company records the estimated fair value of the liability under the letters of credit as a component of accrued liabilities.
An allowance is provided for losses on active consumer loans and service fees receivable based upon expected default rates, net of estimated future recoveries of previously defaulted consumer loans and service fees receivable. The Company considers consumer loans to be in default if they are not repaid on the due date and writes off the principal amount and service fees receivable as of the default date, leaving only active advances in the reported balance. Net defaults and changes in the consumer loan allowance are charged to the consumer loan loss provision.
37
Inventories
- Inventories represent merchandise acquired from forfeited pawns and merchandise purchased directly from the general public. The Company also retails limited quantities of new or refurbished merchandise obtained directly from wholesalers and manufacturers. Inventories from forfeited pawns are recorded at the amount of the pawn principal on the unredeemed goods, exclusive of accrued interest. Inventories purchased directly from customers, wholesalers and manufacturers are recorded at cost. The cost of inventories is determined on the specific identification method. Inventories are stated at the lower of cost or market value; accordingly, inventory valuation allowances are established, if necessary, when inventory carrying values are in excess of estimated selling prices, net of direct costs of disposal. Management has evaluated inventories and determined that a valuation allowance is not necessary.
Goodwill -
Goodwill represents the excess of the purchase price over the fair value of the net assets acquired in each business combination. The Company performs its goodwill impairment assessment annually as of December 31, and between annual assessments if an event occurs or circumstances change that would more likely than not reduce the fair value of a reporting unit below its carrying amount. The Company’s reporting units, which are tested for impairment, are U.S. Pawn Operations, U.S. Consumer Loan Operations and Latin America Operations. The Company assesses goodwill for impairment at a reporting unit level by first assessing a range of qualitative factors, including, but not limited to, macroeconomic conditions, industry conditions, the competitive environment, changes in the market for the Company’s products and services, regulatory and political developments, entity specific factors such as strategy and changes in key personnel, and overall financial performance. If, after completing this assessment, it is determined that it is more likely than not that the fair value of a reporting unit is less than its carrying value, the Company proceeds to the two-step impairment testing methodology. As described in “—Results of Continuing Operations—Goodwill Impairment—U.S. Consumer Loan Operations” below, the Company recorded a goodwill impairment charge of $7,913,000 during 2015.
Foreign currency transactions
- The Company has significant operations in Mexico, and Guatemala to a lesser extent, where the functional currency is the Mexican peso and Guatemalan quetzal, respectively. Accordingly, the assets and liabilities of these subsidiaries are translated into U.S. dollars at the exchange rate in effect at each balance sheet date, and the resulting adjustments are accumulated in other comprehensive income (loss) as a separate component of stockholders’ equity. Revenue and expenses are translated at the average exchange rates occurring during the year-to-date period. Prior to translation, any U.S. dollar-denominated transactions of the foreign subsidiaries are remeasured into their functional currency using current rates of exchange for monetary assets and liabilities and historical rates of exchange for non-monetary assets and liabilities. Gains and losses from remeasurement of dollar-denominated monetary assets and liabilities in Mexico and Guatemala are included in store operating expenses.
The Company’s management reviews and analyzes certain operating results in Latin America on a constant currency basis because the Company believes this better represents the Company’s underlying business trends. Amounts presented on a constant currency basis are denoted as such. See “—Non-GAAP Financial Information” for additional discussion of constant currency operating results.
The average value of the Mexican peso to the U.S. dollar exchange rate for fiscal 2015 was 15.8 to 1, compared to 13.3 to 1 in fiscal 2014 and 12.8 to 1 in fiscal 2013. In fiscal 2016, through
February 12, 2016
, the average exchange rate was 18.1 to 1, which equates to a 15% decline as compared to the average value for fiscal 2015 of 15.8 to 1.
38
Results of Continuing Operations
Twelve Months Ended December 31,
2015
Compared to Twelve Months Ended December 31,
2014
.
The following table details the components of the Company’s revenue for the fiscal year ended December 31,
2015
as compared to the fiscal year ended December 31,
2014
(in thousands). Constant currency results exclude the effects of foreign currency translation and are calculated by translating current year results at prior year average exchange rates. The average value of the Mexican peso to the U.S. dollar
decreased
19%
from
13.3
to 1 during fiscal
2014
to
15.8
to 1 during fiscal
2015
. The end-of-period value of the Mexican peso to the U.S. dollar
decreased
17%
, from
14.7
to 1 at
December 31, 2014
to
17.2
to 1 at
December 31, 2015
. As a result of these currency exchange movements, revenue from Mexican operations translated into
fewer
U.S. dollars relative to the prior year, and net assets of Mexican operations as of year end translated into
fewer
U.S. dollars relative to the prior year end. While the strength of the U.S. dollar compared to the Mexican peso
decreased
the translated dollar-value of revenue generated in Mexico, the cost of sales and operating expenses
decreased
as well. The scrap jewelry generated in Mexico was exported and sold in U.S. dollars, which did not contribute to the Company’s peso-denominated revenue stream. For the year ended December 31,
2015
, the Company’s Latin American revenues and net income would have been approximately $68,106,000 and $9,500,000 higher, respectively, had foreign currency exchange rates remained consistent with those for the year ended December 31,
2014
. As the Company acquired the Guatemalan stores on December 31, 2015, there are no prior year comparisons and the assets and liabilities acquired were translated at an exchange rate of 7.6 Guatemalan quetzales / U.S. dollar. See “—Non-GAAP Financial Information—Constant Currency Results” below.
|
Constant Currency Basis
|
||||||||||||||||||
|
Year Ended
|
||||||||||||||||||
|
December 31,
|
Increase /
|
|||||||||||||||||
|
Year Ended December 31,
|
Increase /
|
2015
|
(Decrease)
|
|||||||||||||||
|
|
2015
|
2014
|
(Decrease)
|
(Non-GAAP)
|
(Non-GAAP)
|
|||||||||||||
|
U.S. revenue:
|
|
|
|
|
||||||||||||||
|
Retail merchandise sales
|
$
|
197,011
|
|
$
|
172,354
|
|
14
|
%
|
$
|
197,011
|
|
14
|
%
|
|||||
|
Pawn loan fees
|
94,761
|
|
89,952
|
|
5
|
%
|
94,761
|
|
5
|
%
|
||||||||
|
Consumer loan and credit services fees
|
25,696
|
|
34,051
|
|
(25
|
)%
|
25,696
|
|
(25
|
)%
|
||||||||
|
Wholesale scrap jewelry revenue
|
19,380
|
|
28,243
|
|
(31
|
)%
|
19,380
|
|
(31
|
)%
|
||||||||
|
|
336,848
|
|
324,600
|
|
4
|
%
|
336,848
|
|
4
|
%
|
||||||||
|
Latin America revenue:
|
|
|
|
|
|
|||||||||||||
|
Retail merchandise sales
|
252,285
|
|
255,828
|
|
(1
|
)%
|
300,674
|
|
18
|
%
|
||||||||
|
Pawn loan fees
|
100,687
|
|
109,405
|
|
(8
|
)%
|
119,999
|
|
10
|
%
|
||||||||
|
Consumer loan and credit services fees
|
2,107
|
|
2,698
|
|
(22
|
)%
|
2,511
|
|
(7
|
)%
|
||||||||
|
Wholesale scrap jewelry revenue
|
12,675
|
|
20,346
|
|
(38
|
)%
|
12,675
|
|
(38
|
)%
|
||||||||
|
|
367,754
|
|
388,277
|
|
(5
|
)%
|
435,859
|
|
12
|
%
|
||||||||
|
Total revenue:
|
|
|
|
|
|
|||||||||||||
|
Retail merchandise sales
|
449,296
|
|
428,182
|
|
5
|
%
|
497,685
|
|
16
|
%
|
||||||||
|
Pawn loan fees
|
195,448
|
|
199,357
|
|
(2
|
)%
|
214,760
|
|
8
|
%
|
||||||||
|
Consumer loan and credit services fees
|
27,803
|
|
36,749
|
|
(24
|
)%
|
28,207
|
|
(23
|
)%
|
||||||||
|
Wholesale scrap jewelry revenue
|
32,055
|
|
48,589
|
|
(34
|
)%
|
32,055
|
|
(34
|
)%
|
||||||||
|
|
$
|
704,602
|
|
$
|
712,877
|
|
(1
|
)%
|
$
|
772,707
|
|
8
|
%
|
|||||
Latin America revenue accounted for approximately
52%
of total revenue for fiscal 2015, while U.S. revenue accounted for approximately
48%
of the total revenue. On a constant currency basis, Latin America revenue accounted for approximately
56%
of total revenue for fiscal 2015, while U.S. revenue accounted for approximately
44%
of the total revenue.
39
The following table details customer loans and inventories held by the Company and active CSO Program credit extensions from the Independent Lender as of December 31,
2015
as compared to December 31,
2014
(in thousands). Constant currency results exclude the effects of foreign currency translation and are calculated by translating current-year balances at the prior-year end-of-period exchange rate.
|
Constant Currency Basis
|
||||||||||||||||||
|
Balance at
|
||||||||||||||||||
|
December 31,
|
Increase /
|
|||||||||||||||||
|
Balance at December 31,
|
Increase /
|
2015
|
(Decrease)
|
|||||||||||||||
|
|
2015
|
2014
|
(Decrease)
|
(Non-GAAP)
|
(Non-GAAP)
|
|||||||||||||
|
U.S.:
|
|
|
|
|
||||||||||||||
|
Pawn loans
|
$
|
68,153
|
|
$
|
68,100
|
|
—
|
%
|
$
|
68,153
|
|
—
|
%
|
|||||
|
CSO credit extensions held by independent third-party (1)
|
7,005
|
|
10,421
|
|
(33
|
)%
|
7,005
|
|
(33
|
)%
|
||||||||
|
Other consumer loans
|
688
|
|
790
|
|
(13
|
)%
|
688
|
|
(13
|
)%
|
||||||||
|
Combined customer loans (2)
|
75,846
|
|
79,311
|
|
(4
|
)%
|
75,846
|
|
(4
|
)%
|
||||||||
|
Latin America:
|
|
|
|
|
||||||||||||||
|
Pawn loans
|
49,448
|
|
50,436
|
|
(2
|
)%
|
57,354
|
|
14
|
%
|
||||||||
|
Other consumer loans
|
430
|
|
451
|
|
(5
|
)%
|
503
|
|
12
|
%
|
||||||||
|
Combined customer loans
|
49,878
|
|
50,887
|
|
(2
|
)%
|
57,857
|
|
14
|
%
|
||||||||
|
Total:
|
|
|
|
|
||||||||||||||
|
Pawn loans
|
117,601
|
|
118,536
|
|
(1
|
)%
|
125,507
|
|
6
|
%
|
||||||||
|
CSO credit extensions held by independent third-party (1)
|
7,005
|
|
10,421
|
|
(33
|
)%
|
7,005
|
|
(33
|
)%
|
||||||||
|
Other consumer loans
|
1,118
|
|
1,241
|
|
(10
|
)%
|
1,191
|
|
(4
|
)%
|
||||||||
|
Combined customer loans (2)
|
$
|
125,724
|
|
$
|
130,198
|
|
(3
|
)%
|
$
|
133,703
|
|
3
|
%
|
|||||
|
Pawn inventories:
|
|
|
|
|
||||||||||||||
|
U.S.
|
$
|
56,040
|
|
$
|
49,969
|
|
12
|
%
|
$
|
56,040
|
|
12
|
%
|
|||||
|
Latin America
|
37,418
|
|
41,119
|
|
(9
|
)%
|
43,588
|
|
6
|
%
|
||||||||
|
Combined inventories
|
$
|
93,458
|
|
$
|
91,088
|
|
3
|
%
|
$
|
99,628
|
|
9
|
%
|
|||||
(1) CSO Program amounts outstanding are composed of the principal portion of active CSO Program extensions of credit by the Independent Lender, which are not included on the Company’s balance sheet, net of the Company’s estimated fair value of its liability under the letters of credit guaranteeing the extensions of credit.
|
(2)
|
Combined customer loans is a non-GAAP measure as it includes CSO credit extensions held by the Independent Lender not included on the Company’s balance sheet. The Company believes this non-GAAP measure provides investors with important information needed to evaluate the magnitude of potential loan losses and the opportunity for revenue performance of the consumer loan portfolio on an aggregate basis. The Company also believes the comparison of the aggregate amounts from period to period is more meaningful than comparing only the amounts reflected on the Company’s balance sheet since both credit services fee revenue and the corresponding loss provision are impacted by the aggregate amount of loans owned by the Company and those guaranteed by the Company as reflected in its financial statements.
|
40
The following tables detail the composition of pawn collateral and the average outstanding pawn loan receivable as of
December 31, 2015
as compared to
December 31, 2014
.
|
Balance at December 31,
|
||||||
|
|
2015
|
2014
|
||||
|
Composition of pawn collateral:
|
||||||
|
U.S. pawn loans:
|
|
|
||||
|
General merchandise
|
45
|
%
|
44
|
%
|
||
|
Jewelry
|
55
|
%
|
56
|
%
|
||
|
|
100
|
%
|
100
|
%
|
||
|
Latin America pawn loans:
|
|
|
||||
|
General merchandise
|
87
|
%
|
88
|
%
|
||
|
Jewelry
|
13
|
%
|
12
|
%
|
||
|
|
100
|
%
|
100
|
%
|
||
|
Total pawn loans:
|
|
|
||||
|
General merchandise
|
63
|
%
|
62
|
%
|
||
|
Jewelry
|
37
|
%
|
38
|
%
|
||
|
|
100
|
%
|
100
|
%
|
||
|
Constant Currency Basis
|
||||||||||||||||||
|
Balance at
|
||||||||||||||||||
|
December 31,
|
Increase /
|
|||||||||||||||||
|
Balance at December 31,
|
Increase /
|
2015
|
(Decrease)
|
|||||||||||||||
|
|
2015
|
2014
|
(Decrease)
|
(Non-GAAP)
|
(Non-GAAP)
|
|||||||||||||
|
Average outstanding pawn loan amount:
|
||||||||||||||||||
|
U.S. pawn loans
|
$
|
169
|
|
$
|
171
|
|
(1
|
)%
|
$
|
169
|
|
(1
|
)%
|
|||||
|
Latin America pawn loans
|
63
|
|
67
|
|
(6
|
)%
|
73
|
|
9
|
%
|
||||||||
|
Total pawn loans
|
99
|
|
103
|
|
(4
|
)%
|
105
|
|
2
|
%
|
||||||||
Retail Merchandise Sales Operations
Total retail merchandise sales increased
5%
(
16%
on a constant currency basis) to
$449,296,000
during fiscal
2015
compared to
$428,182,000
for fiscal
2014
. The increased retail merchandise sales in the Company’s pawn stores reflected store additions, maturation of existing stores and an increase in retail inventories available for sale. During fiscal
2015
, the gross profit margin on retail merchandise sales was
38%
compared to a margin of
39%
on retail merchandise sales during fiscal
2014
.
Pawn inventories increased from
$91,088,000
at December 31,
2014
to
$93,458,000
at December 31,
2015
, largely as a result of the
9%
increase in the weighted-average store count in fiscal
2015
and the maturation of existing stores. At
December 31, 2015
, the Company’s pawn inventories were composed of
31%
jewelry (primarily gold jewelry held for retail sale),
38%
electronics and appliances,
10%
tools,
10%
sporting goods and
11%
other. At December 31,
2014
, the Company’s pawn inventories were composed of
30%
jewelry (primarily gold jewelry held for retail sale),
41%
electronics and appliances,
10%
tools,
7%
sporting goods and
12%
other. At
December 31, 2015
,
94%
of total inventories had been held for one year or less, while
6%
had been held for more than one year. At
December 31, 2014
,
95%
of total inventories had been held for one year or less, while
5%
had been held for more than one year. The increase in aged inventory (inventory held for more than one year) is primarily a result of recent acquisition activity. Excluding stores acquired during fiscal
2015
, aged inventories represented 5% of total inventories at
December 31, 2015
.
Pawn Lending Operations
Pawn loan fees decreased
2%
(increased
8%
on a constant currency basis) totaling
$195,448,000
during fiscal
2015
compared to
$199,357,000
for fiscal
2014
. Consolidated pawn receivables as of December 31,
2015
decreased
1%
(increased
6%
on a constant currency basis) compared to December 31,
2014
. The increase in constant currency pawn fees and receivables was primarily due to store additions. Latin America same-store pawn receivables increased 5% on a constant currency basis while U.S. same-store
41
receivables declined 6% as of December 31,
2015
compared to December 31,
2014
. The consolidated annualized yield on pawn loans was
162%
in fiscal
2015
compared to
164%
in the prior year.
Consumer Lending Operations
Service fees from consumer loans and credit services transactions (collectively also known as payday loans) decreased
24%
(
23%
on a constant currency basis) to
$27,803,000
during fiscal
2015
compared to
$36,749,000
for fiscal
2014
. The Company attributes the decrease in part to increased competition, additional regulatory restrictions in many markets where the Company’s payday lending operations are focused as well as the Company’s ongoing strategic downsizing of these operations with the closure of 23 stand-alone consumer finance stores in Texas during fiscal
2015
. Consumer/payday loan-related products comprised
4%
of total revenue during fiscal
2015
compared to
5%
for fiscal
2014
.
The Company’s consumer loan and credit services loss provision of
$7,159,000
was
26%
of consumer loan and credit services fee revenue during fiscal
2015
compared to
$9,287,000
, or
25%
, during fiscal
2014
. The estimated fair value of liabilities under the CSO Program letters of credit, net of anticipated recoveries from customers, was
$498,000
, or
6.6%
of the gross loan balance, at
December 31, 2015
compared to
$493,000
, or
4.5%
of the gross loan balance, at
December 31, 2014
, which is included as a component of the Company’s accrued liabilities. The Company’s loss reserve on consumer loans was
$66,000
, or
5.6%
of the gross loan balance, at
December 31, 2015
compared to
$81,000
, or
6.1%
of the gross loan balance, at
December 31, 2014
.
Wholesale Scrap Jewelry Operations
Revenue from wholesale scrap jewelry operations decreased
34%
to
$32,055,000
during fiscal
2015
compared to
$48,589,000
during fiscal
2014
. Wholesale scrap jewelry revenue during fiscal
2015
consisted primarily of gold sales, of which approximately
24,100
ounces were sold at an average selling price of
$1,145
per ounce compared to approximately
33,100
ounces of gold sold at an average selling price of
$1,268
per ounce in the prior year. The scrap gross profit margin was
14%
compared to the prior-year margin of
16%
. Scrap jewelry profits accounted for
1%
of net revenue (gross profit) for fiscal
2015
compared to
2%
in fiscal
2014
. The Company’s exposure to gold price risk is described further in “Item 7A. Quantitative and Qualitative Disclosures About Market Risk—Gold Price Risk.”
Combined Revenue Results
The decrease in year-over-year total revenue of
1%
(increased
8%
on a constant currency basis) reflected a
3%
increase (
14%
on a constant currency basis) in combined retail sales and pawn fee revenue from new and existing pawn stores, offset by a decrease in non-core wholesale scrap jewelry revenue and consumer loan fees. Same-store core revenue from retail sales and pawn fees increased 3% on a consolidated, constant currency basis from fiscal
2014
to fiscal
2015
. Same-store core revenue in Latin America increased 8% (on a constant currency basis), offset by a decrease in same-store core revenue of 3% in the U.S. as compared to the prior year.
Store Operating Expenses
Store operating expenses
increased
by
4%
(
13%
on a constant currency basis) to
$207,572,000
during fiscal
2015
compared to
$198,986,000
during fiscal
2014
, primarily as a result of the
9%
increase in the weighted-average store count offset by a
19%
year-over-year decline in the average value of the Mexican peso. Same-store operating expenses increased 2% on a constant currency basis, compared to the prior-year period.
The net store profit contribution for fiscal
2015
was
$168,663,000
, which equates to a store-level operating margin of
24%
compared to $
187,311,000
and
26%
in the prior year, respectively. The decline in the store-level operating margin related primarily to a
41%
decrease (
67%
on a constant currency basis) in net revenue from wholesale scrap jewelry and a
25%
decrease (
24%
on a constant currency basis) in net revenue from payday lending.
As a result of the 23 consumer loan store closures during fiscal 2015 and the continued significant deterioration in payday lending market conditions, primarily due to increased regulatory pressure, the Company recognized non-recurring expenses related to the restructuring of the U.S. consumer loan operations of $965,000 during fiscal 2015. The majority of these non-recurring expenses are included in store operating expenses in the accompanying consolidated statements of income.
42
Goodwill Impairment - U.S. Consumer Loan Operations
During the third quarter of 2015, the Company determined that sufficient indicators of potential impairment existed to require an interim goodwill impairment analysis for the U.S. consumer loan operations reporting unit. These indicators included, among others, the impacts of recently enacted and additional proposed local, state and federal regulatory restrictions affecting short-term and long-term profitability expectations for payday and title lending products, the Company’s long-term ongoing strategy to reduce non-core consumer lending operations along with continued store closures and the significant deterioration in payday lending market conditions. As a result of the Company’s interim goodwill impairment analysis, a $7,913,000 goodwill impairment charge was recorded in the third quarter of 2015 leaving no remaining goodwill or other intangible assets associated with its U.S. consumer loan operations reporting unit.
Administrative Expenses, Interest, Taxes and Income
Administrative expenses were flat at
$54,758,000
during fiscal
2015
compared to
$54,586,000
during fiscal
2014
, primarily as a result of a
19%
decline in the average value of the Mexican peso which reduced administrative expenses in Mexico, and reduced incentive compensation expense related to current year operating results, partially offset by a
9%
increase in the weighted-average store count resulting in additional management and supervisory compensation and other support expenses required for such growth. As a percentage of revenue, administrative expenses were
8%
during fiscal
2015
and
2014
.
Interest expense increased to
$16,887,000
during fiscal
2015
compared to
$13,527,000
for fiscal
2014
, primarily due to the issuance of the Company's 6.75% senior notes in March 2014 and, to a lesser extent, an increase in the amount outstanding on the Company’s 2015 Credit Facility, as defined below. See “—Liquidity and Capital Resources.”
For fiscal
2015
and
2014
, the Company’s effective federal income tax rates were
30.8%
and
27.0%
, respectively. The Company recognized an estimated non-recurring income tax benefit of $5,841,000 during fiscal 2014 as a result of a change in its estimated U.S. federal liability associated with the 2013 termination of its election to include foreign subsidiaries in its consolidated U.S. federal income tax return. Excluding the non-recurring net benefits, the consolidated tax rate for fiscal 2014 was 32.0%.
Net income decreased
29%
to
$60,710,000
during fiscal
2015
compared to
$85,166,000
during fiscal
2014
. The decrease was primarily due to the non-cash goodwill impairment and other non-recurring charges related to the Company’s U.S. consumer loan operations, the weaker value of the Mexican peso versus the U.S. dollar, the continued declines in non-core jewelry scrapping and non-core payday lending operations and an increase in interest expense primarily due to the issuance of the Company’s 6.75% senior notes in March 2014. These decreases were partially offset by the continued growth in core pawn operations, a non-recurring tax benefit and a reduction in incentive compensation expense. Comprehensive income decreased
60%
to
$22,578,000
during fiscal
2015
compared to
$56,649,000
during fiscal
2014
, as a result of the translation of the Company’s net assets denominated in local currencies into U.S. dollars as of
December 31, 2015
.
43
Twelve Months Ended December 31,
2014
Compared to Twelve Months Ended December 31,
2013
.
The following table details the components of the Company’s revenue for the fiscal year ended December 31, 2014 as compared to the fiscal year ended December 31, 2013 (in thousands). Constant currency results exclude the effects of foreign currency translation and are calculated by translating current year results at prior year average exchange rates. The average value of the Mexican peso to the U.S. dollar decreased 4% from 12.8 to 1 during fiscal 2013 to 13.3 to 1 during fiscal 2014. The end-of-period value of the Mexican peso to the U.S. dollar decreased 12%, from 13.1 to 1 at December 31, 2013 to 14.7 to 1 at December 31, 2014. As a result of these currency exchange movements, revenue from Mexican operations translated into fewer U.S. dollars relative to the prior year, and net assets of Mexican operations as of year end translated into fewer U.S. dollars relative to the prior year end. While the strength of the U.S. dollar compared to the Mexican peso decreased the translated dollar-value of revenue generated in Mexico, the cost of sales and operating expenses decreased as well. The scrap jewelry generated in Mexico was exported and sold in U.S. dollars, which did not contribute to the Company’s peso-denominated revenue stream. For the year ended December 31, 2014, the Company’s Latin American revenues and net income would have been approximately $15,269,000 and $2,100,000 higher, respectively, had foreign currency exchange rates remained consistent with those for the year ended December 31, 2013. See “—Non-GAAP Financial Information—Constant Currency Results” below.
|
Constant Currency Basis
|
||||||||||||||||||
|
Year Ended
|
||||||||||||||||||
|
December 31,
|
Increase /
|
|||||||||||||||||
|
Year Ended December 31,
|
Increase /
|
2014
|
(Decrease)
|
|||||||||||||||
|
|
2014
|
2013
|
(Decrease)
|
(Non-GAAP)
|
(Non-GAAP)
|
|||||||||||||
|
U.S. revenue:
|
|
|
|
|
||||||||||||||
|
Retail merchandise sales
|
$
|
172,354
|
|
$
|
139,469
|
|
24
|
%
|
$
|
172,354
|
|
24
|
%
|
|||||
|
Pawn loan fees
|
89,952
|
|
79,398
|
|
13
|
%
|
89,952
|
|
13
|
%
|
||||||||
|
Consumer loan and credit services fees
|
34,051
|
|
40,378
|
|
(16
|
)%
|
34,051
|
|
(16
|
)%
|
||||||||
|
Wholesale scrap jewelry sales
|
28,243
|
|
38,617
|
|
(27
|
)%
|
28,243
|
|
(27
|
)%
|
||||||||
|
|
324,600
|
|
297,862
|
|
9
|
%
|
324,600
|
|
9
|
%
|
||||||||
|
Latin America revenue:
|
|
|
|
|
|
|||||||||||||
|
Retail merchandise sales
|
255,828
|
|
227,718
|
|
12
|
%
|
266,445
|
|
17
|
%
|
||||||||
|
Pawn loan fees
|
109,405
|
|
102,157
|
|
7
|
%
|
113,946
|
|
12
|
%
|
||||||||
|
Consumer loan and credit services fees
|
2,698
|
|
3,403
|
|
(21
|
)%
|
2,810
|
|
(17
|
)%
|
||||||||
|
Wholesale scrap jewelry sales
|
20,346
|
|
29,708
|
|
(32
|
)%
|
20,346
|
|
(32
|
)%
|
||||||||
|
|
388,277
|
|
362,986
|
|
7
|
%
|
403,547
|
|
11
|
%
|
||||||||
|
Total revenue:
|
|
|
|
|
|
|||||||||||||
|
Retail merchandise sales
|
428,182
|
|
367,187
|
|
17
|
%
|
438,799
|
|
20
|
%
|
||||||||
|
Pawn loan fees
|
199,357
|
|
181,555
|
|
10
|
%
|
203,898
|
|
12
|
%
|
||||||||
|
Consumer loan and credit services fees
|
36,749
|
|
43,781
|
|
(16
|
)%
|
36,861
|
|
(16
|
)%
|
||||||||
|
Wholesale scrap jewelry sales
|
48,589
|
|
68,325
|
|
(29
|
)%
|
48,589
|
|
(29
|
)%
|
||||||||
|
|
$
|
712,877
|
|
$
|
660,848
|
|
8
|
%
|
$
|
728,147
|
|
10
|
%
|
|||||
U.S. revenue accounted for approximately 46% of the total revenue for fiscal 2014, while Latin America revenue accounted for approximately 54% of total revenue. On a constant currency basis, Latin America revenue accounted for approximately
55%
of total revenue for fiscal 2014, while U.S. revenue accounted for approximately
45%
of the total revenue.
44
The following table details customer loans and inventories held by the Company and active CSO Program credit extensions from the Independent Lender as of December 31, 2014 as compared to December 31, 2013 (in thousands). Constant currency results exclude the effects of foreign currency translation and are calculated by translating current-year balances at the prior-year end-of-period exchange rate.
|
Constant Currency Basis
|
||||||||||||||||||
|
Balance at
|
||||||||||||||||||
|
December 31,
|
Increase /
|
|||||||||||||||||
|
Balance at December 31,
|
Increase /
|
2014
|
(Decrease)
|
|||||||||||||||
|
|
2014
|
2013
|
(Decrease)
|
(Non-GAAP)
|
(Non-GAAP)
|
|||||||||||||
|
U.S.:
|
|
|
|
|
||||||||||||||
|
Pawn loans
|
$
|
68,100
|
|
$
|
65,716
|
|
4
|
%
|
$
|
68,100
|
|
4
|
%
|
|||||
|
CSO credit extensions held by independent third-party (1)
|
10,421
|
|
12,240
|
|
(15
|
)%
|
10,421
|
|
(15
|
)%
|
||||||||
|
Other consumer loans
|
790
|
|
832
|
|
(5
|
)%
|
790
|
|
(5
|
)%
|
||||||||
|
Combined customer loans (2)
|
79,311
|
|
78,788
|
|
1
|
%
|
79,311
|
|
1
|
%
|
||||||||
|
Latin America:
|
|
|
|
|
|
|||||||||||||
|
Pawn loans
|
50,436
|
|
49,518
|
|
2
|
%
|
56,816
|
|
15
|
%
|
||||||||
|
Other consumer loans
|
451
|
|
618
|
|
(27
|
)%
|
508
|
|
(18
|
)%
|
||||||||
|
Combined customer loans
|
50,887
|
|
50,136
|
|
1
|
%
|
57,324
|
|
14
|
%
|
||||||||
|
Total:
|
|
|
|
|
|
|||||||||||||
|
Pawn loans
|
118,536
|
|
115,234
|
|
3
|
%
|
124,916
|
|
8
|
%
|
||||||||
|
CSO credit extensions held by independent third-party (1)
|
10,421
|
|
12,240
|
|
(15
|
)%
|
10,421
|
|
(15
|
)%
|
||||||||
|
Other consumer loans
|
1,241
|
|
1,450
|
|
(14
|
)%
|
1,298
|
|
(10
|
)%
|
||||||||
|
Combined customer loans (2)
|
$
|
130,198
|
|
$
|
128,924
|
|
1
|
%
|
$
|
136,635
|
|
6
|
%
|
|||||
|
Pawn inventories:
|
|
|
|
|
||||||||||||||
|
U.S.
|
$
|
49,969
|
|
$
|
40,910
|
|
22
|
%
|
$
|
49,969
|
|
22
|
%
|
|||||
|
Latin America
|
41,119
|
|
36,883
|
|
11
|
%
|
46,321
|
|
26
|
%
|
||||||||
|
Combined inventories
|
$
|
91,088
|
|
$
|
77,793
|
|
17
|
%
|
$
|
96,290
|
|
24
|
%
|
|||||
(1) CSO Program amounts outstanding are composed of the principal portion of active CSO Program extensions of credit by the Independent Lender, which are not included on the Company’s balance sheet, net of the Company’s estimated fair value of its liability under the letters of credit guaranteeing the extensions of credit.
|
(2)
|
Combined customer loans is a non-GAAP measure as it includes CSO credit extensions held by the Independent Lender not included on the Company’s balance sheet. The Company believes this non-GAAP measure provides investors with important information needed to evaluate the magnitude of potential loan losses and the opportunity for revenue performance of the consumer loan portfolio on an aggregate basis. The Company also believes the comparison of the aggregate amounts from period to period is more meaningful than comparing only the amounts reflected on the Company’s balance sheet since both credit services fee revenue and the corresponding loss provision are impacted by the aggregate amount of loans owned by the Company and those guaranteed by the Company as reflected in its financial statements.
|
45
The following tables detail the composition of pawn collateral and the average outstanding pawn loan receivable as of December 31,
2014
as compared to December 31,
2013
.
|
Balance at December 31,
|
||||||
|
|
2014
|
2013
|
||||
|
Composition of pawn collateral:
|
||||||
|
U.S. pawn loans:
|
|
|
||||
|
General merchandise
|
44
|
%
|
40
|
%
|
||
|
Jewelry
|
56
|
%
|
60
|
%
|
||
|
|
100
|
%
|
100
|
%
|
||
|
Latin America pawn loans:
|
|
|
||||
|
General merchandise
|
88
|
%
|
87
|
%
|
||
|
Jewelry
|
12
|
%
|
13
|
%
|
||
|
|
100
|
%
|
100
|
%
|
||
|
Total pawn loans:
|
|
|
||||
|
General merchandise
|
62
|
%
|
61
|
%
|
||
|
Jewelry
|
38
|
%
|
39
|
%
|
||
|
|
100
|
%
|
100
|
%
|
||
|
Constant Currency Basis
|
||||||||||||||||||
|
Balance at
|
||||||||||||||||||
|
December 31,
|
Increase /
|
|||||||||||||||||
|
Balance at December 31,
|
Increase /
|
2014
|
(Decrease)
|
|||||||||||||||
|
|
2014
|
2013
|
(Decrease)
|
(Non-GAAP)
|
(Non-GAAP)
|
|||||||||||||
|
Average outstanding pawn loan amount:
|
||||||||||||||||||
|
U.S. pawn loans
|
$
|
171
|
|
$
|
171
|
|
—
|
%
|
$
|
171
|
|
—
|
%
|
|||||
|
Latin America pawn loans
|
67
|
|
71
|
|
(6
|
)%
|
75
|
|
6
|
%
|
||||||||
|
Total pawn loans
|
103
|
|
107
|
|
(4
|
)%
|
108
|
|
1
|
%
|
||||||||
Retail Merchandise Sales Operations
Total retail merchandise sales increased 17% (20% on a constant currency basis) to $428,182,000 during fiscal 2014 compared to $367,187,000 for fiscal 2013. The increased retail merchandise sales in the Company’s pawn stores reflected store additions, maturation of existing stores and an increase in retail inventories. During fiscal 2014, the gross profit margin on retail merchandise sales was 39% compared to a margin of 40% on retail merchandise sales during fiscal 2013.
Pawn inventories increased from $77,793,000 at December 31, 2013 to $91,088,000 at December 31, 2014, largely as a result of the 10% increase in the weighted-average store count in fiscal 2014, which included certain acquired stores that carried significant levels of inventory and the maturation of existing stores. At December 31, 2014, the Company’s pawn inventories were composed of 30% jewelry (primarily gold jewelry held for retail sale), 41% electronics and appliances, 10% tools, 7% sporting goods and 12% other. At December 31, 2013, the Company’s pawn inventories were composed of 34% jewelry (primarily gold jewelry held for retail sale), 41% electronics and appliances, 10% tools, 2% sporting goods and 13% other. At December 31, 2014, 95% of total inventories had been held for one year or less, while 5% had been held for more than one year. At December 31, 2013, 97% of total inventories had been held for one year or less, while 3% had been held for more than one year. The increase in aged inventory (inventory held for more than one year) is primarily a result of recent acquisition activity. Excluding stores acquired during fiscal 2014, aged inventories represented 3% of total inventories at December 31, 2014.
46
Pawn Lending Operations
Pawn loan fees increased 10% (12% on a constant currency basis) to $199,357,000 during fiscal 2014 compared to $181,555,000 for fiscal 2013. The increase in pawn loan fees was consistent with the increase in total outstanding pawn receivables and an increase in the effective yield on pawn loans. Consolidated pawn receivables as of December 31, 2014 increased 3% (8% on a constant currency basis) compared to December 31, 2013, primarily from store additions, maturation of existing stores and a 1% increase in the average loan amount outstanding (constant currency basis). Consolidated same-store pawn receivables (on a constant currency basis) declined 1% in total, resulting from a 5% decline in the U.S. and a 4% increase in Latin America as of December 31, 2014 compared to December 31, 2013. The consolidated annualized yield on pawn loans was 164% in fiscal 2014 compared to 163% in the prior year.
Consumer Lending Operations
Service fees from consumer loans and credit services transactions (collectively also known as payday loans) decreased 16% (on both a reported and a constant currency basis) to $36,749,000 during fiscal 2014 compared to $43,781,000 for fiscal 2013. The Company attributes the decrease in part to increased competition and regulatory restrictions in certain Texas markets coupled with the closing of certain consumer loan locations in Texas. Consumer/payday loan-related products comprised 5% of total revenue during fiscal 2014 compared to 7% for fiscal 2013.
The Company’s consumer loan and credit services loss provision of $9,287,000 was 25% of consumer loan and credit services fee revenue during fiscal 2014 compared to $11,368,000, or 26%, during fiscal 2013. The estimated fair value of liabilities under the CSO Program letters of credit, net of anticipated recoveries from customers, was $493,000, or 4.5% of the gross loan balance, at December 31, 2014 compared to $580,000, or 4.5% of the gross loan balance, at December 31, 2013, which is included as a component of the Company’s accrued liabilities. The Company’s loss reserve on consumer loans was $81,000, or 6.1% of the gross loan balance, at December 31, 2014 compared to $84,000, or 5.5% of the gross loan balance, at December 31, 2013.
Wholesale Scrap Jewelry Operations
Revenue from wholesale scrap jewelry operations decreased 29% to $48,589,000 during fiscal 2014 compared to $68,325,000 during fiscal 2013. Wholesale scrap jewelry revenue during fiscal 2014 consisted primarily of gold sales, of which approximately 33,100 ounces were sold at an average selling price of $1,268 per ounce compared to approximately 42,300 ounces of gold sold at an average selling price of $1,423 per ounce in the prior year. The scrap gross profit margin was 16% compared to the prior-year margin of 14%. Scrap jewelry profits accounted for 2% of net revenue (gross profit) for fiscal 2014 compared to 3% in fiscal 2013.
Combined Revenue Results
The increase in year-over-year total revenue of 8% (10% on a constant currency basis) reflected a 14% increase (17% on a constant currency basis) in combined retail sales and pawn fee revenue from new and existing pawn stores, offset by a decrease in non-core wholesale scrap jewelry revenue and consumer loan fees. Same-store core revenue from retail sales and pawn fees increased 2% on a consolidated, constant currency basis from fiscal 2013 to fiscal 2014. Same-store core revenue in Latin America increased 4% (on a constant currency basis), offset by a decrease in same-store core revenue of 3% in the U.S. as compared to the prior year.
Store Operating Expenses
Store operating expenses increased by 10% (12% on a constant currency basis) to $198,986,000 during fiscal 2014 compared to $181,321,000 during fiscal 2013, primarily as a result of a 10% increase in the weighted-average store count, which included a number of large, mature stores added through acquisitions, partially offset by a decline in same-store operating expenses, which decreased 5% on a constant currency basis compared to the prior-year period, and a 4% decline in the average value of the Mexican peso.
The net store profit contribution from continuing operations for fiscal 2014 was $187,311,000, which equates to a store-level operating margin of 26% compared to $175,573,000 and 27% in the prior year, respectively. The decline in the store-level operating margin related primarily to a 23% decrease (30% on a constant currency basis) in net revenue from wholesale scrap jewelry and a 15% decrease (on a reported and a constant currency basis) in net revenue from payday lending.
47
Administrative Expenses, Interest, Taxes and Income
Administrative expenses increased 10% to $54,586,000 during fiscal 2014 compared to $49,530,000 during fiscal 2013, primarily as a result of increased incentive compensation expense in fiscal 2014 as compared to fiscal 2013 and a 10% increase in the weighted-average store count resulting in additional management and supervisory compensation and other support expenses required for such growth. This increase was offset by a 4% decline in the average value of the Mexican peso. As a percentage of revenue, administrative expenses increased from 7% during fiscal 2013 to 8% during fiscal 2014.
Interest expense increased to $13,527,000 during fiscal 2014 compared to $3,492,000 for fiscal 2013, reflecting an increase in the amount of outstanding debt and the higher interest rate of the Company's 6.75% senior notes issued in March 2014 as compared to the revolving line of credit.
For fiscal 2014 and 2013, the Company’s effective federal income tax rates were 27.0% and 29.7%, respectively. In July 2013, the Company terminated an election to include foreign subsidiaries in its consolidated U.S. federal income tax return (the “Tax Restructuring”) and it is the Company’s intent to indefinitely reinvest the earnings of these subsidiaries outside the U.S. As a result of the Tax Restructuring, the Company recognized an estimated non-recurring net income tax benefit of approximately $3,979,000 during fiscal 2013 consisting of a $3,436,000 income tax benefit from the elimination of certain U.S. deferred tax liabilities associated with foreign operations and an estimated $5,398,000 income tax benefit arising from the recognition of certain foreign deferred tax assets, partially offset by an estimated $4,855,000 in additional U.S. income tax expense. In 2014, the Company prepared and filed federal income tax returns in both the U.S. and Mexico for the fiscal 2013 tax year which reflected the effects of the Tax Restructuring, including changes in certain previously estimated current and deferred tax amounts. As a result, the Company recorded fiscal 2014 non-recurring income tax benefits of $3,742,000 from the change in estimated U.S. income tax liabilities related to the Tax Restructuring and $2,099,000 from the recognition of additional estimated foreign deferred tax assets as a result of the Tax Restructuring. Excluding the non-recurring net benefits, the consolidated tax rate was 32.0% and 33.0% for fiscal 2014 and 2013, respectively.
Income from continuing operations increased 1% to $85,438,000 during fiscal 2014 compared to $84,479,000 during fiscal 2013, primarily as a result of increased income from operations and a lower effective tax rate which was largely offset by increased interest expense associated with the $200,000,000 offering of 6.75% senior notes in March 2014. Net income was $85,166,000 during fiscal 2014 compared to $83,846,000 during fiscal 2013, which included the results of discontinued operations. Comprehensive income decreased 28% to $56,649,000 during fiscal 2014 compared to $79,025,000 during fiscal 2013, as a result of the translation of the Company’s net assets denominated in local currencies into U.S. dollars as of December 31, 2014.
Liquidity and Capital Resources
As of
December 31, 2015
, the Company’s primary sources of liquidity were
$86,954,000
in cash and cash equivalents,
$162,000,000
of available and unused funds under the Company's long-term lines of credit with its commercial lenders,
$135,125,000
in customer loans and pawn loan fees and service charges receivable and
$93,458,000
in inventories. As of
December 31, 2015
, the amount of cash associated with indefinitely reinvested foreign earnings was approximately $77,067,000, which is primarily held in Mexican pesos. The Company had working capital of
$279,259,000
as of
December 31, 2015
and total equity exceeded liabilities by a ratio of
1.3
to 1.
On March 24, 2014, the Company issued $200,000,000 of 6.75% senior notes due on April 1, 2021 (the “Notes”). Interest on the Notes is payable semi-annually in arrears on April 1 and October 1. The Notes are fully and unconditionally guaranteed on a senior unsecured basis jointly and severally by all of the Company's existing and future domestic subsidiaries that guarantee the 2015 Credit Facility. The Notes permit the Company to make certain restricted payments, such as repurchasing shares of its stock and paying cash dividends, within certain parameters, the most restrictive of which generally limits such restricted payments to 50% of adjusted net income.
During the period from January 1, 2015 through October 29, 2015, the Company maintained a revolving line of credit agreement with a group of U.S. based commercial lenders (the “2014 Credit Facility”) in the amount of $160,000,000, which was scheduled to mature in February 2019. The 2014 Credit Facility charged interest, at the Company’s option, at either (1) the prevailing London Interbank Offered Rate (“LIBOR”) (with interest periods of 1, 2, 3 or 6 months at the Company’s option) plus a fixed spread of 2.5% or (2) the prevailing prime or base rate plus a fixed spread of 1.5%.
48
On October 30, 2015, the Company entered into an agreement to amend and extend the 2014 Credit Facility (as amended, the “2015 Credit Facility”). The total lender commitment under the 2015 Credit Facility was increased from $160,000,000 to
$210,000,000
and the number of participating lenders increased from four to five. Additionally, the term of the 2015 Credit Facility was extended through
October 2020
. At
December 31, 2015
, the Company had
$58,000,000
outstanding under the 2015 Credit Facility and
$152,000,000
was available for borrowings. The 2015 Credit Facility continues to bear interest, at the Company’s option, at either (i) the prevailing LIBOR (with interest periods of 1, 2, 3 or 6 months at the Company’s option) plus a fixed spread of 2.5% or (ii) the prevailing prime or base rate plus a fixed spread of 1.5%. The 2015 Credit Facility establishes a minimum LIBOR rate of 0%. The weighted-average interest rate on amounts outstanding under the 2015 Credit Facility at
December 31, 2015
was
2.83%
based on the prevailing 30-day LIBOR rate. The 2015 Credit Facility requires the Company to maintain certain financial ratios and comply with certain financial covenants and allows the Company to make certain restricted payments, such as repurchasing shares of its stock and paying cash dividends, within certain parameters, provided the Company maintains compliance with those financial ratios and covenants after giving effect to such restricted payments. The Company is required to pay an annual commitment fee of 0.50% on the average daily unused portion of the 2015 Credit Facility commitment. The 2015 Credit Facility limits the Company’s ability to incur additional indebtedness, subject to customary exceptions, including permitted additional unsecured debt so long as the aggregate principal amount of the loans and commitments under the 2015 Credit Facility plus such additional unsecured debt plus foreign third-party loans does not in the aggregate exceed $500,000,000. The 2015 Credit Facility is unsecured except for the pledge of 65% of the voting equity interests of the Company’s foreign subsidiaries, and the Company is restricted from pledging any of its other assets as collateral against other indebtedness. The 2015 Credit Facility is guaranteed by the Company’s material U.S. operating subsidiaries. The 2015 Credit Facility reduced the threshold percentage of domestic operations represented by domestic guarantors from 90% to 85% of total domestic revenues and assets, and the Company added two additional domestic operating subsidiaries as guarantors of the 2015 Credit Facility. The 2015 Credit Facility eliminated an adjustment for deferred tax effects from the fixed charge covenant calculation. The Company was in compliance with the requirements and covenants of the 2015 Credit Facility as of
December 31, 2015
, and it believes it has the capacity to borrow the full amount available under the 2015 Credit Facility under the most restrictive covenant. During fiscal
2015
, the Company
had net proceeds
of
$35,600,000
from borrowings pursuant to
the 2015 Credit Facility.
On March 9, 2015, the Company entered into an agreement with a bank in Mexico to establish a revolving credit facility (the “Mexico Credit Facility”) in the amount of
$10,000,000
. The Mexico Credit Facility bears interest at the prevailing 30-day LIBOR rate plus a fixed spread of
2.0%
and matures in
December 2017
. Under the terms of the Mexico Credit Facility, the Company is required to maintain certain financial ratios and comply with certain financial covenants. The Company is required to pay a one-time commitment fee of $25,000 due when the first amount is drawn/borrowed. At
December 31, 2015
, the Company had no amount outstanding under the Mexico Credit Facility and
$10,000,000
was available for borrowings.
In general, revenue growth is dependent upon the Company’s ability to fund growth of store locations, customer loan balances and inventories. In addition to these factors, changes in loan balances, collection of pawn fees, merchandise sales, inventory levels, operating expenses, administrative expenses, tax rates, gold prices, foreign currency exchange rates and the pace of new store expansions and acquisitions affect the Company’s liquidity. Management believes cash on hand, the borrowings available under its credit facilities, anticipated cash generated from operations (including the normal seasonal increases in operating cash flows occurring in the first and fourth quarters) and other current working capital will be sufficient to meet the Company’s anticipated capital requirements for its business for at least the next twelve months. Where appropriate or desirable, in connection with the Company’s efficient management of its liquidity position, the Company could seek to raise additional funds from a variety of sources, including the sale of assets, reductions in capital spending, the issuance of debt or equity securities and/or changes to its management of current assets. The characteristics of the Company’s current assets, specifically the ability to rapidly liquidate gold jewelry inventory and adjust outflows of cash in its lending practices, gives the Company flexibility to quickly modify its business strategy to increase cash flow from its business, if necessary. Regulatory developments affecting the Company’s operations may also impact profitability and liquidity. See “—Item 1—Business-Governmental Regulation.”
The following tables set forth certain historical information with respect to the Company’s sources and uses of cash and other key indicators of liquidity (dollar amounts in thousands):
|
Year Ended December 31,
|
||||||||||||
|
2015
|
2014
|
2013
|
||||||||||
|
Cash flow provided by operating activities
|
$
|
92,749
|
|
$
|
97,679
|
|
$
|
106,718
|
|
|||
|
Cash flow used in investing activities
|
$
|
(71,676
|
)
|
$
|
(85,366
|
)
|
$
|
(140,726
|
)
|
|||
|
Cash flow provided by (used in) financing activities
|
$
|
9,127
|
|
$
|
(9,098
|
)
|
$
|
54,644
|
|
|||
49
|
Balance at December 31,
|
||||||||||||
|
2015
|
2014
|
2013
|
||||||||||
|
Working capital (1)
|
$
|
279,259
|
|
$
|
258,194
|
|
$
|
236,417
|
|
|||
|
Current ratio (1)
|
7.05x
|
|
7.07x
|
|
5.85x
|
|
||||||
|
Liabilities to equity (1)
|
75
|
%
|
65
|
%
|
61
|
%
|
||||||
|
Inventory turns
|
3.4x
|
|
3.6x
|
|
3.6x
|
|
||||||
|
(1)
|
Prior year amounts have been revised or reclassified. See Note
2
of Notes to Consolidated Financial Statements for further information.
|
Net cash provided by operating activities decreased
$4,930,000
, or
5%
, from
$97,679,000
for fiscal
2014
to
$92,749,000
for fiscal
2015
, due primarily to a decrease in net income of $24,456,000 partially offset by the $7,913,000 non-cash goodwill impairment charge and other net changes in certain operating assets and liabilities (as noted in the statements of cash flows).
Net cash used in investing activities decreased
$13,690,000
, or
16%
, from
$85,366,000
during fiscal
2014
to
$71,676,000
during fiscal
2015
. Cash flows from investing activities are utilized primarily to fund pawn store acquisitions, growth of pawn loans and purchases of property and equipment. The Company paid
$46,887,000
in cash related to acquisitions during fiscal
2015
compared to
$58,942,000
in fiscal
2014
. The Company funded
$3,716,000
of loans in fiscal
2015
compared to
$2,470,000
of loans in fiscal
2014
.
Net cash provided by financing activities increased
$18,225,000
, or
200%
, from net cash used in financing activities of
$9,098,000
for fiscal
2014
to net cash provided by financing activities of
$9,127,000
for fiscal
2015
. Net payments on the Company’s credit facilities were $159,600,000 during fiscal 2014 compared to net proceeds of $35,600,000 during fiscal 2015. The Company also paid $407,000 and $1,410,000 of debt issuance costs related to the Company’s credit facilities during fiscal 2015 and 2014, respectively. The Company received proceeds from the offering of the Notes of $200,000,000 and paid $5,200,000 of related debt issuance costs during fiscal 2014. The Company repurchased shares of its common stock (
$39,974,000
during fiscal
2015
compared to
$43,947,000
during fiscal
2014
), and realized proceeds from the exercise of stock options and the related tax benefit of
$15,021,000
during fiscal
2015
compared to
$9,411,000
during fiscal
2014
. During fiscal
2015
, the Company paid the statutory minimum withholding taxes on the net share settlement of certain stock options exercised in the amount of
$1,113,000
.
During fiscal
2015
, the Company opened 38 new pawn stores in Mexico, acquired 33 pawn stores in the U.S. and acquired 32 pawn stores in Guatemala. The purchase price of the
2015
acquisitions, net of cash acquired, was
$46,037,000
and was composed of $45,462,000 in cash paid during fiscal 2015 and an additional $575,000 payable on or before June 2016. During fiscal
2015
, the Company paid $1,425,000 of amounts payable related to prior-year acquisitions. The Company funded
$21,073,000
in capital expenditures, primarily for new stores, during fiscal
2015
and could fund capital expenditures at a similar rate in
2016
. Acquisition purchase prices, capital expenditures, working capital requirements and start-up losses related to this expansion have been primarily funded through cash balances, operating cash flows and the Company’s credit facilities. The Company’s cash flow and liquidity available to fund expansion in
2015
included net cash flow from operating activities of
$92,749,000
for fiscal
2015
.
The Company intends to continue expansion primarily through acquisitions and new store openings. For
2016
, the Company expects to add approximately
210
to
225
stores of which at least 190 additions have already or are expected to occur in the first quarter. Management believes cash on hand, the amounts available to be drawn under the credit facilities and cash generated from operations will be sufficient to accommodate the Company’s current operations and store expansion plans for
2016
.
The Company continually looks for, and is presented with, potential acquisition opportunities. The Company acquired 166 stores in Mexico in January 2016 and 13 stores in El Salvador in February 2016 for a combined purchase price of approximately $34,555,000, net of cash acquired and before certain post-closing adjustments. In addition, the Company assumed approximately $7,000,000 in net debt from these acquisitions and the entire balance was paid-off in January 2016. The all-cash transaction was funded entirely with Mexican pesos generated from operations in Mexico. The Company currently has no other contractual commitments for materially significant future acquisitions or other capital commitments. The Company will evaluate potential acquisitions based upon growth potential, purchase price, available liquidity, strategic fit and quality of management personnel, among other factors. If the Company encounters an attractive opportunity to acquire new stores in the near future, the Company may seek additional financing, the terms of which will be negotiated on a case-by-case basis.
50
In January 2016, the Company’s Board of Directors approved the initiation of a cash dividend payment at an annual rate of $0.50 per share to be paid quarterly. The first quarterly dividend payment is expected to be paid on March 15, 2016 to shareholders of record as of March 1, 2016. The declaration and payment of cash dividends in the future (quarterly or otherwise) will be made by the Board of Directors, from time to time, subject to the Company’s financial condition, results of operations, business requirements, compliance with legal requirements and debt covenant restrictions.
In January 2015, the Company’s Board of Directors authorized a common stock repurchase program for up to 2,000,000 shares of the Company’s outstanding common stock. During fiscal
2015
, the Company repurchased
852,000
shares of its common stock at an aggregate cost of
$39,974,000
at an average price of
$46.94
per share and
1,148,000
shares remain available for repurchase under the repurchase program. The number of shares to be purchased and the timing of the purchases are based on a variety of factors, including, but not limited to, the level of cash balances, credit availability, debt covenant restrictions, general business conditions, regulatory requirements, the market price of the Company's stock and the availability of alternative investment opportunities. No time limit was set for completion of repurchases under the new authorization and the program may be suspended or discontinued at any time.
Non-GAAP Financial Information
The Company uses certain financial calculations such as adjusted net income, adjusted net income per share, adjusted EBITDA, free cash flow and constant currency results (as defined or explained below) as factors in the measurement and evaluation of the Company’s operating performance and period-over-period growth. The Company derives these financial calculations on the basis of methodologies other than GAAP, primarily by excluding from a comparable GAAP measure certain items that the Company does not consider to be representative of its actual operating performance. These financial calculations are “non-GAAP financial measures” as defined in SEC rules. The Company uses these financial calculations in operating its business because management believes they are less susceptible to variances in actual operating performance that can result from the excluded items and other infrequent charges. The Company presents these financial measures to investors because management believes they are useful to investors in evaluating the primary factors that drive the Company’s operating performance and because management believes they provide greater transparency into the Company’s results of operations. However, items that are excluded and other adjustments and assumptions that are made in calculating adjusted net income, adjusted net income per share, adjusted EBITDA, free cash flow and constant currency results are significant components in understanding and assessing the Company’s financial performance. These non-GAAP financial measures should be evaluated in conjunction with, and are not a substitute for, the Company’s GAAP financial measures. Further, because these non-GAAP financial measures are not determined in accordance with GAAP and are thus susceptible to varying calculations, adjusted net income, adjusted net income per share, adjusted EBITDA, free cash flow and constant currency results, as presented, may not be comparable to other similarly titled measures of other companies.
51
Adjusted Net Income and Adjusted Net Income Per Share
Management believes the presentation of adjusted net income and adjusted net income per share (“Adjusted Income Measures”) provides investors with greater transparency and provides a more complete understanding of the Company’s financial performance and prospects for the future. In addition, management believes the adjustments shown below are useful to investors in order to allow them to compare the Company’s financial results for the current periods presented with the prior periods presented.
The following table provides a reconciliation between the net income and diluted earnings per share calculated in accordance with GAAP to the Adjusted Income Measures, which are shown net of tax (unaudited, in thousands, except per share data):
|
Year Ended December 31,
|
|||||||||||||||||||||||
|
|
2015
|
2014
|
2013
|
||||||||||||||||||||
|
In
Thousands
|
Per Share
|
In
Thousands
|
Per Share
|
In
Thousands
|
Per Share
|
||||||||||||||||||
|
Net income, as reported
|
$
|
60,710
|
|
$
|
2.14
|
|
$
|
85,166
|
|
$
|
2.93
|
|
$
|
83,846
|
|
$
|
2.84
|
|
|||||
|
Adjustments, net of tax:
|
|||||||||||||||||||||||
|
Non-recurring restructuring expenses related to U.S. consumer loan operations
|
5,784
|
|
0.21
|
|
—
|
|
—
|
|
—
|
|
—
|
|
|||||||||||
|
Non-recurring store acquisition expenses
|
1,989
|
|
0.07
|
|
679
|
|
0.02
|
|
1,645
|
|
0.06
|
|
|||||||||||
|
Non-recurring tax benefit
|
—
|
|
—
|
|
(5,841
|
)
|
(0.20
|
)
|
(3,979
|
)
|
(0.14
|
)
|
|||||||||||
|
Adjusted net income
|
$
|
68,483
|
|
$
|
2.42
|
|
$
|
80,004
|
|
$
|
2.75
|
|
$
|
81,512
|
|
$
|
2.76
|
|
|||||
The following tables provide a reconciliation of the gross amounts, the impact of income taxes and the net amounts for each of the adjustments included in the table above (unaudited, in thousands):
|
Year Ended December 31,
|
|||||||||||||||||||||||||||||||||||
|
|
2015
|
2014
|
2013
|
||||||||||||||||||||||||||||||||
|
Pre-tax
|
Tax
|
After-tax
|
Pre-tax
|
Tax
|
After-tax
|
Pre-tax
|
Tax
|
After-tax
|
|||||||||||||||||||||||||||
|
Non-recurring restructuring expenses related to U.S. consumer loan operations
|
$
|
8,878
|
|
$
|
3,094
|
|
$
|
5,784
|
|
$
|
—
|
|
$
|
—
|
|
$
|
—
|
|
$
|
—
|
|
$
|
—
|
|
$
|
—
|
|
||||||||
|
Non-recurring store acquisition expenses
|
2,875
|
|
886
|
|
1,989
|
|
998
|
|
319
|
|
679
|
|
2,350
|
|
705
|
|
1,645
|
|
|||||||||||||||||
|
Non-recurring tax benefit
|
—
|
|
—
|
|
—
|
|
—
|
|
5,841
|
|
(5,841
|
)
|
—
|
|
3,979
|
|
(3,979
|
)
|
|||||||||||||||||
|
Total adjustments
|
$
|
11,753
|
|
$
|
3,980
|
|
$
|
7,773
|
|
$
|
998
|
|
$
|
6,160
|
|
$
|
(5,162
|
)
|
$
|
2,350
|
|
$
|
4,684
|
|
$
|
(2,334
|
)
|
||||||||
Adjusted Earnings Before Interest, Taxes, Depreciation and Amortization
The Company defines adjusted EBITDA as net income before income taxes, depreciation and amortization, interest expense, interest income and non-recurring charges as listed below. The Company believes adjusted EBITDA is commonly used by investors to assess a company’s leverage capacity, liquidity and financial performance. However, adjusted EBITDA has limitations as an analytical tool and should not be considered in isolation or as a substitute for net income or other statement of income data prepared in accordance with GAAP. The following table provides a reconciliation of net income to adjusted EBITDA (unaudited, in thousands):
52
|
Year Ended December 31,
|
|||||||||||
|
2015
|
2014
|
2013
|
|||||||||
|
Net income
|
$
|
60,710
|
|
$
|
85,166
|
|
$
|
83,846
|
|
||
|
Income taxes
|
26,971
|
|
31,542
|
|
35,713
|
|
|||||
|
Depreciation and amortization (1)
|
17,446
|
|
17,476
|
|
15,361
|
|
|||||
|
Interest expense
|
16,887
|
|
13,527
|
|
3,492
|
|
|||||
|
Interest income
|
(1,566
|
)
|
(682
|
)
|
(322
|
)
|
|||||
|
EBITDA
|
120,448
|
|
147,029
|
|
138,090
|
|
|||||
|
Adjustments:
|
|||||||||||
|
Non-recurring restructuring expenses related to U.S. consumer loan operations
|
8,878
|
|
—
|
|
—
|
|
|||||
|
Non-recurring store acquisition expenses
|
2,875
|
|
998
|
|
2,350
|
|
|||||
|
Adjusted EBITDA
|
$
|
132,201
|
|
$
|
148,027
|
|
$
|
140,440
|
|
||
|
Adjusted EBITDA margin calculated as follows:
|
|||||||||||
|
Total revenue
|
$
|
704,602
|
|
$
|
712,877
|
|
$
|
660,848
|
|
||
|
Adjusted EBITDA
|
$
|
132,201
|
|
$
|
148,027
|
|
$
|
140,440
|
|
||
|
Adjusted EBITDA as a percentage of revenue
|
19
|
%
|
21
|
%
|
21
|
%
|
|||||
|
Leverage ratio (indebtedness divided by adjusted EBITDA):
|
|||||||||||
|
Indebtedness
|
$
|
258,000
|
|
$
|
222,400
|
|
$
|
190,352
|
|
||
|
Adjusted EBITDA
|
$
|
132,201
|
|
$
|
148,027
|
|
$
|
140,440
|
|
||
|
Leverage ratio
|
2.0:1
|
|
1.5:1
|
|
1.4:1
|
|
|||||
|
(1)
|
For fiscal 2015, excludes $493,000 of depreciation and amortization, which is included in the non-recurring restructuring expenses related to U.S. consumer loan operations.
|
Free Cash Flow
For purposes of its internal liquidity assessments, the Company considers free cash flow, which is defined as cash flow from operating activities reduced by purchases of property and equipment and net cash outflow from loan receivables. Free cash flow is commonly used by investors as a measure of cash generated by business operations that will be used to repay scheduled debt maturities and can be used to invest in future growth through new business development activities or acquisitions, repurchase stock, pay cash dividends or repay debt obligations prior to their maturities. These metrics can also be used to evaluate the Company’s ability to generate cash flow from business operations and the impact that this cash flow has on the Company’s liquidity. However, free cash flow has limitations as an analytical tool and should not be considered in isolation or as a substitute for cash flow from operating activities, including discontinued operations, or other income statement data prepared in accordance with GAAP. The following table reconciles “net cash flow from operating activities” to “free cash flow” (unaudited, in thousands):
|
Year Ended December 31,
|
|||||||||||
|
2015
|
2014
|
2013
|
|||||||||
|
Cash flow from operating activities
|
$
|
92,749
|
|
$
|
97,679
|
|
$
|
106,718
|
|
||
|
Cash flow from investing activities:
|
|
|
|||||||||
|
Loan receivables
|
(3,716
|
)
|
(2,470
|
)
|
(411
|
)
|
|||||
|
Purchases of property and equipment
|
(21,073
|
)
|
(23,954
|
)
|
(26,672
|
)
|
|||||
|
Free cash flow
|
$
|
67,960
|
|
$
|
71,255
|
|
$
|
79,635
|
|
||
53
Constant Currency Results
The Company’s reporting currency is the U.S. dollar. However, certain performance metrics discussed in this report are presented on a “constant currency” basis, which may be considered a non-GAAP measurement of financial performance. The Company’s management uses constant currency results to evaluate operating results of business operations in Latin America, which are primarily transacted in local currencies. Constant currency results reported herein are calculated by translating certain balance sheet and income statement items denominated in local currencies using the exchange rate from the prior-year comparable period, as opposed to the current comparable period, in order to exclude the effects of foreign currency rate fluctuations for purposes of evaluating period-over-period comparisons. Business operations in Mexico and Guatemala are transacted in Mexican pesos and Guatemalan quetzales, respectively. As the Company acquired its first stores in Guatemala on December 31, 2015, there are no prior year comparisons and the assets and liabilities acquired were translated at an exchange rate of 7.6 Guatemalan quetzales / U.S. dollar. The following table provides exchange rates for the Mexican peso for the current and prior year periods (unaudited):
|
|
2015
|
2014
|
2013
|
|||||||||
|
Mexican peso / U.S. dollar exchange rate:
|
Rate
|
% Change
Over Prior
Year Period
|
Rate
|
% Change
Over Prior
Year Period
|
|
Rate
|
||||||
|
Quarter Ended March 31:
|
||||||||||||
|
End-of-period
|
15.2
|
(16
|
)%
|
13.1
|
(6
|
)%
|
12.4
|
|||||
|
Three months ended
|
14.9
|
(13
|
)%
|
13.2
|
(4
|
)%
|
|
12.7
|
||||
|
Quarter Ended June 30:
|
|
|
||||||||||
|
End-of-period
|
15.6
|
(20
|
)%
|
13.0
|
—
|
%
|
13.0
|
|||||
|
Three months ended
|
15.3
|
(18
|
)%
|
13.0
|
(4
|
)%
|
12.5
|
|||||
|
Quarter Ended September 30:
|
||||||||||||
|
End-of-period
|
17.0
|
(26
|
)%
|
13.5
|
(3
|
)%
|
13.1
|
|||||
|
Three months ended
|
16.4
|
(25
|
)%
|
13.1
|
(2
|
)%
|
12.9
|
|||||
|
Quarter Ended December 31:
|
||||||||||||
|
End-of-period
|
17.2
|
(17
|
)%
|
14.7
|
(12
|
)%
|
13.1
|
|||||
|
Three months ended
|
16.7
|
(21
|
)%
|
13.8
|
(6
|
)%
|
13.0
|
|||||
|
Fiscal Year:
|
||||||||||||
|
End-of-period
|
17.2
|
(17
|
)%
|
14.7
|
(12
|
)%
|
13.1
|
|||||
|
Twelve months ended
|
15.8
|
(19
|
)%
|
13.3
|
(4
|
)%
|
12.8
|
|||||
54
Contractual Commitments
A tabular disclosure of contractual obligations at December 31,
2015
is as follows:
|
Payments Due by Period
|
|||||||||||||||||||
|
(in thousands)
|
|||||||||||||||||||
|
Total
|
Less Than 1 Year
|
1 - 3 Years
|
3 - 5 Years
|
More Than 5 Years
|
|||||||||||||||
|
Operating leases
|
$
|
145,168
|
|
$
|
42,641
|
|
$
|
59,505
|
|
$
|
28,243
|
|
$
|
14,779
|
|
||||
|
Revolving credit facilities (1)
|
58,000
|
|
—
|
|
—
|
|
58,000
|
|
—
|
|
|||||||||
|
Senior unsecured notes
|
200,000
|
|
—
|
|
—
|
|
—
|
|
200,000
|
|
|||||||||
|
Interest on senior unsecured notes
|
74,250
|
|
13,500
|
|
27,000
|
|
27,000
|
|
6,750
|
|
|||||||||
|
Employment contracts
|
8,767
|
|
2,194
|
|
3,473
|
|
1,510
|
|
1,590
|
|
|||||||||
|
Consulting contract with former officer and director of the Company
|
700
|
|
700
|
|
—
|
|
—
|
|
—
|
|
|||||||||
|
Total
|
$
|
486,885
|
|
$
|
59,035
|
|
$
|
89,978
|
|
$
|
114,753
|
|
$
|
223,119
|
|
||||
|
(1)
|
Excludes interest obligations under the Company's revolving credit facilities. See Note
10
of Notes to Consolidated Financial Statements.
|
Off-Balance Sheet Arrangements
The Company offers a fee-based credit services organization program to assist consumers in Texas markets in obtaining extensions of credit. Under the CSO Program, the Company assists customers in applying for a short-term extension of credit from the Independent Lender and issues the Independent Lender a letter of credit to guarantee the repayment of the extension of credit. When a consumer executes a credit services agreement with the Company, the customer agrees to pay a fee to the Company if the Independent Lender approves the extension of credit, and the Company agrees to guarantee the customer’s obligation to repay the extension of credit received by the customer from the Independent Lender if the customer fails to do so.
For extension of credit products originated by the Independent Lender, the Independent Lender is responsible for evaluating each of its customers’ applications, determining whether to approve an extension of credit based on an application and determining the amount of the extension of credit. The Company is not involved in the Independent Lender’s extension of credit approval processes or in determining the lender’s approval procedures or criteria. At December 31,
2015
, the outstanding amount of active extensions of credit originated and held by the Independent Lender was
$7,503,000
.
Since the Company may not be successful in collection of delinquent accounts under the CSO Program, the Company’s consumer loan loss provision includes amounts estimated to be adequate to absorb credit losses from extensions of credit in the aggregate consumer loan portfolio, including those expected to be assigned to the Company or acquired by the Company as a result of its guaranty obligations. Estimated losses of
$498,000
on portfolios owned by the Independent Lender are included in “accrued liabilities” in the consolidated balance sheet as of December 31,
2015
. The Company believes this amount is adequate to absorb credit losses from extensions of credit expected to be assigned to the Company or acquired by the Company as a result of its guaranty obligations.
Inflation
The Company does not believe inflation has had a material effect on the volume of customer loans originated, merchandise sales, or results of operations.
55
Seasonality
The Company’s business is subject to seasonal variations. Therefore, operating results for each quarter and year-to-date period are not necessarily indicative of the results of operations for the full year. Typically, the Company experiences seasonal growth of service fees in the third and fourth quarter of each year due to loan balance growth. Service fees generally decline in the first and second quarter of each year after the heavy repayment period of pawn loans associated with statutory bonuses received by customers in the fourth quarter in Mexico and with tax refund proceeds received by customers in the first quarter in the U.S. Retail sales are seasonally higher in the fourth quarter associated with holiday shopping.
Recent Accounting Pronouncements
See discussion in Note
2
of Notes to Consolidated Financial Statements. The Company does not expect recent accounting pronouncements issued and not yet adopted to have a material effect on the Company’s financial statement disclosures, financial position or results of operations.
Market risks relating to the Company’s operations result primarily from changes in interest rates, gold prices and foreign currency exchange rates. The Company does not engage in speculative or leveraged transactions, nor does it hold or issue financial instruments for trading purposes.
Gold Price Risk
The Company has significant holdings of gold in the form of jewelry inventories and pawn collateral and a significant portion of retail merchandise sales are gold jewelry as are most of the wholesale scrap jewelry sales. At December 31,
2015
, the Company held approximately
$28,972,000
in jewelry inventories, representing
31%
of total inventory. In addition, approximately $43,512,000, or
37%
, of total pawn loans were collateralized by jewelry, which was primarily gold. Of the Company’s total retail merchandise revenue during fiscal
2015
, approximately $80,873,000, or 18%, was gold jewelry sales. Net revenue (gross profit) from jewelry sales in fiscal
2015
was $34,776,000, of which a substantial majority was gold. During fiscal
2015
, the average market price of gold declined by 8%, from $1,266 to $1,160 per ounce. The impact of this decline on operating results for fiscal
2015
is discussed in “Item 7. Management’s Discussion and Analysis of Financial Condition and Results of Operations—Results of Continuing Operations.” A further significant and sustained decline in the price of gold would negatively impact the value of jewelry inventories held by the Company and the value of gold jewelry pledged as collateral by pawn customers. As a result, the Company’s profit margins from the sale of existing jewelry inventories would be negatively impacted, as would the potential profit margins on gold jewelry currently pledged as collateral by pawn customers in the event it was forfeited by the customer. In addition, a decline in gold prices could result in a lower balance of pawn loans outstanding for the Company, as customers would receive lower loan amounts for individual pieces of pledged gold jewelry. The Company believes that many customers would be willing to add additional items of value to their pledge in order to obtain the desired loan amount, thus mitigating a portion of this risk.
Foreign Currency Risk
The financial statements of the Company’s subsidiaries in Mexico and Guatemala are translated into U.S. dollars using period-end exchange rates for assets and liabilities and average exchange rates for revenue and expenses. Adjustments resulting from translating net assets are reported as a separate component of accumulated other comprehensive income (loss) within shareholders’ equity under the caption, “currency translation adjustment.” Exchange rate gains or losses related to foreign currency transactions are recognized as transaction gains or losses in the Company’s income statement as incurred.
Latin America revenues and cost of revenues account for
52%
and
55%
, respectively of consolidated amounts for the year ended December 31,
2015
. The majority of Latin America revenues and a smaller portion of expenses are denominated in currencies other than the U.S. dollar and the Company therefore has foreign currency risk related to these currencies, which are primarily the Mexican peso and to a much lesser extent, the Guatemalan quetzal.
Accordingly, changes in exchange rates, and in particular a weakening of foreign currencies relative to the U.S. dollar, may negatively affect the Company’s revenue and earnings of its Latin America operations as expressed in U.S. dollars. For the year ended December 31,
2015
, the Company’s Latin America revenues and net income would have been approximately $68,106,000 and $9,500,000 higher, respectively, had foreign currency exchange rates remained consistent with those for the year ended December 31,
2014
.
56
The Company does not use foreign exchange contracts or derivatives to hedge any foreign currency exposures. The volatility of exchange rates depends on many factors that it cannot forecast with reliable accuracy. The Company’s continued Latin America expansion increases exposure to exchange rate fluctuations and, as a result, such fluctuations could have a significant impact on future results of operations. The average value of the Mexican peso to the U.S. dollar exchange rate for fiscal 2015 was 15.8 to 1, compared to 13.3 to 1 in fiscal 2014 and 12.8 to 1 in fiscal 2013. In fiscal 2016, through
February 12, 2016
, the average exchange rate was 18.1 to 1, which equates to a 15% decline as compared to the average value for fiscal 2015 of 15.8 to 1.
Interest Rate Risk
The Company is potentially exposed to market risk in the form of interest rate risk in regards to its long-term lines of credit. At December 31,
2015
, the Company had
$58,000,000
outstanding under its revolving lines of credit. The revolving lines of credit are generally priced with a variable rate based on the 30-day LIBOR plus a fixed spread. Based on the average outstanding indebtedness during fiscal
2015
, a 1% (100 basis points) increase in interest rates would have increased the Company’s interest expense by approximately $490,000 for fiscal
2015
.
Interest rate fluctuations will generally not affect the Company’s future earnings or cash flows on its fixed rate debt unless such instruments mature or are otherwise terminated. However, interest rate changes will affect the fair value of the Company’s fixed rate instruments. At December 31,
2015
, the fair value of the Company’s fixed rate debt was $199,000,000 and the carrying value of the Company’s fixed rate debt was $200,000,000. The fair value estimate of the Company’s fixed rate debt was estimated based on a discounted cash flow analysis using a discount rate representing the Company’s estimate of the rate that would be used by market participants. Changes in assumptions or estimation methodologies may have a material effect on these estimated fair values. As the Company expects to hold its fixed rate instruments to maturity and the amounts due under such instruments would be limited to the outstanding principal balance and any accrued and unpaid interest, the Company does not expect that fluctuations in interest rates, and the resulting change in fair value of its fixed rate instruments, would have a significant impact on the Company’s operations.
The Company’s cash and cash equivalents are invested in money market accounts. Accordingly, the Company is subject to changes in market interest rates. However, the Company does not believe a change in these rates would have a material adverse effect on the Company’s operating results, financial condition, or cash flows.
The financial statements prepared in accordance with Regulation S-X are included in a separate section of this report. See the index to Financial Statements at Item 15(a)(1) and (2) of this report.
None.
57
Evaluation of Disclosure Controls and Procedures
Under the supervision and with the participation of the Company’s Chief Executive Officer and Chief Financial Officer, management of the Company has evaluated the effectiveness of the design and operation of the Company’s disclosure controls and procedures (as defined in Rules 13a-15(e) and 15d-15(e) under the Exchange Act) as of December 31,
2015
(the “Evaluation Date”). Based upon that evaluation, the Chief Executive Officer and Chief Financial Officer concluded that, as of the Evaluation Date, the Company’s disclosure controls and procedures are effective (1) to ensure that information required to be disclosed by the Company in reports that it files or submits under the Exchange Act is recorded, processed, summarized and reported within the time periods specified in the SEC rules and forms; and (2) to ensure that information required to be disclosed in the reports that the Company files or submits under the Exchange Act is accumulated and communicated to the Company’s management, including the Company’s Chief Executive Officer and Chief Financial Officer, to allow timely decisions regarding required disclosures.
The Company’s management, including its Chief Executive Officer and Chief Financial Officer, does not expect the Company’s disclosure controls and procedures or internal controls will prevent all possible error and fraud. The Company’s disclosure controls and procedures are, however, designed to provide reasonable assurance of achieving their objectives, and the Company’s Chief Executive Officer and Chief Financial Officer have concluded that the Company’s disclosure controls and procedures are effective at that reasonable assurance level.
Management’s Report on Internal Control Over Financial Reporting
Management is responsible for establishing and maintaining adequate internal control over financial reporting and for the assessment of the effectiveness of the Company’s internal control over financial reporting. Internal control over financial reporting (as defined in Rules 13a-15(f) and 15d(f) under the Exchange Act) is a process designed to provide reasonable assurance regarding the reliability of financial reporting and the preparation of financial statements for external reporting purposes in accordance with GAAP. Internal control over financial reporting includes those policies and procedures that (1) pertain to the maintenance of records that, in reasonable detail, accurately and fairly reflect the transactions and dispositions of assets, (2) provide reasonable assurance that transactions are recorded as necessary to permit preparation of financial statements in accordance with GAAP, (3) provide reasonable assurance that receipts and expenditures are being made only in accordance with appropriate authorization of management and the board of directors, and (4) provide reasonable assurance regarding prevention or timely detection of unauthorized acquisition, use, or disposition of assets that could have a material effect on the financial statements.
All internal control systems, no matter how well designed, have inherent limitations, therefore, even those systems determined to be effective can provide only reasonable assurance with respect to financial statement preparation and presentation.
Under the supervision and with the participation of the Company’s Chief Executive Officer and Chief Financial Officer, management has assessed the effectiveness of the Company’s internal control over financial reporting as of December 31,
2015
. To make this assessment, management used the criteria for effective internal control over financial reporting described in
Internal Control-Integrated Framework (2013)
issued by the Committee of Sponsoring Organizations of the Treadway Commission. Based on this assessment, management concludes that, as of December 31,
2015
, the Company’s internal control over financial reporting is effective based on those criteria.
The Company’s internal control over financial reporting as of December 31,
2015
, has been audited by Hein & Associates LLP, the independent registered public accounting firm that audited the Company’s financial statements included in this report, and their report is included below.
Changes in Internal Control Over Financial Reporting
There was no change in the Company’s internal control over financial reporting during the quarter ended December 31,
2015
that has materially affected, or is reasonably likely to materially affect, the Company’s internal control over financial reporting.
58
REPORT OF INDEPENDENT REGISTERED PUBLIC ACCOUNTING FIRM
To the Board of Directors and Stockholders of First Cash Financial Services, Inc.
We have audited First Cash Financial Services, Inc. and subsidiaries’ (collectively the “Company”) internal control over financial reporting as of December 31,
2015
based on criteria established in
Internal Control-Integrated Framework
issued by the Committee of Sponsoring Organizations of the Treadway Commission in 2013. First Cash Financial Services, Inc.’s management is responsible for maintaining effective internal control over financial reporting and for its assessment of the effectiveness of internal control over financial reporting included in the accompanying Management’s Report on Internal Control Over Financial Reporting. Our responsibility is to express an opinion on the company’s internal control over financial reporting based on our audit.
We conducted our audit in accordance with the standards of the Public Company Accounting Oversight Board (United States). Those standards require that we plan and perform the audit to obtain reasonable assurance about whether effective internal control over financial reporting was maintained in all material respects. Our audit included obtaining an understanding of internal control over financial reporting, assessing the risk that a material weakness exists, and testing and evaluating the design and operating effectiveness of internal control based on the assessed risk. Our audit also included performing such other procedures as we considered necessary in the circumstances. We believe that our audit provides a reasonable basis for our opinion.
A company’s internal control over financial reporting is a process designed to provide reasonable assurance regarding the reliability of financial reporting and the preparation of financial statements for external purposes in accordance with generally accepted accounting principles. A company’s internal control over financial reporting includes those policies and procedures that (a) pertain to the maintenance of records that, in reasonable detail, accurately and fairly reflect the transactions and dispositions of the assets of the company; (b) provide reasonable assurance that transactions are recorded as necessary to permit preparation of financial statements in accordance with generally accepted accounting principles, and that receipts and expenditures of the company are being made only in accordance with authorizations of management and directors of the company; and (c) provide reasonable assurance regarding prevention or timely detection of unauthorized acquisition, use, or disposition of the company’s assets that could have a material effect on the financial statements.
Because of its inherent limitations, internal control over financial reporting may not prevent or detect misstatements. Also, projections of any evaluation of effectiveness to future periods are subject to the risk that controls may become inadequate because of changes in conditions, or that the degree of compliance with the policies or procedures may deteriorate.
In our opinion, First Cash Financial Services, Inc. maintained, in all material respects, effective internal control over financial reporting as of December 31,
2015
based on criteria established in
Internal Control - Integrated Framework
issued by the Committee of Sponsoring Organizations of the Treadway Commission in 2013.
We have also audited, in accordance with the standards of the Public Company Accounting Oversight Board (United States), the consolidated balance sheets of First Cash Financial Services, Inc. and subsidiaries as of December 31,
2015
and
2014
, and the related consolidated statements of income, changes in stockholders’ equity, comprehensive income and cash flows for each of the three years ended December 31,
2015
, and our report dated
February 17, 2016
expressed an unqualified opinion thereon.
/s/ Hein & Associates LLP
Dallas, Texas
February 17, 2016
59
Not applicable.
The information required by Item 10 to this Annual Report on Form 10-K with respect to the directors, executive officers and compliance with Section 16(a) of the Exchange Act is incorporated herein by reference from the information provided under the headings “Election of Directors,” “Executive Officers,” “Corporate Governance and Board Matters” and “Section 16(a) Beneficial Ownership Reporting Compliance,” contained in the Company’s Proxy Statement to be filed with the SEC in connection with the solicitation of proxies for the Company’s
2016
Annual Meeting of Stockholders to be held on or about
June 7, 2016
(the “
2016
Proxy Statement”).
The Company has adopted a Code of Ethics that applies to all of its directors, officers, and employees. This Code of Ethics is publicly available on the Company’s website at
www.firstcash.com
. The Company intends to disclose future amendments to, or waivers from, certain provisions of its Code of Ethics on its website in accordance with applicable NASDAQ and SEC requirements. Copies of the Company’s Code of Ethics are also available, free of charge, by submitting a written request to First Cash Financial Services, Inc., Investor Relations, 690 E. Lamar Blvd., Suite 400, Arlington, Texas 76011.
The information required by Item 11 to this Annual Report on Form 10-K is incorporated herein by reference from the information provided under the headings “Executive and Director Compensation” and “Compensation Committee Interlocks and Insider Participation” of the
2016
Proxy Statement.
The information required by Item 12 to this Annual Report on Form 10-K is incorporated herein by reference from the information provided under the heading “Equity Compensation Plan Information” and “Security Ownership of Certain Beneficial Owners and Management and Related Stockholder Matters” of the
2016
Proxy Statement.
The information required by Item 13 to this Annual Report on Form 10-K is incorporated herein by reference from the information provided under the headings “Certain Relationships and Related Person Transactions” and “Corporate Governance and Board Matters” of the
2016
Proxy Statement.
The information required by Item 14 to this Annual Report on Form 10-K is incorporated herein by reference from the information provided under the heading “Ratify the Selection of Hein & Associates LLP as the Independent Registered Public Accounting Firm of the Company for the Year Ending December 31,
2016
” of the
2016
Proxy Statement.
60
|
(a)
|
The following documents are filed as part of this report:
|
||||
|
(1)
|
Consolidated Financial Statements:
|
Page
|
|||
|
Report of Independent Registered Public Accounting Firm
|
|||||
|
Consolidated Balance Sheets
|
|||||
|
Consolidated Statements of Income
|
|||||
|
Consolidated Statements of Comprehensive Income (Loss)
|
|||||
|
Consolidated Statements of Changes in Stockholders’ Equity
|
|||||
|
Consolidated Statements of Cash Flows
|
|||||
|
Notes to Consolidated Financial Statements
|
|||||
|
(2)
|
All schedules are omitted because they are not applicable or the required information is shown in the financial statements or the notes thereto.
|
||||
|
(3)
|
Exhibits:
|
||||
|
|
|
Incorporated by Reference
|
|
|||||||||
|
Exhibit No.
|
Exhibit Description
|
Form
|
File No.
|
Exhibit
|
Filing Date
|
Filed Herewith
|
||||||
|
3.1
|
Amended Certificate of Incorporation
|
DEF 14A
|
0-19133
|
A
|
04/29/2004
|
|||||||
|
3.2
|
Amended Bylaws
|
10-K
|
0-19133
|
3.2
|
03/31/2000
|
|||||||
|
4.1
|
Common Stock Specimen
|
S-1
|
33-48436
|
4.2a
|
06/05/1992
|
|||||||
|
4.2
|
Indenture, dated as of March 24, 2014, by and among First Cash Financial Services, Inc., the guarantors listed therein and BOKF, NA, dba Bank of Texas (including the form of Note attached as an exhibit thereto)
|
8-K
|
0-19133
|
4.1
|
03/25/2014
|
|||||||
|
10.1
|
First Cash Financial Services, Inc. 1999 Stock Option Plan *
|
S-3
|
333-71077
|
10.63
|
01/25/1999
|
|||||||
|
10.2
|
Executive Incentive Compensation Plan *
|
DEF 14A
|
0-19133
|
A
|
04/30/2003
|
|||||||
|
10.3
|
First Cash Financial Services, Inc. 2004
Long-Term Incentive Plan *
|
DEF 14A
|
0-19133
|
A
|
04/29/2004
|
|||||||
|
10.4
|
First Cash Financial Services, Inc. 2011
Long-Term Incentive Plan *
|
DEF 14A
|
0-19133
|
A
|
04/28/2011
|
|||||||
|
10.5
|
First Cash 401(k) Profit Sharing Plan, as amended effective as of October 1, 2010 (executed on August 5, 2010)
|
S-8
|
333- 106881
|
4(g)
|
05/31/2012
|
|||||||
|
10.6
|
Credit Agreement, dated February 5, 2014, among First Cash Financial Services, Inc., Certain Subsidiaries of the Borrower From Time to Time Party Hereto, the Lenders Party Hereto, and Wells Fargo Bank, National Association
|
8-K
|
0-19133
|
10.1
|
02/07/2014
|
|||||||
|
10.7
|
First Amendment to Credit Agreement, dated October 30, 2015, between First Cash Financial Services, Inc. and Wells Fargo Bank, N.A., Texas Capital Bank, N.A., BOFK, N.A., Amegy Bank, N.A. and LegacyTexas Bank
|
8-K
|
0-19133
|
10.1
|
11/03/2015
|
|||||||
|
14.1
|
Amended and Restated Code of Ethics
|
10-K
|
0-19133
|
14.1
|
03/15/2010
|
|||||||
|
21.1
|
Subsidiaries
|
X
|
||||||||||
61
|
|
|
Incorporated by Reference
|
|
|||||||||
|
Exhibit No.
|
Exhibit Description
|
Form
|
File No.
|
Exhibit
|
Filing Date
|
Filed Herewith
|
||||||
|
23.1
|
Consent of Independent Registered Public Accounting Firm, Hein & Associates LLP
|
X
|
||||||||||
|
31.1
|
Certification Pursuant to Section 302 of the Sarbanes-Oxley Act provided by Rick L. Wessel, Chief Executive Officer
|
|
|
|
|
X
|
||||||
|
31.2
|
Certification Pursuant to Section 302 of the Sarbanes-Oxley Act provided by R. Douglas Orr, Chief Financial Officer
|
|
|
|
|
X
|
||||||
|
32.1
|
Certification Pursuant to 18 U.S.C. Section 1350, as Adopted Pursuant to Section 906 of the Sarbanes-Oxley Act of 2002 provided by Rick L. Wessel, Chief Executive Officer
|
|
|
|
|
X
|
||||||
|
32.2
|
Certification Pursuant to 18 U.S.C. Section 1350, as Adopted Pursuant to Section 906 of the Sarbanes-Oxley Act of 2002 provided by R. Douglas Orr, Chief Financial Officer
|
|
|
|
|
X
|
||||||
|
101 (1)
|
The following financial information from the Company's Annual Report on Form 10-K for fiscal 2015, filed with the SEC on February 17, 2016, is formatted in Extensible Business Reporting Language (XBRL): (i) Consolidated Balance Sheets at December 31, 2015 and December 31, 2014, (ii) Consolidated Statements of Income for the years ended December 31, 2015, December 31, 2014 and December 31, 2013, (iii) Consolidated Statements of Comprehensive Income (Loss) for the years ended December 31, 2015, December 31, 2014 and December 31, 2013, (iv) Consolidated Statements of Changes in Stockholders’ Equity for the years ended December 31, 2015, December 31, 2014 and December 31, 2013, (v) Consolidated Statements of Cash Flows for the years ended December 31, 2015, December 31, 2014 and December 31, 2013, and (vi) Notes to Consolidated Financial Statements.
|
X
|
||||||||||
|
*
|
Indicates management contract or compensatory plan, contract or arrangement.
|
|
(1)
|
The XBRL related information in Exhibit 101 to this Annual Report on Form 10-K shall not be deemed “filed” for purposes of Section 18 of the Securities Exchange Act of 1934, as amended, or otherwise subject to liability of that section and shall not be incorporated by reference into any filing or other document pursuant to the Securities Act of 1933, as amended, except as shall be expressly set forth by specific reference in such filing or document.
|
62
SIGNATURES
Pursuant to the requirements of Section 13 or 15(d) of the Securities Exchange Act of 1934, the registrant has duly caused this report to be signed on its behalf by the undersigned, thereunto duly authorized.
|
Dated: February 17, 2016
|
FIRST CASH FINANCIAL SERVICES, INC.
|
|
|
(Registrant)
|
|
|
|
|
|
/s/ RICK L. WESSEL
|
|
|
Rick L. Wessel
|
|
|
Chief Executive Officer
|
|
|
(Principal Executive Officer)
|
|
|
|
|
|
/s/ R. DOUGLAS ORR
|
|
|
R. Douglas Orr
|
|
|
Executive Vice President and Chief Financial Officer
|
|
|
(Principal Financial and Accounting Officer)
|
Pursuant to the requirements of the Securities Exchange Act of 1934, this report has been signed below by the following persons on behalf of the registrant and in the capacities and on the dates indicated.
|
Signature
|
Capacity
|
Date
|
|
/s/ RICK L. WESSEL
Rick L. Wessel
|
Chairman of the Board, President, Chief Executive Officer
(Principal Executive Officer)
|
February 17, 2016
|
|
/s/ R. DOUGLAS ORR
R. Douglas Orr
|
Executive Vice President and Chief Financial Officer
(Principal Financial and Accounting Officer)
|
February 17, 2016
|
|
/s/ GABRIEL GUERRA CASTELLANOS
Gabriel Guerra Castellanos
|
Director
|
February 17, 2016
|
|
/s/ MIKEL D. FAULKNER
Mikel D. Faulkner
|
Director
|
February 17, 2016
|
|
/s/ RANDEL G. OWEN
Randel G. Owen
|
Director
|
February 17, 2016
|
63
REPORT OF INDEPENDENT REGISTERED PUBLIC ACCOUNTING FIRM
To the Board of Directors and Stockholders of First Cash Financial Services, Inc.
We have audited the accompanying consolidated balance sheets of First Cash Financial Services, Inc., and subsidiaries (collectively the “Company”) as of December 31,
2015
and
2014
, and the related consolidated statements of income, comprehensive income, stockholders’ equity and cash flows for each of the three years in the period ended December 31,
2015
. These financial statements are the responsibility of the Company’s management. Our responsibility is to express an opinion on these financial statements based on our audits.
We conducted our audits in accordance with the standards of the Public Company Accounting Oversight Board (United States). Those standards require that we plan and perform the audits to obtain reasonable assurance about whether the financial statements are free of material misstatement. An audit includes examining, on a test basis, evidence supporting the amounts and disclosures in the financial statements. An audit also includes assessing the accounting principles used and significant estimates made by management, as well as evaluating the overall financial statement presentation. We believe that our audits provide a reasonable basis for our opinion.
In our opinion, the consolidated financial statements referred to above present fairly, in all material respects, the financial position of First Cash Financial Services, Inc., and subsidiaries as of December 31,
2015
and
2014
, and the results of their operations and their cash flows for each of the three years in the period ended December 31,
2015
, in conformity with U.S. generally accepted accounting principles.
We also have audited, in accordance with the standards of the Public Company Accounting Oversight Board (United States), First Cash Financial Services, Inc.’s, and subsidiaries’ internal control over financial reporting as of December 31,
2015
, based on criteria established in
Internal Control-Integrated Framework
issued by the Committee of Sponsoring Organizations of the Treadway Commission in 2013, and our report dated
February 17, 2016
expressed an unqualified opinion on the effectiveness of First Cash Financial Services, Inc.’s internal control over financial reporting.
/s/ Hein & Associates LLP
Dallas, Texas
February 17, 2016
F-1
|
FIRST CASH FINANCIAL SERVICES, INC.
|
|||||||||
|
|
|||||||||
|
(in thousands, except per share amounts)
|
|||||||||
|
|
December 31,
|
||||||||
|
|
2015
|
2014
|
|||||||
|
ASSETS
|
|
|
|||||||
|
Cash and cash equivalents
|
$
|
86,954
|
|
$
|
67,992
|
|
|||
|
Pawn loan fees and service charges receivable
|
16,406
|
|
16,926
|
|
|||||
|
Pawn loans
|
117,601
|
|
118,536
|
|
|||||
|
Consumer loans, net
|
1,118
|
|
1,241
|
|
|||||
|
Inventories
|
93,458
|
|
91,088
|
|
|||||
|
Prepaid expenses and other current assets
|
9,897
|
|
4,970
|
|
|||||
|
Total current assets
|
325,434
|
|
300,753
|
|
|||||
|
Property and equipment, net
|
112,447
|
|
113,750
|
|
|||||
|
Goodwill
|
295,609
|
|
276,882
|
|
|||||
|
Other non-current assets
|
14,210
|
|
16,168
|
|
|||||
|
Deferred tax assets
|
9,321
|
|
9,070
|
|
|||||
|
Total assets
|
$
|
757,021
|
|
$
|
716,623
|
|
|||
|
LIABILITIES AND STOCKHOLDERS’ EQUITY
|
|
|
|||||||
|
Accounts payable and accrued liabilities
|
$
|
42,252
|
|
$
|
42,559
|
|
|||
|
Income taxes payable
|
3,923
|
|
—
|
|
|||||
|
Total current liabilities
|
46,175
|
|
42,559
|
|
|||||
|
Revolving unsecured credit facilities
|
58,000
|
|
22,400
|
|
|||||
|
Senior unsecured notes
|
200,000
|
|
200,000
|
|
|||||
|
Deferred tax liabilities
|
21,464
|
|
17,223
|
|
|||||
|
Total liabilities
|
325,639
|
|
282,182
|
|
|||||
|
Commitments and contingencies (Note 12)
|
|
|
|||||||
|
Stockholders’ equity:
|
|
|
|||||||
|
Preferred stock; $0.01 par value; 10,000 shares authorized; no shares issued or
|
|||||||||
|
outstanding
|
—
|
|
—
|
|
|||||
|
Common stock; $0.01 par value; 90,000 shares authorized;
|
|||||||||
|
40,288
and 39,708 shares issued, respectively;
|
|||||||||
|
28,236
and 28,508 shares outstanding, respectively
|
403
|
|
397
|
|
|||||
|
Additional paid-in capital
|
202,393
|
|
188,062
|
|
|||||
|
Retained earnings
|
643,604
|
|
582,894
|
|
|||||
|
Accumulated other comprehensive loss from cumulative foreign
|
|
|
|||||||
|
currency translation adjustments
|
(78,410
|
)
|
(40,278
|
)
|
|||||
|
Common stock held in treasury,
12,052
and 11,200 shares at cost, respectively
|
(336,608
|
)
|
(296,634
|
)
|
|||||
|
Total stockholders’ equity
|
431,382
|
|
434,441
|
|
|||||
|
Total liabilities and stockholders’ equity
|
$
|
757,021
|
|
$
|
716,623
|
|
|||
|
The accompanying notes are an integral part
of these consolidated financial statements.
|
|||||||||
F-2
|
FIRST CASH FINANCIAL SERVICES, INC.
|
|||||||||||||
|
|
|||||||||||||
|
(in thousands, except per share amounts)
|
|||||||||||||
|
|
Year Ended December 31,
|
||||||||||||
|
|
2015
|
2014
|
2013
|
||||||||||
|
Revenue:
|
|
|
|
||||||||||
|
Retail merchandise sales
|
$
|
449,296
|
|
$
|
428,182
|
|
$
|
367,187
|
|
||||
|
Pawn loan fees
|
195,448
|
|
199,357
|
|
181,555
|
|
|||||||
|
Consumer loan and credit services fees
|
27,803
|
|
36,749
|
|
43,781
|
|
|||||||
|
Wholesale scrap jewelry revenue
|
32,055
|
|
48,589
|
|
68,325
|
|
|||||||
|
Total revenue
|
704,602
|
|
712,877
|
|
660,848
|
|
|||||||
|
Cost of revenue:
|
|
|
|
||||||||||
|
Cost of retail merchandise sold
|
278,631
|
|
261,673
|
|
221,361
|
|
|||||||
|
Consumer loan and credit services loss provision
|
7,159
|
|
9,287
|
|
11,368
|
|
|||||||
|
Cost of wholesale scrap jewelry sold
|
27,628
|
|
41,044
|
|
58,545
|
|
|||||||
|
Total cost of revenue
|
313,418
|
|
312,004
|
|
291,274
|
|
|||||||
|
Net revenue
|
391,184
|
|
400,873
|
|
369,574
|
|
|||||||
|
Expenses and other income:
|
|
|
|
||||||||||
|
Store operating expenses
|
207,572
|
|
198,986
|
|
181,321
|
|
|||||||
|
Administrative expenses
|
54,758
|
|
54,586
|
|
49,530
|
|
|||||||
|
Depreciation and amortization
|
17,939
|
|
17,476
|
|
15,361
|
|
|||||||
|
Goodwill impairment - U.S. consumer loan operations
|
7,913
|
|
—
|
|
—
|
|
|||||||
|
Interest expense
|
16,887
|
|
13,527
|
|
3,492
|
|
|||||||
|
Interest income
|
(1,566
|
)
|
(682
|
)
|
(322
|
)
|
|||||||
|
Total expenses and other income
|
303,503
|
|
283,893
|
|
249,382
|
|
|||||||
|
Income from continuing operations before income taxes
|
87,681
|
|
116,980
|
|
120,192
|
|
|||||||
|
Provision for income taxes
|
26,971
|
|
31,542
|
|
35,713
|
|
|||||||
|
Income from continuing operations
|
60,710
|
|
85,438
|
|
84,479
|
|
|||||||
|
Loss from discontinued operations, net of tax
|
—
|
|
(272
|
)
|
(633
|
)
|
|||||||
|
Net income
|
$
|
60,710
|
|
$
|
85,166
|
|
$
|
83,846
|
|
||||
|
Basic income per share:
|
|
|
|
||||||||||
|
Income from continuing operations
|
$
|
2.16
|
|
$
|
2.98
|
|
$
|
2.91
|
|
||||
|
Loss from discontinued operations
|
—
|
|
(0.01
|
)
|
(0.02
|
)
|
|||||||
|
Net income per basic share
|
$
|
2.16
|
|
$
|
2.97
|
|
$
|
2.89
|
|
||||
|
Diluted income per share:
|
|
|
|
||||||||||
|
Income from continuing operations
|
$
|
2.14
|
|
$
|
2.94
|
|
$
|
2.86
|
|
||||
|
Loss from discontinued operations
|
—
|
|
(0.01
|
)
|
(0.02
|
)
|
|||||||
|
Net income per diluted share
|
$
|
2.14
|
|
$
|
2.93
|
|
$
|
2.84
|
|
||||
|
The accompanying notes are an integral part
of these consolidated financial statements.
|
|||||||||||||
F-3
|
FIRST CASH FINANCIAL SERVICES, INC.
|
|||||||||||||
|
CONSOLIDATED STATEMENTS OF COMPREHENSIVE INCOME
|
|||||||||||||
|
(in thousands)
|
|||||||||||||
|
|
Year Ended December 31,
|
||||||||||||
|
|
2015
|
2014
|
2013
|
||||||||||
|
Net income
|
$
|
60,710
|
|
$
|
85,166
|
|
$
|
83,846
|
|
||||
|
Other comprehensive income (loss):
|
|
|
|
||||||||||
|
Currency translation adjustment, gross
|
(38,132
|
)
|
(28,517
|
)
|
(1,374
|
)
|
|||||||
|
Tax (expense) benefit
|
—
|
|
—
|
|
(3,447
|
)
|
|||||||
|
Comprehensive income
|
$
|
22,578
|
|
$
|
56,649
|
|
$
|
79,025
|
|
||||
|
The accompanying notes are an integral part
of these consolidated financial statements. |
|||||||||||||
F-4
|
FIRST CASH FINANCIAL SERVICES, INC.
|
|||||||||||||||||||||||||||||||||||||
|
CONSOLIDATED STATEMENTS OF CHANGES IN STOCKHOLDERS’ EQUITY
|
|||||||||||||||||||||||||||||||||||||
|
(in thousands)
|
|||||||||||||||||||||||||||||||||||||
|
Preferred
Stock
|
Common
Stock
|
Additional
Paid-In
Capital
|
Retained
Earnings
|
Accum-
ulated
Other
Compre-
hensive
Loss
|
Common Stock
Held in Treasury
|
Total
Stock-
holders’
Equity
|
|||||||||||||||||||||||||||||||
|
|
Shares
|
Amount
|
Shares
|
Amount
|
|
|
|
Shares
|
Amount
|
|
|||||||||||||||||||||||||||
|
Balance at 12/31/2014
|
—
|
|
$
|
—
|
|
39,708
|
|
$
|
397
|
|
$
|
188,062
|
|
$
|
582,894
|
|
$
|
(40,278
|
)
|
11,200
|
|
$
|
(296,634
|
)
|
$
|
434,441
|
|
||||||||||
|
Shares issued under share-based com-pensation plan
|
—
|
|
—
|
|
5
|
|
—
|
|
—
|
|
—
|
|
—
|
|
—
|
|
—
|
|
—
|
|
|||||||||||||||||
|
Exercise of stock options, net of 80 shares net-settled
|
—
|
|
—
|
|
575
|
|
6
|
|
8,776
|
|
—
|
|
—
|
|
—
|
|
—
|
|
8,782
|
|
|||||||||||||||||
|
Income tax benefit from exercise of stock options
|
—
|
|
—
|
|
—
|
|
—
|
|
5,126
|
|
—
|
|
—
|
|
—
|
|
—
|
|
5,126
|
|
|||||||||||||||||
|
Share-based compensation expense
|
—
|
|
—
|
|
—
|
|
—
|
|
429
|
|
—
|
|
—
|
|
—
|
|
—
|
|
429
|
|
|||||||||||||||||
|
Net income
|
—
|
|
—
|
|
—
|
|
—
|
|
—
|
|
60,710
|
|
—
|
|
—
|
|
—
|
|
60,710
|
|
|||||||||||||||||
|
Currency translation adjustment
|
—
|
|
—
|
|
—
|
|
—
|
|
—
|
|
—
|
|
(38,132
|
)
|
—
|
|
—
|
|
(38,132
|
)
|
|||||||||||||||||
|
Repurchases of treasury stock
|
—
|
|
—
|
|
—
|
|
—
|
|
—
|
|
—
|
|
—
|
|
852
|
|
(39,974
|
)
|
(39,974
|
)
|
|||||||||||||||||
|
Balance at 12/31/2015
|
—
|
|
$
|
—
|
|
40,288
|
|
$
|
403
|
|
$
|
202,393
|
|
$
|
643,604
|
|
$
|
(78,410
|
)
|
12,052
|
|
$
|
(336,608
|
)
|
$
|
431,382
|
|
||||||||||
|
The accompanying notes are an integral part
of these consolidated financial statements.
|
|||||||||||||||||||||||||||||||||||||
F-5
|
FIRST CASH FINANCIAL SERVICES, INC.
|
|||||||||||||||||||||||||||||||||||||
|
CONSOLIDATED STATEMENTS OF CHANGES IN STOCKHOLDERS’ EQUITY
|
|||||||||||||||||||||||||||||||||||||
|
CONTINUED
|
|||||||||||||||||||||||||||||||||||||
|
(in thousands)
|
|||||||||||||||||||||||||||||||||||||
|
Preferred
Stock
|
Common
Stock
|
Additional
Paid-In
Capital
|
Retained
Earnings
|
Accum-
ulated
Other
Compre-
hensive
Loss
|
Common Stock
Held in Treasury
|
Total
Stock-
holders’
Equity
|
|||||||||||||||||||||||||||||||
|
|
Shares
|
Amount
|
Shares
|
Amount
|
|
|
|
Shares
|
Amount
|
|
|||||||||||||||||||||||||||
|
Balance at 12/31/2013
|
—
|
|
$
|
—
|
|
39,377
|
|
$
|
394
|
|
$
|
176,675
|
|
$
|
497,728
|
|
$
|
(11,761
|
)
|
10,429
|
|
$
|
(252,687
|
)
|
$
|
410,349
|
|
||||||||||
|
Shares issued under share-based com-pensation plan
|
—
|
|
—
|
|
37
|
|
—
|
|
—
|
|
—
|
|
—
|
|
—
|
|
—
|
|
—
|
|
|||||||||||||||||
|
Exercise of stock options
|
—
|
|
—
|
|
294
|
|
3
|
|
5,267
|
|
—
|
|
—
|
|
—
|
|
—
|
|
5,270
|
|
|||||||||||||||||
|
Income tax benefit from exercise of stock options
|
—
|
|
—
|
|
—
|
|
—
|
|
4,141
|
|
—
|
|
—
|
|
—
|
|
—
|
|
4,141
|
|
|||||||||||||||||
|
Share-based compensation expense
|
—
|
|
—
|
|
—
|
|
—
|
|
1,979
|
|
—
|
|
—
|
|
—
|
|
—
|
|
1,979
|
|
|||||||||||||||||
|
Net income
|
—
|
|
—
|
|
—
|
|
—
|
|
—
|
|
85,166
|
|
—
|
|
—
|
|
—
|
|
85,166
|
|
|||||||||||||||||
|
Currency translation adjustment
|
—
|
|
—
|
|
—
|
|
—
|
|
—
|
|
—
|
|
(28,517
|
)
|
—
|
|
—
|
|
(28,517
|
)
|
|||||||||||||||||
|
Repurchases of treasury stock
|
—
|
|
—
|
|
—
|
|
—
|
|
—
|
|
—
|
|
—
|
|
771
|
|
(43,947
|
)
|
(43,947
|
)
|
|||||||||||||||||
|
Balance at 12/31/2014
|
—
|
|
$
|
—
|
|
39,708
|
|
$
|
397
|
|
$
|
188,062
|
|
$
|
582,894
|
|
$
|
(40,278
|
)
|
11,200
|
|
$
|
(296,634
|
)
|
$
|
434,441
|
|
||||||||||
|
The accompanying notes are an integral part
of these consolidated financial statements.
|
|||||||||||||||||||||||||||||||||||||
F-6
|
FIRST CASH FINANCIAL SERVICES, INC.
|
|||||||||||||||||||||||||||||||||||||
|
CONSOLIDATED STATEMENTS OF CHANGES IN STOCKHOLDERS’ EQUITY
|
|||||||||||||||||||||||||||||||||||||
|
CONTINUED
|
|||||||||||||||||||||||||||||||||||||
|
(in thousands)
|
|||||||||||||||||||||||||||||||||||||
|
Preferred
Stock
|
Common
Stock
|
Additional
Paid-In
Capital
|
Retained
Earnings
|
Accum-
ulated
Other
Compre-
hensive
Loss
|
Common Stock
Held in Treasury
|
Total
Stock-
holders’
Equity
|
|||||||||||||||||||||||||||||||
|
|
Shares
|
Amount
|
Shares
|
Amount
|
|
|
|
Shares
|
Amount
|
|
|||||||||||||||||||||||||||
|
Balance at 12/31/2012
|
—
|
|
$
|
—
|
|
38,796
|
|
$
|
388
|
|
$
|
159,081
|
|
$
|
413,882
|
|
$
|
(6,940
|
)
|
9,700
|
|
$
|
(213,995
|
)
|
$
|
352,416
|
|
||||||||||
|
Shares issued under share-based com-pensation plan
|
—
|
|
—
|
|
8
|
|
—
|
|
—
|
|
—
|
|
—
|
|
—
|
|
—
|
|
—
|
|
|||||||||||||||||
|
Exercise of stock options
|
—
|
|
—
|
|
573
|
|
6
|
|
9,236
|
|
—
|
|
—
|
|
—
|
|
—
|
|
9,242
|
|
|||||||||||||||||
|
Income tax benefit from exercise of stock options
|
—
|
|
—
|
|
—
|
|
—
|
|
7,805
|
|
—
|
|
—
|
|
—
|
|
—
|
|
7,805
|
|
|||||||||||||||||
|
Share-based compensation expense
|
—
|
|
—
|
|
—
|
|
—
|
|
553
|
|
—
|
|
—
|
|
—
|
|
—
|
|
553
|
|
|||||||||||||||||
|
Net income
|
—
|
|
—
|
|
—
|
|
—
|
|
—
|
|
83,846
|
|
—
|
|
—
|
|
—
|
|
83,846
|
|
|||||||||||||||||
|
Currency translation adjustment, net of tax
|
—
|
|
—
|
|
—
|
|
—
|
|
—
|
|
—
|
|
(4,821
|
)
|
—
|
|
—
|
|
(4,821
|
)
|
|||||||||||||||||
|
Repurchases of treasury stock
|
—
|
|
—
|
|
—
|
|
—
|
|
—
|
|
—
|
|
—
|
|
729
|
|
(38,692
|
)
|
(38,692
|
)
|
|||||||||||||||||
|
Balance at 12/31/2013
|
—
|
|
$
|
—
|
|
39,377
|
|
$
|
394
|
|
$
|
176,675
|
|
$
|
497,728
|
|
$
|
(11,761
|
)
|
10,429
|
|
$
|
(252,687
|
)
|
$
|
410,349
|
|
||||||||||
|
The accompanying notes are an integral part
of these consolidated financial statements.
|
|||||||||||||||||||||||||||||||||||||
F-7
|
FIRST CASH FINANCIAL SERVICES, INC.
|
|||||||||||
|
|
|||||||||||
|
(in thousands)
|
|||||||||||
|
Year Ended December 31,
|
|||||||||||
|
|
2015
|
2014
|
2013
|
||||||||
|
Cash flow from operating activities:
|
|
|
|||||||||
|
Net income
|
$
|
60,710
|
|
$
|
85,166
|
|
$
|
83,846
|
|
||
|
Adjustments to reconcile net income to net cash flow provided by operating activities:
|
|
|
|
||||||||
|
Non-cash portion of credit loss provision
|
761
|
|
916
|
|
1,033
|
|
|||||
|
Share-based compensation expense
|
429
|
|
1,979
|
|
553
|
|
|||||
|
Depreciation and amortization expense
|
17,939
|
|
17,476
|
|
15,361
|
|
|||||
|
Amortization of debt issuance costs
|
943
|
|
902
|
|
—
|
|
|||||
|
Impairment of goodwill - U.S. consumer loan operations
|
7,913
|
|
—
|
|
—
|
|
|||||
|
Deferred income taxes
|
(430
|
)
|
1,128
|
|
(7,928
|
)
|
|||||
|
Loss on disposition of consumer loan stores
|
—
|
|
—
|
|
1,298
|
|
|||||
|
Changes in operating assets and liabilities, net of business combinations:
|
|
|
|
||||||||
|
Pawn fees and service charges receivable
|
(100
|
)
|
(116
|
)
|
(1,371
|
)
|
|||||
|
Merchandise inventories
|
(1,404
|
)
|
(1,364
|
)
|
(1,200
|
)
|
|||||
|
Prepaid expenses and other assets
|
490
|
|
(1,645
|
)
|
2,030
|
|
|||||
|
Accounts payable and accrued expenses
|
4,350
|
|
1,272
|
|
5,586
|
|
|||||
|
Income taxes payable
|
1,148
|
|
(8,035
|
)
|
7,510
|
|
|||||
|
Net cash flow provided by operating activities
|
92,749
|
|
97,679
|
|
106,718
|
|
|||||
|
Cash flow from investing activities:
|
|
|
|
||||||||
|
Loan receivables, net of cash repayments
|
(3,716
|
)
|
(2,470
|
)
|
(411
|
)
|
|||||
|
Purchases of property and equipment
|
(21,073
|
)
|
(23,954
|
)
|
(26,672
|
)
|
|||||
|
Acquisitions of pawn stores, net of cash acquired
|
(46,887
|
)
|
(58,942
|
)
|
(113,643
|
)
|
|||||
|
Net cash flow used in investing activities
|
(71,676
|
)
|
(85,366
|
)
|
(140,726
|
)
|
|||||
|
Cash flow from financing activities:
|
|
|
|
||||||||
|
Borrowings from revolving credit facilities
|
120,000
|
|
50,000
|
|
152,500
|
|
|||||
|
Repayments of revolving credit facilities
|
(84,400
|
)
|
(209,600
|
)
|
(73,000
|
)
|
|||||
|
Repayments of notes payable
|
—
|
|
(8,352
|
)
|
(3,211
|
)
|
|||||
|
Issuance of senior unsecured notes
|
—
|
|
200,000
|
|
—
|
|
|||||
|
Debt issuance costs paid
|
(407
|
)
|
(6,610
|
)
|
—
|
|
|||||
|
Purchases of treasury stock
|
(39,974
|
)
|
(43,947
|
)
|
(38,692
|
)
|
|||||
|
Proceeds from exercise of share-based compensation awards
|
9,895
|
|
5,270
|
|
9,242
|
|
|||||
|
Income tax benefit from exercise of stock options
|
5,126
|
|
4,141
|
|
7,805
|
|
|||||
|
Payment of minimum withholding taxes on net share settlement of stock options exercised
|
(1,113
|
)
|
—
|
|
—
|
|
|||||
|
Net cash flow provided by (used in) financing activities
|
9,127
|
|
(9,098
|
)
|
54,644
|
|
|||||
|
Effect of exchange rates on cash
|
(11,238
|
)
|
(5,866
|
)
|
(278
|
)
|
|||||
|
Change in cash and cash equivalents
|
18,962
|
|
(2,651
|
)
|
20,358
|
|
|||||
|
Cash and cash equivalents at beginning of the year
|
67,992
|
|
70,643
|
|
50,285
|
|
|||||
|
Cash and cash equivalents at end of the year
|
$
|
86,954
|
|
$
|
67,992
|
|
$
|
70,643
|
|
||
|
The accompanying notes are an integral part
of these consolidated financial statements.
|
|||||||||||
F-8
|
FIRST CASH FINANCIAL SERVICES, INC.
|
|||||||||||
|
CONSOLIDATED STATEMENTS OF CASH FLOWS
|
|||||||||||
|
CONTINUED
|
|||||||||||
|
(in thousands)
|
|||||||||||
|
Year Ended December 31,
|
|||||||||||
|
|
2015
|
2014
|
2013
|
||||||||
|
Supplemental disclosure of cash flow information:
|
|
|
|||||||||
|
Cash paid during the period for:
|
|||||||||||
|
Interest
|
$
|
15,464
|
|
$
|
10,294
|
|
$
|
3,477
|
|
||
|
Income taxes
|
21,579
|
|
32,860
|
|
27,111
|
|
|||||
|
Supplemental disclosure of non-cash investing activity:
|
|||||||||||
|
Non-cash transactions in connection with pawn loans settled through forfeitures of collateral transferred to inventories
|
$
|
186,389
|
|
$
|
177,519
|
|
$
|
147,976
|
|
||
|
Supplemental disclosure of non-cash financing activity:
|
|||||||||||
|
Notes and other amounts payable in connection with pawn acquisitions
|
$
|
575
|
|
$
|
1,425
|
|
$
|
2,008
|
|
||
|
The accompanying notes are an integral part
of these consolidated financial statements.
|
|||||||||||
F-9
FIRST CASH FINANCIAL SERVICES, INC.
NOTES TO CONSOLIDATED FINANCIAL STATEMENTS
NOTE
1
-
ORGANIZATION AND NATURE OF THE COMPANY
First Cash Financial Services, Inc., (together with its wholly-owned subsidiaries, the “Company”) is incorporated in the state of Delaware. The Company is engaged primarily in the operation of pawn stores, which lend money on the collateral of pledged personal property and retail previously owned merchandise acquired through pawn forfeitures and purchases directly from the general public. The Company also retails limited quantities of new or refurbished merchandise obtained directly from wholesalers and manufacturers. In addition to making short-term secured pawn loans, certain of the Company’s pawn stores offer short-term consumer loans and credit services. The Company also operates consumer loan stores that provide consumer loans, credit services and check cashing services. As of
December 31, 2015
, the Company owned and operated
1,005
pawn stores and
70
consumer loan stores in
14
U.S. states,
29
states in Mexico and Guatemala.
The Company manages its pawn and consumer loan operations under
three
operating segments: U.S. pawn operations, U.S. consumer loan operations and Latin America pawn and consumer loan operations. The
three
operating segments have been aggregated into
one
reportable segment because they have similar economic characteristics and similar long-term financial performance metrics. Additionally, all
three
segments offer similar and overlapping products and services to a similar customer demographic and are supported by a single, centralized administrative support platform.
NOTE
2
-
SUMMARY OF SIGNIFICANT ACCOUNTING POLICIES
The following is a summary of significant accounting policies followed in the preparation of these financial statements:
Principles of consolidation
- The accompanying consolidated financial statements include the accounts of First Cash Financial Services, Inc. and its wholly-owned subsidiaries. The Company regularly makes acquisitions and the results of operations for the acquired stores have been consolidated since the acquisition dates. All significant intercompany accounts and transactions have been eliminated. See Note
4
.
Cash and cash equivalents
- The Company considers any highly liquid investments with an original maturity of three months or less at the date of acquisition to be cash equivalents. As of
December 31, 2015
, the amount of cash associated with indefinitely reinvested foreign earnings was approximately
$77,067,000
.
Customer loans and revenue recognition
- Pawn loans typically have a term of
30
days and are secured by the customer’s pledge of tangible personal property. If a pawn loan defaults, the Company relies on the sale of pawned property to recover the principal amount of an unpaid pawn loan, plus a yield on the investment, because the Company’s pawn loans are non-recourse against the customer. The customer’s creditworthiness does not affect the Company’s financial position or results of operations. Generally, forfeited merchandise has historically sold for an amount in excess of the cost of goods sold (which is the cost basis in the loan or the amount paid for purchased merchandise) or fair value. The Company accrues pawn loan fee revenue on a constant-yield basis over the life of the pawn loan for all pawns for which the Company deems collection to be probable based on historical pawn redemption statistics. If the pawn is not repaid, the principal amount loaned becomes the carrying value of the forfeited collateral, which is recovered through sales to other customers at prices above the carrying value.
The Company’s pawn merchandise sales are primarily retail sales to the general public in its pawn stores. The Company acquires pawn merchandise inventory through forfeited pawns and through purchases of used goods directly from the general public. The Company also retails limited quantities of new or refurbished merchandise obtained directly from wholesalers and manufacturers. The Company records sales revenue at the time of the sale. The Company presents merchandise sales net of any sales or value-added taxes collected. The Company does not provide direct financing to customers for the purchase of its merchandise, but does permit its customers to purchase merchandise on an interest-free layaway plan. Should the customer fail to make a required payment pursuant to a layaway plan, the previous payments are forfeited to the Company. Interim payments from customers on layaway sales are recorded as deferred revenue and subsequently recorded as income during the period in which final payment is received or when previous payments are forfeited to the Company. Some jewelry is melted at a third-party facility and the precious metal content is sold at either prevailing market commodity prices or a previously agreed upon price with a commodity buyer. The Company records revenue from these transactions when a price has been agreed upon and the Company ships the jewelry to the buyer.
F-10
Consumer loans are unsecured cash advances and installment loans with terms that typically range from
7
to
365
days. The Company accrues consumer loan fees on a constant-yield basis over the term of the consumer loan. The Company offers a credit services product (“CSO Program”) to assist customers in obtaining an extension of credit from an independent, non-bank, consumer lending company (the “Independent Lender”). The Company’s CSO Program in Texas is licensed as a Credit Access Business (“CAB”) under Texas Finance Code Chapter 393 and regulated by the Texas Office of the Consumer Credit Commissioner. The Company recognizes credit services fees ratably over the life of the extension of credit made by the Independent Lender. The extensions of credit made by the Independent Lender to credit services customers of the Company have terms of
7
to
180
days.
Credit loss provisions
- The Company has determined no allowance related to credit losses on pawn loans is required as the fair value of the pledged collateral is significantly in excess of the pawn loan amount. The Company maintains an allowance for credit losses on consumer loans on an aggregate basis at a level it considers sufficient to cover estimated losses in the collection of its consumer loans. The allowance for credit losses is based primarily upon historical credit loss experience, with consideration given to recent credit loss trends and changes in loan characteristics (e.g., average amount financed and term), delinquency levels, collateral values, economic conditions and underwriting and collection practices. The Company considers consumer loans to be in default if they are not repaid on the due date and writes off the principal amount and service charge receivable as of the default date. Net defaults and changes in the consumer loan allowance are charged to the consumer loan loss provision.
Under the CSO Program, the Company issues the Independent Lender a letter of credit to guarantee the repayment of the extension of credit. These letters of credit constitute a guarantee for which the Company is required to recognize, at the inception of the guarantee, a liability for the fair value of the obligation undertaken by issuing the letters of credit. According to the letter of credit, if the borrower defaults on the extension of credit, the Company will pay the Independent Lender the principal, accrued interest, insufficient funds fee, and late fee, all of which the Company records as a component of its credit loss provision. The Company is entitled to seek recovery, directly from its customers, of the amounts it pays the Independent Lender in performing under the letters of credit. The Company records the estimated fair value of the liability under the letters of credit in accrued liabilities. The allowances for credit losses and the estimated fair value of the liability under the letters of credit are periodically reviewed by management with any changes reflected in current operations. Although it is at least reasonably possible that events or circumstances could occur in the future that are not presently foreseen which could cause actual credit losses to be materially different from the recorded allowance for credit losses, the Company believes it has given appropriate consideration to all relevant factors and has made reasonable assumptions in determining the allowance for credit losses.
Changes in the liability for credit services losses are as follows (in thousands):
|
Year Ended December 31,
|
|||||||||||
|
|
2015
|
2014
|
2013
|
||||||||
|
Balance at beginning of year
|
$
|
493
|
|
$
|
580
|
|
$
|
669
|
|
||
|
Provision for credit losses under letters of credit
|
6,351
|
|
8,080
|
|
9,899
|
|
|||||
|
Amounts paid to Independent Lender under letters of credit, net of recoveries from customers
|
(6,346
|
)
|
(8,167
|
)
|
(9,988
|
)
|
|||||
|
Balance at end of year
|
$
|
498
|
|
$
|
493
|
|
$
|
580
|
|
||
Foreign currency transactions
- The Company has significant operations in Mexico, and Guatemala to a lesser extent, where the functional currency is the Mexican peso and Guatemalan quetzal, respectively. Accordingly, the assets and liabilities of these subsidiaries are translated into U.S. dollars at the exchange rate in effect at each balance sheet date, and the resulting adjustments are accumulated in other comprehensive income (loss) as a separate component of stockholders’ equity. Revenue and expenses are translated at the average exchange rates occurring during the respective fiscal period. Prior to translation, U.S. dollar-denominated transactions of the foreign subsidiaries are remeasured into their functional currency using current rates of exchange for monetary assets and liabilities and historical rates of exchange for non-monetary assets and liabilities. Gains and losses from remeasurement of dollar-denominated monetary assets and liabilities in Mexico and Guatemala are included in store operating expenses. Deferred taxes are not currently provided on cumulative foreign currency translation adjustments as the Company indefinitely reinvests earnings of its foreign subsidiaries.
The average value of the Mexican peso to the U.S. dollar exchange rate for fiscal 2015 was
15.8
to
1
, compared to
13.3
to
1
in fiscal 2014 and
12.8
to
1
in fiscal 2013. In fiscal 2016, through
February 12, 2016
, the average exchange rate was
18.1
to
1
, which equates to a
15%
decline as compared to the average value for fiscal 2015 of
15.8
to
1
.
Store operating expenses
- Costs incurred in operating the pawn stores and consumer loan stores have been classified as store operating expenses. Operating expenses include salary and benefit expense of store-level employees, occupancy costs, bank charges, security, insurance, utilities, supplies, cash shortages and other costs incurred by the stores.
F-11
Layaway and deferred revenue
- Interim payments from customers on layaway sales are credited to deferred revenue and subsequently recorded as income during the period in which final payment is received or when the previous payments are forfeited to the Company.
Inventories
- Inventories represent merchandise acquired from forfeited pawns and merchandise purchased directly from the general public. The Company also retails limited quantities of new or refurbished merchandise obtained directly from wholesalers and manufacturers. Inventories from forfeited pawns are recorded at the amount of the pawn principal on the unredeemed goods, exclusive of accrued interest. Inventories purchased directly from customers, wholesalers and manufacturers are recorded at cost. The cost of inventories is determined on the specific identification method. Inventories are stated at the lower of cost or market value and, accordingly, inventory valuation allowances are established when inventory carrying values are in excess of estimated selling prices, net of direct costs of disposal. Management has evaluated inventories and determined that a valuation allowance is not necessary.
Property and equipment
- Property and equipment are recorded at cost. Depreciation is recorded on the straight-line method based on estimated useful lives of
30
years for buildings and
three
to
five
years for equipment. The costs of improvements on leased stores are capitalized as leasehold improvements and are amortized on the straight-line method over the applicable lease period, or useful life, if shorter. Maintenance and repairs are charged to expense as incurred; renewals and betterments are charged to the appropriate property and equipment accounts. Upon sale or retirement of depreciable assets, the cost and related accumulated depreciation is removed from the accounts, and the resulting gain or loss is included in the results of operations in the period the assets are sold or retired.
Goodwill
- Goodwill represents the excess of the purchase price over the fair value of the net assets acquired in each business combination. The Company performs its goodwill impairment assessment annually as of December 31, and between annual assessments if an event occurs or circumstances change that would more likely than not reduce the fair value of a reporting unit below its carrying amount. The Company’s reporting units, which are tested for impairment, are U.S. pawn operations, U.S. consumer loan operations and Latin America pawn and consumer loan operations. The Company assesses goodwill for impairment at a reporting unit level by first assessing a range of qualitative factors, including, but not limited to, macroeconomic conditions, industry conditions, the competitive environment, changes in the market for the Company’s products and services, regulatory and political developments, entity specific factors, such as strategy and changes in key personnel, and overall financial performance. If, after completing this assessment, it is determined that it is more likely than not that the fair value of a reporting unit is less than its carrying value, the Company proceeds to the two-step impairment testing methodology. As described in Note
13
, the Company recorded a goodwill impairment charge related to its U.S. consumer loan operations reporting unit of
$7,913,000
in fiscal 2015.
Long-lived assets
- Property and equipment and non-current assets are reviewed for impairment whenever events or changes in circumstances indicate that the net book value of the asset may not be recoverable. An impairment loss is recognized if the sum of the expected future cash flows (undiscounted and before interest) from the use of the asset is less than the net book value of the asset. Generally, the amount of the impairment loss is measured as the difference between the net book value of the asset and the estimated fair value of the related asset. The Company has not recorded any material impairment loss for the fiscal years ended December 31,
2015
,
2014
and
2013
.
Fair value of financial instruments
- The fair value of financial instruments is determined by reference to various market data and other valuation techniques, as appropriate. Financial assets and liabilities are classified based on the lowest level of input that is significant to the fair value measurement. The Company’s assessment of the significance of a particular input to the fair value measurement requires judgment, and may affect the valuation of the fair value of assets and liabilities and their placement within the fair value hierarchy levels. All fair value measurements related to acquisitions are level 3, non-recurring measurements, based on non-observable inputs. Unless otherwise disclosed, the fair values of financial instruments approximate their recorded values, due primarily to their short-term nature. See Note
6
.
Income taxes
- The Company uses the liability method of computing deferred income taxes on all material temporary differences. Temporary differences are the differences between the reported amounts of assets and liabilities and their tax bases. See Note
11
.
Advertising
- The Company expenses the costs of advertising the first time the advertising takes place. Advertising expense from continuing operations for the fiscal years ended December 31,
2015
,
2014
and
2013
, was
$679,000
,
$1,328,000
, and
$2,244,000
, respectively.
F-12
Share-based compensation
- All share-based payments to employees are recognized in the financial statements based on the grant date or subsequent modification date, if applicable, fair value. The Company recognizes compensation cost net of estimated forfeitures and recognizes the compensation cost for only those awards expected to vest on a straight-line basis over the requisite service period of the award, which is generally the vesting term. The Company records share-based compensation cost as an administrative expense. The Company applied the alternative transition method in calculating its pool of excess tax benefits available to absorb future tax deficiencies. See Note
14
.
Earnings per share
- Basic income per share is computed by dividing income by the weighted-average number of shares outstanding during the year. Diluted income per share is calculated by giving effect to the potential dilution that could occur if securities or other contracts to issue common shares were exercised and converted into common shares during the year.
The following table sets forth the computation of basic and diluted earnings per share (in thousands, except per share data):
|
Year Ended December 31,
|
|||||||||||
|
|
2015
|
2014
|
2013
|
||||||||
|
Numerator:
|
|
|
|
||||||||
|
Income from continuing operations for calculating basic and diluted earnings per share
|
$
|
60,710
|
|
$
|
85,438
|
|
$
|
84,479
|
|
||
|
Loss from discontinued operations
|
—
|
|
(272
|
)
|
(633
|
)
|
|||||
|
Net income for calculating basic and diluted earnings per share
|
$
|
60,710
|
|
$
|
85,166
|
|
$
|
83,846
|
|
||
|
Denominator:
|
|
|
|
||||||||
|
Weighted-average common shares for calculating basic earnings per share
|
28,138
|
|
28,671
|
|
29,079
|
|
|||||
|
Effect of dilutive securities:
|
|
|
|
||||||||
|
Stock options and nonvested awards
|
188
|
|
399
|
|
495
|
|
|||||
|
Weighted-average common shares for calculating diluted earnings per share
|
28,326
|
|
29,070
|
|
29,574
|
|
|||||
|
Basic earnings per share:
|
|
|
|
||||||||
|
Income from continuing operations
|
$
|
2.16
|
|
$
|
2.98
|
|
$
|
2.91
|
|
||
|
Loss from discontinued operations
|
—
|
|
(0.01
|
)
|
(0.02
|
)
|
|||||
|
Net income per basic share
|
$
|
2.16
|
|
$
|
2.97
|
|
$
|
2.89
|
|
||
|
Diluted earnings per share:
|
|
|
|
||||||||
|
Income from continuing operations
|
$
|
2.14
|
|
$
|
2.94
|
|
$
|
2.86
|
|
||
|
Loss from discontinued operations
|
—
|
|
(0.01
|
)
|
(0.02
|
)
|
|||||
|
Net income per diluted share
|
$
|
2.14
|
|
$
|
2.93
|
|
$
|
2.84
|
|
||
Pervasiveness of estimates
- The preparation of financial statements in conformity with accounting principles generally accepted in the United States of America requires management to make estimates and assumptions that affect the reported amounts of assets and liabilities, and related revenue and expenses, and the disclosure of gain and loss contingencies at the date of the financial statements. Such estimates and assumptions are subject to a number of risks and uncertainties, which may cause actual results to differ materially from the Company’s estimates. Significant estimates include allowances for doubtful accounts receivable and related credit loss provisions, impairment of goodwill and current and deferred tax assets and liabilities.
Revisions and reclassifications
- Certain amounts for the years ended December 31,
2014
and
2013
have been reclassified in order to conform to the
2015
presentation. See “—Recent accounting pronouncements” below regarding the impact of the Company’s adoption of ASU 2015-17, “Balance Sheet Classification of Deferred Taxes” (“ASU 2015-17”) on the classification of deferred tax assets and liabilities in the Company’s consolidated balance sheets. Also, see Note
18
for a discussion of reclassifications made to the condensed consolidating guarantor financial statements.
F-13
The Company revised certain previously reported amounts for the years ended December 31, 2014 and 2013 for the correction of prior period errors. ASC 740 “Income Taxes,” provides an exception to recording deferred tax attributes associated with foreign currency translation adjustments, which are recorded in comprehensive income. In July 2013, the Company terminated an election to include foreign subsidiaries in its consolidated U.S. federal income tax return and it is the Company’s intent to indefinitely reinvest the earnings of these subsidiaries outside the U.S. The Company had incorrectly recorded a deferred tax asset on these accumulated foreign currency translation adjustments in prior periods. The correction of the error resulted in a reduction in comprehensive income of
$10,100,000
and
$4,010,000
for the years ended December 31, 2014 and 2013, respectively, and a
$14,110,000
reduction of deferred tax assets as of December 31, 2014 but had no impact on the Company’s consolidated statements of income or cash flows. In addition, see Note
18
for a description of revisions made to the condensed consolidating guarantor financial statements. The Company has evaluated the effects of these errors, both qualitatively and quantitatively, and concluded that they did not have a material impact on any previously issued financial statements or the full year results for fiscal 2015.
Recent accounting pronouncements
- In April 2014, the Financial Accounting Standards Board issued ASU No. 2014-08, “Presentation of Financial Statements (Topic 205) and Property, Plant, and Equipment (Topic 360)” (“ASU 2014-08”). ASU 2014-08 requires a disposal representing a strategic shift that has (or will have) a major effect on an entity’s financial results or a business activity classified as held for sale to be reported as discontinued operations. ASU 2014-08 also expands the disclosure requirements for discontinued operations and adds new disclosures for individually significant dispositions that do not qualify as discontinued operations. ASU 2014-08 is effective prospectively for fiscal years, and interim reporting periods within those years, beginning after December 15, 2014. The adoption of ASU 2014-08 did not have a material effect on the Company’s current financial position, results of operations or financial statement disclosures, however, it may impact the reporting of future discontinued operations if and when they occur.
In May 2014, the Financial Accounting Standards Board issued ASU No. 2014-09, “Revenue from Contracts with Customers (Topic 606)” (“ASU 2014-09”). ASU 2014-09 is a comprehensive new revenue recognition model that requires a company to recognize revenue to depict the transfer of goods or services to a customer at an amount that reflects the consideration it expects to receive in exchange for those goods or services. ASU 2014-09 also requires additional disclosure about the nature, amount, timing and uncertainty of revenue and cash flows arising from customer contracts, including significant judgments and changes in judgments and assets recognized from costs incurred to obtain or fulfill a contract. In August 2015, the Financial Accounting Standards Board issued ASU 2015-14, which delayed the effective date of ASU 2014-09 by one year resulting in it becoming effective for annual reporting periods (including interim periods within those periods) beginning after December 15, 2017 for public companies. Early adoption is permitted but not before annual reporting periods beginning after December 15, 2016. The Company is currently assessing the potential impact of ASU 2014-09 on its consolidated financial statements.
In April 2015, the Financial Accounting Standards Board issued ASU No. 2015-03, “Interest - Imputation of Interest (Subtopic 835-30): Simplifying the Presentation of Debt Issuance Costs” (“ASU 2015-03”). ASU 2015-03 requires debt issuance costs related to a recognized debt liability be presented in the balance sheet as a direct deduction from the carrying amount of the related debt liability instead of being presented as an asset. In August 2015, the Financial Accounting Standards Board issued ASU No. 2015-15, which clarified the guidance in ASU 2015-03 regarding presentation and subsequent measurement of debt issuance costs related to line of credit arrangements. The SEC Staff announced they would not object to an entity deferring and presenting debt issuance costs as an asset and subsequently amortizing the deferred debt issuance costs ratably over the term of the line of credit arrangement, regardless of whether there are any outstanding borrowings on the line of credit arrangement. ASU 2015-03 requires retrospective application and represents a change in accounting principle. ASU 2015-03 is effective for fiscal years beginning after December 15, 2015 and interim periods within those fiscal years. Early adoption is permitted for financial statements that have not been previously issued. The Company does not expect ASU 2015-03 to have a material effect on the Company’s results of operations, however, it will impact future balance sheet presentation and financial statement disclosures related to the Company’s debt issuance costs, upon adoption.
In July 2015, the Financial Accounting Standards Board issued ASU No. 2015-11, “Simplifying the Measurement of Inventory” (“ASU 2015-11”). ASU 2015-11 requires inventory be measured at the lower of cost or net realizable value. ASU 2015-11 defines net realizable value as the estimated selling price in the ordinary course of business, less reasonably predictable costs of completion, disposal, and transportation. Inventory measured using last-in, first-out (“LIFO”) or the retail inventory method are excluded from the scope of this update. ASU 2015-11 requires prospective application and is effective for fiscal years beginning after December 15, 2016 and interim periods within those fiscal years, with early adoption permitted. The Company does not expect ASU 2015-11 to have a material effect on the Company’s current financial position, results of operations or financial statement disclosures.
F-14
In September 2015, the Financial Accounting Standards Board issued ASU No. 2015-16, “Simplifying the Accounting for Measurement-Period Adjustments” (“ASU 2015-16”). ASU 2015-16 requires that an acquirer recognize adjustments to provisional amounts that are identified during the measurement period in the reporting period in which the adjustment amount is determined. ASU 2015-16 is effective prospectively for fiscal years, and interim reporting periods within those years, beginning on or after December 15, 2015. Early adoption is permitted for financial statements that have not been previously issued. The adoption of ASU 2015-16 did not have a material effect on the Company’s current financial position, results of operations or financial statement disclosures.
In November 2015, the Financial Accounting Standards Board issued ASU 2015-17. ASU 2015-17 provides presentation requirements to classify deferred tax assets and liabilities as noncurrent in a classified statement of financial position. ASU 2015-17 is effective for annual reporting periods, and interim periods therein, beginning after December 15, 2016. ASU 2015-17 may be applied either prospectively or retrospectively to all periods presented. Early adoption is permitted for any interim and annual financial statements that have not yet been issued. The Company adopted ASU 2015-17 as of December 31, 2015, retrospectively. After the impact of the revision to deferred tax assets described in “Revisions and reclassifications” above, the adoption of ASU 2015-17 resulted in a
$7,122,000
decrease in current deferred tax assets, a
$9,070,000
increase in non-current deferred tax assets and a
$1,948,000
increase in non-current deferred tax liabilities in the Company’s consolidated balance sheet at December 31, 2014. The adoption of ASU 2015-17 did not have an effect on the Company’s results of operations.
NOTE
3
-
CAPITAL STOCK
In January 2013, the Company's Board of Directors authorized a repurchase program for up to
1,500,000
shares of the Company's outstanding common stock. The Company completed the
1,500,000
share repurchase program on August 21, 2014, with a total of
729,000
shares of its common stock repurchased during fiscal 2013 and
771,000
shares repurchased during fiscal 2014. The total shares repurchased were at an average price of
$55.09
per share.
In January 2015, the Company’s Board of Directors authorized a new repurchase program for up to
2,000,000
shares of the Company’s outstanding common stock. The Board of Directors made this determination after considering the Company's liquidity needs and capital resources as well as the estimated current value of the Company's assets. During fiscal
2015
, the Company repurchased
852,000
shares of its common stock at an aggregate cost of
$39,974,000
at an average price of
$46.94
per share and
1,148,000
shares remain available for repurchase under the repurchase program. Under its new share repurchase program, the Company can purchase common stock in open market transactions, block or privately negotiated transactions, and may from time to time purchase shares pursuant to a trading plan in accordance with Rule 10b5-1 and Rule 10b-18 under the Exchange Act, or by any combination of such methods. The number of shares to be purchased and the timing of the purchases are based on a variety of factors, including, but not limited to, the level of cash balances, credit availability, debt covenant restrictions, general business conditions, regulatory requirements, the market price of the Company's stock and the availability of alternative investment opportunities. No time limit was set for completion of repurchases under the new authorization and the program may be suspended or discontinued at any time.
NOTE
4
-
ACQUISITIONS
2015 Acquisitions
The Company completed acquisitions during fiscal
2015
as described below consistent with its strategy to continue its expansion of pawn stores in selected markets. The purchase price of each acquisition was allocated to assets and liabilities acquired based upon their estimated fair market values at the date of acquisition. The excess purchase price over the estimated fair market value of the net assets acquired has been recorded as goodwill. The goodwill arising from these acquisitions consist largely of the synergies and economies of scale expected from combining the operations of the Company and the pawn stores acquired.
On December 31, 2015, the Company acquired the stock of Maxi Prenda Guatemala, S.A., the operating entity owning the pawn loans, inventory, layaways and other operating assets and liabilities of
32
full-service pawn stores located in Guatemala (the “Latin America Acquisition”). The purchase price for the all-cash transaction was
$10,445,000
, net of cash acquired and subject to certain post-closing adjustments. The estimated fair values of the assets acquired and liabilities assumed are preliminary, as the Company is gathering information to finalize the valuation of these assets and liabilities. As this acquisition was completed on December 31, 2015, there was no impact on the Company’s consolidated statements of income. This was the first step in a multi-stage acquisition which was completed in February 2016 and is further described in Note
19
.
F-15
During fiscal
2015
,
33
pawn stores located in
six
U.S. states were acquired by the Company in
seven
separate asset purchase transactions (“U.S. Acquisitions”) for an aggregate purchase price of
$35,592,000
, net of cash acquired, and was composed of
$35,017,000
in cash paid during fiscal
2015
and payables to the sellers of
$575,000
. During fiscal
2015
, the Company also paid
$1,425,000
of purchase price amounts payable related to prior-year acquisitions.
The preliminary allocations of the purchase prices for the Company’s acquisitions during 2015 (the “2015 acquisitions”) are as follows (in thousands):
|
U.S.
Acquisitions |
Latin America
Acquisition
|
Total
|
|||||||||
|
Pawn loans
|
$
|
4,159
|
|
$
|
2,686
|
|
$
|
6,845
|
|
||
|
Pawn loan fees and service charges receivable
|
270
|
|
268
|
|
538
|
|
|||||
|
Inventory
|
2,991
|
|
929
|
|
3,920
|
|
|||||
|
Other current assets
|
17
|
|
2,634
|
|
2,651
|
|
|||||
|
Property and equipment
|
345
|
|
1,271
|
|
1,616
|
|
|||||
|
Goodwill (1)
|
27,654
|
|
3,039
|
|
30,693
|
|
|||||
|
Intangible assets (2)
|
553
|
|
105
|
|
658
|
|
|||||
|
Other non-current assets
|
7
|
|
78
|
|
85
|
|
|||||
|
Deferred tax assets
|
—
|
|
272
|
|
272
|
|
|||||
|
Current liabilities
|
(404
|
)
|
(837
|
)
|
(1,241
|
)
|
|||||
|
Purchase price
|
$
|
35,592
|
|
$
|
10,445
|
|
$
|
46,037
|
|
||
|
(1)
|
Substantially all of the goodwill for the U.S. Acquisitions is expected to be deductible for U.S. income tax purposes. However, the goodwill for the Latin America Acquisition is not expected to be deductible for Guatemalan income tax purposes.
|
|
(2)
|
Intangible assets primarily consist of customer relationships, which are included in other non-current assets in the accompanying consolidated balance sheets. Customer relationships are generally amortized over
five
years.
|
During fiscal
2015
, revenue from the 2015 acquisitions since the respective acquisition dates was
$11,194,000
. During fiscal
2015
, the net loss from the
2015
acquisitions since the acquisition dates (including acquisition and integration costs) was
$964,000
. Combined transaction and integration costs related to the
2015
acquisitions were approximately
$2,875,000
, which are primarily included in administrative expenses in the accompanying consolidated statements of income.
The following unaudited pro forma financial information reflects the consolidated results of operations of the Company as if all the above acquisitions had occurred on
January 1, 2014
. The unaudited pro forma financial information has been prepared for informational purposes only and does not purport to be indicative of what would have resulted had the acquisition occurred on the date indicated or what may result in the future (in thousands, except per share data):
|
|
Year Ended
|
Year Ended
|
||||||||||||||
|
December 31, 2015
|
December 31, 2014
|
|||||||||||||||
|
|
As Reported
|
Pro Forma
|
As Reported
|
Pro Forma
|
||||||||||||
|
Total revenue
|
$
|
704,602
|
|
$
|
732,097
|
|
$
|
712,877
|
|
$
|
751,873
|
|
||||
|
Net income
|
60,710
|
|
62,692
|
|
85,166
|
|
88,647
|
|
||||||||
|
Net income per share:
|
|
|
|
|
||||||||||||
|
Basic
|
$
|
2.16
|
|
$
|
2.23
|
|
$
|
2.97
|
|
$
|
3.09
|
|
||||
|
Diluted
|
2.14
|
|
2.21
|
|
2.93
|
|
3.05
|
|
||||||||
2014 Acquisitions
The Company completed acquisitions during fiscal 2014 as described below consistent with its strategy to continue its expansion of pawn stores in selected markets. The purchase price of each acquisition was allocated to assets and liabilities acquired based upon their estimated fair market values at the date of acquisition. The excess purchase price over the estimated fair market value of the net assets acquired has been recorded as goodwill. The goodwill arising from these acquisitions consist largely of the synergies and economies of scale expected from combining the operations of the Company and the pawn stores acquired.
F-16
In October 2014, the Company acquired from Windmill Acquisition Group, LLC, PHC Holding Group, LLC and PGC Holdings, LLC (collectively, the principal owners) the pawn loans, inventory, layaways and certain other operating assets and liabilities of
15
pawn stores located in Kentucky, Tennessee, Missouri and South Carolina. The purchase price for the all-cash transaction was
$25,344,000
, net of cash acquired and subject to certain working capital adjustments, and was composed of
$23,744,000
in cash paid at closing and an additional
$1,600,000
payable to the sellers, all of which had been repaid as of December 31, 2015.
In August 2014, the Company acquired from Cash America of Mexico, Inc. the operating entities owning the pawn loans, inventory, layaways and other operating assets and liabilities of
47
pawn stores located in
13
states in Mexico. The purchase price for the all-cash transaction was approximately
$18,481,000
, net of cash acquired and subject to certain working capital adjustments.
Additionally, during fiscal 2014,
ten
pawn stores located in
two
U.S. states were acquired by the Company in
three
separate asset purchase transactions for an aggregate purchase price of
$14,534,000
, net of cash acquired, and was composed of
$14,384,000
in cash and payables to the sellers of
$150,000
, all of which had been repaid as of December 31, 2015. During fiscal 2014, the Company also paid
$2,008,000
of amounts payable related to prior-year acquisitions.
NOTE
5
-
DISCONTINUED OPERATIONS
The Company’s strategy has been to grow its pawn operations while reducing the percentage of revenue from other consumer loan and credit services products. As a result, the Company discontinued the operations of the Cash & Go, Ltd. joint venture, a consolidated
50%
-owned subsidiary, which owned and operated
37
check cashing and financial services kiosks located inside convenience stores in the state of Texas. The Company recorded an after-tax loss for Cash & Go, Ltd. of
$272,000
, or
$0.01
per share, in fiscal 2014, which was reported as a loss from discontinued operations. In fiscal 2013, the Company recorded a charge of
$844,000
, net of tax, or
$0.03
per share, and after-tax earnings from operations for Cash & Go, Ltd. were
$211,000
, or
$0.01
per share.
All revenue, expenses and income reported in these financial statements have been adjusted to reflect the reclassification of all discontinued operations. The carrying amounts of the assets and liabilities for discontinued operations at December 31, 2013 were immaterial.
The following table summarizes the operating results, including gains or losses from dispositions, of all the operations which have been reclassified as discontinued operations in the consolidated statements of operations for the years ended
December 31, 2015
,
2014
and
2013
(in thousands, except per share data):
|
Year Ended December 31,
|
|||||||||||
|
2015
|
2014
|
2013
|
|||||||||
|
Consumer loan and credit services fees
|
$
|
—
|
|
$
|
124
|
|
$
|
3,337
|
|
||
|
Consumer loan and credit services loss provision
|
—
|
|
(120
|
)
|
(691
|
)
|
|||||
|
Net revenue
|
—
|
|
4
|
|
2,646
|
|
|||||
|
Expenses and other losses:
|
|
|
|||||||||
|
Operating and administrative expenses
|
—
|
|
423
|
|
2,322
|
|
|||||
|
Loss on disposition of consumer loan stores
|
—
|
|
—
|
|
1,298
|
|
|||||
|
Total expenses and other losses
|
—
|
|
423
|
|
3,620
|
|
|||||
|
Loss from discontinued operations before income taxes
|
—
|
|
(419
|
)
|
(974
|
)
|
|||||
|
Tax benefit
|
—
|
|
147
|
|
341
|
|
|||||
|
Loss from discontinued operations, net of tax
|
$
|
—
|
|
$
|
(272
|
)
|
$
|
(633
|
)
|
||
|
Loss from discontinued operations (basic)
|
$
|
—
|
|
$
|
(0.01
|
)
|
$
|
(0.02
|
)
|
||
|
Loss from discontinued operations (diluted)
|
$
|
—
|
|
$
|
(0.01
|
)
|
$
|
(0.02
|
)
|
||
F-17
NOTE
6
-
FAIR VALUE OF FINANCIAL INSTRUMENTS
The fair value of financial instruments is determined by reference to various market data and other valuation techniques, as appropriate. Financial assets and liabilities are classified based on the lowest level of input that is significant to the fair value measurement. The Company's assessment of the significance of a particular input to the fair value measurement requires judgment, and may affect the valuation of the fair value of assets and liabilities and their placement within the fair value hierarchy levels. The three fair value levels are (from highest to lowest):
Level 1: Quoted market prices in active markets for identical assets or liabilities.
Level 2: Observable market-based inputs or unobservable inputs that are corroborated by market data.
Level 3: Unobservable inputs that are not corroborated by market data.
As cash and cash equivalents have maturities of less than three months, the carrying values of cash and cash equivalents approximate fair value (Level 1 of the fair value hierarchy). Due to their short-term maturities, pawn loans, consumer loans (net), pawn loan fees and service charges receivable approximate fair value (Level 3 of the fair value hierarchy).
The carrying value of the Company’s prior credit facility (the 2014 Credit Facility described in Note
10
) approximated fair value as of December 31, 2014. The carrying value of the Company’s current credit facilities (the 2015 Credit Facility and the Mexico Credit Facility described in Note
10
) approximated fair value as of
December 31, 2015
. The fair value of the Company’s
6.75%
senior notes was approximately
$199,000,000
and
$207,000,000
as of
December 31, 2015
and
December 31, 2014
, respectively, compared to a carrying value of
$200,000,000
. These fair values have been estimated based on a discounted cash flow analysis using a discount rate representing the Company’s estimate of the rate that would be used by market participants (Level 2 of the fair value hierarchy). Changes in assumptions or estimation methodologies may have a material effect on these estimated fair values.
NOTE
7
-
CUSTOMER LOANS AND VALUATION ACCOUNTS
Customer loans, net of unearned finance fees, consist of the following (in thousands):
|
Pawn
|
Consumer Loan
|
Total
|
|||||||||
|
December 31, 2015
|
|||||||||||
|
Total customer loans
|
$
|
117,601
|
|
$
|
1,184
|
|
$
|
118,785
|
|
||
|
Less allowance for doubtful accounts
|
—
|
|
(66
|
)
|
(66
|
)
|
|||||
|
$
|
117,601
|
|
$
|
1,118
|
|
$
|
118,719
|
|
|||
|
December 31, 2014
|
|||||||||||
|
Total customer loans
|
$
|
118,536
|
|
$
|
1,322
|
|
$
|
119,858
|
|
||
|
Less allowance for doubtful accounts
|
—
|
|
(81
|
)
|
(81
|
)
|
|||||
|
$
|
118,536
|
|
$
|
1,241
|
|
$
|
119,777
|
|
|||
NOTE
8
-
PROPERTY AND EQUIPMENT
Property and equipment used in continuing operations consist of the following (in thousands):
|
Year Ended December 31,
|
|||||||
|
2015
|
2014
|
||||||
|
Land
|
$
|
14,309
|
|
$
|
12,171
|
|
|
|
Buildings
|
19,261
|
|
18,494
|
|
|||
|
Furniture, fixtures, equipment and leasehold improvements
|
186,697
|
|
188,680
|
|
|||
|
220,267
|
|
219,345
|
|
||||
|
Less: accumulated depreciation
|
(107,820
|
)
|
(105,595
|
)
|
|||
|
$
|
112,447
|
|
$
|
113,750
|
|
||
F-18
Depreciation expense from continuing operations for the fiscal years ended
December 31, 2015
,
2014
and
2013
, was
$16,140,000
,
$15,947,000
, and
$14,285,000
, respectively.
NOTE
9
-
ACCOUNTS PAYABLE AND ACCRUED LIABILITIES
Accounts payable and accrued liabilities consist of the following (in thousands):
|
Year Ended December 31,
|
|||||||
|
2015
|
2014
|
||||||
|
Deferred layaway sales revenue
|
$
|
13,747
|
|
$
|
13,573
|
|
|
|
Accrued compensation
|
7,438
|
|
10,010
|
|
|||
|
Sales, property, and payroll withholding taxes payable
|
6,473
|
|
6,045
|
|
|||
|
Accrued interest payable
|
3,476
|
|
3,379
|
|
|||
|
Trade accounts payable
|
1,823
|
|
2,148
|
|
|||
|
Benefits liabilities and withholding payable
|
1,079
|
|
439
|
|
|||
|
Reserves for expected losses on outstanding CSO letters of credit
|
498
|
|
493
|
|
|||
|
Other accrued liabilities
|
7,718
|
|
6,472
|
|
|||
|
$
|
42,252
|
|
$
|
42,559
|
|
||
NOTE
10
-
LONG-TERM DEBT
As of
December 31, 2015
, annual maturities of the outstanding long-term debt for each of the five years after
December 31, 2015
are as follows (in thousands):
|
Fiscal
|
|||
|
2016
|
$
|
—
|
|
|
2017
|
—
|
|
|
|
2018
|
—
|
|
|
|
2019
|
—
|
|
|
|
2020
|
58,000
|
|
|
|
Thereafter
|
200,000
|
|
|
|
$
|
258,000
|
|
|
Senior Unsecured Notes
On March 24, 2014, the Company issued
$200,000,000
of
6.75%
senior notes due on April 1, 2021 (the “Notes”). Interest on the Notes is payable semi-annually in arrears on April 1 and October 1. The Notes are fully and unconditionally guaranteed on a senior unsecured basis jointly and severally by all of the Company's existing and future domestic subsidiaries that guarantee the 2015 Credit Facility. The Notes permit the Company to make certain restricted payments, such as repurchasing shares of its stock and paying cash dividends, within certain parameters, the most restrictive of which generally limits such restricted payments to
50%
of adjusted net income.
Revolving Credit Facilities
During the period from January 1, 2015 through October 29, 2015, the Company maintained a revolving line credit agreement with a group of U.S. based commercial lenders (the “2014 Credit Facility”) in the amount of
$160,000,000
, which was scheduled to mature in
February 2019
. The 2014 Credit Facility charged interest, at the Company’s option, at either (1) the prevailing London Interbank Offered Rate (“LIBOR”) (with interest periods of 1, 2, 3 or 6 months at the Company’s option) plus a fixed spread of
2.5%
or (2) the prevailing prime or base rate plus a fixed spread of
1.5%
.
On October 30, 2015, the Company entered into an agreement to amend and extend its existing bank credit facility (as amended, the “2015 Credit Facility”). The total lender commitment under the 2015 Credit Facility was increased from
$160,000,000
to
$210,000,000
and the number of participating lenders increased from
four
to
five
. Additionally, the term of the 2015 Credit Facility was extended through
October 2020
. At
December 31, 2015
, the Company had
$58,000,000
outstanding under the 2015 Credit Facility and
$152,000,000
was available for borrowings. The 2015 Credit Facility continues to bear interest, at the Company’s option, at either (i) the prevailing LIBOR (with interest periods of 1, 2, 3 or 6 months at the Company’s option) plus a fixed spread
F-19
of
2.5%
or (ii) the prevailing prime or base rate plus a fixed spread of
1.5%
. The 2015 Credit Facility establishes a minimum LIBOR rate of
0%
. The weighted-average interest rate on amounts outstanding under the 2015 Credit Facility at
December 31, 2015
was
2.83%
based on the prevailing 30-day LIBOR rate. The 2015 Credit Facility requires the Company to maintain certain financial ratios and comply with certain financial covenants and allows the Company to make certain restricted payments, such as repurchasing shares of its stock and paying cash dividends, within certain parameters, provided the Company maintains compliance with those financial ratios and covenants after giving effect to such restricted payments. The Company is required to pay an annual commitment fee of
0.50%
on the average daily unused portion of the 2015 Credit Facility commitment. The 2015 Credit Facility limits the Company’s ability to incur additional indebtedness, subject to customary exceptions, including permitted additional unsecured debt so long as the aggregate principal amount of the loans and commitments under the 2015 Credit Facility plus such additional unsecured debt plus foreign third-party loans does not in the aggregate exceed
$500,000,000
. The 2015 Credit Facility is unsecured except for the pledge of
65%
of the voting equity interests of the Company’s foreign subsidiaries, and the Company is restricted from pledging any of its other assets as collateral against other indebtedness. The 2015 Credit Facility is guaranteed by the Company’s material U.S. operating subsidiaries. The 2015 Credit Facility was amended to reduce the threshold percentage of domestic operations represented by domestic guarantors from
90%
to
85%
of total domestic revenues and assets, and the Company added
two
additional domestic operating subsidiaries as guarantors of the 2015 Credit Facility. The 2015 Credit Facility was also amended to eliminate an adjustment for deferred tax effects from the fixed charge covenant calculation. The Company was in compliance with the requirements and covenants of the 2015 Credit Facility as of
December 31, 2015
. During fiscal
2015
, the
Company
had net proceeds
of
$35,600,000
from borrowings pursuant to
the 2015 Credit Facility.
On March 9, 2015, the Company entered into an agreement with a bank in Mexico to establish a revolving credit facility (the “Mexico Credit Facility”) in the amount of
$10,000,000
. The Mexico Credit Facility bears interest at the prevailing 30-day LIBOR rate plus a fixed spread of
2.0%
and matures in
December 2017
. Under the terms of the Mexico Credit Facility, the Company is required to maintain certain financial ratios and comply with certain financial covenants. The Company is required to pay a one-time commitment fee of
$25,000
due when the first amount is drawn/borrowed. At
December 31, 2015
, the Company had no amount outstanding under the Mexico Credit Facility and
$10,000,000
was available for borrowings.
Other Notes Payable
In March 2014, the Company used
$7,541,000
of the proceeds from the sale of the Notes to repay the entire remaining balances on notes payable of
$6,134,000
related to a September 2012 multi-store acquisition and a note payable of
$1,407,000
related to a January 2012 multi-store acquisition.
F-20
NOTE
11
-
INCOME TAXES
Components of the provision for income taxes and the income to which it relates for the years ended
December 31, 2015
,
2014
and
2013
consist of the following (in thousands):
|
Year Ended December 31,
|
|||||||||||
|
2015
|
2014
|
2013
|
|||||||||
|
Income from continuing operations before income taxes (1):
|
|||||||||||
|
Domestic
|
$
|
27,599
|
|
$
|
50,984
|
|
$
|
43,936
|
|
||
|
Foreign
|
60,082
|
|
65,996
|
|
76,256
|
|
|||||
|
Income from continuing operations before income taxes
|
$
|
87,681
|
|
$
|
116,980
|
|
$
|
120,192
|
|
||
|
Current income taxes:
|
|||||||||||
|
Federal
|
$
|
7,933
|
|
$
|
11,494
|
|
$
|
22,468
|
|
||
|
Foreign
|
18,763
|
|
17,823
|
|
20,392
|
|
|||||
|
State and local
|
705
|
|
1,097
|
|
781
|
|
|||||
|
Current provision for income taxes
|
27,401
|
|
30,414
|
|
43,641
|
|
|||||
|
Deferred provision (benefit) for income taxes:
|
|||||||||||
|
Federal
|
931
|
|
2,232
|
|
(799
|
)
|
|||||
|
Foreign
|
(1,414
|
)
|
(1,232
|
)
|
(7,218
|
)
|
|||||
|
State and local
|
53
|
|
128
|
|
89
|
|
|||||
|
Total deferred provision (benefit) for income taxes
|
(430
|
)
|
1,128
|
|
(7,928
|
)
|
|||||
|
Provision for income taxes
|
$
|
26,971
|
|
$
|
31,542
|
|
$
|
35,713
|
|
||
|
(1)
|
Includes the allocation of certain administrative expenses and the payment of royalties between domestic and foreign subsidiaries.
|
The provision for income taxes related to discontinued operations was a
$0
,
$147,000
and
$341,000
benefit for the years ended
December 31, 2015
,
2014
and
2013
, respectively.
In July 2013, the Company terminated an election to include foreign subsidiaries in its consolidated U.S. federal income tax return (the “Tax Restructuring”) and it is the Company’s intent to indefinitely reinvest the earnings of these subsidiaries outside the U.S. Accordingly, under U.S. income tax law, as of December 31, 2015, the undistributed earnings of the foreign subsidiaries are not subject to current U.S. federal income taxes. The cumulative amount of indefinitely reinvested earnings of foreign subsidiaries is
$101,961,000
at December 31, 2015. These earnings would be subject to additional U.S. taxes of
$6,507,000
if the earnings were repatriated into the U.S. for 2015.
As a result of the Tax Restructuring, the Company recognized an estimated non-recurring net income tax benefit of approximately
$3,979,000
during fiscal 2013 consisting of a
$3,436,000
income tax benefit from the elimination of certain U.S. deferred tax liabilities associated with foreign operations and an estimated
$5,398,000
income tax benefit arising from the recognition of certain foreign deferred tax assets, partially offset by an estimated
$4,855,000
in additional U.S. income tax expense. In 2014, the Company prepared and filed federal income tax returns in both the U.S. and Mexico for the fiscal 2013 tax year which reflected the effects of the Tax Restructuring, including changes in certain previously estimated current and deferred tax amounts. As a result, the Company recorded fiscal 2014 non-recurring income tax benefits of
$3,742,000
from the change in estimated U.S. income tax liabilities related to the Tax Restructuring and
$2,099,000
from the recognition of additional estimated foreign deferred tax assets as a result of the Tax Restructuring.
F-21
The principal deferred tax assets and liabilities consist of the following at
December 31, 2015
and
2014
(in thousands):
|
December 31,
|
|||||||
|
2015
|
2014
|
||||||
|
Deferred tax assets:
|
|||||||
|
Depreciation
|
$
|
5,652
|
|
$
|
6,010
|
|
|
|
Accrued fees on forfeited pawn loans
|
3,784
|
|
3,864
|
|
|||
|
Deferred cost of goods sold deduction
|
2,101
|
|
2,391
|
|
|||
|
Accrued compensation
|
859
|
|
778
|
|
|||
|
Share-based compensation
|
507
|
|
—
|
|
|||
|
Other
|
1,875
|
|
1,710
|
|
|||
|
Total deferred tax assets
|
14,778
|
|
14,753
|
|
|||
|
Deferred tax liabilities:
|
|||||||
|
Intangible asset amortization
|
22,761
|
|
21,443
|
|
|||
|
Depreciation
|
3,093
|
|
—
|
|
|||
|
Share-based compensation
|
—
|
|
222
|
|
|||
|
Other
|
1,067
|
|
1,241
|
|
|||
|
Total deferred tax liabilities
|
$
|
26,921
|
|
$
|
22,906
|
|
|
|
Net deferred tax liabilities
|
$
|
(12,143
|
)
|
$
|
(8,153
|
)
|
|
|
Reported as:
|
|||||||
|
Deferred tax assets
|
$
|
9,321
|
|
$
|
9,070
|
|
|
|
Deferred tax liabilities
|
(21,464
|
)
|
(17,223
|
)
|
|||
|
Net deferred tax liabilities
|
$
|
(12,143
|
)
|
$
|
(8,153
|
)
|
|
The Company has evaluated the nature and timing of its deferred tax assets and concluded that no valuation allowance is necessary. Also, see Note
2
Revisions and reclassifications
for a discussion of a revision made to the Company’s consolidated balance sheet as of December 31, 2014 impacting a previously reported deferred tax asset related to the cumulative foreign currency translation adjustment.
The effective rate on income from continuing operations differs from the U.S. federal statutory rate of
35%
. The following is a reconciliation of such differences (in thousands):
|
Year Ended December 31,
|
|||||||||||
|
2015
|
2014
|
2013
|
|||||||||
|
Tax at the U.S. federal statutory rate
|
$
|
30,688
|
|
$
|
40,943
|
|
$
|
42,067
|
|
||
|
State income taxes, net of federal tax benefit of
$265
, $429 and $273, respectively
|
493
|
|
796
|
|
508
|
|
|||||
|
Rate benefit from foreign earnings
|
(3,531
|
)
|
(4,576
|
)
|
(2,281
|
)
|
|||||
|
Net non-recurring benefit of Tax Restructuring
|
—
|
|
(5,841
|
)
|
(3,979
|
)
|
|||||
|
Other taxes and adjustments, net
|
(679
|
)
|
220
|
|
(602
|
)
|
|||||
|
Provision for income taxes
|
$
|
26,971
|
|
$
|
31,542
|
|
$
|
35,713
|
|
||
|
Effective tax rate
|
30.8
|
%
|
27.0
|
%
|
29.7
|
%
|
|||||
Prior to the Tax Restructuring in July 2013, the Company’s foreign operations were included in its consolidated U.S. federal income tax return and effectively taxed at the U.S. federal statutory rate of
35%
. Following the Tax Restructuring, the Company’s foreign operations are subject to their respective foreign statutory rates, which are lower than the U.S. federal statutory rate of
35%
. Excluding the net non-recurring benefits recorded in 2014 and 2013 related to the Tax Restructuring, the consolidated tax rate was
32.0%
and
33.0%
for fiscal 2014 and 2013, respectively, reflecting the blended statutory federal tax rates of
35%
in the U.S. and
30%
in Mexico.
F-22
The Company reviews the determination of whether tax benefits claimed or expected to be claimed on a tax return should be recorded in the financial statements. The Company may recognize the tax benefit from an uncertain tax position only if it is more likely than not that the tax position will be sustained on examination by the taxing authorities, based on the technical merits of the position. The tax benefits recognized in the financial statements from such a position are measured based on the largest benefit that has a greater than
fifty
percent likelihood of being realized upon ultimate settlement. Interest and penalties related to income tax liabilities that could arise would be classified as interest expense in the Company’s consolidated statements of income. There were no such interest or penalties for the fiscal years ended
December 31, 2015
,
2014
and
2013
.
As of
December 31, 2015
and
2014
, the Company had no unrecognized tax benefits and, therefore, the Company did not have a liability for accrued interest and penalties. The Company does not believe its unrecognized tax benefits will significantly change over the next twelve months.
The Company files federal income tax returns in the United States, Mexico and Guatemala, as well as multiple state and local income tax returns in the United States. The Company’s U.S. federal returns are not subject to examination for tax years prior to 2012. The Company’s U.S. state income tax returns are not subject to examination for the tax years prior to 2012 with the exception of
three
states, which are not subject to examination for tax years prior to 2011. With respect to federal tax returns in Mexico and Guatemala, the tax years prior to 2010 are closed to examination. There are no state income taxes in Mexico or Guatemala.
NOTE
12
-
COMMITMENTS AND CONTINGENCIES
Leases
The Company leases certain of its facilities and equipment under operating leases with terms generally ranging from
three
to
five
years. Most facility leases contain renewal options. Remaining future minimum rentals due under non-cancelable operating leases are as follows (in thousands):
|
Fiscal
|
|||
|
2016
|
$
|
42,641
|
|
|
2017
|
33,603
|
|
|
|
2018
|
25,902
|
|
|
|
2019
|
18,319
|
|
|
|
2020
|
9,924
|
|
|
|
Thereafter
|
14,779
|
|
|
|
$
|
145,168
|
|
|
Rent expense from continuing operations under such leases was
$49,959,000
,
$46,220,000
and
$40,484,000
for the years ended
December 31, 2015
,
2014
and
2013
, respectively.
Litigation
The Company is, from time to time, a defendant (actual or threatened) in certain lawsuits and arbitration claims encountered in the ordinary course of its business, the resolution of which, if determined in a manner adverse to the Company, in the opinion of management, should not have a material adverse effect on the Company’s financial position, results of operations, or cash flows.
Guarantees
The Company offers a fee-based CSO Program to assist consumers in its Texas markets in obtaining extensions of credit. The Company’s CSO Program in Texas is licensed as a CAB under Texas Finance Code Chapter 393 and regulated by the Texas Office of the Consumer Credit Commissioner. Under the CSO Program, the Company assists customers in applying for a short-term extension of credit from the Independent Lender and issues the Independent Lender a letter of credit to guarantee the repayment of the extension of credit. The extensions of credit made by the Independent Lender to credit services customers of the Company range in amount from
$50
to
$1,500
, have terms of
7
to
180
days and bear interest at a rate of
10%
on an annualized basis. The Independent Lender is considered a variable interest entity of the Company. The net loans outstanding represent less than
50%
of the Independent Lender’s total assets. In addition, the Company does not have any ownership interest in the Independent Lender, does not exercise control over it and is not the primary beneficiary and, therefore, does not consolidate the Independent Lender’s results with its results.
F-23
The letters of credit under the CSO Program constitute a guarantee for which the Company is required to recognize, at the inception of the guarantee, a liability for the fair value of the obligation undertaken by issuing the letters of credit. The Independent Lender may present the letter of credit to the Company for payment if the customer fails to repay the full amount of the extension of credit and accrued interest after the due date of the extension of credit. Each letter of credit expires approximately
30 days
after the due date of the extension of credit. The Company’s maximum loss exposure under all of the outstanding letters of credit issued on behalf of its customers to the Independent Lender as of
December 31, 2015
was
$8,192,000
compared to
$11,907,000
at
December 31, 2014
. According to the terms of the letter of credit, if the borrower defaults on the extension of credit, the Company will pay the Independent Lender the principal, accrued interest, insufficient funds fee, and late fees, all of which the Company records as a component of its credit loss provision. The Company is entitled to seek recovery, directly from its customers, of the amounts it pays the Independent Lender in performing under the letters of credit. The Company records the estimated fair value of the liability under the letters of credit, which was
$498,000
at
December 31, 2015
, as a component of accrued liabilities. The loss provision associated with the CSO Program is based primarily upon historical loss experience, with consideration given to recent loss trends, delinquency rates, economic conditions and management’s expectations of future credit losses.
NOTE
13
-
GOODWILL
The Company performs its goodwill impairment assessment annually as of December 31, and between annual assessments if an event occurs or circumstances change that would more likely than not reduce the fair value of a reporting unit below its carrying value. The Company’s reporting units, which are tested for impairment, are U.S. pawn operations, U.S. consumer loan operations and Latin America pawn and consumer loan operations. The Company assesses goodwill for impairment at a reporting unit level by initially assessing a range of qualitative factors, including, but not limited to, macroeconomic conditions, industry conditions, the competitive environment, changes in the market for the Company’s products and services, regulatory and political developments, entity specific factors, such as strategy and changes in key personnel, and overall financial performance. If, after completing this assessment, it is determined it is more likely than not that the fair value of a reporting unit is less than its carrying value, the Company proceeds to the two-step impairment testing methodology.
The first step is a comparison of the reporting unit's fair value to its carrying value. If the fair value of the reporting unit exceeds its carrying value, goodwill is not impaired and no further testing is required. If the fair value of the reporting unit is less than its carrying value, there is an indication that impairment may exist and the second step must be performed to measure the amount of impairment loss. In the second step, the fair value of the reporting unit is allocated to all of the assets and liabilities of the reporting unit, including any unrecognized intangible assets, in a hypothetical analysis that calculates the implied fair value of goodwill in the same manner as if the reporting unit was being acquired in a business combination. If the implied fair value of the reporting unit's goodwill is less than its carrying value, the difference is recorded as an impairment charge.
During the third quarter of 2015, the Company determined that sufficient indicators of potential impairment existed to require an interim goodwill impairment analysis for the U.S. consumer loan operations reporting unit. These indicators included, among others, the impacts of recently enacted and additional proposed local, state and federal regulatory restrictions affecting short-term and long-term profitability expectations for payday and title lending products, the Company’s long-term ongoing strategy to reduce non-core consumer lending operations along with significant deterioration in payday lending market conditions. Due to the aforementioned indicators, the Company concluded that it was more likely than not that the fair value of the U.S. consumer loan operations reporting unit was less than the carrying value.
The Company estimated fair value of the U.S. consumer loan operations reporting unit by applying a multiple to the reporting units’ forecast earnings before interest, taxes, depreciation and amortization, as this is a common valuation technique within the consumer loan industry (the inputs used in the fair value calculation are significant unobservable inputs, or Level 3 inputs, in the fair value hierarchy). The resulting estimated fair value of the reporting unit was less than its carrying value and after performing the second step in the goodwill impairment testing methodology, the Company determined there was no material implied goodwill.
As a result, a
$7,913,000
goodwill impairment charge was recorded in the third quarter of fiscal 2015, which is included as goodwill impairment - U.S. consumer loan operations in the accompanying consolidated statements of operations. As of December 31, 2015, the Company has no remaining goodwill or other intangible assets associated with its U.S. consumer loan operations reporting unit.
F-24
Changes in the carrying value of goodwill were as follows (in thousands):
|
December 31, 2015
|
|||
|
Balance, beginning of year
|
$
|
276,882
|
|
|
Acquisitions (Note 4)
|
30,693
|
|
|
|
Goodwill impairment - U.S. consumer loan operations
|
(7,913
|
)
|
|
|
Effect of foreign currency translation
|
(4,976
|
)
|
|
|
Other adjustments
|
923
|
|
|
|
Balance, end of year
|
$
|
295,609
|
|
|
December 31, 2014
|
|||
|
Balance, beginning of year
|
$
|
251,241
|
|
|
Acquisitions (Note 4)
|
29,869
|
|
|
|
Effect of foreign currency translation
|
(4,305
|
)
|
|
|
Other adjustments
|
77
|
|
|
|
Balance, end of year
|
$
|
276,882
|
|
NOTE
14
-
EQUITY COMPENSATION PLANS AND SHARE-BASED COMPENSATION
The Company has previously adopted equity and share-based compensation plans to attract and retain executives, directors and key employees. Under these plans, the Company has granted qualified and non-qualified common stock options and nonvested common stock awards to officers, directors and other key employees. At
December 31, 2015
,
1,088,000
shares were reserved for future grants under the plans.
Stock Options
The Company has not issued any common stock options in the last four fiscal years. Previous option awards have been granted to purchase the Company’s common stock at an exercise price equal to or greater than the fair market value at the date of grant and generally have a maximum duration of
ten
years. The Company typically issues shares of common stock to satisfy option exercises.
Stock options outstanding as of
December 31, 2015
are as follows (in thousands, except exercise price and life):
|
Weighted-Average
|
Currently
|
|||||||||||||||
|
Exercise Price
|
Options
|
Remaining Life
|
Exercisable
|
|||||||||||||
|
$
|
24.57
|
|
13
|
|
1.3
|
13
|
|
|||||||||
|
$
|
38.00
|
|
40
|
|
5.9
|
—
|
|
|||||||||
|
$
|
40.00
|
|
50
|
|
5.0
|
—
|
|
|||||||||
|
103
|
|
4.9
|
13
|
|
||||||||||||
F-25
A summary of stock option activity for the years ended
December 31, 2015
,
2014
and
2013
, is as follows (in thousands, except exercise price):
|
2015
|
2014
|
2013
|
||||||||||||||||||
|
Weighted-
|
Weighted-
|
Weighted-
|
||||||||||||||||||
|
Average
|
Average
|
Average
|
||||||||||||||||||
|
Underlying
|
Exercise
|
Underlying
|
Exercise
|
Underlying
|
Exercise
|
|||||||||||||||
|
Shares
|
Price
|
Shares
|
Price
|
Shares
|
Price
|
|||||||||||||||
|
Outstanding at beginning of year
|
758
|
|
$
|
20.67
|
|
1,052
|
|
$
|
19.90
|
|
1,635
|
|
$
|
18.51
|
|
|||||
|
Granted
|
—
|
|
—
|
|
—
|
|
—
|
|
—
|
|
—
|
|
||||||||
|
Exercised
|
(655
|
)
|
18.06
|
|
(294
|
)
|
17.93
|
|
(573
|
)
|
16.12
|
|
||||||||
|
Canceled or forfeited
|
—
|
|
—
|
|
—
|
|
—
|
|
(10
|
)
|
10.00
|
|
||||||||
|
Outstanding at end of year
|
103
|
|
37.34
|
|
758
|
|
20.67
|
|
1,052
|
|
19.90
|
|
||||||||
|
Exercisable at end of year
|
13
|
|
24.57
|
|
663
|
|
18.14
|
|
953
|
|
18.05
|
|
||||||||
At
December 31, 2015
, the aggregate intrinsic value for in-the-money stock options outstanding was
$161,000
, all of which was exercisable at the end of the year with a remaining contractual term of
1.3
years. The aggregate intrinsic value reflects the total pre-tax intrinsic value (the difference between the Company’s closing stock price on the last trading day of the period and the exercise price of the options, multiplied by the number of in-the-money options) that would have been received by the option holders had all in-the-money option holders exercised their options on
December 31, 2015
.
The total intrinsic value of options exercised for fiscal
2015
,
2014
and
2013
, was
$14,609,000
,
$11,858,000
and
$22,375,000
, respectively. The intrinsic values are based on the closing price of the Company’s stock on the date of exercise. The Company typically issues shares of common stock to satisfy option exercises.
Nonvested Common Stock Awards (Restricted Stock)
The Company has granted nonvested common stock awards (also known as “restricted stock”) to Company officers, employees and non-management members of the Board of Directors under the Company’s incentive plans. The nonvested common stock awards are issued as common shares upon vesting. The awards granted in 2015 and 2014 each included
40,000
shares with performance-based criteria with
four
annual measurement periods beginning in the year of issuance. The vesting performance criteria for each year relate to growth in the Company’s EBITDA from continuing operations, excluding gross profit from non-core sales of scrap jewelry, compared to the base period, which is the fiscal year prior to the year of issuance. All other awards granted in 2015, 2014 and 2013 vest ratably over time through a
six
year period from the date of issuance. The fair value of the nonvested awards is based on the Company’s closing stock price on the day of the grant or subsequent award modification date, if applicable, and the fair value of performance-based awards is based on the maximum amount of the award expected to be achieved. The amount attributable to award grants is amortized to expense over the vesting periods.
The following table summarizes the nonvested common stock award activity during
2015
,
2014
and
2013
(in thousands, except fair value amounts):
|
2015
|
2014
|
2013
|
||||||||||||||||||
|
Weighted-
|
Weighted-
|
Weighted-
|
||||||||||||||||||
|
Average
|
Average
|
Average
|
||||||||||||||||||
|
Underlying
|
Fair Value
|
Underlying
|
Fair Value
|
Underlying
|
Fair Value
|
|||||||||||||||
|
Shares
|
of Grant
|
Shares
|
of Grant
|
Shares
|
of Grant
|
|||||||||||||||
|
Outstanding at beginning of year
|
87
|
|
$
|
48.99
|
|
117
|
|
$
|
39.91
|
|
153
|
|
$
|
39.24
|
|
|||||
|
Granted
|
45
|
|
47.08
|
|
47
|
|
51.08
|
|
1
|
|
51.70
|
|
||||||||
|
Vested
|
(5
|
)
|
43.26
|
|
(37
|
)
|
46.48
|
|
(8
|
)
|
32.97
|
|
||||||||
|
Canceled or forfeited
|
(48
|
)
|
49.26
|
|
(40
|
)
|
42.14
|
|
(29
|
)
|
39.49
|
|
||||||||
|
Outstanding at end of year
|
79
|
|
48.10
|
|
87
|
|
48.99
|
|
117
|
|
39.91
|
|
||||||||
F-26
Nonvested common stock awards vesting in
2015
,
2014
and
2013
had an aggregate intrinsic value of
$245,000
,
$2,006,000
and
$471,000
, respectively, based on the closing price of the Company’s stock on the date of vesting. The outstanding award units had an aggregate intrinsic value of
$2,964,000
at
December 31, 2015
.
Share-Based Compensation Expense
The Company’s net income includes the following compensation costs related to share-based compensation arrangements (in thousands):
|
Year Ended December 31,
|
|||||||||||
|
2015
|
2014
|
2013
|
|||||||||
|
Gross compensation costs:
|
|||||||||||
|
Stock options
|
$
|
149
|
|
$
|
153
|
|
$
|
158
|
|
||
|
Nonvested stock
|
280
|
|
1,826
|
|
395
|
|
|||||
|
Total gross compensation costs
|
429
|
|
1,979
|
|
553
|
|
|||||
|
Income tax benefits:
|
|||||||||||
|
Stock options
|
(52
|
)
|
(54
|
)
|
(55
|
)
|
|||||
|
Nonvested stock
|
(98
|
)
|
(639
|
)
|
(138
|
)
|
|||||
|
Total income tax benefits
|
(150
|
)
|
(693
|
)
|
(193
|
)
|
|||||
|
Net compensation expense
|
$
|
279
|
|
$
|
1,286
|
|
$
|
360
|
|
||
|
Tax benefit realized from stock options exercised during the year
|
$
|
5,126
|
|
$
|
4,141
|
|
$
|
7,805
|
|
||
During fiscal 2014, the Company modified certain performance criteria of nonvested common stock awards granted to
two
of the Company’s employees in fiscal 2012 and fiscal 2011. The modification removed the impact of certain non-core earnings from the performance criteria. The total net incremental share-based compensation expense recognized during fiscal 2014 as a result of the modification was
$908,000
, net of a resulting
$489,000
tax benefit. As no modified stock awards vested in fiscal 2015, there was no incremental impact to share-based compensation expense recognized during fiscal 2015 as a result of the modification.
As of
December 31, 2015
, the total compensation cost related to nonvested stock options not yet recognized was
$378,000
and is expected to be recognized over the weighted-average period of
1.7
years. As of
December 31, 2015
, the total compensation cost related to nonvested common stock awards not yet recognized was
$3,254,000
and is expected to be recognized over the weighted-average period of
1.7
years. There was
$0
,
$126,000
and
$1,288,000
of excess tax benefit over exercise price recorded as increases to additional paid-in capital in fiscal
2015
,
2014
and
2013
, respectively.
F-27
NOTE
15
-
FIRST CASH 401(k) PROFIT SHARING PLAN
The First Cash 401(k) Profit Sharing Plan (the “Plan”) is provided by the Company for all full-time, U.S.-based, employees who have been employed with the Company for
six
months or longer. Under the Plan, a participant may contribute up to
100%
of earnings, with the Company matching the first
6%
at a rate of
40%
. The employee and Company contributions are paid to a corporate trustee and invested in various funds. Company contributions made to participants’ accounts become fully vested upon completion of
five
years of service. The total Company matching contributions to the Plan were
$800,000
,
$784,000
and
$712,000
for the years ended
December 31, 2015
,
2014
and
2013
, respectively.
F-28
NOTE
16
-
GEOGRAPHIC AREAS
The following table shows revenue, selected current assets and long-lived assets (all non-current assets except goodwill, intangibles and deferred tax assets) by geographic area (in thousands):
|
Year Ended December 31,
|
|||||||||||
|
2015
|
2014
|
2013
|
|||||||||
|
Revenue:
|
|||||||||||
|
United States
|
$
|
336,848
|
|
$
|
324,600
|
|
$
|
297,862
|
|
||
|
Latin America
|
367,754
|
|
388,277
|
|
362,986
|
|
|||||
|
$
|
704,602
|
|
$
|
712,877
|
|
$
|
660,848
|
|
|||
|
Pawn loans and consumer loans:
|
|||||||||||
|
United States
|
$
|
68,841
|
|
$
|
68,890
|
|
$
|
66,548
|
|
||
|
Latin America
|
49,878
|
|
50,887
|
|
50,136
|
|
|||||
|
$
|
118,719
|
|
$
|
119,777
|
|
$
|
116,684
|
|
|||
|
Inventories:
|
|||||||||||
|
United States
|
$
|
56,040
|
|
$
|
49,969
|
|
$
|
40,910
|
|
||
|
Latin America
|
37,418
|
|
41,119
|
|
36,883
|
|
|||||
|
$
|
93,458
|
|
$
|
91,088
|
|
$
|
77,793
|
|
|||
|
Long-lived assets:
|
|||||||||||
|
United States
|
$
|
69,868
|
|
$
|
69,456
|
|
$
|
58,539
|
|
||
|
Latin America
|
50,608
|
|
52,998
|
|
52,339
|
|
|||||
|
$
|
120,476
|
|
$
|
122,454
|
|
$
|
110,878
|
|
|||
F-29
NOTE
17
-
QUARTERLY FINANCIAL DATA (UNAUDITED)
Summarized quarterly financial data (in thousands, except per share data) for the fiscal years ended
December 31, 2015
and
2014
, are set forth below. The Company’s operations are subject to seasonal fluctuations. The amounts reported below have been adjusted to reflect reclassification of the discontinued operations.
|
Quarter Ended
|
|||||||||||||||
|
March 31
|
June 30
|
September 30
|
December 31
|
||||||||||||
|
2015
|
|||||||||||||||
|
Total revenue
|
$
|
176,023
|
|
$
|
167,623
|
|
$
|
169,532
|
|
$
|
191,424
|
|
|||
|
Cost of revenue
|
77,252
|
|
73,577
|
|
74,090
|
|
88,499
|
|
|||||||
|
Net revenue
|
98,771
|
|
94,046
|
|
95,442
|
|
102,925
|
|
|||||||
|
Total expenses and other income
|
74,382
|
|
74,615
|
|
79,208
|
|
75,298
|
|
|||||||
|
Net income
|
16,788
|
|
13,339
|
|
11,173
|
|
19,410
|
|
|||||||
|
Diluted income per share
|
0.59
|
|
0.47
|
|
0.40
|
|
0.69
|
|
|||||||
|
Diluted weighted average shares
|
28,620
|
|
28,411
|
|
28,224
|
|
28,097
|
|
|||||||
|
2014
|
|||||||||||||||
|
Total revenue
|
$
|
169,777
|
|
$
|
165,326
|
|
$
|
175,000
|
|
$
|
202,774
|
|
|||
|
Cost of revenue
|
73,321
|
|
71,405
|
|
76,137
|
|
91,141
|
|
|||||||
|
Net revenue
|
96,456
|
|
93,921
|
|
98,863
|
|
111,633
|
|
|||||||
|
Total expenses and other income
|
67,448
|
|
70,522
|
|
70,983
|
|
74,940
|
|
|||||||
|
Income from continuing operations
|
22,954
|
|
16,015
|
|
19,528
|
|
26,941
|
|
|||||||
|
Income (loss) from discontinued operations, net of tax
|
(272
|
)
|
—
|
|
—
|
|
—
|
|
|||||||
|
Net income
|
22,682
|
|
16,015
|
|
19,528
|
|
26,941
|
|
|||||||
|
Diluted income per share:
|
|||||||||||||||
|
Income from continuing operations, net of tax
|
0.78
|
|
0.55
|
|
0.68
|
|
0.94
|
|
|||||||
|
Income (loss) from discontinued operations, net of tax
|
(0.01
|
)
|
—
|
|
—
|
|
—
|
|
|||||||
|
Net income
|
0.77
|
|
0.55
|
|
0.68
|
|
0.94
|
|
|||||||
|
Diluted weighted average shares
|
29,342
|
|
29,341
|
|
28,805
|
|
28,804
|
|
|||||||
NOTE
18
-
CONDENSED CONSOLIDATING GUARANTOR FINANCIAL STATEMENTS
In connection with the issuance of the Notes, certain of the Company’s domestic subsidiaries (collectively, “Guarantor Subsidiaries”), fully, unconditionally, jointly and severally guaranteed the payment obligations under the Notes. Each of the Guarantor Subsidiaries is
100%
owned, directly or indirectly, by the Company. The following supplemental financial information sets forth, on a consolidating basis, the balance sheets, statements of comprehensive income (loss) and statements of cash flows of First Cash Financial Services, Inc. (the “Parent Company”), the Guarantor Subsidiaries and the Parent Company’s other subsidiaries (the “Non-Guarantor Subsidiaries”).
The supplemental condensed consolidating financial information has been prepared pursuant to SEC rules and regulations for condensed financial information and does not include the more complete disclosures included in annual financial statements. Investments in consolidated subsidiaries have been presented under the equity method of accounting. The principal eliminating entries eliminate investments in subsidiaries, intercompany balances and intercompany revenues and expenses. The condensed financial information may not necessarily be indicative of the results of operations or financial position had the Guarantor Subsidiaries or Non-Guarantor Subsidiaries operated as independent entities.
F-30
|
Condensed Consolidating Balance Sheet
|
||||||||||||||||||||
|
December 31, 2015
|
||||||||||||||||||||
|
(in thousands)
|
||||||||||||||||||||
|
Parent
Company
|
Guarantor
Subsidiaries
|
Non-Guarantor
Subsidiaries |
Consolidating
Eliminations
|
Consolidated
|
||||||||||||||||
|
ASSETS
|
|
|||||||||||||||||||
|
Cash and cash equivalents
|
$
|
5,460
|
|
$
|
3,765
|
|
$
|
77,729
|
|
$
|
—
|
|
$
|
86,954
|
|
|||||
|
Pawn loan fees and service charges receivable
|
—
|
|
7,596
|
|
8,810
|
|
—
|
|
16,406
|
|
||||||||||
|
Pawn loans
|
—
|
|
61,204
|
|
56,397
|
|
—
|
|
117,601
|
|
||||||||||
|
Consumer loans, net
|
—
|
|
624
|
|
494
|
|
—
|
|
1,118
|
|
||||||||||
|
Inventories
|
—
|
|
46,349
|
|
47,109
|
|
—
|
|
93,458
|
|
||||||||||
|
Prepaid expenses and other current assets
|
6,477
|
|
—
|
|
3,420
|
|
—
|
|
9,897
|
|
||||||||||
|
Intercompany receivable
|
7,382
|
|
—
|
|
—
|
|
(7,382
|
)
|
—
|
|
||||||||||
|
Total current assets
|
19,319
|
|
119,538
|
|
193,959
|
|
(7,382
|
)
|
325,434
|
|
||||||||||
|
Property and equipment, net
|
3,568
|
|
55,585
|
|
53,294
|
|
—
|
|
112,447
|
|
||||||||||
|
Goodwill
|
—
|
|
196,224
|
|
99,385
|
|
—
|
|
295,609
|
|
||||||||||
|
Other non-current assets
|
5,416
|
|
4,893
|
|
3,901
|
|
—
|
|
14,210
|
|
||||||||||
|
Deferred tax assets
|
—
|
|
—
|
|
9,321
|
|
—
|
|
9,321
|
|
||||||||||
|
Investments in subsidiaries
|
675,574
|
|
—
|
|
—
|
|
(675,574
|
)
|
—
|
|
||||||||||
|
Total assets
|
$
|
703,877
|
|
$
|
376,240
|
|
$
|
359,860
|
|
$
|
(682,956
|
)
|
$
|
757,021
|
|
|||||
|
LIABILITIES AND STOCKHOLDERS’ EQUITY
|
|
|
|
|
|
|||||||||||||||
|
Accounts payable and accrued liabilities
|
$
|
14,308
|
|
$
|
7,929
|
|
$
|
20,015
|
|
$
|
—
|
|
$
|
42,252
|
|
|||||
|
Income taxes payable
|
—
|
|
—
|
|
3,923
|
|
—
|
|
3,923
|
|
||||||||||
|
Intercompany payable
|
—
|
|
—
|
|
7,382
|
|
(7,382
|
)
|
—
|
|
||||||||||
|
Total current liabilities
|
14,308
|
|
7,929
|
|
31,320
|
|
(7,382
|
)
|
46,175
|
|
||||||||||
|
Revolving unsecured credit facilities
|
58,000
|
|
—
|
|
—
|
|
—
|
|
58,000
|
|
||||||||||
|
Senior unsecured notes
|
200,000
|
|
—
|
|
—
|
|
—
|
|
200,000
|
|
||||||||||
|
Deferred tax liabilities
|
187
|
|
18,880
|
|
2,397
|
|
—
|
|
21,464
|
|
||||||||||
|
Total liabilities
|
272,495
|
|
26,809
|
|
33,717
|
|
(7,382
|
)
|
325,639
|
|
||||||||||
|
Total stockholders’ equity
|
431,382
|
|
349,431
|
|
326,143
|
|
(675,574
|
)
|
431,382
|
|
||||||||||
|
Total liabilities and stockholders’ equity
|
$
|
703,877
|
|
$
|
376,240
|
|
$
|
359,860
|
|
$
|
(682,956
|
)
|
$
|
757,021
|
|
|||||
F-31
|
Condensed Consolidating Balance Sheet
|
||||||||||||||||||||
|
December 31, 2014
|
||||||||||||||||||||
|
(in thousands)
|
||||||||||||||||||||
|
Parent
Company
|
Guarantor
Subsidiaries
|
Non-Guarantor
Subsidiaries |
Consolidating
Eliminations
|
Consolidated
|
||||||||||||||||
|
ASSETS
|
|
|||||||||||||||||||
|
Cash and cash equivalents
|
$
|
7,799
|
|
$
|
3,146
|
|
$
|
57,047
|
|
$
|
—
|
|
$
|
67,992
|
|
|||||
|
Pawn loan fees and service charges receivable
|
—
|
|
8,047
|
|
8,879
|
|
—
|
|
16,926
|
|
||||||||||
|
Pawn loans
|
—
|
|
61,384
|
|
57,152
|
|
—
|
|
118,536
|
|
||||||||||
|
Consumer loans, net
|
—
|
|
690
|
|
551
|
|
—
|
|
1,241
|
|
||||||||||
|
Inventories
|
—
|
|
39,505
|
|
51,583
|
|
—
|
|
91,088
|
|
||||||||||
|
Prepaid expenses and other current assets
|
1,881
|
|
—
|
|
3,089
|
|
—
|
|
4,970
|
|
||||||||||
|
Intercompany receivable
|
4,948
|
|
—
|
|
—
|
|
(4,948
|
)
|
—
|
|
||||||||||
|
Total current assets
|
14,628
|
|
112,772
|
|
178,301
|
|
(4,948
|
)
|
300,753
|
|
||||||||||
|
Property and equipment, net
|
3,997
|
|
53,944
|
|
55,809
|
|
—
|
|
113,750
|
|
||||||||||
|
Goodwill
|
—
|
|
181,101
|
|
95,781
|
|
—
|
|
276,882
|
|
||||||||||
|
Other non-current assets
|
5,967
|
|
5,594
|
|
4,607
|
|
—
|
|
16,168
|
|
||||||||||
|
Deferred tax assets
|
893
|
|
—
|
|
9,070
|
|
(893
|
)
|
9,070
|
|
||||||||||
|
Investments in subsidiaries
|
648,296
|
|
—
|
|
—
|
|
(648,296
|
)
|
—
|
|
||||||||||
|
Total assets
|
$
|
673,781
|
|
$
|
353,411
|
|
$
|
343,568
|
|
$
|
(654,137
|
)
|
$
|
716,623
|
|
|||||
|
LIABILITIES AND STOCKHOLDERS’ EQUITY
|
|
|
|
|
|
|||||||||||||||
|
Accounts payable and accrued liabilities
|
$
|
16,940
|
|
$
|
7,108
|
|
$
|
18,511
|
|
$
|
—
|
|
$
|
42,559
|
|
|||||
|
Intercompany payable
|
—
|
|
—
|
|
4,948
|
|
(4,948
|
)
|
—
|
|
||||||||||
|
Total current liabilities
|
16,940
|
|
7,108
|
|
23,459
|
|
(4,948
|
)
|
42,559
|
|
||||||||||
|
Revolving unsecured credit facility
|
22,400
|
|
—
|
|
—
|
|
—
|
|
22,400
|
|
||||||||||
|
Senior unsecured notes
|
200,000
|
|
—
|
|
—
|
|
—
|
|
200,000
|
|
||||||||||
|
Deferred tax liabilities
|
—
|
|
14,069
|
|
4,047
|
|
(893
|
)
|
17,223
|
|
||||||||||
|
Total liabilities
|
239,340
|
|
21,177
|
|
27,506
|
|
(5,841
|
)
|
282,182
|
|
||||||||||
|
Total stockholders’ equity
|
434,441
|
|
332,234
|
|
316,062
|
|
(648,296
|
)
|
434,441
|
|
||||||||||
|
Total liabilities and stockholders’ equity
|
$
|
673,781
|
|
$
|
353,411
|
|
$
|
343,568
|
|
$
|
(654,137
|
)
|
$
|
716,623
|
|
|||||
F-32
|
Condensed Consolidating Statement of Comprehensive Income (Loss)
|
||||||||||||||||||||
|
Year Ended December 31, 2015
|
||||||||||||||||||||
|
(in thousands)
|
||||||||||||||||||||
|
Parent
Company
|
Guarantor
Subsidiaries |
Non-Guarantor
Subsidiaries |
Consolidating
Eliminations |
Consolidated
|
||||||||||||||||
|
Revenue:
|
|
|
|
|
||||||||||||||||
|
Retail merchandise sales
|
$
|
—
|
|
$
|
163,648
|
|
$
|
285,648
|
|
$
|
—
|
|
$
|
449,296
|
|
|||||
|
Pawn loan fees
|
—
|
|
84,295
|
|
111,153
|
|
—
|
|
195,448
|
|
||||||||||
|
Consumer loan and credit services fees
|
—
|
|
25,294
|
|
2,509
|
|
—
|
|
27,803
|
|
||||||||||
|
Wholesale scrap jewelry
revenue
|
—
|
|
17,396
|
|
14,659
|
|
—
|
|
32,055
|
|
||||||||||
|
Total revenue
|
—
|
|
290,633
|
|
413,969
|
|
—
|
|
704,602
|
|
||||||||||
|
Cost of revenue:
|
|
|
|
|
|
|||||||||||||||
|
Cost of retail merchandise sold
|
—
|
|
95,129
|
|
183,502
|
|
—
|
|
278,631
|
|
||||||||||
|
Consumer loan and credit services loss provision
|
—
|
|
6,748
|
|
411
|
|
—
|
|
7,159
|
|
||||||||||
|
Cost of wholesale scrap jewelry sold
|
—
|
|
15,861
|
|
11,767
|
|
—
|
|
27,628
|
|
||||||||||
|
Total cost of revenue
|
—
|
|
117,738
|
|
195,680
|
|
—
|
|
313,418
|
|
||||||||||
|
Net revenue
|
—
|
|
172,895
|
|
218,289
|
|
—
|
|
391,184
|
|
||||||||||
|
Expenses and other income:
|
|
|
|
|
|
|||||||||||||||
|
Store operating expenses
|
—
|
|
92,277
|
|
115,295
|
|
—
|
|
207,572
|
|
||||||||||
|
Administrative expenses (1)
|
26,467
|
|
—
|
|
28,291
|
|
—
|
|
54,758
|
|
||||||||||
|
Depreciation and amortization
|
758
|
|
6,800
|
|
10,381
|
|
—
|
|
17,939
|
|
||||||||||
|
Goodwill impairment - U.S. consumer loan operations
|
—
|
|
7,913
|
|
—
|
|
—
|
|
7,913
|
|
||||||||||
|
Interest expense
|
16,887
|
|
—
|
|
—
|
|
—
|
|
16,887
|
|
||||||||||
|
Interest income
|
(13
|
)
|
—
|
|
(1,553
|
)
|
—
|
|
(1,566
|
)
|
||||||||||
|
Total expenses and other income
|
44,099
|
|
106,990
|
|
152,414
|
|
—
|
|
303,503
|
|
||||||||||
|
Income (loss) before income taxes
|
(44,099
|
)
|
65,905
|
|
65,875
|
|
—
|
|
87,681
|
|
||||||||||
|
Provision for income taxes
|
(16,844
|
)
|
24,385
|
|
19,430
|
|
—
|
|
26,971
|
|
||||||||||
|
Income (loss) before equity in net income of subsidiaries
|
(27,255
|
)
|
41,520
|
|
46,445
|
|
—
|
|
60,710
|
|
||||||||||
|
Equity in net income of subsidiaries
|
87,965
|
|
—
|
|
—
|
|
(87,965
|
)
|
—
|
|
||||||||||
|
Net income (loss)
|
$
|
60,710
|
|
$
|
41,520
|
|
$
|
46,445
|
|
$
|
(87,965
|
)
|
$
|
60,710
|
|
|||||
|
Other comprehensive income (loss):
|
|
|
|
|
|
|||||||||||||||
|
Currency translation adjustment
|
(38,132
|
)
|
—
|
|
—
|
|
—
|
|
(38,132
|
)
|
||||||||||
|
Comprehensive income (loss)
|
$
|
22,578
|
|
$
|
41,520
|
|
$
|
46,445
|
|
$
|
(87,965
|
)
|
$
|
22,578
|
|
|||||
|
(1)
|
Includes the allocation of certain administrative expenses and the payment of royalties between the Parent Company and certain foreign Non-Guarantor Subsidiaries.
|
F-33
|
Condensed Consolidating Statement of Comprehensive Income (Loss)
|
||||||||||||||||||||
|
Year Ended December 31, 2014
|
||||||||||||||||||||
|
(in thousands)
|
||||||||||||||||||||
|
Parent
Company
|
Guarantor
Subsidiaries |
Non-Guarantor
Subsidiaries |
Consolidating
Eliminations |
Consolidated
|
||||||||||||||||
|
Revenue:
|
|
|
|
|
||||||||||||||||
|
Retail merchandise sales
|
$
|
—
|
|
$
|
155,619
|
|
$
|
272,563
|
|
$
|
—
|
|
$
|
428,182
|
|
|||||
|
Pawn loan fees
|
—
|
|
83,321
|
|
116,036
|
|
—
|
|
199,357
|
|
||||||||||
|
Consumer loan and credit services fees
|
—
|
|
33,568
|
|
3,181
|
|
—
|
|
36,749
|
|
||||||||||
|
Wholesale scrap jewelry
revenue
|
—
|
|
26,365
|
|
22,224
|
|
—
|
|
48,589
|
|
||||||||||
|
Total revenue
|
—
|
|
298,873
|
|
414,004
|
|
—
|
|
712,877
|
|
||||||||||
|
Cost of revenue:
|
|
|
|
|
|
|||||||||||||||
|
Cost of retail merchandise sold
|
—
|
|
88,590
|
|
173,083
|
|
—
|
|
261,673
|
|
||||||||||
|
Consumer loan and credit services loss provision
|
—
|
|
8,678
|
|
609
|
|
—
|
|
9,287
|
|
||||||||||
|
Cost of wholesale scrap jewelry sold
|
—
|
|
22,675
|
|
18,369
|
|
—
|
|
41,044
|
|
||||||||||
|
Total cost of revenue
|
—
|
|
119,943
|
|
192,061
|
|
—
|
|
312,004
|
|
||||||||||
|
Net revenue
|
—
|
|
178,930
|
|
221,943
|
|
—
|
|
400,873
|
|
||||||||||
|
Expenses and other income:
|
|
|
|
|
|
|||||||||||||||
|
Store operating expenses
|
—
|
|
89,068
|
|
109,918
|
|
—
|
|
198,986
|
|
||||||||||
|
Administrative expenses (1)
|
24,095
|
|
—
|
|
30,491
|
|
—
|
|
54,586
|
|
||||||||||
|
Depreciation and amortization
|
997
|
|
6,104
|
|
10,375
|
|
—
|
|
17,476
|
|
||||||||||
|
Interest expense
|
13,527
|
|
—
|
|
—
|
|
—
|
|
13,527
|
|
||||||||||
|
Interest income
|
(24
|
)
|
—
|
|
(658
|
)
|
—
|
|
(682
|
)
|
||||||||||
|
Total expenses and other income
|
38,595
|
|
95,172
|
|
150,126
|
|
—
|
|
283,893
|
|
||||||||||
|
Income (loss) from continuing operations before income taxes
|
(38,595
|
)
|
83,758
|
|
71,817
|
|
—
|
|
116,980
|
|
||||||||||
|
Provision for income taxes
|
(17,651
|
)
|
30,983
|
|
18,210
|
|
—
|
|
31,542
|
|
||||||||||
|
Income (loss) from continuing operations before equity in net income of subsidiaries
|
(20,944
|
)
|
52,775
|
|
53,607
|
|
—
|
|
85,438
|
|
||||||||||
|
Loss from discontinued operations, net of tax
|
—
|
|
—
|
|
(272
|
)
|
—
|
|
(272
|
)
|
||||||||||
|
Equity in net income of subsidiaries
|
106,110
|
|
—
|
|
—
|
|
(106,110
|
)
|
—
|
|
||||||||||
|
Net income (loss)
|
$
|
85,166
|
|
$
|
52,775
|
|
$
|
53,335
|
|
$
|
(106,110
|
)
|
$
|
85,166
|
|
|||||
|
Other comprehensive income (loss):
|
|
|
|
|
|
|||||||||||||||
|
Currency translation adjustment
|
(28,517
|
)
|
—
|
|
—
|
|
—
|
|
(28,517
|
)
|
||||||||||
|
Comprehensive income (loss)
|
$
|
56,649
|
|
$
|
52,775
|
|
$
|
53,335
|
|
$
|
(106,110
|
)
|
$
|
56,649
|
|
|||||
|
(1)
|
Includes the allocation of certain administrative expenses and the payment of royalties between the Parent Company and certain foreign Non-Guarantor Subsidiaries.
|
F-34
|
Condensed Consolidating Statement of Comprehensive Income (Loss)
|
||||||||||||||||||||
|
Year Ended December 31, 2013
|
||||||||||||||||||||
|
(in thousands)
|
||||||||||||||||||||
|
Parent
Company
|
Guarantor
Subsidiaries |
Non-Guarantor
Subsidiaries |
Consolidating
Eliminations |
Consolidated
|
||||||||||||||||
|
Revenue:
|
|
|
|
|
||||||||||||||||
|
Retail merchandise sales
|
$
|
—
|
|
$
|
126,228
|
|
$
|
240,959
|
|
$
|
—
|
|
$
|
367,187
|
|
|||||
|
Pawn loan fees
|
—
|
|
73,853
|
|
107,702
|
|
—
|
|
181,555
|
|
||||||||||
|
Consumer loan and credit services fees
|
—
|
|
39,903
|
|
3,878
|
|
—
|
|
43,781
|
|
||||||||||
|
Wholesale scrap jewelry
revenue
|
—
|
|
36,035
|
|
32,290
|
|
—
|
|
68,325
|
|
||||||||||
|
Total revenue
|
—
|
|
276,019
|
|
384,829
|
|
—
|
|
660,848
|
|
||||||||||
|
Cost of revenue:
|
|
|
|
|
|
|||||||||||||||
|
Cost of retail merchandise sold
|
—
|
|
68,447
|
|
152,914
|
|
—
|
|
221,361
|
|
||||||||||
|
Consumer loan and credit services loss provision
|
—
|
|
10,685
|
|
683
|
|
—
|
|
11,368
|
|
||||||||||
|
Cost of wholesale scrap jewelry sold
|
—
|
|
29,854
|
|
28,691
|
|
—
|
|
58,545
|
|
||||||||||
|
Total cost of revenue
|
—
|
|
108,986
|
|
182,288
|
|
—
|
|
291,274
|
|
||||||||||
|
Net revenue
|
—
|
|
167,033
|
|
202,541
|
|
—
|
|
369,574
|
|
||||||||||
|
Expenses and other income:
|
|
|
|
|
|
|||||||||||||||
|
Store operating expenses
|
—
|
|
78,973
|
|
102,348
|
|
—
|
|
181,321
|
|
||||||||||
|
Administrative expenses (1)
|
30,900
|
|
—
|
|
18,630
|
|
—
|
|
49,530
|
|
||||||||||
|
Depreciation and amortization
|
1,193
|
|
4,867
|
|
9,301
|
|
—
|
|
15,361
|
|
||||||||||
|
Interest expense
|
3,492
|
|
—
|
|
—
|
|
—
|
|
3,492
|
|
||||||||||
|
Interest income
|
(8
|
)
|
—
|
|
(314
|
)
|
—
|
|
(322
|
)
|
||||||||||
|
Total expenses and other income
|
35,577
|
|
83,840
|
|
129,965
|
|
—
|
|
249,382
|
|
||||||||||
|
Income (loss) from continuing operations before income taxes
|
(35,577
|
)
|
83,193
|
|
72,576
|
|
—
|
|
120,192
|
|
||||||||||
|
Provision for income taxes
|
(12,637
|
)
|
29,117
|
|
19,233
|
|
—
|
|
35,713
|
|
||||||||||
|
Income (loss) from continuing operations before equity in net income of subsidiaries
|
(22,940
|
)
|
54,076
|
|
53,343
|
|
—
|
|
84,479
|
|
||||||||||
|
Loss from discontinued operations, net of tax
|
—
|
|
—
|
|
(633
|
)
|
—
|
|
(633
|
)
|
||||||||||
|
Equity in net income of subsidiaries
|
106,786
|
|
—
|
|
—
|
|
(106,786
|
)
|
—
|
|
||||||||||
|
Net income (loss)
|
$
|
83,846
|
|
$
|
54,076
|
|
$
|
52,710
|
|
$
|
(106,786
|
)
|
$
|
83,846
|
|
|||||
|
Other comprehensive income (loss):
|
|
|
|
|
|
|||||||||||||||
|
Currency translation adjustment
|
(4,821
|
)
|
—
|
|
—
|
|
—
|
|
(4,821
|
)
|
||||||||||
|
Comprehensive income (loss)
|
$
|
79,025
|
|
$
|
54,076
|
|
$
|
52,710
|
|
$
|
(106,786
|
)
|
$
|
79,025
|
|
|||||
|
(1)
|
Includes the allocation of certain administrative expenses and the payment of royalties between the Parent Company and certain foreign Non-Guarantor Subsidiaries.
|
F-35
|
Condensed Consolidating Statement of Cash Flows
|
||||||||||||||||||||
|
Year Ended December 31, 2015
|
||||||||||||||||||||
|
(in thousands)
|
||||||||||||||||||||
|
Parent
Company
|
Guarantor
Subsidiaries |
Non-Guarantor
Subsidiaries |
Consolidating
Eliminations |
Consolidated
|
||||||||||||||||
|
Cash flow from operating activities:
|
|
|||||||||||||||||||
|
Net cash flow provided by (used in) operating activities
|
$
|
32,753
|
|
$
|
59,675
|
|
$
|
66,713
|
|
$
|
(66,392
|
)
|
$
|
92,749
|
|
|||||
|
Cash flow from investing activities:
|
|
|
|
|
|
|||||||||||||||
|
Loan receivables, net of cash repayments
|
—
|
|
1,803
|
|
(5,519
|
)
|
—
|
|
(3,716
|
)
|
||||||||||
|
Purchases of property and equipment
|
(329
|
)
|
(6,919
|
)
|
(13,825
|
)
|
—
|
|
(21,073
|
)
|
||||||||||
|
Acquisitions of pawn stores, net of cash acquired
|
—
|
|
(29,617
|
)
|
(17,270
|
)
|
—
|
|
(46,887
|
)
|
||||||||||
|
Investing activity with subsidiaries
|
(43,890
|
)
|
—
|
|
—
|
|
43,890
|
|
—
|
|
||||||||||
|
Net cash flow provided by (used in) investing activities
|
(44,219
|
)
|
(34,733
|
)
|
(36,614
|
)
|
43,890
|
|
(71,676
|
)
|
||||||||||
|
Cash flow from financing activities:
|
|
|
|
|
|
|||||||||||||||
|
Borrowings from revolving credit facilities
|
120,000
|
|
—
|
|
—
|
|
—
|
|
120,000
|
|
||||||||||
|
Repayments of revolving credit facilities
|
(84,400
|
)
|
—
|
|
—
|
|
—
|
|
(84,400
|
)
|
||||||||||
|
Debt issuance costs paid
|
(407
|
)
|
—
|
|
—
|
|
—
|
|
(407
|
)
|
||||||||||
|
Purchases of treasury stock
|
(39,974
|
)
|
—
|
|
—
|
|
—
|
|
(39,974
|
)
|
||||||||||
|
Proceeds from exercise of share-based compensation awards
|
9,895
|
|
—
|
|
—
|
|
—
|
|
9,895
|
|
||||||||||
|
Income tax benefit from exercise of stock options
|
5,126
|
|
—
|
|
—
|
|
—
|
|
5,126
|
|
||||||||||
|
Payment of minimum withholding taxes on net share settlement of stock options exercised
|
(1,113
|
)
|
—
|
|
—
|
|
—
|
|
(1,113
|
)
|
||||||||||
|
Proceeds from intercompany financing related activity
|
—
|
|
36,536
|
|
7,354
|
|
(43,890
|
)
|
—
|
|
||||||||||
|
Intercompany dividends paid
|
—
|
|
(60,859
|
)
|
(5,533
|
)
|
66,392
|
|
—
|
|
||||||||||
|
Net cash flow provided by (used in) financing activities
|
9,127
|
|
(24,323
|
)
|
1,821
|
|
22,502
|
|
9,127
|
|
||||||||||
|
Effect of exchange rates on cash
|
—
|
|
—
|
|
(11,238
|
)
|
—
|
|
(11,238
|
)
|
||||||||||
|
Change in cash and cash equivalents
|
(2,339
|
)
|
619
|
|
20,682
|
|
—
|
|
18,962
|
|
||||||||||
|
Cash and cash equivalents at beginning of the period
|
7,799
|
|
3,146
|
|
57,047
|
|
—
|
|
67,992
|
|
||||||||||
|
Cash and cash equivalents at end of the period
|
$
|
5,460
|
|
$
|
3,765
|
|
$
|
77,729
|
|
$
|
—
|
|
$
|
86,954
|
|
|||||
F-36
|
Condensed Consolidating Statement of Cash Flows
|
||||||||||||||||||||
|
Year Ended December 31, 2014
|
||||||||||||||||||||
|
(in thousands)
|
||||||||||||||||||||
|
Parent
Company
|
Guarantor
Subsidiaries |
Non-Guarantor
Subsidiaries |
Consolidating
Eliminations |
Consolidated
|
||||||||||||||||
|
Cash flow from operating activities:
|
|
|||||||||||||||||||
|
Net cash flow provided by (used in) operating activities
|
$
|
42,632
|
|
$
|
62,403
|
|
$
|
63,510
|
|
$
|
(70,866
|
)
|
$
|
97,679
|
|
|||||
|
Cash flow from investing activities:
|
|
|
|
|
|
|||||||||||||||
|
Loan receivables, net of cash repayments
|
—
|
|
2,785
|
|
(5,255
|
)
|
—
|
|
(2,470
|
)
|
||||||||||
|
Purchases of property and equipment
|
(839
|
)
|
(8,097
|
)
|
(15,018
|
)
|
—
|
|
(23,954
|
)
|
||||||||||
|
Acquisitions of pawn stores, net of cash acquired
|
—
|
|
(16,417
|
)
|
(42,525
|
)
|
—
|
|
(58,942
|
)
|
||||||||||
|
Investing activity with subsidiaries
|
(49,570
|
)
|
—
|
|
—
|
|
49,570
|
|
—
|
|
||||||||||
|
Net cash flow provided by (used in) investing activities
|
(50,409
|
)
|
(21,729
|
)
|
(62,798
|
)
|
49,570
|
|
(85,366
|
)
|
||||||||||
|
Cash flow from financing activities:
|
|
|
|
|
|
|||||||||||||||
|
Borrowings from revolving credit facilities
|
50,000
|
|
—
|
|
—
|
|
—
|
|
50,000
|
|
||||||||||
|
Repayments of revolving credit facilities
|
(209,600
|
)
|
—
|
|
—
|
|
—
|
|
(209,600
|
)
|
||||||||||
|
Repayments of notes payable
|
(8,352
|
)
|
—
|
|
—
|
|
—
|
|
(8,352
|
)
|
||||||||||
|
Issuance of senior notes
|
200,000
|
|
—
|
|
—
|
|
—
|
|
200,000
|
|
||||||||||
|
Debt issuance costs paid
|
(6,610
|
)
|
—
|
|
—
|
|
—
|
|
(6,610
|
)
|
||||||||||
|
Purchases of treasury stock
|
(43,947
|
)
|
—
|
|
—
|
|
—
|
|
(43,947
|
)
|
||||||||||
|
Proceeds from exercise of share-based compensation awards
|
5,270
|
|
—
|
|
—
|
|
—
|
|
5,270
|
|
||||||||||
|
Income tax benefit from exercise of stock options
|
4,141
|
|
—
|
|
—
|
|
—
|
|
4,141
|
|
||||||||||
|
Proceeds from intercompany financing related activity
|
—
|
|
24,514
|
|
25,056
|
|
(49,570
|
)
|
—
|
|
||||||||||
|
Intercompany dividends paid
|
—
|
|
(66,623
|
)
|
(4,243
|
)
|
70,866
|
|
—
|
|
||||||||||
|
Net cash flow provided by (used in) financing activities
|
(9,098
|
)
|
(42,109
|
)
|
20,813
|
|
21,296
|
|
(9,098
|
)
|
||||||||||
|
Effect of exchange rates on cash
|
—
|
|
—
|
|
(5,866
|
)
|
—
|
|
(5,866
|
)
|
||||||||||
|
Change in cash and cash equivalents
|
(16,875
|
)
|
(1,435
|
)
|
15,659
|
|
—
|
|
(2,651
|
)
|
||||||||||
|
Cash and cash equivalents at beginning of the period
|
24,674
|
|
4,581
|
|
41,388
|
|
—
|
|
70,643
|
|
||||||||||
|
Cash and cash equivalents at end of the period
|
$
|
7,799
|
|
$
|
3,146
|
|
$
|
57,047
|
|
$
|
—
|
|
$
|
67,992
|
|
|||||
F-37
|
Condensed Consolidating Statement of Cash Flows
|
||||||||||||||||||||
|
Year Ended December 31, 2013
|
||||||||||||||||||||
|
(in thousands)
|
||||||||||||||||||||
|
Parent
Company
|
Guarantor
Subsidiaries |
Non-Guarantor
Subsidiaries |
Consolidating
Eliminations |
Consolidated
|
||||||||||||||||
|
Cash flow from operating activities:
|
|
|||||||||||||||||||
|
Net cash flow provided by (used in) operating activities
|
$
|
74,402
|
|
$
|
62,677
|
|
$
|
38,207
|
|
$
|
(68,568
|
)
|
$
|
106,718
|
|
|||||
|
Cash flow from investing activities:
|
|
|
|
|
|
|||||||||||||||
|
Loan receivables, net of cash repayments
|
—
|
|
4,138
|
|
(4,549
|
)
|
—
|
|
(411
|
)
|
||||||||||
|
Purchases of property and equipment
|
(1,616
|
)
|
(12,767
|
)
|
(12,289
|
)
|
—
|
|
(26,672
|
)
|
||||||||||
|
Acquisitions of pawn stores, net of cash acquired
|
—
|
|
(99,792
|
)
|
(13,851
|
)
|
—
|
|
(113,643
|
)
|
||||||||||
|
Investing activity with subsidiaries
|
(114,901
|
)
|
—
|
|
—
|
|
114,901
|
|
—
|
|
||||||||||
|
Net cash flow provided by (used in) investing activities
|
(116,517
|
)
|
(108,421
|
)
|
(30,689
|
)
|
114,901
|
|
(140,726
|
)
|
||||||||||
|
Cash flow from financing activities:
|
|
|
|
|
|
|||||||||||||||
|
Borrowings from revolving credit facilities
|
152,500
|
|
—
|
|
—
|
|
—
|
|
152,500
|
|
||||||||||
|
Repayments of revolving credit facilities
|
(73,000
|
)
|
—
|
|
—
|
|
—
|
|
(73,000
|
)
|
||||||||||
|
Repayments of notes payable
|
(3,211
|
)
|
—
|
|
—
|
|
—
|
|
(3,211
|
)
|
||||||||||
|
Purchases of treasury stock
|
(38,692
|
)
|
—
|
|
—
|
|
—
|
|
(38,692
|
)
|
||||||||||
|
Proceeds from exercise of share-based compensation awards
|
9,242
|
|
—
|
|
—
|
|
—
|
|
9,242
|
|
||||||||||
|
Income tax benefit from exercise of stock options
|
7,805
|
|
—
|
|
—
|
|
—
|
|
7,805
|
|
||||||||||
|
Proceeds from intercompany financing related activity
|
—
|
|
112,559
|
|
2,342
|
|
(114,901
|
)
|
—
|
|
||||||||||
|
Intercompany dividends paid
|
—
|
|
(66,186
|
)
|
(2,382
|
)
|
68,568
|
|
—
|
|
||||||||||
|
Net cash flow provided by (used in) financing activities
|
54,644
|
|
46,373
|
|
(40
|
)
|
(46,333
|
)
|
54,644
|
|
||||||||||
|
Effect of exchange rates on cash
|
—
|
|
—
|
|
(278
|
)
|
—
|
|
(278
|
)
|
||||||||||
|
Change in cash and cash equivalents
|
12,529
|
|
629
|
|
7,200
|
|
—
|
|
20,358
|
|
||||||||||
|
Cash and cash equivalents at beginning of the period
|
12,145
|
|
3,952
|
|
34,188
|
|
—
|
|
50,285
|
|
||||||||||
|
Cash and cash equivalents at end of the period
|
$
|
24,674
|
|
$
|
4,581
|
|
$
|
41,388
|
|
$
|
—
|
|
$
|
70,643
|
|
|||||
F-38
Certain amounts in the above condensed consolidating financial statements for the years ended December 31,
2014
and
2013
have been reclassified in order to conform to the
2015
presentation. These reclassifications include (1) the retrospective reflection of certain domestic Non-Guarantor Subsidiaries becoming Guarantor Subsidiaries on October 30, 2015, (2) the retrospective early adoption of ASU 2015-17 (as further described in Note
2
) and (3) the presentation of “equity in net income of subsidiaries” in the condensed consolidating statements of comprehensive income (loss).
In addition, the above condensed consolidating financial statements for the years ended December 31,
2014
and
2013
have been revised to (1) correct certain prior-year intercompany balances between the Parent Company and certain Non-Guarantor Subsidiaries in the condensed consolidating balance sheet, (2) correct certain prior-year intercompany activities between the Parent Company, Guarantor Subsidiaries and Non-Guarantor Subsidiaries as cash flows from investing and financing activities that had previously been reflected within cash flows from operating activities in the condensed consolidating statements of cash flows and (3) correct certain prior-year deferred tax asset balances related to foreign currency translation adjustments in the condensed consolidating balance sheet and condensed consolidating statements of comprehensive income (loss) (as further described in Note
2
). The Company has evaluated the effects of these errors, both qualitatively and quantitatively, and concluded that they did not have a material impact on any previously issued financial statements or the full year results for fiscal 2015.
The impact of these reclassifications and revisions to the condensed consolidating financial statements for 2014 and 2013 are summarized in the tables below:
|
Summary Condensed Consolidating Balance Sheet
|
||||||||||||||||||||
|
December 31, 2014
|
||||||||||||||||||||
|
(in thousands)
|
||||||||||||||||||||
|
Parent
Company
|
Guarantor
Subsidiaries
|
Non-Guarantor
Subsidiaries |
Consolidating
Eliminations
|
Consolidated
|
||||||||||||||||
|
Total assets, as reported
|
$
|
858,199
|
|
$
|
314,832
|
|
$
|
566,389
|
|
$
|
(1,024,745
|
)
|
$
|
714,675
|
|
|||||
|
Reclassifications
|
(176
|
)
|
38,579
|
|
(38,579
|
)
|
2,124
|
|
1,948
|
|
||||||||||
|
Revisions
|
(184,242
|
)
|
—
|
|
(184,242
|
)
|
368,484
|
|
—
|
|
||||||||||
|
Total assets, revised
|
$
|
673,781
|
|
$
|
353,411
|
|
$
|
343,568
|
|
$
|
(654,137
|
)
|
$
|
716,623
|
|
|||||
|
Total liabilities, as reported
|
$
|
409,648
|
|
$
|
20,528
|
|
$
|
23,207
|
|
$
|
(187,259
|
)
|
$
|
266,124
|
|
|||||
|
Reclassifications
|
(176
|
)
|
649
|
|
(649
|
)
|
2,124
|
|
1,948
|
|
||||||||||
|
Revisions
|
(170,132
|
)
|
—
|
|
4,948
|
|
179,294
|
|
14,110
|
|
||||||||||
|
Total liabilities, revised
|
$
|
239,340
|
|
$
|
21,177
|
|
$
|
27,506
|
|
$
|
(5,841
|
)
|
$
|
282,182
|
|
|||||
|
Total stockholders’ equity, as reported
|
$
|
448,551
|
|
$
|
294,304
|
|
$
|
543,182
|
|
$
|
(837,486
|
)
|
$
|
448,551
|
|
|||||
|
Reclassifications
|
—
|
|
37,930
|
|
(37,930
|
)
|
—
|
|
—
|
|
||||||||||
|
Revisions
|
(14,110
|
)
|
—
|
|
(189,190
|
)
|
189,190
|
|
(14,110
|
)
|
||||||||||
|
Total stockholders’ equity, revised
|
$
|
434,441
|
|
$
|
332,234
|
|
$
|
316,062
|
|
$
|
(648,296
|
)
|
$
|
434,441
|
|
|||||
F-39
|
Summary Condensed Consolidating Statement of Comprehensive Income
|
||||||||||||||||||||
|
Year Ended December 31, 2014
|
||||||||||||||||||||
|
(in thousands)
|
||||||||||||||||||||
|
Parent
Company
|
Guarantor
Subsidiaries
|
Non-Guarantor
Subsidiaries |
Consolidating
Eliminations
|
Consolidated
|
||||||||||||||||
|
Net income (loss), as reported
|
$
|
(20,944
|
)
|
$
|
49,655
|
|
$
|
56,455
|
|
$
|
—
|
|
$
|
85,166
|
|
|||||
|
Reclassifications
|
106,110
|
|
3,120
|
|
(3,120
|
)
|
(106,110
|
)
|
—
|
|
||||||||||
|
Net income (loss), revised
|
$
|
85,166
|
|
$
|
52,775
|
|
$
|
53,335
|
|
$
|
(106,110
|
)
|
$
|
85,166
|
|
|||||
|
Other comprehensive income (loss), as reported:
|
$
|
(20,944
|
)
|
$
|
49,655
|
|
$
|
38,038
|
|
$
|
—
|
|
$
|
66,749
|
|
|||||
|
Reclassifications
|
106,110
|
|
3,120
|
|
(3,120
|
)
|
(106,110
|
)
|
—
|
|
||||||||||
|
Revisions
|
(28,517
|
)
|
—
|
|
18,417
|
|
—
|
|
(10,100
|
)
|
||||||||||
|
Other comprehensive income (loss), revised:
|
$
|
56,649
|
|
$
|
52,775
|
|
$
|
53,335
|
|
$
|
(106,110
|
)
|
$
|
56,649
|
|
|||||
|
Summary Condensed Consolidating Statement of Comprehensive Income
|
||||||||||||||||||||
|
Year Ended December 31, 2013
|
||||||||||||||||||||
|
(in thousands)
|
||||||||||||||||||||
|
Parent
Company
|
Guarantor
Subsidiaries
|
Non-Guarantor
Subsidiaries |
Consolidating
Eliminations
|
Consolidated
|
||||||||||||||||
|
Net income (loss), as reported
|
$
|
(22,940
|
)
|
$
|
52,617
|
|
$
|
54,169
|
|
$
|
—
|
|
$
|
83,846
|
|
|||||
|
Reclassifications
|
106,786
|
|
1,459
|
|
(1,459
|
)
|
(106,786
|
)
|
—
|
|
||||||||||
|
Net income (loss), revised
|
$
|
83,846
|
|
$
|
54,076
|
|
$
|
52,710
|
|
$
|
(106,786
|
)
|
$
|
83,846
|
|
|||||
|
Other comprehensive income (loss), as reported:
|
$
|
(22,940
|
)
|
$
|
52,617
|
|
$
|
53,358
|
|
$
|
—
|
|
$
|
83,035
|
|
|||||
|
Reclassifications
|
106,786
|
|
1,459
|
|
(1,459
|
)
|
(106,786
|
)
|
—
|
|
||||||||||
|
Revisions
|
(4,821
|
)
|
—
|
|
811
|
|
—
|
|
(4,010
|
)
|
||||||||||
|
Other comprehensive income (loss), revised:
|
$
|
79,025
|
|
$
|
54,076
|
|
$
|
52,710
|
|
$
|
(106,786
|
)
|
$
|
79,025
|
|
|||||
F-40
|
Summary Condensed Consolidating Statement of Cash Flows
|
||||||||||||||||||||
|
Year Ended December 31, 2014
|
||||||||||||||||||||
|
(in thousands)
|
||||||||||||||||||||
|
Parent
Company
|
Guarantor
Subsidiaries
|
Non-Guarantor
Subsidiaries |
Consolidating
Eliminations
|
Consolidated
|
||||||||||||||||
|
Cash flow from operating activities, as reported
|
$
|
(20,276
|
)
|
$
|
18,939
|
|
$
|
99,016
|
|
$
|
—
|
|
$
|
97,679
|
|
|||||
|
Reclassifications
|
—
|
|
(101
|
)
|
101
|
|
—
|
|
—
|
|
||||||||||
|
Revisions
|
62,908
|
|
43,565
|
|
(35,607
|
)
|
(70,866
|
)
|
—
|
|
||||||||||
|
Cash flow from operating activities, revised
|
$
|
42,632
|
|
$
|
62,403
|
|
$
|
63,510
|
|
$
|
(70,866
|
)
|
$
|
97,679
|
|
|||||
|
Cash flow from investing activities, as reported
|
$
|
12,499
|
|
$
|
(20,273
|
)
|
$
|
(77,592
|
)
|
$
|
—
|
|
$
|
(85,366
|
)
|
|||||
|
Reclassifications
|
—
|
|
(1,456
|
)
|
1,456
|
|
—
|
|
—
|
|
||||||||||
|
Revisions
|
(62,908
|
)
|
—
|
|
13,338
|
|
49,570
|
|
—
|
|
||||||||||
|
Cash flow from investing activities, revised
|
$
|
(50,409
|
)
|
$
|
(21,729
|
)
|
$
|
(62,798
|
)
|
$
|
49,570
|
|
$
|
(85,366
|
)
|
|||||
|
Cash flow from financing activities, as reported
|
$
|
(9,098
|
)
|
$
|
—
|
|
$
|
—
|
|
$
|
—
|
|
$
|
(9,098
|
)
|
|||||
|
Reclassifications
|
—
|
|
(42,109
|
)
|
20,813
|
|
21,296
|
|
—
|
|
||||||||||
|
Cash flow from financing activities, revised
|
$
|
(9,098
|
)
|
$
|
(42,109
|
)
|
$
|
20,813
|
|
$
|
21,296
|
|
$
|
(9,098
|
)
|
|||||
|
Summary Condensed Consolidating Statement of Cash Flows
|
||||||||||||||||||||
|
Year Ended December 31, 2013
|
||||||||||||||||||||
|
(in thousands)
|
||||||||||||||||||||
|
Parent
Company
|
Guarantor
Subsidiaries
|
Non-Guarantor
Subsidiaries |
Consolidating
Eliminations
|
Consolidated
|
||||||||||||||||
|
Cash flow from operating activities, as reported
|
$
|
(78,799
|
)
|
$
|
82,737
|
|
$
|
102,780
|
|
$
|
—
|
|
$
|
106,718
|
|
|||||
|
Reclassifications
|
—
|
|
274
|
|
(274
|
)
|
—
|
|
—
|
|
||||||||||
|
Revisions
|
153,201
|
|
(20,334
|
)
|
(64,299
|
)
|
(68,568
|
)
|
—
|
|
||||||||||
|
Cash flow from operating activities, revised
|
$
|
74,402
|
|
$
|
62,677
|
|
$
|
38,207
|
|
$
|
(68,568
|
)
|
$
|
106,718
|
|
|||||
|
Cash flow from investing activities, as reported
|
$
|
36,684
|
|
$
|
(82,382
|
)
|
$
|
(95,028
|
)
|
$
|
—
|
|
$
|
(140,726
|
)
|
|||||
|
Reclassifications
|
—
|
|
(26,039
|
)
|
26,039
|
|
—
|
|
—
|
|
||||||||||
|
Revisions
|
(153,201
|
)
|
—
|
|
38,300
|
|
114,901
|
|
—
|
|
||||||||||
|
Cash flow from investing activities, revised
|
$
|
(116,517
|
)
|
$
|
(108,421
|
)
|
$
|
(30,689
|
)
|
$
|
114,901
|
|
$
|
(140,726
|
)
|
|||||
|
Cash flow from financing activities, as reported
|
$
|
54,644
|
|
$
|
—
|
|
$
|
—
|
|
$
|
—
|
|
$
|
54,644
|
|
|||||
|
Revisions
|
—
|
|
46,373
|
|
(40
|
)
|
(46,333
|
)
|
—
|
|
||||||||||
|
Cash flow from financing activities, revised
|
$
|
54,644
|
|
$
|
46,373
|
|
$
|
(40
|
)
|
$
|
(46,333
|
)
|
$
|
54,644
|
|
|||||
F-41
NOTE
19
-
SUBSEQUENT EVENT
Consistent with the Company’s strategy to continue its expansion of pawn stores in Latin America, the Company acquired the operating entity owning the pawn loans, inventory, layaways and other operating assets and liabilities of
166
pawn stores located in Mexico on January 6, 2016 and the assets of
13
pawn stores located in El Salvador on February 2, 2016. As described in Note
4
, the Company also acquired
32
pawn stores in Guatemala on December 31, 2015 in a related transaction. The combined purchase price for these stores was approximately
$45,000,000
, net of cash acquired before certain post-closing adjustments. In addition, the Company assumed approximately
$7,000,000
in net debt from these acquisitions which was repaid in full by the Company in January 2016.
The acquisitions of the stores in Mexico and El Salvador will be recorded in the first quarter of 2016 and the assets, liabilities and results of operations of the locations will be included in the Company’s consolidated results as of the respective acquisition dates. Certain disclosures related to these acquisitions, including the preliminary purchase price allocation and pro forma results, have not been presented because the initial accounting for the business combination is incomplete as of the filing date. The Company will include necessary disclosure in its quarterly report on Form 10-Q for the first fiscal quarter of 2016.
F-42
TABLE OF CONTENTS
Part IItem 1. BusinessItem 1A. Risk FactorsItem 1B. Unresolved Staff CommentsItem 2. PropertiesItem 3. Legal ProceedingsItem 4. Mine Safety DisclosuresPart IIItem 5. Market For Registrant S Common Equity, Related Stockholder Matters and Issuer Purchases Of Equity SecuritiesItem 6. Selected Financial DataItem 7. Management S Discussion and Analysis Of Financial Condition and Results Of OperationsItem 7A. Quantitative and Qualitative Disclosures About Market RiskItem 8. Financial Statements and Supplementary DataItem 9. Changes in and Disagreements with Accountants on Accounting and Financial DisclosureItem 9A. Controls and ProceduresItem 9B. Other InformationPart IIIItem 10. Directors, Executive Officers and Corporate GovernanceItem 11. Executive CompensationItem 12. Security Ownership Of Certain Beneficial Owners and Management and Related Stockholder MattersItem 13. Certain Relationships and Related Transactions, and Director IndependenceItem 14. Principal Accountant Fees and ServicesPart IVItem 15. Exhibits and Financial Statement SchedulesNote 1 - Organization and Nature Of The CompanyNote 2 - Summary Of Significant Accounting PoliciesNote 3 - Capital StockNote 4 - AcquisitionsNote 5 - Discontinued OperationsNote 6 - Fair Value Of Financial InstrumentsNote 7 - Customer Loans and Valuation AccountsNote 8 - Property and EquipmentNote 9 - Accounts Payable and Accrued LiabilitiesNote 10 - Long-term DebtNote 11 - Income TaxesNote 12 - Commitments and ContingenciesNote 13 - GoodwillNote 14 - Equity Compensation Plans and Share-based CompensationNote 15 - First Cash 401(k) Profit Sharing PlanNote 16 - Geographic AreasNote 17 - Quarterly Financial Data (unaudited)Note 18 - Condensed Consolidating Guarantor Financial StatementsNote 19 - Subsequent Event