FIRSTCASH, INC
10-Ks and 10-Qs
|
|
|
|
|
|
|
|
|
|
|
|
|
|
|
|
|
|
|
|
|
|
|
|
|
|
|
|
|
|
|
|
|
|
|
|
|
|
|
|
|
|
|
|
|
|
|
|
|
|
|
|
|
|
|
|
|
|
|
UNITED STATES
SECURITIES AND EXCHANGE COMMISSION
WASHINGTON, D.C. 20549
FORM 10-K
|
[ X ]
|
ANNUAL REPORT PURSUANT TO SECTION 13 OR 15(d) OF THE SECURITIES EXCHANGE ACT OF 1934
|
For the fiscal year ended
December 31, 2018
OR
|
[ ]
|
TRANSITION REPORT PURSUANT TO SECTION 13 OR 15(d) OF THE SECURITIES EXCHANGE ACT OF 1934
|
For the transition period from __________ to ___________
Commission file number 001-10960

FIRSTCASH, INC.
(Exact name of registrant as specified in its charter)
|
Delaware
|
75-2237318
|
|
(State or other jurisdiction of incorporation or organization)
|
(I.R.S. Employer Identification No.)
|
|
1600 West 7th Street, Fort Worth, Texas
|
76102
|
|
(Address of principal executive offices)
|
(Zip Code)
|
(817) 335-1100
(Registrant’s telephone number, including area code)
Securities registered pursuant to Section 12(b) of the Act:
|
Title of Each Class
|
Name of Each Exchange on Which Registered
|
|
Common Stock, par value $.01 per share
|
The Nasdaq Stock Market
|
Securities registered pursuant to Section 12(g) of the Act:
None
Indicate by check mark if the registrant is a well-known seasoned issuer, as defined in Rule 405 of the Securities Act.
x
Yes
o
No
Indicate by check mark if the registrant is not required to file reports pursuant to Section 13 or Section 15(d) of the Act.
o
Yes
x
No
Indicate by check mark whether the registrant (1) has filed all reports required to be filed by Section 13 or 15(d) of the Securities Exchange Act of 1934 during the preceding 12 months (or for such shorter period that the registrant was required to file such reports), and (2) has been subject to such filing requirements for the past 90 days.
x
Yes
o
No
Indicate by check mark whether the registrant has submitted electronically every Interactive Data File required to be submitted pursuant to Rule 405 of Regulation S-T (
§
232.405) during the preceding 12 months (or for such shorter period that the registrant was required to submit and post such files).
x
Yes
o
No
Indicate by check mark if disclosure of delinquent filers pursuant to Item 405 of Regulation S-K (§229.405) is not contained herein, and will not be contained, to the best of registrant's knowledge, in definitive proxy or information statements incorporated by reference in Part III of this Form 10-K or any amendment to this Form 10-K.
x
Indicate by check mark whether the registrant is a large accelerated filer, an accelerated filer, a non-accelerated filer or a smaller reporting company or an emerging growth company. See the definitions of “large accelerated filer,” “accelerated filer,” “smaller reporting company” and “emerging growth company” in Rule 12b-2 of the Exchange Act.
|
x
Large accelerated filer
|
o
Accelerated filer
|
|
o
Non-accelerated filer
|
o
Smaller reporting company
|
|
o
Emerging growth company
|
|
If an emerging growth company, indicate by check mark if the registrant has elected not to use the extended transition period for complying with any new or revised financial accounting standards provided pursuant to Section 13(a) of the Exchange Act.
o
Indicate by check mark whether the registrant is a shell company (as defined in Rule 12b-2 of the Act).
o
Yes
x
No
As of
June 29, 2018
, the aggregate market value of the registrant’s common stock held by non-affiliates of the registrant was approximately
$3,326,000,000
based on the closing price as reported on the New York Stock Exchange.
As of
January 28, 2019
, there were
43,565,075
shares of common stock outstanding.
DOCUMENTS INCORPORATED BY REFERENCE
Portions of the registrant’s definitive Proxy Statement relating to its
2019
Annual Meeting of Stockholders to be held on or about
June 11, 2019
, is incorporated by reference in Part III, Items 10, 11, 12, 13 and 14 of this Annual Report on Form 10-K.
FIRSTCASH, INC.
FORM 10-K
For the Year Ended December 31,
2018
TABLE OF CONTENTS
FORWARD-LOOKING INFORMATION
This annual report contains forward-looking statements about the business, financial condition and prospects of FirstCash, Inc. and its wholly owned subsidiaries (together, the “Company”). Forward-looking statements, as that term is defined in the Private Securities Litigation Reform Act of 1995, can be identified by the use of forward-looking terminology such as “believes,” “projects,” “expects,” “may,” “estimates,” “should,” “plans,” “targets,” “intends,” “could,” “would,” “anticipates,” “potential,” “confident,” “optimistic” or the negative thereof, or other variations thereon, or comparable terminology, or by discussions of strategy, objectives, estimates, guidance, expectations and future plans. Forward-looking statements can also be identified by the fact these statements do not relate strictly to historical or current matters. Rather, forward-looking statements relate to anticipated or expected events, activities, trends or results. Because forward-looking statements relate to matters that have not yet occurred, these statements are inherently subject to risks and uncertainties.
While the Company believes the expectations reflected in forward-looking statements are reasonable, there can be no assurances such expectations will prove to be accurate. Security holders are cautioned that such forward-looking statements involve risks and uncertainties. Certain factors may cause results to differ materially from those anticipated by the forward-looking statements made in this annual report. Such factors may include, without limitation, the risks, uncertainties and regulatory developments discussed and described in (1) this annual report, including the risks described in Part I, Item IA, “Risk Factors” hereof, and (2) other reports filed with the SEC. Many of these risks and uncertainties are beyond the ability of the Company to control, nor can the Company predict, in many cases, all of the risks and uncertainties that could cause its actual results to differ materially from those indicated by the forward-looking statements. The forward-looking statements contained in this annual report speak only as of the date of this annual report, and the Company expressly disclaims any obligation or undertaking to report any updates or revisions to any such statement to reflect any change in the Company’s expectations or any change in events, conditions or circumstances on which any such statement is based, except as required by law.
PART I
Item 1. Business
General
The Company is a leading operator of retail pawn stores in the U.S. and Latin America. As of
December 31, 2018
, the Company had
2,473
locations, consisting of
1,094
stores in
24
U.S. states and the District of Columbia,
1,323
stores in all
32
states in Mexico,
39
stores in Guatemala,
13
stores in El Salvador and
four
stores in Colombia.
The Company’s primary business is the operation of full-service pawn stores, also known as “pawnshops,” which make pawn loans secured by personal property such as consumer electronics, jewelry, tools, household appliances, sporting goods and musical instruments. Pawn stores also generate significant retail sales of merchandise acquired through collateral forfeitures on forfeited pawn loans and over-the-counter purchases of merchandise directly from customers. For the year ended
December 31, 2018
,
97%
of the Company’s revenues were derived from pawn operations. The Company’s strategy is to focus on growing its full-service pawn operations in the U.S. and Latin America through a combination of new store openings and strategic acquisition opportunities as they arise.
Pawn stores provide customers with instant access to capital through small non-recourse pawn loans or buying merchandise from its customers. Pawn loans can be quickly and easily accessed by customers who often have limited access to traditional credit products. Pawn loans are safe and affordable non-recourse loans for which the customer has no legal obligation to repay. The Company does not attempt to collect on delinquent loans, does not take legal actions against its customers, does not blacklist its customers, nor does it issue any negative external credit reporting, but rather relies only on the resale of the pawn collateral for recovery.
Pawnshops also contribute to the modern “circular economy.” The retail merchandise sold in pawnshops is almost entirely sourced locally from its customers and is sold at significant discounts compared to similar “new” items offered by other retailers. By acquiring and reselling popular consumer products, the Company and its customers are extending the lifetime value of goods. The Company also provides an interest-free layaway program which assists cash and credit-constrained shoppers in acquiring retail merchandise by offering affordable payments over time.
The Company organizes its operations into two reportable segments: the U.S. operations segment and the Latin America operations segment. The U.S. operations segment consists of all pawn and consumer loan operations in the U.S. and the Latin America operations segment consists of all pawn and consumer loan operations in Latin America, which includes operations in Mexico, Guatemala, El Salvador and Colombia. For the year ended
December 31, 2018
,
69%
of total revenues were derived from the U.S. and
31%
were derived from Latin America. For additional historical information on the composition of revenues from the U.S. and Latin America, see “Item 7. Management’s Discussion and Analysis of Financial Condition and Results of Operations—Results of Operations.”
On September 1, 2016, the Company completed its merger with Cash America International, Inc. (“Cash America”), whereby Cash America merged with and into a wholly owned subsidiary of the Company (the “Merger”). The accompanying audited consolidated results of operations for the year ended December 31, 2016 includes the results of operations for Cash America for the period September 2, 2016 to December 31, 2016, thereby affecting comparability to fiscal 2018 and 2017 amounts, which include the results of operations for Cash America for the full respective periods.
The Company was formed as a Texas corporation in July 1988. In April 1991, the Company reincorporated as a Delaware corporation. The Company’s principal executive offices are located at 1600 West 7th Street, Fort Worth, Texas 76102, and its telephone number is (817) 335-1100.
1
Pawn Industry
The Company’s pawn stores directly compete in both the specialty retail and consumer finance industries. Pawn stores are neighborhood-based retail stores that buy and sell consumer items such as consumer electronics, jewelry, tools, appliances, sporting goods and musical instruments. Pawn stores also provide a quick and convenient source of small consumer loans to unbanked, under-banked and credit-challenged customers. These consumers are typically not effectively or efficiently served by traditional lenders such as banks, credit unions, credit card providers or other small loan providers.
United States
The pawn industry in the U.S. is well established, with the highest concentration of pawn stores located in the Southeast, Midwest and Southwest regions of the country. The operation of pawn stores is governed primarily by state laws and accordingly, states that maintain regulations most conducive to profitable pawn operations have historically seen the greatest concentration of pawn stores. Management believes the U.S. pawn industry, although mature, remains highly fragmented. The two major publicly traded companies in the pawn industry, which includes the Company, currently operate approximately 1,600 of the estimated 12,000 to 14,000 pawn stores in the U.S. The Company believes the majority of pawnshops in the U.S. are owned by individuals operating five or fewer locations.
Mexico and Other Latin American Markets
The majority of pawn stores in Latin America are smaller than U.S. pawn stores, with limited retail space and pawn loans typically collateralized by gold jewelry or small consumer electronics. In contrast, a majority of the Company’s pawn stores in Latin America are larger format, full-service stores, similar to the U.S. stores, which lend on a wide array of collateral and have a larger retail sales floor. Accordingly, competition in Latin America with the Company’s larger format, full-service pawn stores is limited. A large percentage of the population in Mexico and other countries in Latin America is unbanked or under-banked and has limited access to consumer credit. The Company believes there is significant opportunity for further expansion in Mexico and other Latin American countries due to the large potential consumer base and limited competition from other large format, full-service pawn store operators.
Business Strategy
The Company’s business plan is to increase revenues and long-term profitability by opening new (“de novo”) retail pawn locations, acquiring existing pawn stores in strategic markets and attempting to increase revenue and operating profits in existing stores. In pursuing its business strategy, the Company seeks to establish clusters of several stores in specific geographic areas with favorable regulations and customer demographics and to achieve certain economies of scale relative to management and supervision, pricing and purchasing, information and accounting systems and marketing.
The Company has opened or acquired 1,750 pawn stores in the last five fiscal years. Net store additions have grown at a compound annual store growth rate of 22% over this period. The Company intends to open additional stores in locations where management believes appropriate demand and other favorable conditions exist. The following table details stores opened and acquired over the five year period ended December 31,
2018
:
2
|
Year Ended December 31,
|
||||||||||||||
|
2018
|
2017
|
2016
|
2015
|
2014
|
||||||||||
|
U.S. operations segment:
|
||||||||||||||
|
Merged Cash America locations
|
—
|
|
—
|
|
815
|
|
—
|
|
—
|
|
||||
|
New locations opened
|
—
|
|
2
|
|
—
|
|
—
|
|
8
|
|
||||
|
Locations acquired
|
27
|
|
1
|
|
3
|
|
33
|
|
25
|
|
||||
|
Total additions
|
27
|
|
3
|
|
818
|
|
33
|
|
33
|
|
||||
|
Latin America operations segment:
|
||||||||||||||
|
New locations opened
|
52
|
|
45
|
|
41
|
|
38
|
|
31
|
|
||||
|
Locations acquired
|
366
|
|
5
|
|
179
|
|
32
|
|
47
|
|
||||
|
Total additions
|
418
|
|
50
|
|
220
|
|
70
|
|
78
|
|
||||
|
Total:
|
|
|
|
|
|
|
||||||||
|
Merged Cash America locations
|
—
|
|
—
|
|
815
|
|
—
|
|
—
|
|
||||
|
New locations opened
|
52
|
|
47
|
|
41
|
|
38
|
|
39
|
|
||||
|
Locations acquired
|
393
|
|
6
|
|
182
|
|
65
|
|
72
|
|
||||
|
Total additions
|
445
|
|
53
|
|
1,038
|
|
103
|
|
111
|
|
||||
For additional information on store count activity, see “Locations and Operations” below.
New Store Openings
The Company plans to continue opening new pawn stores, primarily in Latin America, and to a much lesser extent, in the U.S. The Company typically opens new stores in under-developed markets, especially where customer demographics are favorable and competition is limited or restricted. After a suitable location has been identified and a lease and the appropriate licenses are obtained, a new store can typically be open for business within six to 12 weeks. The investment required to open a new location includes store operating cash, inventory, funds for pawn loans, leasehold improvements, store fixtures, security systems, computer equipment and other start-up costs.
Acquisitions
Due to the fragmented nature of the pawn industry, the Company believes attractive acquisition opportunities will continue to arise from time to time in both Latin America and the U.S. Before making an acquisition, management assesses the demographic characteristics of the surrounding area, considers the number, proximity and size of competing stores, and researches federal, state and local regulatory standards. Specific pawn store acquisition criteria include an evaluation of the volume of merchandise sales and pawn transactions, outstanding customer pawn loan balances, historical pawn yields, merchandise sales margins, pawn loan redemption rates, the condition and quantity of inventory on hand and the location, condition and lease terms of the facility.
Enhance Productivity of Existing and Newly Opened Stores
The primary factors affecting the profitability of the Company’s existing store base are the volume and gross profit of merchandise sales, the volume of and yield on pawn loans and store operating expenses. To encourage customer traffic, which management believes is a key determinant of a store’s success, the Company has taken several steps to distinguish its stores and to make customers feel more comfortable. In addition to a clean and secure physical store facility, the stores’ exteriors typically display attractive and distinctive signage similar to that used by contemporary specialty retailers.
The Company has employee-training programs that promote customer service, productivity and professionalism. The Company utilizes a proprietary computer information system that provides fully-integrated functionality to support point-of-sale retail operations, real-time merchandise valuations, loan-to-value calculations, inventory management, customer recordkeeping, loan management, compliance and control systems and employee compensation. Each store is connected on a real-time basis to a secure data center that houses the centralized databases and operating systems. The information systems provide management with the ability to continuously monitor store transactions and operating results.
3
The Company maintains a well-trained internal audit staff that conducts regular store audits to test compliance of financial and operational controls. Management believes the current operating and financial controls and systems are adequate for the Company’s existing store base and can accommodate reasonably foreseeable growth in the near term.
Services Offered by the Company
Pawn Merchandise Sales
The Company’s pawn merchandise sales are primarily retail sales to the general public from its pawn stores. The items the Company sells generally consist of pre-owned consumer electronics, jewelry, tools, household appliances, sporting goods and musical instruments. The Company also melts certain quantities of scrap jewelry and sells the gold, silver and diamonds in commodity markets. Merchandise sales accounted for approximately
67%
of the Company’s revenue during fiscal
2018
.
Merchandise inventory is acquired primarily through forfeited pawn loan collateral and, to a lesser extent, through purchases of used goods directly from the general public. Merchandise acquired by the Company through forfeited pawn loan collateral is carried in inventory at the amount of the related pawn loan, exclusive of any accrued service fees. The Company also acquires limited quantities of new or refurbished general merchandise inventories directly from wholesalers and manufacturers.
The Company does not provide direct financing to customers for the purchase of its merchandise, but does permit its customers to purchase merchandise on an interest-free “layaway” plan. Should the customer fail to make a required payment pursuant to a layaway plan, the item is returned to inventory and previous payments are typically forfeited to the Company. Interim payments from customers on layaway sales are recorded as deferred revenue and subsequently recorded as retail merchandise sales revenue when the merchandise is delivered to the customer upon receipt of final payment or when previous payments are forfeited to the Company.
Retail sales are seasonally highest in the fourth quarter associated with holiday shopping and, to a lesser extent, in the first quarter associated with tax refunds in the U.S.
Pawn Lending Activities
The Company’s pawn stores make small, secured loans to its customers in order to help them meet short-term cash needs. All pawn loans are collateralized by personal property such as consumer electronics, jewelry, tools, household appliances, sporting goods and musical instruments. The pledged collateral provides the only security to the Company for the repayment of the loan. The Company does not investigate the creditworthiness of the borrower, primarily relying instead on the marketability and sales value of pledged goods as a basis for its credit decision. Pawn loans are non-recourse loans and a customer does not have a legal obligation to repay a pawn loan. There is no collections process and the decision to not repay the loan will not affect the customer’s credit score.
At the time a pawn loan transaction is entered into, an agreement or contract, commonly referred to as a “pawn ticket,” is delivered to the borrower for signature that sets forth, among other items, the name and address of the pawnshop, the borrower’s name, the borrower’s identification number from his/her driver’s license or other government issued identification, date, identification and description of the pledged goods, including applicable serial numbers, amount financed, pawn service fee, maturity date, total amount that must be paid to redeem the pledged goods on the maturity date and the annual percentage rate.
Pledged property is held in a secured, non-public area of the pawn store through the term of the loan, unless the loan is repaid earlier. In certain markets, the Company also provides pawn loans collateralized by automobiles, which typically remain in the possession of the customer. The term of a pawn loan is typically 30 days plus an additional grace period of 14 to 90 days, depending on geographic markets and local regulations. Pawn loans may be either paid in full with accrued pawn loan fees and service charges or, where permitted by law, may be renewed or extended by the customer’s payment of accrued pawn loan fees and service charges. If a pawn loan is not repaid prior to the expiration of the grace period, the pawn collateral is forfeited to the Company and transferred to inventory at a value equal to the principal amount of the loan, exclusive of accrued service fees. The Company does not record pawn loan losses or charge-offs because the amount advanced becomes the carrying cost of the forfeited collateral that is to be recovered through the merchandise sales function described above.
The pawn loan fees are typically calculated as a percentage of the pawn loan amount based on the size, duration and type of collateral of the pawn loan and generally range from 4% to 25% per month, as permitted by applicable law. As required by applicable law, the amounts of these charges are disclosed to the customer on the pawn ticket. Pawn loan fees accounted for approximately
30%
of the Company’s revenue during fiscal
2018
.
4
The amount the Company is willing to finance for a pawn loan is primarily based on a percentage of the estimated retail value of the collateral. There are no minimum or maximum pawn loan to fair market value restrictions in connection with the Company’s lending activities. In order to estimate the value of the collateral, the Company utilizes its proprietary computer information system to recall recent selling prices of similar merchandise in its own stores. The basis for the Company’s determination of the retail value also includes such sources as precious metals spot markets, catalogs, blue books, online auction sites and retailer advertisements. These sources, together with the employees’ experience in selling similar items of merchandise in particular stores, influence the determination of the estimated retail value of such items. The Company does not utilize a standard or mandated percentage of estimated retail value in determining the amount to be financed. Rather, the employee has the authority to set the percentage for a particular item and to determine the ratio of pawn loan amount to estimated sales value with the expectation that, if the item is forfeited to the pawnshop, its subsequent sale should yield a gross profit margin consistent with the Company’s historical experience. The recovery of the principal and realization of gross profit on sales of inventory is dependent on the Company’s initial assessment of the property’s estimated retail value. Improper assessment of the retail value of the collateral in the lending function can result in reduced marketability of the property resulting in a reduced gross profit margin.
The Company typically experiences seasonal growth in its pawn loan balances in the third and fourth quarters following lower balances in the first two quarters due to the heavy repayment of pawn loans associated with statutory bonuses received by customers in the fourth quarter in Mexico and with tax refund proceeds typically received by customers in the first quarter in the U.S.
Credit Services and Consumer Loan Activities
As of
December 31, 2018
, the Company operated
17
stand-alone consumer loan locations in the U.S. In addition,
262
pawn locations in the U.S. also offer consumer loan products, of which 113 are the smaller format Cashland stores located in Ohio. Effective June 30, 2018, the Company ceased to offer unsecured consumer loan products in Mexico and closed its remaining stand-alone consumer loan stores in that country. Total revenues from consumer loan and credit services operations accounted for approximately
3%
of total revenues in
2018
.
The Company offers fee-based credit services organization programs (“CSO Programs”) to assist consumers in obtaining extensions of credit. The Company’s stand-alone consumer loan stores and select pawn stores in the states of Texas and Ohio offer the CSO Programs. The Company’s CSO Programs comply with the respective jurisdiction’s credit services organization act, credit access business law or a similar statute. Under the CSO Programs, the Company assists customers in applying for a short-term extension of credit from independent, non-bank, consumer lending companies (the “Independent Lenders”) and issues the Independent Lenders a guarantee for the repayment of the extension of credit. The Company also offers an automobile title lending product under the CSO Programs. Credit services fees accounted for
1%
of the Company’s revenue during fiscal
2018
.
The Company also offers small, unsecured consumer loans to customers in various states within the U.S. To qualify for a consumer loan, a customer generally must have proof of steady income, residence and valid identification. At maturity, the loan and related fee is repaid by the customer with cash at the store or through a pre-authorized automated clearing house (“ACH”) transaction. If the customer fails to repay the loan or the ACH transaction is returned, the Company initiates collection procedures. Consumer loan fees accounted for
2%
of the Company’s revenue during fiscal
2018
.
On July 30, 2018, the governor of Ohio signed into law the Ohio Fairness in Lending Act (the “Ohio Act”) which will significantly impact the consumer loan industry in Ohio. See “Governmental Regulation” for further information about the Act and its potential impact on the Company’s results of operations.
See additional discussion of the credit loss provision and related allowances/accruals in “Item 7. Management’s Discussion and Analysis of Financial Condition and Results of Operations—Critical Accounting Policies.”
5
Franchise Operations
As of
December 31, 2018
, the Company had
62
unconsolidated franchised check cashing locations in the U.S. operating under the “Mr. Payroll” brand. Each of the Company’s unconsolidated franchised check cashing locations is subject to a franchise agreement negotiated individually with each franchisee and has varying durations. The Company receives franchise fees from each franchisee based on the gross revenue of check cashing services provided within the franchisee’s facility.
As of December 31, 2018, the Company had
221
unconsolidated franchised pawn locations in Mexico operating under the “Prendamex” brand. Each of the Company’s unconsolidated franchised pawn locations is subject to a franchise agreement negotiated individually with each franchisee and has varying durations. The Company receives franchise fees from each franchisee based on pawn loan and inventory balances of the franchised stores.
Total revenue from franchise fees accounted for less than 1% of consolidated total revenue during fiscal
2018
.
Locations and Operations
As of
December 31, 2018
, the Company had
2,473
store locations composed of
1,094
stores in
24
U.S. states and the District of Columbia,
1,323
stores in all
32
states in Mexico,
39
stores in Guatemala,
13
stores in El Salvador and
four
stores in Colombia.
The following table details store count activity for the twelve months ended
December 31, 2018
:
|
|
Consumer
Loan
Locations
(3)
|
|
|||||||
|
Pawn
Locations
(1), (2)
|
Total
Locations
|
||||||||
|
U.S. operations segment:
|
|
|
|
||||||
|
Total locations, beginning of period
|
1,068
|
|
44
|
|
1,112
|
|
|||
|
Locations acquired
|
27
|
|
—
|
|
27
|
|
|||
|
Locations closed or consolidated
|
(18
|
)
|
(27
|
)
|
(45
|
)
|
|||
|
Total locations, end of period
|
1,077
|
|
17
|
|
1,094
|
|
|||
|
Latin America operations segment:
|
|
|
|
||||||
|
Total locations, beginning of period
|
971
|
|
28
|
|
999
|
|
|||
|
New locations opened
|
52
|
|
—
|
|
52
|
|
|||
|
Locations acquired
|
366
|
|
—
|
|
366
|
|
|||
|
Locations closed or consolidated
|
(10
|
)
|
(28
|
)
|
(38
|
)
|
|||
|
Total locations, end of period
|
1,379
|
|
—
|
|
1,379
|
|
|||
|
Total:
|
|
|
|
||||||
|
Total locations, beginning of period
|
2,039
|
|
72
|
|
2,111
|
|
|||
|
New locations opened
|
52
|
|
—
|
|
52
|
|
|||
|
Locations acquired
|
393
|
|
—
|
|
393
|
|
|||
|
Locations closed or consolidated
|
(28
|
)
|
(55
|
)
|
(83
|
)
|
|||
|
Total locations, end of period
|
2,456
|
|
17
|
|
2,473
|
|
|||
|
(1)
|
At
December 31, 2018
,
262
of the U.S. pawn stores, primarily located in Texas and Ohio, also offered consumer loans and/or credit services primarily as an ancillary product. This compares to 313 U.S. pawn locations which offered such products as of December 31, 2017. Effective June 30, 2018, the Company no longer offers an unsecured consumer loan product in Latin America. The table does not include
221
Mexico pawn locations operated by independent franchisees under franchising agreements with the Company.
|
|
(2)
|
The Company closed 28 pawn stores, 18 in the U.S. and 10 in Latin America, during fiscal
2018
, which were primarily smaller format stores emphasizing payday lending or underperforming locations which were consolidated into existing stores, an opportunity driven by merger and acquisition activity.
|
|
(3)
|
The Company’s U.S. free-standing consumer loan locations offer consumer loans and/or credit services products and are located in Ohio and Texas. The table does not include
62
U.S. check cashing locations operated by independent franchisees under franchising agreements with the Company.
|
6
The Company maintains its primary administrative offices in Fort Worth, Texas, Monterrey, Mexico and Mexico City, Mexico.
As of
December 31, 2018
, the Company’s stores were located in the following countries and states:
|
Pawn
Locations
(1)
|
Consumer
Loan Locations (1) |
Total Locations
|
||||||
|
U.S.:
|
||||||||
|
Texas
|
389
|
|
8
|
|
397
|
|
||
|
Ohio
|
110
|
|
9
|
|
119
|
|
||
|
Florida
|
75
|
|
—
|
|
75
|
|
||
|
Tennessee
|
53
|
|
—
|
|
53
|
|
||
|
Georgia
|
46
|
|
—
|
|
46
|
|
||
|
North Carolina
|
41
|
|
—
|
|
41
|
|
||
|
Indiana
|
33
|
|
—
|
|
33
|
|
||
|
Washington
|
33
|
|
—
|
|
33
|
|
||
|
Arizona
|
31
|
|
—
|
|
31
|
|
||
|
Colorado
|
30
|
|
—
|
|
30
|
|
||
|
Maryland
|
29
|
|
—
|
|
29
|
|
||
|
Illinois
|
27
|
|
—
|
|
27
|
|
||
|
Nevada
|
27
|
|
—
|
|
27
|
|
||
|
South Carolina
|
27
|
|
—
|
|
27
|
|
||
|
Louisiana
|
26
|
|
—
|
|
26
|
|
||
|
Kentucky
|
25
|
|
—
|
|
25
|
|
||
|
Missouri
|
24
|
|
—
|
|
24
|
|
||
|
Oklahoma
|
18
|
|
—
|
|
18
|
|
||
|
Alabama
|
8
|
|
—
|
|
8
|
|
||
|
Utah
|
7
|
|
—
|
|
7
|
|
||
|
Alaska
|
6
|
|
—
|
|
6
|
|
||
|
Virginia
|
6
|
|
—
|
|
6
|
|
||
|
District of Columbia
|
3
|
|
—
|
|
3
|
|
||
|
Wyoming
|
2
|
|
—
|
|
2
|
|
||
|
Nebraska
|
1
|
|
—
|
|
1
|
|
||
|
1,077
|
|
17
|
|
1,094
|
|
|||
|
Mexico:
|
||||||||
|
Estado de. Mexico (State of Mexico)
|
155
|
|
—
|
|
155
|
|
||
|
Veracruz
|
133
|
|
—
|
|
133
|
|
||
|
Puebla
|
109
|
|
—
|
|
109
|
|
||
|
Tamaulipas
|
87
|
|
—
|
|
87
|
|
||
|
Baja California
|
78
|
|
—
|
|
78
|
|
||
|
Nuevo Leon
|
64
|
|
—
|
|
64
|
|
||
|
Jalisco
|
62
|
|
—
|
|
62
|
|
||
|
Tabasco
|
54
|
|
—
|
|
54
|
|
||
|
Chiapas
|
50
|
|
—
|
|
50
|
|
||
|
Coahuila
|
43
|
|
—
|
|
43
|
|
||
|
Estado de Ciudad de Mexico (State of Mexico City)
|
43
|
|
—
|
|
43
|
|
||
|
Oaxaca
|
42
|
|
—
|
|
42
|
|
||
7
|
Pawn
Locations
(1)
|
Consumer
Loan Locations (1) |
Total Locations
|
||||||
|
Mexico (continued):
|
||||||||
|
Hidalgo
|
41
|
|
—
|
|
41
|
|
||
|
Chihuahua
|
40
|
|
—
|
|
40
|
|
||
|
Guanajuato
|
36
|
|
—
|
|
36
|
|
||
|
Quintana Roo
|
31
|
|
—
|
|
31
|
|
||
|
Sonora
|
30
|
|
—
|
|
30
|
|
||
|
Guerrero
|
26
|
|
—
|
|
26
|
|
||
|
Sinaloa
|
25
|
|
—
|
|
25
|
|
||
|
Michoacan
|
21
|
|
—
|
|
21
|
|
||
|
Morelos
|
18
|
|
—
|
|
18
|
|
||
|
San Luis Potosi
|
18
|
|
—
|
|
18
|
|
||
|
Aguascalientes
|
17
|
|
—
|
|
17
|
|
||
|
Campeche
|
16
|
|
—
|
|
16
|
|
||
|
Durango
|
15
|
|
—
|
|
15
|
|
||
|
Queretaro
|
14
|
|
—
|
|
14
|
|
||
|
Tlaxcala
|
12
|
|
—
|
|
12
|
|
||
|
Yucatan
|
11
|
|
—
|
|
11
|
|
||
|
Baja California Sur
|
10
|
|
—
|
|
10
|
|
||
|
Zacatecas
|
10
|
|
—
|
|
10
|
|
||
|
Nayarit
|
7
|
|
—
|
|
7
|
|
||
|
Colima
|
5
|
|
—
|
|
5
|
|
||
|
1,323
|
|
—
|
|
1,323
|
|
|||
|
Guatemala
|
39
|
|
—
|
|
39
|
|
||
|
El Salvador
|
13
|
|
—
|
|
13
|
|
||
|
Colombia
|
4
|
|
—
|
|
4
|
|
||
|
Total
|
2,456
|
|
17
|
|
2,473
|
|
||
|
(1)
|
The table does not include
221
Mexico pawn locations and
62
U.S. check cashing locations operated by independent franchisees under franchising agreements with the Company.
|
8
Pawn Store Operations
The typical Company large-format pawn store is a freestanding building or part of a retail shopping center with adequate, well-lit parking. The Company also operates smaller stores in Mexico in urban markets which may not have parking. Management has established a standard store design intended to distinguish the Company’s stores from the competition. The design consists of a well-illuminated exterior with distinctive signage and a layout similar to other contemporary specialty retailers. The Company’s stores are typically open six or seven days a week from 9:00 a.m. to between 6:00 p.m. and 9:00 p.m.
The Company attempts to attract customers primarily through the pawn stores’ visibility and neighborhood presence. The Company uses seasonal promotions, special discounts for regular customers, prominent display of impulse purchase items such as consumer electronics, jewelry and tools, tent and sidewalk sales, and a layaway purchasing plan to attract retail shoppers. The Company attempts to attract and retain pawn customers by lending a competitive percentage of the estimated sales value of items presented for pledge and by providing quick financing, renewal and redemption services in an appealing atmosphere.
Generally, each pawnshop employs a manager, one or two assistant managers, and between one and eight sales personnel, depending upon the size, sales volume and location of the store. The store manager is responsible for customer relations, reviewing pawn transactions and related collateral, inventory management, supervising personnel and assuring the store is managed in accordance with Company guidelines and established policies and procedures which emphasize safeguarding of Company assets, strict cost containment and financial controls. All store personnel are expected to monitor expenses to contain costs. All material invoices are paid from Company headquarters in order to enhance financial accountability. The Company believes careful monitoring of customer transaction metrics and operational expenses enables it to maintain financial stability and profitability.
Each store manager reports to a district manager, who typically oversees four to seven store managers. District managers typically report to a regional manager who, in turn, typically reports to a regional operations director. Regional operations directors report to a regional vice president of operations. There are four regional vice presidents of operations and a senior vice president of operations who report to the chief operating officer.
The Company believes the profitability of its pawnshops is dependent, among other factors, upon its employees’ ability to engage with customers and provide prompt and courteous service. The Company’s proprietary computer system tracks certain key transactional performance measures including pawn loan yields and merchandise sales margins and permits a store manager or clerk to rapidly recall the cost of an item in inventory and the date it was purchased, as well as the prior transaction history of a particular customer. It also facilitates the timely valuation of goods by showing values assigned to similar goods. The Company has networked its stores to allow employees to more accurately determine the retail value of merchandise and to permit the Company’s headquarters to more efficiently monitor each store’s operations, including merchandise sales, service charge revenue, pawn loans written and redeemed and changes in inventory.
The Company trains its employees through direct instruction and on-the-job pawn and sales experience. New employees are introduced to the business through an orientation and training program that includes on-the-job training in lending practices, layaways, merchandise valuation and general administration of store operations. Certain experienced employees receive training and an introduction to the fundamentals of management to acquire the skills necessary to advance into management positions within the organization. Management training typically involves exposure to income maximization, recruitment, inventory control and cost efficiency. The Company maintains a performance-based profit sharing compensation plan for all store employees based on sales, gross profit and other performance criteria.
Credit Services and Consumer Loan Operations
Similar to the Company’s pawn store operations, the Company’s credit services and consumer loan locations are typically part of a retail strip shopping center with good visibility from a major street and easy access to parking. Management has established a standard store design intended to distinguish the Company’s stores from the competition, which consists of a well-illuminated exterior with distinctive signage. The interiors typically feature an ample lobby separated from employee work areas by glass teller windows. The Company’s credit services and consumer loan locations typically have hours similar to the Company’s pawn stores. The Company does not have any online credit services or consumer loan operations.
9
Environmental Sustainability and Social Responsibili
ty
The Company is committed to sustainability and to operating its business in a manner that results in a positive impact on its employees, communities and the environment.
Pawnshops are neighborhood-based stores which contribute to the modern “circular economy.” Each of the Company’s
2,456
pawn locations provides a quick and convenient source of small, non-recourse consumer loans and a neighborhood-based market for consumers to buy and resell popular consumer products in a safe environment. Virtually all collateral and inventory is pre-owned merchandise which is sourced and then recycled within each store’s geographic neighborhood. Unlike most retailers, the Company does not rely on manufacturing its inventories nor does it source any material volume of inventories from third party manufacturers or wholesalers. Accordingly, the Company does not own, operate or contract for any manufacturing, warehousing or distribution facilities which directly support the retail operations and, other than operating small store front locations of typically 5,000 square feet or less, the Company has virtually no carbon footprint related to its operations.
The Company also contributes to its communities by providing customers with instant access to capital through small non-recourse pawn loans or buying merchandise from its customers. Pawn loans can be quickly and easily accessed by customers who often have limited access to traditional credit products. Pawn loans are highly regulated, safe and affordable non-recourse loans for which the customer has no legal obligation to repay. The Company does not attempt to collect on delinquent loans, does not take legal actions against its customers, does not blacklist its customers, nor does it issue any negative external credit reporting, but rather relies only on the resale of the pawn collateral for recovery.
The Company has over 19,000 employees across five countries (the U.S., Mexico, Guatemala, El Salvador and Colombia). It is committed to creating a safe, trusted and diverse environment in which its employees can thrive. Its employees’ wages are typically well above minimum wage standards in each country in which it operates. It also provides its employees with extensive training and advancement opportunities, demonstrated by its long track record of employee advancement and promotion from within the organization. The Company maintains a robust know your customer, anti-money laundering and anti-bribery training program and requires its locations to adhere to a labor compliance program that meets or exceeds the standards established for coercion and harassment, discrimination and restrictions to freedom of association. The Company’s locations provide a safe, comfortable and healthy work environment and maintain compliance with all occupational safety, wage and hour laws and other workplace regulations.
The Company values diversity at all levels of its organization. In the U.S., approximately 68% of all employees are ethnically diverse, and in total, approximately 87% of all employees are ethnically diverse. The Company’s store management employee population, in particular, exhibits a high level of female and ethnic diversity, with approximately 54% being female and approximately 90% being either female and/or ethnically diverse.
The Company also believes in fairly compensating its employees and providing them with an ability to share in the Company’s profitability. For example, the majority of the Company’s front-line employees participate in a non-qualified profit sharing program which pays up to 8% of the gross profit they personally participate in through customer service activities.
Competition
The Company encounters significant competition in connection with all aspects of its business operations. These competitive conditions may adversely affect the Company’s revenue, profitability and ability to expand. The Company believes the primary elements of competition in the businesses in which it operates are store location, customer service, the ability to lend competitive amounts on pawn loans and to sell popular retail merchandise at competitive prices. In addition, the Company competes with other lenders and retailers to attract, motivate and retain employees with competitive compensation programs.
The Company’s pawn business competes primarily with other pawn store operators, other specialty consumer finance operators, rent-to-own stores and specialty consumer goods retailers. Management believes the pawn industry remains highly fragmented with an estimated 12,000 to 14,000 total pawnshops in the U.S. and 7,000 to 8,000 pawnshops in Mexico. Including the Company, there are two publicly-held, U.S.-based pawnshop operators, both of which have pawn operations in the U.S., Mexico, Guatemala and El Salvador. Of these two, the Company had the most pawn stores and the largest market capitalization as of
December 31, 2018
, and believes it is the largest public or private operator of large format, full-service pawn stores in the U.S. and Mexico. The pawnshop and other specialty consumer finance industries are characterized by a large number of independent owner-operators, some of whom own and operate multiple locations. In addition, the Company competes with other non-pawn lenders, such as banks and consumer finance companies, which generally lend on an unsecured as well as a secured basis. Other lenders may and do lend money on terms more favorable than those offered by the Company. Many of these financial institutions have greater financial resources than the Company’s with which to compete for consumer loans.
10
In both its U.S. and Latin American retail pawn operations, the Company’s competitors include numerous retail and wholesale merchants, including jewelry stores, rent-to-own stores, discount retail stores, “second-hand” stores, consumer electronics stores, other specialty retailers, online retailers, online auction sites, online classified advertising sites and other pawnshops. Competitive factors in the Company’s retail operations include the ability to provide the customer with a variety of merchandise items at attractive prices. Many of the retail competitors have significantly greater size and financial resources than the Company.
Intellectual Property
The Company relies on a combination of trademarks, trade secrets, proprietary software, website domain names and other rights, including confidentiality procedures and contractual provisions to protect its proprietary technology, processes and other intellectual property.
The Company’s competitors may develop products that are similar to its technology, such as the Company’s proprietary point of sale software. The Company enters into agreements with its employees, consultants and partners, and through these and other written agreements, the Company attempts to control access to and distribution of its software, documentation and other proprietary technology and information. Despite the Company’s efforts to protect its proprietary rights, third parties may, in an authorized or unauthorized manner, attempt to use, copy or otherwise obtain and market or distribute its intellectual property rights or technology or otherwise develop a product with the same functionality as its solution. Policing all unauthorized use of the Company’s intellectual property rights is nearly impossible. The Company cannot be certain that the steps it has taken or will take in the future will prevent misappropriations of its technology or intellectual property rights.
“First Cash Pawn,” “Cash America”
and
“Cashland”
are trademarks owned by the Company registered in the U.S.
“FirstCash,” “First Cash,” “First Cash Empeño y Joyeria,” “Cash Ya,” “Cash & Go,” “CA,” “Cash America,” “Presta Max,” “Realice Empeños,” “Empeños Mexicanos” and “Maxi Prenda”
are trademarks owned by the Company registered in the respective Latin American countries. Prendamex is a registered trademark in Mexico for which the Company has a contractual right to use. Other significant trade names used by the Company in the U.S. and abroad include First Cash Advance, Famous Pawn, Fast Cash Pawn & Gold Center, King Pawn, Mister Money Pawn, Money Man Pawn, Valu + Pawn, Dan’s Discount Jewelry & Pawn, Quick Cash Pawn, Atomic Pawn, Loftis Jewelry & Pawnbrokers, Regent Pawn & Jewelry, Smart Pawn, Piazza Jewelry & Pawn, David’s Pawn Shop, Sharp Mart, Lakelands Pawn & Gun, SuperPawn, Mr. Payroll and Cash Plus Pawn.
Governmental Regulation
General
The Company is subject to significant regulation of its pawn, consumer loan and general business operations in all of the jurisdictions in which it operates. These regulations are implemented through various laws, ordinances and regulatory pronouncements from federal, state and municipal governmental entities in the U.S. and Latin America. These regulatory bodies often have broad discretionary authority over the establishment, interpretation and enforcement of such regulations. These regulations are subject to change, sometimes significantly, as a result of political, economic or social trends, events and media perception.
The Company is subject to specific laws, regulations and ordinances primarily concerning its pawn and consumer lending operations. Many statutes and regulations prescribe, among other things, the general terms of the Company’s pawn and consumer loan agreements, including maximum service fees and/or interest rates that may be charged and collected and mandatory consumer disclosures. In many municipal, state and federal jurisdictions, in both the U.S. and countries in Latin America, the Company must obtain and maintain regulatory store operating and employee licenses and comply with regular or frequent regulatory reporting and registration requirements, including reporting and recording of pawn loans, pawned collateral, used merchandise purchased from the general public, retail sales activities, firearm transactions, export, import and transfer of merchandise, and currency transactions, among other things.
In both the U.S. and Latin America, certain elected officials, regulators, consumer advocacy groups and the media have advocated for governmental action to further restrict or even prohibit pawn transactions or small consumer loans, such as payday advances and credit services products. Such advocates often characterize pawn and payday lending activities as unfair or potentially abusive to consumers and typically focus on the aggregate fees charged to a consumer for pawn and consumer loans, which are typically higher than the interest rate generally charged by banks, credit unions and credit card issuers to consumers with established or higher-rated credit. They also focus on affordability issues such as the borrower’s ability to repay such loans, real or perceived patterns of sustained or cyclical usage of such lending products and consumer loan collection practices perceived to be unfair or abusive. During the last few years, legislation, ordinances and edicts at federal, state and municipal levels have been introduced or enacted to prohibit, restrict or further regulate pawn and related transactions, including acceptance of pawn collateral and used merchandise in general or, from certain individuals, sales of such merchandise in general or specific categories such as firearms,
11
payday loans, consumer loans, credit services and related service fees on these products. In addition, public officials and regulatory authorities, including law enforcement in various levels of government in the U.S. and countries in Latin America have and will likely continue to make edicts, proposals or public statements concerning new or expanded regulations that would prohibit or further restrict pawn and consumer lending activities or other related pawn transactions.
The Company is subject to numerous other types of regulations including, but not limited to, regulations related to securities and exchange activities, including financial reporting and internal controls processes, data protection and privacy, tax compliance, health and safety, labor and employment practices, import/export activities, real estate transactions, electronic banking, credit card transactions, marketing, advertising and other general business activities.
There can be no assurance that the current political domestic and international climate will not change and negatively affect the Company’s business, or that additional local, state or federal statutes, regulations or edicts will not be enacted or that existing laws and regulations will not be amended, decreed or interpreted at some future date that could prohibit or limit the ability of the Company to profitably operate any or all of its services. For example, such regulations could restrict the ability of the Company to offer pawn loans, consumer loans and credit services, significantly decrease the interest rates or service fees for such lending activities, prohibit or more stringently regulate the acceptance of pawn collateral or buying used merchandise and the sale, exportation or importation of such pawn merchandise, or processing of consumer loan transactions through the banking system, any of which could have a material adverse effect on the Company’s operations and financial condition. If legislative, regulatory or other arbitrary actions or interpretations are taken at a federal, state or local level in the U.S. or countries in Latin America which negatively affect the pawn, consumer loan or credit services industries where the Company has a concentrated or significant number of stores, those actions could have a material adverse effect on the Company’s business operations. There can be no assurance that such regulatory action at any jurisdiction level will not be enacted, or that existing laws and regulations will not be amended, decreed or interpreted in such a way which could have a material adverse effect on the Company’s operations and financial condition.
U.S. Federal Regulations
The U.S. government and its agencies have significant regulatory authority over consumer financial services activities. In recent years, additional legislation and regulations have been enacted or proposed which has increased or could continue to increase regulation of the consumer finance industry. These regulations and restrictions are or may be specific to pawn, credit services and consumer loan operations.
The Consumer Financial Protection Bureau (the “CFPB”), created by Title X of the Dodd Frank Wall Street Reform and Consumer Protection Act of 2010 (the “Dodd-Frank Act”), has broad regulatory, supervisory and enforcement powers over certain financial institutions. Specifically, it has enforcement authority over all organizations the CFPB deems may create the potential for consumer harm or risk. The CFPB’s powers include explicit supervisory authority to examine and require registration of providers of consumer financial products and services, including providers of secured and unsecured consumer loans, such as the Company, the authority to adopt rules describing specified acts and practices as being “unfair,” “deceptive,” “abusive” and hence “unlawful,” and the authority to impose recordkeeping obligations and promulgate additional compliance requirements.
Over the years, the CFPB has systematically gathered data related to all aspects of the consumer loan industry and its impact on consumers and continues to use its
Short-Term, Small-Dollar Lending Procedures
, the field guide its examiners use when examining small-dollar lenders like the Company. The CFPB’s examination authority permits examiners to inspect the Company’s books and records and ask questions about its business and its practices relating to unsecured, small dollar loans, like payday loans. The examination procedures include, among other things, specific modules for examining marketing activities, loan application and origination activities, payment processing activities and sustained use by consumers, collections and collection practices, defaults, consumer reporting and third-party or vendor relationships.
In addition to the Dodd-Frank Act’s grant of regulatory, supervisory, and enforcement powers to the CFPB, the Dodd-Frank Act gives the CFPB authority to pursue administrative proceedings or litigation for actual or perceived violations of federal consumer laws (including the CFPB’s own rules). In these proceedings, the CFPB can seek consent orders, confidential memorandums of understandings, obtain cease and desist orders (which can include orders for redisclosure, restitution or rescission of contracts, as well as affirmative or injunctive relief) and monetary penalties ranging from $5,000 per day for certain violations of federal consumer laws to $25,000 per day for reckless violations, and $1,000,000 per day for knowing or intentional violations. Also, where a company has been found to have violated consumer laws, the Dodd-Frank Act (in addition to similar state consumer laws) empowers state attorneys general and state regulators to bring administrative or civil actions seeking the same equitable relief available to the CFPB, in addition to state-led enforcement actions and consent orders. If the CFPB or one or more state officials believe that the Company has violated any of the applicable laws or regulations, they could exercise their enforcement powers in ways that could have a material adverse effect on the Company or its business.
12
On October 5, 2017, the CFPB released its small-dollar loan rule (the “SDL Rule”), however it has yet to take practical effect since, in early 2018, the CFPB announced its intention to “reconsider” the SDL Rule in January 2019, and in early December 2018, a judge in the 5th Circuit stayed the SDL Rule in a case filed by trade groups, which effectively put the compliance date for this rule on hold until further order by the court. While the SDL Rule has technically been finalized, it is still not certain whether it will take effect, and to what extent it will impact the Company. If the SDL Rule takes effect as currently written, lenders, like the Company, will likely be required, among other things, to determine whether consumers have the ability to repay their loans before issuing certain short-term small dollar, payday and auto title loans, obtain verification from the consumer of certain debts and verification through outside sources by lenders of certain debts, implement mandatory cooling off periods and increase restrictions on collection practices. The SDL Rule defines the Company’s consumer loan products, both short-term loans, and installment loans, as loans covered under the rule. However, the Company believes the SDL Rule (even in its current form) will not directly impact the vast majority of its pawn products, which comprise approximately
97%
of its total revenues. On a consolidated basis, the Company expects consumer loan revenue for the year ending December 31,
2019
to account for less than 2% of the Company’s consolidated total revenue. If the SDL Rule remains effective in its current form, the small dollar lending industry will experience a significant regulatory change.
In July 2015, the U.S. Department of Defense published a finalized set of additional requirements and restrictions under the Military Lending Act (“MLA Rule”). The MLA Rule, which went into effect on October 3, 2016, amended requirements for its “safe harbor” (making covered member attestation insufficient on its own to comply with the “safe harbor” provision of the MLA Rule) and expanded the scope of the credit products covered by the MLA to include overdraft lines of credit, pawn loans, or vehicle and certain unsecured installment loan products to the extent any such products have a military annual percentage rate greater than 36%. While the Company does not believe that active members of the U.S. military or their dependents comprise a significant percentage of the historical customer base in most locations, compliance with the MLA Rule, including its safe harbor provisions, is complex, increases compliance risks and related costs and limits the potential customer base of the Company.
In addition to the federal laws and frameworks already governing the financial industry, the U.S. Justice Department (“DOJ” or “Department of Justice”), in conjunction with federal banking regulators, began an initiative in 2013 (“Operation Choke Point”) directed at banks in the U.S. that do business with payment processors, payday lenders, pawn operators and other companies believed to be at higher risk for fraud and money laundering. It is believed the intent of this initiative was to restrict the ability of banks to provide financial services to companies in the targeted industries. In January 2015, the Federal Deposit Insurance Corporation (the “FDIC”) issued a publication encouraging banks to take a risk-based approach in assessing individual customer relationships, rather than declining to provide banking services to entire categories of customers without regard to the risks presented by an individual customer or the financial institution’s ability to manage the risk. Further, in August 2017, the Department of Justice informed lawmakers that Operation Choke Point was no longer in effect. Nevertheless, the Company continues to experience difficulty in securing new banking services and maintaining existing banking services in certain markets. There can be no assurance that Operation Choke Point and its subsequent effects will not pose a further or stigmatized threat to the Company’s ability to access credit, maintain bank accounts and treasury services, process payday lending transactions or obtain other banking services needed to operate efficiently and profitably.
In connection with pawn transactions and credit services/consumer loan transactions, the Company must comply with various disclosure requirements under the Federal Truth in Lending Act (and Federal Reserve Regulation Z promulgated thereunder). These disclosures include, among other things, the total amount of the finance charges and annualized percentage rate of the charges associated with pawn transactions, consumer loan and credit services transactions.
The credit services/consumer loan business is also subject to various laws, rules and guidelines relating to the procedures and disclosures needed for debiting a debtor’s checking account for amounts due via an ACH transaction. Additionally, the Company may be subject to certain portions of other laws such as the Federal Fair Debt Collection Practices Act, the Fair Credit Reporting Act and applicable state collection laws when conducting its collection activities related to its unsecured small dollar loans, depending on the product or service.
Under the Bank Secrecy Act, the U.S. Department of the Treasury (the “Treasury Department”) regulates transactions involving currency in an amount greater than $10,000. Additionally, the purchase of monetary instruments for cash in amounts from $3,000 to $10,000 must be recorded, however, the Company no longer offers these transactions. In general, and depending on the service or product, financial institutions, including the Company, must report each deposit, withdrawal, exchange of currency or other payment or transfer, whether by, through or to the financial institution, that involves currency in an amount greater than $10,000 during a specific period. In addition, multiple related currency transactions must be treated as single transactions if the financial institution has knowledge that the transactions are by, or on behalf of, any one person and result in either cash in or cash out totaling more than $10,000 during any one business day or over a certain time period.
13
Under the USA PATRIOT Act passed by Congress in 2001 and revised in 2006, the Company is subject to certain anti-money laundering laws dependent on the products and services offered. Beginning on January 1, 2018, the Company ceased to offer fee-based check cashing services in its non-franchise stores and no longer considers itself a money services business as defined under U.S. federal law. As a result, the Company is no longer subject to anti-money laundering requirements under U.S. federal laws pertaining to money services businesses.
The Gramm-Leach-Bliley Act requires the Company to generally protect the confidentiality of its customers’ nonpublic personal information and to disclose to its customers its privacy policy and practices, including those regarding sharing the customers’ nonpublic personal information with third parties. Such disclosure must be made to customers at the time the customer relationship is established, at least annually thereafter, and if there is a change in the Company’s privacy policy. In addition, the Company is subject to strict document retention and destruction policies.
The federal Equal Credit Opportunity Act (“ECOA”) prohibits discrimination against any credit applicant on the basis of any protected category, such as race, color, religion, national origin, sex, marital status, or age, and requires the Company to notify credit applicants of the Company’s consumer loan products of any action taken on the individual’s credit application. The Company must provide a loan applicant a Notice of Adverse Action (“NOAA”) when the Company denies an application for credit related to its unsecured consumer loan products. The NOAA must inform the applicant of (1) the action taken regarding the credit application, (2) a statement of the ECOA’s prohibition on discrimination, (3) the name and address of both the creditor and the federal agency that monitors compliance with the ECOA, and (4) the applicant’s right to learn the specific reasons for the denial of credit and the contact information for the parties the applicant can contact to obtain those reasons. The Company provides NOAA letters and maintains records of all such letters as required by the ECOA and its regulations.
The Company’s unsecured consumer loan products also may be subject to the Fair Credit Reporting Act (regulation V), which requires the Company to provide certain information to customers when credit information is provided by a reporting agency and used in issuing credit to a customer or to respond to customers who dispute an inaccuracy regarding the reporting of their information.
The Company’s advertising and marketing activities, in general and depending on the type of product and/or service offered, are subject to additional federal laws and regulations administered by the Federal Trade Commission and the CFPB which prohibit unfair or deceptive acts or practices and false or misleading advertisements.
The Fair and Accurate Credit Transactions Act (“FACTA”) requires the Company to adopt written guidance and procedures for detecting, mitigating, preventing and responding appropriately to identity theft and to adopt various employee policies, procedures, and provide employee training and materials that address the importance of protecting nonpublic personal information, specifically, personal identifiable information, and aid the Company in detecting and responding to suspicious activity, including suspicious activity which may suggest a possible identity theft red flag, as appropriate.
The Company is subject to the Foreign Corrupt Practices Act (“FCPA”) and other similar laws in other jurisdictions that prohibit improper payments or offers of improper payments to foreign governments and their officials and political parties by U.S. persons and issuers (as defined by the statute) for the purpose of obtaining or retaining business. In addition, the FCPA requires adequate accounting internal controls and record keeping. It is the Company’s policy to maintain safeguards to discourage these practices by its employees and vendors and follow Company standards of conduct for its business throughout the U.S. and Latin America, including the prohibition of any direct or indirect payment or transfer of Company funds or assets to suppliers, vendors, or government officials in the form of bribes, kickbacks or other illegal payoffs.
Each pawn store location that handles pawned firearms or buys and sells firearms must comply with the Brady Handgun Violence Prevention Act (the “Brady Act”). The Brady Act requires that federally licensed firearms dealers conduct a background check in connection with releasing, selling or otherwise disposing of firearms. In addition, the Company must also comply with various state law provisions and the regulations of the U.S. Department of Justice-Bureau of Alcohol, Tobacco and Firearms that require each pawn lending location dealing in guns to obtain a Federal Firearm License (“FFL”) and maintain a permanent written record of all receipts and dispositions of firearms. As of December 31,
2018
, the Company had 714 locations in the U.S. with an active FFL.
14
U.S. State and Local Regulations
The Company operates pawn stores in
24
U.S. states and the District of Columbia, all of which have licensing and/or fee regulations on pawnshop operations and employees. In general, state statutes and regulations establish licensing requirements for pawnbrokers and may regulate various aspects of pawn transactions, including the purchase and sale of merchandise, service charges, interest rates, the content and form of the pawn transaction agreement and the length of time a pawnbroker must hold a purchased item or forfeited pawn before it is made available for sale. Additionally, these statutes and regulations in various jurisdictions restrict or prohibit the Company from transferring and/or relocating its pawn licenses and restrict or prohibit the issuance of new licenses. The Company’s fee structures are at or below the applicable rate ceilings adopted by each of these states. The Company offers its pawn and retail customers an interest free layaway plan which complies with applicable state laws. In addition, the Company is in compliance with the net asset requirements in states where it is required to maintain certain levels of liquid assets for each pawn store it operates in the applicable state. Failure to observe a state’s legal requirements for pawn brokering could result, among other things, in loss of pawn licenses, fines, refunds, and other civil or criminal proceedings.
Many of the Company’s pawn locations are also subject to local ordinances that require, among other things, local permits, licenses, record keeping requirements and procedures, reporting of daily transactions, and adherence to local law enforcement “do not buy lists” by checking law enforcement created databases. Specifically, under some county and municipal ordinances, pawn stores must provide local law enforcement agencies with reports of all daily transactions involving pawns and over-the-counter merchandise purchased directly from customers. These daily transaction reports are designed to provide local law enforcement officials with a detailed description of the merchandise involved, including serial numbers, if any, or other specific identifying information, including the name and address of the customer obtained from a valid identification card and photographs of the customers and/or merchandise in certain jurisdictions. Goods held to secure pawns or goods directly purchased may be subject to mandatory holding periods before they can be resold by the Company. If pawned or purchased merchandise is determined to belong to an owner other than the borrower or seller, it may be subject to confiscation by police for recovery by the rightful owners. Historically, the Company has not found the volume of the confiscations or claims to have a material adverse effect upon results of operations. The Company does not maintain insurance to cover the costs of returning merchandise to its rightful owners but historically has benefited from civil and criminal restitution efforts.
The Company operates its consumer loan business in
seven
states which are regulated under a variety of enabling state statutes and subject to various local rules, regulations and ordinances. The scope of these regulations, including the fees and terms of the Company’s consumer loan products and services, varies by state, county and city. These laws generally define the services that the Company can provide to consumers and require the Company to provide a contract to the customer outlining the Company’s services and the cost of those services to the customer. During fiscal
2018
, the Company’s consumer loan and credit services fee revenue represented approximately
3%
of the Company’s overall revenues.
The states with laws that specifically regulate the Company’s unsecured consumer loan products and services typically limit the principal amount of a consumer loan and set maximum fees or interest rates that customers may be charged. Most states also limit a customer’s ability to renew a short-term consumer loan and require various disclosures to consumers. State statutes often specify minimum and maximum maturity dates for consumer loans and, in some cases specifically related to unsecured loans, specify mandatory cooling-off periods between transactions. The Company’s collection activities regarding past due amounts on its unsecured, small dollar loans, are subject to consumer protection laws and state regulations relating to debt collection practices. Also, some states require the Company to report loan activity to state-wide databases and restrict the number and/or principal amount of loans a consumer may have outstanding at any particular time or over the course of a particular period of time, typically twelve months. In addition, these laws may require additional disclosures to consumers and may require the Company to be registered with the jurisdiction and/or be bonded.
As a credit services organization in Texas and Ohio, the Company assists customers in applying for a short-term, unsecured extension of credit from the Independent Lenders and issues the Independent Lenders a guarantee for the repayment of the extension of credit. When a consumer executes a credit services agreement with the Company, the customer agrees to pay a fee to the Company if the Independent Lenders approve the extension of credit, and the Company agrees to guarantee the customer’s obligation to repay the extension of credit received by the customer from the Independent Lenders if the customer fails to do so. The credit services organization must give a consumer the right to cancel the credit services agreement without penalty for three days after the agreement is signed. In addition, credit services locations generally must be registered as a credit services organization and are subject to various other jurisdictional regulations and requirements.
On July 30, 2018, the governor of Ohio signed into law the Ohio Act. The Ohio Act will significantly impact the consumer loan industry in Ohio, as it effectively caps a consumer loan amount at $1,000, substantially limits consumer loans with maturities of less than 90 days by capping monthly payments as a percentage of the borrower’s gross income, creates a maximum loan term of one year, caps interest rates at 28% per annum and caps the total cost of a consumer loan (including fees) at 60% of the original
15
principal. There are also other provisions such as disclosure requirements, maximum borrowing levels and collections restrictions. In addition, the Ohio Act essentially eliminates the use of credit service organizations (each a “CSO”) by prohibiting a CSO from brokering loans that meet any of the following conditions: (1) the loan amount is less than $5,000, (2) the term of the loan is one year or less, and (3) the annual percentage rate exceeds 28%. The provisions of the Ohio Act went into effect on October 29, 2018, but will not apply to loans made and credit extensions obtained until April 27, 2019.
The Company currently operates 113 Cashland-branded stores in Ohio that primarily offer consumer loan and credit services products, which are likely to be negatively impacted by the Ohio Act in 2019. The Company also operates six pawn stores in Ohio that also offer consumer loan and credit services products as ancillary products and would be much less impacted. The Company’s Ohio operations generated consumer lending and credit services revenues and net revenues in 2018 of $41.7 million and $28.6 million, respectively, representing 2.3% and 3.0% of the Company’s consolidated revenue and net revenue, respectively. In addition, the Cashland stores generated $36.8 million in gross pawn related revenues and $18.8 million in net pawn related revenues. The Company will continue to analyze the impact of the Ohio Act, including potential replacement products, affecting the viability of its Cashland operations in Ohio after the provisions of the law become effective in April 2019. While most of the Cashland stores also offer pawn products that will enable many of them to continue to operate profitably, the Company anticipates the expected decrease in consumer lending revenue after the Ohio Act becomes effective could cause one-third or more of the stores to become unprofitable and potentially subject to closing.
Local rules, regulations and ordinances vary widely from county to county or city to city. While many of the local rules and regulations relate primarily to zoning and land use restrictions, certain cities have restrictive regulations specific to pawn and consumer loan products. Additionally, local jurisdictions’ efforts to regulate or restrict the terms of pawn, consumer loan and credit services products will likely continue to increase.
It is expected that additional legislation and/or regulations relating to pawn transactions, credit services, installment loans and other consumer loan products will be proposed in several state legislatures and/or city councils where the Company has pawn, unsecured consumer loan products and credit services operations. Though the Company cannot accurately predict the scope, extent and nature of future regulations, it is likely that such legislation may address the maximum allowable interest rates on loans, significantly restrict the ability of customers to obtain such loans by limiting the maximum number of consecutive loan transactions that may be provided to a customer, and/or limiting the total loans a customer may have outstanding at any point in time. Any or all of these changes could make offering these products less profitable and could restrict or even eliminate the availability of consumer loan, pawn transactions and credit services products in some or all of the states or localities in which the Company offers such products.
Many local government entities prohibit or restrict pawn and other consumer finance and check cashing activities through zoning ordinances, which can significantly limit the ability of the Company to move, expand, remodel or relocate store locations, and in some cases cause existing stores to be closed. Consequently, the Company has de-emphasized its unsecured, consumer loan business over the last few years and will likely continue to do so in the future, and beginning in fiscal 2018, the Company no longer offers fee-based check cashing services in its non-franchised stores.
The Company cannot currently assess the likelihood of any other proposed legislation, regulations or amendments, such as those described above or discussed in “Item 1A, Risk Factors,” which could be enacted. However, if such legislation or regulations were enacted in certain jurisdictions, it could have a materially adverse impact on the revenue and profitability of the Company.
Mexico Federal Regulations
Federal law in Mexico provides for administrative regulation of the pawnshop industry by Procuraduria Federal del Consumidor (“PROFECO”), Mexico’s primary federal consumer protection agency, which requires the Company to annually register its pawn stores, approve pawn contracts and disclose the interest rate and fees charged on pawn transactions. In addition, the pawnshop industry in Mexico is subject to various general business regulations in the areas of tax compliance, customs, consumer protections, anti-money laundering, public safety and employment matters, among others, by various federal, state and local governmental agencies.
PROFECO regulates the form and non-financial terms of pawn contracts and defines certain operating standards and procedures for pawnshops, including retail operations, consumer disclosures and establishes reporting requirements and requires all pawn businesses and its owners to register annually with and be approved by PROFECO in order to legally operate. In addition, all operators must comply with additional customer notice and disclosure provisions, bonding requirements to insure against loss or insolvency, reporting of certain types of suspicious transactions, and reporting to state law enforcement officials of certain transactions (or series of transactions) or suspicious transactions on a monthly basis to states’ attorneys general offices. PROFECO continues to modify its process and procedures regarding its annual registration requirements and the Company has complied and
16
complies in all material respects with this process and registration requirements as administered by PROFECO. There are significant fines and sanctions, including operating suspensions for failure to register and/or comply with PROFECO’s rules and regulations.
Mexico’s anti-money laundering regulations, The Federal Law for the Prevention and Identification of Transactions with Funds From Illegal Sources (“Anti-Money Laundering Law”), requires monthly reporting of certain transactions (or series of transactions) exceeding certain monetary limits, imposes strict maintenance of customer identification records and controls and requires reporting of all foreign (non-Mexican) customer transactions. This law affects all industries in Mexico and is intended to detect commercial activities arising from illicit or ill-gotten means though bilateral cooperation between Mexico’s Ministry of Finance and Public Credit (“Hacienda”), and all of Mexico’s various states’ attorneys general offices (“PGR”). This law restricts the use of cash in certain transactions associated with high-value assets and limits, to the extent possible, money laundering activities protected by the anonymity that cash transactions provide. The law empowers Hacienda to oversee and enforce these regulations and to follow up on the information received from other agencies in Mexico and abroad. Relevant aspects of the law specifically affecting the pawn industry include monthly reporting by the Company to Hacienda and the PGR on “vulnerable activities,” which encompass the sale of jewelry, precious metals and watches exceeding $64,883 Mexican pesos, individually, and retail and pawn transactions (of cash or credit) exceeding $129,363 Mexican pesos, in aggregate. There are significant fines and sanctions for failure to comply with the Anti-Money Laundering Law.
Mexico’s Federal Personal Information Protection Act (“Mexico Privacy Law”) requires companies to protect their customers’ personal information, among other things. Specifically, the Mexico Privacy Law requires that the Company create and maintain a privacy policy and inform its customers whether the Company shares the customer’s personal information with third parties or transfers personal information to third parties. It also requires public posting (both on-line and in-store) of the Company’s privacy policy, which includes a process for the customer to revoke any previous consent granted to the Company for the use of the customer’s personal information, or limit the use or disclosure of such information.
Mexico State and Local Regulations
Certain state and local governmental entities in Mexico also regulate pawn, other consumer finance and retail businesses through state laws and local zoning and permitting ordinances. For example, in certain states where the Company has significant or concentrated operations, states have enacted legislation or implemented regulations which require items such as special state operating permits for pawn stores, certification of pawn employees trained in valuation of merchandise, strict customer identification controls, collateral ownership certifications and/or detailed and specified transactional reporting of customers and operations. Certain other states have proposed similar legislation but have not yet enacted such legislation. Additionally, certain municipalities in Mexico have attempted to curtail the operation of new and existing pawn stores through additional local business licensing, permitting and reporting requirements. State and local agencies, including local and state police officials, often have unlimited and discretionary authority to suspend store operations pending an investigation of suspicious pawn transactions or resolution of actual or alleged regulatory, licensing and permitting issues.
Other Latin American Federal and Local Regulations
Similar to Mexico, certain federal, department and local governmental entities in Guatemala, El Salvador, and Colombia also regulate the pawn industry and retail and commercial businesses. Certain federal laws and local zoning and permitting ordinances require basic commercial business licenses and signage permits. Operating in these countries also subjects the Company to other types of regulations including, but not limited to, regulations related to commercialization of merchandise, financial reporting, privacy and data protection, tax compliance, customs, labor and employment practices, real estate transactions, anti-money laundering, commercial and electronic banking restrictions, credit card transactions, marketing, advertising and other general business activities. Like Mexico, department agencies, including local and state police officials have unlimited and discretionary authority in their application of their rules and requirements.
As the scope of the Company’s international operations increases, the Company may face additional administrative and regulatory costs in operating and managing its business. In addition, unexpected changes, arbitrary or adverse court decisions, adverse action by financial regulators, aggressive public officials or regulators attacking the Company’s business models, administrative interpretations of federal or local requirements or legislation, or public remarks by elected officials could negatively impact the Company’s operations and profitability.
Employees
The Company employs approximately 19,000 employees as of
December 31, 2018
, including approximately 1,300 persons employed in executive, supervisory, administrative and accounting functions. None of the Company’s employees are covered by collective bargaining agreements. The Company considers its employee relations to be satisfactory.
17
Insurance
The Company maintains or reimburses its landlords for maintaining property all-risk coverage and liability insurance for each of its locations in amounts management believes to be adequate. The Company maintains workers’ compensation or employer’s indemnification insurance in states in which the Company operates.
FirstCash Website
The Company’s primary website is at
www.firstcash.com
. The Company makes available, free of charge, at its corporate website, its annual report on Form 10-K, quarterly reports on Form 10-Q, current reports on Form 8-K and amendments to those reports filed or furnished pursuant to Section 13(a) or 15(d) of the Securities Exchange Act of 1934, as amended (the “Exchange Act”), as soon as reasonably practicable after they are electronically filed with the Securities and Exchange Commission (“SEC”). The SEC maintains an internet site that contains reports, proxy and information statements and other information regarding issuers that file electronically with the SEC at
www.sec.gov
.
Item 1A. Risk Factors
Important risk factors that could materially affect the Company’s business, financial condition or results of operations in future periods are described below. These factors are not intended to be an all-encompassing list of risks and uncertainties and are not the only risks and uncertainties facing the Company. Additional risks not currently known to the Company or that it currently deems to be immaterial also may materially adversely affect its business, financial condition or results of operations in future periods.
Operational, Strategic and General Business Risks
Increased competition from banks, credit unions, internet-based lenders, other short-term consumer lenders, and other entities offering similar financial services, as well as retail businesses that offer products and services offered by the Company, could adversely affect the Company’s results of operations.
The Company’s principal competitors are other pawnshops, consumer loan companies, internet-based lenders, consumer finance companies, rent-to-own stores, retail finance programs, payroll lenders, banks, credit unions and other financial institutions that serve the Company’s primarily cost conscious and underbanked customer base. Many other financial institutions or other businesses that do not now offer products or services directed toward the Company’s traditional customer base, many of whom may be much larger than the Company, could begin doing so. Significant increases in the number and size of competitors for the Company’s business could result in a decrease in the number of consumer loans or pawn transactions that the Company writes, resulting in lower levels of revenue and earnings in these categories. Furthermore, the Company has many competitors to its retail operations, such as retailers of new merchandise, retailers of pre-owned merchandise, other pawnshops, thrift shops, online retailers, online classified advertising sites and online auction sites.
In Mexico, the Company competes directly with government sponsored or affiliated non-profit foundations operating pawn stores. The Mexican government could take regulatory or administrative actions that would harm the Company’s ability to compete profitably in the Mexico market. Increased competition or aggressive marketing and pricing practices by these competitors could result in decreased revenue, margins and inventory turnover rates in the Company’s retail operations.
A decrease in demand for the Company’s products and services and the failure of the Company to adapt to such decreases could adversely affect the Company’s results of operations.
Although the Company actively manages its products and service offerings to ensure that such offerings meet the needs and preferences of its customer base, the demand for a particular product or service may decrease due to a variety of factors, including many that the Company may not be able to control, anticipate or respond to in a timely manner, such as the availability and pricing of competing products or technology, changes in customers’ financial conditions as a result of changes in unemployment levels, fuel prices, interest rates, other economic conditions or other events, real or perceived loss of consumer confidence or regulatory restrictions that increase or reduce customer access to particular products. Should the Company fail to adapt to a significant change in its customers’ demand for, or regular access to, its products, the Company’s revenue could decrease significantly. Even if the Company makes adaptations, its customers may resist or may reject products or services whose adaptations make them less attractive or less available. In any event, the effect of any product or service change on the results of the Company’s business may not be fully ascertainable until the change has been in effect for some time. In particular, the Company has changed, and will continue to change, some of the consumer loan products and services it offers due to regulatory developments. Demand may also fluctuate by geographic region. The current geographic concentration of the Company’s stores creates exposure to local economies
18
and politics, and regional downturns (see “Item 1. Business—Locations and Operations” for store concentration by state). As a result, the Company’s business is currently more susceptible to regional conditions than the operations of more geographically diversified competitors, and the Company is vulnerable to economic downturns or changing political landscapes in those regions. Any unforeseen events or circumstances that negatively affect these areas could materially adversely affect the Company’s revenues and profitability.
The Company depends on its senior management and may not be able to retain those employees or recruit additional qualified personnel.
The Company depends on its senior management. A significant increase in the costs to retain any members of the Company’s senior management could adversely affect the Company’s business and operations. Furthermore, the loss of services of any of the members of the Company’s senior management could adversely affect the Company’s business until a suitable replacement can be found. There may be a limited number of persons with the requisite skills to serve in these positions, and the Company cannot ensure that it would be able to identify or employ such qualified personnel on acceptable terms.
The Company’s growth is subject to external factors and other circumstances over which it has limited control or that are beyond its control. These factors and circumstances could adversely affect the Company’s ability to grow through the opening of new store locations.
The success of the Company’s expansion strategy is subject to numerous external factors, such as the availability of sites with favorable customer demographics, limited competition, acceptable regulatory restrictions and landscape, political or community acceptance, suitable lease terms, its ability to attract, train and retain qualified associates and management personnel, the ability to obtain required government permits and licenses and the ability to identify attractive acquisition targets and complete such acquisitions. Some of these factors are beyond the Company’s control. The failure to execute the Company’s expansion strategy would adversely affect the Company’s ability to expand its business and could materially adversely affect its business, prospects, results of operations and financial condition.
The inability to successfully identify attractive acquisition targets, realize administrative and operational synergies and integrate completed acquisitions could adversely affect results.
The Company has historically grown, in part, through strategic acquisitions, including its Merger with Cash America and its Maxi Prenda acquisition, both in 2016, and its acquisition of
393
stores during
2018
. The Company’s strategy is to continue to pursue attractive acquisition opportunities if and when they become available. The success of an acquisition is subject to numerous internal and external factors, such as competition rules, the ability to consolidate information technology and accounting functions, the management of additional sales, administrative, operations and management personnel, overall management of a larger organization, competitive market forces, and general economic and regulatory factors. It is possible that the integration process could result in unrealized administrative and operational synergies, the loss of key employees, the disruption of ongoing businesses, tax costs or inefficiencies, or inconsistencies in standards, controls, information technology systems, procedures and policies, any of which could adversely affect the Company’s ability to maintain relationships with customers, employees, or other third-parties or the Company’s ability to achieve the anticipated benefits of such acquisitions and could harm its financial performance. Furthermore, future acquisitions may be in jurisdictions in which the Company does not currently operate in, which could make the successful consummation and integration of any such acquisitions more difficult. Failure to successfully integrate an acquisition could have an adverse effect on the Company’s business, results of operations and financial condition, and failure to successfully identify attractive acquisition targets and complete such acquisitions could have an adverse effect on the Company’s growth. Additionally, any acquisition has the risk that the Company may not realize a return on the acquisition or the Company’s investment.
The Company’s future success is largely dependent upon the ability of its management team to successfully execute its business strategy.
The Company’s future success, including its ability to achieve its growth and profitability goals, is dependent on the ability of its management team to execute on its long-term business strategy, which requires them to, among other things: (1) successfully open new pawn stores; (2) identify attractive acquisition opportunities, close on such acquisitions on favorable terms and successfully integrate acquired businesses; (3) encourage and improve customer traffic at its pawn stores; (4) improve the customer experience at its pawn stores; (5) enhance productivity of its pawn stores, including through investments in technology; (6) control expenses in line with their current projections; (7) maintain and enhance the Company’s reputation; and (8) effectively respond to regulatory developments and changes that impact its business. Failure of management to execute its business strategy could negatively impact the Company’s business, growth prospects, financial condition or results of operations. Further, if the Company’s growth is not
19
effectively managed, the Company’s business, financial condition, results of operations and future prospects could be negatively affected, and the Company may not be able to continue to implement its business strategy and successfully conduct its operations.
The Company’s business depends on the uninterrupted operation of the Company’s facilities, systems and business functions, including its information technology and other business systems, and reliance on other companies to provide key components of its business systems.
The Company’s business depends highly upon its employees’ ability to perform, in an efficient and uninterrupted fashion, necessary business functions such as operating, managing and securing its retail locations, technical support centers, call centers, security monitoring, treasury and accounting functions and other administrative support functions. Additionally, the Company’s storefront operations depend on the efficiency and reliability of the Company’s proprietary point-of-sale and loan management system, FirstPawn. A shut-down of or inability to access the facilities in which the Company’s storefront point-of-sale and loan management system and other technology infrastructure are based, such as due to a power outage, a security breach, a breakdown or failure of one or more of its information technology, telecommunications or other systems, a cyber attack, or sustained or repeated disruptions of such systems could significantly impair its ability to perform such functions on a timely basis and could result in a deterioration of the Company’s ability to perform efficient storefront lending and merchandise disposition activities, provide customer service, perform collection activities, or perform other necessary business functions.
Furthermore, third parties provide a number of the key components necessary to the Company’s business functions and systems. While the Company has carefully selected these third-party vendors and has ongoing programs to review these vendors and assess risk associated therewith, the Company does not control their actions. Any problems caused by these third parties, including those resulting from disruptions in communication services provided by a vendor, failure of a vendor to handle current or higher volumes, cyber-attacks and security breaches, regulatory restrictions, fines, or orders or other regulatory action causing reputational harm, failure of a vendor to provide services for any reason or poor performance of services, could adversely affect the Company’s ability to deliver products and services to its customers and otherwise conduct its business. Financial or operational difficulties of a third-party vendor could also hurt its operations if those difficulties interfere with the vendor's ability to serve the Company. Furthermore, the Company’s vendors could also be sources of operational and information security risk to the Company, including from breakdowns or failures of their own systems or capacity constraints. Replacing these third-party vendors could also create significant delay and expense. Accordingly, use of such third parties creates an unavoidable inherent risk to the Company’s business and operations.
Security breaches, cyber attacks or fraudulent activity could result in damage to the Company’s operations or lead to reputational damage and expose the Company to significant liabilities.
A security breach of the Company’s computer systems, or those of the Company’s third-party service providers, including as a result of cyber attacks, could interrupt or damage its operations or harm its reputation. In addition, the Company could be subject to liability if confidential customer or employee information is misappropriated from its computer systems. Any compromise of security, including security breaches perpetrated on persons with whom the Company has commercial relationships, that results in the unauthorized access to or use of personal information or the unauthorized access to or use of confidential employee, customer, supplier or Company information, could result in a violation of applicable privacy and other laws, significant legal and financial exposure, damage to the Company’s reputation, and a loss of confidence of the Company’s customers, vendors and others, which could harm its business and operations. Any compromise of security could deter people from entering into transactions that involve transmitting confidential information to the Company’s systems and could harm relationships with the Company’s suppliers, which could have a material adverse effect on the Company’s business. Actual or anticipated cyber attacks may cause the Company to incur substantial costs, including costs to investigate, deploy additional personnel and protection technologies, train employees and engage third-party experts and consultants. Despite the implementation of significant security measures, these systems may still be vulnerable to physical break-ins, computer viruses, programming errors, attacks by third parties or similar disruptive problems. The Company may not have the resources or technical sophistication to anticipate or prevent rapidly evolving types of cyber attacks.
The Company’s customers provide personal information in one of four ways: (1) when conducting a pawn transaction or selling merchandise, (2) when conducting a background check in connection with releasing or selling firearms, (3) during a consumer loan transaction (when personal and bank account information is necessary for approving this transaction), and (4) when conducting a retail purchase whereby a customer’s payment method is via a credit card, debit card or check. While the Company has implemented systems and processes to protect against unauthorized access to or use of such personal information, there is no guarantee that these procedures are adequate to safeguard against all security breaches or misuse of the information. Furthermore, the Company relies on encryption and authentication technology to provide security and authentication to effectively secure transmission of confidential information, including customer bank account, credit card information and other personal information. However, there is no guarantee that these systems or processes will address all of the cyber threats that continue to evolve.
20
In addition, many of the third parties who provide products, services, or support to the Company could also experience any of the above cyber risks or security breaches, which could impact the Company’s customers and its business and could result in a loss of customers, suppliers or revenue.
Lastly, the regulatory environment related to information security, data collection and use, and privacy is increasingly rigorous, with new and constantly changing requirements applicable to the Company’s business, and compliance with those requirements could result in additional costs. These costs associated with information security, such as increased investment in technology or investigative expenses, the costs of compliance with privacy laws, and fines, penalties and costs incurred to prevent or remediate information security or cyber breaches, could be substantial and adversely impact the Company’s business.
If the Company is unable to protect its intellectual property rights, its ability to compete could be negatively impacted.
The success of the Company’s business depends to a certain extent upon the value associated with its intellectual property rights, including its proprietary, internally developed point-of-sale and loan management system that is in use in all of its stores. The Company uses the trademarks “FirstCash,” “First Cash,” “First Cash Pawn,” “Cash America,” “Cashland,” “First Cash Empeño y Joyeria,” “Cash Ya,” “Cash & Go,” “CA,” “Presta Max,” “Realice Empeños,” “Empeños Mexicanos,” “Maxi Prenda” and “Prendamex” along with numerous other trade names as described herein. The Company relies on a combination of trademarks, trade secrets, proprietary software, website domain names and other rights, including confidentiality procedures and contractual provisions to protect its proprietary technology, processes and other intellectual property. While the Company intends to vigorously protect its trademarks and proprietary point of sale systems against infringement, it may not be successful. In addition, the laws of certain foreign countries may not protect intellectual property rights to the same extent as the laws of the U.S. The costs required to protect the Company’s intellectual property rights and trademarks could be substantial.
The Company’s lending business is somewhat seasonal, which causes the Company’s revenues and operating cash flows to fluctuate and may adversely affect the Company’s ability to service its debt obligations.
The Company’s U.S. lending business typically experiences reduced demand in the first and second quarters as a result of its customers’ receipt of federal tax refund checks typically in February of each year. Demand for the Company’s U.S. lending services is generally greatest during the third and fourth quarters. Also, retail sales are seasonally higher in the fourth quarter associated with holiday shopping. Typically, the Company experiences seasonal growth of service fees in the third and fourth quarter of each year due to loan balance growth. Service fees generally decline in the first and second quarter of each year due to the heavy repayment of pawn loans associated with statutory bonuses received by customers in the fourth quarter in Mexico and with tax refund proceeds typically received by customers in the first quarter in the U.S. This seasonality requires the Company to manage its cash flows over the course of the year. If a governmental authority were to pursue economic stimulus actions or issue additional tax refunds, tax credits or other statutory payments at other times during the year, such actions could have a material adverse effect on the Company’s business, prospects, results of operations and financial condition during these periods. If the Company’s revenues were to fall substantially below what it would normally expect during certain periods, the Company’s annual financial results and its ability to service its debt obligations could be adversely affected.
The Company’s allowance for credit losses for credit services and consumer loans may not be sufficient to cover actual credit losses, which could adversely affect its financial condition and operating results.
The Company offers fee-based CSO Programs through which the Company assists customers in applying for short-term extensions of credit from Independent Lenders. The Company’s stand-alone consumer loan stores and select pawn stores in the states of Texas and Ohio offer the CSO Programs. When an extension of credit is granted, the Company provides a guarantee to the Independent Lenders for the repayment of the customer’s extension of credit. The Company records the estimated fair value of the guarantee liability in accrued liabilities. The Company also has customer loans arising from its consumer loan operations. The Company is required to recognize losses resulting from the inability of credit services and consumer loan customers and/or borrowers to repay such receivables or loans. The Company maintains an allowance for credit losses in an attempt to cover credit losses inherent in its consumer loan operations. Additional credit losses will likely occur in the future and may occur at a rate greater than the Company has experienced to date. The allowance for credit losses is based primarily upon historical credit loss experience, with consideration given to delinquency levels, collateral values, economic conditions and underwriting and collection practices. This evaluation is inherently subjective, as it requires estimates of material factors that may be susceptible to significant change, especially in the event of a change in the governmental regulations that affect the Company’s ability to generate new loans or collect outstanding loans. If the Company’s assumptions and judgments prove to be incorrect, its current allowance may not be sufficient and adjustments may be necessary to allow for different economic conditions or adverse developments in its loan portfolio, which could adversely affect its financial condition and operating results.
21
The failure or inability of third-parties who provide products, services or support to the Company to maintain their products, services or support could disrupt Company operations or result in a loss of revenue.
The
Company’s credit services operations depend, in part, on the willingness and ability of the Independent Lenders to make extensions of credit to its customers. The loss of the relationship with these lenders, and an inability to replace them with new lenders, or the failure of the lenders to fund new extensions of credit and to maintain volumes, quality and consistency in its loan programs could cause the Company to lose customers and substantially decrease the revenue and earnings of the Company’s credit services business. In addition, the Company’s lending, pawn retail, scrap jewelry and cash management operations are dependent upon the Company’s ability to maintain retail banking relationships with commercial banks. Actions by federal regulators in the U.S. and other Latin American countries where the Company operates have caused many commercial banks, including certain banks used by the Company, to cease offering such services to the Company and other companies in the Company’s industry. The Company also relies significantly on outside vendors to provide services such as financial transaction processing (including foreign exchange), utilities, store security, armored transport, precious metal smelting, data and voice networks and other information technology products and services. The failure or inability of any of these third-party lenders, financial institutions or vendors to provide such services could limit the Company’s ability to grow its business and could increase the Company’s costs of doing business, which could adversely affect the Company’s operations if the Company is unable to timely replace them with comparable service providers at a comparable cost.
An inability to collect consumer loan payments through the ACH system would materially adversely affect the Company’s consumer loan business.
The Company’s consumer loan businesses, including loans made through the CSO Programs, depend all or in part on the ACH system to collect amounts due to the Company by withdrawing funds from its customers’ bank accounts when the Company has obtained written authorization to do so from its customers. The Company’s ACH transactions are processed by banks or other payment processors, and if these banks or other payment processors cease to provide ACH processing services to the Company, the Company would have to materially alter, or possibly discontinue, some or all of its credit services and consumer loan business if alternative processing methods are not effective or not available, which could have a material adverse effect on the Company’s business, prospects and results of operations and financial condition.
Regulatory, Legislative and Legal Risks
The Company’s products and services are subject to extensive regulation and supervision under various federal, state and local laws, ordinances and regulations in both the U.S. and Latin America. If changes in regulations affecting the Company’s pawn, credit services and consumer loan businesses create increased restrictions, or have the effect of prohibiting loans in the jurisdictions where the Company offers these products, such regulations could materially impair or reduce the Company’s pawn, credit services and consumer loan businesses and limit its expansion into new markets.
The Company’s products and services are subject to extensive regulation and supervision under various federal, state and local laws, ordinances and regulations in both the U.S. and Latin America. The Company faces the risk that restrictions or limitations on loan products, loan amounts, fees and interest rates charged on loans and customer qualifications or loan products resulting from the enactment, change, or interpretation of laws and regulations in the U.S. or Latin America could have a negative effect on the Company’s business activities. Both consumer loans, including vehicle title loans, and, to a lesser extent, pawn transactions and buy/sell agreements, have come under increased scrutiny and increasingly restrictive regulation in recent years. Other enacted or recently proposed regulatory activity may limit the number of loans that customers may receive or have outstanding and require the Company to offer an extended payment plan to its customers, and regulations adopted by some states require that all borrowers of certain loan products be listed on a database, limit the yield on pawn or consumer loans and limit the number of such loans borrowers may have outstanding. Certain consumer advocacy groups, federal, state and local legislators and governmental agencies have also asserted that rules, laws and regulations should be tightened so as to severely limit, if not eliminate, the availability of pawn transactions, buy/sell agreements, consumer loans and credit services products to consumers. It is difficult to assess the likelihood of the enactment of any unfavorable federal or state legislation or local ordinances, and there can be no assurance that additional legislative, administrative or regulatory initiatives will not be enacted that would severely restrict, prohibit, or eliminate the Company’s ability to offer certain products and services.
In Latin America, restrictions and regulations affecting pawn, buy/sell and consumer loan products, including licensing requirements for pawn stores and their employees, customer identification requirements, suspicious activity reporting, disclosure requirements and limits on interest rates, loan service fees, or other fees have been and continue to be proposed from time to time. Adoption of such federal, state or local regulation or legislation in the U.S. and Latin America could restrict, or even eliminate, the availability of pawn transactions, buy/sell agreements and consumer loans at some or all of the Company’s locations, which would adversely affect the Company’s operations and financial condition.
22
The extent of the impact of any future legislative or regulatory changes will depend on the political climate, the nature of the legislative, administrative or regulatory change, the jurisdictions to which the new or modified laws would apply, and the amount of business the Company does in that jurisdiction. Moreover, similar actions by states or foreign countries in which the Company does not currently operate could limit its opportunities to pursue its growth strategies. A more detailed discussion of the regulatory environment and current developments and risks to the Company is provided in “Business-Governmental Regulation.”
The CFPB has regulatory, supervisory and enforcement powers over providers of consumer financial products and services in the U.S., and it could exercise its enforcement powers in ways that could have a material adverse effect on the Company’s business and financial results.
The CFPB has been exercising its supervisory review over certain non-bank providers of consumer financial products and services, including providers of consumer loans and certain title pawn loans such as the Company. The CFPB’s examination authority permits its examiners to inspect the books and records of providers of short-term, small dollar lenders, such as the Company, and ask questions about their business practices. The CFPB’s examination procedures include specific modules for examining marketing activities, loan application and origination activities, payment processing activities, sustained use by consumers, collection practices, accounts in default and consumer reporting activities as well as third-party relationships. As a result of these examinations of non-bank providers of consumer credit, the Company could be required to discontinue certain services or products, or change its practices or procedures, whether as a result of another party being examined or as a result of an examination of the Company, and could be subject to specific enforcement action, including monetary penalties, which could adversely affect the Company. Under certain circumstances, the CFPB may also be able to exercise regulatory or enforcement authority over providers of pawn services through its rule making authority.
In addition to having the authority to obtain monetary penalties for violations of applicable federal consumer financial laws (including the CFPB’s own rules), the CFPB can require remediation of practices, including through confidential memorandums of understanding and consent orders, pursue administrative proceedings or litigation and obtain cease and desist orders (which can include orders for restitution or rescission of contracts, as well as other kinds of affirmative or equitable relief). Also, where a company has violated Title X of the Dodd-Frank Act or CFPB regulations implemented under Title X of the Dodd-Frank Act, the Dodd-Frank Act empowers state attorneys general and state regulators to bring civil actions to remedy alleged violations of state law. If the CFPB or one or more state attorneys general or state regulators believe that the Company has violated any of the applicable laws or regulations or any consent orders or confidential memorandums of understanding against or with the Company, they could exercise their enforcement powers in ways that could have a material adverse effect on the Company’s business and financial results.
The SDL Rule, promulgated by the CFPB in October 2017, has yet to take practical effect since in early 2018, the CFPB announced its intention to “reconsider” the SDL Rule in January 2019, and in early December 2018, a judge in the 5th Circuit stayed the SDL Rule in a case filed by trade groups, which effectively put the compliance date for this rule on hold until further order by the court. While the SDL Rule has technically been finalized, it is still not certain whether it will take effect, and to what extent it will impact the Company. If the SDL Rule remains effective in its current form, the small dollar lending industry will experience a significant regulatory change. The Company continues to determine the potential impact on its consumer loan portfolio if the SDL Rule does take effect as currently written. On a consolidated basis, the Company expects consumer loan and credit services fee revenue for the year ending December 31,
2019
to account for less than 2% of the Company’s consolidated total revenue.
See “Item 1. Business—Government Regulation” for a further discussion of the regulatory authority of the CFPB.
Mexico’s PROFECO has regulatory, supervisory and enforcement powers over pawn operators and pawn operations, and it could exercise its enforcement powers in ways that could have a material adverse effect on the Company’s business and financial results.
Federal law in Mexico provides for administrative regulation of the pawnshop industry by PROFECO, Mexico’s primary federal consumer protection agency. PROFECO requires all pawn operators, like the Company, to register its pawn stores and to disclose the interest rate and fees charged on pawn transactions. PROFECO also establishes and regulates the form and non-financial terms of pawn contracts and defines certain operating standards and procedures for pawnshops and reporting requirements for pawnshops.
PROFECO requires all pawn businesses and their owners to annually register with and be approved by PROFECO in order to legally operate. In addition, all operators must comply with additional customer notice and disclosure provisions, bonding requirements to insure against loss or insolvency, reporting of certain types of suspicious transactions and monthly reporting to state law enforcement officials of certain transactions (or series of transactions). There are significant fines and sanctions, including operating suspensions, for failure to register and/or comply with PROFECO’s rules and regulations. PROFECO regularly modifies its processes and procedures regarding its annual registration requirements and pawn operations and the Company has complied and complies in all material respects with requirements as administered by PROFECO.
23
The adoption of new laws or regulations or adverse changes in, or the interpretation or enforcement of, existing laws or regulations affecting the Company’s products and services could adversely affect its financial condition and operating results.
Governments, including agencies, at the national, state and local levels, may seek to enforce or impose new laws, regulatory restrictions or licensing requirements that affect the Company’s products or services it offers, the terms on which it may offer them, and the disclosure, compliance and reporting obligations it must fulfill in connection with its business. They may also interpret or enforce existing requirements in new ways that could restrict the Company’s ability to continue its current methods of operation or to expand operations, impose significant additional compliance costs, and could have a material adverse effect on the Company’s financial condition and results of operations. In some cases, these measures could even directly prohibit some or all of the Company’s current business activities in certain jurisdictions, or render them unprofitable and/or impractical to continue.
The Company anticipates the recent enactment of the Ohio Act will have a material impact on its consumer lending operations in the state of Ohio, which could adversely impact its Ohio-based consumer lending and credit services revenues.
The Company currently operates 113 Cashland-branded stores in Ohio that primarily offer consumer loan and credit services products, which are likely to be negatively impacted by the Ohio Act in 2019. The Company also operates six pawn stores in Ohio that also offer consumer loan and credit services products as ancillary products and would be much less impacted. See “Item 1. Business—Government Regulation” for further information about the Ohio Act. Fiscal 2018 consumer lending and credit services revenues and net revenues in Ohio were $41.7 and $28.6 million, respectively, representing 2.3% and 3.0% of the Company’s consolidated revenue and net revenue, respectively. In addition, the Cashland-branded stores generated $36.8 million in gross pawn related revenues and $18.8 million in net pawn related revenues during fiscal 2018. While the Ohio Act did not materially affect the Company’s Ohio-based consumer lending and credit services revenues in 2018, the Company will continue to analyze the impact of the Ohio Act, including the regulatory and economic viability of potential replacement products for its Cashland operations in Ohio in 2019 and beyond, in light of the Ohio Act, which will generally apply to loans made and credit extensions obtained after April 26, 2019. If such replacement products are found to be viable from both a regulatory and economic perspective, they may result in a smaller loan portfolio and/or a reduction in the yield of the loan portfolio. While most of the Cashland stores also offer pawn products that will enable many of them to continue to operate profitably, the Company anticipates the expected decrease in consumer lending revenue after the Ohio Act becomes effective could cause one-third or more of the stores to become unprofitable and potentially subject to closing. The lack of viable replacement products and the potential for store closures would result in the loss of a significant amount of the Company’s Ohio-based consumer lending and credit services revenues, and for those Cashland stores closed, would result in the loss of pawn related revenue, which would adversely impact the Company’s earnings.
Media reports, statements made by regulators and elected officials and public perception in general of pawnshop and consumer loan operations, including payday advances or pawn transactions, as being predatory or abusive could materially adversely affect the Company’s pawn, consumer loan and credit services businesses. In recent years, consumer advocacy groups and some media reports, in both the U.S. and Latin America, have advocated governmental action to prohibit or place severe restrictions on consumer loans, including payday advances and pawn services.
Reports and statements made by consumer advocacy groups, members of the media, regulators and elected officials often focus on the annual or monthly cost to a consumer of consumer loans and pawn transactions, which are generally higher than the interest typically charged by banks to consumers with better credit histories. These reports and statements typically characterize pawn and/or consumer loans as predatory or abusive or focus on alleged instances of pawn operators purchasing or accepting stolen property as pawn collateral. If the negative characterization of these types of transactions becomes increasingly accepted by consumers, demand for pawn and/or consumer loan products could significantly decrease, which could materially affect the Company’s results of operations and financial condition. Additionally, if the negative characterization of these types of transactions becomes increasingly accepted by legislators and regulators, the Company could become subject to more restrictive laws and regulations that could have a material adverse effect on the Company’s financial condition and results of operations.
Judicial or administrative decisions, CFPB rule-making or amendments to the Federal Arbitration Act (the “FAA”) could render the arbitration agreements the Company uses illegal or unenforceable.
The Company includes dispute arbitration provisions in its customer loan and pawn agreements. These provisions are designed to allow the Company to resolve any customer disputes through individual arbitration rather than in court. The Company’s arbitration provisions explicitly provide that all arbitrations will be conducted on an individual and not on a class basis. Thus, the Company’s arbitration agreements, if enforced, have the effect of mitigating class and collective action liability. The Company’s arbitration agreements do not have any impact on regulatory enforcement proceedings. The Company takes the position that the FAA requires enforcement, in accordance with the terms of its arbitration agreements, of class and collective action waivers of the type the
24
Company uses, particularly now that the CFPB’s “Arbitration Rule” prohibiting class action waivers was officially repealed in November 2017.
In the past, however, a number of state and federal circuit courts, including the California and Nevada Supreme Courts, and the National Labor Relations Board concluded that arbitration agreements with consumer class action waivers are “unconscionable” and hence unenforceable, particularly where a small dollar amount is in controversy on an individual basis. In April 2011, however, the U.S. Supreme Court ruled in a 5-4 decision in
AT&T Mobility v. Concepcion
that the FAA preempts state laws that would otherwise invalidate consumer arbitration agreements with class action waivers. In December 2015, the Supreme Court in a 6-3 decision in
DIRECTV, Inc. v. Imburgia
upheld DIRECTV’s service agreement that included a binding arbitration provision with a class action waiver, and declared that the arbitration clause at issue was governed by the FAA. The Company’s arbitration agreements differ in some respects from the agreement at issue in
Concepcion
and
DIRECTV
and some courts have continued, in the aftermath of
Concepcion,
to find reasons to rule that arbitration agreements are unenforceable.
In light of conflicting court decisions and potential future CFPB rulemaking, it is possible that the Company’s arbitration agreements will be rendered unenforceable. Additionally, Congress has considered legislation that would generally limit or prohibit mandatory dispute arbitration in certain consumer contracts, and it has adopted such prohibitions with respect to certain mortgage loans and certain consumer loans to active-duty members of the military and their dependents.
Any judicial or administrative decision, federal legislation or CFPB rule that would impair the Company’s ability to enter into and enforce consumer arbitration agreements with class action waivers could significantly increase the Company’s exposure to class action litigation as well as litigation in plaintiff friendly jurisdictions. Such litigation could have a material adverse effect on the Company’s business, results of operations and financial condition.
Current and future litigation or regulatory proceedings, both in the U.S. and Latin America, could have a material adverse effect on the Company’s business, prospects, results of operations and financial condition.
The Company or its subsidiaries has been or may be involved in the future, in lawsuits, regulatory or administrative proceedings, examinations, investigations, consent orders, memorandums of understanding, audits, other actions arising in the ordinary course of business, including those related to consumer finance and protection, federal or state wage and hour laws, product liability, unclaimed property, employment, personal injury and other matters that could cause it to incur substantial expenditures and generate adverse publicity. In particular, the Company may be involved in lawsuits or regulatory actions related to consumer finance and protection, employment, marketing, unclaimed property, competition matters, and other matters, including class action lawsuits brought against it for alleged violations of the Fair Labor Standards Act, state wage and hour laws, state or federal advertising laws, consumer protection, lending and other laws. The consequences of defending proceedings or an adverse ruling in any current or future litigation, judicial or administrative proceeding, including consent orders or memorandums of understanding, could cause the Company to incur substantial legal fees, to have to refund fees and/or interest collected, refund the principal amount of advances, pay treble or other multiple damages, pay monetary penalties, fines, and/or modify or terminate the Company’s operations in particular states or countries. Defense or filing of any lawsuit or administrative proceeding, even if successful, could require substantial time, resources, and attention of the Company’s management and could require the expenditure of significant amounts for legal fees and other related costs. Settlement of lawsuits or administrative proceedings may also result in significant payments and modifications to the Company’s operations. Due to the inherent uncertainties of litigation, administrative proceedings and other claims, the Company cannot accurately predict the ultimate outcome of any such matters.
Adverse court and administrative interpretations or enforcement of the various laws and regulations under which the Company operates could require the Company to alter the products that it offers or cease doing business in the jurisdiction where the court, state or federal agency interpretation and enforcement is applicable. The Company is also subject to regulatory proceedings, and the Company could suffer losses from interpretations and enforcement of state or federal laws in those regulatory proceedings, even if it is not a party to those proceedings. Any of these events could have a material adverse effect on the Company’s business, prospects, results of operations and financial condition and could impair the Company’s ability to continue current operations. Besides regulation specific to consumer lending, which is discussed previously, the Company’s pawn, credit services and consumer loan businesses are subject to other federal, state and local regulations, tax laws and import/export laws, including, but not limited to, the Dodd-Frank Act, Unfair Deceptive or Abusive Acts and Practices, Federal Truth in Lending Act and Regulation Z adopted thereunder, Fair Debt Collections Practices Act, Military Lending Act, Bank Secrecy Act, Money Laundering Suppression Act of 1994, USA PATRIOT Act, Gramm-Leach-Bliley Act, Equal Credit Opportunity Act, Electronic Funds Transfer Act, Foreign Corrupt Practices Act and the Brady Handgun Violence Prevention Act. In addition, the Company’s marketing efforts and the representations the Company makes about its products and services are subject to federal and state unfair and deceptive practice statutes, including the Federal Trade Commission Act and analogous state statutes under which the Federal Trade Commission, state attorneys general or private plaintiffs may bring legal actions. If the Company is found to have engaged in an unfair and deceptive practice, it could have a material adverse effect on its business, prospects, results of operations and financial condition.
25
The Company sells products manufactured by third parties, some of which may be defective. Many such products are manufactured overseas in countries which may utilize quality control standards that vary from those legally allowed or commonly accepted in the U.S., which may increase the Company’s risk that such products may be defective. If any products that the Company sells were to cause physical injury or injury to property, the injured party or parties could bring claims against the Company as the retailer of the products based upon strict product liability. In addition, the Company’s products are subject to the federal Consumer Product Safety Act and the Consumer Product Safety Improvement Act, which empower the Consumer Product Safety Commission to protect consumers from hazardous products. The Consumer Product Safety Commission has the authority to exclude from the market and recall certain consumer products that are found to be hazardous. Similar laws exist in some states and cities in the U.S. If the Company fails to comply with government and industry safety standards, the Company may be subject to claims, lawsuits, product recalls, fines and negative publicity that could have a material adverse effect on its business, prospects, results of operations and financial condition.
Some of the Company’s U.S. stores sell firearms, ammunition and certain related accessories, which may be associated with an increased risk of injury and related lawsuits. The Company may incur losses due to lawsuits relating to its performance of background checks on firearms purchases as mandated by state and federal law or the improper use of firearms sold by the Company, including lawsuits by individuals, municipalities or other organizations attempting to recover damages or costs from firearms retailers relating to the misuse of firearms. Commencement of such lawsuits against the Company could have a material adverse effect on its business, prospects, results of operations and financial condition.
The Company is also subject to similar applicable laws and regulations in Latin America. For example, Mexico’s Anti-Money Laundering Law, which requires monthly reporting of certain transactions (or series of transactions) exceeding monetary limits, and require stricter maintenance of customer identification records and controls, and reporting of all foreign (non-Mexican) customer transactions. Guatemala, El Salvador and Colombia also have similar reporting requirements. The Company is also subject to the terms and enforcement of the Mexico Privacy Law, which requires companies to protect their customers’ personal information, among other things including mandatory disclosures.
Certain state and local governmental entities in Latin America also regulate pawn, other consumer finance and retail businesses through state laws and local zoning and permitting ordinances. State and local agencies, including local police authorities, often have unlimited, broad and discretionary authority to interpret and apply laws, and suspend store operations pending investigation of suspicious pawn transactions and resolution of actual or alleged regulatory, licensing and permitting issues, among other issues.
Compliance with applicable laws and regulations is costly, can affect operating results and may result in operational restrictions. The Company’s failure to comply with applicable laws and regulations could subject it to regulatory enforcement actions, result in the assessment against the Company of civil, monetary, criminal or other penalties, require the Company to abandon operations or certain product offerings, refund interest or fees, result in a determination that certain loans are not collectible, result in a revocation of licenses, or cause damage to its reputation, brands and customer relationships, any of which could have a material adverse effect on the Company’s business, prospects, results of operations and financial condition.
The sale and ownership of firearms, ammunition and certain related accessories is subject to current and potential regulation, which could have a material adverse effect on the Company’s reputation, business, prospects, results of operations and financial condition.
Because the Company sells firearms, ammunition and certain related accessories, the Company is required to comply with federal, state and local laws and regulations pertaining to the purchase, storage, transfer and sale of such products, and the Company is subject to reputational harm if a customer purchases a firearm that is later used in a deadly shooting. These laws and regulations require the Company, among other things, to ensure that each pawn location offering firearms has its FFL, that all purchasers of firearms are subjected to a pre-sale background check, to record the details of each firearm sale on appropriate government-issued forms, to record each receipt or transfer of a firearm and to maintain these records for a specified period of time. The Company is also required to timely respond to traces of firearms by law enforcement agencies. Over the past several years, the purchase, sale and ownership of firearms, ammunition and certain related accessories has been the subject of increased media scrutiny and federal, state and local regulation. The media scrutiny and regulatory efforts are likely to continue in the Company’s current markets and other markets into which the Company may expand. If enacted, new laws and regulations could limit the types of licenses, firearms, ammunition and certain related accessories that the Company is permitted to purchase and sell and could impose new restrictions and requirements on the manner in which the Company offers, purchases and sells these products. If the Company fails to comply with existing or newly enacted laws and regulations relating to the purchase and sale of firearms, ammunition and certain related accessories, its licenses to sell or maintain inventory of firearms at its stores may be suspended or revoked, which could have a material adverse effect on the Company’s business, prospects, results of operations and financial condition. In addition, new laws and regulations impacting the ownership of firearms and ammunition could cause a decline in the demand for and sales
26
of the Company’s products, which could materially adversely impact its revenue and profitability. Complying with increased regulation relating to the sale of firearms, ammunition and certain related accessories could be costly.
The Company is subject to the FCPA and other anti-corruption laws, and the Company’s failure to comply with these anti-corruption laws could result in penalties that could have a material adverse effect on its business, results of operations and financial condition.
The Company is subject to the FCPA, which generally prohibits companies and their agents or intermediaries from making improper payments to foreign officials for the purpose of obtaining or keeping business and/or other benefits. Although the Company has policies and procedures designed to ensure that it, its employees, agents, and intermediaries comply with the FCPA and other anti-corruption laws, there can be no assurance that such policies or procedures will work effectively all of the time or protect the Company against liability for actions taken by its employees, agents, and intermediaries with respect to its business or any businesses that it may acquire. In the event the Company believes, or has reason to believe, its employees, agents, or intermediaries have or may have violated applicable anti-corruption laws in the jurisdiction in which it operates, including the FCPA, the Company may be required to investigate or have a third party investigate the relevant facts and circumstances, which can be expensive and require significant time and attention from senior management. The Company’s continued operation and expansion outside the U.S., especially in Latin America, could increase the risk, perceived or otherwise, of such violations in the future. If the Company is found to have violated the FCPA or other laws governing the conduct of business with government entities (including local laws), the Company may be subject to criminal and civil penalties and other remedial measures, which could have an adverse effect on its business, results of operations, and financial condition. Investigation of any potential or perceived violations of the FCPA or other anti-corruption laws by U.S. or foreign authorities could harm the Company’s reputation and could have a material adverse effect on its business, results of operations and financial condition.
Failure to maintain certain criteria required by state and local regulatory bodies could result in fines or the loss of the Company’s licenses to conduct business.
Most states and many local jurisdictions both in the U.S. and in Latin America in which the Company operates, as well as the federal governments in Latin America, require registration and licenses of stores and employees to conduct the Company’s business. These states or their respective regulatory bodies have established criteria the Company must meet in order to obtain, maintain, and renew those licenses. For example, many of the states in which the Company operates require it to meet or exceed certain operational, advertising, disclosure, collection, and recordkeeping requirements and to maintain a minimum amount of net worth or equity. From time to time, the Company is subject to audits in these states to ensure it is meeting the applicable requirements to maintain these licenses. Failure to meet these requirements could result in various fines and penalties or store closures, which could include temporary suspension of operations, the revocation of existing licenses or the denial of new and renewal licensing requests. The Company cannot guarantee future license applications or renewals will be granted. If the Company were to lose any of its licenses to conduct its business, it could result in the temporary or permanent closure of stores, which could adversely affect the Company’s business, results of operations and cash flows.
The complexity of the political and regulatory environment in which the Company operates and the related cost of compliance are both increasing due to the changing political landscape, additional legal and regulatory requirements, the Company’s ongoing expansion into new markets and the fact that foreign laws occasionally are vague or conflict with domestic laws. In addition to potential damage to the Company’s reputation and brand, failure to comply with applicable federal, state and local laws and regulations such as those outlined above may result in the Company being subject to claims, lawsuits, fines and adverse publicity that could have a material adverse effect on its business, results of operations and financial condition.
Foreign Operations Risks
The Company’s financial position and results of operations may fluctuate significantly due to fluctuations in currency exchange rates in Latin American markets.
The Company derives significant revenue, earnings and cash flow from operations in Latin America, where business operations are transacted in Mexican pesos, Guatemalan quetzales and Colombian pesos. The Company’s
exposure to currency exchange rate fluctuations results primarily from the translation exposure associated with the preparation of the Company’s consolidated financial statements, as well as from transaction exposure associated with transactions and assets and liabilities denominated in currencies other than the respective subsidiaries’ functional currencies. While the Company’s consolidated financial statements are reported in U.S. dollars, the financial statements of the Company’s Latin American subsidiaries are prepared using their respective functional currency and translated into U.S. dollars by applying appropriate exchange rates. As a result, fluctuations in the exchange rate of the U.S. dollar relative to the Latin American currencies could cause significant fluctuations in the value of the Company’s assets, liabilities, stockholders’ equity and operating results. In addition, while expenses with respect to foreign
27
operations are generally denominated in the same currency as corresponding sales, the Company has transaction exposure to the extent expenditures are incurred in currencies other than the respective subsidiaries’ functional currencies. The costs of doing business in foreign jurisdictions also may increase as a result of adverse currency rate fluctuations. In addition, changes in currency rates could negatively affect customer demand, especially in Latin America and in U.S. stores located along the Mexican border. For a detailed discussion of the impact of fluctuations in currency exchange rates, see “Item 7A. Quantitative and Qualitative Disclosures About Market Risk.”
Risks and uncertainties related to the Company’s foreign operations could negatively impact the Company’s operating results.
As of
December 31, 2018
, the Company had
1,379
store locations in Latin America, including
1,323
in Mexico,
39
in Guatemala,
13
in El Salvador and
four
in Colombia and the Company plans to open additional stores in Latin America in the future. Doing business in each of these countries, and in Latin America generally, involves increased risks related to geo-political events, political instability, corruption, economic volatility, drug cartel and gang-related violence, social and ethnic unrest including riots and looting, enforcement of property rights, governmental regulations, tax policies, banking policies or restrictions, foreign investment policies, public safety and security, anti-money laundering regulations, interest rate regulation, and import/export regulations among others. As in many developing markets, there are also uncertainties as to how both local law and U.S. federal law is applied, including areas involving commercial transactions and foreign investment. As a result, actions or events could occur in Mexico, Guatemala, El Salvador or Colombia that are beyond the Company’s control, which could restrict or eliminate the Company’s ability to operate some or all of its locations in these countries or significantly reduce customer traffic, product demand and the expected profitability of such operations.
Changes impacting U.S. international trade and corporate tax provisions may have an adverse effect on the Company’s financial condition and results of operations.
Because international operations increase the complexity of an organization, the Company may face additional administrative costs in managing its business. In addition, most countries typically impose additional burdens on non-domestic companies through the use of local regulations, tariffs, labor controls and other federal or state requirements or legislation. As the Company derives significant revenue, earnings and cash flow from operations in Latin America, primarily in Mexico, there are some inherent risks regarding the overall stability of the trading relationship between Mexico and the U.S. and the burdens imposed thereon by any changes to (or the adoption of new) regulations, tariffs or other federal or state legislation. Specifically, the Company has significant exposure to fluctuations and devaluations of the Mexican peso and the health of the Mexican economy, which, in each case, may be negatively impacted by changes in U.S. trade treaties and corporate tax policy. In some cases, there have been negative reactions to the enacted and/or proposed policies as expressed in the media and by politicians in Mexico, which could potentially negatively impact U.S. companies operating in Mexico. In particular, there is uncertainty around the new presidential administration in Mexico and how the policies of this new administration may impact U.S. companies doing business in Mexico generally and pawn and consumer finance companies in particular. While the Company engages in limited cross-border transactions other than those involving scrap jewelry sales, any such changes in regulations, trade treaties, corporate tax policy, import taxes or adverse court or administrative interpretations of the foregoing could adversely and significantly affect the Mexican economy and ultimately the Mexican peso, which could adversely and significantly affect the Company’s financial position and results of the Company’s Latin America operations.
General Economic and Market Risks
A sustained deterioration of economic conditions or an economic crisis could reduce demand or profitability for the Company’s products and services and increase credit losses which would result in reduced earnings.
The Company’s business and financial results may be adversely impacted by sustained unfavorable economic conditions or unfavorable economic conditions associated with a global or regional economic crisis which, in either case, include adverse changes in interest or tax rates, effects of government initiatives to manage economic conditions and increased volatility of commodity markets and foreign currency exchange rates. Specifically, a sustained or rapid deterioration in the economy could cause deterioration in the performance of the Company’s loan portfolios and in consumer or market demand for pre-owned merchandise or gold such as that sold in the Company’s pawnshops. A sustained deterioration in the economy could reduce the demand and resale value of pre-owned merchandise and reduce the amount that the Company could effectively lend on an item of collateral. Such reductions could adversely affect pawn loan balances, pawn redemption rates, inventory balances, inventory mixes, sales volumes and gross profit margins. An economic slowdown also could result in a decrease in loan demand and an increase in loan defaults on consumer loan and credit services products. During such a slowdown, the Company could be required to tighten its underwriting standards, which would reduce consumer loan balances and related revenue and credit services fees, and could face more difficulty in collecting defaulted consumer loans, which could lead to an increase in loan losses. As consumer loans and credit services
28
customers generally have to be employed to qualify for a loan or extension of credit, an increase in the unemployment rate would reduce the number of potential customers.
Inclement weather, natural disasters or health epidemics can adversely impact the Company’s operating results.
The occurrence of weather events such as rain, cold weather, snow, wind, storms, hurricanes, earthquakes, volcanic eruptions, or other natural disasters or health epidemics in the Company’s markets could adversely affect consumer traffic, retail sales and loan origination or collection activities at the Company’s stores and have a material adverse effect on the Company’s results of operations. In addition, the Company may incur property, casualty or other losses not covered by insurance. The Company maintains a program of insurance coverage for various types of property, casualty and other risks. The types and amounts of insurance that the Company obtains vary from time to time, depending on availability, cost and management’s decisions with respect to risk retention. The Company’s insurance policies are subject to deductibles and exclusions that result in the Company’s retention of a level of risk on a self-insurance basis. Losses not covered by insurance could be substantial and may increase the Company’s expenses, which could harm the Company’s results of operations and financial condition.
Declines in commodity market prices of gold, other precious metals and diamonds could negatively affect the Company’s profits.
The Company’s profitability could be adversely impacted by commodity market fluctuations. As of
December 31, 2018
, approximately
56%
of the Company’s pawn loans were collateralized with jewelry, which is primarily gold, and
51%
of its inventories consisted of jewelry, which is also primarily gold. The Company sells significant quantities of gold, other precious metals and diamonds acquired through collateral forfeitures or direct purchases from customers. A significant and sustained decline in gold and/or other precious metal and diamond prices could result in decreased merchandise sales and related margins, decreased inventory valuations and sub-standard collateralization of outstanding pawn loans. In addition, a significant decline in market prices could result in a lower balance of pawn loans outstanding for the Company, as customers would receive lower loan amounts for individual pieces of jewelry or other gold items. For a detailed discussion of the impact of a decline in market prices on wholesale scrap jewelry sales, see “Item 7A. Quantitative and Qualitative Disclosures About Market Risk.”
Changes in the capital markets or the Company’s financial condition could reduce availability of capital on favorable terms, if at all.
The Company has, in the past, accessed the debt capital markets to refinance existing debt obligations and to obtain capital to finance growth. Efficient access to these markets is critical to the Company’s ongoing financial success. However, the Company’s future access to the debt capital markets could become restricted due to a variety of factors, including a deterioration of the Company’s earnings, cash flows, balance sheet quality, regulatory restrictions, fines, or orders or other regulatory action causing reputational harm, or overall business or industry prospects, a significant deterioration in the state of the capital markets, including impacts of inflation or rising interest rates or a negative bias toward the Company’s industry by market participants. Inability to access the credit markets on acceptable terms, if at all, could have a material adverse effect on the Company’s financial condition and ability to fund future growth.
Adverse real estate market fluctuations and/or the inability to renew and extend store operating leases could affect the Company’s profits.
The Company leases most of its locations. A significant rise in real estate prices or real property taxes could result in an increase in store lease costs as the Company opens new locations and renews leases for existing locations, thereby negatively impacting the Company’s results of operations. The Company also owns certain developed and undeveloped real estate, which could be impacted by adverse market fluctuations. In addition, the inability of the Company to renew, extend or replace expiring store leases could have an adverse effect on the Company’s results of operations.
A discussion of certain other market risks is covered in “Item 7A. Quantitative and Qualitative Disclosures About Market Risk.”
29
Accounting, Tax and Financial Risks
The Company's existing and future levels of indebtedness could adversely affect its financial health, its ability to obtain financing in the future, its ability to react to changes in its business and its ability to fulfill its obligations under such indebtedness.
As of
December 31, 2018
, including the Company's 5.375% senior unsecured notes issued in May 2017 (“Notes”) and the Company’s unsecured credit facility, the Company had outstanding principal indebtedness of
$595.0 million
and availability of
$126.8 million
under its unsecured credit facility. The Company's level of indebtedness could:
|
•
|
make it more difficult for it to satisfy its obligations with respect to the Notes and its other indebtedness, resulting in possible defaults on and acceleration of such indebtedness;
|
|
•
|
require it to dedicate a substantial portion of its cash flow from operations to the payment of principal and interest on its indebtedness, thereby reducing the availability of such cash flows to fund working capital, acquisitions, new store openings, capital expenditures and other general corporate purposes;
|
|
•
|
limit its ability to obtain additional financing for working capital, acquisitions, new store openings, capital expenditures, debt service requirements and other general corporate purposes;
|
|
•
|
limit its ability to refinance indebtedness or cause the associated costs of such refinancing to increase;
|
|
•
|
restrict the ability of its subsidiaries to pay dividends or otherwise transfer assets to the Company, which could limit its ability to, among other things, make required payments on its debt;
|
|
•
|
increase the Company's vulnerability to general adverse economic and industry conditions, including interest rate fluctuations (because a portion of its borrowings are at variable rates of interest); and
|
|
•
|
place the Company at a competitive disadvantage compared to other companies with proportionately less debt or comparable debt at more favorable interest rates who, as a result, may be better positioned to withstand economic downturns.
|
Any of the foregoing impacts of the Company's level of indebtedness could have a material adverse effect on its business, financial condition and results of operations.
The Company is subject to goodwill impairment risk.
At
December 31, 2018
, the Company had
$917.4 million
of goodwill on its consolidated balance sheet, all of which represents assets capitalized in connection with the Company’s acquisitions and business combinations. Accounting for goodwill requires significant management estimates and judgment. Management performs periodic reviews of the carrying value of goodwill to determine whether events and circumstances indicate that an impairment in value may have occurred. A variety of factors could cause the carrying value of goodwill to become impaired. A write-down of the carrying value of goodwill could result in a non-cash charge, which could have an adverse effect on the Company’s results of operations.
Unexpected changes in both domestic and foreign tax rates could negatively impact the Company’s operating results.
The Company’s financial results may be negatively impacted should tax rates in the U.S. and/or Latin America be increased in the future or otherwise adversely affected by changes in allowable expense deductions, or as a result of the imposition of new withholding requirements on repatriation of foreign earnings.
Certain tax positions taken by the Company require the judgment of management and could be challenged by federal taxing authorities in the U.S. and Latin America.
Management’s judgment is required in determining the provision for income taxes, the deferred tax assets and liabilities and any valuation allowance recorded against deferred tax assets. Management’s judgment is also required in evaluating whether tax benefits meet the more-likely-than-not threshold for recognition under ASC 740-10-25,
Income Taxes
.
Item 1B. Unresolved Staff Comments
None.
30
Item 2. Properties
As of
December 31, 2018
, the Company owned the real estate and buildings for 93 of its pawn stores and owned three other parcels of real estate, including the Company’s corporate headquarters building in Fort Worth, Texas. The Company’s strategy is generally to lease, rather than purchase, space for its pawnshop locations unless the Company finds what it believes is a superior location at an attractive price. As of
December 31, 2018
, the Company leased 2,448 store locations that were open or were in the process of opening. Leased facilities are generally leased for a term of three to five years with one or more options to renew. A majority of the store leases can be terminated early upon an adverse change in law which negatively affects the store’s profitability. The Company’s leases expire on dates ranging between 2019 and 2045. All store leases provide for specified periodic rental payments ranging from approximately $1,000 to $25,000 per month as of
December 31, 2018
. For more information about the Company’s pawn store locations, see “Item 1. Business—Locations and Operations.”
The following table details material corporate locations leased by the Company (dollars in thousands):
|
Description
|
Location
|
Square Footage
|
Lease Expiration Date
|
Monthly Rental Payment
|
||||||
|
Administrative offices
|
Monterrey, Mexico
|
15,000
|
December 31, 2019
|
$
|
14
|
|
||||
|
Administrative offices
|
Mexico City, Mexico
|
8,000
|
March 31, 2024
|
14
|
|
|||||
|
Administrative operations
|
Cincinnati, Ohio
|
10,000
|
April 30, 2019
|
10
|
|
|||||
|
Administrative operations
|
Fort Worth, Texas
|
24,000
|
July 31, 2021
|
10
|
|
|||||
Most leases require the Company to maintain the property and pay the cost of insurance and property taxes. The Company believes termination of any particular lease would not have a material adverse effect on the Company’s operations. The Company believes the facilities currently owned and leased by it as pawn stores are suitable for such purpose. The Company considers its equipment, furniture and fixtures to be in good condition.
Item 3. Legal Proceedings
The Company is a defendant in certain routine litigation matters and regulatory actions encountered in the ordinary course of its business. Certain of these matters are covered to an extent by insurance. In the opinion of management, the resolution of these matters is not expected to have a material adverse effect on the Company’s financial position, results of operations or liquidity.
Item 4. Mine Safety Disclosures
Not Applicable.
PART II
Item 5. Market for Registrant’s Common Equity, Related Stockholder Matters and Issuer Purchases of Equity Securities
General Market Information
The Company’s common stock is quoted on the Nasdaq Global Select Market (“Nasdaq”) under the symbol “FCFS.” As a result of a voluntary listing transfer, shares of the Company ceased trading on the New York Stock Exchange at the close of trading on October 5, 2018 and began trading on the Nasdaq under the stock symbol “FCFS” on October 8, 2018.
On
January 28, 2019
, there were approximately 277 stockholders of record of the Company’s common stock.
In October 2018, the Company’s Board of Directors approved a plan to increase the annual dividend 14% from $0.88 per share to $1.00 per share, or $0.25 per share quarterly, beginning in the fourth quarter of 2018. The declared $0.25 per share first quarter cash dividend on common shares outstanding, or an aggregate of
$10.9 million
based on the December 31,
2018
share count, will be paid on
February 28, 2019
to stockholders of record as of
February 14, 2019
. While the Company currently expects to continue the payment of quarterly cash dividends, the declaration and payment of cash dividends in the future (quarterly or otherwise) will be made by the Board of Directors, from time to time, subject to the Company’s financial condition, results of operations, business requirements, compliance with legal requirements and debt covenant restrictions.
31
Issuer Purchases of Equity Securities
During fiscal
2018
, the Company repurchased a total of 3,343,000 shares of common stock at an aggregate cost of $274.5 million and an average cost per share of $82.12, and during fiscal
2017
, repurchased 1,616,000 shares of common stock at an aggregate cost of $93.0 million and an average cost per share of $57.56.
The following table provides the information with respect to purchases made by the Company of shares of its common stock during each month a share repurchase program was in effect during the three months ended December 31,
2018
(dollars in thousands, except per share amounts):
|
Total
Number
Of Shares
Purchased
|
Average
Price
Paid
Per Share
|
Total Number Of
Shares Purchased
As Part Of Publicly
Announced Plans
|
Approximate Dollar Value Of Shares That May Yet Be Purchased Under The Plans
|
|||||||||||
|
October 1 through October 31, 2018
|
—
|
|
$
|
—
|
|
—
|
|
$
|
160,016
|
|
||||
|
November 1 through November 30, 2018
|
23,000
|
|
83.77
|
|
23,000
|
|
158,086
|
|
||||||
|
December 1 through December 31, 2018
|
206,000
|
|
74.43
|
|
206,000
|
|
142,760
|
|
||||||
|
Total
|
229,000
|
|
75.37
|
|
229,000
|
|
||||||||
The following table provides purchases made by the Company of shares of its common stock under each share repurchase program in effect during fiscal
2018
(dollars in thousands):
|
Plan Authorization Date
|
Plan Completion Date
|
Dollar Amount Authorized
|
Shares Purchased in 2018
|
Dollar Amount Purchased in 2018
|
Remaining Dollar Amount Authorized For Future Purchases
|
||||||||||||
|
May 15, 2017
|
January 31, 2018
|
$
|
100,000
|
|
239,000
|
|
$
|
17,288
|
|
$
|
—
|
|
|||||
|
October 24, 2017
|
April 6, 2018
|
100,000
|
|
1,282,000
|
|
100,000
|
|
—
|
|
||||||||
|
April 25, 2018
|
June 13, 2018
|
100,000
|
|
1,098,000
|
|
100,000
|
|
—
|
|
||||||||
|
July 25, 2018
|
Currently active
|
100,000
|
|
724,000
|
|
57,240
|
|
42,760
|
|
||||||||
|
October 24, 2018
|
Currently active
|
100,000
|
|
—
|
|
—
|
|
100,000
|
|
||||||||
|
Total
|
3,343,000
|
|
$
|
274,528
|
|
$
|
142,760
|
|
|||||||||
32
Performance Graph
The graph set forth below compares the cumulative total stockholder return on the common stock of the Company for the period from December 31, 2013 through December 31, 2018, with the cumulative total return on the S&P 600 Small Cap Index and the Russell 2000 Index, representing broad-based equity market indexes, and the S&P 600 Small Cap Consumer Finance Index and the S&P 600 Small Cap Specialty Stores Index, representing industry-based indexes, over the same period (assuming the investment of $100 on December 31, 2013 and assuming the reinvestment of all dividends on the date paid). The Company has previously included a peer group index, however believes the comparison to the above mentioned industry-based indexes is a more applicable comparison. As a result, the performance graph below does not include a peer group index. Note that historic performance is not necessarily indicative of future performance.
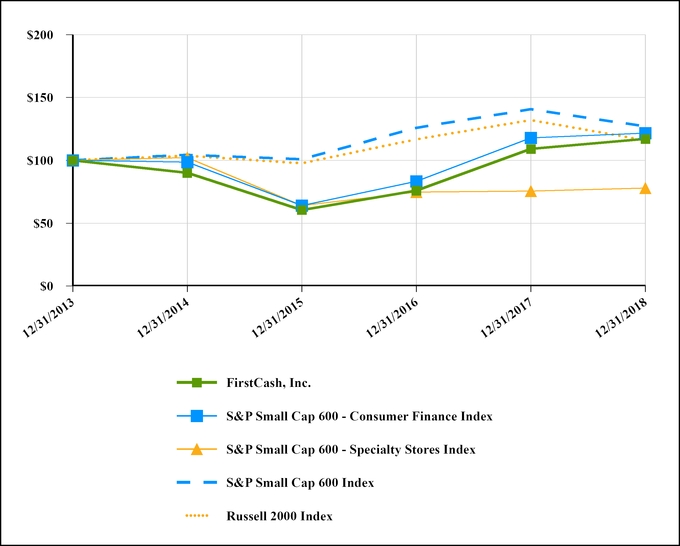
Item 6. Selected Financial Data
The information below should be read in conjunction with “Item 7. Management’s Discussion and Analysis of Financial Condition and Results of Operations” and the Company’s consolidated financial statements and related notes thereto in “Item 8. Financial Statements and Supplementary Data.” The information below is derived from and qualified by reference to the Company’s audited financial statements for each of the five years ended December 31,
2018
.
33
|
Year Ended December 31,
|
|||||||||||||||||||
|
2018
|
2017
|
2016
|
2015
|
2014
|
|||||||||||||||
|
(in thousands, except per share amounts and location counts)
|
|||||||||||||||||||
|
Income Statement Data
(1)
:
|
|||||||||||||||||||
|
Revenue:
|
|||||||||||||||||||
|
Retail merchandise sales
|
$
|
1,091,614
|
|
$
|
1,051,099
|
|
$
|
669,131
|
|
$
|
449,296
|
|
$
|
428,182
|
|
||||
|
Pawn loan fees
|
525,146
|
|
510,905
|
|
312,757
|
|
195,448
|
|
199,357
|
|
|||||||||
|
Wholesale scrap jewelry sales
|
107,821
|
|
140,842
|
|
62,638
|
|
32,055
|
|
48,589
|
|
|||||||||
|
Consumer loan and credit services fees
|
56,277
|
|
76,976
|
|
43,851
|
|
27,803
|
|
36,749
|
|
|||||||||
|
Total revenue
|
1,780,858
|
|
1,779,822
|
|
1,088,377
|
|
704,602
|
|
712,877
|
|
|||||||||
|
Cost of revenue:
|
|||||||||||||||||||
|
Cost of retail merchandise sold
|
696,666
|
|
679,703
|
|
418,556
|
|
278,631
|
|
261,673
|
|
|||||||||
|
Cost of wholesale scrap jewelry sold
|
99,964
|
|
132,794
|
|
53,025
|
|
27,628
|
|
41,044
|
|
|||||||||
|
Consumer loan and credit services loss provision
|
17,461
|
|
19,819
|
|
11,993
|
|
7,159
|
|
9,287
|
|
|||||||||
|
Total cost of revenue
|
814,091
|
|
832,316
|
|
483,574
|
|
313,418
|
|
312,004
|
|
|||||||||
|
Net revenue
|
966,767
|
|
947,506
|
|
604,803
|
|
391,184
|
|
400,873
|
|
|||||||||
|
Expenses and other income:
|
|||||||||||||||||||
|
Store operating expenses
(2)
|
563,321
|
|
552,191
|
|
327,062
|
|
207,731
|
|
199,205
|
|
|||||||||
|
Administrative expenses
|
120,042
|
|
122,473
|
|
96,537
|
|
51,883
|
|
53,588
|
|
|||||||||
|
Depreciation and amortization
|
42,961
|
|
55,233
|
|
31,865
|
|
17,939
|
|
17,476
|
|
|||||||||
|
Interest expense, net
|
26,729
|
|
22,438
|
|
19,569
|
|
15,321
|
|
12,845
|
|
|||||||||
|
Merger and other acquisition expenses
|
7,643
|
|
9,062
|
|
36,670
|
|
2,875
|
|
998
|
|
|||||||||
|
(Gain) loss on foreign exchange
(2)
|
762
|
|
(317
|
)
|
952
|
|
(159
|
)
|
(219
|
)
|
|||||||||
|
Loss on extinguishment of debt
|
—
|
|
14,114
|
|
—
|
|
—
|
|
—
|
|
|||||||||
|
Net gain on sale of common stock of Enova
|
—
|
|
—
|
|
(1,299
|
)
|
—
|
|
—
|
|
|||||||||
|
Goodwill impairment - U.S. consumer loan operations
|
—
|
|
—
|
|
—
|
|
7,913
|
|
—
|
|
|||||||||
|
Total expenses and other income
|
761,458
|
|
775,194
|
|
511,356
|
|
303,503
|
|
283,893
|
|
|||||||||
|
Income from continuing operations before income taxes
|
205,309
|
|
172,312
|
|
93,447
|
|
87,681
|
|
116,980
|
|
|||||||||
|
Provision for income taxes
|
52,103
|
|
28,420
|
|
33,320
|
|
26,971
|
|
31,542
|
|
|||||||||
|
Income from continuing operations
|
153,206
|
|
143,892
|
|
60,127
|
|
60,710
|
|
85,438
|
|
|||||||||
|
Loss from discontinued operations, net of tax
|
—
|
|
—
|
|
—
|
|
—
|
|
(272
|
)
|
|||||||||
|
Net income
|
$
|
153,206
|
|
$
|
143,892
|
|
$
|
60,127
|
|
$
|
60,710
|
|
$
|
85,166
|
|
||||
|
Dividends declared per common share
|
$
|
0.91
|
|
$
|
0.77
|
|
$
|
0.565
|
|
$
|
—
|
|
$
|
—
|
|
||||
34
|
Year Ended December 31,
|
|||||||||||||||||||
|
2018
|
2017
|
2016
|
2015
|
2014
|
|||||||||||||||
|
Income Statement Data (Continued)
(1)
:
|
|||||||||||||||||||
|
Earnings per share:
|
|||||||||||||||||||
|
Basic:
|
|||||||||||||||||||
|
Income from continuing operations
|
$
|
3.42
|
|
$
|
3.01
|
|
$
|
1.72
|
|
$
|
2.16
|
|
$
|
2.98
|
|
||||
|
Net income
|
3.42
|
|
3.01
|
|
1.72
|
|
2.16
|
|
2.97
|
|
|||||||||
|
Diluted:
|
|||||||||||||||||||
|
Income from continuing operations
|
3.41
|
|
3.00
|
|
1.72
|
|
2.14
|
|
2.94
|
|
|||||||||
|
Net income
|
3.41
|
|
3.00
|
|
1.72
|
|
2.14
|
|
2.93
|
|
|||||||||
|
Balance Sheet Data:
|
|||||||||||||||||||
|
Inventories
|
$
|
275,130
|
|
$
|
276,771
|
|
$
|
330,683
|
|
$
|
93,458
|
|
$
|
91,088
|
|
||||
|
Pawn loans
|
362,941
|
|
344,748
|
|
350,506
|
|
117,601
|
|
118,536
|
|
|||||||||
|
Net working capital
|
656,847
|
|
721,626
|
|
748,507
|
|
279,259
|
|
258,194
|
|
|||||||||
|
Total assets
|
2,107,974
|
|
2,062,784
|
|
2,145,203
|
|
752,895
|
|
711,880
|
|
|||||||||
|
Long-term liabilities
|
656,825
|
|
466,880
|
|
551,589
|
|
275,338
|
|
234,880
|
|
|||||||||
|
Total liabilities
|
789,870
|
|
587,451
|
|
695,217
|
|
321,513
|
|
277,439
|
|
|||||||||
|
Stockholders’ equity
|
1,318,104
|
|
1,475,333
|
|
1,449,986
|
|
431,382
|
|
434,441
|
|
|||||||||
|
Statement of Cash Flows Data:
|
|||||||||||||||||||
|
Net cash flows provided by (used in):
|
|||||||||||||||||||
|
Operating activities
|
$
|
243,429
|
|
$
|
220,357
|
|
$
|
96,854
|
|
$
|
92,749
|
|
$
|
97,679
|
|
||||
|
Investing activities
|
(159,247
|
)
|
1,397
|
|
(25,967
|
)
|
(71,676
|
)
|
(85,366
|
)
|
|||||||||
|
Financing activities
|
(127,061
|
)
|
(197,506
|
)
|
(58,713
|
)
|
9,127
|
|
(9,098
|
)
|
|||||||||
|
Location Counts:
|
|||||||||||||||||||
|
Pawn stores
|
2,456
|
|
2,039
|
|
2,012
|
|
1,005
|
|
912
|
|
|||||||||
|
Consumer loan stores
|
17
|
|
72
|
|
73
|
|
70
|
|
93
|
|
|||||||||
|
2,473
|
|
2,111
|
|
2,085
|
|
1,075
|
|
1,005
|
|
||||||||||
|
(1)
|
See “Item 7. Management’s Discussion and Analysis of Financial Condition and Results of Operations—Non-GAAP Financial Information—Adjusted Net Income and Adjusted Diluted Earnings Per Share” for additional information about certain
2018
,
2017
and
2016
income and expense items that affected the Company’s consolidated net income and diluted earnings per share.
|
|
(2)
|
Prior-year amounts have been reclassified. See Note 2 of Notes to Consolidated Financial Statements for further information.
|
Item 7. Management’s Discussion and Analysis of Financial Condition and Results of Operations
General
The Company is a leading operator of retail-based pawn stores with more than 2,450 store locations in the U.S. and Latin America. The Company’s pawn stores generate significant retail sales primarily from the merchandise acquired through collateral forfeitures and over-the-counter purchases from customers. The stores also offer pawn loans to help customers meet small short-term cash needs. Personal property, such as consumer electronics, jewelry, tools, household appliances, sporting goods and musical instruments is pledged as collateral for the pawn loans and held by the Company over the term of the loan plus a stated grace period. In addition, some of the Company’s pawn stores offer credit services products and/or consumer loans. The Company’s strategy is to grow its retail-based pawn operations primarily in Latin America but also in the U.S. through new store openings and strategic acquisitions as opportunities arise. Pawn operations, which include retail merchandise sales, pawn loan fees and wholesale scrap jewelry sales, accounted for approximately
97%
and
96%
of the Company’s consolidated revenue during fiscal
2018
and
2017
, respectively.
35
The Company organizes its operations into two reportable segments. The U.S. operations segment consists of all pawn and consumer loan operations in the U.S. and the Latin America operations segment consists of all pawn and consumer loan operations in Latin America, which includes operations in Mexico, Guatemala, El Salvador and Colombia. Financial information regarding the Company’s revenue and long-lived assets by geographic areas is provided in Note
16
of Notes to Consolidated Financial Statements contained herein.
The Company recognizes pawn loan fee revenue on a constant-yield basis over the life of the pawn loan for all pawn loans of which the Company deems collection to be probable based on historical redemption statistics. If a pawn loan is not repaid prior to the expiration of the loan term, including any extension or grace period, if applicable, the property is forfeited to the Company and transferred to inventory at a value equal to the principal amount of the loan, exclusive of accrued pawn fee revenue. The Company records merchandise sales revenue at the time of the sale and presents merchandise sales net of any sales or value-added taxes collected. The Company does not provide direct financing to customers for the purchase of its merchandise, but does permit its customers to purchase merchandise on an interest-free layaway plan. Should the customer fail to make a required payment pursuant to a layaway plan, the previous payments are typically forfeited to the Company. Interim payments from customers on layaway sales are recorded as deferred revenue and subsequently recorded as retail merchandise sales revenue when the merchandise is delivered to the customer upon receipt of final payment or when previous payments are forfeited to the Company. Some jewelry is processed at third-party facilities and the precious metal and diamond content is sold at either prevailing market commodity prices or a previously agreed upon price with a commodity buyer. The Company records revenue from these wholesale scrap jewelry transactions when a price has been agreed upon and the Company ships the commodity to the buyer.
The Company operates a small number of stand-alone consumer finance stores in the U.S. These stores provide consumer financial services products including credit services and consumer loans. In addition,
262
of the Company’s pawn stores also offer credit services and/or consumer loans as an ancillary product, which have been deemphasized by the Company in recent years due to regulatory constraints and increased internet based competition for such products. Beginning in fiscal 2018, the Company no longer offers fee-based check cashing services in its company-owned stores. In addition, effective June 30, 2018, the Company no longer offers an unsecured consumer loan product in Latin America. Consumer loan and credit services revenue accounted for approximately
3%
and
4%
of consolidated revenue for fiscal
2018
and
2017
, respectively.
The Company recognizes service fee income on consumer loan transactions on a constant-yield basis over the life of the loan and recognizes credit services fees ratably over the life of the extension of credit made by the Independent Lenders. Changes in the valuation reserve on consumer loans and credit services transactions are charged or credited to the consumer loan credit loss provision. The credit loss provision associated with the Company’s CSO Programs and consumer loans is based primarily upon historical credit loss experience, with consideration given to recent credit loss trends, delinquency rates, economic conditions and management’s expectations of future credit losses.
Operating expenses consist of all items directly related to the operation of the Company’s stores, including salaries and related payroll costs, rent, utilities, facilities maintenance, advertising, property taxes, licenses, supplies and security. Administrative expenses consist of items relating to the operation of the corporate offices, including the compensation and benefit costs of corporate management, district managers and other operations management personnel, collection operations and personnel, accounting and administrative costs, information technology costs, liability and casualty insurance, outside legal and accounting fees and stockholder-related expenses. Merger and other acquisition expenses primarily include incremental costs directly associated with merger and acquisition activities, including professional fees, legal expenses, severance, retention and other employee-related costs, accelerated vesting of certain equity compensation awards, contract breakage costs and costs related to consolidation of technology systems and corporate facilities.
Stores included in the same-store calculations presented in this report are those stores that were opened or acquired prior to the beginning of the prior-year comparative fiscal period and remained open through the end of the reporting period. Also included are stores that were relocated during the applicable period within a specified distance serving the same market where there is not a significant change in store size and where there is not a significant overlap or gap in timing between the opening of the new store and the closing of the existing store.
The Company’s management reviews and analyzes certain operating results in Latin America on a constant currency basis because the Company believes this better represents the Company’s underlying business trends. Constant currency results are non-GAAP financial measures, which exclude the effects of foreign currency translation and are calculated by translating current year results at prior year average exchange rates. The scrap jewelry generated in Latin America is sold and settled in U.S. dollars and therefore, wholesale scrap jewelry sales revenue is not affected by foreign currency translation. A small percentage of the operating and administrative expenses in Latin America are also billed and paid in U.S. dollars, which are not affected by foreign currency translation.
36
Business operations in Mexico, Guatemala and Colombia are transacted in Mexican pesos, Guatemalan quetzales and Colombian pesos, respectively. The Company also has operations in El Salvador where the reporting and functional currency is the U.S. dollar. The following table provides exchange rates for the Mexican peso, Guatemalan quetzal and Colombian peso for the current and prior-year periods:
|
2018
|
2017
|
2016
|
||||||||||||||
|
Rate
|
% Change
Over Prior
Year Period
Favorable /
(Unfavorable)
|
Rate
|
% Change
Over Prior
Year Period
Favorable /
(Unfavorable)
|
|
Rate
|
|||||||||||
|
Mexican peso / U.S. dollar exchange rate:
|
||||||||||||||||
|
End-of-period
|
19.7
|
—
|
%
|
19.7
|
5
|
%
|
20.7
|
|||||||||
|
Twelve months ended
|
19.2
|
(2
|
)%
|
18.9
|
(1
|
)%
|
18.7
|
|||||||||
|
Guatemalan quetzal / U.S. dollar exchange rate:
|
||||||||||||||||
|
End-of-period
|
7.7
|
(5
|
)%
|
7.3
|
3
|
%
|
7.5
|
|||||||||
|
Twelve months ended
|
7.5
|
(1
|
)%
|
7.4
|
3
|
%
|
7.6
|
|||||||||
|
Colombian peso / U.S. dollar exchange rate:
|
||||||||||||||||
|
End-of-period
|
3,250
|
(9
|
)%
|
2,984
|
1
|
%
|
3,001
|
|||||||||
|
Twelve months ended
|
2,956
|
—
|
%
|
2,951
|
3
|
%
|
3,052
|
|||||||||
Amounts presented on a constant currency basis are denoted as such. See “Non-GAAP Financial Information” for additional discussion of constant currency operating results.
37
The following table details income statement items as a percent of total revenue and other operating metrics:
|
Year Ended December 31,
|
||||||||
|
2018
|
2017
|
2016
|
||||||
|
Revenue:
|
||||||||
|
Retail merchandise sales
|
61.3
|
%
|
59.1
|
%
|
61.5
|
%
|
||
|
Pawn loan fees
|
29.5
|
|
28.7
|
|
28.7
|
|
||
|
Wholesale scrap jewelry sales
|
6.0
|
|
7.9
|
|
5.8
|
|
||
|
Consumer loan and credit services fees
|
3.2
|
|
4.3
|
|
4.0
|
|
||
|
Cost of revenue:
|
||||||||
|
Cost of retail merchandise sold
|
39.1
|
|
38.2
|
|
38.4
|
|
||
|
Cost of wholesale scrap jewelry sold
|
5.6
|
|
7.5
|
|
4.9
|
|
||
|
Consumer loan and credit services loss provision
|
1.0
|
|
1.1
|
|
1.1
|
|
||
|
Net revenue
|
54.3
|
|
53.2
|
|
55.6
|
|
||
|
Expenses and other income:
|
||||||||
|
Store operating expenses
(1)
|
31.6
|
|
31.0
|
|
30.0
|
|
||
|
Administrative expenses
|
6.8
|
|
6.9
|
|
8.9
|
|
||
|
Depreciation and amortization
|
2.4
|
|
3.1
|
|
2.9
|
|
||
|
Interest expense, net
|
1.5
|
|
1.2
|
|
1.8
|
|
||
|
Merger and other acquisition expenses
|
0.4
|
|
0.5
|
|
3.4
|
|
||
|
(Gain) loss on foreign exchange
(1)
|
0.1
|
|
—
|
|
0.1
|
|
||
|
Loss on extinguishment of debt
|
—
|
|
0.8
|
|
—
|
|
||
|
Net gain on sale of common stock of Enova
|
—
|
|
—
|
|
(0.1
|
)
|
||
|
Income before income taxes
|
11.5
|
|
9.7
|
|
8.6
|
|
||
|
Provision for income taxes
|
2.9
|
|
1.6
|
|
3.1
|
|
||
|
Net income
|
8.6
|
|
8.1
|
|
5.5
|
|
||
|
(1)
|
Prior-year amounts have been reclassified. See Note 2 of Notes to Consolidated Financial Statements for further information.
|
38
Critical Accounting Policies
The preparation of financial statements in conformity with GAAP requires management to make estimates, assumptions and judgments that affect the reported amounts of assets and liabilities, related revenue and expenses, and disclosure of gain and loss contingencies at the date of the financial statements. Such estimates, assumptions and judgments are subject to a number of risks and uncertainties, which may cause actual results to differ materially from the Company’s estimates. The significant accounting policies that the Company believes are the most critical to aid in fully understanding and evaluating its reported financial results include the following:
Customer loans and revenue recognition
- Receivables on the balance sheet consist of pawn loans and consumer loans. Pawn loans are collateralized by pledged tangible personal property, which the Company holds during the term of the loan plus a stated grace period. In certain markets, the Company also provides pawn loans collateralized by automobiles, which typically remain in the possession of the customer. The Company accrues pawn loan fee revenue on a constant-yield basis over the life of the pawn for all pawns for which the Company deems collection to be probable based on historical pawn redemption statistics. The typical pawn loan term is generally 30 days plus an additional grace period of 14 to 90 days, depending on geographical markets and local regulations. Pawn loans may be either paid in full with accrued pawn loan fees and service charges or, where permitted by law, may be renewed or extended by the customer’s payment of accrued pawn loan fees and service charges. If the pawn is not repaid upon expiration of the grace period, the principal amount loaned becomes the carrying value of the forfeited collateral, which is typically recovered through sales of the forfeited items at prices well above the carrying value.
The Company’s pawn merchandise sales are primarily retail sales to the general public in its pawn stores. The Company acquires pawn merchandise inventory through forfeited pawn loans and through purchases of used goods directly from the general public. The Company also retails limited quantities of new or refurbished merchandise obtained directly from wholesalers and manufacturers. The Company records sales revenue at the time of the sale. The Company presents merchandise sales net of any sales or value-added taxes collected. The Company does not provide direct financing to customers for the purchase of its merchandise, but does permit its customers to purchase merchandise on an interest-free layaway plan. Should the customer fail to make a required payment pursuant to a layaway plan, the previous payments are typically forfeited to the Company. Interim payments from customers on layaway sales are recorded as deferred revenue and subsequently recorded as retail merchandise sales revenue when the merchandise is delivered to the customer upon receipt of final payment or when previous payments are forfeited to the Company. Some jewelry is processed at third-party facilities and the precious metal and diamond content is sold at either prevailing market commodity prices or a previously agreed upon price with a commodity buyer. The Company records revenue from these wholesale scrap jewelry transactions when a price has been agreed upon and the Company ships the commodity to the buyer.
The Company accrues consumer loan service fees on a constant-yield basis over the term of the consumer loan. Consumer loans have terms that typically range from 7 to 365 days. The Company recognizes credit services fees ratably over the life of the extension of credit made by the Independent Lenders. The extensions of credit made by the Independent Lenders to credit services customers typically have terms of
7
to
365
days.
Credit loss provisions
- The Company has determined no allowance related to credit losses on pawn loans is required, as the fair value of the pledged collateral is significantly in excess of the pawn loan amount. The Company maintains an allowance for credit losses on consumer loans on an aggregate basis at a level it considers sufficient to cover estimated losses in the collection of its consumer loans. The allowance for credit losses is based primarily upon historical credit loss experience, with consideration given to recent credit loss trends and changes in loan characteristics (e.g., average amount financed and term), delinquency levels, collateral values, economic conditions and underwriting and collection practices. The allowance for credit losses is periodically reviewed by management with any changes reflected in current operations.
The Company fully reserves or charges off consumer loans once the loan has been classified as delinquent for 60 days. Short-term loans are considered delinquent when payment of an amount due is not made as of the due date. Installment loans are considered delinquent when a customer misses two payments. If a loan is estimated to be uncollectible before it is fully reserved, it is charged off at that point. Recoveries on loans previously charged to the allowance, including the sale of delinquent loans to unaffiliated third parties, are credited to the allowance when collected or when sold to a third party. The Company generally does not accrue interest on delinquent consumer loans. In addition, delinquent consumer loans generally may not be renewed, and if, during its attempt to collect on a delinquent consumer loan, the Company allows additional time for payment through a payment plan or a promise to pay, it is still considered delinquent. Generally, all payments received are first applied against accrued but unpaid interest and fees and then against the principal balance of the loan.
39
Under the CSO Programs, the Company assists customers in applying for a short-term extension of credit from Independent Lenders and issues the Independent Lenders a guarantee for the repayment of the extension of credit. The Company is required to recognize, at the inception of the guarantee, a liability for the fair value of the obligation undertaken by issuing the guarantee. According to the guarantee, if the borrower defaults on the extension of credit, the Company will pay the Independent Lenders the principal, accrued interest, insufficient funds and late fee, if applicable, all of which the Company records as a component of its credit loss provision. The Company is entitled to seek recovery, directly from its customers, of the amounts it pays the Independent Lenders in performing under the guarantees. The Company records the estimated fair value of the liability in accrued liabilities. The estimated fair value of the liability is periodically reviewed by management with any changes reflected in current operations.
Inventories
- Inventories represent merchandise acquired from forfeited pawns and merchandise purchased directly from the general public. The Company also retails limited quantities of new or refurbished merchandise obtained directly from wholesalers and manufacturers. Inventories from forfeited pawns are recorded at the amount of the pawn principal on the unredeemed goods, exclusive of accrued interest. Inventories purchased directly from customers, wholesalers and manufacturers are recorded at cost. The cost of inventories is determined on the specific identification method. Inventories are stated at the lower of cost or net realizable value and, accordingly, inventory valuation allowances are established if inventory carrying values are in excess of estimated selling prices, net of direct costs of disposal. Management has evaluated inventories and determined that a valuation allowance is not necessary.
Goodwill and other indefinite-lived intangible assets -
Goodwill represents the excess of the purchase price over the fair value of the net assets acquired in each business combination. The Company performs its goodwill impairment assessment annually as of December 31, and between annual assessments if an event occurs or circumstances change that would more likely than not reduce the fair value of a reporting unit below its carrying amount. The Company’s reporting units, which are tested for impairment, are U.S. operations and Latin America operations. The Company assesses goodwill for impairment at a reporting unit level by first assessing a range of qualitative factors, including, but not limited to, macroeconomic conditions, industry conditions, the competitive environment, changes in the market for the Company’s products and services, regulatory and political developments, entity specific factors such as strategy and changes in key personnel, and overall financial performance. If, after completing this assessment, it is determined that it is more likely than not that the fair value of a reporting unit is less than its carrying value, the Company proceeds to the two-step impairment testing methodology.
The Company’s material indefinite-lived intangible assets consist of trade names and pawn licenses. The Company performs its indefinite-lived intangible asset impairment assessment annually as of December 31, and between annual assessments if an event occurs or circumstances change that would more likely than not reduce the fair value of a reporting unit below its carrying amount. The Company determined there was no impairment as of December 31,
2018
and
2017
.
Foreign currency transactions
- The Company has significant operations in Latin America, where in Mexico, Guatemala and Colombia the functional currency is the Mexican peso, Guatemalan quetzal and Colombian peso, respectively. Accordingly, the assets and liabilities of these subsidiaries are translated into U.S. dollars at the exchange rate in effect at each balance sheet date, and the resulting adjustments are accumulated in other comprehensive income (loss) as a separate component of stockholders’ equity. Revenues and expenses are translated at the average exchange rates occurring during the respective fiscal period. Prior to translation, U.S. dollar-denominated transactions of the foreign subsidiaries are remeasured into their functional currency using current rates of exchange for monetary assets and liabilities and historical rates of exchange for non-monetary assets and liabilities. Gains and losses from remeasurement of dollar-denominated monetary assets and liabilities in Mexico, Guatemala and Colombia are accumulated in (gain) loss on foreign exchange as a separate component on the consolidated statements of income. Deferred taxes are not currently provided on cumulative foreign currency translation adjustments, as the Company indefinitely reinvests earnings of its foreign subsidiaries. The Company also has operations in El Salvador where the reporting and functional currency is the U.S. dollar.
40
Results of Operations
2018
Consolidated Operating Results Highlights
The following are the results from
2018
the Company believes are key indicators of its operating performance when compared to
2017
. See “Non-GAAP Financial Information” for additional discussion of non-GAAP financial measures.
|
•
|
Total revenue was $1.8 billion in both fiscal 2018 and 2017. Revenue from core pawn operations, which includes pawn fees and retail merchandise sales revenue, in 2018 increased $54.8 million, or 4% compared to 2017.
|
|
•
|
Net revenue (gross profit) increased $19.3 million over the prior year with a 110 basis point increase in the gross margin to 54% of revenues.
|
|
•
|
Pre-tax profit margin increased 180 basis points to 11.5% and adjusted pre-tax profit margin, which is calculated using a non-GAAP financial measure, increased 100 basis points to 12.0%.
|
|
•
|
Net income increased $9.3 million, or 6% and adjusted net income, a non-GAAP financial measure, increased $27.1 million, or 21%.
|
|
•
|
Diluted earnings per share increased 14% to $3.41 and adjusted diluted earnings per share, a non-GAAP financial measure, increased 29% to $3.53.
|
|
•
|
Return on assets increased 50 basis points to 7.4%, while return on tangible assets increased 150 basis points to 13.9%.
|
|
•
|
Return on equity was 11.2% while return on tangible equity was 37.7%, which represented increases of 140 basis points and 1,110 basis points, respectively.
|
|
•
|
The Company acquired 3,343,000 shares of its outstanding common shares for $274.5 million at an average price of $82.12 per share.
|
|
•
|
The Company declared and paid total cash dividends of $0.91 per common share, representing an 18% increase per share.
|
|
•
|
As of
December 31, 2018
, the Company had
2,473
store locations, which represents a net store-count increase of
17%
over the number of stores at
December 31, 2017
.
|
The following charts present net income, adjusted net income, adjusted EBITDA, diluted earnings per share and adjusted diluted earnings per share for the fiscal years ended
December 31, 2018
,
2017
and
2016
(in millions, except per share amounts):
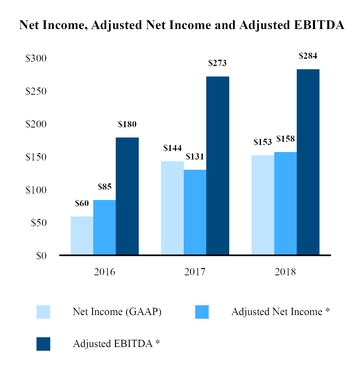
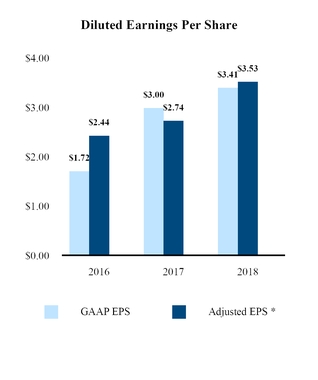
* Non-GAAP financial measures. See “Non-GAAP Financial Information” for additional discussion of non-GAAP financial measures.
41
Operating Results for the Twelve Months Ended December 31,
2018
Compared to the Twelve Months Ended December 31,
2017
U.S. Operations Segment
The following table details earning assets, which consist of pawn loans, inventories and consumer loans, net, as well as other earning asset metrics of the U.S. operations segment as of December 31,
2018
as compared to December 31,
2017
(dollars in thousands, except as otherwise noted):
|
As of December 31,
|
Increase /
|
|||||||||||
|
|
2018
|
2017
|
(Decrease)
|
|||||||||
|
U.S. Operations Segment
|
|
|
|
|||||||||
|
Earning assets:
|
||||||||||||
|
Pawn loans
|
$
|
271,584
|
|
$
|
276,570
|
|
(2
|
)%
|
||||
|
Inventories
|
199,978
|
|
216,739
|
|
(8
|
)%
|
||||||
|
Consumer loans, net
(1)
|
15,902
|
|
23,179
|
|
(31
|
)%
|
||||||
|
$
|
487,464
|
|
$
|
516,488
|
|
(6
|
)%
|
|||||
|
Average outstanding pawn loan amount (in ones)
|
$
|
172
|
|
$
|
162
|
|
6
|
%
|
||||
|
Composition of pawn collateral:
|
||||||||||||
|
General merchandise
|
34
|
%
|
34
|
%
|
||||||||
|
Jewelry
|
66
|
%
|
66
|
%
|
||||||||
|
|
100
|
%
|
100
|
%
|
||||||||
|
Composition of inventories:
|
||||||||||||
|
General merchandise
|
42
|
%
|
42
|
%
|
||||||||
|
Jewelry
|
58
|
%
|
58
|
%
|
||||||||
|
100
|
%
|
100
|
%
|
|||||||||
|
Percentage of inventory aged greater than one year
|
4
|
%
|
6
|
%
|
||||||||
|
(1)
|
Does not include the off-balance sheet principal portion of active extensions of credit made by independent third-party lenders, which are guaranteed by the Company through its CSO Programs. These amounts, net of the Company’s estimated fair value of its liability for guaranteeing the extensions of credit, totaled
$5.8 million
and
$9.3 million
as of December 31,
2018
and
2017
, respectively.
|
The following table presents segment pre-tax operating income of the U.S. operations segment for the fiscal year ended
December 31, 2018
as compared to the fiscal year ended
December 31, 2017
(dollars in thousands). Store operating expenses include salary and benefit expense of store-level employees, occupancy costs, bank charges, security, insurance, utilities, supplies and other costs incurred by the stores.
42
|
Year Ended December 31,
|
|||||||||||||
|
2018
|
2017
|
Decrease
|
|||||||||||
|
U.S. Operations Segment
|
|||||||||||||
|
Revenue:
|
|||||||||||||
|
Retail merchandise sales
|
$
|
709,594
|
|
$
|
717,490
|
|
(1
|
)%
|
|||||
|
Pawn loan fees
|
373,406
|
|
380,596
|
|
(2
|
)%
|
|||||||
|
Wholesale scrap jewelry sales
|
85,718
|
|
119,197
|
|
(28
|
)%
|
|||||||
|
Consumer loan and credit services fees
|
55,417
|
|
75,209
|
|
(26
|
)%
|
|||||||
|
Total revenue
|
1,224,135
|
|
1,292,492
|
|
(5
|
)%
|
|||||||
|
Cost of revenue:
|
|
|
|||||||||||
|
Cost of retail merchandise sold
|
450,516
|
|
468,527
|
|
(4
|
)%
|
|||||||
|
Cost of wholesale scrap jewelry sold
|
78,308
|
|
112,467
|
|
(30
|
)%
|
|||||||
|
Consumer loan and credit services loss provision
|
17,223
|
|
19,431
|
|
(11
|
)%
|
|||||||
|
Total cost of revenue
|
546,047
|
|
600,425
|
|
(9
|
)%
|
|||||||
|
Net revenue
|
678,088
|
|
692,067
|
|
(2
|
)%
|
|||||||
|
Segment expenses:
|
|
|
|||||||||||
|
Store operating expenses
|
414,097
|
|
423,214
|
|
(2
|
)%
|
|||||||
|
Depreciation and amortization
|
21,021
|
|
24,073
|
|
(13
|
)%
|
|||||||
|
Total segment expenses
|
435,118
|
|
447,287
|
|
(3
|
)%
|
|||||||
|
Segment pre-tax operating income
|
$
|
242,970
|
|
$
|
244,780
|
|
(1
|
)%
|
|||||
Retail Merchandise Sales Operations
U.S. retail merchandise sales decreased
1%
to
$709.6 million
during fiscal
2018
compared to
$717.5 million
for fiscal
2017
. Same-store retail sales decreased 2% during fiscal
2018
compared to fiscal
2017
. The decline in retail sales was primarily due to higher than normal retail sales in the later half of 2017 as a result of focused liquidation of excess and aged inventories in the Cash America stores. During fiscal
2018
, the gross profit margin on retail merchandise sales in the U.S. was
37%
compared to a margin of
35%
during fiscal
2017
, which resulted in a 4% increase in net revenue from retail sales in 2018 compared to 2017. The increase in retail sales margin was primarily driven by improvements in the legacy Cash America locations.
U.S. inventories decreased
8%
from
$216.7 million
at December 31,
2017
to
$200.0 million
at December 31,
2018
. The decrease was primarily a result of the strategic reductions in inventory levels in the Cash America stores. Inventories aged greater than one year in the U.S. at December 31,
2018
were 4% compared to 6% at December 31,
2017
.
Pawn Lending Operations
U.S. pawn loan fees decreased
2%
to
$373.4 million
during fiscal
2018
compared to
$380.6 million
for fiscal
2017
. Same-store pawn fees also decreased 2% during fiscal
2018
compared to fiscal
2017
. Pawn loan receivables as of December 31,
2018
decreased
2%
in total and 3% on a same-store basis compared to December 31,
2017
. The decline in same-store pawn receivables and pawn loan fees relates primarily to the ongoing adoption of FirstCash’s lending practices in the Cash America stores, including an increase in the percentage of direct purchases of goods from customers less likely to redeem a pawn loan.
43
Wholesale Scrap Jewelry Operations
U.S. wholesale scrap jewelry revenue, consisting primarily of gold sales, decreased
28%
to
$85.7 million
during fiscal
2018
compared to
$119.2 million
during fiscal
2017
. The decrease was primarily due to higher than normal jewelry scrapping activity in the later half of 2017 as a result of focused liquidation of excess and aged inventories in the Cash America stores. The scrap jewelry gross profit margin in the U.S. was
9%
compared to the prior-year margin of
6%
. Scrap jewelry profits accounted for
1%
of U.S. net revenue (gross profit) for both fiscal
2018
and
2017
.
Consumer Lending Operations
Service fees from U.S. consumer loans and credit services transactions (collectively, consumer lending operations) decreased
26%
to
$55.4 million
during fiscal
2018
compared to
$75.2 million
for fiscal
2017
due primarily to store closings described below and a 22% decrease in same-store revenues. Net revenue (gross profit) from U.S. consumer lending operations decreased
32%
to
$38.2 million
during fiscal
2018
compared to
$55.8 million
during fiscal
2017
. Revenue and gross profit from consumer lending operations accounted for
5%
and
6%
of total U.S. revenue and gross profit, respectively, during fiscal
2018
compared to
6%
and
8%
, respectively, during fiscal
2017
.
During fiscal
2018
, the Company closed 27 U.S. stand-alone consumer lending locations and discontinued offering consumer lending products in 45 U.S. pawnshops, which previously offered consumer loans and/or credit services as ancillary products. Included in the 27 U.S. store closures were eight California consumer lending stores the Company closed after selling their operating assets. As a result, the Company no longer has operations in California. The Company recorded an immaterial loss resulting from the sale and store closures, which includes the cost of terminating the remaining lease liabilities. The Company plans to continue strategically reducing its consumer lending operations in the future in light of increasing regulatory constraints and internet-based competition.
On April 26, 2019, the provisions of the Ohio Act become effective, which will significantly impact the consumer loan industry in Ohio and essentially eliminate the use of traditional single pay loans and the use of credit service organizations in Ohio. The Company continues to analyze the expected impact of the Ohio Act on its 119 stores located in Ohio, all of which offer consumer loan and credit services products. As a result of the anticipated impacts, the Company recorded a fixed asset impairment charge of approximately $1.5 million during the fourth quarter of 2018, which is included in administrative expenses on the consolidated statements of income. See “Item 1. Business—Government Regulation” for further discussion of the Ohio Act.
Segment Expenses and Segment Pre-Tax Operating Income
U.S. store operating expenses decreased
2%
to
$414.1 million
during fiscal
2018
compared to
$423.2 million
during fiscal
2017
, primarily due to continued efforts to integrate and optimize the Cash America store operations and a
1%
decrease in the U.S. weighted-average store count. Same-store operating expenses decreased 1% compared with the prior-year period.
U.S. store depreciation and amortization decreased
13%
to
$21.0 million
during fiscal
2018
compared to
$24.1 million
during fiscal
2017
, primarily due to a reduction in capital spending in Cash America stores compared to pre-Merger levels.
The U.S. segment pre-tax operating income for fiscal
2018
was
$243.0 million
, which generated a pre-tax segment operating margin of
20%
compared to
$244.8 million
and
19%
in the prior year, respectively. The increase in the segment pre-tax operating margin was primarily due to continued improvements in retail sales margins and reductions in store operating expenses and store depreciation and amortization.
44
Latin America Operations Segment
The Company’s management reviews and analyzes certain operating results in Latin America on a constant currency basis because the Company believes this better represents the Company’s underlying business trends. Constant currency results are non-GAAP financial measures, which exclude the effects of foreign currency translation and are calculated by translating current year results at prior year average exchange rates. The scrap jewelry generated in Latin America is sold and settled in U.S. dollars and therefore, wholesale scrap jewelry sales revenue is not affected by foreign currency translation. A small percentage of the operating and administrative expenses in Latin America are also billed and paid in U.S. dollars, which are not affected by foreign currency translation.
Latin American results of operations for fiscal
2018
compared to fiscal
2017
were impacted by a
2%
unfavorable change
in the average value of the Mexican peso compared to the U.S. dollar. The translated value of Latin American earning assets as of December 31,
2018
compared to December 31,
2017
was not materially impacted by foreign exchange rates.
The following table details earning assets, which consist of pawn loans, inventories and consumer loans, net, as well as other earning asset metrics of the Latin America operations segment as of December 31,
2018
as compared to December 31,
2017
(dollars in thousands, except as otherwise noted):
|
Constant Currency Basis
|
|||||||||||||||||||||
|
Balance at
|
|||||||||||||||||||||
|
December 31,
|
Increase /
|
||||||||||||||||||||
|
As of December 31,
|
Increase /
|
2018
|
(Decrease)
|
||||||||||||||||||
|
|
2018
|
2017
|
(Decrease)
|
(Non-GAAP)
|
(Non-GAAP)
|
||||||||||||||||
|
Latin America Operations Segment
|
|
|
|
|
|||||||||||||||||
|
Earning assets:
|
|||||||||||||||||||||
|
Pawn loans
|
$
|
91,357
|
|
$
|
68,178
|
|
34
|
%
|
$
|
91,285
|
|
34
|
%
|
||||||||
|
Inventories
|
75,152
|
|
60,032
|
|
25
|
%
|
75,069
|
|
25
|
%
|
|||||||||||
|
Consumer loans, net
(1)
|
—
|
|
343
|
|
(100
|
)%
|
—
|
|
(100
|
)%
|
|||||||||||
|
$
|
166,509
|
|
$
|
128,553
|
|
30
|
%
|
$
|
166,354
|
|
29
|
%
|
|||||||||
|
Average outstanding pawn loan amount (in ones)
|
$
|
68
|
|
$
|
64
|
|
6
|
%
|
$
|
68
|
|
6
|
%
|
||||||||
|
Composition of pawn collateral:
|
|||||||||||||||||||||
|
General merchandise
|
74
|
%
|
80
|
%
|
|||||||||||||||||
|
Jewelry
|
26
|
%
|
20
|
%
|
|||||||||||||||||
|
100
|
%
|
100
|
%
|
||||||||||||||||||
|
Composition of inventories:
|
|||||||||||||||||||||
|
General merchandise
|
68
|
%
|
75
|
%
|
|||||||||||||||||
|
Jewelry
|
32
|
%
|
25
|
%
|
|||||||||||||||||
|
100
|
%
|
100
|
%
|
||||||||||||||||||
|
Percentage of inventory aged greater than one year
|
1
|
%
|
1
|
%
|
|||||||||||||||||
|
(1)
|
Effective June 30, 2018, the Company no longer offers an unsecured consumer loan product in Latin America.
|
45
The following table presents segment pre-tax operating income of the Latin America operations segment for the fiscal year ended
December 31, 2018
as compared to the fiscal year ended
December 31, 2017
(dollars in thousands). Store operating expenses include salary and benefit expense of store-level employees, occupancy costs, bank charges, security, insurance, utilities, supplies and other costs incurred by the stores.
|
Constant Currency Basis
|
||||||||||||||||||||||
|
Year Ended
|
||||||||||||||||||||||
|
December 31,
|
Increase /
|
|||||||||||||||||||||
|
Year Ended December 31,
|
Increase /
|
2018
|
(Decrease)
|
|||||||||||||||||||
|
|
2018
|
2017
|
(Decrease)
|
(Non-GAAP)
|
(Non-GAAP)
|
|||||||||||||||||
|
Latin America Operations Segment
|
||||||||||||||||||||||
|
Revenue:
|
||||||||||||||||||||||
|
Retail merchandise sales
|
$
|
382,020
|
|
$
|
333,609
|
|
15
|
%
|
$
|
388,102
|
|
16
|
%
|
|||||||||
|
Pawn loan fees
|
151,740
|
|
130,309
|
|
16
|
%
|
154,144
|
|
18
|
%
|
||||||||||||
|
Wholesale scrap jewelry sales
|
22,103
|
|
21,645
|
|
2
|
%
|
22,103
|
|
2
|
%
|
||||||||||||
|
Consumer loan fees
|
860
|
|
1,767
|
|
(51
|
)%
|
874
|
|
(51
|
)%
|
||||||||||||
|
Total revenue
|
556,723
|
|
487,330
|
|
14
|
%
|
565,223
|
|
16
|
%
|
||||||||||||
|
Cost of revenue:
|
|
|
|
|||||||||||||||||||
|
Cost of retail merchandise sold
|
246,150
|
|
211,176
|
|
17
|
%
|
250,069
|
|
18
|
%
|
||||||||||||
|
Cost of wholesale scrap jewelry sold
|
21,656
|
|
20,327
|
|
7
|
%
|
21,998
|
|
8
|
%
|
||||||||||||
|
Consumer loan loss provision
|
238
|
|
388
|
|
(39
|
)%
|
242
|
|
(38
|
)%
|
||||||||||||
|
Total cost of revenue
|
268,044
|
|
231,891
|
|
16
|
%
|
272,309
|
|
17
|
%
|
||||||||||||
|
Net revenue
|
288,679
|
|
255,439
|
|
13
|
%
|
292,914
|
|
15
|
%
|
||||||||||||
|
Segment expenses:
|
|
|
|
|||||||||||||||||||
|
Store operating expenses
(1)
|
149,224
|
|
128,977
|
|
16
|
%
|
151,414
|
|
17
|
%
|
||||||||||||
|
Depreciation and amortization
|
11,333
|
|
10,311
|
|
10
|
%
|
11,499
|
|
12
|
%
|
||||||||||||
|
Total segment expenses
|
160,557
|
|
139,288
|
|
15
|
%
|
162,913
|
|
17
|
%
|
||||||||||||
|
Segment pre-tax operating income
|
$
|
128,122
|
|
$
|
116,151
|
|
10
|
%
|
$
|
130,001
|
|
12
|
%
|
|||||||||
|
(1)
|
The gain on foreign exchange for the Latin America operations segment of $0.3 million for fiscal 2017 was reclassified on the consolidated statements of income in order to conform with the presentation for the year ended December 31, 2018. The gain on foreign exchange was reclassified from store operating expenses and reported separately on the consolidated statements of income.
|
Retail Merchandise Sales Operations
Latin America retail merchandise sales increased
15%
(
16%
on a constant currency basis) to
$382.0 million
during fiscal
2018
compared to
$333.6 million
for fiscal
2017
. The increase was primarily due to revenue contributions from recent acquisition activity, new store openings and a 6% increase (8% on a constant currency basis) in same-store retail sales. The gross profit margin on retail merchandise sales was
36%
during fiscal
2018
compared to
37%
during fiscal
2017
. The decrease in retail margins was in large part the result of recent acquisitions of smaller format stores that have historically had lower retail margins.
Inventories in Latin America increased
25%
(also
25%
on a constant currency basis) from
$60.0 million
at December 31,
2017
to
$75.2 million
at December 31,
2018
. The increase was primarily due to the acquisition of 366 smaller format stores in Mexico during fiscal 2018, new store openings and the maturation of existing stores. Inventories aged greater than one year in Latin America were
1%
at both December 31,
2018
and
2017
.
46
Pawn Lending Operations
Pawn loan fees in Latin America increased
16%
(
18%
on a constant currency basis) totaling
$151.7 million
during fiscal
2018
compared to
$130.3 million
for fiscal
2017
, primarily as a result of the
34%
increase (also
34%
on a constant currency basis) in pawn loan receivables as of
December 31, 2018
compared to December 31,
2017
. The increase in pawn receivables was primarily driven by pawn loans acquired in the recent acquisitions, new store additions, a lower than normal seasonal repayment of pawn loan balances during December 2018 compared to December 2017 and a 7% increase (also 7% on a constant currency basis) in same-store pawn receivables.
Wholesale Scrap Jewelry Operations
Latin America wholesale scrap jewelry revenue, consisting primarily of gold sales, increased
2%
(also
2%
on a constant currency basis) to
$22.1 million
during fiscal
2018
compared to
$21.6 million
during fiscal
2017
. The scrap jewelry gross profit margin in Latin America was
2%
(flat on a constant currency basis) compared to the prior-year margin of
6%
. Scrap jewelry profits accounted for less than 1% of Latin America net revenue (gross profit) for fiscal
2018
and fiscal
2017
.
Consumer Lending Operations
The Company continues to strategically focus on its core pawn business and reduce its exposure to non-core unsecured lending products. Effective June 30, 2018, the Company ceased to offer unsecured consumer loan products in Mexico resulting in the closure of the 28 stand-alone consumer loan stores and the discontinuance of unsecured consumer loan products in the 49 pawn stores that previously offered unsecured consumer loans as an ancillary product.
Segment Expenses and Segment Pre-Tax Operating Income
Store operating expenses increased
16%
(
17%
on a constant currency basis) to
$149.2 million
during fiscal
2018
compared to
$129.0 million
during fiscal
2017
. Total store operating expenses increased primarily due to the
25%
increase in the Latin America weighted-average store count. Same-store operating expenses increased 3% (4% on a constant currency basis) compared to the prior-year period.
The segment pre-tax operating income for fiscal
2018
was
$128.1 million
, which generated a pre-tax segment operating margin of
23%
compared to
$116.2 million
and
24%
in the prior year, respectively. The decline in the pre-tax operating margin was, in part, the result of the recent smaller format store acquisitions that experienced lower margins during the integration.
47
Consolidated Results of Operations
The following table reconciles pre-tax operating income of the Company’s U.S. operations segment and Latin America operations segment discussed above to consolidated net income for the fiscal year ended
December 31, 2018
as compared to the fiscal year ended
December 31, 2017
(dollars in thousands):
|
Year Ended December 31,
|
Increase /
|
||||||||||||
|
|
2018
|
2017
|
(Decrease)
|
||||||||||
|
Consolidated Results of Operations
|
|||||||||||||
|
Segment pre-tax operating income:
|
|||||||||||||
|
U.S. operations segment pre-tax operating income
|
$
|
242,970
|
|
$
|
244,780
|
|
(1
|
)%
|
|||||
|
Latin America operations segment pre-tax operating income
(1)
|
128,122
|
|
116,151
|
|
10
|
%
|
|||||||
|
Consolidated segment pre-tax operating income
|
371,092
|
|
360,931
|
|
3
|
%
|
|||||||
|
Corporate expenses and other income:
|
|
|
|||||||||||
|
Administrative expenses
|
120,042
|
|
122,473
|
|
(2
|
)%
|
|||||||
|
Depreciation and amortization
|
10,607
|
|
20,849
|
|
(49
|
)%
|
|||||||
|
Interest expense
|
29,173
|
|
24,035
|
|
21
|
%
|
|||||||
|
Interest income
|
(2,444
|
)
|
(1,597
|
)
|
53
|
%
|
|||||||
|
Merger and other acquisition expenses
|
7,643
|
|
9,062
|
|
(16
|
)%
|
|||||||
|
(Gain) loss on foreign exchange
(1)
|
762
|
|
(317
|
)
|
340
|
%
|
|||||||
|
Loss on extinguishment of debt
|
—
|
|
14,114
|
|
(100
|
)%
|
|||||||
|
Total corporate expenses and other income
|
165,783
|
|
188,619
|
|
(12
|
)%
|
|||||||
|
Income before income taxes
|
205,309
|
|
172,312
|
|
19
|
%
|
|||||||
|
Provision for income taxes
|
52,103
|
|
28,420
|
|
83
|
%
|
|||||||
|
|
|
||||||||||||
|
Net income
|
$
|
153,206
|
|
$
|
143,892
|
|
6
|
%
|
|||||
|
(1)
|
The gain on foreign exchange for the Latin America operations segment of $0.3 million for fiscal 2017 was reclassified on the consolidated statements of income in order to conform with the presentation for the year ended December 31, 2018. The gain on foreign exchange was reclassified from store operating expenses and reported separately on the consolidated statements of income.
|
Corporate Expenses and Taxes
Administrative expenses
decreased
2%
to
$120.0 million
during fiscal
2018
compared to
$122.5 million
during fiscal
2017
, as administrative synergies realized from the Merger and a
2%
unfavorable change
in the average value of the Mexican peso were partially offset by an
11%
increase in the consolidated weighted-average store count, resulting in additional management and supervisory compensation and other support expenses required for such growth. Administrative expenses were
7%
of revenue during fiscal
2018
and
2017
.
Corporate depreciation and amortization decreased to
$10.6 million
during fiscal
2018
compared to
$20.8 million
during fiscal
2017
, primarily due to the realization of depreciation and amortization synergies from the Merger and a reduction in capital spending compared to pre-Merger levels.
Interest expense increased to
$29.2 million
during fiscal
2018
compared to
$24.0 million
for fiscal
2017
, primarily due to increased average balances outstanding and increased interest rates on the Company’s unsecured credit facility. See “Liquidity and Capital Resources.”
48
Merger and other acquisition expenses decreased to
$7.6 million
during fiscal
2018
compared to
$9.1 million
during fiscal
2017
due to merger and acquisition activity. See “Non-GAAP Financial Information” for additional details of merger and other acquisition expenses.
During fiscal 2017, the Company repurchased through a tender offer, or otherwise redeemed, its previously outstanding $200 million, 6.75% senior unsecured notes due 2021, incurring a loss on extinguishment of debt of
$14.1 million
.
For fiscal
2018
and
2017
, the Company’s consolidated effective income tax rates were
25.4%
and
16.5%
, respectively. The Tax Act, which was enacted in December 2017, impacted the Company by, among other things, reducing its U.S. corporate income tax rate from
35%
to
21%
starting in 2018. Also as a result of the Tax Act, the Company recorded a provisional net income tax benefit of $27.3 million during fiscal 2017. During fiscal 2018, the Company finalized certain estimates and tax positions used in the analysis of the provisional net income tax benefit and recorded an additional $1.5 million income tax benefit. Excluding these non-recurring tax benefits, the effective income tax rate for fiscal 2018 and 2017 was 26.1% and 32.3%, respectively. The decrease in the 2018 adjusted effective tax rate as compared to the adjusted fiscal 2017 effective tax rate was primarily due to the reduced U.S. corporate income tax rate in 2018 compared to 2017. See Note
11
of Notes to Consolidated Financial Statements.
Net Income, Adjusted Net Income, Diluted Earnings Per Share and Adjusted Diluted Earnings Per Share
The following table sets forth revenue, net revenue, net income, diluted earnings per share, adjusted net income and adjusted diluted earnings per share for the fiscal year ended December 31,
2018
as compared to the fiscal year ended December 31,
2017
(in thousands, except per share amounts):
|
|
Year Ended December 31,
|
|||||||||||||||
|
2018
|
2017
|
|||||||||||||||
|
As Reported
|
Adjusted
|
As Reported
|
Adjusted
|
|||||||||||||
|
(GAAP)
|
(Non-GAAP)
|
(GAAP)
|
(Non-GAAP)
|
|||||||||||||
|
Revenue
|
$
|
1,780,858
|
|
$
|
1,780,858
|
|
$
|
1,779,822
|
|
$
|
1,779,822
|
|
||||
|
Net revenue
|
$
|
966,767
|
|
$
|
966,767
|
|
$
|
947,506
|
|
$
|
947,506
|
|
||||
|
Net income
|
$
|
153,206
|
|
$
|
158,290
|
|
$
|
143,892
|
|
$
|
131,225
|
|
||||
|
Diluted earnings per share
|
$
|
3.41
|
|
$
|
3.53
|
|
$
|
3.00
|
|
$
|
2.74
|
|
||||
|
Weighted-average diluted shares
|
44,884
|
|
44,884
|
|
47,888
|
|
47,888
|
|
||||||||
Adjusted net income removes certain items from GAAP net income that the Company does not consider to be representative of its actual operating performance, such as the income tax benefits as a result of the Tax Act, certain merger, acquisition and consumer lending impairment expenses and debt extinguishment costs, but does not adjust for the effects of foreign currency rate fluctuations. See “Non-GAAP Financial Information—Adjusted Net Income and Adjusted Diluted Earnings Per Share” below.
49
Operating Results for the Twelve Months Ended December 31,
2017
Compared to the Twelve Months Ended December 31,
2016
On September 1, 2016, the Company completed the Merger with Cash America. The following results of operations for the year ended December 31, 2016 includes the results of operations for Cash America for the period September 2, 2016 to December 31, 2016, thereby affecting comparability to fiscal 2017 amounts, which include the results of operations for Cash America for the full respective period.
U.S. Operations Segment
Unless otherwise noted, same-store calculations exclude the results of the merged Cash America stores. Legacy Cash America same-store calculations refer to Cash America stores that were opened prior to the beginning of the prior-year comparative fiscal period (although not then owned by the Company) and remained open through the end of the reporting period.
The following table details earning assets, which consist of pawn loans, inventories and consumer loans, net, as well as other earning asset metrics of the U.S. operations segment as of December 31,
2017
as compared to December 31,
2016
(dollars in thousands, except as otherwise noted):
|
As of December 31,
|
Increase /
|
|||||||||||
|
|
2017
|
2016
|
(Decrease)
|
|||||||||
|
U.S. Operations Segment
|
|
|
|
|||||||||
|
Earning assets:
|
||||||||||||
|
Pawn loans
|
$
|
276,570
|
|
$
|
293,392
|
|
(6
|
)%
|
||||
|
Inventories
|
216,739
|
|
282,860
|
|
(23
|
)%
|
||||||
|
Consumer loans, net
(1)
|
23,179
|
|
28,847
|
|
(20
|
)%
|
||||||
|
$
|
516,488
|
|
$
|
605,099
|
|
(15
|
)%
|
|||||
|
Average outstanding pawn loan amount (in ones)
|
$
|
162
|
|
$
|
152
|
|
7
|
%
|
||||
|
Composition of pawn collateral:
|
||||||||||||
|
General merchandise
|
34
|
%
|
36
|
%
|
||||||||
|
Jewelry
|
66
|
%
|
64
|
%
|
||||||||
|
100
|
%
|
100
|
%
|
|||||||||
|
Composition of inventories:
|
||||||||||||
|
General merchandise
|
42
|
%
|
47
|
%
|
||||||||
|
Jewelry
|
58
|
%
|
53
|
%
|
||||||||
|
100
|
%
|
100
|
%
|
|||||||||
|
Percentage of inventory aged greater than one year
|
6
|
%
|
11
|
%
|
||||||||
|
(1)
|
Does not include the off-balance sheet principal portion of active extensions of credit made by independent third-party lenders, which are guaranteed by the Company through its CSO Programs. These amounts, net of the Company’s estimated fair value of its liability for guaranteeing the extensions of credit, totaled $9.3 million and $12.1 million as of December 31, 2017 and 2016, respectively.
|
50
The following table presents segment pre-tax operating income of the U.S. operations segment for the fiscal year ended
December 31, 2017
as compared to the fiscal year ended
December 31, 2016
(dollars in thousands). Store operating expenses include salary and benefit expense of store-level employees, occupancy costs, bank charges, security, insurance, utilities, supplies and other costs incurred by the stores.
|
Year Ended December 31,
|
|||||||||||||
|
2017
|
2016
|
Increase
|
|||||||||||
|
U.S. Operations Segment
|
|||||||||||||
|
Revenue:
|
|
|
|
|
|||||||||
|
Retail merchandise sales
|
$
|
717,490
|
|
$
|
386,026
|
|
86
|
%
|
|
||||
|
Pawn loan fees
|
380,596
|
|
195,883
|
|
94
|
%
|
|
||||||
|
Wholesale scrap jewelry sales
|
119,197
|
|
47,680
|
|
150
|
%
|
|||||||
|
Consumer loan and credit services fees
|
75,209
|
|
41,922
|
|
79
|
%
|
|
||||||
|
Total revenue
|
1,292,492
|
|
671,511
|
|
92
|
%
|
|
||||||
|
Cost of revenue:
|
|||||||||||||
|
Cost of retail merchandise sold
|
468,527
|
|
241,086
|
|
94
|
%
|
|||||||
|
Cost of wholesale scrap jewelry sold
|
112,467
|
|
41,357
|
|
172
|
%
|
|||||||
|
Consumer loan and credit services loss provision
|
19,431
|
|
11,494
|
|
69
|
%
|
|||||||
|
Total cost of revenue
|
600,425
|
|
293,937
|
|
104
|
%
|
|||||||
|
Net revenue
|
692,067
|
|
377,574
|
|
83
|
%
|
|||||||
|
Segment expenses:
|
|
|
|||||||||||
|
Store operating expenses
|
423,214
|
|
215,227
|
|
97
|
%
|
|||||||
|
Depreciation and amortization
|
24,073
|
|
13,618
|
|
77
|
%
|
|||||||
|
Total segment expenses
|
447,287
|
|
228,845
|
|
95
|
%
|
|||||||
|
Segment pre-tax operating income
|
$
|
244,780
|
|
$
|
148,729
|
|
65
|
%
|
|||||
Retail Merchandise Sales Operations
U.S. retail merchandise sales increased 86% to $717.5 million during fiscal 2017 compared to $386.0 million for fiscal 2016. The increase was primarily due to fiscal 2016 only including the results of operations for Cash America for the period September 2, 2016 to December 31, 2016 (“Cash America 2016 Partial Period”), as the Merger was completed on September 1, 2016. Same-store retail sales decreased 1% in legacy First Cash stores and decreased 4% in legacy Cash America stores during fiscal 2017 compared to fiscal 2016. Gross profit margin on retail merchandise sales in the U.S. was 35% during fiscal 2017 compared to a margin of 38% during fiscal 2016, reflecting the impact of historically lower margins in the Cash America stores and a focus during 2017 on liquidating aged inventory items in the Cash America stores.
U.S. inventories decreased 23% from $282.9 million at December 31, 2016 to $216.7 million at December 31, 2017. The decrease
was primarily a result of focused liquidation of aged inventories though promotional discounts and jewelry scrapping. Inventories aged greater than one year in the U.S. were 6% overall and 7% and 5% in the legacy Cash America stores and legacy First Cash U.S. stores, respectively.
51
Pawn Lending Operations
U.S. pawn loan fees increased 94% totaling $380.6 million during fiscal 2017 compared to $195.9 million for fiscal 2016. The increase was primarily due to the Cash America 2016 Partial Period. Legacy First Cash same-store pawn loan fees increased 4%, while legacy Cash America same-store pawn loan fees decreased 9% during fiscal 2017 compared to fiscal 2016. Pawn loan receivables in the U.S. as of December 31, 2017 decreased 6% compared to December 31, 2016 and decreased 7% on a same-store basis. Legacy First Cash same-store pawn receivables increased 6%, while legacy Cash America same-store pawn receivables decreased 10% as of December 31, 2017 compared to December 31, 2016. The decline in legacy Cash America same-store pawn receivables and pawn loan fees was primarily due to the expected impact of reducing the holding period on delinquent pawn loans, optimizing loan-to-value ratios and to a lesser extent, the impact of Hurricane Harvey on pawn receivables in coastal Texas markets.
Wholesale Scrap Jewelry Operations
U.S. wholesale scrap jewelry revenue, consisting primarily of gold sales, increased 150% to $119.2 million during fiscal 2017 compared to $47.7 million during fiscal 2016. The increase in wholesale scrap jewelry revenue was primarily due to the Cash America 2016 Partial Period and an increase in volume due to the clearing of aged inventory in the Cash America stores. The scrap jewelry gross profit margin in the U.S. was 6% compared to the prior-year margin of 13%, primarily as a result of the typically higher cost basis in scrap jewelry sold by the Cash America stores. Scrap jewelry profits accounted for 1% of U.S. net revenue (gross profit) for fiscal 2017 compared to 2% in fiscal 2016, and is considered a non-core revenue stream of the Company.
Consumer Lending Operations
Service fees from U.S. consumer loans and credit services transactions (collectively, consumer lending operations) increased 79% to $75.2 million during fiscal 2017 compared to $41.9 million for fiscal 2016. The increase in fees was due to the Cash America 2016 Partial Period. Excluding the increase due to the Cash America 2016 Partial Period, consumer loan and credit services fees decreased 31% as the Company continues to de-emphasize consumer lending operations in light of increasing internet-based competition and regulatory constraints. Revenues from consumer lending operations comprised 6% of total U.S. revenue during fiscal 2017 and 2016.
Segment Expenses and Segment Pre-Tax Operating Income
U.S. store operating expenses increased 97% to $423.2 million during fiscal 2017 compared to $215.2 million during fiscal 2016, primarily as a result of the Merger. Same-store operating expenses increased 2% and decreased 3% in the legacy First Cash and Cash America stores, respectively, compared with the prior-year period.
U.S. store depreciation and amortization increased 77% to $24.1 million during fiscal 2017 compared to $13.6 million during fiscal 2016, primarily as a result of the Merger.
The U.S. segment pre-tax operating income for fiscal 2017 was $244.8 million, which generated a pre-tax segment operating margin of 19% compared to $148.7 million and 22% in the prior year, respectively. The decline in the segment pre-tax operating margin was primarily due to historically lower operating margins in the Cash America stores and a focus during 2017 on liquidating aged inventory levels in Cash America stores, resulting in lower gross profit margins on retail merchandise sales.
52
Latin America Operations Segment
Latin American results of operations for fiscal 2017 compared to fiscal 2016 were impacted by a 1% unfavorable change in the average value of the Mexican peso compared to the U.S. dollar. The translated value of Latin American earning assets as of December 31, 2017 compared to December 31, 2016 also were impacted by a 5% favorable change in the end-of-period value of the Mexican peso compared to the U.S. dollar.
The following table details earning assets, which consist of pawn loans, inventories and consumer loans, net, as well as other earning asset metrics of the Latin America operations segment as of December 31,
2017
as compared to December 31,
2016
(dollars in thousands, except as otherwise noted):
|
Constant Currency Basis
|
|||||||||||||||||||||
|
Balance at
|
|||||||||||||||||||||
|
December 31,
|
Increase /
|
||||||||||||||||||||
|
As of December 31,
|
Increase /
|
2017
|
(Decrease)
|
||||||||||||||||||
|
|
2017
|
2016
|
(Decrease)
|
(Non-GAAP)
|
(Non-GAAP)
|
||||||||||||||||
|
Latin America Operations Segment
|
|
|
|
|
|||||||||||||||||
|
Earning assets:
|
|||||||||||||||||||||
|
Pawn loans
|
$
|
68,178
|
|
$
|
57,114
|
|
19
|
%
|
$
|
65,238
|
|
14
|
%
|
||||||||
|
Inventories
|
60,032
|
|
47,823
|
|
26
|
%
|
57,400
|
|
20
|
%
|
|||||||||||
|
Consumer loans, net
|
343
|
|
357
|
|
(4
|
)%
|
328
|
|
(8
|
)%
|
|||||||||||
|
$
|
128,553
|
|
$
|
105,294
|
|
22
|
%
|
$
|
122,966
|
|
17
|
%
|
|||||||||
|
Average outstanding pawn loan amount (in ones)
|
$
|
64
|
|
$
|
58
|
|
10
|
%
|
$
|
61
|
|
5
|
%
|
||||||||
|
Composition of pawn collateral:
|
|||||||||||||||||||||
|
General merchandise
|
80
|
%
|
80
|
%
|
|||||||||||||||||
|
Jewelry
|
20
|
%
|
20
|
%
|
|||||||||||||||||
|
100
|
%
|
100
|
%
|
||||||||||||||||||
|
Composition of inventories:
|
|||||||||||||||||||||
|
General merchandise
|
75
|
%
|
76
|
%
|
|||||||||||||||||
|
Jewelry
|
25
|
%
|
24
|
%
|
|||||||||||||||||
|
100
|
%
|
100
|
%
|
||||||||||||||||||
|
Percentage of inventory aged greater than one year
|
1
|
%
|
1
|
%
|
|||||||||||||||||
53
The following table presents segment pre-tax operating income of the Latin America operations segment for the fiscal year ended
December 31, 2017
as compared to the fiscal year ended
December 31, 2016
(dollars in thousands). Store operating expenses include salary and benefit expense of store-level employees, occupancy costs, bank charges, security, insurance, utilities, supplies and other costs incurred by the stores.
|
Constant Currency Basis
|
||||||||||||||||||||||
|
Year Ended
|
||||||||||||||||||||||
|
December 31,
|
Increase /
|
|||||||||||||||||||||
|
Year Ended December 31,
|
Increase /
|
2017
|
Decrease
|
|||||||||||||||||||
|
|
2017
|
2016
|
(Decrease)
|
(Non-GAAP)
|
(Non-GAAP)
|
|||||||||||||||||
|
Latin America Operations Segment
|
||||||||||||||||||||||
|
Revenue:
|
|
|
|
|
||||||||||||||||||
|
Retail merchandise sales
|
$
|
333,609
|
|
$
|
283,105
|
|
18
|
%
|
$
|
338,009
|
|
19
|
%
|
|||||||||
|
Pawn loan fees
|
130,309
|
|
116,874
|
|
11
|
%
|
131,972
|
|
13
|
%
|
||||||||||||
|
Wholesale scrap jewelry sales
|
21,645
|
|
14,958
|
|
45
|
%
|
21,645
|
|
45
|
%
|
||||||||||||
|
Consumer loan fees
|
1,767
|
|
1,929
|
|
(8
|
)%
|
1,793
|
|
(7
|
)%
|
||||||||||||
|
Total revenue
|
487,330
|
|
416,866
|
|
17
|
%
|
493,419
|
|
18
|
%
|
||||||||||||
|
Cost of revenue:
|
||||||||||||||||||||||
|
Cost of retail merchandise sold
|
211,176
|
|
177,470
|
|
19
|
%
|
213,925
|
|
21
|
%
|
||||||||||||
|
Cost of wholesale scrap jewelry sold
|
20,327
|
|
11,668
|
|
74
|
%
|
20,568
|
|
76
|
%
|
||||||||||||
|
Consumer loan loss provision
|
388
|
|
499
|
|
(22
|
)%
|
394
|
|
(21
|
)%
|
||||||||||||
|
Total cost of revenue
|
231,891
|
|
189,637
|
|
22
|
%
|
234,887
|
|
24
|
%
|
||||||||||||
|
|
||||||||||||||||||||||
|
Net revenue
|
255,439
|
|
227,229
|
|
12
|
%
|
258,532
|
|
14
|
%
|
||||||||||||
|
|
||||||||||||||||||||||
|
Segment expenses:
|
|
|
|
|
||||||||||||||||||
|
Store operating expenses
(1)
|
128,977
|
|
111,835
|
|
15
|
%
|
130,472
|
|
17
|
%
|
||||||||||||
|
Depreciation and amortization
|
10,311
|
|
10,429
|
|
(1
|
)%
|
10,432
|
|
—
|
%
|
||||||||||||
|
Total segment expenses
|
139,288
|
|
122,264
|
|
14
|
%
|
140,904
|
|
15
|
%
|
||||||||||||
|
|
|
|||||||||||||||||||||
|
Segment pre-tax operating income
|
$
|
116,151
|
|
$
|
104,965
|
|
11
|
%
|
$
|
117,628
|
|
12
|
%
|
|||||||||
|
(1)
|
The (gain) loss on foreign exchange for the Latin America operations segment of ($0.3) million and $1.0 million for fiscal 2017 and 2016, respectively, was reclassified on the consolidated statements of income in order to conform with the presentation for the year ended December 31, 2018. The (gain) loss on foreign exchange was reclassified from store operating expenses and reported separately on the consolidated statements of income.
|
Retail Merchandise Sales Operations
Latin America retail merchandise sales increased 18% (19% on a constant currency basis) to $333.6 million during fiscal 2017 compared to $283.1 million for fiscal 2016. The increase was primarily due to an 11% increase (12% on a constant currency basis) in same-store retail sales driven by strong retail demand trends, a 47% increase (50% on a constant currency basis) in retail sales in the 166 Maxi Prenda stores located in Mexico (acquired on January 6, 2016 and therefore not included in the same-store figure above) driven by operating synergies as a result of the utilization of the Company’s proprietary IT platform and best practice retailing strategies, and the maturation of existing stores. The gross profit margin on retail merchandise sales was 37% during fiscal 2017 and 2016.
Inventories in Latin America increased 26% (20% on a constant currency basis) from $47.8 million at December 31, 2016 to $60.0 million at December 31, 2017. Increased inventory levels in the Maxi Prenda stores, which historically carried lower inventory balances than the typical First Cash store, accounted for 22% of the increase with growth from new store openings and the maturation of existing stores accounting for the remainder of the increase.
54
Pawn Lending Operations
Pawn loan fees in Latin America increased 11% (13% on a constant currency basis) totaling $130.3 million during fiscal 2017 compared to $116.9 million for fiscal 2016 as a result of the 19% increase (14% on a constant currency basis) in pawn loan receivables as of December 31, 2017 compared to December 31, 2016. The increase in pawn receivables reflects a same-store pawn receivable increase of 17% (12% on a constant currency basis) and new store additions. The increase in same-store pawn receivables was primarily due to strong demand for pawn loans and the maturation of existing stores.
Wholesale Scrap Jewelry Operations
Latin America wholesale scrap jewelry revenue, consisting primarily of gold sales, increased 45% (also 45% on a constant currency basis) to $21.6 million during fiscal 2017 compared to $15.0 million during fiscal 2016. The increase in wholesale scrap jewelry revenue was primarily due to a reduced volume of scrapping activities in the Maxi Prenda stores during fiscal 2016 as those stores were being converted to the Company’s proprietary point of sale and loan management system. The scrap gross profit margin in Latin America was 6% (5% on a constant currency basis) compared to the prior-year margin of 22%. The 22% scrap gross profit margin in fiscal 2016 was unusually high due to the 18% decline in the average value of the Mexican peso that year, which effectively lowered the cost of the scrap jewelry (scrap is sold in U.S. dollars but sourced in Mexican pesos). Scrap jewelry profits accounted for approximately 1% of Latin America net revenue (gross profit) for fiscal 2017 and fiscal 2016, and is considered a non-core revenue stream of the Company.
Segment Expenses and Segment Pre-Tax Operating Income
Store operating expenses increased 15% (17% on a constant currency basis) to $129.0 million during fiscal 2017 compared to $111.8 million during fiscal 2016 and same-store operating expenses increased 6% (increased 7% on a constant currency basis) compared to the prior-year period. The increase in both total and same-store operating expenses was due in large part to increased compensation expense related to incentive pay and wage inflation.
The segment pre-tax operating income for fiscal 2017 was $116.2 million, which generated a pre-tax segment operating margin of 24% compared to $105.0 million and 25% in the prior year, respectively.
55
Consolidated Results of Operations
The following table reconciles pre-tax operating income of the Company’s U.S. operations segment and Latin America operations segment discussed above to consolidated net income for the fiscal year ended
December 31, 2017
as compared to the fiscal year ended
December 31, 2016
(dollars in thousands):
|
Year Ended December 31,
|
Increase /
|
||||||||||||
|
|
2017
|
2016
|
(Decrease)
|
||||||||||
|
Consolidated Results of Operations
|
|||||||||||||
|
Segment pre-tax operating income:
|
|||||||||||||
|
U.S. operations segment pre-tax operating income
|
$
|
244,780
|
|
$
|
148,729
|
|
65
|
%
|
|||||
|
Latin America operations segment pre-tax operating income
(1)
|
116,151
|
|
104,965
|
|
11
|
%
|
|||||||
|
Consolidated segment pre-tax operating income
|
360,931
|
|
253,694
|
|
42
|
%
|
|||||||
|
Corporate expenses and other income:
|
|
|
|||||||||||
|
Administrative expenses
|
122,473
|
|
96,537
|
|
27
|
%
|
|||||||
|
Depreciation and amortization
|
20,849
|
|
7,818
|
|
167
|
%
|
|||||||
|
Interest expense
|
24,035
|
|
20,320
|
|
18
|
%
|
|||||||
|
Interest income
|
(1,597
|
)
|
(751
|
)
|
113
|
%
|
|||||||
|
Merger and other acquisition expenses
|
9,062
|
|
36,670
|
|
(75
|
)%
|
|||||||
|
(Gain) loss on foreign exchange
(1)
|
(317
|
)
|
952
|
|
(133
|
)%
|
|||||||
|
Loss on extinguishment of debt
|
14,114
|
|
—
|
|
—
|
%
|
|||||||
|
Net gain on sale of common stock of Enova
|
—
|
|
(1,299
|
)
|
(100
|
)%
|
|||||||
|
Total corporate expenses and other income
|
188,619
|
|
160,247
|
|
18
|
%
|
|||||||
|
Income before income taxes
|
172,312
|
|
93,447
|
|
84
|
%
|
|||||||
|
Provision for income taxes
|
28,420
|
|
33,320
|
|
(15
|
)%
|
|||||||
|
|
|
||||||||||||
|
Net income
|
$
|
143,892
|
|
$
|
60,127
|
|
139
|
%
|
|||||
|
(1)
|
The (gain) loss on foreign exchange for the Latin America operations segment of ($0.3) million and $1.0 million for fiscal 2017 and 2016, respectively, was reclassified on the consolidated statements of income in order to conform with the presentation for the year ended December 31, 2018. The (gain) loss on foreign exchange was reclassified from store operating expenses and reported separately on the consolidated statements of income.
|
Corporate Expenses and Taxes
Administrative expenses increased 27% to $122.5 million during fiscal 2017 compared to $96.5 million during fiscal 2016, primarily as a result of the Merger and a 36% increase in the weighted-average store count resulting in additional management and supervisory compensation and other support expenses required for such growth. As a percentage of revenue, administrative expenses decreased from 9% during fiscal 2016 to 7% during fiscal 2017, primarily due to synergies realized from the Merger and the Maxi Prenda acquisition.
Corporate depreciation and amortization increased to $20.8 million during fiscal 2017 compared to $7.8 million during fiscal 2016, primarily due to the assumption of $118.2 million in property and equipment and $23.4 million in intangible assets subject to amortization as a result of the Merger, which were depreciated and amortized during all of fiscal 2017 as compared to the period September 2, 2016 to December 31, 2016 during fiscal 2016.
Interest expense increased to $24.0 million during fiscal 2017 compared to $20.3 million for fiscal 2016. See “Liquidity and Capital Resources.”
56
Merger and other acquisition expenses decreased to $9.1 million during fiscal 2017 compared to $36.7 million during fiscal 2016, reflecting the timing of transaction and integration costs related to the Merger. See “Non-GAAP Financial Information” for additional details of merger and other acquisition expenses.
During fiscal 2017, the Company repurchased through a tender offer, or otherwise redeemed, its previously outstanding $200 million, 6.75% senior unsecured notes due 2021, incurring a loss on extinguishment of debt of $14.1 million.
The Company’s effective income tax rate for fiscal 2017 was 16.5%, primarily a result of the passage of the Tax Act in fiscal 2017, as the Company recorded a provisional net one-time tax benefit of $27.3 million during the fourth quarter of 2017. Excluding the tax benefit realized as a result of the Tax Act, the effective income tax rate for fiscal 2017 was 32.3% compared to 35.7% for fiscal 2016. The decrease in the adjusted fiscal 2017 effective tax rate as compared to the 2016 effective tax rate was primarily due to an increase in certain foreign permanent tax benefits and certain significant Merger related expenses being non-deductible for income tax purposes during fiscal 2016, which increased the 2016 effective tax rate.
Net Income, Adjusted Net Income, Diluted Earnings Per Share and Adjusted Diluted Earnings Per Share
The following table sets forth revenue, net revenue, net income, diluted earnings per share, adjusted net income and adjusted diluted earnings per share for the fiscal year ended December 31,
2017
as compared to the fiscal year ended December 31,
2016
(in thousands, except per share amounts):
|
|
Year Ended December 31,
|
|||||||||||||||
|
2017
|
2016
|
|||||||||||||||
|
As Reported
|
Adjusted
|
As Reported
|
Adjusted
|
|||||||||||||
|
(GAAP)
|
(Non-GAAP)
|
(GAAP)
|
(Non-GAAP)
|
|||||||||||||
|
Revenue
|
$
|
1,779,822
|
|
$
|
1,779,822
|
|
$
|
1,088,377
|
|
$
|
1,088,377
|
|
||||
|
Net revenue
|
$
|
947,506
|
|
$
|
947,506
|
|
$
|
604,803
|
|
$
|
604,803
|
|
||||
|
Net income
|
$
|
143,892
|
|
$
|
131,225
|
|
$
|
60,127
|
|
$
|
85,332
|
|
||||
|
Diluted earnings per share
|
$
|
3.00
|
|
$
|
2.74
|
|
$
|
1.72
|
|
$
|
2.44
|
|
||||
|
Weighted-average diluted shares
|
47,888
|
|
47,888
|
|
35,004
|
|
35,004
|
|
||||||||
Adjusted net income removes certain items from GAAP net income that the Company does not consider to be representative of its actual operating performance, such as the non-recurring net tax benefit from the Tax Act, debt extinguishment costs and merger and other acquisition expenses, but does not adjust for the effects of foreign currency rate fluctuations. See “Non-GAAP Financial Information—Adjusted Net Income and Adjusted Diluted Earnings Per Share” below.
57
Liquidity and Capital Resources
As of
December 31, 2018
, the Company’s primary sources of liquidity were
$71.8 million
in cash and cash equivalents,
$126.8 million
of available and unused funds under the Company's revolving unsecured credit facility,
$424.3 million
in customer loans and fees and service charges receivable and
$275.1 million
in inventories. As of
December 31, 2018
, the amount of cash associated with indefinitely reinvested foreign earnings was
$28.2 million
, which is primarily held in Mexican pesos. The Company had working capital of
$656.8 million
as of
December 31, 2018
and total equity exceeded liabilities by a ratio of
1.7
to 1.
During the period from January 1, 2018 through October 4, 2018, the Company maintained an unsecured line of credit with a group of U.S. based commercial lenders (the “Credit Facility”) in the amount of $400.0 million, which was scheduled to mature in September 2022. The Credit Facility charged interest, at the Company’s option, at either (1) the prevailing London Interbank Offered Rate (“LIBOR”) (with interest periods of 1 week or 1, 2, 3 or 6 months at the Company’s option) plus a fixed spread of
2.5%
or (2) the prevailing prime or base rate plus a fixed spread of
1.5%
.
On October 4, 2018, the Company amended and extended the Credit Facility. The total lender commitment under the amended facility increased from $400.0 million to
$425.0 million
and the term was extended to
October 4, 2023
. Certain financial covenants in the facility were amended, including an increase to the permitted consolidated leverage ratio from 2.75 to 3.0 times EBITDA adjusted for certain items as defined in the Credit Facility and an increase to the permitted domestic leverage ratio from 3.5 to 4.0 times domestic EBITDA adjusted for certain items as defined in the Credit Facility.
At
December 31, 2018
, the Company had
$295.0 million
in outstanding borrowings and
$3.2 million
in outstanding letters of credit under the Credit Facility, leaving
$126.8 million
available for future borrowings. The Credit Facility remains unsecured and continues to bear interest, at the Company’s option, at either (1) the prevailing LIBOR (with interest periods of 1 week or 1, 2, 3 or 6 months at the Company’s option) plus a fixed spread of
2.5%
or (2) the prevailing prime or base rate plus a fixed spread of
1.5%
. The agreement has a LIBOR floor of
0%
. Additionally, the Company is required to pay an annual commitment fee of
0.50%
on the average daily unused portion of the Credit Facility commitment. The weighted-average interest rate on amounts outstanding under the Credit Facility at
December 31, 2018
was
4.94%
based on 1 week LIBOR. Under the terms of the Credit Facility, the Company is required to maintain certain financial ratios and comply with certain financial covenants. The Credit Facility also contains customary restrictions on the Company’s ability to incur additional debt, grant liens, make investments, consummate acquisitions and similar negative covenants with customary carve-outs and baskets. The Company was in compliance with the covenants of the Credit Facility as of
December 31, 2018
, and believes it has the capacity to borrow a substantial portion of the amount available under the Credit Facility under the most restrictive covenant. During fiscal
2018
, the Company
received net proceeds
of
$188.0 million
from borrowings pursuant to
the Credit Facility.
On May 30, 2017, the Company issued $300.0 million of 5.375% senior unsecured notes due on June 1, 2024 (the “Notes”), all of which are currently outstanding. Interest on the Notes is payable semi-annually in arrears on June 1 and December 1. The Notes are fully and unconditionally guaranteed on a senior unsecured basis jointly and severally by all of the Company's existing and future domestic subsidiaries that guarantee its Credit Facility. The Notes will permit the Company to make restricted payments, such as purchasing shares of its stock and paying cash dividends, in an unlimited amount if, after giving pro forma effect to the incurrence of any indebtedness to make such payment, the Company's consolidated total debt ratio (“Net Debt Ratio”) is less than 2.25 to 1. The Net Debt Ratio is defined generally in the indenture governing the Notes as the ratio of (1) the total consolidated debt of the Company minus cash and cash equivalents of the Company to (2) the Company’s consolidated trailing twelve months EBITDA, as adjusted to exclude certain non-recurring expenses and giving pro forma effect to operations acquired during the measurement period. As of
December 31, 2018
, the Net Debt Ratio was
1.8
to 1; see the table below for additional information on the calculation of the Net Debt Ratio.
The Company used the proceeds from the Notes to repurchase, or otherwise redeem, its previously outstanding $200.0 million, 6.75% senior unsecured notes due 2021 (the “2021 Notes”). As a result, during fiscal 2017, the Company recognized a $14.1 million loss on extinguishment of debt related to the repurchase or redemption of the 2021 Notes.
In general, revenue growth is dependent upon the Company’s ability to fund the addition of store locations (both de novo openings and acquisitions) and growth in customer loan balances and inventories. In addition to these factors, changes in loan balances, collection of pawn fees, merchandise sales, inventory levels, seasonality, operating expenses, administrative expenses, expenses related to merger and acquisition activities, tax rates, gold prices, foreign currency exchange rates and the pace of new store expansions and acquisitions, affect the Company’s liquidity. Management believes cash on hand, the borrowings available under its Credit Facility, anticipated cash generated from operations (including the normal seasonal increases in operating cash flows occurring in the first and fourth quarters) and other current working capital will be sufficient to meet the Company’s anticipated capital requirements for its business for at least the next twelve months. Where appropriate or desirable, in connection with the Company’s efficient management of its liquidity position, the Company could seek to raise additional funds from a variety of
58
sources, including the sale of assets, reductions in capital spending, the issuance of debt or equity securities and/or changes to its management of current assets. The characteristics of the Company’s current assets, specifically the ability to rapidly liquidate gold jewelry inventory and adjust outflows of cash in its lending practices, gives the Company flexibility to quickly modify its business strategy to increase cash flow from its business, if necessary. Regulatory developments affecting the Company’s operations may also impact profitability and liquidity. See “Item 1. Business—Governmental Regulation.”
The Company regularly evaluates opportunities to optimize its capital structure, including through consideration of the issuance of debt or equity, to refinance existing debt and to fund ongoing cash needs such as general corporate purposes, growth initiatives and its dividend and stock repurchase program.
The following tables set forth certain historical information with respect to the Company’s sources and uses of cash and other key indicators of liquidity (dollars in thousands):
|
Year Ended December 31,
|
||||||||||||
|
2018
|
2017
|
2016
|
||||||||||
|
Cash flow provided by operating activities
|
$
|
243,429
|
|
$
|
220,357
|
|
$
|
96,854
|
|
|||
|
Cash flow provided by (used in) investing activities
|
(159,247
|
)
|
1,397
|
|
(25,967
|
)
|
||||||
|
Cash flow used in financing activities
|
(127,061
|
)
|
(197,506
|
)
|
(58,713
|
)
|
||||||
|
Balance at December 31,
|
||||||||||||
|
2018
|
2017
|
2016
|
||||||||||
|
Net working capital
|
$
|
656,847
|
|
$
|
721,626
|
|
$
|
748,507
|
|
|||
|
Current ratio
|
5.9:1
|
7.0:1
|
6.2:1
|
|||||||||
|
Liabilities to equity
|
0.6:1
|
0.4:1
|
0.5:1
|
|||||||||
|
Net Debt Ratio
(1)
|
1.8:1
|
1.1:1
|
2.1:1
|
|||||||||
|
(1)
|
Adjusted EBITDA, a component of the Net Debt Ratio, is a non-GAAP financial measure. See “Non-GAAP Financial Information” for a calculation of the Net Debt Ratio.
|
Net cash provided by operating activities increased
$23.1 million
, or
10%
, from
$220.4 million
for fiscal
2017
to
$243.4 million
for fiscal
2018
, due to an increase in net income of
$9.3 million
, net changes in certain non-cash adjustments to reconcile net income to operating cash flow and net changes in operating assets and liabilities (as detailed in the consolidated statements of cash flows).
Net cash used in investing activities increased
$160.6 million
from net cash provided by investing activities of
$1.4 million
during fiscal
2017
to net cash used in investing activities of
$159.2 million
during fiscal
2018
. Cash flows from investing activities are utilized primarily to fund pawn store acquisitions, purchases of furniture, fixtures, equipment and improvements, which includes capital expenditures for improvements to existing stores and for new store openings, and discretionary purchases of store real property. In addition, cash flows related to net fundings/repayments of pawn and consumer loans are included in investing activities. The Company paid
$113.7 million
in cash related to store acquisitions,
$35.7 million
for furniture, fixtures, equipment and improvements and
$20.0 million
for discretionary store real property purchases during fiscal
2018
compared to
$2.2 million
,
$26.0 million
and
$11.2 million
in fiscal
2017
, respectively. The Company received funds from a net decrease in pawn and consumer loans of
$10.1 million
during fiscal
2018
compared to
$40.7 million
during fiscal
2017
.
Net cash used in financing activities decreased
$70.4 million
, or
36%
, from
$197.5 million
during fiscal
2017
to
$127.1 million
during fiscal
2018
. Net
borrowings
on the Credit Facility were
$188.0 million
during fiscal
2018
compared to net
payments
of
$153.0 million
during fiscal
2017
. During fiscal 2017, the Company received $300.0 million in proceeds from the private offering of the Notes and paid $5.3 million in debt issuance costs related to the Notes and the Credit Facility. Using part of the proceeds from the Notes, the Company repurchased, or otherwise redeemed, the 2021 Notes and paid tender or redemption premiums over the face value of the 2021 Notes and other reacquisition costs of $10.9 million during fiscal 2017. The Company paid
$0.9 million
of debt issuance costs related to the Credit Facility during fiscal 2018. The Company funded
$273.7 million
worth of common stock share repurchases and paid dividends of
$40.9 million
during fiscal
2018
, compared to funding
$91.7 million
worth of share repurchases and dividends paid of
$36.8 million
during fiscal
2017
.
59
During fiscal
2018
, the Company opened 52 new pawn stores in Latin America, acquired 366 pawn stores in Latin America and acquired 27 pawn stores in the U.S. The cumulative purchase price of the
2018
acquisitions was $125.4 million, net of cash acquired and subject to future post-closing adjustments. The consideration for the purchases was composed of $113.7 million in cash paid during fiscal
2018
and $11.7 million of short-term payables due to the sellers in 2019. The Company also funded
$35.7 million
in capital expenditures during fiscal
2018
for improvements to existing stores, new store additions and corporate assets, and an additional
$20.0 million
related to the purchase of store real property, primarily from landlords at existing stores. Management considers the store real property purchases to be discretionary in nature and not required to operate or grow its pawn operations. Acquisition purchase prices, capital expenditures, working capital requirements and start-up losses related to new store openings have been primarily funded through cash balances, operating cash flows and the Credit Facility. The Company’s cash flow and liquidity available to fund expansion in
2018
included net cash flow from operating activities of
$243.4 million
for fiscal
2018
.
The Company intends to continue expansion primarily through acquisitions and new store openings. For fiscal
2019
, the Company expects to add approximately 80 to 85 new full-service pawn locations, primarily in Mexico, which includes expected openings of approximately 15 stores in Guatemala and 10 stores in Colombia. Additionally, as opportunities arise at attractive prices, the Company intends to continue purchasing the real estate from its landlords at existing stores. Excluding these discretionary store real property purchases, the Company expects total purchases of furniture, fixtures, equipment and improvements for
2019
, including expenditures for new and remodeled stores and other corporate assets, will total approximately $30.0 million to $35.0 million. Management believes cash on hand, the amounts available to be drawn under the Credit Facility and cash generated from operations will be sufficient to accommodate the Company’s current operations and store expansion plans for
2019
.
The Company continually looks for, and is presented with, potential acquisition opportunities. The Company currently has no contractual commitments for materially significant future acquisitions, business combinations or capital commitments. The Company will evaluate potential acquisitions based upon growth potential, purchase price, available liquidity, debt covenant restrictions, strategic fit and quality of management personnel, among other factors. If the Company encounters an attractive opportunity to acquire new stores in the near future, the Company may seek additional financing, the terms of which will be negotiated on a case-by-case basis.
As of
December 31, 2018
, the Company has contractual commitments to deliver a total of 18,000 gold ounces between the months of January and June 2019 at a weighted-average price of $1,258 per ounce. Subsequent to December 31, 2018, the Company committed to delivering an additional 18,000 gold ounces between the months of July and December 2019 at a weighted-average price of $1,300 per ounce. The ounces required to be delivered over this time period are within historical scrap gold volumes and the Company expects to have the required gold ounces to meet the commitments as they come due.
During fiscal
2018
, the Company repurchased a total of 3,343,000 shares of common stock at an aggregate cost of $274.5 million and an average cost per share of $82.12, and during fiscal
2017
, repurchased 1,616,000 shares of common stock at an aggregate cost of $93.0 million and an average cost per share of $57.56. The Company intends to continue repurchases under its active share repurchase programs through open market transactions under trading plans in accordance with Rule 10b5-1 and Rule 10b-18 under the Exchange Act of 1934, as amended, subject to a variety of factors, including, but not limited to, the level of cash balances, credit availability, debt covenant restrictions, general business conditions, regulatory requirements, the market price of the Company’s stock, dividend policy and the availability of alternative investment opportunities.
The following table provides purchases made by the Company of shares of its common stock under each share repurchase program in effect during fiscal
2018
(dollars in thousands):
|
Plan Authorization Date
|
Plan Completion Date
|
Dollar Amount Authorized
|
Shares Purchased in 2018
|
Dollar Amount Purchased in 2018
|
Remaining Dollar Amount Authorized For Future Purchases
|
||||||||||||
|
May 15, 2017
|
January 31, 2018
|
$
|
100,000
|
|
239,000
|
|
$
|
17,288
|
|
$
|
—
|
|
|||||
|
October 24, 2017
|
April 6, 2018
|
100,000
|
|
1,282,000
|
|
100,000
|
|
—
|
|
||||||||
|
April 25, 2018
|
June 13, 2018
|
100,000
|
|
1,098,000
|
|
100,000
|
|
—
|
|
||||||||
|
July 25, 2018
|
Currently active
|
100,000
|
|
724,000
|
|
57,240
|
|
42,760
|
|
||||||||
|
October 24, 2018
|
Currently active
|
100,000
|
|
—
|
|
—
|
|
100,000
|
|
||||||||
|
Total
|
3,343,000
|
|
$
|
274,528
|
|
$
|
142,760
|
|
|||||||||
Total cash dividends paid in fiscal
2018
and
2017
were
$40.9 million
and
$36.8 million
, respectively. In October 2018, the Company’s Board of Directors approved a plan to increase the annual dividend 14% from $0.88 per share to $1.00 per share, or
60
$0.25 per share quarterly, beginning in the fourth quarter of 2018. The declared $0.25 per share first quarter cash dividend on common shares outstanding, or an aggregate of
$10.9 million
based on the December 31,
2018
share count, will be paid on
February 28, 2019
to stockholders of record as of
February 14, 2019
. On an annualized basis, this represents an aggregate run rate dividend of
$43.6 million
based on the December 31,
2018
share count as compared to aggregate dividends paid of
$40.9 million
in fiscal
2018
. The declaration and payment of cash dividends in the future (quarterly or otherwise) will be made by the Board of Directors, from time to time, subject to the Company’s financial condition, results of operations, business requirements, compliance with legal requirements and debt covenant restrictions.
Non-GAAP Financial Information
The Company uses certain financial calculations such as adjusted net income, adjusted diluted earnings per share, adjusted pre-tax profit margin, adjusted net income margin, EBITDA, adjusted EBITDA, free cash flow, adjusted free cash flow and constant currency results as factors in the measurement and evaluation of the Company’s operating performance and period-over-period growth. The Company derives these financial calculations on the basis of methodologies other than GAAP, primarily by excluding from a comparable GAAP measure certain items the Company does not consider to be representative of its actual operating performance. These financial calculations are “non-GAAP financial measures” as defined in SEC rules. The Company uses these non-GAAP financial measures in operating its business because management believes they are less susceptible to variances in actual operating performance that can result from the excluded items, other infrequent charges and currency fluctuations. The Company presents these financial measures to investors because management believes they are useful to investors in evaluating the primary factors that drive the Company’s operating performance and because management believes they provide greater transparency into the Company’s results of operations. However, items that are excluded and other adjustments and assumptions that are made in calculating these non-GAAP financial measures are significant components in understanding and assessing the Company’s financial performance. These non-GAAP financial measures should be evaluated in conjunction with, and are not a substitute for, the Company’s GAAP financial measures. Further, because these non-GAAP financial measures are not determined in accordance with GAAP and are thus susceptible to varying calculations, the non-GAAP financial measures, as presented, may not be comparable to other similarly titled measures of other companies.
The Company has adjusted the applicable financial measures to exclude, among other expenses and benefits, merger and other acquisition expenses because it generally would not incur such costs and expenses as part of its continuing operations. Merger and other acquisition expenses include incremental costs directly associated with merger and acquisition activities, including professional fees, legal expenses, severance, retention and other employee-related costs, accelerated vesting of certain equity compensation awards, contract breakage costs and costs related to consolidation of technology systems and corporate facilities, among others.
61
Adjusted Net Income, Adjusted Diluted Earnings Per Share, Adjusted Pre-Tax Profit Margin and Adjusted Net Income Margin
Management believes the presentation of adjusted net income, adjusted diluted earnings per share, adjusted pre-tax profit margin and adjusted net income margin provides investors with greater transparency and provides a more complete understanding of the Company’s financial performance and prospects for the future by excluding items that management believes are non-operating in nature and not representative of the Company’s core operating performance. In addition, management believes the adjustments shown below are useful to investors in order to allow them to compare the Company’s financial results for the current periods presented with the prior periods presented.
The following table provides a reconciliation between net income and diluted earnings per share calculated in accordance with GAAP to adjusted net income and adjusted diluted earnings per share, which are shown net of tax (unaudited, in thousands, except per share amounts):
|
Year Ended December 31,
|
|||||||||||||||||||||||
|
|
2018
|
2017
|
2016
|
||||||||||||||||||||
|
In Thousands
|
Per Share
|
In Thousands
|
Per Share
|
In Thousands
|
Per Share
|
||||||||||||||||||
|
Net income and diluted earnings per share, as reported
|
$
|
153,206
|
|
$
|
3.41
|
|
$
|
143,892
|
|
$
|
3.00
|
|
$
|
60,127
|
|
$
|
1.72
|
|
|||||
|
Adjustments, net of tax:
|
|||||||||||||||||||||||
|
Merger and other acquisition expenses:
|
|||||||||||||||||||||||
|
Transaction
|
4,686
|
|
0.11
|
|
—
|
|
—
|
|
14,399
|
|
0.41
|
|
|||||||||||
|
Severance and retention
|
105
|
|
—
|
|
2,456
|
|
0.05
|
|
9,594
|
|
0.27
|
|
|||||||||||
|
Other
|
621
|
|
0.01
|
|
3,254
|
|
0.07
|
|
2,030
|
|
0.06
|
|
|||||||||||
|
Total merger and other acquisition expenses
|
5,412
|
|
0.12
|
|
5,710
|
|
0.12
|
|
26,023
|
|
0.74
|
|
|||||||||||
|
Asset impairments related to consumer loan operations
|
1,166
|
|
0.03
|
|
—
|
|
—
|
|
—
|
|
—
|
|
|||||||||||
|
Net tax benefit from Tax Act
|
(1,494
|
)
|
(0.03
|
)
|
(27,269
|
)
|
(0.57
|
)
|
—
|
|
—
|
|
|||||||||||
|
Loss on extinguishment of debt
|
—
|
|
—
|
|
8,892
|
|
0.19
|
|
—
|
|
—
|
|
|||||||||||
|
Net gain on sale of common stock of Enova
|
—
|
|
—
|
|
—
|
|
—
|
|
(818
|
)
|
(0.02
|
)
|
|||||||||||
|
Adjusted net income and diluted earnings per share
|
$
|
158,290
|
|
$
|
3.53
|
|
$
|
131,225
|
|
$
|
2.74
|
|
$
|
85,332
|
|
$
|
2.44
|
|
|||||
62
The following table provides a reconciliation of the gross amounts, the impact of income taxes and the net amounts for the adjustments included in the table above (unaudited, in thousands):
|
Year Ended December 31,
|
|||||||||||||||||||||||||||||||||||
|
|
2018
|
2017
|
2016
|
||||||||||||||||||||||||||||||||
|
Pre-tax
|
Tax
|
After-tax
|
Pre-tax
|
Tax
|
After-tax
|
Pre-tax
|
Tax
|
After-tax
|
|||||||||||||||||||||||||||
|
Merger and other acquisition expenses
(1)
|
$
|
7,643
|
|
$
|
2,231
|
|
$
|
5,412
|
|
$
|
9,062
|
|
$
|
3,352
|
|
$
|
5,710
|
|
$
|
36,670
|
|
$
|
10,647
|
|
$
|
26,023
|
|
||||||||
|
Asset impairments related to consumer loan operations
|
1,514
|
|
348
|
|
1,166
|
|
—
|
|
—
|
|
—
|
|
—
|
|
—
|
|
—
|
|
|||||||||||||||||
|
Net tax benefit from Tax Act
|
—
|
|
1,494
|
|
(1,494
|
)
|
—
|
|
27,269
|
|
(27,269
|
)
|
—
|
|
—
|
|
—
|
|
|||||||||||||||||
|
Loss on extinguishment of debt
|
—
|
|
—
|
|
—
|
|
14,114
|
|
5,222
|
|
8,892
|
|
—
|
|
—
|
|
—
|
|
|||||||||||||||||
|
Net gain on sale of common stock of Enova
|
—
|
|
—
|
|
—
|
|
—
|
|
—
|
|
—
|
|
(1,299
|
)
|
(481
|
)
|
(818
|
)
|
|||||||||||||||||
|
Total adjustments
|
$
|
9,157
|
|
$
|
4,073
|
|
$
|
5,084
|
|
$
|
23,176
|
|
$
|
35,843
|
|
$
|
(12,667
|
)
|
$
|
35,371
|
|
$
|
10,166
|
|
$
|
25,205
|
|
||||||||
|
(1)
|
Resulting tax benefit for fiscal 2016 is less than the statutory rate as a portion of the transaction costs were not deductible for tax purposes. See Note
4
of Notes to Consolidated Financial Statements for further information.
|
The following table provides a calculation of the adjusted pre-tax profit margin and the adjusted net income margin (unaudited, dollars in thousands):
|
Year Ended December 31,
|
|||||||||||
|
2018
|
2017
|
2016
|
|||||||||
|
Adjusted pre-tax profit margin calculated as follows:
|
|||||||||||
|
Income before income taxes, as reported
|
$
|
205,309
|
|
$
|
172,312
|
|
$
|
93,447
|
|
||
|
Merger and other acquisition expenses
|
7,643
|
|
9,062
|
|
36,670
|
|
|||||
|
Asset impairments related to consumer loan operations
|
1,514
|
|
—
|
|
—
|
|
|||||
|
Loss on extinguishment of debt
|
—
|
|
14,114
|
|
—
|
|
|||||
|
Net gain on sale of common stock of Enova
|
—
|
|
—
|
|
(1,299
|
)
|
|||||
|
Adjusted income before income taxes
|
$
|
214,466
|
|
$
|
195,488
|
|
$
|
128,818
|
|
||
|
Total revenue
|
$
|
1,780,858
|
|
$
|
1,779,822
|
|
$
|
1,088,377
|
|
||
|
Adjusted pre-tax profit margin
|
12.0
|
%
|
11.0
|
%
|
11.8
|
%
|
|||||
|
Adjusted net income margin calculated as follows:
|
|||||||||||
|
Adjusted net income
|
$
|
158,290
|
|
$
|
131,225
|
|
$
|
85,332
|
|
||
|
Total revenue
|
$
|
1,780,858
|
|
$
|
1,779,822
|
|
$
|
1,088,377
|
|
||
|
Adjusted net income margin
|
8.9
|
%
|
7.4
|
%
|
7.8
|
%
|
|||||
63
Earnings Before Interest, Taxes, Depreciation and Amortization (EBITDA) and Adjusted EBITDA
The Company defines EBITDA as net income before income taxes, depreciation and amortization, interest expense and interest income and adjusted EBITDA as EBITDA adjusted for certain items as listed below that management considers to be non-operating in nature and not representative of its actual operating performance. The Company believes EBITDA and adjusted EBITDA are commonly used by investors to assess a company’s financial performance, and adjusted EBITDA is used in the calculation of the Net Debt Ratio as defined in the Company’s senior unsecured notes covenants. The following table provides a reconciliation of net income to EBITDA and adjusted EBITDA (unaudited, dollars in thousands):
|
Year Ended December 31,
|
|||||||||||
|
2018
|
2017
|
2016
|
|||||||||
|
Net income
|
$
|
153,206
|
|
$
|
143,892
|
|
$
|
60,127
|
|
||
|
Income taxes
|
52,103
|
|
28,420
|
|
33,320
|
|
|||||
|
Depreciation and amortization
|
42,961
|
|
55,233
|
|
31,865
|
|
|||||
|
Interest expense
|
29,173
|
|
24,035
|
|
20,320
|
|
|||||
|
Interest income
|
(2,444
|
)
|
(1,597
|
)
|
(751
|
)
|
|||||
|
EBITDA
|
274,999
|
|
249,983
|
|
144,881
|
|
|||||
|
Adjustments:
|
|||||||||||
|
Merger and other acquisition expenses
|
7,643
|
|
9,062
|
|
36,670
|
|
|||||
|
Asset impairments related to consumer loan operations
|
1,514
|
|
—
|
|
—
|
|
|||||
|
Loss on extinguishment of debt
|
—
|
|
14,114
|
|
—
|
|
|||||
|
Net gain on sale of common stock of Enova
|
—
|
|
—
|
|
(1,299
|
)
|
|||||
|
Adjusted EBITDA
|
$
|
284,156
|
|
$
|
273,159
|
|
$
|
180,252
|
|
||
|
Net Debt Ratio calculation:
|
|||||||||||
|
Total debt (outstanding principal)
|
$
|
595,000
|
|
$
|
407,000
|
|
$
|
460,000
|
|
||
|
Less: cash and cash equivalents
|
(71,793
|
)
|
(114,423
|
)
|
(89,955
|
)
|
|||||
|
Net debt
|
$
|
523,207
|
|
$
|
292,577
|
|
$
|
370,045
|
|
||
|
Adjusted EBITDA
|
$
|
284,156
|
|
$
|
273,159
|
|
$
|
180,252
|
|
||
|
Net Debt Ratio (Net Debt divided by Adjusted EBITDA)
|
1.8
|
:1
|
1.1
|
:1
|
2.1
|
:1
|
|||||
Free Cash Flow and Adjusted Free Cash Flow
For purposes of its internal liquidity assessments, the Company considers free cash flow and adjusted free cash flow. The Company defines free cash flow as cash flow from operating activities less purchases of furniture, fixtures, equipment and improvements and net fundings/repayments of pawn and consumer loans, which are considered to be operating in nature by the Company but are included in cash flow from investing activities. Adjusted free cash flow is defined as free cash flow adjusted for merger and other acquisition expenses paid that management considers to be non-operating in nature.
The Company previously included store real property purchases as a component of purchases of property and equipment. Management considers the store real property purchases to be discretionary in nature and not required to operate or grow its pawn operations. To further enhance transparency of these distinct items, the Company now reports purchases of store real property and purchases of furniture, fixtures, equipment and improvements separately on the consolidated statements of cash flows. As a result, the current definitions of free cash flow and adjusted free cash flow differ from prior period definitions as they now exclude discretionary purchases of store real property and the Company has retrospectively applied the current definitions to prior-period results.
Free cash flow and adjusted free cash flow are commonly used by investors as an additional measure of cash generated by business operations that may be used to repay scheduled debt maturities and debt service or, following payment of such debt obligations and other non-discretionary items, may be available to invest in future growth through new business development activities or acquisitions, repurchase stock, pay cash dividends or repay debt obligations prior to their maturities. These metrics can also be used to evaluate the Company’s ability to generate cash flow from business operations and the impact that this cash flow has on the Company’s liquidity. However, free cash flow and adjusted free cash flow have limitations as analytical tools and should not
64
be considered in isolation or as a substitute for cash flow from operating activities or other income statement data prepared in accordance with GAAP. The following table reconciles cash flow from operating activities to free cash flow and adjusted free cash flow (unaudited, in thousands):
|
Year Ended December 31,
|
|||||||||||
|
2018
|
2017
|
2016
|
|||||||||
|
Cash flow from operating activities
|
$
|
243,429
|
|
$
|
220,357
|
|
$
|
96,854
|
|
||
|
Cash flow from investing activities:
|
|
|
|||||||||
|
Loan receivables, net of cash repayments
|
10,125
|
|
40,735
|
|
(16,072
|
)
|
|||||
|
Purchases of furniture, fixtures, equipment and improvements
|
(35,677
|
)
|
(25,971
|
)
|
(20,456
|
)
|
|||||
|
Free cash flow
|
217,877
|
|
235,121
|
|
60,326
|
|
|||||
|
Merger and other acquisition expenses paid, net of tax benefit
|
7,072
|
|
6,659
|
|
20,939
|
|
|||||
|
Adjusted free cash flow
|
$
|
224,949
|
|
$
|
241,780
|
|
$
|
81,265
|
|
||
Constant Currency Results
The Company’s reporting currency is the U.S. dollar. However, certain performance metrics discussed in this report are presented on a “constant currency” basis, which is considered a non-GAAP financial measure. The Company’s management uses constant currency results to evaluate operating results of business operations in Latin America, which are primarily transacted in local currencies.
The Company believes constant currency results provide investors with valuable supplemental information regarding the underlying performance of its business operations in Latin America, consistent with how the Company’s management evaluates such performance and operating results. Constant currency results reported herein are calculated by translating certain balance sheet and income statement items denominated in local currencies using the exchange rate from the prior-year comparable period, as opposed to the current comparable period, in order to exclude the effects of foreign currency rate fluctuations for purposes of evaluating period-over-period comparisons. Business operations in Mexico, Guatemala and Colombia are transacted in Mexican pesos, Guatemalan quetzales and Colombian pesos, respectively. The Company also has operations in El Salvador where the reporting and functional currency is the U.S. dollar. See the Latin America operations segment tables in “Results of Operations” above for additional reconciliation of certain constant currency amounts to as reported GAAP amounts.
Contractual Commitments
A tabular disclosure of contractual obligations at December 31,
2018
is as follows (in thousands):
|
Payments Due by Period
|
|||||||||||||||||||
|
Total
|
Less Than 1 Year
|
1 - 3 Years
|
3 - 5 Years
|
More Than 5 Years
|
|||||||||||||||
|
Operating leases
|
$
|
350,257
|
|
$
|
105,762
|
|
$
|
151,598
|
|
$
|
63,213
|
|
$
|
29,684
|
|
||||
|
Revolving unsecured credit facility
(1)
|
295,000
|
|
—
|
|
—
|
|
295,000
|
|
—
|
|
|||||||||
|
Senior unsecured notes
|
300,000
|
|
—
|
|
—
|
|
—
|
|
300,000
|
|
|||||||||
|
Interest on senior unsecured notes
|
88,688
|
|
16,125
|
|
32,250
|
|
32,250
|
|
8,063
|
|
|||||||||
|
Executive employment contracts
(2)
|
12,918
|
|
4,305
|
|
8,223
|
|
390
|
|
—
|
|
|||||||||
|
Total
|
$
|
1,046,863
|
|
$
|
126,192
|
|
$
|
192,071
|
|
$
|
390,853
|
|
$
|
337,747
|
|
||||
|
(1)
|
Excludes interest obligations under the Company's revolving unsecured credit facility. See Note
10
of Notes to Consolidated Financial Statements.
|
|
(2)
|
The employment contracts generally provide that if an executive’s employment with the Company is terminated during the term by the Company without “cause” or by the executive for “good reason” (as such terms are defined in the employment agreements), the executive would be entitled to a lump sum cash severance payment equal to one times (or two times, if such termination occurs within twelve months following a change in control of the Company) the sum of (1) the executive’s salary in effect as of the termination, and (2) the average of the annual cash incentives earned by the executive for each of the three fiscal years immediately preceding the year in which the termination occurs.
|
65
Off-Balance Sheet Arrangements
The Company offers a fee-based credit services organization program to assist consumers in obtaining extensions of credit. The Company’s stand-alone consumer loan stores and select pawn stores in the states of Texas and Ohio offer the CSO Programs. The Company’s CSO Programs comply with the respective jurisdiction’s credit services organization act, credit access business law or a similar statute. Under the CSO Programs, the Company assists customers in applying for a short-term extension of credit from the Independent Lenders and issues the Independent Lenders a guarantee for the repayment of the extension of credit. For extension of credit products originated by the Independent Lenders, the Independent Lenders are responsible for evaluating each of its customers’ applications, determining whether to approve an extension of credit based on an application and determining the amount of the extension of credit. The Company is not involved in the Independent Lenders’ extension of credit approval processes or in determining the Independent Lenders’ approval procedures or criteria. At December 31,
2018
, the outstanding amount of active extensions of credit originated and held by the Independent Lenders was
$6.0 million
.
Since the Company may not be successful in collection of delinquent accounts under the CSO Programs, the Company’s consumer loan loss provision includes amounts estimated to be adequate to absorb credit losses from extensions of credit in the aggregate consumer loan portfolio, including those expected to be assigned to the Company or acquired by the Company as a result of its guaranty obligations. Estimated losses of
$0.3 million
on portfolios owned by the Independent Lenders are included in accounts payable and accrued liabilities in the consolidated balance sheet as of December 31,
2018
. The Company believes this amount is adequate to absorb credit losses from extensions of credit expected to be assigned to the Company or acquired by the Company as a result of its guaranty obligations.
Inflation
The Company does not believe inflation has had a material effect on the volume of customer loans originated, merchandise sales, or results of operations.
Seasonality
The Company’s business is subject to seasonal variations, and operating results for each quarter and year-to-date periods are not necessarily indicative of the results of operations for the full year. Typically, the Company experiences seasonal growth of service fees in the third and fourth quarter of each year due to loan balance growth. Service fees generally decline in the first and second quarter of each year after the heavy repayment period of pawn and consumer loans associated with statutory bonuses received by customers in the fourth quarter in Mexico and with tax refund proceeds received by customers in the first quarter in the U.S. Retail sales are seasonally higher in the fourth quarter associated with holiday shopping, and to a lesser extent, in the first quarter associated with tax refunds in the U.S.
Recent Accounting Pronouncements
See discussion in Note
2
of Notes to Consolidated Financial Statements.
Item 7A. Quantitative and Qualitative Disclosures About Market Risk
Market risks relating to the Company’s operations result primarily from changes in interest rates, gold prices and foreign currency exchange rates. The Company does not engage in speculative or leveraged transactions, nor does it hold or issue financial instruments for trading purposes.
Gold Price Risk
The Company has significant holdings of gold in the form of jewelry inventories and pawn collateral, and a significant portion of retail merchandise sales are gold jewelry as are most of the wholesale scrap jewelry sales. At December 31,
2018
, the Company held approximately
$140.3 million
in jewelry inventories, representing
51%
of total inventory. In addition, approximately $203.2 million, or
56%
, of total pawn loans were collateralized by jewelry, which was primarily gold. Of the Company’s total retail merchandise revenue during fiscal
2018
, approximately $349.3 million, or 32%, was jewelry sales. During fiscal
2018
, the average market price of gold increased by 1%, from $1,257 to $1,268 per ounce. A significant and sustained decline in the price of gold would negatively impact the value of jewelry inventories held by the Company and the value of gold jewelry pledged as collateral by pawn customers. As a result, the Company’s profit margins from the sale of existing jewelry inventories would be negatively impacted, as would the potential profit margins on gold jewelry currently pledged as collateral by pawn customers in the event it was forfeited by the customer. In addition, a decline in gold prices could result in a lower balance of pawn loans outstanding for the Company, as customers would receive lower loan amounts for individual pieces of pledged gold jewelry, although the Company
66
believes that many customers would be willing to add additional items of value to their pledge in order to obtain the desired loan amount, thus mitigating a portion of this risk.
Foreign Currency Risk
The financial statements of the Company’s subsidiaries in Mexico, Guatemala and Colombia are translated into U.S. dollars using period-end exchange rates for assets and liabilities and average exchange rates for revenues and expenses. Adjustments resulting from translating net assets are reported as a separate component of accumulated other comprehensive income (loss) within stockholders’ equity under the caption “currency translation adjustment.” Exchange rate gains or losses related to foreign currency transactions are recognized as transaction gains or losses in the Company’s income statement as incurred. The Company also has operations in El Salvador where the reporting and functional currency is the U.S. dollar.
On a dollar translated basis, Latin America revenues and cost of revenues account for
31%
and
33%
, respectively, of consolidated amounts for the year ended December 31,
2018
. The majority of Latin America revenues and a smaller portion of expenses are denominated in currencies other than the U.S. dollar and the Company therefore has foreign currency risk related to these currencies, which are primarily the Mexican peso, and to a much lesser extent, the Guatemalan quetzal and Colombian peso.
Accordingly, changes in exchange rates, and in particular a weakening of foreign currencies relative to the U.S. dollar, may negatively affect the Company’s revenue and earnings of its Latin America operations as expressed in U.S. dollars. For the year ended December 31,
2018
, the Company’s Latin America revenues and pre-tax operating income would have been approximately
$8.5 million
and
$1.9 million
higher, respectively, had foreign currency exchange rates remained consistent with those for the year ended December 31,
2017
. See “Item 7. Management’s Discussion and Analysis of Financial Condition and Results of Operations—Results of Operations” for further discussion of Latin America constant currency results.
The Company does not typically use foreign exchange contracts or derivatives to hedge any foreign currency exposures. The volatility of exchange rates depends on many factors that it cannot forecast with reliable accuracy. The Company’s continued Latin America expansion increases exposure to exchange rate fluctuations and, as a result, such fluctuations could have a significant impact on future results of operations. The average value of the Mexican peso to the U.S. dollar exchange rate for fiscal
2018
was
19.2
to 1, compared to
18.9
to 1 in fiscal
2017
and
18.7
to 1 in fiscal
2016
. It is anticipated that for
2019
a one point change in the average Mexican peso to the U.S. dollar exchange rate will impact annual earnings by approximately $3.4 million to $4.3 million.
The average value of the Guatemalan quetzal to the U.S. dollar exchange rate for fiscal
2018
was
7.5
to 1, compared to
7.4
to 1 in fiscal
2017
and
7.6
to 1 in fiscal
2016
. The average value of the Colombian peso to the U.S. dollar exchange rate for fiscal
2018
was
2,956
to 1, compared to
2,951
to 1 in fiscal
2017
and
3,052
to 1 in fiscal
2016
.
Interest Rate Risk
The Company is potentially exposed to market risk in the form of interest rate risk in regards to its long-term unsecured line of credit. At December 31,
2018
, the Company had
$295.0 million
outstanding under its revolving line of credit. The revolving line of credit is generally priced with a variable rate based on a 1 week or 1, 2, 3 or 6 month LIBOR plus a fixed spread. Based on the average outstanding indebtedness during fiscal
2018
, a 1% (100 basis points) increase in interest rates would have increased the Company’s interest expense by approximately $2.2 million for fiscal
2018
.
Interest rate fluctuations will generally not affect the Company’s future earnings or cash flows on its fixed rate debt unless such instruments mature or are otherwise terminated. However, interest rate changes will affect the fair value of the Company’s fixed rate instruments. At December 31,
2018
, the fair value of the Company’s fixed rate debt was approximately
$293.0 million
and the outstanding principal of the Company’s fixed rate debt was $300.0 million. The fair value estimate of the Company’s fixed rate debt was estimated based on quoted prices in markets that are not active. Changes in assumptions or estimation methodologies may have a material effect on this estimated fair value. As the Company expects to hold its fixed rate instruments to maturity and the amounts due under such instruments would be limited to the outstanding principal balance and any accrued and unpaid interest, the Company does not expect that fluctuations in interest rates, and the resulting change in fair value of its fixed rate instruments, would have a significant impact on the Company’s operations.
The Company’s cash and cash equivalents are sometimes invested in money market accounts. Accordingly, the Company is subject to changes in market interest rates. However, the Company does not believe a change in these rates would have a material adverse effect on the Company’s operating results, financial condition, or cash flows.
67
Item 8. Financial Statements and Supplementary Data
The financial statements prepared in accordance with Regulation S-X are included in a separate section of this report. See the index to Financial Statements at Item 15(a)(1) and (2) of this report.
Item 9. Changes in and Disagreements with Accountants on Accounting and Financial Disclosure
Not applicable.
Item 9A. Controls and Procedures
Evaluation of Disclosure Controls and Procedures
The Company’s management, under the supervision and with the participation of the Company’s Chief Executive Officer and Chief Financial Officer, has evaluated the effectiveness of the Company’s disclosure controls and procedures (as defined in Rules 13a-15(e) under the Exchange Act) as of December 31,
2018
(the “Evaluation Date”). Based upon that evaluation, the Chief Executive Officer and Chief Financial Officer concluded that, as of the Evaluation Date, the Company’s disclosure controls and procedures were effective.
Limitations on Effectiveness of Controls and Procedures
The Company’s management, including its Chief Executive Officer and Chief Financial Officer, does not expect the Company’s disclosure controls and procedures or internal controls will prevent all possible error and fraud. The Company’s disclosure controls and procedures are, however, designed to provide reasonable assurance of achieving their objectives, and the Company’s Chief Executive Officer and Chief Financial Officer have concluded that the Company’s disclosure controls and procedures are effective at that reasonable assurance level.
Management’s Report on Internal Control Over Financial Reporting
Management is responsible for establishing and maintaining adequate internal control over financial reporting and for the assessment of the effectiveness of the Company’s internal control over financial reporting. Internal control over financial reporting (as defined in Rules 13a-15(f) and 15d(f) under the Exchange Act) is a process designed to provide reasonable assurance regarding the reliability of financial reporting and the preparation of financial statements for external reporting purposes in accordance with GAAP. Internal control over financial reporting includes those policies and procedures that (1) pertain to the maintenance of records that, in reasonable detail, accurately and fairly reflect the transactions and dispositions of assets, (2) provide reasonable assurance that transactions are recorded as necessary to permit preparation of financial statements in accordance with GAAP, (3) provide reasonable assurance that receipts and expenditures are being made only in accordance with appropriate authorization of management and the board of directors, and (4) provide reasonable assurance regarding prevention or timely detection of unauthorized acquisition, use, or disposition of assets that could have a material effect on the financial statements.
All internal control systems, no matter how well designed, have inherent limitations, therefore, even those systems determined to be effective can provide only reasonable assurance with respect to financial statement preparation and presentation.
Under the supervision and with the participation of the Company’s Chief Executive Officer and Chief Financial Officer, management has assessed the effectiveness of the Company’s internal control over financial reporting as of December 31,
2018
. To make this assessment, management used the criteria for effective internal control over financial reporting described in
Internal Control-Integrated Framework (2013)
issued by the Committee of Sponsoring Organizations of the Treadway Commission. Based on this assessment, management concludes that, as of December 31,
2018
, the Company’s internal control over financial reporting is effective based on those criteria.
The Company’s internal control over financial reporting as of December 31,
2018
, has been audited by RSM US LLP, the independent registered public accounting firm that audited the Company’s financial statements included in this report, and RSM’s attestation report is included below.
Changes in Internal Control Over Financial Reporting
There have been no changes in the Company’s internal control over financial reporting during the quarter ended December 31,
2018
that have materially affected, or are reasonably likely to materially affect, the Company’s internal control over financial reporting.
68
REPORT OF INDEPENDENT REGISTERED PUBLIC ACCOUNTING FIRM
To the Stockholders and the Board of Directors of FirstCash, Inc.
Opinion on the Internal Control Over Financial Reporting
We have audited FirstCash, Inc. and its subsidiaries (the Company) internal control over financial reporting as of December 31,
2018
, based on criteria established in
Internal Control - Integrated Framework
issued by the Committee of Sponsoring Organizations of the Treadway Commission in 2013. In our opinion, the Company maintained, in all material respects, effective internal control over financial reporting as of December 31,
2018
, based on criteria established in
Internal Control - Integrated Framework
issued by the Committee of Sponsoring Organizations of the Treadway Commission in 2013.
We have also audited, in accordance with the standards of the Public Company Accounting Oversight Board (United States) (PCAOB), the consolidated balance sheets as of December 31,
2018
and
2017
, the related consolidated statements of income, comprehensive income, stockholders' equity and cash flows for each of the three years in the period ended December 31,
2018
and the related notes to the consolidated financial statements of the Company and our report dated
February 4, 2019
expressed an unqualified opinion.
Basis for Opinion
The Company’s management is responsible for maintaining effective internal control over financial reporting and for its assessment of the effectiveness of internal control over financial reporting in the accompanying Management’s Report on Internal Control over Financial Reporting. Our responsibility is to express an opinion on the Company’s internal control over financial reporting based on our audit. We are a public accounting firm registered with the PCAOB and are required to be independent with respect to the Company in accordance with U.S. federal securities laws and the applicable rules and regulations of the Securities and Exchange Commission and the PCAOB.
We conducted our audit in accordance with the standards of the PCAOB. Those standards require that we plan and perform the audit to obtain reasonable assurance about whether effective internal control over financial reporting was maintained in all material respects. Our audit included obtaining an understanding of internal control over financial reporting, assessing the risk that a material weakness exists, and testing and evaluating the design and operating effectiveness of internal control based on the assessed risk. Our audit also included performing such other procedures as we considered necessary in the circumstances. We believe that our audit provides a reasonable basis for our opinion.
Definition and Limitations of Internal Control Over Financial Reporting
A company's internal control over financial reporting is a process designed to provide reasonable assurance regarding the reliability of financial reporting and the preparation of financial statements for external purposes in accordance with generally accepted accounting principles. A company's internal control over financial reporting includes those policies and procedures that (1) pertain to the maintenance of records that, in reasonable detail, accurately and fairly reflect the transactions and dispositions of the assets of the company; (2) provide reasonable assurance that transactions are recorded as necessary to permit preparation of financial statements in accordance with generally accepted accounting principles, and that receipts and expenditures of the company are being made only in accordance with authorizations of management and directors of the company; and (3) provide reasonable assurance regarding prevention or timely detection of unauthorized acquisition, use or disposition of the company's assets that could have a material effect on the financial statements.
Because of its inherent limitations, internal control over financial reporting may not prevent or detect misstatements. Also, projections of any evaluation of effectiveness to future periods are subject to the risk that controls may become inadequate because of changes in conditions, or that the degree of compliance with the policies or procedures may deteriorate.
/s/ RSM US LLP
Dallas, Texas
February 4, 2019
69
Item 9B. Other Information
None.
PART III
Item 10. Directors, Executive Officers and Corporate Governance
The information required by Item 10 to this Annual Report on Form 10-K with respect to the directors, executive officers and compliance with Section 16(a) of the Exchange Act is incorporated herein by reference from the information provided under the headings “Election of Directors,” “Executive Officers,” “Corporate Governance, Board Matters and Director Compensation” and “Section 16(a) Beneficial Ownership Reporting Compliance,” contained in the Company’s Proxy Statement to be filed with the SEC in connection with the solicitation of proxies for the Company’s
2019
Annual Meeting of Stockholders to be held on or about
June 11, 2019
(the “
2019
Proxy Statement”).
The Company has adopted a Code of Ethics that applies to all of its directors, officers, and employees. This Code of Ethics is publicly available on the Company’s website at
www.firstcash.com
. The Company intends to disclose future amendments to, or waivers from, certain provisions of its Code of Ethics on its website in accordance with applicable Nasdaq and SEC requirements. Copies of the Company’s Code of Ethics are also available, free of charge, by submitting a written request to FirstCash, Inc., Investor Relations, 1600 West 7th Street, Fort Worth, Texas 76102.
Item 11. Executive Compensation
The information required by Item 11 to this Annual Report on Form 10-K is incorporated herein by reference from the information provided under the headings “Executive Compensation” and “Compensation Committee Interlocks and Insider Participation” of the
2019
Proxy Statement.
Item 12. Security Ownership of Certain Beneficial Owners and Management and Related Stockholder Matters
The information required by Item 12 to this Annual Report on Form 10-K is incorporated herein by reference from the information provided under the heading “Equity Compensation Plan Information” and “Security Ownership of Certain Beneficial Owners and Management and Related Stockholder Matters” of the
2019
Proxy Statement.
Item 13. Certain Relationships and Related Transactions, and Director Independence
The information required by Item 13 to this Annual Report on Form 10-K is incorporated herein by reference from the information provided under the headings “Certain Relationships and Related Person Transactions” and “Corporate Governance, Board Matters and Director Compensation” of the
2019
Proxy Statement.
Item 14. Principal Accountant Fees and Services
The information required by Item 14 to this Annual Report on Form 10-K is incorporated herein by reference from the information provided under the heading “Ratification of Independent Registered Public Accounting Firm” of the
2019
Proxy Statement.
70
PART IV
Item 15. Exhibits and Financial Statement Schedules
|
(a)
|
The following documents are filed as part of this report:
|
||||
|
(1)
|
Consolidated Financial Statements:
|
Page
|
|||
|
Report of Independent Registered Public Accounting Firm
|
|||||
|
Consolidated Balance Sheets
|
|||||
|
Consolidated Statements of Income
|
|||||
|
Consolidated Statements of Comprehensive Income
|
|||||
|
Consolidated Statements of Changes in Stockholders’ Equity
|
|||||
|
Consolidated Statements of Cash Flows
|
|||||
|
Notes to Consolidated Financial Statements
|
|||||
|
(2)
|
All schedules are omitted because they are not applicable or the required information is shown in the financial statements or the notes thereto.
|
||||
|
(3)
|
Exhibits:
|
||||
|
|
|
Incorporated by Reference
|
|
|||||||||
|
Exhibit No.
|
Exhibit Description
|
Form
|
File No.
|
Exhibit
|
Filing Date
|
Filed Herewith
|
||||||
|
2.1
|
8-K
|
0-19133
|
2.1
|
04/29/2016
|
||||||||
|
3.1
|
DEF 14A
|
0-19133
|
B
|
04/29/2004
|
||||||||
|
3.2
|
8-K
|
001-10960
|
3.1
|
09/02/2016
|
||||||||
|
3.3
|
8-K
|
001-10960
|
3.2
|
09/02/2016
|
||||||||
|
4.1
|
Common Stock Specimen
|
S-1
|
33-48436
|
4.2a
|
06/05/1992
|
|||||||
|
4.2
|
8-K
|
001-10960
|
4.1
|
05/31/2017
|
||||||||
|
10.1
|
DEF 14A
|
0-19133
|
C
|
04/29/2004
|
||||||||
|
10.2
|
DEF 14A
|
0-19133
|
A
|
04/28/2011
|
||||||||
|
10.3
|
S-8
|
333-
214452
|
99.2
|
11/04/2016
|
||||||||
|
10.4
|
S-8
|
333- 106881
|
4(g)
|
05/31/2012
|
||||||||
|
10.5
|
8-K
|
0-19133
|
10.1
|
07/26/2016
|
||||||||
|
10.6
|
8-K
|
0-19133
|
10.1
|
08/26/2016
|
||||||||
71
|
|
|
Incorporated by Reference
|
|
|||||||||
|
Exhibit No.
|
Exhibit Description
|
Form
|
File No.
|
Exhibit
|
Filing Date
|
Filed Herewith
|
||||||
|
10.7
|
8-K
|
0-19133
|
10.2
|
08/26/2016
|
||||||||
|
10.8
|
8-K
|
0-19133
|
10.3
|
08/26/2016
|
||||||||
|
10.9
|
10-Q
|
001-10960
|
10.1
|
05/05/2017
|
||||||||
|
10.10
|
8-K
|
001-10960
|
10.1
|
05/31/2017
|
||||||||
|
10.11
|
10-Q
|
001-10960
|
10.1
|
08/01/2018
|
||||||||
|
10.12
|
10-Q
|
001-10960
|
10.2
|
08/01/2018
|
||||||||
|
10.13
|
8-K
|
001-10960
|
10.1
|
10/04/2018
|
||||||||
|
16.1
|
8-K
|
0-19133
|
16.1
|
08/30/2016
|
||||||||
|
21.1
|
X
|
|||||||||||
|
23.1
|
X
|
|||||||||||
|
31.1
|
|
|
|
|
X
|
|||||||
|
31.2
|
|
|
|
|
X
|
|||||||
|
32.1
|
|
|
|
|
X
|
|||||||
|
32.2
|
|
|
|
|
X
|
|||||||
72
|
|
|
Incorporated by Reference
|
|
|||||||||
|
Exhibit No.
|
Exhibit Description
|
Form
|
File No.
|
Exhibit
|
Filing Date
|
Filed Herewith
|
||||||
|
101
(1)
|
The following financial information from the Company's Annual Report on Form 10-K for fiscal 2018, filed with the SEC on February 4, 2019, is formatted in Extensible Business Reporting Language (XBRL): (i) Consolidated Balance Sheets at December 31, 2018 and December 31, 2017, (ii) Consolidated Statements of Income for the years ended December 31, 2018, December 31, 2017 and December 31, 2016, (iii) Consolidated Statements of Comprehensive Income for the years ended December 31, 2018, December 31, 2017 and December 31, 2016, (iv) Consolidated Statements of Changes in Stockholders’ Equity for the years ended December 31, 2018, December 31, 2017 and December 31, 2016, (v) Consolidated Statements of Cash Flows for the years ended December 31, 2018, December 31, 2017 and December 31, 2016, and (vi) Notes to Consolidated Financial Statements.
|
X
|
||||||||||
|
*
|
The schedules to the Agreement and Plan of Merger have been omitted from this filing pursuant to Item 601(b)(2) of Regulation S-K. Registrant will furnish copies of such schedules to the U.S. Securities and Exchange Commission upon request by the Commission.
|
|
**
|
Indicates management contract or compensatory plan, contract or arrangement.
|
|
(1)
|
The XBRL related information in Exhibit 101 to this Annual Report on Form 10-K shall not be deemed “filed” for purposes of Section 18 of the Securities Exchange Act of 1934, as amended, or otherwise subject to liability of that section and shall not be incorporated by reference into any filing or other document pursuant to the Securities Act of 1933, as amended, except as shall be expressly set forth by specific reference in such filing or document.
|
Item 16. Form 10-K Summary
None.
73
SIGNATURES
Pursuant to the requirements of Section 13 or 15(d) of the Securities Exchange Act of 1934, the registrant has duly caused this report to be signed on its behalf by the undersigned, thereunto duly authorized.
|
Dated: February 4, 2019
|
FIRSTCASH, INC.
|
|
|
(Registrant)
|
|
|
|
|
|
/s/ RICK L. WESSEL
|
|
|
Rick L. Wessel
|
|
|
Chief Executive Officer
|
|
(On behalf of the Registrant)
|
|
Pursuant to the requirements of the Securities Exchange Act of 1934, this report has been signed below by the following persons on behalf of the registrant and in the capacities and on the dates indicated.
|
Signature
|
Capacity
|
Date
|
|
/s/ RICK L. WESSEL
Rick L. Wessel
|
Vice-Chairman of the Board and Chief Executive Officer
(Principal Executive Officer)
|
February 4, 2019
|
|
/s/ R. DOUGLAS ORR
R. Douglas Orr
|
Executive Vice President and Chief Financial Officer
(Principal Financial and Accounting Officer)
|
February 4, 2019
|
|
/s/ DANIEL R. FEEHAN
Daniel R. Feehan |
Chairman of the Board
|
February 4, 2019
|
|
/s/ DANIEL E. BERCE
Daniel E. Berce
|
Director
|
February 4, 2019
|
|
/s/ MIKEL D. FAULKNER
Mikel D. Faulkner
|
Director
|
February 4, 2019
|
|
/s/ JAMES H. GRAVES
James H. Graves
|
Director
|
February 4, 2019
|
|
/s/ JORGE MONTAÑO
Jorge Montaño
|
Director
|
February 4, 2019
|
|
/s/ RANDEL G. OWEN
Randel G. Owen
|
Director
|
February 4, 2019
|
74
REPORT OF INDEPENDENT REGISTERED PUBLIC ACCOUNTING FIRM
To the Stockholders and the Board of Directors of FirstCash, Inc.
Opinion on the Financial Statements
We have audited the accompanying consolidated balance sheets of FirstCash, Inc., and subsidiaries (the Company) as of December 31,
2018
and
2017
, the related consolidated statements of income, comprehensive income, stockholders’ equity and cash flows for each of the three years in the period ended December 31,
2018
, and the related notes to the consolidated financial statements (collectively, the financial statements). In our opinion, the consolidated financial statements present fairly, in all material respects, the financial position of the Company as of December 31,
2018
and
2017
, and the results of its operations and its cash flows for each of the three years in the period ended December 31,
2018
, in conformity with accounting principles generally accepted in the United States of America.
We have also audited, in accordance with the standards of the Public Company Accounting Oversight Board (United States) (PCAOB), the Company's internal control over financial reporting as of December 31,
2018
, based on criteria established in
Internal Control - Integrated Framework
issued by the Committee of Sponsoring Organizations of the Treadway Commission in 2013, and our report dated
February 4, 2019
expressed an unqualified opinion on the effectiveness of the Company's internal control over financial reporting.
Basis for Opinion
These financial statements are the responsibility of the Company’s management. Our responsibility is to express an opinion on the Company’s financial statements based on our audits. We are a public accounting firm registered with the PCAOB and are required to be independent with respect to the Company in accordance with U.S. federal securities laws and the applicable rules and regulations of the Securities and Exchange Commission and the PCAOB.
We conducted our audits in accordance with the standards of the PCAOB. Those standards require that we plan and perform the audits to obtain reasonable assurance about whether the financial statements are free of material misstatement, whether due to error or fraud. Our audits included performing procedures to assess the risks of material misstatement of the financial statements, whether due to error or fraud, and performing procedures that respond to those risks. Such procedures included examining, on a test basis, evidence regarding the amounts and disclosures in the financial statements. Our audits also included evaluating the accounting principles used and significant estimates made by management, as well as evaluating the overall presentation of the financial statements. We believe that our audits provide a reasonable basis for our opinion.
/s/ RSM US LLP
We have served as the Company’s auditor since 2016.
Dallas, Texas
February 4, 2019
F-1
|
FIRSTCASH, INC.
|
|||||||||
|
CONSOLIDATED BALANCE SHEETS
|
|||||||||
|
(in thousands, except per share amounts)
|
|||||||||
|
|
December 31,
|
||||||||
|
|
2018
|
2017
|
|||||||
|
ASSETS
|
|
|
|||||||
|
Cash and cash equivalents
|
$
|
71,793
|
|
$
|
114,423
|
|
|||
|
Fees and service charges receivable
|
45,430
|
|
42,736
|
|
|||||
|
Pawn loans
|
362,941
|
|
344,748
|
|
|||||
|
Consumer loans, net
|
15,902
|
|
23,522
|
|
|||||
|
Inventories
|
275,130
|
|
276,771
|
|
|||||
|
Income taxes receivable
|
1,379
|
|
19,761
|
|
|||||
|
Prepaid expenses and other current assets
|
17,317
|
|
20,236
|
|
|||||
|
Total current assets
|
789,892
|
|
842,197
|
|
|||||
|
Property and equipment, net
|
251,645
|
|
230,341
|
|
|||||
|
Goodwill
|
917,419
|
|
831,145
|
|
|||||
|
Intangible assets, net
|
88,140
|
|
93,819
|
|
|||||
|
Other assets
|
49,238
|
|
54,045
|
|
|||||
|
Deferred tax assets
|
11,640
|
|
11,237
|
|
|||||
|
Total assets
|
$
|
2,107,974
|
|
$
|
2,062,784
|
|
|||
|
LIABILITIES AND STOCKHOLDERS’ EQUITY
|
|
|
|||||||
|
Accounts payable and accrued liabilities
|
$
|
96,928
|
|
$
|
84,331
|
|
|||
|
Customer deposits
|
35,368
|
|
32,019
|
|
|||||
|
Income taxes payable
|
749
|
|
4,221
|
|
|||||
|
Total current liabilities
|
133,045
|
|
120,571
|
|
|||||
|
Revolving unsecured credit facility
|
295,000
|
|
107,000
|
|
|||||
|
Senior unsecured notes
|
295,887
|
|
295,243
|
|
|||||
|
Deferred tax liabilities
|
54,854
|
|
47,037
|
|
|||||
|
Other liabilities
|
11,084
|
|
17,600
|
|
|||||
|
Total liabilities
|
789,870
|
|
587,451
|
|
|||||
|
Commitments and contingencies (Note 12)
|
|
|
|||||||
|
Stockholders’ equity:
|
|
|
|||||||
|
Preferred stock; $0.01 par value; 10,000 shares authorized; no shares issued or
|
|||||||||
|
outstanding
|
—
|
|
—
|
|
|||||
|
Common stock; $0.01 par value; 90,000 shares authorized;
|
|||||||||
|
49,276
and 49,276 shares issued, respectively;
|
|||||||||
|
43,603
and 46,914 shares outstanding, respectively
|
493
|
|
493
|
|
|||||
|
Additional paid-in capital
|
1,224,608
|
|
1,220,356
|
|
|||||
|
Retained earnings
|
606,810
|
|
494,457
|
|
|||||
|
Accumulated other comprehensive loss
|
(113,117
|
)
|
(111,877
|
)
|
|||||
|
Common stock held in treasury,
5,673
and 2,362 shares at cost, respectively
|
(400,690
|
)
|
(128,096
|
)
|
|||||
|
Total stockholders’ equity
|
1,318,104
|
|
1,475,333
|
|
|||||
|
Total liabilities and stockholders’ equity
|
$
|
2,107,974
|
|
$
|
2,062,784
|
|
|||
|
The accompanying notes are an integral part
of these consolidated financial statements.
|
|||||||||
F-2
|
FIRSTCASH, INC.
|
||||||||||||
|
CONSOLIDATED STATEMENTS OF INCOME
|
||||||||||||
|
(in thousands, except per share amounts)
|
||||||||||||
|
|
Year Ended December 31,
|
|||||||||||
|
|
2018
|
2017
|
2016
|
|||||||||
|
Revenue:
|
|
|
|
|||||||||
|
Retail merchandise sales
|
$
|
1,091,614
|
|
$
|
1,051,099
|
|
$
|
669,131
|
|
|||
|
Pawn loan fees
|
525,146
|
|
510,905
|
|
312,757
|
|
||||||
|
Wholesale scrap jewelry sales
|
107,821
|
|
140,842
|
|
62,638
|
|
||||||
|
Consumer loan and credit services fees
|
56,277
|
|
76,976
|
|
43,851
|
|
||||||
|
Total revenue
|
1,780,858
|
|
1,779,822
|
|
1,088,377
|
|
||||||
|
Cost of revenue:
|
|
|
|
|||||||||
|
Cost of retail merchandise sold
|
696,666
|
|
679,703
|
|
418,556
|
|
||||||
|
Cost of wholesale scrap jewelry sold
|
99,964
|
|
132,794
|
|
53,025
|
|
||||||
|
Consumer loan and credit services loss provision
|
17,461
|
|
19,819
|
|
11,993
|
|
||||||
|
Total cost of revenue
|
814,091
|
|
832,316
|
|
483,574
|
|
||||||
|
Net revenue
|
966,767
|
|
947,506
|
|
604,803
|
|
||||||
|
Expenses and other income:
|
|
|
|
|||||||||
|
Store operating expenses
|
563,321
|
|
552,191
|
|
327,062
|
|
||||||
|
Administrative expenses
|
120,042
|
|
122,473
|
|
96,537
|
|
||||||
|
Depreciation and amortization
|
42,961
|
|
55,233
|
|
31,865
|
|
||||||
|
Interest expense
|
29,173
|
|
24,035
|
|
20,320
|
|
||||||
|
Interest income
|
(2,444
|
)
|
(1,597
|
)
|
(751
|
)
|
||||||
|
Merger and other acquisition expenses
|
7,643
|
|
9,062
|
|
36,670
|
|
||||||
|
(Gain) loss on foreign exchange
|
762
|
|
(317
|
)
|
952
|
|
||||||
|
Loss on extinguishment of debt
|
—
|
|
14,114
|
|
—
|
|
||||||
|
Net gain on sale of common stock of Enova
|
—
|
|
—
|
|
(1,299
|
)
|
||||||
|
Total expenses and other income
|
761,458
|
|
775,194
|
|
511,356
|
|
||||||
|
Income before income taxes
|
205,309
|
|
172,312
|
|
93,447
|
|
||||||
|
Provision for income taxes
|
52,103
|
|
28,420
|
|
33,320
|
|
||||||
|
Net income
|
$
|
153,206
|
|
$
|
143,892
|
|
$
|
60,127
|
|
|||
|
Earnings per share:
|
|
|
|
|||||||||
|
Basic
|
$
|
3.42
|
|
$
|
3.01
|
|
$
|
1.72
|
|
|||
|
Diluted
|
3.41
|
|
3.00
|
|
1.72
|
|
||||||
|
Dividends declared per common share
|
$
|
0.91
|
|
$
|
0.77
|
|
$
|
0.565
|
|
|||
|
The accompanying notes are an integral part
of these consolidated financial statements.
|
||||||||||||
F-3
|
FIRSTCASH, INC.
|
||||||||||||
|
CONSOLIDATED STATEMENTS OF COMPREHENSIVE INCOME
|
||||||||||||
|
(in thousands)
|
||||||||||||
|
|
Year Ended December 31,
|
|||||||||||
|
|
2018
|
2017
|
2016
|
|||||||||
|
Net income
|
$
|
153,206
|
|
$
|
143,892
|
|
$
|
60,127
|
|
|||
|
Other comprehensive income:
|
|
|
|
|||||||||
|
Currency translation adjustment
|
(1,240
|
)
|
7,929
|
|
(41,396
|
)
|
||||||
|
Comprehensive income
|
$
|
151,966
|
|
$
|
151,821
|
|
$
|
18,731
|
|
|||
|
The accompanying notes are an integral part
of these consolidated financial statements. |
||||||||||||
F-4
|
FIRSTCASH, INC.
|
||||||||||||||||||||||||||||||||||||
|
CONSOLIDATED STATEMENTS OF CHANGES IN STOCKHOLDERS’ EQUITY
|
||||||||||||||||||||||||||||||||||||
|
(in thousands)
|
||||||||||||||||||||||||||||||||||||
|
Preferred
Stock
|
Common
Stock
|
Additional
Paid-In
Capital
|
Retained
Earnings
|
Accum-
ulated
Other
Compre-
hensive
Loss
|
Common Stock
Held in Treasury
|
Total
Stock-
holders’
Equity
|
||||||||||||||||||||||||||||||
|
|
Shares
|
Amount
|
Shares
|
Amount
|
|
|
|
Shares
|
Amount
|
|
||||||||||||||||||||||||||
|
Balance at 12/31/2017
|
—
|
|
$
|
—
|
|
49,276
|
|
$
|
493
|
|
$
|
1,220,356
|
|
$
|
494,457
|
|
$
|
(111,877
|
)
|
2,362
|
|
$
|
(128,096
|
)
|
$
|
1,475,333
|
|
|||||||||
|
Shares issued under share-based compensa-tion plan
|
—
|
|
—
|
|
—
|
|
—
|
|
(1,240
|
)
|
—
|
|
—
|
|
(22
|
)
|
1,240
|
|
—
|
|
||||||||||||||||
|
Exercise of stock options
|
—
|
|
—
|
|
—
|
|
—
|
|
(294
|
)
|
—
|
|
—
|
|
(10
|
)
|
694
|
|
400
|
|
||||||||||||||||
|
Share-based compensa-tion expense
|
—
|
|
—
|
|
—
|
|
—
|
|
5,786
|
|
—
|
|
—
|
|
—
|
|
—
|
|
5,786
|
|
||||||||||||||||
|
Net income
|
—
|
|
—
|
|
—
|
|
—
|
|
—
|
|
153,206
|
|
—
|
|
—
|
|
—
|
|
153,206
|
|
||||||||||||||||
|
Dividends paid
|
—
|
|
—
|
|
—
|
|
—
|
|
—
|
|
(40,853
|
)
|
—
|
|
—
|
|
—
|
|
(40,853
|
)
|
||||||||||||||||
|
Currency translation adjustment
|
—
|
|
—
|
|
—
|
|
—
|
|
—
|
|
—
|
|
(1,240
|
)
|
—
|
|
—
|
|
(1,240
|
)
|
||||||||||||||||
|
Purchases of treasury stock
|
—
|
|
—
|
|
—
|
|
—
|
|
—
|
|
—
|
|
—
|
|
3,343
|
|
(274,528
|
)
|
(274,528
|
)
|
||||||||||||||||
|
Balance at 12/31/2018
|
—
|
|
$
|
—
|
|
49,276
|
|
$
|
493
|
|
$
|
1,224,608
|
|
$
|
606,810
|
|
$
|
(113,117
|
)
|
5,673
|
|
$
|
(400,690
|
)
|
$
|
1,318,104
|
|
|||||||||
|
The accompanying notes are an integral part
of these consolidated financial statements.
|
||||||||||||||||||||||||||||||||||||
F-5
|
FIRSTCASH, INC.
|
||||||||||||||||||||||||||||||||||||
|
CONSOLIDATED STATEMENTS OF CHANGES IN STOCKHOLDERS’ EQUITY
|
||||||||||||||||||||||||||||||||||||
|
CONTINUED
|
||||||||||||||||||||||||||||||||||||
|
(in thousands)
|
||||||||||||||||||||||||||||||||||||
|
Preferred
Stock
|
Common
Stock
|
Additional
Paid-In
Capital
|
Retained
Earnings
|
Accum-
ulated
Other
Compre-
hensive
Loss
|
Common Stock
Held in Treasury
|
Total
Stock-
holders’
Equity
|
||||||||||||||||||||||||||||||
|
|
Shares
|
Amount
|
Shares
|
Amount
|
|
|
|
Shares
|
Amount
|
|
||||||||||||||||||||||||||
|
Balance at 12/31/2016
|
—
|
|
$
|
—
|
|
49,276
|
|
$
|
493
|
|
$
|
1,217,969
|
|
$
|
387,401
|
|
$
|
(119,806
|
)
|
769
|
|
$
|
(36,071
|
)
|
$
|
1,449,986
|
|
|||||||||
|
Shares issued under share-based compensa-tion plan
|
—
|
|
—
|
|
—
|
|
—
|
|
(440
|
)
|
—
|
|
—
|
|
(10
|
)
|
440
|
|
—
|
|
||||||||||||||||
|
Exercise of stock options
|
—
|
|
—
|
|
—
|
|
—
|
|
(242
|
)
|
—
|
|
—
|
|
(13
|
)
|
549
|
|
307
|
|
||||||||||||||||
|
Share-based compensa-tion expense
|
—
|
|
—
|
|
—
|
|
—
|
|
3,069
|
|
—
|
|
—
|
|
—
|
|
—
|
|
3,069
|
|
||||||||||||||||
|
Net income
|
—
|
|
—
|
|
—
|
|
—
|
|
—
|
|
143,892
|
|
—
|
|
—
|
|
—
|
|
143,892
|
|
||||||||||||||||
|
Dividends paid
|
—
|
|
—
|
|
—
|
|
—
|
|
—
|
|
(36,836
|
)
|
—
|
|
—
|
|
—
|
|
(36,836
|
)
|
||||||||||||||||
|
Currency translation adjustment
|
—
|
|
—
|
|
—
|
|
—
|
|
—
|
|
—
|
|
7,929
|
|
—
|
|
—
|
|
7,929
|
|
||||||||||||||||
|
Purchases of treasury stock
|
—
|
|
—
|
|
—
|
|
—
|
|
—
|
|
—
|
|
—
|
|
1,616
|
|
(93,014
|
)
|
(93,014
|
)
|
||||||||||||||||
|
Balance at 12/31/2017
|
—
|
|
$
|
—
|
|
49,276
|
|
$
|
493
|
|
$
|
1,220,356
|
|
$
|
494,457
|
|
$
|
(111,877
|
)
|
2,362
|
|
$
|
(128,096
|
)
|
$
|
1,475,333
|
|
|||||||||
|
The accompanying notes are an integral part
of these consolidated financial statements.
|
||||||||||||||||||||||||||||||||||||
F-6
|
FIRSTCASH, INC.
|
||||||||||||||||||||||||||||||||||||
|
CONSOLIDATED STATEMENTS OF CHANGES IN STOCKHOLDERS’ EQUITY
|
||||||||||||||||||||||||||||||||||||
|
CONTINUED
|
||||||||||||||||||||||||||||||||||||
|
(in thousands)
|
||||||||||||||||||||||||||||||||||||
|
Preferred
Stock
|
Common
Stock
|
Additional
Paid-In
Capital
|
Retained
Earnings
|
Accum-
ulated
Other
Compre-
hensive
Loss
|
Common Stock
Held in Treasury
|
Total
Stock-
holders’
Equity
|
||||||||||||||||||||||||||||||
|
|
Shares
|
Amount
|
Shares
|
Amount
|
|
|
|
Shares
|
Amount
|
|
||||||||||||||||||||||||||
|
Balance at 12/31/2015
|
—
|
|
$
|
—
|
|
40,288
|
|
$
|
403
|
|
$
|
202,393
|
|
$
|
643,604
|
|
$
|
(78,410
|
)
|
12,052
|
|
$
|
(336,608
|
)
|
$
|
431,382
|
|
|||||||||
|
Shares issued under share-based compensa-tion plan
|
—
|
|
—
|
|
7
|
|
—
|
|
(3,903
|
)
|
—
|
|
—
|
|
(83
|
)
|
3,903
|
|
—
|
|
||||||||||||||||
|
Shares issued upon merger with Cash America
|
—
|
|
—
|
|
20,181
|
|
202
|
|
1,015,305
|
|
—
|
|
—
|
|
—
|
|
—
|
|
1,015,507
|
|
||||||||||||||||
|
Share-based compensa-tion expense
|
—
|
|
—
|
|
—
|
|
—
|
|
4,174
|
|
—
|
|
—
|
|
—
|
|
—
|
|
4,174
|
|
||||||||||||||||
|
Net income
|
—
|
|
—
|
|
—
|
|
—
|
|
—
|
|
60,127
|
|
—
|
|
—
|
|
—
|
|
60,127
|
|
||||||||||||||||
|
Dividends paid
|
—
|
|
—
|
|
—
|
|
—
|
|
—
|
|
(19,808
|
)
|
—
|
|
—
|
|
—
|
|
(19,808
|
)
|
||||||||||||||||
|
Currency translation adjustment
|
—
|
|
—
|
|
—
|
|
—
|
|
—
|
|
—
|
|
(41,396
|
)
|
—
|
|
—
|
|
(41,396
|
)
|
||||||||||||||||
|
Retirement of treasury stock
|
—
|
|
—
|
|
(11,200
|
)
|
(112
|
)
|
—
|
|
(296,522
|
)
|
—
|
|
(11,200
|
)
|
296,634
|
|
—
|
|
||||||||||||||||
|
Balance at 12/31/2016
|
—
|
|
$
|
—
|
|
49,276
|
|
$
|
493
|
|
$
|
1,217,969
|
|
$
|
387,401
|
|
$
|
(119,806
|
)
|
769
|
|
$
|
(36,071
|
)
|
$
|
1,449,986
|
|
|||||||||
|
The accompanying notes are an integral part
of these consolidated financial statements.
|
||||||||||||||||||||||||||||||||||||
F-7
|
FIRSTCASH, INC.
|
|||||||||||
|
CONSOLIDATED STATEMENTS OF CASH FLOWS
|
|||||||||||
|
(in thousands)
|
|||||||||||
|
Year Ended December 31,
|
|||||||||||
|
|
2018
|
2017
|
2016
|
||||||||
|
Cash flow from operating activities:
|
|
|
|||||||||
|
Net income
|
$
|
153,206
|
|
$
|
143,892
|
|
$
|
60,127
|
|
||
|
Adjustments to reconcile net income to net cash flow provided by operating activities:
|
|
|
|
||||||||
|
Non-cash portion of consumer loan credit loss provision
|
9,405
|
|
12,727
|
|
5,970
|
|
|||||
|
Share-based compensation expense
|
5,786
|
|
3,069
|
|
4,174
|
|
|||||
|
Net gain on sale of common stock of Enova
|
—
|
|
—
|
|
(1,299
|
)
|
|||||
|
Depreciation and amortization expense
|
42,961
|
|
55,233
|
|
31,865
|
|
|||||
|
Asset impairments related to consumer loan operations
|
1,514
|
|
—
|
|
—
|
|
|||||
|
Amortization of debt issuance costs
|
1,920
|
|
1,838
|
|
1,427
|
|
|||||
|
Amortization of favorable/(unfavorable) lease intangibles, net
|
(259
|
)
|
(976
|
)
|
(232
|
)
|
|||||
|
Loss on extinguishment of debt
|
—
|
|
14,114
|
|
—
|
|
|||||
|
Deferred income taxes, net
|
7,427
|
|
(14,497
|
)
|
11,912
|
|
|||||
|
Changes in operating assets and liabilities, net of business combinations:
|
|
|
|
||||||||
|
Fees and service charges receivable
|
(432
|
)
|
(1,411
|
)
|
1,776
|
|
|||||
|
Inventories
|
3,321
|
|
16,193
|
|
(4,619
|
)
|
|||||
|
Prepaid expenses and other assets
|
681
|
|
13,702
|
|
4,878
|
|
|||||
|
Accounts payable, accrued expenses and other liabilities
|
3,077
|
|
(35,135
|
)
|
(16,335
|
)
|
|||||
|
Income taxes
|
14,822
|
|
11,608
|
|
(2,790
|
)
|
|||||
|
Net cash flow provided by operating activities
|
243,429
|
|
220,357
|
|
96,854
|
|
|||||
|
Cash flow from investing activities:
|
|
|
|
||||||||
|
Loan receivables, net of cash repayments
|
10,125
|
|
40,735
|
|
(16,072
|
)
|
|||||
|
Purchases of furniture, fixtures, equipment and improvements
|
(35,677
|
)
|
(25,971
|
)
|
(20,456
|
)
|
|||||
|
Purchases of store real property
|
(19,996
|
)
|
(11,164
|
)
|
(13,407
|
)
|
|||||
|
Portion of aggregate merger consideration paid in cash, net of cash acquired
|
—
|
|
—
|
|
(8,250
|
)
|
|||||
|
Acquisitions of pawn stores, net of cash acquired
|
(113,699
|
)
|
(2,203
|
)
|
(29,866
|
)
|
|||||
|
Proceeds from sale of common stock of Enova
|
—
|
|
—
|
|
62,084
|
|
|||||
|
Net cash flow provided by (used in) investing activities
|
(159,247
|
)
|
1,397
|
|
(25,967
|
)
|
|||||
|
Cash flow from financing activities:
|
|
|
|
||||||||
|
Borrowings from revolving unsecured credit facility
|
416,000
|
|
206,000
|
|
400,000
|
|
|||||
|
Repayments of revolving unsecured credit facility
|
(228,000
|
)
|
(359,000
|
)
|
(198,000
|
)
|
|||||
|
Repayments of debt assumed with merger and other acquisitions
|
—
|
|
—
|
|
(238,532
|
)
|
|||||
|
Issuance of senior unsecured notes
|
—
|
|
300,000
|
|
—
|
|
|||||
|
Repurchase/redemption of senior unsecured notes
|
—
|
|
(200,000
|
)
|
—
|
|
|||||
|
Repurchase/redemption premiums paid on senior unsecured notes
|
—
|
|
(10,895
|
)
|
—
|
|
|||||
|
Debt issuance costs paid
|
(948
|
)
|
(5,342
|
)
|
(2,373
|
)
|
|||||
|
Purchases of treasury stock
|
(273,660
|
)
|
(91,740
|
)
|
—
|
|
|||||
|
Proceeds from exercise of share-based compensation awards
|
400
|
|
307
|
|
—
|
|
|||||
|
Dividends paid
|
(40,853
|
)
|
(36,836
|
)
|
(19,808
|
)
|
|||||
|
Net cash flow used in financing activities
|
(127,061
|
)
|
(197,506
|
)
|
(58,713
|
)
|
|||||
F-8
|
FIRSTCASH, INC.
|
|||||||||||
|
CONSOLIDATED STATEMENTS OF CASH FLOWS
|
|||||||||||
|
CONTINUED
|
|||||||||||
|
(in thousands)
|
|||||||||||
|
Year Ended December 31,
|
|||||||||||
|
2018
|
2017
|
2016
|
|||||||||
|
Effect of exchange rates on cash
|
249
|
|
220
|
|
(9,173
|
)
|
|||||
|
Change in cash and cash equivalents
|
(42,630
|
)
|
24,468
|
|
3,001
|
|
|||||
|
Cash and cash equivalents at beginning of the year
|
114,423
|
|
89,955
|
|
86,954
|
|
|||||
|
Cash and cash equivalents at end of the year
|
$
|
71,793
|
|
$
|
114,423
|
|
$
|
89,955
|
|
||
|
Supplemental disclosure of cash flow information:
|
|||||||||||
|
Cash paid during the period for:
|
|||||||||||
|
Interest
|
$
|
27,121
|
|
$
|
24,301
|
|
$
|
18,663
|
|
||
|
Income taxes
|
29,597
|
|
29,813
|
|
21,535
|
|
|||||
|
Supplemental disclosure of non-cash investing and financing activity:
|
|||||||||||
|
Non-cash transactions in connection with pawn loans settled through forfeitures of collateral transferred to inventories
|
$
|
492,743
|
|
$
|
436,705
|
|
$
|
265,060
|
|
||
|
Amounts payable assumed in connection with pawn acquisitions
|
—
|
|
—
|
|
2,554
|
|
|||||
|
Issuance of common stock associated with the merger
|
—
|
|
—
|
|
1,015,507
|
|
|||||
|
Revolving unsecured credit facility assumed as a result of the merger
|
—
|
|
—
|
|
(232,000
|
)
|
|||||
|
Notes payable assumed in other acquisitions
|
—
|
|
—
|
|
(6,630
|
)
|
|||||
|
The accompanying notes are an integral part
of these consolidated financial statements.
|
|||||||||||
F-9
FIRSTCASH, INC.
NOTES TO CONSOLIDATED FINANCIAL STATEMENTS
NOTE
1
-
ORGANIZATION AND NATURE OF THE COMPANY
FirstCash, Inc., (together with its wholly-owned subsidiaries, the “Company”) is incorporated in the state of Delaware. The Company is engaged primarily in the operation of pawn stores, which lend money on the collateral of pledged personal property and retail previously owned merchandise acquired through pawn loan forfeitures and purchases directly from the general public. The Company also retails limited quantities of new or refurbished merchandise obtained directly from wholesalers and manufacturers. Certain of the Company’s pawn stores also offer short-term consumer loans and credit services, as do the Company’s stand-alone consumer lending stores. As of
December 31, 2018
, the Company owned and operated
2,473
stores in
24
U.S. states and the District of Columbia, all
32
states in Mexico and the countries of Guatemala, El Salvador and Colombia.
On September 1, 2016, the Company completed its merger with Cash America International, Inc. (“Cash America”), whereby Cash America merged with and into a wholly owned subsidiary of the Company (the “Merger”). The accompanying audited consolidated results of operations for the year ended December 31, 2018 and 2017 include the results of operations for Cash America for the full respective period, while the comparable 2016 period includes the results of operations for Cash America for the period September 2, 2016 to December 31, 2016, affecting comparability of fiscal 2018 and 2017 amounts to 2016 amounts.
NOTE
2
-
SUMMARY OF SIGNIFICANT ACCOUNTING POLICIES
The following is a summary of significant accounting policies followed in the preparation of these financial statements:
Principles of consolidation
- The accompanying consolidated financial statements include the accounts of FirstCash, Inc. and its wholly-owned subsidiaries. The Company regularly makes acquisitions and the results of operations for the acquired stores have been consolidated since the acquisition dates. All significant intercompany accounts and transactions have been eliminated. See Note
3
.
Cash and cash equivalents
- The Company considers any highly liquid investments with an original maturity of three months or less at the date of acquisition to be cash equivalents. As of
December 31, 2018
, the amount of cash associated with indefinitely reinvested foreign earnings was
$28.2 million
, which is primarily held in Mexican pesos.
Customer loans and revenue recognition
- Pawn loans typically have a term of
30
days and are secured by the customer’s pledge of tangible personal property, which the Company holds during the term of the loan. In certain markets, the Company also provides pawn loans collateralized by automobiles, which typically remain in the possession of the customer. If a pawn loan defaults, the Company relies on the sale of the pawned property to recover the principal amount of an unpaid pawn loan, plus a yield on the investment, because the Company’s pawn loans are non-recourse against the customer. The customer’s creditworthiness does not affect the Company’s financial position or results of operations. The Company accrues pawn loan fee revenue on a constant-yield basis over the life of the pawn loan for all pawns for which the Company deems collection to be probable based on historical pawn redemption statistics. If the pawn loan is not repaid, the principal amount loaned becomes the carrying value of the forfeited collateral, which is recovered through sales to other customers at prices above the carrying value.
The Company’s pawn merchandise sales are primarily retail sales to the general public in its pawn stores. The Company acquires pawn merchandise inventory through forfeited pawn loans and through purchases of used goods directly from the general public. The Company also retails limited quantities of new or refurbished merchandise obtained directly from wholesalers and manufacturers. The Company records sales revenue at the time of the sale. The Company presents merchandise sales net of any sales or value-added taxes collected. The Company does not provide direct financing to customers for the purchase of its merchandise, but does permit its customers to purchase merchandise on an interest-free layaway plan. Should the customer fail to make a required payment pursuant to a layaway plan, the previous payments are typically forfeited to the Company. Interim payments from customers on layaway sales are recorded as deferred revenue and subsequently recorded as retail merchandise sales revenue when the merchandise is delivered to the customer upon receipt of final payment or when previous payments are forfeited to the Company. Some jewelry is processed at third-party facilities and the precious metal and diamond content is sold at either prevailing market commodity prices or a previously agreed upon price with a commodity buyer. The Company records revenue from these wholesale scrap jewelry transactions when a price has been agreed upon and the Company ships the commodity to the buyer.
F-10
Consumer loans are unsecured cash advances and installment loans with terms that typically range from
7
to
365
days. The Company accrues consumer loan fees on a constant-yield basis over the term of the consumer loan. The Company offers fee-based credit services organization programs (“CSO Programs”) to assist consumers in obtaining extensions of credit from independent, non-bank, consumer lending companies (the “Independent Lenders”). The Company’s stand-alone consumer loan stores and select pawn stores in the states of Texas and Ohio offer the CSO Programs. The Company’s CSO Programs comply with the respective jurisdiction’s credit services organization act, credit access business law or a similar statute. The Company recognizes credit services fees ratably over the life of the extension of credit made by the Independent Lenders. The extensions of credit made by the Independent Lenders to credit services customers typically have terms of
7
to
365
days.
Credit loss provisions
- The Company has determined no allowance related to credit losses on pawn loans is required, as the fair value of the pledged collateral is significantly in excess of the pawn loan amount. The Company maintains an allowance for credit losses on consumer loans on an aggregate basis at a level it considers sufficient to cover estimated losses in the collection of its consumer loans. The allowance for credit losses is based primarily upon historical credit loss experience, with consideration given to recent credit loss trends and changes in loan characteristics (e.g., average amount financed and term), delinquency levels, collateral values, economic conditions and underwriting and collection practices. The allowance for credit losses is periodically reviewed by management with any changes reflected in current operations.
The Company fully reserves or charges off consumer loans once the loan has been classified as delinquent for
60 days
. Short-term loans are considered delinquent when payment of an amount due is not made as of the due date. Installment loans are considered delinquent when a customer misses
two
payments. If a loan is estimated to be uncollectible before it is fully reserved, it is charged off at that point. Recoveries on loans previously charged to the allowance, including the sale of delinquent loans to unaffiliated third parties, are credited to the allowance when collected or when sold to a third party. The Company generally does not accrue interest on delinquent consumer loans. In addition, delinquent consumer loans generally may not be renewed, and if, during its attempt to collect on a delinquent consumer loan, the Company allows additional time for payment through a payment plan or a promise to pay, it is still considered delinquent. Generally, all payments received are first applied against accrued but unpaid interest and fees and then against the principal balance of the loan.
Under the CSO Programs, the Company assists customers in applying for a short-term extension of credit from Independent Lenders and issues the Independent Lenders a guarantee for the repayment of the extension of credit. The Company is required to recognize, at the inception of the guarantee, a liability for the fair value of the obligation undertaken by issuing the guarantee. According to the guarantee, if the borrower defaults on the extension of credit, the Company will pay the Independent Lenders the principal, accrued interest, insufficient funds and late fee, if applicable, all of which the Company records as a component of its credit loss provision. The Company is entitled to seek recovery, directly from its customers, of the amounts it pays the Independent Lenders in performing under the guarantees. The Company records the estimated fair value of the liability in accrued liabilities. The estimated fair value of the liability is periodically reviewed by management with any changes reflected in current operations.
Although it is at least reasonably possible that events or circumstances could occur in the future that are not presently foreseen which could cause actual credit losses to be materially different from the recorded allowance for credit losses, the Company believes it has given appropriate consideration to all relevant factors and has made reasonable assumptions in determining the allowance for credit losses.
Foreign currency transactions
- The Company has significant operations in Latin America, where in Mexico, Guatemala and Colombia the functional currency is the Mexican peso, Guatemalan quetzal and Colombian peso, respectively. Accordingly, the assets and liabilities of these subsidiaries are translated into U.S. dollars at the exchange rate in effect at each balance sheet date, and the resulting adjustments are accumulated in other comprehensive income (loss) as a separate component of stockholders’ equity. Revenues and expenses are translated at the average exchange rates occurring during the respective fiscal period. Prior to translation, U.S. dollar-denominated transactions of the foreign subsidiaries are remeasured into their functional currency using current rates of exchange for monetary assets and liabilities and historical rates of exchange for non-monetary assets and liabilities. Gains and losses from remeasurement of dollar-denominated monetary assets and liabilities in Mexico, Guatemala and Colombia are included in (gain) loss on foreign exchange in the consolidated statements of income. Deferred taxes are not currently provided on cumulative foreign currency translation adjustments, as the Company indefinitely reinvests earnings of its foreign subsidiaries. The Company also has operations in El Salvador where the reporting and functional currency is the U.S. dollar.
The average value of the Mexican peso to the U.S. dollar exchange rate for fiscal
2018
was
19.2
to
1
, compared to
18.9
to
1
in fiscal
2017
and
18.7
to
1
in fiscal
2016
. The average value of the Guatemalan quetzal to the U.S. dollar exchange rate for fiscal
2018
was
7.5
to
1
, compared to
7.4
to
1
in fiscal
2017
and
7.6
to
1
in fiscal
2016
. The average value of the Colombian peso to the U.S. dollar exchange rate for fiscal
2018
was
2,956
to
1
, compared to
2,951
to
1
in fiscal
2017
and
3,052
to
1
in fiscal
2016
.
F-11
Store operating expenses
- Costs incurred in operating the pawn stores and consumer loan stores have been classified as store operating expenses. Operating expenses include salary and benefit expense of store-level employees, occupancy costs, bank charges, security, insurance, utilities, supplies and other costs incurred by the stores.
Layaway and deferred revenue
- Interim payments from customers on layaway sales are credited to deferred revenue and subsequently recorded as retail merchandise sales revenue when the merchandise is delivered to the customer upon receipt of final payment or when the previous payments are forfeited to the Company. Layaway payments from customers are included in customer deposits in the accompanying consolidated balance sheets.
Inventories
- Inventories represent merchandise acquired from forfeited pawns and merchandise purchased directly from the general public. The Company also retails limited quantities of new or refurbished merchandise obtained directly from wholesalers and manufacturers. Inventories from forfeited pawns are recorded at the amount of the pawn principal on the unredeemed goods, exclusive of accrued interest. Inventories purchased directly from customers, wholesalers and manufacturers are recorded at cost. The cost of inventories is determined on the specific identification method. Inventories are stated at the lower of cost or net realizable value and, accordingly, inventory valuation allowances are established if inventory carrying values are in excess of estimated selling prices, net of direct costs of disposal. Management has evaluated inventories and determined that a valuation allowance is not necessary.
Property and equipment
- Property and equipment are recorded at cost. Depreciation is recorded on the straight-line method generally based on estimated useful lives of
30
to
40
years for buildings and
three
to
five
years for furniture, fixtures and equipment.
The costs of improvements on leased stores are capitalized as leasehold improvements and are depreciated using the straight-line method over the applicable lease period, or useful life, if shorter. Maintenance and repairs are charged to expense as incurred and renewals and betterments are charged to the appropriate property and equipment accounts. Upon sale or retirement of depreciable assets, the cost and related accumulated depreciation is removed from the accounts, and the resulting gain or loss is included in the results of operations in the period the assets are sold or retired.
Goodwill and other indefinite-lived intangible assets
- Goodwill represents the excess of the purchase price over the fair value of the net assets acquired in each business combination. The Company performs its goodwill impairment assessment annually as of December 31, and between annual assessments if an event occurs or circumstances change that would more likely than not reduce the fair value of a reporting unit below its carrying amount. The Company’s reporting units, which are tested for impairment, are U.S. operations and Latin America operations. The Company assesses goodwill for impairment at a reporting unit level by first assessing a range of qualitative factors, including, but not limited to, macroeconomic conditions, industry conditions, the competitive environment, changes in the market for the Company’s products and services, regulatory and political developments, entity specific factors, such as strategy and changes in key personnel, and overall financial performance. If, after completing this assessment, it is determined that it is more likely than not that the fair value of a reporting unit is less than its carrying value, the Company proceeds to the two-step impairment testing methodology. See Note
13
.
The Company’s material indefinite-lived intangible assets consist of trade names and pawn licenses. The Company performs its indefinite-lived intangible asset impairment assessment annually as of December 31, and between annual assessments if an event occurs or circumstances change that would more likely than not reduce the fair value of a reporting unit below its carrying amount. See Note
13
.
Long-lived assets
- Property and equipment, intangible assets subject to amortization and non-current assets are reviewed for impairment whenever events or changes in circumstances indicate that the net book value of the asset may not be recoverable. An impairment loss is recognized if the sum of the expected future cash flows (undiscounted and before interest) from the use of the asset is less than the net book value of the asset. Generally, the amount of the impairment loss is measured as the difference between the net book value of the asset and the estimated fair value of the related asset. As a result of certain expected regulatory impacts to the Company’s consumer loan operations, the Company recorded a fixed asset impairment charge of approximately
$1.5 million
related to certain stores primarily offering consumer loan products during the fourth quarter of
2018
, which was not material to the Company’s consolidated financial statements. The Company did not record any impairment loss for the years ended December 31,
2017
and
2016
.
Fair value of financial instruments
- The fair value of financial instruments is determined by reference to various market data and other valuation techniques, as appropriate. Financial assets and liabilities are classified based on the lowest level of input that is significant to the fair value measurement. The Company’s assessment of the significance of a particular input to the fair value measurement requires judgment, and may affect the valuation of the fair value of assets and liabilities and their placement within the fair value hierarchy levels. All fair value measurements related to acquisitions are level 3, non-recurring measurements, based on non-observable inputs. Unless otherwise disclosed, the fair values of financial instruments approximate their recorded values, due primarily to their short-term nature. See Note
6
.
F-12
Income taxes
- The Company uses the asset and liability method of computing deferred income taxes on all material temporary differences. Temporary differences are the differences between the reported amounts of assets and liabilities and their tax bases. The Tax Cuts and Jobs Act (“Tax Act”), which was enacted in December 2017, impacted the Company by, among other things, reducing its U.S. corporate income tax rate from
35%
to
21%
starting in 2018. See Note
11
.
Advertising
- The Company expenses the costs of advertising the first time the advertising takes place. Advertising expense for the fiscal years ended December 31,
2018
,
2017
and
2016
, was
$1.4 million
,
$1.8 million
, and
$1.9 million
, respectively.
Share-based compensation
- All share-based payments to employees and directors are recognized in the financial statements based on the grant date or if applicable, the subsequent modification date fair value. The Company recognizes compensation cost net of estimated forfeitures and recognizes the compensation cost for only those awards expected to vest on a straight-line basis over the requisite service period of the award, which is generally the vesting term. The Company records share-based compensation cost as an administrative expense. See Note
14
.
Forward sales commitments
- The Company periodically uses forward sale agreements with a major gold bullion bank to sell a portion of the expected amount of scrap gold and silver jewelry, which is typically broken or of low retail value, produced in the normal course of business from its liquidation of such merchandise. These commitments qualify for an exemption from derivative accounting as normal sales, based on historical terms, conditions and quantities, and are therefore not recorded on the Company's balance sheet.
Earnings per share
- Basic earnings per share is computed by dividing net income by the weighted-average number of shares outstanding during the year. Diluted earnings per share is calculated by giving effect to the potential dilution that could occur if securities or other contracts to issue common shares were exercised and converted into common shares during the year.
The following table sets forth the computation of basic and diluted earnings per share (in thousands, except per share amounts):
|
Year Ended December 31,
|
|||||||||||
|
|
2018
|
2017
|
2016
|
||||||||
|
Numerator:
|
|
|
|
||||||||
|
Net income
|
$
|
153,206
|
|
$
|
143,892
|
|
$
|
60,127
|
|
||
|
Denominator:
|
|
|
|
||||||||
|
Weighted-average common shares for calculating basic earnings per share
|
44,777
|
|
47,854
|
|
34,997
|
|
|||||
|
Effect of dilutive securities:
|
|
|
|
||||||||
|
Stock options and restricted stock unit awards
|
107
|
|
34
|
|
7
|
|
|||||
|
Weighted-average common shares for calculating diluted earnings per share
|
44,884
|
|
47,888
|
|
35,004
|
|
|||||
|
Earnings per share:
|
|
|
|
||||||||
|
Basic
|
$
|
3.42
|
|
$
|
3.01
|
|
$
|
1.72
|
|
||
|
Diluted
|
3.41
|
|
3.00
|
|
1.72
|
|
|||||
Pervasiveness of estimates
- The preparation of financial statements in conformity with accounting principles generally accepted in the United States of America requires management to make estimates and assumptions that affect the reported amounts of assets and liabilities, and related revenue and expenses, and the disclosure of gain and loss contingencies at the date of the financial statements. Such estimates and assumptions are subject to a number of risks and uncertainties, which may cause actual results to differ materially from the Company’s estimates. Significant estimates include allowances for doubtful accounts receivable and related credit loss provisions, impairment of goodwill and other intangible assets and current and deferred tax assets and liabilities.
Reclassifications
- (Gain) loss on foreign exchange of
$(0.3) million
and
$1.0 million
for fiscal
2017
and
2016
, respectively, was reclassified on the consolidated statements of income in order to conform with the presentation for the year ended December 31, 2018. The (gain) loss on foreign exchange was reclassified from store operating expenses and reported separately on the consolidated statements of income.
F-13
Purchases of store real property of
$11.2 million
and
$13.4 million
for fiscal
2017
and
2016
, respectively, were reclassified on the consolidated statements of cash flows in order to conform with the presentation for the year ended December 31, 2018. Purchases of store real property were reclassified from purchases of furniture, fixtures, equipment and improvements and reported separately on the consolidated statements of cash flows. As a result, purchases of furniture, fixtures, equipment and improvements include expenditures for improvements to existing stores, de novo store openings and corporate assets, and excludes discretionary store real property purchases.
Recent accounting pronouncements
- In May 2014, the Financial Accounting Standards Board issued ASU No. 2014-09, “Revenue from Contracts with Customers (Topic 606)” (“ASU 2014-09”). ASU 2014-09 is a comprehensive revenue recognition model that requires a company to recognize revenue to depict the transfer of goods or services to a customer at an amount that reflects the consideration it expects to receive in exchange for those goods or services. ASU 2014-09 also requires additional disclosure about the nature, amount, timing and uncertainty of revenue and cash flows arising from customer contracts, including significant judgments and changes in judgments and assets recognized from costs incurred to obtain or fulfill a contract. In August 2015, the Financial Accounting Standards Board issued ASU No. 2015-14, “Revenue from Contracts with Customers (Topic 606),” which delayed the effective date of ASU 2014-09 by one year. In addition, between March 2016 and December 2016, the Financial Accounting Standards Board issued ASU No. 2016-08, “Revenue from Contracts with Customers - Principal versus Agent Considerations (Reporting revenue gross versus net)” (“ASU 2016-08”), ASU No. 2016-10, “Identifying Performance Obligations and Licensing” (“ASU 2016-10”), ASU No. 2016-12, “Revenue from Contracts with Customers (Topic 606): Narrow-Scope Improvements and Practical Expedients” (“ASU 2016-12”), and ASU No. 2016-20, “Technical Corrections and Improvements to Topic 606, Revenue from Contracts with Customers” (“ASU 2016-20”). ASU 2016-08, ASU 2016-10, ASU 2016-12 and ASU 2016-20 clarify certain aspects of ASU 2014-09 and provide additional implementation guidance. ASU 2014-09, ASU 2016-08, ASU 2016-10, ASU 2016-12 and ASU 2016-20 (collectively, “ASC 606”) became effective for annual reporting periods (including interim periods within those periods) beginning after December 15, 2017 for public companies. Entities are permitted to adopt ASC 606 using one of two methods: (1) full retrospective adoption, meaning the standard is applied to all periods presented, or (2) modified retrospective adoption, meaning the cumulative effect of applying the new standard is recognized as an adjustment to the opening retained earnings balance.
The Company adopted ASC 606 as of January 1, 2018 using the modified retrospective method. The adoption of ASC 606 did not impact the Company’s revenue recognition for pawn loan fees, consumer loan fees or credit services fees, as each of these revenue streams is outside the scope of ASC 606. Further, the Company has not identified any impacts to its consolidated financial statements that were material as a result of the adoption of ASC 606 for its retail merchandise sales or wholesale scrap jewelry sales revenue streams. The Company has not changed the presentation of its consolidated financial statements for assets, liabilities, or revenues from contracts with customers, nor has the Company recognized any cumulative effect adjustment as a result of the adoption of ASC 606.
In February 2016, the Financial Accounting Standards Board issued ASU No. 2016-02, “Leases (Topic 842)” (“ASU 2016-02”). ASU 2016-02 requires a lessee to recognize, in the statement of financial position, a liability to make lease payments (the lease liability) and a right-to-use asset representing its right to use the underlying asset for the lease term. Leases will be classified as either financing or operating, with classification affecting the pattern of expense recognition in the income statement. Lessor accounting remains largely unchanged. In July 2018, the Financial Accounting Standards Board issued ASU No. 2018-10, “Codification Improvements to Topic 842, Leases” (“ASU 2018-10”) which updates narrow aspects of the guidance issued in ASU 2016-02. In July 2018, the Financial Accounting Standards Board issued ASU No. 2018-11, “Leases (Topic 842) Targeted Improvements” (“ASU 2018-11”) which provides an optional transition method that allows entities to initially apply the new standard at the adoption date and recognize a cumulative-effect adjustment to the opening balance of retained earnings in the period of adoption without restating prior periods. In December 2018, the Financial Accounting Standards Board issued ASU No. 2018-20, “Leases (Topic 842): Narrow-Scope Improvements for Lessors” (“ASU 2018-20”) which is expected to reduce a lessor’s implementation and ongoing costs associated with applying ASU 2016-02. ASU 2016-02, ASU 2018-10, ASU 2018-11 and ASU 2018-20 are effective for annual reporting periods beginning after December 15, 2018, and interim periods within those annual periods, with early adoption permitted. The Company is currently assessing the potential impact of ASU 2016-02, ASU 2018-10, ASU 2018-11 and ASU 2018-20 on its consolidated financial statements, though the adoption will result in a material increase in the assets and liabilities reflected on its consolidated balance sheets. In addition, the Company has approximately 110 leases in Mexico which are denominated in U.S. dollars. The lease liability of these U.S. dollar denominated leases, which will be considered a monetary liability, will be remeasured into Mexican pesos using current rates of exchange which could create volatility in the Company’s consolidated results of operations from the recognition of foreign currency exchange gains or losses.
In June 2016, the Financial Accounting Standards Board issued ASU No. 2016-13, “Financial Instruments - Credit Losses (Topic 326): Measurement of Credit Losses on Financial Instruments” (“ASU 2016-13”). ASU 2016-13 amends the impairment model by requiring entities to use a forward-looking approach based on expected losses to estimate credit losses on certain types of financial instruments, including trade receivables. In November 2018, the Financial Accounting Standards Board issued ASU No.
F-14
2018-19, “Codification Improvements to Topic 326, Financial Instruments - Credit Losses” (“ASU 2018-19”) which clarifies that receivables arising from operating leases are accounted for using lease guidance and not as financial instruments. ASU 2016-13 and ASU 2018-19 are effective for public entities for fiscal years beginning after December 15, 2019, with early adoption permitted. The Company is currently assessing the potential impact of ASU 2016-13 and ASU 2018-19 on its consolidated financial statements.
In August 2016, the Financial Accounting Standards Board issued ASU No. 2016-15, “Statement of Cash Flows (Topic 230): Classification of Certain Cash Receipts and Cash Payments” (“ASU 2016-15”). ASU 2016-15 clarifies how companies present and classify certain cash receipts and cash payments in the statement of cash flows. ASU 2016-15 addresses eight specific cash flow issues with the objective of reducing existing diversity in practice. ASU 2016-15 became effective for public entities for fiscal years beginning after December 15, 2017. The adoption of ASU 2016-15 did not have a material effect on the Company’s consolidated financial statements or financial statement disclosures.
In January 2017, the Financial Accounting Standards Board issued ASU No. 2017-01, “Business Combinations (Topic 805) - Clarifying the Definition of a Business” (“ASU 2017-01”). ASU 2017-01 provides amendments to clarify the definition of a business and affects all companies and other reporting organizations that must determine whether they have acquired or sold a business. The amendments are intended to help companies and other organizations evaluate whether transactions should be accounted for as acquisitions (or disposals) of assets or businesses. The guidance became effective for public business entities for fiscal years beginning after December 15, 2017, and interim periods within those fiscal years and should be applied prospectively as of the beginning of the period of adoption. The adoption of ASU 2017-01 did not have a material effect on the Company’s current financial position, results of operations or financial statement disclosures.
In January 2017, the Financial Accounting Standards Board issued ASU No. 2017-04, “Intangibles - Goodwill and Other (Topic 350) - Simplifying the Test for Goodwill Impairment” (“ASU 2017-04”). These amendments eliminate step 2 from the goodwill impairment test. The amendments also eliminate the requirements for any reporting unit with a zero or negative carrying amount to perform a qualitative assessment and, if it fails that qualitative test, to perform step 2 of the goodwill impairment test. An entity still has the option to perform the qualitative assessment for a reporting unit to determine if the quantitative impairment test is necessary. The guidance is effective for annual or any interim goodwill impairment tests in fiscal years beginning after December 15, 2019. Early adoption is permitted for interim or annual goodwill impairment tests performed on testing dates after January 1, 2017 and should be adopted on a prospective basis. The Company does not expect ASU 2017-04 to have a material effect on the Company’s current financial position, results of operations or financial statement disclosures.
In March 2018, the Financial Accounting Standards Board issued ASU No 2018-05, “Income Taxes (Topic 740): Amendments to SEC Paragraphs Pursuant to SEC Staff Accounting Bulletin No. 118” (“ASU 2018-05”), which became effective immediately. ASU 2018-05 adds various SEC paragraphs pursuant to the issuance of the December 2017 SEC Staff Accounting Bulletin No. 118, Income Tax Accounting Implications of the Tax Cuts and Jobs Act (“SAB 118”). See Note
11
.
In June 2018, the Financial Accounting Standards Board issued ASU No. 2018-07, “Compensation-Stock Compensation (Topic 718) - Improvements to Nonemployee Share-Based Payment Accounting” (“ASU 2018-07”). ASU 2018-07 simplifies the accounting for nonemployee share-based payment transactions. The amendments specify that Topic 718 applies to all share-based payment transactions in which a grantor acquires goods or services to be used or consumed in a grantor’s own operations by issuing share-based payment awards. ASU 2018-07 is effective for public entities for fiscal years beginning after December 15, 2018, with early adoption permitted, but no earlier than a company’s adoption of ASC 606. The Company does not expect ASU 2018-07 to have a material effect on the Company’s current financial position, results of operations or financial statement disclosures.
In July 2018, the Financial Accounting Standards Board issued ASU No. 2018-09, “Codification Improvements” (“ASU 2018-09”). ASU 2018-09 does not prescribe any new accounting guidance, but instead makes minor improvements and clarifications of several different Financial Accounting Standards Board Accounting Standards Codification areas based on comments and suggestions made by various stakeholders. Certain updates are applicable immediately while others provide for a transition period to adopt in fiscal years beginning after December 15, 2018. The Company does not expect ASU 2018-09 to have a material effect on the Company’s current financial position, results of operations or financial statement disclosures.
In August 2018, the Financial Accounting Standards Board issued ASU No. 2018-13, “Fair Value Measurement (Topic 820): Disclosure Framework-Changes to the Disclosure Requirements for Fair Value Measurement” (“ASU 2018-13”). ASU 2018-13 modifies the disclosure requirements on fair value measurements. ASU 2018-13 is effective for public entities for fiscal years beginning after December 15, 2019, with early adoption permitted for any removed or modified disclosures. The removed and modified disclosures will be adopted on a retrospective basis and the new disclosures will be adopted on a prospective basis. The Company does not expect ASU 2018-13 to have a material effect on the Company’s current financial position, results of operations or financial statement disclosures.
F-15
NOTE
3
-
ACQUISITIONS
2018
Acquisitions
Consistent with the Company’s strategy to continue its expansion of pawn operations in selected markets, during fiscal
2018
the Company acquired
366
pawn stores located in Mexico in
six
separate transactions and
27
pawn stores located in the U.S. in
nine
separate transactions. The aggregate purchase prices for these acquisitions totaled
$125.4 million
, net of cash acquired and subject to future post-closing adjustments. The purchases were composed of
$113.7 million
in cash paid during fiscal 2018 and remaining short-term amounts payable to the sellers of approximately
$11.7 million
.
In regard to the Mexico acquisitions, in February 2018 the Company acquired the operating assets of
126
pawn stores operating under the Prendamex brand. The seller of these pawn stores also owned and operated a franchise business whereby independent franchisees entered into individual franchise agreements allowing the franchisee, among other things, the use of the Prendamex brand. Subsequent to the February transaction, the Company entered into
five
additional asset acquisitions in 2018 of stores owned by certain of the independent Prendamex franchisees, representing aggregate purchases of
240
locations. Each of the
five
acquisitions involved different independent ownerships groups and were individually negotiated and completed separately during the months of June, August, September, October and November. Also in conjunction with the February transaction, the Company assumed certain of the franchisor rights and obligations from the original Prendamex seller representing a total of
221
franchised store locations under which the Company continues to operate as the franchisor of these locations as of December 31, 2018.
The purchase price of each of the 2018 acquisitions was allocated to assets acquired and liabilities assumed based upon the estimated fair market values at the date of each acquisition. The excess purchase price over the estimated fair market value of the net assets acquired has been recorded as goodwill. The goodwill arising from these acquisitions consists largely of the synergies and economies of scale expected from combining the operations of the Company and the pawn stores acquired.
The estimated fair value of the assets acquired and liabilities assumed are preliminary, as the Company is gathering information to finalize the valuation of these assets and liabilities. The preliminary allocation of the aggregate purchase price of the Company’s individually immaterial acquisitions during fiscal
2018
is as follows (in thousands):
|
Pawn loans
|
$
|
21,391
|
|
|
Pawn loan fees receivable
|
2,300
|
|
|
|
Inventories
|
10,826
|
|
|
|
Other current assets
|
991
|
|
|
|
Property and equipment
|
3,983
|
|
|
|
Goodwill
(1)
|
86,968
|
|
|
|
Intangible assets
(2)
|
934
|
|
|
|
Other non-current assets
|
168
|
|
|
|
Current liabilities
|
(2,171
|
)
|
|
|
Aggregate purchase price
|
$
|
125,390
|
|
|
(1)
|
Goodwill associated with the U.S. operations segment and the Latin America operations segment was
$15.6 million
and
$71.4 million
, respectively. Substantially all of the goodwill is expected to be deductible for respective U.S. and Mexico income tax purposes.
|
|
(2)
|
Intangible assets primarily consist of customer relationships, which are generally amortized over
five years
.
|
The results of operations for the acquired stores have been consolidated since the respective acquisition dates. During fiscal
2018
, revenue from the acquired stores was
$46.0 million
and the
earnings
from the combined acquisitions since the acquisition dates (including approximately
$5.0 million
of transaction and integration costs) was approximately
$0.4 million
.
Historical pre-acquisition financial statements of the
six
separate Mexico acquisitions were created in local country GAAP and the Company did not obtain pre-acquisition financial statements prepared in accordance with U.S. GAAP. As a result, and due to the insignificance of these acquisitions, it is impractical for the Company to adequately present supplemental pro forma information.
2017 Acquisitions
During fiscal 2017, the Company completed the acquisitions of
five
stores in Mexico and
one
store in the U.S., which were not material to the Company’s consolidated financial statements.
F-16
NOTE
4
-
MERGER AND OTHER ACQUISITION EXPENSES
The Company incurred significant expenses in fiscal 2018, 2017 and 2016 in connection with merger and acquisition activity. These expenses are predominantly incremental costs directly associated with merger and acquisition activity, including, but not limited to, professional fees, legal expenses, severance, retention and other employee-related costs, accelerated vesting of certain equity compensation awards, contract breakage costs and costs related to consolidation of technology systems and corporate facilities. The Company presents merger and other acquisition expenses separately in the consolidated statements of income to identify these activities apart from the expenses incurred to operate the business. The table below summarizes the major components of merger and other acquisition expenses (in thousands):
|
Year Ended December 31,
|
||||||||||||
|
|
2018
|
2017
|
2016
|
|||||||||
|
Merger and other acquisition expenses:
|
|
|
|
|||||||||
|
Transaction
(1)
|
$
|
6,658
|
|
$
|
—
|
|
$
|
18,702
|
|
|||
|
Severance and retention
(2)
|
137
|
|
3,897
|
|
15,229
|
|
||||||
|
Other
(3)
|
848
|
|
5,165
|
|
2,739
|
|
||||||
|
Total merger and other acquisition expenses
|
$
|
7,643
|
|
$
|
9,062
|
|
$
|
36,670
|
|
|||
|
(1)
|
For the year ended December 31, 2016, the Company recognized an income tax benefit of $
3.9 million
related to Merger transaction expenses; a significant portion of these expenses were not deductible for income tax purposes.
|
|
(2)
|
For the year ended December 31,
2018
,
2017
and
2016
, the Company made severance and retention payments of
$1.4 million
,
$7.4 million
and $
10.4 million
, respectively, and as of December 31,
2018
,
2017
and
2016
, had
$0.0 million
,
$1.3 million
and $
4.8 million
, respectively, accrued for future payments. Accrued severance and retention is included in accounts payable and accrued expenses in the accompanying consolidated balance sheets.
|
|
(3)
|
Represents accelerated share-based compensation expense related to restricted stock awards for certain First Cash employees which vested as a result of the Merger and other integration expenses.
|
NOTE
5
-
STOCKHOLDERS' EQUITY
During fiscal
2018
, the Company repurchased a total of
3,343,000
shares of common stock at an aggregate cost of
$274.5 million
and an average cost per share of
$82.12
, and during fiscal
2017
, repurchased
1,616,000
shares of common stock at an aggregate cost of
$93.0 million
and an average cost per share of
$57.56
. The Company intends to continue repurchases under its active share repurchase programs through open market transactions under trading plans in accordance with Rule 10b5-1 and Rule 10b-18 under the Exchange Act of 1934, as amended, subject to a variety of factors, including, but not limited to, the level of cash balances, credit availability, debt covenant restrictions, general business conditions, regulatory requirements, the market price of the Company’s stock, dividend policy and the availability of alternative investment opportunities.
The following table provides purchases made by the Company of shares of its common stock under each share repurchase program in effect during fiscal
2018
(dollars in thousands):
|
Plan Authorization Date
|
Plan Completion Date
|
Dollar Amount Authorized
|
Shares Purchased in 2018
|
Dollar Amount Purchased in 2018
|
Remaining Dollar Amount Authorized For Future Purchases
|
||||||||||||
|
May 15, 2017
|
January 31, 2018
|
$
|
100,000
|
|
239,000
|
|
$
|
17,288
|
|
$
|
—
|
|
|||||
|
October 24, 2017
|
April 6, 2018
|
100,000
|
|
1,282,000
|
|
100,000
|
|
—
|
|
||||||||
|
April 25, 2018
|
June 13, 2018
|
100,000
|
|
1,098,000
|
|
100,000
|
|
—
|
|
||||||||
|
July 25, 2018
|
Currently active
|
100,000
|
|
724,000
|
|
57,240
|
|
42,760
|
|
||||||||
|
October 24, 2018
|
Currently active
|
100,000
|
|
—
|
|
—
|
|
100,000
|
|
||||||||
|
Total
|
3,343,000
|
|
$
|
274,528
|
|
$
|
142,760
|
|
|||||||||
F-17
Total cash dividends paid in fiscal
2018
and
2017
were
$40.9 million
and
$36.8 million
, respectively. The declaration and payment of cash dividends in the future (quarterly or otherwise) will be made by the Board of Directors, from time to time, subject to the Company’s financial condition, results of operations, business requirements, compliance with legal requirements and debt covenant restrictions.
NOTE
6
-
FAIR VALUE OF FINANCIAL INSTRUMENTS
The fair value of financial instruments is determined by reference to various market data and other valuation techniques, as appropriate. Financial assets and liabilities are classified based on the lowest level of input that is significant to the fair value measurement. The Company's assessment of the significance of a particular input to the fair value measurement requires judgment, and may affect the valuation of the fair value of assets and liabilities and their placement within the fair value hierarchy levels. The three fair value levels are (from highest to lowest):
Level 1: Quoted market prices in active markets for identical assets or liabilities.
Level 2: Observable market-based inputs or unobservable inputs that are corroborated by market data.
Level 3: Unobservable inputs that are not corroborated by market data.
Recurring Fair Value Measurements
As of
December 31, 2018
and
2017
, the Company did not have any financial assets or liabilities that are measured at fair value on a recurring basis.
Fair Value Measurements on a Nonrecurring Basis
The Company measures non-financial assets and liabilities such as property and equipment and intangible assets at fair value on a nonrecurring basis or when events or circumstances indicate that the carrying amount of the assets may be impaired.
Financial Assets and Liabilities Not Measured at Fair Value
The Company’s financial assets and liabilities as of
December 31, 2018
and
2017
that are not measured at fair value in the consolidated balance sheets are as follows (in thousands):
|
Carrying Value
|
Estimated Fair Value
|
|||||||||||||||||||
|
December 31,
|
December 31,
|
Fair Value Measurements Using
|
||||||||||||||||||
|
2018
|
2018
|
Level 1
|
Level 2
|
Level 3
|
||||||||||||||||
|
Financial assets:
|
||||||||||||||||||||
|
Cash and cash equivalents
|
$
|
71,793
|
|
$
|
71,793
|
|
$
|
71,793
|
|
$
|
—
|
|
$
|
—
|
|
|||||
|
Fees and service charges receivable
|
45,430
|
|
45,430
|
|
—
|
|
—
|
|
45,430
|
|
||||||||||
|
Pawn loans
|
362,941
|
|
362,941
|
|
—
|
|
—
|
|
362,941
|
|
||||||||||
|
Consumer loans, net
|
15,902
|
|
15,902
|
|
—
|
|
—
|
|
15,902
|
|
||||||||||
|
$
|
496,066
|
|
$
|
496,066
|
|
$
|
71,793
|
|
$
|
—
|
|
$
|
424,273
|
|
||||||
|
Financial liabilities:
|
||||||||||||||||||||
|
Revolving unsecured credit facility
|
$
|
295,000
|
|
$
|
295,000
|
|
$
|
—
|
|
$
|
295,000
|
|
$
|
—
|
|
|||||
|
Senior unsecured notes (outstanding principal)
|
300,000
|
|
293,000
|
|
—
|
|
293,000
|
|
—
|
|
||||||||||
|
$
|
595,000
|
|
$
|
588,000
|
|
$
|
—
|
|
$
|
588,000
|
|
$
|
—
|
|
||||||
F-18
|
Carrying Value
|
Estimated Fair Value
|
|||||||||||||||||||
|
December 31,
|
December 31,
|
Fair Value Measurements Using
|
||||||||||||||||||
|
2017
|
2017
|
Level 1
|
Level 2
|
Level 3
|
||||||||||||||||
|
Financial assets:
|
||||||||||||||||||||
|
Cash and cash equivalents
|
$
|
114,423
|
|
$
|
114,423
|
|
$
|
114,423
|
|
$
|
—
|
|
$
|
—
|
|
|||||
|
Fees and service charges receivable
|
42,736
|
|
42,736
|
|
—
|
|
—
|
|
42,736
|
|
||||||||||
|
Pawn loans
|
344,748
|
|
344,748
|
|
—
|
|
—
|
|
344,748
|
|
||||||||||
|
Consumer loans, net
|
23,522
|
|
23,522
|
|
—
|
|
—
|
|
23,522
|
|
||||||||||
|
$
|
525,429
|
|
$
|
525,429
|
|
$
|
114,423
|
|
$
|
—
|
|
$
|
411,006
|
|
||||||
|
Financial liabilities:
|
||||||||||||||||||||
|
Revolving unsecured credit facility
|
$
|
107,000
|
|
$
|
107,000
|
|
$
|
—
|
|
$
|
107,000
|
|
$
|
—
|
|
|||||
|
Senior unsecured notes (outstanding principal)
|
300,000
|
|
314,000
|
|
—
|
|
314,000
|
|
—
|
|
||||||||||
|
$
|
407,000
|
|
$
|
421,000
|
|
$
|
—
|
|
$
|
421,000
|
|
$
|
—
|
|
||||||
As cash and cash equivalents have maturities of less than three months, the carrying value of cash and cash equivalents approximates fair value. Due to their short-term maturities, the carrying value of pawn loans and fees and service charges receivable approximate fair value. Consumer loans, net are carried net of the allowance for estimated loan losses, which is calculated by applying historical loss rates combined with recent default trends to the gross consumer loan balance. Therefore, the carrying value approximates fair value.
The carrying value of the Company’s revolving unsecured credit facility approximates fair value as of
December 31, 2018
and
2017
. The fair value of the revolving unsecured credit facility is estimated based on market values for debt issuances with similar characteristics or rates currently available for debt with similar terms. In addition, the revolving unsecured credit facility has a variable interest rate based on a fixed spread over LIBOR and reprices with any changes in LIBOR. The fair value of the senior unsecured notes is estimated based on quoted prices in markets that are not active.
NOTE
7
-
CUSTOMER LOANS AND VALUATION ACCOUNTS
Customer loans, including pawn receivables and net of unearned finance fees, consist of the following (in thousands):
|
Pawn Loans
|
Consumer Loans
|
Total
|
|||||||||
|
December 31, 2018
|
|||||||||||
|
Total customer loans
|
$
|
362,941
|
|
$
|
16,785
|
|
$
|
379,726
|
|
||
|
Less allowance for doubtful accounts
|
—
|
|
(883
|
)
|
(883
|
)
|
|||||
|
$
|
362,941
|
|
$
|
15,902
|
|
$
|
378,843
|
|
|||
|
December 31, 2017
|
|||||||||||
|
Total customer loans
|
$
|
344,748
|
|
$
|
25,337
|
|
$
|
370,085
|
|
||
|
Less allowance for doubtful accounts
|
—
|
|
(1,815
|
)
|
(1,815
|
)
|
|||||
|
$
|
344,748
|
|
$
|
23,522
|
|
$
|
368,270
|
|
|||
F-19
Changes in the allowance for consumer loan credit losses are as follows (in thousands):
|
Year Ended December 31,
|
|||||||||||
|
|
2018
|
2017
|
2016
|
||||||||
|
Balance at beginning of year
|
$
|
1,815
|
|
$
|
2,251
|
|
$
|
66
|
|
||
|
Provision for credit losses
|
9,405
|
|
12,762
|
|
6,049
|
|
|||||
|
Charge-offs, net of recoveries from customers
|
(10,337
|
)
|
(13,198
|
)
|
(3,864
|
)
|
|||||
|
Balance at end of year
|
$
|
883
|
|
$
|
1,815
|
|
$
|
2,251
|
|
||
Under the CSO Programs, the Company assists customers in applying for a short-term extension of credit from Independent Lenders and issues the Independent Lenders a guarantee for the repayment of the extension of credit. The Company is required to recognize, at the inception of the guarantee, a liability for the fair value of the obligation undertaken by issuing the guarantee. The Company records the estimated fair value of the liability in accrued liabilities. Changes in the liability for credit services losses are as follows (in thousands):
|
Year Ended December 31,
|
|||||||||||
|
|
2018
|
2017
|
2016
|
||||||||
|
Balance at beginning of year
|
$
|
440
|
|
$
|
582
|
|
$
|
498
|
|
||
|
Provision for credit losses
|
8,056
|
|
7,057
|
|
5,944
|
|
|||||
|
Amounts paid to Independent Lenders under guarantees, net of recoveries from customers
|
(8,244
|
)
|
(7,199
|
)
|
(5,860
|
)
|
|||||
|
Balance at end of year
|
$
|
252
|
|
$
|
440
|
|
$
|
582
|
|
||
NOTE
8
-
PROPERTY AND EQUIPMENT
Property and equipment consists of the following (in thousands):
|
As of December 31,
|
|||||||
|
2018
|
2017
|
||||||
|
Land
|
$
|
37,578
|
|
$
|
33,700
|
|
|
|
Buildings
|
76,406
|
|
63,016
|
|
|||
|
Furniture, fixtures, equipment and improvements
|
348,620
|
|
313,545
|
|
|||
|
462,604
|
|
410,261
|
|
||||
|
Less: accumulated depreciation
|
(210,959
|
)
|
(179,920
|
)
|
|||
|
$
|
251,645
|
|
$
|
230,341
|
|
||
Depreciation expense for the fiscal years ended
December 31, 2018
,
2017
and
2016
was
$36.4 million
,
$44.5 million
and
$26.6 million
, respectively.
F-20
NOTE
9
-
ACCOUNTS PAYABLE AND ACCRUED LIABILITIES
Accounts payable and accrued liabilities consist of the following (in thousands):
|
As of December 31,
|
|||||||
|
2018
|
2017
|
||||||
|
Accrued compensation
|
$
|
28,130
|
|
$
|
25,203
|
|
|
|
Sales, property, and payroll withholding taxes payable
|
12,563
|
|
14,812
|
|
|||
|
Acquisition purchase price amounts payable to sellers
|
12,636
|
|
1,117
|
|
|||
|
Trade accounts payable
|
6,886
|
|
4,791
|
|
|||
|
Current unfavorable lease intangible liability
|
6,191
|
|
7,767
|
|
|||
|
Deferred fees from CSO Programs
|
4,501
|
|
7,560
|
|
|||
|
Benefits liabilities and withholding payable
|
3,541
|
|
3,465
|
|
|||
|
Accrued interest payable
|
1,534
|
|
1,402
|
|
|||
|
Liability for expected losses on outstanding guarantees from CSO Programs
|
252
|
|
440
|
|
|||
|
Merger related severance and retention payable
|
—
|
|
1,336
|
|
|||
|
Other accrued liabilities
|
20,694
|
|
16,438
|
|
|||
|
$
|
96,928
|
|
$
|
84,331
|
|
||
NOTE
10
-
LONG-TERM DEBT
As of
December 31, 2018
, annual maturities of the outstanding long-term debt for each of the five years after
December 31, 2018
are as follows (in thousands):
|
Fiscal
|
|||
|
2019
|
$
|
—
|
|
|
2020
|
—
|
|
|
|
2021
|
—
|
|
|
|
2022
|
—
|
|
|
|
2023
|
295,000
|
|
|
|
Thereafter
|
300,000
|
|
|
|
$
|
595,000
|
|
|
The following table details the Company’s long-term debt at the respective principal amounts, net of unamortized debt issuance costs (in thousands):
|
As of December 31,
|
|||||||
|
2018
|
2017
|
||||||
|
Revolving unsecured credit facility, maturing 2023
|
$
|
295,000
|
|
$
|
107,000
|
|
|
|
5.375% senior unsecured notes due 2024
(1)
|
295,887
|
|
295,243
|
|
|||
|
Total long-term debt
|
$
|
590,887
|
|
$
|
402,243
|
|
|
|
(1)
|
As of
December 31, 2018
and
2017
, deferred debt issuance costs of
$4.1 million
and
$4.8 million
, respectively, are included as a direct deduction from the carrying amount of the senior unsecured notes due 2024 in the accompanying consolidated balance sheets.
|
F-21
Revolving Unsecured Credit Facility
During the period from January 1, 2018 through October 4, 2018, the Company maintained an unsecured line of credit with a group of U.S. based commercial lenders (the “Credit Facility”) in the amount of
$400.0 million
, which was scheduled to mature in September 2022. The Credit Facility charged interest, at the Company’s option, at either (1) the prevailing London Interbank Offered Rate (“LIBOR”) (with interest periods of 1 week or 1, 2, 3 or 6 months at the Company’s option) plus a fixed spread of
2.5%
or (2) the prevailing prime or base rate plus a fixed spread of
1.5%
.
On October 4, 2018, the Company amended and extended the Credit Facility. The total lender commitment under the amended facility increased from
$400.0 million
to
$425.0 million
and the term was extended to
October 4, 2023
. Certain financial covenants in the facility were amended, including an increase to the permitted consolidated leverage ratio from
2.75
to
3.0
times EBITDA adjusted for certain items as defined in the Credit Facility and an increase to the permitted domestic leverage ratio from
3.5
to
4.0
times domestic EBITDA adjusted for certain items as defined in the Credit Facility.
At
December 31, 2018
, the Company had
$295.0 million
in outstanding borrowings and
$3.2 million
in outstanding letters of credit under the Credit Facility, leaving
$126.8 million
available for future borrowings. The Credit Facility remains unsecured and continues to bear interest, at the Company’s option, at either (1) the prevailing LIBOR (with interest periods of 1 week or 1, 2, 3 or 6 months at the Company’s option) plus a fixed spread of
2.5%
or (2) the prevailing prime or base rate plus a fixed spread of
1.5%
. The agreement has a LIBOR floor of
0%
. Additionally, the Company is required to pay an annual commitment fee of
0.50%
on the average daily unused portion of the Credit Facility commitment. The weighted-average interest rate on amounts outstanding under the Credit Facility at
December 31, 2018
was
4.94%
based on 1 week LIBOR. Under the terms of the Credit Facility, the Company is required to maintain certain financial ratios and comply with certain financial covenants. The Credit Facility also contains customary restrictions on the Company’s ability to incur additional debt, grant liens, make investments, consummate acquisitions and similar negative covenants with customary carve-outs and baskets. The Company was in compliance with the covenants of the Credit Facility as of
December 31, 2018
. During fiscal
2018
, the Company
received net proceeds
of
$188.0 million
from borrowings pursuant to
the Credit Facility.
Senior Unsecured Notes
On May 30, 2017, the Company issued
$300.0 million
of
5.375%
senior unsecured notes due on June 1, 2024 (the “Notes”), all of which are currently outstanding. Interest on the Notes is payable semi-annually in arrears on June 1 and December 1. The Notes are fully and unconditionally guaranteed on a senior unsecured basis jointly and severally by all of the Company's existing and future domestic subsidiaries that guarantee its revolving unsecured credit facility. The Notes will permit the Company to make restricted payments, such as purchasing shares of its stock and paying cash dividends, in an unlimited amount if, after giving pro forma effect to the incurrence of any indebtedness to make such payment, the Company's consolidated total debt ratio (“Net Debt Ratio”) is less than
2.25
to
1
. The Net Debt Ratio is defined generally in the indenture governing the Notes as the ratio of (1) the total consolidated debt of the Company minus cash and cash equivalents of the Company to (2) the Company’s consolidated trailing twelve months EBITDA, as adjusted to exclude certain non-recurring expenses and giving pro forma effect to operations acquired during the measurement period.
The Company used the proceeds from the Notes to repurchase, or otherwise redeem, its previously outstanding
$200.0 million
,
6.75%
senior unsecured notes due 2021 (the “2021 Notes”). As a result, during fiscal 2017, the Company recognized a
$14.1 million
loss on extinguishment of debt related to the repurchase or redemption of the 2021 Notes.
NOTE
11
-
INCOME TAXES
On December 22, 2017, the Tax Act was enacted into law. The Tax Act impacted the Company by, among other things, reducing its U.S. corporate income tax rate from
35%
to
21%
starting in 2018, and creating a territorial tax system with a one-time mandatory tax on its previously deferred foreign earnings.
The Company recorded a provisional net income tax benefit of
$27.3 million
during the fourth quarter of 2017 as a result of the Tax Act. As of December 31, 2018, the Company finalized certain estimates and tax positions used in the analysis of the provisional net income tax benefit and recorded an additional
$1.5 million
income tax benefit, which is included in the provision for income taxes in fiscal 2018. The adjustment to the provisional net income tax benefit was primarily a result of changes in interpretations and assumptions the Company made as a result of implementation guidance issued by the Internal Revenue Service during 2018.
F-22
Components of the provision for income taxes and the income to which it relates for the years ended
December 31, 2018
,
2017
and
2016
consist of the following (in thousands):
|
Year Ended December 31,
|
|||||||||||
|
2018
|
2017
|
2016
|
|||||||||
|
Income before income taxes
(1)
:
|
|||||||||||
|
Domestic
|
$
|
125,056
|
|
$
|
93,365
|
|
$
|
30,804
|
|
||
|
Foreign
|
80,253
|
|
78,947
|
|
62,643
|
|
|||||
|
Income before income taxes
|
$
|
205,309
|
|
$
|
172,312
|
|
$
|
93,447
|
|
||
|
Current income taxes:
|
|||||||||||
|
Federal
(2)
|
$
|
18,751
|
|
$
|
15,995
|
|
$
|
1,419
|
|
||
|
Foreign
|
23,231
|
|
23,340
|
|
18,787
|
|
|||||
|
State and local
|
2,506
|
|
968
|
|
1,139
|
|
|||||
|
Current provision for income taxes
|
44,488
|
|
40,303
|
|
21,345
|
|
|||||
|
Deferred provision (benefit) for income taxes:
|
|||||||||||
|
Federal
(3)
|
7,621
|
|
(11,509
|
)
|
11,826
|
|
|||||
|
Foreign
|
(566
|
)
|
(1,079
|
)
|
(528
|
)
|
|||||
|
State and local
|
560
|
|
705
|
|
677
|
|
|||||
|
Total deferred provision (benefit) for income taxes
|
7,615
|
|
(11,883
|
)
|
11,975
|
|
|||||
|
Provision for income taxes
|
$
|
52,103
|
|
$
|
28,420
|
|
$
|
33,320
|
|
||
|
(1)
|
Includes the allocation of certain administrative expenses and the payment of royalties between domestic and foreign subsidiaries.
|
|
(2)
|
The year ended December 31, 2017 includes a provisional
$1.9 million
income tax expense relating to the one-time mandatory tax on previously deferred earnings of the Company’s foreign subsidiaries as a result of the Tax Act. The year ended December 31, 2018 includes a
$1.5 million
income tax benefit as a result of the Company’s finalization of certain estimates and tax positions used to record the 2017 provisional tax expense and
$0.8 million
of income tax expense relating to the global intangible low-taxed income (GILTI) inclusion.
|
|
(3)
|
The year ended December 31, 2017 includes a provisional
$29.2 million
income tax benefit resulting from the remeasurement of the Company’s domestic net deferred tax liabilities based on the new lower corporate income tax rate as a result of the Tax Act. During fiscal 2018, the Company finalized certain estimates and tax positions used in the analysis of the 2017 provisional tax benefit resulting in no adjustments.
|
The Company does not include foreign subsidiaries in its consolidated U.S. federal income tax return and it is the Company’s intent to indefinitely reinvest the earnings of these subsidiaries outside the U.S. At
December 31, 2018
, the cumulative amount of indefinitely reinvested earnings of foreign subsidiaries was
$204.7 million
, which would not be subject to additional U.S. taxes if the earnings were repatriated into the U.S.
F-23
The principal deferred tax assets and liabilities consist of the following (in thousands):
|
As of December 31,
|
|||||||
|
2018
|
2017
|
||||||
|
Deferred tax assets:
|
|||||||
|
Property and equipment in foreign jurisdictions
|
$
|
8,073
|
|
$
|
6,752
|
|
|
|
Accrued fees on forfeited pawn loans
|
7,489
|
|
7,002
|
|
|||
|
Deferred cost of goods sold deduction
|
3,494
|
|
2,058
|
|
|||
|
Accrued compensation and employee benefits
|
1,912
|
|
1,749
|
|
|||
|
State net operating losses
|
6,430
|
|
6,219
|
|
|||
|
Other
|
6,027
|
|
5,459
|
|
|||
|
Total deferred tax assets
|
33,425
|
|
29,239
|
|
|||
|
Deferred tax liabilities:
|
|||||||
|
Intangible assets
|
66,734
|
|
55,121
|
|
|||
|
Property and equipment in domestic jurisdictions
|
1,668
|
|
1,054
|
|
|||
|
Other
|
1,807
|
|
2,645
|
|
|||
|
Total deferred tax liabilities
|
70,209
|
|
58,820
|
|
|||
|
Net deferred tax liabilities before valuation allowance
|
(36,784
|
)
|
(29,581
|
)
|
|||
|
Valuation allowance
|
(6,430
|
)
|
(6,219
|
)
|
|||
|
Net deferred tax liabilities
|
$
|
(43,214
|
)
|
$
|
(35,800
|
)
|
|
|
Reported as:
|
|||||||
|
Deferred tax assets
|
$
|
11,640
|
|
$
|
11,237
|
|
|
|
Deferred tax liabilities
|
(54,854
|
)
|
(47,037
|
)
|
|||
|
Net deferred tax liabilities
|
$
|
(43,214
|
)
|
$
|
(35,800
|
)
|
|
The Company has a valuation allowance of
$6.4 million
and
$6.2 million
as of
December 31, 2018
and
2017
, respectively, related to the deferred tax assets associated with its state net operating losses. The Company has evaluated the nature and timing of its other deferred tax assets and concluded that no additional valuation allowance is necessary.
The following is a reconciliation of income taxes calculated at the U.S. federal statutory rate to the provision for income taxes (dollars in thousands):
|
Year Ended December 31,
|
|||||||||||
|
2018
|
2017
|
2016
|
|||||||||
|
U.S. federal statutory rate
|
21
|
%
|
35
|
%
|
35
|
%
|
|||||
|
Tax at the U.S. federal statutory rate
|
$
|
43,115
|
|
$
|
60,309
|
|
$
|
32,706
|
|
||
|
State income tax, net of federal tax benefit of
$644
, $586 and $636, respectively
|
2,422
|
|
1,087
|
|
1,181
|
|
|||||
|
Net incremental income tax expense (benefit) from foreign earnings
(1)
|
6,031
|
|
(5,442
|
)
|
(3,642
|
)
|
|||||
|
Net tax benefit resulting from the enactment of the Tax Act
|
(1,494
|
)
|
(27,269
|
)
|
—
|
|
|||||
|
Nondeductible compensation expense
|
1,827
|
|
—
|
|
—
|
|
|||||
|
Nondeductible transaction related costs
|
—
|
|
—
|
|
2,659
|
|
|||||
|
Other taxes and adjustments, net
|
202
|
|
(265
|
)
|
416
|
|
|||||
|
Provision for income taxes
|
$
|
52,103
|
|
$
|
28,420
|
|
$
|
33,320
|
|
||
|
Effective tax rate
|
25.4
|
%
|
16.5
|
%
|
35.7
|
%
|
|||||
F-24
|
(1)
|
Includes a
$3.3 million
,
$4.0 million
and
$1.5 million
foreign permanent tax benefit related to an inflation index adjustment allowed under Mexico tax law for the years ended
December 31, 2018
,
2017
and
2016
, respectively.
|
The Company’s foreign operating subsidiaries are owned by a wholly-owned subsidiary located in the Netherlands. The foreign operating subsidiaries are subject to their respective foreign statutory rates, which differ from the U.S. federal statutory rate. The statutory tax rates in Mexico, Guatemala, El Salvador and Colombia are generally
30%
,
25%
,
30%
and
37%
, respectively. The statutory tax rate in the Netherlands is
0%
on eligible dividends received from its foreign subsidiaries.
The Company reviews the determination of whether tax benefits claimed or expected to be claimed on a tax return should be recorded in the financial statements. The Company may recognize the tax benefit from an uncertain tax position only if it is more likely than not that the tax position will be sustained on examination by the taxing authorities, based on the technical merits of the position. The tax benefits recognized in the financial statements from such a position are measured based on the largest benefit that has a greater than
fifty
percent likelihood of being realized upon ultimate settlement. Interest and penalties related to income tax liabilities that could arise would be classified as interest expense in the Company’s consolidated statements of income.
As of
December 31, 2018
and
2017
, the Company had
no
unrecognized tax benefits and, therefore, the Company did
no
t have a liability for accrued interest and penalties and
no
such interest or penalties were incurred for the fiscal years ended
December 31, 2018
,
2017
and
2016
.
The Company files federal income tax returns in the U.S., Mexico, Guatemala, El Salvador, Colombia and the Netherlands, as well as multiple state and local income tax returns in the U.S. The Company’s U.S. federal returns are not subject to examination for tax years prior to 2015. The Company’s U.S. state income tax returns are not subject to examination for the tax years prior to 2015 with the exception of
six
states, which are not subject to examination for tax years prior to 2014. With respect to federal tax returns in Mexico, Guatemala, El Salvador, Colombia and the Netherlands, the tax years prior to 2013 are closed to examination. There are no state income taxes in Mexico, Guatemala, El Salvador, Colombia or the Netherlands.
NOTE
12
-
COMMITMENTS AND CONTINGENCIES
Leases
The Company leases certain of its facilities and equipment under operating leases with terms generally ranging from
three
to
five
years. Most facility leases contain renewal options. Remaining future minimum rentals due under non-cancelable operating leases are as follows (in thousands):
|
Fiscal
|
|||
|
2019
|
$
|
105,762
|
|
|
2020
|
86,049
|
|
|
|
2021
|
65,549
|
|
|
|
2022
|
41,129
|
|
|
|
2023
|
22,084
|
|
|
|
Thereafter
|
29,684
|
|
|
|
$
|
350,257
|
|
|
Rent expense under such leases was
$124.3 million
,
$117.7 million
and
$74.3 million
for the years ended
December 31, 2018
,
2017
and
2016
, respectively.
As a result of the Merger, the Company recognized a favorable lease intangible asset and an unfavorable lease intangible liability related to assumed Cash America leases to the extent such leases contained favorable or unfavorable terms relative to market (together the “Lease Intangibles”). The current portion of favorable lease intangibles is included in prepaid expenses and other current assets and the non-current portion is included in other assets in the accompanying consolidated balance sheets. The current portion of unfavorable lease intangibles is included in accounts payable and accrued liabilities and the non-current portion is included in other liabilities in the accompanying consolidated balance sheets. The Lease Intangibles are amortized to rent expense, which is a component of store operating expenses, on a straight-line basis over the lives of the respective leases.
F-25
The Lease Intangibles consist of the following (in thousands):
|
As of December 31,
|
|||||||
|
2018
|
2017
|
||||||
|
Favorable lease intangible asset
|
$
|
45,596
|
|
$
|
53,429
|
|
|
|
Unfavorable lease intangible liability
|
$
|
(17,275
|
)
|
$
|
(25,367
|
)
|
|
The net amortization of the Lease Intangibles reduced store operating expense by
$0.3 million
,
$1.0 million
and
$0.2 million
for the years ended
December 31, 2018
,
2017
and
2016
, respectively. The remaining weighted-average amortization period for favorable and unfavorable lease intangibles is
4.8
and
2.1
years, respectively. Estimated future net amortization of the Lease Intangibles is as follows (in thousands):
|
Fiscal
|
|||
|
2019
|
$
|
986
|
|
|
2020
|
1,977
|
|
|
|
2021
|
2,452
|
|
|
|
2022
|
2,954
|
|
|
|
2023
|
3,326
|
|
|
|
Thereafter
|
16,626
|
|
|
|
$
|
28,321
|
|
|
Litigation
The Company, in the ordinary course of business, is a defendant (actual or threatened) in certain lawsuits, arbitration claims and other general claims. In management’s opinion, any potential adverse result should not have a material adverse effect on the Company’s financial position, results of operations, or cash flows.
Guarantees
The Company offers fee-based CSO Programs to assist consumers in obtaining extensions of credit from Independent Lenders. Under the CSO Programs, the Company assists customers in applying for a short-term extension of credit from the Independent Lenders and issues the Independent Lenders a guarantee for the repayment of the extension of credit. The Company is required to recognize, at the inception of the guarantee, a liability for the fair value of the obligation undertaken by issuing the guarantees. The Company records the estimated fair value of the liability in accrued liabilities. The loss provision associated with the CSO Programs is based primarily upon historical loss experience, with consideration given to recent loss trends, delinquency rates, economic conditions and management’s expectations of future credit losses. The Company’s maximum loss exposure under all of the outstanding guarantees issued on behalf of its customers to the Independent Lenders as of
December 31, 2018
was
$6.2 million
compared to
$10.1 million
at
December 31, 2017
.
Gold Forward Sales Contracts
As of
December 31, 2018
, the Company had contractual commitments to deliver a total of
18,000
gold ounces between the months of January and June 2019 at a weighted-average price of
$1,258
per ounce. Subsequent to December 31, 2018, the Company committed to delivering an additional
18,000
gold ounces between the months of July and December 2019 at a weighted-average price of
$1,300
per ounce. The ounces required to be delivered over this time period are within historical scrap gold volumes.
F-26
NOTE
13
-
GOODWILL AND OTHER INTANGIBLE ASSETS
Goodwill
Changes in the carrying value of goodwill by segment were as follows (in thousands):
|
December 31, 2018
|
U.S. operations segment
|
Latin America operations segment
|
Total
|
||||||||
|
Balance, beginning of year
|
$
|
743,997
|
|
$
|
87,148
|
|
$
|
831,145
|
|
||
|
Acquisitions (see Note 3)
|
15,541
|
|
71,427
|
|
86,968
|
|
|||||
|
Effect of foreign currency translation
|
—
|
|
(694
|
)
|
(694
|
)
|
|||||
|
Balance, end of year
|
$
|
759,538
|
|
$
|
157,881
|
|
$
|
917,419
|
|
||
|
December 31, 2017
|
|||||||||||
|
Balance, beginning of year
|
$
|
746,204
|
|
$
|
84,947
|
|
$
|
831,151
|
|
||
|
Acquisitions (see Note 3)
|
414
|
|
140
|
|
554
|
|
|||||
|
Effect of foreign currency translation
|
—
|
|
2,061
|
|
2,061
|
|
|||||
|
Other adjustments
|
(2,621
|
)
|
—
|
|
(2,621
|
)
|
|||||
|
Balance, end of year
|
$
|
743,997
|
|
$
|
87,148
|
|
$
|
831,145
|
|
||
The Company performed its annual assessment of goodwill and determined there was
no
impairment as of December 31,
2018
and
2017
.
Definite-Lived Intangible Assets
The following table summarizes the components of gross and net definite-lived intangible assets subject to amortization (in thousands):
|
As of December 31,
|
||||||||||||||||||||||||
|
2018
|
2017
|
|||||||||||||||||||||||
|
Gross
Carrying
Amount
|
Accumulated Amortization
|
Net
Carrying
Amount
|
Gross
Carrying
Amount
|
Accumulated Amortization
|
Net
Carrying
Amount
|
|||||||||||||||||||
|
Customer relationships
|
$
|
25,453
|
|
$
|
(18,955
|
)
|
$
|
6,498
|
|
$
|
24,533
|
|
$
|
(15,256
|
)
|
$
|
9,277
|
|
||||||
|
Executive non-compete agreements
|
8,700
|
|
(8,700
|
)
|
—
|
|
8,700
|
|
(5,800
|
)
|
2,900
|
|
||||||||||||
|
$
|
34,153
|
|
$
|
(27,655
|
)
|
$
|
6,498
|
|
$
|
33,233
|
|
|
$
|
(21,056
|
)
|
$
|
12,177
|
|
||||||
The customer relationships are generally amortized using an accelerated amortization method that reflects the future cash flows expected from the returning pawn customers. The executive non-compete agreements were amortized on a straight-line basis over the life of the executive non-compete agreements and are fully amortized as of December 31, 2018.
F-27
Amortization expense for definite-lived intangible assets was
$6.6 million
,
$10.7 million
and
$5.2 million
for the years ended December 31,
2018
,
2017
and
2016
, respectively. The remaining weighted-average amortization period for customer relationships is
1.4
years. Estimated future amortization expense is as follows (in thousands):
|
Fiscal
|
|||
|
2019
|
$
|
2,774
|
|
|
2020
|
2,236
|
|
|
|
2021
|
1,185
|
|
|
|
2022
|
184
|
|
|
|
2023
|
119
|
|
|
|
$
|
6,498
|
|
|
Indefinite-Lived Intangible Assets
The Company performed its annual assessment of indefinite-lived intangible assets and determined there was
no
impairment as of December 31,
2018
and
2017
. Indefinite-lived intangible assets as of December 31,
2018
and
2017
, consist of the following (in thousands):
|
As of December 31,
|
||||||||
|
2018
|
2017
|
|||||||
|
Trade names
|
$
|
46,300
|
|
$
|
46,300
|
|
||
|
Pawn licenses
(1)
|
34,092
|
|
34,092
|
|
||||
|
Other indefinite-lived intangibles
|
1,250
|
|
1,250
|
|
||||
|
$
|
81,642
|
|
$
|
81,642
|
|
|||
|
(1)
|
Costs to renew licenses with indefinite lives are expensed as incurred and recorded in store operating expenses in the consolidated statements of income.
|
NOTE
14
-
EQUITY COMPENSATION PLANS AND SHARE-BASED COMPENSATION
The Company has previously adopted equity and share-based compensation plans to attract and retain executive officers, directors and key employees. Under these plans, the Company has granted qualified and non-qualified common stock options and restricted stock unit awards to executive officers, directors and other key employees. At
December 31, 2018
,
778,000
shares were reserved for future grants to all employees and directors under the plans. Additionally, there were
1,995,000
shares reserved for future grants to current employees and directors who were not employees or directors of the Company at the date of the Merger.
Restricted Stock Unit Awards
The Company has granted restricted stock units under the Company’s equity and share-based incentive compensation plans. The restricted stock units are settled in shares of common stock upon vesting. The performance-based awards granted in 2018 and 2017 have maximum share awards of
102,000
and
117,000
shares, respectively, which vest at the end of a
three
-year cumulative performance period beginning on January 1 of the respective grant year. The Company’s level of achievement of the performance goals will result in the vesting of restricted stock awards between zero and the maximum share award at the end of each respective
three
-year performance period. The vesting performance criteria for the 2018 and 2017 performance-based grants relate to growth in the Company’s net income, adjusted for certain non-core and/or non-recurring items, and total store additions over the respective three-year cumulative period. The awards granted in 2016 include
40,000
shares with performance-based criteria with
four
annual measurement periods beginning in the year of issuance. The vesting performance criteria for the 2016 performance-based grants relate to growth in the Company’s EBITDA, adjusted for certain non-core and/or non-recurring items, compared to the base period, which is the fiscal year prior to the year of issuance. All other awards granted in
2018
,
2017
and
2016
vest ratably over a
five
or
six
year period from the grant date. The grant date fair value of the restricted stock units is based on the Company’s closing stock price on the day of the grant or subsequent award modification date, if applicable, and the fair value of performance-based awards is based on the maximum amount of the award expected to be achieved. The amount attributable to award grants is amortized to expense over the vesting periods. The Company typically issues treasury shares to satisfy vested restricted stock unit awards.
F-28
The following table summarizes the restricted stock unit award activity for the years ended December 31,
2018
,
2017
and
2016
(shares in thousands):
|
2018
|
2017
|
2016
|
||||||||||||||||||
|
Weighted-
|
Weighted-
|
Weighted-
|
||||||||||||||||||
|
Average
|
Average
|
Average
|
||||||||||||||||||
|
Underlying
|
Fair Value
|
Underlying
|
Fair Value
|
Underlying
|
Fair Value
|
|||||||||||||||
|
Shares
|
of Grant
|
Shares
|
of Grant
|
Shares
|
of Grant
|
|||||||||||||||
|
Outstanding at beginning of year
|
157
|
|
$
|
47.36
|
|
30
|
|
$
|
45.93
|
|
79
|
|
$
|
48.10
|
|
|||||
|
Granted
(1)
|
119
|
|
72.70
|
|
137
|
|
47.57
|
|
51
|
|
42.60
|
|
||||||||
|
Vested
|
(22
|
)
|
44.62
|
|
(10
|
)
|
45.93
|
|
(100
|
)
|
45.96
|
|
||||||||
|
Outstanding at end of year
|
254
|
|
59.53
|
|
157
|
|
47.36
|
|
30
|
|
45.93
|
|
||||||||
|
(1)
|
For fiscal 2018 and 2017, includes
102,000
and
117,000
shares, respectively, of performance-based grants, which represents the maximum possible award. The Company’s level of achievement of the respective performance goals will result in actual vesting of between zero and the maximum share award at the end of each respective
three
-year performance period.
|
Restricted stock unit awards vesting in fiscal
2018
,
2017
and
2016
had an aggregate intrinsic value of
$1.6 million
,
$0.7 million
and
$4.9 million
, respectively, based on the closing price of the Company’s stock on the date of vesting. During 2016, the change of control provisions triggered by the Merger resulted in immediate vesting of
83,000
restricted stock unit awards outstanding as of September 1, 2016, the date of the Merger. The outstanding award units had an aggregate intrinsic value of
$18.4 million
at
December 31, 2018
.
Stock Options
The Company has
no
t issued any common stock options in the last
seven
fiscal years. Previous option awards have been granted to purchase the Company’s common stock at an exercise price equal to or greater than the fair market value at the date of grant and generally had a maximum duration of
ten
years. The Company typically issues treasury shares to satisfy stock option exercises.
Stock options outstanding as of
December 31, 2018
are as follows (shares in thousands):
|
Weighted-Average
|
Currently
|
|||||||||||||||
|
Exercise Price
|
Option Shares
|
Remaining Life
|
Exercisable Shares
|
|||||||||||||
|
$
|
38.00
|
|
40
|
|
2.9
|
10
|
|
|||||||||
|
40.00
|
|
40
|
|
2.0
|
20
|
|
||||||||||
|
80
|
|
2.5
|
30
|
|
||||||||||||
The following table summarizes stock option activity for the years ended
December 31, 2018
,
2017
and
2016
(shares in thousands):
|
2018
|
2017
|
2016
|
||||||||||||||||||
|
Weighted-
|
Weighted-
|
Weighted-
|
||||||||||||||||||
|
Average
|
Average
|
Average
|
||||||||||||||||||
|
Underlying
|
Exercise
|
Underlying
|
Exercise
|
Underlying
|
Exercise
|
|||||||||||||||
|
Shares
|
Price
|
Shares
|
Price
|
Shares
|
Price
|
|||||||||||||||
|
Outstanding at beginning of year
|
90
|
|
$
|
39.11
|
|
103
|
|
$
|
37.34
|
|
103
|
|
$
|
37.34
|
|
|||||
|
Exercised
|
(10
|
)
|
40.00
|
|
(13
|
)
|
24.57
|
|
—
|
|
—
|
|
||||||||
|
Outstanding at end of year
|
80
|
|
39.00
|
|
90
|
|
39.11
|
|
103
|
|
37.34
|
|
||||||||
|
Exercisable at end of year
|
30
|
|
39.33
|
|
20
|
|
40.00
|
|
23
|
|
31.43
|
|
||||||||
F-29
At
December 31, 2018
, the aggregate intrinsic value for the stock options outstanding was
$2.7 million
, of which
$1.0 million
was exercisable at the end of the year, with weighted-average remaining contractual terms of
2.5
years. The aggregate intrinsic value reflects the total pre-tax intrinsic value (the difference between the Company’s closing stock price on the last trading day of the period and the exercise price of the options, multiplied by the number of in-the-money options) that would have been received by the option holders had all option holders exercised their options on
December 31, 2018
.
The total intrinsic value of options exercised for fiscal
2018
,
2017
and
2016
was
$0.5 million
,
$0.3 million
and
$0.0 million
, respectively. The intrinsic values are based on the closing price of the Company’s stock on the date of exercise.
Share-Based Compensation Expense
The Company’s net income includes the following compensation costs related to share-based compensation arrangements (in thousands):
|
Year Ended December 31,
|
|||||||||||
|
2018
|
2017
|
2016
|
|||||||||
|
Gross compensation costs:
|
|||||||||||
|
Restricted stock unit awards
|
$
|
5,712
|
|
$
|
2,959
|
|
$
|
4,038
|
|
||
|
Stock options
|
74
|
|
110
|
|
136
|
|
|||||
|
Total gross compensation costs
|
5,786
|
|
3,069
|
|
4,174
|
|
|||||
|
Income tax benefits:
|
|||||||||||
|
Restricted stock unit awards
|
(1,320
|
)
|
(1,036
|
)
|
(782
|
)
|
|||||
|
Exercise of stock options
|
(94
|
)
|
(39
|
)
|
(48
|
)
|
|||||
|
Total income tax benefits
|
(1,414
|
)
|
(1,075
|
)
|
(830
|
)
|
|||||
|
Net compensation expense
|
$
|
4,372
|
|
$
|
1,994
|
|
$
|
3,344
|
|
||
As of
December 31, 2018
, the total compensation cost related to nonvested restricted stock unit awards not yet recognized was
$7.9 million
and is expected to be recognized over the weighted-average period of
1.4
years. As of
December 31, 2018
, the total compensation cost related to nonvested stock options not yet recognized was
$0.1 million
and is expected to be recognized over the weighted-average period of
0.8
years.
NOTE
15
-
BENEFIT PLANS
The Company’s 401(k) savings plan (the “Plan”) is available to all full-time, U.S.-based employees who have been employed with the Company for
six
months or longer. Under the Plan, a participant may contribute up to
100%
of earnings, with the Company matching the first
5%
of contributions at a rate of
50%
. The employee and Company contributions are paid to a corporate trustee and invested in various funds based on participant direction. Company contributions made to participants’ accounts become fully vested upon completion of
five
years of service. The total Company matching contributions to the Plan were
$3.1 million
,
$4.2 million
and
$2.0 million
for the years ended
December 31, 2018
,
2017
and
2016
, respectively.
F-30
NOTE
16
-
SEGMENT AND GEOGRAPHIC INFORMATION
Segment Information
The Company organizes its operations into
two
reportable segments as follows:
|
•
|
U.S. operations - Includes all pawn and consumer loan operations in the U.S.
|
|
•
|
Latin America operations - Includes all pawn and consumer loan operations in Latin America, which includes operations in Mexico, Guatemala, El Salvador and Colombia.
|
The following tables present reportable segment information for the fiscal years ended December 31,
2018
,
2017
and
2016
as well as separately identified segment assets (in thousands):
|
Year Ended December 31, 2018
|
||||||||||||||||
|
|
U.S.
Operations
|
Latin America
Operations
|
Corporate
|
Consolidated
|
||||||||||||
|
Revenue:
|
|
|
|
|||||||||||||
|
Retail merchandise sales
|
$
|
709,594
|
|
$
|
382,020
|
|
$
|
—
|
|
$
|
1,091,614
|
|
||||
|
Pawn loan fees
|
373,406
|
|
151,740
|
|
—
|
|
525,146
|
|
||||||||
|
Wholesale scrap jewelry sales
|
85,718
|
|
22,103
|
|
—
|
|
107,821
|
|
||||||||
|
Consumer loan and credit services fees
|
55,417
|
|
860
|
|
—
|
|
56,277
|
|
||||||||
|
Total revenue
|
1,224,135
|
|
556,723
|
|
—
|
|
1,780,858
|
|
||||||||
|
Cost of revenue:
|
|
|
|
|
||||||||||||
|
Cost of retail merchandise sold
|
450,516
|
|
246,150
|
|
—
|
|
696,666
|
|
||||||||
|
Cost of wholesale scrap jewelry sold
|
78,308
|
|
21,656
|
|
—
|
|
99,964
|
|
||||||||
|
Consumer loan and credit services loss provision
|
17,223
|
|
238
|
|
—
|
|
17,461
|
|
||||||||
|
Total cost of revenue
|
546,047
|
|
268,044
|
|
—
|
|
814,091
|
|
||||||||
|
Net revenue
|
678,088
|
|
288,679
|
|
—
|
|
966,767
|
|
||||||||
|
Expenses and other income:
|
|
|
|
|
||||||||||||
|
Store operating expenses
|
414,097
|
|
149,224
|
|
—
|
|
563,321
|
|
||||||||
|
Administrative expenses
|
—
|
|
—
|
|
120,042
|
|
120,042
|
|
||||||||
|
Depreciation and amortization
|
21,021
|
|
11,333
|
|
10,607
|
|
42,961
|
|
||||||||
|
Interest expense
|
—
|
|
—
|
|
29,173
|
|
29,173
|
|
||||||||
|
Interest income
|
—
|
|
—
|
|
(2,444
|
)
|
(2,444
|
)
|
||||||||
|
Merger and other acquisition expenses
|
—
|
|
—
|
|
7,643
|
|
7,643
|
|
||||||||
|
Loss on foreign exchange
|
—
|
|
—
|
|
762
|
|
762
|
|
||||||||
|
Total expenses and other income
|
435,118
|
|
160,557
|
|
165,783
|
|
761,458
|
|
||||||||
|
Income (loss) before income taxes
|
$
|
242,970
|
|
$
|
128,122
|
|
$
|
(165,783
|
)
|
$
|
205,309
|
|
||||
|
As of December 31, 2018
|
||||||||||||||||
|
U.S.
Operations |
Latin America
Operations |
Corporate
|
Consolidated
|
|||||||||||||
|
Pawn loans
|
$
|
271,584
|
|
$
|
91,357
|
|
$
|
—
|
|
$
|
362,941
|
|
||||
|
Consumer loans, net
(1)
|
15,902
|
|
—
|
|
—
|
|
15,902
|
|
||||||||
|
Inventories
|
199,978
|
|
75,152
|
|
—
|
|
275,130
|
|
||||||||
|
Goodwill
|
759,538
|
|
157,881
|
|
—
|
|
917,419
|
|
||||||||
|
Total assets
|
1,534,542
|
|
407,282
|
|
166,150
|
|
2,107,974
|
|
||||||||
|
(1)
|
Effective June 30, 2018, the Company no longer offers an unsecured consumer loan product in Latin America.
|
F-31
|
Year Ended December 31, 2017
|
||||||||||||||||
|
|
U.S.
Operations
|
Latin America
Operations
|
Corporate
|
Consolidated
|
||||||||||||
|
Revenue:
|
|
|
|
|||||||||||||
|
Retail merchandise sales
|
$
|
717,490
|
|
$
|
333,609
|
|
$
|
—
|
|
$
|
1,051,099
|
|
||||
|
Pawn loan fees
|
380,596
|
|
130,309
|
|
—
|
|
510,905
|
|
||||||||
|
Wholesale scrap jewelry sales
|
119,197
|
|
21,645
|
|
—
|
|
140,842
|
|
||||||||
|
Consumer loan and credit services fees
|
75,209
|
|
1,767
|
|
—
|
|
76,976
|
|
||||||||
|
Total revenue
|
1,292,492
|
|
487,330
|
|
—
|
|
1,779,822
|
|
||||||||
|
Cost of revenue:
|
|
|
|
|
||||||||||||
|
Cost of retail merchandise sold
|
468,527
|
|
211,176
|
|
—
|
|
679,703
|
|
||||||||
|
Cost of wholesale scrap jewelry sold
|
112,467
|
|
20,327
|
|
—
|
|
132,794
|
|
||||||||
|
Consumer loan and credit services loss provision
|
19,431
|
|
388
|
|
—
|
|
19,819
|
|
||||||||
|
Total cost of revenue
|
600,425
|
|
231,891
|
|
—
|
|
832,316
|
|
||||||||
|
Net revenue
|
692,067
|
|
255,439
|
|
—
|
|
947,506
|
|
||||||||
|
Expenses and other income:
|
|
|
|
|
||||||||||||
|
Store operating expenses
(1)
|
423,214
|
|
128,977
|
|
—
|
|
552,191
|
|
||||||||
|
Administrative expenses
|
—
|
|
—
|
|
122,473
|
|
122,473
|
|
||||||||
|
Depreciation and amortization
|
24,073
|
|
10,311
|
|
20,849
|
|
55,233
|
|
||||||||
|
Interest expense
|
—
|
|
—
|
|
24,035
|
|
24,035
|
|
||||||||
|
Interest income
|
—
|
|
—
|
|
(1,597
|
)
|
(1,597
|
)
|
||||||||
|
Merger and other acquisition expenses
|
—
|
|
—
|
|
9,062
|
|
9,062
|
|
||||||||
|
Gain on foreign exchange
(1)
|
—
|
|
—
|
|
(317
|
)
|
(317
|
)
|
||||||||
|
Loss on extinguishment of debt
|
—
|
|
—
|
|
14,114
|
|
14,114
|
|
||||||||
|
Total expenses and other income
|
447,287
|
|
139,288
|
|
188,619
|
|
775,194
|
|
||||||||
|
Income (loss) before income taxes
|
$
|
244,780
|
|
$
|
116,151
|
|
$
|
(188,619
|
)
|
$
|
172,312
|
|
||||
|
(1)
|
The gain on foreign exchange for the Latin America operations segment of
$0.3 million
for fiscal 2017 was reclassified on the consolidated statements of income in order to conform with the presentation for the year ended December 31, 2018. The gain on foreign exchange was reclassified from store operating expenses and reported separately on the consolidated statements of income.
|
|
As of December 31, 2017
|
||||||||||||||||
|
U.S.
Operations |
Latin America
Operations |
Corporate
|
Consolidated
|
|||||||||||||
|
Pawn loans
|
$
|
276,570
|
|
$
|
68,178
|
|
$
|
—
|
|
$
|
344,748
|
|
||||
|
Consumer loans, net
|
23,179
|
|
343
|
|
—
|
|
23,522
|
|
||||||||
|
Inventories
|
216,739
|
|
60,032
|
|
—
|
|
276,771
|
|
||||||||
|
Goodwill
|
743,997
|
|
87,148
|
|
—
|
|
831,145
|
|
||||||||
|
Total assets
|
1,527,012
|
|
282,605
|
|
253,167
|
|
2,062,784
|
|
||||||||
F-32
|
Year Ended December 31, 2016
|
||||||||||||||||
|
|
U.S.
Operations
|
Latin America
Operations
|
Corporate
|
Consolidated
|
||||||||||||
|
Revenue:
|
|
|
|
|||||||||||||
|
Retail merchandise sales
|
$
|
386,026
|
|
$
|
283,105
|
|
$
|
—
|
|
$
|
669,131
|
|
||||
|
Pawn loan fees
|
195,883
|
|
116,874
|
|
—
|
|
312,757
|
|
||||||||
|
Wholesale scrap jewelry sales
|
47,680
|
|
14,958
|
|
—
|
|
62,638
|
|
||||||||
|
Consumer loan and credit services fees
|
41,922
|
|
1,929
|
|
—
|
|
43,851
|
|
||||||||
|
Total revenue
|
671,511
|
|
416,866
|
|
—
|
|
1,088,377
|
|
||||||||
|
Cost of revenue:
|
|
|
|
|
||||||||||||
|
Cost of retail merchandise sold
|
241,086
|
|
177,470
|
|
—
|
|
418,556
|
|
||||||||
|
Cost of wholesale scrap jewelry sold
|
41,357
|
|
11,668
|
|
—
|
|
53,025
|
|
||||||||
|
Consumer loan and credit services loss provision
|
11,494
|
|
499
|
|
—
|
|
11,993
|
|
||||||||
|
Total cost of revenue
|
293,937
|
|
189,637
|
|
—
|
|
483,574
|
|
||||||||
|
Net revenue
|
377,574
|
|
227,229
|
|
—
|
|
604,803
|
|
||||||||
|
Expenses and other income:
|
|
|
|
|
||||||||||||
|
Store operating expenses
(1)
|
215,227
|
|
111,835
|
|
—
|
|
327,062
|
|
||||||||
|
Administrative expenses
|
—
|
|
—
|
|
96,537
|
|
96,537
|
|
||||||||
|
Depreciation and amortization
|
13,618
|
|
10,429
|
|
7,818
|
|
31,865
|
|
||||||||
|
Interest expense
|
—
|
|
—
|
|
20,320
|
|
20,320
|
|
||||||||
|
Interest income
|
—
|
|
—
|
|
(751
|
)
|
(751
|
)
|
||||||||
|
Merger and other acquisition expenses
|
—
|
|
—
|
|
36,670
|
|
36,670
|
|
||||||||
|
Loss on foreign exchange
(1)
|
—
|
|
—
|
|
952
|
|
952
|
|
||||||||
|
Net gain on sale of common stock of Enova
|
—
|
|
—
|
|
(1,299
|
)
|
(1,299
|
)
|
||||||||
|
Total expenses and other income
|
228,845
|
|
122,264
|
|
160,247
|
|
511,356
|
|
||||||||
|
Income (loss) before income taxes
|
$
|
148,729
|
|
$
|
104,965
|
|
$
|
(160,247
|
)
|
$
|
93,447
|
|
||||
|
(1)
|
The loss on foreign exchange for the Latin America operations segment of
$1.0 million
for fiscal 2016 was reclassified on the consolidated statements of income in order to conform with the presentation for the year ended December 31, 2018. The loss on foreign exchange was reclassified from store operating expenses and reported separately on the consolidated statements of income.
|
|
As of December 31, 2016
|
||||||||||||||||
|
U.S.
Operations |
Latin America
Operations |
Corporate
|
Consolidated
|
|||||||||||||
|
Pawn loans
|
$
|
293,392
|
|
$
|
57,114
|
|
$
|
—
|
|
$
|
350,506
|
|
||||
|
Consumer loans, net
|
28,847
|
|
357
|
|
—
|
|
29,204
|
|
||||||||
|
Inventories
|
282,860
|
|
47,823
|
|
—
|
|
330,683
|
|
||||||||
|
Goodwill
|
746,204
|
|
84,947
|
|
—
|
|
831,151
|
|
||||||||
|
Total assets
|
1,637,995
|
|
247,915
|
|
259,293
|
|
2,145,203
|
|
||||||||
F-33
Geographic Information
The following table shows revenue and long-lived assets (all non-current assets except goodwill, intangibles, net and deferred tax assets) by geographic area (in thousands):
|
Year Ended December 31,
|
||||||||||||
|
2018
|
2017
|
2016
|
||||||||||
|
Revenue:
|
||||||||||||
|
U.S.
|
$
|
1,224,135
|
|
$
|
1,292,492
|
|
$
|
671,511
|
|
|||
|
Mexico
|
531,744
|
|
464,161
|
|
397,549
|
|
||||||
|
Other Latin America
|
24,979
|
|
23,169
|
|
19,317
|
|
||||||
|
$
|
1,780,858
|
|
$
|
1,779,822
|
|
$
|
1,088,377
|
|
||||
|
Long-lived assets:
|
||||||||||||
|
U.S.
|
$
|
226,358
|
|
$
|
227,659
|
|
$
|
257,939
|
|
|||
|
Mexico
|
65,260
|
|
53,175
|
|
47,243
|
|
||||||
|
Other Latin America
|
9,265
|
|
3,552
|
|
2,554
|
|
||||||
|
$
|
300,883
|
|
$
|
284,386
|
|
$
|
307,736
|
|
||||
NOTE
17
-
QUARTERLY FINANCIAL DATA (UNAUDITED)
Summarized quarterly financial data for the fiscal years ended
December 31, 2018
and
2017
are set forth in the table below (in thousands, except per share amounts). The Company’s operations are subject to seasonal fluctuations. The Company computed the quarterly diluted earnings per share amounts as if each quarter was a discrete period based on that quarter’s weighted-average shares outstanding. As a result, the sum of the diluted earnings per share by quarter will not necessarily total the annual diluted earnings per share.
|
Quarter Ended
|
|||||||||||||||
|
March 31
|
June 30
|
September 30
|
December 31
|
||||||||||||
|
2018
|
|||||||||||||||
|
Total revenue
|
$
|
449,800
|
|
$
|
419,972
|
|
$
|
429,878
|
|
$
|
481,208
|
|
|||
|
Total cost of revenue
|
210,719
|
|
191,544
|
|
192,620
|
|
219,208
|
|
|||||||
|
Net revenue
|
239,081
|
|
228,428
|
|
237,258
|
|
262,000
|
|
|||||||
|
Total expenses and other income
|
183,302
|
|
186,157
|
|
193,175
|
|
198,824
|
|
|||||||
|
Net income
|
41,635
|
|
30,171
|
|
33,325
|
|
48,075
|
|
|||||||
|
Diluted earnings per share
|
0.90
|
|
0.67
|
|
0.76
|
|
1.09
|
|
|||||||
|
Diluted weighted-average shares
|
46,479
|
|
45,043
|
|
44,116
|
|
43,936
|
|
|||||||
|
2017
|
|||||||||||||||
|
Total revenue
|
$
|
447,576
|
|
$
|
416,629
|
|
$
|
435,412
|
|
$
|
480,205
|
|
|||
|
Total cost of revenue
|
204,676
|
|
192,205
|
|
204,366
|
|
231,069
|
|
|||||||
|
Net revenue
|
242,900
|
|
224,424
|
|
231,046
|
|
249,136
|
|
|||||||
|
Total expenses and other income
|
190,658
|
|
202,956
|
|
189,479
|
|
192,101
|
|
|||||||
|
Net income
|
32,645
|
|
15,239
|
|
28,274
|
|
67,734
|
|
|||||||
|
Diluted earnings per share
|
0.67
|
|
0.32
|
|
0.59
|
|
1.43
|
|
|||||||
|
Diluted weighted-average shares
|
48,402
|
|
48,289
|
|
47,668
|
|
47,212
|
|
|||||||
F-34
TABLE OF CONTENTS
Part IItem 1. BusinessItem 1A. Risk FactorsItem 1B. Unresolved Staff CommentsItem 2. PropertiesItem 3. Legal ProceedingsItem 4. Mine Safety DisclosuresPart IIItem 5. Market For Registrant S Common Equity, Related Stockholder Matters and Issuer Purchases Of Equity SecuritiesItem 6. Selected Financial DataItem 7. Management S Discussion and Analysis Of Financial Condition and Results Of OperationsItem 7A. Quantitative and Qualitative Disclosures About Market RiskItem 8. Financial Statements and Supplementary DataItem 9. Changes in and Disagreements with Accountants on Accounting and Financial DisclosureItem 9A. Controls and ProceduresItem 9B. Other InformationPart IIIItem 10. Directors, Executive Officers and Corporate GovernanceItem 11. Executive CompensationItem 12. Security Ownership Of Certain Beneficial Owners and Management and Related Stockholder MattersItem 13. Certain Relationships and Related Transactions, and Director IndependenceItem 14. Principal Accountant Fees and ServicesPart IVItem 15. Exhibits and Financial Statement SchedulesItem 16. Form 10-k SummaryNote 1 - Organization and Nature Of The CompanyNote 2 - Summary Of Significant Accounting PoliciesNote 3 - AcquisitionsNote 4 - Merger and Other Acquisition ExpensesNote 5 - Stockholders' EquityNote 6 - Fair Value Of Financial InstrumentsNote 7 - Customer Loans and Valuation AccountsNote 8 - Property and EquipmentNote 9 - Accounts Payable and Accrued LiabilitiesNote 10 - Long-term DebtNote 11 - Income TaxesNote 12 - Commitments and ContingenciesNote 13 - Goodwill and Other Intangible AssetsNote 14 - Equity Compensation Plans and Share-based CompensationNote 15 - Benefit PlansNote 16 - Segment and Geographic InformationNote 17 - Quarterly Financial Data (unaudited)