UNITED STATES
SECURITIES AND EXCHANGE COMMISSION
Washington, D.C. 20549
Form 10-K
(Mark One)
|
x
|
ANNUAL REPORT PURSUANT TO SECTION 13 OR 15(d) OF THE SECURITIES EXCHANGE ACT OF 1934
|
For the fiscal year ended December 31, 2010
OR
|
o
|
TRANSITION REPORT PURSUANT TO SECTION 13 OR 15(d) OF THE SECURITIES EXCHANGE ACT OF 1934
|
For the transition period from_______to_______
Commission file number 000-53012
MEDICAL BILLING ASSISTANCE, INC.
(Exact name of registrant as specified in its charter)
|
Colorado
(State or other jurisdiction of incorporation or organization)
|
59-2851601
(I.R.S. Employer Identification No.)
|
|
|
709 S. Harbor City Blvd., Suite 250, Melbourne, FL
(Address of principal executive offices)
|
32901
(Zip Code)
|
Registrant’s telephone number, including area code
(321) 725-0090
Securities registered pursuant to Section 12(b) of the Act:
|
Title of each class
|
Name of each exchange on which registered
|
|
|
N/A
|
N/A
|
Securities registered pursuant to Section 12(g) of the Act:
Common Stock, par value $0.001 per share
Indicate by check mark if the registrant is a well-known seasoned issuer, as defined in Rule 405 of the Securities Act. Yes
o
No
x
Indicate by check mark if the registrant is not required to file reports pursuant to Section 13 or 15(d) of the Act. Yes
o
No
x
Indicate by check mark whether the registrant (1) has filed all reports required to be filed by Section 13 or 15(d) of the Securities Exchange Act of 1934 during the preceding 12 months (or for such shorter period that the registrant was required to file such reports), and (2) has been subject to such filing requirements for the past 90 days. Yes
x
No
o
Indicate by check mark whether the registrant has submitted electronically and posted on its corporate website, if any, every Interactive Data File required to be submitted and posted pursuant to Rule 405 of Regulation S-T (§232.405 of this chapter) during the preceding 12 months (or for such shorter period that the registrant was required to submit and post such files).
Yes
o
No
o
Indicate by check mark if disclosure of delinquent filers pursuant to Item 405 of Regulation S-K (§ 229.405 of this chapter) is not contained herein, and will not be contained, to the best of registrant’s knowledge, in definitive proxy or information statements incorporated by reference in Part III of this Form 10-K or any amendment to this Form 10-K.
o
Indicate by check mark whether the registrant is a large accelerated filer, an accelerated filer, a non-accelerated filer, or a smaller reporting company. See the definitions of “large accelerated filer,” “accelerated filer” and “smaller reporting company” in Rule 12b-2 of the Exchange Act.
Large accelerated filer
o
Accelerated filer
o
Non-accelerated filer
o
(Do not check if a smaller reporting company) Smaller reporting company
x
Indicate by check mark whether the registrant is a shell company (as defined in Rule 12b-2 of the Act). Yes
o
No
x
The aggregate market value of the voting and non-voting common equity held by non-affiliates computed by reference to the price at which the common equity was last sold as of the last business day of the registrant’s most recently completed second fiscal quarter was $320,750.
As of April 12, 2011, there were 49,716,000 shares of common stock, par value $0.001 per share, outstanding.
1
MEDICAL BILLING ASSISTANCE, INC.
Table of Contents
|
Page
|
|||
|
PART I
|
|||
|
Item 1.
|
Business.
|
3 | |
|
Item 1A.
|
Risk Factors.
|
6 | |
|
Item 1B.
|
Unresolved Staff Comments.
|
12 | |
|
Item 2.
|
Properties.
|
12 | |
|
Item 3.
|
Legal Proceedings.
|
12 | |
|
Item 4.
|
(
Removed and Reserved.
)
|
12 | |
|
PART II
|
|||
|
Item 5.
|
Market for Registrant’s Common Equity, Related Stockholder Matters and Issuer Purchases of Equity Securities.
|
12 | |
|
Item 6.
|
Selected Financial Data.
|
13 | |
|
Item 7.
|
Management’s Discussion and Analysis of Financial Condition and Results of Operations.
|
13 | |
|
Item 7A.
|
Quantitative and Qualitative Disclosures About Market Risk.
|
17 | |
|
Item 8.
|
Financial Statements and Supplementary Data.
|
17 | |
|
Item 9.
|
Changes in and Disagreements With Accountants on Accounting and Financial Disclosure.
|
19 | |
|
Item 9A.
|
Controls and Procedures.
|
19 | |
|
Item 9B.
|
Other Information.
|
19 | |
|
PART III
|
|||
|
Item 10.
|
Directors, Executive Officers and Corporate Governance.
|
20 | |
|
Item 11.
|
Executive Compensation.
|
21 | |
|
Item 12.
|
Security Ownership of Certain Beneficial Owners and Management and Related Stockholder Matters.
|
22 | |
|
Item 13.
|
Certain Relationships and Related Transactions, and Director Independence.
|
22 | |
|
Item 14.
|
Principal Accountant Fees and Services.
|
23 | |
|
PART IV
|
|||
|
Item 15.
|
Exhibits and Financial Statement Schedules.
|
24 |
2
Forward-Looking Statements
Forward-looking statements in this report, including without limitation, statements related to Medical Billing Assistance, Inc.’s plans, strategies, objectives, expectations, intentions and adequacy of resources, are made pursuant to the safe harbor provisions of the Private Securities Litigation Reform Act of 1995. Investors are cautioned that such forward-looking statements involve risks and uncertainties including without limitation the following: (i) Medical Billing Assistance, Inc.’s plans, strategies, objectives, expectations and intentions are subject to change at any time at the discretion of Medical Billing Assistance, Inc.; (ii) Medical Billing Assistance, Inc.’s plans and results of operations will be affected by Medical Billing Assistance, Inc.’s ability to manage growth and competition; and (iii) other risks and uncertainties indicated from time to time in Medical Billing Assistance, Inc.’s filings with the Securities and Exchange Commission.
In some cases, you can identify forward-looking statements by terminology such as ‘‘may,’’ ‘‘will,’’ ‘‘should,’’ ‘‘could,’’ ‘‘expects,’’ ‘‘plans,’’ ‘‘intends,’’ ‘‘anticipates,’’ ‘‘believes,’’ ‘‘estimates,’’ ‘‘predicts,’’ ‘‘potential,’’ or ‘‘continue’’ or the negative of such terms or other comparable terminology. Although we believe that the expectations reflected in the forward-looking statements are reasonable, we cannot guarantee future results, levels of activity, performance or achievements. Moreover, neither we nor any other person assumes responsibility for the accuracy and completeness of such statements. Readers are cautioned not to place undue reliance on these forward-looking statements, which speak only as of the date hereof. We are under no duty to update any of the forward-looking statements after the date of this report.
We were incorporated in the State of Colorado on May 30, 2007 to act as a holding corporation for I.V. Services Ltd., Inc. (“IVS”), a Florida corporation engaged in providing billing services to the medical community. IVS was incorporated in the State of Florida on September 28, 1987. On June 30, 2007, we issued the 8,000,000 common shares to Mr. Michael West in exchange for 100% of the capital stock of IVS.
On December 29, 2010, we entered into a Share Exchange Agreement (the “Share Exchange Agreement”) with FCID Medical, Inc., a Florida corporation (“FCID Medical”) and FCID Holdings, Inc., a Florida corporation (“FCID Holdings)”, which together will be referred to herein with FCID Medical as “FCID”, and the shareholders of FCID (the “FCID Shareholders”). Pursuant to the terms of the Share Exchange Agreement, the FCID Shareholders exchanged 100% of the outstanding common stock of FCID for a total of 40,000,000 shares of common stock of the Company, resulting in FCID Medical and FCID Holdings being 100% owned subsidiaries of the Company (the “Share Exchange”).
In connection with the Share Exchange Agreement, in addition to the foregoing and effective on the closing date, Michael West resigned as President, Treasurer and director of the Company and Steve West resigned as officer of the Company but retained a directorship with the Company. After such resignations, Christian Charles Romandetti was appointed President, Chief Executive Officer and a director of the Company, and Donald Bittar was appointed Chief Financial Officer, Treasurer and Secretary.
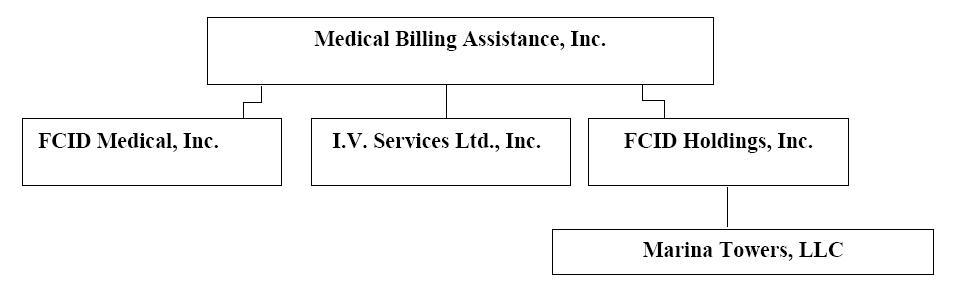
All of our operations are conducted out of our wholly-owned subsidiaries: IVS, FCID Medical and FCID Holdings. We have real estate holdings through FCID Holdings, Inc., under which Marina Towers, LLC is wholly-owned subsidiary. A diagram of our corporate structure is set below:
Our address is 709 S. Harbor City Blvd., Suite 250, Melbourne, FL 32901. Our telephone number is (321) 725-0090.
3
We are focusing the majority of our efforts on the business of FCID Medical. FCID Medical’s strategic plan is to provide MRI centers and medical practices in primarily rural communities with cost effective imaging and diagnostics, while fully complying with governmental regulations, guidelines and industry standards. MDBL will be headquartered in Melbourne, FL in the Marina Towers, in a building owned by Marina Towers, LLC, a subsidiary of FCID Holdings, and will develop training capabilities as well as central billing systems in this location.
FCID Holdings will manage our real estate holdings. With the completion of the Share Exchange Agreement, FCID Holdings, which owns a wholly-owned subsidiary known as Marina Towers, LLC, is one of our subsidiaries. Marina Towers, LLC operates Marina Towers, a 68,090 square foot five- story office building that generates revenue and income that we will use to expand our operating businesses.
One of our business goals will be on providing medical billing services through IVS to durable medical equipment companies and other medical businesses. A DME is a company, which sells or rents durable medical equipment to patients for use in their homes. Our plan is to help companies comply with constantly changing billing and documentation requirements thrust upon them by Medicare, Medicaid and private health insurance companies.
The majority of our efforts, however, will be developing the FCID Medical’s strategic plan is to provide MRI centers and medical practices in primarily rural communities.
Industry Overview
The full universe of the Medical Imaging Industry (MRI, MRA, PET, CAT, X-Ray) generates $100 billion annually. According to America Health Insurance Plans
(an industry trade group) this market is expected to continue to significantly increase .
Contributing factors to the strong growth of Medical Imaging are:
|
·
|
An aging population demanding more medical services.
|
|
·
|
Aging Baby Boomers medical demands in diagnostic imaging.
|
|
·
|
An increase in demand by a potential of 30 million people on the insurance rolls due to the Federal Healthcare Reform Act.
|
|
·
|
An exceptional causative factor is MRI imaging has become one of the most accepted standards for medical diagnosis.
|
|
·
|
Open Air MRI systems are increasing in popularity and rapidly becoming the preferred choice by providers and patients.
|
|
·
|
Open Air MRI systems can handle over 50% of all scans in the market place while offering the advantages of lower costs to purchase and operate while maintaining exceptional quality of service for patients.
|
Three major factors have opened the door to opportunity:
|
·
|
Regulatory Intervention:
With the perception that Medicare fraud and abuse is skyrocketing, regulatory agencies are implementing and expanding into historic levels of compliance requirements. FCID Medical research has shown that after reimbursement rates, compliance issues are the single causative factor for existing facilities to consider exiting the market. As a multi-facility provider, FCID Medical will be positioned to have a dedicated compliance person for every 10 locations providing FCID Medical with a unique negotiating position in the acquisition of existing facilities. This focus and dedication to compliance through a dedicated compliance division will allow FCID Medical to achieve complete installations in the shortest possible time frames.
|
|
·
|
Reimbursement models:
Most third party payers follow reimbursement schedules based on Medicare reimbursement rates. Based upon experience, FCID Medical believes the reimbursement models being proposed are predominantly based upon utilization of each MRI center. To summarize, the government has represented a utilization level for MRI centers of 3000 scans per year. Facilities that are below 1200 scans per year will find it very difficult to stay competitive in the marketplace. When considering acquisitions, FCID Medical will be basing each acquisition on the capability of achieving 2500 to 3000 scans per machine, per year. Thus achieving maximum utilization of the equipment, which in turn, will allow maximum reimbursement rates from the government.
|
|
·
|
Consolidation opportunities:
A recent survey by The Radiological Business Management Association and the American College of Radiology concluded that 40% of Physicians who owned facilities would consider consolidating. This creates an exceptional opportunity for consolidation within the industry. The opportunity will take the business model of accretive acquisition and roll up.
|
4
Products and Services
We will offer Magnetic Resonance Imaging (“MRI”) to our customers. MRI is a technique that involves the use of magnetic fields to produce computer-processed, three dimensional, cross-sectional images of the body. The resulting image reproduces soft tissue anatomy (as found in the brain, breast tissue, spinal cord, and interior ligaments of body joints such as the knee) with superior clarity, and without exposing patients to ionizing radiation. MRI systems are classified into two classes, conventional MRI systems and Open MRI systems. The Open MRI system allows a more conducive environment for handling sports injuries, young children and people who suffer claustrophobia or severe obesity. In 2009, an estimated 30 million scans were performed representing a market of approximately $30 + billion. At the core of this market place is the rapidly expanding Baby Boomer demographic that will see an increasing portion of the population turn 65 each year from now until 2020. As scans continue to be the preferred diagnostic tool, the demand created by this growing demographic will dramatically increase the number of scans necessary.
Business Plan
FCID Medical's tactical approach is to expand MRI Centers
in rural communities with cost-effective imaging and diagnostic services. Expansion within rural areas will allow FCID Medical the greatest competitive advantage within the market place because of its unique advantages. The growth strategy will be comprised of a tactical accretive acquisition roll up model for existing facilities and a secondary tactical approach to open new facilities in targeted rural locations.
FCID Medical plans to become one of the Nation's leaders of diagnostic services within rural areas of the US while complying fully with all governmental regulations, guidelines and industry standards. This unique business model of accretive acquisition roll up, equipment choices and centralized billing give FCID Medical the competitive advantages to ensure rapid successful growth in the market place.
FCID Medical recognizes the diminishing margins and the renewed focus on increased transparency and efficiency in the near future. In anticipation of this, FCID Medical has implemented tactics which will yield the following advantages:
|
▪
|
MRI machines have different levels of power measured on a Tesla scale. 3.0 Tesla machines are the most powerful and cost $3 to 4 million to purchase. In addition, they come with very high operating and maintenance costs.
|
|
▪
|
The Open MRI machine that FCID Medical specifies is a .3 Tesla. Not only is this machine significantly less in cost (600k to 750k) to purchase, it is also costs 60% less than the 3.0 to operate.
|
|
▪
|
FCID Medical prefers to operate Open MRI scanners which are suitable and functional for over 50% of all scans in the market place. The fiscal advantages are very favorable as re-imbursement rates remain constant regardless of the type of scanner used, thus increasing margins when FCID Medical Open MRI’s are specified.
|
|
▪
|
Streamlined Billing: Research performed by FCID Medical has shown that billing for Physician-owned MRI facilities can run as high as 18% of revenue and incorporates long delays in collections. FCID Medical has identified, by a combination of outsourcing and through bringing the billing in-house to a centralized billing platform (Melbourne, FL Corporate Headquarters), billing costs will be reduced to 7% during initial operational phases and then further reduce this cost to 4% of revenues.
|
|
▪
|
FCID Medical will receive payment for patient services primarily from the Medicare program, state government’s respective Medicaid programs, Health Maintenance Organizations (HMO), Preferred Provider Organizations (PPO), private insurers, in addition directly from patients. The approximate percentages of total revenues from operations are as follows:
|

FCID Medical has identified a profitable, unique business and financial model to penetrate the continued growing MRI market. FCID Medical will target existing profitable MRI centers, through acquisition and roll up due to increasing consolidation in the industry, while also identifying and establishing highly profitable MRI centers in the vastly under-served markets in rural America. With FCID Medical's unique business formula, a profitable and continued growth cycle will be immediately achievable and sustainable. FCID Medical believes that simplicity in its business model will allow for ease in measuring effectiveness. To summarize, there are over 30 million scans in the US being done per year. This number will continue to increase as numerous doctors believe that an MRI is the standard diagnostic test, equivalent to what an x-ray was 10 years ago. FCID Medical is in the scan business and believes that 1% market penetration is very achievable, resulting in 300,000 scans per year with potential revenues in excess of $300 million.
5
Intellectual Property
We are currently pursuing registered trademarks for our business brand name and several product and service names and marketing slogans. Although we consider our intellectual property rights to be valuable, we do not believe that the rejection or expiration of any single trademark would materially affect our consolidated results of operations.
Competition
The market for diagnostic imaging and radiation services and systems is competitive. Our major diagnostic imaging competitors include Alliance Healthcare Services,Inc., RadNet, Inc., InSight Health Services Corp., Medquest, Inc., Medical Resources, Inc., Shared Medical Services, Kings Medical Company Inc. and DMS Health Group. There are many competitors in the imaging sector we find ourselves competing with to gain business. If we are unable to successfully compete, our client base would decline and our business and financial condition would be harmed.
Regulatory Matters
Healthcare laws and regulations may change significantly in the future which could adversely affect our financial condition and results of operations. We continuously monitor these developments and modify our operations from time to time as the legislative and regulatory environment changes.
In March 2010, the President signed one of the most significant health care reform measures in decades. The Patient Protection and Affordable Care Act, as amended by the Health Care and Education Affordability Reconciliation Act (collectively, the “PPACA”), substantially changes the way health care is financed by both governmental and private insurers, including several payment reforms that establish payments to hospitals and physicians based in part on quality measures, and may significantly impact our industry. The PPACA requires, among other things, payment rates for services using imaging equipment that costs over $1 million to be calculated using revised equipment usage assumptions and reduced payment rates for imaging services paid under the Medicare Part B fee schedule. The current 50% utilization assumption rate would be replaced with a 75% usage rate for such equipment for services furnished on or after January 1, 2011. In addition, the PPACA changes the technical component discount on imaging of contiguous body parts during a single imaging session from 25% to 50%, as mandated by the DRA. We are unable to predict what effect the PPACA or other healthcare reform measures that may be adopted in the future will have on our business. The federal government will, however,
Employees
As of December 31, 2010 we employ a total of 4 employees. None of our employees are covered by a collective bargaining agreement. At the present time, the employment of all employees is “at-will”.
The risk factors discussed below could cause our actual results to differ materially from those expressed in any forward-looking statements. Although we have attempted to list comprehensively these important factors, we caution you that other factors may in the future prove to be important in affecting our results of operations. New factors emerge from time to time and it is not possible for us to predict all of these factors, nor can we assess the impact of each such factor on the business or the extent to which any factor, or combination of factors, may cause actual results to differ materially from those contained in any forward-looking statement.
The risks described below set forth what we believe to be the most material risks associated with the purchase of our common stock. Before you invest in our common stock, you should carefully consider these risk factors, as well as the other information contained in this prospectus.
6
RISKS RELATED TO OUR BUSINESS
Our limited operating history in our present format makes it difficult for us to evaluate our future business prospects and make decisions based on those estimates of our future performance.
Our Company is currently implementing a new business plan. As such, it has a limited operating history upon which you can base an evaluation of its business and prospects. To address these risks and uncertainties, we must do the following:
|
·
|
Successfully execute its business strategy;
|
|
·
|
Respond to competitive developments; and
|
|
·
|
Attract, integrate, retain and motivate qualified personnel.
|
We cannot be certain that our business strategy will be successful or that we will successfully address these risks. In the event that we do not successfully address these risks, our business, prospects, financial condition, and results of operations could be materially and adversely affected.
As a result of our current assets to liability ratio, our accountants have expressed doubts about our ability to continue as a going concern.
While our accountants have expressed doubt about our ability to continue as a going concern as a result of our current assets to liability ratio, management has development plans and plans for a best
efforts offering to maintain the Company as a going concern. The company’s plans to achieve and maintain profitability and positive cash flow is dependent upon our continued operations of Marina Towers and our ability to successfully develop and implement FCID Medical’s plans to provide MRI centers and medical practices to rural communities, as well as the operation of the consulting practice with regard to providing medical billing assistance to durable medical equipment companies.
Our management has limited experience as a public company.
Our management has limited experience operating a public company. We plan to comply with all of the various rules and regulations which are required of a public company. However, if we cannot operate successfully as a public company, your investment may be materially adversely affected.
We are implementing a strategy to grow our business, which is expensive and may not generate income.
We intend to grow our business, and we plan to incur expenses associated with our growth and expansion. Although we are taking steps to raise funds through equity offerings to implement our growth strategy, these funds may not be adequate to offset all of the expenses we incur in expanding our business. We will need to generate revenues to offset expenses associated with our growth, and we may be unsuccessful in achieving revenues, despite our attempts to grow our business. If our growth strategies do not result in significant revenues and income, we may have to abandon our plans for further growth.
Changes in the rates or methods of third-party reimbursements for diagnostic imaging services could result in reduced demand for our services or create downward pricing pressure, which would result in a decline in our revenues and harm to our financial position.
Third-party payors such as Medicare, Medicaid or private health insurance companies, and changes in the rates or methods of reimbursement for the services we plan to provide could have a significant negative impact on those revenues. At this time, we cannot predict the impact of rate reductions will have on our future revenues or business. Moreover, healthcare provider clients on whom we will depend for the majority of our revenues generally rely on reimbursement from third-party payors. If our clients receive decreased reimbursement, this could result in a reduced demand for our services or downward pricing pressures, which could have a material impact on our financial position.
Future requirements limiting access to or payment for radiology services may negatively impact our future revenues or business. If legislation substantially changes the way health care is financed by both governmental and private insurers, it may negatively impact payment rates for certain imaging services. We cannot predict at this time whether or the extent to which other proposed changes will be adopted, if any, or how these or future changes will affect the demand for our services.
7
We may experience competition from other medical diagnostic and radiation companies and equipment manufacturers and this competition could adversely affect our revenues and our business.
The market for diagnostic imaging and radiation services and systems is competitive. Our major diagnostic imaging competitors include Alliance Healthcare Services, Inc., RadNet, Inc., InSight Health Services Corp., Medquest, Inc., Medical Resources, Inc., Shared Medical Services, Kings Medical Company Inc. and DMS Health Group. There are many competitors in the imaging sector we find ourselves competing with to gain business. If we are unable to successfully compete, our client base would decline and our business and financial condition would be harmed.
Managed care organizations may prevent healthcare providers from using our services which would cause us to lose current and prospective clients.
Healthcare providers participating as providers under managed care plans may be required to refer diagnostic imaging tests to specific imaging service providers depending on the plan in which each covered patient is enrolled. These requirements currently inhibit healthcare providers from using our diagnostic imaging services in some cases. The proliferation of managed care may prevent an increasing number of healthcare providers from using our services in the future which would cause our revenues to decline.
Adverse changes in general domestic and worldwide economic conditions and instability and disruption of credit markets could adversely affect our operating results, financial condition, or liquidity.
We are subject to risks arising from adverse changes in general domestic and global economic conditions, including recession or economic slowdown and disruption of credit markets. Recent global market and economic conditions have been unprecedented and challenging with tighter credit conditions and recession in most major economies continuing into 2010. Continued concerns about the systemic impact of potential long-term and wide-spread recession, inflation, energy costs, geopolitical issues, the availability and cost of credit, the United States mortgage market and a declining real estate market in the United States have contributed to increased market volatility and diminished expectations for the United States economy. Added concerns fueled by the United States government financial assistance to certain companies and other federal government’s interventions in the United States financial system has led to increased market uncertainty and instability in both United States and international capital and credit markets. These conditions, combined with volatile oil prices, declining business and consumer confidence, increased unemployment, increased tax rates and governmental budget deficits and debt levels have contributed to volatility of unprecedented levels. We believe our MRI and PET/CT scan volumes may be impacted by unemployment rates, the number of under-insured or uninsured patients and other conditions arising from the global economic conditions described above. At this time, it is unclear what impact this might have on our future revenues or business.
As a result of these market conditions, the cost and availability of credit has been and may continue to be adversely affected by illiquid credit markets and wider credit spreads. Concern about the stability of the markets generally and the strength of counterparties specifically has led many lenders and institutional investors to reduce, and in some cases, cease to provide funding to borrowers.
Continued turbulence in the United States and international markets and economies may adversely affect our liquidity and financial condition, and the liquidity and financial condition of our customers. If these market conditions continue, they may limit our ability, and the ability of our customers, to timely replace maturing liabilities, and access the capital markets to meet liquidity needs, resulting in adverse effects on our financial condition and results of operations.
We may not receive payment from some of our healthcare provider customers because of their financial circumstances.
Some of our healthcare provider customers may not have significant financial resources, liquidity or access to capital. If these customers experience financial difficulties they may be unable to pay us for the equipment and services that we will provide. A significant deterioration in general or local economic conditions could have a material adverse effect on the financial health of certain of our healthcare provider customers. As a result, this may adversely affect our financial condition and results of operations.
Technological change in our industry could reduce the demand for our services and require us to incur significant costs to upgrade our equipment.
We plan to operate in a competitive, capital intensive and high fixed-cost industry. The development of new technologies or refinements of existing ones might make existing systems technologically or economically obsolete. Competition among manufacturers for a greater share of the MRI/CT and other diagnostic imaging systems market has resulted in and likely will continue to result in technological advances in the speed and imaging capacity of these new systems. Should new technological advances occur, we may not be able to acquire the new or improved systems. In the future, to the extent we are unable to generate sufficient cash from our operations or obtain additional funds through bank financing or the issuance of equity or debt securities; we may be unable to maintain a competitive equipment base. In addition, advancing technology may enable hospitals, physicians or other diagnostic service providers to perform procedures without the assistance of diagnostic service providers such as ourselves. As a result, we may not be able to maintain a competitive position in our targeted regions or expand our business.
8
Because a high percentage of our operating expenses are fixed, a relatively small decrease in revenues could have a significant negative impact on our financial results.
A high percentage of our expenses will be fixed, meaning they do not vary significantly with the increase or decrease in revenues. Such expenses include, but will not be limited to, debt service and capital lease payments, rent and operating lease payments, salaries, maintenance, insurance and vehicle operation costs. As a result, a relatively small reduction in the prices be charge for our services or procedure volume could have a disproportionate negative effect on our financial results.
We may be subject to professional liability risks, which could be costly and could negatively impact our business and financial results.
We may be subject to professional liability claims. Although there currently are no known hazards associated with any of our scanning or therapy delivery technologies directly related to the physical equipment when used properly, hazards may be discovered in the future. Furthermore, there is a risk of harm to a patient during an MRI if the patient has certain types of metal implants or cardiac pacemakers within his or her body. Although patients are screened to safeguard against this risk, screening may nevertheless fail to identify the hazard. There also is potential risk to patients treated with therapy equipment secondary to inadvertent or excessive over- or under exposure to radiation—a topic on which the U.S. House of Representatives Committee on Energy and Commerce Subcommittee on Health held a hearing on February 26, 2010. We maintain professional liability insurance with coverage that we believe is consistent with industry practice and appropriate in light of the risks attendant to our business. However, any claim made against us could be costly to defend against, result in a substantial damage award against us and divert the attention of our management from our operations, which could have an adverse effect on our financial performance.
Loss of key executives and failure to attract qualified managers and sales persons could limit our growth and negatively impact our operations.
We depend upon our management team to a substantial extent. In particular, we depend upon Christian Charles Romandetti, our President and Chief Executive Officer for his skills, experience and knowledge of our Company and industry contacts. We currently do not have key employee insurance policies covering any of our management team. The loss of Mr. Romandetti or other members of our management team could have a material adverse effect on our business, results of operations or financial condition.
We require field managers and sales persons with experience in our industry to operate and sell our services for diagnostic imaging. It is impossible to predict the availability of qualified field managers and sales persons or the compensation levels that will be required to hire them. The loss of the services of any member of our senior management or our inability to hire qualified field managers and sales persons at economically reasonable compensation levels could adversely affect our ability to operate and grow our business.
Loss of, and failure to attract, qualified employees, technologists and other clinical staff could limit our growth and negatively impact our operations.
Our future success depends on our ability to identify, hire, develop, motivate and retain highly skilled personnel for all areas of our organization. Competition in our industry for qualified employees is intense. In particular, there is a very high demand for qualified technologists who are necessary to operate our systems, particularly PET and PET/CT technologists. We may not be able to hire and retain a sufficient number of technologists and we expect that our costs for the salaries and benefits of these employees will continue to increase for the foreseeable future because of the industry’s competitive demand for their services. Our continued ability to compete effectively depends on our ability to attract new employees and to retain and motivate our existing employees.
We may not be able to achieve the expected benefits from future acquisitions, which would adversely affect our financial condition and results.
We plan to rely on acquisitions as a method of expanding our business. If we do not successfully integrate acquisitions, we may not realize anticipated operating advantages and cost savings. The integration of companies that have previously operated separately involves a number of risks, including:
|
•
|
demands on management related to the increase in our size after an acquisition;
|
||
|
•
|
the diversion of management’s attention from the management of daily operations to the integration of operations;
|
||
|
•
|
difficulties in the assimilation and retention of employees;
|
||
|
•
|
potential adverse effects on operating results; and
|
||
|
•
|
challenges in retaining clients.
|
9
We may not be able to maintain the levels of operating efficiency acquired companies have achieved or might achieve separately. Successful integration of each of their operations will depend upon our ability to manage those operations and to eliminate redundant and excess costs. Because of difficulties in combining operations, we may not be able to achieve the cost savings and other size-related benefits that we hoped to achieve after these acquisitions, which would harm our financial condition and operating results.
If we fail to comply with various licensure, certification and accreditation standards, we may be subject to loss of licensure, certification or accreditation which would adversely affect our operations.
All of the states in which we operate require that the imaging technologists that operate our computed tomography, single photon emission computed tomography and positron emission tomography systems be licensed or certified. Also, each of our retail sites must continue to meet various requirements in order to receive payments from the Medicare program. In addition, we are currently accredited by The Joint Commission, an independent, non-profit organization that accredits various types of healthcare providers such as hospitals, nursing homes and providers of diagnostic imaging services. In the healthcare industry, various types of organizations are accredited to meet certain Medicare certification requirements, expedite third-party payments and fulfill state licensure requirements. Some managed care providers prefer to contract with accredited organizations. Any lapse in our licenses, certifications or accreditations, or those of our technologists, or the failure of any of our retail sites to satisfy the necessary requirements under Medicare could adversely affect our operations and financial results.
The regulatory and political framework is uncertain and evolving.
Healthcare laws and regulations may change significantly in the future which could adversely affect our financial condition and results of operations. We continuously monitor these developments and modify our operations from time to time as the legislative and regulatory environment changes.
In March 2010, the President signed one of the most significant health care reform measures in decades. The Patient Protection and Affordable Care Act, as amended by the Health Care and Education Affordability Reconciliation Act (collectively, the “PPACA”), substantially changes the way health care is financed by both governmental and private insurers, including several payment reforms that establish payments to hospitals and physicians based in part on quality measures, and may significantly impact our industry. The PPACA requires, among other things, payment rates for services using imaging equipment that costs over $1 million to be calculated using revised equipment usage assumptions and reduced payment rates for imaging services paid under the Medicare Part B fee schedule. The current 50% usage assumption rate would be replaced with a 75% usage rate for such equipment for services furnished on or after January 1, 2011. In addition, the PPACA changes the technical component discount on imaging of contiguous body parts during a single imaging session from 25% to 50%, as mandated by the DRA. We are unable to predict what effect the PPACA or other healthcare reform measures that may be adopted in the future will have on our business.
Rising operating expenses and decrease in rents at our properties could reduce our cash flow and funds available for future dividends.
Marina Tower, LLC real estate property will likely be subject to operating risks common to real estate in general, any or all of which may negatively affect us. If any property is not fully occupied or if rents are being paid in an amount that is insufficient to cover operating expenses, we could be required to expend funds for that property’s operating expenses. If our competitors offer space at rental rates below market rates, or below the rental rates we charge our tenants, we may lose existing or potential tenants and we may be pressured to reduce our rental rates below those we charge in order to retain tenants when our tenants’ leases expire. Our property could also be subject to increases in real estate and other tax rates, utility costs, operating expenses, insurance costs, repairs and maintenance and administrative expenses. Such rise in operating expenses and loss of rents could reduce our cash flows and funds available for future dividends.
RISKS RELATED TO OUR CAPITAL STRUCTURE
Because our stock is traded on the Over-the-Counter Bulletin Board, it has a limited public trading market . As a result, it may be difficult or impossible for you to liquidate your investment.
While our common stock currently is listed for trading, we have had only a few trades. We are quoted on the Over-the-Counter Bulletin Board under the trading symbol MDBL. We cannot assure that such a market will improve in the future. The OTC Bulletin Board requires that we be a reporting company under the Securities Exchange Act of 1934. Further, we cannot assure that an investor will be able to liquidate his investment without considerable delay, if at all. If a more active market does develop, the price may be highly volatile. Our limited operating history, lack of profitability, negligible stock liquidity, potential extreme price and volume fluctuations, and regulatory burdens may have a significant impact on the market price of the common stock. It is also possible that the relatively low price of our common stock may keep many brokerage firms from engaging in transactions in our common stock.
10
Applicable SEC rules governing the trading of “Penny Stocks” limits the liquidity of our common stock, which may affect the trading price of our common stock.
Our common stock is currently quoted on the Bulletin Board. Our stock trades well below $5.00 per share. As a result, our common stock is considered a “penny stock” and is subject to SEC rules and regulations that impose limitations upon the manner in which our shares can be publicly traded. These regulations require the delivery, prior to any transaction involving a penny stock, of a disclosure schedule explaining the penny stock and the associated risks. Under these regulations, certain brokers who recommend such securities to persons other than established customers or certain accredited investors must make a special written suitability determination for the purchaser and receive the written purchaser’s agreement to a transaction prior to purchase. These regulations have the effect of limiting the trading activity of our common stock and reducing the liquidity of an investment in our common stock.
We do not expect to pay dividends in the foreseeable future.
We have not paid dividends on our common stock and do not anticipate paying dividends on our common stock in the foreseeable future. We currently plan to use all funds generated by operations for reinvestment in our operating activities. Investors should not count on dividends in evaluating an investment in our common stock.
Our largest shareholders hold significant control over our common stock and they may be able to control our Company indefinitely.
Our largest shareholders currently have beneficial ownership of approximately 60.7% of our outstanding common stock. These significant stockholders therefore have considerable influence over the outcome of all matters submitted to our stockholders for approval, including the election of directors, the approval of significant corporate transactions.
Possible volatility in our stock price could negatively affect us and our stockholders.
The price of our common stock could also be subject to wide fluctuations in the future as a result of a number of other factors, including the following:
|
•
|
changes in expectations as to future financial performance or buy/sell recommendations of securities analysts;
|
|
|
•
|
our, or a competitor’s, announcement of new products or services, or significant acquisitions, strategic partnerships, joint ventures or capital commitments; and
|
|
|
•
|
the operating and stock price performance of other comparable companies.
|
In addition, the U.S. securities markets have experienced significant price and volume fluctuations. These fluctuations often have been unrelated to the operating performance of companies in these markets. Broad market and industry factors may lead to volatility in the price of our common stock, regardless of our operating performance. Moreover, our stock has limited trading volume, and this illiquidity may increase the volatility of our stock price.
Kodiak will pay less than the then-prevailing market price for our common stock under the Equity Facility.
The common stock to be issued to Kodiak pursuant to the Equity Facility will be purchased at a 10% discount to the lowest closing bid price of our common stock during the five trading days following our delivery of a put notice to Kodiak. Subject to fluctuations in the market price of our stock, Kodiak will realize an immediate gain upon sale of the stock it purchases from us. When Kodiak sells the shares, the price of our common stock could decrease.
Existing shareholders could experience a substantial dilution upon the issuance of common stock pursuant to the Equity Facility.
If the average market price of our stock for all puts made under the Equity Facility is not greater than $0.75, we would need to issue more than 9,333,333 shares to receive the entire $7,000,000 available under the Equity Facility (plus 466,666 shares as commission to Kodiak). Based on the closing price of the Company’s common stock as of February 11, 2011 the total number of shares issuable under the Equity Facility would be approximately 6,244,425 shares (plus 466,666 shares as commission to Kodiak). This would cause our shareholders to experience a substantial dilution.
11
We may not be able to access sufficient funds under the Equity Facility when needed.
Our ability to put shares to Kodiak and obtain funds under the Equity Facility is limited by the terms and conditions in the Equity Facility, including restrictions on when we may exercise our put rights, restrictions on the amount we may put to Kodiak at any one time, which is determined in part by the trading volume of our common stock, and a limitation on Kodiak’s obligation to purchase if such purchase would result in Kodiak beneficially owning more than 9.99% of our common stock. Therefore, our ability to access the bulk of the funds available under the Equity Facility depends in part on Kodiak’s sale of stock purchased from us in prior puts. Accordingly, the Equity Facility may not be available at any given time to satisfy our funding needs.
If an active, liquid trading market for our common stock does not develop, you may not be able to sell your shares quickly or at or above the price you paid for it.
Although our common stock currently trades on the Over-the-Counter Bulletin Board, an active and liquid trading market for our common stock has not yet and may not ever develop or be sustained. You may not be able to sell your shares quickly or at or above the price you paid for our stock if trading in our stock is not active.
Not applicable.
Our executive offices are located at 709 S. Harbor City Blvd., Suite 250, Melbourne, FL. In the Marina Towers LLC building this company is a wholly owned subsidiary of FCID Holdings,. The Marina Towers building is a five story, multi-tenant building that has Class A space and a gross square footage of 68,090. Marina Towers provides us with an immediate and fully operational tangible asset.
We believe that our present facilities will be suitable for the operation of our business for the foreseeable future and should we need to expand, we expect that suitable additional space will be available on commercially reasonable terms, although no assurance can be made in this regard. We also believe our property is adequately covered by insurance.
There are no significant legal proceedings pending, and we are not aware of any material proceeding contemplated by a governmental authority, to which we are a party or any of our property is subject.
Market Information
Our common stock is traded in the over-the-counter market under the symbol "MDBL". The following table sets forth the high and low bid, as reported by pinksheets.com, for our common stock for the calendar periods indicated.
|
FISCAL YEAR 2010
|
HIGH
|
LOW
|
||||||
|
First Quarter
|
$ | 0.25 | $ | 0.25 | ||||
|
Second Quarter
|
$ | 0.25 | $ | 0.25 | ||||
|
Third Quarter
|
$ | 0.25 | $ | 0.25 | ||||
|
Fourth Quarter
|
$ | 0.25 | $ | 0.50 | ||||
|
FISCAL YEAR 2009
|
HIGH
|
LOW
|
||||||
|
First Quarter
|
$ | 0.25 | $ | 0.25 | ||||
|
Second Quarter
|
$ | 0.25 | $ | 0.25 | ||||
|
Third Quarter
|
$ | 0.25 | $ | 0.25 | ||||
|
Fourth Quarter
|
$ | 0.25 | $ | 0.50 | ||||
12
The last reported sales price of our common stock on April 12, 2011 was $1.00. The above quotations do not include retail mark-ups, mark-downs or commissions and represents prices between dealers and not necessarily actual transactions. The past performance of our securities is not necessarily indicative of future performance.
Shares Outstanding and Holders of Record
As of April 12, 2011, there were 49,716,000 shares of our common stock outstanding and approximately 63 shareholders of record of our common stock.
Dividend Policy
We have not declared or paid any cash dividends on our common stock since our inception. We do not intend to pay cash dividends on our common stock in the foreseeable future. We anticipate we will retain any earnings for use in our operations and development of our business.
Recent Sales of Unregistered Securities
There were no sales of unregistered securities during the fiscal year ended December 31, 2010 other than those transactions previously reported to the SEC on the Company’s quarterly reports on Form 10-Q and current reports on Form 8-K.
Securities Authorized for Issuance Under Equity Compensation Plans
None.
Purchases of Equity Securities by the Issuer and Affiliated Purchasers
None.
Not applicable.
MANAGEMENT'S DISCUSSION & ANALYSIS
The following discussion of our financial condition and results of operations should be read in conjunction with, and is qualified in its entirety by, the consolidated financial statements and notes thereto included in this Annual Report on Form 10-K. This item contains forward-looking statements that involve risks and uncertainties. Actual results may differ materially from those indicated in such forward-looking statements.
Forward-Looking Statements
This Annual Report on Form 10-K and the documents incorporated herein by reference contain forward-looking statements. Such forward-looking statements are based on current expectations, estimates, and projections about our industry, management beliefs, and certain assumptions made by our management. Words such as “anticipates”, “expects”, “intends”, “plans”, “believes”, “seeks”, “estimates”, variations of such words, and similar expressions are intended to identify such forward-looking statements. These statements are not guarantees of future performance and are subject to certain risks, uncertainties, and assumptions that are difficult to predict; therefore, actual results may differ materially from those expressed or forecasted in any such forward-looking statements. Unless required by law, we undertake no obligation to update publicly any forward-looking statements, whether as a result of new information, future events, or otherwise. However, readers should carefully review the risk factors set forth herein and in other reports and documents that we file from time to time with the Securities and Exchange Commission, particularly the Annual Reports on Form 10-K, Quarterly reports on Form 10-Q and any Current Reports on Form 8-K.
13
Overview and History
We were incorporated in the State of Colorado on May 30, 2007 to act as a holding corporation for I.V. Services Ltd., Inc. (“IVS”), a Florida corporation engaged in providing billing services to the medical community. IVS was incorporated in the State of Florida on September 28, 1987. On June 30, 2007, we issued the 8,000,000 common shares to Mr. Michael West in exchange for 100% of the capital stock of IVS.
On December 29, 2010, we entered into a Share Exchange Agreement (the “Share Exchange Agreement”) with FCID Medical, Inc., a Florida corporation (“FCID Medical”) and FCID Holdings, Inc., a Florida corporation (“FCID Holdings)”, which together will be referred to herein with FCID Medical as “FCID”, and the shareholders of FCID (the “FCID Shareholders”). Pursuant to the terms of the Share Exchange Agreement, the FCID Shareholders exchanged 100% of the outstanding common stock of FCID for a total of 40,000,000 shares of common stock of the Company, resulting in FCID Medical and FCID Holdings being 100% owned subsidiaries of the Company (the “Share Exchange”).
In connection with the Share Exchange Agreement, in addition to the foregoing and effective on the closing date, Michael West resigned as President, Treasurer and director of the Company and Steve West resigned as officer of the Company but retained a directorship with the Company. After such resignations, Christian Charles Romandetti was appointed President, Chief Executive Officer and a director of the Company, and Donald Bittar was appointed Chief Financial Officer, Treasurer and Secretary.
All of our operations are conducted out of our wholly-owned subsidiaries: IVS, FCID Medical and FCID Holdings. We have real estate holdings through FCID Holdings, Inc., under which Marina Towers, LLC is wholly-owned subsidiary. A diagram of our corporate structure is set below:

Our address is 709 S. Harbor City Blvd., Suite 250, Melbourne, FL 32901, and our telephone number is (321) 725-0090.
We are focusing the majority of our efforts on the business of FCID Medical. FCID Medical’s strategic plan is to provide MRI centers and medical practices in primarily rural communities with cost effective imaging and diagnostics, while fully complying with governmental regulations, guidelines and industry standards. MDBL will be headquartered in Melbourne, FL in the Marina Towers, in a building owned by Marina Towers, LLC, a subsidiary of FCID Holdings, and will develop training capabilities as well as central billing systems in this location.
14
FCID Holdings will manage our real estate holdings. With the completion of the Share Exchange Agreement, FCID Holdings, which owns a wholly-owned subsidiary known as Marina Towers, LLC, is one of our subsidiaries. Marina Towers, LLC operates Marina Towers, a 68,090 square foot Class A five-story office building that generates revenue and income that we will use to expand our operating businesses.
One of our business goals will be on providing medical billing services through IVS to durable medical equipment companies and other medical businesses. A DME is a company, which sells or rents durable medical equipment to patients for use in their homes. Our plan is to help companies comply with constantly changing billing and documentation requirements thrust upon them by Medicare, Medicaid and private health insurance companies.
The majority of our efforts, however, will be developing the FCID Medical’s strategic plan to provide MRI centers and medical practices in primarily rural communities.
Results of Operations
The following discussion involves our results of operations for the year ended December 31, 2010 compared to the year ended December 31, 2009.
Comparing our operations, we had revenues of $1,266,947 for the year ended December 31, 2010, compared to revenues of $1,073,408 for the year ended December 31, 2009. The increase in revenue of $193,539, or 18%, is primarily attributable to an increase in revenue generated from Marina Towers.
Operating expenses, which include general and administrative expenses for the year ended December 31, 2010, were $896,462 compared to expenses of $637,162 for the year ending December 31, 2009. The increase of $259,300, or 41%, is mainly attributable to legal and accounting expenses related to our Share Exchange, and the finders fees and options associated with our financing activities.
The major components of operating expenses include general and administrative, legal and accounting fees, and finders fees.
We believe that the general and administrative expenses in current operations should remain fairly constant as our revenues develop. Each additional sale or service and correspondingly the gross profit of such sale or service have minimal offsetting operating expenses. Thus, additional sales could become profit at a higher return on sales rate as a result of not needing to expand operating expenses at the same pace.
We had a net gain of $36,886 for the year ended December 31, 2010 compared to a net gain of $155,596 for the year ended December 31, 2009. This decrease in net gain of $118,710, or 76%, is mainly attributable to the non-recurring expenses that were necessary to complete the Share Exchange and the provision for income taxes.
15
While our accountants have expressed doubt about our ability to continue as a going concern as a result of our current assets to liability ratio, management has development plans and plans for a best efforts offering to maintain the Company as a going concern. Our ability to achieve and maintain profitability and positive cash flow is dependent upon our continued operations of Marina Towers and our ability to successfully develop and implement FCID Medical’s plans to provide MRI centers and medical practices to rural communities, as well as the operation of the consulting practice with regard to providing medical billing assistance to durable medical equipment companies.
In addition, we expect that we will need to raise additional funds to pursue the next phase of our business plan with FCID Medical. We cannot assure that additional financing will be available when needed on favorable terms, or at all.
We expect to maintain a positive cash flow in our current operations with FCID Holdings, Inc. as our revenues develop. We cannot guarantee that we will be successful in generating sufficient revenues or other funds in the future to cover all operating costs. Failure to generate sufficient revenues or additional financing when needed could cause us to go out of business.
Liquidity and Capital Resources
As of December 31, 2010, we had cash or cash equivalents of $3,318.
Net cash used for operating activities was $414,390 for the year ended December 31, 2010, compared to cash used for operating activities of $94,583 for the year ended December 31, 2009. We anticipate that overhead costs in current operations will remain fairly constant as revenues develop.
Cash flows used or provided by investing activities was $-0- for the year ended December 31, 2010, compared to $109,884 used for the year ended December 31, 2009.
Cash flows used by financing activities was $814,614 for the year ended December 31, 2010, compared to cash flows used for financing activities of $3,217 for the year ended December 31, 2009. The cash flows provided by financing activities are all related to changes in equity.
Over the next twelve months we do not expect any material our capital costs to develop operations. We plan to buy office equipment to be used in our operations.
We believe that we have sufficient capital in the short term for our current level of operations. This is because we have sufficient revenues generated from Marina Towers to maintain profitability in our operations and sources to maintain operations.
On January 26, 2011, we entered into an Investment Agreement and Registration Rights Agreement with Kodiak Capital Group, LLC. Pursuant to the agreements, Kodiak has committed to purchase up to $7,000,000 of the Company’s common stock over thirty-six months (the “Equity Facility”). The aggregate number of shares issuable by the Company and purchasable by Kodiak under the Investment Agreement will be determined by the purchase prices for the common stock, as determined under the terms of the Investment Agreement.
There can be no assurance that our cash flow will increase in the near future from anticipated new business activities, or that revenues generated from our existing operations will be sufficient to allow us to continue to pursue new customer programs or profitable ventures.
16
Critical Accounting Policies
Revenue recognition
Revenue is recognized on an accrual basis after services have been performed under contract terms, the event price to the client is fixed or determinable, and collectability is reasonably assured.
Use of Estimates
The preparation of financial statements in conformity with generally accepted accounting principles requires management to make estimates and assumptions that affect reported amounts of assets and liabilities and disclosure of contingent assets and liabilities at the date of the financial statements and the reported amounts of revenues and expenses during the reporting period. Actual results could differ from those estimates.
Income tax
The Company accounts for income taxes pursuant to Accounting Standards Codified 740 (“ASC 740”). Under ASC 740 deferred taxes are provided on a liability method whereby deferred tax assets are recognized for deductible temporary differences and operating loss carryforwards and deferred tax liabilities are recognized for taxable temporary differences. Temporary differences are the differences between the reported amounts of assets and liabilities and their tax bases. Deferred tax assets are reduced by a valuation allowance when, in the opinion of management, it is more likely than not that some portion or all of the deferred tax assets will not be realized. Deferred tax assets and liabilities are adjusted for the effects of changes in tax laws and rates on the date of enactment.
Off-Balance Sheet Arrangements
We do not have any off-balance sheet arrangements.
Disagreements with Accountants on Accounting and Financial Disclosure.
We did not have any disagreements on accounting and financial disclosures with our present accounting firm during the reporting period.
Not applicable.
17
MEDICAL BILLING ASSISTANCE, INC.
CONSOLIDATED FINANCIAL STATEMENTS
December 31, 2009 and 2010
18
MEDICAL BILLING ASSISTANCE, INC.
Consolidated Financial Statements
TABLE OF CONTENTS
|
Page
|
|
|
REPORT OF INDEPENDENT REGISTERED PUBLIC ACCOUNTING FIRM
|
F-2 |
|
CONSOLIDATED FINANCIAL STATEMENTS
|
|
|
Consolidated balance sheets
|
F-3 |
|
Consolidated statements of operations
|
F-4
|
|
Consolidated statements of stockholders’ equity
|
F-5 |
|
Consolidated statements of cash flows
|
F-6 - F-7
|
|
Notes to consolidated financial statements
|
F-8 - F-14 |
F-1
RONALD R. CHADWICK, P.C.
Certified Public Accountant
2851 South Parker Road, Suite 720
Aurora, Colorado 80014
Telephone (303)306-1967
Fax (303)306-1944
REPORT OF INDEPENDENT REGISTERED PUBLIC ACCOUNTING FIRM
Board of Directors
Medical Billing Assistance, Inc.
Melbourne, Florida
I have audited the accompanying consolidated balance sheets of Medical Billing Assistance, Inc. as of December 31, 2009 and 2010, and the related consolidated statements of operations, stockholders’ equity and cash flows for the years then ended. These financial statements are the responsibility of the Company's management. My responsibility is to express an opinion on these financial statements based on my audit.
I conducted my audit in accordance with the standards of the Public Company Accounting Oversight Board (United States). Those standards require that I plan and perform the audit to obtain reasonable assurance about whether the financial statements are free of material misstatement. An audit includes examining, on a test basis, evidence supporting the amounts and disclosures in the financial statements. An audit also includes assessing the accounting principles used and significant estimates made by management, as well as evaluating the overall financial statement presentation. I believe that my audit provides a reasonable basis for my opinion.
In my opinion, the consolidated financial statements referred to above present fairly, in all material respects, the consolidated financial position of Medical Billing Assistance, Inc. as of December 31, 2009 and 2010, and the consolidated results of its operations and its cash flows for the years then ended in conformity with accounting principles generally accepted in the United States of America.
The accompanying financial statements have been prepared assuming that the Company will continue as a going concern. As discussed in Note 8 to the financial statements the Company has a working capital and stockholders’ deficit that raise substantial doubt about its ability to continue as a going concern. Management's plans in regard to these matters are also described in Note 8. The financial statements do not include any adjustments that might result from the outcome of this uncertainty.
| Aurora, Colorado |

|
||
| March 25, 2011 | RONALD R. CHADWICK, P.C. | ||
F-2
MEDICAL BILLING ASSISTANCE, INC.
|
Dec. 31, 2009
|
Dec. 31, 2010
|
|||||||
|
ASSETS
|
||||||||
|
Current assets
|
||||||||
|
Cash
|
$ | 403,542 | $ | 3,318 | ||||
|
Prepaid expenses
|
7,847 | 7,811 | ||||||
|
Total current assets
|
411,389 | 11,129 | ||||||
|
Fixed assets - net
|
4,860,016 | 4,698,560 | ||||||
|
Deposits
|
5,752 | 4,415 | ||||||
|
Total Assets
|
$ | 5,277,157 | $ | 4,714,104 | ||||
|
LIABILITIES & STOCKHOLDERS' EQUITY
|
||||||||
|
Current liabilities
|
||||||||
|
Accounts payable
|
$ | 104,094 | $ | 154,606 | ||||
|
Related party payables
|
- | 51,197 | ||||||
|
Accrued interest payable
|
- | 26,785 | ||||||
|
Prepaid rent
|
- | 23,586 | ||||||
|
Notes payable - current
|
- | 249,580 | ||||||
|
Income tax payable
|
- | 29,019 | ||||||
|
Other liabilities
|
5,671 | 12,701 | ||||||
|
Total current liabilties
|
109,765 | 547,474 | ||||||
|
Tenant deposits
|
47,399 | 47,399 | ||||||
|
Notes payable
|
5,499,962 | 5,253,229 | ||||||
|
Total Liabilities
|
5,657,126 | 5,848,102 | ||||||
|
Stockholders' Equity
|
||||||||
|
Preferred stock, $.01 par value;
|
||||||||
|
1,000,000 shares authorized;
|
||||||||
|
no shares issued and outstanding
|
- | - | ||||||
|
Common stock, $.001 par value;
|
||||||||
|
100,000,000 shares authorized;
|
||||||||
|
40,000,000 (2009) and 49,716,000 (2010)
|
||||||||
|
shares issued and outstanding
|
40,000 | 49,716 | ||||||
|
Additional paid in capital
|
(2,013,409 | ) | (2,814,040 | ) | ||||
|
Retained earnings
|
1,593,440 | 1,630,326 | ||||||
|
Total Stockholders' Equity
|
(379,969 | ) | (1,133,998 | ) | ||||
|
Total Liabilities and Stockholders' Equity
|
$ | 5,277,157 | $ | 4,714,104 | ||||
The accompanying notes are an integral part of the consolidated financial statements.
F-3
MEDICAL BILLING ASSISTANCE, INC.
|
Year Ended
|
Year Ended
|
|||||||
|
Dec. 31, 2009
|
Dec. 31, 2010
|
|||||||
|
Rent revenue
|
$ | 1,029,725 | $ | 1,140,770 | ||||
|
Rent revenue - related party
|
121,778 | |||||||
|
Other revenue
|
43,683 | 4,399 | ||||||
| 1,073,408 | 1,266,947 | |||||||
|
Operating expenses:
|
||||||||
|
Depreciation
|
159,588 | 161,456 | ||||||
|
Legal and accounting
|
122,586 | |||||||
|
Finders fees
|
100,000 | |||||||
|
Option expense
|
38,115 | |||||||
|
General and administrative
|
477,574 | 474,305 | ||||||
| 637,162 | 896,462 | |||||||
|
Gain (loss) from operations
|
436,246 | 370,485 | ||||||
|
Other income (expense):
|
||||||||
|
Interest revenue
|
459 | 93 | ||||||
|
Interest expense
|
(281,109 | ) | (304,673 | ) | ||||
| (280,650 | ) | (304,580 | ) | |||||
|
Income (loss) before
|
||||||||
|
provision for income taxes
|
155,596 | 65,905 | ||||||
|
Provision for income tax
|
- | 29,019 | ||||||
|
Net income (loss)
|
$ | 155,596 | $ | 36,886 | ||||
|
Net income (loss) per share
|
||||||||
|
(Basic and fully diluted)
|
$ | 0.00 | $ | 0.00 | ||||
|
Weighted average number of
|
||||||||
|
common shares outstanding
|
40,000,000 | 40,056,677 | ||||||
The accompanying notes are an integral part of the consolidated financial statements.
F-4
MEDICAL BILLING ASSISTANCE, INC.
CONSOLIDATED STATEMENTS OF STOCKHOLDERS' EQUITY
|
Common Stock
|
Stock-
|
|||||||||||||||||||
|
Amount
|
Paid in
|
Retained
|
holders'
|
|||||||||||||||||
|
Shares (1)
|
$.001 Par
|
Capital
|
Earnings
|
Equity
|
||||||||||||||||
|
Balances at December 31, 2008
|
40,000,000 | $ | 40,000 | $ | (2,010,192 | ) | $ | 1,437,844 | $ | (532,348 | ) | |||||||||
|
Contributions (distributions) - net
|
(3,217 | ) | (3,217 | ) | ||||||||||||||||
|
Net income (loss) for the year
|
155,596 | 155,596 | ||||||||||||||||||
|
Balances at December 31, 2009
|
40,000,000 | $ | 40,000 | $ | (2,013,409 | ) | $ | 1,593,440 | $ | (379,969 | ) | |||||||||
|
Stock issued for reverse acquisition
|
9,716,000 | 9,716 | (110,266 | ) | (100,550 | ) | ||||||||||||||
|
Compensatory equity issuances -
|
||||||||||||||||||||
|
subsidiary
|
2,800 | 2,800 | ||||||||||||||||||
|
Option issuance
|
38,115 | 38,115 | ||||||||||||||||||
|
Contributions (distributions) - net
|
(731,280 | ) | (731,280 | ) | ||||||||||||||||
|
Net income (loss) for the year
|
36,886 | 36,886 | ||||||||||||||||||
|
Balances at December 31, 2010
|
49,716,000 | $ | 49,716 | $ | (2,814,040 | ) | $ | 1,630,326 | $ | (1,133,998 | ) | |||||||||
(1) As restated for a reverse acquisition on December 29, 2010
The accompanying notes are an integral part of the consolidated financial statements.
F-5
MEDICAL BILLING ASSISTANCE, INC.
|
Year Ended
|
Year Ended
|
|||||||
|
Dec. 31, 2009
|
Dec. 31, 2010
|
|||||||
|
Cash Flows From Operating Activities:
|
||||||||
|
Net income (loss)
|
$ | 155,596 | $ | 36,886 | ||||
|
Adjustments to reconcile net loss to
|
||||||||
|
net cash provided by (used for)
|
||||||||
|
operating activities:
|
||||||||
|
Depreciation
|
159,588 | 161,456 | ||||||
|
Compensatory equity issuances
|
- | 40,915 | ||||||
|
Compensatory debt issuances
|
- | 54,331 | ||||||
|
Prepaid expenses
|
(1,901 | ) | 36 | |||||
|
Other assets
|
- | 1,337 | ||||||
|
Accrued payables
|
(240,794 | ) | 59,794 | |||||
|
Tenant deposits
|
22,430 | - | ||||||
|
Income tax payable
|
29,019 | |||||||
|
Other liabilities
|
(336 | ) | 7,030 | |||||
|
Prepaid rent
|
- | 23,586 | ||||||
|
Net cash provided by (used for)
|
||||||||
|
operating activities
|
94,583 | 414,390 | ||||||
|
Cash Flows From Investing Activities:
|
||||||||
|
Fixed asset purchases
|
(109,884 | ) | - | |||||
|
Net cash provided by (used for)
|
||||||||
|
investing activities
|
(109,884 | ) | - | |||||
(Continued On Following Page)
The accompanying notes are an integral part of the consolidated financial statements.
F-6
MEDICAL BILLING ASSISTANCE, INC.
CONSOLIDATED STATEMENTS OF CASH FLOWS
(Continued From Previous Page)
|
Year Ended
|
Year Ended
|
|||||||
|
Dec. 31, 2009
|
Dec. 31, 2010
|
|||||||
|
Cash Flows From Financing Activities:
|
||||||||
|
Note payable - payments
|
(83,334 | ) | ||||||
|
Distributions - net
|
(3,217 | ) | (731,280 | ) | ||||
|
Net cash provided by (used for)
|
||||||||
|
financing activities
|
(3,217 | ) | (814,614 | ) | ||||
|
Net Increase (Decrease) In Cash
|
(18,518 | ) | (400,224 | ) | ||||
|
Cash At The Beginning Of The Period
|
422,060 | 403,542 | ||||||
|
Cash At The End Of The Period
|
$ | 403,542 | $ | 3,318 | ||||
|
Schedule Of Non-Cash Investing And Financing Activities
|
||||||||
|
In 2010 the Company issued notes to a related party for expense payments made on
|
||||||||
|
behalf of the Company of $54,331,
|
||||||||
|
issued 9,716,000 shares of commn stock pursuant to a reverse acquisition for
|
||||||||
|
net liabilities of $100,550, and recorded $38,115 in paid in capital for an option issuance
|
||||||||
|
and $2,800 in paid in capital for a subsidiary stock issuance for services.
|
||||||||
|
Supplemental Disclosure:
|
||||||||
|
Cash paid for interest
|
$ | 281,109 | $ | 276,637 | ||||
|
Cash paid for income taxes
|
$ | - | $ | - | ||||
|
The accompanying notes are an integral part of the consolidated financial statements.
|
||||||||
F-7
MEDICAL BILLING ASSISTANCE, INC.
NOTES TO CONSOLIDATED FINANCIAL STATEMENTS
December 31, 2009 and 2010
Medical Billing Assistance, Inc. was incorporated in the State of Colorado on May 30, 2007.
On December 29, 2010 Medical Billing Assistance, Inc. entered into a share exchange agreement (the "Agreement") with FCID Holdings, Inc. and FCID Medical, Inc., acquiring 100% of the outstanding common stock of FCID Holdings, Inc. and FCID Medical, Inc. through the issuance of 40,000,000 shares of its common stock. The transaction was accounted for as a reverse acquisition as the shareholders of FCID Holdings, Inc. and FCID Medical, Inc. retained the majority of the outstanding common stock of Medical Billing Assistance, Inc. after the share exchange. FCID Medical, Inc. is an inactive corporation with no assets or liabilities. Effective with the Agreement, the Company's stockholders' equity was retroactively recapitalized as that of FCID Holdings, Inc. while 100% of the assets and liabilities of Medical Billing Assistance, Inc. valued at $(100,550), consisting of cash $242, investment in subsidiary of $(66,286), accounts payable $16,677, notes payable $16,600, interest payable $1,079, and other liabilities $150 were recorded as being acquired in the reverse acquisition for its 9,716,000 outstanding common shares on the acquisition date. Subsequent to the December 29, 2010 recapitalization, Medical Billing Assistance, Inc., FCID Holdings, Inc. and FCID Medical, Inc. remain separate legal entities (with Medical Billing Assistance, Inc. as the parent of FCID Holdings, Inc. and FCID Medical, Inc.). The accompanying consolidated financial statements exclude the financial position, results of operations and cash flows of Medical Billing Assistance, Inc. prior to the December 29, 2010 share exchange.
FCID Holdings, Inc. was incorporated in the State of Florida on February 25, 2010. FCID Holdings, Inc. was formed to act as a holding corporation for other business entities as needed, including Marina Towers, LLC, a Florida limited liability company that owns and manages a commercial real estate office building. Marina Towers, LLC was formed in the State of Florida on July 24, 2003. Effective September 30, 2010, in an acquisition classified as a transaction between parties under common control, FCID Holdings, Inc. acquired all the outstanding membership interests of Marina Towers, LLC (12,000,000 FCID Holdings, Inc. common shares were issued for 60 Class A and 40 Class B membership interests of Marina Towers, LLC), making Marina Towers, LLC a wholly owned subsidiary of FCID Holdings, Inc. The financial statements include the activity of Marina Towers, LLC from January 1, 2008 through February 25, 2010, and the combined activity of FCID Holdings, Inc. and Marina Towers, LLC thereafter through December 31, 2010, with the financial statements presented as if FCID Holdings, Inc. and Marina Towers, LLC had been combined from July 24, 2003 forward.
The combined entities of Medical Billing Assistance, Inc., I.V. Services, Ltd., Inc. (a subsidiary of Medical Billing Assistance, Inc.), FCID Holdings, Inc. and FCID Medical, Inc., and Marina Towers, LLC are referred to collectively hereinafter as the “Company”.
The Company plans to provide management services for medical practices. The Company may also engage in any other business activity permitted by law, as designated by the Board of Directors of the Company.
F-8
MEDICAL BILLING ASSISTANCE, INC.
NOTES TO CONSOLIDATED FINANCIAL STATEMENTS
December 31, 2009 and 2010
NOTE 1. ORGANIZATION, OPERATIONS AND SUMMARY OF SIGNIFICANT ACCOUNTING POLICIES (Continued):
Principles of consolidation
The accompanying consolidated financial statements include the accounts of Medical Billing Assistance, Inc. and its wholly owned subsidiary. All intercompany accounts and transactions have been eliminated in consolidation.
Use of Estimates
The preparation of financial statements in conformity with generally accepted accounting principles requires management to make estimates and assumptions that affect reported amounts of assets and liabilities and disclosure of contingent assets and liabilities at the date of the financial statements and the reported amounts of revenues and expenses during the reporting period. Actual results could differ from those estimates.
Cash and cash equivalents
The Company considers all highly liquid investments with an original maturity of three months or less as cash equivalents.
Accounts receivable
The Company reviews accounts receivable periodically for collectability and establishes an allowance for doubtful accounts and records bad debt expense when deemed necessary. At December 31, 2009 and 2010 the Company had no balance in its allowance for doubtful accounts.
Property and equipment
Property and equipment are recorded at cost and depreciated under accelerated or straight line methods over each item's estimated useful life.
Revenue recognition
Revenue is recognized on an accrual basis as earned under contract terms.
Advertising costs
Advertising costs are expensed as incurred. The Company had advertising costs in 2009 and 2010 of $0 and $1,500.
F-9
MEDICAL BILLING ASSISTANCE, INC.
NOTES TO CONSOLIDATED FINANCIAL STATEMENTS
December 31, 2009 and 2010
Income tax
The Company accounts for income taxes pursuant to ASC 740. Under ASC 740 deferred taxes are provided on a liability method whereby deferred tax assets are recognized for deductible temporary differences and operating loss carryforwards and deferred tax liabilities are recognized for taxable temporary differences. Temporary differences are the differences between the reported amounts of assets and liabilities and their tax bases. Deferred tax assets are reduced by a valuation allowance when, in the opinion of management, it is more likely than not that some portion or all of the deferred tax assets will not be realized. Deferred tax assets and liabilities are adjusted for the effects of changes in tax laws and rates on the date of enactment.
Stock based compensation
The Company accounts for employee and non-employee stock awards under ASC 718, whereby equity instruments issued to employees for services are recorded based on the fair value of the instrument issued and those issued to non-employees are recorded based on the fair value of the consideration received or the fair value of the equity instrument, whichever is more reliably measurable.
Financial Instruments
The carrying value of the Company’s financial instruments, as reported in the accompanying balance sheets, approximates fair value.
Long-Lived Assets
In accordance with ASC 350, the Company regularly reviews the carrying value of intangible and other long-lived assets for the existence of facts or circumstances, both internally and externally, that suggest impairment. If impairment testing indicates a lack of recoverability, an impairment loss is recognized by the Company if the carrying amount of a long-lived asset exceeds its fair value.
Products and services
The Company earns revenue from renting office space, medical billing services, and plans to acquire and manage medical practices and MRI diagnostic centers, but currently does not separate activities into separate operating segments.
F-10
MEDICAL BILLING ASSISTANCE, INC.
NOTES TO CONSOLIDATED FINANCIAL STATEMENTS
December 31, 2009 and 2010
Fixed asset values recorded at cost are as follows:
| 2009 |
2010
|
|||||||
|
Land
|
$ | 1,000,000 | $ | 1,000,000 | ||||
|
Building
|
3,055,168 | 3,055,168 | ||||||
|
Building improvements
|
1,662,362 | 1,662,362 | ||||||
| 5,717,530 | 5,717,530 | |||||||
|
Less accumulated depreciation
|
(857,514 | ) | (1,018,970 | ) | ||||
|
Total
|
$ | 4,860,016 | $ | 4,698,560 | ||||
Depreciation expense in 2009 and 2010 was $159,588 and $161,456.
The Company carries various service contracts on its office building for repairs, maintenance and inspections. Certain contracts are long term and noncancellable. The Company’s future minimum payments under noncancellable service contracts by year from December 31, 2010 forward are approximately: 2011 $12,000, 2012 $11,000, 2013 $6,500, Total $29,500. Total service contract expense in 2009 and 2010 was $23,272 and $24,009.
The Company at December 31, 2009 and 2010 owed $47,098 and $51,197 to a shareholder and former officer for non-interest bearing, due on demand working capital advances.
F-11
MEDICAL BILLING ASSISTANCE, INC.
NOTES TO CONSOLIDATED FINANCIAL STATEMENTS
December 31, 2009 and 2010
At December 31, 2009 and 2010 the Company owed a bank $18,250 and $15,250 under a line of credit note payable. The line of credit is secured by all Company assets, guaranteed by a Company shareholder, due on demand, and bears interest at prime plus 6%. Interest expense under the note in 2009 and 2010 was $758 and $631. Accrued interest payable at each date was $59 and $49.
At December 31, 2009 and 2010 the Company owed a shareholder and former officer $3,300 and $16,600 plus accrued interest of $83 and $1,079 under an unsecured, due on demand note payable bearing interest at 6% per annum. Interest expense under the note in 2009 and 2010 was $83 and $996.
At December 31, 2010 the Company owed a company related by common control $54,331 under two unsecured, due on demand notes payable bearing interest at 8% per annum. The notes were taken out in late December 2010 and accrued no interest expense for the year.
The Company has a mortgage note payable on its commercial office building which is secured by land and the building, bears interest at a variable rate of prime plus .5% with a minimum rate of 5.5%, with monthly interest only payments required through January 2010, then monthly principal and interest payments commencing in February 2010 using a 20 year amortization schedule recalculated monthly for interest rate changes, with all outstanding principal and interest due in full in January 2012. The principal balance on the loan at December 31, 2009 and 2010 was $5,499,962, and $5,416,628. Interest expense under the note in 2009 and 2010 was $281,109 and $304,653. Future minimum principal payments by year (using an interest rate of 5.5% for estimate purposes) from December 31 2010 forward are: 2011 $163,399, 2012 $5,253,229, Total $5,416,628.
F-12
MEDICAL BILLING ASSISTANCE, INC.
NOTES TO CONSOLIDATED FINANCIAL STATEMENTS
December 31, 2009 and 2010
Deferred income taxes arise from the temporary differences between financial statement and income tax recognition of net operating losses and other items. Loss carryovers are limited under the Internal Revenue Code should a significant change in ownership occur.
Due to the reverse acquisition of Medical Billing Assistance, Inc. by FCID Holdings, Inc. on December 29, 2010, the net operating loss carryforwards of Medical Billing Assistance, Inc. incurred prior to that date may not be useable for income tax purposes. As through September 30, 2010 FCID Holdings, Inc. was inactive, and FCID Holdings, Inc.’s active subsidiary is a limited liability company and through September 30, 2010 passed no income through to FCID Holdings, Inc. for federal and state income tax purposes, FCID Holdings, Inc. through September 30, 2010 incurred no income tax at the corporate level.
The Company accounts for income taxes pursuant to ASC 740.
Income taxes at Federal and state statutory rates are reconciled to the Company’s actual income taxes as follows:
|
December 31, 2009
|
December 31, 2010
|
|||||||
|
Tax at federal statutory rate (15 - 39%)
|
$ | - | $ | 11,476 | ||||
|
State income tax (5%)
|
- | 3,295 | ||||||
|
Book to tax differences
|
- | 14,248 | ||||||
|
Income tax – current
|
$ | - | $ | 29,019 | ||||
|
Income tax - deferred
|
$ | - | $ | - | ||||
F-13
MEDICAL BILLING ASSISTANCE, INC.
NOTES TO CONSOLIDATED FINANCIAL STATEMENTS
December 31, 2009 and 2010
Non-employee stock options
The Company had no stock option activity in 2009. At the beginning of 2010 the Company had no non-employee stock options outstanding. During 2010 the Company granted 400,000 options for services, allowing the holder to purchase one share of common stock per option, with all options exercisable immediately at a price of $.75 per share, and with the option exercise periods expiring in December 2012. During 2010 no options were exercised, and no options expired, leaving a 2010 year end outstanding balance of 400,000 non-employee stock options. The fair value of the 400,000 options granted in 2010 was estimated on the date of grant using the Black-Scholes option pricing model with the following assumptions: risk free interest rate of .74%, dividend yield of 0%, expected lives of two years, volatility of 57%. The Company incurred and recorded compensation expense under these stock option grants of $38,115 in 2010.
Employee stock options
The Company had no employee stock option activity in 2009 or 2010.
The Company has a working capital deficit and stockholders' deficit, and in all likelihood will be required to make significant future expenditures in connection with marketing efforts along with general administrative expenses. These conditions raise substantial doubt about the Company’s ability to continue as a going concern.
The Company incurred various non-recurring expenses in the last quarter of 2010 in connection with its share exchange agreement, and prior to the share exchange agreement Marina Towers, LLC allocated large distributions to its members, leading in part to the Company’s working capital deficit. The current core business of the Company is the operation of Marina Towers, which led to a positive cash flow from operations in 2009 and 2010. The Company is also involved in development project efforts to purchase MRI centers and medical practices, and has current plans for a “best efforts” stock offering. Management believes that ongoing profitable operations of Marina Towers, LLC, along with successful completion of its business development plan will allow the Company to improve or eliminate its working capital deficit and will provide the opportunity for the Company to continue as a going concern.
The Company has evaluated subsequent events through the date of issuance of these financial statements and determined that there are no reportable subsequent events.
F-14
None.
Disclosure Controls and Procedures
We carried out an evaluation, under the supervision and with the participation of our management, including our chief executive officer and chief financial officer, of the effectiveness of the design and operation of our disclosure controls and procedures, as defined in Rules 13a-15(e) and 15d-15(e) under the Securities Exchange Act of 1934, as amended (the ‘‘Exchange Act’’). Disclosure controls and procedures include, without limitation, controls and procedures designed to ensure that information required to be disclosed by an issuer in the reports that it files or submits under the Exchange Act is accumulated and communicated to the issuer’s management, including its principal executive and principal financial officers, or persons performing similar functions, as appropriate to allow timely decisions regarding required disclosure. Based upon our evaluation, our chief executive officer and chief financial officer concluded that our disclosure controls and procedures are effective, as of December 31, 2010, in ensuring that material information that we are required to disclose in reports that we file or submit under the Exchange Act is recorded, processed, summarized and reported within the time periods specified in the Securities and Exchange Commission rules and forms.
Changes in Internal Control over Financial Reporting
There were no changes in our system of internal control over financial reporting during the fourth quarter of the year ended December 31, 2010 that have materially affected, or are reasonably likely to materially affect, our internal control over financial reporting.
Management’s Annual Report on Internal Control over Financial Reporting
Our management is responsible for establishing and maintaining adequate internal control over financial reporting. Internal control over financial reporting is defined in Rules 13a-15(f) and 15d-15(f) under the Exchange Act as a process designed by, or under the supervision of, a company’s principal executive and principal financial officers and effected by a company’s board of directors, management and other personnel to provide reasonable assurance regarding the reliability of financial reporting and the preparation of financial statements for external purposes in accordance with generally accepted accounting principles. Our internal control over financial reporting includes those policies and procedures that:
|
·
|
pertain to the maintenance of records that, in reasonable detail, accurately and fairly reflect the transactions and dispositions of our assets;
|
|
|
·
|
provide reasonable assurance that transactions are recorded as necessary to permit preparation of financial statements in accordance with generally accepted accounting principles, and that our receipts and expenditures are being made only in accordance with authorizations of our management and directors; and
|
|
|
·
|
provide reasonable assurance regarding prevention or timely detection of unauthorized acquisition, use or disposition of our assets that could have a material effect on the financial statements.
|
Because of its inherent limitations, internal control over financial reporting may not prevent or detect misstatements. Projections of any evaluation of effectiveness to future periods are subject to the risk that controls may become inadequate because of changes in conditions, or that the degree of compliance with the policies or procedures may deteriorate.
Our management assessed the effectiveness of our internal control over financial reporting as of December 31, 2010. In making this assessment, management used the criteria set forth by the Committee of Sponsoring Organizations of the Treadway Commission (COSO) in Internal Control — Integrated Framework.
Based on our assessment, our management has concluded that, as of December 31, 2010, our internal control over financial reporting is effective based on those criteria.
This annual report does not include an attestation report of our registered public accounting firm regarding internal control over financial reporting. Management’s report was not subject to attestation by our registered public accounting firm pursuant to rules of the Securities and Exchange Commission that permanently exempt smaller reporting companies.
None.
19
Directors and Executive Officers
Set forth below are the names of the directors and officers of the Company, all positions and offices with the Company held, the period during which he has served as such, and the business experience during at least the last five years:
|
Name
|
Age
|
Positions and Offices Held
|
||
|
Christian Charles Romandetti
|
50
|
President, Chief Executive Officer and Director
|
||
|
Donald Bittar
|
69
|
Chief Financial Officer, Treasurer and Secretary
|
||
|
Stephen West
|
53
|
Director
|
Christian Charles Romandetti, President and Chief Executive Officer and Director
Mr. Romandetti was named President and Chief Executive Officer of the Company in 2010. Since 2003 to the present, he has been the Managing Member of Marina Towers, LLC, now one of the Company’s subsidiaries. He is also the Managing Member of C&K, LLC, a property holding company. From 2004 to 2005, he was a director of Sunrise Bank, a bank in which he was a founding director. Since 2007 to the present, Mr. Romandetti has been involved as a consultant to various medical practices, including MRI centers. Prior to 2003, Mr. Romandetti he as an executive officer for numerous companies in the real estate, marine, automotive and construction products industries.
Donald Bittar, Chief Financial Officer, Treasurer and Secretary
Mr. Bittar was named Executive Vice President, Treasurer and Secretary of the Company in 2010. He previously was President and Chairman of Associated Mortgage of North America, Inc. from 1999. Prior to that, he served as President of DA Bittar and Associates Inc., a management and technology consulting firm, from 1980. Prior to that, Mr. Bittar served as President and Chairman of Marine Telephone, Inc., from 1969.
Since 1969, Mr. Bittar has taught finance, management and information technology classes in undergraduate and graduate schools. Currently, he is teaching as an Adjunct Professor in the Graduate School of Business and the College of Business, Florida Institute of Technology. He has been a frequent speaker at the National Association of Mortgage Bankers, National Council of Savings Institutions, Council of Presidents, New England Bankers Association and the National Corporate Cash Managers Association. Mr. Bittar received an MBA from Long Island University in 1964 and is resident of Melbourne, Florida
Stephen West, Director
Mr. West has been a Director since our holding company was founded in May, 2007. He has been involved in the computer data storage market since 1978. He spent twenty-two years at Storage Technology Corporation where he held positions as Director of Sales for their Telecommunications Region, Vice President and General Manager of the Western Region and Vice President of Global Accounts. Mr. West also worked for Qwest Cyber Solutions as Director of Channel Sales. Since February 2009, Mr. West has also served as the District Manager of Computer Sales of NetSource. Since March 2002, he has been the Executive Vice President of Sales for PeakData Inc., a computer data storage company. He is also one of its founders. PeakData, Inc. focuses on sales and integration of enterprise storage solutions for fortune 1000 companies in the telecommunications, medical, and financial industries. Mr. West graduated from the University of Cincinnati with a BBA in 1978.
Family Relationships
There is no family relationship between any director, executive officer, or person nominated or chosen by the Company to become a director or executive officer.
20
Involvement in Certain Legal Proceedings
To our knowledge, during the last ten years, none of our directors and executive officers (including those of our subsidiaries) has:
|
·
|
Had a bankruptcy petition filed by or against any business of which such person was a general partner or executive officer either at the time of the bankruptcy or within two years prior to that time.
|
|
·
|
Been convicted in a criminal proceeding or been subject to a pending criminal proceeding, excluding traffic violations and other minor offenses.
|
|
·
|
Been subject to any order, judgment or decree, not subsequently reversed, suspended or vacated, of any court of competent jurisdiction, permanently or temporarily enjoining, barring, suspending or otherwise limiting his involvement in any type of business, securities or banking activities.
|
|
·
|
Been found by a court of competent jurisdiction (in a civil action), the SEC, or the Commodities Futures Trading Commission to have violated a federal or state securities or commodities law, and the judgment has not been reversed, suspended or vacated.
|
|
·
|
Been the subject to, or a party to, any sanction or order, not subsequently reverse, suspended or vacated, of any self-regulatory organization, any registered entity, or any equivalent exchange, association, entity or organization that has disciplinary authority over its members or persons associated with a member.
|
Committees of the Board of Directors
There are no committees of the Board of Directors.
Changes in Nominating Process
There are no material changes to the procedures by which security holders may recommend nominees to our Board of Directors.
Section 16(a) Beneficial Ownership Reporting Compliance
Section 16(a) of the Securities Exchange Act of 1934 (the “34 Act”) requires our officers and directors and persons owning more than ten percent of the Common Stock, to file initial reports of ownership and changes in ownership with the Securities and Exchange Commission (“SEC”). Additionally, Item 405 of Regulation S-K under the 34 Act requires us to identify in its Form 10-K and proxy statement those individuals for whom one of the above referenced reports was not filed on a timely basis during the most recent year or prior years. We have nothing to report in this regard.
Code of Ethics
We do not currently have a code of ethics that applies to our Chief Executive Officer, Chief Financial Officer, Chief Accounting Officer or Controller, or persons performing similar functions. Because we have only limited business operations and two (2) officers and two (2) directors, we believe a code of ethics would have limited utility. We intend to adopt such a code of ethics as our business operations expand and we have more directors, officers and employees.
Options/SAR Grants and Fiscal Year End Option Exercises and Values
We have not had a stock option plan or other similar incentive compensation plan for officers, directors and employees, and no stock options, restricted stock or SAR grants were granted or were outstanding at any time.
No compensation has been paid and no stock options granted to any of our officers or directors in the last three years.
No retirement, pension, profit sharing, stock option or insurance programs or other similar programs have been adopted by us for the benefit of its employees.
Compensation of Directors
We do not currently pay any compensation to our directors.
21
SECURITY OWNERSHIP OF CERTAIN BENEFICIAL OWNERS AND MANAGEMENT AND RELATED STOCKHOLDER MATTERS.
The following sets forth the number of shares of our $.0.001 par value common stock beneficially owned by (i) each person who, as of April 12, 2011, was known by us to own beneficially more than five percent (5%) of its common stock; (ii) our individual Directors and (iii) our Officers and Directors as a group. A total of 49,716,000 common shares were issued and outstanding as of April 12, 2011.
|
Amount and Nature of
|
||||||||
|
Name and Address
of Beneficial Owner
|
Beneficial Ownership(1)(2)
|
Percent of
Class
|
||||||
|
Christian Charles Romandetti (3)
|
30,200,000 | 60.7 | % | |||||
|
GIRTFT LLC (4)
|
23,000,000 | 46.2 | % | |||||
|
Marina Towers Holdings, LLC (5)
|
7,200,000 | 14.5 | % | |||||
|
Donald A. Bittar
|
0 | 0.0 | % | |||||
|
StephenWest
|
216,500 | 0.4 | % | |||||
|
16325 East Dorado Ave.
|
||||||||
|
Centennial, CO 80115
|
||||||||
|
All Officers and Directors as a Group
|
32,416,500 | 61.1 | % | |||||
|
(three persons)
|
||||||||
_______________
(1) All ownership is beneficial and of record, unless indicated otherwise.
(2) The Beneficial owner has sole voting and investment power with respect to the shares shown.
(3) Mr. Romandetti’s beneficial ownership is solely through GIRTFT LLC and Marina Towers Holdings, LLC.
(4) GIRTFT LLC is a trust for which Mr. Romandetti is the trustee.
(5) Marina Towers Holdings, LLC is a limited liability company for which Mr. Romandetti is the Managing Member.
At December 31, 2009 and 2008, we owed $47,098 and $43,898, respectively, in loans to Mr. Michael West. The loans are non-interest bearing and due on demand. The loans were made for working capital advances. Mr. West has agreed to continue to loan such funds as may be necessary through December 31, 2010 for working capital purposes.
At December 31, 2009 we owed Mr. Michael West $3,300 plus accrued interest of $83 under an unsecured, due on demand note payable bearing interest at 6% per annum. Interest expense under the note in 2009 was $83.
In 2009 we paid a corporation under common control $4,300 for consulting fees.
Director Independence
Stephen West qualifies as an independent director under the NYSE corporate governance rules.
22
The following table sets forth the fees that the Company accrued or paid to Ronald Chadwick, P.C. during fiscal 2010 and fiscal 2009.
|
2010
|
2009
|
|||||||
|
Audit Fees(1)
|
$ | 10,050 | $ | 7,500 | ||||
|
Audit-Related Fees(2)
|
15,810 | - | ||||||
|
Tax Fees(3)
|
- | - | ||||||
|
All Other Fees
|
- | - | ||||||
|
Total
|
$ | 25,860 | $ | 7,500 | ||||
|
|
(1) Audit fees relate to professional services rendered in connection with the audit of the Company’s annual financial statements and internal control over financial reporting, quarterly review of financial statements included in the Company’s Quarterly Reports on Form 10-Q, and audit services provided in connection with other statutory and regulatory filings.
|
|
|
(2) Audit-related fees relate to professional services rendered in connection with assurance and related services that are reasonably related to the performance of the audit or review of the Company’s financial statements, including due diligence.
|
|
|
(3) Tax fees relate to professional services rendered for tax compliance, tax advice and tax planning for the Company.
|
Pre-Approval Policies and Procedures
We do not have an audit committee and as a result our entire board of directors performs the duties of an audit committee. Our board of directors evaluates the scope and cost of the engagement of an auditor before the auditor renders audit and non-audit services.
23
|
Exhibit No.
|
Description
|
||
|
3.1
|
Articles of Incorporation of Medical Billing Assistance, Inc. (incorporated by reference to the Company’s Form SB-2 Registration Statement as filed December 20, 2007)
|
||
|
3.2
|
Bylaws of Medical Billing Assistance, Inc. (incorporated by reference to the Company’s Form SB-2 Registration Statement as filed December 20, 2007)
|
||
|
10.1
|
Share Exchange Agreement, dated December 29, 2010, by and between Medical Billing Assistance, Inc., FCID Medical, Inc., and FCID Holdings, Inc. (incorporated by reference to the Company’s Form SB-2 Registration Statement as filed December 20, 2007)
|
||
|
21.1
|
List of Subsidiaries
|
||
|
31.1
|
Certification of CEO pursuant to Sec. 302
|
||
| 31.2 |
Certification of CFO pursuant to Sec. 302
|
||
|
32.1
|
Certification of CEO pursuant to Sec. 906
|
||
| 32.2 |
Certification of CFO pursuant to Sec. 906
|
24
SIGNATURES
Pursuant to the requirements of Section 13 or 15(d) of the Securities Exchange Act of 1934, the registrant has duly caused this report to be signed on its behalf by the undersigned, thereunto duly authorized.
|
MEDICAL BILLING ASSISTANCE, INC.
|
||
|
Date: April 15, 2011
|
By:
|
/
s/ Christian Charles Romandetti
|
|
Christian Charles Romandetti,
President and Chief Executive Officer
|
||
In accordance with the Exchange Act, this report has been signed below by the following persons on behalf of the registrant and in the capacities and on the dates indicated.
|
Name
|
Capacity
|
Date
|
||
|
/s/ Christian Charles Romandetti
|
||||
|
Christian Charles Romandetti
|
Director, Chief Executive Officer and President
(Principal Executive Officer)
|
April 15, 2011
|
||
|
/s/ Donald A. Bittar
|
||||
|
Donald A. Bittar
|
Chief Financial Officer
(Principal Financial Officer and
|
April 15, 2011
|
||
|
Principal Accounting Officer)
|
||||
|
/s/ Stephen H. West
|
||||
|
Stephen H. West
|
Director
|
April 15, 2011
|
||
25
Exhibits Index
|
Exhibit No.
|
Description
|
||
|
3.1
|
Articles of Incorporation of Medical Billing Assistance, Inc. (incorporated by reference to the Company’s Form SB-2 Registration Statement as filed December 20, 2007)
|
||
|
3.2
|
Bylaws of Medical Billing Assistance, Inc. (incorporated by reference to the Company’s Form SB-2 Registration Statement as filed December 20, 2007)
|
||
|
10.1
|
Share Exchange Agreement, dated December 29, 2010, by and between Medical Billing Assistance, Inc., FCID Medical, Inc., and FCID Holdings, Inc. (incorporated by reference to the Company’s Form SB-2 Registration Statement as filed December 20, 2007)
|
||
|
21.1
|
List of Subsidiaries
|
||
|
31.1
|
Certification of CEO pursuant to Sec. 302
|
||
| 31.2 |
Certification of CFO pursuant to Sec. 302
|
||
|
32.1
|
Certification of CEO pursuant to Sec. 906
|
||
| 32.2 |
Certification of CFO pursuant to Sec. 906
|
26
TABLE OF CONTENTS
Part IItem 1. BusinessItem 1A. Risk FactorsItem 1B. Unresolved Staff CommentsItem 2. PropertiesItem 3. Legal ProceedingsItem 4. (removed and Reserved)Part IIItem 5. Market For Registrant S Common Equity, Related Stockholder Matters and Issuer Purchases Of Equity SecuritiesItem 6. Selected Financial DataItem 7. Management S Discussion and Analysis Of Financial Condition and Results Of OperationsItem 7A. Quantitative and Qualitative Disclosures About Market RiskItem 8. Financial Statements and Supplementary DataNote 1. Organization, Operations and Summary Of Significant Accounting PoliciesNote 1. Organization, Operations and Summary Of Significant Accounting Policies (continued):Note 2. Fixed AssetsNote 3. Service ContractsNote 4. Related Party TransactionsNote 5. Notes PayableNote 6. Income TaxesNote 7. Stock OptionsNote 8. Going ConcernNote 9. Subsequent EventsItem 9. Changes in and Disagreements with Accountants on Accounting and Financial Disclosure. NoneItem 9. Changes in and Disagreements with Accountants on Accounting and Financial DisclosureItem 9A. Controls and ProceduresItem 9B. Other InformationPart IIIItem 10. Directors, Executive Officers and Corporate GovernanceItem 11. Executive CompensationItem 12. Security Ownership Of Certain Beneficial Owners and Management and Related Stockholder MattersItem 13. Certain Relationships and Related Transactions, and Director IndependenceItem 14. Principal Accountant Fees and ServicesPart IVItem 15. Exhibits and Financial Statement Schedules