FIRST CITIZENS BANCSHARES INC /DE/
10-Ks and 10-Qs
|
|
|
|
|
|
|
|
|
|
|
|
|
|
|
|
|
|
|
|
|
|
|
|
|
|
|
|
|
|
|
|
|
|
|
|
|
|
|
|
|
|
|
|
|
|
|
|
|
|
|
|
|
|
|
|
UNITED STATES
SECURITIES AND EXCHANGE COMMISSION
Washington, D.C. 20549
FORM 10-K
ANNUAL REPORT PURSUANT TO SECTION 13 OR 15(d)
OF THE SECURITIES EXCHANGE ACT OF 1934
For the fiscal year ended
December 31, 2012
Commission File Number 001-16715
_________________________________________________________________
FIRST CITIZENS BANCSHARES, INC.
(Exact name of Registrant as specified in the charter)
|
Delaware
|
|
56-1528994
|
|
(State or other jurisdiction
|
|
(I.R.S. Employer
|
|
of incorporation or organization)
|
|
Identification Number)
|
4300 Six Forks Road
Raleigh, North Carolina 27609
(Address of Principal Executive Offices, Zip Code)
(919) 716-7000
(Registrant’s Telephone Number, including Area Code)
_________________________________________________________________
Securities Registered Pursuant to Section 12(b) of the Securities Exchange Act of 1934:
|
Title of each class
|
Name of each exchange
on which registered
|
|
|
Class A Common Stock, Par Value $1
|
NASDAQ Global Select Market
|
|
Securities Registered Pursuant to Section 12(g) of the Securities Exchange Act of 1934.
Class B Common Stock, Par Value $1
(Title of class)
_________________________________________________________________
Indicate by check mark if the Registrant is a well-known seasoned issuer, as defined in Rule 405 of the Securities Act. Yes
x
No
¨
Indicate by check mark if the Registrant is not required to file reports pursuant to Section 13 or Section 15(d) of the Act. Yes
¨
No
x
Indicate by check mark whether the Registrant (1) has filed all reports required to be filed by Section 13 or 15(d) of the Securities Exchange Act of 1934 during the preceding twelve months (or for such shorter period that the Registrant was required to file such reports), and (2) has been subject to such filing requirements for the past ninety days. Yes
x
No
¨
Indicate by check mark whether the Registrant has submitted electronically and posted on its corporate Web site, if any, every Interactive Data File required to be submitted and posted pursuant to Rule 405 of Regulation S-T during the preceding 12 months (or for such shorter period that the Registrant was required to submit and post such files). Yes
x
No
¨
Indicate by check mark if disclosure of delinquent filers pursuant to Item 405 of Regulation S-K is not contained herein, and will not be contained, to the best of Registrant’s knowledge, in definitive proxy or information statements incorporated by reference in Part III of this Form 10-K or any amendment to this Form 10-K.
¨
Indicate by check mark whether the Registrant is a large accelerated filer, an accelerated filer, a non-accelerated filer or a smaller reporting company. See definition of “large accelerated filer,” “accelerated filer,” “non-accelerated filer,” and “smaller reporting company” in Rule 12b-2 of the Exchange Act.
|
Large accelerated filer
x
|
|
Accelerated filer
¨
|
|
Non-accelerated filer
¨
|
|
Smaller reporting company
¨
|
Indicate by check mark whether the Registrant is a shell company (as defined in Rule 12b-2 of the Exchange Act). Yes
¨
No
x
The aggregate market value of the Registrant’s common equity held by nonaffiliates computed by reference to the price at which the common equity was last sold as of the last business day of the Registrant’s most recently completed second fiscal quarter was
$888,367,135
.
On
March 1, 2013
, there were
8,586,058
outstanding shares of the Registrant’s Class A Common Stock and
1,032,883
outstanding shares of the Registrant’s Class B Common Stock.
Portions of the Registrant’s definitive Proxy Statement for the
2013 Annual Meeting of Shareholders
are incorporated in Part III of this report.
CROSS REFERENCE INDEX
|
Page
|
||||||
|
PART 1
|
Item 1
|
|||||
|
Item 1A
|
||||||
|
Item 1B
|
Unresolved Staff Comments
|
None
|
||||
|
Item 2
|
||||||
|
Item 3
|
||||||
|
PART II
|
Item 5
|
|||||
|
Item 6
|
||||||
|
Item 7
|
||||||
|
Item 7A
|
||||||
|
Item 8
|
Financial Statements and Supplementary Data
|
|||||
|
Item 9
|
Changes in and Disagreements with Accountants on Accounting and Financial Disclosure
|
None
|
||||
|
Item 9A
|
||||||
|
Item 9B
|
Other Information
|
None
|
||||
|
PART III
|
Item 10
|
Directors, Executive Officers and Corporate Governance
|
*
|
|||
|
Item 11
|
Executive Compensation
|
*
|
||||
|
Item 12
|
Security Ownership of Certain Beneficial Owners and Management and Related Stockholder Matters
|
*
|
||||
|
Item 13
|
Certain Relationships and Related Transactions and Director Independence
|
*
|
||||
|
Item 14
|
Principal Accounting Fees and Services
|
*
|
||||
|
PART IV
|
Item 15
|
Exhibits, Financial Statement Schedules
|
||||
|
(1)
|
Financial Statements (see Item 8 for reference)
|
|||||
|
(2)
|
All Financial Statement Schedules normally required on Form 10-K are omitted since they are not applicable, except as referred to in Item 8.
|
None
|
||||
|
(3)
|
||||||
* Information required by Item 10 is incorporated herein by reference to the information that appears under the headings or captions ‘Proposal 1: Election of Directors,’ ‘Code of Ethics,’ ‘Committees of our Board—General,’ and ‘—Audit and Compliance Committee’, ‘Executive Officers’ and ‘Section 16(a) Beneficial Ownership Reporting Compliance’ from the Registrant’s Proxy Statement for the
2013 Annual Meeting of Shareholders
(
2013 Proxy Statement
) .
Information required by Item 11 is incorporated herein by reference to the information that appears under the headings or captions ‘Compensation Committee Report,’ ‘Compensation Discussion and Analysis,’ ‘Executive Compensation,’ and ‘Director Compensation,’ of the
2013 Proxy Statement
.
Information required by Item 12 is incorporated herein by reference to the information that appears under the heading ‘Beneficial Ownership of Our Common Stock’ of the
2013 Proxy Statement
.
Information required by Item 13 is incorporated herein by reference to the information that appears under the headings or captions ‘Corporate Governance—Director Independence’ and ‘Transactions with Related Persons’ of the
2013 Proxy Statement
.
Information required by Item 14 is incorporated by reference to the information that appears under the caption ‘Services and Fees During
2012
and
2011
’ of the
2013 Proxy Statement
.
2
Business
General
First Citizens BancShares, Inc. (BancShares) was incorporated under the laws of Delaware on August 7, 1986, to become the holding company of First-Citizens Bank & Trust Company (FCB), its banking subsidiary. FCB opened in 1898 as the Bank of Smithfield, Smithfield, North Carolina, and later became First-Citizens Bank & Trust Company. On April 28, 1997, BancShares launched IronStone Bank (ISB), a federally-chartered thrift institution that originally operated under the name Atlantic States Bank. Initially, ISB operated in the counties surrounding Atlanta, Georgia, but gradually expanded into other high-growth markets throughout the United States. On January 7, 2011, ISB was merged into FCB resulting in a single banking subsidiary of BancShares.
As of
December 31, 2012
, FCB operated
414
branches in North Carolina, Virginia, West Virginia, Maryland, Tennessee, Washington, California, Florida, Georgia, Texas, Arizona, New Mexico, Oregon, Colorado, Oklahoma, Kansas, Missouri and Washington, DC.
During 2011, 2010 and 2009, FCB participated in six FDIC-assisted transactions, acquiring assets and assuming liabilities of the failed financial institutions. These transactions have allowed FCB to enter new markets and expand its presence in other markets. A summary of the FDIC-assisted transactions is provided in
Table 2
of Management's Discussion and Analysis.
BancShares' market areas enjoy a diverse employment base, including, in various locations, manufacturing, service industries, agricultural, wholesale and retail trade, technology and financial services. BancShares believes its current market areas will support future growth in loans and deposits. BancShares maintains a community bank approach to providing customer service, a competitive advantage that strengthens our ability to effectively provide financial products and services to individuals and businesses in our markets. However, like larger banks, BancShares has the capacity to offer most financial products and services that our customers require.
A substantial portion of BancShares’ revenue is derived from our operations throughout North Carolina and Virginia, and in certain urban areas of Georgia, Florida, California and Texas. The delivery of products and services to our customers is primarily accomplished through associates deployed throughout our extensive branch network. However, we also provide customers with access to our products and services through online banking, telephone banking, mobile banking and various ATM networks. Business customers may also conduct banking transactions through use of remote image technology.
FCB’s primary deposit markets are North Carolina and Virginia. FCB’s deposit market share in North Carolina was 3.7 percent as of
June 30, 2012
, based on the FDIC Deposit Market Share Report, which makes FCB the fourth largest bank in North Carolina. The three banks larger than FCB based on deposits in North Carolina as of
June 30, 2012
, controlled 78.2 percent of North Carolina deposits. In Virginia, FCB was the 19th largest bank with a
June 30, 2012
, deposit market share of 0.5 percent. The 18 larger banks represent 85.4 percent of total deposits in Virginia as of
June 30, 2012
. The distribution of FCB branches as of
December 31, 2012
, is provided in the following table.
FCB seeks to meet the needs of both individuals and commercial entities in its market areas. Services offered at most offices include taking of deposits, cashing of checks and providing for individual and commercial cash needs; numerous checking and savings plans; commercial, business and consumer lending; a full-service trust department; and other activities incidental to commercial banking. FCB’s wholly-owned subsidiary, First Citizens Investor Services, Inc. (FCIS), provides various investment products including annuities, discount brokerage services and third-party mutual funds to customers primarily through the bank's branch network. Other subsidiaries are not material to BancShares’ consolidated financial position or to consolidated net income.
3
|
December 31, 2012
|
||||
|
State
|
Number of branches
|
Percent of total deposits
|
||
|
North Carolina
|
266
|
|
72.4
|
%
|
|
Virginia
|
48
|
|
7.3
|
|
|
California
|
21
|
|
6.0
|
|
|
Florida
|
17
|
|
3.6
|
|
|
Georgia
|
14
|
|
2.3
|
|
|
Washington
|
11
|
|
2.0
|
|
|
Colorado
|
7
|
|
1.3
|
|
|
Texas
|
7
|
|
1.3
|
|
|
Tennessee
|
6
|
|
0.7
|
|
|
West Virginia
|
5
|
|
0.7
|
|
|
Arizona
|
2
|
|
0.5
|
|
|
New Mexico
|
2
|
|
0.7
|
|
|
Oklahoma
|
2
|
|
0.2
|
|
|
Oregon
|
2
|
|
0.3
|
|
|
District of Columbia
|
1
|
|
0.1
|
|
|
Kansas
|
1
|
|
0.3
|
|
|
Maryland
|
1
|
|
0.2
|
|
|
Missouri
|
1
|
|
0.1
|
|
|
Total
|
414
|
|
100.0
|
%
|
In recent years, FCB has provided various processing and operational services to other banks. The scope of these services declined in 2012 due to client bank attrition and the conversion of certain clients to different systems that resulted in reduced revenue. In early 2013, we elected to sell nearly all processing service relationships to another servicer. Although we will continue to provide processing services to our largest client bank, the revenues generated by all other banks will end during the first quarter of 2013.
The financial services industry is highly competitive and the ability of non-bank financial entities to provide services has intensified competition. Traditional commercial banks are subject to significant competitive pressure from multiple types of financial institutions. This non-bank competitive pressure is perhaps most acute in wealth management and payments processing. Non-banks and other diversified financial conglomerates have developed powerful and focused franchises, which have eroded traditional commercial banks’ market share of both balance sheet and fee-based products.
As the banking industry continues to consolidate, the degree of competition that exists in the banking market will also be affected by the elimination of numerous smaller community-based institutions. Since 2008, asset quality challenges, capital erosion and difficulty attracting new capital and a severe global economic recession have compelled many banks to merge and have led to bank failures that have had a significant impact on the competitive environment. We anticipate that industry consolidation will continue in the foreseeable future.
At
December 31, 2012
, BancShares and its subsidiaries employed a full-time staff of 4,369 and a part-time staff of 452 for a total of 4,821 employees.
Throughout its history, the operations of BancShares have been significantly influenced by descendants of Robert P. Holding, who came to control FCB during the 1920s. Robert P. Holding’s children and grandchildren have served as members of the board of directors, as chief executive officers and other executive management positions and have remained shareholders controlling a large percentage of our common stock since BancShares was formed in 1986.
Our Chairman of the Board and Chief Executive Officer, Frank B. Holding, Jr., is the grandson of Robert P. Holding. Hope H. Connell, Vice Chairman of BancShares and FCB, is Robert P. Holding’s granddaughter. Frank B. Holding, son of Robert P. Holding and father of Frank B. Holding, Jr. and Hope H. Connell, is our Executive Vice Chairman.
4
Lewis R. Holding preceded Frank B. Holding, Jr. as Chairman of the Board and Chief Executive Officer and served in both capacities from the time BancShares was formed until 2008, when he retired as Chief Executive Officer, and 2009, when he retired as Chairman of the Board. Lewis R. Holding, who died in August 2009, was the son of Robert P. Holding and brother of Frank B. Holding. Lewis R. Holding's daughter, Carmen Holding Ames, was a director of BancShares and FCB from 1996 until until she resigned from the board on December 20, 2012.
On December 20, 2012, BancShares purchased 593,954 shares of Class B common stock from Carmen Holding Ames and certain of her related entities, including trusts that held shares for her benefit. On the same day, Ms. Ames and certain related entities also sold 960,201 shares of Class A common stock to institutional investors unaffiliated with BancShares. Subsequent to those transactions, members of the Frank B. Holding family, including those members who serve as our directors and in management positions, and certain family members' related entities including family-owned entities, may be considered to beneficially own, in the aggregate, approximately
24.7 percent
of the outstanding shares of our Class A common stock and approximately
66.3 percent
of the outstanding shares of our Class B common stock, together representing approximately
52.0 percent
of the total votes entitled to be cast by all outstanding shares of both classes of BancShares' common stock. In addition, four other banking organizations in which various members of the Holding family are principal shareholders and serve as directors, collectively hold an aggregate of approximately 5.2 percent of the outstanding shares of our Class A common stock and approximately 6.6 percent of the outstanding shares of our Class B common stock, together representing approximately 6.1 percent of the voting control of BancShares.
Statistical information regarding our business activities is found in Management’s Discussion and Analysis.
Regulatory Considerations
The business and operations of BancShares and FCB are subject to significant federal and state governmental regulation and supervision. BancShares is a financial holding company registered with the Federal Reserve Board (FRB) under the Bank Holding Company Act of 1956, as amended. It is subject to supervision and examination by, and the regulations and reporting requirements of, the FRB.
FCB is a state-chartered bank, subject to supervision and examination by, and the regulations and reporting requirements of, the FDIC and the North Carolina Commissioner of Banks. Deposit obligations are insured by the FDIC to the maximum legal limits.
The various regulatory authorities supervise all areas of BancShares' and FCB's business including loans, allowances for loan and lease losses, mergers and acquisitions, the payment of dividends, various compliance matters and other aspects of its operations. The regulators conduct regular examinations, and BancShares and FCB must furnish periodic reports to its regulators containing detailed financial and other information.
Numerous statutes and regulations apply to and restrict the activities of FCB, including limitations on the ability to pay dividends, capital requirements, reserve requirements, deposit insurance requirements and restrictions on transactions with related parties. The impact of these statutes and regulations is discussed below and in the accompanying audited consolidated financial statements.
On July 21, 2010, the
Dodd-Frank Wall Street Reform and Consumer Protection Act
(Dodd-Frank Act) was signed into law. The Dodd-Frank Act implements far-reaching regulatory reform. Some of the more significant implications of the Dodd-Frank Act are summarized below:
|
•
|
Established centralized responsibility for consumer financial protection by creating a new agency, the Consumer Financial Protection Bureau (CFPB), responsible for implementing, examining and enforcing compliance with federal consumer financial laws;
|
|
•
|
Established the same leverage and risk-based capital requirements that apply to insured depository institutions to most bank holding companies;
|
|
•
|
Required financial holding companies to be well-capitalized and well managed as of July 21, 2011; bank holding companies and banks must also be both well-capitalized and well managed in order to acquire banks located outside their home state;
|
|
•
|
Disallowed the ability of banks and holding companies with more than $10 billion in assets to include trust preferred securities as tier 1 capital; this provision will be applied over a three-year period beginning January 1, 2013;
|
5
|
•
|
Changed the assessment base for federal deposit insurance from the amount of insured deposits to consolidated assets less tangible capital;
|
|
•
|
Eliminated the ceiling on the size of the deposit insurance fund (DIF) and increased the floor on the size of the DIF;
|
|
•
|
Required large, publicly-traded bank holding companies to create a board-level risk committee responsible for the oversight of enterprise risk management;
|
|
•
|
Required implementation of corporate governance revisions;
|
|
•
|
Established a permanent $250,000 limit for federal deposit insurance protection, increased the cash limit of Securities Investor Protection Corporation protection from $100,000 to $250,000 and provided unlimited federal deposit insurance protection until December 31, 2012, for noninterest-bearing demand transaction accounts at all insured depository institutions;
|
|
•
|
Repealed the federal prohibition on the payment of interest on demand deposits, thereby permitting depository institutions to pay interest on business transaction and other accounts;
|
|
•
|
Amended the Electronic Fund Transfer Act to, among other things, give the Federal Reserve the authority to establish rules regarding interchange fees charged for electronic debit transactions by payment card issuers having assets over $10 billion and to enforce a new statutory requirement that such fees be reasonable and proportional to the actual cost of a transaction to the issuer;
|
|
•
|
Increased the authority of the Federal Reserve to examine financial institutions, including non-bank subsidiaries.
|
Many provisions of the Dodd-Frank Act require adoption of rules that will take effect over several years, making it difficult to anticipate the overall financial impact to financial institutions and consumers. The provision of the legislation related to allowable fees that may be charged for debit transactions resulted in significant revenue reductions for debit cards. Elimination of the prohibition on the payment of interest on demand deposits will increase the costs associated with certain deposit instruments.
Provisions within the Dodd-Frank Act related to the disallowance of our ability to include trust preferred securities as tier 1 capital will affect our capital ratios beginning in 2013. At
December 31, 2012
, BancShares had
$93.5 million
of trust preferred securities outstanding. Beginning in 2013 and continuing in each of the following two years, one-third or
$31.2 million
of the trust preferred securities will be disallowed from tier 1 capital. Elimination of the full
$93.5 million
of trust preferred securities from our
December 31, 2012
, capital structure would result in a proforma tier 1 leverage ratio of
8.78 percent
, a proforma tier 1 risk-based ratio of
13.59 percent
and a proforma total risk-based ratio of
15.27 percent
. BancShares would continue to remain well-capitalized under current regulatory guidelines.
During 2008, in response to widespread concern about weakness within the banking industry, the Emergency Economic Stabilization Act was enacted, providing expanded insurance protection to depositors. In addition, the U.S. Treasury created the Troubled Asset Relief Program (TARP) Capital Purchase Program to provide qualifying banks with additional capital. The FDIC created the Temporary Liquidity Guarantee Program (TLGP), which allowed banks to purchase a guarantee for newly-issued senior unsecured debt and provided expanded deposit insurance benefits to certain noninterest-bearing accounts. Due to our strong capital ratios, we did not apply for additional capital under the TARP Capital Purchase Program. We also did not participate in the TLGP debt guarantee program, but did elect to participate in the TLGP expansion of deposit insurance. We continued to participate in the expanded deposit insurance program until the program expired on December 31, 2012.
Under the Federal Deposit Insurance Reform Act of 2005 (FDIRA), the FDIC uses a risk-based assessment system to determine the amount of a bank’s deposit insurance assessment based on an evaluation of the probability that the DIF will incur a loss with respect to that bank. The evaluation considers risks attributable to different categories and concentrations of the bank’s assets and liabilities and other factors the FDIC considers to be relevant, including information obtained from federal and state banking regulators.
The FDIC is responsible for maintaining the adequacy of the DIF, and the amount paid by a bank for deposit insurance is influenced not only by the assessment of the risk it poses to the DIF, but also by the adequacy of the insurance fund to cover the risk posed by all insured institutions. FDIC insurance assessments could be increased substantially in the future if the FDIC finds such an increase to be necessary in order to adequately maintain the DIF. A rate increase and special assessment was imposed on insured financial institutions in 2009 due to the high level of bank failures and the elevated rates continued during 2010. During 2011, a new risk-based assessment model was introduced and future changes in our risk profile could impact our assessment costs. Under the provisions of the FDIRA, the FDIC may terminate a bank’s deposit insurance if it finds that the bank has engaged in unsafe and unsound practices, is in an unsafe or unsound condition to continue operations or has violated applicable laws, regulations, rules or orders.
6
The Sarbanes-Oxley Act of 2002 (SOX Act) mandated important new corporate governance, financial reporting and disclosure requirements intended to enhance the accuracy and transparency of public companies’ reported financial results. It established new responsibilities for corporate chief executive officers, chief financial officers and audit committees in the financial reporting process, and it created a new regulatory body to oversee auditors of public companies. The SOX Act also mandated new enforcement tools, increased criminal penalties for federal mail, wire and securities fraud, and created new criminal penalties for document and record destruction in connection with federal investigations. Additionally, the SOX Act increased the opportunity for private litigation by lengthening the statute of limitations for securities fraud claims and providing new federal corporate whistleblower protection.
The SOX Act requires various securities exchanges, including The NASDAQ Global Select Market, to prohibit the listing of the stock of an issuer unless that issuer maintains an independent audit committee. In addition, the securities exchanges have imposed various corporate governance requirements, including the requirement that various corporate matters (including executive compensation and board nominations) be approved, or recommended for approval by the issuer’s full board of directors, by directors of the issuer who are “independent” as defined by the exchanges’ rules or by committees made up of “independent” directors. Since BancShares’ Class A common stock is a listed stock, BancShares is subject to those provisions of the Act and to corporate governance requirements of The NASDAQ Global Select Market. The economic and operational effects of the SOX Act on public companies, including BancShares, have been and will continue to be significant in terms of the time, resources and costs required to achieve compliance.
The USA Patriot Act of 2001 (Patriot Act) is intended to strengthen the ability of United States law enforcement and the intelligence community to work cohesively to combat terrorism on a variety of fronts. The Patriot Act contains sweeping anti-money laundering and financial transparency laws which required various new regulations, including standards for verifying customer identification at account opening and rules to promote cooperation among financial institutions, regulators and law enforcement entities in identifying parties that may be involved in terrorism or money laundering. The Patriot Act has required financial institutions to adopt new policies and procedures to combat money laundering and it grants the Secretary of the Treasury broad authority to establish regulations and impose requirements and restrictions on financial institutions’ operations.
The Gramm-Leach-Bliley Act (GLB Act) adopted by Congress during 1999 expanded opportunities for banks and bank holding companies to provide services and engage in other revenue-generating activities that previously were prohibited to them. The GLB Act permitted bank holding companies to become “financial holding companies” and expanded activities in which banks and bank holding companies may participate, including opportunities to affiliate with securities firms and insurance companies. During 2000, BancShares became a financial holding company.
Under Delaware law, BancShares is authorized to pay dividends declared by its Board of Directors, provided that no distribution results in its insolvency. The ability of FCB to pay dividends to BancShares is governed by North Carolina statutes and rules and regulations issued by regulatory authorities. Under federal law, and as an insured bank, FCB is prohibited from making any capital distributions, including paying a cash dividend, if it is, or after making the distribution it would become, “undercapitalized” as that term is defined in the Federal Deposit Insurance Act (FDIA).
BancShares is required to comply with the capital adequacy standards established by the FRB and FCB is subject to capital adequacy standards established by the FDIC. The FRB and FDIC have promulgated risk-based capital and leverage capital guidelines for determining the adequacy of the capital of a bank holding company or a bank and all applicable capital standards must be satisfied for a bank holding company or a bank to be considered in compliance with these capital requirements. During 2012, the FRB issued proposed regulations to implement the minimum capital standards of the Basel Committee on Banking Supervision including Basel III.
Current federal law establishes a system of prompt corrective action to resolve the problems of undercapitalized banks. Under this system, the FDIC has established five capital categories (“well capitalized,” “adequately capitalized,” “undercapitalized,” “significantly undercapitalized,” and “critically undercapitalized”). The FDIC is required to take certain mandatory supervisory actions, and is authorized to take other discretionary actions, with respect to banks in the three undercapitalized categories.
Under the FDIC’s rules implementing the prompt corrective action provisions, an insured, state-chartered bank that has a total capital ratio of 10.0 percent or greater, a tier 1 capital ratio of 6.0 percent or greater, a leverage ratio of 5.0 percent or greater and is not subject to any written agreement, order, capital directive, or prompt corrective action directive issued by the FDIC, is considered to be “well-capitalized.” As of
December 31, 2012
, FCB is well-capitalized.
7
Under regulations of the FRB, all FDIC-insured banks must maintain average daily reserves against their transaction accounts. Because required reserves must be maintained in the form of vault cash or in an account at a Federal Reserve Bank or with a qualified correspondent bank, the effect of the reserve requirement is to reduce the amount of FCB's assets that are available for lending or other investment activities.
With respect to acquired loans and other real estate that are subject to various loss share agreements, the FDIC also has responsibility for reviewing various reimbursement claims we submit for losses or expenses we have incurred in conjunction with the resolution of acquired assets.
FCB is subject to the provisions of Section 23A of the Federal Reserve Act, which places limits on the amount of certain transactions with affiliate entities. The total amount of transactions with a single affiliate is limited to 10 percent of capital and surplus and, for all affiliates, to 20 percent of capital and surplus. Each of the transactions among affiliates must also meet specified collateral requirements and must comply with other provisions of Section 23A designed to avoid transfers of low-quality assets between affiliates. FCB is also subject to the provisions of Section 23B of the Federal Reserve Act which, among other things, prohibits the above and certain other transactions with affiliates unless the transactions are on terms substantially the same, or at least as favorable, as those prevailing at the time for comparable transactions with nonaffiliated companies.
Under the Community Reinvestment Act, as implemented by regulations of the federal bank regulatory agencies, an insured bank has a continuing and affirmative obligation, consistent with safe and sound banking practices, to help meet the credit needs of its entire community, including low and moderate income neighborhoods.
FCIS is a registered broker-dealer and investment adviser. Broker-dealer activities are subject to regulation by the Financial Industry Regulatory Authority (FINRA), a self-regulatory organization to which the Securities and Exchange Commission (SEC) has delegated regulatory authority for broker-dealers, as well as by the state securities authorities of the various states in which FCIS operates. Investment advisory activities are subject to direct regulation by the SEC, and investment advisory representatives must register with the state securities authorities of the various states in which they operate.
FCIS is also licensed as an insurance agency in connection with various investment products, such as annuities, that are regulated as insurance products. FCIS’ insurance sales activities are subject to concurrent regulation by securities regulators and by the insurance regulators of the various states in which FCIS conducts business.
Available Information
BancShares does not have its own separate Internet website. However, FCB’s website (
www.firstcitizens.com
) includes a hyperlink to the SEC’s website where the public may obtain copies of BancShares’ annual reports on Form 10-K, quarterly reports on 10-Q, current reports on Form 8-K, and amendments to those reports, free of charge, as soon as reasonably practicable after they are electronically filed with or furnished to the SEC. Interested parties may also directly access the SEC’s website that contains reports and other information that BancShares files electronically with the SEC. The address of the SEC’s website is
www.sec.gov
.
8
Risk Factors
The risks and uncertainties that management believes are material are described below. These risks are not the only risks that BancShares faces. Additional risks and uncertainties that are not currently known or that management does not currently deem to be material could also have a material, adverse impact on our financial condition, the results of our operations or our business. If this were to occur, the market price of our common stock could decline significantly.
Unfavorable economic conditions could continue to adversely affect our business
Our business is highly affected by national, regional and local economic conditions. These conditions cannot be predicted or controlled, and may have a material impact on our operations and financial condition. Unfavorable economic developments beginning in 2008 have resulted in negative effects on the business, risk profile, financial condition and results of operations of financial institutions in the United States, including BancShares and FCB. Continued unfavorable economic conditions could weaken the national economy further as well as the economies of communities that we serve. Further economic deterioration in our market areas could depress our earnings and have an adverse impact on our financial condition and capital adequacy.
Weakness in real estate markets and exposure to junior liens have adversely impacted our business and our results of operations and may continue to do so
Real property collateral values have declined due to continuing weaknesses in real estate sales activity. That risk, coupled with higher delinquencies and losses on various loan products caused by high rates of unemployment and underemployment, has resulted in losses on loans that, while adequately collateralized at the time of origination, are no longer fully secured. Our continuing exposure to under-collateralization is concentrated in our non-commercial revolving mortgage loan portfolio. Approximately two-thirds of the revolving mortgage portfolio is secured by junior lien positions, and lower real estate values for collateral underlying these loans has, in many cases, caused the outstanding balance of the senior lien to exceed the value of the collateral, resulting in a junior lien loan that is in effect unsecured. A large portion of our losses within the revolving mortgage portfolio have arisen from junior lien loans due to the inadequate collateral position.
Because of our conservative underwriting policies and generally stable or increasing collateral values, in past years, we have not experienced significant losses resulting from our junior lien positions. As a result, we have not closely monitored performance of senior lien positions held by other financial institutions in prior years. However, due to higher defaults resulting from financial strain facing our borrowers and lower collateral values, we now collect data to monitor performance of senior lien positions held by other lenders. That information allowed us to better estimate the probability of default on junior lien positions we hold as of
December 31, 2012
.
Further declines in collateral values, unfavorable economic conditions and sustained high rates of unemployment could result in greater delinquency, write-downs or charge-offs in future periods, which could have a material adverse impact on our results of operations and capital adequacy.
Accretion of fair value discounts may result in earnings volatility
Fair value discounts that are recorded at the time an asset is acquired are accreted into interest income based on accounting principles generally accepted in the United States of America. The rate at which those discounts are accreted is unpredictable, the result of various factors including unscheduled prepayments and credit quality improvements that result in a reclassification from nonaccretable difference to accretable yield that is prospectively included in interest income. The fair value discount accretion may result in significant volatility in interest income, net interest income and our earnings. Volatility in earnings could unfavorably influence investor interest in our common stock thereby depressing the market value of our stock and the market capitalization of our company.
Reimbursements under loss share agreements are subject to FDIC oversight and interpretation and contractual term limitations
The FDIC-assisted transactions completed during 2011, 2010 and 2009 include significant protection to FCB from the exposures to prospective losses on certain assets that are covered under loss share agreements with the FDIC. Loans and leases covered under loss share agreements represent
13.5 percent
of total loans and leases as of
December 31, 2012
. The loss share agreements impose certain obligations on us, including obligations to manage covered assets in a manner consistent with prudent business practices and in accordance with the procedures and practices that we customarily use for assets that are not
covered by loss share agreements. Based on projected losses as of
December 31, 2012
, we expect to receive cash payments
9
from the FDIC totaling
$100.2 million
over the remaining lives of the respective loss share agreements. We are also required to report detailed loan level information and file requests for reimbursement of covered losses and expenses on a quarterly basis. In the event of noncompliance, delay or disallowance of some or all of our rights under those agreements could occur, including the denial of reimbursement for losses and related collection costs.
The loss share agreements are subject to differing interpretations by the FDIC and FCB, and disagreements may arise regarding coverage of losses, expenses and contingencies. Additionally, losses that are currently projected to occur during the loss share term may not occur until after the expiration of the applicable agreement, and those losses could have a material impact on results of operations in future periods. Our current estimates of losses include only those losses that we project to occur during the loss share period and for which we believe we will receive reimbursement from the FDIC at the applicable reimbursement rate.
During March 2012, FCB received communications from the US Small Business Administration (SBA) asserting that the SBA is entitled to receive a share of amounts paid or to be paid by the FDIC to FCB relating to certain specific SBA-guaranteed loans pursuant to the Loss Share Agreement between FCB and the FDIC applicable to Temecula Valley Bank. FCB disputes the validity of the SBA claims and is pursuing administrative relief through the SBA.
We are subject to extensive oversight and regulation that continues to change
We and FCB are subject to extensive federal and state banking laws and regulations. These laws and regulations primarily focus on the protection of depositors, federal deposit insurance funds, and the banking system as a whole rather than the protection of security holders. Federal and state banking regulators possess broad powers to take supervisory actions as they deem appropriate. These supervisory actions may result in higher capital requirements, higher deposit insurance premiums, increased expenses, reductions in fee income and limitations on activities that could have a material adverse effect on our results of operations.
The Dodd-Frank Act instituted significant changes to the overall regulatory framework for financial institutions, including the creation of the CFPB, that will impact BancShares and FCB. During the fourth quarter of 2011, limitations on debit card interchange fees became effective. As of January 1, 2013, one-third of our trust preferred securities that qualified as tier 1 capital ceased to be included in tier 1 capital with similar phase-outs occurring during 2014 and 2015.
In September 2010, the Basel Committee on Banking Supervision announced new global regulatory capital guidelines (Basel III) aimed at strengthening existing capital requirements for bank holding companies through a combination of higher minimum capital requirements, new capital conservation buffers, and more conservative definitions of capital and exposure.
In June 2012, the Federal Reserve released proposed rules regarding implementation of the Basel III regulatory capital rules for United States banking organizations. The proposed rules address a significant number of outstanding issues and questions regarding how certain provisions of Basel III are proposed to be adopted in the United States. Key provisions of the proposed rules include the total phase-out from tier 1 capital of trust preferred securities for all banks, a capital conservation buffer of 2.50 percent above minimum capital ratios, inclusion of accumulated other comprehensive income in tier 1 common equity, inclusion in tier 1 capital of perpetual preferred stock, and an effective floor for tier 1 common equity of 7.00 percent. Final rules are expected to be adopted in 2013. While we have estimated the impact that the proposed rules would have on our capital ratios, we are unable at this time to predict how the final rules will differ from the proposed rules and what the effective date of the final rules will be.
We encounter significant competition
We compete with other banks and specialized financial service providers in our market areas. Our primary competitors include local, regional and national banks and savings associations, credit unions, commercial finance companies, various wealth management providers, independent and captive insurance agencies, mortgage companies and non-bank providers of financial services. Some of our larger competitors, including banks that have a significant presence in our market areas, have the capacity to offer products and services we do not offer. Some of our competitors operate in a regulatory environment that is less stringent than the one in which we operate, or are not subject to federal and state income taxes. The fierce competitive pressure that we face may force us to reduce pricing for certain of our products and services to levels that are marginally profitable.
10
Our financial condition could be adversely affected by the soundness of other financial institutions
While the overall financial condition of the banking industry has improved during 2011 and 2012, the number of bank failures since 2008 has been significant and numerous banks remain in critical financial condition. Financial services institutions are interrelated as a result of trading, clearing, counterparty, or other relationships. We have exposure to numerous financial service providers, including banks, brokers and dealers in securities and other institutional clients. Transactions with other financial institutions expose us to credit risk in the event of default of the counterparty.
Natural disasters and other catastrophes could affect our ability to operate
The occurrence of catastrophic events, including weather-related events such as hurricanes, tropical storms, floods, or windstorms, as well as earthquakes, pandemic disease, fires and other catastrophes, could adversely affect our financial condition and results of operations. In addition to natural catastrophic events, man-made events, such as acts of terror and governmental response to acts of terror, could adversely affect general economic conditions, which could have a material impact on our results of operations.
Unpredictable natural and other disasters could have an adverse effect if those events materially disrupt our operations or affect customers’ access to the financial services we offer. Although we carry insurance to mitigate our exposure to certain natural and man-made events, catastrophic events could nevertheless adversely affect our results of operations.
We are subject to interest rate risk
Our results of operations and cash flows are highly dependent upon our net interest income. Interest rates are sensitive to economic and market conditions that are beyond our control, including the actions of the Federal Reserve Board’s Federal Open Market Committee. Changes in monetary policy could influence our interest income and interest expense as well as the fair value of our financial assets and liabilities. If the changes in interest rates on our interest-earning assets are not roughly equal to the changes in interest rates paid on our interest-bearing liabilities, our net interest income and, therefore, our earnings could be adversely impacted.
Even though we maintain what we believe to be an adequate interest rate risk monitoring system, the forecasts of future net interest income are estimates and may be inaccurate. The yield curve may change differently than we forecast, and we cannot accurately predict changes in interest rates or Federal Open Market Committee actions that may directly impact market interest rates.
Our deposit base represents our primary source of core funding and thus balance sheet liquidity. We normally have the ability to stimulate core deposit growth through reasonable and effective pricing strategies. However, in circumstances that impair our ability to generate liquidity, we would need access to noncore funding such as borrowings from the Federal Home Loan Bank and the Federal Reserve, fed funds purchased, and brokered deposits. While we maintain access to noncore funding sources, we are dependent on the availability of collateral and the counterparty’s liquidity capacity and willingness to lend to us.
We face significant operational risks in our businesses
Our ability to adequately conduct and grow our business is dependent on our ability to create and maintain an appropriate operational control infrastructure. Operational risk can arise in numerous ways, including employee fraud, customer fraud, and control lapses in bank operations and information technology. Our dependence on our employees and automated systems, including the automated systems used to account for acquired loans and those systems maintained by third parties, to record and process transactions may further increase the risk that technical failures or tampering of those systems will result in losses that are difficult to detect. We are also subject to disruptions of our operating systems arising from events that are wholly or partially beyond our control. Failure to maintain an appropriate operational infrastructure can lead to loss of service to customers, legal actions, and noncompliance with various laws and regulations.
Our business could suffer if we fail to attract and retain skilled people
FCB's success depends primarily on its ability to attract and retain key people. Competition is intense for people who we believe will be successful in developing and attracting new business and/or managing critical support functions for FCB. Our
historical policy of not providing annual cash incentives, incentive stock awards or long-term incentive awards creates unique challenges to our attraction and retention of key people. We may not be able to hire the best people or, when successful, retain them.
11
We continue to encounter technological change for which we expect to incur significant expense
The financial services industry continues to experience an increase in technological complexity required to provide a competitive array of products and services to customers. Our future success requires that we maintain technology that will support our ability to provide products and services that satisfactorily meet the banking and other financial needs of our customers. During the past two years, we have closely examined the state of our core technology systems and related business processes and determined that significant investments are required. The project to modernize our systems will begin in 2013 with phased implementation through 2016. The magnitude and scope of this project is significant with total costs estimated at $100.0 million. If the project objectives are not achieved or if the cost of the project is materially in excess of the estimate, our business, financial condition and financial results could be adversely impacted.
We are subject to information security risks
We maintain and transmit large amounts of sensitive information electronically, including personal and financial information of our customers. In addition to our own systems, we also rely on external vendors to provide certain services and are, therefore, exposed to their information security risk. While we seek to mitigate internal and external information security risks, the volume of business conducted through electronic devices continues to grow, and our computer systems and network infrastructure, as well as the systems of external vendors and customers, present security risks and could be susceptible to hacking or identity theft.
We are also subject to risks arising from distributed denial of service attacks, which are occurring with increasing frequency. These attacks arise from both domestic and international sources and seek to obtain customer information for fraudulent purposes or, in some cases, to disrupt business activities. These information security risks could lead to a material adverse impact on our business, financial condition and financial results of operations, as well as result in reputational damage.
We rely on external vendors
Third party vendors provide key components of our business infrastructure, including certain data processing and information services. A number of our vendors are large national entities with dominant market presence in their respective fields, and their services could be difficult to quickly replace in the event of failure or other interruption in service. Failures of certain vendors to provide services for any reason could adversely affect our ability to deliver products and services to our customers. External vendors also present information security risk. We monitor vendor risks, including the financial stability of critical vendors. The failure of a critical external vendor could disrupt our business and cause us to incur significant expense.
We are subject to litigation risks that may be uninsured
We face litigation risks as a principal and as a fiduciary from customers, employees, vendors, federal and state regulatory agencies and other parties who may seek to assert individual or class action claims against us. The frequency of claims and
amount of damages and penalties claimed in litigation and regulatory proceedings against financial institutions remain high. Substantial legal liability or significant regulatory action against us may have material adverse financial effects or cause significant reputational harm. Although we carry insurance to mitigate our exposure to certain litigation risks, litigation could, nevertheless, adversely affect our results of operations.
We use accounting estimates in the preparation of our financial statements
The preparation of our financial statements in conformity with accounting principles generally accepted in the United States of America requires management to make significant estimates that affect the financial statements. Significant estimates include the allowance for loan and lease losses, the fair values of acquired loans and other real estate owned both at acquisition date and in subsequent periods, and the related receivable from the FDIC for loss share agreements. Due to the uncertainty of the circumstances relating to these estimates, we may experience more adverse outcomes than originally estimated. The allowance for loan and lease losses may need to be significantly increased. The actual losses or expenses on loans or the losses or expenses not covered under the FDIC agreements may differ from the recorded amounts, resulting in charges that could materially affect our results of operations.
Accounting standards may change
The Financial Accounting Standards Board (FASB) and the Securities and Exchange Commission periodically modify the standards that govern the preparation of our financial statements. The nature of these changes is not predictable and could impact how we record transactions in our financial statements, which could lead to material changes in assets, liabilities,
12
shareholders’ equity, revenues, expenses, and net income. In some cases, we could be required to apply a new or revised standard retroactively, resulting in changes to previously-reported financial results or a cumulative adjustment to retained earnings. The adoption of new accounting rules or standards could require us to implement costly technology changes.
Our access to capital is limited which could impact our future growth
Based on existing capital levels, BancShares and FCB are well-capitalized under current leverage and risk-based capital standards. Historically, our primary capital sources have been retained earnings and debt issued through both private and public markets including trust preferred securities and subordinated debt. Beginning January 1, 2013, provisions of the Dodd-Frank Act will partially eliminate our inclusion in tier 1 risk-based capital of
$93.5 million
of trust preferred securities with total elimination on January 1, 2015. The inability to include the trust preferred securities in tier 1 risk-based capital may lead us to redeem a portion or all of the securities prior to their scheduled maturity date. We have not historically raised capital through new issues of our common stock. Absent a change in that philosophy or additional acquisition gains, our ability to raise additional tier 1 capital is limited to our retained earnings and issuance of perpetual preferred stock. A lack of ready access to adequate amounts of tier 1 capital could limit our ability to consummate additional acquisitions, make new loans, meet our existing lending commitments, and could potentially affect our liquidity, capital adequacy and ability to pay dividends.
The major rating agencies regularly evaluate our creditworthiness and assign credit ratings to our debt and the debt of our bank subsidiary. The ratings of the agencies are based on a number of factors, some of which are outside our control. In addition to factors specific to our financial strength and performance, the rating agencies also consider conditions generally affecting the financial services industry. One of the rating agencies downgraded our ratings in 2012 due to weak core profitability metrics when compared to a peer group. Due to continuing soft economic conditions and the challenges we face to significantly increase our core earnings, rating agencies may further reduce our current credit ratings. Rating reductions could adversely affect our access to funding sources and the cost of obtaining funding.
The market price of our stock may be volatile
Although publicly traded, our Class A and Class B common stock have substantially less liquidity and public float than large publicly traded financial services companies. A relatively small percentage of our common stock is actively traded with average monthly volume during 2012 of
193,957
shares for our Class A stock and
1,645
shares for our Class B stock. The relative lack of market liquidity increases the price volatility of our stock and may make it difficult for our shareholders to sell or buy our common stock when they deem a transaction is warranted at a price that they believe is attractive.
Excluding the impact of liquidity, the market price of our common stock can fluctuate widely in response to other factors, including expectations of operating results, actual operating results, actions of institutional shareholders, speculation in the press or the investment community, market perception of acquisitions, rating agency upgrades or downgrades, stock prices of other companies that are similar to us, general market expectations related to the financial services industry and the potential impact of government actions affecting the financial services industry.
BancShares relies on dividends from FCB
As a financial holding company, BancShares is a separate legal entity from FCB and receives substantially all of its revenue and cash flow through dividends paid by FCB. FCB dividends are the primary source for BancShares' payment of dividends on its common stock and interest and principal on its debt obligations. North Carolina state law establishes certain limits on the amount of dividends that FCB may pay to BancShares. In the event that FCB is unable to pay dividends to BancShares, BancShares may not be able to pay dividends on its common stock or service its debt obligations.
Our recorded goodwill may become impaired
As of
December 31, 2012
, we had
$102.6 million
of goodwill recorded as an asset on our balance sheet. We test goodwill for impairment at least annually, and the impairment test compares the estimated fair value of a reporting unit with its net book value. We also test goodwill for impairment when certain events occur, such as a significant decline in our expected future cash flows, a significant adverse change in the business climate, or a sustained decline in the price of our common stock. These tests may result in a write-off of goodwill deemed to be impaired, which could have a significant impact on our earnings, but would
not impact our capital ratios since capital ratios are determined based upon tangible capital. Although the book value per share of our Class A common stock as of
December 31, 2012
, was
$193.75
compared to a market value of
$163.50
, we do not believe that this represents a sustained decline in the price of our common stock. In the event of a goodwill impairment charge and the resulting unfavorable earnings impact, the price of our stock could decline.
13
Properties
As of
December 31, 2012
, FCB operated branch offices at
414
locations in North Carolina, Virginia, West Virginia, Maryland, Tennessee, Florida, Georgia, Texas, Arizona, California, New Mexico, Colorado, Oregon, Washington, Oklahoma, Kansas, Missouri and Washington, DC. FCB owns many of the buildings and leases other facilities from third parties.
BancShares' headquarters facility, a nine-story building with approximately 163,000 square feet, is located in suburban Raleigh, North Carolina. In addition, we occupy an owned facility in Raleigh that serves as our data and operations center.
Additional information relating to premises, equipment and lease commitments is set forth in
Note E
of BancShares’ Notes to Consolidated Financial Statements.
Legal Proceedings
BancShares and various subsidiaries have been named as defendants in various legal actions arising from our normal business activities in which damages in various amounts are claimed. Although the amount of any ultimate liability with respect to such legal actions cannot be determined, in the opinion of management, there is no pending action that would have a material effect on BancShares’ consolidated financial statements.
Additional information relating legal proceedings is set forth in Note
S
of BancShares’ Notes to Consolidated Financial Statements.
Market for Registrant’s Common Equity, Related Stockholder Matters and Issuer Purchases of Equity Securities
BancShares has two classes of common stock—Class A common and Class B common. Shares of Class A common have one vote per share, while shares of Class B common have 16 votes per share. BancShares’ Class A common stock is listed on the NASDAQ Global Select Market under the symbol FCNCA. The Class B common stock is traded on the over-the-counter market and quoted on the OTC Bulletin Board under the symbol FCNCB. As of
December 31, 2012
, there were
1,729
holders of record of the Class A common stock and
307
holders of record of the Class B common stock. The market for Class B common stock is extremely limited. On many days, there is no trading and, to the extent there is trading, it is generally low in volume.
The average monthly trading volume for the Class A common stock was
242,829
shares for the fourth quarter of
2012
and
193,957
shares for the year ended
December 31, 2012
. The Class B common stock monthly trading volume averaged
1,772
shares in the fourth quarter of
2012
and
1,645
shares for the year ended
December 31, 2012
.
The per share cash dividends declared by BancShares on both the Class A and Class B common stock and the high and low sales prices for each quarterly period during
2012
and
2011
are set forth in the following table.
|
|
2012
|
2011
|
|||||||||||||||||||||||||||||
|
|
Fourth
quarter |
Third
quarter |
Second
quarter |
First
quarter |
Fourth
quarter |
Third
quarter |
Second
quarter |
First
quarter |
|||||||||||||||||||||||
|
Cash dividends (Class A and Class B)
|
$
|
0.30
|
|
$
|
0.30
|
|
$
|
0.30
|
|
$
|
0.30
|
|
$
|
0.30
|
|
$
|
0.30
|
|
$
|
0.30
|
|
$
|
0.30
|
|
|||||||
|
Class A sales price
|
|||||||||||||||||||||||||||||||
|
High
|
174.03
|
|
169.70
|
|
181.62
|
|
185.42
|
|
180.25
|
|
191.66
|
|
204.89
|
|
208.55
|
|
|||||||||||||||
|
Low
|
156.48
|
|
160.89
|
|
161.22
|
|
164.70
|
|
138.71
|
|
137.10
|
|
176.48
|
|
188.81
|
|
|||||||||||||||
|
Class B sales price
|
|||||||||||||||||||||||||||||||
|
High
|
167.69
|
|
179.34
|
|
182.99
|
|
183.98
|
|
189.00
|
|
193.00
|
|
207.69
|
|
208.50
|
|
|||||||||||||||
|
Low
|
158.00
|
|
159.41
|
|
161.11
|
|
172.75
|
|
146.00
|
|
153.00
|
|
184.00
|
|
191.25
|
|
|||||||||||||||
Sales prices for Class A common were obtained from the NASDAQ Global Select Market. Sales prices for Class B common were obtained from the OTC Bulletin Board.
A cash dividend of 30 cents per share was declared by the Board of Directors on
January 29, 2013
, payable on
April 1, 2013
, to holders of record as of
March 18, 2013
. Payment of dividends is made at the discretion of the Board of Directors and is contingent upon satisfactory earnings as well as projected future capital needs. BancShares’ principal source of liquidity for
14
payment of shareholder dividends is the dividend it receives from FCB. FCB is subject to various requirements under federal and state banking laws that restrict the payment of dividends and its ability to lend to BancShares. Subject to the foregoing, it is currently management’s expectation that comparable cash dividends will continue to be paid in the future.
During 2012, our Board of Directors granted authority and approved a plan to purchase up to
100,000
and
25,000
shares of Class A and Class B common stock, respectively, during the period from July 1, 2012 through June 30, 2013. That authority replaced similar plans approved by the Board during 2011 that were in effect during the twelve months preceding July 1, 2012. Pursuant to those plans, during 2012 as a whole, we purchased and retired an aggregate of
56,276
shares of Class A common stock and
100
shares of Class B common stock. Additionally, pursuant to separate authorizations, during 2012 we purchased an aggregate of
606,829
shares of Class B common stock in privately negotiated transactions, including, as previously reported and as further described below, purchases of 593,954 shares during December 2012 from a director and certain of her related interests which were approved by the independent Directors, after review and recommendation by a special committee of independent Directors. As of December 31, 2012, under the existing plan which expires June 30, 2013, BancShares had the ability to purchase
43,724
and
24,900
additional shares of Class A and Class B common stock, respectively.
The following tables provide information regarding purchases of shares of Class A and Class B common stock by BancShares during the three-month period ended
December 31, 2012
, as well as shares that may be purchased under publicly announced plans.
Issuer Repurchases of Equity Securities
|
Period
|
Total number of shares purchased (1)
|
Average price paid
per share
|
Total number of
shares purchased
as part of publicly
announced plans
or programs (2)
|
Maximum number
of shares that may
yet be purchased
under the plans or
programs (2)
|
||||||||
|
Purchases from October 1, 2012, through October 31, 2012
|
6,788
|
|
$
|
162.83
|
|
6,788
|
|
77,715
|
|
|||
|
Purchases from November 1, 2012, through November 30, 2012
|
2,649
|
|
164.00
|
|
2,649
|
|
75,066
|
|
||||
|
Purchases from December 1, 2012, through December 31, 2012
|
31,342
|
|
161.25
|
|
31,342
|
|
43,724
|
|
||||
|
Total
|
40,779
|
|
$
|
161.69
|
|
40,779
|
|
43,724
|
|
|||
|
Period
|
Total number of shares purchased (1)
|
Average price paid
per share
|
Total number of
shares purchased
as part of publicly
announced plans
or programs (2)
|
Maximum number
of shares that may
yet be purchased
under the plans or
programs (2)
|
||||||||
|
Purchases from October 1, 2012, through October 31, 2012
|
—
|
|
$
|
—
|
|
—
|
|
25,000
|
|
|||
|
Purchases from November 1, 2012, through November 30, 2012
|
—
|
|
—
|
|
—
|
|
25,000
|
|
||||
|
Purchases from December 1, 2012, through December 31, 2012
|
594,054
|
|
155.00
|
|
100
|
|
24,900
|
|
||||
|
Total
|
594,054
|
|
$
|
155.00
|
|
100
|
|
24,900
|
|
|||
|
(1)
|
As previously reported, during December 2012, we purchased an aggregate of 593,954 shares of Class B common stock from a director and certain of her related interests in private transactions, at a price of $155.00 per share, pursuant to agreements approved in advance by our independent Directors following approval and recommendation of the transactions by a specially appointed committee of independent Directors.
|
|
(2)
|
The currently effective plan was approved by the Board on June 18, 2012 and authorized the purchase of up to an aggregate of 100,000 and 25,000 shares of Class A and Class B common stock, respectively. It was publicly announced on June 22, 2012, and it expires on June 30, 2013,
|
During December 2012, BancShares purchased 593,954 shares of Class B common stock at a per share price of $155. This purchase was not part of a publicly announced plan or program.
15
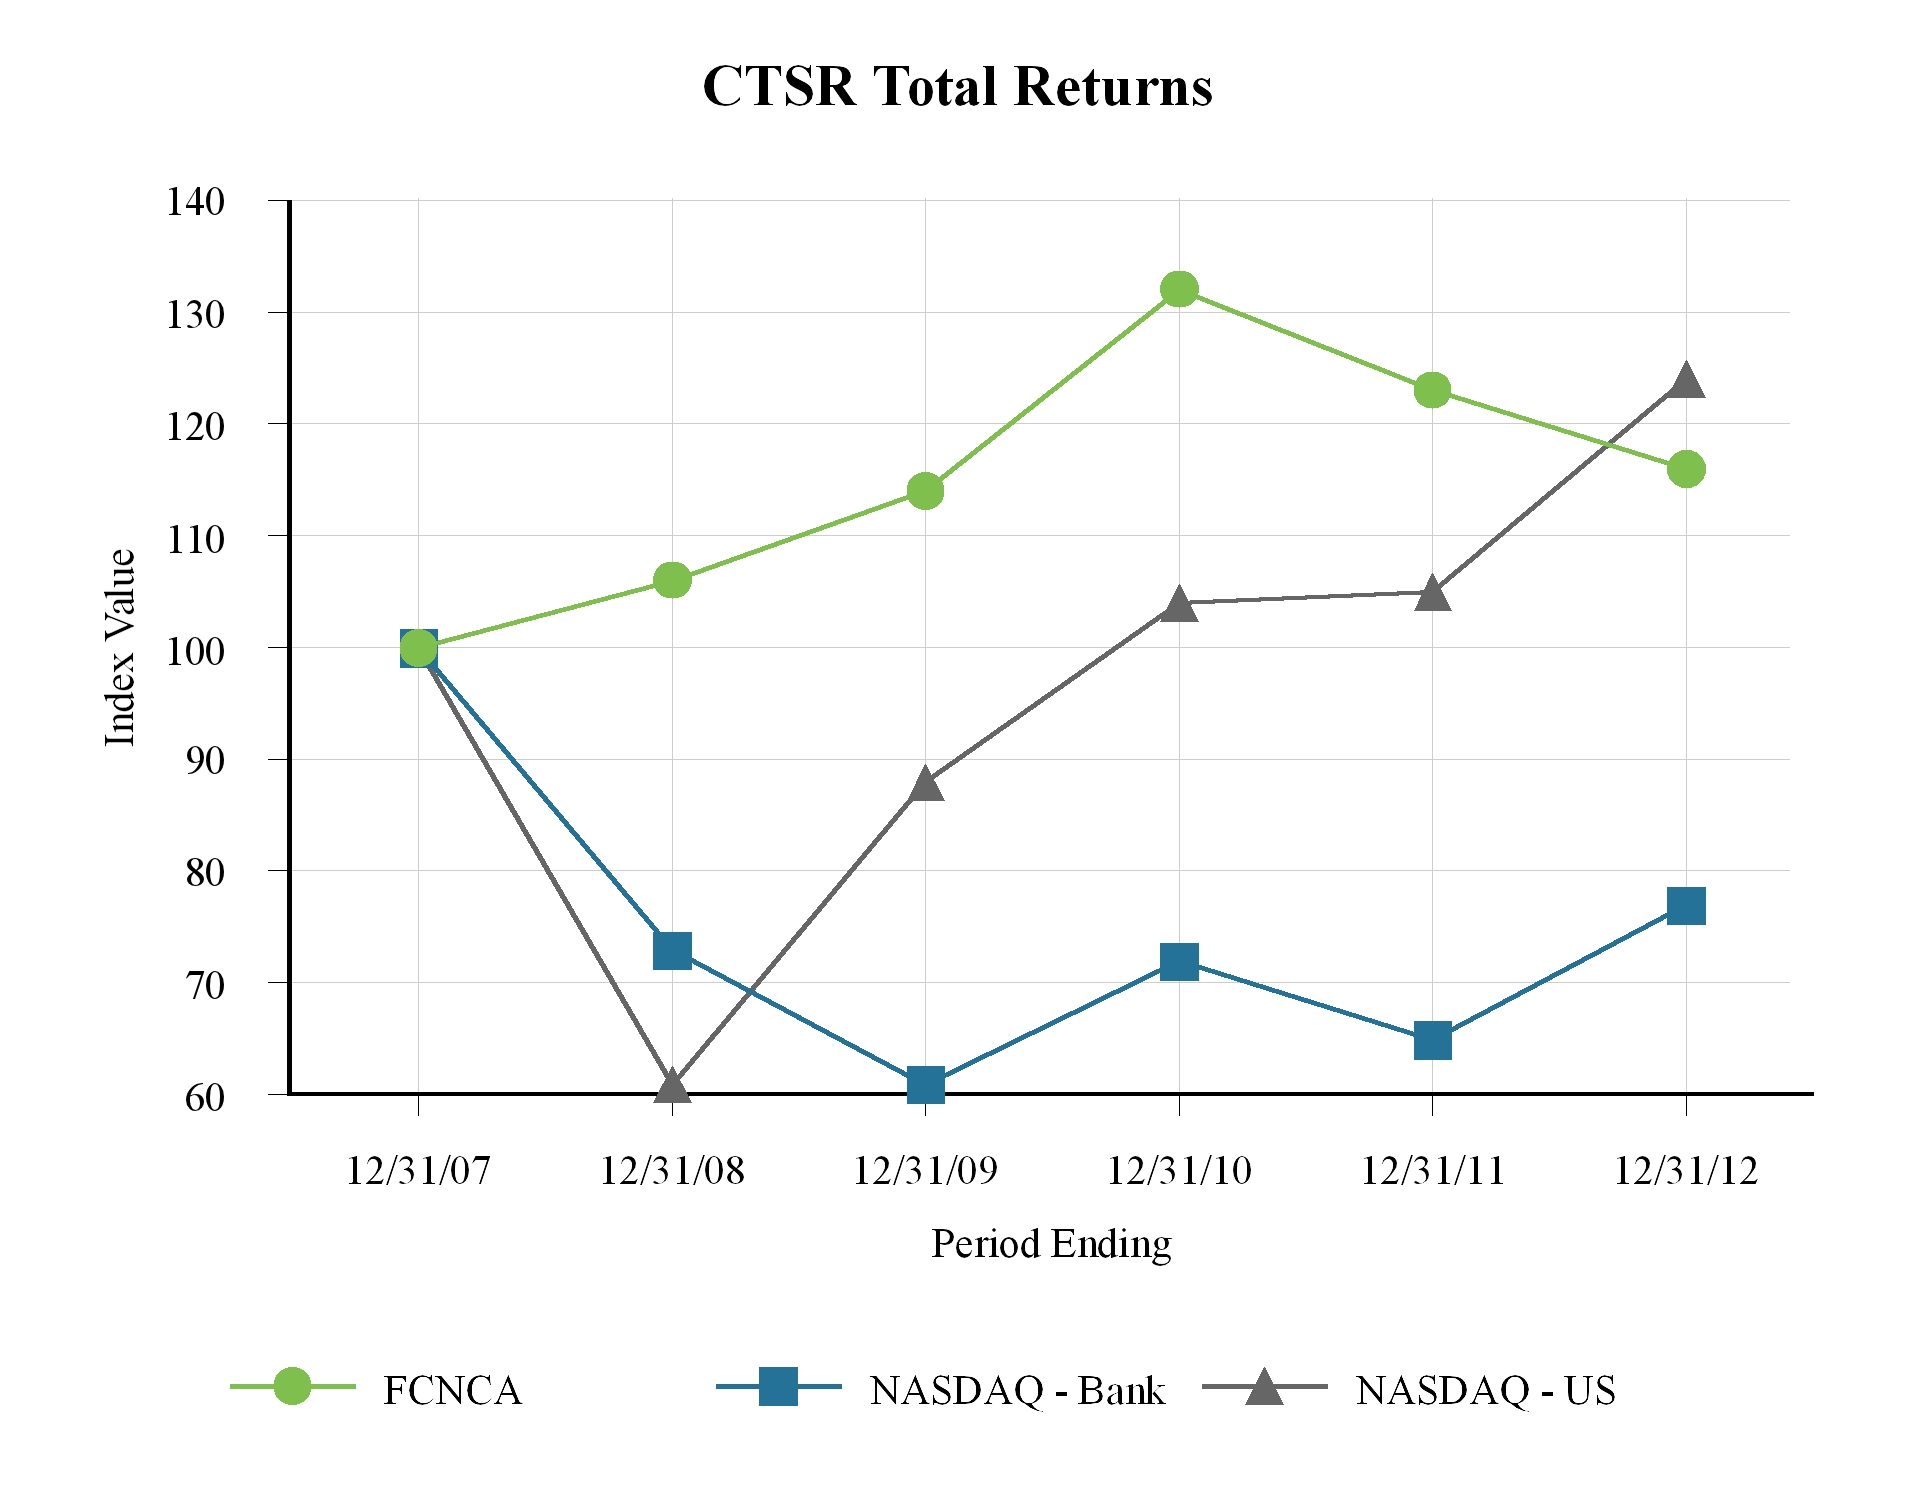
The following graph compares the cumulative total shareholder return (CTSR) of our Class A common stock during the previous five years with the CTSR over the same measurement period of the Nasdaq-Banks Index and the Nasdaq-U.S. Index. Each trend line assumes that $100 was invested on
December 31, 2007
, and that dividends were reinvested for additional shares.
|
12/31/2007
|
12/31/2008
|
12/31/2009
|
12/31/2010
|
12/31/2011
|
12/31/2012
|
|||||||||
|
FCNCA
|
$
|
100
|
|
106
|
|
114
|
|
132
|
|
123
|
|
116
|
|
|
|
Nasdaq - Banks
|
$
|
100
|
|
73
|
|
61
|
|
72
|
|
65
|
|
77
|
|
|
|
Nasdaq - US
|
$
|
100
|
|
61
|
|
88
|
|
104
|
|
105
|
|
124
|
|
|
16
Table 1
FINANCIAL SUMMARY AND SELECTED AVERAGE BALANCES AND RATIOS
|
2012
|
2011
|
2010
|
2009
|
2008
|
||||||||||||||||
|
|
(thousands, except share data and ratios)
|
|||||||||||||||||||
|
SUMMARY OF OPERATIONS
|
||||||||||||||||||||
|
Interest income
|
$
|
1,004,836
|
|
$
|
1,015,159
|
|
$
|
969,368
|
|
$
|
738,159
|
|
$
|
813,351
|
|
|||||
|
Interest expense
|
90,148
|
|
144,192
|
|
195,125
|
|
227,644
|
|
314,945
|
|
||||||||||
|
Net interest income
|
914,688
|
|
870,967
|
|
774,243
|
|
510,515
|
|
498,406
|
|
||||||||||
|
Provision for loan and lease losses
|
142,885
|
|
232,277
|
|
143,519
|
|
79,364
|
|
65,926
|
|
||||||||||
|
Net interest income after provision for loan and lease losses
|
771,803
|
|
638,690
|
|
630,724
|
|
431,151
|
|
432,480
|
|
||||||||||
|
Gain on acquisitions
|
—
|
|
150,417
|
|
136,000
|
|
104,434
|
|
—
|
|
||||||||||
|
Other noninterest income
|
189,300
|
|
313,949
|
|
270,214
|
|
299,017
|
|
307,506
|
|
||||||||||
|
Noninterest expense
|
766,933
|
|
792,925
|
|
733,376
|
|
651,503
|
|
600,382
|
|
||||||||||
|
Income before income taxes
|
194,170
|
|
310,131
|
|
303,562
|
|
183,099
|
|
139,604
|
|
||||||||||
|
Income taxes
|
59,822
|
|
115,103
|
|
110,518
|
|
66,768
|
|
48,546
|
|
||||||||||
|
Net income
|
$
|
134,348
|
|
$
|
195,028
|
|
$
|
193,044
|
|
$
|
116,331
|
|
$
|
91,058
|
|
|||||
|
Net interest income, taxable equivalent
|
$
|
917,664
|
|
$
|
874,727
|
|
$
|
778,382
|
|
$
|
515,446
|
|
$
|
505,151
|
|
|||||
|
PER SHARE DATA
|
||||||||||||||||||||
|
Net income
|
$
|
13.11
|
|
$
|
18.80
|
|
$
|
18.50
|
|
$
|
11.15
|
|
$
|
8.73
|
|
|||||
|
Cash dividends declared
|
1.20
|
|
1.20
|
|
1.20
|
|
1.20
|
|
1.10
|
|
||||||||||
|
Market price at December 31 (Class A)
|
163.50
|
|
174.99
|
|
189.05
|
|
164.01
|
|
152.80
|
|
||||||||||
|
Book value at December 31
|
193.75
|
|
180.97
|
|
166.08
|
|
149.42
|
|
138.33
|
|
||||||||||
|
SELECTED AVERAGE BALANCES
|
||||||||||||||||||||
|
Total assets
|
$
|
21,077,444
|
|
$
|
21,135,572
|
|
$
|
20,841,180
|
|
$
|
17,557,484
|
|
$
|
16,403,717
|
|
|||||
|
Investment securities
|
4,698,559
|
|
4,215,761
|
|
3,641,093
|
|
3,412,620
|
|
3,112,717
|
|
||||||||||
|
Loans and leases
|
13,560,773
|
|
14,050,453
|
|
13,865,815
|
|
12,062,954
|
|
11,306,900
|
|
||||||||||
|
Interest-earning assets
|
18,974,915
|
|
18,824,668
|
|
18,458,160
|
|
15,846,514
|
|
14,870,501
|
|
||||||||||
|
Deposits
|
17,727,117
|
|
17,776,419
|
|
17,542,318
|
|
14,578,868
|
|
13,108,246
|
|
||||||||||
|
Interest-bearing liabilities
|
14,298,026
|
|
15,044,889
|
|
15,235,253
|
|
13,013,237
|
|
12,312,499
|
|
||||||||||
|
Long-term obligations
|
574,721
|
|
766,509
|
|
885,145
|
|
753,242
|
|
607,463
|
|
||||||||||
|
Shareholders’ equity
|
$
|
1,915,269
|
|
$
|
1,811,520
|
|
$
|
1,672,238
|
|
$
|
1,465,953
|
|
$
|
1,484,605
|
|
|||||
|
Shares outstanding
|
10,244,472
|
|
10,376,445
|
|
10,434,453
|
|
10,434,453
|
|
10,434,453
|
|
||||||||||
|
SELECTED PERIOD-END BALANCES
|
||||||||||||||||||||
|
Total assets
|
$
|
21,283,652
|
|
$
|
20,997,298
|
|
$
|
20,806,659
|
|
$
|
18,466,063
|
|
$
|
16,745,662
|
|
|||||
|
Investment securities
|
5,227,570
|
|
4,058,245
|
|
4,512,608
|
|
2,932,765
|
|
3,225,194
|
|
||||||||||
|
Loans and leases:
|
||||||||||||||||||||
|
Covered under loss share agreements
|
1,809,235
|
|
2,362,152
|
|
2,007,452
|
|
1,173,020
|
|
—
|
|
||||||||||
|
Not covered under loss share agreements
|
11,576,115
|
|
11,581,637
|
|
11,480,577
|
|
11,644,999
|
|
11,649,886
|
|
||||||||||
|
Interest-earning assets
|
19,142,433
|
|
18,529,548
|
|
18,487,960
|
|
16,541,425
|
|
15,119,095
|
|
||||||||||
|
Deposits
|
18,086,025
|
|
17,577,274
|
|
17,635,266
|
|
15,337,567
|
|
13,713,763
|
|
||||||||||
|
Interest-bearing liabilities
|
14,213,751
|
|
14,548,389
|
|
15,015,446
|
|
13,561,924
|
|
12,441,025
|
|
||||||||||
|
Long-term obligations
|
444,921
|
|
687,599
|
|
809,949
|
|
797,366
|
|
733,132
|
|
||||||||||
|
Shareholders’ equity
|
$
|
1,864,007
|
|
$
|
1,861,128
|
|
$
|
1,732,962
|
|
$
|
1,559,115
|
|
$
|
1,443,375
|
|
|||||
|
Shares outstanding
|
9,620.914
|
|
10,284.119
|
|
10,434,453
|
|
10,434,453
|
|
10,434,453
|
|
||||||||||
|
SELECTED RATIOS AND OTHER DATA
|
||||||||||||||||||||
|
Rate of return on average assets
|
0.64
|
|
%
|
0.92
|
|
%
|
0.93
|
|
%
|
0.66
|
|
%
|
0.56
|
|
%
|
|||||
|
Rate of return on average shareholders’ equity
|
7.01
|
|
10.77
|
|
11.54
|
|
7.94
|
|
6.13
|
|
||||||||||
|
Net yield on interest-earning assets (taxable equivalent)
|
4.84
|
|
4.65
|
|
4.22
|
|
3.25
|
|
3.40
|
|
||||||||||
|
Allowance for loan and lease losses on noncovered loans to noncovered loans and leases at year-end
|
1.55
|
|
1.56
|
|
1.54
|
|
1.45
|
|
1.35
|
|
||||||||||
|
Nonperforming assets to total loans and leases plus other real estate at year-end:
|
||||||||||||||||||||
|
Covered under loss share agreements
|
9.26
|
|
17.95
|
|
12.87
|
|
16.59
|
|
—
|
|
||||||||||
|
Not covered under loss share agreements
|
1.15
|
|
0.89
|
|
1.14
|
|
0.85
|
|
0.59
|
|
||||||||||
|
Tier 1 risk-based capital ratio
|
14.27
|
|
15.41
|
|
14.86
|
|
13.34
|
|
13.20
|
|
||||||||||
|
Total risk-based capital ratio
|
15.95
|
|
17.27
|
|
16.95
|
|
15.59
|
|
15.49
|
|
||||||||||
|
Leverage capital ratio
|
9.22
|
|
9.90
|
|
9.18
|
|
9.54
|
|
9.88
|
|
||||||||||
|
Dividend payout ratio
|
9.15
|
|
6.38
|
|
6.49
|
|
10.76
|
|
12.60
|
|
||||||||||
|
Average loans and leases to average deposits
|
76.50
|
|
79.04
|
|
79.04
|
|
82.74
|
|
86.26
|
|
||||||||||
Average loans and leases include nonaccrual loans. See discussion of issues affecting comparability of financial statements under the caption FDIC-Assisted Transactions. The capital ratios presented are of First Citizens BancShares, Inc., and Subsidiaries.
17
Management’s Discussion and Analysis of Financial Condition and Results of Operations
Management’s discussion and analysis of earnings and related financial data are presented to assist in understanding the financial condition and results of operations of First Citizens BancShares, Inc. and Subsidiaries (BancShares). This discussion and analysis should be read in conjunction with the audited consolidated financial statements and related notes presented within this report. Intercompany accounts and transactions have been eliminated. Unless otherwise noted, the terms "we," "us" and "BancShares" refer to the consolidated financial position and consolidated results of operations for BancShares.
CRITICAL ACCOUNTING POLICIES
The accounting and reporting policies of BancShares are in accordance with accounting principles generally accepted in the United States of America (GAAP) and conform to general practices within the banking industry. The preparation of financial statements in conformity with GAAP requires management to make estimates and assumptions to arrive at the carrying value of assets and liabilities and amounts reported for revenues and expenses. Our financial position and results of operations can be materially affected by these estimates and assumptions. Critical accounting policies are those policies that are most important to the determination of our financial condition and results of operations or that require management to make assumptions and estimates that are subjective or complex. The most critical accounting and reporting policies include those related to the allowance for loan and lease losses, fair value estimates, the receivable from and payable to the FDIC for loss share agreements, pension plan assumptions and income taxes. Significant accounting policies are discussed in
Note A
of the Notes to Consolidated Financial Statements.
The following is a summary of our critical accounting policies that are highly dependent on estimates and assumptions.
Allowance for loan and lease losses.
The allowance for loan and lease losses reflects the estimated losses resulting from the inability of our customers to make required loan and lease payments. The allowance reflects management’s evaluation of the risk characteristics of the loan and lease portfolio under current economic conditions and considers such factors as the financial condition of the borrower, fair market value of collateral and other items that, in our opinion, deserve current recognition in estimating possible loan and lease losses. Our evaluation process is based on historical evidence and current trends among delinquencies, defaults and nonperforming assets. A consistent methodology is utilized that includes allowances assigned to specific impaired commercial loans and leases, general commercial loan allowances that are based upon estimated loss rates by credit grade with the loss rates derived in part from migration analysis among grades, general non-commercial allowances based upon estimated loss rates derived primarily from historical losses, and a nonspecific allowance based upon economic conditions, loan concentrations and other relevant factors. Specific allowances for impaired loans are determined by analyzing estimated cash flows discounted at a loan's original rate or collateral values in situations where we believe repayment is dependent on collateral liquidation. Substantially all impaired loans are collateralized by real property.
Loans covered by loss share agreements are recorded at fair value at acquisition date. Amounts deemed uncollectible at acquisition date become part of the fair value calculation and are excluded from the allowance for loan and lease losses. Following acquisition, we routinely review covered loans to determine if changes in estimated cash flows have occurred. Subsequent decreases in the amount expected to be collected may result in a provision for loan and lease losses with a corresponding increase in the allowance for loan and lease losses. Subsequent increases in the amount expected to be collected result in a reversal of any previously recorded provision for loan and lease losses and related allowance for loan and lease losses, if any, or prospective adjustment to the accretable yield if no provision for loan and lease losses had been recorded. Proportional adjustments are also recorded to the FDIC receivable for loans covered by loss share agreements.
Management considers the established allowance adequate to absorb losses that relate to loans and leases outstanding at
December 31, 2012
, although future additions may be necessary based on changes in economic conditions, collateral values, erosion of the borrower's access to liquidity and other factors. In addition, various regulatory agencies, as an integral part of their examination process, periodically review the allowance for loan and lease losses. These agencies may require the recognition of additions to the allowance based on their judgments of information available to them at the time of their examination. If the financial condition of our borrowers were to deteriorate, resulting in an impairment of their ability to make payments, our estimates would be updated and additions to the allowance may be required.
Fair value estimates.
BancShares reports investment securities available for sale and interest rate swaps accounted for as cash flow hedges at fair value. At
December 31, 2012
, the percentage of total assets and total liabilities measured at fair value on a recurring basis was
24.6
percent and less than 1.0 percent, respectively. The fair values of assets and liabilities carried at fair value on a recurring basis are primarily based on quoted market prices. At
December 31, 2012
, no assets or
liabilities measured at fair value on a recurring basis were based on significant nonobservable inputs. Certain other assets are
18
reported at fair value on a nonrecurring basis, including loans held for sale, other real estate owned (OREO) and impaired loans. See Note
K
“Estimated Fair Values” in the Notes to Consolidated Financial Statements for additional disclosures regarding fair value.
As required under GAAP, the assets acquired and liabilities assumed in our FDIC-assisted transactions were recognized at their fair values as of the acquisition date. Fair values were determined using valuation methods and assumptions established by management. Use of different assumptions and methods could yield significantly different fair values. Cash flow estimates for loans, leases and OREO were based on judgments regarding future expected loss experience, which included the use of commercial loan credit grades, collateral valuations and current economic conditions. The cash flows were discounted to fair value using rates that included consideration of factors such as current interest rates, costs to service the loans and liquidation of the asset.
Receivable from and Payable to FDIC for loss share agreements.
The receivable from the FDIC for loss share agreements is measured separately from the related covered assets and is recorded at fair value at the acquisition date using projected cash flows related to the loss share agreements based on the expected reimbursements for losses and expenses at the applicable loss share percentages. The receivable from the FDIC is reviewed and updated quarterly as loss estimates and timing of estimated cash flows related to covered loans and OREO change. Post-acquisition adjustments represent the net change in loss estimates related to covered loans and OREO as a result of changes in expected cash flows and the allowance for loan and lease losses related to covered loans. For loans covered by loss share agreements, subsequent decreases in the amount expected to be collected from the borrower or collateral liquidation may result in a provision for loan and lease losses, an increase in the allowance for loan and lease losses and a proportional adjustment to the FDIC receivable for the estimated amount to be reimbursed. Subsequent increases in the amount expected to be collected from the borrower or collateral liquidation result in the reversal of any previously recorded provision for loan and lease losses and related allowance for loan and lease losses and adjustments to the FDIC receivable, or prospective adjustment to the accretable yield and the related FDIC receivable if no provision for loan and lease losses had been recorded previously. While accretable yield is recognized over the estimated remaining life of the covered loan, the FDIC receivable is adjusted over the shorter of the remaining term of the loss share agreement or the life of the covered loan. Other adjustments to the FDIC receivable result from unexpected recoveries of amounts previously charged off, servicing costs that exceed initial estimates and changes to the estimated fair value of OREO.
Certain of the loss share agreements include clawback provisions that require payments to the FDIC if actual losses and expenses do not exceed a calculated amount. Our estimate of the clawback payments based on current loss and expense projections are recorded as an accrued liability. Projected cash flows are discounted to reflect the estimated timing of the payments to the FDIC. For
2012
, the payable to the Federal Deposit Insurance Corporation (FDIC) for loss share agreements, which was previously netted against the receivable from FDIC for loss share agreements and reported as an asset, was reclassified and is now included as a liability.
Pension plan assumptions.
BancShares offers a defined benefit pension plan to qualifying employees. The calculation of the benefit obligation, the future value of plan assets, funded status and related pension expense under the pension plan requires the use of actuarial valuation methods and assumptions. The valuations and assumptions used to determine the future value of plan assets and liabilities are subject to management judgment and may differ significantly depending upon the assumptions used. The discount rate used to estimate the present value of the benefits to be paid under the pension plan reflects the interest rate that could be obtained for a suitable investment used to fund the benefit obligation. The assumed discount rate equaled
4.00
percent at
December 31, 2012
, and
4.75 percent
at
December 31, 2011
. A reduction in the assumed discount rate increases the calculated benefit obligations which results in higher pension expense subsequent to adoption of the lower discount rate. Conversely, an increase in the assumed discount rate causes a reduction in obligations thereby resulting in lower pension expense following the increase in the discount rate.
We also estimate a long-term rate of return on pension plan assets that is used to estimate the future value of plan assets. We consider such factors as the actual return earned on plan assets, historical returns on the various asset classes in the plan and projections of future returns on various asset classes. The calculation of pension expense was based on an assumed expected long-term return on plan assets of
7.50
percent during
2012
compared to
7.75
percent in
2011
. A reduction in the long-term rate of return on plan assets increases pension expense for periods following the decrease in the assumed rate of return.
The assumed rate of future compensation increases is reviewed annually based on actual experience and future salary expectations. We used an assumed rate of compensation increase of
4.00
percent to calculate pension expense during
2012
and
4.00 percent
during
2011
. Assuming other variables remain unchanged, an increase in the rate of future compensation increases results in higher pension expense for periods following the increase in the assumed rate of future compensation increases.
19
Income taxes
. Management estimates income tax expense using the asset and liability method. Under this method, deferred tax assets and liabilities are recognized for future tax consequences attributable to differences between the amount of assets and liabilities reported in the consolidated financial statements and their respective tax bases. In estimating the liabilities and corresponding expense related to income taxes, management assesses the relative merits and risks of various tax positions considering statutory, judicial and regulatory guidance. Because of the complexity of tax laws and regulations, interpretation is difficult and subject to differing judgments. Accrued income taxes payable represents an estimate of the net amounts due to or from taxing jurisdictions based upon various estimates, interpretations and judgments.
We evaluate our effective tax rate on a quarterly basis based upon the current estimate of net income, the favorable impact of various credits, statutory tax rates expected for the year and the amount of tax liability in each jurisdiction in which we operate. Annually, we file tax returns with each jurisdiction where we have tax nexus and settle our return liabilities.
Changes in estimated income tax liabilities occur periodically due to changes in actual or estimated future tax rates and projections of taxable income, interpretations of tax laws, the complexities of multi-state income tax reporting, the status of examinations being conducted by various taxing authorities and the impact of newly enacted legislation or guidance as well as income tax accounting pronouncements.
EXECUTIVE OVERVIEW
BancShares’ earnings and cash flows are primarily derived from our commercial banking activities. We gather deposits from retail and commercial customers and also secure funding through various non-deposit sources. We invest the liquidity generated from these funding sources in interest-earning assets, including loans and leases, investment securities and overnight investments. We also invest in the bank premises and furniture and equipment used to conduct our commercial banking business. In addition to traditional loan and deposit products, we also offer treasury services products, cardholder and merchant services, wealth management services, as well as various other products and services typically offered by commercial banks.
BancShares conducts its banking operations through its wholly-owned subsidiary First-Citizens Bank & Trust Company (FCB), a state-chartered bank organized under the laws of the state of North Carolina. Prior to 2011, BancShares also conducted banking activities through IronStone Bank (ISB), a federally-chartered thrift institution. On January 7, 2011, ISB was merged into FCB.
Various external factors influence the focus of our business efforts. The industry-wide financial challenges that began in 2008 have, to varying degrees, continued through
2012
. During this period, asset quality challenges, capital adequacy problems and weak economic conditions have resulted in unfavorable conditions for growth. During this period of industry-wide turmoil, we have continued our longstanding attention to prudent banking practices. Historically, we have focused on liquidity, asset quality and capital strength as key areas of focus. We believe these qualities are critical to our company's long-term health and also enable us to participate in various growth opportunities.
During the period 2000 though 2008, we focused on organic growth in North Carolina and Virginia and
de novo
branching into high growth markets in other states. However, in recognition of the significant opportunity for balance sheet and capital growth with little credit risk, we elected to participate in six FDIC-assisted transactions involving distressed financial institutions during the period from 2009 through 2011. Participation in FDIC-assisted transactions provided opportunities to increase our business volumes in existing markets and to expand our banking presence to adjacent markets that we deemed demographically attractive. For each of the six FDIC-assisted transactions we completed, loss share agreements protect us from a substantial portion of the asset quality risk that we would otherwise incur. Additionally, purchase discounts and fair value adjustments on acquired assets and assumed liabilities resulted in significant acquisition gains that provided a substantial portion of the equity required to fund the transactions.
Despite the recognition of significant acquisition gains in 2011, 2010 and 2009, narrow interest margins and legislatively-imposed restrictions on our ability to collect various fees have adversely affected our core earnings. Additionally, while distressed customers continue to experience difficulty meeting their debt service obligations, other customers who are fearful of economic uncertainty defer new borrowings and continue to repay existing debt.
As we consider our position in the current business environment, we continue to benefit from our organization’s strengths. In our effort to optimally allocate our resources, we have identified the following corporate strengths and market opportunities:
|
•
|
Our multi-state delivery network that serves both major metropolitan markets and rural communities
|
|
•
|
Our strategic focus on narrow business customer segments that utilize mainstream banking services
|
20
|
•
|
Our focus on balance sheet liquidity
|
|
•
|
Our conservative credit philosophies
|
|
•
|
Our commitment to the long-term impact of strategic, financial and operational decisions
|
|
•
|
Our dedicated associates and experienced executive leadership
|
|
•
|
Our size, which allows us to provide services typically only available through large banks, but with a focus on customer service that is typical of community banks
|
|
•
|
The opportunity to expand our branch network and asset base through acquisitions
|
|
•
|
Our presence in diverse and demographically robust markets
|
|
•
|
Our ability to attract customers of super-regional banks who demand a higher level of customer service than they currently receive
|
|
•
|
The opportunity to generate increased volumes of fee income in areas such as merchant processing, credit card interchange, insurance, business and treasury services and wealth management activities
|
|
•
|
Our potential for customer attraction, enhanced customer experience and incremental sales as a result of the growing desire of customers to acquire financial services over the Internet
|
We have identified the following challenges and threats that are most relevant and likely to have an impact on our success.
|
•
|
Weakened domestic economy driving higher than normal unemployment, elevated credit costs and low interest rates
|
|
•
|
Increased competition from non-bank financial service providers
|
|
•
|
Continued decline in the role of traditional commercial banks in the large loan credit market
|
|
•
|
Continued customer migration away from traditional branch offices as the banking focal point
|
|
•
|
Challenge to attract and retain qualified associates
|
|
•
|
Competition from global financial service providers that operate with narrower margins on loan and deposit products
|
|
•
|
Existing legislative and regulatory actions that have had an adverse impact on fee income, increased our compliance costs and will reduce existing capital
|
|
•
|
The need to make significant investments to improve our information technology infrastructure
|
|
•
|
Overcapacity in noninterest expense structure that reduces our ability to effectively compete with larger financial institutions
|
|
•
|
Incremental capital required by BASEL III
|
During the past two years, we have closely examined the state of our core technology systems and related business processes and determined that significant investments are required. The project to modernize our systems will begin in 2013 with phased implementation through 2016. During 2012, we also identified several product offerings with inadequate business volumes to allow us to achieve adequate profitability. Therefore, during 2012, we divested our working capital division that purchased and collected short-term receivables and our stock transfer division that provided shareholder services to clients.
In addition to our commercial banking activities, we have for a number of years provided a variety of business, data processing, bank operations, corporate trust, stock transfer and related services to other banks and financial institutions. FCB has engaged in that line of business for more than 20 years and has provided certain of those services to as many as 60 different financial institutions. However, due to the rapid consolidation of the banking industry and the resulting loss of a significant number of client banks, as well as the prospective loss of additional client banks, we began a planned transition away from this line of business in 2012.
One of the principal services offered to client banks has been core processing services on our legacy technology systems. As a component of the transition from the client bank services line of business and realizing that the majority of those banks utilizing our legacy technology systems would benefit from a more integrated processing system designed for community banks, we converted nearly all banks to a vendor-provided integrated processing system licensed from the vendor. Another step in the transition from this line of business was the execution in early-2013 of an agreement with the vendor to sell to them our processing business that had been running on their application, thus prospectively terminating our ongoing support and efforts with respect to this aspect of our client bank business. Our largest client bank is a financial institution controlled by Related Persons, which did not migrate to the vendor-provided servicing system due to the size and complexity of that institution. That institution will continue to utilize our core technology systems and is partnering with us on the system modernization project.
While industry earnings recovered during
2012
, financial challenges were evident with pressure on net interest income and noninterest income accompanied by little change in noninterest expenses. The earnings recovery was driven by lower credit costs and reduced allowance for loan and lease loss level. The Federal Reserve's continuing efforts to stimulate economic growth has resulted in interest rates remaining at unprecedented low levels, with an expressed intent to hold benchmark interest rates stable until 2015. The low interest rate environment has created pressure on net interest income.
21
Although improved when compared to 2011, soft real estate markets continue to cause banks to carry relatively large inventories of OREO and to market and sell properties for amounts less than estimated market prices. Real estate demand in many of our markets remains weak, resulting in depressed real estate prices that continue to affect collateral values for many borrowers. As a result, when customer cash flow is inadequate to avoid default, losses resulting from liquidation of collateral are higher than would have occurred prior to the decline in real estate values. Exposure to declining real estate values have caused some loans secured by a second mortgage to become effectively unsecured.
In an effort to assist customers who are experiencing financial difficulty, we have selectively agreed to modify existing loan terms to provide relief to customers who are experiencing liquidity challenges or other circumstances that could affect their ability to meet their debt obligations. As a result, troubled debt restructurings have increased during 2012 and 2011. The majority of the modifications we provide are to customers that are currently performing under existing terms, but may be unable to do so in the near future without a modification.
The demand for our treasury services products has been adversely influenced by extraordinarily low interest rates. Our balance sheet liquidity position remains strong despite significant attrition of deposits assumed in the FDIC-assisted transactions.
Ongoing economic weakness and market uncertainty continues to have a significant impact on virtually all financial institutions in the United States. Beyond the profitability pressures resulting from a weak economy, financial institutions continue to face challenges resulting from implementation of legislative and governmental reforms to stabilize the financial services industry and provide added consumer protection. In addition to the various actions previously enacted by governmental agencies and the Dodd-Frank Wall Street Reform and Consumer Protection Act (Dodd-Frank Act), further changes will likely occur, including the BASEL III requirements that are anticipated to be finalized during 2013.
The Dodd-Frank Act contained provisions that will gradually eliminate our ability to include trust preferred securities as equity for capital adequacy purposes. Due to the pending elimination of those securities from our capital and the cost of those borrowings, we elected to redeem $150.0 million of our trust preferred securities during July 2012.
Financial institutions have typically focused their strategic and operating emphasis on maximizing profitability and therefore have measured their relative success by reference to profitability measures such as return on average assets or return on average shareholders’ equity. BancShares’ return on average assets and return on average equity have historically compared unfavorably to the returns of similar-sized financial holding companies. We have consistently placed primary strategic emphasis upon balance sheet liquidity, asset quality and capital conservation, even when those priorities may have been detrimental to short-term profitability. While we have not been immune from adverse influences arising from economic weaknesses, our long-standing focus on balance sheet strength served us particularly well during the period from 2009 through 2012.
Although we are unable to control the external factors that influence our business, by maintaining high levels of balance sheet liquidity, prudently managing our interest rate exposures and by actively monitoring asset quality, we seek to minimize the potentially adverse risks of unforeseen and unfavorable economic trends and take advantage of favorable economic conditions and opportunities when appropriate. As economic conditions improve, we believe we are well positioned to resume favorable organic growth in loans and deposits and achieve acceptable profitability levels without the benefit of acquisition gains.
22
EARNINGS SUMMARY
BancShares reported earnings for
2012
of
$134.3 million
, or
$13.11
per share, compared to
$195.0 million
, or
$18.80
per share during
2011
. Net income as a percentage of average assets equaled
0.64 percent
during
2012
, compared to
0.92 percent
during
2011
. The return on average equity was
7.01 percent
for
2012
, compared to
10.77 percent
for
2011
. The
$60.7 million
,
or
31.1 percent
, decrease in
2012
net income was primarily due to the 2011 acquisition gains that had an after-tax impact of $91.5 million or $8.79 per share. No acquisition gains were recorded in
2012
. The absence of acquisition gains in
2012
was partially offset by a reduction in the provision for loan and lease losses on covered loans, lower noninterest expense and higher net interest income.
Net interest income during
2012
increased
$43.7 million
, or
5.0
percent, versus
2011
. The taxable-equivalent net yield on interest-earning assets increased
19
basis points due to reduced deposit costs and an increase in average interest-earning assets,
primarily due to higher investment securities and overnight borrowings. During
2012
, acquired loan accretion income significantly impacted the taxable-equivalent net yield on interest-earning assets. Continued reduction in acquired loans over the next several years will likely cause accretion income to decline.
The provision for loan and lease losses decreased
$89.4 million
, to
$142.9 million
for
2012
, compared to
$232.3 million
for
2011
, the result of lower noncovered loan net charge-offs and reduced post-acquisition deterioration of acquired loans covered by loss share agreements. In general, the provision for loan loss entries to record or reverse post-acquisition deterioration of acquired loans are accompanied by corresponding adjustments to the receivable from the FDIC with offsets to noninterest income at the appropriate indemnification rate.
Noninterest income decreased
$275.1 million
or
59.2
percent during
2012
when compared to
2011
, resulting from both the absence of acquisition gains in 2012 and significant differences in the income statement impact of adjustments to the receivable from the FDIC. Adjustments to the receivable from the FDIC for loss share agreements resulted in a
$101.6 million
reduction in noninterest income in
2012
compared to a net reduction of
$19.3 million
in
2011
. Excluding the
$150.4 million
in 2011 acquisition gains and the adjustments to the FDIC receivable, noninterest income decreased
$42.4 million
, or
12.7 percent
during
2012
.
Noninterest expense decreased
$26.0 million
, or
3.3
percent, during
2012
when compared to
2011
due to reductions in foreclosure-related expenses, FDIC deposit insurance premiums, card loyalty program expense and external processing fees.
FDIC-ASSISTED TRANSACTIONS
Participation in FDIC-assisted transactions provided significant growth opportunities for us during 2011, 2010 and 2009. These transactions allowed us to increase our presence in existing markets and to expand our banking presence to contiguous markets. Additionally, purchase discounts and fair value adjustments on acquired assets and assumed liabilities resulted in significant acquisition gains recorded at the time of each acquisition. All of the FDIC-assisted transactions included loss share agreements that protect us from a substantial portion of the credit and asset quality risk we would have otherwise incurred.
Acquisition accounting and issues affecting comparability of financial statements.
As estimated exposures related to the acquired assets covered by loss share agreements change based on post-acquisition events, our adherence to GAAP and accounting policy elections that we have made affect the comparability of our current results of operations to earlier periods. Several of the key issues affecting comparability are as follows:
|
•
|
When post-acquisition events suggest that the amount of cash flows we will ultimately receive for a loan covered by a loss share agreement is less than originally expected:
|
|
•
|
An allowance for loan and lease losses may be established for the post-acquisition exposure that has emerged with a corresponding charge to provision for loan and lease losses;
|
|
•
|
If the expected loss is projected to occur during the relevant loss share period, the receivable from the FDIC is adjusted to reflect the indemnified portion of the post-acquisition exposure with a corresponding increase to noninterest income;
|
|
•
|
When post-acquisition events suggest that the amount of cash flows we will ultimately receive for a loan covered under a loss share agreement is greater than originally expected:
|
23
|
•
|
Any allowance for loan and lease losses that was previously established for post-acquisition exposure is reversed with a corresponding reduction to provision for loan and lease losses; if no allowance was established in earlier periods, the amount of the improvement in the cash flow projection results in a reclassification from the nonaccretable difference created at the acquisition date to an accretable yield; the newly-identified accretable yield is accreted into income over the remaining life of the loan as an increase in interest income;
|
|
•
|
The receivable from the FDIC is adjusted immediately for reversals of previously recognized impairment and prospectively for reclassifications from nonaccretable difference to reflect the indemnified portion of the post-acquisition change in exposure; a corresponding reduction in noninterest income is also recorded immediately for reversals of previously established allowances or, for reclassifications from nonaccretable difference, over the shorter of the remaining life of the related loan or loss share agreements;
|
|
•
|
When actual payments received on loans are greater than current estimates, large nonrecurring discount accretion may be recognized during a specific period; discount accretion is recognized as an increase in interest income;
|
|
•
|
Adjustments to the receivable from the FDIC resulting from changes in estimated loan cash flows are based on the reimbursement provision of the applicable loss share agreement with the FDIC. Adjustments to the receivable from the FDIC partially offset the impact of the adjustment to the covered loan carrying value, but the rate of the change to the receivable from the FDIC relative to the change in the covered loan carrying value is not constant. The loss share agreements establish reimbursement rates for losses incurred within certain ranges. In some loss share agreements, higher loss estimates result in higher reimbursement rates, while in other loss share agreements, higher loss estimates trigger a reduction in the reimbursement rates. In addition, some of the loss share agreements include clawback provisions that require the purchaser to remit a payment to the FDIC in the event the aggregate amount of losses and expenses is less than a loss estimate established by the FDIC. The adjustments to the receivable from and payable to the FDIC based on changes in loss estimates are measured based on the actual reimbursement rates and consider the impact of changes in the projected clawback payment.
Table 3
provides details on the various reimbursement rates for each loss share agreement;
|
|
•
|
As of
December 31, 2012
, loans acquired in all
six
of the FDIC-assisted transactions are being accounted for using an acquired loan accounting system. Loans acquired in the CCB and SAB transactions have been on the acquired loan accounting system throughout 2012, loans acquired in the TVB and VB transactions were added to the acquired loan accounting system during the third quarter of 2012 and loans acquired in the First Regional and United Western transactions were added to the acquired loan accounting system during the fourth quarter of 2012. The acquired loan accounting system has a greater capacity to project future cash flows than the manual system used prior to the dates loans were converted to the acquired loan accounting system. As loans have migrated to the acquired loan accounting system, the balance of loans accounted for under the cost recovery method decreased significantly, which resulted in a large increase in accretable yield. Some of the newly-identified accretable yield has been reclassified from non-accretable difference, but much of the increase results from cash flows that were not previously projected and from revisions of prior projections.
|
24
Table 2
FDIC-ASSISTED TRANSACTIONS
|
|
|
Fair value of
|
|||||||||||||||||||
|
Entity
|
Date of transaction
|
Loans acquired
|
Deposits
assumed
|
Short-term
borrowings
assumed
|
Long-term
obligations
assumed
|
Gains on acquisition
|
|||||||||||||||
|
|
|
(thousands)
|
|||||||||||||||||||
|
Colorado Capital Bank (CCB)
|
July 8, 2011
|
$
|
320,789
|
|
$
|
606,501
|
|
$
|
15,212
|
|
$
|
—
|
|
$
|
86,943
|
|
|||||
|
United Western Bank (United Western)
|
January 21, 2011
|
759,351
|
|
1,604,858
|
|
336,853
|
|
207,627
|
|
63,474
|
|
||||||||||
|
Sun American Bank (SAB)
|
March 5, 2010
|
290,891
|
|
420,012
|
|
42,533
|
|
40,082
|
|
27,777
|
|
||||||||||
|
First Regional Bank (First Regional)
|
January 29, 2010
|
1,260,249
|
|
1,287,719
|
|
361,876
|
|
—
|
|
107,738
|
|
||||||||||
|
Venture Bank (VB)
|
September 11, 2009
|
456,995
|
|
709,091
|
|
—
|
|
55,618
|
|
48,000
|
|
||||||||||
|
Temecula Valley Bank (TVB)
|
July 17, 2009
|
855,583
|
|
965,431
|
|
79,096
|
|
—
|
|
56,400
|
|
||||||||||
|
Total
|
$
|
3,943,858
|
|
$
|
5,593,612
|
|
$
|
835,570
|
|
$
|
303,327
|
|
$
|
390,332
|
|
||||||
Balance sheet impact.
Table 2
provides information regarding the
six
FDIC-assisted transactions consummated during 2011, 2010 and 2009.
GAAP permits acquired loans to be accounted for in designated pools based on common risk characteristics. When loans are pooled, improvements in some loans within a pool may offset deterioration in other loans within the same pool resulting in less volatility in net interest income and provision for loan and lease losses. All CCB loans and United Western's residential mortgage loans were assigned to pools based on various factors including loan type, collateral type and performance status. All other acquired loans are being accounted for on an individual loan level. The non-pool election for the majority of our acquired loans accentuates volatility in net interest income and the provision for loan and lease losses.
Income statement impact
. The
six
FDIC-assisted transactions created acquisition gains recognized at the time of the respective transaction. For the years ended December 31, 2011, and 2010, acquisition gains totaled
$150.4 million
, and
$136.0 million
, respectively. No acquisition gains were recorded during 2012. Additionally, the acquired loans, assumed deposits and assumed borrowings originated by the
six
banks have affected net interest income, provision for loan and lease losses and noninterest income. Increases in noninterest expense have resulted from incremental staffing, facility costs for the branch locations, collection expenses and foreclosure-related expenses resulting from the FDIC-assisted transactions. Various fair value discounts and premiums that were previously recorded are being accreted and amortized into income over the life of the underlying asset or liability.
Post-acquisition changes that affect the amount of expected cash flows can result in recognition of provision for loan and lease losses or the reversal of previously-recognized provision for loan and lease losses. During the years ended
December 31, 2012, and 2011
, total provision for loan and lease losses related to acquired loans equaled
$100.8 million
and
$174.5 million
, respectively. The decreases in the provision for covered loan losses in 2012 are the result of lower charge-offs, improved cash flow projections and lower post-acquisition deterioration on acquired loans. Provision for loan and lease losses related to acquired loans equaled
$86.9 million
in 2010.
Accretion income is generated by recognizing accretable yield over the life of acquired loans. At acquisition date, accretable yield is the difference in the expected cash flows and the present value of those expected cash flows. The amount of accretable yield related to the loans can change if the estimated cash flows expected to be collected changes subsequent to the initial estimates. While changes in accretable yield generally result from changes identified in credit reviews, more precise cash flow estimates and discount accretion resulting from the deployment of loans acquired from TVB, VB, First Regional and United Western to the acquired loan accounting system during 2012 resulted in a large reduction in loans previously accounted for under the cost recovery method since those loans are now accreting yield. The recognition of accretion income can be accelerated in the event of unscheduled repayments for amounts in excess of current estimates and various other post-acquisition events. Due to the many factors that can influence the amount of accretion income recognized in a given period, this component of net interest income is not easily predictable for future periods and impacts the comparability of interest income, net interest income and overall results of operations. During the years ended
December 31, 2012, and 2011
, total discount accretion on acquired loans equaled
$304.0 million
and
$319.4 million
, respectively. Accretion income recognized during 2010 totaled
$181.4 million
.
25
Post-acquisition improvements that affect accretion income as well as post-acquisition deterioration of covered loans also result in adjustments to the receivable from the FDIC for changes in the estimated amount that would be covered under the respective loss share agreement. While accretion income is recognized prospectively over the remaining life of the loan, the adjustment to the receivable from the FDIC is recognized over the shorter of the remaining life of the loan or the remaining term of the applicable loss share agreement. As a result, the recognition of accretion income may occur over a longer period than the related income statement impact of the adjustment to the receivable from the FDIC. During the year ended
December 31, 2012
, the adjustment to the receivable from the FDIC resulting from post-acquisition improvements in covered assets exceeded the amount of the adjustment for post-acquisition deterioration, resulting in a net reduction to the receivable from the FDIC and a net charge of
$101.6 million
to noninterest income compared to a net reduction to the receivable and a corresponding reduction of
$19.3 million
in noninterest income during
2011
. The change during 2012 primarily reflects favorable changes in loss estimates when compared to 2011.
Certain loss share agreements require that we make a payment to the FDIC in the event the aggregate amount of losses and expenses incurred fall below a certain amount. As of
December 31, 2012
, based on our current estimate of losses and expenses, we estimate that we will be required to pay the FDIC a total of
$101.6 million
.
The various terms of each loss share agreement and the components of the resulting receivable from the FDIC is provided in
Table 3
. The table includes the estimated fair value of the receivable at the respective acquisition dates of each FDIC-assisted transaction as well as the carrying value of the receivable at
December 31, 2012
. Additionally, the portion of the carrying value of the receivable that relates to accretable yield from improvements in acquired loan cash flows subsequent to acquisition is provided for each loss share agreement. This component of the receivable will be recognized as a reduction to noninterest income over the shorter of the remaining life of the associated loan receivable or the related loss share agreement. The carrying value as of
December 31, 2012
, excludes estimated obligations to the FDIC under any applicable clawback provisions.
As of
December 31, 2012
, the receivable from the FDIC includes
$100.2 million
of estimated reimbursements from the FDIC. The receivable from the FDIC also includes
$170.0 million
that we expect to recover through prospective amortization of the asset arising from improvements in the related loans. The timing of expected losses on covered assets is monitored by
management to ensure the losses will occur during the respective loss share terms. When projected losses are expected to occur after expiration of the applicable loss share agreement, the receivable from the FDIC is adjusted to reflect the forfeiture of loss share protection.
26
Table 3
LOSS SHARE PROVISIONS FOR FDIC-ASSISTED TRANSACTIONS
|
Losses/expenses incurred through 12/31/2012
|
Cumulative amount reimbursed by FDIC through 12/31/2012
|
Carrying value at December 31, 2012
|
Current portion of receivable due from FDIC for 12/31/2012 filings
|
Receivable related to accretable yield as of 12/31/2012
|
||||||||||||||||||
|
Fair value at acquisition date
|
Receivable from FDIC
|
Payable to FDIC
|
||||||||||||||||||||
|
Entity
|
||||||||||||||||||||||
|
(thousands)
|
||||||||||||||||||||||
|
TVB - combined losses
|
$
|
103,558
|
|
$
|
184,037
|
|
$
|
—
|
|
$
|
41,406
|
|
$
|
—
|
|
$
|
—
|
|
$
|
30,776
|
|
|
|
VB - combined losses
|
138,963
|
|
149,074
|
|
116,287
|
|
12,754
|
|
—
|
|
2,972
|
|
7,293
|
|
||||||||
|
First Regional - combined losses
|
378,695
|
|
324,117
|
|
208,011
|
|
74,535
|
|
67,718
|
|
17,829
|
|
56,137
|
|
||||||||
|
SAB - combined losses
|
89,734
|
|
87,420
|
|
64,604
|
|
37,435
|
|
3,570
|
|
5,332
|
|
25,381
|
|
||||||||
|
United Western
|
||||||||||||||||||||||
|
Non-single family residential losses
|
112,672
|
|
108,990
|
|
83,236
|
|
33,941
|
|
15,568
|
|
4,199
|
|
14,290
|
|
||||||||
|
Single family residential losses
|
24,781
|
|
1,917
|
|
1,105
|
|
12,425
|
|
—
|
|
428
|
|
7,310
|
|
||||||||
|
CCB - combined losses
|
155,070
|
|
172,534
|
|
124,636
|
|
57,696
|
|
14,785
|
|
13,537
|
|
28,844
|
|
||||||||
|
Total
|
$
|
1,003,473
|
|
$
|
1,028,089
|
|
$
|
597,879
|
|
$
|
270,192
|
|
$
|
101,641
|
|
$
|
44,297
|
|
$
|
170,031
|
|
|
|
Each FDIC-assisted transaction has a separate loss share agreement for Single-Family Residential loans (SFR) and non-Single-Family Residential loans (NSFR).
|
||||||||||||||||||||||
|
For TVB, combined losses are covered at 0 percent up to $193.3 million, 80 percent for losses between $193.3 million and $464.0 million, and 95 percent for losses above $464.0 million.
|
||||||||||||||||||||||
|
For VB, combined losses are covered at 80 percent up to $235.0 million and 95 percent for losses above $235.0 million.
|
||||||||||||||||||||||
|
For FRB, combined losses are covered at 0 percent up to $41.8 million, 80 percent for losses between $41.8 million and $1.02 billion, and 95 percent for losses above $1.02 billion.
|
||||||||||||||||||||||
|
For SAB, combined losses are covered at 80 percent up to $99.0 million and 95 percent for losses above $99.0 million.
|
||||||||||||||||||||||
|
For United Western SFR loans, losses are covered at 80 percent up to $32.5 million, 0 percent between $32.5 million and $57.7 million, and 80 percent for losses above $57.7 million.
|
||||||||||||||||||||||
|
For United Western NSFR loans, losses are covered at 80 percent up to $111.5 million, 30 percent between $111.5 million and $227.0 million, and 80 percent for losses above $227.0 million.
|
||||||||||||||||||||||
|
For CCB, combined losses are covered at 80 percent up to $231.0 million, 0 percent between $231.0 million and $285.9 million, and 80 percent for losses above $285.9 million.
|
||||||||||||||||||||||
|
Fair value at acquisition date represents the initial value of the receivable, net of the payable. Receivable related to accretable yield represents balances that, due to post-acquisition credit quality improvement, will be amortized over the shorter of the covered asset's life or the term of the loss share period.
|
||||||||||||||||||||||
INTEREST-EARNING ASSETS
Interest-earning assets include loans and leases, investment securities and overnight investments, all of which reflect varying interest rates based on the risk level and repricing characteristics of the underlying asset. Riskier investments typically carry a higher interest rate but expose us to potentially higher levels of default.
We have historically focused on maintaining high asset quality, which results in a loan and lease portfolio subjected to strenuous underwriting and monitoring procedures with a concentration of owner-occupied real estate loans in the medical and
related fields. The focus on asset quality also influences the composition of our investment securities portfolio. At
December 31, 2012
, government agency securities represented
58.4 percent
of our investment securities portfolio, compared to
residential mortgage-backed securities and U. S. Treasury securities, which represented
25.4
percent and
15.8 percent
,
27
respectively, of the investment securities portfolio. The balance of the portfolio included corporate bonds, state, county and municipal securities and common stock of other financial institutions. Overnight investments are selectively made with the Federal Reserve Bank and other financial institutions that are within our risk tolerance.
During 2012, interest-earning assets averaged
$18.97 billion
, an increase of
$150.2 million
or
0.8 percent
from 2011. The increase was due to a
$482.8 million
increase in investment securities and a
$157.1 million
increase in overnight investments. Average loans declined by
$489.7 million
.
Loans and leases
Loans and leases totaled
$13.39 billion
at
December 31, 2012
, a decrease of
$558.4 million
or
4.0
percent when compared to
December 31, 2011
. Because of lower levels of noncommercial loans, total noncovered loans decreased $
5.5 million
during 2012, following a decline of $95.5 million during 2011. Loans covered under loss share agreements totaled
$1.81 billion
at
December 31, 2012
, or
13.5 percent
of total loans, compared to
$2.36 billion
at
December 31, 2011
, representing
16.9 percent
of loans outstanding.
Table 4
details the composition of loans and leases for the past five years.
Commercial mortgage loans not covered by loss share agreements totaled
$5.34 billion
at
December 31, 2012
, a
$236.8 million
or
4.6 percent
increase from
December 31, 2011
. In
2011
commercial mortgage loans increased
7.7 percent
over 2010. Noncovered commercial mortgage loans represent
46.1 percent
of total noncovered loans at
December 31, 2012
, and
44.1 percent
at
December 31, 2011
. The sustained growth reflects our continued focus on small business customers, particularly among medical-related and other professional customers. These loans are underwritten based primarily upon the cash flow from the operation of the business rather than the value of the real estate collateral.
At
December 31, 2012
, revolving mortgage loans not covered by loss share agreements totaled
$2.21 billion
or
19.1 percent
of total noncovered loans and leases, compared to
$2.30 billion
or
19.8 percent
at
December 31, 2011
. The
2012
decrease in noncovered revolving mortgage loans is a result of reduced demand among retail customers.
Commercial and industrial loans not covered by loss share agreements equaled
$1.73 billion
at
December 31, 2012
, compared to
$1.76 billion
at
December 31, 2011
, a decline of
$38.3 million
or
2.2 percent
. This decrease follows a decline of
$105.1 million
or
5.6 percent
from 2010 to
2011
. Noncovered commercial and industrial loans represent
14.9 percent
and
15.2 percent
of total noncovered loans and leases, respectively, as of
December 31, 2012
, and
2011
. While general demand for commercial and industrial lending improved during 2012, our primary lending focus remains with real estate-secured lending.
28
Table 4
LOANS AND LEASES
|
December 31
|
|||||||||||||||||||
|
|
2012
|
2011
|
2010
|
2009
|
2008
|
||||||||||||||
|
|
|
|
(thousands)
|
|
|
||||||||||||||
|
Covered loans
|
$
|
1,809,235
|
|
$
|
2,362,152
|
|
$
|
2,007,452
|
|
$
|
1,173,020
|
|
$
|
—
|
|
||||
|
Noncovered loans and leases :
|
|||||||||||||||||||
|
Commercial:
|
|||||||||||||||||||
|
Construction and land development
|
309,190
|
|
381,163
|
|
338,929
|
|
541,110
|
|
548,095
|
|
|||||||||
|
Commercial mortgage
|
5,341,839
|
|
5,104,993
|
|
4,737,862
|
|
4,552,078
|
|
4,343,809
|
|
|||||||||
|
Other commercial real estate
|
160,980
|
|
144,771
|
|
149,710
|
|
158,187
|
|
149,478
|
|
|||||||||
|
Commercial and industrial
|
1,726,126
|
|
1,764,407
|
|
1,869,490
|
|
1,832,670
|
|
1,885,358
|
|
|||||||||
|
Lease financing
|
330,679
|
|
312,869
|
|
301,289
|
|
330,713
|
|
353,933
|
|
|||||||||
|
Other
|
125,681
|
|
158,369
|
|
182,015
|
|
195,084
|
|
99,264
|
|
|||||||||
|
Total commercial loans
|
7,994,495
|
|
7,866,572
|
|
7,579,295
|
|
7,609,842
|
|
7,379,937
|
|
|||||||||
|
Noncommercial:
|
|||||||||||||||||||
|
Residential mortgage
|
822,889
|
|
784,118
|
|
878,792
|
|
864,704
|
|
894,802
|
|
|||||||||
|
Revolving mortgage
|
2,210,133
|
|
2,296,306
|
|
2,233,853
|
|
2,147,223
|
|
1,911,852
|
|
|||||||||
|
Construction and land development
|
131,992
|
|
137,271
|
|
192,954
|
|
81,244
|
|
230,220
|
|
|||||||||
|
Consumer
|
416,606
|
|
497,370
|
|
595,683
|
|
941,986
|
|
1,233,075
|
|
|||||||||
|
Total noncommercial loans
|
3,581,620
|
|
3,715,065
|
|
3,901,282
|
|
4,035,157
|
|
4,269,949
|
|
|||||||||
|
Total noncovered loans and leases
|
11,576,115
|
|
11,581,637
|
|
11,480,577
|
|
11,644,999
|
|
11,649,886
|
|
|||||||||
|
Total loans and leases
|
13,385,350
|
|
13,943,789
|
|
13,488,029
|
|
12,818,019
|
|
11,649,886
|
|
|||||||||
|
Less allowance for loan and lease losses
|
319,018
|
|
270,144
|
|
227,765
|
|
172,282
|
|
157,569
|
|
|||||||||
|
Net loans and leases
|
$
|
13,066,332
|
|
$
|
13,673,645
|
|
$
|
13,260,264
|
|
$
|
12,645,737
|
|
$
|
11,492,317
|
|
||||
|
|
December 31, 2012
|
December 31, 2011
|
|||||||||||||||||||||
|
|
Impaired
at
acquisition
date
|
All other
acquired
loans
|
Total
|
Impaired
at
acquisition
date
|
All other
acquired
loans
|
Total
|
|||||||||||||||||
|
|
(thousands)
|
||||||||||||||||||||||
|
Covered loans:
|
|||||||||||||||||||||||
|
Commercial:
|
|||||||||||||||||||||||
|
Construction and land development
|
$
|
71,225
|
|
$
|
166,681
|
|
$
|
237,906
|
|
$
|
117,603
|
|
$
|
221,270
|
|
$
|
338,873
|
|
|||||
|
Commercial mortgage
|
107,281
|
|
947,192
|
|
1,054,473
|
|
138,465
|
|
1,122,124
|
|
1,260,589
|
|
|||||||||||
|
Other commercial real estate
|
35,369
|
|
71,750
|
|
107,119
|
|
33,370
|
|
125,024
|
|
158,394
|
|
|||||||||||
|
Commercial and industrial
|
3,932
|
|
45,531
|
|
49,463
|
|
27,802
|
|
85,640
|
|
113,442
|
|
|||||||||||
|
Lease financing
|
—
|
|
—
|
|
—
|
|
—
|
|
57
|
|
57
|
|
|||||||||||
|
Other
|
—
|
|
1,074
|
|
1,074
|
|
—
|
|
1,330
|
|
1,330
|
|
|||||||||||
|
Total commercial loans
|
217,807
|
|
1,232,228
|
|
1,450,035
|
|
317,240
|
|
1,555,445
|
|
1,872,685
|
|
|||||||||||
|
Noncommercial:
|
|||||||||||||||||||||||
|
Residential mortgage
|
48,077
|
|
249,849
|
|
297,926
|
|
46,130
|
|
281,438
|
|
327,568
|
|
|||||||||||
|
Revolving mortgage
|
9,606
|
|
29,104
|
|
38,710
|
|
15,350
|
|
36,202
|
|
51,552
|
|
|||||||||||
|
Construction and land development
|
15,136
|
|
5,657
|
|
20,793
|
|
78,108
|
|
27,428
|
|
105,536
|
|
|||||||||||
|
Consumer
|
—
|
|
1,771
|
|
1,771
|
|
1,477
|
|
3,334
|
|
4,811
|
|
|||||||||||
|
Total noncommercial loans
|
72,819
|
|
286,381
|
|
359,200
|
|
141,065
|
|
348,402
|
|
489,467
|
|
|||||||||||
|
Total covered loans
|
$
|
290,626
|
|
$
|
1,518,609
|
|
$
|
1,809,235
|
|
$
|
458,305
|
|
$
|
1,903,847
|
|
$
|
2,362,152
|
|
|||||
29
Consumer loans not covered by loss share agreements amounted to
$416.6 million
at
December 31, 2012
, a decrease of
$80.8 million
, or
16.2 percent
, from the prior year. At
December 31, 2012, and 2011
, consumer loans not covered by loss share agreements represent
3.6 percent
and
4.3 percent
of total noncovered loans, respectively. This decline is the result of the general contraction in consumer borrowing in 2012 and 2011 due to recessionary economic conditions and continued run-off in our automobile sales finance portfolio.
There were
$822.9 million
of residential mortgage loans not covered by loss share agreements at
December 31, 2012
, representing 7.1 percent of total noncovered loans compared to $784.1 million at December 31, 2011, an increase of $38.8 million or 4.9 percent. This increase is indicative of the low interest rate environment and consumer refinance demand. While the majority of residential mortgage loans that we originated in 2012 and 2011 were sold to investors, other loans are retained in the loan portfolio principally due to the nonconforming characteristics of the retained loans.
Commercial construction and land development loans not covered by loss share agreements equaled
$309.2 million
at
December 31, 2012
, a decrease of
$72.0 million
, or
18.9 percent
from
December 31, 2011
. This decrease was driven by repayments and write-downs on a commercial construction and land development relationships based on updated appraisals. Our noncovered construction and land development portfolio does not include significant exposure to builders to acquire, develop or construct homes in large tracts of real estate. Rather, the commercial construction and land development portfolio is composed primarily of loans to construct commercial buildings to be occupied by the borrower. Most of the construction portfolio relates to borrowers in North Carolina and Virginia where real estate values have declined less severely than other markets in which we operate, particularly Atlanta, Georgia and Florida.
At
December 31, 2012
, there were
$1.05 billion
of commercial mortgage loans covered by loss share agreements,
58.3 percent
of the
$1.81 billion
in covered loans. This compares to $1.26 billion of covered commercial mortgage loans, representing 53.4 percent of total covered loans, at December 31, 2011. Covered residential mortgage loans totaled
$297.9 million
or 16.5 percent of total covered loans at December 31, 2012, compared to $327.6 million or 13.9 percent at December 31, 2011.
Construction and land development loans covered by loss share agreements at
December 31, 2012
, totaled
$258.7 million
or
14.3 percent
of total covered loans, a decrease of $185.7 million since December 31, 2011. The changes in covered loan balances since December 31, 2011, reflect continued reductions of outstanding loans from the FDIC-assisted transactions from foreclosure, payoffs and normal run-off.
There were no foreign loans or leases, covered or noncovered, in any period.
We expect non-acquisition loan growth to improve only slightly in 2013 due to the weak demand for loans and intense competitive pricing. Loan projections are subject to change due to further economic deterioration or improvement and other external factors.
Investment securities
Investment securities available for sale at
December 31, 2012, and 2011
totaled
$5.23 billion
and
$4.06 billion
, respectively, a
$1.17 billion
or
28.8 percent
increase. Available for sale securities are reported at their aggregate fair value and unrealized gains and losses are included as a component of other comprehensive income, net of deferred taxes.
Changes in our investment securities portfolio result from trends among loans and leases, deposits and short-term borrowings. When inflows arising from deposit and treasury services products exceed loan and lease demand, we invest excess funds in the securities portfolio. Conversely, when loan demand exceeds growth in deposits and short-term borrowings, we allow overnight investments to decline and use proceeds from maturing and called securities to fund loan demand. The increase during
2012
is the result of deposit growth occurring while loan balances declined.
Since 2009, we have invested a significant portion of our available liquidity in government agency securities, while the balance of U.S. Treasury securities has declined due to scheduled maturities. As a result of policy changes initiated during the second quarter of 2012, we modified the targeted portfolio composition, increasing the allowable portion of mortgage-backed securities, while the U.S. Treasury securities allocation declined. The residential mortgage-backed securities are primarily pass-through securities issued by the Government National Mortgage Association, Federal National Mortgage Association, and Federal Home Loan Mortgage Corporation comprised of 10-year and 15-year loans.
30
Table 5
presents detailed information relating to the investment securities portfolio.
Income on interest-earning assets.
Interest income amounted to
$1.00 billion
during
2012
, a
$10.3 million
or
1.0 percent
decrease from
2011
, compared to a
$45.8 million
or
4.7 percent
increase from
2010
to
2011
. The slight decrease in interest income during
2012
is the result of reduced yields on investment securities offset by higher balances of interest-earning assets. During
2012
, interest-earning assets averaged
$18.97 billion
, an increase of
$150.2 million
from
2011
. This increase results from higher investment security balances caused by deposit growth within our legacy branch network in excess of loan and lease demand.
Table 6
analyzes taxable-equivalent yields and rates on interest-earning assets and interest-bearing liabilities for the five years ending
December 31, 2012
. The taxable-equivalent yield on interest-earning assets was
5.31 percent
during
2012
, a
10
basis point decrease from the
5.41 percent
reported in
2011
, the result of lower average loan balances and reduced yields on investment securities. The taxable-equivalent yield on interest-earning assets equaled
5.27 percent
in
2010
with a significantly higher yield on investment securities, compared to 2011, which was more than offset by a lower loan yield due to more modest levels of accretion income on acquired loans.
The taxable-equivalent yield on the loan and lease portfolio increased from
6.91 percent
in
2011
to
7.15 percent
in
2012
. The
24
basis point yield increase was offset by a
$489.7 million
or
3.5 percent
reduction in average loans and leases resulting in a slight overall decline in loan interest income from
2011
. Loan interest income included
$304.0 million
of discount accretion during
2012
compared to
$319.4 million
during
2011
. The recognition of accretion income on acquired loans is significantly influenced by differences between initial cash flow estimates and changes to those estimates that evolve in subsequent periods. Accretion income in future periods is likely to decrease as the balance of acquired loans continues to decline. Loan interest income in
2011
increased
$53.2 million
, or
5.8 percent
, driven by a
30
basis point yield increase resulting from loan discount accretion income in
2011
, and by incremental interest from a
$184.6 million
, or
1.3 percent
increase in average loans and leases.
Interest income earned on the investment securities portfolio amounted to
$35.5 million
and
$46.0 million
during
2012
and
2011
, respectively, with a taxable-equivalent yield of
0.77 percent
and
1.12 percent
. The
$10.5 million
decrease in investment interest income during
2012
resulted from a
35
basis points decrease in the taxable-equivalent yield. While increases in average balances have partially offset the impact of lower yields, the yield reduction was primarily caused by significantly lower reinvestment rates on new securities as compared to maturing and called securities. Interest income on investment securities declined from
2010
to
2011
by
$6.4 million
due to a
36
basis point decrease in the taxable-equivalent yield. The yield reductions in
2012
and
2011
reflect the extraordinarily low interest rates on investment securities. We anticipate the yield on investment securities will remain at current low levels until the Federal Reserve begins to raise the benchmark fed funds rates, an action that would likely lead to higher asset yields.
31
Table 5
INVESTMENT SECURITIES
|
|
2012
|
2011
|
2010
|
||||||||||||||||||||||||||
|
|
Cost
|
Fair
value |
Average
maturity (yrs./mos.) |
Taxable
equivalent yield |
Cost
|
Fair
value |
Cost
|
Fair
value |
|||||||||||||||||||||
|
Investment securities available for sale:
|
(dollars in thousands)
|
||||||||||||||||||||||||||||
|
U. S. Treasury:
|
|||||||||||||||||||||||||||||
|
Within one year
|
$
|
576,101
|
|
$
|
576,393
|
|
0/11
|
|
0.39
|
%
|
$
|
811,038
|
|
$
|
811,835
|
|
$
|
1,332,798
|
|
$
|
1,336,446
|
|
|||||||
|
One to five years
|
247,140
|
|
247,239
|
|
1/9
|
|
0.27
|
|
76,003
|
|
75,984
|
|
602,868
|
|
602,954
|
|
|||||||||||||
|
Total
|
823,241
|
|
823,632
|
|
1/2
|
|
0.35
|
|
887,041
|
|
887,819
|
|
1,935,666
|
|
1,939,400
|
|
|||||||||||||
|
Government agency:
|
|||||||||||||||||||||||||||||
|
Within one year
|
1,708,572
|
|
1,709,520
|
|
0/4
|
|
0.38
|
|
2,176,527
|
|
2,176,143
|
|
1,879,988
|
|
1,869,569
|
|
|||||||||||||
|
One to five years
|
1,343,468
|
|
1,345,684
|
|
1/10
|
|
0.43
|
|
415,447
|
|
416,066
|
|
50,481
|
|
50,417
|
|
|||||||||||||
|
Total
|
3,052,040
|
|
3,055,204
|
|
1/0
|
|
0.40
|
|
2,591,974
|
|
2,592,209
|
|
1,930,469
|
|
1,919,986
|
|
|||||||||||||
|
Residential mortgage-backed securities:
|
|||||||||||||||||||||||||||||
|
Within one year
|
3,397
|
|
3,456
|
|
0/9
|
|
3.69
|
|
374
|
|
373
|
|
6
|
|
3
|
|
|||||||||||||
|
One to five years
|
732,614
|
|
736,284
|
|
3/8
|
|
1.50
|
|
56,650
|
|
56,929
|
|
10,755
|
|
11,061
|
|
|||||||||||||
|
Five to ten years
|
193,500
|
|
195,491
|
|
7/6
|
|
1.78
|
|
90,595
|
|
91,077
|
|
1,673
|
|
1,700
|
|
|||||||||||||
|
Over ten years
|
385,700
|
|
394,426
|
|
18/4
|
|
2.90
|
|
150,783
|
|
158,842
|
|
126,857
|
|
130,781
|
|
|||||||||||||
|
Total
|
1,315,211
|
|
1,329,657
|
|
8/7
|
|
1.96
|
|
298,402
|
|
307,221
|
|
139,291
|
|
143,545
|
|
|||||||||||||
|
State, county and municipal:
|
|||||||||||||||||||||||||||||
|
Within one year
|
486
|
|
490
|
|
0/3
|
|
5.19
|
|
242
|
|
244
|
|
757
|
|
757
|
|
|||||||||||||
|
One to five years
|
—
|
|
—
|
|
—
|
|
—
|
|
359
|
|
372
|
|
473
|
|
489
|
|
|||||||||||||
|
Five to ten years
|
60
|
|
60
|
|
5/11
|
|
4.75
|
|
10
|
|
10
|
|
10
|
|
10
|
|
|||||||||||||
|
Over ten years
|
—
|
|
—
|
|
—
|
|
—
|
|
415
|
|
415
|
|
—
|
|
—
|
|
|||||||||||||
|
Total
|
546
|
|
550
|
|
0/10
|
|
5.14
|
|
1,026
|
|
1,041
|
|
1,240
|
|
1,256
|
|
|||||||||||||
|
Corporate bonds:
|
|||||||||||||||||||||||||||||
|
Within one year
|
—
|
|
—
|
|
—
|
|
—
|
|
250,476
|
|
252,820
|
|
227,636
|
|
230,043
|
|
|||||||||||||
|
One to five years
|
—
|
|
—
|
|
—
|
|
—
|
|
—
|
|
—
|
|
251,524
|
|
256,615
|
|
|||||||||||||
|
Total
|
—
|
|
—
|
|
—
|
|
—
|
|
250,476
|
|
252,820
|
|
479,160
|
|
486,658
|
|
|||||||||||||
|
Other
|
|||||||||||||||||||||||||||||
|
Five to ten years
|
838
|
|
820
|
|
5/6
|
|
7.58
|
|
—
|
|
—
|
|
—
|
|
—
|
|
|||||||||||||
|
Equity securities
|
543
|
|
16,365
|
|
939
|
|
15,313
|
|
1,055
|
|
19,231
|
|
|||||||||||||||||
|
Total investment securities available for sale
|
5,192,419
|
|
5,226,228
|
|
4,029,858
|
|
4,056,423
|
|
4,486,881
|
|
4,510,076
|
|
|||||||||||||||||
|
Investment securities held to maturity:
|
|||||||||||||||||||||||||||||
|
Residential mortgage-backed securities:
|
|||||||||||||||||||||||||||||
|
One to five years
|
1,242
|
|
1,309
|
|
4/3
|
|
5.58
|
|
12
|
|
11
|
|
—
|
|
—
|
|
|||||||||||||
|
Five to ten years
|
18
|
|
11
|
|
8/10
|
|
4.55
|
|
1,699
|
|
1,820
|
|
2,404
|
|
2,570
|
|
|||||||||||||
|
Over ten years
|
82
|
|
128
|
|
16/2
|
|
7.07
|
|
111
|
|
149
|
|
128
|
|
171
|
|
|||||||||||||
|
Total
|
1,342
|
|
1,448
|
|
5/1
|
|
5.66
|
|
1,822
|
|
1,980
|
|
2,532
|
|
2,741
|
|
|||||||||||||
|
Total investment securities held to maturity
|
1,342
|
|
1,448
|
|
5/1
|
|
5.66
|
|
1,822
|
|
1,980
|
|
2,532
|
|
2,741
|
|
|||||||||||||
|
Total investment securities
|
$
|
5,193,761
|
|
$
|
5,227,676
|
|
$
|
4,031,680
|
|
$
|
4,058,403
|
|
$
|
4,489,413
|
|
$
|
4,512,817
|
|
|||||||||||
Average maturity assumes callable securities mature on their earliest call date; yields are based on amortized cost; yields related to securities that are exempt from federal and/or state income taxes are stated on a taxable-equivalent basis assuming statutory rates of
35.0 percent
for federal income taxes and
6.9 percent
for state income taxes for all periods. Corporate bonds are debt securities issued pursuant to the Temporary Liquidity Guarantee Program issued with the full faith and credit of the United States of America. Mortgage-backed securities are presented based upon weight-average maturities anticipating future prepayments.
32
Table 6
AVERAGE BALANCE SHEETS
|
|
2012
|
2011
|
|||||||||||||||||||
|
Average
Balance
|
Interest
Income/
Expense
|
Yield/
Rate
|
Average
Balance
|
Interest
Income/
Expense
|
Yield/
Rate
|
||||||||||||||||
|
(dollars in thousands, taxable equivalent)
|
|||||||||||||||||||||
|
Assets
|
|||||||||||||||||||||
|
Loans and leases
|
$
|
13,560,773
|
|
$
|
969,802
|
|
7.15
|
%
|
$
|
14,050,453
|
|
$
|
970,225
|
|
6.91
|
%
|
|||||
|
Investment securities:
|
|||||||||||||||||||||
|
U. S. Treasury
|
935,135
|
|
2,574
|
|
0.28
|
|
1,347,874
|
|
8,591
|
|
0.64
|
|
|||||||||
|
Government agency
|
2,857,714
|
|
16,339
|
|
0.57
|
|
2,084,627
|
|
20,672
|
|
0.99
|
|
|||||||||
|
Residential mortgage-backed securities
|
757,296
|
|
14,388
|
|
1.90
|
|
320,611
|
|
9,235
|
|
2.88
|
|
|||||||||
|
Corporate bonds
|
129,827
|
|
2,574
|
|
1.98
|
|
426,114
|
|
7,975
|
|
1.87
|
|
|||||||||
|
State, county and municipal
|
829
|
|
57
|
|
6.88
|
|
3,841
|
|
279
|
|
7.26
|
|
|||||||||
|
Other
|
17,758
|
|
340
|
|
1.91
|
|
32,694
|
|
548
|
|
1.68
|
|
|||||||||
|
Total investment securities
|
4,698,559
|
|
36,272
|
|
0.77
|
|
4,215,761
|
|
47,300
|
|
1.12
|
|
|||||||||
|
Overnight investments
|
715,583
|
|
1,738
|
|
0.24
|
|
558,454
|
|
1,394
|
|
0.25
|
|
|||||||||
|
Total interest-earning assets
|
18,974,915
|
|
$
|
1,007,812
|
|
5.31
|
%
|
18,824,668
|
|
$
|
1,018,919
|
|
5.41
|
%
|
|||||||
|
Cash and due from banks
|
529,224
|
|
486,812
|
|
|||||||||||||||||
|
Premises and equipment
|
876,802
|
|
846,989
|
|
|||||||||||||||||
|
Allowance for loan and lease losses
|
(272,105
|
)
|
(241,367
|
)
|
|||||||||||||||||
|
Other real estate owned
|
172,269
|
|
193,467
|
|
|||||||||||||||||
|
Receivable from FDIC for loss share agreements
|
350,933
|
|
628,132
|
|
|||||||||||||||||
|
Other assets
|
445,406
|
|
396,871
|
|
|||||||||||||||||
|
Total assets
|
$
|
21,077,444
|
|
$
|
21,135,572
|
|
|||||||||||||||
|
Liabilities and shareholders’ equity
|
|||||||||||||||||||||
|
Interest-bearing deposits:
|
|||||||||||||||||||||
|
Checking With Interest
|
$
|
2,105,587
|
|
$
|
1,334
|
|
0.06
|
%
|
$
|
1,933,723
|
|
$
|
1,679
|
|
0.09
|
%
|
|||||
|
Savings
|
874,311
|
|
445
|
|
0.05
|
|
826,881
|
|
1,118
|
|
0.14
|
|
|||||||||
|
Money market accounts
|
5,985,562
|
|
16,185
|
|
0.27
|
|
5,514,920
|
|
21,642
|
|
0.39
|
|
|||||||||
|
Time deposits
|
4,093,347
|
|
39,604
|
|
0.97
|
|
5,350,249
|
|
77,449
|
|
1.45
|
|
|||||||||
|
Total interest-bearing deposits
|
13,058,807
|
|
57,568
|
|
0.44
|
|
13,625,773
|
|
101,888
|
|
0.75
|
|
|||||||||
|
Short-term borrowings
|
664,498
|
|
5,107
|
|
0.77
|
|
652,607
|
|
5,993
|
|
0.92
|
|
|||||||||
|
Long-term obligations
|
574,721
|
|
27,473
|
|
4.78
|
|
766,509
|
|
36,311
|
|
4.74
|
|
|||||||||
|
Total interest-bearing liabilities
|
14,298,026
|
|
$
|
90,148
|
|
0.63
|
%
|
15,044,889
|
|
$
|
144,192
|
|
0.96
|
%
|
|||||||
|
Demand deposits
|
4,668,310
|
|
4,150,646
|
|
|||||||||||||||||
|
Other liabilities
|
195,839
|
|
128,517
|
|
|||||||||||||||||
|
Shareholders’ equity
|
1,915,269
|
|
1,811,520
|
|
|||||||||||||||||
|
Total liabilities and shareholders’ equity
|
$
|
21,077,444
|
|
$
|
21,135,572
|
|
|||||||||||||||
|
Interest rate spread
|
4.68
|
%
|
4.45
|
%
|
|||||||||||||||||
|
Net interest income and net yield on interest-earning assets
|
$
|
917,664
|
|
4.84
|
%
|
$
|
874,727
|
|
4.65
|
%
|
|||||||||||
Loans and leases include loans covered by loss share agreements, loans not covered by loss share agreements, nonaccrual loans and loans held for sale. Yields related to loans, leases and securities exempt from both federal and state income taxes, federal income taxes only, or state income taxes only, are stated on a taxable-equivalent basis assuming a statutory federal income tax rate of
35.0 percent
and a state income tax rate of
6.9 percent
for all periods. Accretion of net deferred loan fees, which are not material for any period shown, are included in the yield calculation.
33
Table 6
AVERAGE BALANCE SHEETS
(continued)
|
2010
|
2009
|
2008
|
|||||||||||||||||||||||||||||
|
Average
Balance
|
Interest
Income/
Expense
|
Yield/
Rate
|
Average
Balance
|
Interest
Income/
Expense
|
Yield/
Rate
|
Average
Balance
|
Interest
Income/
Expense
|
Yield/
Rate
|
|||||||||||||||||||||||
|
(dollars in thousands, taxable equivalent)
|
|||||||||||||||||||||||||||||||
|
$
|
13,865,815
|
|
$
|
917,111
|
|
6.61
|
%
|
$
|
12,062,954
|
|
$
|
661,750
|
|
5.49
|
%
|
$
|
11,306,900
|
|
$
|
683,943
|
|
6.05
|
%
|
||||||||
|
2,073,511
|
|
25,586
|
|
1.23
|
|
2,332,228
|
|
45,231
|
|
1.94
|
|
1,676,157
|
|
56,748
|
|
3.39
|
|
||||||||||||||
|
894,695
|
|
12,852
|
|
1.44
|
|
576,423
|
|
22,767
|
|
3.95
|
|
1,318,195
|
|
65,055
|
|
4.94
|
|
||||||||||||||
|
163,009
|
|
6,544
|
|
4.01
|
|
108,228
|
|
4,812
|
|
4.45
|
|
80,697
|
|
4,311
|
|
5.34
|
|
||||||||||||||
|
487,678
|
|
8,721
|
|
1.79
|
|
342,643
|
|
6,283
|
|
1.83
|
|
—
|
|
—
|
|
—
|
|
||||||||||||||
|
1,926
|
|
120
|
|
6.23
|
|
4,693
|
|
431
|
|
9.18
|
|
4,828
|
|
322
|
|
6.67
|
|
||||||||||||||
|
20,274
|
|
227
|
|
1.12
|
|
48,405
|
|
1,085
|
|
2.24
|
|
32,840
|
|
962
|
|
2.93
|
|
||||||||||||||
|
3,641,093
|
|
54,050
|
|
1.48
|
|
3,412,620
|
|
80,609
|
|
2.36
|
|
3,112,717
|
|
127,398
|
|
4.09
|
|
||||||||||||||
|
951,252
|
|
2,346
|
|
0.25
|
|
370,940
|
|
731
|
|
0.20
|
|
450,884
|
|
8,755
|
|
1.94
|
|
||||||||||||||
|
18,458,160
|
|
$
|
973,507
|
|
5.27
|
%
|
15,846,514
|
|
$
|
743,090
|
|
4.69
|
%
|
14,870,501
|
|
$
|
820,096
|
|
5.51
|
%
|
|||||||||||
|
535,687
|
|
597,443
|
|
591,032
|
|
||||||||||||||||||||||||||
|
844,843
|
|
821,961
|
|
781,149
|
|
||||||||||||||||||||||||||
|
(189,561
|
)
|
(162,542
|
)
|
(145,523
|
)
|
||||||||||||||||||||||||||
|
160,376
|
|
78,924
|
|
14,123
|
|
||||||||||||||||||||||||||
|
630,317
|
|
90,427
|
|
—
|
|
||||||||||||||||||||||||||
|
401,358
|
|
284,757
|
|
292,435
|
|
||||||||||||||||||||||||||
|
$
|
20,841,180
|
|
$
|
17,557,484
|
|
$
|
16,403,717
|
|
|||||||||||||||||||||||
|
$
|
1,772,298
|
|
$
|
1,976
|
|
0.11
|
%
|
$
|
1,547,135
|
|
$
|
1,692
|
|
0.11
|
%
|
$
|
1,440,908
|
|
$
|
1,414
|
|
0.10
|
%
|
||||||||
|
724,219
|
|
1,280
|
|
0.18
|
|
592,610
|
|
684
|
|
0.12
|
|
545,048
|
|
1,103
|
|
0.20
|
|
||||||||||||||
|
4,827,021
|
|
27,076
|
|
0.56
|
|
3,880,703
|
|
27,078
|
|
0.70
|
|
3,187,012
|
|
59,298
|
|
1.86
|
|
||||||||||||||
|
6,443,916
|
|
118,863
|
|
1.84
|
|
5,585,200
|
|
154,305
|
|
2.76
|
|
5,402,505
|
|
201,723
|
|
3.73
|
|
||||||||||||||
|
13,767,454
|
|
149,195
|
|
1.08
|
|
11,605,648
|
|
183,759
|
|
1.58
|
|
10,575,473
|
|
263,538
|
|
2.49
|
|
||||||||||||||
|
582,654
|
|
5,189
|
|
0.89
|
|
654,347
|
|
4,882
|
|
0.75
|
|
1,129,563
|
|
17,502
|
|
1.55
|
|
||||||||||||||
|
885,145
|
|
40,741
|
|
4.60
|
|
753,242
|
|
39,003
|
|
5.18
|
|
607,463
|
|
33,905
|
|
5.58
|
|
||||||||||||||
|
15,235,253
|
|
$
|
195,125
|
|
1.28
|
%
|
13,013,237
|
|
$
|
227,644
|
|
1.75
|
%
|
12,312,499
|
|
$
|
314,945
|
|
2.56
|
%
|
|||||||||||
|
3,774,864
|
|
2,973,220
|
|
2,532,773
|
|
||||||||||||||||||||||||||
|
158,825
|
|
105,074
|
|
73,840
|
|
||||||||||||||||||||||||||
|
1,672,238
|
|
1,465,953
|
|
1,484,605
|
|
||||||||||||||||||||||||||
|
$
|
20,841,180
|
|
$
|
17,557,484
|
|
$
|
16,403,717
|
|
|||||||||||||||||||||||
|
3.99
|
%
|
2.94
|
%
|
2.95
|
%
|
||||||||||||||||||||||||||
|
$
|
778,382
|
|
4.22
|
%
|
$
|
515,446
|
|
3.25
|
%
|
$
|
505,151
|
|
3.40
|
%
|
|||||||||||||||||
34
INTEREST-BEARING LIABILITIES
Interest-bearing liabilities include interest-bearing deposits as well as short-term borrowings and long-term obligations. Deposits represent our primary funding source, although we have the ability to utilize non-deposit borrowings to stabilize our liquidity base and to fulfill commercial customer demand for treasury services. Interest-bearing liabilities totaled
$14.21 billion
as of
December 31, 2012
, down
$334.6 million
from
December 31, 2011
, due to continued customer migration of balances in interest-bearing accounts to demand deposit accounts, the 2012 redemption of trust preferred securities, the continued reductions in deposits assumed in FDIC-assisted transactions and maturities of borrowings from the FHLB.
Average interest-bearing liabilities declined
$746.9 million
or
5.0
percent from
2011
levels due to repayments of debt obligations and continued declines in deposits assumed in FDIC-assisted transactions. During
2011
, interest-bearing liabilities decreased
$190.4 million
or
1.2 percent
percent from
2010
as a result of reductions in deposits assumed in the 2009 and 2010 FDIC-assisted transactions exceeding the impact of deposits assumed in the 2011 transactions.
Deposits
At
December 31, 2012
, deposits totaled
$18.09 billion
, an increase of
$508.8 million
or
2.9 percent
from the
$17.58 billion
in deposits recorded as of
December 31, 2011
. The increase resulted from growth in legacy markets, partially offset by a reduction in assumed deposits.
Due to low interest rates during 2012, the mix of deposits continues to shift toward transaction and money market accounts. Money market accounts increased
$656.3 million
or
11.5 percent
from
December 31, 2011
to
December 31, 2012
, while demand deposits increased
$554.0 million
or
12.8 percent
. Time deposits declined
$1.05 billion
or
22.7 percent
due to run-off of balances assumed in FDIC-assisted transactions and low interest rates.
Interest-bearing deposits averaged
$13.06 billion
during
2012
, a decrease of
$567.0 million
or
4.2 percent
as balances migrated to demand deposit accounts. Average money market balances increased
$470.6 million
or
8.5 percent
while average time deposits decreased
$1.26 billion
or
23.5 percent
. During
2011
, average time deposits decreased
$1.09 billion
or
17.0 percent
compared to the previous year primarily due to run-off of deposits assumed in the 2010 FDIC-assisted transactions.
Table 7
DEPOSITS
|
December 31
|
|||||||||||
|
2012
|
2011
|
2010
|
|||||||||
|
Demand
|
$
|
4,885,700
|
|
$
|
4,331,706
|
|
$
|
3,976,366
|
|
||
|
Checking With Interest
|
2,363,317
|
|
2,103,298
|
|
1,870,636
|
|
|||||
|
Money market accounts
|
6,357,309
|
|
5,700,981
|
|
5,064,644
|
|
|||||
|
Savings
|
905,456
|
|
817,285
|
|
770,849
|
|
|||||
|
Time
|
3,574,243
|
|
4,624,004
|
|
5,952,771
|
|
|||||
|
Total deposits
|
$
|
18,086,025
|
|
$
|
17,577,274
|
|
$
|
17,635,266
|
|
||
At
December 31, 2012
, deposits include
$1.61 billion
of time deposits with balances of
$100,000
or more. Information regarding the scheduled maturity of those time deposits is detailed in
Table 8
.
Due to the presence of significant economic uncertainty and the associated potential risks to funding sources, we continue to focus on core deposit retention as a key business objective. While we believe traditional bank deposit products remain an attractive option for many customers, once economic conditions improve, our liquidity position could be adversely impacted as bank deposits are invested elsewhere. Our ability to fund future loan growth could be constrained unless we are able to generate new deposits at a reasonable cost.
35
Table 8
MATURITIES OF TIME DEPOSITS OF $100,000 OR MORE
|
|
December 31, 2012
|
||
|
|
(thousands)
|
||
|
Less than three months
|
$
|
432,034
|
|
|
Three to six months
|
262,074
|
|
|
|
Six to 12 months
|
398,691
|
|
|
|
More than 12 months
|
517,983
|
|
|
|
Total
|
$
|
1,610,782
|
|
Short-term borrowings
At
December 31, 2012
, short-term borrowings, which include term borrowings with remaining maturities of less than one year, totaled
$568.5 million
, compared to
$615.2 million
one year earlier, a
7.6 percent
decrease. The
$46.7 million
decrease is a result of reductions in repurchase obligations and FHLB borrowings.
Table 9
SHORT-TERM BORROWINGS
|
|
2012
|
2011
|
2010
|
|||||||||||||||||
|
|
Amount
|
Rate
|
Amount
|
Rate
|
Amount
|
Rate
|
||||||||||||||
|
|
(dollars in thousands)
|
|||||||||||||||||||
|
Master notes
|
||||||||||||||||||||
|
At December 31
|
$
|
399,047
|
|
0.47
|
%
|
$
|
375,396
|
|
0.55
|
%
|
$
|
371,350
|
|
0.55
|
%
|
|||||
|
Average during year
|
450,269
|
|
0.46
|
|
383,038
|
|
0.54
|
|
401,115
|
|
0.54
|
|
||||||||
|
Maximum month-end balance during year
|
477,997
|
|
392,648
|
|
409,924
|
|
||||||||||||||
|
Repurchase agreements
|
||||||||||||||||||||
|
At December 31
|
111,907
|
|
0.29
|
|
172,275
|
|
0.40
|
|
78,274
|
|
0.33
|
|
||||||||
|
Average during year
|
143,140
|
|
0.35
|
|
177,983
|
|
0.48
|
|
87,167
|
|
0.28
|
|
||||||||
|
Maximum month-end balance during year
|
171,967
|
|
205,992
|
|
93,504
|
|
||||||||||||||
|
Federal funds purchased
|
||||||||||||||||||||
|
At December 31
|
2,551
|
|
0.25
|
|
2,551
|
|
0.25
|
|
2,551
|
|
0.19
|
|
||||||||
|
Average during year
|
2,551
|
|
0.13
|
|
2,551
|
|
0.11
|
|
4,982
|
|
0.22
|
|
||||||||
|
Maximum month-end balance during year
|
2,551
|
|
2,551
|
|
18,351
|
|
||||||||||||||
|
Notes payable to Federal Home Loan Banks
|
||||||||||||||||||||
|
At December 31
|
55,000
|
|
3.33
|
|
65,000
|
|
4.79
|
|
82,000
|
|
4.61
|
|
||||||||
|
Average during year
|
68,538
|
|
3.69
|
|
74,356
|
|
4.10
|
|
74,148
|
|
3.70
|
|
||||||||
|
Maximum month-end balance during year
|
95,000
|
|
82,000
|
|
137,000
|
|
||||||||||||||
|
Other
|
||||||||||||||||||||
|
At December 31
|
—
|
|
—
|
|
—
|
|
—
|
|
12,422
|
|
—
|
|
||||||||
|
Average during year
|
—
|
|
—
|
|
14,530
|
|
—
|
|
15,242
|
|
—
|
|
||||||||
|
Maximum month-end balance during year
|
—
|
|
20,005
|
|
20,241
|
|
||||||||||||||
36
Long-term obligations
At
December 31, 2012, and 2011
, long-term obligations totaled
$444.9 million
and
$687.6 million
, respectively, a decrease of
$242.7 million
or
35.3 percent
. The decrease resulted from the early redemption of trust preferred securities and maturities of FHLB obligations.
At
December 31, 2012
, long-term obligations included
$96.4 million
in junior subordinated debentures representing obligations to FCB/NC Capital Trust III, a special purpose entity and the grantor trust for $93.5 million of trust preferred securities. FCB/NC Capital Trust III's trust preferred securities mature in 2036 and may be redeemed at par in whole or in part on or after June 30, 2011. BancShares has guaranteed all obligations of FCB/NC Capital III. The proceeds from the trust preferred securities were used to purchase the junior subordinated debentures issued by BancShares.
At December 31, 2011, long-term obligations included
$251.0 million
in junior subordinated debentures representing obligations to two special purpose entities, FCB/NC Capital Trust I and FCB/NC Capital Trust III (the Capital Trusts). The Capital Trusts were the grantor trusts for $243.5 million of trust preferred securities outstanding as of December 31, 2011. The proceeds from the trust preferred securities were used to purchase the junior subordinated debentures issued by BancShares. The $150.0 million in trust preferred securities issued by FCB/NC Capital Trust I had a scheduled maturity in 2028 but were redeemed in whole in July 2012. During December 2011, BancShares purchased $21.5 million of the trust preferred securities previously issued by FCB/NC Capital Trust III. BancShares has guaranteed all obligations of the Capital Trusts.
The Dodd-Frank Act contains provisions that, over a three-year period, will eliminate our ability to include the trust preferred securities in tier 1 capital. As of January 1, 2013, one-third of the outstanding trust preferred securities no longer qualify as tier 1 capital. All trust preferred securities will be excluded from tier 1 capital effective January 1, 2015. The inability to include the securities in tier 1 capital was the primary factor that resulted in our decision to redeem the trust preferred securities issued by FCB/NC Capital Trust I and could lead us to redeem securities issued by FCB/NC Capital Trust III prior to the scheduled maturity date.
Expense of interest-bearing liabilities
Interest expense amounted to
$90.1 million
in
2012
, a
$54.0 million
or
37.5 percent
decrease from
2011
. This followed a
$50.9 million
or
26.1 percent
decrease in interest expense during
2011
compared to
2010
. For
2012
, the decrease in interest expense was the result of lower interest rates, the reduction in average time deposits, and a decline in long-term obligations caused by the early redemption of trust preferred securities and maturities of FHLB obligations. For
2011
, the decrease in interest expense was caused by lower interest rates and a modest decrease in average interest-bearing liabilities. The blended rate on total interest-bearing liabilities equaled
0.63 percent
during
2012
, compared to
0.96 percent
in
2011
and
1.28 percent
in
2010
.
Interest expense on interest-bearing deposits equaled
$57.6 million
during
2012
, down
$44.3 million
or
43.5 percent
from
2011
. The 2012 reduction is the result of lower interest rates and a reduction in time deposits, reflecting a customer preference for non-time deposits. Lower market interest rates caused the aggregate rate on interest-bearing deposits to decline to
0.44 percent
during
2012
, down
31
basis points from
2011
.
Interest expense on long-term obligations decreased
$8.8 million
or
24.3 percent
during
2012
due to the early redemption of the trust preferred securities and maturities of FHLB obligations. The rate paid on average long-term obligations increased
4
basis points from
4.74 percent
in
2011
to
4.78 percent
in
2012
.
NET INTEREST INCOME
Net interest income amounted to
$914.7 million
during
2012
, a
$43.7 million
or
5.0 percent
increase over
2011
. The taxable-equivalent net yield on interest-earning assets equaled
4.84 percent
for
2012
, up
19
basis points from the
4.65 percent
for
2011
. The increase in net interest income is the result of reduced deposit costs and an increase in average interest-earning assets.
Net interest income for
2012
and
2011
included
$304.0 million
and
$319.4 million
, respectively, of accretion income on acquired loans. The continuing accretion of fair value discounts resulting from acquired loans will contribute to volatility in net interest income in future periods. Factors affecting the amount of accretion include unscheduled loan payments, changes in estimated cash flows and impairment. During
2012
, as a result of the deployment of TVB, VB, First Regional and United Western loans to the acquired loan accounting system, many of the loans previously accounted for under the cost recovery method are now accreting yield. Fair value discounts related to non-pooled loans that have been repaid unexpectedly will be accreted into interest income at the time the loan obligation is satisfied.
37
Table 10
isolates the changes in taxable-equivalent net interest income due to changes in volume and interest rates for
2012
and
2011
.
Table 10
CHANGES IN CONSOLIDATED TAXABLE EQUIVALENT NET INTEREST INCOME
|
|
2012
|
2011
|
|||||||||||||||||||||
|
|
Change from previous year
due to: |
Change from previous year
due to: |
|||||||||||||||||||||
|
|
Volume
|
Yield/
Rate |
Total
Change |
Volume
|
Yield/
Rate |
Total
Change |
|||||||||||||||||
|
|
(thousands)
|
||||||||||||||||||||||
|
Assets
|
|||||||||||||||||||||||
|
Loans and leases
|
$
|
(33,990
|
)
|
$
|
33,567
|
|
$
|
(423
|
)
|
$
|
11,860
|
|
$
|
41,254
|
|
$
|
53,114
|
|
|||||
|
Investment securities:
|
|||||||||||||||||||||||
|
U. S. Treasury
|
(1,903
|
)
|
(4,114
|
)
|
(6,017
|
)
|
(6,844
|
)
|
(10,151
|
)
|
(16,995
|
)
|
|||||||||||
|
Government agency
|
6,038
|
|
(10,371
|
)
|
(4,333
|
)
|
14,490
|
|
(6,670
|
)
|
7,820
|
|
|||||||||||
|
Residential mortgage-backed securities
|
6,239
|
|
174
|
|
6,413
|
|
5,426
|
|
(2,735
|
)
|
2,691
|
|
|||||||||||
|
Corporate bonds
|
(4,635
|
)
|
(2,026
|
)
|
(6,661
|
)
|
(1,120
|
)
|
374
|
|
(746
|
)
|
|||||||||||
|
State, county and municipal
|
(213
|
)
|
(9
|
)
|
(222
|
)
|
129
|
|
30
|
|
159
|
|
|||||||||||
|
Other
|
(267
|
)
|
59
|
|
(208
|
)
|
172
|
|
149
|
|
321
|
|
|||||||||||
|
Total investment securities
|
5,259
|
|
(16,287
|
)
|
(11,028
|
)
|
12,253
|
|
(19,003
|
)
|
(6,750
|
)
|
|||||||||||
|
Overnight investments
|
396
|
|
(52
|
)
|
344
|
|
(967
|
)
|
15
|
|
(952
|
)
|
|||||||||||
|
Total interest-earning assets
|
$
|
(28,335
|
)
|
$
|
17,228
|
|
$
|
(11,107
|
)
|
$
|
23,146
|
|
$
|
22,266
|
|
$
|
45,412
|
|
|||||
|
Liabilities
|
|||||||||||||||||||||||
|
Interest-bearing deposits:
|
|||||||||||||||||||||||
|
Checking With Interest
|
$
|
195
|
|
$
|
(540
|
)
|
$
|
(345
|
)
|
$
|
160
|
|
$
|
(457
|
)
|
$
|
(297
|
)
|
|||||
|
Savings
|
69
|
|
(742
|
)
|
(673
|
)
|
160
|
|
(322
|
)
|
(162
|
)
|
|||||||||||
|
Money market accounts
|
1,498
|
|
(6,955
|
)
|
(5,457
|
)
|
3,279
|
|
(8,713
|
)
|
(5,434
|
)
|
|||||||||||
|
Time deposits
|
(15,194
|
)
|
(22,651
|
)
|
(37,845
|
)
|
(18,002
|
)
|
(23,412
|
)
|
(41,414
|
)
|
|||||||||||
|
Total interest-bearing deposits
|
(13,432
|
)
|
(30,888
|
)
|
(44,320
|
)
|
(14,403
|
)
|
(32,904
|
)
|
(47,307
|
)
|
|||||||||||
|
Short-term borrowings
|
101
|
|
(987
|
)
|
(886
|
)
|
632
|
|
172
|
|
804
|
|
|||||||||||
|
Long-term obligations
|
(9,118
|
)
|
280
|
|
(8,838
|
)
|
(5,564
|
)
|
1,134
|
|
(4,430
|
)
|
|||||||||||
|
Total interest-bearing liabilities
|
$
|
(22,449
|
)
|
$
|
(31,595
|
)
|
$
|
(54,044
|
)
|
$
|
(19,335
|
)
|
$
|
(31,598
|
)
|
$
|
(50,933
|
)
|
|||||
|
Change in net interest income
|
$
|
(5,886
|
)
|
$
|
48,823
|
|
$
|
42,937
|
|
$
|
42,481
|
|
$
|
53,864
|
|
$
|
96,345
|
|
|||||
Changes in income relating to certain loans, leases and investment securities are stated on a fully tax-equivalent basis at a rate that approximates BancShares’ marginal tax rate. The taxable equivalent adjustment was
$2,976
,
$3,760
and
$4,139
for the years
2012
,
2011
and
2010
, respectively.
Table 6
provides detailed information on average balances, income/expense, yield/rate by category and the relevant income tax rates. The rate/volume variance is allocated equally between the changes in volume and rate.
NONINTEREST INCOME
Noninterest income is an essential component of our total revenue and is critical to our ability to sustain adequate profitability levels. The primary sources of noninterest income have traditionally consisted of cardholder and merchant services income, service charges on deposit accounts and revenues derived from wealth management services. During
2012
and
2011
, noninterest income has been significantly influenced by gains and post-acquisition adjustments to the receivable from the FDIC resulting from the FDIC-assisted transactions. Noninterest income for 2011 included acquisition gains of
$150.4 million
for the United Western and CCB transactions. No acquisition gains were recorded during 2012.
Noninterest income totaled
$189.3 million
during
2012
, a decrease of
$275.1 million
or
59.2 percent
from
2011
, due primarily to the 2011 acquisition gains and an
$82.3 million
increase in the net charge to noninterest income for adjustments to the FDIC receivable. A significant portion of the higher charges for adjustments to the FDIC receivable in 2012 is attributable to increased amortization of the FDIC receivable as the expiration of the loss share agreements approaches. Adjustments to the FDIC receivable that result from post-acquisition deterioration or accretion of yield that was not initially identified are offset by a corresponding entry to noninterest income. The FDIC receivable adjustment related to credit quality deterioration is recorded
38
immediately, while the FDIC receivable adjustment related to credit quality improvement is recorded prospectively over the shorter of the remaining life of the loss share agreement or the remaining life of the covered asset. Excluding both the acquisition gains and the impact of the adjustments to the FDIC receivable, noninterest income decreased
$42.4 million
, or
12.7 percent
during
2012
.
Noninterest income during
2011
equaled
$464.4 million
, a
$58.2 million
, or
14.3 percent
increase over
2010
due primarily to acquisition gains, reduced adjustments to the FDIC receivable and a gain recorded on the redemption of the trust preferred securities.
Table 11
presents the major components of noninterest income for the past five years.
Table 11
NONINTEREST INCOME
|
|
Year ended December 31
|
||||||||||||||||||
|
|
2012
|
2011
|
2010
|
2009
|
2008
|
||||||||||||||
|
|
(thousands)
|
||||||||||||||||||
|
Gains on acquisitions
|
$
|
—
|
|
$
|
150,417
|
|
$
|
136,000
|
|
$
|
104,434
|
|
$
|
—
|
|
||||
|
Cardholder and merchant services
|
95,472
|
|
110,822
|
|
107,575
|
|
95,376
|
|
97,577
|
|
|||||||||
|
Service charges on deposit accounts
|
61,564
|
|
63,775
|
|
73,762
|
|
78,028
|
|
82,349
|
|
|||||||||
|
Wealth management services
|
57,236
|
|
54,974
|
|
51,378
|
|
46,071
|
|
48,198
|
|
|||||||||
|
Fees from processing services
|
34,816
|
|
30,487
|
|
29,097
|
|
30,904
|
|
29,607
|
|
|||||||||
|
Mortgage income
|
11,268
|
|
12,214
|
|
9,699
|
|
10,435
|
|
6,564
|
|
|||||||||
|
Insurance commissions
|
9,974
|
|
9,165
|
|
8,650
|
|
8,129
|
|
8,277
|
|
|||||||||
|
ATM income
|
5,279
|
|
6,020
|
|
6,656
|
|
6,856
|
|
7,003
|
|
|||||||||
|
Other service charges and fees
|
14,239
|
|
22,647
|
|
20,820
|
|
16,411
|
|
17,598
|
|
|||||||||
|
Securities gains (losses)
|
2,277
|
|
(288
|
)
|
1,952
|
|
(511
|
)
|
8,128
|
|
|||||||||
|
Adjustments to FDIC receivable for loss share agreements
|
(101,594
|
)
|
(19,305
|
)
|
(46,806
|
)
|
2,800
|
|
—
|
|
|||||||||
|
Other
|
(1,231
|
)
|
23,438
|
|
7,431
|
|
4,518
|
|
2,205
|
|
|||||||||
|
Total noninterest income
|
$
|
189,300
|
|
$
|
464,366
|
|
$
|
406,214
|
|
$
|
403,451
|
|
$
|
307,506
|
|
||||
Cardholder and merchant services income decreased
$15.4 million
during
2012
resulting from the fourth quarter 2011 enactment of debit card interchange fee limits mandated by the Dodd-Frank Act. Income from wealth management services increased
$2.3 million
or
4.1 percent
due to increased broker-dealer revenue. Other service charges and fees decreased
$8.4 million
or
37.1 percent
during 2012, largely resulting from lower fee income.
Deposit service charges declined
$2.2 million
, or
3.5 percent
during 2012, the impact of lower fees from overdrafts. This reduction is a result of changes to the assessment methodology for overdraft service charges beginning in the third quarter of 2011, including establishing a daily maximum overdraft charge and implementing transaction amounts beneath which overdraft charges would not be assessed.
For
2012
, mortgage income equaled
$11.3 million
compared to
$12.2 million
in
2011
. The reduction in mortgage income during
2012
includes the impact of $3.6 million in reserves for estimated recourse obligations for residential mortgage loans sold to various investors in prior years.
Fees from processing services increased
$4.3 million
or
14.2 percent
during
2012
due to accrual adjustments and nonrecurring charges for special services. Although fees from processing services increased during 2012, we expect the revenues derived from this line of business to decline in 2013 due to client bank attrition and the execution in early-2013 of an agreement with a vendor to sell to them our processing business that had been running on their application. Although we will continue to provide processing services to the largest bank we have previously supported, the revenues generated by all other banks, which totaled $19.2 million during 2012, will substantially decline during 2013.
Other noninterest income decreased
$24.7 million
during
2012
, primarily due to a
$9.7 million
gain on the redemption of preferred securities recorded during 2011.
39
NONINTEREST EXPENSE
The primary components of noninterest expense are salaries and related employee benefits, occupancy costs for branch offices and support facilities, and equipment and software costs for our branch offices and our technology and operations infrastructure. Noninterest expense for
2012
amounted to
$766.9 million
, a
$26.0 million
or
3.3 percent
decrease over
2011
. Noninterest expense in 2011 was
$792.9 million
, a
$59.5 million
or
8.1 percent
increase over
2010
.
Table 12
presents the major components of noninterest expense for the past five years.
Salary expense decreased
$0.8 million
or
0.2 percent
during
2012
as savings from headcount reductions and changes in certain incentive plans offset the impact of merit and other increases. During
2011
, salary expense increased
$10.2 million
or
3.4 percent
over
2010
, due to headcount growth resulting primarily from the FDIC-assisted transactions and merit increases. Salary expense directly resulting from new branches and the retained support positions related to the FDIC-assisted transactions declined $3.0 million or 10.3 percent during
2011
. For the period of time between the consummation of the FDIC-assisted transaction and the subsequent conversion to our legacy systems, we retained associates to perform those tasks that, following the conversion, were absorbed by our legacy infrastructure. We also reduced the salary expense related to the FDIC-assisted transactions by closing 14 branches during 2011. As of December 31, 2011, all of the 2010 and 2009 FDIC-assisted transactions had been converted to our processing systems, and the two 2011 FDIC-assisted transactions had been converted to a single processing system. The conversion of the remaining processing systems to our legacy systems occurred during 2012, at which time remaining support positions were eliminated.
Employee benefit expense increased
$6.3 million
or
8.7 percent
during
2012
, the result of unfavorable pension plan assumption changes and higher 401(k) expense resulting from an increase in participants. During
2011
, employee benefit expense increased
$7.8 million
or
12.0 percent
over
2010
, the net result of higher pension expense, executive retirement benefits, employer taxes and 401(k) expense, partially offset by reduced employee health costs. Pension costs are expected to increase in 2013 due to further unfavorable assumption changes, and will remain elevated until interest rates rise which will cause an increase in the discount rate for plan liabilities.
Occupancy expense totaled
$74.8 million
during
2012
, unchanged from the prior year due primarily to a $2.6 million reduction in costs related to the branches resulting from FDIC-assisted transactions. During
2011
, occupancy expense increased
$2.1 million
or
2.8 percent
from
2010
due primarily to added expense for acquired branches.
Equipment expenses increased
$4.9 million
, or
7.0 percent
, during
2012
, following a
$3.1 million
or
4.6 percent
increase in
2011
. The increases in
2012
and
2011
were principally the result of higher hardware and software costs and technology initiatives. During the past two years, we have closely examined the state of our core technology systems and related business processes and determined that significant investments are required. The project to modernize our systems will begin in 2013 with phased implementation through 2016. Total costs are estimated at $100.0 million. As each phase of the project is completed, we anticipate that equipment expense, including depreciation expense for software and hardware investments and maintenance expense will increase.
Cardholder and merchant processing expense decreased
$3.5 million
or
7.2 percent
during
2012
due to vendor reductions connected with the Dodd-Frank imposed fee changes. Cardholder rewards programs decreased $7.5 million or 63.3 percent compared to
2011
, the result of the termination of the debit card rewards program and adjustments to estimated redemption rates for the credit card rewards program.
FDIC deposit insurance expense decreased
$5.8 million
or
35.3 percent
during
2012
, following a reduction of
$6.7 million
during
2011
. The
2012
decrease is the result of a new assessment formula adopted by the FDIC in
2011
. The new formula alters the assessment base from deposits to total assets less equity thereby placing a larger assessment burden on banks with proportionally high levels of non-deposit funding. Our assessment amount declined primarily due to our low reliance on non-deposit funding. The decrease during
2011
represents the net impact of a $7.8 million assessment recognized during 2009 and a higher level of insured deposits during
2011
.
Collection expenses increased
$2.4 million
during
2012
and
$2.8 million
during
2011
principally due to costs incurred for loans acquired in the FDIC-assisted transactions. Collection expenses include legal costs and fees paid to third parties engaged to assist in collection efforts related to covered loans and leases, and may be reimbursable under the FDIC loss share agreements. Collection expenses will likely remain high in 2013 as we continue to resolve exposures resulting from high levels of nonperforming covered assets.
40
Foreclosure-related expenses decreased
$5.5 million
or
11.9 percent
during
2012
, much of which was attributable to activity arising from the FDIC-assisted transactions. Expenses incurred in
2011
increased
$25.7 million
from
2010
. Foreclosure-related expenses include costs to maintain foreclosed property, write-downs following foreclosure, and gains or losses recognized at the time of sale. It is anticipated that foreclosure-related expenses, some of which are reimbursable under the FDIC loss share agreements, will remain elevated for 2013 as we continue to liquidate the loans acquired in the FDIC-assisted transactions.
Advertising expenses decreased $4.1 million or 51.0 percent during
2012
, and legal expenses decreased $3.8 million or 60.5 percent during
2012
, both of which are partially the result of no acquisition activity during
2012
. Processing fees paid to third parties decreased
$1.9 million
or
11.5 percent
during
2012
, the result of converting United Western and CCB to our processing systems.
Other noninterest expense decreased
$5.2 million
during 2012 due to reduced printing costs, courier agency expense, consultant services and appraisal expenses.
Table 12
NONINTEREST EXPENSE
|
|
Year ended December 31
|
||||||||||||||||||
|
|
2012
|
2011
|
2010
|
2009
|
2008
|
||||||||||||||
|
|
(thousands)
|
||||||||||||||||||
|
Salaries and wages
|
$
|
307,331
|
|
$
|
308,088
|
|
$
|
297,897
|
|
$
|
264,342
|
|
$
|
259,250
|
|
||||
|
Employee benefits
|
78,861
|
|
72,526
|
|
64,733
|
|
64,390
|
|
58,899
|
|
|||||||||
|
Occupancy expense
|
74,798
|
|
74,832
|
|
72,766
|
|
66,266
|
|
60,839
|
|
|||||||||
|
Equipment expense
|
74,822
|
|
69,951
|
|
66,894
|
|
60,310
|
|
57,715
|
|
|||||||||
|
Cardholder and merchant services expense:
|
|||||||||||||||||||
|
Cardholder and merchant processing
|
45,129
|
|
48,614
|
|
46,765
|
|
42,605
|
|
42,071
|
|
|||||||||
|
Cardholder reward programs
|
4,325
|
|
11,780
|
|
11,624
|
|
8,457
|
|
9,323
|
|
|||||||||
|
FDIC deposit insurance
|
10,656
|
|
16,459
|
|
23,167
|
|
29,344
|
|
5,126
|
|
|||||||||
|
Collection
|
25,591
|
|
23,237
|
|
20,485
|
|
2,102
|
|
63
|
|
|||||||||
|
Foreclosure-related expense
|
40,654
|
|
46,133
|
|
20,439
|
|
15,107
|
|
3,658
|
|
|||||||||
|
Processing fees paid to third parties
|
14,454
|
|
16,336
|
|
13,327
|
|
9,672
|
|
8,985
|
|
|||||||||
|
Telecommunications
|
11,131
|
|
12,131
|
|
11,328
|
|
11,314
|
|
12,061
|
|
|||||||||
|
Postage
|
6,799
|
|
7,365
|
|
6,848
|
|
6,130
|
|
6,517
|
|
|||||||||
|
Advertising
|
3,897
|
|
7,957
|
|
8,301
|
|
8,111
|
|
8,098
|
|
|||||||||
|
Legal
|
2,490
|
|
6,306
|
|
4,968
|
|
5,425
|
|
6,308
|
|
|||||||||
|
Consultant
|
3,915
|
|
3,021
|
|
2,532
|
|
2,508
|
|
2,514
|
|
|||||||||
|
Amortization of intangibles
|
3,476
|
|
4,386
|
|
6,202
|
|
1,940
|
|
2,048
|
|
|||||||||
|
Other
|
58,604
|
|
63,803
|
|
55,100
|
|
53,480
|
|
56,907
|
|
|||||||||
|
Total noninterest expense
|
$
|
766,933
|
|
$
|
792,925
|
|
$
|
733,376
|
|
$
|
651,503
|
|
$
|
600,382
|
|
||||
INCOME TAXES
During
2012
, BancShares recorded income tax expense of
$59.8 million
, compared to
$115.1 million
during
2011
and
$110.5 million
in
2010
. BancShares’ effective tax rate equaled
30.8 percent
in
2012
,
37.1 percent
in
2011
, and
36.4 percent
in
2010
. The lower effective tax rate for 2012 primarily resulted from the recognition of a $6.4 million credit to income tax expense arising from the favorable outcome of state tax audits for the period 2008-2010, net of additional federal taxes, and higher tax credits in 2012.
Income tax expense for 2010 was reduced by
$2.9 million
due to the release of ISB's state tax valuation allowance. This valuation allowance was released during 2010 following receipt of all necessary regulatory approvals, and in anticipation of the January 7, 2011, merger of FCB and ISB. The release of the valuation allowance reflected the prospective ability of FCB to utilize the benefit of ISB’s state net economic losses following the merger.
41
Table 13
ANALYSIS OF CAPITAL ADEQUACY
|
|
December 31
|
Regulatory
Minimum |
||||||||||||
|
|
2012
|
2011
|
2010
|
|||||||||||
|
|
(dollars in thousands)
|
|||||||||||||
|
First Citizens BancShares, Inc.
|
||||||||||||||
|
Tier 1 capital
|
$
|
1,949,985
|
|
$
|
2,072,610
|
|
$
|
1,935,559
|
|
|||||
|
Tier 2 capital
|
229,385
|
|
250,412
|
|
271,331
|
|
||||||||
|
Total capital
|
$
|
2,179,370
|
|
$
|
2,323,022
|
|
$
|
2,206,890
|
|
|||||
|
Risk-weighted assets
|
$
|
13,663,353
|
|
$
|
13,447,702
|
|
$
|
13,021,521
|
|
|||||
|
Risk-based capital ratios
|
||||||||||||||
|
Tier 1 capital
|
14.27
|
%
|
15.41
|
%
|
14.86
|
%
|
4.00
|
%
|
||||||
|
Total capital
|
15.95
|
%
|
17.27
|
%
|
16.95
|
%
|
8.00
|
%
|
||||||
|
Tier 1 leverage ratio
|
9.22
|
%
|
9.90
|
%
|
9.18
|
%
|
3.00
|
%
|
||||||
|
First-Citizens Bank & Trust Company
|
||||||||||||||
|
Tier 1 capital
|
$
|
1,942,101
|
|
$
|
1,968,032
|
|
$
|
1,522,931
|
|
|||||
|
Tier 2 capital
|
220,933
|
|
243,203
|
|
231,916
|
|
||||||||
|
Total capital
|
$
|
2,163,034
|
|
$
|
2,211,235
|
|
$
|
1,754,847
|
|
|||||
|
Risk-weighted assets
|
$
|
13,518,839
|
|
$
|
13,346,474
|
|
$
|
10,502,859
|
|
|||||
|
Risk-based capital ratios
|
||||||||||||||
|
Tier 1 capital
|
14.37
|
%
|
14.75
|
%
|
14.50
|
%
|
4.00
|
%
|
||||||
|
Total capital
|
16.00
|
%
|
16.57
|
%
|
16.71
|
%
|
8.00
|
%
|
||||||
|
Tier 1 leverage ratio
|
9.34
|
%
|
9.53
|
%
|
8.40
|
%
|
3.00
|
%
|
||||||
SHAREHOLDERS’ EQUITY
We are committed to effectively managing our capital to protect our depositors, creditors and shareholders. We continually monitor the capital levels and ratios for BancShares and FCB to ensure that they comfortably exceed the minimum requirements imposed by regulatory authorities and to ensure that they are appropriate, given growth projections, risk profile and potential changes in the regulatory environment. Failure to meet certain capital requirements may result in actions by regulatory agencies that could have a material impact on our consolidated financial statements.
Table 13
provides information on capital adequacy for BancShares and FCB as of
December 31, 2012, 2011, and 2010
.
BancShares continues to exceed minimum capital standards and FCB remains well-capitalized.
During 2012, BancShares purchased and retired
606,829
shares of Class B common stock in private transactions. In addition, as of July 1, 2012, our board granted authority to purchase up to
100,000
and
25,000
shares of Class A and Class B common stock, respectively, through June 30, 2013. During 2012, we purchased and retired
56,276
shares of Class A common stock and
100
shares of Class B common stock pursuant to the July 1, 2012, board authorization. As of December 31, 2012, under existing authorizations, BancShares had the ability to purchase
43,724
and
24,900
shares of Class A and Class B common stock, respectively.
BancShares purchased
112,471
shares of Class A common stock and
37,863
shares of Class B common stock in 2011. No shares were purchased in 2010. The share purchases were made pursuant to authorizations approved by the Board of Directors.
BancShares is dependent on dividends from FCB to cover its operating expenses, fund its debt obligations and pay shareholder dividends. During
2012
, FCB declared dividends to BancShares in the amount of
$179.6 million
, compared to
$82.8 million
in
2011
and
$50.4 million
in
2010
. The increase in 2012 dividends from FCB related to the redemption of the 1998 trust preferred securities. At
December 31, 2012
, based on limitations imposed by North Carolina General Statutes, FCB had the ability to declare dividends totaling
$1.38 billion
. However, any dividends declared in excess of
$809.0 million
would have caused FCB to lose its well-capitalized designation.
42
As of
December 31, 2012
, BancShares' had $93.5 million of trust preferred capital securities included in tier 1 capital compared to $243.5 million at December 31, 2011. The Dodd-Frank Act contains provisions that, beginning in January 2013, will gradually eliminate our ability to include trust preferred securities in tier 1 risk-based capital. Due to the Dodd-Frank exclusion, excessive liquidity and the high coupon rate, BancShares redeemed $150.0 million of 8.05 percent trust preferred securities issued during 1998 at a premium of $3.6 million on July 31, 2012. BancShares’ remaining $93.5 million in trust preferred capital securities that qualify as tier 1 capital as of
December 31, 2012
, will be eliminated from tier 1 capital in equal increments of $31.2 million over a three-year term, beginning in January 2013. Based on BancShares’ capital structure as of
December 31, 2012
, the impact of the reduction of $31.2 million will result in a tier 1 leverage capital ratio of
9.07 percent
, a tier 1 risk-based capital ratio of
14.04 percent
and a total risk-based capital ratio of
15.72 percent
. Elimination of the full $93.5 million of trust preferred securities from the
December 31, 2012
, capital structure would result in a proforma tier 1 leverage ratio of
8.78 percent
, a proforma tier 1 risk-based ratio of
13.59 percent
and a proforma total risk-based ratio of
15.27 percent
. BancShares would continue to remain well-capitalized under current regulatory guidelines.
Tier 2 capital of BancShares and FCB includes qualifying subordinated debt that was issued in 2005 with a scheduled maturity date of June 1, 2015. Under current regulatory guidelines, when subordinated debt is within five years of its scheduled maturity date, issuers must discount the amount included in tier 2 capital by 20 percent for each year until the debt matures. The amount of subordinated debt that qualifies as tier 2 capital totaled $50.0 million as of December 31, 2012, compared to $75.0 million at December 31, 2011. The amount of subordinated debt eligible to be included in tier 2 capital will decline $25.0 million in the second quarter of 2013 to $25.0 million and the subordinated debt will be completely removed from tier 2 capital in the second quarter of 2014. Tier 2 capital is part of total risk-based capital, reflected in
Table 13
.
In September 2010, the Basel Committee on Banking Supervision announced new global regulatory capital guidelines (Basel III) aimed at strengthening existing capital requirements for bank holding companies through a combination of higher minimum capital requirements, new capital conservation buffers and more conservative definitions of capital and exposure. Basel III would impose a new tier 1 common equity requirement of
7.00 percent
, comprised of a minimum of 4.50 percent plus a capital conservation buffer of 2.50 percent. The transition period for banks to meet the revised common equity requirement will begin in 2013 with full implementation in 2019. The committee has also stated that it may require a counter-cyclical capital buffer in addition to Basel III standards. The new rule also proposes the deduction of certain assets in measuring tier 1 capital.
In June 2012, the Federal Reserve released proposed rules regarding implementation of the Basel III regulatory capital rules for Unites States banking organizations. The proposed rules address a significant number of outstanding issues and questions regarding how certain provisions of Basel III are proposed to be adopted in the Unites States. Key provisions of the proposed rules include the total phase-out from tier 1 capital of trust preferred securities for all banks, a capital conservation buffer of 2.50 percent above minimum capital ratios, inclusion of accumulated other comprehensive income in tier 1 common equity, inclusion in tier 1 capital of perpetual preferred stock and an effective floor for tier 1 common equity of 7.00 percent. Final rules are expected to be adopted in 2013. While we have estimated the impact the proposed rules would have on our capital ratios, we are unable at this time to predict how the final rules will differ from the proposed rules and the effective date of the final rules. We will continue to monitor Basel III developments and remain committed to managing our capital levels in a prudent manner. BancShares' tier 1 common equity ratio based on the current tier 1 capital and risk-weighted assets calculations (excluding trust preferred securities) is
13.59 percent
at
December 31, 2012
, as calculated in
Table 14
compared to the fully phased-in Federal Reserve standards of
7.00 percent
.
Table 14
TIER 1 COMMON EQUITY
|
First Citizens BancShares, Inc.
|
|||
|
December 31, 2012
|
|||
|
(dollars in thousands)
|
|||
|
Tier 1 capital
|
$
|
1,949,985
|
|
|
Less: restricted core capital
|
93,500
|
|
|
|
Tier 1 common equity
|
$
|
1,856,485
|
|
|
Risk-weighted assets
|
$
|
13,663,353
|
|
|
Tier 1 common equity ratio
|
13.59
|
%
|
|
43
RISK MANAGEMENT
Effective risk management is critical to our success. The most significant risks that we confront are credit, interest-rate and liquidity risk. Credit risk is the risk of not collecting payments pursuant to the contractual terms of loan, lease and investment assets. Interest rate risk results from changes in interest rates which may impact the re-pricing of assets and liabilities in different amounts or at different dates. Liquidity risk is the risk that we will be unable to fund obligations to loan customers, depositors or other creditors. To manage these risks as well as other risks that are inherent in our operation and to provide reasonable assurance that our long-term business objectives will be attained, various policies and risk management processes identify, monitor and manage risk within appropriate ranges. Management continually refines and enhances its risk management policies and procedures to maintain effective risk management programs and processes.
In response to the requirements of the Dodd-Frank Act, federal regulators released final stress testing rules on October 9, 2012. The annual stress test is a component of a broader stress testing framework that was finalized in late-2012. Implementation of the annual stress testing requirement has been delayed until September 30, 2013 for institutions with total assets of $10.00 billion to $50.00 billion. Through the stress testing program that has been implemented, BancShares and FCB satisfactorily comply with the 2012 stress testing regulations as well as guidance for ongoing bank-level stress testing published in May 2012. The results of the stress testing activities will be considered in combination with other risk management and monitoring practices to maintain an effective risk management program.
Credit risk management
The maintenance of excellent asset quality has historically been one of our key performance measures. Loans and leases not covered by loss share agreements with the FDIC were underwritten in accordance with our credit policies and procedures and are subject to periodic ongoing reviews. Loans covered by loss share agreements with the FDIC were recorded at fair value at the date of the acquisition and are subject to periodic reviews to identify any further credit deterioration. Our independent credit review function conducts risk reviews and analyses to ensure compliance with credit policies and to monitor asset quality trends. The risk reviews include portfolio analysis by geographic location and horizontal reviews across industry, collateral type and product. We strive to identify potential problem loans as early as possible, to record charge-offs or write-downs as appropriate, and to maintain adequate allowances for loan and lease losses that are inherent in the loan and lease portfolio.
We maintain a well-diversified loan and lease portfolio and seek to minimize the risk associated with large concentrations within specific geographic areas, collateral types or industries. Despite our focus on diversification, several characteristics of our loan portfolio subject us to significant risk, such as our concentrations of real estate secured loans, revolving mortgage loans and medical-related loans.
We have historically carried a significant concentration of real estate secured loans. Within our noncovered loan portfolio, we mitigate that exposure through our underwriting policies that primarily rely on borrower cash flow rather than underlying collateral values. When we do rely on underlying real property values, we favor financing secured by owner-occupied real property and, as a result, a large percentage of our real estate loans are owner occupied. At
December 31, 2012
, loans secured by real estate not covered by loss share agreements totaled
$8.98 billion
or
77.5 percent
of total noncovered loans and leases compared to
$8.85 billion
or
76.4 percent
at
December 31, 2011
. The geographic distribution of the collateral securing these real estate loans is provided in
Table 15
. The table provides the percentage of total noncovered loan balances secured by real estate located in the referenced states. All other states individually represent less than two percent of total noncovered loans. While 53 percent of our real estate exposure is concentrated within North Carolina and Virginia, the FDIC-assisted transactions has allowed us to mitigate geographic risk exposures within those states.
44
Table 15
GEOGRAPHIC DISTRIBUTION OF REAL ESTATE COLLATERAL
|
December 31, 2012
|
||
|
Collateral state
|
Percent of total noncovered loans with collateral located in the state
|
|
|
North Carolina
|
45%
|
|
|
Virginia
|
8
|
|
|
California
|
6
|
|
|
Florida
|
3
|
|
|
Georgia
|
3
|
|
|
Tennessee
|
2
|
|
|
Texas
|
2
|
|
Among real estate secured loans, our revolving mortgage loans present a heightened risk due to a long commitment period during which the financial position of the borrower or the value of the collateral may deteriorate significantly. In addition, a large percentage of our revolving mortgage loans are secured by junior liens. A substantial decline in collateral value could cause a junior lien position to become effectively unsecured. At
December 31, 2012
, revolving mortgage loans secured by real estate amounted to
$2.25 billion
, or
16.8 percent
of noncovered loans compared to
$2.35 billion
or
16.8 percent
at
December 31, 2011
.
We have not acquired revolving mortgages in the secondary market nor have we originated these loans to customers outside of our market areas. All noncovered revolving mortgage loans were originated by us and were underwritten based on our standard lending criteria. The revolving mortgage loan portfolio consists largely of variable rate lines of credit which allow customer draws during the entire contractual period of the line of credit, typically 15 years. Approximately 85 percent of outstanding balances at
December 31, 2012
, require interest-only payments, while the remaining require monthly payments equal to 1.5 percent of the outstanding balance. Over 90 percent of the revolving mortgage portfolio relates to properties in North Carolina and Virginia. Approximately one-third of the loan balances outstanding are secured by senior collateral positions while the remaining balances are secured by junior liens.
Due to higher default risk resulting from financial strain facing our borrowers and lower collateral values, during 2012, we engaged a third party to obtain credit quality data on certain of our junior lien revolving mortgages loans. Accurate data was obtained for lien position and delinquency status for both our junior lien position and the related senior lien. While we attempted to also obtain loan to value data to provide information as to the portion of our junior liens that are effectively unsecured due to reductions in collateral value, the data was not of sufficient quality to allow for such determination to be made. The results indicate that lien positions notated in our loan systems closely matched the lien positions obtained by the third party. In addition, the data collected indicated that 97.0 percent of the sampled junior liens that are current as to payment status on the junior lien are also current on the related senior lien. Only 1.4 percent of the sampled junior liens have senior liens with a more severe delinquency status as compared to the related junior lien. Management therefore considers the credit quality and the probability of default of the senior liens to be generally consistent with our junior lien historical results. The allowance for our revolving mortgage loans is calculated using estimated loss rates with primary consideration placed on losses sustained in recent periods. When considering future losses, we apply subjective adjustments to actual prior losses if we believe we may experience different levels of losses in future periods due to the various risks applicable to revolving mortgage loans including junior lien positions, trends in real estate valuations and potentially higher interest rates.
Noncovered loans and leases to borrowers in medical, dental or related fields totaled
$3.02 billion
as of
December 31, 2012
, and
$3.07 billion
as of
December 31, 2011
, representing
26.1 percent
and
26.5 percent
of noncovered loans and leases, respectively. The credit risk from these loans is mitigated through our underwriting policies that emphasize reliance on adequate borrower cash flow rather than underlying collateral value and our preference for financing secured by owner-occupied real property. Except for this single concentration, no other industry represented more than 10 percent of total noncovered loans and leases outstanding at
December 31, 2012
.
45
In addition to geographic, product and industry concentrations, we monitor our loan and lease portfolio for other risk characteristics. Among the key indicators of credit risk are loan-to-value ratios, which measure exposure as compared to the value of the underlying collateral. Regulatory agencies have established guidelines that define high loan-to-value loans as those real estate loans that exceed 65 percent to 85 percent of the collateral value depending upon the type of collateral. At
December 31, 2012
, we had
$642.6 million
or
5.6 percent
of noncovered loans and leases that exceeded the loan-to-value ratios recommended by the guidelines compared to
$631.1 million
or
5.4 percent
at
December 31, 2011
. While we continuously strive to limit our high loan-to-value loans, we believe that the inherent risk within these loans is mitigated by our strict underwriting criteria and the high rate of owner-occupied properties.
Table 16
NONPERFORMING ASSETS
|
|
December 31
|
||||||||||||||||||
|
|
2012
|
2011
|
2010
|
2009
|
2008
|
||||||||||||||
|
|
(thousands, except ratios)
|
||||||||||||||||||
|
Nonaccrual loans and leases:
|
|||||||||||||||||||
|
Covered under loss share agreements
|
$
|
74,479
|
|
$
|
302,102
|
|
$
|
160,024
|
|
$
|
116,446
|
|
$
|
—
|
|
||||
|
Not covered under loss share agreements
|
89,845
|
|
52,741
|
|
78,814
|
|
58,417
|
|
39,361
|
|
|||||||||
|
Other real estate owned:
|
|||||||||||||||||||
|
Covered under loss share agreements
|
102,577
|
|
148,599
|
|
112,748
|
|
93,774
|
|
—
|
|
|||||||||
|
Not covered under loss share agreements
|
43,513
|
|
50,399
|
|
52,842
|
|
40,607
|
|
29,956
|
|
|||||||||
|
Total nonperforming assets
|
$
|
310,414
|
|
$
|
553,841
|
|
$
|
404,428
|
|
$
|
309,244
|
|
$
|
69,317
|
|
||||
|
Nonperforming assets covered under loss share agreements
|
$
|
177,056
|
|
$
|
450,701
|
|
$
|
272,772
|
|
$
|
210,220
|
|
$
|
—
|
|
||||
|
Nonperforming assets not covered under loss share agreements
|
133,358
|
|
103,140
|
|
131,656
|
|
99,024
|
|
69,317
|
|
|||||||||
|
Total nonperforming assets
|
$
|
310,414
|
|
$
|
553,841
|
|
$
|
404,428
|
|
$
|
309,244
|
|
$
|
69,317
|
|
||||
|
Accruing loans and leases 90 days or more past due:
|
|||||||||||||||||||
|
Covered under loss share agreements
|
$
|
281,000
|
|
$
|
292,194
|
|
$
|
302,120
|
|
$
|
—
|
|
$
|
—
|
|
||||
|
Not covered under loss share agreements
|
11,272
|
|
14,840
|
|
18,501
|
|
27,766
|
|
22,459
|
|
|||||||||
|
Loans and leases at December 31:
|
|||||||||||||||||||
|
Covered under loss share agreements
|
1,809,235
|
|
2,362,152
|
|
2,007,452
|
|
1,173,020
|
|
—
|
|
|||||||||
|
Not covered under loss share agreements
|
11,576,115
|
|
11,581,637
|
|
11,480,577
|
|
11,664,999
|
|
11,649,886
|
|
|||||||||
|
Ratio of nonperforming assets to total loans, leases and other real estate:
|
|||||||||||||||||||
|
Covered under loss share agreements
|
9.26
|
%
|
17.95
|
%
|
12.87
|
%
|
16.59
|
%
|
—
|
%
|
|||||||||
|
Not covered under loss share agreements
|
1.15
|
|
0.89
|
|
1.14
|
|
0.85
|
|
0.59
|
|
|||||||||
|
Ratio of nonperforming assets to total loans, leases and other real estate
|
2.29
|
|
3.92
|
|
2.96
|
|
2.38
|
|
0.59
|
|
|||||||||
|
Interest income that would have been earned on nonperforming loans and leases had they been performing
|
$
|
27,397
|
|
$
|
23,326
|
|
$
|
18,519
|
|
$
|
4,172
|
|
$
|
1,275
|
|
||||
|
Interest income earned on nonperforming loans and leases
|
10,374
|
|
8,589
|
|
9,922
|
|
3,746
|
|
797
|
|
|||||||||
There were no foreign loans or leases outstanding in any period. Accruing loans and leases 90 days or more past due covered by loss share agreements includes impaired loans that are being accounted for using the accretable yield method.
Nonperforming assets include nonaccrual loans and leases and OREO that are both covered and not covered by FDIC loss share agreements. With the exception of certain residential mortgage loans, the accrual of interest on noncovered loans and leases is discontinued when we deem that collection of additional principal or interest is doubtful. Noncovered loans and leases are returned to accrual status when both principal and interest are current and the asset is determined to be performing in
46
accordance with the terms of the loan instrument. The accrual of interest on certain residential mortgage loans is discontinued when a loan is more than three monthly payments past due, and resumes when the loan is less than three monthly payments past due. See
Table 16
for details on nonperforming assets and other risk elements.
Accretion of income for covered loans is discontinued when we are unable to estimate the timing of cash flows. This designation may be made at acquisition date or subsequent to acquisition date, including at maturity when no formal repayment plan has been established. Covered loans may begin or resume accretion of income if information becomes available that allows us to estimate the timing of future cash flows.
Nonperforming assets at December 31, 2012, totaled
$310.4 million
, compared to
$553.8 million
at December 31, 2011, and
$404.4 million
at December 31, 2010. As a percentage of total loans, leases and OREO, nonperforming assets represented
2.3 percent
,
3.9 percent
and
3.0 percent
as of
December 31, 2012, 2011, and 2010
, respectively.
Of the
$310.4 million
in nonperforming assets at December 31, 2012,
$177.1 million
are covered by FDIC loss share agreements while the remaining
$133.4 million
are not covered by loss share agreements. The reduction in covered nonperforming assets from previous periods was primarily caused by the 2012 deployment of the remaining unconverted covered loans to the acquired loan accounting system, which resulted in a reduction in nonaccrual loans for those loans that were previously accounted for under the cost recovery method but are now accreting yield. Nonperforming assets not covered by loss share agreements represent
1.1 percent
of noncovered loans, leases and ORE at
December 31, 2012
, compared to
0.9 percent
at
December 31, 2011
. The
$30.2 million
increase in nonperforming assets not covered by loss share agreements was primarily the result of the 2012 decision to place adequately secured collateral dependent loans that are in the process of foreclosure on nonaccrual.
Covered nonaccrual loans equaled
$74.5 million
as of
December 31, 2012
, compared to $302.1 million at
December 31, 2011
. The reduction in covered nonaccrual loans as of
December 31, 2012
, results primarily from the full deployment of acquired loan accounting system during 2012, which resulted in accretion income being recognized on loans previously classified as nonaccrual. As of June 30, 2012, covered nonaccrual loans totaled $271.4 million, and the $196.9 million reduction between June 30, 2012, and December 31, 2012, primarily relates to loans converted to the acquired loan accounting system during the third and fourth quarters of 2012 that were previously on the cost recovery method and are now on the accretion method. Noncovered nonaccrual loans totaled
$89.8 million
as of
December 31, 2012
, an increase of
$37.1 million
over
December 31, 2011
, the result of the nonaccrual policy change for collateral dependent loans in the process of foreclosure.
OREO includes foreclosed property and branch facilities that we have closed but not sold. Noncovered OREO totaled
$43.5 million
at
December 31, 2012
, compared to
$50.4 million
at
December 31, 2011
. At
December 31, 2012
, construction and land development properties including vacant land for development represented
37.0 percent
of OREO. Vacant land values have experienced an especially steep decline during the economic slowdown due to a significant drop in demand and values may continue to decline if demand remains weak.
Once acquired, net book values of OREO are reviewed at least annually to evaluate if write-downs are required. Real estate appraisals are reviewed by the appraisal review department to ensure the quality of the appraised value in the report. The level of review is dependent on the value and type of the collateral, with higher value and more complex properties receiving a more detailed review. In a market of declining property values, as we have experienced in recent years, we utilize resources in addition to appraisals to obtain the most current market value. Changes to the value of the assets between scheduled valuation dates are monitored through continued communication with brokers and monthly reviews by the asset manager assigned to each asset. The asset manager uses the information gathered from brokers and other market sources to identify any significant changes in the market or the subject property as they occur. Valuations are then adjusted or new appraisals are ordered to ensure the reported values reflect the most current information. Decisions regarding write-downs are based on factors that include appraisals, broker opinions, previous offers received on the property, market conditions and the number of days the property has been on the market.
Restructured loans (TDRs) not covered by loss share agreements that are performing under their modified terms equaled
$89.1 million
and $
123.8 million
at
December 31, 2012
, and
2011
, respectively. Total covered and noncovered TDRs as of
December 31, 2012
, were
$333.2 million
,
$253.4 million
of which are performing under their modified terms. TDRs are selectively made to provide relief to customers experiencing liquidity challenges or other circumstances that could affect their ability to meet their debt obligations. These modifications are typically executed only when customers are current on their payment obligation and we believe the modification will result in avoidance of default. Typical modifications include short-
47
term deferral of interest or modification of payment terms. Nonperforming TDRs are not accruing interest and are included as risk elements within nonaccrual loans and leases in
Table 16
.
Table 16
does not include performing TDRs, which are accruing interest based on the restructured terms.
Table 17
provides details on performing and nonperforming TDRs as of
December 31, 2012
, and
December 31, 2011
.
The allowance for loan and lease losses reflects the estimated losses resulting from the inability of our customers to make required payments. In estimating the allowance, we employ a variety of modeling and analytical tools for measuring credit risk. Generally, noncovered loans and leases to commercial customers are evaluated individually and assigned a credit grade, while noncommercial loans are evaluated collectively. The individual credit grades for commercial loans are assigned based upon factors such as the borrower’s cash flow, the value of any underlying collateral and the strength of any guarantee. Relying on historical data of credit grade losses and migration patterns among credit grades, we calculate a loss estimate for each credit grade. As loans to borrowers experiencing financial stress are moved to higher-risk credit grades, increased allowances are assigned to that exposure.
Table 17
|
December 31
|
|||||||||||||||||||
|
2012
|
2011
|
2010
|
2009
|
2008
|
|||||||||||||||
|
(dollars in thousands)
|
|||||||||||||||||||
|
Performing TDRs:
|
|||||||||||||||||||
|
Covered under loss share agreements
|
$
|
164,256
|
|
$
|
126,240
|
|
$
|
56,398
|
|
$
|
10,013
|
|
$
|
—
|
|
||||
|
Not covered under loss share agreements
|
89,133
|
|
123,796
|
|
64,995
|
|
55,025
|
|
2,349
|
|
|||||||||
|
Total performing TDRs
|
253,389
|
|
250,036
|
|
121,393
|
|
65,038
|
|
2,349
|
|
|||||||||
|
Nonperforming TDRs:
|
|||||||||||||||||||
|
Covered under loss share agreements
|
28,951
|
|
43,491
|
|
12,364
|
|
—
|
|
—
|
|
|||||||||
|
Not covered under loss share agreements
|
50,830
|
|
29,534
|
|
41,774
|
|
9,168
|
|
10,786
|
|
|||||||||
|
Total nonperforming TDRs
|
79,781
|
|
73,025
|
|
54,138
|
|
9,168
|
|
10,786
|
|
|||||||||
|
All TDRs:
|
|||||||||||||||||||
|
Covered under loss share agreements
|
193,207
|
|
169,731
|
|
68,762
|
|
10,013
|
|
—
|
|
|||||||||
|
Not covered under loss share agreements
|
139,963
|
|
153,330
|
|
106,769
|
|
64,193
|
|
13,135
|
|
|||||||||
|
Total TDRs
|
$
|
333,170
|
|
$
|
323,061
|
|
$
|
175,531
|
|
$
|
74,206
|
|
$
|
13,135
|
|
||||
Acquired loans are recorded at fair value as of the loan's acquisition date, and allowances are recorded for post-acquisition credit quality deterioration. Subsequent to the acquisition date, recurring analyses are performed on the credit quality of acquired loans to determine if expected cash flows have changed. Various criteria are used to select loans to be evaluated including change in accrual status, recent credit grade change, updated collateral appraisal and newly-developed workout plan. Based upon the results of the individual loan reviews, revised impairment amounts are calculated which generally result in additional allowance for loan losses or reversal of previously established allowances.
Groups of noncovered noncommercial loans are aggregated by type and probable loss estimates become the basis for the allowance amount. The loss estimates are based on trends of historical losses, delinquency patterns and various other credit risk indicators. During 2012, charge-offs for all types of noncommercial loans declined from 2011. Based upon the generally favorable trends in economic conditions and reduced loss experience, we reduced the loss estimates used to establish the allowance for noncommercial loans.
48
We also establish specific allowances for certain noncovered impaired loans. The loans individually evaluated for impairment include loans graded substandard or worse that are greater than or equal to $500,000 and loans classified as TDR's that are greater than or equal to $100,000. The analysis is performed at the individual loan level, and a decision tree is used to determine whether collateral value or discounted cash flows will be used to calculate the impairment amount.
The noncovered allowance for loan and lease losses also includes a nonspecific component for risks beyond those factors specific to a particular loan, group of loans, or identified by the commercial loan credit grade migration analysis. This nonspecific allowance is based upon factors such as trends in economic conditions in the markets in which we operate, conditions in specific industries where we have large exposures, changes in the size and mix of the overall loan portfolio, the growth in the overall loan portfolio and other judgmental factors. As of
December 31, 2012
, the nonspecific portion of the allowance equaled
$15.9 million
or
5.0 percent
of the total allowance. This compares to
$14.1 million
or
5.2 percent
of the total allowance for loan and lease losses as of
December 31, 2011
.
At
December 31, 2012
, the allowance for loan and lease losses allocated to noncovered loans totaled
$179.0 million
or
1.55 percent
of noncovered loans and leases, compared to
$180.9 million
or
1.56 percent
at
December 31, 2011
. The
$1.8 million
decrease was primarily due to a decrease in average noncovered loans during 2012. The allowance for loans individually evaluated for impairment increased
$10.4 million
since
December 31, 2011
,
due to a lower threshold used to identify impaired loans and reductions in collateral values on certain loans. The allowance for loans collectively evaluated for impairment has decreased
$14.0 million
due to a significantly larger portion of the loan portfolio evaluated for individual impairment.
An additional allowance of
$140.0 million
relates to covered loans at
December 31, 2012
, established as a result of post-acquisition deterioration in credit quality for covered loans. The allowance for covered loans equaled
$89.3 million
at
December 31, 2011
, the increase due to allowances required for deterioration in acquired loans.
Management considers the allowance adequate to absorb estimated probable losses that relate to loans and leases outstanding at
December 31, 2012
, although future additions may be necessary based on changes in economic conditions and other factors. In addition, various regulatory agencies, as an integral part of their examination process, periodically review the allowance for loan and lease losses. Such agencies may require adjustments to the allowance based on information available to them at the time of their examination.
The provision for loan and lease losses recorded during
2012
equaled
$142.9 million
compared to
$232.3 million
during
2011
and
$143.5 million
during 2010. The reduction in provision for noncovered loans and leases during 2012 was primarily the result of reduced provisions for loans individually evaluated for impairment and lower charge-offs. Provision expense related to covered loans totaled
$100.8 million
during
2012
, compared to $174.5 million during
2011
, due to lower post-acquisition deterioration of covered loans, the reversal of previously recorded allowances due to improvements in expected cash flows and reduced charge-offs. The provision for covered loan and lease losses resulting from changes in loss estimates triggers corresponding adjustments to the receivable from the FDIC which are offset by noninterest income at the applicable reimbursement rate.
Provision expense related to noncovered loans equaled
$42.0 million
during
2012
, a decrease of
$15.8 million
, or
27.3 percent
from
2011
, caused primarily by lower charge-offs and, as a result of improving loss experience, reduced loss estimates used to establish the allowance for noncommercial loans.
49
Table 18
ALLOWANCE FOR LOAN AND LEASE LOSSES
|
2012
|
2011
|
2010
|
2009
|
2008
|
|||||||||||||||
|
|
(thousands, except ratios)
|
||||||||||||||||||
|
Allowance for loan and lease losses at beginning of period
|
$
|
270,144
|
|
$
|
227,765
|
|
$
|
172,282
|
|
$
|
157,569
|
|
$
|
136,974
|
|
||||
|
Adjustment resulting from adoption of change in accounting for QSPEs and controlling financial interests, effective January 1, 2010
|
—
|
|
—
|
|
681
|
|
—
|
|
—
|
|
|||||||||
|
Provision for loan and lease losses
|
142,885
|
|
232,277
|
|
143,519
|
|
79,364
|
|
65,926
|
|
|||||||||
|
Charge-offs:
|
|||||||||||||||||||
|
Commercial:
|
|||||||||||||||||||
|
Construction and land development
|
(18,213
|
)
|
(47,621
|
)
|
(15,656
|
)
|
(14,085
|
)
|
(11,832
|
)
|
|||||||||
|
Commercial mortgage
|
(30,590
|
)
|
(56,880
|
)
|
(12,496
|
)
|
(2,081
|
)
|
(696
|
)
|
|||||||||
|
Other commercial real estate
|
(1,510
|
)
|
(29,087
|
)
|
(4,562
|
)
|
(173
|
)
|
—
|
|
|||||||||
|
Commercial and industrial
|
(13,914
|
)
|
(11,994
|
)
|
(22,343
|
)
|
(17,114
|
)
|
(13,593
|
)
|
|||||||||
|
Lease financing
|
(361
|
)
|
(579
|
)
|
(1,825
|
)
|
(1,736
|
)
|
(1,124
|
)
|
|||||||||
|
Other
|
(28
|
)
|
(89
|
)
|
—
|
|
—
|
|
—
|
|
|||||||||
|
Total commercial loans
|
(64,616
|
)
|
(146,250
|
)
|
(56,882
|
)
|
(35,189
|
)
|
(27,245
|
)
|
|||||||||
|
Noncommercial:
|
|||||||||||||||||||
|
Residential mortgage
|
(8,929
|
)
|
(11,289
|
)
|
(1,851
|
)
|
(1,966
|
)
|
(1,165
|
)
|
|||||||||
|
Revolving mortgage
|
(12,460
|
)
|
(13,940
|
)
|
(7,640
|
)
|
(8,390
|
)
|
(3,249
|
)
|
|||||||||
|
Construction and land development
|
(3,932
|
)
|
(12,529
|
)
|
(9,423
|
)
|
(3,521
|
)
|
(5,727
|
)
|
|||||||||
|
Consumer
|
(10,541
|
)
|
(12,832
|
)
|
(19,520
|
)
|
(20,288
|
)
|
(12,695
|
)
|
|||||||||
|
Total noncommercial loans
|
(35,862
|
)
|
(50,590
|
)
|
(38,434
|
)
|
(34,165
|
)
|
(22,836
|
)
|
|||||||||
|
Total charge-offs
|
(100,478
|
)
|
(196,840
|
)
|
(95,316
|
)
|
(69,354
|
)
|
(50,081
|
)
|
|||||||||
|
Recoveries:
|
|||||||||||||||||||
|
Commercial:
|
|||||||||||||||||||
|
Construction and land development
|
445
|
|
607
|
|
—
|
|
517
|
|
52
|
|
|||||||||
|
Commercial mortgage
|
1,626
|
|
1,028
|
|
433
|
|
96
|
|
55
|
|
|||||||||
|
Other commercial real estate
|
14
|
|
502
|
|
—
|
|
—
|
|
—
|
|
|||||||||
|
Commercial and industrial
|
781
|
|
1,037
|
|
2,605
|
|
1,384
|
|
1,645
|
|
|||||||||
|
Lease financing
|
96
|
|
133
|
|
254
|
|
122
|
|
314
|
|
|||||||||
|
Other
|
4
|
|
2
|
|
—
|
|
—
|
|
—
|
|
|||||||||
|
Total commercial loans
|
2,966
|
|
3,309
|
|
3,292
|
|
2,119
|
|
2,066
|
|
|||||||||
|
Noncommercial:
|
|||||||||||||||||||
|
Residential mortgage
|
671
|
|
1,083
|
|
89
|
|
97
|
|
121
|
|
|||||||||
|
Revolving mortgage
|
698
|
|
653
|
|
425
|
|
182
|
|
215
|
|
|||||||||
|
Construction and land development
|
180
|
|
219
|
|
81
|
|
—
|
|
175
|
|
|||||||||
|
Consumer
|
1,952
|
|
1,678
|
|
2,712
|
|
2,305
|
|
2,173
|
|
|||||||||
|
Total noncommercial loans
|
3,501
|
|
3,633
|
|
3,307
|
|
2,584
|
|
2,684
|
|
|||||||||
|
Total recoveries
|
6,467
|
|
6,942
|
|
6,599
|
|
4,703
|
|
4,750
|
|
|||||||||
|
Net charge-offs
|
(94,011
|
)
|
(189,898
|
)
|
(88,717
|
)
|
(64,651
|
)
|
(45,331
|
)
|
|||||||||
|
Allowance for loan and lease losses at end of period
|
$
|
319,018
|
|
$
|
270,144
|
|
$
|
227,765
|
|
$
|
172,282
|
|
$
|
157,569
|
|
||||
|
Average loans and leases:
|
|||||||||||||||||||
|
Covered under loss share agreements
|
$
|
1,991,091
|
|
$
|
2,484,482
|
|
$
|
2,227,234
|
|
$
|
427,599
|
|
$
|
—
|
|
||||
|
Not covered under loss share agreements
|
11,569,682
|
|
11,565,971
|
|
11,638,581
|
|
11,635,355
|
|
11,306,900
|
|
|||||||||
|
Total
|
$
|
13,560,773
|
|
$
|
14,050,453
|
|
$
|
13,865,815
|
|
$
|
12,062,954
|
|
$
|
11,306,900
|
|
||||
|
Loans and leases at period end:
|
|||||||||||||||||||
|
Covered under loss share agreements
|
$
|
1,809,235
|
|
$
|
2,362,152
|
|
$
|
2,007,452
|
|
$
|
1,173,020
|
|
$
|
—
|
|
||||
|
Not covered under loss share agreements
|
11,576,115
|
|
11,581,637
|
|
11,480,577
|
|
11,644,999
|
|
11,649,886
|
|
|||||||||
|
Total
|
$
|
13,385,350
|
|
$
|
13,943,789
|
|
$
|
13,488,029
|
|
$
|
12,818,019
|
|
$
|
11,649,886
|
|
||||
|
Allowance for loan and lease losses allocated to loans and leases:
|
|||||||||||||||||||
|
Covered under loss share agreements
|
$
|
139,972
|
|
$
|
89,261
|
|
$
|
51,248
|
|
$
|
3,500
|
|
$
|
—
|
|
||||
|
Not covered under loss share agreements
|
179,046
|
|
180,883
|
|
176,517
|
|
168,782
|
|
157,569
|
|
|||||||||
|
Total
|
$
|
319,018
|
|
$
|
270,144
|
|
$
|
227,765
|
|
$
|
172,282
|
|
$
|
157,569
|
|
||||
|
Provision for loan and lease losses related to balances:
|
|||||||||||||||||||
|
Covered under loss share agreements
|
$
|
100,839
|
|
$
|
174,478
|
|
$
|
86,872
|
|
$
|
3,500
|
|
$
|
—
|
|
||||
|
Not covered under loss share agreements
|
42,046
|
|
57,799
|
|
56,647
|
|
75,864
|
|
65,926
|
|
|||||||||
|
Total
|
$
|
142,885
|
|
$
|
232,277
|
|
$
|
143,519
|
|
$
|
79,364
|
|
$
|
65,926
|
|
||||
|
Net charge-offs of loans and leases:
|
|||||||||||||||||||
|
Covered under loss share agreements
|
$
|
50,128
|
|
$
|
136,465
|
|
$
|
39,124
|
|
$
|
—
|
|
$
|
—
|
|
||||
|
Not covered under loss share agreements
|
43,883
|
|
53,433
|
|
49,593
|
|
64,651
|
|
45,331
|
|
|||||||||
|
Total
|
$
|
94,011
|
|
$
|
189,898
|
|
$
|
88,717
|
|
$
|
64,651
|
|
$
|
45,331
|
|
||||
|
Reserve for unfunded commitments
|
$
|
7,692
|
|
$
|
7,789
|
|
$
|
7,246
|
|
$
|
7,130
|
|
$
|
7,176
|
|
||||
|
Ratios:
|
|||||||||||||||||||
|
Net charge-offs to average loans and leases:
|
|||||||||||||||||||
|
Covered under loss share agreements
|
2.52
|
%
|
5.49
|
%
|
1.76
|
%
|
—
|
%
|
—
|
%
|
|||||||||
|
Not covered under loss share agreements
|
0.38
|
|
0.46
|
|
0.43
|
|
0.56
|
|
0.40
|
|
|||||||||
|
Total
|
0.69
|
|
1.35
|
|
0.64
|
|
0.54
|
|
0.40
|
|
|||||||||
|
Allowance for loan and lease losses to total loans and leases:
|
|||||||||||||||||||
|
Covered under loss share agreements
|
7.74
|
|
3.78
|
|
2.55
|
|
0.30
|
|
—
|
|
|||||||||
|
Not covered under loss share agreements
|
1.55
|
|
1.56
|
|
1.54
|
|
1.45
|
|
1.35
|
|
|||||||||
|
Total
|
2.38
|
|
1.94
|
|
1.69
|
|
1.34
|
|
1.35
|
|
|||||||||
All information presented in this table relates to domestic loans and leases as BancShares makes no foreign loans and leases.
50
Exclusive of losses related to covered loans, net charge-offs for
2012, 2011 and 2010
totaled
$43.9 million
,
$53.4 million
, and
$49.6 million
, respectively. The decrease in net charge-offs during
2012
resulted from lower losses on revolving mortgage, consumer and construction loans. Net charge-offs of noncovered loans represented
0.38 percent
of average noncovered loans and leases during
2012
compared to
0.46 percent
during
2011
and
0.43 percent
during
2010
. Net charge-offs of covered loans equaled
$50.1 million
and
$136.5 million
during
2012
and
2011
, equal to
2.52 percent
and
5.49 percent
of average covered loans, respectively. The decrease in
2012
covered loan charge-offs is the result of lower losses from loans acquired in the FDIC-assisted transactions. When actual losses are less than initial estimates, the difference is recognized as accretable yield and included in interest income prospectively over the remaining life of the loan. Any subsequent differences in initial estimates and actual results are also reflected with an adjustment to the FDIC receivable at the applicable indemnification rate.
Table 18
provides details concerning the allowance for loan and lease losses for the past five years.
Table 19
details the allocation of the allowance for noncovered loan and lease losses among the various loan types, and Note D to the consolidated financial statements provides the allocation of the allowance for covered loans and leases. The process used to allocate the allowance considers, among other factors, whether the borrower is a retail or commercial customer, whether the loan is secured or unsecured and whether the loan is an open or closed-end agreement. The proportion of the allowance relating to each class of loans will fluctuate based on the degree of the changes in default rates, charge-off activity, specifically identified impairments, and other credit quality indicators when compared to other classes. In
2012
, higher proportions of the noncovered allowance were allocated to commercial mortgage loans because the credit quality of this class of loans has indicated higher levels of deterioration relative to other classes. A lower proportion of the noncovered allowance was allocated to revolving and residential mortgage loans in
2012
due to indications of improved credit quality.
Table 19
ALLOCATION OF ALLOWANCE FOR LOAN AND LEASE LOSSES
|
|
December 31
|
|||||||||||||||||||||||||||||||||
|
|
2012
|
2011
|
2010
|
2009
|
2008
|
|||||||||||||||||||||||||||||
|
|
Allowance
for loan
and lease
losses
|
Percent
of loans
to total
loans
|
Allowance
for loan
and lease
losses
|
Percent
of loans
to total
loans
|
Allowance
for loan
and lease
losses
|
Percent
of loans
to total
loans
|
Allowance
for loan
and lease
losses
|
Percent
of loans
to total
loans
|
Allowance
for loan
and lease
losses
|
Percent
of loans
to total
loans
|
||||||||||||||||||||||||
|
|
(dollars in thousands)
|
|||||||||||||||||||||||||||||||||
|
Allowance for loan and lease losses allocated to:
|
||||||||||||||||||||||||||||||||||
|
Noncovered loans and leases
|
||||||||||||||||||||||||||||||||||
|
Commercial:
|
||||||||||||||||||||||||||||||||||
|
Construction and land development
|
$
|
6,031
|
|
2.3
|
%
|
$
|
5,467
|
|
2.7
|
%
|
$
|
10,512
|
|
2.5
|
%
|
$
|
4,572
|
|
2.9
|
%
|
$
|
9,822
|
|
4.7
|
%
|
|||||||||
|
Commercial mortgage
|
70,927
|
|
39.9
|
|
67,486
|
|
36.6
|
|
64,772
|
|
35.1
|
|
52,590
|
|
35.5
|
|
43,222
|
|
37.1
|
|
||||||||||||||
|
Other commercial real estate
|
2,059
|
|
1.2
|
|
2,169
|
|
1.0
|
|
2,200
|
|
1.1
|
|
5,366
|
|
1.2
|
|
5,231
|
|
1.3
|
|
||||||||||||||
|
Commercial and industrial
|
23,352
|
|
12.9
|
|
23,723
|
|
12.7
|
|
24,089
|
|
13.9
|
|
21,059
|
|
14.3
|
|
19,396
|
|
16.1
|
|
||||||||||||||
|
Lease financing
|
3,521
|
|
2.5
|
|
3,288
|
|
2.2
|
|
3,384
|
|
2.2
|
|
4,535
|
|
2.6
|
|
5,091
|
|
3.0
|
|
||||||||||||||
|
Other
|
1,175
|
|
0.9
|
|
1,315
|
|
1.1
|
|
1,473
|
|
1.4
|
|
1,333
|
|
1.5
|
|
632
|
|
0.9
|
|
||||||||||||||
|
Total commercial
|
107,065
|
|
59.7
|
|
103,448
|
|
56.4
|
|
106,430
|
|
56.2
|
|
89,455
|
|
58.0
|
|
83,394
|
|
63.0
|
|
||||||||||||||
|
Noncommercial:
|
||||||||||||||||||||||||||||||||||
|
Residential mortgage
|
3,836
|
|
6.1
|
|
8,879
|
|
5.6
|
|
7,009
|
|
6.5
|
|
8,213
|
|
6.7
|
|
8,006
|
|
8.2
|
|
||||||||||||||
|
Revolving mortgage
|
25,185
|
|
16.5
|
|
27,045
|
|
16.5
|
|
18,016
|
|
16.6
|
|
17,389
|
|
16.8
|
|
16,321
|
|
16.3
|
|
||||||||||||||
|
Construction and land development
|
1,721
|
|
1.0
|
|
1,427
|
|
1.0
|
|
1,751
|
|
1.4
|
|
3,709
|
|
2.0
|
|
2,626
|
|
2.0
|
|
||||||||||||||
|
Consumer
|
25,389
|
|
3.1
|
|
25,962
|
|
3.6
|
|
29,448
|
|
4.4
|
|
37,944
|
|
7.3
|
|
35,545
|
|
10.5
|
|
||||||||||||||
|
Total noncommercial
|
56,131
|
|
26.8
|
|
63,313
|
|
26.6
|
|
56,224
|
|
28.9
|
|
67,255
|
|
32.8
|
|
62,498
|
|
37.0
|
|
||||||||||||||
|
Nonspecific
|
15,850
|
|
14,122
|
|
13,863
|
|
12,072
|
|
11,677
|
|
||||||||||||||||||||||||
|
Total allowance for noncovered loan and lease losses
|
179,046
|
|
86.5
|
|
180,883
|
|
83.1
|
|
176,517
|
|
85.1
|
|
168,782
|
|
90.9
|
|
157,569
|
|
100.0
|
|
||||||||||||||
|
Covered loans
|
139,972
|
|
13.5
|
|
89,261
|
|
16.9
|
|
51,248
|
|
14.9
|
|
3,500
|
|
9.2
|
|
—
|
|
—
|
|
||||||||||||||
|
Total allowance for loan and lease losses
|
$
|
319,018
|
|
100.0
|
%
|
$
|
270,144
|
|
100.0
|
%
|
$
|
227,765
|
|
100.0
|
%
|
$
|
172,282
|
|
100.0
|
%
|
$
|
157,569
|
|
100.0
|
%
|
|||||||||
51
Interest rate risk management
Interest rate risk results principally from assets and liabilities maturing or repricing at different points in time, from assets and liabilities repricing at the same point in time but in different amounts and from short-term and long-term interest rates changing in different magnitudes. Market interest rates also have an impact on the interest rate and repricing characteristics of loans and leases that are originated as well as the rate characteristics of our interest-bearing liabilities.
The maturity distribution and repricing opportunities of interest-earning assets and interest-bearing liabilities have a significant impact on our interest rate risk. Our strategy is to reduce overall interest rate risk by maintaining relatively short maturities.
Table 21
provides loan maturity distribution and information regarding the sensitivity of loans and leases to changes in interest rates.
Table 5
includes maturity information for our investment securities.
Table 8
displays maturity information for time deposits with balances in excess of $100,000.
We assess our interest rate risk through slotting by future period the repricing opportunities for interest-earning assets and interest-bearing liabilities, considering forecasted new business volume and changes in existing assets and liabilities. The resulting repricing data allows for the calculation of repricing gaps by period, which in turn enables us to simulate future amounts of net interest income over multiple time horizons using various interest rate scenarios. We then compare the simulated net interest income to forecasted net interest income assuming stable rates to calculate the projected earnings at risk for each of the interest rate scenarios.
Certain variable rate products, including revolving mortgage loans, have interest rate floors. Due to the existence of contractual floors on loans, competitive pressures that constrain our ability to reduce deposit interest rates and the extraordinarily low current level of interest rates, it is highly unlikely that the rates on most interest-earning assets and interest-bearing liabilities can decline materially from current levels. In our simulations, we do not calculate rate shocks, rate ramps or market value of equity for declining rate scenarios and assume the prime interest rate will not move below the
December 31, 2012
, rate of 3.25 percent.
Table 20
provides the impact on net interest income resulting from various interest rate scenarios as of
December 31, 2012, and 2011
. Our shock projections incorporate assumptions of estimated customer migration of short-term deposit instruments to long-term, higher-rate instruments as rates rise. We also utilize the market value of equity as a tool in measuring and managing interest rate risk.
Table 20
INTEREST RATE RISK ANALYSIS
|
|
Favorable (unfavorable) impact
on net interest income compared
to stable rate scenario over the
12-month period following:
|
||||
|
Assumed rate change
|
December 31, 2012
|
December 31, 2011
|
|||
|
Most likely
|
—
|
%
|
—
|
%
|
|
|
Immediate 200 basis point increase
|
4.00
|
|
7.03
|
|
|
|
Gradual 200 basis point increase
|
3.00
|
|
1.76
|
|
|
The market value of equity measures the degree to which the market values of our assets and liabilities will change given a specific degree of movement in interest rates. Our calculation methodology for the market value of equity utilizes a 200-basis point parallel rate shock. As of
December 31, 2012
, the market value of equity calculated with a 200-basis point immediate increase in interest rates equals
9.66 percent
, down from
10.09 percent
of assets when calculated with stable rates. The estimated amounts for the market value of equity are highly influenced by the relatively longer maturity of the commercial loan component of interest-earning assets when compared to the shorter term maturity characteristics of interest-bearing liabilities.
We do not typically utilize interest rate swaps, floors, collars or other derivative financial instruments to attempt to hedge our overall balance sheet rate sensitivity and interest rate risk. However, during 2006 we entered into an interest rate swap to synthetically convert the variable rate of $115.0 million of junior subordinated debentures to a fixed rate of 7.125 percent for a period of five years. This swap matured on June 30, 2011. During 2009, we entered into a second interest rate swap covering the period from June 2011 to December 2011 at a fixed interest rate of 5.50 percent. Following the redemption of $21.5 million of the junior subordinated debentures, the 2009 swap was terminated in December 2011 and we entered into a new swap to synthetically convert the variable rate on the remaining $93.5 million of junior subordinated debentures to a fixed rate of 5.50 percent through June 2016. All of the interest rate swaps qualified as hedges under GAAP during the periods in which they were in effect.
Liquidity risk management
52
Liquidity risk results from the mismatching of asset and liability cash flows and the potential inability to secure adequate amounts of funding from traditional sources of liquidity at a reasonable cost. We manage this risk by structuring our balance sheet prudently and by maintaining various noncore funding sources to fund potential cash needs. Our primary source of funds has historically been our large retail and commercial customer base, which continues to provide a stable base of core deposits. Core deposits are our largest and most cost-effective source of funding. We also maintain access to various types of noncore funding including advances from the FHLB of Atlanta, federal funds arrangements with correspondent banks, brokered and CDARS deposits and a line of credit from a correspondent bank. Short-term borrowings resulting from commercial treasury customers are also a recurring source of liquidity, although the majority of those borrowings must be collateralized thereby potentially restricting the use of the resulting liquidity.
We project our liquidity levels in the normal course of business as well as in conditions that might give rise to significant stress on our current liquidity and contingent sources of liquidity through noncore funding. We endeavor to estimate the impact of on and off-balance sheet arrangements and commitments that may impact liquidity. We monitor various financial and liquidity metrics, perform liquidity stress testing and have documented contingency funding plans that would be invoked if conditions warranted. Sources of noncore funding include available cash reserves, the ability to sell, pledge or borrow against unpledged investment securities and available borrowing capacity at the FHLB of Atlanta and the Federal Reserve discount window.
One of our principal sources of noncore funding is advances from the FHLB of Atlanta. Outstanding FHLB advances equaled
$235.3 million
as of
December 31, 2012
, and we had sufficient collateral pledged to secure
$1.09 billion
of additional borrowings. Additionally, we maintain federal funds lines of credit and other borrowing facilities. At December 31, 2012, BancShares had contingent access to
$475.0 million
in unsecured borrowings through various sources.
Once we have satisfied our loan demand and other funding needs, residual liquidity is held in cash or invested in overnight investments and investment securities available for sale. Net of amounts pledged for various purposes, the amount of such immediately-available balance sheet liquidity approximated
$2.82 billion
at
December 31, 2012
, compared to
$1.40 billion
at
December 31, 2011
.
Table 21
LOAN MATURITY DISTRIBUTION AND INTEREST RATE SENSITIVITY
|
|
At December 31, 2012, maturing
|
||||||||||||||
|
|
Within
One Year
|
One to Five
Years
|
After
Five Years
|
Total
|
|||||||||||
|
|
(thousands)
|
||||||||||||||
|
Loans and leases:
|
|||||||||||||||
|
Secured by real estate
|
$
|
2,449,044
|
|
$
|
5,597,247
|
|
$
|
2,687,658
|
|
$
|
10,733,949
|
|
|||
|
Commercial and industrial
|
555,204
|
|
777,336
|
|
443,049
|
|
1,775,589
|
|
|||||||
|
Other
|
371,895
|
|
415,114
|
|
88,803
|
|
875,812
|
|
|||||||
|
Total loans and leases
|
$
|
3,376,143
|
|
$
|
6,789,697
|
|
$
|
3,219,510
|
|
$
|
13,385,350
|
|
|||
|
Loans covered under loss share agreements
|
$
|
417,533
|
|
$
|
939,157
|
|
$
|
452,545
|
|
$
|
1,809,235
|
|
|||
|
Loans not covered under loss share agreements
|
2,958,611
|
|
5,850,539
|
|
2,766,965
|
|
11,576,115
|
|
|||||||
|
Total loans and leases
|
$
|
3,376,144
|
|
$
|
6,789,696
|
|
$
|
3,219,510
|
|
$
|
13,385,350
|
|
|||
|
Loans maturing after one year with:
|
|||||||||||||||
|
Fixed interest rates
|
$
|
5,925,092
|
|
$
|
2,640,048
|
|
$
|
8,565,140
|
|
||||||
|
Floating or adjustable rates
|
864,604
|
|
579,462
|
|
1,444,066
|
|
|||||||||
|
Total
|
$
|
6,789,696
|
|
$
|
3,219,510
|
|
$
|
10,009,206
|
|
||||||
53
Table 22
- SELECTED QUARTERLY DATA
|
|
2012
|
2011
|
|||||||||||||||||||||||||||||
|
|
Fourth
Quarter
|
Third
Quarter
|
Second
Quarter
|
First
Quarter
|
Fourth
Quarter
|
Third
Quarter
|
Second
Quarter
|
First
Quarter
|
|||||||||||||||||||||||
|
|
(thousands, except share data and ratios)
|
||||||||||||||||||||||||||||||
|
SUMMARY OF OPERATIONS
|
|||||||||||||||||||||||||||||||
|
Interest income
|
$
|
280,891
|
|
$
|
236,674
|
|
$
|
240,519
|
|
$
|
246,752
|
|
$
|
272,176
|
|
$
|
252,179
|
|
$
|
245,604
|
|
$
|
245,200
|
|
|||||||
|
Interest expense
|
17,943
|
|
21,318
|
|
25,087
|
|
25,800
|
|
29,758
|
|
34,992
|
|
38,229
|
|
41,213
|
|
|||||||||||||||
|
Net interest income
|
262,948
|
|
215,356
|
|
215,432
|
|
220,952
|
|
242,418
|
|
217,187
|
|
207,375
|
|
203,987
|
|
|||||||||||||||
|
Provision for loan and lease losses
|
64,880
|
|
17,623
|
|
29,667
|
|
30,715
|
|
89,253
|
|
44,628
|
|
53,977
|
|
44,419
|
|
|||||||||||||||
|
Net interest income after provision for loan and lease losses
|
198,068
|
|
197,733
|
|
185,765
|
|
190,237
|
|
153,165
|
|
172,559
|
|
153,398
|
|
159,568
|
|
|||||||||||||||
|
Gains on acquisitions
|
—
|
|
—
|
|
—
|
|
—
|
|
—
|
|
86,943
|
|
—
|
|
63,474
|
|
|||||||||||||||
|
Other noninterest income
|
33,219
|
|
51,842
|
|
57,296
|
|
46,943
|
|
105,238
|
|
75,956
|
|
66,649
|
|
66,106
|
|
|||||||||||||||
|
Noninterest expense
|
198,728
|
|
190,077
|
|
194,797
|
|
183,331
|
|
211,583
|
|
203,832
|
|
187,482
|
|
190,028
|
|
|||||||||||||||
|
Income before income taxes
|
32,559
|
|
59,498
|
|
48,264
|
|
53,849
|
|
46,820
|
|
131,626
|
|
32,565
|
|
99,120
|
|
|||||||||||||||
|
Income taxes
|
10,813
|
|
19,974
|
|
10,681
|
|
18,354
|
|
16,273
|
|
50,205
|
|
11,265
|
|
37,360
|
|
|||||||||||||||
|
Net income
|
$
|
21,746
|
|
$
|
39,524
|
|
$
|
37,583
|
|
$
|
35,495
|
|
$
|
30,547
|
|
$
|
81,421
|
|
$
|
21,300
|
|
$
|
61,760
|
|
|||||||
|
Net interest income, taxable equivalent
|
$
|
263,635
|
|
$
|
216,069
|
|
$
|
216,194
|
|
$
|
221,765
|
|
$
|
243,309
|
|
$
|
218,178
|
|
$
|
208,301
|
|
$
|
204,939
|
|
|||||||
|
PER SHARE DATA
|
|||||||||||||||||||||||||||||||
|
Net income
|
$
|
2.15
|
|
$
|
3.85
|
|
$
|
3.66
|
|
$
|
3.45
|
|
2.97
|
|
7.86
|
|
2.04
|
|
5.92
|
|
|||||||||||
|
Cash dividends declared
|
0.30
|
|
0.30
|
|
0.30
|
|
0.30
|
|
0.30
|
|
0.30
|
|
0.30
|
|
0.30
|
|
|||||||||||||||
|
Market price at period end (Class A)
|
163.50
|
|
162.90
|
|
166.65
|
|
182.69
|
|
174.99
|
|
143.54
|
|
187.22
|
|
200.58
|
|
|||||||||||||||
|
Book value at period end
|
193.75
|
|
192.49
|
|
187.88
|
|
184.14
|
|
180.97
|
|
181.58
|
|
174.11
|
|
171.46
|
|
|||||||||||||||
|
SELECTED QUARTERLY AVERAGE BALANCES
|
|||||||||||||||||||||||||||||||
|
Total assets
|
$
|
21,245,425
|
|
$
|
21,075,174
|
|
$
|
21,085,228
|
|
$
|
20,843,491
|
|
$
|
21,042,227
|
|
$
|
21,157,741
|
|
$
|
21,042,081
|
|
$
|
21,385,014
|
|
|||||||
|
Investment securities
|
5,169,159
|
|
4,888,047
|
|
4,598,141
|
|
4,141,160
|
|
4,056,949
|
|
4,082,574
|
|
4,162,397
|
|
4,568,205
|
|
|||||||||||||||
|
Loans and leases (covered and noncovered)
|
13,357,928
|
|
13,451,164
|
|
13,612,114
|
|
13,822,226
|
|
14,093,034
|
|
14,173,224
|
|
14,028,109
|
|
13,904.054
|
|
|||||||||||||||
|
Interest-earning assets
|
19,273,850
|
|
19,059,474
|
|
18,983,321
|
|
18,584,625
|
|
18,670,998
|
|
18,821,838
|
|
18,742,282
|
|
19,067,378
|
|
|||||||||||||||
|
Deposits
|
17,983,033
|
|
17,755,974
|
|
17,667,221
|
|
17,498,813
|
|
17,679,125
|
|
17,772,429
|
|
17,678,210
|
|
18,065,652
|
|
|||||||||||||||
|
Long-term obligations
|
447,600
|
|
524,313
|
|
646,854
|
|
682,067
|
|
713,378
|
|
753,685
|
|
797,375
|
|
802,720
|
|
|||||||||||||||
|
Interest-bearing liabilities
|
14,109,359
|
|
14,188,609
|
|
14,418,509
|
|
14,478,901
|
|
14,635,353
|
|
14,991,875
|
|
15,018,805
|
|
15,543,484
|
|
|||||||||||||||
|
Shareholders’ equity
|
$
|
1,951,874
|
|
$
|
1,945,263
|
|
$
|
1,906,884
|
|
$
|
1,870,066
|
|
$
|
1,869,479
|
|
$
|
1,830,503
|
|
$
|
1,803,385
|
|
$
|
1,752,129
|
|
|||||||
|
Shares outstanding
|
10,159,262
|
|
10,264,159
|
|
10,271,343
|
|
10,283,842
|
|
10,286,271
|
|
10,363,964
|
|
10,422,857
|
|
10,434,453
|
|
|||||||||||||||
|
SELECTED QUARTER-END BALANCES
|
|||||||||||||||||||||||||||||||
|
Total assets
|
$
|
21,283,652
|
|
$
|
21,173,620
|
|
$
|
21,240,990
|
|
$
|
21,143,628
|
|
$
|
20,997,298
|
|
$
|
21,015,344
|
|
$
|
21,021,650
|
|
$
|
21,167,495
|
|
|||||||
|
Investment securities
|
5,227,570
|
|
5,013,500
|
|
4,635,826
|
|
4,459,427
|
|
4,058,245
|
|
3,996,768
|
|
4,016,339
|
|
4,204,357
|
|
|||||||||||||||
|
Loans and leases:
|
|||||||||||||||||||||||||||||||
|
Covered under loss share agreements
|
1,809,235
|
|
1,897,097
|
|
1,999,351
|
|
2,183,869
|
|
2,362,152
|
|
2,557,450
|
|
2,399,738
|
|
2,658,134
|
|
|||||||||||||||
|
Not covered under loss share agreements
|
11,576,115
|
|
11,455,233
|
|
11,462,458
|
|
11,489,529
|
|
11,581,637
|
|
11,603,526
|
|
11,528,854
|
|
11,392,351
|
|
|||||||||||||||
|
Deposits
|
18,086,025
|
|
17,893,215
|
|
17,801,646
|
|
17,759,492
|
|
17,577,274
|
|
17,663,275
|
|
17,662,966
|
|
17,811.736
|
|
|||||||||||||||
|
Long-term obligations
|
444,921
|
|
472,170
|
|
644,682
|
|
649,818
|
|
687,599
|
|
744,839
|
|
792,661
|
|
801,081
|
|
|||||||||||||||
|
Shareholders’ equity
|
$
|
1,864,007
|
|
$
|
1,974,124
|
|
$
|
1,929,790
|
|
$
|
1,892,123
|
|
$
|
1,861,128
|
|
$
|
1,871,930
|
|
$
|
1,810,189
|
|
$
|
1,789,133
|
|
|||||||
|
Shares outstanding
|
9,620,914
|
|
10,255,747
|
|
10,271,244
|
|
10,275,731
|
|
10,284,119
|
|
10,309,251
|
|
10,396,765
|
|
10,434,453
|
|
|||||||||||||||
|
SELECTED RATIOS AND OTHER DATA
|
|||||||||||||||||||||||||||||||
|
Rate of return on average assets (annualized)
|
0.41
|
%
|
0.75
|
%
|
0.72
|
%
|
0.68
|
%
|
0.58
|
%
|
1.53
|
%
|
0.42
|
%
|
1.18
|
%
|
|||||||||||||||
|
Rate of return on average shareholders’ equity (annualized)
|
4.43
|
|
8.08
|
|
7.93
|
|
7.63
|
|
6.48
|
|
17.65
|
|
4.94
|
|
14.30
|
|
|||||||||||||||
|
Net yield on interest-earning assets (taxable equivalent)
|
5.44
|
|
4.51
|
|
4.58
|
|
4.80
|
|
5.17
|
|
4.60
|
|
4.46
|
|
4.36
|
|
|||||||||||||||
|
Allowance for loan and lease losses to loans and leases:
|
|||||||||||||||||||||||||||||||
|
Covered under loss share agreements
|
7.74
|
|
4.77
|
|
4.39
|
|
3.94
|
|
3.78
|
|
2.93
|
|
2.89
|
|
2.08
|
|
|||||||||||||||
|
Not covered under loss share agreements
|
1.55
|
|
1.62
|
|
1.62
|
|
1.62
|
|
1.56
|
|
1.54
|
|
1.57
|
|
1.56
|
|
|||||||||||||||
|
Nonperforming assets to total loans and leases and other real estate at period end:
|
|||||||||||||||||||||||||||||||
|
Covered under loss share agreements
|
9.26
|
|
12.87
|
|
18.37
|
|
18.68
|
|
17.95
|
|
16.64
|
|
16.39
|
|
12.92
|
|
|||||||||||||||
|
Not covered under loss share agreements
|
1.15
|
|
1.05
|
|
1.03
|
|
0.99
|
|
0.89
|
|
0.93
|
|
1.06
|
|
1.13
|
|
|||||||||||||||
|
Tier 1 risk-based capital ratio
|
14.27
|
|
15.08
|
|
15.97
|
|
15.74
|
|
15.41
|
|
15.46
|
|
15.38
|
|
15.24
|
|
|||||||||||||||
|
Total risk-based capital ratio
|
15.95
|
|
16.76
|
|
17.66
|
|
17.62
|
|
17.27
|
|
17.33
|
|
17.27
|
|
17.32
|
|
|||||||||||||||
|
Leverage capital ratio
|
9.22
|
|
9.67
|
|
10.21
|
|
10.16
|
|
9.90
|
|
9.83
|
|
9.50
|
|
9.35
|
|
|||||||||||||||
|
Dividend payout ratio
|
13.95
|
|
7.79
|
|
8.20
|
|
8.70
|
|
10.10
|
|
3.79
|
|
14.68
|
|
5.07
|
|
|||||||||||||||
|
Average loans and leases to average deposits
|
74.28
|
|
75.76
|
|
77.05
|
|
78.99
|
|
79.72
|
|
79.75
|
|
79.35
|
|
76.96
|
|
|||||||||||||||
Average loan and lease balances include nonaccrual loans and leases. The capital ratios presented are of First Citizens BancShares, Inc., and Subsidiaries.
54
FOURTH QUARTER ANALYSIS
For the quarter ending
December 31, 2012
, BancShares reported net income of
$21.7 million
, compared to
$30.5 million
for the corresponding period of
2011
. Lower earnings during the fourth quarter
2012
were caused by lower noninterest income from reductions to the FDIC receivable, partially offset by higher net interest income and lower provision for loan losses.
Per share income for the fourth quarter
2012
totaled
$2.15
, compared to
$2.97
for the same period a year ago. The annualized return on average assets equaled
0.41 percent
for the fourth quarter of
2012
, compared to
0.58 percent
for the fourth quarter of
2011
. The annualized return on average equity was
4.43 percent
during the fourth quarter of
2012
compared to
6.48 percent
for the same period of
2011
.
Net interest income increased
$20.5 million
, or
8.5 percent
, during the fourth quarter of
2012
due primarily to a
27
basis points improvement in the taxable-equivalent net yield on interest-earning assets when compared to the fourth quarter of
2011
. The increase in net yield was due to a stable yield on interest-earning assets when compared to the decline in the rate on interest-bearing liabilities.
Interest-earning assets averaged
$19.27 billion
during the fourth quarter of
2012
, up $
602.9 million
from the fourth quarter of
2011
. Average loans and leases decreased
$735.1 million
, or
5.2 percent
, since the fourth quarter of
2011
due to lower loan demand and run-off of acquired loan balances. Average investment securities grew
$1.11 billion
, or
27.4 percent
, resulting from more investable funds due to weak loan demand.
Average interest-bearing liabilities decreased
$526.0 million
, or
3.6 percent
, during the fourth quarter of
2012
, principally due to a significant reduction in average time deposits and repayments of long-term obligations. The rate on interest-bearing liabilities decreased
30
basis points from
0.81 percent
during the fourth quarter of
2011
to
0.51 percent
during the fourth quarter of
2012
, as market interest rates remained low and maturing time deposits repriced to current low rates.
The provision for loan and lease losses equaled
$64.9 million
during the fourth quarter of
2012
, a
$24.4 million
decrease from the same period of
2011
, due to lower post-acquisition deterioration of covered loans and reduced provision on noncovered loans. Net charge-offs on noncovered loans during the fourth quarter of
2012
equaled
$9.5 million
, down
$7.5 million
from the fourth quarter of
2011
primarily due to higher losses on residential construction loans in 2011. The annualized ratio of noncovered net charge-offs to average noncovered loans and leases equaled
0.33 percent
during the fourth quarter of
2012
, versus 0.58 percent during the same period of
2011
. Net charge-offs resulting from post-acquisition deterioration of covered loans equaled
$12.9 million
and
$56.2 million
, respectively, during the fourth quarter of
2012
and
2011
.
Total noninterest income decreased
$72.0 million
, or
68.4 percent
, from the fourth quarter of
2011
, due to unfavorable variance in the income statement impact of adjustments to the FDIC receivable.
Noninterest expense equaled
$198.7 million
during the fourth quarter of
2012
, down
$12.9 million
, or
6.1 percent
. Foreclosure-related expenses decreased $10.7 million in the fourth quarter of 2012 compared to the fourth quarter of 2011.
Other expenses for the fourth quarter of 2012 declined $7.2 million when compared to the fourth quarter of 2011, due to lower
FDIC insurance expense resulting from the new assessment calculation and a decline in expenses related to card loyalty programs.
Table 22
provides quarterly information for each of the quarters in
2012
and
2011
.
Table 23
analyzes the components of changes in net interest income between the fourth quarter of
2012
and
2011
.
55
Table 23
CONSOLIDATED TAXABLE EQUIVALENT RATE/VOLUME VARIANCE ANALYSIS—FOURTH QUARTER
|
|
2012
|
2011
|
Increase (decrease) due to:
|
||||||||||||||||||||||||||||||
|
|
Average
balance
|
Interest
income/
expense
|
Yield/
rate
|
Average
balance
|
Interest
income/
expense
|
Yield/
rate
|
Volume
|
Yield/
rate
|
Total
change
|
||||||||||||||||||||||||
|
|
(dollars in thousands)
|
||||||||||||||||||||||||||||||||
|
Assets
|
|||||||||||||||||||||||||||||||||
|
Loans and leases
|
$
|
13,357,928
|
|
$
|
271,316
|
|
8.08
|
%
|
$
|
14,093,034
|
|
$
|
262,683
|
|
7.39
|
%
|
$
|
(14,733
|
)
|
$
|
23,366
|
|
$
|
8,633
|
|
||||||||
|
Investment securities:
|
|||||||||||||||||||||||||||||||||
|
U. S. Treasury
|
869,775
|
|
523
|
|
0.24
|
|
962,401
|
|
1,117
|
|
0.46
|
|
(84
|
)
|
(510
|
)
|
(594
|
)
|
|||||||||||||||
|
Government agency
|
2,892,502
|
|
3,422
|
|
0.47
|
|
2,401,808
|
|
4,974
|
|
0.83
|
|
814
|
|
(2,366
|
)
|
(1,552
|
)
|
|||||||||||||||
|
Residential mortgage-backed securities
|
1,341,318
|
|
5,505
|
|
1.63
|
|
318,820
|
|
852
|
|
1.06
|
|
3,460
|
|
1,193
|
|
4,653
|
|
|||||||||||||||
|
Corporate bonds
|
46,354
|
|
255
|
|
2.20
|
|
355,905
|
|
2,969
|
|
3.31
|
|
(2,144
|
)
|
(570
|
)
|
(2,714
|
)
|
|||||||||||||||
|
State, county and municipal
|
580
|
|
9
|
|
6.17
|
|
1,042
|
|
66
|
|
25.13
|
|
(18
|
)
|
(39
|
)
|
(57
|
)
|
|||||||||||||||
|
Other
|
18,630
|
|
40
|
|
0.85
|
|
16,973
|
|
69
|
|
1.61
|
|
5
|
|
(34
|
)
|
(29
|
)
|
|||||||||||||||
|
Total investment securities
|
5,169,159
|
|
9,754
|
|
0.75
|
|
4,056,949
|
|
10,047
|
|
0.99
|
|
2,033
|
|
(2,326
|
)
|
(293
|
)
|
|||||||||||||||
|
Overnight investments
|
746,763
|
|
508
|
|
0.27
|
|
521,015
|
|
337
|
|
0.26
|
|
153
|
|
18
|
|
171
|
|
|||||||||||||||
|
Total interest-earning assets
|
$
|
19,273,850
|
|
$
|
281,578
|
|
5.81
|
%
|
$
|
18,670,998
|
|
$
|
273,067
|
|
5.80
|
%
|
$
|
(12,547
|
)
|
$
|
21,058
|
|
$
|
8,511
|
|
||||||||
|
Liabilities
|
|||||||||||||||||||||||||||||||||
|
Deposits:
|
|||||||||||||||||||||||||||||||||
|
Checking With Interest
|
$
|
2,183,140
|
|
$
|
329
|
|
0.06
|
%
|
$
|
1,976,271
|
|
$
|
351
|
|
0.07
|
%
|
$
|
32
|
|
$
|
(54
|
)
|
$
|
(22
|
)
|
||||||||
|
Savings
|
899,428
|
|
113
|
|
0.05
|
|
844,227
|
|
270
|
|
0.13
|
|
15
|
|
(172
|
)
|
(157
|
)
|
|||||||||||||||
|
Money market accounts
|
6,222,991
|
|
3,601
|
|
0.23
|
|
5,656,855
|
|
4,644
|
|
0.33
|
|
424
|
|
(1,467
|
)
|
(1,043
|
)
|
|||||||||||||||
|
Time deposits
|
3,715,193
|
|
8,156
|
|
0.87
|
|
4,812,622
|
|
14,897
|
|
1.23
|
|
(2,890
|
)
|
(3,851
|
)
|
(6,741
|
)
|
|||||||||||||||
|
Total interest-bearing deposits
|
13,020,752
|
|
12,199
|
|
0.37
|
|
13,289,975
|
|
20,162
|
|
0.60
|
|
(2,419
|
)
|
(5,544
|
)
|
(7,963
|
)
|
|||||||||||||||
|
Short-term borrowings
|
641,007
|
|
1,018
|
|
0.63
|
|
632,000
|
|
1,344
|
|
0.84
|
|
13
|
|
(339
|
)
|
(326
|
)
|
|||||||||||||||
|
Long-term obligations
|
447,600
|
|
4,726
|
|
4.22
|
|
713,378
|
|
8,252
|
|
4.59
|
|
(2,958
|
)
|
(568
|
)
|
(3,526
|
)
|
|||||||||||||||
|
Total interest-bearing liabilities
|
$
|
14,109,359
|
|
$
|
17,943
|
|
0.51
|
%
|
$
|
14,635,353
|
|
$
|
29,758
|
|
0.81
|
%
|
$
|
(5,364
|
)
|
$
|
(6,451
|
)
|
$
|
(11,815
|
)
|
||||||||
|
Interest rate spread
|
5.30
|
%
|
4.99
|
%
|
|||||||||||||||||||||||||||||
|
Net interest income and net yield on interest-earning assets
|
$
|
263,635
|
|
5.44
|
%
|
$
|
243,309
|
|
5.17
|
%
|
$
|
(7,183
|
)
|
$
|
27,509
|
|
$
|
20,326
|
|
||||||||||||||
Average loans and leases includes nonaccrual loans and leases. Yields related to loans, leases and securities exempt from both federal and state income taxes, federal income taxes only, or state income taxes only, are stated on a taxable-equivalent basis assuming a statutory federal income tax rate of
35.0 percent
and a state income tax rate of
6.9 percent
for each period.
56
COMMITMENTS AND CONTRACTUAL OBLIGATIONS
Table 24
identifies significant obligations and commitments as of
December 31, 2012
.
Table 24
COMMITMENTS AND CONTRACTUAL OBLIGATIONS
|
|
Payments due by period
|
||||||||||||||||||
|
Type of obligation
|
Less than 1 year
|
1-3 years
|
4-5 years
|
Thereafter
|
Total
|
||||||||||||||
|
|
(thousands)
|
||||||||||||||||||
|
Contractual obligations:
|
|||||||||||||||||||
|
Deposits
|
$
|
17,069,596
|
|
$
|
743,980
|
|
$
|
272,433
|
|
$
|
16
|
|
$
|
18,086,025
|
|
||||
|
Short-term borrowings
|
568,505
|
|
—
|
|
—
|
|
—
|
|
568,505
|
|
|||||||||
|
Long-term obligations
|
3,690
|
|
209,833
|
|
11,124
|
|
220,274
|
|
444,921
|
|
|||||||||
|
Operating leases
|
20,910
|
|
30,716
|
|
14,881
|
|
44,722
|
|
111,229
|
|
|||||||||
|
Estimated payments for claw-back provisions of FDIC loss share agreements
|
—
|
|
—
|
|
—
|
|
101,641
|
|
101,641
|
|
|||||||||
|
Total contractual obligations
|
$
|
17,662,701
|
|
$
|
984,529
|
|
$
|
298,438
|
|
$
|
366,653
|
|
$
|
19,312,321
|
|
||||
|
Commitments:
|
|||||||||||||||||||
|
Loan commitments
|
$
|
1,108,858
|
|
$
|
1,350,358
|
|
$
|
270,196
|
|
$
|
2,738,586
|
|
$
|
5,467,998
|
|
||||
|
Standby letters of credit
|
54,665
|
|
8,420
|
|
—
|
|
—
|
|
63,085
|
|
|||||||||
|
Affordable housing partnerships
|
2,457
|
|
5,546
|
|
136
|
|
20
|
|
8,159
|
|
|||||||||
|
Total commitments
|
$
|
1,165,980
|
|
$
|
1,364,324
|
|
$
|
270,332
|
|
$
|
2,738,606
|
|
$
|
5,539,242
|
|
||||
CURRENT ACCOUNTING AND REGULATORY ISSUES
In May 2011, the FASB issued
Amendments to Achieve Common Fair Value Measurement and Disclosure Requirements in U.S. GAAP and IFRS
(ASU 2011-04). ASU 2011-04 creates a uniform framework for applying fair value measurement principles for companies around the world. It eliminates differences between GAAP and International Financial Reporting Standards issued by the International Accounting Standards Board. New disclosures required by the guidance include: quantitative information about the significant unobservable inputs used for Level 3 measurements; a qualitative discussion about the sensitivity of recurring Level 3 measurements to changes in the unobservable inputs disclosed, including the interrelationship between inputs; and a description of the company's valuation processes. The updates in ASU 2011-04 are effective for interim and annual periods beginning after December 15, 2011, and all amendments are to be applied prospectively with any changes in measurements recognized in income in the period of adoption. The provisions of this update have affected BancShares' financial statement disclosures but had no impact on BancShares' financial condition, results of operations or liquidity.
In September 2011, the FASB issued
Intangibles - Goodwill and Other Intangible Assets: Testing Goodwill for Impairment
(ASU 2011-08), which allows an entity the option to first assess the qualitative factors to determine whether the existence of events or circumstances leads to a determination that is it more likely than not that the fair value of a reporting unit is less than its carrying amount. Under ASU 2011-08, if, after that assessment is made, an entity determines that it is more likely than not that the carrying value of goodwill is not impaired, then the two-step impairment test is not required. However, if the entity concludes otherwise, the two-step impairment test would be required. The provisions of ASU 2011-08 are effective for interim and annual periods beginning after December 15, 2011, although early adoption is allowed. Adoption of ASU 2011-08 did not have material impact on BancShares' financial condition, results of operations or liquidity.
In June 2011, the FASB issued
Comprehensive Income: Presentation of Comprehensive Income
(ASU 2011-05). ASU 2011-05 allows financial statement issuers to present the total of comprehensive income, the components of net income, and the components of other comprehensive income either in a single continuous statement of comprehensive income or in two separate but consecutive statements. Additionally, in December 2011, the FASB issued
Comprehensive Income (Topic 220): Deferral of the Effective Date for Amendments to the Presentation of Reclassifications of Items Out of Accumulated Other Comprehensive Income in Accounting Standards Update No. 2011-05
(ASU 2011-12)
which deferred the portion of ASU 2011-05 that relates to the presentation of reclassification adjustments
.
ASU 2011-05 eliminates the option to present the
57
components of other comprehensive income as part of the statement of changes in shareholders' equity, which is the presentation method previously utilized by BancShares. The updates in ASU 2011-05 and ASU 2011-12 are effective for fiscal years, and interim periods within those years, beginning after December 15, 2011, and have been applied retrospectively. The provisions of these updates have affected BancShares' financial statement format but had no impact on BancShares' financial condition, results of operations or liquidity.
In September 2012, the FASB's Emerging Issues Task Force (EITF) ratified
EITF Issue No. 12-C Subsequent Accounting for an Indemnification Asset Recognized at the Acquisition Date as a Result of a Government-Assisted Acquisition of a Financial Institution
(Issue 12-C). Issue 12-C requires that any indemnification asset resulting from a government-assisted transaction be subsequently measured on the same basis as the underlying loans by using the contractual limitations of the related loss share agreement. Issue 12-C is to be applied prospectively to new and earlier transactions, including the FDIC-assisted transactions involving BancShares. Issue 12-C is effective for periods ending after December 15, 2012, with early adoption permitted. BancShares adopted the provisions of Issue 12-C effective September 30, 2012, with no material impact on BancShares' financial condition, results of operations or liquidity.
The enactment of the Dodd-Frank Wall Street Reform and Consumer Protection Act (Dodd-Frank Act) has resulted in expansive changes in many areas affecting the financial services industry in general and BancShares in particular. The legislation provides broad economic oversight, consumer financial services protection, investor protection, rating agency reform and derivative regulatory reform. Various corporate governance requirements have resulted in expanded proxy disclosures and shareholder rights. Additional provisions address the mortgage industry in an effort to strengthen lending practices. Deposit insurance reform has resulted in permanent FDIC protection for up to $250,000 of deposits and requires the FDIC’s Deposit Insurance Fund to maintain 1.35 percent of insured deposits with the burden for closing the shortfall falling to banks with more than $10.0 billion in assets.
In response to the Dodd-Frank Act, the formula used to calculate the FDIC insurance assessment paid by each FDIC-insured institution was significantly altered. The new formula was effective April 1, 2011, and changes the assessment base from deposits to total assets less equity, thereby placing a larger assessment burden on banks with large levels of non-deposit funding. The new assessment formula also considers the level of higher-risk consumer loans and higher-risk commercial and industrial loans and securities, risk factors that will potentially result in incremental insurance costs. The FDIC recently finalized their definitions of these higher-risk assets and reporting of these assets under the new definitions is effective beginning April 1, 2013. This will require BancShares to implement process and system changes to accurately identify and report these higher-risk assets.
The Dodd-Frank Act also imposes new regulatory capital requirements for banks that will result in the disallowance of qualified trust preferred capital securities as tier 1 capital beginning in 2013. This legislation requires the reduction in tier 1 capital by the amount of qualified trust preferred capital securities in equal increments over a three-year period beginning in 2013. As of December 31, 2012, BancShares has $93.5 million in trust preferred securities that were outstanding and included as tier 1 capital following the July 31, 2012, redemption of $150.0 million of trust preferred capital securities. The remaining $93.5 million in trust preferred capital securities will be eliminated from tier 1 capital in installments of $31.2 million in each year over the three-year period beginning in 2013.
On June 29, 2011, the Board of Governors of the Federal Reserve System issued a final rule establishing standards for debit card interchange fees and prohibiting network exclusivity arrangements and routing restrictions. The issuance of this rule was required by the Dodd-Frank Act. Under the final rule, the maximum permissible interchange fee that an issuer may receive for an electronic debit transaction will be the sum of 21 cents per transaction and 5 basis points multiplied by the value of the transaction. The Federal Reserve also approved an interim final rule that allows for an upward adjustment of no more than 1 cent to an issuer's debit card interchange fee if the issuer develops and implements policies and procedures reasonably designed to achieve the fraud-prevention standards set out in the interim final rule. Both rules were effective October 1, 2011, and contributed to reductions in noninterest income of $4.6 million during 2011 and $11.6 million during 2012.
In June 2012, the Federal Reserve released proposed rules regarding implementation of the Basel III regulatory capital rules for United States banking organizations. The proposed rules address a significant number of outstanding issues and questions regarding how certain provisions of Basel III are proposed to be adopted in the United States. Key provisions of the proposed rules include the total phase-out from tier 1 capital of trust preferred securities for all banks, a capital conservation buffer of 2.50 percent above minimum capital ratios, inclusion of accumulated other comprehensive income in tier 1 common equity, inclusion in tier 1 capital of perpetual preferred stock and an effective floor for tier 1 common equity of 7.00 percent. Final rules are expected to be adopted in 2013. While we have estimated the impact the proposed rules would have on our capital ratios, we are unable at this time to predict how the final rules will differ from the proposed rules and the effective date
58
of the final rules. We will continue to monitor Basel III developments and remain committed to managing our capital levels in a prudent manner. BancShares' tier 1 common equity ratio based on the current tier 1 capital and risk-adjusted assets calculations (excluding trust preferred securities) is
13.59 percent
at
December 31, 2012
, compared to the proposed fully phased-in Federal Reserve standard of 7.00 percent.
Although it is likely that further regulatory actions will arise as the Federal government attempts to address the economic situation, management is not aware of any further recommendations by regulatory authorities that, if implemented, would have or would be reasonably likely to have a material effect on liquidity, capital ratios or results of operations.
Controls and Procedures
BancShares' management, with the participation of its Chief Executive Officer and Chief Financial Officer, has evaluated the effectiveness of the design and operation of BancShares' disclosure controls and procedures as of
December 31, 2012
, in accordance with Rule 13a-15 of the Securities Exchange Act of 1934 (Exchange Act). Based upon that evaluation, as of the end of the period covered by this report, the Chief Executive Officer and the Chief Financial Officer concluded that BancShares' disclosure controls and procedures were effective to provide reasonable assurance that it is able to record, process, summarize and report in a timely manner the information required to be disclosed in the reports it files under the Exchange Act .
Management’s Annual Report on Internal Control over Financial Reporting is included on page 61 of this Report. The report of BancShares’ independent registered public accounting firm regarding BancShares’ internal control over financial reporting is included on page 62 of this Report.
Changes in Internal Control over Financial Reporting
In connection with the above evaluation of the effectiveness of BancShares' disclosure controls and procedures, except as described below, no changes in BancShares' internal control over financial reporting were identified as having occurred during the quarter ended
December 31, 2012
, that have materially affected, or are reasonably likely to materially affect, BancShares' internal control over financial reporting.
As of December 31, 2011, BancShares' management determined that a material weakness existed in its internal control over financial reporting related to the accounting and reporting for acquired loans and the receivable from the FDIC arising from FDIC-assisted transactions. Beginning in the first quarter 2012, management initiated numerous actions and initiatives to remediate the material weakness. The actions and initiatives included the engagement of a consulting firm to provide consultation and assistance primarily related to the conversion of loans acquired in the FDIC-assisted transactions to an acquired loan accounting system, the hiring of additional staff, enhancement of the methodology used to analyze the validity of the valuation of the receivable from the FDIC, design and implementation of top-level reconciliations for acquired loan balances and the preparation of quarterly yield analyses.
BancShares' management, including its Chief Executive Officer and Chief Financial Officer, completed steps during the fourth quarter to remediate the material weakness. Those steps included the conversion of all remaining loans to the acquired loan accounting system, completion of detailed testing of key data inputs to the acquired loan accounting system, completion of detailed documentation of loan accounting system procedures, controls, and processing steps, testing and utilization of a tool to estimate the receivable from and payable to the FDIC and completion of reconciliations of various balances from the acquired loan accounting system to the general ledger as of year-end. Testing and remediation was completed during the fourth quarter of 2012, and the material weakness identified in the 2011 Form 10-K is deemed to be remediated.
59
Forward-Looking Statements
Statements in this Report and exhibits relating to plans, strategies, economic performance and trends, projections of results of specific activities or investments, expectations or beliefs about future events or results, and other statements that are not descriptions of historical facts, may be forward-looking statements within the meaning of the Private Securities Litigation Reform Act of 1995, Section 27A of the Securities Act of 1933 and Section 21E of the Securities Exchange Act of 1934.
Forward-looking information is inherently subject to risks and uncertainties, and actual results could differ materially from those currently anticipated due to a number of factors, which include, but are not limited to, factors discussed in our Annual Report on Form 10-K and in other documents filed by us with the Securities and Exchange Commission from time to time.
Forward-looking statements may be identified by terms such as “may,” “will,” “should,” “could,” “expects,” “plans,” “intends,” “anticipates,” “believes,” “estimates,” “predicts,” “forecasts,” “projects,” “potential” or “continue,” or similar terms or the negative of these terms, or other statements concerning opinions or judgments of BancShares’ management about future events.
Factors that could influence the accuracy of those forward-looking statements include, but are not limited to, the financial success or changing strategies of our customers, customer acceptance of our services, products and fee structure, the competitive nature of the financial services industry, our ability to compete effectively against other financial institutions and non-traditional financial service providers in our banking markets, actions of government regulators, the level of market interest rates and our ability to manage our interest rate risk, changes in general economic conditions that affect our loan portfolio, the abilities of our borrowers to repay their loans, the values of real estate and other loan collateral, and other developments or changes in our business that we do not expect.
Although we believe that the expectations reflected in the forward-looking statements are reasonable, we cannot guarantee future results, levels of activity, performance or achievements. We have no obligation to update these forward-looking statements.
60
MANAGEMENT’S ANNUAL REPORT ON INTERNAL CONTROL OVER FINANCIAL REPORTING
The management of First Citizens BancShares, Inc. (BancShares) is responsible for establishing and maintaining adequate internal control over financial reporting. BancShares’ internal control system was designed to provide reasonable assurance to the company’s management and board of directors regarding the preparation and fair presentation of published financial statements.
BancShares' management assessed the effectiveness of the company's internal control over financial reporting as of
December 31, 2012
. In making this assessment, it used the criteria set forth by the Committee of Sponsoring Organizations of the Treadway Commission (COSO) in
Internal Control-Integrated Framework
. Based on that assessment, BancShares' management believes that, as of
December 31, 2012
, BancShares' internal control over financial reporting is effective based on those criteria.
All internal control systems, no matter how well designed, have inherent limitations. Therefore, even those systems determined to be effective can provide only reasonable assurance with respect to financial statement preparation and presentation. A control deficiency exists when the design or operation of a control does not allow management or employees, in the normal course of performing their assigned functions, to prevent or detect misstatements on a timely basis. A significant deficiency is a control deficiency, or combination of control deficiencies, in internal control over financial reporting that is less severe than a material weakness, yet important enough to merit attention by those responsible for oversight of the company's financial reporting. A material weakness in internal control over financial reporting is a control deficiency, or combination of control deficiencies, in internal control over financial reporting such that there is a reasonable possibility that a material misstatement of a company's annual or interim financial statements will not be prevented or detected on a timely basis.
BancShares' independent registered public accounting firm has issued an audit report on the company's internal control over financial reporting. This report appears on page 62.
61

REPORT OF INDEPENDENT REGISTERED PUBLIC ACCOUNTING FIRM
Board of Directors and Shareholders
First Citizens BancShares, Inc.
We have audited First Citizens BancShares, Inc. and subsidiaries' (BancShares) internal control over financial reporting as of
December 31, 2012
, based on criteria established in
Internal Control-Integrated Framework
issued by the Committee of Sponsoring Organizations of the Treadway Commission (COSO). BancShares' management is responsible for maintaining effective internal control over financial reporting and for its assessment of the effectiveness of internal control over financial reporting included in the accompanying Management's Annual Report on Internal Control Over Financial Reporting. Our responsibility is to express an opinion on BancShares' internal control over financial reporting based on our audit.
We conducted our audit in accordance with the standards of the Public Company Accounting Oversight Board (United States). Those standards require that we plan and perform the audit to obtain reasonable assurance about whether effective internal control over financial reporting was maintained in all material respects. Our audit included obtaining an understanding of internal control over financial reporting, assessing the risk that a material weakness exists, and testing and evaluating the design and operating effectiveness of internal control based on the assessed risk. Our audit also included performing such other procedures as we considered necessary in the circumstances. We believe that our audit provides a reasonable basis for our opinion.
A company's internal control over financial reporting is a process designed to provide reasonable assurance regarding the reliability of financial reporting and the preparation of financial statements for external purposes in accordance with generally accepted accounting principles. A company's internal control over financial reporting includes those policies and procedures that (1) pertain to the maintenance of records that, in reasonable detail, accurately and fairly reflect the transactions and dispositions of the assets of the company; (2) provide reasonable assurance that transactions are recorded as necessary to permit preparation of financial statements in accordance with generally accepted accounting principles, and that receipts and expenditures of the company are being made only in accordance with authorizations of management and directors of the company; and (3) provide reasonable assurance regarding prevention or timely detection of unauthorized acquisition, use, or disposition of the company's assets that could have a material effect on the financial statements.
Because of its inherent limitations, internal control over financial reporting may not prevent or detect misstatements. Also, projections of any evaluation of effectiveness to future periods are subject to the risk that controls may become inadequate because of changes in conditions, or that the degree of compliance with the policies or procedures may deteriorate.
In our opinion, BancShares maintained, in all material respects, effective internal control over financial reporting as of
December 31, 2012
, based on criteria established in
Internal Control-Integrated Framework
issued by the Committee of Sponsoring Organizations of the Treadway Commission (COSO).
We have also audited, in accordance with the standards of the Public Company Accounting Oversight Board (United States), the consolidated financial statements of BancShares as of
December 31, 2012 and 2011
and for each of the years in the three-year period ended
December 31, 2012
, and our report dated
March 1, 2013
, expressed an unqualified opinion on those consolidated financial statements.

Charlotte, North Carolina
March 1, 2013
62
REPORT OF INDEPENDENT REGISTERED PUBLIC ACCOUNTING FIRM
Board of Directors and Shareholders
First Citizens BancShares, Inc.
We have audited the accompanying consolidated balance sheets of First Citizens BancShares, Inc. and subsidiaries (BancShares) as of
December 31, 2012 and 2011
, and the related consolidated statements of income, comprehensive income, changes in shareholders' equity and cash flows for each of the years in the three-year period ended
December 31, 2012
. These consolidated financial statements are the responsibility of BancShares' management. Our responsibility is to express an opinion on these consolidated financial statements based on our audits.
We conducted our audits in accordance with the standards of the Public Company Accounting Oversight Board (United States). Those standards require that we plan and perform the audit to obtain reasonable assurance about whether the financial statements are free of material misstatement. An audit includes examining, on a test basis, evidence supporting the amounts and disclosures in the financial statements. An audit also includes assessing the accounting principles used and significant estimates made by management, as well as evaluating the overall financial statement presentation. We believe that our audits provide a reasonable basis for our opinion.
In our opinion, the consolidated financial statements referred to above present fairly, in all material respects, the financial position of BancShares as of
December 31, 2012 and 2011
, and the results of their operations and their cash flows for each of the years in the three-year period ended
December 31, 2012
, in conformity with accounting principles generally accepted in the United States of America.
We have also audited, in accordance with the standards of the Public Company Accounting Oversight Board (United States), BancShares' internal control over financial reporting as of
December 31, 2012
, based on criteria established in
Internal Control-Integrated Framework
issued by the Committee of Sponsoring Organizations of the Treadway Commission (COSO), and our report dated
March 1, 2013
, expressed an unqualified opinion.
Charlotte, North Carolina
March 1, 2013
63
Consolidated Balance Sheets
First Citizens BancShares, Inc. and Subsidiaries
|
|
December 31
|
||||||
|
|
2012
|
2011
|
|||||
|
|
(thousands, except share data)
|
||||||
|
Assets
|
|||||||
|
Cash and due from banks
|
$
|
639,730
|
|
$
|
590,801
|
|
|
|
Overnight investments
|
443,180
|
|
434,975
|
|
|||
|
Investment securities available for sale
(cost of $5,192,419 in 2012 and $4,029,858 in 2011) |
5,226,228
|
|
4,056,423
|
|
|||
|
Investment securities held to maturity
(fair value of $1,448 in 2012 and $1,980 in 2011) |
1,342
|
|
1,822
|
|
|||
|
Loans held for sale
|
86,333
|
|
92,539
|
|
|||
|
Loans and leases:
|
|||||||
|
Covered under loss share agreements
|
1,809,235
|
|
2,362,152
|
|
|||
|
Not covered under loss share agreements
|
11,576,115
|
|
11,581,637
|
|
|||
|
Less: Allowance for loan and lease losses
|
319,018
|
|
270,144
|
|
|||
|
Net loans and leases
|
13,066,332
|
|
13,673,645
|
|
|||
|
Premises and equipment
|
882,768
|
|
854,476
|
|
|||
|
Other real estate owned:
|
|||||||
|
Covered under loss share agreements
|
102,577
|
|
148,599
|
|
|||
|
Not covered under loss share agreements
|
43,513
|
|
50,399
|
|
|||
|
Income earned not collected
|
47,666
|
|
42,216
|
|
|||
|
Receivable from FDIC for loss share agreements
|
270,192
|
|
617,377
|
|
|||
|
Goodwill
|
102,625
|
|
102,625
|
|
|||
|
Other intangible assets
|
3,556
|
|
7,032
|
|
|||
|
Other assets
|
367,610
|
|
324,369
|
|
|||
|
Total assets
|
$
|
21,283,652
|
|
$
|
20,997,298
|
|
|
|
Liabilities
|
|||||||
|
Deposits:
|
|||||||
|
Noninterest-bearing
|
$
|
4,885,700
|
|
$
|
4,331,706
|
|
|
|
Interest-bearing
|
13,200,325
|
|
13,245,568
|
|
|||
|
Total deposits
|
18,086,025
|
|
17,577,274
|
|
|||
|
Short-term borrowings
|
568,505
|
|
615,222
|
|
|||
|
Long-term obligations
|
444,921
|
|
687,599
|
|
|||
|
Payable to FDIC for loss share agreements
|
101,641
|
|
77,866
|
|
|||
|
Other liabilities
|
218,553
|
|
178,209
|
|
|||
|
Total liabilities
|
19,419,645
|
|
19,136,170
|
|
|||
|
Shareholders’ equity
|
|||||||
|
Common stock:
|
|||||||
|
Class A - $1 par value (11,000,000 shares authorized; 8,588,031 shares issued and outstanding at December 31, 2012; 8,644,307 shares issued and outstanding at December 31, 2011)
|
8,588
|
|
8,644
|
|
|||
|
Class B - $1 par value (2,000,000 shares authorized; 1,032,883 shares issued and outstanding at December 31, 2012; 1,639,812 shares issued and outstanding at December 31, 2011)
|
1,033
|
|
1,640
|
|
|||
|
Surplus
|
143,766
|
|
143,766
|
|
|||
|
Retained earnings
|
1,792,726
|
|
1,773,652
|
|
|||
|
Accumulated other comprehensive loss
|
(82,106
|
)
|
(66,574
|
)
|
|||
|
Total shareholders’ equity
|
1,864,007
|
|
1,861,128
|
|
|||
|
Total liabilities and shareholders’ equity
|
$
|
21,283,652
|
|
$
|
20,997,298
|
|
|
See accompanying Notes to Consolidated Financial Statements.
64
First Citizens BancShares, Inc. and Subsidiaries
|
|
Year ended December 31
|
||||||||||
|
|
2012
|
2011
|
2010
|
||||||||
|
Interest income
|
(thousands, except share and per share data)
|
||||||||||
|
Loans and leases
|
$
|
967,601
|
|
$
|
967,737
|
|
$
|
914,545
|
|
||
|
Investment securities:
|
|||||||||||
|
U.S. Treasury
|
2,471
|
|
8,248
|
|
24,569
|
|
|||||
|
Government agency
|
15,688
|
|
19,848
|
|
12,341
|
|
|||||
|
Residential mortgage-backed securities
|
14,388
|
|
9,235
|
|
6,544
|
|
|||||
|
Corporate bonds
|
2,574
|
|
7,975
|
|
8,721
|
|
|||||
|
State, county and municipal
|
36
|
|
174
|
|
75
|
|
|||||
|
Other
|
340
|
|
548
|
|
227
|
|
|||||
|
Total interest and dividends on investments
|
35,497
|
|
46,028
|
|
52,477
|
|
|||||
|
Overnight investments
|
1,738
|
|
1,394
|
|
2,346
|
|
|||||
|
Total interest income
|
1,004,836
|
|
1,015,159
|
|
969,368
|
|
|||||
|
Interest expense
|
|||||||||||
|
Deposits
|
57,568
|
|
101,888
|
|
149,195
|
|
|||||
|
Short-term borrowings
|
5,107
|
|
5,993
|
|
5,189
|
|
|||||
|
Long-term obligations
|
27,473
|
|
36,311
|
|
40,741
|
|
|||||
|
Total interest expense
|
90,148
|
|
144,192
|
|
195,125
|
|
|||||
|
Net interest income
|
914,688
|
|
870,967
|
|
774,243
|
|
|||||
|
Provision for loan and lease losses
|
142,885
|
|
232,277
|
|
143,519
|
|
|||||
|
Net interest income after provision for loan and lease losses
|
771,803
|
|
638,690
|
|
630,724
|
|
|||||
|
Noninterest income
|
|||||||||||
|
Gains on acquisitions
|
—
|
|
150,417
|
|
136,000
|
|
|||||
|
Cardholder and merchant services
|
95,472
|
|
110,822
|
|
107,575
|
|
|||||
|
Service charges on deposit accounts
|
61,564
|
|
63,775
|
|
73,762
|
|
|||||
|
Wealth management services
|
57,236
|
|
54,974
|
|
51,378
|
|
|||||
|
Fees from processing services
|
34,816
|
|
30,487
|
|
29,097
|
|
|||||
|
Mortgage income
|
11,268
|
|
12,214
|
|
9,699
|
|
|||||
|
Insurance commissions
|
9,974
|
|
9,165
|
|
8,650
|
|
|||||
|
ATM income
|
5,279
|
|
6,020
|
|
6,656
|
|
|||||
|
Other service charges and fees
|
14,239
|
|
22,647
|
|
20,820
|
|
|||||
|
Securities gains (losses)
|
2,277
|
|
(288
|
)
|
1,952
|
|
|||||
|
Adjustments to FDIC receivable for loss share agreements
|
(101,594
|
)
|
(19,305
|
)
|
(46,806
|
)
|
|||||
|
Other
|
(1,231
|
)
|
23,438
|
|
7,431
|
|
|||||
|
Total noninterest income
|
189,300
|
|
464,366
|
|
406,214
|
|
|||||
|
Noninterest expense
|
|||||||||||
|
Salaries and wages
|
307,331
|
|
308,088
|
|
297,897
|
|
|||||
|
Employee benefits
|
78,861
|
|
72,526
|
|
64,733
|
|
|||||
|
Occupancy, net
|
74,798
|
|
74,832
|
|
72,766
|
|
|||||
|
Equipment
|
74,822
|
|
69,951
|
|
66,894
|
|
|||||
|
FDIC deposit insurance
|
10,656
|
|
16,459
|
|
23,167
|
|
|||||
|
Foreclosure-related expenses
|
40,654
|
|
46,133
|
|
20,439
|
|
|||||
|
Other
|
179,811
|
|
204,936
|
|
187,480
|
|
|||||
|
Total noninterest expense
|
766,933
|
|
792,925
|
|
733,376
|
|
|||||
|
Income before income taxes
|
194,170
|
|
310,131
|
|
303,562
|
|
|||||
|
Income taxes
|
59,822
|
|
115,103
|
|
110,518
|
|
|||||
|
Net income
|
$
|
134,348
|
|
$
|
195,028
|
|
$
|
193,044
|
|
||
|
Per share information
|
|||||||||||
|
Net income per share
|
$
|
13.11
|
|
$
|
18.80
|
|
$
|
18.50
|
|
||
|
Dividends declared per share
|
1.20
|
|
1.20
|
|
1.20
|
|
|||||
|
Average shares outstanding
|
10,244,472
|
|
10,376,445
|
|
10,434,453
|
|
|||||
See accompanying Notes to Consolidated Financial Statements.
65
Consolidated Statements of Comprehensive Income
First Citizens BancShares, Inc. and Subsidiaries
|
|
Year ended December 31
|
||||||||||
|
|
2012
|
2011
|
2010
|
||||||||
|
(thousands)
|
|||||||||||
|
Net income
|
$
|
134,348
|
|
$
|
195,028
|
|
$
|
193,044
|
|
||
|
Other comprehensive income
|
|||||||||||
|
Unrealized gains on securities:
|
|||||||||||
|
Change in unrealized securities gains arising during period
|
9,566
|
|
3,108
|
|
(10,201
|
)
|
|||||
|
Deferred tax (expense) benefit
|
(3,759
|
)
|
(1,148
|
)
|
3,760
|
|
|||||
|
Reclassification adjustment for losses (gains) included in net income
|
(2,322
|
)
|
262
|
|
(2,373
|
)
|
|||||
|
Deferred tax expense (benefit)
|
917
|
|
(159
|
)
|
1,436
|
|
|||||
|
Total change in unrealized gains on securities, net of tax
|
4,402
|
|
2,063
|
|
(7,378
|
)
|
|||||
|
Change in fair value of cash flow hedges:
|
|||||||||||
|
Change in unrecognized loss on cash flow hedges
|
(2,779
|
)
|
(8,329
|
)
|
(9,994
|
)
|
|||||
|
Deferred tax benefit
|
1,097
|
|
3,289
|
|
3,946
|
|
|||||
|
Reclassification adjustment for losses included in net income
|
3,095
|
|
7,107
|
|
5,869
|
|
|||||
|
Deferred tax benefit
|
(1,222
|
)
|
(2,806
|
)
|
(2,317
|
)
|
|||||
|
Total change in unrecognized loss on cash flow hedges, net of tax
|
191
|
|
(739
|
)
|
(2,496
|
)
|
|||||
|
Change in pension obligation:
|
|||||||||||
|
Change in pension obligation
|
(44,315
|
)
|
(58,630
|
)
|
(6,815
|
)
|
|||||
|
Deferred tax benefit
|
17,354
|
|
22,959
|
|
2,669
|
|
|||||
|
Reclassification adjustment for losses included in net income
|
11,236
|
|
7,071
|
|
4,010
|
|
|||||
|
Deferred tax benefit
|
(4,400
|
)
|
(2,769
|
)
|
(1,570
|
)
|
|||||
|
Total change in pension obligation, net of tax
|
(20,125
|
)
|
(31,369
|
)
|
(1,706
|
)
|
|||||
|
Other comprehensive loss, net of tax
|
(15,532
|
)
|
(30,045
|
)
|
(11,580
|
)
|
|||||
|
Total comprehensive income
|
$
|
118,816
|
|
$
|
164,983
|
|
$
|
181,464
|
|
||
See accompanying Notes to Consolidated Financial Statements.
66
Consolidated Statements of Changes In Shareholders’ Equity
First Citizens BancShares, Inc. and Subsidiaries
|
Class A
Common Stock |
Class B
Common Stock |
Surplus
|
Retained
Earnings |
Accumulated
Other Comprehensive Loss |
Total
Shareholders’ Equity |
||||||||||||||||||
|
|
(thousands, except share data)
|
||||||||||||||||||||||
|
Balance at December 31, 2009
|
$
|
8,757
|
|
$
|
1,678
|
|
$
|
143,766
|
|
$
|
1,429,863
|
|
$
|
(24,949
|
)
|
$
|
1,559,115
|
|
|||||
|
Adjustment resulting from adoption of a change in accounting for QSPEs and controlling financial interests effective January 1, 2010
|
—
|
|
—
|
|
—
|
|
4,904
|
|
—
|
|
4,904
|
|
|||||||||||
|
Net income
|
—
|
|
—
|
|
—
|
|
193,044
|
|
—
|
|
193,044
|
|
|||||||||||
|
Other comprehensive loss, net of tax
|
—
|
|
—
|
|
—
|
|
—
|
|
(11,580
|
)
|
(11,580
|
)
|
|||||||||||
|
Cash dividends ($1.20 per share)
|
—
|
|
—
|
|
—
|
|
(12,521
|
)
|
—
|
|
(12,521
|
)
|
|||||||||||
|
Balance at December 31, 2010
|
8,757
|
|
1,678
|
|
143,766
|
|
1,615,290
|
|
(36,529
|
)
|
1,732,962
|
|
|||||||||||
|
Net income
|
—
|
|
—
|
|
—
|
|
195,028
|
|
—
|
|
195,028
|
|
|||||||||||
|
Other comprehensive loss, net of tax
|
—
|
|
—
|
|
—
|
|
—
|
|
(30,045
|
)
|
(30,045
|
)
|
|||||||||||
|
Repurchase of 112,471 shares of Class A common stock
|
(113
|
)
|
—
|
|
—
|
|
(16,672
|
)
|
—
|
|
(16,785
|
)
|
|||||||||||
|
Repurchase of 37,863 shares of Class B common stock
|
—
|
|
(38
|
)
|
—
|
|
(7,564
|
)
|
—
|
|
(7,602
|
)
|
|||||||||||
|
Cash dividends ($1.20 per share)
|
—
|
|
—
|
|
—
|
|
(12,430
|
)
|
—
|
|
(12,430
|
)
|
|||||||||||
|
Balance at December 31, 2011
|
8,644
|
|
1,640
|
|
143,766
|
|
1,773,652
|
|
(66,574
|
)
|
1,861,128
|
|
|||||||||||
|
Net income
|
—
|
|
—
|
|
—
|
|
134,348
|
|
—
|
|
134,348
|
|
|||||||||||
|
Other comprehensive loss, net of tax
|
—
|
|
—
|
|
—
|
|
—
|
|
(15,532
|
)
|
(15,532
|
)
|
|||||||||||
|
Repurchase of 56,276 shares of Class A common stock
|
(56
|
)
|
—
|
|
—
|
|
(9,075
|
)
|
—
|
|
(9,131
|
)
|
|||||||||||
|
Repurchase of 606,929 shares of Class B common stock
|
—
|
|
(607
|
)
|
—
|
|
(93,886
|
)
|
—
|
|
(94,493
|
)
|
|||||||||||
|
Cash dividends ($1.20 per share)
|
—
|
|
—
|
|
—
|
|
(12,313
|
)
|
—
|
|
(12,313
|
)
|
|||||||||||
|
Balance at December 31, 2012
|
$
|
8,588
|
|
$
|
1,033
|
|
$
|
143,766
|
|
$
|
1,792,726
|
|
$
|
(82,106
|
)
|
$
|
1,864,007
|
|
|||||
See accompanying Notes to Consolidated Financial Statements.
67
First Citizens BancShares, Inc. and Subsidiaries
|
|
Year ended December 31
|
||||||||||
|
|
2012
|
2011
|
2010
|
||||||||
|
(thousands)
|
|||||||||||
|
Operating activities
|
|||||||||||
|
Net income
|
$
|
134,348
|
|
$
|
195,028
|
|
$
|
193,044
|
|
||
|
Adjustments to reconcile net income to cash provided by operating activities:
|
|||||||||||
|
Provision for loan and lease losses
|
142,885
|
|
232,277
|
|
143,519
|
|
|||||
|
Deferred tax benefit
|
(35,265
|
)
|
(16,637
|
)
|
(41,375
|
)
|
|||||
|
Change in current taxes payable
|
29,095
|
|
(2,820
|
)
|
(25,432
|
)
|
|||||
|
Depreciation
|
68,941
|
|
65,170
|
|
62,761
|
|
|||||
|
Change in accrued interest payable
|
(14,366
|
)
|
(14,340
|
)
|
(877
|
)
|
|||||
|
Change in income earned not collected
|
(5,450
|
)
|
48,423
|
|
(15,300
|
)
|
|||||
|
Gains on acquisitions
|
—
|
|
(150,417
|
)
|
(136,000
|
)
|
|||||
|
Securities losses (gains)
|
(2,277
|
)
|
288
|
|
(1,952
|
)
|
|||||
|
Origination of loans held for sale
|
(575,705
|
)
|
(513,253
|
)
|
(605,302
|
)
|
|||||
|
Proceeds from sales of loans held for sale
|
589,376
|
|
518,398
|
|
592,608
|
|
|||||
|
Gain on sales of loans held for sale
|
(7,465
|
)
|
(8,751
|
)
|
(8,858
|
)
|
|||||
|
Loss on other real estate
|
36,229
|
|
53,450
|
|
15,633
|
|
|||||
|
Gain on retirement of long-term obligations
|
—
|
|
(9,685
|
)
|
—
|
|
|||||
|
Net amortization of premiums and accretion of discounts
|
(158,227
|
)
|
(194,434
|
)
|
(119,085
|
)
|
|||||
|
Change in FDIC receivable for loss share agreements
|
(7,181
|
)
|
44,551
|
|
26,284
|
|
|||||
|
Net change in other assets
|
(17,617
|
)
|
89,979
|
|
(6,810
|
)
|
|||||
|
Net change in other liabilities
|
23,967
|
|
(1,541
|
)
|
21,455
|
|
|||||
|
Net cash provided by operating activities
|
201,288
|
|
335,686
|
|
94,313
|
|
|||||
|
Investing activities
|
|||||||||||
|
Net change in loans and leases outstanding
|
627,806
|
|
473,974
|
|
926,122
|
|
|||||
|
Purchases of investment securities available for sale
|
(5,169,641
|
)
|
(3,480,699
|
)
|
(4,192,967
|
)
|
|||||
|
Proceeds from maturities of investment securities held to maturity
|
480
|
|
709
|
|
1,069
|
|
|||||
|
Proceeds from maturities of investment securities available for sale
|
3,986,370
|
|
4,002,724
|
|
2,592,097
|
|
|||||
|
Proceeds from sales of investment securities available for sale
|
7,900
|
|
242,023
|
|
38,496
|
|
|||||
|
Net change in overnight investments
|
(8,205
|
)
|
(36,585
|
)
|
324,870
|
|
|||||
|
Cash received from the FDIC for loss share agreements
|
251,972
|
|
293,067
|
|
52,422
|
|
|||||
|
Proceeds from sales of other real estate
|
147,858
|
|
135,803
|
|
143,740
|
|
|||||
|
Additions to premises and equipment
|
(88,883
|
)
|
(76,901
|
)
|
(70,836
|
)
|
|||||
|
Dispositions of premises and equipment
|
—
|
|
—
|
|
1,316
|
|
|||||
|
Net cash received from acquisitions
|
—
|
|
1,150,879
|
|
106,489
|
|
|||||
|
Net cash provided (used) by investing activities
|
(244,343
|
)
|
2,704,994
|
|
(77,182
|
)
|
|||||
|
Financing activities
|
|||||||||||
|
Net change in time deposits
|
(1,049,761
|
)
|
(2,273,418
|
)
|
(743,191
|
)
|
|||||
|
Net change in demand and other interest-bearing deposits
|
1,558,512
|
|
4,417
|
|
1,333,159
|
|
|||||
|
Net change in short-term borrowings
|
(101,717
|
)
|
(283,440
|
)
|
(500,217
|
)
|
|||||
|
Repayment of long-term obligations
|
(196,338
|
)
|
(320,730
|
)
|
(114,425
|
)
|
|||||
|
Origination of long-term obligations
|
310
|
|
—
|
|
—
|
|
|||||
|
Repurchase of common stock
|
(103,624
|
)
|
(24,387
|
)
|
—
|
|
|||||
|
Cash dividends paid
|
(15,398
|
)
|
(12,499
|
)
|
(12,521
|
)
|
|||||
|
Net cash provided (used) by financing activities
|
91,984
|
|
(2,910,057
|
)
|
(37,195
|
)
|
|||||
|
Change in cash and due from banks
|
48,929
|
|
130,623
|
|
(20,064
|
)
|
|||||
|
Cash and due from banks at beginning of period
|
590,801
|
|
460,178
|
|
480,242
|
|
|||||
|
Cash and due from banks at end of period
|
$
|
639,730
|
|
$
|
590,801
|
|
$
|
460,178
|
|
||
|
Cash payments for:
|
|||||||||||
|
Interest
|
$
|
104,514
|
|
$
|
157,477
|
|
$
|
196,002
|
|
||
|
Income taxes
|
66,453
|
|
91,465
|
|
187,183
|
|
|||||
|
Supplemental disclosure of noncash investing and financing activities:
|
|||||||||||
|
Change in unrealized securities gains (losses)
|
$
|
7,244
|
|
$
|
3,370
|
|
$
|
(12,574
|
)
|
||
|
Change in fair value of cash flow hedges
|
316
|
|
(1,222
|
)
|
(4,125
|
)
|
|||||
|
Change in pension obligation
|
(33,079
|
)
|
(51,559
|
)
|
(2,804
|
)
|
|||||
|
Transfers of loans to other real estate
|
140,645
|
|
213,195
|
|
156,918
|
|
|||||
|
Acquisitions:
|
|||||||||||
|
Assets acquired
|
—
|
|
2,934,464
|
|
2,291,659
|
|
|||||
|
Liabilities assumed
|
—
|
|
2,784,047
|
|
2,155,861
|
|
|||||
|
Net assets acquired
|
—
|
|
150,417
|
|
135,798
|
|
|||||
See accompanying Notes to Consolidated Financial Statements.
68
FIRST CITIZENS BANCSHARES, INC. AND SUBSIDIARIES
NOTES TO CONSOLIDATED FINANCIAL STATEMENTS
(dollars in thousands)
NOTE A
- SUMMARY OF SIGNIFICANT ACCOUNTING POLICIES
General
First Citizens BancShares, Inc. (BancShares) is a financial holding company organized under the laws of Delaware and conducts operations through its banking subsidiary, First-Citizens Bank & Trust Company (FCB), which is headquartered in Raleigh, North Carolina.
The accounting and reporting policies of BancShares and its subsidiaries are in accordance with accounting principles generally accepted in the United States of America (GAAP). Additionally, where applicable, the policies conform to the accounting and reporting guidelines prescribed by bank regulatory authorities. The following is a summary of BancShares' more significant accounting policies.
Nature of Operations
FCB operates
414
branches in North Carolina, Virginia, West Virginia, Maryland, Tennessee, California, Washington, Florida, Washington, DC, Georgia, Texas, Arizona, New Mexico, Colorado, Oregon, Missouri, Oklahoma and Kansas. FCB provides full-service banking services designed to meet the needs of retail and commercial customers in the markets in which it operates. The services provided include transaction and savings deposit accounts, commercial and consumer loans, trust, and asset management. Investment services, including sales of annuities and third party mutual funds are offered through First Citizens Investor Services, Inc., and title insurance is offered through Neuse Financial Services, Inc.
Principles of Consolidation
The consolidated financial statements of BancShares include the accounts of BancShares and those subsidiaries that are majority owned by BancShares and over which BancShares exercises control. In consolidation, all significant intercompany accounts and transactions are eliminated. The results of operations of companies or assets acquired are included only from the dates of acquisition. All material wholly-owned and majority-owned subsidiaries are consolidated unless GAAP requires otherwise.
On
January 7, 2011
, IronStone Bank (ISB), a federally-chartered thrift institution and wholly-owned subsidiary of BancShares, was legally merged into FCB resulting in a single banking subsidiary of BancShares. Prior to the
January 2011
merger, FCB and ISB were considered to be distinct operating segments. As a result of the merger and various organizational changes resulting from the merger, there is no longer a focus on the discrete financial measures of each entity, and, based on application of GAAP, no other reportable operating segments exist. Therefore, BancShares now operates as one reportable segment.
FCB has investments in certain low income housing tax credit and renewable energy LLC's that have been evaluated and determined to be variable interest entities (VIEs). VIEs are legal entities in which equity investors do not have sufficient equity at risk for the entity to independently finance its activities, or as a group, the holders of the equity investment at risk lack the power through voting or similar rights to direct the activities of the entity that most significantly impact its economic performance, or do not have the obligation to absorb the expected losses of the entity or the right to receive expected residual returns of the entity. Consolidation of a VIE is considered appropriate if a reporting entity holds a controlling financial interest in the VIE. Analysis of these investments concluded that FCB is not the primary beneficiary and does not hold a controlling interest in the VIEs and, therefore, the assets and liabilities of these partnerships are not consolidated into the financial statements of FCB or BancShares. The recorded investment in these partnerships is reported within other assets in BancShares' Consolidated Balance Sheets.
Reclassifications
In certain instances, amounts reported in prior years' consolidated financial statements have been reclassified to conform to current financial statement presentation. Such reclassifications had no effect on previously reported cash flows, shareholders'
69
FIRST CITIZENS BANCSHARES, INC. AND SUBSIDIARIES
NOTES TO CONSOLIDATED FINANCIAL STATEMENTS—(Continued)
(dollars in thousands)
equity or net income. For
2012
, the payable to FDIC for loss share agreements, which was previously netted against the receivable from FDIC for loss share agreements and reported as an asset, was reclassified and is now included as a liability. Income taxes receivable from federal and state tax authorities, which were previously netted within other liabilities, were reclassified and are now included as other assets.
Use of Estimates in the Preparation of Financial Statements
The preparation of consolidated financial statements in conformity with GAAP requires management to make estimates and assumptions that affect the reported amounts of assets and liabilities and disclosure of contingent liabilities at the date of the consolidated financial statements and the reported amounts of revenues and expenses during the reporting period. Different assumptions in the application of these policies could result in material changes in BancShares' consolidated financial position and/or consolidated results of operations and related disclosures. The most significant estimates made by BancShares in the preparation of its consolidated financial statements are the determination of the following:
|
•
|
Allowance for loan and lease losses
|
|
•
|
Fair value estimates
|
|
•
|
Receivable from FDIC for loss share agreements
|
|
•
|
Payable to FDIC for loss share agreements
|
|
•
|
Purchase accounting related adjustments
|
|
•
|
Pension plan assumptions
|
|
•
|
Income taxes
|
Business Combinations
BancShares accounts for all business combinations using the acquisition method of accounting as required by Accounting Standards Codification (ASC) Topic 805, Business Combinations. Under this method of accounting, acquired assets and assumed liabilities are included with the acquirer's accounts as of the date of acquisition with any excess of purchase price over the fair value of the net assets acquired (including identifiable intangibles) capitalized as goodwill. In addition, acquisition-related costs and restructuring costs are recognized as period expenses as incurred.
The acquired assets and assumed liabilities are recorded at estimated fair values. Management makes significant estimates and exercises significant judgment in accounting for business combinations. Management judgmentally assigns risk ratings to loans based on credit quality, appraisals and estimated collateral values, and estimated expected cash flows to measure fair values for loans. Other real estate (OREO) acquired through foreclosure is valued based upon pending sales contracts and appraised values, adjusted for current market conditions. Management uses quoted or current market prices to determine the fair value of investment securities. Fair valu
es of deposits, short-term borrowings and long-term obligations are based on current market interest rates and are inclusive of any applicable prepayment penalties.
Fair values of acquired assets and assumed liabilities are subject to refinement for up to
one
year after the closing date of the transaction (the measurement period) as additional information regarding acquisition date fair values becomes available. As of
December 31, 2012
, BancShares has no acquisitions still in the measurement period. Subsequent accounting for acquired assets and liabilities will typically follow the accounting guidance otherwise applicable to these assets and liabilities.
During
2011, 2010 and 2009
, FCB acquired certain assets and assumed certain liabilities of
six
entities as noted below (collectively referred to as “the Acquisitions”) with the assistance of the FDIC, which had been appointed Receiver of each entity by its respective state banking authority.
|
Name of entity
|
|
Headquarters location
|
|
Date of transaction
|
|
Colorado Capital Bank (CCB)
|
Castle Rock, Colorado
|
July 8, 2011
|
||
|
United Western Bank (United Western)
|
|
Denver, Colorado
|
|
January 21, 2011
|
|
Sun American Bank (SAB)
|
|
Boca Raton, Florida
|
|
March 5, 2010
|
|
First Regional Bank (First Regional)
|
|
Los Angeles, California
|
|
January 29, 2010
|
|
Venture Bank (VB)
|
|
Lacey, Washington
|
|
September 11, 2009
|
|
Temecula Valley Bank (TVB)
|
|
Temecula, California
|
|
July 17, 2009
|
70
FIRST CITIZENS BANCSHARES, INC. AND SUBSIDIARIES
NOTES TO CONSOLIDATED FINANCIAL STATEMENTS—(Continued)
(dollars in thousands)
Cash and Cash Equivalents
Cash and cash equivalents include cash and due from banks, interest-bearing deposits with banks, and Federal funds sold. Cash and cash equivalents have maturities of three months or less. Accordingly, the carrying amount of such instruments is considered a reasonable estimate of fair value.
Investment Securities
BancShares' investments consist of government agency securities, U.S. Treasury securities, mortgage-backed securities, corporate bonds, state, county, and municipal obligations and equity securities.
BancShares classifies marketable investment securities as held to maturity, available for sale or trading. Interest income and dividends on securities are recognized in interest income on an accrual basis. Premiums and discounts on debt securities are amortized as an adjustment to interest income using the interest method. At
December 31, 2012, and 2011
, BancShares had no investment securities held for trading purposes.
Debt securities are classified as held to maturity where BancShares has both the intent and ability to hold the securities to maturity. These securities are reported at amortized cost.
Investment securities that may be sold to meet liquidity needs arising from unanticipated deposit and loan fluctuations, changes in regulatory capital requirements, or unforeseen changes in market conditions, are classified as available for sale. Securities available for sale are reported at estimated fair value, with unrealized gains and losses reported in accumulated other comprehensive income or loss, net of deferred income taxes, in the shareholders' equity section of the Consolidated Balance Sheets. Gains or losses realized from the sale of securities available for sale are determined by specific identification and are included in noninterest income. As of
December 31, 2012
, there was no intent to sell any of the securities classified as available for sale.
BancSha
res evaluates each held to maturity and available for sale security in a loss position for other-than-temporary impairment (OTTI) in accordance with ASC Topic 320-10 at least quarterly. BancShares considers such factors as the length of time and the extent to which the market value has been below amortized cost, long term expectations and recent experience regarding principal and interest payments, BancShares' intent to sell, and whether it is more likely than not that it would be required to sell those securities before the anticipated recovery of the amortized cost basis. The credit component of an OTTI loss is recognized in earnings and the non-credit component is recognized in accumulated other comprehensive income in situations where BancShares does not intend to sell the security, and it is more likely than not that BancShares will not be required to sell the security prior to recovery.
Nonmarketable Securities - FHLB Stock and TARP Stock
Federal law requires a member institution of the Federal Home Loan Bank (FHLB) system to purchase and hold restricted stock of its district FHLB according to a predetermined formula. This stock is restricted in that it may only be sold to the FHLB and all sales must be at par. Accordingly, the FHLB restricted stock is carried at cost, less any applicable impairment charges. Investments in preferred stock that had initially been issued under the U. S. Treasury's Troubled Asset Recovery Program (TARP) and were purchased in the auction process initiated when the U. S. Treasury decided to liquidate its investments are carried at cost, less any applicable impairment charges because the securities are not traded and an active market does not exist. Nonmarketable securities are
periodically evaluated for impairment. BancShares considers positive and negative evidence, including the profitability and asset quality of the issuer, dividend payment history and recent redemption experience, when determining the ultimate recoverability of the recorded investment.
Investments in FHLB stock and TARP stock are included in other assets.
Loans Held For Sale
BancShares accounts for new originations of prime residential mortgage loans at the lower of aggregate cost or fair value. Gains and losses on sales of mortgage loans are charged to the Consolidated Statements of Income in mortgage income.
71
FIRST CITIZENS BANCSHARES, INC. AND SUBSIDIARIES
NOTES TO CONSOLIDATED FINANCIAL STATEMENTS—(Continued)
(dollars in thousands)
Loans and Leases
BancShares' accounting methods for loans and leases differ depending on whether they are originated or acquired, and if acquired, whether or not the acquired assets reflect credit deterioration since the date of origination such that it is probable at the date of acquisition that BancShares will be unable to collect all contractually required payments.
Originated Loans and Leases
Loans and leases for which management has the intent and ability to hold for the foreseeable future are classified as held for investment and carried at the principal amount outstanding net of any unearned income, charge-offs, and unamortized fees and costs on originated loans. Nonrefundable fees collected and certain direct costs incurred related to loan originations are deferred and recorded as an adjustment to loans and leases outstanding. The net amount of the nonrefundable fees and costs are amortized to interest income over the contractual lives using methods that approximate a constant yield.
BancShares classifies all loans and leases as past due when the payment of principal and interest based upon contractual terms is greater than 30 days delinquent. When commercial loans are placed on nonaccrual status, a charge-off is recorded to decrease the carrying value of such loan to the estimated fair value of the collateral securing the loan. Consumer loans are subject to mandatory charge-off at a specified delinquency date consistent with regulatory guidelines. As such, consumer loans are subject to collateral valuation and charge-off, as applicable, when they are moved to nonaccrual status as described below.
Acquired Loans and Leases
Acquired loans and leases are recorded at fair value at the date of acquisition. No allowance for loan and lease losses is recorded on the acquisition date as the fair value of the acquired assets incorporates assumptions regarding credit risk.
Acquired loans and leases are evaluated at acquisition and where a discount is noted at least in part due to credit, the loans are accounted for under the guidance in ASC Topic 310-30,
Loans and Debt Securities Acquired with Deteriorated Credit Quality
. Purchased impaired loans and leases reflect credit deterioration since origination such that it is probable at acquisition that BancShares will be unable to collect all contractually required payments. As of the acquisition date, the difference between contractually required payments and the cash flows expected to be collected is the nonaccretable difference, which is included as a reduction to the carrying amount of acquired loans and leases. Any excess of cash flows expected at acquisition over the estimated fair value is the accretable yield and is recognized in interest income over the asset's remaining life using a level yield method if the timing and amount of the future cash flows is reasonably estimable.
Over the life of acquired loans and leases, BancShares continues to estimate cash flows expected to be collected on individual loans and leases or on pools of loans and leases sharing common risk characteristics. BancShares evaluates at each balance sheet date whether the estimated cash flows and corresponding present value of its loans and leases determined using the effective interest rates has decreased and if so, recognizes a provision for loan loss in its Consolidated Statements of Income. For any increases in cash flows expected to be collected, BancShares adjusts any prior recorded allowance for loan and lease losses first, and then the amount of accretable yield recognized on a prospective basis over the loan's or pool's remaining life.
BancShares is accounting for all loans and leases acquired from Temecula Valley Bank (TVB), Venture Bank (VB), First Regional Bank (First Regional) and Sun American Bank (SAB), and all non-mortgage loans acquired from United Western Bank (United Western) on a loan level basis.
BancShares did not initially estimate the timing of cash flows for loans and leases acquired in the TVB or VB transactions at the dates of the acquisitions and applied the cost recovery method until the timing and amount of cash flows were estimated in later periods. Cash flow analyses were performed to determine the timing and amount of cash flows expected to be collected. During
2012
, all acquired loans and leases, including those of TVB, VB, First Regional and United Western, were loaded into an acquired loan accounting system that facilitates estimating cash flows and computing the related accretion and impairment, based upon management assumptions. As a result, accretion income is now being recognized on all non-pooled loans and leases except for situations when the timing and amount of future cash flows can still not be determined. Loans and leases with uncertain future cash flows are accounted for under the cost recovery method, and those loans and leases are generally reported as nonaccrual.
72
FIRST CITIZENS BANCSHARES, INC. AND SUBSIDIARIES
NOTES TO CONSOLIDATED FINANCIAL STATEMENTS—(Continued)
(dollars in thousands)
For loans and leases where the cash flow analysis was initially performed at the loan pool level the amount of accretable yield and nonaccretable difference is determined at the pool level. Each loan pool is made up of assets with similar characteristics at the date of acquisition including loan type, collateral type and performance status. All loan pools that have accretable yield to be recognized in interest income are classified as accruing regardless of the status of individual loans within the pool.
Nonperforming Assets
Nonperforming assets include nonaccrual loans and leases and foreclosed property. Foreclosed property consists of real estate and other assets acquired as a result of customers' loan defaults. The majority of loans and leases are placed on nonaccrual status when it is probable that principal or interest is not fully collectible, or generally when principal or interest becomes 90 days past due, whichever occurs first.
Generally, when loans and leases are placed on nonaccrual status, accrued interest receivable that had been recognized in the current year is reversed against interest income; accrued interest receivable that had been recognized in a prior year is charged off. Interest payments received thereafter are applied as a reduction to the remaining principal balance as long as concern exists as to the ultimate collection of the principal. Loans and leases are generally removed from nonaccrual status when they become current as to both principal and interest and concern no longer exists as to the collectability of principal and interest. Residential mortgage loans return to an accrual status when the loan balance is less than three payments past due.
Management considers loans and leases not covered by FDIC loss share agreements to be impaired when, based on current information and events, it is probable that a borrower will be unable to pay all amounts due according to the contractual terms of the loan agreement. Impaired loans and leases greater than
$500
at
December 31, 2012
, and to
$1,000
at
December 31, 2011
, are valued by either the discounted expected cash flow method using the loan's original effective interest rate or the collateral value. When the ultimate collectibility of an impaired loan's principal is doubtful, all cash receipts are applied to principal. Once the recorded principal balance has been reduced to zero, future cash receipts are applied to interest income, to the extent that any interest has been foregone. The adoption of a lower impairment threshold during 2012 was made to enable more accurate measurement of impairment on an individual loan basis.
When a secured loan is determined to be uncollectible, it is charged off by reducing the loan balance and the related allowance for the portion of the loan that exceeds the estimated collateral value. A loan is deemed to be uncollectible when the financial position of the borrower indicates that collection of all or part of future payments due will not occur. Unsecured loans are charged off in full when they become four months past due unless a definitive plan has been established for repayment.
Noncovered other real estate owned (OREO) acquired as a result of foreclosure is carried at the lower of cost or net realizable value. Net realizable value equals fair value less estimated selling costs. Cost is determined based on the sum of unpaid principal, accrued but unpaid interest, and acquisition costs associated with the loan. Any excess of cost over net realizable value at the time of foreclosure is charged to the allowance for loan and lease losses.
Nonperforming assets are subject to periodic revaluations of the underlying collateral. The periodic revaluations are generally based on the appraised value of the property and may include additional adjustments based upon management's review of the valuation and specific knowledge of the nonperforming asset. Valuations are updated at least annually and upon foreclosure, an updated appraisal is ordered if management determines one is necessary. Routine maintenance costs, subsequent declines in market value and net losses on disposal are included in foreclosed property expense. Gains and losses resulting form the sale or writedown of OREO and income and expenses related to its operation are recorded in other noninterest income.
OREO covered by loss share agreements with the FDIC is reported exclusive of expected reimbursement cash flows from the FDIC at the lower of cost or appraised value, net of estimate selling costs. Subsequent downward adjustments to the estimated recoverable value of covered OREO result in a reduction of covered OREO, a charge to other noninterest expense and an increase in the FDIC receivable for the estimated amount to be reimbursed, with a corresponding amount recorded as an adjustment to other noninterest income.
Modifications to a borrower's debt agreement are considered troubled debt restructurings (TDRs) if a concession is granted for economic or legal reasons related to a borrower's financial difficulties that otherwise would not be considered. TDRs are undertaken in order to improve the likelihood of collection on the loan and may take the form of modifications made
73
FIRST CITIZENS BANCSHARES, INC. AND SUBSIDIARIES
NOTES TO CONSOLIDATED FINANCIAL STATEMENTS—(Continued)
(dollars in thousands)
with the stated interest rate lower than the current market rate for new debt with similar risk, other modifications to the structure of the loan that fall outside of normal underwriting policies and procedures, or in certain limited circumstances forgiveness of principal or interest. Modifications of acquired loans that are part of a pool accounted for as a single asset are not considered restructurings. TDRs can involve loans remaining on nonaccrual, moving to nonaccrual, or continuing on accruing status, depending on the individual facts and circumstances of the borrower. In circumstances where a portion of the loan balance is charged off, BancShares typically classifies the remaining balance as nonaccrual.
For all accruing TDR loans greater than $500, management uses a discounted cash flow approach at the individual loan level. For all other TDR loans, management's analysis is performed using a pooled approach, grouping loans by similar loan types and risk characteristics, and using a discounted cash flow approach. In developing discount rates for the pooled approach, management compared the subsequent default rate on TDR loans to the delinquency rates on the entire portfolio. Based on this analysis, management determined that the discount rate was basically twice the historical loss rate of similar non-restructured loans. Therefore, management doubled the historical loss rates in building the discount rate.
In connection with commercial TDRs, the decision to maintain a loan that has been restructured on accrual status is based on a current credit evaluation of the borrower's financial condition and prospects for repayment under the modified terms. This evaluation includes consideration of the borrower's current capacity to pay, which among other things may include a review of the borrower's current financial statements, an analysis of cash flow documenting the borrower's capacity to pay all debt obligations, and an evaluation of secondary sources of payment from the borrower and any guarantors. This evaluation also includes an evaluation of the borrower's current willingness to pay, which may include a review of past payment history, an evaluation of the borrower's willingness to provide information on a timely basis, and consideration of offers from the borrower to provide additional collateral or guarantor support. The credit evaluation also reflects consideration of the adequacy of collateral to cover all principal and interest and trends indicating improving profitability and collectability of receivables.
Restructured nonaccrual loans may be returned to accrual status based on a current credit evaluation of the borrower's financial condition and prospects for repayment under the modified terms. This evaluation includes consideration of the borrower's sustained historical repayment performance for a reasonable period, generally a minimum of six months, prior to the date on which the loan is returned to accrual status. Sustained historical repayment performance for a reasonable time prior to the restructuring may also be considered.
Covered Assets and Receivable from FDIC for Loss Share Agreements
Assets subject to loss share agreements with the FDIC are labeled “covered” on the balance sheet and include certain acquired loans and other assets. These loss share agreements afford BancShares significant protection. The agreements cover realized losses on certain loans and other assets purchased from the FDIC during the time period specified in the agreements. Realized losses covered include loan contractual balances, accrued interest on loans for up to 90 days, the book value of foreclosed real estate acquired, and certain direct costs, less cash or other consideration received by BancShares.
Because the FDIC will reimburse BancShares for losses on certain loans and other assets acquired, an indemnification asset, the Receivable from FDIC for loss share agreements, is recorded at fair value at the acquisition date. The indemnification asset is recognized at the same time as the indemnified loans and other assets, and measured on the same basis, subject to collectability or contractual limitations. The fair value of the loss share agreements on the acquisition date reflect the discounted reimbursements expected to be received from the FDIC, using an appropriate discount rate, which was based on the market rate for a similar term security at the time of the acquisition adjusted for additional risk premium.
The loss share agreements continue to be measured on the same basis as the related indemnified assets. Because the acquired loans are subject to the accounting prescribed by ASC Topic 310, subsequent changes to the basis of the loss share agreements also follow that model. Deterioration in the credit quality of the loans (immediately recorded as an adjustment to the allowance for loan losses) would immediately increase the basis of the loss share agreements, with the offset recorded through the consolidated statement of income. Improvements in the credit quality or cash flows of loans (reflected as an adjustment to yield and accreted into income over the remaining life of the loans) decrease the basis of the loss share agreements, with such decrease being amortized into income over (1) the same period or (2) the life of the loss share agreements, whichever is shorter. Loss assumptions used in the basis of the indemnified loans are consistent with the loss assumptions used to measure the indemnification asset. Discounts and premiums on the indemnification asset reflecting an element of the time value of money is accreted into income over the life of the loss share agreements.
74
FIRST CITIZENS BANCSHARES, INC. AND SUBSIDIARIES
NOTES TO CONSOLIDATED FINANCIAL STATEMENTS—(Continued)
(dollars in thousands)
Collection and other servicing costs related to loans covered under FDIC loss share agreements are charged to noninterest expense as incurred. A receivable from the FDIC is then recorded for the estimated amount of such expenses that are expected to be reimbursed and results in an increase to noninterest income. The estimated amount of such reimbursements is determined by several factors including the existence of loan participation agreements with other financial institutions, the presence of partial guarantees from the Small Business Administration and whether a reimbursable loss has been recorded on the loan for which collection and servicing costs have been incurred. Future adjustments to the receivable from the FDIC may be necessary as additional information becomes available related to the amount of previously recorded collection and servicing costs that will actually be reimbursed by the FDIC and the probable timing of such reimbursements.
In addition, ongoing compliance risk under the loss share agreements with the FDIC is considerable and the event of noncompliance could result in coverage under the loss-share being disallowed or not timely receiving the maximum reimbursement, thus increasing the actual losses to BancShares.
Payable to FDIC for Loss Share Agreements
The purchase and assumption agreements for certain FDIC-assisted transactions include provisions commonly known as a "clawback liability" that may be owed to the FDIC at the termination of the loss share agreements
.
The FDIC clawback liability represents an estimated payment by BancShares to the FDIC if actual cumulative losses on acquired covered assets are lower than the cumulative losses originally estimated by the FDIC at the time of acquisition. The clawback liability is estimated periodically by discounting estimated future payments and is recorded in the Consolidated Balance Sheets as a payable to FDIC for loss share agreements. The ultimate settlement amount of the FDIC clawback is dependent upon the performance of the underlying covered loans, the passage of time and actual claims submitted to the FDIC.
Allowance for Loan and Lease Losses
The allowance for credit losses comprises the allowance for loan and lease losses (ALLL) and the reserve for unfunded lending commitments. The allowance for credit losses represents management's best estimate of probable credit losses within the loan and lease portfolio and off-balance sheet lending commitments at the balance sheet date. Management determines the ALLL based on an ongoing evaluation. This evaluation is inherently subjective because it requires material estimates, including the amounts and timing of cash flows expected to be received on impaired loans. Those estimates are susceptible to significant change. Adjustments are established by charges to the provision for loan and lease losses, which is reflected in the Consolidated Statements of Income. Loans and lease balances deemed to be uncollectible are charged off against the allowance for loan and lease losses. Recoveries of amounts previously charged off are credited to the allowance for loan and lease losses.
As part of its quarterly allowance assessment, management takes into consideration various qualitative factors, including economic conditions, composition of the loan portfolio, trends in delinquent and nonperforming loans, historical loss experience by categories of loans, concentrations of credit, changes in lending policies and underwriting standards, regulatory exam results, and other factors indicative of potential losses remaining in the portfolio.
BancShares methodology for analyzing the allowance for loan losses consists of specific allocations on significant individual credits, a general allowance, and a nonspecific allowance. The specific component is determined when management believes that the collectability of an individually reviewed loan has been impaired and a loss is probable. The fair value of these loans may be determined based upon the present value of expected cash flows, market prices of the loans, if available, or the value of the underlying collateral. Expected cash flows are required to be discounted at the loans' effective interest rates. The general allowance component takes into consideration probable, incurred losses that are inherent within the loan portfolio but have not been specifically identified. Loans are divided into segments for analysis based in part on the risk profile inherent in each category. Loans are further segmented into pools within each segment to appropriately recognize changes in inherent risk. A primary component of determining the general allowance for performing and classified loans not analyzed specifically is the actual loss history of the various pools. A portion of the allowance for loan and lease losses is not allocated to any specific category of loans. This nonspecific portion of the allowance reflects management's best estimate of the elements of imprecision and estimation risk inherent in the calculation of the overall allowance. Due to the subjectivity involved in determining the overall allowance, including the nonspecific portion, the portion considered nonspecific may fluctuate from
75
FIRST CITIZENS BANCSHARES, INC. AND SUBSIDIARIES
NOTES TO CONSOLIDATED FINANCIAL STATEMENTS—(Continued)
(dollars in thousands)
period to period based on management's evaluation of the factors affecting the assumptions used in calculating the allowance, including historical loss experience, current economic conditions, the extent of concentrations of loans, the changes in lending policies or procedures, and changes in the mix of the loan portfolio.
A loan is considered to be impaired under ASC Topic 310,
Receivables
when, based upon current information and events, it is probable that BancShares will be unable to collect all amounts due according to the contractual terms of the loan. Loans classified as impaired are placed on nonaccrual status. All loans rated substandard or worse that are greater than or equal to
$500
are reviewed for potential impairment on a quarterly basis. In addition, loans greater than or equal to
$100
which have been classified as TDRs are reviewed for potential impairment. In assessing the impairment of a loan and the related reserve requirement for that loan, various methodologies are employed. Impairment on loans that are not collateral dependent is determined primarily using the present value of expected future cash flows discounted at the loan's effective interest rate. Specific valuation allowances are established or partial charge-offs are recorded on impaired loans for the difference between the loan amount and the estimated net realizable value. With respect to most real estate loans, and specifically if the loan is considered to be a probable foreclosure, a fair value of collateral approach is generally used. The underlying collateral is appraised and market value, appropriately adjusted for an assessment of the sales and marketing costs as well as the total hold period, is used to calculate an anticipated realizable value. Future adjustments to the ALLL may be necessary based on changes in economic and other conditions. Additionally, various regulatory agencies, as an integral part of their examination process, periodically review BancShares' ALLL. Such agencies may require the recognition of adjustments to the ALLL based on their judgments of information available to them at the time of their examination. Management considers the established ALLL adequate to absorb probable losses that relate to loans and leases outstanding as of
December 31, 2012
.
Accounting standards require the presentation of certain disclosure information at the portfolio segment level, which represents the level at which an entity develops and documents a systematic methodology to determine its allowance for credit losses. BancShares concluded that its loan and lease portfolio comprises three portfolio segments; noncovered commercial, noncovered noncommercial, and covered loans. The noncovered commercial segment includes commercial construction and land development, commercial mortgage, commercial and industrial, lease financing, and other commercial real estate. The noncovered noncommercial segment includes noncommercial construction and land development, residential mortgage, revolving mortgage, and consumer. Covered loans were identified based on loans acquired with loss sharing agreements with the FDIC.
Each portfolio segment and the classes within those segments are subject to risks that could have an adverse impact on the credit quality of the loan and lease portfolio and the related allowance for loan and lease losses. Management has identified the most significant risks as described below which are generally similar among the segments and classes. While the list is not exhaustive, it provides a description of the risks that management has determined are the most significant.
Commercial loans and leases
Each commercial loan or lease is centrally underwritten based primarily upon the customer's ability to generate the required cash flow to service the debt in accordance with the contractual terms and conditions of the loan agreement. A complete understanding of the borrower's businesses including the experience and background of the principals is obtained prior to approval. To the extent that the loan or lease is secured by collateral, which is true for the majority of commercial loans and leases, the likely value of the collateral and what level of strength the collateral brings to the transaction is evaluated. To the extent that the principals or other parties provide personal guarantees, the relative financial strength and liquidity of each guarantor is assessed. Common risks to each class of commercial loans include general economic conditions within the markets BancShares serves, as well as risks that are specific to each transaction including demand for products and services, personal events such as disability or change in marital status, and reductions in the value of collateral. Due to the concentration of loans in the medical, dental, and related fields, BancShares is susceptible to risks that legislative and governmental actions will fundamentally alter the economic structure of the medical care industry in the United States.
In addition to these common risks for the majority of commercial loans and leases, additional risks are inherent in certain classes of commercial loans and leases.
Commercial construction and land development
Commercial construction and land development loans are highly dependent on the supply and demand for commercial real estate in the markets served by BancShares as well as the demand for newly constructed residential homes and lots that
76
FIRST CITIZENS BANCSHARES, INC. AND SUBSIDIARIES
NOTES TO CONSOLIDATED FINANCIAL STATEMENTS—(Continued)
(dollars in thousands)
customers are developing. Continuing deterioration in demand could result in significant decreases in the underlying collateral values and make repayment of the outstanding loans more difficult for customers.
Commercial mortgage, commercial and industrial and lease financing
Commercial mortgage and commercial and industrial loans and lease financing are primarily dependent on the ability of borrowers to achieve business results consistent with those projected at loan origination resulting in cash flow sufficient to service the debt. To the extent that a customer's business results are significantly unfavorable versus the original projections, the ability for the loan to be serviced on a basis consistent with the contractual terms may be at risk. While these loans and leases are generally secured by real property, personal property, or business assets such as inventory or accounts receivable, it is possible that the liquidation of the collateral will not fully satisfy the obligation.
Other commercial real estate
Other commercial real estate loans consist primarily of loans secured by multifamily housing and agricultural loans. The primary risk associated with multifamily loans is the ability of the income-producing property that collateralizes the loan to produce adequate cash flow to service the debt. High unemployment or generally weak economic conditions may result in customers having to provide rental rate concessions to achieve adequate occupancy rates. The performance of agricultural loans is highly dependent on favorable weather, reasonable costs for seed and fertilizer, and the ability to successfully market the product at a profitable margin. The demand for these products is also dependent on macroeconomic conditions that are beyond the control of the borrower.
Noncommercial loans
Each noncommercial loan is centrally underwritten using automated credit scoring and analysis tools. These credit scoring tools take into account factors such as payment history, credit utilization, length of credit history, types of credit currently in use, and recent credit inquiries. To the extent that the loan is secured by collateral, the likely value of that collateral is evaluated. Common risks to each class of noncommercial loans include risks that are not specific to individual transactions such as general economic conditions within the markets BancShares serves, particularly unemployment and potential declines in real estate values. Personal events such as disability or change in marital status also add risk to noncommercial loans.
In addition to these common risks for the majority of noncommercial loans, additional risks are inherent in certain classes of noncommercial loans.
Revolving mortgage
Revolving mortgage loans are often secured by second liens on residential real estate, thereby making such loans particularly susceptible to declining collateral values. A substantial decline in collateral value could render a second lien position to be effectively unsecured. Additional risks include lien perfection inaccuracies, disputes with first lienholders, and uncertainty regarding the customer's performance with respect to the first lien that may further weaken the collateral position. Further, the open-end structure of these loans creates the risk that customers may draw on the lines in excess of the collateral value if there have been significant declines since origination.
Consumer
The consumer loan portfolio includes loans secured by personal property such as automobiles, marketable securities, other titled recreational vehicles including boats and motorcycles, as well as unsecured consumer debt. The value of underlying collateral within this class is especially volatile due to potential rapid depreciation in values since date of loan origination in excess of principal repayment.
Residential mortgage and noncommercial construction and land development
Residential mortgage and noncommercial construction and land development loans are made to individuals and are typically secured by 1-4 family residential property, undeveloped land, and partially developed land in anticipation of pending construction of a personal residence. Significant and rapid declines in real estate values can result in residential mortgage loan
77
FIRST CITIZENS BANCSHARES, INC. AND SUBSIDIARIES
NOTES TO CONSOLIDATED FINANCIAL STATEMENTS—(Continued)
(dollars in thousands)
borrowers having debt levels in excess of the current market value of the collateral. Noncommercial construction and land development projects can experience delays in completion and cost overruns that exceed the borrower's financial ability to complete the project. Such cost overruns can routinely result in foreclosure of partially completed and unmarketable collateral.
Covered loans
The risks associated with covered loans are generally consistent with the risks identified for commercial and noncommercial loans and the classes of loans within those segments. Further, these loans were underwritten by other institutions with weaker lending standards. Therefore, there is a significant risk that the loans are not adequately supported by borrower cash flow or the values of underlying collateral at the time of origination.
Reserve for Unfunded Commitments
The reserve for unfunded commitments represents the estimated probable losses related to unfunded credit facilities. The reserve is calculated in a manner similar to the loans evaluated collectively for impairment and taking into account the likelihood that the available credit will be utilized as well as the exposure to default. The reserve for unfunded commitments is presented within other liabilities on the consolidated balance sheets separately from the allowance for loan and lease losses and adjustments to the reserve for unfunded commitments are included in other noninterest expense in the consolidated statements of income.
Securities Sold Under Repurchase Agreements
Securities sold under repurchase agreements generally have maturities of one day and are reflected as short-term borrowings on the Consolidated Balance Sheets and are recorded based on the amount of cash received in connection with the borrowing. At
December 31, 2012, and 2011
, BancShares had
$111,907
and
$172,275
of securities sold under repurchase agreements, respectively.
Servicing Asset
Other assets include an estimate of the fair value of servicing rights on SBA loans and mortgage loans that had been originated and subsequently sold by TVB and United Western. The assets were initially recorded at fair value based on valuations performed by an independent third party. The valuation model considered assumptions that market participants would use in estimating future net servicing income, such as the cost to service, the discount rate, prepayment speeds, and other factors typical in such a valuation. SBA loan originations have been discontinued, and the servicing assets are being amortized over the estimated life of the underlying loans.
Premises and Equipment
Premises, equipment, and capital leases are stated at cost less accumulated depreciation and amortization. For financial reporting purposes, depreciation and amortization are computed by the straight-line method and are expensed over the estimated useful lives of the assets, which range from
25
to
40
years for premises and
3
to
10
years for furniture, software and equipment. Leasehold improvements are amortized over the terms of the respective leases or the useful lives of the improvements, whichever is shorter. Gains and losses on dispositions are recorded in other expense. Maintenance and repairs are charged to occupancy expense or equipment expense as incurred. Obligations under capital leases are amortized using the interest method to allocate payments between principal reduction and interest expense. Rent expense and rental income on operating leases is recorded using the straight-line method over the appropriate lease terms.
Goodwill and Other Intangible Assets
BancShares accounts for acquisitions using the acquisition method of accounting. Under acquisition accounting, if the purchase price of an acquired company exceeds the fair value of its net assets, the excess is carried on the acquirer's balance sheet as goodwill. An intangible asset is recognized as an asset apart from goodwill if it arises from contractual or other legal rights or if it is capable of being separated or divided from the acquired entity and sold, transferred, licensed, rented or exchanged. Intangible assets are identifiable assets, such as core deposit intangibles, resulting from acquisitions which are amortized on a straight-line basis over an estimated useful life and evaluated for impairment whenever events or changes in circumstances indicate the carrying amount of the assets may not be recoverable.
78
FIRST CITIZENS BANCSHARES, INC. AND SUBSIDIARIES
NOTES TO CONSOLIDATED FINANCIAL STATEMENTS—(Continued)
(dollars in thousands)
Goodwill is not amortized but is evaluated at least annually for impairment or more frequently if events occur or circumstances change that may trigger a decline in the value of the reporting unit or otherwise indicate that a potential impairment exists. Examples of such events or circumstances include adverse change in legal factors, business climate, unanticipated competition, change in regulatory environment, or loss of key personnel. The evaluation of goodwill is based on a variety of factors, including common stock trading multiples and data from comparable acquisitions. Potential impairment of goodwill exists when the carrying amount of a reporting unit exceeds its fair value. In accordance with ASC Topic 350,
Intangibles - Goodwill and Other
, the fair value for each reporting unit is computed using one or a combination of the income, market value, or cost methods.
The income method uses a discounted cash flow analysis to determine fair value by considering a reporting unit's capital structure and applying a risk-adjusted discount rate to forecast earnings based on a capital asset pricing model. The market value method uses recent transaction analysis or publicly traded comparable analysis for similar assets and liabilities to determine fair value. The cost method assumes the net assets of a recent business combination accounted for under the acquisition method of accounting will be recorded at fair value if no event or circumstance has occurred triggering a decline in the value.
To the extent a reporting unit's carrying amount exceeds its fair value, an indication exists that the reporting unit's goodwill may be impaired, and a second step of impairment testing will be performed. In the second step, the implied fair value of the reporting unit's goodwill is determined by allocating the reporting unit's fair value to all of its assets (recognized and unrecognized) and liabilities as if the reporting unit had been acquired in a business combination at the date of the impairment test. If the implied fair value of the reporting unit's goodwill is lower than its carrying amount, goodwill is impaired and is written down to the implied fair value. The loss recognized is limited to the carrying amount of goodwill. Once an impairment loss is recognized, future increases in fair value will not result in the reversal of previously recognized losses.
Goodwill is tested at least annually for impairment. BancShares performs its annual impairment test as of
July 31
each year. For
2012
, the results the analysis provided no indication of potential impairment of BancShares' goodwill. Goodwill will continue to be monitored for triggering events that may indicate impairment prior to the next scheduled annual impairment test.
Other intangible assets with estimable lives are amortized over their estimated useful lives, which are periodically reviewed for reasonableness. As a result of the FDIC-assisted transactions in
2011, 2010 and 2009
, an identifiable intangible asset was recorded representing the estimated value of the core deposits acquired and certain customer relationships.
Fair Values
Fair value disclosures are required for all financial instruments, whether or not recognized in the balance sheet, for which it is practicable to estimate that value. Under GAAP, individual fair value estimates are ranked on a three-tier scale based on the relative reliability of the inputs used in the valuation. Fair values determined using level 1 inputs rely on active and observable markets to price identical assets or liabilities. In situations where identical assets and liabilities are not traded in active markets, fair values may be determined based on level 2 inputs, which represent observable data for similar assets and liabilities. Fair values for assets and liabilities that are not actively traded in observable markets are based on level 3 inputs, which are considered to be nonobservable. Fair value estimates derived from level 3 inputs cannot be substantiated by comparison to independent markets and, in many cases, could not be realized through immediate settlement of the instrument. Accordingly, the aggregate fair value amounts presented do not represent the underlying value to BancShares. For additional information, see Note
K
to the Consolidated Financial Statements.
Income Taxes
Deferred income taxes are reported when different accounting methods have been used in determining income for income tax purposes and for financial reporting purposes. Deferred taxes are computed using the asset and liability approach as prescribed in ASC Topic 740,
Income Taxes
. Under this method, a deferred tax asset or liability is determined based on the currently enacted tax rates applicable to the period in which the differences between the financial statement carrying amounts and tax basis of existing assets and liabilities are expected to be reported in BancShares' income tax returns. The effect on deferred taxes of a change in tax rates is recognized in income in the period that includes the enactment date.
79
FIRST CITIZENS BANCSHARES, INC. AND SUBSIDIARIES
NOTES TO CONSOLIDATED FINANCIAL STATEMENTS—(Continued)
(dollars in thousands)
BancShares continually monitors and evaluates the potential impact of current events on the estimates used to establish income tax expenses and income tax liabilities. On a periodic basis, BancShares evaluates its income tax positions based on current tax law, positions taken by various tax auditors within the jurisdictions that BancShares is required to file income tax returns, as well as potential or pending audits or assessments by such tax auditors.
BancShares files a consolidated federal income tax return and various combined and separate company state tax returns.
Derivative Financial Instruments
A derivative is a financial instrument that derives its cash flows, and therefore its value, by reference to an underlying instrument, index or referenced interest rate. These instruments include interest rate swaps, caps, floors, collars, options or other financial instruments designed to hedge exposures to interest rate risk or for speculative purposes.
BancShares selectively uses interest rate swaps for interest rate risk management purposes. During
2011, 2009 and 2006
, BancShares entered into interest rate swaps that qualify as cash flow hedges under GAAP. These interest rate swaps convert variable-rate exposure on outstanding debt to a fixed rate. The derivatives are valued each quarter, and changes in the fair values are recorded on the consolidated balance sheet with an offset to other comprehensive income for the effective portion and an offset to the consolidated statements of income for any ineffective portion. The assessment of effectiveness is performed using the long-haul method. BancShares’ interest rate swaps have been fully effective since inception; therefore, changes in the fair value of the interest rate swaps have had no impact on net income. There are no speculative derivative financial instruments in any period.
In the event of a change in the forecasted cash flows of the underlying hedged item, the related interest rate swap will be terminated, and management will consider the appropriateness of entering into another swap to hedge the remaining exposure. The fair value of the terminated hedge will be amortized from accumulated other comprehensive income into earnings over the original life of the terminated swap, provided the remaining cash flows are still probable.
Subsequent Events
Management has evaluated subsequent events through the date of filing this Form 10-K.
Per Share Data
Net income per share has been computed by dividing net income by the average number of both classes of common shares outstanding during each period. BancShares had no potential common stock outstanding in any period.
Cash dividends per share apply to both Class A and Class B common stock. Shares of Class A common stock carry
one
vote per share, while shares of Class B common stock carry
16
votes per share.
Defined Benefit Pension Plan
BancShares offers a noncontributory defined benefit pension plan to certain qualifying employees. The calculation of the obligations and related expenses under the plan requires the use of actuarial valuation methods and assumptions. Actuarial assumptions used in the determination of future values of plan assets and liabilities are subject to management judgment and may differ significantly if different assumptions are used. The discount rate assumption used to measure the plan obligation is based on a yield curve developed from high-quality corporate bonds across a full maturity spectrum. The projected cash flows of the pension plan are discounted based on this yield curve, and a single discount rate is calculated to achieve the same present value. Refer to Note L - Employee Benefit Plans in the Notes to Consolidated Financial Statements for disclosures related to BancShares' defined benefit pension plan.
Recently Adopted Accounting Pronouncements
FASB ASU 2011-04, “Fair Value Measurement (Topic 820) - Amendments to Achieve Common Fair Value Measurement and Disclosure Requirements in U.S. GAAP and IFRS”
This ASU amends the wording used to describe many of the requirements in GAAP for measuring fair value and for disclosing information about fair value measurements. The ASU clarifies the application of existing fair value measurement requirements and changes principles or requirement for measuring fair value and for disclosing information about fair value
80
FIRST CITIZENS BANCSHARES, INC. AND SUBSIDIARIES
NOTES TO CONSOLIDATED FINANCIAL STATEMENTS—(Continued)
(dollars in thousands)
measurements. The ASU requires new disclosures for any transfers between Levels 1 and 2 of the fair value hierarchy, not just
significant transfers, and further expands focus on Level 3 measurements, including quantitative information about the significant unobservable inputs used for all Level 3 measurements, a qualitative discussion about the sensitivity of recurring Level 3 measurements to changes in the unobservable inputs disclosed, and a description of the valuation processes. The adoption of ASU 2011-04 was effective for reporting periods beginning on or after
December 15, 2011
, and is included in Note K to the Consolidated Financial Statements.
FASB ASU 2011-05, “Comprehensive Income (Topic 220) - Presentation of Comprehensive Income” as amended by FASB ASU 2011-12, “Comprehensive Income (Topic 220)-Deferral of the Effective Date for Amendments to the Presentation of Reclassification of Items Out of Accumulated Other Comprehensive Income in Accounting Standards Update (“ASU”) 2011-05.”
This ASU increases the prominence of other comprehensive income (“OCI”) in financial statements and provides two options for presenting OCI. The ASU eliminates the current placement near the statement of shareholders' equity or detailed in the Consolidated Statement of Changes in Shareholders' Equity. The ASU provides for an OCI statement to be included with the net income statement, and together the two will make a statement of total comprehensive income. Alternatively, businesses can have an OCI statement separate from a net income statement, but the two statements should appear consecutively within a financial report. The ASU does not affect the calculation of earnings per share. The adoption of ASU 2011-05 was effective
December 15, 2011
. The guidance does not change the items that must be reported in OCI. BancShares adopted this guidance and has elected to present two separate but consecutive financial statements.
Recently Issued Accounting Pronouncements
FASB ASU 2012-06. “Business Combinations (Topic 805) - Subsequent Accounting for an Indemnification Asset Recognized at the Acquisition Date as a Result of a Government-Assisted Acquisition of a Financial Institution”
This ASU addresses the diversity in practice about how to interpret the terms on the same basis and contractual limitations when subsequently measuring an indemnification asset recognized in a government-assisted (Federal Deposit Insurance Corporation or National Credit Union Administration) acquisition of a financial institution that includes a loss sharing agreement (indemnification agreement). When BancShares recognizes an indemnification asset (in accordance with Subtopic 805-20) as a result of a government-assisted acquisition of a financial institution and subsequently a change in the cash flows expected to be collected on the indemnification asset occurs (as a result of a change in cash flows expected to be collected on the assets subject to indemnification), BancShares should subsequently account for the change in the measurement of the indemnification asset on the same basis as the change in the assets subject to indemnification. Any amortization of changes in value should be limited to the contractual term of the indemnification agreement (that is, the lesser of the term of the indemnification agreement and the remaining life of the indemnified assets). This guidance is effective for annual periods beginning on or after
December 15, 2012
, and interim periods within those annual periods. BancShares has previously accounted for its indemnification asset in accordance with this guidance; accordingly, this guidance will have no impact on BancShares' consolidated financial position, results of operations, or cash flows.
FASB ASU 2011-11, “Balance Sheet (Topic 210) - Disclosures about Offsetting Assets and Liabilities
.”
This ASU addresses the differences in reporting between GAAP and International Financial Reporting Standards (“IFRS”) regarding offsetting (netting) assets and liabilities and enhances current disclosures. ASU 2011-11 requires BancShares to disclose both gross information and net information about instruments and transactions eligible for offset in the statement of financial position and instruments and transactions subject to an agreement similar to a master netting arrangement. The scope includes derivatives, sale and repurchase agreements and reverse sales and repurchase agreements, as well as securities borrowing and securities lending arrangements. ASU 2011-11 is effective for annual reporting periods beginning on or after
January 1, 2013
, and interim periods within those annual periods. BancShares does not expect the adoption of ASU 2011-11 to have a material impact on its financial condition or results of operations.
81
FIRST CITIZENS BANCSHARES, INC. AND SUBSIDIARIES
NOTES TO CONSOLIDATED FINANCIAL STATEMENTS—(Continued)
(dollars in thousands)
NOTE B
- INVESTMENT SECURITIES
The aggregate values of investment securities at
December 31, 2012, and 2011
, along with gains and losses determined on an individual security basis are as follows:
|
Cost
|
Gross
unrealized
gains
|
Gross
unrealized
losses
|
Fair value
|
||||||||||||||
|
Investment securities available for sale
|
|||||||||||||||||
|
2012
|
|||||||||||||||||
|
U.S. Treasury
|
$
|
823,241
|
|
$
|
403
|
|
$
|
12
|
|
$
|
823,632
|
|
|||||
|
Government agency
|
3,052,040
|
|
3,501
|
|
337
|
|
3,055,204
|
|
|||||||||
|
Other
|
838
|
|
—
|
|
18
|
|
820
|
|
|||||||||
|
Residential mortgage-backed securities
|
1,315,211
|
|
14,787
|
|
341
|
|
1,329,657
|
|
|||||||||
|
Equity securities
|
543
|
|
15,822
|
|
—
|
|
16,365
|
|
|||||||||
|
State, county and municipal
|
546
|
|
4
|
|
—
|
|
550
|
|
|||||||||
|
Total investment securities available for sale
|
$
|
5,192,419
|
|
$
|
34,517
|
|
$
|
708
|
|
$
|
5,226,228
|
|
|||||
|
2011
|
|||||||||||||||||
|
U.S. Treasury
|
$
|
887,041
|
|
$
|
808
|
|
$
|
30
|
|
$
|
887,819
|
|
|||||
|
Government agency
|
2,591,974
|
|
1,747
|
|
1,512
|
|
2,592,209
|
|
|||||||||
|
Corporate bonds
|
250,476
|
|
2,344
|
|
—
|
|
252,820
|
|
|||||||||
|
Residential mortgage-backed securities
|
298,402
|
|
9,165
|
|
346
|
|
307,221
|
|
|||||||||
|
Equity securities
|
939
|
|
14,374
|
|
—
|
|
15,313
|
|
|||||||||
|
State, county and municipal
|
1,026
|
|
16
|
|
1
|
|
1,041
|
|
|||||||||
|
Total investment securities available for sale
|
$
|
4,029,858
|
|
$
|
28,454
|
|
$
|
1,889
|
|
$
|
4,056,423
|
|
|||||
|
Investment securities held to maturity
|
|||||||||||||||||
|
2012
|
|||||||||||||||||
|
Residential mortgage-backed securities
|
$
|
1,342
|
|
$
|
133
|
|
27
|
|
$
|
1,448
|
|
||||||
|
2011
|
|||||||||||||||||
|
Residential mortgage-backed securities
|
$
|
1,822
|
|
$
|
184
|
|
26
|
|
$
|
1,980
|
|
||||||
Investments in residential mortgage-backed securities primarily represent pass-through securities issued by the Government National Mortgage Association, Federal National Mortgage Association, and Federal Home Loan Mortgage Corporation.
The following table provides maturity information for investment securities as of
December 31, 2012, and 2011
. Callable agency securities are assumed to mature on their earliest call date. Maturity information for residential mortgage-backed securities is adjusted to reflect estimated prepayments.
82
FIRST CITIZENS BANCSHARES, INC. AND SUBSIDIARIES
NOTES TO CONSOLIDATED FINANCIAL STATEMENTS—(Continued)
(dollars in thousands)
|
|
2012
|
2011
|
|||||||||||||
|
|
Cost
|
Fair value
|
Cost
|
Fair value
|
|||||||||||
|
Investment securities available for sale
|
|||||||||||||||
|
Maturing in:
|
|||||||||||||||
|
One year or less
|
$
|
2,288,556
|
|
$
|
2,289,859
|
|
$
|
3,238,657
|
|
$
|
3,241,415
|
|
|||
|
One through five years
|
2,323,222
|
|
2,329,207
|
|
548,459
|
|
549,351
|
|
|||||||
|
Five through 10 years
|
194,398
|
|
196,371
|
|
90,605
|
|
91,087
|
|
|||||||
|
Over 10 years
|
385,700
|
|
394,426
|
|
151,198
|
|
159,257
|
|
|||||||
|
Equity securities
|
543
|
|
16,365
|
|
939
|
|
15,313
|
|
|||||||
|
Total investment securities available for sale
|
$
|
5,192,419
|
|
$
|
5,226,228
|
|
$
|
4,029,858
|
|
$
|
4,056,423
|
|
|||
|
Investment securities held to maturity
|
|||||||||||||||
|
Maturing in:
|
|||||||||||||||
|
One through five years
|
$
|
1,242
|
|
$
|
1,309
|
|
$
|
12
|
|
$
|
11
|
|
|||
|
Five through 10 years
|
18
|
|
11
|
|
1,699
|
|
1,820
|
|
|||||||
|
Over 10 years
|
82
|
|
128
|
|
111
|
|
149
|
|
|||||||
|
Total investment securities held to maturity
|
$
|
1,342
|
|
$
|
1,448
|
|
$
|
1,822
|
|
$
|
1,980
|
|
|||
For each period presented, securities gains (losses) include the following:
|
2012
|
2011
|
2010
|
|||||||||
|
Gross gains on sales of investment securities available for sale
|
$
|
2,324
|
|
$
|
531
|
|
$
|
4,103
|
|
||
|
Gross losses on sales of investment securities available for sale
|
(2
|
)
|
(793
|
)
|
(1,730
|
)
|
|||||
|
Other than temporary impairment losses on equity investments
|
(45
|
)
|
(26
|
)
|
(421
|
)
|
|||||
|
Total securities gains (losses)
|
$
|
2,277
|
|
$
|
(288
|
)
|
$
|
1,952
|
|
||
All of the OTTI recognized during
2012, 2011 and 2010
was credit related.
83
FIRST CITIZENS BANCSHARES, INC. AND SUBSIDIARIES
NOTES TO CONSOLIDATED FINANCIAL STATEMENTS—(Continued)
(dollars in thousands)
The following table provides information regarding securities with unrealized losses as of
December 31, 2012, and 2011
:
|
|
Less than 12 months
|
12 months or more
|
Total
|
||||||||||||||||||||
|
|
Fair
Value
|
Unrealized
Losses
|
Fair
Value
|
Unrealized
Losses
|
Fair
Value
|
Unrealized
Losses
|
|||||||||||||||||
|
December 31, 2012
|
|||||||||||||||||||||||
|
Investment securities available for sale:
|
|||||||||||||||||||||||
|
U.S. Treasury
|
$
|
120,045
|
|
$
|
12
|
|
$
|
—
|
|
$
|
—
|
|
$
|
120,045
|
|
$
|
12
|
|
|||||
|
Government agency
|
407,498
|
|
337
|
|
—
|
|
—
|
|
407,498
|
|
337
|
|
|||||||||||
|
Residential mortgage-backed securities
|
135,880
|
|
214
|
|
9,433
|
|
127
|
|
145,313
|
|
341
|
|
|||||||||||
|
Other
|
820
|
|
18
|
|
—
|
|
—
|
|
820
|
|
18
|
|
|||||||||||
|
Total
|
$
|
664,243
|
|
$
|
581
|
|
$
|
9,433
|
|
$
|
127
|
|
$
|
673,676
|
|
$
|
708
|
|
|||||
|
Investment securities held to maturity:
|
|||||||||||||||||||||||
|
Residential mortgage-backed securities
|
$
|
—
|
|
$
|
—
|
|
$
|
17
|
|
$
|
27
|
|
$
|
17
|
|
$
|
27
|
|
|||||
|
Total
|
$
|
—
|
|
$
|
—
|
|
$
|
17
|
|
$
|
27
|
|
$
|
17
|
|
$
|
27
|
|
|||||
|
December 31, 2011
|
|||||||||||||||||||||||
|
Investment securities available for sale:
|
|||||||||||||||||||||||
|
U.S. Treasury
|
$
|
151,269
|
|
$
|
30
|
|
$
|
—
|
|
$
|
—
|
|
$
|
151,269
|
|
$
|
30
|
|
|||||
|
Government agency
|
1,336,763
|
|
1,512
|
|
—
|
|
—
|
|
1,336,763
|
|
1,512
|
|
|||||||||||
|
Residential mortgage-backed securities
|
59,458
|
|
304
|
|
1,380
|
|
42
|
|
60,838
|
|
346
|
|
|||||||||||
|
State, county and municipal
|
—
|
|
—
|
|
10
|
|
1
|
|
10
|
|
1
|
|
|||||||||||
|
Total
|
$
|
1,547,490
|
|
$
|
1,846
|
|
$
|
1,390
|
|
$
|
43
|
|
$
|
1,548,880
|
|
$
|
1,889
|
|
|||||
|
Investment securities held to maturity:
|
|||||||||||||||||||||||
|
Residential mortgage-backed securities
|
$
|
—
|
|
$
|
—
|
|
$
|
21
|
|
$
|
26
|
|
$
|
21
|
|
$
|
26
|
|
|||||
|
Total
|
$
|
—
|
|
$
|
—
|
|
$
|
21
|
|
$
|
26
|
|
$
|
21
|
|
$
|
26
|
|
|||||
Investment securities with an aggregate fair value of
$9,450
have had continuous unrealized losses for more than twelve months as of
December 31, 2012
. The aggregate amount of the unrealized losses among those
23
residential mortgage-backed securities was
$154
at
December 31, 2012
. Investment securities with an aggregate fair value of
$1,411
had continuous unrealized losses for more than twelve months as of
December 31, 2011
. The aggregate amount of the unrealized losses among those
18
securities was
$69
at
December 31, 2011
. These securities include residential mortgage-backed and state, county and municipal securities. None of the unrealized losses identified as of
December 31, 2012, and 2011
, relate to the marketability of the securities or the issuer’s ability to honor redemption obligations. At
December 31, 2012, and 2011
, BancShares had the ability and intent to retain these securities for a period of time sufficient to recover all unrealized losses. Therefore,
none
of the securities are deemed to be other than temporarily impaired.
Investment securities having an aggregate carrying value of
$2,351,072
at
December 31, 2012
, and
$2,588,704
at
December 31, 2011
, were pledged as collateral to secure public funds on deposit, to secure certain short-term borrowings and for other purposes as required by law.
84
FIRST CITIZENS BANCSHARES, INC. AND SUBSIDIARIES
NOTES TO CONSOLIDATED FINANCIAL STATEMENTS—(Continued)
(dollars in thousands)
NOTE C
- LOANS AND LEASES
Loans and leases outstanding by segment and class at
December 31, 2012, and 2011
, are as follows:
|
2012
|
2011
|
||||||
|
Covered loans
|
$
|
1,809,235
|
|
$
|
2,362,152
|
|
|
|
Noncovered loans and leases:
|
|||||||
|
Commercial:
|
|||||||
|
Construction and land development
|
309,190
|
|
381,163
|
|
|||
|
Commercial mortgage
|
5,341,839
|
|
5,104,993
|
|
|||
|
Other commercial real estate
|
160,980
|
|
144,771
|
|
|||
|
Commercial and industrial
|
1,726,126
|
|
1,764,407
|
|
|||
|
Lease financing
|
330,679
|
|
312,869
|
|
|||
|
Other
|
125,681
|
|
158,369
|
|
|||
|
Total commercial loans
|
7,994,495
|
|
7,866,572
|
|
|||
|
Noncommercial:
|
|||||||
|
Residential mortgage
|
822,889
|
|
784,118
|
|
|||
|
Revolving mortgage
|
2,210,133
|
|
2,296,306
|
|
|||
|
Construction and land development
|
131,992
|
|
137,271
|
|
|||
|
Consumer
|
416,606
|
|
497,370
|
|
|||
|
Total noncommercial loans
|
3,581,620
|
|
3,715,065
|
|
|||
|
Total noncovered loans and leases
|
11,576,115
|
|
11,581,637
|
|
|||
|
Total loans and leases
|
$
|
13,385,350
|
|
$
|
13,943,789
|
|
|
|
|
2012
|
2011
|
|||||||||||||||||||||
|
|
Impaired at
acquisition
date
|
All other
acquired
loans
|
Total
|
Impaired at
acquisition
date
|
All other
acquired
loans
|
Total
|
|||||||||||||||||
|
Covered loans:
|
|||||||||||||||||||||||
|
Commercial:
|
|||||||||||||||||||||||
|
Construction and land development
|
$
|
71,225
|
|
$
|
166,681
|
|
$
|
237,906
|
|
$
|
117,603
|
|
$
|
221,270
|
|
$
|
338,873
|
|
|||||
|
Commercial mortgage
|
107,281
|
|
947,192
|
|
1,054,473
|
|
138,465
|
|
1,122,124
|
|
1,260,589
|
|
|||||||||||
|
Other commercial real estate
|
35,369
|
|
71,750
|
|
107,119
|
|
33,370
|
|
125,024
|
|
158,394
|
|
|||||||||||
|
Commercial and industrial
|
3,932
|
|
45,531
|
|
49,463
|
|
27,802
|
|
85,640
|
|
113,442
|
|
|||||||||||
|
Lease financing
|
—
|
|
—
|
|
—
|
|
—
|
|
57
|
|
57
|
|
|||||||||||
|
Other
|
—
|
|
1,074
|
|
1,074
|
|
—
|
|
1,330
|
|
1,330
|
|
|||||||||||
|
Total commercial loans
|
217,807
|
|
1,232,228
|
|
1,450,035
|
|
317,240
|
|
1,555,445
|
|
1,872,685
|
|
|||||||||||
|
Noncommercial:
|
|||||||||||||||||||||||
|
Residential mortgage
|
48,077
|
|
249,849
|
|
297,926
|
|
46,130
|
|
281,438
|
|
327,568
|
|
|||||||||||
|
Revolving mortgage
|
9,606
|
|
29,104
|
|
38,710
|
|
15,350
|
|
36,202
|
|
51,552
|
|
|||||||||||
|
Construction and land development
|
15,136
|
|
5,657
|
|
20,793
|
|
78,108
|
|
27,428
|
|
105,536
|
|
|||||||||||
|
Consumer
|
—
|
|
1,771
|
|
1,771
|
|
1,477
|
|
3,334
|
|
4,811
|
|
|||||||||||
|
Total noncommercial loans
|
72,819
|
|
286,381
|
|
359,200
|
|
141,065
|
|
348,402
|
|
489,467
|
|
|||||||||||
|
Total covered loans
|
$
|
290,626
|
|
$
|
1,518,609
|
|
$
|
1,809,235
|
|
$
|
458,305
|
|
$
|
1,903,847
|
|
$
|
2,362,152
|
|
|||||
85
FIRST CITIZENS BANCSHARES, INC. AND SUBSIDIARIES
NOTES TO CONSOLIDATED FINANCIAL STATEMENTS—(Continued)
(dollars in thousands)
At
December 31, 2012
,
26.1 percent
of noncovered loans and leases were to customers in medical-related fields, compared to
26.5 percent
at
December 31, 2011
. These loans are primarily commercial mortgage loans secured by owner-occupied commercial real estate. There were no foreign loans or loans to finance highly leveraged transactions during
2012
or
2011
.
Substantially all noncovered loans and leases are to customers domiciled within BancShares’ principal market areas. Certain loans acquired in FDIC-assisted transactions that are covered under loss share agreements were made to borrowers that are not within the principal market areas of the originating banks.
At
December 31, 2012
, noncovered loans totaling
$2,570,773
were pledged to secure debt obligations, compared to
$2,492,644
at
December 31, 2011
.
Credit quality indicators
Loans and leases are monitored for credit quality on a recurring basis. The credit quality indicators used are dependent on the portfolio segment to which the loan relates. Commercial loans and leases, noncommercial loans and leases and covered loans have different credit quality indicators as a result of the methods used to monitor each of these loan segments.
The credit quality indicators for commercial loans and leases and all covered loans and leases are developed through review of individual borrowers on an ongoing basis. Each borrower is evaluated at least annually with more frequent evaluation of more severely criticized loans or leases. The indicators represent the rating for loans or leases as of the date presented based on the most recent assessment performed. These credit quality indicators are defined as follows:
Pass –
A pass rated asset is not adversely classified because it does not display any of the characteristics for adverse classification.
Special mention
– A special mention asset has potential weaknesses that deserve management’s close attention. If left uncorrected, such potential weaknesses may result in deterioration of the repayment prospects or collateral position at some future date. Special mention assets are not adversely classified and do not warrant adverse classification.
Substandard
– A substandard asset is inadequately protected by the current net worth and paying capacity of the obligor or of the collateral pledged, if any. Assets classified as substandard generally have a well-defined weakness, or weaknesses, that jeopardize the liquidation of the debt. These assets are characterized by the distinct possibility of loss if the deficiencies are not corrected.
Doubtful
– An asset classified doubtful has all the weaknesses inherent in an asset classified substandard with the added characteristic that the weaknesses make collection or liquidation in full highly questionable and improbable on the basis of currently existing facts, conditions, and values.
Loss
– Assets classified loss are considered uncollectible and of such little value that their continuing to be carried as an asset is not warranted. This classification is not necessarily equivalent to no potential for recovery or salvage value, but rather that it is not appropriate to defer a full write-off even though partial recovery may be effected in the future.
Ungraded
– Ungraded loans represent loans that are not included in the individual credit grading process due to their relatively small balances or borrower type. The majority of noncovered, ungraded loans at
December 31, 2012
, and
December 31, 2011
, relate to business credit cards and tobacco buyout loans. Tobacco buyout loans with an outstanding balance of
$43,110
at
December 31, 2012
, and
$63,129
at
December 31, 2011
, are secured by assignments of receivables made pursuant to the Fair and Equitable Tobacco Reform Act of 2004. The credit risk associated with these loans is considered low as the payments that began in
2005
and continue through
2014
are to be made by the Commodity Credit Corporation which is part of the United States Department of Agriculture.
The credit quality indicators for noncovered, noncommercial loans are based on the delinquency status of the borrower. As the borrower becomes more delinquent, the likelihood of loss increases.
86
FIRST CITIZENS BANCSHARES, INC. AND SUBSIDIARIES
NOTES TO CONSOLIDATED FINANCIAL STATEMENTS—(Continued)
(dollars in thousands)
The composition of the loans and leases outstanding at
December 31, 2012, and 2011
by credit quality indicator is provided below:
|
|
Commercial noncovered loans and leases
|
||||||||||||||||||||||||||
|
Grade:
|
Construction and
land
development
|
Commercial
mortgage
|
Other
commercial real
estate
|
Commercial and
industrial
|
Lease financing
|
Other
|
Total
commercial
noncovered loans
|
||||||||||||||||||||
|
December 31, 2012
|
|||||||||||||||||||||||||||
|
Pass
|
$
|
274,480
|
|
$
|
5,018,677
|
|
$
|
151,549
|
|
$
|
1,564,862
|
|
$
|
325,626
|
|
$
|
124,083
|
|
$
|
7,459,277
|
|
||||||
|
Special mention
|
14,666
|
|
161,789
|
|
2,812
|
|
18,368
|
|
1,601
|
|
837
|
|
200,073
|
|
|||||||||||||
|
Substandard
|
18,761
|
|
145,980
|
|
5,038
|
|
24,059
|
|
1,663
|
|
756
|
|
196,257
|
|
|||||||||||||
|
Doubtful
|
952
|
|
12,822
|
|
98
|
|
1,693
|
|
771
|
|
—
|
|
16,336
|
|
|||||||||||||
|
Ungraded
|
331
|
|
2,571
|
|
1,483
|
|
117,144
|
|
1,018
|
|
5
|
|
122,552
|
|
|||||||||||||
|
Total
|
$
|
309,190
|
|
$
|
5,341,839
|
|
$
|
160,980
|
|
$
|
1,726,126
|
|
$
|
330,679
|
|
$
|
125,681
|
|
$
|
7,994,495
|
|
||||||
|
December 31, 2011
|
|||||||||||||||||||||||||||
|
Pass
|
$
|
332,742
|
|
$
|
4,749,254
|
|
$
|
130,586
|
|
$
|
1,556,651
|
|
$
|
306,225
|
|
$
|
157,089
|
|
$
|
7,232,547
|
|
||||||
|
Special mention
|
18,973
|
|
220,235
|
|
5,821
|
|
36,951
|
|
4,537
|
|
1,271
|
|
287,788
|
|
|||||||||||||
|
Substandard
|
28,793
|
|
129,391
|
|
7,794
|
|
28,240
|
|
2,107
|
|
—
|
|
196,325
|
|
|||||||||||||
|
Doubtful
|
17
|
|
1,164
|
|
377
|
|
643
|
|
—
|
|
—
|
|
2,201
|
|
|||||||||||||
|
Ungraded
|
638
|
|
4,949
|
|
193
|
|
141,922
|
|
—
|
|
9
|
|
147,711
|
|
|||||||||||||
|
Total
|
$
|
381,163
|
|
$
|
5,104,993
|
|
$
|
144,771
|
|
$
|
1,764,407
|
|
$
|
312,869
|
|
$
|
158,369
|
|
$
|
7,866,572
|
|
||||||
|
|
Noncommercial noncovered loans and leases
|
||||||||||||||||||
|
|
Residential
mortgage
|
Revolving
mortgage
|
Construction
and land
development
|
Consumer
|
Total non-
commercial
noncovered
loans
|
||||||||||||||
|
December 31, 2012
|
|||||||||||||||||||
|
Current
|
$
|
786,626
|
|
$
|
2,190,186
|
|
$
|
128,764
|
|
$
|
409,218
|
|
$
|
3,514,794
|
|
||||
|
31-60 days past due
|
15,711
|
|
12,868
|
|
1,941
|
|
4,405
|
|
34,925
|
|
|||||||||
|
61-90 days past due
|
7,559
|
|
3,200
|
|
490
|
|
1,705
|
|
12,954
|
|
|||||||||
|
Over 90 days past due
|
12,993
|
|
3,879
|
|
797
|
|
1,278
|
|
18,947
|
|
|||||||||
|
Total
|
$
|
822,889
|
|
$
|
2,210,133
|
|
$
|
131,992
|
|
$
|
416,606
|
|
$
|
3,581,620
|
|
||||
|
December 31, 2011
|
|||||||||||||||||||
|
Current
|
$
|
757,113
|
|
$
|
2,286,511
|
|
$
|
135,774
|
|
$
|
491,142
|
|
$
|
3,670,540
|
|
||||
|
31-60 days past due
|
11,790
|
|
3,437
|
|
798
|
|
3,514
|
|
19,539
|
|
|||||||||
|
61-90 days past due
|
2,686
|
|
2,042
|
|
127
|
|
1,271
|
|
6,126
|
|
|||||||||
|
Over 90 days past due
|
12,529
|
|
4,316
|
|
572
|
|
1,443
|
|
18,860
|
|
|||||||||
|
Total
|
$
|
784,118
|
|
$
|
2,296,306
|
|
$
|
137,271
|
|
$
|
497,370
|
|
$
|
3,715,065
|
|
||||
87
FIRST CITIZENS BANCSHARES, INC. AND SUBSIDIARIES
NOTES TO CONSOLIDATED FINANCIAL STATEMENTS—(Continued)
(dollars in thousands)
|
|
Covered loans
|
||||||||||||||||||||||||||||||||||||||
|
Grade:
|
Construction
and land
development -
commercial
|
Commercial
mortgage
|
Other
commercial
real estate
|
Commercial
and
industrial
|
Lease financing
|
Residential
mortgage
|
Revolving
mortgage
|
Construction
and land development non- commercial |
Consumer
and other
|
Total covered
loans
|
|||||||||||||||||||||||||||||
|
December 31, 2012
|
|||||||||||||||||||||||||||||||||||||||
|
Pass
|
$
|
17,010
|
|
$
|
376,974
|
|
$
|
33,570
|
|
$
|
19,451
|
|
$
|
—
|
|
$
|
172,165
|
|
$
|
29,540
|
|
$
|
334
|
|
$
|
1,617
|
|
$
|
650,661
|
|
|||||||||
|
Special mention
|
25,734
|
|
259,264
|
|
17,518
|
|
12,465
|
|
—
|
|
14,863
|
|
1,736
|
|
—
|
|
34
|
|
331,614
|
|
|||||||||||||||||||
|
Substandard
|
105,061
|
|
344,542
|
|
44,335
|
|
14,698
|
|
—
|
|
83,193
|
|
7,434
|
|
17,190
|
|
239
|
|
616,692
|
|
|||||||||||||||||||
|
Doubtful
|
87,445
|
|
73,016
|
|
11,696
|
|
2,757
|
|
—
|
|
4,268
|
|
—
|
|
3,269
|
|
117
|
|
182,568
|
|
|||||||||||||||||||
|
Ungraded
|
2,656
|
|
677
|
|
—
|
|
92
|
|
—
|
|
23,437
|
|
—
|
|
—
|
|
838
|
|
27,700
|
|
|||||||||||||||||||
|
Total
|
$
|
237,906
|
|
$
|
1,054,473
|
|
$
|
107,119
|
|
$
|
49,463
|
|
$
|
—
|
|
$
|
297,926
|
|
$
|
38,710
|
|
$
|
20,793
|
|
$
|
2,845
|
|
$
|
1,809,235
|
|
|||||||||
|
December 31, 2011
|
|||||||||||||||||||||||||||||||||||||||
|
Pass
|
$
|
29,321
|
|
$
|
397,526
|
|
$
|
49,259
|
|
$
|
36,409
|
|
$
|
57
|
|
$
|
189,794
|
|
$
|
34,164
|
|
$
|
4,958
|
|
$
|
2,393
|
|
$
|
743,881
|
|
|||||||||
|
Special mention
|
92,758
|
|
348,482
|
|
33,754
|
|
32,257
|
|
—
|
|
25,464
|
|
3,566
|
|
13,394
|
|
942
|
|
550,617
|
|
|||||||||||||||||||
|
Substandard
|
125,158
|
|
427,996
|
|
58,351
|
|
21,914
|
|
—
|
|
70,582
|
|
9,863
|
|
72,349
|
|
1,096
|
|
787,309
|
|
|||||||||||||||||||
|
Doubtful
|
87,936
|
|
84,871
|
|
17,030
|
|
22,862
|
|
—
|
|
13,833
|
|
3,959
|
|
14,835
|
|
982
|
|
246,308
|
|
|||||||||||||||||||
|
Ungraded
|
3,700
|
|
1,714
|
|
—
|
|
—
|
|
—
|
|
27,895
|
|
—
|
|
—
|
|
728
|
|
34,037
|
|
|||||||||||||||||||
|
Total
|
$
|
338,873
|
|
$
|
1,260,589
|
|
$
|
158,394
|
|
$
|
113,442
|
|
$
|
57
|
|
$
|
327,568
|
|
$
|
51,552
|
|
$
|
105,536
|
|
$
|
6,141
|
|
$
|
2,362,152
|
|
|||||||||
The aging of the outstanding loans and leases by class at
December 31, 2012, and 2011
, (excluding loans acquired with deteriorated credit quality) is provided in the table below. The calculation of days past due begins on the day after payment is due and includes all days through which required interest or principal have not been paid. Loans and leases 30 days or less past due are considered current due to certain grace periods that allow borrowers to make payments within a stated period after the due date and still remain in compliance with the loan agreement.
|
31-60 days
past due
|
61-90 days
past due
|
Greater
than 90
days
|
Total past
due
|
Current
|
Total loans
and leases
|
||||||||||||||||||
|
December 31, 2012
|
|||||||||||||||||||||||
|
Noncovered loans and leases:
|
|||||||||||||||||||||||
|
Construction and land development - commercial
|
$
|
927
|
|
$
|
—
|
|
$
|
7,878
|
|
$
|
8,805
|
|
$
|
300,385
|
|
$
|
309,190
|
|
|||||
|
Commercial mortgage
|
21,075
|
|
3,987
|
|
20,318
|
|
45,380
|
|
5,296,459
|
|
5,341,839
|
|
|||||||||||
|
Other commercial real estate
|
387
|
|
1,240
|
|
1,034
|
|
2,661
|
|
158,319
|
|
160,980
|
|
|||||||||||
|
Commercial and industrial
|
6,205
|
|
1,288
|
|
1,614
|
|
9,107
|
|
1,717,019
|
|
1,726,126
|
|
|||||||||||
|
Lease financing
|
991
|
|
138
|
|
621
|
|
1,750
|
|
328,929
|
|
330,679
|
|
|||||||||||
|
Other
|
18
|
|
13
|
|
—
|
|
31
|
|
125,650
|
|
125,681
|
|
|||||||||||
|
Residential mortgage
|
15,711
|
|
7,559
|
|
12,993
|
|
36,263
|
|
786,626
|
|
822,889
|
|
|||||||||||
|
Revolving mortgage
|
12,868
|
|
3,200
|
|
3,879
|
|
19,947
|
|
2,190,186
|
|
2,210,133
|
|
|||||||||||
|
Construction and land development - noncommercial
|
1,941
|
|
490
|
|
797
|
|
3,228
|
|
128,764
|
|
131,992
|
|
|||||||||||
|
Consumer
|
4,405
|
|
1,705
|
|
1,278
|
|
7,388
|
|
409,218
|
|
416,606
|
|
|||||||||||
|
Total noncovered loans and leases
|
$
|
64,528
|
|
$
|
19,620
|
|
$
|
50,412
|
|
$
|
134,560
|
|
$
|
11,441,555
|
|
$
|
11,576,115
|
|
|||||
88
FIRST CITIZENS BANCSHARES, INC. AND SUBSIDIARIES
NOTES TO CONSOLIDATED FINANCIAL STATEMENTS—(Continued)
(dollars in thousands)
|
31-60 days
past due
|
61-90 days
past due
|
Greater
than 90
days
|
Total past
due
|
Current
|
Total loans
and leases
|
||||||||||||||||||
|
December 31, 2011
|
|||||||||||||||||||||||
|
Noncovered loans and leases:
|
|||||||||||||||||||||||
|
Construction and land development - commercial
|
$
|
2,623
|
|
$
|
1,494
|
|
$
|
2,177
|
|
$
|
6,294
|
|
$
|
374,869
|
|
$
|
381,163
|
|
|||||
|
Commercial mortgage
|
18,308
|
|
4,438
|
|
15,626
|
|
38,372
|
|
5,066,621
|
|
5,104,993
|
|
|||||||||||
|
Other commercial real estate
|
657
|
|
147
|
|
561
|
|
1,365
|
|
143,406
|
|
144,771
|
|
|||||||||||
|
Commercial and industrial
|
5,235
|
|
1,230
|
|
1,438
|
|
7,903
|
|
1,756,504
|
|
1,764,407
|
|
|||||||||||
|
Lease financing
|
637
|
|
212
|
|
620
|
|
1,469
|
|
311,400
|
|
312,869
|
|
|||||||||||
|
Other
|
—
|
|
—
|
|
—
|
|
—
|
|
158,369
|
|
158,369
|
|
|||||||||||
|
Residential mortgage
|
11,790
|
|
2,686
|
|
12,529
|
|
27,005
|
|
757,113
|
|
784,118
|
|
|||||||||||
|
Revolving mortgage
|
3,437
|
|
2,042
|
|
4,316
|
|
9,795
|
|
2,286,511
|
|
2,296,306
|
|
|||||||||||
|
Construction and land development - noncommercial
|
798
|
|
127
|
|
572
|
|
1,497
|
|
135,774
|
|
137,271
|
|
|||||||||||
|
Consumer
|
3,514
|
|
1,271
|
|
1,443
|
|
6,228
|
|
491,142
|
|
497,370
|
|
|||||||||||
|
Total noncovered loans and leases
|
$
|
46,999
|
|
$
|
13,647
|
|
$
|
39,282
|
|
$
|
99,928
|
|
$
|
11,481,709
|
|
$
|
11,581,637
|
|
|||||
The recorded investment, by class, in loans and leases on nonaccrual status and loans and leases greater than
90
days past due and still accruing at
December 31, 2012
, and
December 31, 2011
, (excluding loans and leases acquired with deteriorated credit quality) is as follows:
|
|
December 31, 2012
|
December 31, 2011
|
|||||||||||||
|
|
Nonaccrual
loans and
leases
|
Loans and
leases > 90
days and
accruing
|
Nonaccrual
loans and
leases
|
Loans and
leases > 90
days and
accruing
|
|||||||||||
|
Noncovered loans and leases:
|
|||||||||||||||
|
Construction and land development - commercial
|
$
|
14,930
|
|
$
|
541
|
|
$
|
15,102
|
|
$
|
313
|
|
|||
|
Commercial mortgage
|
48,869
|
|
1,671
|
|
23,748
|
|
3,107
|
|
|||||||
|
Commercial and industrial
|
8,635
|
|
466
|
|
1,864
|
|
320
|
|
|||||||
|
Lease financing
|
1,075
|
|
—
|
|
200
|
|
554
|
|
|||||||
|
Other commercial real estate
|
2,319
|
|
—
|
|
1,170
|
|
—
|
|
|||||||
|
Construction and land development - noncommercial
|
668
|
|
111
|
|
—
|
|
572
|
|
|||||||
|
Residential mortgage
|
12,603
|
|
3,337
|
|
10,657
|
|
4,227
|
|
|||||||
|
Revolving mortgage
|
—
|
|
3,877
|
|
—
|
|
4,306
|
|
|||||||
|
Consumer and other
|
746
|
|
1,269
|
|
—
|
|
1,441
|
|
|||||||
|
Total noncovered loans and leases
|
$
|
89,845
|
|
$
|
11,272
|
|
$
|
52,741
|
|
$
|
14,840
|
|
|||
Other risk elements related to lending activities include OREO and restructured loans. BancShares held
$139,963
and
$153,330
in noncovered restructured loans and
$43,513
and
$50,399
in noncovered OREO at
December 31, 2012, and 2011
, respectively. At
December 31, 2012, and 2011
, respectively,
$50,830
and
$29,534
of noncovered restructured loans were also on nonaccrual status. BancShares does not have any significant outstanding commitments to borrowers that have restructured existing loans to more favorable terms due to their financial difficulties.
Interest income on total nonperforming loans and leases that would have been recorded had these loans and leases been performing was
$27,397
,
$23,326
and
$18,519
respectively, during
2012, 2011 and 2010
. When loans and leases are on nonaccrual status, any payments received are applied on a cash basis with all cash receipts applied first to principal and any payments received in excess of the unpaid principal balance being applied to interest. The amount of cash basis interest income recognized during
2012, 2011 and 2010
was not material.
89
FIRST CITIZENS BANCSHARES, INC. AND SUBSIDIARIES
NOTES TO CONSOLIDATED FINANCIAL STATEMENTS—(Continued)
(dollars in thousands)
Acquired loans
When the fair values of covered loans were established, certain loans were identified as impaired. The following table provides changes in the carrying value of acquired loans during the years ended
December 31, 2012, and 2011
:
|
|
2012
|
2011
|
|||||||||||||
|
|
Impaired at
acquisition
date
|
All other
acquired
loans
|
Impaired at
acquisition
date
|
All other
acquired
loans
|
|||||||||||
|
Balance, January 1
|
$
|
458,305
|
|
$
|
1,903,847
|
|
$
|
330,705
|
|
$
|
1,676,747
|
|
|||
|
Fair value at acquisition date of acquired loans covered under loss share agreements
|
—
|
|
—
|
|
302,340
|
|
777,800
|
|
|||||||
|
Reductions for repayments, foreclosures and changes in carrying value, net of accretion
|
(167,679
|
)
|
(385,238
|
)
|
(174,740
|
)
|
(550,700
|
)
|
|||||||
|
Balance, December 31
|
$
|
290,626
|
|
$
|
1,518,609
|
|
$
|
458,305
|
|
$
|
1,903,847
|
|
|||
|
Outstanding principal balance, December 31
|
$
|
1,136,377
|
|
$
|
2,145,581
|
|
$
|
1,334,299
|
|
$
|
2,537,652
|
|
|||
The timing and amounts of cash flow analyses were prepared at the acquisition dates for all acquired loans deemed impaired at acquisition, except loans acquired in the VB and TVB transactions where the timing of cash flows was not estimated, and those analyses are used to determine the amount of accretable yield recognized on those loans. Subsequent changes in cash flow estimates result in changes to the amount of accretable yield to be recognized. No estimate of the timing of cash flows was initially made for loans acquired in the TVB or VB transactions at the dates of the acquisitions and, therefore, the cost recovery method was being applied to these loans unless cash flow estimates in the later periods indicated subsequent improvement that would lead to the recognition of accretable yield.
The carrying value of loans on the cost recovery method was
$74,479
at
December 31, 2012
, and
$200,819
at
December 31, 2011
. Prior to
2012
, the cost recovery method was being applied to nonperforming loans acquired from the TVB, VB, First Regional and United Western transactions unless available cash flow estimates indicated subsequent improvement that would lead to the recognition of accretable yield. During the third and fourth quarters of
2012
, loans acquired in the TVB, VB, First Regional and United Western transactions were installed on an acquired loan accounting system that enabled better estimations of cash flows for all loans. As a result of the four banks being converted to the acquired loan accounting system during
2012
, there was a significant reduction in loans accounted for under the cost recovery method. The cost recovery method continues to be applied to loans when the timing of the cash flows is no longer reasonably estimable due to subsequent nonperformance by the borrower or uncertainty in the ultimate disposition of the asset.
The following table documents changes to the amount of accretable yield for the years ended
December 31, 2012, and 2011
. For acquired loans, improved cash flow estimates and receipt of unscheduled loan payments result in the reclassification of nonaccretable yield to accretable yield. During
2012
, the improved ability to estimate cash flows due to expanded use of an acquired loan accounting system also contributed to significant increases in accretable yield. Accretable yield resulting from the improved ability to estimate future cash flows generally does not represent amounts previously identified as nonaccretable difference.
|
2012
|
2011
|
||||||
|
Balance, January 1
|
$
|
276,690
|
|
$
|
164,586
|
|
|
|
Additions for acquired loans
|
—
|
|
106,520
|
|
|||
|
Accretion
|
(304,023
|
)
|
(319,429
|
)
|
|||
|
Reclassifications from nonaccretable difference
|
353,708
|
|
325,013
|
|
|||
|
Changes in expected cash flows that do not affect nonaccretable difference
|
213,189
|
|
—
|
|
|||
|
Balance, December 31
|
$
|
539,564
|
|
$
|
276,690
|
|
|
90
FIRST CITIZENS BANCSHARES, INC. AND SUBSIDIARIES
NOTES TO CONSOLIDATED FINANCIAL STATEMENTS—(Continued)
(dollars in thousands)
Loans held for sale
In each period, BancShares originated much of its residential mortgage loan production through correspondent institutions. Loan sale activity for
2012, 2011 and 2010
is summarized below:
|
2012
|
2011
|
2010
|
|||||||||
|
Loans held for sale at December 31
|
$
|
86,333
|
|
$
|
92,539
|
|
$
|
88,933
|
|
||
|
For the year ended December 31:
|
|||||||||||
|
Loans sold
|
581,911
|
|
509,647
|
|
583,750
|
|
|||||
|
Net gain on sale of loans held for sale
|
7,465
|
|
8,751
|
|
8,858
|
|
|||||
NOTE D
- ALLOWANCE FOR LOAN AND LEASE LOSSES
Activity in the allowance for loan and lease losses is summarized as follows:
|
Noncovered loans
|
Covered loans
|
Total
|
||||||||
|
Balance at December 31, 2009
|
$
|
168,782
|
|
$
|
3,500
|
|
$
|
172,282
|
|
|
|
Provision for loan and lease losses
|
56,647
|
|
86,872
|
|
143,519
|
|
||||
|
Adoption of change in accounting for QSPE
|
681
|
|
—
|
|
681
|
|
||||
|
Loans and leases charged off
|
(55,783
|
)
|
(39,533
|
)
|
(95,316
|
)
|
||||
|
Loans and leases recovered
|
6,190
|
|
409
|
|
6,599
|
|
||||
|
Net charge-offs
|
(49,593
|
)
|
(39,124
|
)
|
(88,717
|
)
|
||||
|
Balance at December 31, 2010
|
176,517
|
|
51,248
|
|
227,765
|
|
||||
|
Provision for loan and lease losses
|
57,799
|
|
174,478
|
|
232,277
|
|
||||
|
Loans and leases charged off
|
(59,287
|
)
|
(137,553
|
)
|
(196,840
|
)
|
||||
|
Loans and leases recovered
|
5,854
|
|
1,088
|
|
6,942
|
|
||||
|
Net charge-offs
|
(53,433
|
)
|
(136,465
|
)
|
(189,898
|
)
|
||||
|
Balance at December 31, 2011
|
180,883
|
|
89,261
|
|
270,144
|
|
||||
|
Provision for loan and lease losses
|
42,046
|
|
100,839
|
|
142,885
|
|
||||
|
Loans and leases charged off
|
(50,208
|
)
|
(50,270
|
)
|
(100,478
|
)
|
||||
|
Loans and leases recovered
|
6,325
|
|
142
|
|
6,467
|
|
||||
|
Net charge-offs
|
(43,883
|
)
|
(50,128
|
)
|
(94,011
|
)
|
||||
|
Balance at December 31, 2012
|
$
|
179,046
|
|
$
|
139,972
|
|
$
|
319,018
|
|
|
Activity in the allowance for loans and lease losses, ending balances of loans and leases and related allowance by class of loans as of
December 31, 2012, and 2011
are summarized as follows:
91
FIRST CITIZENS BANCSHARES, INC. AND SUBSIDIARIES
NOTES TO CONSOLIDATED FINANCIAL STATEMENTS—(Continued)
(dollars in thousands)
|
Construction
and land development - commercial |
Commercial
mortgage |
Other
commercial real estate |
Commercial
and industrial |
Lease
financing |
Other
|
Residential
mortgage |
Revolving
mortgage |
Construction
and land development - non-commercial |
Consumer
|
Non-
specific |
Total
|
||||||||||||||||||||||||||||||||||||
|
Noncovered loans and leases
|
|||||||||||||||||||||||||||||||||||||||||||||||
|
Allowance for loan and lease losses:
|
|||||||||||||||||||||||||||||||||||||||||||||||
|
Balance at January 1, 2012
|
$
|
5,467
|
|
$
|
67,486
|
|
$
|
2,169
|
|
$
|
23,723
|
|
$
|
3,288
|
|
$
|
1,315
|
|
$
|
8,879
|
|
$
|
27,045
|
|
$
|
1,427
|
|
$
|
25,962
|
|
$
|
14,122
|
|
$
|
180,883
|
|
|||||||||||
|
Charge-offs
|
(9,546
|
)
|
(7,081
|
)
|
(254
|
)
|
(5,472
|
)
|
(361
|
)
|
(28
|
)
|
(4,790
|
)
|
(11,341
|
)
|
(1,047
|
)
|
(10,288
|
)
|
—
|
|
(50,208
|
)
|
|||||||||||||||||||||||
|
Recoveries
|
445
|
|
1,626
|
|
14
|
|
781
|
|
96
|
|
4
|
|
529
|
|
698
|
|
180
|
|
1,952
|
|
—
|
|
6,325
|
|
|||||||||||||||||||||||
|
Provision
|
9,665
|
|
8,896
|
|
130
|
|
4,320
|
|
498
|
|
(116
|
)
|
(782
|
)
|
8,783
|
|
1,161
|
|
7,763
|
|
1,728
|
|
42,046
|
|
|||||||||||||||||||||||
|
Balance at December 31, 2012
|
$
|
6,031
|
|
$
|
70,927
|
|
$
|
2,059
|
|
$
|
23,352
|
|
$
|
3,521
|
|
$
|
1,175
|
|
$
|
3,836
|
|
$
|
25,185
|
|
$
|
1,721
|
|
$
|
25,389
|
|
$
|
15,850
|
|
$
|
179,046
|
|
|||||||||||
|
Balance at December 31, 2012
|
|||||||||||||||||||||||||||||||||||||||||||||||
|
ALLL for loans and leases individually evaluated for impairment
|
$
|
2,469
|
|
$
|
11,697
|
|
$
|
298
|
|
$
|
2,133
|
|
$
|
202
|
|
$
|
53
|
|
$
|
959
|
|
$
|
1
|
|
$
|
287
|
|
$
|
256
|
|
$
|
—
|
|
$
|
18,355
|
|
|||||||||||
|
ALLL for loans and leases collectively evaluated for impairment
|
3,562
|
|
59,230
|
|
1,761
|
|
21,219
|
|
3,319
|
|
1,122
|
|
2,877
|
|
25,184
|
|
1,434
|
|
25,133
|
|
—
|
|
144,841
|
|
|||||||||||||||||||||||
|
Nonspecific ALLL
|
—
|
|
—
|
|
—
|
|
—
|
|
—
|
|
—
|
|
—
|
|
—
|
|
—
|
|
—
|
|
15,850
|
|
15,850
|
|
|||||||||||||||||||||||
|
Total allowance for loan and lease losses
|
$
|
6,031
|
|
$
|
70,927
|
|
$
|
2,059
|
|
$
|
23,352
|
|
$
|
3,521
|
|
$
|
1,175
|
|
$
|
3,836
|
|
$
|
25,185
|
|
$
|
1,721
|
|
$
|
25,389
|
|
$
|
15,850
|
|
$
|
179,046
|
|
|||||||||||
|
Loans and leases:
|
|||||||||||||||||||||||||||||||||||||||||||||||
|
Balance at December 31, 2012
|
|||||||||||||||||||||||||||||||||||||||||||||||
|
Loans and leases individually evaluated for impairment
|
$
|
17,075
|
|
$
|
133,804
|
|
$
|
3,375
|
|
$
|
22,619
|
|
$
|
804
|
|
$
|
707
|
|
$
|
15,836
|
|
$
|
4,203
|
|
$
|
1,321
|
|
$
|
2,509
|
|
$
|
—
|
|
$
|
202,253
|
|
|||||||||||
|
Loans and leases collectively evaluated for impairment
|
292,115
|
|
5,208,035
|
|
157,605
|
|
1,703,507
|
|
329,875
|
|
124,974
|
|
807,053
|
|
2,205,930
|
|
130,671
|
|
414,097
|
|
—
|
|
11,373,862
|
|
|||||||||||||||||||||||
|
Total loans and leases
|
$
|
309,190
|
|
$
|
5,341,839
|
|
$
|
160,980
|
|
$
|
1,726,126
|
|
$
|
330,679
|
|
$
|
125,681
|
|
$
|
822,889
|
|
$
|
2,210,133
|
|
$
|
131,992
|
|
$
|
416,606
|
|
$
|
—
|
|
$
|
11,576,115
|
|
|||||||||||
|
Allowance for loan and lease losses:
|
|||||||||||||||||||||||||||||||||||||||||||||||
|
Balance at January 1, 2011
|
$
|
10,512
|
|
$
|
64,772
|
|
$
|
2,200
|
|
$
|
24,089
|
|
$
|
3,384
|
|
$
|
1,473
|
|
$
|
7,009
|
|
$
|
18,016
|
|
$
|
1,751
|
|
$
|
29,448
|
|
$
|
13,863
|
|
$
|
176,517
|
|
|||||||||||
|
Charge-offs
|
(11,189
|
)
|
(6,975
|
)
|
(24
|
)
|
(5,879
|
)
|
(579
|
)
|
(89
|
)
|
(5,566
|
)
|
(13,940
|
)
|
(2,617
|
)
|
(12,429
|
)
|
—
|
|
(59,287
|
)
|
|||||||||||||||||||||||
|
Recoveries
|
218
|
|
945
|
|
23
|
|
1,025
|
|
133
|
|
2
|
|
989
|
|
653
|
|
189
|
|
1,677
|
|
—
|
|
5,854
|
|
|||||||||||||||||||||||
|
Provision
|
5,926
|
|
8,744
|
|
(30
|
)
|
4,488
|
|
350
|
|
(71
|
)
|
6,447
|
|
22,316
|
|
2,104
|
|
7,266
|
|
259
|
|
57,799
|
|
|||||||||||||||||||||||
|
Balance at December 31, 2011
|
$
|
5,467
|
|
$
|
67,486
|
|
$
|
2,169
|
|
$
|
23,723
|
|
$
|
3,288
|
|
$
|
1,315
|
|
$
|
8,879
|
|
$
|
27,045
|
|
|
$
|
1,427
|
|
$
|
25,962
|
|
$
|
14,122
|
|
$
|
180,883
|
|
||||||||||
|
Balance at December 31, 2011
|
|||||||||||||||||||||||||||||||||||||||||||||||
|
ALLL for loans and leases individually evaluated for impairment
|
$
|
1,139
|
|
$
|
5,266
|
|
$
|
283
|
|
$
|
640
|
|
$
|
17
|
|
$
|
14
|
|
$
|
411
|
|
$
|
—
|
|
$
|
145
|
|
$
|
47
|
|
$
|
—
|
|
$
|
7,962
|
|
|||||||||||
|
ALLL for loans and leases collectively evaluated for impairment
|
4,328
|
|
62,220
|
|
1,886
|
|
23,083
|
|
3,271
|
|
1,301
|
|
8,468
|
|
27,045
|
|
1,282
|
|
25,915
|
|
—
|
|
158,799
|
|
|||||||||||||||||||||||
|
Nonspecific ALLL
|
—
|
|
—
|
|
—
|
|
—
|
|
—
|
|
—
|
|
—
|
|
—
|
|
—
|
|
—
|
|
14,122
|
|
14,122
|
|
|||||||||||||||||||||||
|
Total allowance for loan and lease losses
|
$
|
5,467
|
|
$
|
67,486
|
|
$
|
2,169
|
|
$
|
23,723
|
|
$
|
3,288
|
|
$
|
1,315
|
|
$
|
8,879
|
|
$
|
27,045
|
|
$
|
1,427
|
|
$
|
25,962
|
|
$
|
14,122
|
|
$
|
180,883
|
|
|||||||||||
|
Loans and leases:
|
|||||||||||||||||||||||||||||||||||||||||||||||
|
Balance at December 31, 2011
|
|||||||||||||||||||||||||||||||||||||||||||||||
|
Loans and leases individually evaluated for impairment
|
$
|
26,782
|
|
$
|
92,872
|
|
$
|
5,686
|
|
$
|
15,996
|
|
$
|
328
|
|
$
|
193
|
|
$
|
9,776
|
|
$
|
—
|
|
$
|
3,676
|
|
$
|
992
|
|
$
|
—
|
|
$
|
156,301
|
|
|||||||||||
|
Loans and leases collectively evaluated for impairment
|
354,381
|
|
5,012,121
|
|
139,085
|
|
1,748,411
|
|
312,541
|
|
158,176
|
|
774,342
|
|
2,296,306
|
|
133,595
|
|
496,378
|
|
—
|
|
11,425,336
|
|
|||||||||||||||||||||||
|
Total loans and leases
|
$
|
381,163
|
|
$
|
5,104,993
|
|
$
|
144,771
|
|
$
|
1,764,407
|
|
$
|
312,869
|
|
$
|
158,369
|
|
$
|
784,118
|
|
$
|
2,296,306
|
|
$
|
137,271
|
|
$
|
497,370
|
|
$
|
—
|
|
$
|
11,581,637
|
|
|||||||||||
92
FIRST CITIZENS BANCSHARES, INC. AND SUBSIDIARIES
NOTES TO CONSOLIDATED FINANCIAL STATEMENTS—(Continued)
(dollars in thousands)
|
Construction
and land development - commercial |
Commercial
mortgage |
Other
commercial real estate |
Commercial
and industrial |
Lease
financing |
Residential
mortgage |
Revolving
mortgage |
Construction
and land development - non-commercial |
Consumer
and other
|
Total
|
||||||||||||||||||||||||||||||
|
Covered loans and leases
|
|||||||||||||||||||||||||||||||||||||||
|
Allowance for loan and lease losses:
|
|||||||||||||||||||||||||||||||||||||||
|
Balance at January 1, 2012
|
$
|
16,693
|
|
$
|
39,557
|
|
$
|
16,862
|
|
$
|
5,500
|
|
$
|
13
|
|
$
|
5,433
|
|
$
|
77
|
|
$
|
4,652
|
|
$
|
474
|
|
$
|
89,261
|
|
|||||||||
|
Charge-offs
|
(8,667
|
)
|
(23,509
|
)
|
(1,256
|
)
|
(8,442
|
)
|
—
|
|
(4,139
|
)
|
(1,119
|
)
|
(2,885
|
)
|
(253
|
)
|
(50,270
|
)
|
|||||||||||||||||||
|
Recoveries
|
—
|
|
—
|
|
—
|
|
—
|
|
—
|
|
142
|
|
—
|
|
—
|
|
—
|
|
142
|
|
|||||||||||||||||||
|
Provision
|
23,160
|
|
34,227
|
|
(4,372
|
)
|
11,839
|
|
(13
|
)
|
18,401
|
|
10,796
|
|
6,520
|
|
281
|
|
100,839
|
|
|||||||||||||||||||
|
Balance at December 31, 2012
|
$
|
31,186
|
|
$
|
50,275
|
|
$
|
11,234
|
|
$
|
8,897
|
|
$
|
—
|
|
$
|
19,837
|
|
$
|
9,754
|
|
$
|
8,287
|
|
$
|
502
|
|
$
|
139,972
|
|
|||||||||
|
Balance at December 31, 2012
|
|||||||||||||||||||||||||||||||||||||||
|
ALLL for loans acquired with deteriorated credit quality
|
$
|
31,186
|
|
$
|
50,275
|
|
$
|
11,234
|
|
$
|
8,897
|
|
$
|
—
|
|
$
|
19,837
|
|
$
|
9,754
|
|
$
|
8,287
|
|
$
|
502
|
|
$
|
139,972
|
|
|||||||||
|
Loans:
|
|||||||||||||||||||||||||||||||||||||||
|
Balance at December 31, 2012
|
|||||||||||||||||||||||||||||||||||||||
|
Loans acquired with deteriorated credit quality
|
237,906
|
|
1,054,473
|
|
107,119
|
|
49,463
|
|
—
|
|
297,926
|
|
38,710
|
|
20,793
|
|
2,845
|
|
1,809,235
|
|
|||||||||||||||||||
|
Allowance for loan and lease losses:
|
|||||||||||||||||||||||||||||||||||||||
|
Balance at January 1, 2011
|
$
|
20,654
|
|
$
|
13,199
|
|
$
|
4,148
|
|
$
|
6,828
|
|
$
|
—
|
|
$
|
113
|
|
$
|
676
|
|
$
|
5,607
|
|
$
|
23
|
|
$
|
51,248
|
|
|||||||||
|
Charge-offs
|
(36,432
|
)
|
(49,905
|
)
|
(29,063
|
)
|
(6,115
|
)
|
—
|
|
(5,723
|
)
|
—
|
|
(9,912
|
)
|
(403
|
)
|
(137,553
|
)
|
|||||||||||||||||||
|
Recoveries
|
389
|
|
83
|
|
479
|
|
12
|
|
—
|
|
94
|
|
—
|
|
30
|
|
1
|
|
1,088
|
|
|||||||||||||||||||
|
Provision
|
32,082
|
|
76,180
|
|
41,298
|
|
4,775
|
|
13
|
|
10,949
|
|
(599
|
)
|
8,927
|
|
853
|
|
174,478
|
|
|||||||||||||||||||
|
Balance at December 31, 2011
|
$
|
16,693
|
|
$
|
39,557
|
|
$
|
16,862
|
|
$
|
5,500
|
|
$
|
13
|
|
$
|
5,433
|
|
$
|
77
|
|
$
|
4,652
|
|
$
|
474
|
|
$
|
89,261
|
|
|||||||||
|
Balance at December 31, 2011
|
|||||||||||||||||||||||||||||||||||||||
|
ALLL for loans acquired with deteriorated credit quality
|
$
|
16,693
|
|
$
|
39,557
|
|
$
|
16,862
|
|
$
|
5,500
|
|
$
|
13
|
|
$
|
5,433
|
|
$
|
77
|
|
$
|
4,652
|
|
$
|
474
|
|
$
|
89,261
|
|
|||||||||
|
Loans:
|
|||||||||||||||||||||||||||||||||||||||
|
Balance at December 31, 2011
|
|||||||||||||||||||||||||||||||||||||||
|
Loans acquired with deteriorated credit quality
|
338,873
|
|
1,260,589
|
|
158,394
|
|
113,442
|
|
57
|
|
327,568
|
|
51,552
|
|
105,536
|
|
6,141
|
|
2,362,152
|
|
|||||||||||||||||||
93
FIRST CITIZENS BANCSHARES, INC. AND SUBSIDIARIES
NOTES TO CONSOLIDATED FINANCIAL STATEMENTS—(Continued)
(dollars in thousands)
The following table provides information on noncovered impaired loans and leases, exclusive of those loans and leases evaluated collectively as a homogeneous group, including interest income recognized in the period during which the loans and leases were considered impaired.
|
With a
recorded
allowance
|
With no
recorded
allowance
|
Total
|
Unpaid
principal balance |
Related
allowance
recorded
|
|||||||||||||||
|
December 31, 2012
|
|||||||||||||||||||
|
Noncovered impaired loans and leases
|
|||||||||||||||||||
|
Construction and land development—commercial
|
$
|
5,941
|
|
$
|
10,116
|
|
$
|
16,057
|
|
$
|
31,879
|
|
$
|
2,340
|
|
||||
|
Commercial mortgage
|
39,648
|
|
72,160
|
|
111,808
|
|
114,351
|
|
10,628
|
|
|||||||||
|
Other commercial real estate
|
1,425
|
|
1,823
|
|
3,248
|
|
3,348
|
|
279
|
|
|||||||||
|
Commercial and industrial
|
7,429
|
|
11,371
|
|
18,800
|
|
19,196
|
|
1,949
|
|
|||||||||
|
Lease financing
|
665
|
|
81
|
|
746
|
|
746
|
|
194
|
|
|||||||||
|
Other
|
—
|
|
707
|
|
707
|
|
707
|
|
53
|
|
|||||||||
|
Residential mortgage
|
9,346
|
|
4,240
|
|
13,586
|
|
13,978
|
|
832
|
|
|||||||||
|
Revolving mortgage
|
1,238
|
|
2,965
|
|
4,203
|
|
4,203
|
|
1
|
|
|||||||||
|
Construction and land development—noncommercial
|
1,162
|
|
158
|
|
1,320
|
|
1,321
|
|
287
|
|
|||||||||
|
Consumer
|
1,609
|
|
900
|
|
2,509
|
|
2,509
|
|
256
|
|
|||||||||
|
Total impaired noncovered loans and leases
|
$
|
68,463
|
|
$
|
104,521
|
|
$
|
172,984
|
|
$
|
192,238
|
|
$
|
16,819
|
|
||||
|
December 31, 2011
|
|||||||||||||||||||
|
Noncovered impaired loans and leases
|
|||||||||||||||||||
|
Construction and land development—commercial
|
$
|
24,994
|
|
$
|
—
|
|
$
|
24,994
|
|
$
|
30,756
|
|
$
|
1,027
|
|
||||
|
Commercial mortgage
|
53,687
|
|
11,840
|
|
65,527
|
|
66,463
|
|
3,813
|
|
|||||||||
|
Other commercial real estate
|
1,558
|
|
1,022
|
|
2,580
|
|
322
|
|
114
|
|
|||||||||
|
Commercial and industrial
|
7,157
|
|
7,111
|
|
14,268
|
|
12,674
|
|
549
|
|
|||||||||
|
Lease financing
|
322
|
|
—
|
|
322
|
|
992
|
|
16
|
|
|||||||||
|
Other
|
—
|
|
—
|
|
—
|
|
—
|
|
—
|
|
|||||||||
|
Residential mortgage
|
9,776
|
|
—
|
|
9,776
|
|
2,580
|
|
411
|
|
|||||||||
|
Revolving mortgage
|
—
|
|
—
|
|
—
|
|
—
|
|
—
|
|
|||||||||
|
Construction and land development—noncommercial
|
3,676
|
|
—
|
|
3,676
|
|
14,268
|
|
145
|
|
|||||||||
|
Consumer
|
992
|
|
—
|
|
992
|
|
3,676
|
|
47
|
|
|||||||||
|
Total impaired noncovered loans and leases
|
$
|
102,162
|
|
$
|
19,973
|
|
$
|
122,135
|
|
$
|
131,731
|
|
$
|
6,122
|
|
||||
94
FIRST CITIZENS BANCSHARES, INC. AND SUBSIDIARIES
NOTES TO CONSOLIDATED FINANCIAL STATEMENTS—(Continued)
(dollars in thousands)
|
YTD average
balance
|
Interest income
recognized YTD
|
||||||
|
Year ended December 31, 2012
|
|||||||
|
Noncovered impaired loans and leases
|
|||||||
|
Construction and land development - commercial
|
$
|
22,493
|
|
$
|
399
|
|
|
|
Commercial mortgage
|
96,082
|
|
4,630
|
|
|||
|
Other commercial real estate
|
2,690
|
|
142
|
|
|||
|
Commercial and industrial
|
13,658
|
|
788
|
|
|||
|
Lease financing
|
497
|
|
37
|
|
|||
|
Other
|
424
|
|
23
|
|
|||
|
Residential mortgage
|
14,951
|
|
586
|
|
|||
|
Revolving mortgage
|
2,931
|
|
68
|
|
|||
|
Construction and land development - noncommercial
|
2,850
|
|
41
|
|
|||
|
Consumer
|
1,850
|
|
21
|
|
|||
|
Total noncovered impaired loans and leases
|
$
|
158,426
|
|
$
|
6,735
|
|
|
|
Year ended December 31, 2011
|
|||||||
|
Noncovered impaired loans and leases
|
|||||||
|
Construction and land development - commercial
|
$
|
26,612
|
|
$
|
56
|
|
|
|
Commercial mortgage
|
65,729
|
|
1,330
|
|
|||
|
Other commercial real estate
|
1,368
|
|
55
|
|
|||
|
Commercial and industrial
|
12,984
|
|
456
|
|
|||
|
Lease financing
|
587
|
|
21
|
|
|||
|
Other
|
38
|
|
—
|
|
|||
|
Residential mortgage
|
9,252
|
|
300
|
|
|||
|
Construction and land development - noncommercial
|
2,022
|
|
105
|
|
|||
|
Consumer
|
636
|
|
18
|
|
|||
|
Total noncovered impaired loans and leases
|
$
|
119,228
|
|
$
|
2,341
|
|
|
|
Year ended December 31, 2010
|
|||||||
|
Construction and land development - commercial
|
$
|
19,235
|
|
$
|
93
|
|
|
|
Commercial mortgage
|
25,451
|
|
1,193
|
|
|||
|
Other commercial real estate
|
353
|
|
18
|
|
|||
|
Commercial and industrial
|
3,420
|
|
337
|
|
|||
|
Lease financing
|
281
|
|
9
|
|
|||
|
Other
|
31
|
|
3
|
|
|||
|
Residential mortgage
|
2,314
|
|
129
|
|
|||
|
Construction and land development - noncommercial
|
182
|
|
41
|
|
|||
|
Consumer
|
39
|
|
1
|
|
|||
|
Total noncovered impaired loans and leases
|
$
|
51,306
|
|
$
|
1,824
|
|
|
At
December 31, 2012
, covered loans which have had an adverse change in expected cash flows since the date of acquisition equaled
$975,920
, f
or which
$139,972
in related allowance for loan losses has been recorded. At
December 31, 2011
, covered loans which have had an adverse change in expected cash flows since the date of acquisition equaled
$1,886,929
,
for which
$89,261
in related allowance for loan losses has been recorded. Covered loans of
$833,315
at
December 31, 2012
, and
$475,223
at
December 31, 2011
, that have had no adverse change in expected cash flows since the date of acquisition have no allowance for loan losses recorded.
95
FIRST CITIZENS BANCSHARES, INC. AND SUBSIDIARIES
NOTES TO CONSOLIDATED FINANCIAL STATEMENTS—(Continued)
(dollars in thousands)
Troubled Debt Restructurings
The following table provides the types of troubled debt restructurings made for the years ended
December 31, 2012
and
December 31, 2011
, as well as loans restructured during
2012
and
2011
that have experienced payment default subsequent to restructuring.
.
|
Year ended December 31, 2012
|
Year ended December 31, 2011
|
||||||||||||||||||
|
All restructurings
|
Restructurings with subsequent payment default
|
All restructurings
|
Restructurings with subsequent payment default
|
||||||||||||||||
|
Number of loans
|
Recorded investment
|
Number of loans
|
Recorded investment
|
Number of loans
|
Recorded investment
|
Number of loans
|
Recorded investment
|
||||||||||||
|
Noncovered loans
|
|||||||||||||||||||
|
Interest only period provided
|
|||||||||||||||||||
|
Construction and land development - commercial
|
2
|
$
|
316
|
|
—
|
$
|
—
|
|
3
|
$
|
1,232
|
|
3
|
$
|
1,232
|
|
|||
|
Commercial mortgage
|
12
|
3,891
|
|
3
|
1,440
|
|
32
|
16,473
|
|
7
|
3,684
|
|
|||||||
|
Commercial and industrial
|
2
|
574
|
|
—
|
—
|
|
7
|
2,601
|
|
—
|
—
|
|
|||||||
|
Lease financing
|
—
|
—
|
|
—
|
—
|
|
1
|
71
|
|
—
|
—
|
|
|||||||
|
Residential mortgage
|
2
|
893
|
|
2
|
893
|
|
3
|
592
|
|
—
|
—
|
|
|||||||
|
Construction and land development - noncommercial
|
—
|
—
|
|
—
|
—
|
|
2
|
807
|
|
—
|
—
|
|
|||||||
|
Consumer
|
—
|
—
|
|
—
|
—
|
|
1
|
900
|
|
—
|
—
|
|
|||||||
|
Total interest only
|
18
|
5,674
|
|
5
|
2,333
|
|
49
|
22,676
|
|
10
|
4,916
|
|
|||||||
|
Loan term extension
|
|||||||||||||||||||
|
Construction and land development - commercial
|
2
|
7,667
|
|
—
|
—
|
|
5
|
$
|
9,262
|
|
—
|
$
|
—
|
|
|||||
|
Commercial mortgage
|
50
|
16,818
|
|
13
|
3,456
|
|
50
|
22,471
|
|
7
|
2,771
|
|
|||||||
|
Other commercial real estate
|
3
|
1,318
|
|
—
|
—
|
|
5
|
2,208
|
|
1
|
147
|
|
|||||||
|
Commercial and industrial
|
11
|
1,363
|
|
4
|
169
|
|
24
|
9,818
|
|
4
|
770
|
|
|||||||
|
Lease financing
|
3
|
166
|
|
—
|
—
|
|
6
|
252
|
|
—
|
—
|
|
|||||||
|
Residential mortgage
|
9
|
521
|
|
2
|
155
|
|
8
|
1,923
|
|
2
|
625
|
|
|||||||
|
Construction and land development - noncommercial
|
1
|
158
|
|
—
|
—
|
|
1
|
395
|
|
—
|
—
|
|
|||||||
|
Consumer
|
7
|
1,132
|
|
—
|
—
|
|
1
|
92
|
|
1
|
92
|
|
|||||||
|
Total loan term extension
|
86
|
29,143
|
|
19
|
3,780
|
|
100
|
46,421
|
|
15
|
4,405
|
|
|||||||
|
Below market interest rate
|
|||||||||||||||||||
|
Construction and land development - commercial
|
1
|
227
|
|
—
|
—
|
|
7
|
$
|
13,800
|
|
—
|
$
|
—
|
|
|||||
|
Commercial mortgage
|
12
|
7,333
|
|
1
|
490
|
|
21
|
13,082
|
|
4
|
678
|
|
|||||||
|
Other commercial real estate
|
—
|
—
|
|
—
|
—
|
|
1
|
372
|
|
1
|
372
|
|
|||||||
|
Commercial and industrial
|
11
|
1,584
|
|
1
|
—
|
|
4
|
503
|
|
1
|
28
|
|
|||||||
|
Residential mortgage
|
13
|
1,887
|
|
5
|
828
|
|
12
|
2,572
|
|
1
|
52
|
|
|||||||
|
Construction and land development - noncommercial
|
—
|
—
|
|
—
|
—
|
|
2
|
2,357
|
|
1
|
356
|
|
|||||||
|
Revolving mortgage
|
1
|
48
|
|
1
|
48
|
|
—
|
—
|
|
—
|
—
|
|
|||||||
|
Consumer
|
4
|
17
|
|
1
|
—
|
|
—
|
—
|
|
—
|
—
|
|
|||||||
|
Total below market interest rate
|
42
|
11,096
|
|
9
|
1,366
|
|
47
|
32,686
|
|
8
|
1,486
|
|
|||||||
|
Other concession
|
|||||||||||||||||||
|
Commercial mortgage
|
3
|
1,036
|
|
0
|
—
|
|
1
|
593
|
|
—
|
0
|
|
|||||||
|
Commercial and industrial
|
—
|
—
|
|
0
|
—
|
|
2
|
37
|
|
2
|
37
|
|
|||||||
|
Residential mortgage
|
1
|
384
|
|
0
|
—
|
|
0
|
—
|
|
—
|
—
|
|
|||||||
|
Total other concession
|
4
|
1,420
|
|
0
|
—
|
|
3
|
630
|
|
2
|
37
|
|
|||||||
|
Total noncovered restructurings
|
150
|
$
|
47,333
|
|
33
|
$
|
7,479
|
|
199
|
$
|
102,413
|
|
35
|
$
|
10,844
|
|
|||
96
FIRST CITIZENS BANCSHARES, INC. AND SUBSIDIARIES
NOTES TO CONSOLIDATED FINANCIAL STATEMENTS—(Continued)
(dollars in thousands)
|
Year ended December 31, 2012
|
Year ended December 31, 2011
|
||||||||||||||||||
|
All restructurings
|
Restructurings with subsequent payment default
|
All restructurings
|
Restructurings with subsequent payment default
|
||||||||||||||||
|
Number of loans
|
Recorded investment at period end
|
Number of loans
|
Recorded investment at period end
|
Number of loans
|
Recorded investment at period end
|
Number of loans
|
Recorded investment at period end
|
||||||||||||
|
Covered loans
|
|||||||||||||||||||
|
Interest only period provided
|
|||||||||||||||||||
|
Construction and land development - commercial
|
2
|
$
|
496
|
|
1
|
$
|
356
|
|
6
|
$
|
10,481
|
|
1
|
$
|
3,602
|
|
|||
|
Commercial mortgage
|
4
|
10,404
|
|
1
|
234
|
|
4
|
8,331
|
|
1
|
2
|
|
|||||||
|
Other commercial real estate
|
1
|
2,994
|
|
—
|
—
|
|
—
|
—
|
|
—
|
—
|
|
|||||||
|
Commercial and industrial
|
1
|
170
|
|
—
|
—
|
|
—
|
—
|
|
—
|
—
|
|
|||||||
|
Residential mortgage
|
1
|
98
|
|
—
|
—
|
|
2
|
5,361
|
|
1
|
4,287
|
|
|||||||
|
Total interest only
|
9
|
14,162
|
|
2
|
590
|
|
12
|
24,173
|
|
3
|
7,891
|
|
|||||||
|
Loan term extension
|
|||||||||||||||||||
|
Construction and land development - commercial
|
9
|
7,294
|
|
1
|
3,703
|
|
7
|
3,145
|
|
3
|
1,386
|
|
|||||||
|
Commercial mortgage
|
4
|
2,584
|
|
—
|
—
|
|
7
|
7,368
|
|
—
|
—
|
|
|||||||
|
Other commercial real estate
|
—
|
—
|
|
—
|
—
|
|
5
|
9,733
|
|
—
|
—
|
|
|||||||
|
Commercial and industrial
|
2
|
158
|
|
—
|
—
|
|
3
|
291
|
|
—
|
—
|
|
|||||||
|
Residential mortgage
|
4
|
5,111
|
|
2
|
4,629
|
|
6
|
2,188
|
|
3
|
744
|
|
|||||||
|
Construction and land development - noncommercial
|
—
|
—
|
|
—
|
—
|
|
1
|
2,097
|
|
1
|
2,097
|
|
|||||||
|
Total loan term extension
|
19
|
15,147
|
|
3
|
8,332
|
|
29
|
24,822
|
|
7
|
4,227
|
|
|||||||
|
Below market interest rate
|
|||||||||||||||||||
|
Construction and land development - commercial
|
13
|
19,953
|
|
5
|
8,781
|
|
21
|
22,554
|
|
5
|
15,615
|
|
|||||||
|
Commercial mortgage
|
18
|
19,100
|
|
6
|
3,906
|
|
21
|
50,962
|
|
2
|
1,357
|
|
|||||||
|
Other commercial real estate
|
2
|
1,954
|
|
—
|
—
|
|
1
|
684
|
|
—
|
—
|
|
|||||||
|
Commercial and industrial
|
5
|
1,299
|
|
2
|
—
|
|
7
|
2,217
|
|
1
|
809
|
|
|||||||
|
Residential mortgage
|
21
|
4,622
|
|
10
|
490
|
|
19
|
4,392
|
|
6
|
1,409
|
|
|||||||
|
Construction and land development - noncommercial
|
1
|
—
|
|
1
|
—
|
|
1
|
1,678
|
|
—
|
—
|
|
|||||||
|
Total below market interest rate
|
60
|
46,928
|
|
24
|
13,177
|
|
70
|
82,487
|
|
14
|
19,190
|
|
|||||||
|
Other concession
|
|||||||||||||||||||
|
Residential mortgage
|
1
|
54
|
|
1
|
54
|
|
1
|
702
|
|
—
|
—
|
|
|||||||
|
Total other concession
|
1
|
54
|
|
1
|
54
|
|
1
|
702
|
|
—
|
—
|
|
|||||||
|
Total covered restructurings
|
89
|
$
|
76,291
|
|
30
|
$
|
22,153
|
|
112
|
$
|
132,184
|
|
24
|
$
|
31,308
|
|
|||
For the years ended
December 31, 2012
, and
December 31, 2011
, the recorded investment in troubled debt restructurings prior to modification was not materially impacted by the modification since forgiveness of principal is not a restructuring option frequently used by BancShares.
Total troubled debt restructurings at
December 31, 2012
equaled
$333,170
, of which,
$193,207
were covered and
$139,963
were noncovered. Total troubled debt restructurings at
December 31, 2011
equaled
$323,061
, of which,
$169,731
were covered and
$153,330
were noncovered. Noncovered troubled debt restructurings of
$89,133
and
$123,796
as of
December 31, 2012
and
2011
, are considered performing as a result of the loans carrying a market interest rate and exhibiting evidence of sustained performance after restructuring.
97
FIRST CITIZENS BANCSHARES, INC. AND SUBSIDIARIES
NOTES TO CONSOLIDATED FINANCIAL STATEMENTS—(Continued)
(dollars in thousands)
NOTE E
- PREMISES AND EQUIPMENT
Major classifications of premises and equipment at
December 31, 2012, and 2011
are summarized as follows:
|
2012
|
2011
|
||||||
|
Land
|
$
|
202,168
|
|
$
|
193,663
|
|
|
|
Premises and leasehold improvements
|
840,149
|
|
803,602
|
|
|||
|
Furniture and equipment
|
390,345
|
|
353,664
|
|
|||
|
Total
|
1,432,662
|
|
1,350,929
|
|
|||
|
Less accumulated depreciation and amortization
|
549,894
|
|
496,453
|
|
|||
|
Total premises and equipment
|
$
|
882,768
|
|
$
|
854,476
|
|
|
There were no premises pledged to secure borrowings at
December 31, 2012, and 2011
.
BancShares leases certain premises and equipment under various lease agreements that provide for payment of property taxes, insurance and maintenance costs. Operating leases frequently provide for one or more renewal options on the same basis as current rental terms. However, certain leases require increased rentals under cost of living escalation clauses. Some leases also provide purchase options.
Future minimum rental commitments for noncancellable operating leases with initial or remaining terms of one or more years consisted of the following at
December 31, 2012:
|
Year ended December 31
|
|||
|
2013
|
$
|
20,910
|
|
|
2014
|
16,911
|
|
|
|
2015
|
13,805
|
|
|
|
2016
|
9,035
|
|
|
|
2017
|
5,846
|
|
|
|
Thereafter
|
44,722
|
|
|
|
Total minimum payments
|
$
|
111,229
|
|
Total rent expense for all operating leases amounted to
$23,630
in
2012
,
$24,749
in
2011
and
$24,627
in
2010
, net of rent income, which totaled
$1,728
,
$1,667
and
$1,685
during
2012
,
2011
and
2010
, respectively.
NOTE F
- RECEIVABLE FROM FDIC FOR LOSS SHARE AGREEMENTS
BancShares has entered into loss share agreements with the FDIC that provide significant protection regarding certain acquired assets. The expected reimbursements under the loss share agreements were recorded as an indemnification asset at the time of each acquisition.
The following table presents the changes in the receivable from the FDIC for loss share agreements:
|
2012
|
2011
|
2010
|
|||||||||
|
Balance, January 1
|
$
|
617,377
|
|
$
|
671,023
|
|
$
|
249,842
|
|
||
|
Additional receivable from acquisitions
|
—
|
|
316,932
|
|
512,778
|
|
|||||
|
Amortization of discounts and premiums, net
|
(102,394
|
)
|
(32,960
|
)
|
(12,891
|
)
|
|||||
|
Receipt of payments from FDIC
|
(251,972
|
)
|
(293,067
|
)
|
(52,422
|
)
|
|||||
|
Post-acquisition adjustments
|
7,181
|
|
(44,551
|
)
|
(26,284
|
)
|
|||||
|
Balance, December 31
|
$
|
270,192
|
|
$
|
617,377
|
|
$
|
671,023
|
|
||
98
FIRST CITIZENS BANCSHARES, INC. AND SUBSIDIARIES
NOTES TO CONSOLIDATED FINANCIAL STATEMENTS—(Continued)
(dollars in thousands)
Post-acquisition adjustments represent the net change in loss estimates related to covered loans and OREO as a result of changes in expected cash flows and the allowance for loan and lease losses related to covered loans. For loans covered by loss share agreements, subsequent decreases in the amount expected to be collected from the borrower or collateral liquidation result in a provision for loan and lease losses, an increase in the allowance for loan and lease losses and a proportional adjustment to the receivable from the FDIC for the estimated amount to be reimbursed. Subsequent increases in the amount expected to be collected from the borrower or collateral liquidation result in the reversal of any previously recorded provision for loan and lease losses and related allowance for loan and lease losses and related adjustments to the receivable from the FDIC, or prospective adjustment to the accretable yield and the related receivable from the FDIC if no provision for loan and lease losses had been recorded previously. Other adjustments include those resulting from amounts owed to the FDIC for unexpected recoveries of amounts previously charged off. Adjustments related to acquisition date fair values, made within
one
year after the closing date of the respective acquisition, are reflected in the acquisition gain.
NOTE G
- MORTGAGE SERVICING RIGHTS
The activity of the servicing asset for
2012, 2011 and 2010
is as follows:
|
2012
|
2011
|
2010
|
|||||||||
|
Balance, January 1
|
$
|
4,346
|
|
$
|
2,894
|
|
$
|
4,552
|
|
||
|
Amortization expense recognized during the year
|
(2,260
|
)
|
(1,984
|
)
|
(1,354
|
)
|
|||||
|
Adoption of change in accounting for QSPE
|
—
|
|
—
|
|
(304
|
)
|
|||||
|
Acquisition of servicing asset
|
—
|
|
3,436
|
|
—
|
|
|||||
|
Servicing asset impairment
|
(302
|
)
|
—
|
|
—
|
|
|||||
|
Balance, December 31
|
$
|
1,784
|
|
$
|
4,346
|
|
$
|
2,894
|
|
||
During
2011
, BancShares acquired the rights to service mortgage loans that had previously been sold by United Western. The asset was recorded at its fair value and is being amortized over the remaining estimated servicing life at acquisition of
60
months. In conjunction with the adoption of the change in accounting for QSPEs during
2010
, the servicing asset related to a previous asset securitization was eliminated resulting in a decrease to the servicing asset of
$304
. BancShares does not hedge its mortgage servicing asset.
NOTE H
- DEPOSITS
Deposits at
December 31
are summarized as follows:
|
2012
|
2011
|
||||||
|
Demand
|
$
|
4,885,700
|
|
$
|
4,331,706
|
|
|
|
Checking With Interest
|
2,363,317
|
|
2,103,298
|
|
|||
|
Money market accounts
|
6,357,309
|
|
5,700,981
|
|
|||
|
Savings
|
905,456
|
|
817,285
|
|
|||
|
Time
|
3,574,243
|
|
4,624,004
|
|
|||
|
Total deposits
|
$
|
18,086,025
|
|
$
|
17,577,274
|
|
|
Time deposits with a minimum denomination of
$100
totaled
$1,610,782
and
$2,332,368
at
December 31, 2012, and 2011
, respectively.
99
FIRST CITIZENS BANCSHARES, INC. AND SUBSIDIARIES
NOTES TO CONSOLIDATED FINANCIAL STATEMENTS—(Continued)
(dollars in thousands)
At
December 31, 2012
the scheduled maturities of time deposits were:
|
2013
|
$
|
2,557,814
|
|
|
2014
|
473,881
|
|
|
|
2015
|
270,099
|
|
|
|
2016
|
191,530
|
|
|
|
2017
|
80,903
|
|
|
|
Thereafter
|
16
|
|
|
|
Total time deposits
|
$
|
3,574,243
|
|
NOTE I
- SHORT-TERM BORROWINGS
Short-term borrowings at
December 31
are as follows:
|
2012
|
2011
|
||||||
|
Master notes
|
$
|
399,047
|
|
$
|
375,396
|
|
|
|
Repurchase agreements
|
111,907
|
|
172,275
|
|
|||
|
Notes payable to Federal Home Loan Banks
|
55,000
|
|
65,000
|
|
|||
|
Federal funds purchased
|
2,551
|
|
2,551
|
|
|||
|
Total short-term borrowings
|
$
|
568,505
|
|
$
|
615,222
|
|
|
At
December 31, 2012
, BancShares and FCB had unused credit lines allowing contingent access to overnight borrowings of up to
$475,000
on an unsecured basis. Additionally, under borrowing arrangements with the Federal Home Loan Bank of Atlanta, FCB has access to an additional
$1,089,122
on a secured basis.
NOTE J - LONG-TERM OBLIGATIONS
Long-term obligations at
December 31
include:
|
2012
|
2011
|
||||||
|
Junior subordinated debenture at 8.05 percent maturing March 5, 2028 (redeemed July 31, 2012)
|
$
|
—
|
|
$
|
154,640
|
|
|
|
Junior subordinated debenture at 3-month LIBOR plus 1.75 percent maturing June 30, 2036
|
96,392
|
|
96,392
|
|
|||
|
Subordinated notes payable at 5.125 percent maturing June 1, 2015
|
125,000
|
|
125,000
|
|
|||
|
Obligations under capitalized leases extending to June 2026
|
10,020
|
|
5,688
|
|
|||
|
Notes payable to Federal Home Loan Bank of Atlanta with rates ranging from 2.00 percent to 3.88 percent and maturing through September 2018
|
170,299
|
|
225,000
|
|
|||
|
Note payable to the Federal Home Loan Bank of Seattle with a rate of 4.74 percent and a maturity date of July 2017
|
10,000
|
|
10,000
|
|
|||
|
Debt from 2005 asset securitization (redeemed July 15, 2012)
|
—
|
|
35,645
|
|
|||
|
Unamortized acquisition accounting adjustments
|
3,069
|
|
4,420
|
|
|||
|
Other long-term debt
|
30,141
|
|
30,814
|
|
|||
|
Total long-term obligations
|
$
|
444,921
|
|
$
|
687,599
|
|
|
On
July 31, 2012
, BancShares redeemed the
8.05 percent
junior subordinated debenture (the 1998 Debenture) issued by FCB/NC Capital Trust I (the Trust). The 1998 Debenture had a face value of
$154,640
and was redeemed for
$163,569
, which represented
102.42 percent
of the face value plus accrued interest. Redemption of the 1998 Debenture triggered the redemption of the
8.05 percent
trust preferred securities (the 1998 Preferred Securities) by the Trust. The 1998 Preferred Securities had an aggregate liquidation amount of
$150,000
and were redeemed for
$158,661
, which represented
102.42 percent
of the face amount plus accrued interest. The redemption resulted in a
$154,640
reduction in long-term borrowings, and the
2.42 percent
prepayment penalty rate resulted in
$3,630
in noninterest expense during
2012
. Prior to its redemption in
2012
, the 1998
100
FIRST CITIZENS BANCSHARES, INC. AND SUBSIDIARIES
NOTES TO CONSOLIDATED FINANCIAL STATEMENTS—(Continued)
(dollars in thousands)
Debenture was held by the Trust. The Trust purchased the 1998 Debenture with the proceeds from the 1998 Preferred Securities. The 1998 Debenture was the sole asset of the trust.
The
variable
rate junior subordinated debenture issued in
2006
(the 2006 Debenture) is held by FCB/NC Capital Trust III. FCB/NC Capital Trust III purchased the 2006 Debenture with the proceeds from the
$115,000
in adjustable rate trust preferred securities issued in
2006
(the 2006 Preferred Securities). The 2006 Debenture is the sole asset of the trust. The 2006 Preferred Securities are redeemable in whole or in part after
June 30, 2011
. In
December 2011
, BancShares purchased and redeemed
$21,500
of these securities. The proceeds from this redemption resulted in a corresponding reduction in the junior subordinated debenture held by FCB/NC Capital Trust III.
The 2006 Preferred Securities and the 2006 Debenture were issued with a variable rate of
175
basis points above the
three-month
LIBOR. Through the use of interest rate swaps, BancShares synthetically converted the variable rate coupon on the securities to a fixed rate of
7.125 percent
through
June 30, 2011
, and to a fixed rate of
5.50 percent
for the period from
July 1, 2011
, through
June 30, 2016
.
FCB/NC Capital Trust I and FCB/NC Capital Trust III are grantor trusts established by BancShares for the purpose of issuing trust preferred capital securities.
The subordinated notes issued during
2005
are unsecured obligations of FCB and are junior to existing and future senior indebtedness and obligations to depositors and general or secured creditors.
Notes payable to the Federal Home Loan Banks of Atlanta and Seattle are secured by investment securities, FHLB stock and loans.
On
July 15, 2012
, BancShares repaid the outstanding debt obligation that related to a
2005
securitization and sale of revolving mortgage loans. The repayment resulted in a
$21,565
reduction in long-term borrowings.
Long-term obligations maturing in each of the five years subsequent to
December 31, 2012
include:
|
2013
|
$
|
3,690
|
|
|
2014
|
3,527
|
|
|
|
2015
|
206,306
|
|
|
|
2016
|
620
|
|
|
|
2017
|
10,504
|
|
|
|
Thereafter
|
220,274
|
|
|
|
Total long-term obligations
|
$
|
444,921
|
|
NOTE
K
- ESTIMATED FAIR VALUES
Fair value represents the price that would be received to sell an asset or transfer a liability in an orderly transaction between market participants at the measurement date. Because no market exists for many financial instruments, fair value estimates are based on judgments regarding future expected loss experience, current economic conditions, risk characteristics of various financial instruments, and other factors. These estimates are subjective in nature and involve uncertainties and matters of significant judgment and, therefore, cannot be determined with precision. Changes in assumptions could significantly affect the estimates.When determining the fair value measurements, BancShares considers the principal or most advantageous market in which the specific assets or liabilities are sold and considers assumptions that market participants would use when pricing those assets or liabilities.
As required under GAAP, individual fair value estimates are ranked based on the relative reliability of the inputs used in the valuation. Fair values determined using level 1 inputs rely on active and observable markets to price identical assets or liabilities. In situations where identical assets and liabilities are not traded in active markets, fair values may be determined
101
FIRST CITIZENS BANCSHARES, INC. AND SUBSIDIARIES
NOTES TO CONSOLIDATED FINANCIAL STATEMENTS—(Continued)
(dollars in thousands)
based on level 2 inputs, which exist when observable data exists for similar assets and liabilities. Fair values for assets and liabilities that are not actively traded in observable markets are based on level 3 inputs, which are considered to be unobservable. BancShares recognizes transfers between levels of the fair value hierarchy at the end of the respective reporting period.
The methodologies used to estimate the fair value of financial assets and financial liabilities are discussed below:
Investment securities
. Investment securities are measured based on quoted market prices, when available. For certain residential mortgage-backed securities and state, county and municipal securities, fair values are determined using broker prices based on recent sales of similar securities. The inputs used in the fair value measurement of investment securities are considered level 1 or level 2 inputs. The details of investment securities available for sale and the corresponding level of inputs are provided in the table of assets measured at fair value on a recurring basis.
Loans held for sale.
Fair value for loans held for sale is generally based on market prices for loans with similar characteristics or external valuations. The inputs used in the fair value measurements for loans held for sale are considered level 2 inputs.
Loans and leases.
For variable rate loans, carrying value is a reasonable estimate of fair value. For fixed rate loans, fair values are estimated based on discounted future cash flows using the current interest rates at which loans with similar terms would be made to borrowers of similar credit quality. Additional valuation adjustments are made for liquidity and credit risk. The inputs used in the fair value measurements for loans and leases are considered level 3 inputs.
Receivable from the FDIC for loss share agreements
. Fair value is estimated based on discounted future cash flows using current discount rates. Due to post-acquisition improvements in expected losses, significant portions of the FDIC receivable will be recovered through amortization of the receivable over the remaining life of the loss share agreement rather than by cash flows from the FDIC. The estimated amounts to be amortized in future periods have no fair value. The inputs used in the fair value measurements for the receivable from the FDIC are considered level 3 inputs. The FDIC loss share agreements are not transferable and, accordingly, there is no market for this receivable.
FHLB stock
. The carrying amount of FHLB stock is a reasonable estimate of fair value as these securities are not readily marketable and are evaluated for impairment based on the ultimate recoverability of the par value. BancShares considers positive and negative evidence, including the profitability and asset quality of the issuer, dividend payment history and recent redemption experience, when determining the ultimate recoverability of the par value. BancShares believes its investment in FHLB stock is ultimately recoverable at par.
Securities issued under the TARP program
. Securities issued under the Troubled Asset Recovery Program are recorded at cost and are evaluated for impairment based on the ultimate recoverability of the purchase price. The fair value of these securities is derived from a third-party proprietary model that is considered to be a level 3 input.
Deposits.
For non-time deposits and variable rate time deposits, carrying value is a reasonable estimate of fair value. The fair value of fixed rate time deposits is estimated by discounting future cash flows using the interest rates currently offered for deposits of similar remaining maturities. The inputs used in the fair value measurements for deposits are considered level 2 inputs.
Long-term obligations.
For fixed rate trust preferred securities, the fair values are determined based on recent trades of the actual security. For other long-term obligations, fair values are estimated by discounting future cash flows using current interest rates for similar financial instruments. The inputs used in the fair value measurements for long-term obligations are considered level 2 inputs.
Payable to FDIC for loss share agreements.
The fair value of the payable to FDIC for loss share agreements is determined by the projected cash flows based on expected payments to the FDIC in accordance with the loss share agreements. Cash flows are discounted to reflect the timing of the estimated amounts due to the FDIC. The inputs used in the fair value measurements for the payable to the FDIC are considered level 3 inputs. See Note
S
for more information on payable to FDIC.
Interest Rate Swap
. Under the terms of the existing cash flow hedge, BancShares pays a fixed payment to the counterparty in exchange for receipt of a variable payment that is determined based on the
three-month
LIBOR rate. The fair value of the cash flow hedge is, therefore, based on projected LIBOR rates for the duration of the hedge, values that, while
102
FIRST CITIZENS BANCSHARES, INC. AND SUBSIDIARIES
NOTES TO CONSOLIDATED FINANCIAL STATEMENTS—(Continued)
(dollars in thousands)
observable in the market, are subject to adjustment due to pricing considerations for the specific instrument. If the fair value of the swap is a net asset, the risk of default by the counterparty is considered in the determination of fair value and is considered a level 3 input. The inputs used in the fair value measurements of the interest rate swap are considered level 2 inputs.
Off-balance-sheet commitments and contingencies.
Carrying amounts are reasonable estimates of the fair values for such financial instruments. Carrying amounts include unamortized fee income and, in some cases, reserves for any credit losses from those financial instruments. These amounts are not material to BancShares’ financial position.
For all other financial assets and financial liabilities, the carrying value is a reasonable estimate of the fair value as of
December 31, 2012, and 2011
.
Estimated fair values of financial assets and financial liabilities are provided in the following table.
|
|
December 31, 2012
|
December 31, 2011
|
|||||||||||||
|
|
Carrying
Value
|
Fair
Value
|
Carrying
Value
|
Fair
Value
|
|||||||||||
|
Cash and due from banks
|
$
|
639,730
|
|
$
|
639,730
|
|
$
|
590,801
|
|
$
|
590,801
|
|
|||
|
Overnight investments
|
443,180
|
|
443,180
|
|
434,975
|
|
434,975
|
|
|||||||
|
Investment securities available for sale
|
5,226,228
|
|
5,226,228
|
|
4,056,423
|
|
4,056,423
|
|
|||||||
|
Investment securities held to maturity
|
1,342
|
|
1,448
|
|
1,822
|
|
1,980
|
|
|||||||
|
Loans held for sale
|
86,333
|
|
87,654
|
|
92,539
|
|
93,235
|
|
|||||||
|
Loans covered under loss share agreements, net of allowance for loan and lease losses
|
1,669,263
|
|
1,635,878
|
|
2,272,891
|
|
2,236,343
|
|
|||||||
|
Loans and leases not covered under loss share agreements, net of allowance for loan and lease losses
|
11,397,069
|
|
11,238,597
|
|
11,400,754
|
|
11,312,900
|
|
|||||||
|
Receivable from FDIC for loss share agreements
|
270,192
|
|
100,161
|
|
617,377
|
|
526,252
|
|
|||||||
|
Income earned not collected
|
47,666
|
|
47,666
|
|
42,216
|
|
42,216
|
|
|||||||
|
Stock issued by:
|
|||||||||||||||
|
Federal Home Loan Bank of Atlanta
|
36,139
|
|
36,139
|
|
41,042
|
|
41,042
|
|
|||||||
|
Federal Home Loan Bank of San Francisco
|
10,107
|
|
10,107
|
|
12,976
|
|
12,976
|
|
|||||||
|
Federal Home Loan Bank of Seattle
|
4,410
|
|
4,410
|
|
4,490
|
|
4,490
|
|
|||||||
|
Securities issued under the TARP program
|
40,768
|
|
40,793
|
|
—
|
|
—
|
|
|||||||
|
Deposits
|
18,086,025
|
|
18,126,893
|
|
17,577,274
|
|
17,638,359
|
|
|||||||
|
Short-term borrowings
|
568,505
|
|
568,505
|
|
615,222
|
|
615,222
|
|
|||||||
|
Long-term obligations
|
444,921
|
|
472,642
|
|
687,599
|
|
719,999
|
|
|||||||
|
Payable to FDIC for loss share agreements
|
101,641
|
|
125,065
|
|
77,866
|
|
90,070
|
|
|||||||
|
Accrued interest payable
|
9,353
|
|
9,353
|
|
23,719
|
|
23,719
|
|
|||||||
|
Interest rate swap
|
10,398
|
|
10,398
|
|
10,714
|
|
10,714
|
|
|||||||
Among BancShares’ assets and liabilities, investment securities available for sale and interest rate swaps accounted for as cash flow hedges are reported at their fair values on a recurring basis. Certain other assets are adjusted to their fair value on a nonrecurring basis, including loans held for sale, which are carried at the lower of cost or market. Impaired loans, OREO, goodwill and other intangible assets are periodically tested for impairment. Loans held for investment, deposits, short-term borrowings and long-term obligations are not reported at fair value. BancShares has not elected to voluntarily report any assets or liabilities at fair value.
103
FIRST CITIZENS BANCSHARES, INC. AND SUBSIDIARIES
NOTES TO CONSOLIDATED FINANCIAL STATEMENTS—(Continued)
(dollars in thousands)
For assets and liabilities carried at fair value on a recurring basis, the following table provides fair value information as of
December 31, 2012, and 2011
:
|
|
|
Fair value measurements using:
|
|||||||||||||
|
Description
|
Fair value
|
Quoted prices in
active markets for
identical assets
and liabilities
(Level 1 inputs)
|
Quoted prices for
similar assets and
liabilities
(Level 2 inputs)
|
Significant
nonobservable inputs
(Level 3 inputs)
|
|||||||||||
|
December 31, 2012
|
|||||||||||||||
|
Assets measured at fair value
|
|||||||||||||||
|
Investment securities available for sale:
|
|||||||||||||||
|
U.S. Treasury
|
$
|
823,632
|
|
$
|
823,632
|
|
$
|
—
|
|
$
|
—
|
|
|||
|
Government agency
|
3,055,204
|
|
3,055,204
|
|
—
|
|
—
|
|
|||||||
|
Corporate bonds
|
820
|
|
820
|
|
—
|
|
—
|
|
|||||||
|
Residential mortgage-backed securities
|
1,329,657
|
|
—
|
|
1,329,657
|
|
—
|
|
|||||||
|
Equity securities
|
16,365
|
|
16,365
|
|
—
|
|
—
|
|
|||||||
|
State, county, municipal
|
550
|
|
—
|
|
550
|
|
—
|
|
|||||||
|
Total
|
$
|
5,226,228
|
|
$
|
3,896,021
|
|
$
|
1,330,207
|
|
$
|
—
|
|
|||
|
Liabilities measured at fair value
|
|||||||||||||||
|
Interest rate swaps accounted for as cash flow hedges
|
$
|
10,398
|
|
$
|
—
|
|
$
|
10,398
|
|
$
|
—
|
|
|||
|
December 31, 2011
|
|||||||||||||||
|
Assets measured at fair value
|
|||||||||||||||
|
Investment securities available for sale:
|
|||||||||||||||
|
U.S. Treasury
|
$
|
887,819
|
|
$
|
887,819
|
|
$
|
—
|
|
$
|
—
|
|
|||
|
Government agency
|
2,592,209
|
|
2,592,209
|
|
—
|
|
—
|
|
|||||||
|
Corporate bonds
|
252,820
|
|
252,820
|
|
—
|
|
—
|
|
|||||||
|
Residential mortgage-backed securities
|
307,221
|
|
—
|
|
307,221
|
|
—
|
|
|||||||
|
Equity securities
|
15,313
|
|
15,313
|
|
—
|
|
—
|
|
|||||||
|
State, county, municipal
|
1,041
|
|
—
|
|
1,041
|
|
—
|
|
|||||||
|
Total
|
$
|
4,056,423
|
|
$
|
3,748,161
|
|
$
|
308,262
|
|
$
|
—
|
|
|||
|
Liabilities measured at fair value
|
|||||||||||||||
|
Interest rate swaps accounted for as cash flow hedges
|
$
|
10,714
|
|
$
|
—
|
|
$
|
10,714
|
|
$
|
—
|
|
|||
Prices for US Treasury securities, government agency securities, corporate bonds and equity securities are readily available in the active markets in which those securities are traded and the resulting fair values are shown in the ‘Level 1 input’ column. Prices for mortgage-backed securities and state, county and municipal securities are obtained using the fair values of similar assets and the resulting fair values are shown in the ‘Level 2 input’ column. There were no transfers between Level 1 and Level 2 inputs during the years ended
December 31, 2012, and 2011
.
Under the terms of the existing cash flow hedges, BancShares pays a fixed payment to the counterparty in exchange for receipt of a variable payment that is determined based on the
three-month
LIBOR rate. The fair value of the cash flow hedges are therefore based on projected LIBOR rates for the duration of the hedges, values that, while observable in the market, are subject to adjustment due to pricing considerations for the specific instrument.
104
FIRST CITIZENS BANCSHARES, INC. AND SUBSIDIARIES
NOTES TO CONSOLIDATED FINANCIAL STATEMENTS—(Continued)
(dollars in thousands)
There were
no
financial instruments with fair values determined by reliance on significant nonobservable inputs during
2012
or
2011
.
No
gains or losses were reported for the years ended
December 31, 2012, and 2011
that relate to fair values estimated based on significant nonobservable inputs.
Certain assets and liabilities are carried at fair value on a nonrecurring basis. Loans held for sale are carried at the lower of aggregate cost or fair value and are, therefore, carried at fair value only when fair value is less than the asset cost. Certain impaired loans are also carried at fair value. OREO is measured and reported at fair value using level 3 inputs for valuations based on nonobservable criteria. For assets and liabilities carried at fair value on a nonrecurring basis, the following table provides fair value information as of
December 31, 2012, and 2011
:
|
|
|
Fair value measurements using:
|
|||||||||||||
|
Description
|
Fair value
|
Quoted prices in
active markets for
identical assets and
liabilities
(Level 1 inputs)
|
Quoted prices for
similar assets
and liabilities
(Level 2 inputs)
|
Significant
nonobservable inputs
(Level 3 inputs)
|
|||||||||||
|
December 31, 2012
|
|||||||||||||||
|
Loans held for sale
|
$
|
65,244
|
|
$
|
—
|
|
$
|
65,244
|
|
$
|
—
|
|
|||
|
Impaired loans not covered by loss share agreements
|
51,644
|
|
—
|
|
—
|
|
51,644
|
|
|||||||
|
Other real estate owned not covered by loss share agreements
|
21,113
|
|
—
|
|
—
|
|
21,113
|
|
|||||||
|
December 31, 2011
|
|||||||||||||||
|
Loans held for sale
|
63,470
|
|
—
|
|
63,470
|
|
—
|
|
|||||||
|
Impaired loans not covered by loss share agreements
|
128,365
|
|
—
|
|
—
|
|
128,365
|
|
|||||||
|
Other real estate owned not covered by loss share agreements
|
14,905
|
|
—
|
|
—
|
|
14,905
|
|
|||||||
The values of loans held for sale are based on prices observed for similar pools of loans. The values of impaired loans are determined by either the collateral value or by the discounted present value of expected cash flows. No covered loans are carried at fair value because all covered loans are accounted for as loans acquired with deteriorated credit quality under the expected cash flow model.
No
financial liabilities were carried at fair value on a nonrecurring basis as of
December 31, 2012, and 2011
.
The following table provides additional information regarding OREO for
2012
and
2011
.
|
Covered
|
Not covered
|
Total
|
|||||||
|
Balance at January 1, 2011
|
$
|
112,748
|
|
$
|
52,842
|
|
$
|
165,590
|
|
|
Acquired in FDIC-assisted transactions
|
36,303
|
|
—
|
|
36,303
|
|
|||
|
Additions
|
138,280
|
|
38,612
|
|
176,892
|
|
|||
|
Sales
|
(118,738
|
)
|
(33,569
|
)
|
(152,307
|
)
|
|||
|
Writedowns
|
(19,994
|
)
|
(7,486
|
)
|
(27,480
|
)
|
|||
|
Balance at December 31, 2011
|
148,599
|
|
50,399
|
|
198,998
|
|
|||
|
Additions
|
105,059
|
|
35,586
|
|
140,645
|
|
|||
|
Sales
|
(124,435
|
)
|
(33,564
|
)
|
(157,999
|
)
|
|||
|
Writedowns
|
(26,646
|
)
|
(8,908
|
)
|
(35,554
|
)
|
|||
|
Balance at December 31, 2012
|
$
|
102,577
|
|
$
|
43,513
|
|
$
|
146,090
|
|
105
FIRST CITIZENS BANCSHARES, INC. AND SUBSIDIARIES
NOTES TO CONSOLIDATED FINANCIAL STATEMENTS—(Continued)
(dollars in thousands)
NOTE L - EMPLOYEE BENEFIT PLANS
BancShares sponsors benefit plans for its qualifying employees including a noncontributory defined benefit pension plan, a 401(k) savings plan and an enhanced 401(k) savings plan. These plans are qualified under the Internal Revenue Code. BancShares also maintains agreements with certain executives that provide supplemental benefits that are paid upon death or separation from service at an agreed-upon age.
Defined Benefit Pension Plan
Employees who were hired prior to
April 1, 2007
, and who qualify under length of service and other requirements may participate in a noncontributory defined benefit pension plan (Plan). Under the Plan, benefits are based on years of service and average earnings. The policy is to fund amounts approximating the maximum amount that is deductible for federal income tax purposes. BancShares made
no
contributions to the plan in
2012
or
2011
, and does not anticipate any contribution during
2013
.
Obligations and Funded Status
The following table provides the change in benefit obligation and plan assets and the funded status of the plan at
December 31, 2012, and 2011
.
|
2012
|
2011
|
||||||
|
Change in Benefit Obligation
|
|||||||
|
Benefit obligation at January 1
|
$
|
493,648
|
|
$
|
431,090
|
|
|
|
Service cost
|
14,241
|
|
13,265
|
|
|||
|
Interest cost
|
23,711
|
|
23,810
|
|
|||
|
Actuarial loss
|
64,540
|
|
38,946
|
|
|||
|
Benefits paid
|
(15,202
|
)
|
(13,463
|
)
|
|||
|
Benefit obligation at December 31
|
580,938
|
|
493,648
|
|
|||
|
Change in Plan Assets
|
|||||||
|
Fair value of plan assets at January 1
|
429,505
|
|
433,467
|
|
|||
|
Actual return on plan assets
|
48,702
|
|
9,501
|
|
|||
|
Employer contributions
|
—
|
|
—
|
|
|||
|
Benefits paid
|
(15,202
|
)
|
(13,463
|
)
|
|||
|
Fair value of plan assets at December 31
|
463,005
|
|
429,505
|
|
|||
|
Funded status at December 31
|
$
|
(117,933
|
)
|
$
|
(64,143
|
)
|
|
The amounts recognized in the consolidated balance sheets as of
December 31, 2012, and 2011
consist of:
|
2012
|
2011
|
||||||
|
Other assets
|
$
|
—
|
|
$
|
—
|
|
|
|
Other liabilities
|
(117,933
|
)
|
(64,144
|
)
|
|||
|
Net liability recognized
|
$
|
(117,933
|
)
|
$
|
(64,144
|
)
|
|
Amounts recognized in accumulated other comprehensive income at
December 31, 2012, and 2011
consist of:
|
2012
|
2011
|
||||||
|
Net loss
|
$
|
157,147
|
|
$
|
123,858
|
|
|
|
Less prior service cost
|
1,187
|
|
1,397
|
|
|||
|
Accumulated other comprehensive loss, excluding income taxes
|
$
|
158,334
|
|
$
|
125,255
|
|
|
106
FIRST CITIZENS BANCSHARES, INC. AND SUBSIDIARIES
NOTES TO CONSOLIDATED FINANCIAL STATEMENTS—(Continued)
(dollars in thousands)
|
Expected amortization amounts in 2013
|
|||
|
Actuarial loss
|
$
|
17,006
|
|
|
Prior service cost
|
210
|
|
|
|
Total
|
$
|
17,216
|
|
The accumulated benefit obligation for the plan at
December 31, 2012, and 2011
equaled
$485,641
and
$412,668
, respectively. The Plan uses a measurement date of
December 31
.
The following table shows the components of periodic benefit cost related to the pension plan and changes in plan assets and benefit obligations recognized in other comprehensive income for the years ended
December 31, 2012, 2011, and 2010
.
|
2012
|
2011
|
2010
|
|||||||||
|
Service cost
|
$
|
14,241
|
|
$
|
13,265
|
|
$
|
12,191
|
|
||
|
Interest cost
|
23,711
|
|
23,810
|
|
22,930
|
|
|||||
|
Expected return on assets
|
(28,478
|
)
|
(29,184
|
)
|
(29,274
|
)
|
|||||
|
Amortization of prior service cost
|
210
|
|
210
|
|
210
|
|
|||||
|
Amortization of net actuarial loss
|
11,026
|
|
6,861
|
|
3,800
|
|
|||||
|
Total net periodic benefit cost
|
20,710
|
|
14,962
|
|
9,857
|
|
|||||
|
Current year actuarial gain (loss)
|
44,315
|
|
58,630
|
|
6,815
|
|
|||||
|
Amortization of actuarial gain (loss)
|
(11,026
|
)
|
(6,861
|
)
|
(3,800
|
)
|
|||||
|
Amortization of prior service cost
|
(210
|
)
|
(210
|
)
|
(210
|
)
|
|||||
|
Total recognized in other comprehensive income
|
33,079
|
|
51,559
|
|
2,805
|
|
|||||
|
Total recognized in net periodic benefit cost and other comprehensive income
|
$
|
53,789
|
|
$
|
66,521
|
|
$
|
12,662
|
|
||
The assumptions used to determine the benefit obligations as of
December 31, 2012, and 2011
are as follows:
|
2012
|
2011
|
||||
|
Discount rate
|
4.00
|
%
|
4.75
|
%
|
|
|
Rate of compensation increase
|
4.00
|
|
4.00
|
|
|
The assumptions used to determine the net periodic benefit cost for the years ended
December 31, 2012, 2011, and 2010
are as follows:
|
2012
|
2011
|
2010
|
||||||
|
Discount rate
|
4.75
|
%
|
5.50
|
%
|
6.00
|
%
|
||
|
Rate of compensation increase
|
4.00
|
|
4.50
|
|
4.50
|
|
||
|
Expected long-term return on plan assets
|
7.50
|
|
7.75
|
|
8.00
|
|
||
The estimated discount rate, which represents the interest rate that could be obtained for a suitable investment used to fund the benefit obligations, is based on a yield curve developed from high-quality corporate bonds across a full maturity spectrum. The projected cash flows of the pension plan are discounted based on this yield curve, and a single discount rate is calculated to achieve the same present value.
The estimated long-term rate of return on plan assets is used to calculate the value of plan assets over time. The methodology utilized to establish the estimated long-term rate of return on plan assets considers the actual return on plan assets for various time horizons since 1996 as a predictor of probable future returns. Historical returns are modified as appropriate by estimates of future market conditions that may positively or negatively affect estimated future returns. The return on plan
107
FIRST CITIZENS BANCSHARES, INC. AND SUBSIDIARIES
NOTES TO CONSOLIDATED FINANCIAL STATEMENTS—(Continued)
(dollars in thousands)
assets for the
15-year
,
10-year
and
5-year
periods ended
December 31, 2012
, equaled
6.98 percent
,
8.77 percent
and
5.81 percent
, respectively. Based on expectations of modest returns over the next several years, the assumed rate of return for
2012
was
7.50 percent
, compared to
7.75 percent
in
2011
.
Plan Assets
BancShares' primary total return objective is to achieve returns that, over the long term, will fund retirement liabilities and provide for the desired plan benefits in a manner that satisfies the fiduciary requirements of the Employee Retirement Income Security Act. The plan assets have a long-term time horizon that runs concurrent with the average life expectancy of the participants. As such, the Plan can assume a time horizon that extends well beyond a full market cycle and can assume a reasonable level of risk. It is expected, however, that both professional investment management and sufficient portfolio diversification will smooth volatility and help to generate a reasonable consistency of return. The investments are broadly diversified among economic sector, industry, quality and size in order to reduce risk and to produce incremental return. Within approved guidelines and restrictions, the investment manager has discretion over the timing and selection of individual investments.
108
FIRST CITIZENS BANCSHARES, INC. AND SUBSIDIARIES
NOTES TO CONSOLIDATED FINANCIAL STATEMENTS—(Continued)
(dollars in thousands)
The fair values of pension plan assets at
December 31, 2012, and 2011
by asset category are as follows:
|
Asset Category
|
Market Value
|
Quoted prices in
Active Markets
for Identical
Assets (Level 1)
|
Significant
Observable
Inputs
(Level 2)
|
Significant
Nonobservable
Inputs
(Level 3)
|
Target
Allocation
|
Actual %
of Plan
Assets
|
|||||||||||||||
|
December 31, 2012
|
|||||||||||||||||||||
|
Cash and equivalents
|
$
|
3,088
|
|
$
|
3,088
|
|
$
|
—
|
|
$
|
—
|
|
0 - 1%
|
|
1
|
%
|
|||||
|
Equity securities
(a)
|
55 - 65 %
|
|
63
|
%
|
|||||||||||||||||
|
Consumer discretionary
|
27,314
|
|
27,314
|
|
—
|
|
—
|
|
|||||||||||||
|
Consumer staples
|
16,294
|
|
16,294
|
|
—
|
|
—
|
|
|||||||||||||
|
Energy
|
28,046
|
|
28,046
|
|
—
|
|
—
|
|
|||||||||||||
|
Information technology
|
38,570
|
|
38,570
|
|
—
|
|
—
|
|
|||||||||||||
|
Telecommunication
|
4,678
|
|
4,678
|
|
—
|
|
—
|
|
|||||||||||||
|
Financials
|
35,921
|
|
35,921
|
|
—
|
|
—
|
|
|||||||||||||
|
Utilities
|
6,043
|
|
6,043
|
|
—
|
|
—
|
|
|||||||||||||
|
Materials
|
9,950
|
|
9,950
|
|
—
|
|
—
|
|
|||||||||||||
|
Health care
|
30,661
|
|
30,661
|
|
—
|
|
—
|
|
|||||||||||||
|
Industrials
|
23,466
|
|
23,466
|
|
—
|
|
—
|
|
|||||||||||||
|
Rights to purchase securities
|
4,168
|
|
4,168
|
|
—
|
|
—
|
|
|||||||||||||
|
Mutual funds
|
68,415
|
|
68,415
|
|
—
|
|
—
|
|
|||||||||||||
|
Debt securities
(b)
|
34 - 44 %
|
|
36
|
%
|
|||||||||||||||||
|
Bond funds
|
166,391
|
|
—
|
|
166,391
|
|
—
|
|
|||||||||||||
|
Total pension assets
|
$
|
463,005
|
|
$
|
296,614
|
|
$
|
166,391
|
|
$
|
—
|
|
100
|
%
|
100
|
%
|
|||||
|
December 31, 2011
|
|||||||||||||||||||||
|
Cash and equivalents
|
$
|
5,002
|
|
$
|
5,002
|
|
$
|
—
|
|
$
|
—
|
|
0 - 1%
|
|
1
|
%
|
|||||
|
Equity securities
(a)
|
55 - 65 %
|
|
63
|
%
|
|||||||||||||||||
|
Consumer discretionary
|
24,003
|
|
24,003
|
|
—
|
|
—
|
|
|||||||||||||
|
Consumer staples
|
15,257
|
|
15,257
|
|
—
|
|
—
|
|
|||||||||||||
|
Energy
|
27,857
|
|
27,857
|
|
—
|
|
—
|
|
|||||||||||||
|
Information technology
|
35,206
|
|
35,206
|
|
—
|
|
—
|
|
|||||||||||||
|
Telecommunication
|
4,888
|
|
4,888
|
|
—
|
|
—
|
|
|||||||||||||
|
Financials
|
31,185
|
|
31,185
|
|
—
|
|
—
|
|
|||||||||||||
|
Utilities
|
6,263
|
|
6,263
|
|
—
|
|
—
|
|
|||||||||||||
|
Materials
|
10,548
|
|
10,548
|
|
—
|
|
—
|
|
|||||||||||||
|
Health care
|
30,195
|
|
30,195
|
|
—
|
|
—
|
|
|||||||||||||
|
Industrials
|
21,451
|
|
21,451
|
|
—
|
|
—
|
|
|||||||||||||
|
Rights to purchase securities
|
3,724
|
|
3,724
|
|
—
|
|
—
|
|
|||||||||||||
|
Mutual funds
|
60,493
|
|
60,493
|
|
—
|
|
—
|
|
|||||||||||||
|
Debt securities
(b)
|
34 - 44 %
|
|
36
|
%
|
|||||||||||||||||
|
Bond funds
|
153,433
|
|
—
|
|
153,432
|
|
—
|
|
|||||||||||||
|
Total pension assets
|
$
|
429,505
|
|
$
|
276,072
|
|
$
|
153,432
|
|
$
|
—
|
|
100
|
%
|
100
|
%
|
|||||
|
(a)
|
This category includes investments in equity securities of large, small and medium sized companies from various industries.
|
|
(b)
|
This category represents investment grade bonds from diverse industries.
|
109
FIRST CITIZENS BANCSHARES, INC. AND SUBSIDIARIES
NOTES TO CONSOLIDATED FINANCIAL STATEMENTS—(Continued)
(dollars in thousands)
Cash Flows
BancShares anticipates making
no
contributions to the pension plan during
2013
. Following are estimated payments to pension plan participants in the indicated periods:
|
|
Projected Benefit Payments
|
||
|
2013
|
$
|
16,781
|
|
|
2014
|
18,062
|
|
|
|
2015
|
19,679
|
|
|
|
2016
|
21,445
|
|
|
|
2017
|
23,238
|
|
|
|
2018-2022
|
141,253
|
|
|
401(k) Savings Plans
Certain employees enrolled in the defined benefit plan are also eligible to participate in a 401(k) savings plan after 31 days of service through deferral of portions of their salary. For employees who participate in the 401(k) savings plan who also continue to accrue additional years of service under the defined benefit plan, based on the employee’s contribution, BancShares matches up to
75
percent of the employee contribution.
At the end of
2007
, current employees were given the option to continue to accrue additional years of service under the the defined benefit plan or to elect to join an enhanced 401(k) savings plan. Under the enhanced 401(k) savings plan, based on the employee’s contribution, BancShares matches up to 100 percent of the employee contribution. In addition to the employer match of the employee contributions, the enhanced 401(k) savings plan provides a guaranteed contribution to plan participants if they remain employed at the end of each calendar year. Employees who elected to enroll in the enhanced 401(k) savings plan discontinued the accrual of additional years of service under the defined benefit plan and became enrolled in the enhanced 401(k) savings plan effective
January 1, 2008
. Eligible employees hired after
January 1, 2008
, have the option to elect to participate in the enhanced 401(k) savings plan.
BancShares made participating contributions to both 401(k) plans totaling
$14,131
,
$13,633
and
$12,307
during
2012, 2011 and 2010
, respectively.
Additional Benefits for Executives and Directors and Officers of Acquired Entities
FCB has entered into contractual agreements with certain executives that provide payments for a period of ten years following separation from service at an agreed-upon age. These agreements also provide a death benefit in the event a participant dies before the term of the agreement ends. FCB has also assumed liability for contractual obligations to directors and officers of previously-acquired entities.
The following table provides the accrued liability as of
December 31, 2012, and 2011
and the changes in the accrued liability during the years then ended:
110
FIRST CITIZENS BANCSHARES, INC. AND SUBSIDIARIES
NOTES TO CONSOLIDATED FINANCIAL STATEMENTS—(Continued)
(dollars in thousands)
|
|
2012
|
2011
|
|||||
|
Present value of accrued liability as of January 1
|
$
|
25,586
|
|
$
|
23,027
|
|
|
|
Benefit expense
|
462
|
|
1,799
|
|
|||
|
Benefits paid
|
(3,241
|
)
|
(1,877
|
)
|
|||
|
Benefits forfeited
|
554
|
|
—
|
|
|||
|
Interest cost
|
2,490
|
|
2,637
|
|
|||
|
Present value of accrued liability as of December 31
|
$
|
25,851
|
|
$
|
25,586
|
|
|
|
Discount rate at December 31
|
4.00
|
%
|
4.75
|
%
|
|||
NOTE M - NONINTEREST EXPENSE
Other noninterest expense for the years ended
December 31, 2012, 2011, and 2010
included the following:
|
2012
|
2011
|
2010
|
|||||||||
|
Cardholder and merchant processing
|
$
|
45,129
|
|
$
|
48,614
|
|
$
|
46,765
|
|
||
|
Collection
|
25,591
|
|
23,237
|
|
20,485
|
|
|||||
|
Processing fees paid to third parties
|
14,454
|
|
16,336
|
|
13,327
|
|
|||||
|
Cardholder reward programs
|
4,325
|
|
11,780
|
|
11,624
|
|
|||||
|
Telecommunications
|
11,131
|
|
12,131
|
|
11,328
|
|
|||||
|
Advertising
|
3,897
|
|
7,957
|
|
8,301
|
|
|||||
|
Postage
|
6,799
|
|
7,365
|
|
6,848
|
|
|||||
|
Amortization of intangible assets
|
3,476
|
|
4,386
|
|
6,202
|
|
|||||
|
Legal
|
2,490
|
|
6,306
|
|
4,968
|
|
|||||
|
Other
|
62,519
|
|
66,824
|
|
57,632
|
|
|||||
|
Total other noninterest expense
|
$
|
179,811
|
|
$
|
204,936
|
|
$
|
187,480
|
|
||
NOTE N - INCOME TAXES
At
December 31
, income tax expense consisted of the following:
|
2012
|
2011
|
2010
|
|||||||||
|
Current tax expense
|
|||||||||||
|
Federal
|
$
|
85,875
|
|
$
|
108,639
|
|
$
|
127,025
|
|
||
|
State
|
9,212
|
|
23,101
|
|
24,868
|
|
|||||
|
Total current tax expense
|
95,087
|
|
131,740
|
|
151,893
|
|
|||||
|
Deferred tax benefit
|
|||||||||||
|
Federal
|
(27,344
|
)
|
(12,127
|
)
|
(33,333
|
)
|
|||||
|
State
|
(7,921
|
)
|
(4,510
|
)
|
(8,042
|
)
|
|||||
|
Total deferred tax benefit
|
(35,265
|
)
|
(16,637
|
)
|
(41,375
|
)
|
|||||
|
Total income tax expense
|
$
|
59,822
|
|
$
|
115,103
|
|
$
|
110,518
|
|
||
Income tax expense differed from the amounts computed by applying the federal income tax rate of
35 percent
to pretax income as a result of the following:
111
FIRST CITIZENS BANCSHARES, INC. AND SUBSIDIARIES
NOTES TO CONSOLIDATED FINANCIAL STATEMENTS—(Continued)
(dollars in thousands)
|
2012
|
2011
|
2010
|
|||||||||
|
Income taxes at statutory rates
|
$
|
67,959
|
|
$
|
108,546
|
|
$
|
106,247
|
|
||
|
Increase (reduction) in income taxes resulting from:
|
|||||||||||
|
Nontaxable income on loans, leases and investments, net of nondeductible expenses
|
(1,309
|
)
|
(1,481
|
)
|
(1,571
|
)
|
|||||
|
State and local income taxes, including change in valuation allowance, net of federal income tax benefit
|
839
|
|
12,084
|
|
10,937
|
|
|||||
|
Tax credits
|
(7,279
|
)
|
(5,166
|
)
|
(4,141
|
)
|
|||||
|
Other, net
|
(388
|
)
|
1,120
|
|
(954
|
)
|
|||||
|
Total income tax expense
|
$
|
59,822
|
|
$
|
115,103
|
|
$
|
110,518
|
|
||
The lower effective tax rates for
2012
result from recognition of a
$6,449
income tax expense reduction resulting from the favorable outcome of state tax audits for the period
2008
through
2010
, net of additional federal taxes.
112
FIRST CITIZENS BANCSHARES, INC. AND SUBSIDIARIES
NOTES TO CONSOLIDATED FINANCIAL STATEMENTS—(Continued)
(dollars in thousands)
The net deferred tax asset included the following components at
December 31
:
|
2012
|
2011
|
||||||
|
Allowance for loan and lease losses
|
$
|
124,928
|
|
$
|
105,788
|
|
|
|
Pension liability
|
46,178
|
|
25,112
|
|
|||
|
Executive separation from service agreements
|
10,123
|
|
10,019
|
|
|||
|
State operating loss carryforward
|
652
|
|
1,350
|
|
|||
|
Unrealized loss on cash flow hedge
|
4,106
|
|
4,231
|
|
|||
|
Other
|
19,465
|
|
17,638
|
|
|||
|
Gross deferred tax asset
|
205,452
|
|
164,138
|
|
|||
|
Less valuation allowance
|
—
|
|
73
|
|
|||
|
Deferred tax asset
|
205,452
|
|
164,065
|
|
|||
|
Accelerated depreciation
|
12,465
|
|
14,494
|
|
|||
|
Lease financing activities
|
10,366
|
|
11,334
|
|
|||
|
Net unrealized gains on securities included in accumulated other comprehensive loss
|
13,292
|
|
10,450
|
|
|||
|
Net deferred loan fees and costs
|
3,714
|
|
3,420
|
|
|||
|
Intangible asset
|
11,897
|
|
11,681
|
|
|||
|
Gain on FDIC-assisted transactions, deferred for tax purposes
|
29,694
|
|
34,208
|
|
|||
|
Other
|
5,373
|
|
5,079
|
|
|||
|
Deferred tax liability
|
86,801
|
|
90,666
|
|
|||
|
Net deferred tax asset
|
$
|
118,651
|
|
$
|
73,399
|
|
|
No valuation allowance was necessary as of
December 31, 2012
, to reduce BancShares’ gross state deferred tax asset to the amount that is more likely than not to be realized. A valuation allowance of
$73
was recorded at
December 31, 2011
.
BancShares and its subsidiaries' federal income tax returns for
2009
through
2011
remain open for examination. Generally, the state jurisdictions in which BancShares files income tax returns are subject to examination for a period up to four years after returns are filed.
Under GAAP, the benefit of a position taken or expected to be taken in a tax return should be recognized when it is more likely than not that the position will be sustained based on its technical merit. The liability for unrecognized tax benefits was not material at
December 31, 2012, and 2011
, and changes in the liability were not material during
2012
,
2011
and
2010
. BancShares does not expect the liability for unrecognized tax benefits to change significantly during
2013
. BancShares recognizes interest and penalties, if any, related to income tax matters in income tax expense, and the amounts recognized during
2012
,
2011
and
2010
were not material.
NOTE O - TRANSACTIONS WITH RELATED PERSONS
BancShares and FCB have had, and expect to have in the future, banking transactions in the ordinary course of business with directors, officers and their associates (Related Persons).
For those identified as Related Persons as of
December 31, 2012
, the following table provides an analysis of changes in the loans outstanding during
2012
:
|
Balance at January 1, 2012
|
$
|
1,496
|
|
|
New loans
|
274
|
|
|
|
Repayments
|
459
|
|
|
|
Balance at December 31, 2012
|
$
|
1,311
|
|
113
FIRST CITIZENS BANCSHARES, INC. AND SUBSIDIARIES
NOTES TO CONSOLIDATED FINANCIAL STATEMENTS—(Continued)
(dollars in thousands)
Unfunded loan commitments available to Related Persons totaled
$4,446
and
$4,343
as of
December 31, 2012, and 2011
, respectively.
During
2012
, BancShares purchased and retired
593,954
shares of Class B common stock from a shareholder and entities under the control of that shareholder. Until the time the shares were purchased, the shareholder served as a director of BancShares and FCB. The purchase of these shares was approved by the Board of Directors at a price approved by an independent committee of the Board.
BancShares provides processing and operational services to other financial institutions. Certain of these institutions are deemed to be Related Persons since significant shareholders of BancShares are also significant shareholders of the other banks. During
2012, 2011 and 2010
, BancShares received
$33,653
,
$34,536
and
$33,654
, respectively, for services rendered to these Related Persons. The amounts recorded from the largest individual institution totaled
$22,793
,
$23,463
and
$22,024
for
2012, 2011 and 2010
, respectively.
Investment securities available for sale include an investment in a financial institution controlled by Related Persons. This investment had a carrying value of
$16,069
and
$14,777
at
December 31, 2012, and 2011
, respectively. The investment had a cost of
$452
at
December 31, 2012
and
$508
at
December 31, 2011
.
NOTE P - DERIVATIVES
At
December 31, 2012
, BancShares had an interest rate swap (the 2011 Swap) that was designated as a cash flow hedge under GAAP. The notional amount of the interest rate swap was
$93,500
at
December 31, 2012, and 2011
. The interest rate swap hedges interest payments through
June 2016
and requires fixed-rate payments by BancShares at
5.50 percent
in exchange for variable-rate payments of
175
basis points above
three-month
LIBOR. As of
December 31, 2012, and 2011
, collateral with a fair value of
$9,656
and
$14,679
, respectively, was pledged to secure the existing obligation under the interest rate swap. Settlement occurs quarterly.
During
December 2011
, an earlier swap (the 2009 Swap) was terminated following the settlement of
$21,500
of the
$115,000
notional amount following the purchase and retirement of a like amount of the underlying trust preferred capital securities. The 2009 Swap, which was intended to convert variable-rate exposure on outstanding debt to a fixed rate during the period
July 2011
through
June 2016
, was designated as a cash flow hedge when it was initiated in 2009 and was fully effective until it was terminated in
December 2011
. As a result of this transaction a gain of
$9,685
was recorded in noninterest income on the retirement of the underlying trust preferred securities and
$2,824
in noninterest expense was recorded for termination of the 2009 swap. The remaining amount of accumulated other comprehensive loss relating to the terminated swap at the date of termination was
$11,002
and is being recognized over the remaining term of the hedged interest payments.
An earlier interest rate swap (the 2006 Swap) hedged interest payments on
$115,000
of trust preferred capital securities from
July 2006
through
June 2011
. The 2006 Swap required fixed-rate payments by BancShares at
7.125 percent
in exchange for variable-rate payments of
175
basis points above
three-month
LIBOR, which is equal to the interest paid to the holders of the trust preferred capital securities.
The fair values of the 2011 Swap, the 2009 Swap and the 2006 Swap are included in other liabilities in the consolidated balance sheets and the net change in fair value is included in the change in other liabilities in the consolidated statements of cash flows. Each of the interest rate swaps is used for interest rate risk management purposes and converts variable-rate exposure on outstanding debt to a fixed rate.
|
|
December 31, 2012
|
December 31, 2011
|
|||||||||||||
|
|
Notional
amount
|
Estimated fair
value of liability
|
Notional
amount
|
Estimated fair
value of liability
|
|||||||||||
|
2011 interest rate swap hedging variable rate exposure on trust preferred securities 2011-2016
|
$
|
93,500
|
|
$
|
10,398
|
|
$
|
93,500
|
|
$
|
10,714
|
|
|||
|
$
|
10,398
|
|
$
|
10,714
|
|
||||||||||
For cash flow hedges, the effective portion of the gain or loss due to changes in the fair value of the derivative hedging instrument is included in other comprehensive income until the related cash flows from the hedged item are recognized in earnings. The ineffective portion, representing the excess of the cumulative change in the fair value of the derivative over the
114
FIRST CITIZENS BANCSHARES, INC. AND SUBSIDIARIES
NOTES TO CONSOLIDATED FINANCIAL STATEMENTS—(Continued)
(dollars in thousands)
cumulative change in expected future discounted cash flows on the hedged transaction, is recorded in the consolidated income statement. BancShares’ interest rate swaps have been fully effective since inception. Therefore, changes in the fair value of the interest rate swaps have had no impact on net income. For the years ended
December 31, 2012, 2011, and 2010
, BancShares recognized interest expense of
$3,095
,
$4,577
, and
$5,869
respectively, resulting from the interest rate swaps, none of which relates to ineffectiveness. The estimated net amount in accumulated other comprehensive income at
December 31, 2012
, that is expected to be reclassified into earnings within the next 12 months is a net after-tax loss of
$1,937
.
The following table discloses activity in accumulated other comprehensive loss related to the interest rate swaps during the years ended
December 31, 2012, 2011, and 2010
.
|
2012
|
2011
|
2010
|
|||||||||
|
Accumulated other comprehensive loss resulting from interest rate swaps as of January 1
|
$
|
(10,714
|
)
|
$
|
(9,492
|
)
|
$
|
(5,367
|
)
|
||
|
Other comprehensive income (loss) recognized during year ended December 31
|
316
|
|
(1,222
|
)
|
(4,125
|
)
|
|||||
|
Accumulated other comprehensive loss resulting from interest rate swaps as of December 31
|
$
|
(10,398
|
)
|
$
|
(10,714
|
)
|
$
|
(9,492
|
)
|
||
BancShares monitors the credit risk of the interest rate swap counterparty.
NOTE Q - GOODWILL AND INTANGIBLE ASSETS
There was no goodwill activity during
2012
and
2011
. Goodwill totaled
$102,625
at
December 31, 2012, and 2011
with no impairment recorded during
2012, 2011 and 2010
.
GAAP requires that goodwill be tested each year to determine if goodwill is impaired. The goodwill impairment test requires a two-step method to evaluate and calculate impairment. The first step requires estimation of the reporting unit’s fair value. If the fair value exceeds the carrying value, no further testing is required. If the carrying value exceeds the fair value, a second step is performed to determine whether an impairment charge must be recorded and, if so, the amount of such charge.
BancShares performs annual impairment tests as of
July 31
each year. After the first step for
2012
and
2011
, no further analysis was required as there was no indication of impairment.
The following information relates to other intangible assets, all of which are being amortized over their estimated useful lives:
|
2012
|
2011
|
||||||
|
Balance, January 1
|
$
|
7,032
|
|
$
|
9,897
|
|
|
|
Intangible assets generated by FDIC-assisted transactions
|
—
|
|
1,521
|
|
|||
|
Amortization
|
(3,476
|
)
|
(4,386
|
)
|
|||
|
Balance, December 31
|
$
|
3,556
|
|
$
|
7,032
|
|
|
Intangible assets generated by FDIC-assisted transactions, which represent the estimated fair value of core deposits and other customer relationships that were acquired, are being amortized over a
four
-year life on an accelerated basis. The gross amount of other intangible assets and accumulated amortization as of
December 31, 2012, and 2011
are:
|
2012
|
2011
|
||||||
|
Gross balance
|
$
|
18,966
|
|
$
|
18,966
|
|
|
|
Accumulated amortization
|
(15,410
|
)
|
(11,934
|
)
|
|||
|
Carrying value
|
$
|
3,556
|
|
$
|
7,032
|
|
|
115
FIRST CITIZENS BANCSHARES, INC. AND SUBSIDIARIES
NOTES TO CONSOLIDATED FINANCIAL STATEMENTS—(Continued)
(dollars in thousands)
Based on current estimated useful lives and carrying values, BancShares anticipates amortization expense for intangible assets in subsequent periods will be:
|
2013
|
$
|
2,308
|
|
|
2014
|
1,122
|
|
|
|
2015
|
126
|
|
|
|
$
|
3,556
|
|
|
NOTE R - SHAREHOLDERS' EQUITY, DIVIDEND RESTRICTIONS AND OTHER REGULATORY MATTERS
Various regulatory agencies have established guidelines that evaluate capital adequacy based on risk-weighted adjusted assets. An additional capital computation evaluates tangible capital based on tangible assets. Minimum capital requirements currently set forth by the regulatory agencies require a tier 1 capital ratio of no less than
4 percent
of risk-weighted assets, a total capital ratio of no less than
8 percent
of risk-weighted assets, and a leverage capital ratio of no less than
3 percent
of tangible assets. To meet the FDIC’s well-capitalized standards, the tier 1 and total capital ratios must be at least
6 percent
and
10 percent
, respectively, while the leverage ratio must equal
5 percent
. Failure to meet minimum capital requirements may result in certain actions by regulators that could have a direct material effect on the consolidated financial statements.
Based on the most recent notifications from its regulators, FCB is well-capitalized under the regulatory framework for prompt corrective action. Management believes that as of
December 31, 2012
, BancShares and FCB met all capital adequacy requirements to which they are subject and was not aware of any conditions or events that would affect FCB’s well-capitalized status.
Following is an analysis of capital ratios for BancShares and FCB as of
December 31, 2012, and 2011
:
|
|
December 31, 2012
|
December 31, 2011
|
|||||||||||||||||
|
|
Amount
|
Ratio
|
Requirement for
Well-Capitalized
|
Amount
|
Ratio
|
Requirement for
Well-Capitalized
|
|||||||||||||
|
BancShares
|
|||||||||||||||||||
|
Tier 1 capital
|
$
|
1,949,985
|
|
14.27
|
%
|
6.00
|
%
|
$
|
2,072,610
|
|
15.41
|
%
|
6.00
|
%
|
|||||
|
Total capital
|
2,179,370
|
|
15.95
|
|
10.00
|
|
2,323,022
|
|
17.27
|
|
10.00
|
|
|||||||
|
Leverage capital
|
1,949,985
|
|
9.22
|
|
5.00
|
|
2,072,610
|
|
9.90
|
|
5.00
|
|
|||||||
|
FCB
|
|||||||||||||||||||
|
Tier 1 capital
|
1,942,101
|
|
14.37
|
|
6.00
|
|
1,968,032
|
|
14.75
|
|
6.00
|
|
|||||||
|
Total capital
|
2,163,034
|
|
16.00
|
|
10.00
|
|
2,211,235
|
|
16.57
|
|
10.00
|
|
|||||||
|
Leverage capital
|
1,942,101
|
|
9.34
|
|
5.00
|
|
1,968,032
|
|
9.53
|
|
5.00
|
|
|||||||
As of
December 31, 2012
, tier 1 capital and total capital for BancShares include
$93,500
of outstanding trust preferred securities that currently qualify as capital. However, beginning in
2013
provisions of the Dodd-Frank Act disallow the inclusion of trust preferred securities in the capital ratio calculations. Beginning in
2013
,
one-third
of the
$93,500
currently included in tier 1 capital will be excluded from capital, with
two-thirds
eliminated in
2014
, and the entire amount of trust preferred securities excluded beginning in
2015
. Proforma elimination of all BancShares' trust preferred securities from
December 31, 2012
, capital would result in a proforma tier 1 leverage ratio of
8.78 percent
, a proforma tier 1 risk-based ratio of
13.59 percent
and a proforma total risk-based ratio of
15.27 percent
. BancShares would continue to remain well-capitalized under current regulatory guidelines.
Tier 2 capital of BancShares and FCB includes qualifying subordinated debt that was issued in
2005
with a scheduled maturity date of
June 1, 2015
. Under current regulatory guidelines, when subordinated debt is within
five
years of its scheduled maturity date, issuers must discount the amount included in tier 2 capital by
20 percent
for each year until the debt matures. The amount of subordinated debt that qualifies as tier 2 capital totaled
$50.0 million
as of
December 31, 2012
, compared to
$75.0 million
at
December 31, 2011
. The amount of subordinated debt eligible to be included in tier 2 capital will decline
116
FIRST CITIZENS BANCSHARES, INC. AND SUBSIDIARIES
NOTES TO CONSOLIDATED FINANCIAL STATEMENTS—(Continued)
(dollars in thousands)
$25.0 million
in the
second quarter
of
2013
to
$25.0 million
and the subordinated debt will be completely removed from tier 2 capital in the
second quarter
of
2014
.
BancShares has two classes of common stock—Class A common and Class B common. Shares of Class A common have one vote per share, while shares of Class B common have 16 votes per share.
During
2012
, the Board of Directors granted authority to purchase up to
100,000
and
25,000
shares of Class A and Class B common stock, respectively, during the period from
July 1, 2012
through
June 30, 2013
. That authority replaced similar plans approved by the Board during 2011 that were in effect during the twelve months preceding July 1, 2012. Pursuant to those plans, during
2012
, BancShares purchased and retired an aggregate of
56,276
shares of Class A common stock and
100
shares of Class B common stock. Additionally, pursuant to separate authorizations, during
2012
, BancShares purchased and retired
606,829
shares of Class B common stock in privately negotiated transactions, including purchases of
593,954
shares during December 2012 from a director and certain of her related interests which were approved by the independent Directors, after review and recommendation by a special committee of independent Directors. As of
December 31, 2012
, under existing plan that expires
June 30, 2013
, BancShares had the ability to purchase
43,724
and
24,900
shares of Class A and Class B common stock, respectively.
BancShares purchased
112,471
shares of Class A common stock and
37,863
shares of Class B common stock during
2011
. BancShares did not issue or sell any Class A or Class B common stock during
2012
or
2011
.
The Board of Directors of FCB may declare a dividend on a portion of its undivided profits as it deems appropriate, subject to the requirements of the FDIC and the General Statutes of North Carolina, without prior regulatory approval. As of
December 31, 2012
, the amount was
$1,382,080
. However, to preserve its well-capitalized status, the maximum amount of the dividend was limited to
$809,000
. Dividends declared by FCB amounted to
$179,588
in
2012
,
$82,812
in
2011
and
$50,424
in
2010
.
BancShares and FCB are subject to various requirements imposed by state and federal banking statutes and regulations, including regulations requiring the maintenance of noninterest-bearing reserve balances at the Federal Reserve Bank. Banks are allowed to reduce the required balances by the amount of vault cash. For
2012
, the requirements averaged
$290,968
.
NOTE
S
- COMMITMENTS AND CONTINGENCIES
In order to meet the financing needs of its customers, BancShares has financial instruments with off-balance sheet risk. These financial instruments include commitments to extend credit, standby letters of credit and recourse obligations on mortgage loans sold. These instruments involve elements of credit, interest rate or liquidity risk.
Commitments to extend credit are legally binding agreements to lend to customers. Commitments generally have fixed expiration dates or other termination clauses and may require payment of fees. Since many of the commitments are expected to expire without being drawn upon, the total commitment amounts do not necessarily represent future liquidity requirements. Established credit standards control the credit-risk exposure associated with these commitments. In some cases, BancShares requires that collateral be pledged to secure the commitment including cash deposits, securities and other assets. At
December 31, 2012, and 2011
, BancShares had unused commitments totaling
$5,467,998
and
$5,636,942
, respectively.
Standby letters of credit are commitments guaranteeing performance of a customer to a third party. Those guarantees are issued primarily to support public and private borrowing arrangements. In order to minimize its exposure, BancShares’ credit policies govern the issuance of standby letters of credit. At
December 31, 2012, and 2011
, BancShares had standby letters of credit amounting to
$63,085
and
$57,446
, respectively. The credit risk related to the issuance of these letters of credit is essentially the same as that involved in extending loans to clients, and therefore, these letters of credit are collateralized when necessary.
Residential mortgage loans are sold with standard representations and warranties relating to documentation and underwriting requirements for the loans. If deficiencies are discovered at any point in the life of the loan, the investor may require BancShares to repurchase the loan. As of
December 31, 2012
, other liabilities included a reserve of
$4,065
for estimated losses arising from the repurchase of loans under those provisions.
117
FIRST CITIZENS BANCSHARES, INC. AND SUBSIDIARIES
NOTES TO CONSOLIDATED FINANCIAL STATEMENTS—(Continued)
(dollars in thousands)
Residential mortgage loans sold with limited recourse liability represent guarantees to repurchase the loans or pay a fee in the event of nonperformance by the borrower. The recourse period is generally
120
days or less. At
December 31, 2012, and 2011
, BancShares has sold loans of approximately
$205,888
and
$207,963
, respectively, for which the recourse period had not yet elapsed. Of these loans,
$97,706
and
$82,167
at
December 31, 2012, and 2011
, respectively, represent loans that would require repurchase in the event of nonperformance by the borrower. Any loans that are repurchased under the recourse obligation would carry the same credit risk as mortgage loans originated by the company and would be collateralized in the same manner.
BancShares has recorded a receivable from the FDIC for the expected reimbursement of losses on assets covered under the various loss share agreements. These loss share agreements impose certain obligations on us that, in the event of noncompliance, could result in the delay or disallowance of some or all of our rights under those agreements. Requests for reimbursement are subject to FDIC review and may be delayed or disallowed for noncompliance. The loss share agreements are subject to interpretation by both the FDIC and FCB, and disagreements may arise regarding coverage of losses, expenses and contingencies.
The purchase and assumption agreements (Agreements) for four FDIC-assisted transactions include provisions related to contingent consideration, commonly known as "clawback liability", which may be owed to the FDIC at the termination of the Agreements
.
The FDIC clawback liability represents an estimated payment by BancShares to the FDIC if actual cumulative losses on acquired covered assets are lower than the cumulative losses originally estimated by the FDIC at the time of acquisition. The FDIC clawback liability is estimated by discounting estimated future payments and is recorded in the Consolidated Balance Sheets as a payable to FDIC for loss share agreements. As of
December 31, 2012, and 2011
, the clawback liability was
$101,641
and
$77,866
, respectively.
BancShares and various subsidiaries have been named as defendants in various legal actions arising from their normal business activities in which damages in various amounts are claimed. Although the amount of any ultimate liability with respect to such matters cannot be determined, in the opinion of management, any such liability will not have a material effect on BancShares’ consolidated financial statements.
During February 2011, United Western Bank, United Western’s parent company, United Western Bancorp and five of their directors filed a complaint in the United States District Court for the District of Columbia against the FDIC, the OTS and others, claiming that the seizure of United Western by the OTS and the subsequent appointment of the FDIC as receiver was illegal. The complaint requested the court to direct the OTS to remove the FDIC as receiver, return control of United Western to the plaintiffs, reimburse the plaintiffs for their costs and attorney fees and to award plaintiffs other relief as may be just and equitable. Neither BancShares nor FCB were named in the complaint. The defendants filed motions to dismiss all claims against them and, during June 2011, the Court dismissed all claims by the holding company and the individual directors, and it dismissed United Western Bank’s claim against the FDIC. However, the Court denied the motion to dismiss United Western Bank’s claim against the OTS and its Acting Director, which permits that claim to proceed. In July 2011, following passage of the Dodd-Frank Act, the OCC and the Acting Comptroller were substituted for the OTS and its Acting Director as the only defendants. On November 20, 2012, the court heard Motions for Summary Judgment filed by each side and took them under advisement. It is unclear what impact, if any, the litigation will have on FCB or the assets acquired in the United Western transaction.
During March 2012, FCB received communications from the US Small Business Administration (SBA) asserting that the SBA is entitled to receive a share of amounts paid or to be paid by the FDIC to FCB relating to certain specific SBA-guaranteed loans pursuant to the loss share agreement between FCB and the FDIC applicable to Temecula Valley Bank. FCB disputes the validity of the SBA claims and is pursuing administrative relief through the SBA. FCB is unable to determine the outcome or range of loss, if any, related to these claims.
118
FIRST CITIZENS BANCSHARES, INC. AND SUBSIDIARIES
NOTES TO CONSOLIDATED FINANCIAL STATEMENTS—(Continued)
(dollars in thousands)
NOTE T - ACCUMULATED OTHER COMPREHENSIVE INCOME (LOSS)
Accumulated other comprehensive income (loss) included the following as of
December 31, 2012, and 2011
:
|
|
December 31, 2012
|
December 31, 2011
|
|||||||||||||||||||||
|
|
Accumulated
other
comprehensive
income (loss)
|
Deferred
tax
liability (asset)
|
Accumulated
other
comprehensive
income (loss),
net of tax
|
Accumulated
other
comprehensive
income (loss)
|
Deferred
tax
liability (asset)
|
Accumulated
other
comprehensive
income (loss),
net of tax
|
|||||||||||||||||
|
Unrealized gains on investment securities available for sale
|
$
|
33,809
|
|
$
|
13,292
|
|
$
|
20,517
|
|
$
|
26,565
|
|
$
|
10,450
|
|
$
|
16,115
|
|
|||||
|
Funded status of defined benefit plan
|
(158,334
|
)
|
(62,003
|
)
|
(96,331
|
)
|
(125,255
|
)
|
(49,049
|
)
|
(76,206
|
)
|
|||||||||||
|
Unrealized loss on cash flow hedge
|
(10,398
|
)
|
(4,106
|
)
|
(6,292
|
)
|
(10,714
|
)
|
(4,231
|
)
|
(6,483
|
)
|
|||||||||||
|
Total
|
$
|
(134,923
|
)
|
$
|
(52,817
|
)
|
$
|
(82,106
|
)
|
$
|
(109,404
|
)
|
$
|
(42,830
|
)
|
$
|
(66,574
|
)
|
|||||
NOTE U
- SUBSEQUENT EVENT
During the
first quarter
of
2013
, BancShares executed an agreement to sell and assign its rights and most of its obligations under various service agreements with certain client banks, some of which are Related Persons, to a third party. The transaction will result in the elimination of several positions that supported the affected functions as well as certain investments in software and equipment. A pre-tax gain of approximately
$5.0 million
(unaudited) is expected to be recognized during the
first quarter
of
2013
.
NOTE V - PARENT COMPANY FINANCIAL STATEMENTS
Parent Company
Condensed Balance Sheets
December 31, 2012, and 2011
|
|
2012
|
2011
|
|||||
|
Assets
|
|||||||
|
Cash
|
$
|
2,131
|
|
$
|
10,765
|
|
|
|
Investment securities
|
237,765
|
|
235,617
|
|
|||
|
Investment in subsidiaries
|
1,969,600
|
|
2,031,229
|
|
|||
|
Due from subsidiaries
|
78,512
|
|
120,836
|
|
|||
|
Other assets
|
83,283
|
|
114,852
|
|
|||
|
Total assets
|
$
|
2,371,291
|
|
$
|
2,513,299
|
|
|
|
Liabilities and Shareholders’ Equity
|
|||||||
|
Short-term borrowings
|
$
|
399,047
|
|
$
|
375,396
|
|
|
|
Long-term obligations
|
96,392
|
|
251,697
|
|
|||
|
Other liabilities
|
11,845
|
|
25,078
|
|
|||
|
Shareholders’ equity
|
1,864,007
|
|
1,861,128
|
|
|||
|
Total liabilities and shareholders’ equity
|
$
|
2,371,291
|
|
$
|
2,513,299
|
|
|
119
FIRST CITIZENS BANCSHARES, INC. AND SUBSIDIARIES
NOTES TO CONSOLIDATED FINANCIAL STATEMENTS—(Continued)
(dollars in thousands)
Parent Company
Condensed Income Statements
For the Years Ended
December 31, 2012, 2011, and 2010
|
|
2012
|
2011
|
2010
|
||||||||
|
Interest income
|
$
|
1,353
|
|
$
|
1,345
|
|
$
|
1,524
|
|
||
|
Interest expense
|
15,435
|
|
21,512
|
|
22,633
|
|
|||||
|
Net interest loss
|
(14,082
|
)
|
(20,167
|
)
|
(21,109
|
)
|
|||||
|
Dividends from subsidiaries
|
179,588
|
|
82,812
|
|
50,424
|
|
|||||
|
Other income (loss)
|
2,843
|
|
9,699
|
|
(314
|
)
|
|||||
|
Other operating expense
|
6,384
|
|
5,298
|
|
2,343
|
|
|||||
|
Income before income tax benefit and equity in undistributed net income of subsidiaries
|
161,965
|
|
67,046
|
|
26,658
|
|
|||||
|
Income tax benefit
|
(8,417
|
)
|
(5,531
|
)
|
(8,343
|
)
|
|||||
|
Income before equity in undistributed net income of subsidiaries
|
170,382
|
|
72,577
|
|
35,001
|
|
|||||
|
(Excess distributions) equity in undistributed net income of subsidiaries
|
(36,034
|
)
|
122,451
|
|
158,043
|
|
|||||
|
Net income
|
$
|
134,348
|
|
$
|
195,028
|
|
$
|
193,044
|
|
||
120
FIRST CITIZENS BANCSHARES, INC. AND SUBSIDIARIES
NOTES TO CONSOLIDATED FINANCIAL STATEMENTS—(Continued)
(dollars in thousands)
Parent Company
Condensed Statements of Cash Flows
Years Ended
December 31, 2012, 2011, and 2010
|
|
2012
|
2011
|
2010
|
||||||||
|
OPERATING ACTIVITIES
|
|||||||||||
|
Net income
|
$
|
134,348
|
|
$
|
195,028
|
|
$
|
193,044
|
|
||
|
Adjustments
|
|||||||||||
|
Excess distributions (undistributed) net income of subsidiaries
|
36,034
|
|
(122,451
|
)
|
(158,043
|
)
|
|||||
|
Net amortization of premiums and discounts
|
439
|
|
203
|
|
(113
|
)
|
|||||
|
Gain on retirement of long term obligations
|
—
|
|
(9,685
|
)
|
—
|
|
|||||
|
Securities (gains) losses
|
(2,274
|
)
|
(62
|
)
|
(44
|
)
|
|||||
|
Other than temporary impairment on securities
|
45
|
|
26
|
|
421
|
|
|||||
|
Change in other assets
|
30,761
|
|
(20,951
|
)
|
(30,443
|
)
|
|||||
|
Change in other liabilities
|
(10,148
|
)
|
(1,925
|
)
|
1,409
|
|
|||||
|
Net cash provided by operating activities
|
189,205
|
|
40,183
|
|
6,231
|
|
|||||
|
INVESTING ACTIVITIES
|
|||||||||||
|
Net change in due from subsidiaries
|
42,323
|
|
146,463
|
|
59,249
|
|
|||||
|
Purchases of investment securities
|
(111,409
|
)
|
(220,387
|
)
|
(75,180
|
)
|
|||||
|
Proceeds from sales, calls, and maturities of securities
|
112,625
|
|
75,151
|
|
65,991
|
|
|||||
|
Investment in subsidiaries
|
9,298
|
|
—
|
|
(14,000
|
)
|
|||||
|
Net cash provided by investing activities
|
52,837
|
|
1,227
|
|
36,060
|
|
|||||
|
FINANCING ACTIVITIES
|
|||||||||||
|
Net change in short-term borrowings
|
23,651
|
|
4,046
|
|
(24,227
|
)
|
|||||
|
Retirement of long-term obligations
|
(155,305
|
)
|
(11,815
|
)
|
—
|
|
|||||
|
Repurchase of common stock
|
(103,624
|
)
|
(24,387
|
)
|
—
|
|
|||||
|
Cash dividends paid
|
(15,398
|
)
|
(12,499
|
)
|
(12,521
|
)
|
|||||
|
Net cash used by financing activities
|
(250,676
|
)
|
(44,655
|
)
|
(36,748
|
)
|
|||||
|
Net change in cash
|
(8,634
|
)
|
(3,245
|
)
|
5,543
|
|
|||||
|
Cash balance at beginning of year
|
10,765
|
|
14,010
|
|
8,467
|
|
|||||
|
Cash balance at end of year
|
$
|
2,131
|
|
$
|
10,765
|
|
$
|
14,010
|
|
||
|
Cash payments for
|
|||||||||||
|
Interest
|
$
|
25,574
|
|
$
|
20,677
|
|
$
|
22,003
|
|
||
|
Income taxes
|
66,453
|
|
91,465
|
|
187,183
|
|
|||||
121
SIGNATURES
Pursuant to the requirements of Section 13 or 15(d) of the Securities Exchange Act of 1934, the Registrant has duly caused this Annual Report to be signed on its behalf by the undersigned, thereunto duly authorized.
Dated:
March 1, 2013
|
FIRST CITIZENS BANCSHARES, INC. (Registrant)
|
|
|
/S/ FRANK B. HOLDING, JR.
|
|
|
Frank B. Holding, Jr.
Chairman and Chief Executive Officer
|
|
Pursuant to the requirements of the Securities Exchange Act of 1934, this report has been signed below by the following persons, on behalf of the Registrant and in the capacities indicated on
March 1, 2013
.
|
Signature
|
|
Title
|
|
Date
|
|
/s/ F
RANK
B. H
OLDING
, J
R
.
Frank B. Holding, Jr.
|
|
Chairman and Chief Executive Officer
|
|
March 1, 2013
|
|
/s/ F
RANK
B. H
OLDING
*
Frank B. Holding
|
|
Executive Vice Chairman
|
|
March 1, 2013
|
|
/
S
/ K
ENNETH
A. B
LACK
Kenneth A. Black
|
|
Vice President, Treasurer, and Chief Financial Officer (principal financial and accounting officer)
|
|
March 1, 2013
|
|
/s/ J
OHN
M. A
LEXANDER
, J
R
. *
John M. Alexander, Jr.
|
|
Director
|
|
March 1, 2013
|
|
/s/ V
ICTOR
E. B
ELL
, III *
Victor E. Bell, III
|
|
Director
|
|
March 1, 2013
|
|
/s/ H
OPE
H
OLDING
C
ONNELL
*
Hope Holding Connell
|
|
Director
|
|
March 1, 2013
|
|
/s/ H
UBERT
M. C
RAIG
, III *
Hubert M. Craig, III
|
|
Director
|
|
March 1, 2013
|
122
|
Signature
|
|
Title
|
|
Date
|
|
/s/ H. L
EE
D
URHAM
, J
R
. *
H. Lee Durham, Jr.
|
|
Director
|
|
March 1, 2013
|
|
/s/ D
ANIEL
L. H
EAVNER
*
Daniel L. Heavner
|
|
Director
|
|
March 1, 2013
|
|
/s/ L
UCIUS
S. J
ONES
*
Lucius S. Jones
|
|
Director
|
|
March 1, 2013
|
|
/s/ R
OBERT
E. M
ASON
, IV *
Robert E. Mason, IV
|
|
Director
|
|
March 1, 2013
|
|
/s/ R
OBERT
T. N
EWCOMB
*
Robert T. Newcomb
|
|
Director
|
|
March 1, 2013
|
|
/s/ J
AMES
M. P
ARKER
*
James M. Parker
|
|
Director
|
|
March 1, 2013
|
|
/s/ R
ALPH
K. S
HELTON
*
Ralph K. Shelton
|
|
Director
|
|
March 1, 2013
|
|
*
|
|
Kenneth A. Black hereby signs this Annual Report on Form 10-K on March 1, 2013, on behalf of each of the indicated persons for whom he is attorney-in-fact pursuant to a Power of Attorney filed herewith.
|
|
By:
|
|
/
S
/ K
ENNETH
A. B
LACK
|
|
|
Kenneth A. Black
As Attorney-In-Fact
|
|
123
EXHIBIT INDEX
|
2.1
|
Purchase and Assumption Agreement between Registrant’s subsidiary First-Citizens Bank & Trust Company and Federal Deposit Insurance Corporation dated July 17, 2009 (incorporated by reference from Registrant’s Form 8-K/A filed February 1, 2010 to Form 8-K dated July 17, 2009)
|
|
2.2
|
Purchase and Assumption Agreement between Registrant’s subsidiary First-Citizens Bank & Trust Company and Federal Deposit Insurance Corporation dated September 11, 2009 (incorporated by reference from Registrant’s Form 8-K/A filed December 21, 2009 to Form 8-K dated September 11, 2009)
|
|
2.3
|
Purchase and Assumption Agreement between Registrant’s subsidiary First-Citizens Bank & Trust Company and Federal Deposit Insurance Corporation dated January 29, 2010 (incorporated by reference from Registrant’s Form 8-K/A filed June 9, 2010 to Form 8-K dated January 29, 2010)
|
|
2.4
|
Purchase and Assumption Agreement between Registrant’s subsidiary First-Citizens Bank & Trust Company and Federal Deposit Insurance Corporation dated March 5, 2010 (incorporated by reference from Registrant’s Form 8-K dated March 5, 2010)
|
|
2.5
|
Purchase and Assumption Agreement between Registrant’s subsidiary First-Citizens Bank & Trust Company and Federal Deposit Insurance Corporation dated January 21, 2011 (incorporated by reference from Registrant’s Form 8-K dated January 21, 2011)
|
|
2.6
|
Purchase and Assumption Agreement between Registrant’s subsidiary First-Citizens Bank & Trust Company and Federal Deposit Insurance Corporation dated July 8, 2011 (incorporated by reference from Registrant’s Form 8-K dated July 8, 2011)
|
|
3.1
|
Certificate of Incorporation of the Registrant, as amended (incorporated by reference from Registrant’s Form 10-K for the year ended December 31, 1992)
|
|
3.2
|
Bylaws of the Registrant, as amended (incorporated by reference from Registrant’s Form 8-K dated April 27, 2009)
|
|
4.1
|
Specimen of Registrant’s Class A Common Stock certificate (incorporated by reference from Registrant’s Form 10-K for the year ended December 31, 2008)
|
|
4.2
|
Specimen of Registrant’s Class B Common Stock certificate (incorporated by reference from Registrant’s Form 10-K for the year ended December 31, 2008)
|
|
4.3
|
Amended and Restated Trust Agreement of FCB/NC Capital Trust I (incorporated by reference from Registration No. 333-59039)
|
|
4.4
|
Form of Guarantee Agreement (incorporated by reference from Registration No. 333-59039)
|
|
4.5
|
Junior Subordinated Indenture dated March 5, 1998 between Registrant and Bankers Trust Company, as Debenture Trustee (incorporated by reference from Registration No. 333-59039)
|
|
4.6
|
Indenture dated June 1, 2005 between Registrant’s subsidiary First-Citizens Bank & Trust Company and Deutsche Bank Trust Company Americas, as Trustee (incorporated by reference from Registrant’s Form 8-K dated June 1, 2005)
|
|
4.7
|
First Supplemental Indenture dated June 1, 2005 between Registrant’s subsidiary First-Citizens Bank & Trust Company and Deutsche Bank Trust Company Americas, as Trustee (incorporated by reference from Registrant’s Form 8-K dated June 1, 2005)
|
|
4.8
|
Amended and Restated Trust Agreement of FCB/NC Capital Trust III (incorporated by reference from Registrant’s Form 10-Q for the quarter ended June 30, 2006)
|
|
4.9
|
Guarantee Agreement relating to Registrant’s guarantee of the capital securities of FCB/NC Capital Trust III (incorporated by reference from Registrant’s Form 10-Q for the quarter ended June 30, 2006)
|
|
4.1
|
Junior Subordinated Indenture dated May 18, 2006 between Registrant and Wilmington Trust Company, as Debenture Trustee (incorporated by reference from Registrant’s Form 10-Q for the quarter ended June 30, 2006)
|
|
10.1
|
Executive Consultation, Separation from Service and Death Benefit Agreement between Registrant’s subsidiary First-Citizens Bank & Trust Company and Frank B. Holding, Jr. (incorporated by reference from Registrant’s Form 8-K dated February 18, 2011)
|
|
10.2
|
Executive Consultation, Separation from Service and Death Benefit Agreement between Registrant’s subsidiary First-Citizens Bank & Trust Company and Frank B. Holding (incorporated by reference from Registrant’s Form 8-K dated February 3, 2009)
|
124
|
10.3
|
Executive Consultation, Separation from Service and Death Benefit Agreement between Registrant’s subsidiary First-Citizens Bank & Trust Company and Hope Holding Connell (incorporated by reference to Registrant’s Form 8-K dated February 18, 2011)
|
|
10.4
|
Executive Consultation, Separation from Service and Death Benefit Agreement between Registrant’s subsidiary First-Citizens Bank & Trust Company and Edward L. Willingham, IV (incorporated by reference to Registrant’s Form 8-K dated February 18, 2011)
|
|
10.5
|
Offer of employment by Registrant’s subsidiary First-Citizens Bank & Trust Company to Carol B. Yochem (incorporated by reference to Registrant’s Form 10-K for the year ended December 31, 2006)
|
|
10.6
|
Executive Consultation, Separation from Service and Death Benefit Agreement between Registrant’s subsidiary First-Citizens Bank & Trust Company and Carol B. Yochem (incorporated by reference to Registrant’s Form 8-K dated February 18, 2011)
|
|
10.7
|
Executive Consultation, Separation from Service and Death Benefit Agreement between Registrant’s subsidiary First-Citizens Bank & Trust Company and Kenneth A. Black (incorporated by reference to Registrant’s Form 8-K dated February 18, 2011)
|
|
10.8
|
Executive Consultation, Separation from Service and Death Benefit Agreement between Registrant’s subsidiary, First-Citizens Bank & Trust Company, as successor by merger to IronStone Bank, and James M. Parker (incorporated by reference from Registrant’s Form 10-Q for the quarter ended September 30, 2007)
|
|
10.9
|
Executive Consultation, Separation from Service and Death Benefit Agreement between Registrant’s subsidiary, First-Citizens Bank & Trust Company, as successor by merger to IronStone Bank, and James M. Parker (incorporated by reference from Registrant’s Form 10-K for the year ended December 31, 2008)
|
|
10.10
|
Executive Consultation, Separation from Service and Death Benefit Agreement between Registrant’s subsidiary, First-Citizens Bank & Trust Company, as successor by merger to IronStone Bank, and James M. Parker (incorporated by reference from Registrant’s Form 8-K dated February 4, 2009)
|
|
10.11
|
Executive Consultation, Separation from Service and Death Benefit Agreement between Registrant’s subsidiary, First-Citizens Bank & Trust Company, as successor by merger to IronStone Bank, and James M. Parker (incorporated by reference from Registrant’s Form 10-K for the year ended December 31, 2010)
|
|
21
|
Subsidiaries of the Registrant (filed herewith)
|
|
24
|
Power of Attorney (filed herewith)
|
|
31.1
|
Certification of Chief Executive Officer (filed herewith)
|
|
31.2
|
Certification of Chief Financial Officer (filed herewith)
|
|
32.1
|
Certification of Chief Executive Officer (filed herewith)
|
|
32.2
|
Certification of Chief Financial Officer (filed herewith)
|
|
99.1
|
Proxy Statement for Registrant’s 2013 Annual Meeting (separately filed)
|
|
*101.INS
|
XBRL Instance Document (filed herewith)
|
|
*101.SCH
|
XBRL Taxonomy Extension Schema (filed herewith)
|
|
*101.CAL
|
XBRL Taxonomy Extension Calculation Linkbase (filed herewith)
|
|
*101.LAB
|
XBRL Taxonomy Extension Label Linkbase (filed herewith)
|
|
*101.PRE
|
XBRL Taxonomy Extension Presentation Linkbase (filed herewith)
|
|
*101.DEF
|
XBRL Taxonomy Definition Linkbase (filed herewith)
|
|
*
|
|
Interactive data files are furnished but not filed for purposes of Sections 11 and 12 of the Securities Act of 1933, as amended, and Section 18 of the Securities Exchange Act of 1934, as amended.
|
COPIES OF EXHIBITS ARE AVAILABLE UPON WRITTEN REQUEST TO
KATHY A. KLOTZBERGER, CORPORATE SECRETARY OF FIRST CITIZENS BANCSHARES, INC.
125
TABLE OF CONTENTS