FIRST CITIZENS BANCSHARES INC /DE/
10-Ks and 10-Qs
|
|
|
|
|
|
|
|
|
|
|
|
|
|
|
|
|
|
|
|
|
|
|
|
|
|
|
|
|
|
|
|
|
|
|
|
|
|
|
|
|
|
|
|
|
|
|
|
|
|
|
|
|
|
|
|
UNITED STATES
SECURITIES AND EXCHANGE COMMISSION
Washington, D.C. 20549
FORM 10-K
ANNUAL REPORT PURSUANT TO SECTION 13 OR 15(d)
OF THE SECURITIES EXCHANGE ACT OF 1934
For the fiscal year ended
December 31, 2013
Commission File Number: 001-16715
____________________________________________________
FIRST CITIZENS BANCSHARES, INC.
(Exact name of Registrant as specified in its charter)
____________________________________________________
|
Delaware
|
56-1528994
|
|
|
(State or other jurisdiction of
incorporation or organization)
|
(I.R.S. Employer
Identification Number)
|
|
|
4300 Six Forks Road
|
||
|
Raleigh, North Carolina 27609
|
||
|
(Address of principal executive offices, ZIP code)
|
||
|
(919) 716-7000
|
||
|
(Registrant's telephone number, including area code)
|
||
____________________________________________________
Securities Registered Pursuant to Section 12(b) of the Securities Exchange Act of 1934:
|
Title of each class
|
Name of each exchange on which registered
|
|
|
Class A Common Stock, Par Value $1
|
NASDAQ Global Select Market
|
|
Securities Registered Pursuant to Section 12(g) of the Securities Exchange Act of 1934.
Class B Common Stock, Par Value $1
(Title of class)
_________________________________________________________________
Indicate by check mark if the Registrant is a well-known seasoned issuer, as defined in Rule 405 of the Securities Act. Yes
x
No
¨
Indicate by check mark if the Registrant is not required to file reports pursuant to Section 13 or Section 15(d) of the Act. Yes
¨
No
x
Indicate by check mark whether the Registrant (1) has filed all reports required to be filed by Section 13 or 15(d) of the Securities Exchange Act of 1934 during the preceding twelve months (or for such shorter period that the Registrant was required to file such reports), and (2) has been subject to such filing requirements for the past ninety days. Yes
x
No
¨
Indicate by check mark whether the Registrant has submitted electronically and posted on its corporate Web site, if any, every Interactive Data File required to be submitted and posted pursuant to Rule 405 of Regulation S-T during the preceding 12 months (or for such shorter period that the Registrant was required to submit and post such files). Yes
x
No
¨
Indicate by check mark if disclosure of delinquent filers pursuant to Item 405 of Regulation S-K is not contained herein, and will not be contained, to the best of Registrant’s knowledge, in definitive proxy or information statements incorporated by reference in Part III of this Form 10-K or any amendment to this Form 10-K.
¨
Indicate by check mark whether the Registrant is a large accelerated filer, an accelerated filer, a non-accelerated filer or a smaller reporting company. See definition of “large accelerated filer,” “accelerated filer,” “non-accelerated filer,” and “smaller reporting company” in Rule 12b-2 of the Exchange Act.
|
Large accelerated filer
x
|
Accelerated filer
¨
|
Non-accelerated filer
¨
|
Smaller reporting company
¨
|
|||
Indicate by check mark whether the Registrant is a shell company (as defined in Rule 12b-2 of the Exchange Act). Yes
¨
No
x
The aggregate market value of the Registrant’s common equity held by nonaffiliates computed by reference to the price at which the common equity was last sold as of the last business day of the Registrant’s most recently completed second fiscal quarter was
$1,199,498,891
.
On
February 26, 2014
, there were
8,586,058
outstanding shares of the Registrant's Class A Common Stock and
1,032,883
outstanding shares of the Registrant's Class B Common Stock.
Portions of the Registrant's definitive Proxy Statement for the
2014 Annual Meeting of Shareholders
are incorporated in Part III of this report.
|
|
|
Page
|
|
|
CROSS REFERENCE INDEX
|
|||
|
PART I
|
Item 1
|
||
|
Item 1A
|
|||
|
Item 1B
|
Unresolved Staff Comments
|
None
|
|
|
Item 2
|
|||
|
Item 3
|
|||
|
PART II
|
Item 5
|
||
|
Item 6
|
|||
|
Item 7
|
|||
|
Item 7A
|
|||
|
Item 8
|
Financial Statemen
ts and Supplementary Data
|
||
|
Item 9
|
Changes in and Disagreements with Accountants on Accounting and Financial Disclosure
|
None
|
|
|
Item 9A
|
|||
|
Item 9B
|
Other Information
|
None
|
|
|
PART III
|
Item 10
|
Directors, Executive Officers and Corporate Governance
|
*
|
|
Item 11
|
Executive Compensation
|
*
|
|
|
Item 12
|
Security Ownership of Certain Beneficial Owners and Management and Related Stockholder Matters
|
*
|
|
|
Item 13
|
Certain Relationships and Related Transactions and Director Independence
|
*
|
|
|
Item 14
|
Principal Accounting Fees and Services
|
*
|
|
|
PART IV
|
Item 15
|
Exhibits, Financial Statement Schedules
|
|
|
(1)
|
Financial Statements (see Item 8 for reference)
|
||
|
(2)
|
All Financial Statement Schedules normally required for Form 10-K are omitted since they are not applicable, except as referred to in Item 8.
|
||
|
(3)
|
|||
* Information required by Item 10 is incorporated herein by reference to the information that appears under the headings or captions ‘Proposal 1: Election of Directors,’ ‘Code of Ethics,’ ‘Committees of our Board—General,’ and ‘—Audit Committee’, ‘Executive Officers’ and ‘Section 16(a) Beneficial Ownership Reporting Compliance’ from the Registrant’s Proxy Statement for the 2014 Annual Meeting of Shareholders (2014 Proxy Statement).
Information required by Item 11 is incorporated herein by reference to the information that appears under the headings or captions ‘Compensation, Nominations and Governance Committee Report,’ ‘Compensation Discussion and Analysis,’ ‘Executive Compensation,’ and ‘Director Compensation,’ of the 2014 Proxy Statement.
Information required by Item 12 is incorporated herein by reference to the information that appears under the captions ‘Beneficial Ownership of Our Common Stock—Directors and Executive Officers’ and '—Principal Shareholders' of the 2014 Proxy Statement.
Information required by Item 13 is incorporated herein by reference to the information that appears under the headings or captions ‘Corporate Governance—Director Independence’ and ‘Transactions with Related Persons’ of the 2014 Proxy Statement.
Information required by Item 14 is incorporated by reference to the information that appears under the caption ‘Services and Fees During
2013
and
2012
’ of the 2014 Proxy Statement.
2
Business
General
First Citizens BancShares, Inc. (BancShares) was incorporated under the laws of Delaware on August 7, 1986, to become the holding company of First-Citizens Bank & Trust Company (FCB), its banking subsidiary. FCB opened in 1898 as the Bank of Smithfield, Smithfield, North Carolina, and later became First-Citizens Bank & Trust Company. On April 28, 1997, BancShares launched IronStone Bank (ISB), a federally-chartered thrift institution that originally operated under the name Atlantic States Bank. Initially, ISB operated in the counties surrounding Atlanta, Georgia, but gradually expanded into other high-growth markets throughout the southeastern and western United States. On January 7, 2011, ISB was merged into FCB resulting in a single banking subsidiary of BancShares.
Prior to 2009, we focused on organic growth, delivering our products and services to customers through
de novo
branch expansion. Beginning in 2009, leveraging on our strong capital and liquidity positions, we participated in six FDIC-assisted transactions involving distressed financial institutions. These transactions allowed FCB to enter new markets and expand its presence in other markets. A summary of the FDIC-assisted transactions is provided in Table 3 of Management's Discussion and Analysis.
As of
December 31, 2013
, FCB operated
397
branches in North Carolina, Virginia, West Virginia, Maryland, Tennessee, Washington, California, Florida, Georgia, Texas, Arizona, New Mexico, Oregon, Colorado, Oklahoma, Kansas, Missouri and Washington, DC.
BancShares' market areas enjoy a diverse employment base, including, in various locations, manufacturing, service industries, agricultural, wholesale and retail trade, technology and financial services. BancShares believes its current market areas will support future growth in loans and deposits. BancShares maintains a community bank approach to providing customer service, a competitive advantage that strengthens our ability to effectively provide financial products and services to individuals and businesses in our markets. However, like larger banks, BancShares has the capacity to offer most financial products and services that our customers require.
During 2013, we refreshed our brand and updated our company logo. Our new brand line, Forever First®, symbolizes our commitment to the people, businesses and communities who rely on us to be the best we can be. It is used in all our branches, in print advertising and for our online presence. In certain North Carolina markets, television, radio and outdoor advertising share our brand story. We have also developed two product bundles that are used to target specific customers. Your Family First was developed for financially-active families, while the Your Venture First package was developed for small business customers.
A substantial portion of BancShares’ revenue is derived from our operations throughout North Carolina and Virginia, and in certain urban areas of Georgia, Florida, California and Texas. We deliver products and services to our customers through our extensive branch network as well as online banking, telephone banking, mobile banking and various ATM networks. Business customers may conduct banking transactions through use of remote image technology.
FCB’s primary deposit markets are North Carolina and Virginia. FCB’s deposit market share in North Carolina was 3.7 percent as of June 30, 2013, based on the FDIC Deposit Market Share Report, which makes FCB the fourth largest bank in North Carolina. The three banks larger than FCB based on deposits in North Carolina as of June 30, 2013, controlled 79.1 percent of North Carolina deposits. In Virginia, FCB was the 18th largest bank with a June 30, 2013, deposit market share of 0.6 percent. The 17 larger banks represent 84.4 percent of total deposits in Virginia as of June 30, 2013.
3
The following table identifies the various states in which FCB maintains branch offices and the percentage of our deposits by state as of
December 31, 2013
.
|
December 31, 2013
|
||||
|
State
|
Number of branches
|
Percent of total deposits
|
||
|
North Carolina
|
253
|
|
72.3
|
%
|
|
Virginia
|
48
|
|
7.7
|
|
|
California
|
21
|
|
5.9
|
|
|
Florida
|
18
|
|
3.5
|
|
|
Georgia
|
14
|
|
2.4
|
|
|
Washington
|
7
|
|
1.9
|
|
|
Texas
|
7
|
|
1.1
|
|
|
Colorado
|
6
|
|
1.1
|
|
|
Tennessee
|
6
|
|
0.6
|
|
|
West Virginia
|
5
|
|
0.7
|
|
|
Arizona
|
2
|
|
0.6
|
|
|
New Mexico
|
2
|
|
1.0
|
|
|
Oklahoma
|
2
|
|
0.3
|
|
|
Oregon
|
2
|
|
0.3
|
|
|
District of Columbia
|
1
|
|
0.1
|
|
|
Kansas
|
1
|
|
0.3
|
|
|
Maryland
|
1
|
|
0.2
|
|
|
Missouri
|
1
|
|
0.1
|
|
|
Total
|
397
|
|
100.0
|
%
|
FCB seeks to meet the needs of both individuals and commercial entities in its market areas. Services offered at most offices include taking of deposits, cashing of checks and providing for individual and commercial cash needs; numerous checking and savings plans; commercial, business and consumer lending; a full-service trust department; and other activities incidental to commercial banking. FCB’s wholly-owned subsidiary, First Citizens Investor Services, Inc. (FCIS), provides various investment products including annuities, discount brokerage services and third-party mutual funds to customers primarily through the bank's branch network. Other subsidiaries are not material to BancShares’ consolidated financial position or to consolidated net income.
In prior years, FCB provided processing and operational services to other banks. The scope of these services declined in 2012 due to client bank attrition, merger transactions involving client banks, and the conversion of certain clients to different systems, resulting in reduced revenues. In early 2013, we elected to sell nearly all processing service relationships to another servicer. Although we will continue to provide processing services to our largest client bank, the revenues generated from all other client banks significantly declined during 2013.
The financial services industry is highly competitive and the ability of non-bank financial entities to provide services has intensified competition. Traditional commercial banks are subject to significant competitive pressure from multiple types of financial institutions. Non-banks and other diversified financial conglomerates have developed powerful and focused franchises, which have eroded traditional commercial banks’ market share of both balance sheet and fee-based products.
At
December 31, 2013
, BancShares and its subsidiaries employed a full-time staff of
4,482
and a part-time staff of
393
for a total of
4,875
employees.
Throughout its history, the operations of BancShares have been significantly influenced by descendants of Robert P. Holding, who came to control FCB during the 1920s. Robert P. Holding’s children and grandchildren have served as members of the board of directors, as chief executive officers and in other executive management positions and, since our formation in 1986, have remained shareholders controlling a large percentage of our common stock.
Our Chairman of the Board and Chief Executive Officer, Frank B. Holding, Jr., is the grandson of Robert P. Holding. Hope Holding Bryant, Vice Chairman of BancShares and FCB, is Robert P. Holding’s granddaughter. Frank B. Holding, son of
4
Robert P. Holding and father of Frank B. Holding, Jr. and Hope Holding Bryant, is our Executive Vice Chairman. On February 14, 2014, Frank Holding announced that he would retire from his position as a director effective April 29, 2014, and that he will retire from his positions as an officer of BancShares and FCB effective September 2, 2014.
Lewis R. Holding preceded Frank B. Holding, Jr. as Chairman of the Board and Chief Executive Officer, and served in both capacities from the time BancShares was formed until 2008, when he retired as Chief Executive Officer, and 2009, when he retired as Chairman of the Board. Lewis R. Holding, who died in August 2009, was the son of Robert P. Holding and brother of Frank B. Holding. Lewis R. Holding's daughter, Carmen Holding Ames, was a director of BancShares and FCB from 1996 until she resigned from the boards on December 20, 2012.
On December 20, 2012, BancShares purchased 593,954 shares of Class B common stock from Carmen Holding Ames and certain of her related entities, including trusts that held shares for her benefit. On the same day, Ms. Ames and certain related entities also sold 960,201 shares of Class A common stock to institutional investors unaffiliated with BancShares.
Members of the Frank B. Holding family, including those members who serve as our directors and in management positions, and certain family members' related entities including family-owned entities, may be considered to beneficially own, in the aggregate, approximately
24.6 percent
of the outstanding shares of our Class A common stock and approximately
66.5 percent
of the outstanding shares of our Class B common stock, together representing approximately
52.2 percent
of the total votes entitled to be cast by all outstanding shares of both classes of BancShares' common stock. In addition, other banking organizations in which various members of the Holding family are principal shareholders and serve as directors, collectively hold an aggregate of approximately
5.1 percent
of the outstanding shares of our Class A common stock and approximately
6.8 percent
of the outstanding shares of our Class B common stock, together representing approximately
6.2 percent
of the voting control of BancShares.
Statistical information regarding our business activities is found in Management’s Discussion and Analysis.
Regulatory Considerations
The business and operations of BancShares and FCB are subject to significant federal and state regulation and supervision. BancShares is a financial holding company registered with the Federal Reserve Board (FRB) under the Bank Holding Company Act of 1956, as amended. It is subject to supervision and examination by, and the regulations and reporting requirements of, the FRB.
FCB is a state-chartered bank, subject to supervision and examination by, and the regulations and reporting requirements of, the FDIC and the North Carolina Commissioner of Banks. Deposit obligations are insured by the FDIC to the maximum legal limits.
Various regulatory authorities supervise all areas of BancShares' and FCB's business including loans, allowances for loan and lease losses, mergers and acquisitions, the payment of dividends, various compliance matters and other aspects of its operations. The regulators conduct regular examinations, and BancShares and FCB must furnish periodic reports to its regulators containing detailed financial and other information.
Numerous statutes and regulations apply to and restrict the activities of FCB, including limitations on the ability to pay dividends, capital requirements, reserve requirements, deposit insurance requirements and restrictions on transactions with related persons and entities controlled by related persons. The impact of these statutes and regulations is discussed below and in the accompanying consolidated financial statements.
In July 2013, Bank regulatory agencies approved new global regulatory capital guidelines (Basel) aimed at strengthening existing capital requirements for bank holding companies through a combination of higher minimum capital requirements, new capital conservation buffers and more conservative definitions of capital and balance sheet exposure. When fully implemented in January 2019, the minimum ratio of common equity tier 1 capital to risk-weighted assets will increase to 4.5 percent and a common equity tier 1 capital conservation buffer of 2.5 percent of risk-weighted assets will be applied, yielding a 7 percent required capital ratio. Basel also raises the minimum ratio of tier 1 capital to risk-weighted assets from 4 percent to 6 percent and includes a minimum leverage ratio of 4 percent.
On July 21, 2010, the
Dodd-Frank Wall Street Reform and Consumer Protection Act
(Dodd-Frank Act) was signed into law. The enactment of the Dodd-Frank Act resulted in expansive changes in many areas affecting the financial services industry in general and BancShares in particular. The legislation provides broad economic oversight, consumer financial services protection, investor protection, rating agency reform and derivatives regulatory reform. Various corporate governance requirements have resulted in expanded proxy disclosures and shareholder rights. Additional provisions address the mortgage industry in an effort to strengthen lending practices. Deposit insurance reform has resulted in permanent FDIC protection for up
5
to $250,000 of deposits and requires the FDIC’s Deposit Insurance Fund to maintain 1.35 percent of insured deposits, with the burden for closing the shortfall falling to banks with more than $10 billion in assets.
The Dodd-Frank Act required that banks with total assets in excess of $10 billion establish an enterprise-wide risk committee consisting of members of its board of directors. At its July 2013 meeting, the board of directors established a Risk Committee that provides oversight of enterprise-wide risk management. With board oversight, the Risk Committee establishes risk appetite and supporting tolerances for credit, market and operational risk and ensures that risk is managed within those tolerances. The Risk Committee also monitors compliance with laws and regulations, reviews the investment securities portfolio to ensure that portfolio returns are managed within market risk tolerance, and monitors our legal activity and associated risk.
The Dodd-Frank Act also mandated that stress tests be developed and performed to ensure that financial institutions have sufficient capital to absorb losses and support operations during multiple economic and bank scenarios. Bank holding companies with total consolidated assets between $10 billion and $50 billion, including BancShares, will undergo annual company-run stress tests. As directed by the Federal Reserve, summaries of BancShares’ results in the severely adverse stress tests will be available to the public starting in June 2015. Through the stress testing program that has been implemented, BancShares and FCB will comply with current regulations. The results of stress testing activities will be considered by our Risk Committee in combination with other risk management and monitoring practices to maintain an effective risk management program.
Mortgage reform rules mandated by the Dodd-Frank Act became effective in January 2014 and require lenders to make a reasonable, good faith determination of a borrower's ability to repay any consumer credit transaction secured by a dwelling and to limit prepayment penalties. Increased risks of legal challenge, private rights of action and regulatory enforcement activities are presented by these rules. BancShares implemented the required systems, process, procedural and product changes prior to the effective dates of the new rules. We have modified our underwriting standards to ensure compliance with the ability to repay requirements. Historical performance and conservative underwriting of impacted loan portfolios mitigates the risks of non-compliance.
In response to the Dodd-Frank Act, the FDIC significantly raised the formula used to calculate the FDIC insurance assessment paid by each FDIC-insured institution. The new formula was effective April 1, 2011, and changed the assessment base from deposits to total assets less equity, resulting in larger assessments to banks with large levels of non-deposit funding. The revised assessment formula considers the level of higher-risk consumer loans and higher-risk commercial and industrial loans and securities, treating them as risk factors that may result in incremental insurance costs. Reporting of these assets under the final definitions was effective April 1, 2013. The new reporting requirement required BancShares to implement process and system changes to identify and report these higher-risk assets, but did not have an immediate material impact on the FDIC insurance assessment paid by or the operating results of BancShares.
The Dodd-Frank Act also imposed new regulatory capital requirements for banks that will result in the disallowance of qualified trust preferred capital securities as tier 1 capital. As of
December 31, 2013
, BancShares had
$93.5 million
in trust preferred capital securities that were included in tier 1 capital. Based on the Inter-Agency Capital Rule Notice,
75 percent
, or
$70.1 million
of BancShares' trust preferred capital securities will be excluded from tier 1 capital beginning
January 1, 2015
, with the remaining
25 percent
, or
$23.4 million
excluded beginning
January 1, 2016
.
The Sarbanes-Oxley Act of 2002 (SOX Act) mandated important new corporate governance, financial reporting and disclosure requirements intended to enhance the accuracy and transparency of public companies’ reported financial results. The SOX Act established new responsibilities for corporate chief executive officers, chief financial officers and audit committees, and it created a new regulatory body to oversee auditors of public companies. The SOX Act also mandated new enforcement tools, increased criminal penalties for federal mail, wire and securities fraud, and created new criminal penalties for document and record destruction in connection with federal investigations. Additionally, the SOX Act increased the opportunity for private litigation by lengthening the statute of limitations for securities fraud claims and providing new federal corporate whistleblower protection.
The SOX Act required various securities exchanges, including the NASDAQ Global Select Market, to prohibit the listing of the stock of an issuer unless that issuer maintains an independent audit committee. In addition, the securities exchanges imposed various corporate governance requirements, including the requirement that various corporate matters (including executive compensation and board nominations) be approved, or recommended for approval by the issuer’s full board of directors, by directors of the issuer who are “independent” as defined by the exchanges’ rules or by committees made up of “independent” directors. Since BancShares’ Class A common stock is a listed stock, BancShares is subject to those provisions of the Act and to corporate governance requirements of the NASDAQ Global Select Market. The economic and operational effects of the SOX Act on public companies, including BancShares, have been and will continue to be significant in terms of the time, resources and costs required to achieve compliance.
6
The USA Patriot Act of 2001 (Patriot Act) was enacted to strengthen the ability of United States law enforcement and the intelligence community to work cohesively to combat terrorism. The Patriot Act contained sweeping anti-money laundering
and financial transparency laws which required various new regulations, including standards for verifying customer identification at account opening and rules to promote cooperation among financial institutions, regulators and law enforcement entities in identifying parties that may be involved in terrorism or money laundering. The Patriot Act required financial institutions to adopt new policies and procedures to combat money laundering and granted the Secretary of the Treasury broad authority to establish regulations and impose requirements and restrictions on financial institutions’ operations.
The Gramm-Leach-Bliley Act (GLB Act) adopted by Congress during 1999 expanded opportunities for banks and bank holding companies to provide services and engage in other revenue-generating activities that previously were prohibited to them. The GLB Act permitted bank holding companies to become “financial holding companies” and expanded activities in which banks and bank holding companies may participate, including opportunities to affiliate with securities firms and insurance companies. BancShares became a financial holding company during 2000.
Under Delaware law, BancShares is authorized to pay dividends declared by its Board of Directors, provided that no distribution results in its insolvency. The ability of FCB to pay dividends to BancShares is governed by North Carolina statutes and rules and regulations issued by regulatory authorities. Under federal law, and as an insured bank, FCB is prohibited from making any capital distributions, including paying a cash dividend, if it is, or after making the distribution it would become, “undercapitalized” as that term is defined in the Federal Deposit Insurance Act (FDIA).
BancShares is required to comply with the capital adequacy standards established by the FRB, and FCB is subject to capital adequacy standards established by the FDIC. The FRB and FDIC have promulgated risk-based capital and leverage capital guidelines for determining the adequacy of the capital of a bank holding company or a bank. All applicable capital standards must be satisfied for a bank holding company or a bank to be considered in compliance with these capital requirements.
Current federal law establishes a system of prompt corrective action to resolve the problems of undercapitalized banks. Under this system, the FDIC has established five capital categories (“well capitalized,” “adequately capitalized,” “undercapitalized,” “significantly undercapitalized,” and “critically undercapitalized”). The FDIC is required to take certain mandatory supervisory actions, and is authorized to take other discretionary actions, with respect to banks in the three undercapitalized categories.
Under the FDIC’s rules implementing the prompt corrective action provisions, an insured, state-chartered bank that has a total capital ratio of 10.0 percent or greater, a tier 1 capital ratio of 6.0 percent or greater, a leverage ratio of 5.0 percent or greater and is not subject to any written agreement, order, capital directive, or prompt corrective action directive issued by the FDIC, is considered to be “well-capitalized.” As of
December 31, 2013
, FCB is well-capitalized.
Under regulations of the FRB, all FDIC-insured banks must maintain daily reserves against their transaction accounts. Because required reserves must be maintained in the form of vault cash or in an account at a Federal Reserve Bank or with a qualified correspondent bank, the effect of the reserve requirement is to reduce the amount of FCB's assets that are available for lending or other investment activities.
With respect to acquired loans and other real estate that are subject to various loss share agreements, the FDIC also has responsibility for reviewing and approving various reimbursement claims we submit for losses or expenses we have incurred in conjunction with the resolution of acquired assets.
FCB is subject to the provisions of Section 23A of the Federal Reserve Act, which places limits on the amount of certain transactions with affiliate entities. The total amount of transactions with a single affiliate is limited to 10 percent of capital and surplus and, for all affiliates, to 20 percent of capital and surplus. Certain of the transactions among affiliates must also meet specified collateral requirements and must comply with other provisions of Section 23A designed to avoid transfers of low-quality assets between affiliates. FCB is also subject to the provisions of Section 23B of the Federal Reserve Act which, among other things, prohibits certain transactions with affiliates unless the transactions are on terms substantially the same, or at least as favorable, as those prevailing at the time for comparable transactions with nonaffiliated companies.
Under the Community Reinvestment Act, as implemented by regulations of the federal bank regulatory agencies, an insured bank has a continuing and affirmative obligation, consistent with safe and sound banking practices, to help meet the credit needs of its entire community, including low and moderate income neighborhoods.
FCIS is a registered broker-dealer and investment adviser. Broker-dealer activities are subject to regulation by the Financial Industry Regulatory Authority (FINRA), a self-regulatory organization to which the Securities and Exchange Commission (SEC) has delegated regulatory authority for broker-dealers, as well as by the state securities authorities of the various states in
7
which FCIS operates. Investment advisory activities are subject to direct regulation by the SEC, and investment advisory representatives must register with the state securities authorities of the various states in which they operate.
FCIS is also licensed as an insurance agency in connection with various investment products, such as annuities, that are regulated as insurance products. FCIS’ insurance sales activities are subject to concurrent regulation by securities regulators and by the insurance regulators of the various states in which FCIS conducts business.
Management is not aware of any further recommendations by regulatory authorities that, if implemented, would have or would be reasonably likely to have a material effect on liquidity, capital ratios or results of operations.
Available Information
BancShares does not have its own separate Internet website. However, FCB’s website (
www.firstcitizens.com
) includes a hyperlink to the SEC’s website where the public may obtain copies of BancShares’ annual reports on Form 10-K, quarterly reports on 10-Q, current reports on Form 8-K, and amendments to those reports, free of charge, as soon as reasonably practicable after they are electronically filed with or furnished to the SEC. Interested parties may also directly access the SEC’s website that contains reports and other information that BancShares files electronically with the SEC. The address of the SEC’s website is
www.sec.gov
.
8
The risks and uncertainties that management believes are material are described below. The risks listed are not the only risks that BancShares faces. Additional risks and uncertainties that are not currently known or that management does not currently deem to be material could also have a material adverse impact on our financial condition, the results of our operations or our business. If such risks and uncertainties were to become reality or the likelihood of those risks were to increase, the market price of our common stock could decline significantly.
Unfavorable economic conditions could adversely affect our business
BancShares’ business is subject to periodic fluctuations based on national, regional and local economic conditions. These fluctuations are not predictable, cannot be controlled, and may have a material adverse impact on BancShares’ operations and financial condition. BancShares’ banking operations are locally oriented and community-based. Accordingly, BancShares expects to continue to be dependent upon local business conditions as well as conditions in the local residential and commercial real estate markets it serves. Unfavorable changes in unemployment, real estate values, interest rates and other factors, could weaken the economies of the communities BancShares serves. Weakness in BancShares’ market area could have an adverse impact on our earnings, and consequently our financial condition and capital adequacy.
Weakness in real estate markets and exposure to junior liens have adversely impacted our business and our results of operations and may continue to do so
Real property collateral values have declined due to weaknesses in real estate sales activity. That risk, coupled with delinquencies and losses on various loan products caused by high rates of unemployment and underemployment, has resulted in losses on loans that, while adequately collateralized at the time of origination, are no longer fully secured. Our continuing exposure to under-collateralization is concentrated in our non-commercial revolving mortgage loan portfolio. Approximately two-thirds of the revolving mortgage portfolio is secured by junior lien positions and lower real estate values for collateral underlying these loans has, in many cases, caused the outstanding balance of the senior lien to exceed the value of the collateral, resulting in a junior lien loan that is in effect unsecured. A large portion of our losses within the revolving mortgage portfolio has arisen from junior lien loans due to inadequate collateral values.
Further declines in collateral values, unfavorable economic conditions and sustained high rates of unemployment could result in greater delinquency, write-downs or charge-offs in future periods, which could have a material adverse impact on our results of operations and capital adequacy.
Accounting for acquired assets may result in earnings volatility
Fair value discounts that are recorded at the time an asset is acquired are accreted into interest income based on accounting principles generally accepted in the United States of America. The rate at which those discounts are accreted is unpredictable, the result of various factors including prepayments and credit quality improvements. Post-acquisition deterioration results in the recognition of provision expense and allowance for loan and lease losses. Additionally, the income statement impact of adjustments to the indemnification asset may occur over a shorter period of time than the adjustments to the covered assets.
Fair value discount accretion, post-acquisition impairment and adjustments to the indemnification asset may result in significant volatility in our earnings. Volatility in earnings could unfavorably influence investor interest in our common stock thereby depressing the market value of our stock and the market capitalization of our company.
Reimbursements under loss share agreements are subject to FDIC oversight and interpretation and contractual term limitations
The FDIC-assisted transactions include loss share agreements that provide significant protection to FCB from the exposures to prospective losses on certain assets. Generally, losses on single family residential loans are covered for ten years. All other loans are generally covered for five years. During the third quarter of 2014, loss share protection will expire for non-single family residential loans acquired from Temecula Valley Bank and Venture Bank. During the first quarter of 2015, loss share protection will expire for non-single family residential loans acquired from First Regional Bank and Sun American Bank. Protection for all other covered assets extends beyond December 31, 2015.
The loss share agreements impose certain obligations on us, including obligations to manage covered assets in a manner consistent with prudent business practices and in accordance with the procedures and practices that we customarily use for assets that are not covered by loss share agreements. We are required to report detailed loan level information and file requests
9
for reimbursement of covered losses and expenses on a quarterly basis. In the event of noncompliance, delay or disallowance of some or all of our rights under those agreements could occur, including the denial of reimbursement for losses and related collection costs. Certain loss share agreements contain contingencies that require that we pay the FDIC in the event aggregate losses are less than a pre-determined amount.
Loans and leases covered under loss share agreements represent
7.8 percent
of total loans and leases as of
December 31, 2013
. As of
December 31, 2013
, we expect to receive cash payments from the FDIC totaling
$38.4 million
over the remaining lives of the respective loss share agreements, exclusive of
$109.4 million
we will owe the FDIC for settlement of the contingent payments.
The loss share agreements are subject to differing interpretations by the FDIC and FCB and disagreements may arise regarding coverage of losses, expenses and contingencies. Additionally, losses that are currently projected to occur during the loss share term may not occur until after the expiration of the applicable agreement and those losses could have a material impact on results of operations in future periods. The carrying value of the FDIC receivable includes only those losses that we project to occur during the loss share period and for which we believe we will receive reimbursement from the FDIC at the applicable reimbursement rate.
Merger integration may be disruptive
On January 1, 2014, 1st Financial Services Corporation (1st Financial) was merged into FCB. During the second quarter of 2014, FCB will convert the 1st Financial systems to FCB systems. Complications in the conversion of operating systems, data processing systems and products may result in the loss of customers, damage to our reputation, operational problems, one-time costs currently not anticipated, or reduced cost savings resulting from the merger. The integration could result in higher than expected deposit attrition, loss of key employees, disruption of our business or otherwise adversely affect our ability to maintain relationships with customers and employees or achieve the anticipated benefits of the acquisition.
We are subject to extensive oversight and regulation that continues to change
We and FCB are subject to extensive federal and state banking laws and regulations. These laws and regulations focus on the protection of depositors, federal deposit insurance funds and the banking system as a whole rather than the protection of security holders. Federal and state banking regulators possess broad powers to take supervisory actions as they deem appropriate. These supervisory actions may result in higher capital requirements, higher deposit insurance premiums, increased expenses, reductions in fee income and limitations on activities that could have a material adverse effect on our results of operations.
In July 2013, Bank regulatory agencies approved new global regulatory capital guidelines (Basel) aimed at strengthening existing capital requirements for bank holding companies through a combination of higher minimum capital requirements, new capital conservation buffers and more conservative definitions of capital and balance sheet exposure. BancShares will be under the new requirements effective January 1, 2015, subject to a transition period for several aspects of the rule. When fully implemented in January 2019, we will be required to maintain a ratio of common equity tier 1 capital to risk-weighted assets of at least 4.5 percent and a common equity tier 1 capital conservation buffer of 2.5 percent of risk-weighted assets, totaling 7.0 percent. The rule also raises the minimum ratio of tier 1 capital to risk-weighted assets from 4.0 percent to 6.0 percent and includes a minimum leverage ratio of 4.0 percent.
The Dodd-Frank Act instituted significant changes to the overall regulatory framework for financial institutions, including the creation of the Consumer Financial Protection Bureau. Additionally, trust preferred securities that currently qualify as tier 1 capital will be fully disallowed by January 1, 2016.
We encounter significant competition
We compete with other banks and specialized financial service providers in our market areas. Our primary competitors include local, regional and national banks, credit unions, commercial finance companies, various wealth management providers,
independent and captive insurance agencies, mortgage companies and non-bank providers of financial services. Some of our larger competitors, including banks that have a significant presence in our market areas, have the capacity to offer products and services we do not offer. Some of our competitors operate in a regulatory environment that is less stringent than the one in which we operate, and certain competitors are not subject to federal and state income taxes. The fierce competitive pressure that we face adversely affects pricing for many of our products and services.
10
Our financial condition could be adversely affected by the soundness of other financial institutions
Financial services institutions are interrelated as a result of trading, clearing, counterparty or other relationships. We have exposure to numerous financial service providers, including banks, brokers and dealers in securities and other financial service providers. Transactions with other financial institutions expose us to credit risk in the event of counterparty default.
We are subject to interest rate risk
Our results of operations and cash flows are highly dependent upon net interest income. Interest rates are sensitive to economic and market conditions that are beyond our control, including the actions of the Federal Reserve Board’s Federal Open Market Committee. Changes in monetary policy could influence interest income and interest expense as well as the fair value of our financial assets and liabilities. If changes in interest rates on our interest-earning assets are not equal to the changes in interest rates on our interest-bearing liabilities, our net interest income and, therefore, our net income could be adversely impacted.
Although we maintain an interest rate risk monitoring system, the forecasts of future net interest income are estimates and may be inaccurate. Actual interest rate movements may differ from our forecasts, and unexpected actions by the Federal Open Market Committee may have a direct impact on market interest rates.
Our deposit base represents our primary source of core funding and balance sheet liquidity. We normally have the ability to stimulate core deposit growth through reasonable and effective pricing strategies. However, in circumstances where our ability to generate needed liquidity is impaired, we need access to noncore funding such as borrowings from the Federal Home Loan Bank and the Federal Reserve, Federal Funds purchased and brokered deposits. While we maintain access to noncore funding sources, we are dependent on the availability of collateral and the counterparty’s willingness and ability to lend.
We face significant operational risks in our businesses
Our ability to adequately conduct and grow our business is dependent on our ability to create and maintain an appropriate operational and organizational control infrastructure. Operational risk can arise in numerous ways, including employee fraud, customer fraud and control lapses in bank operations and information technology. Our dependence on our employees, automated systems and those systems maintained by third parties, to record and process transactions may further increase the risk that technical failures or tampering of those systems will result in losses that are difficult to detect. We are subject to disruptions of our operating systems arising from events that are wholly or partially beyond our control. Failure to maintain an appropriate operational infrastructure can lead to loss of service to customers, legal actions and noncompliance with various laws and regulations.
Our business could suffer if we fail to attract and retain skilled employees
FCB's success depends primarily on our ability to attract and retain key employees. Competition is intense for employees who we believe will be successful in developing and attracting new business and/or managing critical support functions for FCB. We may not be able to hire the best employees or retain them for an adequate period of time after their hire date.
We are subject to information security risks
We maintain and transmit large amounts of sensitive information electronically, including personal and financial information of our customers. In addition to our own systems, we also rely on external vendors to provide certain services and are, therefore,
exposed to their information security risk. While we seek to mitigate internal and external information security risks, the volume of business conducted through electronic devices continues to grow, and our computer systems and network infrastructure, as well as the systems of external vendors and customers, present security risks and could be susceptible to hacking or identity theft.
We are also subject to risks arising from a broad range of attacks by doing business on the Internet, which arise from both domestic and international sources and seek to obtain customer information for fraudulent purposes or, in some cases, to disrupt business activities. Information security risks could result in reputational damage and lead to a material adverse impact on our business, financial condition and financial results of operations.
11
We continue to encounter technological change for which we expect to incur significant expense
The financial services industry continues to experience an increase in technological complexity required to provide a competitive array of products and services to customers. Our future success requires that we maintain technology and associated facilities that will support our ability to provide products and services that satisfactorily meet the banking and other financial needs of our customers. In 2013, we undertook projects to modernize our systems and associated facilities, strengthen our business continuity and disaster recovery efforts and reduce operational risk. The projects will be implemented in phases over the next several years. The magnitude and scope of these projects is significant with total costs estimated to exceed $100 million. If the projects’ objectives are not achieved or if the cost of the projects is materially in excess of the estimate, our business, financial condition and financial results could be adversely impacted.
We rely on external vendors
Third party vendors provide key components of our business infrastructure, including certain data processing and information services. A number of our vendors are large national entities with dominant market presence in their respective fields, and their services could be difficult to quickly replace in the event of failure or other interruption in service. Failures of certain vendors to provide services for any reason could adversely affect our ability to deliver products and services to our customers. External vendors also present information security risk. We monitor vendor risks, including the financial stability of critical vendors. The failure of a critical external vendor could disrupt our business and cause us to incur significant expense.
We use accounting estimates in the preparation of our financial statements
The preparation of our financial statements in conformity with accounting principles generally accepted in the United States of America requires management to make estimates that affect the financial statements. Significant estimates include the allowance for loan and lease losses, the fair values of acquired loans and other real estate owned (OREO) at acquisition date and cash flow projections in subsequent periods, pension plan assumptions, and the related receivable from and payable to the FDIC for loss share agreements. Due to the uncertainty of the circumstances relating to these estimates, we may experience more adverse outcomes than originally estimated. The allowance for loan and lease losses may need to be significantly increased based on future events. The actual losses or expenses on loans or the losses or expenses not covered under the FDIC agreements may differ from the recorded amounts, resulting in charges that could materially affect our results of operations.
Accounting standards may change
The Financial Accounting Standards Board and the Securities and Exchange Commission periodically modify the standards that govern the preparation of our financial statements. The nature of these changes is not predictable and could impact how we record transactions in our financial statements, which could lead to material changes in assets, liabilities, shareholders’ equity, revenues, expenses and net income. In some cases, we could be required to apply new or revised standards retroactively, resulting in changes to previously-reported financial results or a cumulative adjustment to retained earnings. Application of new accounting rules or standards could require us to implement costly technology changes.
Our ability to grow is contingent on capital adequacy
Based on existing capital levels, BancShares and FCB are well-capitalized under current leverage and risk-based capital standards. Our prospective ability to grow is contingent on our ability to generate sufficient capital to remain well-capitalized under current and future capital adequacy guidelines.
Historically, our primary capital sources have been retained earnings and debt issued through both private and public markets including trust preferred securities and subordinated debt. Beginning January 1, 2015, provisions of the Dodd-Frank Act eliminate 75 percent of our trust preferred capital securities from tier 1 capital with the remaining 25 percent phased out January 1, 2016.
Rating agencies regularly evaluate our creditworthiness and assign credit ratings to our debt and the debt of FCB. The ratings of the agencies are based on a number of factors, some of which are outside our control. In addition to factors specific to our financial strength and performance, the rating agencies also consider conditions generally affecting the financial services industry. There can be no assurance that we will maintain our current credit ratings. Rating reductions could adversely affect our access to funding sources and the cost of obtaining funding.
12
The market price of our stock may be volatile
Although publicly traded, our common stock has less liquidity and public float than other large publicly traded financial services companies as well as companies listed on the NASDAQ National Market System. Low liquidity increases the price volatility of our stock and could make it difficult for our shareholders to sell or buy our common stock at specific prices.
Excluding the impact of liquidity, the market price of our common stock can fluctuate widely in response to other factors including expectations of operating results, actual operating results, actions of institutional shareholders, speculation in the press or the investment community, market perception of acquisitions, rating agency upgrades or downgrades, stock prices of other companies that are similar to us, general market expectations related to the financial services industry and the potential impact of government actions affecting the financial services industry.
BancShares relies on dividends from FCB
As a financial holding company, BancShares is a separate legal entity from FCB. BancShares derives considerable revenue and cash flow from dividends paid by FCB. The cash flow from these dividends is the primary source that allows BancShares to pay dividends on its common stock and interest and principal on its debt obligations. North Carolina state law limits the amount of dividends that FCB may pay to BancShares. In the event FCB is unable to pay dividends to BancShares for an extended period of time, BancShares may not be able to service its debt obligations or pay dividends on its common stock.
Our recorded goodwill may become impaired
As of
December 31, 2013
, we had
$102.6 million
of goodwill recorded as an asset on our balance sheet. We test goodwill for impairment at least annually, and the impairment test compares the estimated fair value of a reporting unit with its net book value. We also test goodwill for impairment when certain events occur, such as a significant decline in our expected future cash flows, a significant adverse change in the business climate or a sustained decline in the price of our common stock. These
tests may result in a write-off of goodwill deemed to be impaired, which could have a significant impact on our results of
operations, but would not impact our capital ratios since capital ratios are calculated using tangible capital amounts.
As of
December 31, 2013
, FCB operated branch offices at
397
locations in North Carolina, Virginia, West Virginia, Maryland, Tennessee, Florida, Georgia, Texas, Arizona, California, New Mexico, Colorado, Oregon, Washington, Oklahoma, Kansas, Missouri and Washington, DC. FCB owns many of the buildings and leases other facilities from third parties.
BancShares' headquarters facility, a nine-story building with approximately 163,000 square feet, is located in suburban Raleigh, North Carolina. In addition, we occupy a separate facility in Raleigh that serves as our data and operations center.
Additional information relating to premises, equipment and lease commitments is set forth in Note E of BancShares’ Notes to Consolidated Financial Statements.
BancShares and various subsidiaries have been named as defendants in various legal actions arising from our normal business activities in which damages in various amounts are claimed. Although the amount of any ultimate liability with respect to those other matters cannot be determined, in the opinion of management, any such liability will not have a material effect on BancShares’ consolidated financial statements.
13
BancShares has two classes of common stock—Class A common and Class B common. Shares of Class A common have one vote per share, while shares of Class B common have 16 votes per share. BancShares’ Class A common stock is listed on the NASDAQ Global Select Market under the symbol FCNCA. The Class B common stock is traded on the over-the-counter market and quoted on the OTC Bulletin Board under the symbol FCNCB. As of
December 31, 2013
, there were
1,617
holders of record of the Class A common stock and
286
holders of record of the Class B common stock. The market for Class B common stock is extremely limited. On many days, there is no trading and, to the extent there is trading, it is generally low in volume.
The average monthly trading volume for the Class A common stock was 196,133 shares for the fourth quarter of
December 31, 2013
, and 279,383 shares for the year ended
December 31, 2013
. The Class B common stock monthly trading volume averaged 2,133 shares in the fourth quarter of
December 31, 2013
, and 2,225 shares for the year ended
December 31, 2013
.
The per share cash dividends declared by BancShares on both the Class A and Class B common stock and the high and low sales prices for each quarterly period during
December 31, 2013
, and
December 31, 2012
, are set forth in the following table.
|
|
2013
|
2012
|
|||||||||||||||||||||||||||||
|
|
Fourth
quarter |
Third
quarter |
Second
quarter |
First
quarter |
Fourth
quarter |
Third
quarter |
Second
quarter |
First
quarter |
|||||||||||||||||||||||
|
Cash dividends (Class A and Class B)
|
$
|
0.30
|
|
$
|
0.30
|
|
$
|
0.30
|
|
$
|
0.30
|
|
$
|
0.30
|
|
$
|
0.30
|
|
$
|
0.30
|
|
$
|
0.30
|
|
|||||||
|
Class A sales price
|
|||||||||||||||||||||||||||||||
|
High
|
226.07
|
|
212.30
|
|
204.76
|
|
182.21
|
|
174.03
|
|
169.70
|
|
181.62
|
|
185.42
|
|
|||||||||||||||
|
Low
|
201.64
|
|
194.39
|
|
179.22
|
|
166.49
|
|
156.48
|
|
160.89
|
|
161.22
|
|
164.70
|
|
|||||||||||||||
|
Class B sales price
|
|||||||||||||||||||||||||||||||
|
High
|
211.84
|
|
199.39
|
|
192.46
|
|
174.18
|
|
167.69
|
|
179.34
|
|
182.99
|
|
183.98
|
|
|||||||||||||||
|
Low
|
185.38
|
|
181.69
|
|
171.20
|
|
162.88
|
|
158.00
|
|
159.41
|
|
161.11
|
|
172.75
|
|
|||||||||||||||
Sales prices for Class A common were obtained from the NASDAQ Global Select Market. Sales prices for Class B common were obtained from the OTC Bulletin Board.
A cash dividend of 30 cents per share was declared by the Board of Directors on January 28, 2014, payable on April 7, 2014, to holders of record as of March 17, 2014. Payment of dividends is made at the discretion of the Board of Directors and is contingent upon satisfactory earnings as well as projected future capital needs. BancShares’ principal source of liquidity for payment of shareholder dividends is the dividend it receives from FCB. FCB is subject to various requirements under federal and state banking laws that restrict the payment of dividends and its ability to lend to BancShares. Subject to the foregoing, it is currently management’s expectation that comparable cash dividends will continue to be paid in the future.
During the second quarter of 2013, our board granted authority to purchase up to 100,000 and 25,000 shares of Class A and Class B common stock, respectively, beginning on July 1, 2013, and continuing through June 30, 2014. As of
December 31, 2013
, no purchases had occurred pursuant to that authorization.
As of
December 31, 2013
, under the existing plan that expires June 30, 2014, BancShares had the ability to purchase 100,000 and 25,000 additional shares of Class A and Class B common stock, respectively.
During 2012, our Board of Directors granted authority and approved a plan to purchase up to 100,000 and 25,000 shares of Class A and Class B common stock, respectively, during the period from July 1, 2012, through June 30, 2013. That authority replaced similar plans approved by the Board during 2011 that were in effect during the twelve months preceding July 1, 2012. Pursuant to those plans, during 2012, we purchased and retired an aggregate of 56,276 shares of Class A common stock and 100 shares of Class B common stock. During 2013, BancShares purchased and retired 1,973 shares of Class A common stock pursuant to the July 1, 2012, authorization. Additionally, under separate authorizations, during 2012, BancShares purchased and retired 606,829 shares of Class B common stock in privately negotiated transactions, including purchases of 593,954 shares from a director and certain of her related interests. The purchase of these shares was approved by the Board of Directors at a price approved by an independent committee of the Board.
14
The following tables indicate that no shares of Class A or Class B common stock were purchased by BancShares during the
three months ended
December 31, 2013
. The tables also indicate the number of shares that may be purchased under publicly announced plans.
|
Class A common stock
|
Total number of shares purchases
|
Average price paid
per share
|
Total number of
shares purchased
as part of publicly
announced plans
or programs
|
Maximum number
of shares that may
yet be purchased
under the plans or
programs
|
||||||||
|
Purchases from October 1, 2013, through October 31, 2013
|
—
|
|
$
|
—
|
|
—
|
|
100,000
|
|
|||
|
Purchases from November 1, 2013, through November 30, 2013
|
—
|
|
—
|
|
—
|
|
100,000
|
|
||||
|
Purchases from December 1, 2013, through December 31, 2013
|
—
|
|
—
|
|
—
|
|
100,000
|
|
||||
|
Total
|
—
|
|
$
|
—
|
|
—
|
|
100,000
|
|
|||
|
Class B common stock
|
||||||||||||
|
Purchases from October 1, 2013, through October 31, 2013
|
—
|
|
$
|
—
|
|
—
|
|
25,000
|
|
|||
|
Purchases from November 1, 2013, through November 30, 2013
|
—
|
|
—
|
|
—
|
|
25,000
|
|
||||
|
Purchases from December 1, 2013, through December 31, 2013
|
—
|
|
—
|
|
—
|
|
25,000
|
|
||||
|
Total
|
—
|
|
$
|
—
|
|
—
|
|
25,000
|
|
|||
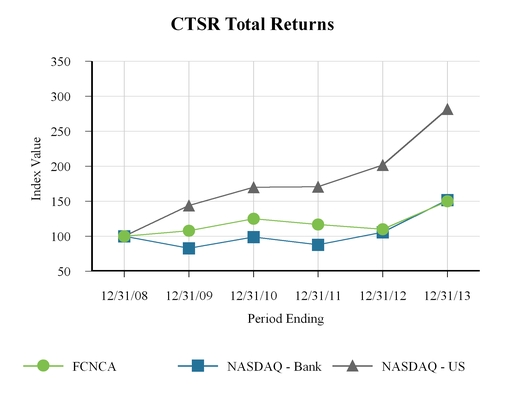
The following graph compares the cumulative total shareholder return (CTSR) of our Class A common stock during the previous five years with the CTSR over the same measurement period of the Nasdaq-Banks Index and the Nasdaq-U.S. Index. Each trend line assumes that $100 was invested on December 31, 2008, and that dividends were reinvested for additional shares.
15
Table 1
FINANCIAL SUMMARY AND SELECTED AVERAGE BALANCES AND RATIOS
FINANCIAL SUMMARY AND SELECTED AVERAGE BALANCES AND RATIOS
|
2013
|
2012
|
2011
|
2010
|
2009
|
|||||||||||||||
|
(dollars in thousands, except share data)
|
|||||||||||||||||||
|
SUMMARY OF OPERATIONS
|
|||||||||||||||||||
|
Interest income
|
$
|
796,804
|
|
$
|
1,004,836
|
|
$
|
1,015,159
|
|
$
|
969,368
|
|
$
|
738,159
|
|
||||
|
Interest expense
|
56,618
|
|
90,148
|
|
144,192
|
|
195,125
|
|
227,644
|
|
|||||||||
|
Net interest income
|
740,186
|
|
914,688
|
|
870,967
|
|
774,243
|
|
510,515
|
|
|||||||||
|
Provision for loan and lease losses
|
(32,255
|
)
|
142,885
|
|
232,277
|
|
143,519
|
|
79,364
|
|
|||||||||
|
Net interest income after provision for loan and lease losses
|
772,441
|
|
771,803
|
|
638,690
|
|
630,724
|
|
431,151
|
|
|||||||||
|
Gains on acquisitions
|
—
|
|
—
|
|
150,417
|
|
136,000
|
|
104,434
|
|
|||||||||
|
Noninterest income
|
263,603
|
|
189,300
|
|
313,949
|
|
270,214
|
|
299,017
|
|
|||||||||
|
Noninterest expense
|
771,380
|
|
766,933
|
|
792,925
|
|
733,376
|
|
651,503
|
|
|||||||||
|
Income before income taxes
|
264,664
|
|
194,170
|
|
310,131
|
|
303,562
|
|
183,099
|
|
|||||||||
|
Income taxes
|
96,965
|
|
59,822
|
|
115,103
|
|
110,518
|
|
66,768
|
|
|||||||||
|
Net income
|
$
|
167,699
|
|
$
|
134,348
|
|
$
|
195,028
|
|
$
|
193,044
|
|
$
|
116,331
|
|
||||
|
Net interest income, taxable equivalent
|
$
|
742,846
|
|
$
|
917,664
|
|
$
|
874,727
|
|
$
|
778,382
|
|
$
|
515,446
|
|
||||
|
PER SHARE DATA
|
|||||||||||||||||||
|
Net income
|
$
|
17.43
|
|
$
|
13.11
|
|
$
|
18.80
|
|
$
|
18.50
|
|
$
|
11.15
|
|
||||
|
Cash dividends
|
1.20
|
|
1.20
|
|
1.20
|
|
1.20
|
|
1.20
|
|
|||||||||
|
Market price at period end (Class A)
|
222.63
|
|
163.50
|
|
174.99
|
|
189.05
|
|
164.01
|
|
|||||||||
|
Book value at period end
|
215.89
|
|
193.75
|
|
180.97
|
|
166.08
|
|
149.42
|
|
|||||||||
|
SELECTED PERIOD AVERAGE BALANCES
|
|||||||||||||||||||
|
Total assets
|
$
|
21,300,800
|
|
$
|
21,077,444
|
|
$
|
21,135,572
|
|
$
|
20,841,180
|
|
$
|
17,557,484
|
|
||||
|
Investment securities
|
5,206,000
|
|
4,698,559
|
|
4,215,761
|
|
3,641,093
|
|
3,412,620
|
|
|||||||||
|
Loans and leases (acquired and originated)
|
13,163,743
|
|
13,560,773
|
|
14,050,453
|
|
13,865,815
|
|
12,062,954
|
|
|||||||||
|
Interest-earning assets
|
19,433,947
|
|
18,974,915
|
|
18,824,668
|
|
18,458,160
|
|
15,846,514
|
|
|||||||||
|
Deposits
|
17,947,996
|
|
17,727,117
|
|
17,776,419
|
|
17,542,318
|
|
14,578,868
|
|
|||||||||
|
Interest-bearing liabilities
|
13,910,299
|
|
14,298,026
|
|
15,044,889
|
|
15,235,253
|
|
13,013,237
|
|
|||||||||
|
Long-term obligations
|
462,203
|
|
574,721
|
|
766,509
|
|
885,145
|
|
753,242
|
|
|||||||||
|
Shareholders' equity
|
$
|
1,942,108
|
|
$
|
1,915,269
|
|
$
|
1,811,520
|
|
$
|
1,672,238
|
|
$
|
1,465,953
|
|
||||
|
Shares outstanding
|
9,618,952
|
|
10,244,472
|
|
10,376,445
|
|
10,434,453
|
|
10,434,453
|
|
|||||||||
|
SELECTED PERIOD-END BALANCES
|
|||||||||||||||||||
|
Total assets
|
$
|
21,199,091
|
|
$
|
21,283,652
|
|
$
|
20,997,298
|
|
$
|
20,806,659
|
|
$
|
18,466,063
|
|
||||
|
Investment securities
|
5,388,610
|
|
5,227,570
|
|
4,058,245
|
|
4,512,608
|
|
2,932,765
|
|
|||||||||
|
Loans and leases:
|
|||||||||||||||||||
|
Acquired
|
1,029,426
|
|
1,809,235
|
|
2,362,152
|
|
2,007,452
|
|
1,173,020
|
|
|||||||||
|
Originated
|
12,104,298
|
|
11,576,115
|
|
11,581,637
|
|
11,480,577
|
|
11,644,999
|
|
|||||||||
|
Interest-earning assets
|
19,428,929
|
|
19,142,433
|
|
18,529,548
|
|
18,487,960
|
|
16,541,425
|
|
|||||||||
|
Deposits
|
17,874,066
|
|
18,086,025
|
|
17,577,274
|
|
17,635,266
|
|
15,337,567
|
|
|||||||||
|
Interest-bearing liabilities
|
13,654,436
|
|
14,213,751
|
|
14,548,389
|
|
15,015,446
|
|
13,561,924
|
|
|||||||||
|
Long-term obligations
|
510,769
|
|
444,921
|
|
687,599
|
|
809,949
|
|
797,366
|
|
|||||||||
|
Shareholders' equity
|
$
|
2,076,675
|
|
$
|
1,864,007
|
|
$
|
1,861,128
|
|
$
|
1,732,962
|
|
$
|
1,559,115
|
|
||||
|
Shares outstanding
|
9,618,941
|
|
9,620,914
|
|
10,284,119
|
|
10,434.453
|
|
10,434.453
|
|
|||||||||
|
SELECTED RATIOS AND OTHER DATA
|
|||||||||||||||||||
|
Rate of return on average assets (annualized)
|
0.79
|
%
|
0.64
|
%
|
0.92
|
%
|
0.93
|
%
|
0.66
|
%
|
|||||||||
|
Rate of return on average shareholders' equity (annualized)
|
8.63
|
|
7.01
|
|
10.77
|
|
11.54
|
|
7.94
|
|
|||||||||
|
Net yield on interest-earning assets (taxable equivalent)
|
3.82
|
|
4.84
|
|
4.65
|
|
4.22
|
|
3.25
|
|
|||||||||
|
Allowance for loan and lease losses to total loans and leases:
|
|||||||||||||||||||
|
Acquired
|
5.20
|
|
7.74
|
|
3.78
|
|
2.55
|
|
0.30
|
|
|||||||||
|
Originated
|
1.49
|
|
1.55
|
|
1.56
|
|
1.54
|
|
1.45
|
|
|||||||||
|
Nonperforming assets to total loans and leases and other real estate at period end:
|
|||||||||||||||||||
|
Acquired
|
7.02
|
|
9.26
|
|
17.95
|
|
12.87
|
|
16.59
|
|
|||||||||
|
Originated
|
0.74
|
|
1.15
|
|
0.89
|
|
1.14
|
|
0.85
|
|
|||||||||
|
Tier 1 risk-based capital ratio
|
14.92
|
|
14.27
|
|
15.41
|
|
14.86
|
|
13.34
|
|
|||||||||
|
Total risk-based capital ratio
|
16.42
|
|
15.95
|
|
17.27
|
|
16.95
|
|
15.59
|
|
|||||||||
|
Leverage capital ratio
|
9.82
|
|
9.23
|
|
9.90
|
|
9.18
|
|
9.54
|
|
|||||||||
|
Dividend payout ratio
|
6.88
|
|
9.15
|
|
6.38
|
|
6.49
|
|
10.76
|
|
|||||||||
|
Average loans and leases to average deposits
|
73.34
|
|
76.50
|
|
79.04
|
|
79.04
|
|
82.74
|
|
|||||||||
Average loan and lease balances include nonaccrual loans and leases. See discussion of issues affecting comparability of financial statements under the caption FDIC-Assisted Transactions.
16
Management’s discussion and analysis of earnings and related financial data are presented to assist in understanding the financial condition and results of operations of First Citizens BancShares, Inc. and Subsidiaries (BancShares). This discussion and analysis should be read in conjunction with the audited consolidated financial statements and related notes presented within this report. Intercompany accounts and transactions have been eliminated. Although certain amounts for prior years have been reclassified to conform to statement presentations for
2013
, the reclassifications have no material effect on shareholders’ equity
or net income as previously reported. Unless otherwise noted, the terms "we," "us" and "BancShares" refer to the consolidated financial position and consolidated results of operations for BancShares.
CRITICAL ACCOUNTING POLICIES
The accounting and reporting policies of BancShares are in accordance with accounting principles generally accepted in the United States of America (GAAP) and conform to general practices within the banking industry. The preparation of financial statements in conformity with GAAP requires management to make estimates and assumptions to arrive at the carrying value of assets and liabilities and amounts reported for revenues and expenses. Our financial position and results of operations can be materially affected by these estimates and assumptions. Critical accounting policies are those policies that are most important to the determination of our financial condition and results of operations or that require management to make assumptions and estimates that are subjective or complex. The most critical accounting and reporting policies include those related to the allowance for loan and lease losses, fair value estimates, the receivable from and payable to the FDIC for loss share agreements, pension plan assumptions and income taxes. Significant accounting policies are discussed in Note A of the Notes to Consolidated Financial Statements.
The following is a summary of our critical accounting policies that are material to our consolidated financial statements and are highly dependent on estimates and assumptions.
Allowance for loan and lease losses.
The allowance for loan and lease losses (ALLL) reflects the estimated losses resulting from the inability of our customers to make required loan and lease payments. The ALLL is based on management's evaluation of the risk characteristics of the loan and lease portfolio under current economic conditions and considers such factors as the financial condition of the borrower, fair market value of collateral and other items that, in our opinion, deserve current recognition in estimating possible loan and lease losses. Our evaluation process is based on historical evidence and current trends among delinquencies, defaults and nonperforming assets.
During 2013, we implemented enhancements to our modeling methodology for estimating the general reserve component of the ALLL. Specifically for the originated commercial loans and leases segment, we refined our modeling methodology by increasing the granularity of the historical net loss data used to develop the applicable loss rates by utilizing information that further considers the class of the commercial loan and associated risk rating. For the originated noncommercial segment, we refined our modeling methodology to incorporate specific loan classes and delinquency status trends into the loss rates. The enhanced ALLL estimates implicitly include the risk of draws on open lines within each loan class. Management has also further enhanced a qualitative framework for considering economic conditions, loan concentrations and other relevant factors at a loan class level. We believe the methodology enhancements improve the application of historical net loss data and the precision of our segment analysis. These enhancements resulted in reallocations between segments, allocation of the nonspecific allowance to specific loan classes and reallocation of substantially all of the reserve for unfunded commitments into the ALLL. Other than these modifications, the enhancements to the methodology had no material impact on the ALLL.
Acquired loans are recorded at fair value at acquisition date. Amounts deemed uncollectible at acquisition date become part of the fair value calculation and are excluded from the ALLL. Following acquisition, we routinely review acquired loans to determine if changes in estimated cash flows have occurred. Subsequent decreases in the amount expected to be collected may result in a provision for loan and lease losses with a corresponding increase in the ALLL. Subsequent increases in the amount expected to be collected result in a reversal of any previously recorded provision for loan and lease losses and related ALLL, if any, or prospective adjustment to the accretable yield if no provision for loan and lease losses had been recorded. Proportional adjustments are also recorded to the FDIC receivable for acquired loans if the timing of the projected loss will result in the loss being covered by loss share agreements.
Management continuously monitors and actively manages the credit quality of the entire loan portfolio and recognizes provision expense to maintain the allowance at an appropriate level. Specific allowances for impaired loans are determined by analyzing estimated cash flows discounted at a loan's original rate or collateral values in situations where we believe repayment is dependent on collateral liquidation. Substantially all impaired loans are collateralized by real property.
17
Management considers the established allowance adequate to absorb losses that relate to loans and leases outstanding at
December 31, 2013
, although future additions may be necessary based on changes in economic conditions, collateral values, erosion of the borrower's access to liquidity and other factors. If the financial condition of our borrowers were to deteriorate, resulting in an impairment of their ability to make payments, our estimates would be updated and additions to the allowance may be required. In addition, various regulatory agencies, as an integral part of their examination process, periodically review the allowance for loan and lease losses. These agencies may require the recognition of additions to the allowance based on their judgments of information available to them at the time of their examination.
Fair value estimates.
BancShares reports investment securities available for sale and interest rate swaps accounted for as cash flow hedges at fair value. At
December 31, 2013
, the percentage of total assets and total liabilities measured at fair value on a recurring basis was
25.4 percent
and less than 1.0 percent, respectively. The fair values of assets and liabilities carried at fair value on a recurring basis are estimated using various model-based valuation techniques. At
December 31, 2013
, no assets or liabilities measured at fair value on a recurring basis were based on significant nonobservable inputs. Certain other assets are reported at fair value on a nonrecurring basis, including loans held for sale, impaired loans and other real estate owned (OREO). See Note L “Estimated Fair Values” in the Notes to Consolidated Financial Statements for additional disclosures regarding fair value.
As required under GAAP, the assets acquired and liabilities assumed in our FDIC-assisted transactions were recognized at their fair values as of the acquisition date. Fair values were determined using valuation methods and assumptions established by management. Use of different assumptions and methods could yield significantly different fair values. Cash flow estimates for loans, leases and OREO were based on judgments regarding future expected loss experience, which included the use of commercial loan credit grades, collateral valuations and current economic conditions. The cash flows were discounted to fair value using rates that included consideration of factors such as current interest rates, costs to service the loans and liquidation of the asset.
Receivable from and payable to the FDIC for loss share agreements.
The receivable from the FDIC for loss share agreements is measured separately from the related covered assets and is recorded at fair value at the acquisition date using projected cash flows related to the loss share agreements based on the expected reimbursements for losses and expenses at the applicable loss share percentages. The receivable from the FDIC is reviewed and updated quarterly as loss estimates and timing of estimated cash flows related to covered loans and OREO change. Post-acquisition adjustments represent the net change in loss estimates related to covered loans and OREO as a result of changes in expected cash flows and the allowance for loan and lease losses related to covered loans. For loans covered by loss share agreements, subsequent decreases in the amount expected to be collected from the borrower or collateral liquidation may result in a provision for loan and lease losses, an increase in the allowance for loan and lease losses and a proportional adjustment to the FDIC receivable for the estimated amount to be reimbursed. Subsequent increases in the amount expected to be collected from the borrower or collateral liquidation result in the reversal of any previously recorded provision for loan and lease losses and related allowance for loan and lease losses, or prospective adjustment to the accretable yield if no provision for loan and lease losses had been recorded previously. Reversal of previously-established allowances result in immediate adjustments to the FDIC receivable to remove amounts that were expected to be reimbursed prior to the improvement. For improvements that increase accretable yield, the FDIC receivable is adjusted over the shorter of the remaining term of the loss share agreement or the life of the covered loan. Other adjustments to the FDIC receivable result from unexpected recoveries of amounts previously charged off, servicing costs that exceed initial estimates and changes to the estimated fair value of OREO.
Certain loss share agreements include clawback provisions that require payments to the FDIC if actual losses and expenses do not exceed a calculated amount. Our estimate of the clawback payments based on current loss and expense projections are recorded as an accrued liability. Projected cash flows are discounted to reflect the estimated timing of the payments to the FDIC.
Pension plan assumptions.
BancShares offers a defined benefit pension plan to qualifying employees. The calculation of the benefit obligation, the future value of plan assets, funded status and related pension expense under the pension plan requires the use of actuarial valuation methods and assumptions. The valuations and assumptions used to determine the future value of plan assets and liabilities are subject to management judgment and may differ significantly depending upon the assumptions used. The discount rate used to estimate the present value of the benefits to be paid under the pension plan reflects the interest rate that could be obtained for a suitable investment used to fund the benefit obligation. For the calculation of pension expense, the assumed discount rate equaled
4.00 percent
during
2013
, and
4.75 percent
during
2012
. At December 31, 2013, BancShares increased the assumed discount rate on its pension liability to 4.90 percent due to higher long-term interest rates. This rate increase reduced BancShares' calculated benefit obligation as of December 31, 2013, and will lower the 2014 pension expense.
18
We also estimate a long-term rate of return on pension plan assets that is used to estimate the future value of plan assets. We consider such factors as the actual return earned on plan assets, historical returns on the various asset classes in the plan and projections of future returns on various asset classes. The calculation of pension expense was based on an assumed expected long-term return on plan assets of
7.25 percent
during
2013
compared to
7.50 percent
in
2012
. A reduction in the long-term rate of return on plan assets increases pension expense for periods following the decrease in the assumed rate of return.
The assumed rate of future compensation increases is reviewed annually based on actual experience and future salary expectations. We used an assumed rate of compensation increase of
4.00 percent
to calculate pension expense during
2013
and
2012
. Assuming other variables remain unchanged, an increase in the rate of future compensation increases results in higher pension expense for periods following the increase in the assumed rate of future compensation increases.
Income taxes
. Management estimates income tax expense using the asset and liability method. Under this method, deferred tax assets and liabilities are recognized for future tax consequences attributable to differences between the amount of assets and liabilities reported in the consolidated financial statements and their respective tax bases. In estimating the liabilities and corresponding expense related to income taxes, management assesses the relative merits and risks of various tax positions considering statutory, judicial and regulatory guidance. Because of the complexity of tax laws and regulations, interpretation is difficult and subject to differing judgments. Accrued income taxes payable represents an estimate of the net amounts due to or from taxing jurisdictions based upon various estimates, interpretations and judgments.
We evaluate our effective tax rate on a quarterly basis based upon the current estimate of net income, the favorable impact of various credits, statutory tax rates expected for the year and the amount of tax liability in each jurisdiction in which we operate. Annually, we file tax returns with each jurisdiction where we have tax nexus and settle our return liabilities.
Changes in estimated income tax liabilities occur periodically due to changes in actual or estimated future tax rates and projections of taxable income, interpretations of tax laws, the complexities of multi-state income tax reporting, the status of examinations being conducted by various taxing authorities and the impact of newly enacted legislation or guidance as well as income tax accounting pronouncements.
19
EXECUTIVE OVERVIEW
BancShares’ earnings and cash flows are primarily derived from our commercial banking activities. We gather deposits from retail and commercial customers and secure funding through various non-deposit sources. We invest the liquidity generated from these funding sources in interest-earning assets, including loans and leases, investment securities and overnight investments. We also invest in bank premises, hardware, software, furniture and equipment used to conduct our commercial banking business. We provide treasury services products, cardholder and merchant services, wealth management services and various other products and services typically offered by commercial banks.
BancShares conducts its banking operations through its wholly-owned subsidiary First-Citizens Bank & Trust Company (FCB), a state-chartered bank organized under the laws of the state of North Carolina. Prior to 2011, BancShares also conducted banking activities through IronStone Bank (ISB), a federally-chartered thrift institution. On January 7, 2011, ISB was merged into FCB.
Prior to 2009, we focused on organic growth, delivering our products and services to customers through
de novo
branch expansion. Beginning in 2009, leveraging on our strong capital and liquidity positions, we participated in six FDIC-assisted transactions involving distressed financial institutions. Each of the FDIC-assisted transactions include indemnification assets, or loss share agreements, that protect us from a substantial portion of the credit and asset quality risk we would otherwise incur. Under GAAP, acquired assets, assumed liabilities and the indemnification asset are recorded at their fair values as of the acquisition date. Subsequent to the acquisition date, the amortization and accretion of premiums and discounts, the recognition of post-acquisition improvement and deterioration and the related accounting for the loss share agreements with the FDIC have contributed to significant income statement volatility. During 2013, in the aggregate, the net impact of assets acquired in the FDIC-assisted transactions has been favorable to current earnings, as recoveries of amounts previously charged off, the reversal of previously-identified impairment and accretion income has exceeded the unfavorable amortization of the receivable from the FDIC for loss share agreements.
On January 1, 2014, FCB completed its merger with 1st Financial Services Corporation (1st Financial) and its wholly-owned banking subsidiary Mountain 1st Bank & Trust Company. In accordance with the acquisition method of accounting, all assets and liabilities were recorded at their fair value as of the acquisition date. As a result of the 1st Financial transaction, during the first quarter of 2014, FCB recorded loans with a fair value of
$316.3 million
, investment securities with a fair value of
$237.4 million
and other real estate with a fair value of
$11.6 million
. The fair value of deposits assumed totaled
$631.9 million
. FCB
paid
$10.0 million
to acquire 1st Financial, including
$8.0 million
to acquire the 1st Financial securities that had been issued under the Troubled Asset Relief Program. As a result of the merger, FCB recorded
$24.5 million
of goodwill. BancShares and FCB remain well-capitalized following the 1st Financial merger.
Various external factors influence the focus of our business efforts, and the results of our operations can change significantly based on those external factors. US economic conditions are improving, but unemployment rates remain high. The rate of economic growth increased during the second half of
2013
. Consumer confidence continues to improve, with consumer spending at the highest level of growth in three years. Continued growth in household net worth, driven by increases in home, stock and other asset values, is believed to have positively influenced consumer confidence. As a result of perceived strength in the economy, during December 2013, the Federal Reserve announced its decision to taper its bond-buying program in 2014.
We continue to experience downward pressure on net interest income, resulting from low interest rates and acquired loan
payoffs. While improvement in economic conditions contributed to originated loan growth during the second half of
2013
, the rapid reduction in our acquired loan portfolio resulted in a net reduction in gross loans during
2013
. Low interest rates and competitive loan and deposit pricing have led to narrow interest margins for our originated loan portfolio. The Federal Reserve's continuing efforts to stimulate economic growth has resulted in interest rates remaining at unprecedented low levels, and policymakers have indicated they intend to hold benchmark interest rates stable until 2015. The low interest rate environment and lack of growth continue to adversely affect net interest income.
Improving economic conditions and favorable real estate prices contributed to significant credit quality improvement during
2013
. Charge-offs among both acquired and originated loans declined during
2013
, and nonperforming assets and delinquencies declined from 2012. Despite these improvements, certain financially-distressed customers continue to experience difficulty meeting their debt service obligations.
20
Following a comprehensive evaluation of our core technology systems and related business processes during 2012, we concluded that significant investments were required to ensure we are able to meet changing business requirements and to support a growing organization. The project to modernize our systems and associated facilities began in 2013 with phased implementation scheduled through 2016. The project will improve our business continuity and disaster recovery efforts and will ultimately reduce operational risk. The magnitude and scope of this effort is significant with total costs estimated to exceed
$100 million.
During the evaluation of our business processes, we identified several services that we concluded were not critical to our long-term strategic objectives. During the first quarter of 2013, we sold our rights and most of our obligations under various service agreements with client banks, some of which are controlled by Related Persons. We continue to provide processing services to First Citizens Bank and Trust Company, Inc. (FCB-SC), an entity controlled by Related Persons and our largest client bank.
During 2013, we unveiled an advertising campaign that features a refreshed brand and updated company logo. Our new brand line, Forever First®, symbolizes our commitment to the people, businesses and communities who rely on us to be the best we can be. It is used in all our branches, in print advertising and for our online presence. In the Triangle and greater Charlotte areas of North Carolina, television, radio and outdoor advertising share our brand story. We have also developed two product bundles that are used to target specific customers. Your Family First was developed for financially-active families, while the Your Venture First package was developed for small business customers.
Our balance sheet liquidity position remains strong. While total deposits have seen little change, during the past 2 years, we have seen significant reductions in time deposits, largely offset by growth among demand and money market deposits. We believe that customers continue to desire the safety of bank deposits, but are not willing to invest in time deposits based on expectations that time deposit rates are likely to increase.
In an effort to assist customers experiencing financial difficulty, we have selectively agreed to modify existing loan terms to provide relief to customers who are experiencing liquidity challenges or other circumstances that could affect their ability to meet debt obligations. The majority of restructured loans (TDRs) are to customers that are currently performing under existing terms but may be unable to do so in the near future without a modification.
Financial institutions conti
nue to face challenges resulting from implementation of legislative and governmental reforms to stabilize the financial services industry and provide added consumer protection. In July 2013, Bank regulatory agencies approved new global regulatory capital guidelines (Basel) aimed at strengthening existing capital requirements for bank holding companies through a combination of higher minimum capital requirements, new capital conservation buffers and more conservative definitions of capital and balance sheet exposure. BancShares will be subject to the requirements of Basel effective January 1, 2015, subject to a transition period for several aspects of the rule.
Table 2
describes the minimum and well-capitalized requirements for the transitional period beginning during 2016 and the fully-phased-in requirements that become effective during 2019. As of
December 31, 2013
, BancShares' tier 1 common equity ratio, was
14.3 percent
, compared to the fully-phased in well-capitalized minimum of
9.0 percent
, which includes the
2.5 percent
minimum conservation buffer.
Table 2
BASEL CAPITAL REQUIREMENTS
|
Basel final rules
|
Basel minimum requirement
2016 |
Basel well capitalized
2016 |
Basel minimum requirement
2019 |
Basel well capitalized
2019 |
||
|
Leverage ratio
|
4.00%
|
5.00%
|
4.00%
|
5.00%
|
||
|
Common equity tier 1
|
4.50
|
6.50
|
4.50
|
6.50
|
||
|
Common equity plus conservation buffer
|
5.13
|
7.13
|
7.00
|
9.00
|
||
|
Tier 1 capital ratio
|
6.00
|
8.00
|
6.00
|
8.00
|
||
|
Total capital ratio
|
8.00
|
10.00
|
8.00
|
10.00
|
||
|
Total capital ratio plus conservation buffer
|
8.63
|
10.63
|
10.50
|
12.50
|
||
21
Although we are unable to control the external factors that influence our business, by maintaining high levels of balance sheet liquidity, prudently managing our interest rate exposures, ensuring our capital positions remain strong and actively monitoring asset quality, we seek
to minimize the potentially adverse risks of unforeseen and unfavorable economic trends and take advantage of favorable economic conditions and opportunities when appropriate.
EARNINGS SUMMARY
BancShares’ reported earnings for
2013
of
$167.7 million
, or
$17.43
per share, compared to
$134.3 million
, or
$13.11
per share during
2012
. The annualized returns on average assets and equity amounted to
0.79 percent
and
8.63 percent
, respectively, during
2013
, compared to
0.64 percent
and
7.01 percent
for
2012
. The increase in net income in
2013
was due to a reduction in the provision for loan and lease losses and higher noninterest income, partially offset by lower net interest income.
Net interest income decreased
$174.5 million
from
$914.7 million
in
2012
to
$740.2 million
in
2013
, primarily due to acquired loan shrinkage resulting in lower accretion income. The taxable-equivalent net yield on interest-earning assets decreased
102
basis points from
4.84 percent
in
2012
to
3.82 percent
in
2013
. Lower accreted loan discounts resulting from payments on acquired loans significantly impacted the taxable-equivalent net yield on interest-earning assets during
2013
and
2012
. Accretion income will continue to decrease in future periods as acquired loan balances continue to decline.
BancShares recorded a
$32.3 million
credit to provision for loan and lease losses during
2013
, compared to provision expense of
$142.9 million
during
2012
. Provision expense declined for both acquired loans and originated loans during
2013
. The credit to provision expense related to acquired loans totaled
$51.5 million
during
2013
, compared to provision expense of
$100.8 million
during
2012
, a
$152.4 million
favorable change. The significant reduction in provision expense for acquired loans resulted from lower current impairment, credit quality improvements and payoffs of acquired loans for which an allowance had previously been established. Provision expense for originated loans totaled
$19.3 million
during
2013
, compared to
$42.0 million
during
2012
, a reduction of
$22.8 million
, resulting from lower net charge-offs and credit quality improvements in the originated portfolio.
For
2013
, noninterest income increased
$74.3 million
from
2012
primarily resulting from higher acquired loan recoveries, a favorable reduction in the adjustments to the FDIC receivable and the sale of a large portion of our client bank processing. These favorable changes were partially offset by lower fees from processing services.
Noninterest expense increased
$4.4 million
, or
0.6 percent
for
2013
, when compared to
2012
. The increase resulted from increases in pension, consulting and advertising expense, partially offset by lower foreclosure-related expenses.
Operating results related to acquired assets were favorable during
2013
and improved when compared to
2012
. The significant reduction in the provision for loan and lease losses related to acquired assets, combined with improved noninterest income resulting from recoveries of acquired loans previously charged off and lower amortization expense related to the FDIC receivable more than offset the impact of lower accretion income. We expect the income statement impact of acquired assets will decrease in future periods as acquired loan balances decline.
Results from our non-acquired bank operations were mixed during
2013
when compared to
2012
. While provision for loan and lease losses declined for
2013
, noninterest expense increased primarily due to higher employee benefits expense and cardholder rewards expense. Net interest income was unchanged from
2012
, while noninterest income increased slightly, the net result of improved cardholder and merchant income, offset by lower fees from processing services.
22
FDIC-ASSISTED TRANSACTIONS
FDIC-assisted transactions provided us significant growth opportunities from 2009 through 2011 and have continued to provide significant contributions to our results of operations. These transactions allowed us to increase our presence in existing markets and to expand our banking presence to adjacent markets. Each of the FDIC-assisted transactions included loss share agreements that, for the term of the loss share agreement, protect us from a substantial portion of the credit and asset quality risk we would otherwise incur.
Balance sheet impact.
Table 3 provides information regarding the six FDIC-assisted transactions consummated during 2011, 2010 and 2009.
Table 3
FDIC-ASSISTED TRANSACTIONS
|
Entity
|
Date of
transaction
|
Fair value of loans acquired
|
||||
|
|
|
(dollars in thousands)
|
||||
|
Colorado Capital Bank (CCB)
|
July 8, 2011
|
$
|
320,789
|
|
||
|
United Western Bank (United Western)
|
January 21, 2011
|
759,351
|
|
|||
|
Sun American Bank (SAB)
|
March 5, 2010
|
290,891
|
|
|||
|
First Regional Bank (First Regional)
|
January 29, 2010
|
1,260,249
|
|
|||
|
Venture Bank (VB)
|
September 11, 2009
|
456,995
|
|
|||
|
Temecula Valley Bank (TVB)
|
July 17, 2009
|
855,583
|
|
|||
|
Total
|
$
|
3,943,858
|
|
|||
|
Carrying value of acquired loans as of December 31, 2013
|
$
|
1,029,426
|
|
|||
Income statement impact.
The six FDIC-assisted transactions created acquisition gains recognized at the time of each respective transaction. No acquisition gains were recorded during
2013
and
2012
, compared to $150.4 million in
2011
. During
2013
and
2012
, acquired loans resulting from the FDIC-assisted transactions have had a significant impact on interest income, provision for loan and lease losses and noninterest income. Due to the many factors that can affect the amount of income or expense related to acquired loans recognized in a given period, these components of net income are not easily predictable for future periods. Variations among these items may affect the comparability of various components of net income.
The amount of accretable yield related to acquired loans changes when the estimated cash flows expected to be collected change. The recognition of accretion income, which is included in interest income, may be accelerated in the event of unscheduled payments and various other post-acquisition events. For
2013
, accretion income on acquired loans equaled
$224.7 million
, compared to
$304.0 million
during
2012
and
$319.4 million
during
2011
. Accretion income continues to decline as acquired loan balances are repaid.
Total provision for loan and lease losses related to acquired loans decreased by
$152.4 million
from provision expense of
$100.8 million
in
2012
to a provision credit of
$51.5 million
in
2013
. The decrease in the provision for acquired loan losses in
2013
is the result of reversal of previously identified impairment for post-acquisition deterioration and payoffs of loans for which an allowance had been established.
During
2013
, the net adjustment to the FDIC receivable for post-acquisition improvements and deterioration in acquired assets resulted in a net reduction to the FDIC receivable and noninterest income of
$72.3 million
, compared to a net reduction in the receivable and a corresponding reduction in noninterest income of
$101.6 million
during
2012
. For
2013
, other noninterest income included
$29.7 million
of acquired loan recoveries, an increase of
$19.2 million
over
2012
.
Expenses related to personnel supporting our acquired loan portfolio, facility and equipment costs, and expenses associated with collection and resolution of acquired loans as well as all income and expenses associated with OREO property covered under loss share agreements are not segregated from corresponding expenses related to originated assets.
23
Acquisition accounting and issues affecting comparability of financial statements.
As estimated exposures related to the acquired assets covered by the loss share agreements change based on post-acquisition events, our adherence to GAAP and accounting policy elections we have made affect the comparability of our current results of operations to earlier periods. Several of the key issues affecting comparability are as follows:
|
•
|
When post-acquisition events suggest that the amount of cash flows we will ultimately receive for an acquired loan is less than originally expected:
|
|
▪
|
An allowance for loan and lease losses is established for the post-acquisition exposure that has emerged with a corresponding charge to provision for loan and lease losses;
|
|
▪
|
If the expected loss is projected to occur during the relevant loss share period, the FDIC receivable is adjusted to reflect the indemnified portion of the post-acquisition exposure with a corresponding increase to noninterest income;
|
|
•
|
When post-acquisition events suggest that the amount of cash flows we will ultimately receive for an acquired loan is greater than originally expected:
|
|
▪
|
Any allowance for loan and lease losses that was previously established for post-acquisition exposure is reversed with a corresponding reduction to provision for loan and lease losses; if no allowance was established in earlier periods, the amount of the improvement in the cash flow projection results in a reclassification from the nonaccretable difference created at the acquisition date to an accretable yield; the newly-identified accretable yield is accreted into income over the remaining life of the loan as interest income;
|
|
▪
|
The FDIC receivable is adjusted immediately for reversals of previously recognized impairment and prospectively for reclassifications from nonaccretable difference to reflect the indemnified portion of the post-acquisition change in exposure; a corresponding reduction in noninterest income is also recorded immediately for reversals of previously established allowances or, for reclassifications from nonaccretable difference, over the shorter of the remaining life of the related loan or relevant loss share agreement;
|
|
•
|
When actual payments received on acquired loans are greater than initial estimates, large nonrecurring discount accretion or reductions in the allowance for loan and lease losses may be recognized during a specific period; discount accretion is recognized as an increase to interest income; reductions in the allowance for loan and lease losses are recorded as a reduction in the provision for loan and lease losses;
|
|
•
|
Adjustments to the FDIC receivable resulting from changes in estimated cash flows for acquired loans are based on the reimbursement provision of the applicable loss share agreement with the FDIC. Adjustments to the FDIC receivable partially offset the adjustment to the acquired loan carrying value, but the rate of the change to the FDIC receivable relative to the change in the acquired loan carrying value is not constant. The loss share agreements establish reimbursement rates for losses incurred within certain ranges. In some loss share agreements, higher loss estimates result in higher reimbursement rates, while in other loss share agreements, higher loss estimates trigger a reduction in the reimbursement rates. In addition, some of the loss share agreements include clawback provisions that require the purchaser to remit a payment to the FDIC in the event that the aggregate amount of losses is less than a loss estimate established by the FDIC. The adjustments to the FDIC receivable based on changes in loss estimates are measured based on the actual reimbursement rates and consider the impact of changes in the projected clawback payment.
|
Receivable from FDIC for loss share agreements.
The various terms of each loss share agreement and the components of the receivable from the FDIC is provided in Table 4. As of
December 31, 2013
, the FDIC receivable included
$38.4 million
we expect to receive through reimbursements from the FDIC and
$55.0 million
we expect to recover through prospective amortization of the asset due to post-acquisition improvements in the related loans.
The timing of expected losses on acquired assets is monitored by management to ensure the losses will occur during the respective loss share terms. When projected losses are expected to occur after expiration of the relevant loss share agreement, the FDIC receivable is adjusted to reflect the forfeiture of loss share protection.
24
Table 4
LOSS SHARE PROVISIONS FOR FDIC-ASSISTED TRANSACTIONS
|
Fair value at acquisition date
|
Losses/expenses incurred through 12/31/2013
|
Cumulative amount reimbursed by FDIC through 12/31/2013
|
Carrying value at
December 31, 2013 |
Current portion of receivable due from (to) FDIC for 12/31/2013 filings
|
Prospective amortization (accretion)
|
||||||||||||||||
|
Receivable from FDIC
|
Payable to FDIC
|
||||||||||||||||||||
|
Entity
|
|||||||||||||||||||||
|
(dollars in thousands)
|
|||||||||||||||||||||
|
TVB - combined losses
|
$
|
103,558
|
|
$
|
194,302
|
|
$
|
—
|
|
$
|
16,988
|
|
$
|
—
|
|
$
|
—
|
|
$
|
16,988
|
|
|
VB - combined losses
|
138,963
|
|
156,254
|
|
123,583
|
|
1,988
|
|
—
|
|
1,421
|
|
(1,176
|
)
|
|||||||
|
First Regional - combined losses
|
378,695
|
|
253,481
|
|
178,180
|
|
15,018
|
|
75,828
|
|
(8,849
|
)
|
15,199
|
|
|||||||
|
SAB - combined losses
|
89,734
|
|
95,876
|
|
78,861
|
|
10,145
|
|
1,543
|
|
(2,160
|
)
|
7,801
|
|
|||||||
|
United Western
|
|||||||||||||||||||||
|
Non-single family residential losses
|
112,672
|
|
111,480
|
|
88,866
|
|
15,209
|
|
16,821
|
|
148
|
|
6,878
|
|
|||||||
|
Single family residential losses
|
24,781
|
|
4,529
|
|
2,835
|
|
11,463
|
|
—
|
|
789
|
|
1,230
|
|
|||||||
|
CCB - combined losses
|
155,070
|
|
186,354
|
|
144,926
|
|
22,586
|
|
15,186
|
|
4,330
|
|
8,038
|
|
|||||||
|
Total
|
$
|
1,003,473
|
|
$
|
1,002,276
|
|
$
|
617,251
|
|
$
|
93,397
|
|
$
|
109,378
|
|
$
|
(4,321
|
)
|
$
|
54,958
|
|
|
Except where noted, each FDIC-assisted transaction has a separate loss share agreement for Single-Family Residential loans (SFR) and non-Single-Family Residential loans (NSFR).
|
|||||||||||||||||||||
|
For TVB, combined losses are covered at 0 percent up to $193.3 million, 80 percent for losses between $193.3 million and $464.0 million and 95 percent for losses above $464.0 million. The loss share agreements expire on July 17, 2014, for all TVB NSFR loans and July 17, 2019, for the SFR loans.
|
|||||||||||||||||||||
|
For VB, combined losses are covered at 80 percent up to $235.0 million and 95 percent for losses above $235.0 million. The loss share agreements expire on September 11, 2014, for all VB NSFR loans and September 11, 2019, for the SFR loans.
|
|||||||||||||||||||||
|
For First Regional, NSFR losses are covered at 0 percent up to $41.8 million, 80 percent for losses between $41.8 million and $1.02 billion and 95 percent for losses above $1.02 billion. The loss share agreement expires on January 29, 2015, for all First Regional NSFR loans. First Regional has no SFR loans.
|
|||||||||||||||||||||
|
For SAB, combined losses are covered at 80 percent up to $99.0 million and 95 percent for losses above $99.0 million. The loss share agreements expire on March 5, 2015, for all SAB NSFR loans and March 4, 2020, for the SFR loans.
|
|||||||||||||||||||||
|
For United Western NSFR loans, losses are covered at 80 percent up to $111.5 million, 30 percent between $111.5 million and $227.0 million and 80 percent for losses above $227.0 million. The loss share agreement expires on January 21, 2016.
|
|||||||||||||||||||||
|
For United Western SFR loans, losses are covered at 80 percent up to $32.5 million, 0 percent between $32.5 million and $57.7 million and 80 percent for losses above $57.7 million. The loss share agreement expires on January 20, 2021.
|
|||||||||||||||||||||
|
For CCB, combined losses are covered at 80 percent up to $231.0 million, 0 percent between $231.0 million and $285.9 million and 80 percent for losses above $285.9 million. The loss share agreements expire on July 7, 2016, for all CCB NSFR loans and July 7, 2021, for the SFR loans.
|
|||||||||||||||||||||
|
Fair value at acquisition date represents the initial fair value of the receivable from FDIC, excluding the payable to FDIC. Receivable related to accretable yield represents balances that, due to post-acquisition credit quality improvement, will be amortized over the shorter of the covered asset's life or the term of the loss share period.
|
|||||||||||||||||||||
25
INTEREST-EARNING ASSETS
Interest-earning assets include loans and leases, investment securities and overnight investments, all of which reflect varying interest rates based on the risk level and repricing characteristics of the underlying asset. Riskier investments typically carry a higher interest rate but expose us to higher levels of market risk.
We have historically focused on maintaining high-asset quality, which results in a loan and lease portfolio subjected to strenuous underwriting and monitoring procedures. We avoid high-risk industry concentrations, but we do maintain a concentration of owner-occupied real estate loans to borrowers in medical and medical-related fields. Our focus on asset quality also influences the composition of our investment securities portfolio. At
December 31, 2013
, government agency securities represented
47.2 percent
of investment securities available for sale, compared to mortgage-backed securities, which represented
45.4 percent
and U.S. Treasury securities, which represented
6.9 percent
of the portfolio. The balance of the available-for-sale portfolio includes common stock of other financial institutions and state, county and municipal securities. Overnight investments are with the Federal Reserve Bank and other financial institutions.
Interest-earning assets averaged
$19.43 billion
for
2013
, compared to
$18.97 billion
for
2012
. The increase of
$459.0 million
, or
2.4 percent
, was due to higher levels of investment securities and overnight investments offset, in part, by lower acquired loans.
Loans and leases
Loans and leases totaled
$13.13 billion
at
December 31, 2013
, a decrease of
$251.6 million
, or
1.9 percent
, when compared to
December 31, 2012
. This follows a decrease of
$558.4 million
, or
4.0 percent
, in total loans and leases from
December 31, 2011
to
December 31, 2012
.
Total originated loans increased
$528.2 million
from
$11.58 billion
at
December 31, 2012
, to
$12.10 billion
at
December 31, 2013
, after declining
$5.5 million
from
December 31, 2011
to
December 31, 2012
. Acquired loans totaled
$1.03 billion
at
December 31, 2013
, compared to
$1.81 billion
at
December 31, 2012
, and
$2.36 billion
at
December 31, 2011
. Originated loan demand improved during the second half of 2013, while acquired loan balances continued to decline due to repayments and charge-offs. Table 5 provides the composition of acquired and originated loan and leases for the past five years.
Originated commercial mortgage loans totaled
$6.36 billion
at
December 31, 2013
,
52.6 percent
of originated loans and leases. The
December 31, 2013
, balance increased
$333.1 million
or
5.5 percent
since
December 31, 2012
, and
$179.2 million
or
3.1 percent
between
December 31, 2011
and
December 31, 2012
. The growth reflects our continued focus on small business customers, particularly among medical-related and other professional customers. These loans are underwritten based primarily upon the cash flow from the operation of the business rather than the value of the real estate collateral.
At
December 31, 2013
, originated revolving mortgage loans totaled
$2.11 billion
, representing
17.5 percent
of total originated loans outstanding, a decrease of
$96.8 million
or
4.4 percent
since
December 31, 2012
, following a decrease of
$86.2 million
or
3.8 percent
between
December 31, 2011
and
December 31, 2012
. The reduction in revolving mortgage loans over the prior two years is a result of a reduced emphasis on this class of lending, partially resulting from eroded collateral values related to junior lien mortgage loans.
At
December 31, 2013
, originated commercial and industrial loans equaled
$1.08 billion
or
8.9 percent
of total originated loans and leases, an increase of
$42.6 million
or
4.1 percent
since
December 31, 2012
. This follows an increase of
$19.4 million
or
1.9 percent
between
December 31, 2011
and
December 31, 2012
. We observed improved demand for commercial and industrial lending during
2013
, which we attribute to improving confidence among small businesses.
Originated residential mortgage loans totaled
$982.4 million
at
December 31, 2013
, up
$159.5 million
or
19.4 percent
from
December 31, 2012
. This follows an increase of
$38.8 million
, or
4.9 percent
between
December 31, 2011
and
December 31, 2012
. While the majority of residential mortgage loans that we originated in
2013
were sold to investors, other loans, including affordable housing loans with nonconforming loan-to-value ratios, were retained in the loan portfolio.
Originated leases totaled
$381.8 million
or
3.2 percent
of total originated loans at
December 31, 2013
, an increase of
$51.1 million
or
15.4 percent
since
December 31, 2012
. This follows an increase of
$17.8 million
or
5.7 percent
between
December 31, 2011
and
December 31, 2012
.
26
Table 5
LOANS AND LEASES
|
December 31
|
|||||||||||||||||||
|
|
2013
|
2012
|
2011
|
2010
|
2009
|
||||||||||||||
|
(dollars in thousands)
|
|||||||||||||||||||
|
Acquired loans:
|
|||||||||||||||||||
|
Commercial:
|
|||||||||||||||||||
|
Construction and land development
|
$
|
78,915
|
|
$
|
237,906
|
|
$
|
338,873
|
|
$
|
368,420
|
|
$
|
223,487
|
|
||||
|
Commercial mortgage
|
642,891
|
|
1,054,473
|
|
1,260,589
|
|
1,089,064
|
|
590,399
|
|
|||||||||
|
Other commercial real estate
|
41,381
|
|
107,119
|
|
158,394
|
|
210,661
|
|
21,638
|
|
|||||||||
|
Commercial and industrial
|
17,254
|
|
49,463
|
|
113,442
|
|
132,477
|
|
95,231
|
|
|||||||||
|
Lease financing
|
—
|
|
—
|
|
57
|
|
—
|
|
—
|
|
|||||||||
|
Other
|
866
|
|
1,074
|
|
1,330
|
|
1,510
|
|
2,887
|
|
|||||||||
|
Total commercial loans
|
781,307
|
|
1,450,035
|
|
1,872,685
|
|
1,802,132
|
|
933,642
|
|
|||||||||
|
Noncommercial:
|
|||||||||||||||||||
|
Residential mortgage
|
213,851
|
|
297,926
|
|
327,568
|
|
74,495
|
|
152,309
|
|
|||||||||
|
Revolving mortgage
|
30,834
|
|
38,710
|
|
51,552
|
|
17,866
|
|
—
|
|
|||||||||
|
Construction and land development
|
2,583
|
|
20,793
|
|
105,536
|
|
105,805
|
|
82,555
|
|
|||||||||
|
Consumer
|
851
|
|
1,771
|
|
4,811
|
|
7,154
|
|
4,514
|
|
|||||||||
|
Total noncommercial loans
|
248,119
|
|
359,200
|
|
489,467
|
|
205,320
|
|
239,378
|
|
|||||||||
|
Total acquired loans
|
1,029,426
|
|
1,809,235
|
|
2,362,152
|
|
2,007,452
|
|
1,173,020
|
|
|||||||||
|
Originated loans and leases:
|
|||||||||||||||||||
|
Commercial:
|
|||||||||||||||||||
|
Construction and land development
|
319,847
|
|
309,190
|
|
381,163
|
|
338,929
|
|
541,110
|
|
|||||||||
|
Commercial mortgage
|
6,362,490
|
|
6,029,435
|
|
5,850,245
|
|
5,505,436
|
|
5,311,550
|
|
|||||||||
|
Other commercial real estate
|
178,754
|
|
160,980
|
|
144,771
|
|
149,710
|
|
158,187
|
|
|||||||||
|
Commercial and industrial
|
1,081,158
|
|
1,038,530
|
|
1,019,155
|
|
1,101,916
|
|
1,073,198
|
|
|||||||||
|
Lease financing
|
381,763
|
|
330,679
|
|
312,869
|
|
301,289
|
|
330,713
|
|
|||||||||
|
Other
|
175,336
|
|
125,681
|
|
158,369
|
|
182,015
|
|
195,084
|
|
|||||||||
|
Total commercial loans
|
8,499,348
|
|
7,994,495
|
|
7,866,572
|
|
7,579,295
|
|
7,609.842
|
|
|||||||||
|
Noncommercial:
|
|||||||||||||||||||
|
Residential mortgage
|
982,421
|
|
822,889
|
|
784,118
|
|
878,792
|
|
864,704
|
|
|||||||||
|
Revolving mortgage
|
2,113,285
|
|
2,210,133
|
|
2,296,306
|
|
2,233,853
|
|
2,147,223
|
|
|||||||||
|
Construction and land development
|
122,792
|
|
131,992
|
|
137,271
|
|
192,954
|
|
81,244
|
|
|||||||||
|
Consumer
|
386,452
|
|
416,606
|
|
497,370
|
|
595,683
|
|
941,986
|
|
|||||||||
|
Total noncommercial loans
|
3,604,950
|
|
3,581,620
|
|
3,715,065
|
|
3,901,282
|
|
4,035,157
|
|
|||||||||
|
Total originated loans and leases
|
12,104,298
|
|
11,576,115
|
|
11,581,637
|
|
11,480,577
|
|
11,644,999
|
|
|||||||||
|
Total loans and leases
|
13,133,724
|
|
13,385,350
|
|
13,943,789
|
|
13,488,029
|
|
12,818,019
|
|
|||||||||
|
Less allowance for loan and lease losses
|
233,394
|
|
319,018
|
|
270,144
|
|
227,765
|
|
172,282
|
|
|||||||||
|
Net loans and leases
|
$
|
12,900,330
|
|
$
|
13,066,332
|
|
$
|
13,673,645
|
|
$
|
13,260,264
|
|
$
|
12,645,737
|
|
||||
27
Originated commercial construction and land development loans totaled
$319.8 million
or
2.6 percent
of total originated loans at
December 31, 2013
, an increase of
$10.7 million
or
3.4 percent
since
December 31, 2012
. Modest growth during
2013
follows a decrease of
$72.0 million
, or
18.9 percent
between
December 31, 2011
and
December 31, 2012
. Most of the construction portfolio relates to borrowers in North Carolina and Virginia where real estate values have been more stable than in other markets in which we operate.
Originated consumer loans totaled
$386.5 million
at
December 31, 2013
, down
$30.2 million
or
7.2 percent
since
December 31, 2012
. Consumer loans decreased
$80.8 million
or
16.2 percent
between
December 31, 2011
and
December 31, 2012
. This decline is the result of the general contraction in consumer borrowing over the past several years due to weak customer demand and continued run-off in our automobile sales finance portfolio.
At
December 31, 2013
, acquired commercial mortgage loans totaled
$642.9 million
, representing
62.5 percent
of the total acquired portfolio compared to
$1.05 billion
at
December 31, 2012
, and
$1.26 billion
at
December 31, 2011
. Acquired residential mortgage loans totaled
$213.9 million
or
20.8 percent
of the acquired portfolio as of
December 31, 2013
, compared to
$297.9 million
or
16.5 percent
of total acquired loans at
December 31, 2012
, and
$327.6 million
or 13.9 percent of total acquired loans at
December 31, 2011
. Acquired commercial construction and land development loans amounted to
$78.9 million
, or
7.7 percent
of total acquired loans at
December 31, 2013
, compared to
$237.9 million
at
December 31, 2012
, and
$338.9 million
from
December 31, 2011
. The changes in acquired loan balances reflect continued reductions of outstanding loans from the FDIC-assisted transactions from payments, charge-offs and foreclosure.
Management believes
2013
loan growth results from improving economic conditions. We expect originated loan growth to continue in 2014 with strengthening economic stability. Loan growth projections are subject to change due to further economic deterioration or improvement and other external factors.
Investment securities
Investment securities available for sale equaled
$5.39 billion
at
December 31, 2013
, compared to
$5.23 billion
at
December 31, 2012
. Available for sale securities are reported at fair value and unrealized gains and losses are included as a component of other comprehensive income, net of deferred taxes. As of
December 31, 2013
, investment securities available for sale had a net unrealized loss of
$16.6 million
, compared to a net unrealized gain of
$33.8 million
that existed as of
December 31, 2012
. After evaluating the securities with unrealized losses, management concluded that no other than temporary impairment existed as of
December 31, 2013
.
During
2013
, in an effort to protect portfolio market value and profitability in a rising rate environment while not detracting from earnings in the current rate environment, management shifted the asset allocation towards more floating rate securities. A portion of proceeds from matured and called U.S. Government agency and U.S. Treasury securities were reinvested into collateralized mortgage obligations issued by the Government National Mortgage Association, the Federal National Mortgage Association and the Federal Home Loan Mortgage Corporation. As as result, the carrying value of mortgage-backed securities available for sale, including collateralized mortgage obligations, increased
$1.12 billion
or
84.0 percent
during
2013
, while U.S. Government agency securities declined
$511.0 million
or
16.7 percent
and U.S. Treasury securities declined
$450.2 million
or
54.7 percent
. At
December 31, 2013
,
76.0 percent
of the collateralized mortgage obligation portfolio was floating rate and
24.0 percent
was fixed rate.
Changes in the total balance of our investment securities portfolio result from trends among loans and leases, deposits and short-term borrowings. Generally, when inflows arising from deposit and treasury services products exceed loan and lease demand, we invest excess funds into the securities portfolio. Conversely, when loan demand exceeds growth in deposits and short-term borrowings, we allow overnight investments to decline and use proceeds from maturing securities to fund loan demand. The total investment securities portfolio book value increased
$211.5 million
in 2013 largely on lower loan balances. Details of investment securities at
December 31, 2013
,
December 31, 2012
and
December 31, 2011
, are provided in Table 6.
28
Table 6
INVESTMENT SECURITIES
|
2013
|
2012
|
2011
|
||||||||||||||||||||||||||
|
Average maturity
(Yrs./mos.)
|
Taxable equivalent yield
|
|||||||||||||||||||||||||||
|
Cost
|
Fair value
|
Cost
|
Fair value
|
Cost
|
Fair value
|
|||||||||||||||||||||||
|
(dollars in thousands)
|
||||||||||||||||||||||||||||
|
Investment securities available for sale:
|
||||||||||||||||||||||||||||
|
U.S. Treasury
|
||||||||||||||||||||||||||||
|
Within one year
|
$
|
245,510
|
|
$
|
245,667
|
|
0/8
|
0.48
|
%
|
$
|
576,101
|
|
$
|
576,393
|
|
$
|
811,038
|
|
$
|
811,835
|
|
|||||||
|
One to five years
|
127,713
|
|
127,770
|
|
1/7
|
1.76
|
|
247,140
|
|
247,239
|
|
76,003
|
|
75,984
|
|
|||||||||||||
|
Total
|
373,223
|
|
373,437
|
|
1/0
|
0.92
|
|
823,241
|
|
823,632
|
|
887,041
|
|
887,819
|
|
|||||||||||||
|
Government agency
|
||||||||||||||||||||||||||||
|
Within one year
|
594,446
|
|
595,216
|
|
0/5
|
0.83
|
|
1,708,572
|
|
1,709,520
|
|
2,176,527
|
|
2,176,143
|
|
|||||||||||||
|
One to five years
|
1,948,777
|
|
1,949,013
|
|
1/11
|
0.62
|
|
1,343,468
|
|
1,345,684
|
|
415,447
|
|
416,066
|
|
|||||||||||||
|
Total
|
2,543,223
|
|
2,544,229
|
|
1/7
|
0.67
|
|
3,052,040
|
|
3,055,204
|
|
2,591,974
|
|
2,592,209
|
|
|||||||||||||
|
Mortgage-backed securities
|
||||||||||||||||||||||||||||
|
Within one year
|
10,703
|
|
10,743
|
|
0/9
|
3.12
|
|
3,397
|
|
3,456
|
|
374
|
|
373
|
|
|||||||||||||
|
One to five years
|
2,221,351
|
|
2,192,285
|
|
3/7
|
1.79
|
|
732,614
|
|
736,284
|
|
56,650
|
|
56,929
|
|
|||||||||||||
|
Five to ten years
|
254,243
|
|
243,845
|
|
5/8
|
2.31
|
|
193,500
|
|
195,491
|
|
90,595
|
|
91,077
|
|
|||||||||||||
|
Over ten years
|
—
|
|
—
|
|
—
|
—
|
|
385,700
|
|
394,426
|
|
150,783
|
|
158,842
|
|
|||||||||||||
|
Total
|
2,486,297
|
|
2,446,873
|
|
3/9
|
1.85
|
|
1,315,211
|
|
1,329,657
|
|
298,402
|
|
307,221
|
|
|||||||||||||
|
State, county and municipal
|
||||||||||||||||||||||||||||
|
Within one year
|
—
|
|
—
|
|
—
|
—
|
|
486
|
|
490
|
|
242
|
|
244
|
|
|||||||||||||
|
One to five years
|
186
|
|
187
|
|
2/5
|
7.88
|
|
—
|
|
—
|
|
359
|
|
372
|
|
|||||||||||||
|
Five to ten years
|
—
|
|
—
|
|
—
|
—
|
|
60
|
|
60
|
|
10
|
|
10
|
|
|||||||||||||
|
Over ten years
|
—
|
|
—
|
|
—
|
—
|
|
—
|
|
—
|
|
415
|
|
415
|
|
|||||||||||||
|
Total
|
186
|
|
187
|
|
2/5
|
7.88
|
|
546
|
|
550
|
|
1,026
|
|
1,041
|
|
|||||||||||||
|
Corporate bonds
|
||||||||||||||||||||||||||||
|
Within one year
|
—
|
|
—
|
|
—
|
—
|
|
—
|
|
—
|
|
250,476
|
|
252,820
|
|
|||||||||||||
|
Other
|
||||||||||||||||||||||||||||
|
One to five years
|
863
|
|
830
|
|
4/5
|
3.8
|
|
838
|
|
820
|
|
—
|
|
—
|
|
|||||||||||||
|
Equity securities
|
543
|
|
22,147
|
|
—
|
—
|
|
543
|
|
16,365
|
|
939
|
|
15,313
|
|
|||||||||||||
|
Total investment securities available for sale
|
5,404,335
|
|
5,387,703
|
|
5,192,419
|
|
5,226,228
|
|
4,029,858
|
|
4,056,423
|
|
||||||||||||||||
|
Investment securities held to maturity:
|
||||||||||||||||||||||||||||
|
Mortgage-backed securities
|
||||||||||||||||||||||||||||
|
Within one year
|
2
|
|
2
|
|
0/10
|
2.72
|
|
—
|
|
—
|
|
—
|
|
—
|
|
|||||||||||||
|
One to five years
|
831
|
|
891
|
|
1/4
|
5.53
|
|
1,242
|
|
1,309
|
|
12
|
|
11
|
|
|||||||||||||
|
Five to ten years
|
74
|
|
81
|
|
5/1
|
7.50
|
|
18
|
|
11
|
|
1,699
|
|
1,820
|
|
|||||||||||||
|
Over ten years
|
—
|
|
—
|
|
—
|
—
|
|
82
|
|
128
|
|
111
|
|
149
|
|
|||||||||||||
|
Total investment securities held to maturity
|
907
|
|
974
|
|
1/8
|
5.69
|
|
1,342
|
|
1,448
|
|
1,822
|
|
1,980
|
|
|||||||||||||
|
Total investment securities
|
$
|
5,405,242
|
|
$
|
5,388,677
|
|
$
|
5,193,761
|
|
$
|
5,227,676
|
|
$
|
4,031,680
|
|
$
|
4,058,403
|
|
||||||||||
29
Table 7
AVERAGE BALANCE SHEETS
|
|
2013
|
2012
|
|||||||||||||||||||
|
Average
Balance |
Interest
Income/ Expense |
Yield/
Rate |
Average
Balance |
Interest
Income/ Expense |
Yield/
Rate |
||||||||||||||||
|
(dollars in thousands, taxable equivalent)
|
|||||||||||||||||||||
|
Assets
|
|||||||||||||||||||||
|
Loans and leases
|
$
|
13,163,743
|
|
$
|
759,261
|
|
5.77
|
%
|
$
|
13,560,773
|
|
$
|
969,802
|
|
7.15
|
%
|
|||||
|
Investment securities:
|
|||||||||||||||||||||
|
U.S. Treasury
|
610,327
|
|
1,714
|
|
0.28
|
|
935,135
|
|
2,574
|
|
0.28
|
|
|||||||||
|
Government agency
|
2,829,328
|
|
12,783
|
|
0.45
|
|
2,857,714
|
|
16,339
|
|
0.57
|
|
|||||||||
|
Mortgage-backed securities
|
1,745,540
|
|
22,642
|
|
1.30
|
|
757,296
|
|
14,388
|
|
1.90
|
|
|||||||||
|
Corporate bonds
|
—
|
|
—
|
|
—
|
|
129,827
|
|
2,574
|
|
1.98
|
|
|||||||||
|
State, county and municipal
|
276
|
|
20
|
|
7.25
|
|
829
|
|
57
|
|
6.88
|
|
|||||||||
|
Other
|
20,529
|
|
321
|
|
1.56
|
|
17,758
|
|
340
|
|
1.91
|
|
|||||||||
|
Total investment securities
|
5,206,000
|
|
37,480
|
|
0.72
|
|
4,698,559
|
|
36,272
|
|
0.77
|
|
|||||||||
|
Overnight investments
|
1,064,204
|
|
2,723
|
|
0.26
|
|
715,583
|
|
1,738
|
|
0.24
|
|
|||||||||
|
Total interest-earning assets
|
19,433,947
|
|
$
|
799,464
|
|
4.12
|
%
|
18,974,915
|
|
$
|
1,007,812
|
|
5.31
|
%
|
|||||||
|
Cash and due from banks
|
483,186
|
|
529,224
|
|
|||||||||||||||||
|
Premises and equipment
|
874,862
|
|
876,802
|
|
|||||||||||||||||
|
Receivable from FDIC for loss share agreements
|
168,281
|
|
350,933
|
|
|||||||||||||||||
|
Allowance for loan and lease losses
|
(257,791
|
)
|
(272,105
|
)
|
|||||||||||||||||
|
Other real estate owned
|
119,694
|
|
172,269
|
|
|||||||||||||||||
|
Other assets
|
478,621
|
|
445,406
|
|
|||||||||||||||||
|
Total assets
|
$
|
21,300,800
|
|
$
|
21,077,444
|
|
|||||||||||||||
|
Liabilities
|
|||||||||||||||||||||
|
Interest-bearing deposits:
|
|||||||||||||||||||||
|
Checking With Interest
|
$
|
2,346,192
|
|
$
|
600
|
|
0.03
|
%
|
$
|
2,105,587
|
|
$
|
1,334
|
|
0.06
|
%
|
|||||
|
Savings
|
968,251
|
|
482
|
|
0.05
|
|
874,311
|
|
445
|
|
0.05
|
|
|||||||||
|
Money market accounts
|
6,338,622
|
|
9,755
|
|
0.15
|
|
5,985,562
|
|
16,185
|
|
0.27
|
|
|||||||||
|
Time deposits
|
3,198,606
|
|
23,658
|
|
0.74
|
|
4,093,347
|
|
39,604
|
|
0.97
|
|
|||||||||
|
Total interest-bearing deposits
|
12,851,671
|
|
34,495
|
|
0.27
|
|
13,058,807
|
|
57,568
|
|
0.44
|
|
|||||||||
|
Short-term borrowings
|
596,425
|
|
2,724
|
|
0.46
|
|
664,498
|
|
5,107
|
|
0.77
|
|
|||||||||
|
Long-term obligations
|
462,203
|
|
19,399
|
|
4.20
|
|
574,721
|
|
27,473
|
|
4.78
|
|
|||||||||
|
Total interest-bearing liabilities
|
13,910,299
|
|
$
|
56,618
|
|
0.41
|
%
|
14,298,026
|
|
$
|
90,148
|
|
0.63
|
%
|
|||||||
|
Demand deposits
|
5,096,325
|
|
4,668,310
|
|
|||||||||||||||||
|
Other liabilities
|
352,068
|
|
195,839
|
|
|||||||||||||||||
|
Shareholders' equity
|
1,942,108
|
|
1,915,269
|
|
|||||||||||||||||
|
Total liabilities and shareholders' equity
|
$
|
21,300,800
|
|
$
|
21,077,444
|
|
|||||||||||||||
|
Interest rate spread
|
3.71
|
%
|
4.68
|
%
|
|||||||||||||||||
|
Net interest income and net yield
|
|||||||||||||||||||||
|
on interest-earning assets
|
742,846
|
|
3.82
|
%
|
917,664
|
|
4.84
|
%
|
|||||||||||||
Loans and leases include acquired loans, originated loans, nonaccrual loans and loans held for sale. Yields related to loans, leases and securities exempt from both federal and state income taxes, federal income taxes only, or state income taxes only are stated on a taxable-equivalent basis assuming statutory federal income tax rates of 35.0 percent and state income tax rates of 6.9 percent for each period. The taxable-equivalent adjustment was
$2,660
,
$2,976
,
$3,760
,
$4,139
and
$4,931
for the years
2013
,
2012
, 2011, 2010 and 2009, respectively.
30
Table 7
AVERAGE BALANCE SHEETS (continued)
|
2011
|
2010
|
2009
|
|||||||||||||||||||||||||||||
|
Average
Balance |
Interest
Income/ Expense |
Yield/
Rate |
Average
Balance |
Interest
Income/ Expense |
Yield/
Rate |
Average
Balance |
Interest
Income/ Expense |
Yield/
Rate |
|||||||||||||||||||||||
|
(dollars in thousands, taxable equivalent)
|
|||||||||||||||||||||||||||||||
|
$
|
14,050,453
|
|
$
|
970,225
|
|
6.91
|
%
|
$
|
13,865,815
|
|
$
|
917,111
|
|
6.61
|
%
|
$
|
12,062,954
|
|
$
|
661,750
|
|
5.49
|
%
|
||||||||
|
1,347,874
|
|
8,591
|
|
0.64
|
|
2,073,511
|
|
25,586
|
|
1.23
|
|
2,332,228
|
|
45,231
|
|
1.94
|
|
||||||||||||||
|
2,084,627
|
|
20,672
|
|
0.99
|
|
894,695
|
|
12,852
|
|
1.44
|
|
576,423
|
|
22,767
|
|
3.95
|
|
||||||||||||||
|
320,611
|
|
9,235
|
|
2.88
|
|
163,009
|
|
6,544
|
|
4.01
|
|
108,228
|
|
4,812
|
|
4.45
|
|
||||||||||||||
|
426,114
|
|
7,975
|
|
1.87
|
|
487,678
|
|
8,721
|
|
1.79
|
|
342,643
|
|
6,283
|
|
1.83
|
|
||||||||||||||
|
3,841
|
|
279
|
|
7.26
|
|
1,926
|
|
120
|
|
6.23
|
|
4,693
|
|
431
|
|
9.18
|
|
||||||||||||||
|
32,694
|
|
548
|
|
1.68
|
|
20,274
|
|
227
|
|
1.12
|
|
48,405
|
|
1,085
|
|
2.24
|
|
||||||||||||||
|
4,215,761
|
|
47,300
|
|
1.12
|
|
3,641,093
|
|
54,050
|
|
1.48
|
|
3,412,620
|
|
80,609
|
|
2.36
|
|
||||||||||||||
|
558,454
|
|
1,394
|
|
0.25
|
|
951,252
|
|
2,346
|
|
0.25
|
|
370,940
|
|
731
|
|
0.20
|
|
||||||||||||||
|
18,824,668
|
|
$
|
1,018,919
|
|
5.41
|
%
|
18,458,160
|
|
$
|
973,507
|
|
5.27
|
%
|
15,846,514
|
|
$
|
743,090
|
|
4.69
|
%
|
|||||||||||
|
486,812
|
|
535,687
|
|
597,443
|
|
||||||||||||||||||||||||||
|
846,989
|
|
844,843
|
|
821,961
|
|
||||||||||||||||||||||||||
|
628,132
|
|
630,317
|
|
90,427
|
|
||||||||||||||||||||||||||
|
(241,367
|
)
|
(189,561
|
)
|
(162,542
|
)
|
||||||||||||||||||||||||||
|
193,467
|
|
160,376
|
|
78,924
|
|
||||||||||||||||||||||||||
|
396,871
|
|
401,358
|
|
284,757
|
|
||||||||||||||||||||||||||
|
$
|
21,135,572
|
|
$
|
20,841,180
|
|
$
|
17,557,484
|
|
|||||||||||||||||||||||
|
$
|
1,933,723
|
|
$
|
1,679
|
|
0.09
|
%
|
$
|
1,772,298
|
|
$
|
1,976
|
|
0.11
|
%
|
$
|
1,547,135
|
|
$
|
1,692
|
|
0.11
|
%
|
||||||||
|
826,881
|
|
1,118
|
|
0.14
|
|
724,219
|
|
1,280
|
|
0.18
|
|
592,610
|
|
684
|
|
0.12
|
|
||||||||||||||
|
5,514,920
|
|
21,642
|
|
0.39
|
|
4,827,021
|
|
27,076
|
|
0.56
|
|
3,880,703
|
|
27,078
|
|
0.70
|
|
||||||||||||||
|
5,350,249
|
|
77,449
|
|
1.45
|
|
6,443,916
|
|
118,863
|
|
1.84
|
|
5,585,200
|
|
154,305
|
|
2.76
|
|
||||||||||||||
|
13,625,773
|
|
101,888
|
|
0.75
|
|
13,767,454
|
|
149,195
|
|
1.08
|
|
11,605,648
|
|
183,759
|
|
1.58
|
|
||||||||||||||
|
652,607
|
|
5,993
|
|
0.92
|
|
582,654
|
|
5,189
|
|
0.89
|
|
654,347
|
|
4,882
|
|
0.75
|
|
||||||||||||||
|
766,509
|
|
36,311
|
|
4.74
|
|
885,145
|
|
40,741
|
|
4.60
|
|
753,242
|
|
39,003
|
|
5.18
|
|
||||||||||||||
|
15,044,889
|
|
$
|
144,192
|
|
0.96
|
%
|
15,235,253
|
|
$
|
195,125
|
|
1.28
|
%
|
13,013,237
|
|
$
|
227,644
|
|
1.75
|
%
|
|||||||||||
|
4,150,646
|
|
3,774,864
|
|
2,973,220
|
|
||||||||||||||||||||||||||
|
128,517
|
|
158,825
|
|
105,074
|
|
||||||||||||||||||||||||||
|
1,811,520
|
|
1,672,238
|
|
1,465,953
|
|
||||||||||||||||||||||||||
|
$
|
21,135,572
|
|
$
|
20,841,180
|
|
$
|
17,557,484
|
|
|||||||||||||||||||||||
|
4.45
|
%
|
3.99
|
%
|
2.94
|
%
|
||||||||||||||||||||||||||
|
$
|
874,727
|
|
4.65
|
%
|
$
|
778,382
|
|
4.22
|
%
|
$
|
515,446
|
|
3.25
|
%
|
|||||||||||||||||
31
INTEREST-BEARING LIABILITIES
Interest-bearing liabilities include interest-bearing deposits, short-term borrowings and long-term obligations. Interest-bearing liabilities totaled
$13.65 billion
as of
December 31, 2013
, down
$559.3 million
from
December 31, 2012
, due to continued migration of time deposits to demand deposit products. Average interest-bearing liabilities decreased
$387.7 million
, or
2.7 percent
from
2012
to
2013
due to lower time deposits and the July 2012 early redemption of
$150.0 million
of trust preferred securities.
Deposits
At
December 31, 2013
, total deposits equaled
$17.87 billion
, a decrease of
$212.0 million
since
December 31, 2012
. Demand deposits increased
$356.1 million
during
2013
, following an increase of
$554.0 million
during
2012
. Time deposits decreased
$699.0 million
and
$1.05 billion
during
2013
and
2012
, respectively. Table 8 provides deposit balances as of
December 31, 2013
,
December 31, 2012
and
December 31, 2011
.
Table 8
DEPOSITS
|
December 31
|
|||||||||||
|
2013
|
2012
|
2011
|
|||||||||
|
(dollars in thousands)
|
|||||||||||
|
Demand
|
$
|
5,241,817
|
|
$
|
4,885,700
|
|
$
|
4,331,706
|
|
||
|
Checking With Interest
|
2,445,972
|
|
2,363,317
|
|
2,103,298
|
|
|||||
|
Money market accounts
|
6,306,942
|
|
6,357,309
|
|
5,700,981
|
|
|||||
|
Savings
|
1,004,097
|
|
905,456
|
|
817,285
|
|
|||||
|
Time
|
2,875,238
|
|
3,574,243
|
|
4,624,004
|
|
|||||
|
Total deposits
|
$
|
17,874,066
|
|
$
|
18,086,025
|
|
$
|
17,577,274
|
|
||
For
2013
, interest-bearing deposits averaged
$12.85 billion
, a decrease of
$207.1 million
, or
1.6 percent
from
2012
. Average time deposits decreased
$894.7 million
during
2013
, with partially offsetting increases in money market accounts.
Due to our focus on maintaining a strong liquidity position, core deposit retention remains a key business objective. We believe that traditional bank deposit products remain an attractive option for many customers, but as economic conditions improve, we recognize that our liquidity position could be adversely affected as bank deposits are withdrawn and invested elsewhere. Our ability to fund future loan growth is dependent on our success at retaining existing deposits and generating new deposits at a reasonable cost.
Table 9
MATURITIES OF TIME DEPOSITS OF $100,000 OR MORE
|
|
December 31, 2013
|
||
|
Time deposits maturing in:
|
(dollars in thousands)
|
||
|
Three months or less
|
$
|
319,222
|
|
|
Over three months through six months
|
166,389
|
|
|
|
Over six months through 12 months
|
313,747
|
|
|
|
More than 12 months
|
472,349
|
|
|
|
Total
|
$
|
1,271,707
|
|
32
Table 10
SHORT-TERM BORROWINGS
|
|
2013
|
2012
|
2011
|
|||||||||||||||||
|
|
Amount
|
Rate
|
Amount
|
Rate
|
Amount
|
Rate
|
||||||||||||||
|
|
(dollars in thousands)
|
|||||||||||||||||||
|
Master notes
|
||||||||||||||||||||
|
At December 31
|
$
|
411,907
|
|
0.42
|
%
|
$
|
399,047
|
|
0.47
|
%
|
$
|
375,396
|
|
0.55
|
%
|
|||||
|
Average during year
|
463,933
|
|
0.40
|
|
450,269
|
|
0.46
|
|
383,038
|
|
0.54
|
|
||||||||
|
Maximum month-end balance during year
|
487,126
|
|
477,997
|
|
392,648
|
|
||||||||||||||
|
Repurchase agreements
|
||||||||||||||||||||
|
At December 31
|
96,960
|
|
0.34
|
|
111,907
|
|
0.29
|
|
172,275
|
|
0.40
|
|
||||||||
|
Average during year
|
108,612
|
|
0.29
|
|
143,140
|
|
0.35
|
|
177,983
|
|
0.48
|
|
||||||||
|
Maximum month-end balance during year
|
120,167
|
|
171,967
|
|
205,992
|
|
||||||||||||||
|
Federal funds purchased
|
||||||||||||||||||||
|
At December 31
|
2,551
|
|
0.13
|
|
2,551
|
|
0.25
|
|
2,551
|
|
0.25
|
|
||||||||
|
Average during year
|
2,551
|
|
0.13
|
|
2,551
|
|
0.13
|
|
2,551
|
|
0.11
|
|
||||||||
|
Maximum month-end balance during year
|
2,551
|
|
2,551
|
|
2,551
|
|
||||||||||||||
|
Notes payable to Federal Home Loan Banks
|
||||||||||||||||||||
|
At December 31
|
—
|
|
—
|
|
55,000
|
|
3.33
|
|
65,000
|
|
4.79
|
|
||||||||
|
Average during year
|
21,329
|
|
2.60
|
|
68,538
|
|
3.69
|
|
74,356
|
|
4.10
|
|
||||||||
|
Maximum month-end balance during year
|
25,000
|
|
—
|
|
95,000
|
|
—
|
|
82,000
|
|
||||||||||
|
Other
|
||||||||||||||||||||
|
At December 31
|
—
|
|
—
|
|
—
|
|
—
|
|
—
|
|
—
|
|
||||||||
|
Average during year
|
—
|
|
—
|
|
—
|
|
—
|
|
14,530
|
|
—
|
|
||||||||
|
Maximum month-end balance during year
|
—
|
|
—
|
|
20,005
|
|
||||||||||||||
Short-term borrowings
At
December 31, 2013
, short-term borrowings totaled
$511.4 million
compared to
$568.5 million
at
December 31, 2012
. The decrease in short-term borrowings since
December 31, 2012
, is due to repayments of FHLB borrowings. Table 10 provides information on short-term borrowings.
Long-term obligations
Long-term obligations equaled
$510.8 million
at
December 31, 2013
, up
$65.8 million
from
December 31, 2012
. The increase since
December 31, 2012
, is a result of additional FHLB borrowings.
At
December 31, 2013
and
December 31, 2012
, long-term obligations included
$96.4 million
in junior subordinated debentures representing obligations to FCB/NC Capital Trust III, a special purpose entity and the grantor trust for
$93.5 million
of trust preferred securities. FCB/NC Capital Trust III's trust preferred securities mature in 2036 and may be redeemed at par in whole or in part at any time. BancShares has guaranteed all obligations of FCB/NC Capital Trust III. The proceeds from the trust preferred securities were used to purchase the junior subordinated debentures issued by BancShares.
33
NET INTEREST INCOME
Net interest income for
2013
totaled
$740.2 million
, a
$174.5 million
, or
19.1 percent
decrease from
2012
. Net interest income for
2012
totaled
$914.7 million
, a
$43.7 million
increase over the
$871.0 million
recorded during 2011. The taxable-equivalent net yield on interest-earning assets decreased
102
basis points during
2013
to
3.82 percent
from
4.84 percent
during
2012
, primarily the result of an unfavorable rate variance resulting from lower asset yields. The taxable-equivalent net yield equaled
4.65 percent
during 2011.
The
2013
reduction in the taxable-equivalent net yield on interest earning assets reversed a three-year trend of increasing net yields that began in 2010. During that period, loan yields increased as yields on investment securities and funding costs declined.
Interest income amounted to
$796.8 million
during
2013
, a decrease of
$208.0 million
, or
20.7 percent
, as compared to
2012
. Interest-earning assets averaged
$19.43 billion
during
2013
, an increase of
$459.0 million
, or
2.4 percent
, from
2012
.
Interest income from loans and leases decreased $
210.4 million
, or
21.7 percent
, from $
967.6 million
in
2012
, to $
757.2 million
in
2013
. The
2013
decline is the combined result of a
138
basis-point decrease in the taxable-equivalent loan yield and a
$397.0 million
reduction in average loans and leases. The reduction in average loans represents continuing reductions in acquired loans, partially offset by originated loan growth.
The
2013
loan yield reduction ended a three-year trend of improving returns on the loan portfolio. The taxable-equivalent loan yield increased from
5.49 percent
in 2009 in each successive year until
2012
, when the loan yield reached
7.15 percent
, before declining to
5.77 percent
during
2013
. The growth from 2009 to
2012
and the reduction in
2013
are due to changes in acquired loan accretion income resulting from the FDIC-assisted transactions. Accretion income for
2013
,
2012
and 2011 totaled
$224.7 million
,
$304.0 million
and
$319.4 million
, respectively. Accretion income will continue to decline as acquired loan balances are repaid. Factors affecting the amount of accretion include unscheduled loan payments, changes in estimated cash flows and impairment. Additionally, fair value discounts related to non-pooled loans that have been repaid unexpectedly are accreted into interest income at the time the loan obligation is satisfied. Collectively, these factors may contribute to volatility in loan interest income in future periods.
Interest income earned on investment securities totaled
$36.9 million
,
$35.5 million
and
$46.0 million
, respectively, during
2013
,
2012
and 2011. During
2013
, the benefit of a
$507.4 million
increase in the average investment securities portfolio was largely offset by a
5
basis point reduction in the taxable-equivalent yield. During
2012
, the impact of a
35
basis point reduction in the taxable-equivalent yield more than offset the benefit of a
$482.8 million
increase in the average securities portfolio. The reductions in the taxable-equivalent yield on the investment portfolio during
2013
and
2012
are due to lower reinvestment rates on new securities compared to maturing and called securities. Management anticipates the yield on investment securities will generally remain at current low levels until the Federal Reserve begins to raise the benchmark fed funds rates, an action that would likely lead to higher asset yields.
Interest expense amounted to
$56.6 million
in
2013
, a $
33.5 million
, or
37.2 percent
decrease from
2012
, the result of a
22
basis point decrease in the rate and a
$387.7 million
decrease in average interest-bearing liabilities. Interest expense declined for the fourth consecutive year during
2013
. The rate on all interest-bearing liabilities fell to
0.41 percent
during
2013
compared to
0.63 percent
during
2012
and
0.96 percent
during 2011.
Much of the reduction in funding costs results from a change in the deposit mix. Interest expense on interest-bearing deposits equaled
$34.5 million
in
2013
, compared to
$57.6 million
in
2012
, a
$23.1 million
decrease. Average time deposits declined from
$5.35 billion
in 2011 to
$4.09 billion
in
2012
and
$3.20 billion
in
2013
. While time deposit balances were falling, average money market balances increased from
$5.51 billion
in 2011 to
$5.99 billion
in
2012
and
$6.34 billion
in
2013
. While not directly affecting net interest income, non-interest bearing demand deposits also experienced significant growth from 2011 to
2013
.
Interest expense on long-term obligations decreased
$8.1 million
, from
$27.5 million
in
2012
to
$19.4 million
in
2013
, primarily due to the early redemption of $150.0 million in trust preferred securities during July 2012.
34
Table 11 isolates the changes in taxable-equivalent net interest income due to changes in volume and interest rates for
2013
and
2012
.
Table 11
CHANGES IN CONSOLIDATED TAXABLE EQUIVALENT NET INTEREST INCOME
|
2013
|
2012
|
||||||||||||||||||||||
|
Change from previous year due to:
|
Change from previous year due to:
|
||||||||||||||||||||||
|
Yield/
|
Total
|
Yield/
|
Total
|
||||||||||||||||||||
|
Volume
|
Rate
|
Change
|
Volume
|
Rate
|
Change
|
||||||||||||||||||
|
(dollars in thousands)
|
|||||||||||||||||||||||
|
Assets
|
|||||||||||||||||||||||
|
Loans and leases
|
$
|
(25,895
|
)
|
$
|
(184,646
|
)
|
$
|
(210,541
|
)
|
$
|
(33,990
|
)
|
$
|
33,567
|
|
$
|
(423
|
)
|
|||||
|
Investment securities:
|
|||||||||||||||||||||||
|
U.S. Treasury
|
(885
|
)
|
25
|
|
(860
|
)
|
(1,903
|
)
|
(4,114
|
)
|
(6,017
|
)
|
|||||||||||
|
Government agency
|
(144
|
)
|
(3,412
|
)
|
(3,556
|
)
|
6,038
|
|
(10,371
|
)
|
(4,333
|
)
|
|||||||||||
|
Mortgage-backed securities
|
15,787
|
|
(7,533
|
)
|
8,254
|
|
6,239
|
|
174
|
|
6,413
|
|
|||||||||||
|
Corporate bonds
|
(1,287
|
)
|
(1,287
|
)
|
(2,574
|
)
|
(4,635
|
)
|
(2,026
|
)
|
(6,661
|
)
|
|||||||||||
|
State, county and municipal
|
(39
|
)
|
2
|
|
(37
|
)
|
(213
|
)
|
(9
|
)
|
(222
|
)
|
|||||||||||
|
Other
|
48
|
|
(67
|
)
|
(19
|
)
|
(267
|
)
|
59
|
|
(208
|
)
|
|||||||||||
|
Total investment securities
|
13,480
|
|
(12,272
|
)
|
1,208
|
|
5,259
|
|
(16,287
|
)
|
(11,028
|
)
|
|||||||||||
|
Overnight investments
|
839
|
|
146
|
|
985
|
|
396
|
|
(52
|
)
|
344
|
|
|||||||||||
|
Total interest-earning assets
|
$
|
(11,576
|
)
|
$
|
(196,772
|
)
|
$
|
(208,348
|
)
|
$
|
(28,335
|
)
|
$
|
17,228
|
|
$
|
(11,107
|
)
|
|||||
|
Liabilities
|
|||||||||||||||||||||||
|
Interest-bearing deposits:
|
|||||||||||||||||||||||
|
Checking With Interest
|
$
|
21
|
|
$
|
(755
|
)
|
$
|
(734
|
)
|
$
|
195
|
|
$
|
(540
|
)
|
$
|
(345
|
)
|
|||||
|
Savings
|
42
|
|
(5
|
)
|
37
|
|
69
|
|
(742
|
)
|
(673
|
)
|
|||||||||||
|
Money market accounts
|
853
|
|
(7,283
|
)
|
(6,430
|
)
|
1,498
|
|
(6,955
|
)
|
(5,457
|
)
|
|||||||||||
|
Time deposits
|
(7,605
|
)
|
(8,341
|
)
|
(15,946
|
)
|
(15,194
|
)
|
(22,651
|
)
|
(37,845
|
)
|
|||||||||||
|
Total interest-bearing deposits
|
(6,689
|
)
|
(16,384
|
)
|
(23,073
|
)
|
(13,432
|
)
|
(30,888
|
)
|
(44,320
|
)
|
|||||||||||
|
Short-term borrowings
|
(424
|
)
|
(1,959
|
)
|
(2,383
|
)
|
101
|
|
(987
|
)
|
(886
|
)
|
|||||||||||
|
Long-term obligations
|
(5,059
|
)
|
(3,015
|
)
|
(8,074
|
)
|
(9,118
|
)
|
280
|
|
(8,838
|
)
|
|||||||||||
|
Total interest-bearing liabilities
|
$
|
(12,172
|
)
|
$
|
(21,358
|
)
|
$
|
(33,530
|
)
|
$
|
(22,449
|
)
|
$
|
(31,595
|
)
|
$
|
(54,044
|
)
|
|||||
|
Change in net interest income
|
$
|
596
|
|
$
|
(175,414
|
)
|
$
|
(174,818
|
)
|
$
|
(5,886
|
)
|
$
|
48,823
|
|
$
|
42.937
|
|
|||||
_________________
Loans and leases include acquired loans, originated loans, nonaccrual loans and loans held for sale. The rate/volume variance is allocated equally between the changes in volume and rate.
NONINTEREST INCOME
Noninterest income is an essential component of our total revenue and is critical to our ability to sustain adequate profitability levels. The primary sources of noninterest income have traditionally consisted of cardholder services income, merchant services income, service charges on deposit accounts and revenues derived from wealth management services. Table 12 provides the components of noninterest income for the previous five years. Noninterest income for 2011, 2010 and 2009 included significant acquisition gains recorded in conjunction with the FDIC-assisted transactions.
During
2013
and
2012
, noninterest income has been significantly influenced by post-acquisition adjustments to the FDIC receivable resulting from the FDIC-assisted transactions. Adjustments to the FDIC receivable are generally offset by noninterest income, with increases to the FDIC receivable generating an increase in noninterest income and reductions in the FDIC receivable triggering a reduction in noninterest income as the FDIC receivable is amortized. During
2013
, BancShares
35
also experienced large recoveries of acquired loan balances that were previously charged off. BancShares records these recoveries as noninterest income rather than as an adjustment to the allowance for loan and lease losses since charge-offs on acquired loans are primarily recorded through the nonaccretable difference.
For
2013
, noninterest income amounted to
$263.6 million
, compared to
$189.3 million
for
2012
. The
$74.3 million
increase in
2013
includes a
$29.3 million
favorable change in the adjustments to the FDIC receivable resulting from lower amortization of the FDIC receivable for post-acquisition improvements. Additionally, during
2013
, BancShares recognized a
$19.2 million
increase in recoveries of acquired loan balances previously charged off, net of amounts shared with the FDIC.
Other noninterest income for
2013
included
$7.5 million
generated from the sale of our rights and most of our obligations under various service agreements with client banks, some of which are controlled by Related Persons. Inclusive of asset impairments and severance costs recorded in conjunction with the sale that are included in noninterest expense, we recorded a net gain of
$5.5 million
. We will continue to provide processing services to First Citizens Bank and Trust Company, Inc. (FCB-SC), an entity controlled by Related Persons and our largest client bank. As a result of the
2013
sale of the client bank agreements, we experienced a
$12.0 million
reduction in fees from processing services. Other noninterest income for 2013 also included $3.6 million of income related to the TARP securities.
Other noninterest income in 2011 included a $9.7 million gain on the redemption of trust preferred securities.
Year-to-date noninterest income benefited from a
$5.7 million
increase in merchant services income and a
$3.2 million
increase in cardholder services income, each of which results from higher transaction volume. Mortgage income increased
$3.0 million
due to increased mortgage originations and wealth management services income increased
$2.4 million
primarily due to improved returns on brokerage services.
Table 12
NONINTEREST INCOME
|
Year ended December 31
|
|||||||||||||||||||
|
2013
|
2012
|
2011
|
2010
|
2009
|
|||||||||||||||
|
(dollars in thousands)
|
|||||||||||||||||||
|
Gain on acquisitions
|
$
|
—
|
|
$
|
—
|
|
$
|
150,417
|
|
$
|
136,000
|
|
$
|
104,434
|
|
||||
|
Cardholder services
|
48,360
|
|
45,174
|
|
56,279
|
|
56,578
|
|
48,986
|
|
|||||||||
|
Merchant services
|
56,024
|
|
50,298
|
|
54,543
|
|
50,997
|
|
46,390
|
|
|||||||||
|
Service charges on deposit accounts
|
60,661
|
|
61,564
|
|
63,775
|
|
73,762
|
|
78,028
|
|
|||||||||
|
Wealth management services
|
59,628
|
|
57,236
|
|
54,974
|
|
51,378
|
|
46,071
|
|
|||||||||
|
Fees from processing services
|
22,821
|
|
34,816
|
|
30,487
|
|
29,097
|
|
30,904
|
|
|||||||||
|
Securities gains (losses)
|
—
|
|
2,277
|
|
(288
|
)
|
1,952
|
|
(511
|
)
|
|||||||||
|
Other service charges and fees
|
15,696
|
|
14,239
|
|
22,647
|
|
20,820
|
|
16,411
|
|
|||||||||
|
Mortgage income
|
11,065
|
|
8,072
|
|
6,597
|
|
9,699
|
|
10,435
|
|
|||||||||
|
Insurance commissions
|
10,694
|
|
9,974
|
|
9,165
|
|
8,650
|
|
8,129
|
|
|||||||||
|
ATM income
|
5,026
|
|
5,279
|
|
6,020
|
|
6,656
|
|
6,856
|
|
|||||||||
|
Adjustments to FDIC receivable and payable for loss share agreements
|
(72,342
|
)
|
(101,594
|
)
|
(19,305
|
)
|
(46,806
|
)
|
2,800
|
|
|||||||||
|
Recoveries of acquired loans previously charged off
|
29,699
|
|
10,489
|
|
13,533
|
|
—
|
|
—
|
|
|||||||||
|
Other
|
16,271
|
|
(8,524
|
)
|
15,522
|
|
7,431
|
|
4,518
|
|
|||||||||
|
Total noninterest income
|
$
|
263,603
|
|
$
|
189,300
|
|
$
|
464,366
|
|
$
|
406,214
|
|
$
|
403,451
|
|
||||
36
NONINTEREST EXPENSE
The primary components of noninterest expense are salaries and related employee benefits, occupancy costs for branch offices and support facilities and equipment and software costs for our branch offices and our technology and operations infrastructure. Noninterest expense equaled
$771.4 million
for
2013
, a
$4.4 million
or
0.6 percent
increase from the
$766.9 million
recorded during
2012
, the net result of higher employee benefits expense and lower foreclosure-related expenses.
Salaries and wages have been essentially unchanged during the past three years, following the increases during 2011 and 2010 that resulted from workforce expansion associated with the FDIC-assisted transactions. Employee benefits, however, have increased significantly over the past three years. During
2013
, employee benefits expense increased
$11.6 million
primarily due to higher pension expense. As a result of applying a lower discount rate during
2013
, pension expense increased
$8.8 million
over
2012
. Employee health costs also increased during
2013
due to general increases in health care costs.
Equipment expense increased
$0.7 million
or
1.0 percent
during
2013
due to higher software costs. Equipment expenses will increase in future periods as we continue an effort to update our core technology systems and related business processes. As each phase of the project is completed, we anticipate that equipment expense, including depreciation expense for software and hardware investments and related maintenance expense, will increase. The project will also require facility-related investments, which will result in higher occupancy costs in future periods. The project began in 2013 and will continue until 2016 with total costs estimated to exceed $100.0 million.
Noninterest expense for
2013
includes a
$5.8 million
increase in consultant fees resulting from technology projects and various strategic business initiatives. Cardholder reward programs increased
$5.8 million
during
2013
when compared to
2012
. The increase was primarily driven by the termination of a debit card reward program during 2012 and adjustments to the estimated redemption rates for the credit card reward program. Advertising expense increased
$4.4 million
during
2013
, when compared to
2012
, due to costs associated with promotion of a new corporate brand. Noninterest expense also includes
$1.4 million
of fixed asset writedowns that resulted from the sale of service agreements with client banks. The writedowns related to prior technology investments that became impaired as a result of that transaction.
Foreclosure-related expenses decreased $
23.5 million
, or
57.9 percent
, in
2013
when compared to
2012
, due to a decrease in foreclosure activity arising from the FDIC-assisted transactions and improvements in real estate values that have contributed to more favorable results from collateral liquidation. Foreclosure-related expenses include costs to maintain foreclosed property, write-downs following foreclosure and gains or losses recognized at the time of sale.
Collection expense also declined during
2013
due to lower loan balances in process of collection. Cardholder processing expense decreased during
2013
primarily due to the favorable impact of a new credit card growth incentive agreement.
INCOME TAXES
We monitor and evaluate the potential impact of current events on the estimates used to establish income tax expenses and income tax liabilities. On a periodic basis, we evaluate our income tax positions based on current tax law, positions taken by various tax auditors within the jurisdictions where BancShares is required to file income tax returns, as well as potential or pending audits or assessments by tax auditors.
For
2013
, income tax expense totaled
$97.0 million
compared to
$59.8 million
during
2012
, reflecting effective tax rates of
36.6 percent
and
30.8 percent
during the respective periods.
The lower effective tax rate for
2012
reflects the impact of a
$6.4 million
credit to income tax expense resulting from the favorable outcome of state tax audits for the period
2008-2010
, net of additional federal taxes. The higher effective tax rate for
2013
also reflects the proportionately smaller impact of permanent differences.
37
Table 13
NONINTEREST EXPENSE
|
Year ended December 31
|
|||||||||||||||||||
|
2013
|
2012
|
2011
|
2010
|
2009
|
|||||||||||||||
|
(dollars in thousands)
|
|||||||||||||||||||
|
Salaries and wages
|
$
|
308,941
|
|
$
|
307,331
|
|
$
|
308,088
|
|
$
|
297,897
|
|
$
|
264,342
|
|
||||
|
Employee benefits
|
90,479
|
|
78,861
|
|
72,526
|
|
64,733
|
|
64,390
|
|
|||||||||
|
Occupancy expense
|
75,718
|
|
74,798
|
|
74,832
|
|
72,766
|
|
66,266
|
|
|||||||||
|
Equipment expense
|
75,545
|
|
74,822
|
|
69,951
|
|
66,894
|
|
60,310
|
|
|||||||||
|
Merchant processing
|
35,279
|
|
33,313
|
|
37,196
|
|
35,663
|
|
28,142
|
|
|||||||||
|
FDIC insurance expense
|
10,175
|
|
10,656
|
|
16,459
|
|
23,167
|
|
29,344
|
|
|||||||||
|
Foreclosure-related expenses
|
17,134
|
|
40,654
|
|
46,133
|
|
20,439
|
|
15,107
|
|
|||||||||
|
Cardholder processing
|
9,892
|
|
11,816
|
|
11,418
|
|
11,102
|
|
14,463
|
|
|||||||||
|
Collection
|
21,209
|
|
25,591
|
|
23,237
|
|
20,485
|
|
2,102
|
|
|||||||||
|
Processing fees paid to third parties
|
15,095
|
|
14,454
|
|
16,336
|
|
13,327
|
|
9,672
|
|
|||||||||
|
Cardholder reward programs
|
10,154
|
|
4,325
|
|
11,780
|
|
11,624
|
|
8,457
|
|
|||||||||
|
Telecommunications
|
10,033
|
|
11,131
|
|
12,131
|
|
11,328
|
|
11,314
|
|
|||||||||
|
Consultant
|
9,740
|
|
3,915
|
|
3,021
|
|
2,532
|
|
2,508
|
|
|||||||||
|
Advertising
|
8,286
|
|
3,897
|
|
7,957
|
|
8,301
|
|
8,111
|
|
|||||||||
|
Other
|
73,700
|
|
71,369
|
|
81,860
|
|
73,118
|
|
66,975
|
|
|||||||||
|
Total noninterest expense
|
$
|
771,380
|
|
$
|
766,933
|
|
$
|
792,925
|
|
$
|
733,376
|
|
$
|
651,503
|
|
||||
SHAREHOLDERS’ EQUITY AND CAPITAL ADEQUACY
We are committed to effectively managing our capital to protect our depositors, creditors and shareholders. We continually monitor the capital levels and ratios for BancShares and FCB to ensure they comfortably exceed the minimum requirements imposed by regulatory authorities and to ensure they are appropriate, given growth projections, risk profile and potential changes in the regulatory environment. Failure to meet certain capital requirements may result in actions by regulatory agencies that could have a material impact on our consolidated financial statements.
Table 14
provides information on capital adequacy for BancShares as of
December 31, 2013, 2012, and 2011
.
Table 14
ANALYSIS OF CAPITAL ADEQUACY
|
|
December 31, 2013
|
December 31, 2012
|
December 31, 2011
|
Regulatory
minimum |
Well-capitalized requirement
|
||||||||||||
|
|
(dollars in thousands)
|
||||||||||||||||
|
Tier 1 capital
|
$
|
2,109,139
|
|
$
|
1,949,985
|
|
$
|
2,072,610
|
|
||||||||
|
Tier 2 capital
|
211,653
|
|
229,385
|
|
250,412
|
|
|||||||||||
|
Total capital
|
$
|
2,320,792
|
|
$
|
2,179,370
|
|
$
|
2,323,022
|
|
||||||||
|
Risk-adjusted assets
|
$
|
14,134,278
|
|
$
|
13,663,353
|
|
$
|
13,447,702
|
|
||||||||
|
Risk-based capital ratios
|
|||||||||||||||||
|
Tier 1 capital
|
14.92
|
%
|
14.27
|
%
|
15.41
|
%
|
4.00
|
%
|
6.00
|
%
|
|||||||
|
Total capital
|
16.42
|
|
15.95
|
|
17.27
|
|
8.00
|
|
10.00
|
|
|||||||
|
Tier 1 leverage ratio
|
9.82
|
|
9.23
|
|
9.90
|
|
3.00
|
|
5.00
|
|
|||||||
BancShares continues to exceed minimum capital standards, and FCB remains well-capitalized.
38
During the second quarter of 2013, our board granted authority to purchase up to 100,000 and 25,000 shares of Class A and Class B common stock, respectively, beginning on July 1, 2013, and continuing through June 30, 2014. As of
December 31, 2013
, no purchases had occurred pursuant to that authorization.
During 2012, our board granted authority to purchase up to 100,000 and 25,000 shares of Class A and Class B common stock, respectively, through June 30, 2013. During 2012, we purchased and retired 56,276 shares of Class A common stock and 100 shares of Class B common stock pursuant to the July 1, 2012, board authorization. During 2013, BancShares purchased and retired 1,973 shares of Class A common stock pursuant to July 1, 2012, authorization.
Additionally, pursuant to separate authorizations, during 2012, BancShares purchased and retired 606,829 shares of Class B common stock in privately negotiated transactions.
BancShares had
$93.5 million
of trust preferred capital securities included in tier 1 capital at
December 31, 2013
,
December 31, 2012
and
$243.5 million
at
December 31, 2011
. During
2012
, BancShares redeemed
$150.0 million
of trust preferred capital securities.
Beginning
January 1, 2015
,
75 percent
of our trust preferred capital securities will be excluded from tier 1 capital, with the remaining
25 percent
phased out
January 1, 2016
. Elimination of all trust preferred capital securities from the
December 31, 2013
capital structure would result in a proforma tier 1 leverage capital ratio of
9.38 percent
, a tier 1 risk-based capital ratio of
14.26 percent
and a total risk-based capital ratio of
15.76 percent
. On a proforma basis assuming disallowance of all trust preferred capital securities, BancShares and FCB continue to remain well-capitalized under current regulatory guidelines.
Tier 2 capital of BancShares and FCB includes qualifying subordinated debt that was issued in 2005 with a scheduled maturity date of June 1, 2015. Under current regulatory guidelines, when subordinated debt is within five years of its scheduled maturity date, issuers must discount the amount included in tier 2 capital by 20 percent for each year until the debt matures. The amount of subordinated debt that qualifies as tier 2 capital totaled $25.0 million as of
December 31, 2013
, compared to $50.0 million at December 31, 2012. Subordinated debt will be completely removed from tier 2 capital in the second quarter of 2014, one year prior to the scheduled maturity of the subordinated debt.
In July 2013, Bank regulatory agencies approved new global regulatory capital guidelines (Basel) aimed at strengthening existing capital requirements for bank holding companies through a combination of higher minimum capital requirements, new capital conservation buffers and more conservative definitions of capital and balance sheet exposure. When fully implemented in January 2019, the rule requires a minimum ratio of common equity tier 1 capital to risk-weighted assets of 4.5 percent. The rule also requires a common equity tier 1 capital conservation buffer of 2.5 percent of risk-weighted assets, resulting in a total capital ratio of 7.0 percent. The rule also raises the minimum ratio of tier 1 capital to risk-weighted assets from 4.0 percent to 6.0 percent and includes a minimum leverage ratio of 4.0 percent.
Management continues to monitor Basel developments and remains committed to managing our capital levels in a prudent manner. BancShares' tier 1 common equity ratio based on the current tier 1 capital and risk-weighted assets calculations, excluding trust preferred securities, is
14.26 percent
at
December 31, 2013
, compared to the fully phased-in requirement of
7.00 percent
. The proposed tier 1 common equity ratio is calculated in
Table 15
.
Table 15
TIER 1 COMMON EQUITY
|
December 31, 2013
|
|||
|
(dollars in thousands)
|
|||
|
Tier 1 capital
|
$
|
2,109,139
|
|
|
Less: restricted core capital
|
93,500
|
|
|
|
Tier 1 common equity
|
$
|
2,015,639
|
|
|
Risk-adjusted assets
|
$
|
14,134,278
|
|
|
Tier 1 common equity ratio
|
14.26
|
%
|
|
Under GAAP, the unrealized gains and losses on certain assets and liabilities, net of deferred taxes, are included in accumulated other comprehensive income (AOCI) within shareholder's equity. In the aggregate, these items represented a net reduction in
39
shareholders' equity of
$25.3 million
at
December 31, 2013
, compared to
$82.1 million
at
December 31, 2012
. The
$56.8 million
improvement in AOCI from
December 31, 2012
, reflects a significant improvement in the funded status of the defined benefit plan, net of an increase in unrealized losses on investment securities available for sale arising due to interest rate
changes during
2013
.
RISK MANAGEMENT
Effective risk management is critical to our success. The most significant risks we confront are credit, interest rate and liquidity risk. Credit risk is the risk of not collecting payments pursuant to the contractual terms of loan, lease and investment assets. Interest rate risk results from changes in interest rates which may impact the re-pricing of assets and liabilities in different amounts or at different dates. Liquidity risk is the risk that we will be unable to fund obligations to loan customers, depositors or other creditors at a reasonable cost.
The Dodd-Frank Act required that banks with total assets in excess of $10 billion establish an enterprise-wide risk committee consisting of members of its board of directors. At its July 2013 meeting, the board of directors established a Risk Committee that provides oversight of enterprise-wide risk management. The Risk Committee is responsible for establishing risk appetite and supporting tolerances for credit, market and operational risk and ensuring that risk is managed within those tolerances, monitoring compliance with laws and regulations, reviewing the investment securities portfolio to ensure that portfolio returns are managed within market risk tolerance and monitoring our legal activity and associated risk. With guidance from and oversight by the Risk Committee, management continually refines and enhances its risk management policies and procedures to maintain effective risk management programs and processes.
The Dodd-Frank Act also mandated that stress tests be developed and performed to ensure that financial institutions have sufficient capital to absorb losses and support operations during multiple economic and bank scenarios. Bank holding companies with total consolidated assets between $10 billion and $50 billion, including BancShares, will undergo annual company-run stress tests. As directed by the Federal Reserve, summaries of BancShares’ results in the severely adverse stress tests will be available to the public starting in June 2015. Through the stress testing program that has been implemented, BancShares and FCB will comply with current regulations. The results of stress testing activities will be considered in combination with other risk management and monitoring practices to maintain an effective risk management program.
Mortgage reform rules mandated by the Dodd-Frank Act became effective in January 2014, requiring lenders to make a reasonable, good faith determination of a borrower's ability to repay any consumer credit transaction secured by a dwelling and to limit prepayment penalties. Increased risks of legal challenge, private right of action and regulatory enforcement are presented by these rules. BancShares implemented the required system, process, procedural and product changes prior to the effective dates of the new rules. We have modified our underwriting standards to ensure compliance with the ability to repay requirements and have determined that we will continue to offer both qualified and non-qualified mortgage products. Historical performance and conservative underwriting of impacted loan portfolios mitigates the risks of non-compliance.
Credit risk management
The maintenance of excellent asset quality has historically been one of our key performance measures. Loans and leases not acquired by loss share agreements with the FDIC were underwritten in accordance with our credit policies and procedures and are subject to periodic ongoing reviews. Acquired loans were recorded at fair value as of the acquisition date and are subject to periodic reviews to identify any further credit deterioration. Our independent credit review function conducts risk reviews and analyses of both acquired and originated loans to ensure compliance with credit policies and to monitor asset quality trends. The risk reviews include portfolio analysis by geographic location, industry, collateral type and product. We strive to identify potential problem loans as early as possible, to record charge-offs or write-downs as appropriate and to maintain adequate allowances for loan and lease losses that are inherent in the loan and lease portfolio.
We maintain a well-diversified loan and lease portfolio and seek to minimize the risk associated with large concentrations within specific geographic areas, collateral types or industries. Despite our focus on diversification, several characteristics of our loan portfolio subject us to significant risk, such as our concentrations of real estate secured loans, revolving mortgage loans and medical-related loans.
We have historically carried a significant concentration of real estate secured loans. Within our originated loan portfolio, we mitigate that exposure through our underwriting policies that primarily rely on borrower cash flow rather than underlying collateral values. When we do rely on underlying real property values, we favor financing secured by owner-occupied real property and, as a result, a large percentage of our real estate secured loans are owner occupied. At
December 31, 2013
,
40
originated loans secured by real estate totaled
$10.08 billion
, or
83.3 percent
, of total originated loans and leases compared to
$9.66 billion
, or
83.5 percent
, of originated loans and leases at
December 31, 2012
, and
$9.59 billion
, or
82.8 percent
, at
December 31, 2011
.
Table 16
GEOGRAPHIC DISTRIBUTION OF REAL ESTATE COLLATERAL
|
December 31, 2013
|
||
|
Collateral location
|
Percent of total originated loans with collateral located in the state
|
|
|
North Carolina
|
58.5
|
%
|
|
Virginia
|
10.0
|
|
|
California
|
7.8
|
|
|
Florida
|
4.4
|
|
|
Georgia
|
4.1
|
|
|
Tennessee
|
2.6
|
|
|
Texas
|
2.3
|
|
|
All other locations
|
10.3
|
|
Among real estate secured loans, our revolving mortgage loans present a heightened risk due to long commitment periods during which the financial position of individual borrowers or collateral values may deteriorate significantly. In addition, a large percentage of our revolving mortgage loans are secured by junior liens. Substantial declines in collateral values could cause junior lien positions to become effectively unsecured. Revolving mortgage loans secured by real estate amounted to
$2.11 billion
, or
17.5 percent
, of originated loans at
December 31, 2013
, compared to
$2.21 billion
, or
19.1 percent
, at
December 31, 2012
, and
$2.30 billion
, or
19.8 percent
, at
December 31, 2011
.
Except for loans acquired in FDIC-assisted transactions, we have not acquired revolving mortgages in the secondary market nor have we originated these loans to customers outside of our market areas. All originated revolving mortgage loans were underwritten by us based on our standard lending criteria. The revolving mortgage loan portfolio consists largely of variable rate lines of credit which allow customer draws during the entire contractual period of the line of credit, typically 15 years. Approximately 85 percent of outstanding balances at
December 31, 2013
, require interest-only payments, while the remaining require monthly payments equal to 1.5 percent of the outstanding balance. Approximately
90.2 percent
of the revolving mortgage portfolio relates to properties in North Carolina and Virginia. Approximately
35.2 percent
of the loan balances outstanding are secured by senior collateral positions while the remaining
64.8 percent
are secured by junior liens.
During 2013, we engaged a third party to obtain credit quality data on certain of our junior lien revolving mortgage loans in an effort to analyze the default risk and loss severity, given recent changes in collateral values. By gathering information on the current lien position and delinquency status for both our junior lien position and the related senior lien, we were able to analyze the impact of the new data on our loss estimates. Less than 1 percent of the sampled junior liens had a related senior lien that was more than 90 days past due. Management concluded that, in the aggregate, the credit quality of loans secured by junior liens was in line with expectations and consistent with the credit quality and the probability of default of loans secured by senior liens.
Originated loans and leases to borrowers in medical, dental or related fields totaled
$3.32 billion
as of
December 31, 2013
, which represents
27.5 percent
of originated loans and leases, compared to
$3.02 billion
or
26.1 percent
of originated loans and leases at
December 31, 2012
, and
$3.07 billion
or
26.5 percent
of originated loans and leases at
December 31, 2011
. The credit risk of this industry concentration is mitigated through our underwriting policies that emphasize reliance on adequate borrower cash flow rather than underlying collateral value and our preference for financing secured by owner-occupied real property. Except for this single concentration, no other industry represented more than 10 percent of total originated loans and leases outstanding at
December 31, 2013
.
41
Table 17
NONPERFORMING ASSETS
|
|
December 31
|
||||||||||||||||||
|
|
2013
|
2012
|
2011
|
2010
|
2009
|
||||||||||||||
|
|
(dollars in thousands, except ratios)
|
||||||||||||||||||
|
Nonaccrual loans and leases:
|
|||||||||||||||||||
|
Acquired
|
$
|
28,493
|
|
$
|
74,479
|
|
$
|
302,102
|
|
$
|
160,024
|
|
$
|
116,446
|
|
||||
|
Originated
|
53,170
|
|
89,845
|
|
52,741
|
|
78,814
|
|
58,417
|
|
|||||||||
|
Other real estate owned:
|
|||||||||||||||||||
|
Covered under loss share agreements
|
47,081
|
|
102,577
|
|
148,599
|
|
112,748
|
|
93,774
|
|
|||||||||
|
Not covered under loss share agreements
|
36,898
|
|
43,513
|
|
50,399
|
|
52,842
|
|
40,607
|
|
|||||||||
|
Total nonperforming assets
|
$
|
165,642
|
|
$
|
310,414
|
|
$
|
553,841
|
|
$
|
404,428
|
|
$
|
309,244
|
|
||||
|
Nonperforming assets acquired
|
75,574
|
|
177,056
|
|
450,701
|
|
272,772
|
|
210,220
|
|
|||||||||
|
Nonperforming assets originated
|
90,068
|
|
133,358
|
|
103,140
|
|
131,656
|
|
99,024
|
|
|||||||||
|
Total nonperforming assets
|
$
|
165,642
|
|
$
|
310,414
|
|
$
|
553,841
|
|
$
|
404,428
|
|
$
|
309,244
|
|
||||
|
Accruing loans and leases 90 days or more past due:
|
|||||||||||||||||||
|
Acquired
|
$
|
193,892
|
|
$
|
281,000
|
|
$
|
292,194
|
|
$
|
302,120
|
|
$
|
—
|
|
||||
|
Originated
|
8,784
|
|
11,272
|
|
14,840
|
|
18,501
|
|
27,766
|
|
|||||||||
|
Loans and leases at December 31:
|
|||||||||||||||||||
|
Acquired
|
$
|
1,029,426
|
|
$
|
1,809,235
|
|
$
|
2,362,152
|
|
$
|
2,007,452
|
|
$
|
1,173,020
|
|
||||
|
Originated
|
12,104,298
|
|
11,576,115
|
|
11,581,637
|
|
11,480,577
|
|
11,664,999
|
|
|||||||||
|
Ratio of nonperforming assets to total loans, leases and other real estate owned:
|
|||||||||||||||||||
|
Acquired
|
7.02
|
%
|
9.26
|
%
|
17.95
|
%
|
12.87
|
%
|
16.59
|
%
|
|||||||||
|
Originated
|
0.74
|
|
1.15
|
|
0.89
|
|
1.14
|
|
0.85
|
|
|||||||||
|
Ratio of nonperforming assets to total loans, leases and other real estate owned
|
1.25
|
|
2.29
|
|
3.92
|
|
2.96
|
|
2.38
|
|
|||||||||
|
Interest income that would have been earned on nonperforming loans and leases had they been performing
|
$
|
18,430
|
|
$
|
27,397
|
|
$
|
23,326
|
|
$
|
18,519
|
|
$
|
4,172
|
|
||||
|
Interest income recognized on nonperforming loans and leases
|
2,062
|
|
10,374
|
|
8,589
|
|
9,922
|
|
3,746
|
|
|||||||||
Nonperforming assets include nonaccrual loans and leases and OREO resulting from both acquired and originated loans. The accrual of interest on originated loans and leases is discontinued when we deem that collection of additional principal or interest is doubtful. Originated loans and leases are returned to accrual status when both principal and interest are current and the asset is determined to be performing in accordance with the terms of the loan instrument. Accretion of income for acquired loans is discontinued when we are unable to estimate the amount or timing of cash flows. This designation may be made at acquisition date or subsequent to acquisition date, including at maturity when no formal repayment plan has been established. Acquired loans may begin or resume accretion of income if information becomes available that allows us to estimate the amount and timing of future cash flows.
Table 17
provides details on nonperforming assets and other risk elements.
At
December 31, 2013
, BancShares’ nonperforming assets amounted to
$165.6 million
or
1.25 percent
of total loans and leases plus OREO, compared to
$310.4 million
or
2.29 percent
at
December 31, 2012
, and
$553.8 million
or
3.92 percent
at
December 31, 2011
. Of the
$165.6 million
in nonperforming assets at
December 31, 2013
,
$75.6 million
related to acquired assets while the remaining
$90.1 million
resulted from originated assets. Nonperforming assets from originated loans represented
0.74 percent
of originated loans, leases and OREO at
December 31, 2013
, compared to
1.15 percent
at
December 31, 2012
.
Acquired nonaccrual loans equaled
$28.5 million
as of
December 31, 2013
, compared to
$74.5 million
at
December 31, 2012
, and
$302.1 million
at
December 31, 2011
. The
2013
reduction in acquired nonaccrual loans resulted from resolution of impaired loans, while the reduction during
2012
primarily results from the deployment of an acquired loan accounting system
42
for four of the FDIC-assisted transactions, which resulted in accretion income being recognized on loans previously classified as nonaccrual and accounted for under the cost recovery method. Utilization of the acquired loan accounting system improved our ability to forecast both the timing and the amount of cash flows on acquired loans, allowing us to accrete income on more of these assets under existing accounting standards. Originated nonaccrual loans decreased
$36.7 million
from
December 31, 2012
, to
$53.2 million
at
December 31, 2013
, due to lower nonaccrual commercial mortgage loans.
OREO includes foreclosed property and branch facilities that we have closed but not sold. Noncovered OREO totaled
$36.9 million
at
December 31, 2013
, compared to
$43.5 million
at
December 31, 2012
, and
$50.4 million
at
December 31, 2011
. At
December 31, 2013
, construction and land development properties including vacant land for development represented
37.6 percent
of OREO. Vacant land values experienced an especially steep decline during the economic slowdown due to a significant drop in demand and values may continue to decline if demand remains weak.
Once acquired, net book values of OREO are reviewed at least annually to evaluate if write-downs are required. Real estate appraisals are reviewed by the appraisal review department to ensure the quality of the appraised value in the report. The level of review is dependent on the value and type of the collateral, with higher value and more complex properties receiving a more detailed review. In a market of declining property values, as we have experienced in recent years, we utilize resources in addition to appraisals to obtain the most current market value. Changes to the value of the assets between scheduled valuation dates are monitored through continued communication with brokers and monthly reviews by the asset manager assigned to each asset. The asset manager uses the information gathered from brokers and other market sources to identify any significant changes in the market or the subject property as they occur. Valuations are then adjusted or new appraisals are ordered to ensure the reported values reflect the most current information. Decisions regarding write-downs are based on factors that include appraisals, broker opinions, previous offers received on the property, market conditions and the number of days the property has been on the market.
Total acquired and originated loans classified as trouble debt restructurings (TDRs) as of
December 31, 2013
, equaled
$206.8 million
,
$176.0 million
of which are performing under their modified terms. Originated TDRs that are performing under their modified terms equaled
$85.1 million
at
December 31, 2013
, compared to
$89.1 million
at
December 31, 2012
, and
$123.8 million
at
December 31, 2011
.
Table 18
provides further details on performing and nonperforming TDRs for the last five years.
Table 18
|
December 31
|
|||||||||||||||||||
|
2013
|
2012
|
2011
|
2010
|
2009
|
|||||||||||||||
|
(dollars in thousands)
|
|||||||||||||||||||
|
Accruing TDRs:
|
|||||||||||||||||||
|
Acquired
|
$
|
90,829
|
|
$
|
164,256
|
|
$
|
126,240
|
|
$
|
56,398
|
|
$
|
10,013
|
|
||||
|
Originated
|
85,126
|
|
89,133
|
|
123,796
|
|
64,995
|
|
55,025
|
|
|||||||||
|
Total accruing TDRs
|
$
|
175,955
|
|
$
|
253,389
|
|
$
|
250,036
|
|
$
|
121,393
|
|
$
|
65,038
|
|
||||
|
Nonaccruing TDRs:
|
|||||||||||||||||||
|
Acquired
|
$
|
11,479
|
|
$
|
28,951
|
|
$
|
43,491
|
|
$
|
12,364
|
|
$
|
—
|
|
||||
|
Originated
|
19,322
|
|
50,830
|
|
29,534
|
|
41,774
|
|
9,168
|
|
|||||||||
|
Total nonaccruing TDRs
|
$
|
30,801
|
|
$
|
79,781
|
|
$
|
73,025
|
|
$
|
54,138
|
|
$
|
9,168
|
|
||||
|
All TDRs:
|
|||||||||||||||||||
|
Acquired
|
$
|
102,308
|
|
$
|
193,207
|
|
$
|
169,731
|
|
$
|
68,762
|
|
$
|
10,013
|
|
||||
|
Originated
|
104,448
|
|
139,963
|
|
153,330
|
|
106,769
|
|
64,193
|
|
|||||||||
|
Total TDRs
|
$
|
206,756
|
|
$
|
333,170
|
|
$
|
323,061
|
|
$
|
175,531
|
|
$
|
74,206
|
|
||||
TDRs are selectively made to provide relief to customers experiencing liquidity challenges or other circumstances that could affect their ability to meet their debt obligations. Typical modifications include short-term deferral of interest or modification of payment terms. Nonperforming TDRs are not accruing interest and are included as nonperforming assets within nonaccrual loans and leases in
Table 17
.
Table 17
does not include performing TDRs, which are accruing interest based on the restructured terms.
43
The ALLL reflects the estimated losses resulting from the inability of our customers to make required payments. The ALLL is based on management's evaluation of the risk characteristics of the loan and lease portfolio under current economic conditions and considers such factors as the financial condition of the borrower, fair market value of collateral and other items that, in our opinion, deserve current recognition in estimating probable loan and lease losses. Our evaluation process is based on historical evidence and current trends among delinquencies, defaults and nonperforming assets.
During
2013
, we implemented enhancements to our modeling methodology for estimating the general reserve component of the ALLL for originated loans. Specifically for the originated commercial loans and leases segment, we refined our modeling methodology by increasing the granularity of the historical net loss data used to develop the applicable loss rates by utilizing information that further considers the class of the commercial loan and associated risk rating. For the originated noncommercial segment, we refined our modeling methodology to incorporate specific loan classes and delinquency status trends into the loss rates. The enhanced ALLL estimates implicitly include the risk of draws on open lines within each loan class. Management has also further enhanced a qualitative framework for considering economic conditions, loan concentrations and other relevant factors at a loan class level. We believe the methodology enhancements improve the granularity of historical net loss data and precision of our segment analysis. These enhancements resulted in certain reallocations between segments, allocation of the nonspecific allowance to specific loan classes and a reallocation of a portion of the reserve for unfunded commitments into the ALLL. Other than these modifications, the enhancements to the methodology had no material impact on the ALLL.
Acquired loans are recorded at fair value as of the loan's acquisition date and allowances are recorded for post-acquisition credit quality deterioration. Subsequent to the acquisition date, recurring analyses are performed on the credit quality of acquired loans to determine if expected cash flows have changed. Various criteria are used to select loans to be evaluated including change in accrual status, recent credit grade change, updated collateral appraisal and newly-developed workout plan. Based upon the results of the individual loan reviews, revised impairment amounts are calculated which generally result in additional allowance for loan losses or reversal of previously established allowances.
Groups of originated noncommercial loans are aggregated by type and probable loss estimates become the basis for the allowance amount. The loss estimates are based on trends of historical losses, delinquency patterns and various other credit risk indicators. During
2013
, noncommercial loan charge-offs declined from
2012
. Based upon the generally favorable trends in economic conditions and reduced loss experience, we reduced the loss estimates used to establish the allowance for noncommercial loans.
A loan is considered to be impaired under ASC Topic 310
Receivables
when, based upon current information and events, it is probable that BancShares will be unable to collect all amounts due according to the contractual terms of the loan. Originated impaired loans are placed on nonaccrual status. Originated loan relationships rated substandard or worse that are greater than or equal to
$500,000
are reviewed for potential impairment on a quarterly basis. Loans classified as TDRs are also reviewed for potential impairment. Specific valuation allowances are established or partial charge-offs are recorded on impaired loans for the difference between the loan amount and the estimated fair value.
At
December 31, 2013
, the allowance for loan and lease losses allocated to originated loans totaled
$179.9 million
or
1.49 percent
of originated loans and leases, compared to
$179.0 million
or
1.55 percent
at
December 31, 2012
, and
$180.9 million
or
1.56 percent
at
December 31, 2011
. An additional allowance of
$53.5 million
relates to acquired loans at
December 31, 2013
, established as a result of post-acquisition deterioration in credit quality for acquired loans. The allowance for acquired loans equaled
$140.0 million
at
December 31, 2012
, and
$89.3 million
at
December 31, 2011
. The allowance for acquired loans has decreased since
December 31, 2012
, due to reversal of previously recorded credit- and timing-related impairment, partially offset by newly-identified impairment.
Management considers the allowance adequate to absorb estimated probable losses that relate to loans and leases outstanding at
December 31, 2013
, although future additions may be necessary based on changes in economic conditions and other factors. In addition, various regulatory agencies, as an integral part of their examination process, periodically review the allowance for loan and lease losses. Such agencies may require adjustments to the allowance based on information available to them at the time of their examination.
BancShares recorded a credit to provision for loan and lease losses during
2013
of
$32.3 million
, compared to provision expense of
$142.9 million
during
2012
and
$232.3 million
during
2011
. The credit to provision expense related to acquired loans totaled
$51.5 million
during
2013
, compared to provision expense of
$100.8 million
during
2012
. The significant reduction in provision expense for acquired loans resulted from lower current impairment and payoffs of acquired loans for which an allowance had previously been established. Provision expense for originated loans totaled
$19.3 million
for
2013
, compared to
$42.0 million
during
2012
, a reduction of
$22.8 million
, resulting from credit quality improvements in the originated commercial loan portfolio.
44
Originated loan net charge-offs equaled
$25.8 million
during
2013
, compared to
$43.9 million
during
2012
and
$53.4 million
during
2011
. On an annualized basis, net charge-offs of originated loans represented
0.22 percent
of average originated loans and leases during
2013
, compared to
0.38 percent
during
2012
and
0.46 percent
during
2011
. Originated loan net charge-offs were down in most loan classes during
2013
, with significant reductions noted in revolving mortgage, commercial mortgage and commercial construction and land development loans.
Net charge-offs on acquired loans equaled
$34.9 million
in
2013
, compared to
$50.1 million
in
2012
,
2.49 percent
and
2.52 percent
of average acquired loans, respectively. Commercial mortgage and commercial and industrial loans experienced reductions in net charge-offs.
Table 19
provides details concerning the allowance for loan and lease losses for the past five years.
Table 20
details the allocation of the allowance for originated loan and lease losses among the various loan types. Note D of BancShares' Notes to Consolidated Financial Statements provides the allocation of the allowance for acquired loans and leases.
45
Table 19
ALLOWANCE FOR LOAN AND LEASE LOSSES
|
2013
|
2012
|
2011
|
2010
|
2009
|
|||||||||||||||
|
(dollars in thousands)
|
|||||||||||||||||||
|
Allowance for loan and lease losses at beginning of period
|
$
|
319,018
|
|
$
|
270,144
|
|
$
|
227,765
|
|
$
|
172,282
|
|
$
|
157,569
|
|
||||
|
Adjustment resulting from adoption of change in accounting for QSPEs and controlling financial interests, effective January 1, 2010
|
—
|
|
—
|
|
—
|
|
681
|
|
—
|
|
|||||||||
|
Reclassification
(1)
|
7,368
|
|
|||||||||||||||||
|
Provision for loan and lease losses
|
(32,255
|
)
|
142,885
|
|
232,277
|
|
143,519
|
|
79,364
|
|
|||||||||
|
Charge-offs:
|
|||||||||||||||||||
|
Commercial:
|
|||||||||||||||||||
|
Construction and land development
|
(11,609
|
)
|
(18,213
|
)
|
(47,621
|
)
|
(15,656
|
)
|
(14,085
|
)
|
|||||||||
|
Commercial mortgage
|
(20,401
|
)
|
(30,590
|
)
|
(56,880
|
)
|
(12,496
|
)
|
(2,081
|
)
|
|||||||||
|
Other commercial real estate
|
(1,243
|
)
|
(1,510
|
)
|
(29,087
|
)
|
(4,562
|
)
|
(173
|
)
|
|||||||||
|
Commercial and industrial
|
(8,877
|
)
|
(13,914
|
)
|
(11,994
|
)
|
(22,343
|
)
|
(17,114
|
)
|
|||||||||
|
Lease financing
|
(272
|
)
|
(361
|
)
|
(579
|
)
|
(1,825
|
)
|
(1,736
|
)
|
|||||||||
|
Other
|
(6
|
)
|
(28
|
)
|
(89
|
)
|
—
|
|
—
|
|
|||||||||
|
Total commercial loans
|
(42,408
|
)
|
(64,616
|
)
|
(146,250
|
)
|
(56,882
|
)
|
(35,189
|
)
|
|||||||||
|
Noncommercial:
|
|||||||||||||||||||
|
Residential mortgage
|
(4,935
|
)
|
(8,929
|
)
|
(11,289
|
)
|
(1,851
|
)
|
(1,966
|
)
|
|||||||||
|
Revolving mortgage
|
(6,460
|
)
|
(12,460
|
)
|
(13,940
|
)
|
(7,640
|
)
|
(8,390
|
)
|
|||||||||
|
Construction and land development
|
(3,827
|
)
|
(3,932
|
)
|
(12,529
|
)
|
(9,423
|
)
|
(3,521
|
)
|
|||||||||
|
Consumer
|
(10,396
|
)
|
(10,541
|
)
|
(12,832
|
)
|
(19,520
|
)
|
(20,288
|
)
|
|||||||||
|
Total noncommercial loans
|
(25,618
|
)
|
(35,862
|
)
|
(50,590
|
)
|
(38,434
|
)
|
(34,165
|
)
|
|||||||||
|
Total charge-offs
|
(68,026
|
)
|
(100,478
|
)
|
(196,840
|
)
|
(95,316
|
)
|
(69,354
|
)
|
|||||||||
|
Recoveries:
|
|||||||||||||||||||
|
Commercial:
|
|||||||||||||||||||
|
Construction and land development
|
1,039
|
|
445
|
|
607
|
|
—
|
|
517
|
|
|||||||||
|
Commercial mortgage
|
996
|
|
1,626
|
|
1,028
|
|
433
|
|
96
|
|
|||||||||
|
Other commercial real estate
|
109
|
|
14
|
|
502
|
|
—
|
|
—
|
|
|||||||||
|
Commercial and industrial
|
1,213
|
|
781
|
|
1,037
|
|
2,605
|
|
1,384
|
|
|||||||||
|
Lease financing
|
107
|
|
96
|
|
133
|
|
254
|
|
122
|
|
|||||||||
|
Other
|
1
|
|
4
|
|
2
|
|
—
|
|
—
|
|
|||||||||
|
Total commercial loans
|
3,465
|
|
2,966
|
|
3,309
|
|
3,292
|
|
2,119
|
|
|||||||||
|
Noncommercial:
|
|||||||||||||||||||
|
Residential mortgage
|
559
|
|
671
|
|
1,083
|
|
89
|
|
97
|
|
|||||||||
|
Revolving mortgage
|
660
|
|
698
|
|
653
|
|
425
|
|
182
|
|
|||||||||
|
Construction and land development
|
209
|
|
180
|
|
219
|
|
81
|
|
—
|
|
|||||||||
|
Consumer
|
2,396
|
|
1,952
|
|
1,678
|
|
2,712
|
|
2,305
|
|
|||||||||
|
Total noncommercial loans
|
3,824
|
|
3,501
|
|
3,633
|
|
3,307
|
|
2,584
|
|
|||||||||
|
Total recoveries
|
7,289
|
|
6,467
|
|
6,942
|
|
6,599
|
|
4,703
|
|
|||||||||
|
Net charge-offs
|
(60,737
|
)
|
(94,011
|
)
|
(189,898
|
)
|
(88,717
|
)
|
(64,651
|
)
|
|||||||||
|
Allowance for loan and lease losses at end of period
|
$
|
233,394
|
|
$
|
319,018
|
|
$
|
270,144
|
|
$
|
227,765
|
|
$
|
172,282
|
|
||||
|
Average loans and leases:
|
|||||||||||||||||||
|
Acquired
|
$
|
1,403,341
|
|
$
|
1,991,091
|
|
$
|
2,484,482
|
|
$
|
2,227,234
|
|
$
|
427,599
|
|
||||
|
Originated
|
11,760,402
|
|
11,569,682
|
|
11,565,971
|
|
11,638,581
|
|
11,635,355
|
|
|||||||||
|
Loans and leases at period end:
|
|||||||||||||||||||
|
Acquired
|
1,029,426
|
|
1,809,235
|
|
2,362,152
|
|
2,007,452
|
|
1,173,020
|
|
|||||||||
|
Originated
|
12,104,298
|
|
11,576,115
|
|
11,581,637
|
|
11,480,577
|
|
11,644,999
|
|
|||||||||
|
Allowance for loan and lease losses allocated to loans and leases:
|
|||||||||||||||||||
|
Acquired
|
$
|
53,520
|
|
$
|
139,972
|
|
$
|
89,261
|
|
$
|
51,248
|
|
$
|
3,500
|
|
||||
|
Originated
|
179,874
|
|
179,046
|
|
180,883
|
|
176,517
|
|
168,782
|
|
|||||||||
|
Total
|
$
|
233,394
|
|
$
|
319,018
|
|
$
|
270,144
|
|
$
|
227,765
|
|
$
|
172,282
|
|
||||
|
Provision for loan and lease losses related to balances:
|
|||||||||||||||||||
|
Acquired
|
$
|
(51,544
|
)
|
$
|
100,839
|
|
$
|
174,478
|
|
$
|
86,872
|
|
$
|
3,500
|
|
||||
|
Originated
|
19,289
|
|
42,046
|
|
57,799
|
|
56,647
|
|
75,864
|
|
|||||||||
|
Total
|
$
|
32,255
|
|
$
|
142,885
|
|
$
|
232,277
|
|
$
|
143,519
|
|
$
|
79,364
|
|
||||
|
Net charge-offs of loans and leases:
|
|||||||||||||||||||
|
Acquired
|
$
|
34,908
|
|
$
|
50,128
|
|
$
|
136,465
|
|
$
|
39,124
|
|
$
|
—
|
|
||||
|
Originated
|
25,829
|
|
43,883
|
|
53,433
|
|
49,593
|
|
64,651
|
|
|||||||||
|
Total
|
$
|
60,737
|
|
$
|
94,011
|
|
$
|
189,898
|
|
$
|
88,717
|
|
$
|
64,651
|
|
||||
|
Reserve for unfunded commitments
(1)
|
$
|
357
|
|
$
|
7,692
|
|
$
|
7,789
|
|
$
|
7,246
|
|
$
|
7,130
|
|
||||
|
Net charge-offs to average loans and leases:
|
|||||||||||||||||||
|
Acquired
|
2.49
|
%
|
2.52
|
%
|
5.49
|
%
|
1.76
|
%
|
—
|
%
|
|||||||||
|
Originated
|
0.22
|
|
0.38
|
|
0.46
|
|
0.43
|
|
0.56
|
|
|||||||||
|
Total
|
0.46
|
|
0.69
|
|
1.35
|
|
0.64
|
|
0.54
|
|
|||||||||
|
Allowance for loan and lease losses to total loans and leases:
|
|||||||||||||||||||
|
Acquired
|
5.20
|
|
7.74
|
|
3.78
|
|
2.55
|
|
0.30
|
|
|||||||||
|
Originated
|
1.49
|
|
1.55
|
|
1.56
|
|
1.54
|
|
1.45
|
|
|||||||||
|
Total
|
1.78
|
|
2.38
|
|
1.94
|
|
1.69
|
|
1.34
|
|
|||||||||
(1)
During 2013, BancShares modified the ALLL model and the methodology for estimating losses on unfunded commitments. As a result of these modifications, $7.4 million of the balance previously reported as a reserve of unfunded commitments was reclassified to the ALLL.
46
Table 20
ALLOCATION OF ALLOWANCE FOR LOAN AND LEASE LOSSES
|
|
December 31
|
|||||||||||||||||||||||||||||||||
|
|
2013
|
2012
|
2011
|
2010
|
2009
|
|||||||||||||||||||||||||||||
|
|
Allowance
for loan and lease losses |
Percent
of loans to total loans |
Allowance
for loan and lease losses |
Percent
of loans to total loans |
Allowance
for loan and lease losses |
Percent
of loans to total loans |
Allowance
for loan and lease losses |
Percent
of loans to total loans |
Allowance
for loan and lease losses |
Percent
of loans to total loans |
||||||||||||||||||||||||
|
|
(dollars in thousands)
|
|||||||||||||||||||||||||||||||||
|
Allowance for loan and lease losses allocated to:
|
||||||||||||||||||||||||||||||||||
|
Originated loans and leases
|
||||||||||||||||||||||||||||||||||
|
Commercial:
|
||||||||||||||||||||||||||||||||||
|
Construction and land development
|
$
|
10,335
|
|
2.4
|
%
|
$
|
6,031
|
|
2.3
|
%
|
$
|
5,467
|
|
2.7
|
%
|
$
|
10,512
|
|
2.5
|
%
|
$
|
4,572
|
|
2.9
|
%
|
|||||||||
|
Commercial mortgage
|
100,257
|
|
48.5
|
|
80,229
|
|
45.0
|
|
67,486
|
|
36.6
|
|
64,772
|
|
35.1
|
|
52,590
|
|
35.5
|
|
||||||||||||||
|
Other commercial real estate
|
1,009
|
|
1.4
|
|
2,059
|
|
1.2
|
|
2,169
|
|
1.0
|
|
2,200
|
|
1.1
|
|
5,366
|
|
1.2
|
|
||||||||||||||
|
Commercial and industrial
|
22,362
|
|
8.2
|
|
14,050
|
|
7.8
|
|
23,723
|
|
12.7
|
|
24,089
|
|
13.9
|
|
21,059
|
|
14.3
|
|
||||||||||||||
|
Lease financing
|
4,749
|
|
2.9
|
|
3,521
|
|
2.5
|
|
3,288
|
|
2.2
|
|
3,384
|
|
2.2
|
|
4,535
|
|
2.6
|
|
||||||||||||||
|
Other
|
190
|
|
1.3
|
|
1,175
|
|
0.9
|
|
1,315
|
|
1.1
|
|
1,473
|
|
1.4
|
|
1,333
|
|
1.5
|
|
||||||||||||||
|
Total commercial
|
138,902
|
|
64.7
|
|
107,065
|
|
59.7
|
|
103,448
|
|
56.4
|
|
106,430
|
|
56.2
|
|
89,455
|
|
58.0
|
|
||||||||||||||
|
Noncommercial:
|
||||||||||||||||||||||||||||||||||
|
Residential mortgage
|
10,511
|
|
7.5
|
|
3,836
|
|
6.1
|
|
8,879
|
|
5.6
|
|
7,009
|
|
6.5
|
|
8,213
|
|
6.7
|
|
||||||||||||||
|
Revolving mortgage
|
16,239
|
|
16.1
|
|
25,185
|
|
16.5
|
|
27,045
|
|
16.5
|
|
18,016
|
|
16.6
|
|
17,389
|
|
16.8
|
|
||||||||||||||
|
Construction and land development
|
681
|
|
1.0
|
|
1,721
|
|
1.0
|
|
1,427
|
|
1.0
|
|
1,751
|
|
1.4
|
|
3,709
|
|
2.0
|
|
||||||||||||||
|
Consumer
|
13,541
|
|
2.9
|
|
25,389
|
|
3.1
|
|
25,962
|
|
3.6
|
|
29,448
|
|
4.4
|
|
37,944
|
|
7.3
|
|
||||||||||||||
|
Total noncommercial
|
40,972
|
|
27.5
|
|
56,131
|
|
26.8
|
|
63,313
|
|
26.6
|
|
56,224
|
|
28.9
|
|
67,255
|
|
32.8
|
|
||||||||||||||
|
Nonspecific
(1)
|
—
|
|
15,850
|
|
14,122
|
|
13,863
|
|
12,072
|
|
||||||||||||||||||||||||
|
Total allowance for originated loan and lease losses
|
179,874
|
|
92.2
|
|
179,046
|
|
86.5
|
|
180,883
|
|
83.1
|
|
176,517
|
|
85.1
|
|
168,782
|
|
90.8
|
|
||||||||||||||
|
Acquired loans
|
53,520
|
|
7.8
|
|
139,972
|
|
13.5
|
|
89,261
|
|
16.9
|
|
51,248
|
|
14.9
|
|
3,500
|
|
9.2
|
|
||||||||||||||
|
Total allowance for loan and lease losses
|
$
|
233,394
|
|
100.0
|
%
|
$
|
319,018
|
|
100.0
|
%
|
$
|
270,144
|
|
100.0
|
%
|
$
|
227,765
|
|
100.0
|
%
|
$
|
172,282
|
|
100.0
|
%
|
|||||||||
(1)
During 2013, in connection with modifications to the ALLL model, the balance previously identified as nonspecific was allocated to various loan classes.
Interest rate risk management
Interest rate risk results principally from assets and liabilities maturing or repricing at different points in time, from assets and liabilities repricing at the same point in time but in different amounts and from short-term and long-term interest rates changing in different magnitudes. Market interest rates also have an impact on the interest rate and repricing characteristics of loans and leases that are originated as well as the rate characteristics of our interest-bearing liabilities.
We assess our interest rate risk by simulating future amounts of net interest income under various interest rate scenarios and comparing those results to forecasted net interest income assuming stable rates. Certain variable rate products, including revolving mortgage loans, have interest rate floors. Due to the existence of contractual floors on loans, competitive pressures that constrain our ability to reduce deposit interest rates and the extraordinarily low current level of interest rates, it is highly unlikely that the rates on most interest-earning assets and interest-bearing liabilities can decline materially from current levels. In our simulations, we do not calculate rate shocks, rate ramps or market value of equity for declining rate scenarios and assume the prime interest rate will not move below the
December 31, 2013
, rate of
3.25 percent
. Our rate shock simulations indicate that, over a 24-month period, net interest income will increase by
4.6 percent
and
1.2 percent
with rates rising 200- and 400-basis points, respectively. Our shock projections incorporate assumptions of likely customer migration of short-term deposit instruments to long-term, higher-rate instruments as rates rise. We also utilize the economic value of equity (EVE) as a tool in measuring and managing interest rate risk. As of
December 31, 2013
, the EVE calculated with a 200-basis point shock up in rates increases
0.7 percent
from the base case EVE value.
47
Table 21 provides the impact on net interest income resulting from various interest rate scenarios as of
December 31, 2013, and 2012
. Our shock projections incorporate assumptions of estimated customer migration of short-term deposit instruments to long-term, higher-rate instruments as rates rise. We also utilize the market value of equity as a tool in measuring and managing interest rate risk. Table 22 provides loan maturity distribution and information regarding the sensitivity of loans and leases to changes in interest rates.
Table 21
INTEREST RATE RISK ANALYSIS
|
|
Favorable (unfavorable) impact
on net interest income compared to stable rate scenario over the 12-month period following: |
||||
|
Assumed rate change
|
December 31, 2013
|
|
December 31, 2012
|
|
|
|
Most likely
|
—
|
%
|
—
|
%
|
|
|
Immediate 200 basis point increase
|
4.60
|
|
4.00
|
|
|
|
Gradual 200 basis point increase
|
2.80
|
|
3.00
|
|
|
We do not typically utilize interest rate swaps, floors, collars or other derivative financial instruments to attempt to hedge our overall balance sheet rate sensitivity and interest rate risk. However, we have entered into an interest rate swap to synthetically convert the variable rate on $93.5 million of junior subordinated debentures to a fixed rate of 5.50 percent through June 2016. The interest rate swap qualifies as a hedge under GAAP. See Note Q “Derivative” in the Notes to Consolidated Financial Statements for additional discussion of this interest rate swap.
Table 22
LOAN MATURITY DISTRIBUTION AND INTEREST RATE SENSITIVITY
|
|
At December 31, 2013, maturing
|
||||||||||||||
|
|
Within
One Year |
One to Five
Years |
After
Five Years |
Total
|
|||||||||||
|
|
(dollars in thousands)
|
||||||||||||||
|
Loans and leases:
|
|||||||||||||||
|
Secured by real estate
|
$
|
885,759
|
|
$
|
3,047,137
|
|
$
|
7,157,148
|
|
$
|
11,090,044
|
|
|||
|
Commercial and industrial
|
396,024
|
|
476,943
|
|
225,445
|
|
1,098,412
|
|
|||||||
|
Other
|
323,865
|
|
386,341
|
|
235,062
|
|
945,268
|
|
|||||||
|
Total loans and leases
|
1,605,648
|
|
3,910,421
|
|
7,617,655
|
|
13,133,724
|
|
|||||||
|
Acquired loans
|
332,297
|
|
186,002
|
|
511,127
|
|
1,029,426
|
|
|||||||
|
Originated loans
|
1,273,351
|
|
3,724,419
|
|
7,106,528
|
|
12,104,298
|
|
|||||||
|
Total loans and leases
|
$
|
1,605,648
|
|
$
|
3,910,421
|
|
$
|
7,617,655
|
|
$
|
13,133,724
|
|
|||
|
Loans maturing after one year with:
|
|||||||||||||||
|
Fixed interest rates
|
$
|
3,197,095
|
|
$
|
5,061,051
|
|
$
|
8,258,146
|
|
||||||
|
Floating or adjustable rates
|
713,326
|
|
2,556,604
|
|
3,269,930
|
|
|||||||||
|
Total
|
$
|
3,910,421
|
|
$
|
7,617,655
|
|
$
|
11,528,076
|
|
||||||
48
Liquidity risk management
Liquidity risk is the risk that an institution is unable to generate or obtain sufficient cash or its equivalents on a cost-effective basis to meet commitments as they fall due. The most common sources of liquidity risk arise from mismatches in the timing and value of on-balance sheet and off-balance sheet cash inflows and outflows. In general, on-balance sheet mismatches generate liquidity risk when the effective maturity of assets exceeds the effective maturity of liabilities. A commonly cited example of a balance sheet liquidity mismatch is when long-term loans (assets) are funded with short-term deposits (liabilities). Other forms of liquidity risk include market constraints on the ability to convert assets into cash at expected levels, an inability to access funding sources at sufficient levels at a reasonable cost, and changes in economic conditions or exposure to credit, market, operation, legal and reputation risks that can affect an institution’s liquidity risk profile.
We utilize various limit-based measures to monitor, measure and control liquidity risk across three different types of liquidity:
|
•
|
Tactical liquidity measures the risk of a negative cash flow position whereby cash outflows exceed cash inflows over a short-term horizon out to nine weeks;
|
|
•
|
Structural liquidity measures the amount by which illiquid assets are supported by long-term funding; and
|
|
•
|
Contingent liquidity utilizes cash flow stress testing across three crisis scenarios to determine the adequacy of our liquidity.
|
We aim to maintain a diverse mix of existing and potential liquidity sources to support the liquidity management function. At its core is a reliance on the retail deposit book, due to the generally stable balances and low cost it offers. Other sources of liquidity include asset-based liquidity in the form of cash and unencumbered securities, as well as access to wholesale funding from external counterparties, primarily FHLB advances and Federal Funds lines. We aim to avoid funding concentrations by diversifying our external funding with respect to maturities, counterparties and nature (i.e. secured versus unsecured).
One of our principal sources of noncore funding is advances from the FHLB of Atlanta. Outstanding FHLB advances equaled
$250.3 million
as of
December 31, 2013
, and we had sufficient collateral pledged to secure
$1.14 billion
of additional borrowings. Additionally, we maintain Federal Funds lines and other borrowing facilities. At
December 31, 2013
, BancShares had access to
$665.0 million
in unsecured borrowings through various sources.
Free liquidity includes cash on deposit at various banks, overnight investments and the unpledged portion of investment securities available for sale, all of which can be easily converted to cash. Free liquidity totaled
$3.39 billion
at
December 31, 2013
, compared to
$2.82 billion
at
December 31, 2012
.
FOURTH QUARTER ANALYSIS
For the quarter ended
December 31, 2013
, BancShares reported net income of
$27.2 million
, compared to
$21.7 million
for the corresponding period of
2012
, an increase of
$5.5 million
, or
25.2 percent
, due to a significant reduction in the provision for loan and lease losses and an increase in noninterest income, partially offset by lower net interest income.
Per share income for the
fourth quarter
2013
totaled
$2.83
, compared to
$2.15
for the same period a year ago. The annualized return on average assets equaled
0.50 percent
for the
fourth quarter
of
2013
, compared to
0.41 percent
for the
fourth quarter
of
2012
. The annualized return on average equity was
5.37 percent
during the
fourth quarter
of
2013
, compared to
4.43 percent
for the same period of
2012
.
Net interest income totaled
$176.6 million
during the
fourth quarter
of
2013
, a decrease of
$86.4 million
or
32.8 percent
from the
fourth quarter
of
2012
due to lower asset yields and acquired loan shrinkage. The taxable-equivalent net yield on interest-earning assets equaled
3.55 percent
during the
fourth quarter
of
2013
, down from
5.44 percent
during the
fourth quarter
of
2012
. During
2013
, the impact of growth among low-yielding overnight investments and investment securities and reductions in higher yielding loans contributed to a
$90.0 million
unfavorable rate variance. Net interest income for the
fourth quarter
of
2013
included
$44.9 million
of accretion income, compared to
$110.6 million
in the
fourth quarter
of
2012
, the result of a significant reduction in acquired loan balances.
Interest-earning assets averaged
$19.79 billion
during the
fourth quarter
of
2013
, up
$513.4 million
from the
fourth quarter
of
2012
. Average loans and leases decreased
$269.3 million
, or
2.0 percent
, since the
fourth quarter
of
2012
due to payoffs of acquired loans, partially offset by originated loan growth Average investment securities grew
$116.6 million
, or
2.3 percent
, as a result of trends among loans and leases, deposits and short-term borrowings.
49
Average interest-bearing liabilities decreased
$319.3 million
, or
2.3 percent
, during the
fourth quarter
of
2013
, due to a decrease in average interest-bearing deposits as customer migration away from time deposit products continues. The rate on interest-bearing liabilities decreased
13
basis points from
0.51
percent during the
fourth quarter
of
2012
to
0.38
percent during the
fourth quarter
of
2013
, as market interest rates remained low and maturing time deposits were moved to non-time products or reinvested at lower rates.
BancShares recorded provision expense of
$7.3 million
during the
fourth quarter
of
2013
, compared to a credit to provision for loan and lease losses during the third quarter of
2013
of
$7.7 million
and provision expense of
$64.9 million
during the
fourth quarter
of
2012
. BancShares recorded a
$0.8 million
credit to provision expense related to acquired loans during the
fourth quarter
of
2013
, compared to provision expense of
$62.3 million
recorded during the
fourth quarter
of
2012
. The
$63.2 million
favorable change resulted from credit quality improvements and unexpected payoffs of acquired loans for which an allowance had previously been established. Provision expense for originated loans totaled
$8.1 million
during the
fourth quarter
of
2013
, compared to
$2.5 million
during the
fourth quarter
of
2012
, an increase of
$5.6 million
, due to loan growth and additional impairment identified during quarterly loan reviews.
Exclusive of losses related to acquired loans, net charge-offs equaled
$6.5 million
during the
fourth quarter
of
2013
, compared to
$9.5 million
during the
fourth quarter
of
2012
. On an annualized basis, net charge-offs represented
0.22 percent
of average originated loans and leases during the
fourth quarter
of
2013
, compared to
0.33 percent
during the
fourth quarter
of
2012
. Net charge-offs on acquired loans equaled
$5.2 million
in the
fourth quarter
of
2013
, compared to
$12.9 million
recorded in the
fourth quarter
of
2012
.
Total noninterest income increased
$36.0 million
, or
108.2 percent
, from the
fourth quarter
of
2012
, due to an increase in acquired loan recoveries and lower amortization expense related to the FDIC receivable.
Noninterest expense equaled
$196.3 million
during the
fourth quarter
of
2013
, down
$2.4 million
, or
1.2 percent
, due to a reduction in foreclosure-related expenses, partially offset by higher salary and consulting expense.
Table 23 provides quarterly information for each of the quarters in
2013
and
2012
. Table 24 analyzes the components of changes in net interest income between the
fourth quarter
of
2013
and
2012
.
50
Table 23
SELECTED QUARTERLY DATA
|
|
2013
|
2012
|
|||||||||||||||||||||||||||||
|
|
Fourth
Quarter |
Third
Quarter |
Second
Quarter |
First
Quarter |
Fourth
Quarter |
Third
Quarter |
Second
Quarter |
First
Quarter |
|||||||||||||||||||||||
|
|
(dollars in thousands, except share data and ratios)
|
||||||||||||||||||||||||||||||
|
SUMMARY OF OPERATIONS
|
|||||||||||||||||||||||||||||||
|
Interest income
|
$
|
189,640
|
|
$
|
192,634
|
|
$
|
193,926
|
|
$
|
220,604
|
|
$
|
280,891
|
|
$
|
236,674
|
|
$
|
240,519
|
|
$
|
246,752
|
|
|||||||
|
Interest expense
|
13,047
|
|
13,451
|
|
14,398
|
|
15,722
|
|
17,943
|
|
21,318
|
|
25,087
|
|
25,800
|
|
|||||||||||||||
|
Net interest income
|
176,593
|
|
179,183
|
|
179,528
|
|
204,882
|
|
262,948
|
|
215,356
|
|
215,432
|
|
220,952
|
|
|||||||||||||||
|
Provision for loan and lease losses
|
7,276
|
|
(7,683
|
)
|
(13,242
|
)
|
(18,606
|
)
|
64,880
|
|
17,623
|
|
29,667
|
|
30,715
|
|
|||||||||||||||
|
Net interest income after provision for loan and lease losses
|
169,317
|
|
186,866
|
|
192,770
|
|
223,488
|
|
198,068
|
|
197,733
|
|
185,765
|
|
190,237
|
|
|||||||||||||||
|
Noninterest income
|
69,177
|
|
71,918
|
|
64,995
|
|
57,513
|
|
33,219
|
|
51,842
|
|
57,296
|
|
46,943
|
|
|||||||||||||||
|
Noninterest expense
|
196,315
|
|
192,143
|
|
188,567
|
|
194,355
|
|
198,728
|
|
190,077
|
|
194,797
|
|
183,331
|
|
|||||||||||||||
|
Income before income taxes
|
42,179
|
|
66,641
|
|
69,198
|
|
86,646
|
|
32,559
|
|
59,498
|
|
48,264
|
|
53,849
|
|
|||||||||||||||
|
Income taxes
|
14,953
|
|
25,659
|
|
25,292
|
|
31,061
|
|
10,813
|
|
19,974
|
|
10,681
|
|
18,354
|
|
|||||||||||||||
|
Net income
|
$
|
27,226
|
|
$
|
40,982
|
|
$
|
43,906
|
|
$
|
55,585
|
|
$
|
21,746
|
|
$
|
39,524
|
|
$
|
37,583
|
|
$
|
35,495
|
|
|||||||
|
Net interest income, taxable equivalent
|
$
|
177,280
|
|
$
|
179,823
|
|
$
|
180,188
|
|
$
|
205,553
|
|
$
|
263,635
|
|
$
|
216,069
|
|
$
|
216,194
|
|
$
|
221,765
|
|
|||||||
|
PER SHARE DATA
|
|||||||||||||||||||||||||||||||
|
Net income
|
$
|
2.83
|
|
$
|
4.26
|
|
$
|
4.56
|
|
$
|
5.78
|
|
$
|
2.15
|
|
$
|
3.85
|
|
$
|
3.66
|
|
$
|
3.45
|
|
|||||||
|
Cash dividends
|
0.30
|
|
0.30
|
|
0.30
|
|
0.30
|
|
0.30
|
|
0.30
|
|
0.30
|
|
0.30
|
|
|||||||||||||||
|
Market price at period end (Class A)
|
222.63
|
|
205.60
|
|
192.05
|
|
182.70
|
|
163.50
|
|
162.90
|
|
166.65
|
|
182.69
|
|
|||||||||||||||
|
Book value at period end
|
215.89
|
|
206.06
|
|
201.62
|
|
199.46
|
|
193.75
|
|
192.49
|
|
187.88
|
|
184.14
|
|
|||||||||||||||
|
SELECTED QUARTERLY AVERAGE BALANCES
|
|||||||||||||||||||||||||||||||
|
Total assets
|
$
|
21,562,920
|
|
$
|
21,260,384
|
|
$
|
21,224,412
|
|
$
|
21,150,143
|
|
$
|
21,245,425
|
|
$
|
21,119,099
|
|
$
|
21,085,228
|
|
$
|
20,843,491
|
|
|||||||
|
Investment securities
|
5,285,783
|
|
5,177,729
|
|
5,162,893
|
|
5,196,930
|
|
5,169,159
|
|
4,888,047
|
|
4,598,141
|
|
4,141,160
|
|
|||||||||||||||
|
Loans and leases (acquired and originated)
|
13,088,636
|
|
13,111,710
|
|
13,167,580
|
|
13,289,828
|
|
13,357,928
|
|
13,451,164
|
|
13,612,114
|
|
13,822,226
|
|
|||||||||||||||
|
Interest-earning assets
|
19,787,236
|
|
19,428,949
|
|
19,332,679
|
|
19,180,308
|
|
19,273,850
|
|
19,059,474
|
|
18,983,321
|
|
18,584,625
|
|
|||||||||||||||
|
Deposits
|
18,102,752
|
|
17,856,882
|
|
17,908,705
|
|
17,922,665
|
|
17,983,033
|
|
17,755,974
|
|
17,667,221
|
|
17,498,813
|
|
|||||||||||||||
|
Long-term obligations
|
510,871
|
|
449,013
|
|
443,804
|
|
444,539
|
|
447,600
|
|
524,313
|
|
646,854
|
|
682,067
|
|
|||||||||||||||
|
Interest-bearing liabilities
|
13,790,088
|
|
13,757,983
|
|
13,958,137
|
|
14,140,511
|
|
14,109,359
|
|
14,188,609
|
|
14,418,509
|
|
14,478,901
|
|
|||||||||||||||
|
Shareholders’ equity
|
$
|
2,010,191
|
|
$
|
1,953,128
|
|
$
|
1,929,621
|
|
$
|
1,877,445
|
|
$
|
1,951,874
|
|
$
|
1,945,263
|
|
$
|
1,906,884
|
|
$
|
1,870,066
|
|
|||||||
|
Shares outstanding
|
9,618,941
|
|
9,618,941
|
|
9,618,941
|
|
9,618,985
|
|
10,159,262
|
|
10,264,159
|
|
10,271,343
|
|
10,283,842
|
|
|||||||||||||||
|
SELECTED QUARTER-END BALANCES
|
|||||||||||||||||||||||||||||||
|
Total assets
|
$
|
21,199,091
|
|
$
|
21,511,352
|
|
$
|
21,308,822
|
|
$
|
21,351,012
|
|
$
|
21,283,652
|
|
$
|
21,259,346
|
|
$
|
21,240,990
|
|
$
|
21,143,628
|
|
|||||||
|
Investment securities
|
5,388,610
|
|
5,162,598
|
|
5,186,106
|
|
5,280,907
|
|
5,227,570
|
|
5,013,500
|
|
4,635,826
|
|
4,459,427
|
|
|||||||||||||||
|
Loans and leases:
|
|||||||||||||||||||||||||||||||
|
Acquired
|
1,029,426
|
|
1,188,281
|
|
1,443,336
|
|
1,621,327
|
|
1,809,235
|
|
1,897,097
|
|
1,999,351
|
|
2,183,869
|
|
|||||||||||||||
|
Originated
|
12,104,298
|
|
11,884,585
|
|
11,655,469
|
|
11,509,080
|
|
11,576,115
|
|
11,455,233
|
|
11,462,458
|
|
11,489,529
|
|
|||||||||||||||
|
Deposits
|
17,874,066
|
|
18,063,319
|
|
18,018,015
|
|
18,064,921
|
|
18,086,025
|
|
17,893,215
|
|
17,801,646
|
|
17,759,492
|
|
|||||||||||||||
|
Long-term obligations
|
510,769
|
|
510,963
|
|
443,313
|
|
444,252
|
|
444,921
|
|
472,170
|
|
644,682
|
|
649,818
|
|
|||||||||||||||
|
Shareholders’ equity
|
$
|
2,076,675
|
|
$
|
1,982,057
|
|
$
|
1,939,330
|
|
$
|
1,918,581
|
|
$
|
1,864,007
|
|
$
|
1,974,124
|
|
$
|
1,929,790
|
|
$
|
1,892,123
|
|
|||||||
|
Shares outstanding
|
9,618,941
|
|
9,618,941
|
|
9,618,941
|
|
9,618,941
|
|
9,620,914
|
|
10,255,747
|
|
10,271,244
|
|
10,275,731
|
|
|||||||||||||||
|
SELECTED RATIOS AND OTHER DATA
|
|||||||||||||||||||||||||||||||
|
Rate of return on average assets (annualized)
|
0.50
|
%
|
0.76
|
%
|
0.83
|
%
|
1.07
|
%
|
0.41
|
%
|
0.75
|
%
|
0.72
|
%
|
0.68
|
%
|
|||||||||||||||
|
Rate of return on average shareholders’ equity (annualized)
|
5.37
|
|
8.32
|
|
9.13
|
|
12.01
|
|
4.43
|
|
8.08
|
|
7.93
|
|
7.63
|
|
|||||||||||||||
|
Net yield on interest-earning assets (taxable equivalent)
|
3.55
|
|
3.67
|
|
3.74
|
|
4.35
|
|
5.44
|
|
4.51
|
|
4.58
|
|
4.80
|
|
|||||||||||||||
|
Allowance for loan and lease losses to loans and leases:
|
|||||||||||||||||||||||||||||||
|
Acquired
|
5.20
|
|
5.01
|
|
5.30
|
|
5.95
|
|
7.74
|
|
4.77
|
|
4.39
|
|
3.94
|
|
|||||||||||||||
|
Originated
|
1.49
|
|
1.50
|
|
1.56
|
|
1.53
|
|
1.55
|
|
1.62
|
|
1.62
|
|
1.62
|
|
|||||||||||||||
|
Nonperforming assets to total loans and leases and other real estate at period end:
|
|||||||||||||||||||||||||||||||
|
Acquired
|
7.02
|
|
7.05
|
|
8.62
|
|
8.46
|
|
9.26
|
|
12.87
|
|
18.37
|
|
18.68
|
|
|||||||||||||||
|
Originated
|
0.74
|
|
0.90
|
|
0.91
|
|
1.10
|
|
1.15
|
|
1.05
|
|
1.03
|
|
0.99
|
|
|||||||||||||||
|
Tier 1 risk-based capital ratio
|
14.92
|
|
15.04
|
|
14.91
|
|
14.50
|
|
14.27
|
|
15.09
|
|
15.97
|
|
15.74
|
|
|||||||||||||||
|
Total risk-based capital ratio
|
16.42
|
|
16.54
|
|
16.41
|
|
16.19
|
|
15.95
|
|
16.78
|
|
17.66
|
|
17.62
|
|
|||||||||||||||
|
Leverage capital ratio
|
9.82
|
|
9.84
|
|
9.68
|
|
9.36
|
|
9.23
|
|
9.67
|
|
10.21
|
|
10.16
|
|
|||||||||||||||
|
Dividend payout ratio
|
10.60
|
|
7.04
|
|
6.58
|
|
5.19
|
|
13.95
|
|
7.79
|
|
8.20
|
|
8.70
|
|
|||||||||||||||
|
Average loans and leases to average deposits
|
72.30
|
|
73.43
|
|
73.53
|
|
74.15
|
|
74.28
|
|
75.76
|
|
77.05
|
|
78.99
|
|
|||||||||||||||
51
Table 24
CONSOLIDATED TAXABLE EQUIVALENT RATE/VOLUME VARIANCE ANALYSIS - FOURTH QUARTER
|
2013
|
2012
|
Increase (decrease) due to:
|
|||||||||||||||||||||||||||||||
|
Interest
|
Interest
|
||||||||||||||||||||||||||||||||
|
Average
|
Income/
|
Yield/
|
Average
|
Income/
|
Yield/
|
Yield/
|
Total
|
||||||||||||||||||||||||||
|
Balance
|
Expense
|
Rate
|
Balance
|
Expense
|
Rate
|
Volume
|
Rate
|
Change
|
|||||||||||||||||||||||||
|
(dollars in thousands)
|
|||||||||||||||||||||||||||||||||
|
Assets
|
|||||||||||||||||||||||||||||||||
|
Loans and leases
|
$
|
13,088,636
|
|
$
|
178,623
|
|
5.41
|
|
%
|
$
|
13,357,928
|
|
$
|
271,316
|
|
8.08
|
|
%
|
$
|
(4,140
|
)
|
$
|
(88,553
|
)
|
$
|
(92,693
|
)
|
||||||
|
Investment securities:
|
|||||||||||||||||||||||||||||||||
|
U. S. Treasury
|
413,061
|
|
302
|
|
0.29
|
|
869,775
|
|
523
|
|
0.24
|
|
(303
|
)
|
82
|
|
(221
|
)
|
|||||||||||||||
|
Government agency
|
2,630,718
|
|
3,192
|
|
0.49
|
|
2,892,502
|
|
3,422
|
|
0.47
|
|
(341
|
)
|
111
|
|
(230
|
)
|
|||||||||||||||
|
Mortgage-backed securities
|
2,219,755
|
|
7,142
|
|
1.28
|
|
1,341,318
|
|
5,505
|
|
1.63
|
|
3,215
|
|
(1,578
|
)
|
1,637
|
|
|||||||||||||||
|
Corporate bonds
|
—
|
|
—
|
|
—
|
|
46,354
|
|
255
|
|
2.20
|
|
(128
|
)
|
(127
|
)
|
(255
|
)
|
|||||||||||||||
|
State, county and municipal
|
187
|
|
4
|
|
8.49
|
|
580
|
|
9
|
|
6.17
|
|
(7
|
)
|
2
|
|
(5
|
)
|
|||||||||||||||
|
Other
|
22,062
|
|
90
|
|
1.62
|
|
18,630
|
|
40
|
|
0.85
|
|
11
|
|
39
|
|
50
|
|
|||||||||||||||
|
Total investment securities
|
5,285,783
|
|
10,730
|
|
0.81
|
|
5,169,159
|
|
9,754
|
|
0.75
|
|
2,447
|
|
(1,471
|
)
|
976
|
|
|||||||||||||||
|
Overnight investments
|
1,412,817
|
|
973
|
|
0.27
|
|
746,763
|
|
508
|
|
0.27
|
|
459
|
|
6
|
|
465
|
|
|||||||||||||||
|
Total interest-earning assets
|
19,787,236
|
|
$
|
190,326
|
|
3.81
|
|
%
|
19,273,850
|
|
$
|
281,578
|
|
5.81
|
|
%
|
$
|
(1,234
|
)
|
$
|
(90,018
|
)
|
$
|
(91,252
|
)
|
||||||||
|
Cash and due from banks
|
474,495
|
|
535,260
|
|
|||||||||||||||||||||||||||||
|
Premises and equipment
|
873,925
|
|
889,405
|
|
|||||||||||||||||||||||||||||
|
Receivable from FDIC for loss share agreements
|
107,073
|
|
219,867
|
|
|||||||||||||||||||||||||||||
|
Allowance for loan and lease losses
|
(233,066
|
)
|
(271,924
|
)
|
|||||||||||||||||||||||||||||
|
Other real estate owned
|
91,840
|
|
152,744
|
|
|||||||||||||||||||||||||||||
|
Other assets
|
461,417
|
|
446,223
|
|
|||||||||||||||||||||||||||||
|
Total assets
|
$
|
21,562,920
|
|
$
|
21,245,425
|
|
|||||||||||||||||||||||||||
|
Liabilities
|
|||||||||||||||||||||||||||||||||
|
Interest-bearing deposits:
|
|||||||||||||||||||||||||||||||||
|
Checking With Interest
|
$
|
2,379,384
|
|
$
|
145
|
|
0.02
|
|
%
|
$
|
2,183,140
|
|
$
|
329
|
|
0.06
|
|
%
|
$
|
33
|
|
$
|
(217
|
)
|
$
|
(184
|
)
|
||||||
|
Savings
|
998,303
|
|
125
|
|
0.05
|
|
899,428
|
|
113
|
|
0.05
|
|
12
|
|
—
|
|
12
|
|
|||||||||||||||
|
Money market accounts
|
6,351,952
|
|
2,004
|
|
0.13
|
|
6,222,991
|
|
3,601
|
|
0.23
|
|
23
|
|
(1,620
|
)
|
(1,597
|
)
|
|||||||||||||||
|
Time deposits
|
2,952,193
|
|
4,987
|
|
0.67
|
|
3,715,193
|
|
8,156
|
|
0.87
|
|
(1,485
|
)
|
(1,684
|
)
|
(3,169
|
)
|
|||||||||||||||
|
Total interest-bearing deposits
|
12,681,832
|
|
7,261
|
|
0.23
|
|
13,020,752
|
|
12,199
|
|
0.37
|
|
(1,417
|
)
|
(3,521
|
)
|
(4,938
|
)
|
|||||||||||||||
|
Short-term borrowings
|
597,385
|
|
596
|
|
0.40
|
|
641,007
|
|
1,018
|
|
0.63
|
|
(60
|
)
|
(362
|
)
|
(422
|
)
|
|||||||||||||||
|
Long-term obligations
|
510,871
|
|
5,189
|
|
4.06
|
|
447,600
|
|
4,726
|
|
4.22
|
|
655
|
|
(192
|
)
|
463
|
|
|||||||||||||||
|
Total interest-bearing liabilities
|
13,790,088
|
|
$
|
13,046
|
|
0.38
|
|
%
|
14,109,359
|
|
$
|
17,943
|
|
0.51
|
|
%
|
$
|
(822
|
)
|
$
|
(4,075
|
)
|
$
|
(4,897
|
)
|
||||||||
|
Demand deposits
|
5,420,920
|
|
4,962,280
|
|
|||||||||||||||||||||||||||||
|
Other liabilities
|
341,721
|
|
221,912
|
|
|||||||||||||||||||||||||||||
|
Shareholders' equity
|
2,010,191
|
|
1,951,874
|
|
|||||||||||||||||||||||||||||
|
Total liabilities and shareholders' equity
|
$
|
21,562,920
|
|
$
|
21,245,425
|
|
|||||||||||||||||||||||||||
|
Interest rate spread
|
3.43
|
|
%
|
5.30
|
|
%
|
|||||||||||||||||||||||||||
|
Net interest income and net yield
|
|||||||||||||||||||||||||||||||||
|
on interest-earning assets
|
$
|
177,280
|
|
3.55
|
|
%
|
$
|
263,635
|
|
5.44
|
|
%
|
$
|
(412
|
)
|
$
|
(85,943
|
)
|
$
|
(86,355
|
)
|
||||||||||||
Loans and leases include acquired loans, originated loans, nonaccrual loans and loans held for sale. Yields related to loans, leases and securities exempt from both federal and state income taxes, federal income taxes only, or state income taxes only are stated on a taxable-equivalent basis assuming statutory federal income tax rates of 35.0 percent and state income tax rates of 6.9 percent for each period. The taxable-equivalent adjustment was
$687
and
$687
for
2013
and
2012
, respectively. The rate/volume variance is allocated equally between the changes in volume and rate.
52
COMMITMENTS AND CONTRACTUAL OBLIGATIONS
Table 25
identifies significant obligations and commitments as of
December 31, 2013
.
Table 25
COMMITMENTS AND CONTRACTUAL OBLIGATIONS
|
|
Payments due by period
|
||||||||||||||||||
|
Type of obligation
|
Less than 1 year
|
1-3 years
|
4-5 years
|
Thereafter
|
Total
|
||||||||||||||
|
|
(dollars in thousands)
|
||||||||||||||||||
|
Contractual obligations:
|
|||||||||||||||||||
|
Deposits
|
$
|
1,920,998
|
|
$
|
828,784
|
|
$
|
125,456
|
|
$
|
—
|
|
$
|
2,875,238
|
|
||||
|
Short-term borrowings
|
511,418
|
|
—
|
|
—
|
|
—
|
|
511,418
|
|
|||||||||
|
Long-term obligations
|
2,908
|
|
205,422
|
|
132,449
|
|
169,990
|
|
510,769
|
|
|||||||||
|
Operating leases
|
17,181
|
|
21,543
|
|
10,543
|
|
41,554
|
|
90,821
|
|
|||||||||
|
Estimated payment to FDIC due to claw-back provisions under loss share agreements
|
—
|
|
—
|
|
—
|
|
143,091
|
|
143,091
|
|
|||||||||
|
Total contractual obligations
|
$
|
2,452,505
|
|
$
|
1,055,749
|
|
$
|
268,448
|
|
$
|
354,635
|
|
$
|
4,131,337
|
|
||||
|
Commitments:
|
|||||||||||||||||||
|
Loan commitments
|
$
|
2,413,093
|
|
$
|
501,958
|
|
$
|
423,334
|
|
$
|
2,499,918
|
|
$
|
5,838,303
|
|
||||
|
Standby letters of credit
|
49,240
|
|
5,545
|
|
—
|
|
26
|
|
54,811
|
|
|||||||||
|
Affordable housing partnerships
|
14,457
|
|
2,967
|
|
298
|
|
13
|
|
17,735
|
|
|||||||||
|
Total commitments
|
$
|
2,476,790
|
|
$
|
510,470
|
|
$
|
423,632
|
|
$
|
2,499,957
|
|
$
|
5,910,849
|
|
||||
CURRENT ACCOUNTING PRONOUNCEMENTS
Financial Accounting Standards Board (FASB) Accounting Standards Update (ASU ) 2014-01, “Investments—Equity Method and Joint Ventures (Topic 323)—Accounting for Investments in Qualified Affordable Housing Projects”
This ASU permits BancShares to make an accounting policy election to account for their investments in qualified affordable housing projects using the proportional amortization method if certain conditions are met. Under the proportional amortization method, BancShares would amortize the initial cost of the investment in proportion to the tax credits and other tax benefits received and recognizes the net investment performance in the income statement as a component of income tax expense (benefit).
For those investments in qualified affordable housing projects not accounted for using the proportional amortization method, the investment should be accounted for as an equity method investment or a cost method investment in accordance with Subtopic 970-323. The decision to apply the proportional amortization method of accounting will be applied consistently to all qualifying affordable housing project investments rather than a decision to be applied to individual investments.
The amendments in this ASU should be applied retrospectively to all periods presented and are effective for annual periods and interim reporting periods within those annual periods, beginning after December 15, 2014. Early adoption is permitted.
BancShares is in the process of evaluating this ASU and the potential impact of adoption and, therefore, has elected not to adopt the proportional amortization method as outlined in ASU 2014-01 at this time.
Financial Accounting Standards Board (FASB) Accounting Standards Update (ASU ) 2013-11, “Income Taxes (Topic 740)”
This ASU states that an unrecognized tax benefit, or a portion of an unrecognized tax benefit, should be presented in the financial statements as a reduction to a deferred tax asset for a net operating loss carryforward, a similar tax loss, or a tax credit carryforward, except as follows. To the extent a net operating loss carryforward, a similar tax loss or a tax credit carryforward is not available at the reporting date under the tax law of the applicable jurisdiction to settle any additional income taxes that would result from the disallowance of a tax position or the tax law of the applicable jurisdiction does not require BancShares to use, and BancShares does not intend to use, the deferred tax asset for such purpose, the unrecognized tax benefit should be
53
presented in the financial statements as a liability and should not be combined with deferred tax assets. The assessment of whether a deferred tax asset is available is based on the unrecognized tax benefit and deferred tax asset that exist at the reporting date and should be made presuming disallowance of the tax position at the reporting date.
The provisions of this Update are effective for fiscal years, and interim periods within those years, beginning after December 15, 2013. Early adoption is permitted.
The provisions of this ASU will be applied prospectively to all unrecognized tax benefits that exist at the effective date. Retrospective application is permitted. BancShares will adopt this ASU by the date required and does not anticipate that the ASU will have a material effect on its financial position or results of operations.
FASB ASU 2013-04, “Liabilities”
This ASU provides guidance for the recognition, measurement and disclosure of obligations resulting from joint and several liability arrangements for which the total amount of the obligation within the scope of this update is fixed at the reporting date, except for obligations addressed within existing guidance in GAAP.
The guidance requires BancShares to measure those obligations as the sum of the amount the reporting entity agreed to pay on the basis of its arrangement among its co-obligors and any additional amount the reporting entity expects to pay on behalf of its co-obligors. The guidance in this update also requires an entity to disclose the nature and amount of the obligation as well as other information about those obligations.
The amendments in this update are effective for fiscal years beginning after December 31, 2013. Early adoption is permitted. BancShares will adopt the methodologies prescribed by this ASU by the date required and does not anticipate that the ASU will have a material effect on its financial position or results of operations.
FASB ASU 2013-02, “Comprehensive Income (Topic 220): Reporting of Amounts Reclassified Out of Accumulated Other Comprehensive Income”
This ASU requires BancShares to provide information about the amounts reclassified out of accumulated other comprehensive income by component. In addition, an entity is required to present, either on the face of the statement where net income is presented or in the notes, significant amounts reclassified out of accumulated other comprehensive income by the respective line items of net income but only if the amount reclassified is required under GAAP to be reclassified to net income in its entirety in the same reporting period. For other amounts, BancShares is required to cross-reference to other disclosures required under GAAP that provide additional detail about those amounts.
For public entities, the amendments are effective prospectively for reporting periods beginning after December 15, 2012. BancShares has adopted the methodologies prescribed by this ASU by the date required and the ASU did not have a material effect on its financial position or results of operations. BancShares has included the required disclosures in Note U.
FASB ASU 2012-06. “Business Combinations (Topic 805) - Subsequent Accounting for an Indemnification Asset Recognized at the Acquisition Date as a Result of a Government-Assisted Acquisition of a Financial Institution”
This ASU addresses the diversity in practice about how to interpret the terms on the same basis and contractual limitations when subsequently measuring an indemnification asset recognized in a government-assisted (Federal Deposit Insurance Corporation or National Credit Union Administration) acquisition of a financial institution that includes a loss sharing agreement (indemnification agreement). When BancShares recognizes an indemnification asset (in accordance with Subtopic 805-20) as a result of a government-assisted acquisition of a financial institution and subsequently a change in the cash flows expected to be collected on the indemnification asset occurs (as a result of a change in cash flows expected to be collected on the assets subject to indemnification), BancShares should subsequently account for the change in the measurement of the indemnification asset on the same basis as the change in the assets subject to indemnification. Any amortization of changes in value should be limited to the contractual term of the indemnification agreement (that is, the lesser of the term of the indemnification agreement and the remaining life of the indemnified assets).
This guidance became effective for annual periods beginning on or after December 15, 2012, and interim periods within those annual periods. BancShares has previously accounted for its indemnification asset in accordance with this guidance; accordingly, this guidance had no impact on BancShares' consolidated financial position, results of operations or cash flows.
REGULATORY ISSUES
In July 2013, Bank regulatory agencies approved new global regulatory capital guidelines aimed at strengthening existing capital requirements for bank holding companies through a combination of higher minimum capital requirements, new capital conservation buffers and more conservative definitions of capital and balance sheet exposure. When fully implemented in
54
January 2019, Basel requires a minimum ratio of common equity tier 1 capital to risk-weighted assets of 4.5 percent. The new guidelines also requires a common equity tier 1 capital conservation buffer of 2.5 percent of risk-weighted assets, resulting in a total capital ratio of 7.0 percent. The rule also raises the minimum ratio of tier 1 capital to risk-weighted assets from 4.0 percent to 6.0 percent and includes a minimum leverage ratio of 4.0 percent.
The Dodd-Frank Act mandated that stress tests be developed and performed to ensure that financial institutions have sufficient capital to absorb losses and support operations during multiple economic and bank scenarios. Bank holding companies with total consolidated assets between $10 billion and $50 billion, including BancShares, will undergo annual company-run stress tests. As directed by the Federal Reserve, summaries of BancShares’ results in the severely adverse stress tests will be available to the public starting in June 2015. Through the stress testing program that has been implemented, BancShares and FCB will comply with current regulations. The results of stress testing activities will be considered in combination with other risk management and monitoring practices to maintain an effective risk management program.
In response to the Dodd-Frank Act, the formula used to calculate the FDIC insurance assessment paid by each FDIC-insured institution was significantly altered. The new formula was effective April 1, 2011, and changes the assessment base from deposits to total assets less equity, thereby placing a larger assessment burden on banks with large levels of non-deposit funding. The new assessment formula also considers the level of higher-risk consumer loans and higher-risk commercial and industrial loans and securities, risk factors that will potentially result in incremental insurance costs. Reporting of these assets under the final definitions was effective April 1, 2013. This new reporting requirement required BancShares to implement process and system changes to identify and report these higher-risk assets but did not have a material impact on the FDIC insurance assessment paid by or operating results of BancShares.
The Dodd-Frank Act also imposes new regulatory capital requirements for banks that will result in the disallowance of qualified trust preferred capital securities as tier 1 capital. As of
December 31, 2013
, BancShares had
$93.5 million
in trust preferred capital securities that were outstanding and included as tier 1 capital. Based on the Inter-Agency Capital Rule Notice, 75 percent, or
$70.1 million
of BancShares' trust preferred capital securities will be excluded from tier 1 capital beginning January 1, 2015, with the remaining 25 percent, or
$23.4 million
, excluded beginning January 1, 2016.
Management is not aware of any further recommendations by regulatory authorities that, if implemented, would have or would be reasonably likely to have a material effect on liquidity, capital ratios or results of operations.
BancShares' management, with the participation of its Chief Executive Officer and Chief Financial Officer, has evaluated the effectiveness of the design and operation of BancShares' disclosure controls and procedures as of the end of the period covered by this Annual Report, in accordance with Rule 13a-15 of the Securities Exchange Act of 1934 (Exchange Act). Based upon that evaluation, as of the end of the period covered by this report, the Chief Executive Officer and the Chief Financial Officer concluded that BancShares' disclosure controls and procedures were effective to provide reasonable assurance that it is able to record, process, summarize and report in a timely manner the information required to be disclosed in the reports it files under the Exchange Act.
No changes in BancShares' internal control over financial reporting occurred during the
fourth quarter
of
2013
that have materially affected, or are reasonably likely to materially affect, BancShares' internal control over financial reporting.
FORWARD-LOOKING STATEMENTS
Statements in this Report and exhibits relating to plans, strategies, economic performance and trends, projections of results of specific activities or investments, expectations or beliefs about future events or results and other statements that are not descriptions of historical facts may be forward-looking statements within the meaning of the Private Securities Litigation Reform Act of 1995, Section 27A of the Securities Act of 1933 and Section 21E of the Securities Exchange Act of 1934.
Forward-looking information is inherently subject to risks and uncertainties, and actual results could differ materially from those currently anticipated due to a number of factors which include, but are not limited to, factors discussed in our Annual Report on Form 10-K and in other documents filed by us from time to time with the Securities and Exchange Commission.
55
Forward-looking statements may be identified by terms such as “may,” “will,” “should,” “could,” “expects,” “plans,” “intends,” “anticipates,” “believes,” “estimates,” “predicts,” “forecasts,” “projects,” “potential” or “continue,” or similar terms or the negative of these terms, or other statements concerning opinions or judgments of BancShares’ management about future events.
Factors that could influence the accuracy of those forward-looking statements include, but are not limited to, the financial success or changing strategies of our customers, customer acceptance of our services, products and fee structure, the competitive nature of the financial services industry, our ability to compete effectively against other financial institutions in our banking markets, actions of government regulators, the level of market interest rates and our ability to manage our interest rate risk, changes in general economic conditions that affect our loan and lease portfolio, the abilities of our borrowers to repay their loans and leases, the values of real estate and other collateral, the impact of the FDIC-assisted transactions and other developments or changes in our business that we do not expect.
Actual results may differ materially from those expressed in or implied by any forward-looking statements. Except to the extent required by applicable law or regulation, BancShares undertakes no obligation to revise or update publicly any forward-looking statements for any reason.
56
MANAGEMENT’S ANNUAL REPORT ON INTERNAL CONTROL OVER FINANCIAL REPORTING
The management of First Citizens BancShares, Inc. (BancShares) is responsible for establishing and maintaining adequate internal control over financial reporting. BancShares’ internal control system was designed to provide reasonable assurance to the company’s management and board of directors regarding the preparation and fair presentation of published financial statements.
BancShares' management assessed the effectiveness of the company's internal control over financial reporting as of
December 31, 2013
. In making this assessment, it used the criteria set forth by the Committee of Sponsoring Organizations of the Treadway Commission (COSO) in
Internal Control-Integrated Framework (1992)
. Based on that assessment, BancShares' management believes that, as of
December 31, 2013
, BancShares' internal control over financial reporting is effective based on those criteria.
All internal control systems, no matter how well designed, have inherent limitations. Therefore, even those systems determined to be effective can provide only reasonable assurance with respect to financial statement preparation and presentation. A control deficiency exists when the design or operation of a control does not allow management or employees, in the normal course of performing their assigned functions, to prevent or detect misstatements on a timely basis. A significant deficiency is a control deficiency, or combination of control deficiencies, in internal control over financial reporting that is less severe than a material weakness, yet important enough to merit attention by those responsible for oversight of the company's financial reporting. A material weakness in internal control over financial reporting is a control deficiency, or combination of control deficiencies, in internal control over financial reporting such that there is a reasonable possibility that a material misstatement of a company's annual or interim financial statements will not be prevented or detected on a timely basis.
BancShares' independent registered public accounting firm has issued an audit report on the company's internal control over financial reporting. This report appears on page 58.
57

REPORT OF INDEPENDENT REGISTERED PUBLIC ACCOUNTING FIRM
Board of Directors and Shareholders
First Citizens BancShares, Inc.
We have audited First Citizens BancShares, Inc. and subsidiaries' (BancShares) internal control over financial reporting as of
December 31, 2013
, based on criteria established in
Internal Control-Integrated Framework (1992)
issued by the Committee of Sponsoring Organizations of the Treadway Commission (COSO). BancShares' management is responsible for maintaining effective internal control over financial reporting and for its assessment of the effectiveness of internal control over financial reporting included in the accompanying Management's Annual Report on Internal Control Over Financial Reporting. Our responsibility is to express an opinion on BancShares' internal control over financial reporting based on our audit.
We conducted our audit in accordance with the standards of the Public Company Accounting Oversight Board (United States). Those standards require that we plan and perform the audit to obtain reasonable assurance about whether effective internal control over financial reporting was maintained in all material respects. Our audit included obtaining an understanding of internal control over financial reporting, assessing the risk that a material weakness exists, and testing and evaluating the design and operating effectiveness of internal control based on the assessed risk. Our audit also included performing such other procedures as we considered necessary in the circumstances. We believe that our audit provides a reasonable basis for our opinion.
A company's internal control over financial reporting is a process designed to provide reasonable assurance regarding the reliability of financial reporting and the preparation of financial statements for external purposes in accordance with generally accepted accounting principles. A company's internal control over financial reporting includes those policies and procedures that (1) pertain to the maintenance of records that, in reasonable detail, accurately and fairly reflect the transactions and dispositions of the assets of the company; (2) provide reasonable assurance that transactions are recorded as necessary to permit preparation of financial statements in accordance with generally accepted accounting principles, and that receipts and expenditures of the company are being made only in accordance with authorizations of management and directors of the company; and (3) provide reasonable assurance regarding prevention or timely detection of unauthorized acquisition, use, or disposition of the company's assets that could have a material effect on the financial statements.
Because of its inherent limitations, internal control over financial reporting may not prevent or detect misstatements. Also, projections of any evaluation of effectiveness to future periods are subject to the risk that controls may become inadequate because of changes in conditions, or that the degree of compliance with the policies or procedures may deteriorate.
In our opinion, First Citizens BancShares, Inc. and subsidiaries maintained, in all material respects, effective internal control over financial reporting as of
December 31, 2013
, based on criteria established in
Internal Control-Integrated Framework (1992)
issued by the Committee of Sponsoring Organizations of the Treadway Commission (COSO).
We also have audited, in accordance with the standards of the Public Company Accounting Oversight Board (United States), the consolidated financial statements of BancShares as of
December 31, 2013 and 2012
and for each of the years in the three-year period ended
December 31, 2013
, and our report dated
February 26, 2014
, expressed an unqualified opinion on those consolidated financial statements.

Charlotte, North Carolina
February 26, 2014
58
REPORT OF INDEPENDENT REGISTERED PUBLIC ACCOUNTING FIRM
Board of Directors and Shareholders
First Citizens BancShares, Inc.
We have audited the accompanying consolidated balance sheets of First Citizens BancShares, Inc. and subsidiaries (BancShares) as of
December 31, 2013 and 2012
, and the related consolidated statements of income, comprehensive income, changes in shareholders' equity and cash flows for each of the years in the three-year period ended
December 31, 2013
. These consolidated financial statements are the responsibility of BancShares' management. Our responsibility is to express an opinion on these consolidated financial statements based on our audits.
We conducted our audits in accordance with the standards of the Public Company Accounting Oversight Board (United States). Those standards require that we plan and perform the audit to obtain reasonable assurance about whether the financial statements are free of material misstatement. An audit includes examining, on a test basis, evidence supporting the amounts and disclosures in the financial statements. An audit also includes assessing the accounting principles used and significant estimates made by management, as well as evaluating the overall financial statement presentation. We believe that our audits provide a reasonable basis for our opinion.
In our opinion, the consolidated financial statements referred to above present fairly, in all material respects, the financial position of First Citizens BancShares, Inc. and subsidiaries as of
December 31, 2013 and 2012
, and the results of their operations and their cash flows for each of the years in the three-year period ended
December 31, 2013
, in conformity with accounting principles generally accepted in the United States of America.
We also have audited, in accordance with the standards of the Public Company Accounting Oversight Board (United States), BancShares' internal control over financial reporting as of
December 31, 2013
, based on criteria established in
Internal Control-Integrated Framework (1992)
issued by the Committee of Sponsoring Organizations of the Treadway Commission (COSO), and our report dated
February 26, 2014
, expressed an unqualified opinion.
Charlotte, North Carolina
February 26, 2014
59
First Citizens BancShares, Inc. and Subsidiaries
Consolidated Balance Sheets
|
December 31, 2013
|
December 31, 2012
|
||||||
|
|
(dollars in thousands, except share data)
|
||||||
|
Assets
|
|||||||
|
Cash and due from banks
|
$
|
533,599
|
|
$
|
639,730
|
|
|
|
Overnight investments
|
859,324
|
|
443,180
|
|
|||
|
Investment securities available for sale (cost of $5,404,335 at December 31, 2013, and $5,192,419 at December 31, 2012)
|
5,387,703
|
|
5,226,228
|
|
|||
|
Investment securities held to maturity (fair value of $974 at December 31, 2013, and $1,448 at December 31, 2012)
|
907
|
|
1,342
|
|
|||
|
Loans held for sale
|
47,271
|
|
86,333
|
|
|||
|
Loans and leases:
|
|||||||
|
Acquired
|
1,029,426
|
|
1,809,235
|
|
|||
|
Originated
|
12,104,298
|
|
11,576,115
|
|
|||
|
Less allowance for loan and lease losses
|
233,394
|
|
319,018
|
|
|||
|
Net loans and leases
|
12,900,330
|
|
13,066,332
|
|
|||
|
Premises and equipment
|
876,522
|
|
882,768
|
|
|||
|
Other real estate owned:
|
|||||||
|
Covered under loss share agreements
|
47,081
|
|
102,577
|
|
|||
|
Not covered under loss share agreements
|
36,898
|
|
43,513
|
|
|||
|
Income earned not collected
|
48,390
|
|
47,666
|
|
|||
|
Receivable from FDIC for loss share agreements
|
93,397
|
|
270,192
|
|
|||
|
Goodwill
|
102,625
|
|
102,625
|
|
|||
|
Other intangible assets
|
1,247
|
|
3,556
|
|
|||
|
Other assets
|
263,797
|
|
367,610
|
|
|||
|
Total assets
|
$
|
21,199,091
|
|
$
|
21,283,652
|
|
|
|
Liabilities
|
|||||||
|
Deposits:
|
|||||||
|
Noninterest-bearing
|
$
|
5,241,817
|
|
$
|
4,885,700
|
|
|
|
Interest-bearing
|
12,632,249
|
|
13,200,325
|
|
|||
|
Total deposits
|
17,874,066
|
|
18,086,025
|
|
|||
|
Short-term borrowings
|
511,418
|
|
568,505
|
|
|||
|
Long-term obligations
|
510,769
|
|
444,921
|
|
|||
|
Payable to FDIC for loss share agreements
|
109,378
|
|
101,641
|
|
|||
|
Other liabilities
|
116,785
|
|
218,553
|
|
|||
|
Total liabilities
|
19,122,416
|
|
19,419,645
|
|
|||
|
Shareholders’ equity
|
|||||||
|
Common stock:
|
|||||||
|
Class A - $1 par value (11,000,000 shares authorized; 8,586,058 shares issued and outstanding at December 31, 2013; 8,588,031 shares issued and outstanding at December 31, 2012)
|
8,586
|
|
8,588
|
|
|||
|
Class B - $1 par value (2,000,000 shares authorized; 1,032,883 shares issued and outstanding at December 31, 2013, and December 31, 2012)
|
1,033
|
|
1,033
|
|
|||
|
Surplus
|
143,766
|
|
143,766
|
|
|||
|
Retained earnings
|
1,948,558
|
|
1,792,726
|
|
|||
|
Accumulated other comprehensive loss
|
(25,268
|
)
|
(82,106
|
)
|
|||
|
Total shareholders’ equity
|
2,076,675
|
|
1,864,007
|
|
|||
|
Total liabilities and shareholders’ equity
|
$
|
21,199,091
|
|
$
|
21,283,652
|
|
|
See accompanying Notes to Consolidated Financial Statements.
60
First Citizens BancShares, Inc. and Subsidiaries
|
|
Year ended December 31
|
||||||||||
|
|
2013
|
2012
|
2011
|
||||||||
|
|
(dollars in thousands, except share and per share data)
|
||||||||||
|
Interest income
|
|||||||||||
|
Loans and leases
|
$
|
757,197
|
|
$
|
967,601
|
|
$
|
967,737
|
|
||
|
Investment securities:
|
|||||||||||
|
U. S. Treasury
|
1,645
|
|
2,471
|
|
8,248
|
|
|||||
|
Government agency
|
12,265
|
|
15,688
|
|
19,848
|
|
|||||
|
Mortgage-backed securities
|
22,642
|
|
14,388
|
|
9,235
|
|
|||||
|
Corporate bonds
|
—
|
|
2,574
|
|
7,975
|
|
|||||
|
State, county and municipal
|
12
|
|
36
|
|
174
|
|
|||||
|
Other
|
320
|
|
340
|
|
548
|
|
|||||
|
Total investment securities interest and dividend income
|
36,884
|
|
35,497
|
|
46,028
|
|
|||||
|
Overnight investments
|
2,723
|
|
1,738
|
|
1,394
|
|
|||||
|
Total interest income
|
796,804
|
|
1,004,836
|
|
1,015,159
|
|
|||||
|
Interest expense
|
|||||||||||
|
Deposits
|
34,495
|
|
57,568
|
|
101,888
|
|
|||||
|
Short-term borrowings
|
2,724
|
|
5,107
|
|
5,993
|
|
|||||
|
Long-term obligations
|
19,399
|
|
27,473
|
|
36,311
|
|
|||||
|
Total interest expense
|
56,618
|
|
90,148
|
|
144,192
|
|
|||||
|
Net interest income
|
740,186
|
|
914,688
|
|
870,967
|
|
|||||
|
Provision for loan and lease losses
|
(32,255
|
)
|
142,885
|
|
232,277
|
|
|||||
|
Net interest income after provision for loan and lease losses
|
772,441
|
|
771,803
|
|
638,690
|
|
|||||
|
Noninterest income
|
|||||||||||
|
Gains on acquisitions
|
—
|
|
—
|
|
150,417
|
|
|||||
|
Cardholder services
|
48,360
|
|
45,174
|
|
56,279
|
|
|||||
|
Merchant services
|
56,024
|
|
50,298
|
|
54,543
|
|
|||||
|
Service charges on deposit accounts
|
60,661
|
|
61,564
|
|
63,775
|
|
|||||
|
Wealth management services
|
59,628
|
|
57,236
|
|
54,974
|
|
|||||
|
Fees from processing services
|
22,821
|
|
34,816
|
|
30,487
|
|
|||||
|
Securities gains (losses)
|
—
|
|
2,277
|
|
(288
|
)
|
|||||
|
Other service charges and fees
|
15,696
|
|
14,239
|
|
22,647
|
|
|||||
|
Mortgage income
|
11,065
|
|
8,072
|
|
6,597
|
|
|||||
|
Insurance commissions
|
10,694
|
|
9,974
|
|
9,165
|
|
|||||
|
ATM income
|
5,026
|
|
5,279
|
|
6,020
|
|
|||||
|
Adjustments to FDIC receivable and payable for loss share agreements
|
(72,342
|
)
|
(101,594
|
)
|
(19,305
|
)
|
|||||
|
Other
|
45,970
|
|
1,965
|
|
29,055
|
|
|||||
|
Total noninterest income
|
263,603
|
|
189,300
|
|
464,366
|
|
|||||
|
Noninterest expense
|
|||||||||||
|
Salaries and wages
|
308,941
|
|
307,331
|
|
308,088
|
|
|||||
|
Employee benefits
|
90,479
|
|
78,861
|
|
72,526
|
|
|||||
|
Occupancy expense
|
75,718
|
|
74,798
|
|
74,832
|
|
|||||
|
Equipment expense
|
75,545
|
|
74,822
|
|
69,951
|
|
|||||
|
FDIC insurance expense
|
10,175
|
|
10,656
|
|
16,459
|
|
|||||
|
Foreclosure-related expenses
|
17,134
|
|
40,654
|
|
46,133
|
|
|||||
|
Other
|
193,388
|
|
179,811
|
|
204,936
|
|
|||||
|
Total noninterest expense
|
771,380
|
|
766,933
|
|
792,925
|
|
|||||
|
Income before income taxes
|
264,664
|
|
194,170
|
|
310,131
|
|
|||||
|
Income taxes
|
96,965
|
|
59,822
|
|
115,103
|
|
|||||
|
Net income
|
$
|
167,699
|
|
$
|
134,348
|
|
$
|
195,028
|
|
||
|
Per share information
|
|||||||||||
|
Net income per share
|
$
|
17.43
|
|
$
|
13.11
|
|
$
|
18.80
|
|
||
|
Dividends declared per share
|
1.20
|
|
1.20
|
|
1.20
|
|
|||||
|
Average shares outstanding
|
9,618,952
|
|
10,244,472
|
|
10,376,445
|
|
|||||
See accompanying Notes to Consolidated Financial Statements.
First Citizens BancShares, Inc. and Subsidiaries
Consolidated Statements of Comprehensive Income
|
|
Year ended December 31
|
||||||||||
|
|
2013
|
2012
|
2011
|
||||||||
|
(dollars in thousands)
|
|||||||||||
|
Net income
|
$
|
167,699
|
|
$
|
134,348
|
|
$
|
195,028
|
|
||
|
Other comprehensive income (loss)
|
|||||||||||
|
Unrealized gains and losses on securities:
|
|||||||||||
|
Change in unrealized securities gains (losses) arising during period
|
(50,441
|
)
|
9,566
|
|
3,108
|
|
|||||
|
Deferred tax benefit (expense)
|
19,833
|
|
(3,759
|
)
|
(1,148
|
)
|
|||||
|
Reclassification adjustment for losses (gains) included in income before income taxes
|
—
|
|
(2,322
|
)
|
262
|
|
|||||
|
Deferred tax expense (benefit)
|
—
|
|
917
|
|
(159
|
)
|
|||||
|
Total change in unrealized gains (losses) on securities, net of tax
|
(30,608
|
)
|
4,402
|
|
2,063
|
|
|||||
|
Change in fair value of cash flow hedges:
|
|||||||||||
|
Change in unrecognized loss on cash flow hedges
|
(103
|
)
|
(2,779
|
)
|
(8,329
|
)
|
|||||
|
Deferred tax benefit
|
43
|
|
1,097
|
|
3,289
|
|
|||||
|
Reclassification adjustment for losses included in income before income taxes
|
3,281
|
|
3,095
|
|
7,107
|
|
|||||
|
Deferred tax benefit
|
(1,363
|
)
|
(1,222
|
)
|
(2,806
|
)
|
|||||
|
Total change in unrecognized loss on cash flow hedges, net of tax
|
1,858
|
|
191
|
|
(739
|
)
|
|||||
|
Change in pension obligation:
|
|||||||||||
|
Change in pension obligation
|
123,557
|
|
(44,315
|
)
|
(58,630
|
)
|
|||||
|
Deferred tax benefit (expense)
|
(48,475
|
)
|
17,354
|
|
22,959
|
|
|||||
|
Reclassification adjustment for losses included in income before income taxes
|
17,195
|
|
11,236
|
|
7,071
|
|
|||||
|
Deferred tax benefit
|
(6,689
|
)
|
(4,400
|
)
|
(2,769
|
)
|
|||||
|
Total change in pension obligation, net of tax
|
85,588
|
|
(20,125
|
)
|
(31,369
|
)
|
|||||
|
Other comprehensive income (loss)
|
56,838
|
|
(15,532
|
)
|
(30,045
|
)
|
|||||
|
Total comprehensive income
|
$
|
224,537
|
|
$
|
118,816
|
|
$
|
164,983
|
|
||
See accompanying Notes to Consolidated Financial Statements.
62
First Citizens BancShares, Inc. and Subsidiaries
Consolidated Statements of Changes in Shareholders’ Equity
|
Class A
Common Stock
|
Class B
Common Stock
|
Surplus
|
Retained
Earnings
|
Accumulated
Other
Comprehensive
Loss
|
Total
Shareholders’
Equity
|
||||||||||||||||||
|
|
(dollars in thousands, except share data)
|
||||||||||||||||||||||
|
Balance at December 31, 2010
|
$
|
8,757
|
|
$
|
1,678
|
|
$
|
143,766
|
|
$
|
1,615,290
|
|
$
|
(36,529
|
)
|
$
|
1,732,962
|
|
|||||
|
Net income
|
—
|
|
—
|
|
—
|
|
195,028
|
|
—
|
|
195,028
|
|
|||||||||||
|
Other comprehensive loss, net of tax
|
—
|
|
—
|
|
—
|
|
—
|
|
(30,045
|
)
|
(30,045
|
)
|
|||||||||||
|
Repurchase of 112,471 shares of Class A common stock
|
(113
|
)
|
—
|
|
—
|
|
(16,672
|
)
|
—
|
|
(16,785
|
)
|
|||||||||||
|
Repurchase of 37,863 shares of Class B common stock
|
—
|
|
(38
|
)
|
—
|
|
(7,564
|
)
|
—
|
|
(7,602
|
)
|
|||||||||||
|
Cash dividends ($1.20 per share)
|
—
|
|
—
|
|
—
|
|
(12,430
|
)
|
—
|
|
(12,430
|
)
|
|||||||||||
|
Balance at December 31, 2011
|
8,644
|
|
1,640
|
|
143,766
|
|
1,773,652
|
|
(66,574
|
)
|
1,861,128
|
|
|||||||||||
|
Net income
|
—
|
|
—
|
|
—
|
|
134,348
|
|
—
|
|
134,348
|
|
|||||||||||
|
Other comprehensive loss, net of tax
|
—
|
|
—
|
|
—
|
|
—
|
|
(15,532
|
)
|
(15,532
|
)
|
|||||||||||
|
Repurchase of 56,276 shares of Class A common stock
|
(56
|
)
|
—
|
|
—
|
|
(9,075
|
)
|
—
|
|
(9,131
|
)
|
|||||||||||
|
Repurchase of 606,929 shares of Class B common stock
|
—
|
|
(607
|
)
|
—
|
|
(93,886
|
)
|
—
|
|
(94,493
|
)
|
|||||||||||
|
Cash dividends ($1.20 per share)
|
—
|
|
—
|
|
—
|
|
(12,313
|
)
|
—
|
|
(12,313
|
)
|
|||||||||||
|
Balance at December 31, 2012
|
8,588
|
|
1,033
|
|
143,766
|
|
1,792,726
|
|
(82,106
|
)
|
1,864,007
|
|
|||||||||||
|
Net income
|
—
|
|
—
|
|
—
|
|
167,699
|
|
—
|
|
167,699
|
|
|||||||||||
|
Other comprehensive income, net of tax
|
—
|
|
—
|
|
—
|
|
—
|
|
56,838
|
|
56,838
|
|
|||||||||||
|
Repurchase of 1,973 shares of Class A common stock
|
(2
|
)
|
—
|
|
—
|
|
(319
|
)
|
—
|
|
(321
|
)
|
|||||||||||
|
Cash dividends ($1.20 per share)
|
—
|
|
—
|
|
—
|
|
(11,548
|
)
|
—
|
|
(11,548
|
)
|
|||||||||||
|
December 31, 2013
|
$
|
8,586
|
|
$
|
1,033
|
|
$
|
143,766
|
|
$
|
1,948,558
|
|
$
|
(25,268
|
)
|
$
|
2,076,675
|
|
|||||
See accompanying Notes to Consolidated Financial Statements.
63
First Citizens BancShares, Inc. and Subsidiaries
|
|
Year ended December 31
|
||||||||||
|
|
2013
|
2012
|
2011
|
||||||||
|
OPERATING ACTIVITIES
|
(dollars in thousands)
|
||||||||||
|
Net income
|
$
|
167,699
|
|
$
|
134,348
|
|
$
|
195,028
|
|
||
|
Adjustments to reconcile net income to cash provided by operating activities:
|
|||||||||||
|
Provision for loan and lease losses
|
(32,255
|
)
|
142,885
|
|
232,277
|
|
|||||
|
Deferred tax expense (benefit)
|
47,889
|
|
(35,265
|
)
|
(16,637
|
)
|
|||||
|
Change in current taxes
|
(79,173
|
)
|
29,095
|
|
(2,820
|
)
|
|||||
|
Depreciation
|
70,841
|
|
68,941
|
|
65,170
|
|
|||||
|
Change in accrued interest payable
|
(2,616
|
)
|
(14,366
|
)
|
(14,340
|
)
|
|||||
|
Change in income earned not collected
|
(724
|
)
|
(5,450
|
)
|
48,423
|
|
|||||
|
Gains on acquisitions
|
—
|
|
—
|
|
(150,417
|
)
|
|||||
|
Gain on sale of processing services, net
|
(4,085
|
)
|
—
|
|
—
|
|
|||||
|
Securities losses (gains)
|
—
|
|
(2,277
|
)
|
288
|
|
|||||
|
Origination of loans held for sale
|
(393,908
|
)
|
(575,705
|
)
|
(513,253
|
)
|
|||||
|
Proceeds from sale of loans held for sale
|
443,708
|
|
589,376
|
|
518,398
|
|
|||||
|
Gain on sale of loans
|
(10,738
|
)
|
(7,465
|
)
|
(8,751
|
)
|
|||||
|
Net writedowns/losses on other real estate
|
6,686
|
|
36,229
|
|
53,450
|
|
|||||
|
Gain on retirement of long-term obligations
|
—
|
|
—
|
|
(9,685
|
)
|
|||||
|
Net amortization of premiums and discounts
|
(115,060
|
)
|
(158,227
|
)
|
(194,434
|
)
|
|||||
|
FDIC receivable for loss share agreements
|
71,771
|
|
(7,181
|
)
|
44,551
|
|
|||||
|
Net change in other assets
|
103,974
|
|
(17,617
|
)
|
89,979
|
|
|||||
|
Net change in other liabilities
|
56,998
|
|
23,967
|
|
(1,541
|
)
|
|||||
|
Net cash provided by operating activities
|
331,007
|
|
201,288
|
|
335,686
|
|
|||||
|
INVESTING ACTIVITIES
|
|||||||||||
|
Net change in loans outstanding
|
323,436
|
|
627,806
|
|
473,974
|
|
|||||
|
Purchases of investment securities available for sale
|
(2,671,420
|
)
|
(5,169,641
|
)
|
(3,480,699
|
)
|
|||||
|
Proceeds from maturities/calls of investment securities held to maturity
|
435
|
|
480
|
|
709
|
|
|||||
|
Proceeds from maturities/calls of investment securities available for sale
|
2,437,851
|
|
3,986,370
|
|
4,002,724
|
|
|||||
|
Proceeds from sales of investment securities available for sale
|
—
|
|
7,900
|
|
242,023
|
|
|||||
|
Net change in overnight investments
|
(416,144
|
)
|
(8,205
|
)
|
(36,585
|
)
|
|||||
|
Cash received from the FDIC for loss share agreements
|
19,373
|
|
251,972
|
|
293,067
|
|
|||||
|
Proceeds from sale of other real estate
|
147,550
|
|
147,858
|
|
135,803
|
|
|||||
|
Additions to premises and equipment
|
(66,037
|
)
|
(88,883
|
)
|
(76,901
|
)
|
|||||
|
Net cash received from acquisitions
|
—
|
|
—
|
|
1,150,879
|
|
|||||
|
Net cash (used) provided by investing activities
|
(224,956
|
)
|
(244,343
|
)
|
2,704,994
|
|
|||||
|
FINANCING ACTIVITIES
|
|||||||||||
|
Net change in time deposits
|
(699,005
|
)
|
(1,049,761
|
)
|
(2,273,418
|
)
|
|||||
|
Net change in demand and other interest-bearing deposits
|
487,046
|
|
1,558,512
|
|
4,417
|
|
|||||
|
Net change in short-term borrowings
|
(57,087
|
)
|
(101,717
|
)
|
(283,440
|
)
|
|||||
|
Repayment of long-term obligations
|
(4,152
|
)
|
(196,338
|
)
|
(320,730
|
)
|
|||||
|
Origination of long-term obligations
|
70,000
|
|
310
|
|
—
|
|
|||||
|
Repurchase of common stock
|
(321
|
)
|
(103,624
|
)
|
(24,387
|
)
|
|||||
|
Cash dividends paid
|
(8,663
|
)
|
(15,398
|
)
|
(12,499
|
)
|
|||||
|
Net cash (used) provided by financing activities
|
(212,182
|
)
|
91,984
|
|
(2,910,057
|
)
|
|||||
|
Change in cash and due from banks
|
(106,131
|
)
|
48,929
|
|
130,623
|
|
|||||
|
Cash and due from banks at beginning of period
|
639,730
|
|
590,801
|
|
460,178
|
|
|||||
|
Cash and due from banks at end of period
|
$
|
533,599
|
|
$
|
639,730
|
|
$
|
590,801
|
|
||
|
CASH PAYMENTS FOR:
|
|||||||||||
|
Interest
|
$
|
59,234
|
|
$
|
104,514
|
|
$
|
157,477
|
|
||
|
Income taxes
|
102,890
|
|
66,453
|
|
91,465
|
|
|||||
|
SUPPLEMENTAL DISCLOSURE OF NONCASH INVESTING AND FINANCING ACTIVITIES:
|
|||||||||||
|
Change in unrealized securities gains (losses)
|
$
|
(50,441
|
)
|
$
|
7,244
|
|
$
|
3,370
|
|
||
|
Change in fair value of cash flow hedge
|
3,178
|
|
316
|
|
(1,222
|
)
|
|||||
|
Change in pension obligation
|
140,752
|
|
(33,079
|
)
|
(51,559
|
)
|
|||||
|
Transfers of loans to other real estate
|
92,125
|
|
140,645
|
|
213,195
|
|
|||||
|
Dividends declared but not paid
|
2,885
|
|
—
|
|
—
|
|
|||||
|
Reclassification of reserve for unfunded commitments to allowance for loan and lease losses
|
7,368
|
|
—
|
|
—
|
|
|||||
|
Acquisitions:
|
|||||||||||
|
Assets acquired
|
—
|
|
—
|
|
2,934,464
|
|
|||||
|
Liabilities assumed
|
—
|
|
—
|
|
2,784,047
|
|
|||||
|
Net assets acquired
|
—
|
|
—
|
|
150,417
|
|
|||||
See accompanying Notes to Consolidated Financial Statements.
64
First Citizens BancShares, Inc. and Subsidiaries
Notes to Consolidated Financial Statements
NOTE A
ACCOUNTING POLICIES AND BASIS OF PRESENTATION
General
First Citizens BancShares, Inc. (BancShares) is a financial holding company organized under the laws of Delaware and conducts operations through its banking subsidiary, First-Citizens Bank & Trust Company (FCB), which is headquartered in Raleigh, North Carolina.
On January 1, 2014, FCB completed the merger of 1st Financial Services Corporation (1st Financial). The 1st Financial merger was accounted for under the acquisition method of accounting. The purchased assets, assumed liabilities and identifiable intangible assets were recorded at their acquisition date estimated fair values. Fair values are subject to refinement for up to one year after the closing date of the transaction as additional information regarding closing date fair values becomes available. See Note V for additional information regarding the 1st Financial merger.
The accounting and reporting policies of BancShares and its subsidiaries are in accordance with accounting principles generally accepted in the United States of America (GAAP). Additionally, where applicable, the policies conform to the accounting and reporting guidelines prescribed by bank regulatory authorities. The following is a summary of BancShares' more significant accounting policies.
Nature of Operations
FCB operates
397
branches in North Carolina, Virginia, West Virginia, Maryland, Tennessee, California, Washington, Florida, Washington, DC, Georgia, Texas, Arizona, New Mexico, Colorado, Oregon, Missouri, Oklahoma and Kansas. FCB provides full-service banking services designed to meet the needs of retail and commercial customers in the markets in which it operates. The services provided include transaction and savings deposit accounts, commercial and consumer loans, trust and asset management. Investment services, including sales of annuities and third party mutual funds are offered through First Citizens Investor Services, Inc., and title insurance is offered through Neuse Financial Services, Inc.
Principles of Consolidation and Segment Reporting
The consolidated financial statements of BancShares include the accounts of BancShares and those subsidiaries that are majority owned by BancShares and over which BancShares exercises control. In consolidation, all significant intercompany accounts and transactions are eliminated. The results of operations of companies or assets acquired are included only from the dates of acquisition. All material wholly-owned and majority-owned subsidiaries are consolidated unless GAAP requires otherwise.
On January 7, 2011, IronStone Bank (ISB), a federally-chartered thrift institution and wholly-owned subsidiary of BancShares, was legally merged into FCB resulting in a single banking subsidiary of BancShares. Prior to the January 2011 merger, FCB and ISB were considered to be distinct operating segments. As a result of the merger and various organizational changes resulting from the merger, there is no longer a focus on the discrete financial measures of each entity, and, based on application of GAAP, no other reportable operating segments exist. Therefore, BancShares now operates as one reportable segment.
FCB has investments in certain low income housing tax credit and renewable energy LLCs that have been evaluated and determined to be variable interest entities (VIEs). VIEs are legal entities in which equity investors do not have sufficient equity at risk for the entity to independently finance its activities, or as a group, the holders of the equity investment at risk lack the power through voting or similar rights to direct the activities of the entity that most significantly impact its economic performance, or do not have the obligation to absorb the expected losses of the entity or the right to receive expected residual returns of the entity. Consolidation of a VIE is considered appropriate if a reporting entity holds a controlling financial interest in the VIE. Analysis of these investments concluded that FCB is not the primary beneficiary and does not hold a controlling interest in the VIEs and, therefore, the assets and liabilities of these partnerships are not consolidated into the financial statements of FCB or BancShares. The recorded investment in these partnerships is reported within other assets in BancShares' Consolidated Balance Sheets.
65
FIRST CITIZENS BANCSHARES, INC. AND SUBSIDIARIES
NOTES TO CONSOLIDATED FINANCIAL STATEMENTS (Continued)
Reclassifications
In certain instances, amounts reported in prior years' consolidated financial statements have been reclassified to conform to the current financial statement presentation. Such reclassifications had no effect on previously reported cash flows, shareholders' equity or net income.
During the third quarter of 2013, management reevaluated its fair value leveling methodology and the inputs utilized by the 3rd party pricing services for the current and prior periods. Management concluded that due to the reliance on significant observable inputs, the fair values of its US Treasury, Government agency and other securities should be classified as level 2 rather than the level 1 previously disclosed. Management also concluded that its equity securities should be classified as level 2 rather than the level 1 previously disclosed due to the inactive nature of the markets in which these securities trade.
Use of Estimates in the Preparation of Financial Statements
The preparation of financial statements in conformity with GAAP requires management to make estimates and assumptions that affect the reported amounts of assets and liabilities and disclosure of contingent assets and liabilities as of the date of the financial statements and the reported amounts of revenues and expenses during the reporting periods. Actual results could differ from those estimates, and different assumptions in the application of these policies could result in material changes in BancShares' consolidated financial position, the consolidated results of its operations or related disclosures. Material estimates that are particularly susceptible to significant change include:
|
•
|
Allowance for loan and lease losses
|
|
•
|
Fair value of financial instruments, including acquired assets and assumed liabilities
|
|
•
|
Pension plan assumptions
|
|
•
|
Cash flow estimates on acquired loans
|
|
•
|
Receivable from and payable to the FDIC for loss share agreements
|
|
•
|
Income tax assets, liabilities and expense
|
Business Combinations
BancShares accounts for all business combinations using the acquisition method of accounting as required by Accounting Standards Codification (ASC) Topic 805, Business Combinations. Under this method of accounting, acquired assets and assumed liabilities are included with the acquirer's accounts as of the date of acquisition, with any excess of purchase price over the fair value of the net assets acquired (including identifiable core deposit intangibles (CDI)) capitalized as goodwill. The CDI asset is recognized as an asset apart from goodwill when it arises from contractual or other legal rights or if it is capable of being separated or divided from the acquired entity and sold, transferred, licensed, rented or exchanged. In addition, acquisition-related costs and restructuring costs are recognized as period expenses as incurred.
The acquired assets and assumed liabilities are recorded at estimated fair values. Management makes significant estimates and exercises significant judgment in accounting for business combinations. Management judgmentally assigns risk ratings to loans based on credit quality, appraisals and estimated collateral values, and estimated expected cash flows to measure fair values for loans. Other real estate (OREO) is valued based upon pending sales contracts and appraised values, adjusted for current market conditions. CDI is valued based on a weighted combination of the income and market approach where the income approach converts anticipated economic benefits to a present value and the market approach evaluates the market in which the asset is traded to find an indication of prices from actual transactions. Management uses quoted or current market prices to determine the fair value of investment securities. Fair values of deposits, short-term borrowings and long-term obligations are based on current market interest rates and are inclusive of any applicable prepayment penalties.
Cash and Cash Equivalents
Cash and cash equivalents include cash and due from banks, interest-bearing deposits with banks and Federal funds sold. Cash and cash equivalents have maturities of three months or less. Accordingly, the carrying amount of such instruments is considered a reasonable estimate of fair value.
66
FIRST CITIZENS BANCSHARES, INC. AND SUBSIDIARIES
NOTES TO CONSOLIDATED FINANCIAL STATEMENTS (Continued)
Investment Securities
BancShares' investments consist of government agency securities, U.S. Treasury securities, mortgage-backed securities, corporate bonds, state, county and municipal obligations and equity securities.
BancShares classifies marketable investment securities as held to maturity, available for sale or trading. Interest income and dividends on securities are recognized in interest income on an accrual basis. Premiums and discounts on debt securities are amortized as an adjustment to interest income using the interest method. At
December 31, 2013, and 2012
, BancShares had no investment securities held for trading purposes.
Debt securities are classified as held to maturity where BancShares has both the intent and ability to hold the securities to maturity. These securities are reported at amortized cost.
Investment securities that may be sold to meet liquidity needs arising from unanticipated deposit and loan fluctuations, changes in regulatory capital requirements or unforeseen changes in market conditions, are classified as available for sale. Securities available for sale are reported at estimated fair value, with unrealized gains and losses reported in accumulated other comprehensive income or loss, net of deferred income taxes, in the shareholders' equity section of the Consolidated Balance Sheets. Gains or losses realized from the sale of securities available for sale are determined by specific identification and are included in noninterest income. As of
December 31, 2013
, there was no intent to sell any of the securities classified as available for sale.
BancShares evaluates each held to maturity and available for sale security in a loss position for other-than-temporary impairment (OTTI) in accordance with ASC Topic 320-10,
Investments - Debt and Equity Securities
, at least quarterly. BancShares considers such factors as the length of time and the extent to which the market value has been below amortized cost, long term expectations and recent experience regarding principal and interest payments, BancShares' intent to sell, and whether it is more likely than not that it would be required to sell those securities before the anticipated recovery of the amortized cost basis. The credit component of an OTTI loss is recognized in earnings and the non-credit component is recognized in accumulated other comprehensive income in situations where BancShares does not intend to sell the security, and it is more likely than not that BancShares will not be required to sell the security prior to recovery.
Nonmarketable Securities - FHLB Stock and TARP Stock
Federal law requires a member institution of the Federal Home Loan Bank (FHLB) system to purchase and hold restricted stock of its district FHLB according to a predetermined formula. This stock is restricted in that it may only be sold to the FHLB and all sales must be at par. Accordingly, the FHLB restricted stock is carried at cost, less any applicable impairment charges.
Investments in preferred stock that had initially been issued under the U. S. Treasury's Troubled Asset Recovery Program (TARP) and were purchased in the auction process initiated when the U. S. Treasury decided to liquidate its investments are carried at cost, less any applicable impairment charges, because the securities are not traded and an active market does not exist. Nonmarketable securities are
periodically evaluated for impairment. BancShares considers positive and negative evidence, including the profitability and asset quality of the issuer, dividend payment history and recent redemption experience when determining the ultimate recoverability of the recorded investment.
Investments in FHLB stock and TARP stock are included in other assets.
Loans Held For Sale
BancShares accounts for new originations of prime residential mortgage loans at the lower of aggregate cost or fair value. Gains and losses on sales of mortgage loans are charged to the Consolidated Statements of Income in mortgage income.
Loans and Leases
BancShares' accounting methods for loans and leases differ depending on whether they are originated or acquired, and if acquired, whether or not the acquired assets reflect credit deterioration since the date of origination such that it is probable at the date of acquisition that BancShares will be unable to collect all contractually required payments.
Originated Loans and Leases
Loans and leases for which management has the intent and ability to hold for the foreseeable future are classified as held for investment and carried at the principal amount outstanding net of any unearned income, charge-offs and unamortized fees and
67
FIRST CITIZENS BANCSHARES, INC. AND SUBSIDIARIES
NOTES TO CONSOLIDATED FINANCIAL STATEMENTS (Continued)
costs on originated loans. Nonrefundable fees collected and certain direct costs incurred related to loan originations are deferred and recorded as an adjustment to loans and leases outstanding. The net amount of the nonrefundable fees and costs are amortized to interest income over the contractual lives using methods that approximate a constant yield.
Acquired Loans and Leases
Acquired loans and leases are recorded at fair value at the date of acquisition. No allowance for loan and lease losses is recorded on the acquisition date as the fair value of the acquired assets incorporates assumptions regarding credit risk.
Acquired loans and leases are evaluated at acquisition and where a discount is noted at least in part due to credit, the loans are accounted for under the guidance in ASC Topic 310-30,
Loans and Debt Securities Acquired with Deteriorated Credit Quality
. Purchased impaired loans and leases reflect credit deterioration since origination such that it is probable at acquisition that BancShares will be unable to collect all contractually required payments. As of the acquisition date, the difference between contractually required payments and the cash flows expected to be collected is the nonaccretable difference, which is included as a reduction to the carrying amount of acquired loans and leases. If the timing and amount of the future cash flows is reasonably estimable, any excess of cash flows expected at acquisition over the estimated fair value is the accretable yield and is recognized in interest income over the asset's remaining life using a level yield method.
Over the life of acquired loans and leases, BancShares continues to estimate cash flows expected to be collected on individual loans and leases or on pools of loans and leases sharing common risk characteristics. BancShares evaluates at each balance sheet date whether the estimated cash flows and corresponding present value of its loans and leases determined using the effective interest rates has decreased and if so, recognizes provision for loan and lease losses in its Consolidated Statements of Income. For any increases in cash flows expected to be collected, BancShares adjusts any prior recorded allowance for loan and lease losses first, and then the amount of accretable yield recognized on a prospective basis over the loan's or pool's remaining life.
Accretion income is recognized on all non-pooled loans and leases except for situations when the timing and amount of future cash flows cannot be determined. Loans and leases with uncertain future cash flows are accounted for under the cost recovery method and those loans and leases are generally reported as nonaccrual.
For loans and leases where the cash flow analysis was initially performed at the loan pool level, the amount of accretable yield and nonaccretable difference is determined at the pool level. Each loan pool is made up of assets with similar characteristics at the date of acquisition including loan type, collateral type and performance status. All loan pools that have accretable yield to be recognized in interest income are classified as accruing regardless of the status of individual loans within the pool.
Impaired Loans, Troubled Debt Restructurings (TDR) and Nonperforming Assets
Management will deem originated loans and leases to be impaired when, based on current information and events, it is probable that a borrower will be unable to pay all amounts due according to the contractual terms of the loan agreement. Generally, management considers the following loans to be impaired; all TDR loans, commercial and consumer relationships which are nonaccrual or 90+ days past due and greater than
$500,000
as well as any other loan management deems impaired. Once a loan is considered impaired, it is required to be individually evaluated for impairment at least quarterly using discounted cash flows, observable market price or the fair value of collateral. When the ultimate collectability of an impaired loan's principal is doubtful, all cash receipts are applied to principal. Once the recorded principal balance has been reduced to zero, future cash receipts are applied to interest income, to the extent that any interest has been foregone.
A loan is considered a TDR when a modification to a borrower's debt agreement is made and where a concession that is granted for economic or legal reasons related to a borrower's financial difficulties that otherwise would not be granted. TDRs are undertaken in order to improve the likelihood of collection on the loan and may result in a stated interest rate lower than the current market rate for new debt with similar risk, other modifications to the structure of the loan that fall outside of normal underwriting policies and procedures or, in certain limited circumstances, forgiveness of principal or interest. Modifications of acquired loans that are part of a pool accounted for as a single asset are not designated as TDRs. TDRs can involve loans remaining on nonaccrual, moving to nonaccrual or continuing on accruing status, depending on the individual facts and circumstances of the borrower. In circumstances where a portion of the loan balance is charged off, BancShares typically classifies the remaining balance as nonaccrual.
In connection with commercial TDRs, the decision to maintain a loan that has been restructured on accrual status is based on a current credit evaluation of the borrower's financial condition and prospects for repayment under the modified terms. This evaluation includes consideration of the borrower's current capacity to pay, which may include a review of the borrower's
68
FIRST CITIZENS BANCSHARES, INC. AND SUBSIDIARIES
NOTES TO CONSOLIDATED FINANCIAL STATEMENTS (Continued)
current financial statements, an analysis of cash flow documenting the borrower's capacity to pay all debt obligations and an evaluation of secondary sources of payment from the borrower and any guarantors. This evaluation also includes an evaluation of the borrower's current willingness to pay, which may include a review of past payment history, an evaluation of the borrower's willingness to provide information on a timely basis and consideration of offers from the borrower to provide additional collateral or guarantor support. The credit evaluation also reflects consideration of the adequacy of collateral to cover all principal and interest and trends indicating improving profitability and collectability of receivables.
Nonaccrual TDRs may be returned to accrual status based on a current credit evaluation of the borrower's financial condition and prospects for repayment under the modified terms. This evaluation includes consideration of the borrower's sustained historical repayment performance for a reasonable period, generally a minimum of six months, prior to the date on which the loan is returned to accrual status. Sustained historical repayment performance for a reasonable time prior to the restructuring may also be considered.
Nonperforming assets include nonaccrual loans and leases and foreclosed property. Foreclosed property consists of real estate and other assets acquired as a result of loan defaults.
BancShares classifies all originated loans and leases as past due when the payment of principal and interest based upon contractual terms is greater than 30 days delinquent. Generally, commercial loans are placed on nonaccrual status when principal or interest becomes 90 days past due or when it is probable that principal or interest is not fully collectible, whichever occurs first. Once a loan is placed on nonaccrual status it is evaluated for impairment and a charge-off is recorded in the amount of the impairment. Consumer loans are subject to mandatory charge-off at a specified delinquency date consistent with regulatory guidelines.
Generally, when loans and leases are placed on nonaccrual status, accrued interest receivable that had been recognized in the current year is reversed against interest income; accrued interest receivable that had been recognized in a prior year is charged off. All payments received thereafter are applied as a reduction to the remaining principal balance as long as concern exists as to the ultimate collection of the principal. Loans and leases are generally removed from nonaccrual status when they become current as to both principal and interest and concern no longer exists as to the collectability of principal and interest.
Noncovered OREO acquired as a result of foreclosure is carried at net realizable value. Net realizable value equals fair value less estimated selling costs. Any excess of cost over fair value at the time of foreclosure is charged to the allowance for loan and lease losses. Cost is determined based on the sum of unpaid principal, accrued but unpaid interest and acquisition costs associated with the loan.
OREO are subject to periodic revaluations of the underlying collateral, at least annually. The periodic revaluations are generally based on the appraised value of the property and may include additional adjustments based upon management's review of the valuation and specific knowledge of the OREO. Routine maintenance costs, subsequent declines in market value and net losses on disposal are included in foreclosed property expense. Gains and losses resulting from the sale or writedown of OREO and income and expenses related to its operation are recorded in other noninterest income.
OREO covered by loss share agreements with the FDIC is reported exclusive of expected reimbursement cash flows from the FDIC at net realizable value. Subsequent downward adjustments to the estimated recoverable value of covered OREO result in a reduction of covered OREO, a charge to foreclosure related expenses and an increase in the FDIC receivable for the estimated amount to be reimbursed, with a corresponding amount recorded as an adjustment to FDIC receivable.
Covered Assets and Receivable from FDIC for Loss Share Agreements
Assets subject to loss share agreements with the FDIC include certain acquired loans and OREO. These loss share agreements afford BancShares significant protection. The agreements cover realized losses on certain loans and other assets purchased from the FDIC during the time period specified in the agreements. Realized losses covered include loan contractual balances, accrued interest on loans for up to 90 days, the book value of foreclosed real estate acquired and certain direct costs, less cash or other consideration received by BancShares.
The FDIC receivable is recorded at fair value at the acquisition date of the indemnified assets and is measured on the same basis as the underlying loans, subject to collectability or contractual limitations. The fair value of the loss share agreements on the acquisition date reflects the discounted reimbursements expected to be received from the FDIC, using an appropriate discount rate, which was based on the market rate for a similar term security at the time of the acquisition adjusted for additional risk premium.
69
FIRST CITIZENS BANCSHARES, INC. AND SUBSIDIARIES
NOTES TO CONSOLIDATED FINANCIAL STATEMENTS (Continued)
The loss share agreements continue to be measured on the same basis as the related indemnified assets. Because the acquired loans are subject to the accounting prescribed by ASC 310-30, subsequent changes to the basis of the loss share agreements also follow that model. Deterioration in the credit quality of the loans, which is immediately recorded as an adjustment to the allowance for loan losses, would immediately increase the FDIC receivable, with the offset recorded through the consolidated statement of income. Improvements in the credit quality or cash flows of loans, which is reflected as an adjustment to yield and accreted into income over the remaining life of the loans, decrease the FDIC receivable, with such decrease being amortized into income over (1) the same period as the underlying loans or (2) the life of the loss share agreements, whichever is shorter. Loss assumptions used in the basis of the indemnified loans are consistent with the loss assumptions used to measure the indemnification asset. Discounts and premiums reflecting the estimated timing of expected reimbursements is accreted into income over the life of the loss share agreements.
Collection and other servicing costs related to loans covered under FDIC loss share agreements are charged to noninterest expense as incurred. A receivable from the FDIC is recorded for the estimated amount of such expenses that are expected to be reimbursed and results in an increase to noninterest income. The estimated amount of such reimbursements is determined by several factors including the existence of loan participation agreements with other financial institutions, the presence of partial guarantees from the Small Business Administration and whether a reimbursable loss has been recorded on the loan for which collection and servicing costs have been incurred. Future adjustments to the receivable from the FDIC may be necessary as additional information becomes available related to the amount of previously recorded collection and servicing costs that will actually be reimbursed by the FDIC and the probable timing of such reimbursements.
Payable to the FDIC for Loss Share Agreements
The purchase and assumption agreements for certain FDIC-assisted transactions include contingent payments that may be owed to the FDIC at the termination of the loss share agreements
.
The contingent payment is due to the FDIC if actual cumulative losses on acquired covered assets are lower than the cumulative losses originally estimated by the FDIC at the time of acquisition. The contingent liability, which is reported in the Consolidated Balance Sheets as a payable to the FDIC for loss share agreements, is calculated by discounting estimated future payments. The ultimate settlement amount of the contingent payment is dependent upon the performance of the underlying covered loans, the passage of time and actual claims submitted to the FDIC.
Allowance for Loan and Lease Losses (ALLL)
Originated Loans
The ALLL represents management's best estimate of probable credit losses within the loan and lease portfolio at the balance sheet date. Management determines the ALLL based on an ongoing evaluation. This evaluation is inherently subjective because it requires material estimates, including the amount and timing of cash flows expected to be received on acquired loans. Those estimates are susceptible to significant change. Adjustments to the ALLL are recorded with a corresponding entry to provision for loan and lease losses. Loan and lease balances deemed to be uncollectible are charged off against the ALLL. Recoveries of amounts previously charged off are generally credited to the ALLL.
Accounting standards require the presentation of certain information at the portfolio segment level, which represents the level at which an entity develops and documents a systematic methodology to determine its ALLL. BancShares evaluates its loan and lease portfolio using three portfolio segments: originated commercial, originated noncommercial and acquired. The originated commercial segment includes commercial construction and land development, commercial mortgage, commercial and industrial, lease financing and other commercial real estate loans, and the related ALLL is calculated based on a risk-based approach as reflected in credit risk grades assigned to commercial segment loans. The originated noncommercial segment includes noncommercial construction and land development, residential mortgage, revolving mortgage and consumer loans, and the associated ALLL was determined using a delinquency-based approach.
BancShares' methodology for calculating the ALLL includes estimating a general allowance for pools of unimpaired loans and specific allocations for significant individual impaired loans. The general allowance is based on net historical loan loss experience for homogeneous groups of loans based mostly on loan type then aggregated on the basis of similar risk characteristics and performance trends. The general allowance estimate also contains qualitative components that allow management to adjust reserves based on historical loan loss experience for changes in the economic environment, portfolio trends and other factors. The specific allowance component is determined when management believes that the collectability of an individually reviewed loan has been impaired and a loss is probable. The fair value of impaired loans is based on the present
70
FIRST CITIZENS BANCSHARES, INC. AND SUBSIDIARIES
NOTES TO CONSOLIDATED FINANCIAL STATEMENTS (Continued)
value of expected cash flows, market prices of the loans, if available, or the value of the underlying collateral. Expected cash flows are discounted at the loans' effective interest rates.
The general allowance considers probable, incurred losses that are inherent within the loan portfolio but have not been specifically identified. Loans are divided into segments for analysis based in part on the risk profile inherent in each segment. Loans are further segmented into classes to appropriately recognize changes in inherent risk. A primary component of determining the general allowance for performing and classified loans not analyzed specifically is the actual loss history of the various classes. Loan loss factors based on historical experience may be adjusted for significant factors that, in management's judgment, affect the collectability of the portfolio at the balance sheet date. For originated commercial loans and leases, management incorporates historical net loss data to develop the applicable loan loss factors by utilizing information that considers the class of the commercial loan and associated risk rating. For the originated noncommercial segment, management incorporates specific loan class and delinquency status trends into the loan loss factors. Loan loss factors may be adjusted quarterly based on changes in the level of historical net charge-offs and model adjustment parameter updates by management, such as the number of periods included in the calculation of loss factors, loss severity and portfolio attrition.
The quarterly ALLL evaluation process for the general allowance also includes a qualitative framework that considers economic conditions, composition of the loan portfolio, trends in delinquent and nonperforming loans, historical loss experience by categories of loans, concentrations of credit, changes in lending policies and underwriting standards, regulatory exam results and other factors indicative of inherent losses remaining in the portfolio. Management may adjust the ALLL calculated based on historical loan loss factors when assessing changes in the factors in the qualitative framework. The adjustments to the ALLL for the qualitative framework are based on economic data, data analysis of portfolio trends and management judgment. These adjustments are specific to the loan class level. Prior to the second quarter of 2013, a portion of the allowance for loan and lease losses was not allocated to any specific class of loans. This nonspecific portion reflected management's best estimate of the elements of imprecision and estimation risk inherent in the calculation of the overall allowance.
During the second quarter of 2013, BancShares implemented enhancements to the process to estimate the ALLL and the reserve for unfunded commitments, described below. Through detailed analysis of historical loss data, the process enhancements enabled allocation of the previously unallocated "nonspecific" ALLL and a portion of the reserve for unfunded loan commitments to specific loan classes. The enhanced ALLL estimates implicitly include the risk of draws on open lines within each loan class. Other than the modifications described above, the enhancements to the methodology had no material impact on the ALLL.
Specific allocations are made for significant, individual impaired loans. Management deems a loan to be impaired when, based upon current information and events, it is probable that BancShares will be unable to collect all amounts due according to the contractual terms of the loan. Generally management considers the following loans to be impaired: all TDR loans, commercial and consumer relationships which are nonaccrual or 90+ days past due and greater than
$500,000
as well as any other loan management deems impaired. All impaired loans are
reviewed for potential impairment on a quarterly basis. Specific valuation allowances are established or partial charge-offs are recorded on impaired loans for the difference between the loan amount and the estimated fair value.
Management continuously monitors and actively manages the credit quality of the entire loan portfolio and adjusts the ALLL to an appropriate level. By assessing the probable estimated incurred losses in the loan portfolio on a quarterly basis, management is able to adjust specific and general loss estimates based upon the most recent information available. Future adjustments to the ALLL may be necessary based on changes in economic and other conditions. Additionally, various regulatory agencies, as an integral part of their examination process, periodically review BancShares' ALLL. Such agencies may require the recognition of adjustments to the ALLL based on their judgments of information available to them at the time of their examination. Management considers the established ALLL adequate to absorb probable losses that relate to loans and leases outstanding as of
December 31, 2013
.
Each portfolio segment and the classes within those segments are subject to risks that could have an adverse impact on the credit quality of the loan and lease portfolio and the related ALLL. Management has identified the most significant risks as described below that are generally similar among the segments and classes. While the list is not exhaustive, it provides a description of the risks management has determined are the most significant.
71
FIRST CITIZENS BANCSHARES, INC. AND SUBSIDIARIES
NOTES TO CONSOLIDATED FINANCIAL STATEMENTS (Continued)
Originated Commercial Loans and Leases
Each commercial loan or lease is centrally underwritten based primarily upon the customer's ability to generate the required cash flow to service the debt in accordance with the contractual terms and conditions of the loan agreement. A complete understanding of the borrower's business, including the experience and background of the principals, is obtained prior to approval. To the extent that the loan or lease is secured by collateral, which is true for the majority of commercial loans and leases, the likely value of the collateral and what level of strength the collateral brings to the transaction is evaluated. To the extent that the principals or other parties provide personal guarantees, the relative financial strength and liquidity of each guarantor is assessed.
The significant majority of relationships in the originated commercial segment are assigned credit risk grades based upon an assessment of conditions that affect the borrower's ability to meet contractual obligations under the loan agreement. This process includes reviewing the borrowers' financial information, payment history, credit documentation, public information and other information specific to each borrower. Credit risk grades are reviewed annually, or at any point management becomes aware of information affecting the borrowers' ability to fulfill their obligations. Our credit risk grading standards are described in Note C.
The impairment assessment and determination of the related specific reserve for each impaired loan is based on a loan's characteristics. Impairment measurement for loans that are not collateral dependent is based on the present value of expected cash flows discounted at the loan's effective interest rate. Specific valuation allowances are established or partial charge-offs are recorded for the difference between the loan amount and the estimated fair value. Impairment measurement for most real estate loans, particularly when a loan is considered to be a probable foreclosure, is based on the fair value of the underlying collateral. Collateral is appraised and market value, appropriately adjusted for an assessment of the sales and marketing costs as well as the expected holding period, is used to calculate an anticipated fair value.
General reserves for collective impairment are based on estimated incurred losses related to unimpaired commercial loans and leases as of the balance sheet date. Incurred loss estimates for the originated commercial segment are based on average loss rates by credit risk ratings, which are estimated using historical loss experience and credit risk rating migrations. Incurred loss estimates may be adjusted through a qualitative assessment to reflect current economic conditions and portfolio trends including credit quality, concentrations, aging of the portfolio and significant policy and underwriting changes.
Common risks to each class of commercial loans include general economic conditions within the markets BancShares serves, as well as risks that are specific to each transaction including demand for products and services, personal events, such as disability or change in marital status and reductions in the value of collateral. Due to the concentration of loans in the medical, dental and related fields, BancShares is susceptible to risks that governmental actions, including implementation of the Affordable Care Act, will fundamentally alter the medical care industry in the United States.
In addition to these common risks for the majority of the originated commercial segment, additional risks are inherent in certain classes of originated commercial loans and leases.
Commercial construction and land development
Commercial construction and land development loans are highly dependent on the supply and demand for commercial real estate in the markets served by BancShares as well as the demand for newly constructed residential homes and lots that customers are developing. Deterioration in demand could result in decreases in collateral values and could make repayment of the outstanding loans more difficult for customers.
Commercial mortgage, commercial and industrial and lease financing
Commercial mortgage loans, commercial and industrial loans and lease financing are primarily dependent on the ability of borrowers to achieve business results consistent with those projected at loan origination resulting in cash flow sufficient to service the debt. To the extent that a customer's business results are significantly unfavorable versus the original projections, the ability for the loan to be serviced on a basis consistent with the contractual terms may be at risk. While these loans and leases are generally secured by real property, personal property or business assets such as inventory or accounts receivable, it is possible that the liquidation of the collateral will not fully satisfy the obligation.
Other commercial real estate
Other commercial real estate loans consist primarily of loans secured by multifamily housing and agricultural loans. The primary risk associated with multifamily loans is the ability of the income-producing property that collateralizes the loan to produce adequate cash flow to service the debt. High unemployment or generally weak economic conditions may result in customers having to provide rental rate concessions to achieve adequate occupancy rates. The performance of agricultural loans is highly dependent on favorable weather, reasonable costs for seed and fertilizer and the ability to successfully market the
72
FIRST CITIZENS BANCSHARES, INC. AND SUBSIDIARIES
NOTES TO CONSOLIDATED FINANCIAL STATEMENTS (Continued)
product at a profitable margin. The demand for these products is also dependent on macroeconomic conditions that are beyond the control of the borrower.
Originated Noncommercial Loans and Leases
Each originated noncommercial loan is centrally underwritten using automated credit scoring and analysis tools. These credit scoring tools take into account factors such as payment history, credit utilization, length of credit history, types of credit currently in use and recent credit inquiries. To the extent that the loan is secured by collateral, the likely value of that collateral is evaluated.
The ALLL for the originated noncommercial segment is primarily calculated on a pooled basis using a delinquency-based approach. Estimates of incurred losses are based on historical loss experience and the migration of receivables through the various delinquency pools applied to the current risk mix. These estimates may be adjusted through a qualitative assessment to reflect current economic conditions, portfolio trends and other factors. The remaining portion of the ALLL related to the originated noncommercial segment results from loans that are deemed impaired. The impairment assessment and determination of the related specific reserve for each impaired loan is based on a loan's characteristics. Impairment measurement for loans that are not collateral dependent is based on the present value of expected cash flows discounted at the loan's effective interest rate. Specific valuation allowances are established or partial charge-offs are recorded for the difference between the loan amount and the estimated fair value. Impairment measurement for most real estate loans, particularly when a loan is considered to be a probable foreclosure, is based on the fair value of the underlying collateral. Collateral is appraised and market value, appropriately adjusted for an assessment of the sales and marketing costs as well as the expected holding period, is used to calculate an anticipated fair value.
Common risks to each class of noncommercial loans include risks that are not specific to individual transactions such as general economic conditions within the markets BancShares serves, particularly unemployment and potential declines in real estate values. Personal events such as disability or change in marital status also add risk to noncommercial loans.
In addition to these common risks for the majority of noncommercial loans, additional risks are inherent in certain classes of noncommercial loans.
Revolving mortgage
Revolving mortgage loans are often secured by second liens on residential real estate, thereby making such loans particularly susceptible to declining collateral values. A substantial decline in collateral value could render a second lien position to be effectively unsecured. Additional risks include lien perfection inaccuracies, disputes with first lienholders and uncertainty regarding the customer's performance with respect to the first lien that may further weaken the collateral position. Further, the open-end structure of these loans creates the risk that customers may draw on the lines in excess of the collateral value if there have been significant declines since origination.
Consumer
The consumer loan portfolio includes loans secured by personal property such as automobiles, marketable securities, other titled recreational vehicles including boats and motorcycles, as well as unsecured consumer debt. The value of underlying collateral within this class is especially volatile due to potential rapid depreciation in values since date of loan origination, potentially in excess of principal balances.
Residential mortgage and noncommercial construction and land development
Residential mortgage and noncommercial construction and land development loans are made to individuals and are typically secured by 1-4 family residential property, undeveloped land and partially developed land in anticipation of pending construction of a personal residence. Significant and rapid declines in real estate values can result in residential mortgage loan borrowers having debt levels in excess of the current market value of the collateral. Noncommercial construction and land development projects can experience delays in completion and cost overruns that exceed the borrower's financial ability to complete the project. Such cost overruns can routinely result in foreclosure of partially completed and unmarketable collateral.
Acquired loans
The risks associated with acquired loans are generally consistent with the risks identified for commercial and noncommercial originated loans and the classes of loans within those segments. However, these loans were underwritten by other institutions with weaker lending standards. Additionally, in some cases, collateral for acquired loans is located in regions that have experienced profound erosion of real estate values. Therefore, there exists a significant risk that acquired loans are not adequately supported by borrower cash flow or the values of underlying collateral.
73
FIRST CITIZENS BANCSHARES, INC. AND SUBSIDIARIES
NOTES TO CONSOLIDATED FINANCIAL STATEMENTS (Continued)
The ALLL for acquired loans is estimated based on the estimated cash flows approach. Over the life of acquired loans and leases, BancShares continues to estimate cash flows expected to be collected on individual loans and leases or on pools of loans and leases sharing common risk characteristics. BancShares evaluates at each balance sheet date whether the estimated cash flows and corresponding present value of its loans and leases determined using the effective interest rates has decreased and if so, recognizes provision for loan and lease losses. For any increases in cash flows expected to be collected, BancShares adjusts any prior recorded allowance for loan and lease losses first and then the amount of accretable yield recognized on a prospective basis over the loan's or pool's remaining life.
Reserve for Unfunded Commitments
The reserve for unfunded commitments represents the estimated probable losses related to unfunded lending commitments, such as letters of credit, financial guarantees and similar binding commitments. The reserve is calculated in a manner similar to the loans evaluated collectively for impairment, while also considering the timing and likelihood that the available credit will be utilized as well as the exposure upon default. The reserve for unfunded commitments is presented within other liabilities on the consolidated balance sheets, distinct from the ALLL, and adjustments to the reserve for unfunded commitments are included in other noninterest expense in the consolidated statements of income.
Securities Sold Under Repurchase Agreements
Securities sold under repurchase agreements generally have maturities of one day and are reflected as short-term borrowings on the Consolidated Balance Sheets and are recorded based on the amount of cash received in connection with the borrowing. At
December 31, 2013, and 2012
, BancShares had
$97.0 million
and
$111.9 million
of securities sold under repurchase agreements, respectively.
Premises and Equipment
Premises, equipment and capital leases are stated at cost less accumulated depreciation and amortization. For financial reporting purposes, depreciation and amortization are computed using the straight-line method and are expensed over the estimated useful lives of the assets, which range from
25
to
40
years for premises and
three
to
10
years for furniture, software and equipment. Leasehold improvements are amortized over the terms of the respective leases or the useful lives of the improvements, whichever is shorter. Gains and losses on dispositions are recorded in other noninterest expense. Maintenance and repairs are charged to occupancy expense or equipment expense as incurred. Obligations under capital leases are amortized over the life of the lease using the interest method to allocate payments between principal reduction and interest expense. Rent expense and rental income on operating leases are recorded using the straight-line method over the appropriate lease terms.
Goodwill and Other Intangible Assets
BancShares accounts for acquisitions using the acquisition method of accounting. Under acquisition accounting, if the purchase price of an acquired company exceeds the fair value of its net assets, the excess is carried on the acquirer's balance sheet as goodwill. An intangible asset is recognized as an asset apart from goodwill if it arises from contractual or other legal rights or if it is capable of being separated or divided from the acquired entity and sold, transferred, licensed, rented or exchanged. Intangible assets are identifiable assets, such as core deposit intangibles, resulting from acquisitions which are amortized on an accelerated basis over an estimated useful life and evaluated for impairment whenever events or changes in circumstances indicate the carrying amount of the assets may not be recoverable.
Goodwill is not amortized but is evaluated at least annually for impairment or more frequently if events occur or circumstances change that may trigger a decline in the value of the reporting unit or otherwise indicate that a potential impairment exists. Examples of such events or circumstances include deterioration of general economic conditions, limitations on accessing capital, other equity and credit market developments, adverse change(s) in the environment in which BancShares operates, regulatory or political developments and changes in management, key personnel, strategy or customers. The evaluation of goodwill is based on a variety of factors, including common stock trading multiples and data from comparable acquisitions. Potential impairment of goodwill exists when the carrying amount of a reporting unit exceeds its fair value. In accordance with ASC Topic 350,
Intangibles - Goodwill and Other
, the fair value for the reporting unit is computed using various methods including market capitalization, price-earnings multiples, price-to-tangible book and market premium.
To the extent the reporting unit's carrying amount exceeds its fair value, an indication exists that the reporting unit's goodwill may be impaired, and the second step of impairment testing will be performed. In the second step, the implied fair value of the reporting unit's goodwill is determined by allocating the reporting unit's fair value to all of its assets (recognized and unrecognized) and liabilities as if the reporting unit had been acquired in a business combination at the date of the impairment
74
FIRST CITIZENS BANCSHARES, INC. AND SUBSIDIARIES
NOTES TO CONSOLIDATED FINANCIAL STATEMENTS (Continued)
test. If the implied fair value of the reporting unit's goodwill is lower than its carrying amount, goodwill is impaired and is written down to the implied fair value. The loss recognized is limited to the carrying amount of goodwill. Once an impairment loss is recognized, future increases in fair value will not result in the reversal of previously recognized losses.
Annual impairment tests are conducted as of July 31 each year. Based on the July 31, 2013, impairment test, management concluded there was no indication of goodwill impairment. In addition to the annual testing requirement, impairment tests are performed if various other events occur including significant adverse changes in the business climate, considering various qualitative and quantitative factors to determine whether impairment exists. There were no such events subsequent to the annual impairment test performed during 2013.
Other intangible assets with estimable lives are amortized over their estimated useful lives, which are periodically reviewed for reasonableness. As a result of the FDIC-assisted transactions in 2011, 2010 and 2009, identifiable intangible assets were recorded representing the estimated value of the core deposits acquired and certain customer relationships.
Fair Values
Fair value disclosures are required for all financial instruments, whether or not recognized in the balance sheet, for which it is practicable to estimate that value. Under GAAP, individual fair value estimates are ranked on a three-tier scale based on the relative reliability of the inputs used in the valuation. Fair values determined using level 1 inputs rely on active and observable markets to price identical assets or liabilities. In situations where identical assets and liabilities are not traded in active markets, fair values may be determined based on level 2 inputs, which represent observable data for similar assets and liabilities. Fair values for assets and liabilities that are not actively traded in observable markets are based on level 3 inputs, which are considered to be nonobservable. Fair value estimates derived from level 3 inputs cannot be substantiated by comparison to independent markets and, in many cases, cannot be realized through immediate settlement of the instrument. Accordingly, the aggregate fair value amounts presented do not necessarily represent the underlying value to BancShares. For additional information, see Note L to the Consolidated Financial Statements.
Income Taxes
Deferred income taxes are reported when different accounting methods have been used in determining income for income tax purposes and for financial reporting purposes. Deferred taxes are computed using the asset and liability approach as prescribed in ASC Topic 740,
Income Taxes
. Under this method, a deferred tax asset or liability is determined based on the currently enacted tax rates applicable to the period in which the differences between the financial statement carrying amounts and tax basis of existing assets and liabilities are expected to be reported in BancShares' income tax returns. The effect on deferred taxes of a change in tax rates is recognized in income in the period that includes the enactment date.
BancShares continually monitors and evaluates the potential impact of current events on the estimates used to establish income tax expenses and income tax liabilities. On a periodic basis, BancShares evaluates its income tax positions based on current tax law, positions taken by various tax auditors within the jurisdictions that BancShares is required to file income tax returns, as well as potential or pending audits or assessments by such tax auditors.
BancShares files a consolidated federal income tax return and various combined and separate company state tax returns.
Derivative Financial Instruments
A derivative is a financial instrument that derives its cash flows, and therefore its value, by reference to an underlying instrument, index or referenced interest rate. These instruments include interest rate swaps, caps, floors, collars, options or other financial instruments designed to hedge exposures to interest rate risk or for speculative purposes.
BancShares selectively uses interest rate swaps for interest rate risk management purposes. During 2011, BancShares entered into an interest rate swap that qualifies as a cash flow hedge under GAAP. This interest rate swap converts variable-rate exposure on outstanding debt to a fixed rate. The derivative is valued each quarter and changes in the fair value are recorded on the consolidated balance sheet with an offset to other comprehensive income for the effective portion and an offset to the consolidated statement of income for any ineffective portion. The assessment of effectiveness is performed using the long-haul method. BancShares’ interest rate swap has been fully effective since inception; therefore, changes in the fair value of the interest rate swap have had no impact on net income. There are no speculative derivative financial instruments in any period.
75
FIRST CITIZENS BANCSHARES, INC. AND SUBSIDIARIES
NOTES TO CONSOLIDATED FINANCIAL STATEMENTS (Continued)
In the event of a change in the forecasted cash flows of the underlying hedged item, the related hedge will be terminated, and management will consider the appropriateness of entering into another hedge for the remaining exposure. The fair value of the terminated hedge will be amortized from accumulated other comprehensive income into earnings over the original life of the terminated swap, provided the remaining cash flows are still probable.
Subsequent Events
Management has evaluated subsequent events through the date of filing this Form 10-K. See
Note V
for more information.
Per Share Data
Net income per share has been computed by dividing net income by the average number of both classes of common shares outstanding during each period. BancShares had no potential common stock outstanding in any period.
Cash dividends per share apply to both Class A and Class B common stock. Shares of Class A common stock carry
one
vote per share, while shares of Class B common stock carry
16
votes per share.
Defined Benefit Pension Plan
BancShares offers a noncontributory defined benefit pension plan to certain qualifying employees. The calculation of the obligations and related expenses under the plan requires the use of actuarial valuation methods and assumptions. Actuarial assumptions used in the determination of future values of plan assets and liabilities are subject to management judgment and may differ significantly if different assumptions are used. The discount rate assumption used to measure the plan obligation is based on a yield curve developed from high-quality corporate bonds across a full maturity spectrum. The projected cash flows of the pension plan are discounted based on this yield curve, and a single discount rate is calculated to achieve the same present value. Refer to Note M in the Consolidated Financial Statements for disclosures related to BancShares' defined benefit pension plan.
Recently Adopted Accounting Pronouncements
FASB ASU 2013-02, “Comprehensive Income (Topic 220): Reporting of Amounts Reclassified Out of Accumulated Other Comprehensive Income”
This ASU requires BancShares to provide information about the amounts reclassified out of accumulated other comprehensive income by component. In addition, an entity is required to present, either on the face of the statement where net income is presented or in the notes, significant amounts reclassified out of accumulated other comprehensive income by the respective line items of net income but only if the amount reclassified is required under GAAP to be reclassified to net income in its entirety in the same reporting period. For other amounts, BancShares is required to cross-reference to other disclosures required under GAAP that provide additional detail about those amounts.
For public entities, the amendments are effective prospectively for reporting periods beginning after December 15, 2012. BancShares adopted the methodologies prescribed by this ASU by the date required. Adoption of this ASU did not have a material effect on BancShares' financial position or results of operations. BancShares has included the required disclosures in its Consolidated Statements of Comprehensive Income and in
Note U
to the Consolidated Financial Statements.
FASB ASU 2012-06. “Business Combinations (Topic 805) - Subsequent Accounting for an Indemnification Asset Recognized at the Acquisition Date as a Result of a Government-Assisted Acquisition of a Financial Institution”
This ASU addresses the diversity in practice about how to interpret the terms on the same basis and contractual limitations when subsequently measuring an indemnification asset recognized in a government-assisted (Federal Deposit Insurance Corporation or National Credit Union Administration) acquisition of a financial institution that includes a loss sharing agreement (indemnification agreement). When BancShares recognizes an indemnification asset (in accordance with Subtopic 805-20) as a result of a government-assisted acquisition of a financial institution and subsequently a change in the cash flows expected to be collected on the indemnification asset occurs (as a result of a change in cash flows expected to be collected on the assets subject to indemnification), BancShares should subsequently account for the change in the measurement of the indemnification asset on the same basis as the change in the assets subject to indemnification. Any amortization of changes in value should be limited to the contractual term of the indemnification agreement (that is, the lesser of the term of the indemnification agreement and the remaining life of the indemnified assets).
76
FIRST CITIZENS BANCSHARES, INC. AND SUBSIDIARIES
NOTES TO CONSOLIDATED FINANCIAL STATEMENTS (Continued)
This guidance became effective for annual periods beginning on or after December 15, 2012, and interim periods within those annual periods. BancShares adopted ASU 2012-06 on January 1, 2013. BancShares had previously accounted for its indemnification asset in accordance with this guidance; accordingly, the adoption of this guidance had no impact on BancShares' consolidated financial position, results of operations or cash flows.
Recently Issued Accounting Pronouncements
FASB ASU 2014-01, “Investments—Equity Method and Joint Ventures (Topic 323)—Accounting for Investments in Qualified Affordable Housing Projects”
This ASU permits BancShares to make an accounting policy election to account for their investments in qualified affordable housing projects using the proportional amortization method if certain conditions are met. Under the proportional amortization method, BancShares would amortize the initial cost of the investment in proportion to the tax credits and other tax benefits received and recognize the net investment performance in the income statement as a component of income tax expense (benefit).
For those investments in qualified affordable housing projects not accounted for using the proportional amortization method, the investment should be accounted for as an equity method investment or a cost method investment in accordance with Subtopic 970-323.
The decision to apply the proportional amortization method of accounting will be applied consistently to all qualifying affordable housing project investments rather than a decision to be applied to individual investments.
The amendments in this ASU should be applied retrospectively to all periods presented and are effective for annual periods and interim reporting periods within those annual periods, beginning after December 15, 2014. Early adoption is permitted.
BancShares is in the process of evaluating this ASU and the potential impact of adoption and, therefore, has elected not to adopt the proportional amortization method as outlined in ASU 2014-01 at this time.
FASB ASU 2013-11, “Income Taxes (Topic 740)”
This ASU states that an unrecognized tax benefit, or a portion of an unrecognized tax benefit, should be presented in the financial statements as a reduction to a deferred tax asset for a net operating loss carryforward, a similar tax loss, or a tax credit carryforward, except as follows. To the extent a net operating loss carryforward, a similar tax loss, or a tax credit carryforward is not available at the reporting date under the tax law of the applicable jurisdiction to settle any additional income taxes that would result from the disallowance of a tax position or the tax law of the applicable jurisdiction does not require BancShares to use, and BancShares does not intend to use, the deferred tax asset for such purpose, the unrecognized tax benefit should be presented in the financial statements as a liability and should not be combined with deferred tax assets. The assessment of whether a deferred tax asset is available is based on the unrecognized tax benefit and deferred tax asset that exist at the reporting date and should be made presuming disallowance of the tax position at the reporting date.
The provisions of this ASU are effective for fiscal years, and interim periods within those years, beginning after December 15, 2013. Early adoption is permitted.
The provisions of this ASU will be applied prospectively to all unrecognized tax benefits that exist at the effective date. Retrospective application is permitted. BancShares will adopt this ASU by the date required and does not anticipate that the ASU will have a material effect on its financial position or results of operations.
FASB ASU 2013-04, “Liabilities”
This ASU provides guidance for the recognition, measurement, and disclosure of obligations resulting from joint and several liability arrangements for which the total amount of the obligation within the scope of this ASU is fixed at the reporting date, except for obligations addressed within existing guidance in GAAP.
The updated guidance requires BancShares to measure those obligations as the sum of the amount the reporting entity agreed to pay on the basis of its arrangement among its co-obligors and any additional amount the reporting entity expects to pay on behalf of its co-obligors. The guidance in this ASU also requires an entity to disclose the nature and amount of the obligation as well as other information about those obligations.
The amendments in this update are effective for fiscal years beginning after December 31, 2013. Early adoption is permitted. BancShares will adopt the methodologies prescribed by this ASU by the date required, and does not anticipate that the ASU will have a material effect on its financial position or results of operations.
77
FIRST CITIZENS BANCSHARES, INC. AND SUBSIDIARIES
NOTES TO CONSOLIDATED FINANCIAL STATEMENTS (Continued)
NOTE B
INVESTMENTS
Investment securities as of
December 31, 2013
, and
2012
, along with unrealized gains and losses determined on an individual security basis, are as follows:
|
Cost
|
Gross
unrealized
gains
|
Gross unrealized
losses
|
Fair
value
|
||||||||||||
|
(dollars in thousands)
|
|||||||||||||||
|
Investment securities available for sale
|
|||||||||||||||
|
December 31, 2013
|
|||||||||||||||
|
U.S. Treasury
|
$
|
373,223
|
|
$
|
259
|
|
$
|
45
|
|
$
|
373,437
|
|
|||
|
Government agency
|
2,543,223
|
|
1,798
|
|
792
|
|
2,544,229
|
|
|||||||
|
Mortgage-backed securities
|
2,486,297
|
|
4,526
|
|
43,950
|
|
2,446,873
|
|
|||||||
|
Equity securities
|
543
|
|
21,604
|
|
—
|
|
22,147
|
|
|||||||
|
State, county and municipal
|
186
|
|
1
|
|
—
|
|
187
|
|
|||||||
|
Other
|
863
|
|
—
|
|
33
|
|
830
|
|
|||||||
|
Total investment securities available for sale
|
$
|
5,404,335
|
|
$
|
28,188
|
|
$
|
44,820
|
|
$
|
5,387,703
|
|
|||
|
December 31, 2012
|
|||||||||||||||
|
U.S. Treasury
|
$
|
823,241
|
|
$
|
403
|
|
$
|
12
|
|
$
|
823,632
|
|
|||
|
Government agency
|
3,052,040
|
|
3,501
|
|
337
|
|
3,055,204
|
|
|||||||
|
Mortgage-backed securities
|
1,315,211
|
|
14,787
|
|
341
|
|
1,329,657
|
|
|||||||
|
Equity securities
|
543
|
|
15,822
|
|
—
|
|
16,365
|
|
|||||||
|
State, county and municipal
|
546
|
|
4
|
|
—
|
|
550
|
|
|||||||
|
Other
|
838
|
|
—
|
|
18
|
|
820
|
|
|||||||
|
Total investment securities available for sale
|
$
|
5,192,419
|
|
$
|
34,517
|
|
$
|
708
|
|
$
|
5,226,228
|
|
|||
|
Investment securities held to maturity
|
|||||||||||||||
|
December 31, 2013
|
|||||||||||||||
|
Mortgage-backed securities
|
$
|
907
|
|
$
|
67
|
|
$
|
—
|
|
$
|
974
|
|
|||
|
December 31, 2012
|
|||||||||||||||
|
Mortgage-backed securities
|
$
|
1,342
|
|
$
|
133
|
|
$
|
27
|
|
$
|
1,448
|
|
|||
Investments in mortgage-backed securities primarily represent securities issued by the Government National Mortgage Association, Federal National Mortgage Association and Federal Home Loan Mortgage Corporation.
78
FIRST CITIZENS BANCSHARES, INC. AND SUBSIDIARIES
NOTES TO CONSOLIDATED FINANCIAL STATEMENTS (Continued)
The following table provides the maturity distribution of amortizing investment securities. Repayments of mortgage-backed securities are dependent on the underlying loan balances. Equity securities do not have a stated maturity date.
|
|
December 31, 2013
|
December 31, 2012
|
|||||||||||||
|
|
Cost
|
Fair
value
|
Cost
|
Fair
value
|
|||||||||||
|
(dollars in thousands)
|
|||||||||||||||
|
Investment securities available for sale
|
|||||||||||||||
|
Amortizing securities maturing in:
|
|||||||||||||||
|
One year or less
|
$
|
839,956
|
|
$
|
840,883
|
|
$
|
2,285,159
|
|
$
|
2,286,403
|
|
|||
|
One through five years
|
2,077,539
|
|
2,077,800
|
|
1,590,608
|
|
1,592,923
|
|
|||||||
|
Five through 10 years
|
—
|
|
—
|
|
898
|
|
880
|
|
|||||||
|
Mortgage-backed securities
|
2,486,297
|
|
2,446,873
|
|
1,315,211
|
|
1,329,657
|
|
|||||||
|
Equity securities
|
543
|
|
22,147
|
|
543
|
|
16,365
|
|
|||||||
|
Total investment securities available for sale
|
$
|
5,404,335
|
|
$
|
5,387,703
|
|
$
|
5,192,419
|
|
$
|
5,226,228
|
|
|||
|
Investment securities held to maturity
|
|||||||||||||||
|
Mortgage-backed securities held to maturity
|
$
|
907
|
|
$
|
974
|
|
$
|
1,342
|
|
$
|
1,448
|
|
|||
For each period presented, securities gains (losses) include the following:
|
|
Year ended December 31
|
||||||||||
|
|
2013
|
2012
|
2011
|
||||||||
|
(dollars in thousands)
|
|||||||||||
|
Gross gains on sales of investment securities available for sale
|
$
|
—
|
|
$
|
2,324
|
|
$
|
531
|
|
||
|
Gross losses on sales of investment securities available for sale
|
—
|
|
(2
|
)
|
(793
|
)
|
|||||
|
Other than temporary impairment loss on equity securities
|
—
|
|
(45
|
)
|
(26
|
)
|
|||||
|
Total securities gains (losses)
|
$
|
—
|
|
$
|
2,277
|
|
$
|
(288
|
)
|
||
79
FIRST CITIZENS BANCSHARES, INC. AND SUBSIDIARIES
NOTES TO CONSOLIDATED FINANCIAL STATEMENTS (Continued)
The following table provides information regarding securities with unrealized losses as of
December 31, 2013
, and
2012
.
|
|
Less than 12 months
|
12 months or more
|
Total
|
||||||||||||||||||||
|
|
Fair
Value
|
Unrealized
Losses
|
Fair
Value
|
Unrealized
Losses
|
Fair
Value
|
Unrealized
Losses
|
|||||||||||||||||
|
(dollars in thousands)
|
|||||||||||||||||||||||
|
December 31, 2013
|
|||||||||||||||||||||||
|
Investment securities available for sale:
|
|||||||||||||||||||||||
|
U.S. Treasury
|
$
|
102,105
|
|
$
|
45
|
|
$
|
—
|
|
$
|
—
|
|
$
|
102,105
|
|
$
|
45
|
|
|||||
|
Government agency
|
780,552
|
|
761
|
|
29,969
|
|
31
|
|
810,521
|
|
792
|
|
|||||||||||
|
Mortgage-backed securities
|
2,221,213
|
|
42,876
|
|
26,861
|
|
1,074
|
|
2,248,074
|
|
43,950
|
|
|||||||||||
|
Other
|
830
|
|
33
|
|
—
|
|
—
|
|
830
|
|
33
|
|
|||||||||||
|
Total
|
$
|
3,104,700
|
|
$
|
43,715
|
|
$
|
56,830
|
|
$
|
1,105
|
|
$
|
3,161,530
|
|
$
|
44,820
|
|
|||||
|
Investment securities held to maturity:
|
|||||||||||||||||||||||
|
Mortgage-backed securities
|
$
|
—
|
|
$
|
—
|
|
$
|
—
|
|
$
|
—
|
|
$
|
—
|
|
$
|
—
|
|
|||||
|
December 31, 2012
|
|||||||||||||||||||||||
|
Investment securities available for sale:
|
|||||||||||||||||||||||
|
U.S. Treasury
|
$
|
120,045
|
|
$
|
12
|
|
$
|
—
|
|
$
|
—
|
|
$
|
120,045
|
|
$
|
12
|
|
|||||
|
Government agency
|
407,498
|
|
337
|
|
—
|
|
—
|
|
407,498
|
|
337
|
|
|||||||||||
|
Mortgage-backed securities
|
135,880
|
|
214
|
|
9,433
|
|
127
|
|
145,313
|
|
341
|
|
|||||||||||
|
Other
|
820
|
|
18
|
|
—
|
|
—
|
|
820
|
|
18
|
|
|||||||||||
|
Total
|
$
|
664,243
|
|
$
|
581
|
|
$
|
9,433
|
|
$
|
127
|
|
$
|
673,676
|
|
$
|
708
|
|
|||||
|
Investment securities held to maturity:
|
|||||||||||||||||||||||
|
Mortgage-backed securities
|
$
|
—
|
|
$
|
—
|
|
$
|
17
|
|
$
|
27
|
|
$
|
17
|
|
$
|
27
|
|
|||||
Investment securities with an aggregate fair value of
$56.8 million
have had continuous unrealized losses for more than 12 months as of
December 31, 2013
, with an aggregate unrealized loss of
$1.1 million
. These
18
investments included mortgage-backed and government agency securities.
None
of the unrealized losses identified as of
December 31, 2013
, or
December 31, 2012
, relate to the marketability of the securities or the issuer’s ability to honor redemption obligations. For all periods presented, BancShares had the ability and intent to retain these securities for a period of time sufficient to recover all unrealized losses. Therefore,
none
of the securities were deemed to be other than temporarily impaired.
Investment securities having an aggregate carrying value of
$2.75 billion
at
December 31, 2013
, and
$2.35 billion
at
December 31, 2012
, were pledged as collateral to secure public funds on deposit and certain short-term borrowings, and for other purposes as required by law.
80
FIRST CITIZENS BANCSHARES, INC. AND SUBSIDIARIES
NOTES TO CONSOLIDATED FINANCIAL STATEMENTS (Continued)
NOTE C
LOANS AND LEASES
Loans and leases outstanding include the following as of the dates indicated:
|
December 31, 2013
|
December 31, 2012
|
||||||
|
(dollars in thousands)
|
|||||||
|
Acquired loans
|
|||||||
|
Commercial:
|
|||||||
|
Construction and land development
|
$
|
78,915
|
|
$
|
237,906
|
|
|
|
Commercial mortgage
|
642,891
|
|
1,054,473
|
|
|||
|
Other commercial real estate
|
41,381
|
|
107,119
|
|
|||
|
Commercial and industrial
|
17,254
|
|
49,463
|
|
|||
|
Other
|
866
|
|
1,074
|
|
|||
|
Total commercial loans
|
781,307
|
|
1,450,035
|
|
|||
|
Noncommercial:
|
|||||||
|
Residential mortgage
|
213,851
|
|
297,926
|
|
|||
|
Revolving mortgage
|
30,834
|
|
38,710
|
|
|||
|
Construction and land development
|
2,583
|
|
20,793
|
|
|||
|
Consumer
|
851
|
|
1,771
|
|
|||
|
Total noncommercial loans
|
248,119
|
|
359,200
|
|
|||
|
Total acquired loans
|
1,029,426
|
|
1,809,235
|
|
|||
|
Originated loans and leases:
|
|||||||
|
Commercial:
|
|||||||
|
Construction and land development
|
319,847
|
|
309,190
|
|
|||
|
Commercial mortgage
|
6,362,490
|
|
6,029,435
|
|
|||
|
Other commercial real estate
|
178,754
|
|
160,980
|
|
|||
|
Commercial and industrial
|
1,081,158
|
|
1,038,530
|
|
|||
|
Lease financing
|
381,763
|
|
330,679
|
|
|||
|
Other
|
175,336
|
|
125,681
|
|
|||
|
Total commercial loans
|
8,499,348
|
|
7,994,495
|
|
|||
|
Noncommercial:
|
|||||||
|
Residential mortgage
|
982,421
|
|
822,889
|
|
|||
|
Revolving mortgage
|
2,113,285
|
|
2,210,133
|
|
|||
|
Construction and land development
|
122,792
|
|
131,992
|
|
|||
|
Consumer
|
386,452
|
|
416,606
|
|
|||
|
Total noncommercial loans
|
3,604,950
|
|
3,581,620
|
|
|||
|
Total originated loans and leases
|
12,104,298
|
|
11,576,115
|
|
|||
|
Total loans and leases
|
$
|
13,133,724
|
|
$
|
13,385,350
|
|
|
At
December 31, 2013
,
$2.56 billion
in originated loans were pledged to secure debt obligations, compared to
$2.57 billion
at
December 31, 2012
.
81
FIRST CITIZENS BANCSHARES, INC. AND SUBSIDIARIES
NOTES TO CONSOLIDATED FINANCIAL STATEMENTS (Continued)
Credit quality indicators
Loans and leases are monitored for credit quality on a recurring basis. The credit quality indicators used are dependent on the portfolio segment to which the loan relates. Originated commercial loans and leases, originated noncommercial loans and leases and acquired loans have different credit quality indicators as a result of the methods used to monitor each of these loan segments.
The credit quality indicators for originated commercial loans and leases and all acquired loans and leases are developed through review of individual borrowers on an ongoing basis. Each borrower is evaluated at least annually with more frequent evaluation of more severely criticized loans or leases. The indicators represent the rating for loans or leases as of the date presented based on the most recent assessment performed. These credit quality indicators are defined as follows:
Pass
– A pass rated asset is not adversely classified because it does not display any of the characteristics for adverse classification.
Special mention
– A special mention asset has potential weaknesses that deserve management’s close attention. If left uncorrected, such potential weaknesses may result in deterioration of the repayment prospects or collateral position at some future date. Special mention assets are not adversely classified and do not warrant adverse classification.
Substandard
– A substandard asset is inadequately protected by the current net worth and paying capacity of the borrower or of the collateral pledged, if any. Assets classified as substandard generally have a well-defined weakness, or weaknesses, that jeopardize the liquidation of the debt. These assets are characterized by the distinct possibility of loss if the deficiencies are not corrected.
Doubtful
– An asset classified as doubtful has all the weaknesses inherent in an asset classified substandard with the added characteristic that the weaknesses make collection or liquidation in full highly questionable and improbable on the basis of currently existing facts, conditions and values.
Loss
– Assets classified as loss are considered uncollectible and of such little value that it is inappropriate to be carried as an asset. This classification is not necessarily equivalent to no potential for recovery or salvage value, but rather that it is not appropriate to defer a full charge-off even though partial recovery may be effected in the future.
Ungraded
– Ungraded loans represent loans that are not included in the individual credit grading process due to their relatively small balances or borrower type. The majority of originated, ungraded loans at
December 31, 2013
, relate to business credit cards and tobacco buyout loans classified as commercial and industrial loans. Business credit card loans with an outstanding balance of
$72.4 million
at
December 31, 2013
, are subject to automatic charge-off when they become 120 days past due in the same manner as unsecured consumer lines of credit. Tobacco buyout loans with an outstanding balance of
$22.1 million
at
December 31, 2013
, are secured by assignments of receivables made pursuant to the Fair and Equitable Tobacco Reform Act of 2004. The credit risk associated with these loans is considered low as the payments that began in 2005 and continue through 2014 are made by the Commodity Credit Corporation, which is part of the United States Department of Agriculture. Final payment from the Commodity Credit Corporation was received during January 2014.
The credit quality indicators for originated, noncommercial loans are based on the delinquency status of the borrower. As the borrower becomes more delinquent, the likelihood of loss increases.
82
FIRST CITIZENS BANCSHARES, INC. AND SUBSIDIARIES
NOTES TO CONSOLIDATED FINANCIAL STATEMENTS (Continued)
The composition of the loans and leases outstanding at
December 31, 2013
, and
December 31, 2012
, by credit quality indicator is provided below:
|
|
Originated commercial loans and leases
|
||||||||||||||||||||||||||
|
Grade:
|
Construction and land
development
|
Commercial
mortgage
|
Other
commercial real estate
|
Commercial and
industrial
|
Lease financing
|
Other
|
Total originated commercial loans and leases
|
||||||||||||||||||||
|
(dollars in thousands)
|
|||||||||||||||||||||||||||
|
December 31, 2013
|
|||||||||||||||||||||||||||
|
Pass
|
$
|
308,231
|
|
$
|
6,094,505
|
|
$
|
174,913
|
|
$
|
964,840
|
|
$
|
375,371
|
|
$
|
174,314
|
|
$
|
8,092,174
|
|
||||||
|
Special mention
|
8,620
|
|
119,515
|
|
1,362
|
|
14,686
|
|
2,160
|
|
982
|
|
147,325
|
|
|||||||||||||
|
Substandard
|
2,944
|
|
141,913
|
|
2,216
|
|
6,352
|
|
3,491
|
|
40
|
|
156,956
|
|
|||||||||||||
|
Doubtful
|
52
|
|
5,159
|
|
75
|
|
144
|
|
592
|
|
—
|
|
6,022
|
|
|||||||||||||
|
Ungraded
|
—
|
|
1,398
|
|
188
|
|
95,136
|
|
149
|
|
—
|
|
96,871
|
|
|||||||||||||
|
Total
|
$
|
319,847
|
|
$
|
6,362,490
|
|
$
|
178,754
|
|
$
|
1,081,158
|
|
$
|
381,763
|
|
$
|
175,336
|
|
$
|
8,499,348
|
|
||||||
|
December 31, 2012
|
|||||||||||||||||||||||||||
|
Pass
|
$
|
274,480
|
|
$
|
5,688,541
|
|
$
|
151,549
|
|
$
|
894,998
|
|
$
|
325,626
|
|
$
|
124,083
|
|
$
|
7,459,277
|
|
||||||
|
Special mention
|
14,666
|
|
166,882
|
|
2,812
|
|
13,275
|
|
1,601
|
|
837
|
|
200,073
|
|
|||||||||||||
|
Substandard
|
18,761
|
|
157,966
|
|
5,038
|
|
12,073
|
|
1,663
|
|
756
|
|
196,257
|
|
|||||||||||||
|
Doubtful
|
952
|
|
13,475
|
|
98
|
|
1,040
|
|
771
|
|
—
|
|
16,336
|
|
|||||||||||||
|
Ungraded
|
331
|
|
2,571
|
|
1,483
|
|
117,144
|
|
1,018
|
|
5
|
|
122,552
|
|
|||||||||||||
|
Total
|
$
|
309,190
|
|
$
|
6,029,435
|
|
$
|
160,980
|
|
$
|
1,038,530
|
|
$
|
330,679
|
|
$
|
125,681
|
|
$
|
7,994,495
|
|
||||||
|
|
Originated noncommercial loans and leases
|
||||||||||||||||||
|
|
Residential
mortgage
|
Revolving
mortgage
|
Construction
and land
development
|
Consumer
|
Total originated noncommercial
loans |
||||||||||||||
|
(dollars in thousands)
|
|||||||||||||||||||
|
December 31, 2013
|
|||||||||||||||||||
|
Current
|
$
|
955,300
|
|
$
|
2,095,480
|
|
$
|
121,026
|
|
$
|
382,710
|
|
$
|
3,554,516
|
|
||||
|
30-59 days past due
|
12,885
|
|
10,977
|
|
1,193
|
|
2,114
|
|
27,169
|
|
|||||||||
|
60-89 days past due
|
4,658
|
|
2,378
|
|
317
|
|
955
|
|
8,308
|
|
|||||||||
|
90 days or greater past due
|
9,578
|
|
4,450
|
|
256
|
|
673
|
|
14,957
|
|
|||||||||
|
Total
|
$
|
982,421
|
|
$
|
2,113,285
|
|
$
|
122,792
|
|
$
|
386,452
|
|
$
|
3,604,950
|
|
||||
|
December 31, 2012
|
|||||||||||||||||||
|
Current
|
$
|
786,626
|
|
$
|
2,190,186
|
|
$
|
128,764
|
|
409,218
|
|
$
|
3,514,794
|
|
|||||
|
30-59 days past due
|
15,711
|
|
12,868
|
|
1,941
|
|
4,405
|
|
34,925
|
|
|||||||||
|
60-89 days past due
|
7,559
|
|
3,200
|
|
490
|
|
1,705
|
|
12,954
|
|
|||||||||
|
90 days or greater past due
|
12,993
|
|
3,879
|
|
797
|
|
1,278
|
|
18,947
|
|
|||||||||
|
Total
|
$
|
822,889
|
|
$
|
2,210,133
|
|
$
|
131,992
|
|
$
|
416,606
|
|
$
|
3,581,620
|
|
||||
83
FIRST CITIZENS BANCSHARES, INC. AND SUBSIDIARIES
NOTES TO CONSOLIDATED FINANCIAL STATEMENTS (Continued)
|
|
Acquired loans
|
||||||||||||||||||||||||||||||||||
|
Grade:
|
Construction
and land
development -
commercial
|
Commercial
mortgage
|
Other
commercial
real estate
|
Commercial
and
industrial
|
Residential
mortgage
|
Revolving
mortgage
|
Construction
and land development - noncommercial |
Consumer
and other
|
Total acquired
loans
|
||||||||||||||||||||||||||
|
(dollars in thousands)
|
|||||||||||||||||||||||||||||||||||
|
December 31, 2013
|
|||||||||||||||||||||||||||||||||||
|
Pass
|
$
|
2,619
|
|
$
|
296,824
|
|
$
|
22,225
|
|
$
|
8,021
|
|
$
|
135,326
|
|
$
|
26,322
|
|
$
|
149
|
|
$
|
1,345
|
|
$
|
492,831
|
|
||||||||
|
Special mention
|
15,530
|
|
125,295
|
|
3,431
|
|
2,585
|
|
6,301
|
|
2,608
|
|
—
|
|
—
|
|
155,750
|
|
|||||||||||||||||
|
Substandard
|
52,228
|
|
179,657
|
|
7,012
|
|
5,225
|
|
52,774
|
|
1,013
|
|
2,139
|
|
—
|
|
300,048
|
|
|||||||||||||||||
|
Doubtful
|
7,436
|
|
40,471
|
|
8,713
|
|
1,257
|
|
2,058
|
|
891
|
|
295
|
|
—
|
|
61,121
|
|
|||||||||||||||||
|
Ungraded
|
1,102
|
|
644
|
|
—
|
|
166
|
|
17,392
|
|
—
|
|
—
|
|
372
|
|
19,676
|
|
|||||||||||||||||
|
Total
|
$
|
78,915
|
|
$
|
642,891
|
|
$
|
41,381
|
|
$
|
17,254
|
|
$
|
213,851
|
|
$
|
30,834
|
|
$
|
2,583
|
|
$
|
1,717
|
|
$
|
1,029,426
|
|
||||||||
|
December 31, 2012
|
|||||||||||||||||||||||||||||||||||
|
Pass
|
$
|
17,010
|
|
$
|
376,974
|
|
$
|
33,570
|
|
$
|
19,451
|
|
$
|
172,165
|
|
$
|
29,540
|
|
$
|
334
|
|
$
|
1,617
|
|
$
|
650,661
|
|
||||||||
|
Special mention
|
25,734
|
|
259,264
|
|
17,518
|
|
12,465
|
|
14,863
|
|
1,736
|
|
—
|
|
34
|
|
331,614
|
|
|||||||||||||||||
|
Substandard
|
105,061
|
|
344,542
|
|
44,335
|
|
14,698
|
|
83,193
|
|
7,434
|
|
17,190
|
|
239
|
|
616,692
|
|
|||||||||||||||||
|
Doubtful
|
87,445
|
|
73,016
|
|
11,696
|
|
2,757
|
|
4,268
|
|
—
|
|
3,269
|
|
117
|
|
182,568
|
|
|||||||||||||||||
|
Ungraded
|
2,656
|
|
677
|
|
—
|
|
92
|
|
23,437
|
|
—
|
|
—
|
|
838
|
|
27,700
|
|
|||||||||||||||||
|
Total
|
$
|
237,906
|
|
$
|
1,054,473
|
|
$
|
107,119
|
|
$
|
49,463
|
|
$
|
297,926
|
|
$
|
38,710
|
|
$
|
20,793
|
|
$
|
2,845
|
|
$
|
1,809,235
|
|
||||||||
84
FIRST CITIZENS BANCSHARES, INC. AND SUBSIDIARIES
NOTES TO CONSOLIDATED FINANCIAL STATEMENTS (Continued)
The aging of the outstanding loans and leases, by class, at
December 31, 2013
, and
December 31, 2012
, (excluding loans and leases acquired with deteriorated credit quality) is provided in the table below. The calculation of days past due begins on the day after payment is due and includes all days through which all required interest or principal has not been paid. Loans and leases 30 days or less past due are considered current due to various grace periods that allow borrowers to make payments within a stated period after the due date and still remain in compliance with the loan agreement.
|
30-59 days
past due
|
60-89 days
past due
|
90 days or greater
|
Total past
due
|
Current
|
Total loans
and leases
|
||||||||||||||||||
|
(dollars in thousands)
|
|||||||||||||||||||||||
|
December 31, 2013
|
|||||||||||||||||||||||
|
Originated loans and leases:
|
|||||||||||||||||||||||
|
Construction and land development - commercial
|
$
|
1,603
|
|
$
|
9
|
|
$
|
457
|
|
$
|
2,069
|
|
$
|
317,778
|
|
$
|
319,847
|
|
|||||
|
Commercial mortgage
|
11,131
|
|
3,601
|
|
14,407
|
|
29,139
|
|
6,333,351
|
|
6,362,490
|
|
|||||||||||
|
Other commercial real estate
|
139
|
|
210
|
|
470
|
|
819
|
|
177,935
|
|
178,754
|
|
|||||||||||
|
Commercial and industrial
|
3,336
|
|
682
|
|
436
|
|
4,454
|
|
1,076,704
|
|
1,081,158
|
|
|||||||||||
|
Lease financing
|
789
|
|
1,341
|
|
101
|
|
2,231
|
|
379,532
|
|
381,763
|
|
|||||||||||
|
Other
|
—
|
|
85
|
|
—
|
|
85
|
|
175,251
|
|
175,336
|
|
|||||||||||
|
Residential mortgage
|
12,885
|
|
4,658
|
|
9,578
|
|
27,121
|
|
955,300
|
|
982,421
|
|
|||||||||||
|
Revolving mortgage
|
10,977
|
|
2,378
|
|
4,450
|
|
17,805
|
|
2,095,480
|
|
2,113,285
|
|
|||||||||||
|
Construction and land development - noncommercial
|
1,193
|
|
317
|
|
256
|
|
1,766
|
|
121,026
|
|
122,792
|
|
|||||||||||
|
Consumer
|
2,114
|
|
955
|
|
673
|
|
3,742
|
|
382,710
|
|
386,452
|
|
|||||||||||
|
Total originated loans and leases
|
$
|
44,167
|
|
$
|
14,236
|
|
$
|
30,828
|
|
$
|
89,231
|
|
$
|
12,015,067
|
|
$
|
12,104,298
|
|
|||||
|
December 31, 2012
|
|||||||||||||||||||||||
|
Originated loans and leases:
|
|||||||||||||||||||||||
|
Construction and land development - commercial
|
$
|
927
|
|
$
|
—
|
|
$
|
7,878
|
|
$
|
8,805
|
|
$
|
300,385
|
|
$
|
309,190
|
|
|||||
|
Commercial mortgage
|
24,447
|
|
4,179
|
|
21,327
|
|
49,953
|
|
5,979,482
|
|
6,029,435
|
|
|||||||||||
|
Other commercial real estate
|
387
|
|
1,240
|
|
1,034
|
|
2,661
|
|
158,319
|
|
160,980
|
|
|||||||||||
|
Commercial and industrial
|
2,833
|
|
1,096
|
|
605
|
|
4,534
|
|
1,033,996
|
|
1,038,530
|
|
|||||||||||
|
Lease financing
|
991
|
|
138
|
|
621
|
|
1,750
|
|
328,929
|
|
330,679
|
|
|||||||||||
|
Other
|
18
|
|
13
|
|
—
|
|
31
|
|
125,650
|
|
125,681
|
|
|||||||||||
|
Residential mortgage
|
15,711
|
|
7,559
|
|
12,993
|
|
36,263
|
|
786,626
|
|
822,889
|
|
|||||||||||
|
Revolving mortgage
|
12,868
|
|
3,200
|
|
3,879
|
|
19,947
|
|
2,190,186
|
|
2,210,133
|
|
|||||||||||
|
Construction and land development - noncommercial
|
1,941
|
|
490
|
|
797
|
|
3,228
|
|
128,764
|
|
131,992
|
|
|||||||||||
|
Consumer
|
4,405
|
|
1,705
|
|
1,278
|
|
7,388
|
|
409,218
|
|
416,606
|
|
|||||||||||
|
Total originated loans and leases
|
$
|
64,528
|
|
$
|
19,620
|
|
$
|
50,412
|
|
$
|
134,560
|
|
$
|
11,441,555
|
|
$
|
11,576,115
|
|
|||||
85
FIRST CITIZENS BANCSHARES, INC. AND SUBSIDIARIES
NOTES TO CONSOLIDATED FINANCIAL STATEMENTS (Continued)
The recorded investment, by class, in loans and leases on nonaccrual status, and loans and leases greater than 90 days past due and still accruing at
December 31, 2013
, and
December 31, 2012
, (excluding loans and leases acquired with deteriorated credit quality) are as follows:
|
|
December 31, 2013
|
December 31, 2012
|
|||||||||||||
|
|
Nonaccrual
loans and
leases
|
Loans and
leases > 90
days and
accruing
|
Nonaccrual
loans and
leases
|
Loans and
leases > 90
days and
accruing
|
|||||||||||
|
(dollars in thousands)
|
|||||||||||||||
|
Originated loans and leases:
|
|||||||||||||||
|
Construction and land development - commercial
|
$
|
544
|
|
$
|
—
|
|
$
|
14,930
|
|
$
|
541
|
|
|||
|
Commercial mortgage
|
33,529
|
|
1,113
|
|
50,532
|
|
1,671
|
|
|||||||
|
Commercial and industrial
|
1,428
|
|
294
|
|
6,972
|
|
466
|
|
|||||||
|
Lease financing
|
832
|
|
—
|
|
1,075
|
|
—
|
|
|||||||
|
Other commercial real estate
|
1,610
|
|
—
|
|
2,319
|
|
—
|
|
|||||||
|
Construction and land development - noncommercial
|
457
|
|
256
|
|
668
|
|
111
|
|
|||||||
|
Residential mortgage
|
14,701
|
|
1,998
|
|
12,603
|
|
3,337
|
|
|||||||
|
Revolving mortgage
|
—
|
|
4,450
|
|
—
|
|
3,877
|
|
|||||||
|
Consumer
|
69
|
|
673
|
|
746
|
|
1,269
|
|
|||||||
|
Total originated loans and leases
|
$
|
53,170
|
|
$
|
8,784
|
|
$
|
89,845
|
|
$
|
11,272
|
|
|||
Acquired Loans
The following table provides changes in the carrying value of acquired loans during the years ended
December 31, 2013
, and
December 31, 2012
:
|
2013
|
2012
|
||||||
|
(dollars in thousands)
|
|||||||
|
Balance at January 1
|
$
|
1,809,235
|
|
$
|
2,362,152
|
|
|
|
Reductions for repayments, foreclosures and decreases in fair value
|
(779,809
|
)
|
(552,917
|
)
|
|||
|
Balance at December 31
|
$
|
1,029,426
|
|
$
|
1,809,235
|
|
|
|
Outstanding principal balance at December 31
|
$
|
1,833,955
|
|
$
|
3,281,958
|
|
|
The carrying value of loans on the cost recovery method was
$28.5 million
at
December 31, 2013
, and
$74.5 million
at
December 31, 2012
. The cost recovery method is applied to loans when the timing of future cash flows is not reasonably estimable due to borrower nonperformance or uncertainty in the ultimate disposition of the asset.
For acquired loans, improved cash flow estimates and receipt of unscheduled loan payments result in the reclassification of nonaccretable difference to accretable yield. Accretable yield resulting from the improved ability to estimate future cash flows generally does not represent amounts previously identified as nonaccretable difference.
86
FIRST CITIZENS BANCSHARES, INC. AND SUBSIDIARIES
NOTES TO CONSOLIDATED FINANCIAL STATEMENTS (Continued)
The following table documents changes to the amount of accretable yield for
2013
and
2012
. Removals represent a reduction to the accretable yield as a result of loans that were fully charged off or paid off during the period.
|
2013
|
2012
|
||||||
|
(dollars in thousands)
|
|||||||
|
Balance at January 1
|
$
|
539,564
|
|
$
|
276,690
|
|
|
|
Accretion
|
(224,672
|
)
|
(304,023
|
)
|
|||
|
Reclassifications from nonaccretable difference
|
92,349
|
|
353,708
|
|
|||
|
Changes in expected cash flows that do not affect nonaccretable difference
|
32,749
|
|
213,189
|
|
|||
|
Balance at December 31
|
$
|
439,990
|
|
$
|
539,564
|
|
|
NOTE D
ALLOWANCE FOR LOAN AND LEASE LOSSES
Activity in the allowance for loan and lease losses is summarized as follows:
|
Originated
|
Acquired
|
Total
|
|||||||||
|
(dollars in thousands)
|
|||||||||||
|
Balance at December 31, 2010
|
$
|
176,517
|
|
$
|
51,248
|
|
$
|
227,765
|
|
||
|
Provision for loan and lease losses
|
57,799
|
|
174,478
|
|
232,277
|
|
|||||
|
Loans and leases charged off
|
(59,287
|
)
|
(137,553
|
)
|
(196,840
|
)
|
|||||
|
Loans and leases recovered
|
5,854
|
|
1,088
|
|
6,942
|
|
|||||
|
Net charge-offs
|
(53,433
|
)
|
(136,465
|
)
|
(189,898
|
)
|
|||||
|
Balance at December 31, 2011
|
180,883
|
|
89,261
|
|
270,144
|
|
|||||
|
Provision for loan and lease losses
|
42,046
|
|
100,839
|
|
142,885
|
|
|||||
|
Loans and leases charged off
|
(50,208
|
)
|
(50,270
|
)
|
(100,478
|
)
|
|||||
|
Loans and leases recovered
|
6,325
|
|
142
|
|
6,467
|
|
|||||
|
Net charge-offs
|
(43,883
|
)
|
(50,128
|
)
|
(94,011
|
)
|
|||||
|
Balance at December 31, 2012
|
179,046
|
|
139,972
|
|
319,018
|
|
|||||
|
Reclassification
(1)
|
7,368
|
|
—
|
|
7,368
|
|
|||||
|
Provision for loan and lease losses
|
19,289
|
|
(51,544
|
)
|
(32,255
|
)
|
|||||
|
Loans and leases charged off
|
(33,118
|
)
|
(34,908
|
)
|
(68,026
|
)
|
|||||
|
Loans and leases recovered
|
7,289
|
|
—
|
|
7,289
|
|
|||||
|
Net charge-offs
|
(25,829
|
)
|
(34,908
|
)
|
(60,737
|
)
|
|||||
|
Balance at December 31, 2013
|
$
|
179,874
|
|
$
|
53,520
|
|
$
|
233,394
|
|
||
(1)
Reclassification results from enhancements to the ALLL calculation during the second quarter of 2013 that resulted in the allocation of
$15.8 million
previously designated as 'nonspecific' to other loan classes and the absorption of
$7.4 million
of the reserve for unfunded commitments related to unfunded, revocable loan commitments into the ALLL. Further discussion is contained in Note A.
87
FIRST CITIZENS BANCSHARES, INC. AND SUBSIDIARIES
NOTES TO CONSOLIDATED FINANCIAL STATEMENTS (Continued)
Activity in the allowance for loan and lease losses, ending balances of loans and leases and related allowance by class of loans is summarized as follows:
|
Construction
and land
development
- commercial
|
Commercial
mortgage
|
Other
commercial
real estate
|
Commercial
and
industrial
|
Lease
financing
|
Other
|
Residential
mortgage
|
Revolving
mortgage
|
Construction
and land
development
- non-
commercial
|
Consumer
|
Non-
specific
|
Total
|
||||||||||||||||||||||||||||||||||||
|
(dollars in thousands)
|
|||||||||||||||||||||||||||||||||||||||||||||||
|
Originated Loans
|
|||||||||||||||||||||||||||||||||||||||||||||||
|
Allowance for loan and lease losses:
|
|||||||||||||||||||||||||||||||||||||||||||||||
|
Balance at January 1, 2012
|
$
|
5,467
|
|
$
|
67,486
|
|
$
|
2,169
|
|
$
|
23,723
|
|
$
|
3,288
|
|
$
|
1,315
|
|
$
|
8,879
|
|
$
|
27,045
|
|
$
|
1,427
|
|
$
|
25,962
|
|
$
|
14,122
|
|
$
|
180,883
|
|
|||||||||||
|
Provision
|
9,665
|
|
18,198
|
|
130
|
|
(4,982
|
)
|
498
|
|
(116
|
)
|
(782
|
)
|
8,783
|
|
1,161
|
|
7,763
|
|
1,728
|
|
42,046
|
|
|||||||||||||||||||||||
|
Charge-offs
|
(9,546
|
)
|
(7,081
|
)
|
(254
|
)
|
(5,472
|
)
|
(361
|
)
|
(28
|
)
|
(4,790
|
)
|
(11,341
|
)
|
(1,047
|
)
|
(10,288
|
)
|
—
|
|
(50,208
|
)
|
|||||||||||||||||||||||
|
Recoveries
|
445
|
|
1,626
|
|
14
|
|
781
|
|
96
|
|
4
|
|
529
|
|
698
|
|
180
|
|
1,952
|
|
—
|
|
6,325
|
|
|||||||||||||||||||||||
|
Balance at December 31, 2012
|
6,031
|
|
80,229
|
|
2,059
|
|
14,050
|
|
3,521
|
|
1,175
|
|
3,836
|
|
25,185
|
|
1,721
|
|
25,389
|
|
15,850
|
|
179,046
|
|
|||||||||||||||||||||||
|
Reclassification
(1)
|
5,141
|
|
27,421
|
|
(815
|
)
|
7,551
|
|
(253
|
)
|
(1,288
|
)
|
5,717
|
|
(9,838
|
)
|
(478
|
)
|
(10,018
|
)
|
(15,772
|
)
|
7,368
|
|
|||||||||||||||||||||||
|
Provision
|
2,809
|
|
(4,485
|
)
|
(32
|
)
|
4,333
|
|
1,646
|
|
308
|
|
2,786
|
|
6,296
|
|
(379
|
)
|
6,085
|
|
(78
|
)
|
19,289
|
|
|||||||||||||||||||||||
|
Charge-offs
|
(4,685
|
)
|
(3,904
|
)
|
(312
|
)
|
(4,785
|
)
|
(272
|
)
|
(6
|
)
|
(2,387
|
)
|
(6,064
|
)
|
(392
|
)
|
(10,311
|
)
|
—
|
|
(33,118
|
)
|
|||||||||||||||||||||||
|
Recoveries
|
1,039
|
|
996
|
|
109
|
|
1,213
|
|
107
|
|
1
|
|
559
|
|
660
|
|
209
|
|
2,396
|
|
—
|
|
7,289
|
|
|||||||||||||||||||||||
|
Balance at December 31, 2013
|
$
|
10,335
|
|
$
|
100,257
|
|
$
|
1,009
|
|
$
|
22,362
|
|
$
|
4,749
|
|
$
|
190
|
|
$
|
10,511
|
|
$
|
16,239
|
|
$
|
681
|
|
$
|
13,541
|
|
$
|
—
|
|
$
|
179,874
|
|
|||||||||||
(1)
Reclassification results from enhancements to the ALLL calculation during the second quarter of 2013 that resulted in the allocation of
$15.8 million
previously designated as 'nonspecific' to other loan classes and the absorption of
$7.4 million
of the reserve for unfunded commitments related to unfunded, revocable loan commitments into the ALLL. Further discussion is contained in Note A.
|
Construction
and land
development
- commercial
|
Commercial
mortgage
|
Other
commercial
real estate
|
Commercial
and industrial
|
Lease
financing
|
Other
|
Residential
mortgage
|
Revolving
mortgage
|
Construction
and land
development
- non-commercial
|
Consumer
|
Non-
specific
|
Total
|
||||||||||||||||||||||||||||||||||||
|
(dollars in thousands)
|
|||||||||||||||||||||||||||||||||||||||||||||||
|
Allowance for loan and lease losses:
|
|||||||||||||||||||||||||||||||||||||||||||||||
|
December 31, 2013
|
|||||||||||||||||||||||||||||||||||||||||||||||
|
ALLL for loans and leases individually evaluated for impairment
|
$
|
103
|
|
$
|
6,873
|
|
$
|
209
|
|
$
|
771
|
|
$
|
54
|
|
$
|
—
|
|
$
|
1,586
|
|
$
|
372
|
|
$
|
72
|
|
$
|
121
|
|
$
|
—
|
|
$
|
10,161
|
|
|||||||||||
|
ALLL for loans and leases collectively evaluated for impairment
|
10,232
|
|
93,384
|
|
800
|
|
21,591
|
|
4,695
|
|
190
|
|
8,925
|
|
15,867
|
|
609
|
|
13,420
|
|
—
|
|
169,713
|
|
|||||||||||||||||||||||
|
Nonspecific ALLL
|
—
|
|
—
|
|
—
|
|
—
|
|
—
|
|
—
|
|
—
|
|
—
|
|
—
|
|
—
|
|
—
|
|
—
|
|
|||||||||||||||||||||||
|
Total allowance for loan and lease losses
|
$
|
10,335
|
|
$
|
100,257
|
|
$
|
1,009
|
|
$
|
22,362
|
|
$
|
4,749
|
|
$
|
190
|
|
$
|
10,511
|
|
$
|
16,239
|
|
$
|
681
|
|
$
|
13,541
|
|
$
|
—
|
|
$
|
179,874
|
|
|||||||||||
|
December 31, 2012
|
|||||||||||||||||||||||||||||||||||||||||||||||
|
ALLL for loans and leases individually evaluated for impairment
|
$
|
2,469
|
|
$
|
11,697
|
|
$
|
298
|
|
$
|
2,133
|
|
$
|
202
|
|
$
|
53
|
|
$
|
959
|
|
$
|
1
|
|
$
|
287
|
|
$
|
256
|
|
$
|
—
|
|
$
|
18,355
|
|
|||||||||||
|
ALLL for loans and leases collectively evaluated for impairment
|
3,562
|
|
68,532
|
|
1,761
|
|
11,917
|
|
3,319
|
|
1,122
|
|
2,877
|
|
25,184
|
|
1,434
|
|
25,133
|
|
—
|
|
144,841
|
|
|||||||||||||||||||||||
|
Nonspecific ALLL
|
—
|
|
—
|
|
—
|
|
—
|
|
—
|
|
—
|
|
—
|
|
—
|
|
—
|
|
—
|
|
15,850
|
|
15,850
|
|
|||||||||||||||||||||||
|
Total allowance for loan and lease losses
|
$
|
6,031
|
|
$
|
80,229
|
|
$
|
2,059
|
|
$
|
14,050
|
|
$
|
3,521
|
|
$
|
1,175
|
|
$
|
3,836
|
|
$
|
25,185
|
|
$
|
1,721
|
|
$
|
25,389
|
|
$
|
15,850
|
|
$
|
179,046
|
|
|||||||||||
88
FIRST CITIZENS BANCSHARES, INC. AND SUBSIDIARIES
NOTES TO CONSOLIDATED FINANCIAL STATEMENTS (Continued)
|
Construction
and land
development
- commercial
|
Commercial
mortgage
|
Other
commercial
real estate
|
Commercial
and industrial
|
Lease
financing
|
Other
|
Residential
mortgage
|
Revolving
mortgage
|
Construction
and land
development
- non-commercial
|
Consumer
|
Non-
specific
|
Total
|
||||||||||||||||||||||||||||||||||||
|
(dollars in thousands)
|
|||||||||||||||||||||||||||||||||||||||||||||||
|
Loans and leases:
|
|||||||||||||||||||||||||||||||||||||||||||||||
|
December 31, 2013
|
|||||||||||||||||||||||||||||||||||||||||||||||
|
Loans and leases individually evaluated for impairment
|
$
|
2,272
|
|
$
|
97,111
|
|
$
|
1,878
|
|
$
|
9,300
|
|
$
|
188
|
|
$
|
—
|
|
$
|
15,539
|
|
$
|
3,596
|
|
$
|
1,108
|
|
$
|
1,154
|
|
$
|
—
|
|
$
|
132,146
|
|
|||||||||||
|
Loans and leases collectively evaluated for impairment
|
317,575
|
|
6,265,379
|
|
176,876
|
|
1,071,858
|
|
381,575
|
|
175,336
|
|
966,882
|
|
2,109,689
|
|
121,684
|
|
385,298
|
|
—
|
|
11,972,152
|
|
|||||||||||||||||||||||
|
Total loan and leases
|
$
|
319,847
|
|
$
|
6,362,490
|
|
$
|
178,754
|
|
$
|
1,081,158
|
|
$
|
381,763
|
|
$
|
175,336
|
|
$
|
982,421
|
|
$
|
2,113,285
|
|
$
|
122,792
|
|
$
|
386,452
|
|
$
|
—
|
|
$
|
12,104,298
|
|
|||||||||||
|
December 31, 2012
|
|||||||||||||||||||||||||||||||||||||||||||||||
|
Loans and leases individually evaluated for impairment
|
$
|
17,075
|
|
$
|
133,804
|
|
$
|
3,375
|
|
$
|
22,619
|
|
$
|
804
|
|
$
|
707
|
|
$
|
15,836
|
|
$
|
4,203
|
|
$
|
1,321
|
|
$
|
2,509
|
|
$
|
—
|
|
$
|
202,253
|
|
|||||||||||
|
Loans and leases collectively evaluated for impairment
|
292,115
|
|
5,895,631
|
|
157,605
|
|
1,015,911
|
|
329,875
|
|
124,974
|
|
807,053
|
|
2,205,930
|
|
130,671
|
|
414,097
|
|
—
|
|
11,373,862
|
|
|||||||||||||||||||||||
|
Total loan and leases
|
$
|
309,190
|
|
$
|
6,029,435
|
|
$
|
160,980
|
|
$
|
1,038,530
|
|
$
|
330,679
|
|
$
|
125,681
|
|
$
|
822,889
|
|
$
|
2,210,133
|
|
$
|
131,992
|
|
$
|
416,606
|
|
$
|
—
|
|
$
|
11,576,115
|
|
|||||||||||
|
Construction
and land
development -
commercial
|
Commercial
mortgage
|
Other
commercial
real estate
|
Commercial
and
industrial
|
Lease
financing
|
Residential
mortgage
|
Revolving
mortgage
|
Construction
and land
development -
noncommercial
|
Consumer
and other
|
Total
|
||||||||||||||||||||||||||||||
|
(dollars in thousands)
|
|||||||||||||||||||||||||||||||||||||||
|
Acquired Loans
|
|||||||||||||||||||||||||||||||||||||||
|
Allowance for loan and lease losses:
|
|||||||||||||||||||||||||||||||||||||||
|
Balance at January 1, 2012
|
$
|
16,693
|
|
$
|
39,557
|
|
$
|
16,862
|
|
$
|
5,500
|
|
$
|
13
|
|
$
|
5,433
|
|
$
|
77
|
|
$
|
4,652
|
|
$
|
474
|
|
$
|
89,261
|
|
|||||||||
|
Provision
|
23,160
|
|
34,227
|
|
(4,372
|
)
|
11,839
|
|
(13
|
)
|
18,401
|
|
10,796
|
|
6,520
|
|
281
|
|
100,839
|
|
|||||||||||||||||||
|
Charge-offs
|
(8,667
|
)
|
(23,509
|
)
|
(1,256
|
)
|
(8,442
|
)
|
—
|
|
(4,139
|
)
|
(1,119
|
)
|
(2,885
|
)
|
(253
|
)
|
(50,270
|
)
|
|||||||||||||||||||
|
Recoveries
|
—
|
|
—
|
|
—
|
|
—
|
|
—
|
|
142
|
|
—
|
|
—
|
|
—
|
|
142
|
|
|||||||||||||||||||
|
Balance at December 31, 2012
|
31,186
|
|
50,275
|
|
11,234
|
|
8,897
|
|
—
|
|
19,837
|
|
9,754
|
|
8,287
|
|
502
|
|
139,972
|
|
|||||||||||||||||||
|
Provision
|
(22,942
|
)
|
(3,872
|
)
|
(8,949
|
)
|
470
|
|
—
|
|
(5,487
|
)
|
(6,399
|
)
|
(4,170
|
)
|
(195
|
)
|
(51,544
|
)
|
|||||||||||||||||||
|
Charge-offs
|
(6,924
|
)
|
(16,497
|
)
|
(931
|
)
|
(4,092
|
)
|
—
|
|
(2,548
|
)
|
(396
|
)
|
(3,435
|
)
|
(85
|
)
|
(34,908
|
)
|
|||||||||||||||||||
|
Recoveries
|
—
|
|
—
|
|
—
|
|
—
|
|
—
|
|
—
|
|
—
|
|
—
|
|
—
|
|
—
|
|
|||||||||||||||||||
|
Balance at December 31, 2013
|
$
|
1,320
|
|
$
|
29,906
|
|
$
|
1,354
|
|
$
|
5,275
|
|
$
|
—
|
|
$
|
11,802
|
|
$
|
2,959
|
|
$
|
682
|
|
$
|
222
|
|
$
|
53,520
|
|
|||||||||
|
Allowance for loan and lease losses:
|
|||||||||||||||||||||||||||||||||||||||
|
December 31, 2013
|
|||||||||||||||||||||||||||||||||||||||
|
ALLL for loans and leases acquired with deteriorated credit quality
|
$
|
1,320
|
|
$
|
29,906
|
|
$
|
1,354
|
|
$
|
5,275
|
|
$
|
—
|
|
$
|
11,802
|
|
$
|
2,959
|
|
$
|
682
|
|
$
|
222
|
|
$
|
53,520
|
|
|||||||||
|
December 31, 2012
|
|||||||||||||||||||||||||||||||||||||||
|
ALLL for loans and leases acquired with deteriorated credit quality
|
31,186
|
|
50,275
|
|
11,234
|
|
8,897
|
|
—
|
|
19,837
|
|
9,754
|
|
8,287
|
|
502
|
|
139,972
|
|
|||||||||||||||||||
|
Loans and leases:
|
|||||||||||||||||||||||||||||||||||||||
|
December 31, 2013
|
|||||||||||||||||||||||||||||||||||||||
|
Loans and leases acquired with deteriorated credit quality
|
78,915
|
|
642,891
|
|
41,381
|
|
17,254
|
|
—
|
|
213,851
|
|
30,834
|
|
2,583
|
|
1,717
|
|
1,029,426
|
|
|||||||||||||||||||
|
December 31, 2012
|
|||||||||||||||||||||||||||||||||||||||
|
Loans and leases acquired with deteriorated credit quality
|
237,906
|
|
1,054,473
|
|
107,119
|
|
49,463
|
|
—
|
|
297,926
|
|
38,710
|
|
20,793
|
|
2,845
|
|
1,809,235
|
|
|||||||||||||||||||
89
FIRST CITIZENS BANCSHARES, INC. AND SUBSIDIARIES
NOTES TO CONSOLIDATED FINANCIAL STATEMENTS (Continued)
The following tables provide information on originated impaired loans and leases, exclusive of loans and leases evaluated collectively as a homogeneous group, including interest income recognized in the period during which the loans and leases were considered impaired.
|
With a
recorded
allowance
|
With no
recorded
allowance
|
Total
|
Unpaid
principal balance |
Related
allowance
recorded
|
|||||||||||||||
|
(dollars in thousands)
|
|||||||||||||||||||
|
December 31, 2013
|
|||||||||||||||||||
|
Impaired originated loans and leases
|
|||||||||||||||||||
|
Construction and land development - commercial
|
$
|
1,025
|
|
$
|
1,247
|
|
$
|
2,272
|
|
$
|
7,306
|
|
$
|
103
|
|
||||
|
Commercial mortgage
|
57,819
|
|
39,292
|
|
97,111
|
|
103,522
|
|
6,873
|
|
|||||||||
|
Other commercial real estate
|
783
|
|
1,095
|
|
1,878
|
|
2,279
|
|
209
|
|
|||||||||
|
Commercial and industrial
|
7,197
|
|
2,103
|
|
9,300
|
|
10,393
|
|
771
|
|
|||||||||
|
Lease financing
|
133
|
|
55
|
|
188
|
|
188
|
|
54
|
|
|||||||||
|
Residential mortgage
|
11,534
|
|
4,005
|
|
15,539
|
|
15,939
|
|
1,586
|
|
|||||||||
|
Revolving mortgage
|
3,382
|
|
214
|
|
3,596
|
|
3,596
|
|
372
|
|
|||||||||
|
Construction and land development - noncommercial
|
651
|
|
457
|
|
1,108
|
|
1,108
|
|
72
|
|
|||||||||
|
Consumer
|
1,154
|
|
—
|
|
1,154
|
|
1,154
|
|
121
|
|
|||||||||
|
Total impaired originated loans and leases
|
$
|
83,678
|
|
$
|
48,468
|
|
$
|
132,146
|
|
$
|
145,485
|
|
$
|
10,161
|
|
||||
|
December 31, 2012
|
|||||||||||||||||||
|
Impaired originated loans and leases
|
|||||||||||||||||||
|
Construction and land development - commercial
|
$
|
5,941
|
|
$
|
11,134
|
|
$
|
17,075
|
|
$
|
32,898
|
|
$
|
2,469
|
|
||||
|
Commercial mortgage
|
39,648
|
|
94,156
|
|
133,804
|
|
136,743
|
|
11,697
|
|
|||||||||
|
Other commercial real estate
|
1,425
|
|
1,950
|
|
3,375
|
|
3,475
|
|
298
|
|
|||||||||
|
Commercial and industrial
|
7,429
|
|
15,190
|
|
22,619
|
|
22,619
|
|
2,133
|
|
|||||||||
|
Lease financing
|
665
|
|
139
|
|
804
|
|
804
|
|
202
|
|
|||||||||
|
Other
|
—
|
|
707
|
|
707
|
|
707
|
|
53
|
|
|||||||||
|
Residential mortgage
|
9,346
|
|
6,490
|
|
15,836
|
|
16,229
|
|
959
|
|
|||||||||
|
Revolving mortgage
|
1,238
|
|
2,965
|
|
4,203
|
|
4,203
|
|
1
|
|
|||||||||
|
Construction and land development - noncommercial
|
1,162
|
|
159
|
|
1,321
|
|
1,321
|
|
287
|
|
|||||||||
|
Consumer
|
1,609
|
|
900
|
|
2,509
|
|
2,509
|
|
256
|
|
|||||||||
|
Nonspecific
|
—
|
|
—
|
|
—
|
|
—
|
|
—
|
|
|||||||||
|
Total impaired originated loans and leases
|
$
|
68,463
|
|
$
|
133,790
|
|
$
|
202,253
|
|
$
|
221,508
|
|
$
|
18,355
|
|
||||
90
FIRST CITIZENS BANCSHARES, INC. AND SUBSIDIARIES
NOTES TO CONSOLIDATED FINANCIAL STATEMENTS (Continued)
|
YTD
Average
Balance
|
YTD Interest Income Recognized
|
||||||
|
(dollars in thousands)
|
|||||||
|
Year ended December 31, 2013
|
|||||||
|
Originated impaired loans and leases:
|
|||||||
|
Construction and land development - commercial
|
$
|
6,414
|
|
$
|
270
|
|
|
|
Commercial mortgage
|
105,628
|
|
5,702
|
|
|||
|
Other commercial real estate
|
2,658
|
|
144
|
|
|||
|
Commercial and industrial
|
12,772
|
|
642
|
|
|||
|
Lease financing
|
350
|
|
22
|
|
|||
|
Other
|
—
|
|
—
|
|
|||
|
Residential mortgage
|
15,470
|
|
444
|
|
|||
|
Revolving mortgage
|
5,653
|
|
485
|
|
|||
|
Construction and land development - noncommercial
|
958
|
|
55
|
|
|||
|
Consumer
|
1,427
|
|
53
|
|
|||
|
Total originated impaired loans and leases
|
$
|
151,330
|
|
$
|
7,817
|
|
|
|
Year ended December 31, 2012
|
|||||||
|
Originated impaired loans and leases:
|
|||||||
|
Construction and land development - commercial
|
$
|
22,493
|
|
$
|
399
|
|
|
|
Commercial mortgage
|
96,082
|
|
4,630
|
|
|||
|
Other commercial real estate
|
2,690
|
|
142
|
|
|||
|
Commercial and industrial
|
13,658
|
|
788
|
|
|||
|
Lease financing
|
497
|
|
37
|
|
|||
|
Other
|
424
|
|
23
|
|
|||
|
Residential mortgage
|
14,951
|
|
586
|
|
|||
|
Revolving mortgage
|
2,931
|
|
68
|
|
|||
|
Construction and land development - noncommercial
|
2,850
|
|
41
|
|
|||
|
Consumer
|
1,850
|
|
21
|
|
|||
|
Total originated impaired loans and leases
|
$
|
158,426
|
|
$
|
6,735
|
|
|
|
Year ended December 31, 2011
|
|||||||
|
Originated impaired loans and leases:
|
|||||||
|
Construction and land development - commercial
|
$
|
26,612
|
|
$
|
56
|
|
|
|
Commercial mortgage
|
65,729
|
|
1,330
|
|
|||
|
Other commercial real estate
|
1,368
|
|
55
|
|
|||
|
Commercial and industrial
|
12,984
|
|
456
|
|
|||
|
Lease financing
|
587
|
|
21
|
|
|||
|
Other
|
38
|
|
—
|
|
|||
|
Residential mortgage
|
9,252
|
|
300
|
|
|||
|
Revolving mortgage
|
—
|
|
—
|
|
|||
|
Construction and land development - noncommercial
|
2,022
|
|
105
|
|
|||
|
Consumer
|
636
|
|
18
|
|
|||
|
Total originated impaired loans and leases
|
$
|
119,228
|
|
$
|
2,341
|
|
|
At
December 31, 2013
, acquired loans that have had an adverse change in expected cash flows since the date of acquisition equaled
$459.9 million
, for which
$53.5 million
in related allowance for loan losses has been recorded.
91
FIRST CITIZENS BANCSHARES, INC. AND SUBSIDIARIES
NOTES TO CONSOLIDATED FINANCIAL STATEMENTS (Continued)
Troubled Debt Restructurings
BancShares accounts for certain loan modifications or restructurings as troubled debt restructurings (TDRs). In general, the modification or restructuring of a loan is considered a TDR if, for economic reasons or legal reasons related to a borrower's financial difficulties, a concession is granted to the borrower that creditors would not otherwise consider. Concessions may relate to the contractual interest rate, maturity date, payment structure or other actions. In accordance with GAAP, loans acquired under ASC 310-30,
Loans and Debt Securities Acquired
with Deteriorated Credit Quality,
are not initially considered to be TDRs, but can be classified as such if a modification is made subsequent to acquisition. The following table provides a summary of total TDRs by accrual status.
|
December 31, 2013
|
December 31, 2012
|
||||||||||||||||||||||
|
Accruing
|
Nonaccruing
|
Total
|
Accruing
|
Nonaccruing
|
Total
|
||||||||||||||||||
|
(dollars in thousands)
|
|||||||||||||||||||||||
|
Commercial loans
|
|||||||||||||||||||||||
|
Construction and land development - commercial
|
$
|
21,032
|
|
$
|
1,002
|
|
$
|
22,034
|
|
$
|
47,368
|
|
$
|
26,920
|
|
$
|
74,288
|
|
|||||
|
Commercial mortgage
|
113,323
|
|
23,387
|
|
136,710
|
|
151,728
|
|
37,603
|
|
189,331
|
|
|||||||||||
|
Other commercial real estate
|
3,470
|
|
1,150
|
|
4,620
|
|
10,137
|
|
2,194
|
|
12,331
|
|
|||||||||||
|
Commercial and industrial
|
9,838
|
|
1,142
|
|
10,980
|
|
10,940
|
|
7,237
|
|
18,177
|
|
|||||||||||
|
Lease
|
49
|
|
—
|
|
49
|
|
224
|
|
—
|
|
224
|
|
|||||||||||
|
Total commercial loans
|
147,712
|
|
26,681
|
|
174,393
|
|
220,397
|
|
73,954
|
|
294,351
|
|
|||||||||||
|
Noncommercial
|
|||||||||||||||||||||||
|
Residential
|
23,343
|
|
3,663
|
|
27,006
|
|
28,777
|
|
5,828
|
|
34,605
|
|
|||||||||||
|
Revolving mortgage
|
3,095
|
|
—
|
|
3,095
|
|
48
|
|
—
|
|
48
|
|
|||||||||||
|
Construction and land development - noncommercial
|
651
|
|
457
|
|
1,108
|
|
1,657
|
|
—
|
|
1,657
|
|
|||||||||||
|
Consumer and other
|
1,154
|
|
—
|
|
1,154
|
|
2,509
|
|
—
|
|
2,509
|
|
|||||||||||
|
Total noncommercial loans
|
28,243
|
|
4,120
|
|
32,363
|
|
32,991
|
|
5,828
|
|
38,819
|
|
|||||||||||
|
Total loans
|
$
|
175,955
|
|
$
|
30,801
|
|
$
|
206,756
|
|
$
|
253,388
|
|
$
|
79,782
|
|
$
|
333,170
|
|
|||||
Total troubled debt restructurings at
December 31, 2013
, equaled
$206.8 million
, of which
$102.3 million
were acquired and
$104.4 million
were originated. TDRs at
December 31, 2012
, totaled
$333.2 million
, which consisted of
$193.2 million
acquired and
$140.0 million
that were originated.
The majority of TDRs are included in the special mention, substandard or doubtful grading categories, which results in more elevated loss expectations when determining the expected cash flows that are used to determine the allowance for loan losses associated with these loans. When a restructured loan subsequently defaults, it is evaluated and downgraded if appropriate. The more severely graded the loan, the lower the estimated expected cash flows and the greater the allowance recorded. Further, TDRs over
$500,000
and graded substandard or lower are evaluated individually for impairment through a review of collateral values.
92
FIRST CITIZENS BANCSHARES, INC. AND SUBSIDIARIES
NOTES TO CONSOLIDATED FINANCIAL STATEMENTS (Continued)
The following tables provide the types of TDRs made during the
three months ended December 31, 2013
, and
2012
, as well as a summary of loans that were modified as a TDR during the
12 months ended December 31, 2013
, and
2012
that subsequently defaulted during the
three months ended December 31, 2013
, and
2012
. BancShares defines payment default as movement of the TDR to nonaccrual status, foreclosure or charge-off, whichever occurs first.
.
|
Three months ended December 31, 2013
|
Three months ended December 31, 2012
|
||||||||||||||||||
|
All restructurings
|
Restructurings with payment default
|
All restructurings
|
Restructurings with payment default
|
||||||||||||||||
|
Number of Loans
|
Recorded investment at period end
|
Number of Loans
|
Recorded investment at period end
|
Number of Loans
|
Recorded investment at period end
|
Number of Loans
|
Recorded investment at period end
|
||||||||||||
|
(dollars in thousands)
|
|||||||||||||||||||
|
Originated loans
|
|||||||||||||||||||
|
Interest only period provided
|
|||||||||||||||||||
|
Commercial mortgage
|
1
|
$
|
305
|
|
1
|
$
|
—
|
|
1
|
$
|
861
|
|
1
|
$
|
595
|
|
|||
|
Commercial and industrial
|
1
|
198
|
|
—
|
—
|
|
2
|
337
|
|
1
|
746
|
|
|||||||
|
Residential mortgage
|
—
|
—
|
|
—
|
—
|
|
—
|
—
|
|
1
|
559
|
|
|||||||
|
Construction and land development-noncommercial
|
—
|
—
|
|
—
|
—
|
|
1
|
476
|
|
—
|
—
|
|
|||||||
|
Total interest only
|
2
|
503
|
|
1
|
—
|
|
4
|
1,674
|
|
3
|
1,900
|
|
|||||||
|
Loan term extension
|
|||||||||||||||||||
|
Commercial mortgage
|
1
|
770
|
|
—
|
—
|
|
7
|
2,319
|
|
3
|
122
|
|
|||||||
|
Commercial and industrial
|
—
|
—
|
|
—
|
—
|
|
1
|
24
|
|
1
|
24
|
|
|||||||
|
Residential mortgage
|
3
|
241
|
|
—
|
—
|
|
1
|
16
|
|
1
|
108
|
|
|||||||
|
Consumer
|
—
|
—
|
|
—
|
—
|
|
1
|
8
|
|
—
|
—
|
|
|||||||
|
Total loan term extension
|
4
|
1,011
|
|
—
|
—
|
|
10
|
2,367
|
|
5
|
254
|
|
|||||||
|
Below market interest rate
|
|||||||||||||||||||
|
Commercial mortgage
|
8
|
3,964
|
|
1
|
295
|
|
8
|
3,444
|
|
1
|
490
|
|
|||||||
|
Commercial and industrial
|
—
|
—
|
|
—
|
—
|
|
3
|
311
|
|
—
|
—
|
|
|||||||
|
Residential mortgage
|
6
|
347
|
|
—
|
—
|
|
2
|
130
|
|
1
|
59
|
|
|||||||
|
Revolving mortgage
|
6
|
496
|
|
2
|
378
|
|
—
|
—
|
|
—
|
—
|
|
|||||||
|
Consumer
|
—
|
—
|
|
—
|
—
|
|
2
|
16
|
|
—
|
—
|
|
|||||||
|
Total below market interest rate
|
20
|
4,807
|
|
3
|
673
|
|
15
|
3,901
|
|
2
|
549
|
|
|||||||
|
Discharged from bankruptcy
|
|||||||||||||||||||
|
Residential mortgage
|
1
|
32
|
|
—
|
—
|
|
—
|
—
|
|
—
|
—
|
||||||||
|
Revolving mortgage
|
—
|
—
|
|
3
|
130
|
|
—
|
—
|
|
—
|
—
|
||||||||
|
Total discharged from bankruptcy
|
1
|
32
|
|
3
|
130
|
|
—
|
—
|
|
—
|
—
|
||||||||
|
Total originated restructurings
|
27
|
$
|
6,353
|
|
7
|
$
|
803
|
|
29
|
$
|
7,942
|
|
10
|
$
|
2,703
|
|
|||
93
FIRST CITIZENS BANCSHARES, INC. AND SUBSIDIARIES
NOTES TO CONSOLIDATED FINANCIAL STATEMENTS (Continued)
|
Three months ended December 31, 2013
|
Three months ended December 31, 2012
|
||||||||||||||||||
|
All restructurings
|
Restructurings with payment default
|
All restructurings
|
Restructurings with payment default
|
||||||||||||||||
|
Number of loans
|
Recorded investment at period end
|
Number of loans
|
Recorded investment at period end
|
Number of loans
|
Recorded investment at period end
|
Number of loans
|
Recorded investment at period end
|
||||||||||||
|
(dollars in thousands)
|
|||||||||||||||||||
|
Acquired loans
|
|||||||||||||||||||
|
Interest only period provided
|
|||||||||||||||||||
|
Commercial mortgage
|
2
|
$
|
403
|
|
—
|
$
|
—
|
|
—
|
$
|
—
|
|
—
|
$
|
—
|
|
|||
|
Other commercial real estate
|
—
|
—
|
|
—
|
—
|
|
1
|
2,994
|
|
—
|
—
|
|
|||||||
|
Total interest only
|
2
|
403
|
|
—
|
—
|
|
1
|
2,994
|
|
—
|
—
|
|
|||||||
|
Loan term extension
|
|||||||||||||||||||
|
Construction and land development - commercial
|
1
|
100
|
|
—
|
—
|
|
—
|
—
|
|
—
|
—
|
|
|||||||
|
Commercial mortgage
|
—
|
—
|
|
1
|
157
|
|
—
|
—
|
|
—
|
—
|
|
|||||||
|
Residential mortgage
|
—
|
—
|
|
—
|
—
|
|
—
|
—
|
|
1
|
66
|
|
|||||||
|
Total loan term extension
|
1
|
100
|
|
1
|
157
|
|
—
|
—
|
|
1
|
66
|
|
|||||||
|
Below market interest rate
|
|||||||||||||||||||
|
Construction and land development - commercial
|
—
|
—
|
|
—
|
—
|
|
3
|
17,615
|
|
3
|
7,050
|
|
|||||||
|
Commercial mortgage
|
1
|
165
|
|
2
|
2,183
|
|
4
|
2,715
|
|
1
|
1,229
|
|
|||||||
|
Commercial and industrial
|
—
|
—
|
|
—
|
—
|
|
1
|
253
|
|
—
|
—
|
|
|||||||
|
Residential mortgage
|
1
|
100
|
|
—
|
—
|
|
3
|
2,542
|
|
3
|
122
|
|
|||||||
|
Total below market interest rate
|
2
|
265
|
|
2
|
2,183
|
|
11
|
23,125
|
|
7
|
8,401
|
|
|||||||
|
Other concession
|
|||||||||||||||||||
|
Residential mortgage
|
—
|
—
|
|
—
|
—
|
|
—
|
—
|
|
1
|
54
|
|
|||||||
|
Total other concession
|
—
|
—
|
|
—
|
—
|
|
—
|
—
|
|
1
|
54
|
|
|||||||
|
Total restructurings
|
5
|
$
|
768
|
|
3
|
$
|
2,340
|
|
12
|
$
|
26,119
|
|
9
|
$
|
8,521
|
|
|||
For the
three months ended December 31, 2013
, the recorded investment in troubled debt restructurings subsequent to modification was not materially impacted by the modification since forgiveness of principal is not a restructuring option frequently used by BancShares.
94
FIRST CITIZENS BANCSHARES, INC. AND SUBSIDIARIES
NOTES TO CONSOLIDATED FINANCIAL STATEMENTS (Continued)
The following tables provide the types of TDRs made during the
twelve months ended December 31, 2013
, and
2012
, as well as a summary of loans that were modified as a TDR during the
12 months ended December 31, 2013
, and
2012
that subsequently defaulted during the
twelve months ended December 31, 2013
, and
2012
. BancShares defines payment default as movement of the TDR to nonaccrual status, foreclosure or charge-off, whichever occurs first.
|
Year ended December 31, 2013
|
Year ended December 31, 2012
|
||||||||||||||||||
|
All restructurings
|
Restructurings with payment default
|
All restructurings
|
Restructurings with payment default
|
||||||||||||||||
|
Number of Loans
|
Recorded investment at period end
|
Number of Loans
|
Recorded investment at period end
|
Number of Loans
|
Recorded investment at period end
|
Number of Loans
|
Recorded investment at period end
|
||||||||||||
|
(dollars in thousands)
|
|||||||||||||||||||
|
Originated loans
|
|||||||||||||||||||
|
Interest only period provided
|
|||||||||||||||||||
|
Construction and land development - commercial
|
—
|
$
|
—
|
|
—
|
$
|
—
|
|
2
|
$
|
316
|
|
—
|
$
|
—
|
|
|||
|
Commercial mortgage
|
6
|
1,520
|
|
1
|
—
|
|
12
|
3,891
|
|
3
|
1,440
|
|
|||||||
|
Commercial and industrial
|
2
|
397
|
|
—
|
—
|
|
2
|
574
|
|
—
|
—
|
|
|||||||
|
Other commercial real estate
|
1
|
—
|
|
—
|
—
|
|
—
|
—
|
|
—
|
—
|
|
|||||||
|
Residential mortgage
|
1
|
630
|
|
—
|
—
|
|
2
|
893
|
|
2
|
893
|
|
|||||||
|
Total interest only
|
10
|
2,547
|
|
1
|
—
|
|
18
|
5,674
|
|
5
|
2,333
|
|
|||||||
|
Loan term extension
|
|||||||||||||||||||
|
Construction and land development - commercial
|
—
|
—
|
|
—
|
—
|
|
2
|
7,667
|
|
—
|
—
|
|
|||||||
|
Commercial mortgage
|
9
|
3,270
|
|
—
|
—
|
|
50
|
16,818
|
|
13
|
3,456
|
|
|||||||
|
Other commercial real estate
|
—
|
—
|
|
—
|
—
|
|
3
|
1,318
|
|
—
|
—
|
|
|||||||
|
Commercial and industrial
|
1
|
47
|
|
—
|
—
|
|
11
|
1,363
|
|
4
|
169
|
|
|||||||
|
Lease financing
|
—
|
—
|
|
—
|
—
|
|
3
|
166
|
|
—
|
—
|
|
|||||||
|
Residential mortgage
|
11
|
539
|
|
—
|
—
|
|
9
|
521
|
|
2
|
155
|
|
|||||||
|
Construction and land development - noncommercial
|
—
|
—
|
|
—
|
—
|
|
1
|
158
|
|
—
|
—
|
|
|||||||
|
Consumer
|
2
|
62
|
|
—
|
—
|
|
7
|
1,132
|
|
—
|
—
|
|
|||||||
|
Total loan term extension
|
23
|
3,918
|
|
—
|
—
|
|
86
|
29,143
|
|
19
|
3,780
|
|
|||||||
|
Below market interest rate
|
|||||||||||||||||||
|
Construction and land development - commercial
|
3
|
609
|
|
—
|
—
|
|
1
|
227
|
|
—
|
—
|
|
|||||||
|
Commercial mortgage
|
28
|
10,873
|
|
1
|
295
|
|
12
|
7,333
|
|
1
|
490
|
|
|||||||
|
Commercial and industrial
|
3
|
851
|
|
—
|
—
|
|
11
|
1,584
|
|
1
|
—
|
|
|||||||
|
Other commercial real estate
|
2
|
378
|
|
—
|
—
|
|
—
|
—
|
|
—
|
—
|
|
|||||||
|
Residential mortgage
|
21
|
1,235
|
|
—
|
—
|
|
13
|
1,887
|
|
5
|
828
|
|
|||||||
|
Revolving mortgage
|
13
|
801
|
|
3
|
451
|
|
1
|
48
|
|
1
|
48
|
|
|||||||
|
Construction & land development - noncommercial
|
4
|
269
|
|
—
|
—
|
|
—
|
—
|
|
—
|
—
|
|
|||||||
|
Consumer
|
3
|
219
|
|
—
|
—
|
|
4
|
17
|
|
1
|
—
|
|
|||||||
|
Total below market interest rate
|
77
|
15,235
|
|
4
|
746
|
|
42
|
11,096
|
|
9
|
1,366
|
|
|||||||
|
Discharged from bankruptcy
|
|||||||||||||||||||
|
Residential mortgage
|
7
|
510
|
|
2
|
60
|
|
—
|
—
|
|
—
|
—
|
|
|||||||
|
Revolving mortgage
|
31
|
2,577
|
|
6
|
274
|
|
—
|
—
|
|
—
|
—
|
|
|||||||
|
Total discharged from bankruptcy
|
38
|
3,087
|
|
8
|
334
|
|
—
|
—
|
|
—
|
—
|
|
|||||||
|
Other concession
|
|||||||||||||||||||
|
Commercial mortgage
|
—
|
—
|
|
—
|
—
|
|
3
|
1,036
|
|
—
|
—
|
|
|||||||
|
Residential mortgage
|
—
|
—
|
|
—
|
—
|
|
1
|
384
|
|
—
|
—
|
|
|||||||
|
Total other concession
|
—
|
—
|
|
—
|
—
|
|
4
|
1,420
|
|
—
|
—
|
|
|||||||
|
Total originated restructurings
|
148
|
$
|
24,787
|
|
13
|
$
|
1,080
|
|
150
|
$
|
47,333
|
|
33
|
$
|
7,479
|
|
|||
95
FIRST CITIZENS BANCSHARES, INC. AND SUBSIDIARIES
NOTES TO CONSOLIDATED FINANCIAL STATEMENTS (Continued)
|
Year ended December 31, 2013
|
Year ended December 31, 2012
|
||||||||||||||||||
|
All restructurings
|
Restructurings with payment default
|
All restructurings
|
Restructurings with payment default
|
||||||||||||||||
|
Number of Loans
|
Recorded investment at period end
|
Number of Loans
|
Recorded investment at period end
|
Number of Loans
|
Recorded investment at period end
|
Number of Loans
|
Recorded investment at period end
|
||||||||||||
|
(dollars in thousands)
|
|||||||||||||||||||
|
Acquired loans
|
|||||||||||||||||||
|
Interest only period provided
|
|||||||||||||||||||
|
Construction and land development - commercial
|
1
|
$
|
2,590
|
|
1
|
$
|
2,590
|
|
2
|
$
|
496
|
|
1
|
$
|
356
|
|
|||
|
Commercial mortgage
|
5
|
2,880
|
|
1
|
299
|
|
4
|
10,404
|
|
1
|
234
|
|
|||||||
|
Other commercial real estate
|
—
|
—
|
|
—
|
—
|
|
1
|
2,994
|
|
—
|
—
|
|
|||||||
|
Commercial and industrial
|
1
|
21
|
|
—
|
—
|
|
1
|
170
|
|
—
|
—
|
|
|||||||
|
Residential mortgage
|
1
|
39
|
|
—
|
—
|
|
1
|
98
|
|
—
|
—
|
|
|||||||
|
Total interest only
|
8
|
5,530
|
|
2
|
2,889
|
|
9
|
14,162
|
|
2
|
590
|
|
|||||||
|
Loan term extension
|
|||||||||||||||||||
|
Construction and land development - commercial
|
6
|
2,247
|
|
—
|
—
|
|
9
|
7,294
|
|
1
|
3,703
|
|
|||||||
|
Commercial mortgage
|
1
|
157
|
|
1
|
157
|
|
4
|
2,584
|
|
—
|
—
|
|
|||||||
|
Commercial and industrial
|
2
|
1,080
|
|
—
|
—
|
|
2
|
158
|
|
—
|
—
|
|
|||||||
|
Residential mortgage
|
3
|
5,153
|
|
2
|
5,120
|
|
4
|
5,111
|
|
2
|
4,629
|
|
|||||||
|
Total loan term extension
|
12
|
8,637
|
|
3
|
5,277
|
|
19
|
15,147
|
|
3
|
8,332
|
|
|||||||
|
Below market interest rate
|
|||||||||||||||||||
|
Construction and land development - commercial
|
2
|
106
|
|
—
|
—
|
|
13
|
19,953
|
|
5
|
8,781
|
|
|||||||
|
Commercial mortgage
|
12
|
7,513
|
|
4
|
2,418
|
|
18
|
19,100
|
|
6
|
3,906
|
|
|||||||
|
Other commercial real estate
|
—
|
—
|
|
—
|
—
|
|
2
|
1,954
|
|
—
|
—
|
|
|||||||
|
Commercial and industrial
|
2
|
493
|
|
—
|
—
|
|
5
|
1,299
|
|
2
|
—
|
|
|||||||
|
Residential mortgage
|
10
|
2,088
|
|
5
|
1,475
|
|
21
|
4,622
|
|
10
|
490
|
|
|||||||
|
Construction and land development - noncommercial
|
—
|
—
|
|
—
|
—
|
|
1
|
—
|
|
1
|
—
|
|
|||||||
|
Total below market interest rate
|
26
|
10,200
|
|
9
|
3,893
|
|
60
|
46,928
|
|
24
|
13,177
|
|
|||||||
|
Other concession
|
|||||||||||||||||||
|
Commercial mortgage
|
1
|
110
|
|
—
|
—
|
|
—
|
—
|
|
—
|
—
|
|
|||||||
|
Residential mortgage
|
—
|
—
|
|
—
|
—
|
|
1
|
54
|
|
1
|
54
|
|
|||||||
|
Total other concession
|
1
|
110
|
|
—
|
—
|
|
1
|
54
|
|
1
|
54
|
|
|||||||
|
Total acquired restructurings
|
47
|
$
|
24,477
|
|
14
|
$
|
12,059
|
|
89
|
$
|
76,291
|
|
30
|
$
|
22,153
|
|
|||
NOTE E
PREMISES AND EQUIPMENT
Major classifications of premises and equipment at
December 31, 2013
, and
2012
, are summarized as follows:
|
2013
|
2012
|
||||||
|
(dollars in thousands)
|
|||||||
|
Land
|
$
|
204,259
|
|
$
|
202,168
|
|
|
|
Premises and leasehold improvements
|
875,511
|
|
840,149
|
|
|||
|
Furniture and equipment
|
394,348
|
|
390,345
|
|
|||
|
Total
|
1,474,118
|
|
1,432,662
|
|
|||
|
Less accumulated depreciation and amortization
|
597,596
|
|
549,894
|
|
|||
|
Total premises and equipment
|
$
|
876,522
|
|
$
|
882,768
|
|
|
There were
no
premises pledged to secure borrowings at
December 31, 2013
, and
2012
.
96
FIRST CITIZENS BANCSHARES, INC. AND SUBSIDIARIES
NOTES TO CONSOLIDATED FINANCIAL STATEMENTS (Continued)
BancShares leases certain premises and equipment under various lease agreements that provide for payment of property taxes, insurance and maintenance costs. Operating leases frequently provide for one or more renewal options on the same basis as current rental terms. However, certain leases require increased rentals under cost of living escalation clauses. Some leases also provide purchase options.
Future minimum rental commitments for noncancellable operating leases with initial or remaining terms of one or more years consisted of the following at
December 31, 2013
:
|
Year ended December 31
|
|||
|
(dollars in thousands)
|
|||
|
2014
|
$
|
17,181
|
|
|
2015
|
13,004
|
|
|
|
2016
|
8,539
|
|
|
|
2017
|
5,969
|
|
|
|
2018
|
4,574
|
|
|
|
Thereafter
|
41,554
|
|
|
|
Total minimum payments
|
$
|
90,821
|
|
Total rent expense for all operating leases amounted to
$21.4 million
in
2013
,
$23.6 million
in
2012
and
$24.7 million
in
2011
, net of rent income, which totaled
$1.8 million
,
$1.7 million
and
$1.7 million
during
2013
,
2012
and
2011
, respectively.
NOTE F
OTHER REAL ESTATE OWNED
The following table explains changes in other real estate owned during
2013
and
2012
.
|
Covered
|
Noncovered
|
Total
|
|||||||||
|
(dollars in thousands)
|
|||||||||||
|
Balance at January 1, 2012
|
$
|
148,599
|
|
$
|
50,399
|
|
$
|
198,998
|
|
||
|
Additions
|
105,059
|
|
35,586
|
|
140,645
|
|
|||||
|
Sales
|
(124,435
|
)
|
(33,564
|
)
|
(157,999
|
)
|
|||||
|
Writedowns
|
(26,646
|
)
|
(8,908
|
)
|
(35,554
|
)
|
|||||
|
Balance at December 31, 2012
|
102,577
|
|
43,513
|
|
146,090
|
|
|||||
|
Additions
|
59,034
|
|
33,908
|
|
92,942
|
|
|||||
|
Sales
|
(96,744
|
)
|
(36,168
|
)
|
(132,912
|
)
|
|||||
|
Writedowns
|
(17,786
|
)
|
(4,355
|
)
|
(22,141
|
)
|
|||||
|
Balance at December 31, 2013
|
$
|
47,081
|
|
$
|
36,898
|
|
$
|
83,979
|
|
||
97
FIRST CITIZENS BANCSHARES, INC. AND SUBSIDIARIES
NOTES TO CONSOLIDATED FINANCIAL STATEMENTS (Continued)
NOTE G
RECEIVABLE FROM THE FDIC FOR LOSS SHARE AGREEMENTS
The following table presents the changes in the receivable for loss share agreements:
|
|
Year ended December 31
|
||||||||||
|
|
2013
|
2012
|
2011
|
||||||||
|
(dollars in thousands)
|
|||||||||||
|
Balance at January 1
|
$
|
270,192
|
|
$
|
617,377
|
|
$
|
671,023
|
|
||
|
Additional receivable from acquisitions
|
—
|
|
—
|
|
316,932
|
|
|||||
|
Amortization of discounts and premiums, net
|
(85,651
|
)
|
(102,394
|
)
|
(32,960
|
)
|
|||||
|
Cash payments from FDIC
|
(19,373
|
)
|
(251,972
|
)
|
(293,067
|
)
|
|||||
|
Post-acquisition and other adjustments, net
|
(71,771
|
)
|
7,181
|
|
(44,551
|
)
|
|||||
|
Balance at December 31
|
$
|
93,397
|
|
$
|
270,192
|
|
$
|
617,377
|
|
||
The receivable from the FDIC for loss share agreements is measured separately from the related covered assets and is recorded at fair value at the acquisition date using projected cash flows related to the loss share agreements based on the expected reimbursements for losses and the applicable loss share percentages. See Note T
for information related to BancShares' recorded payable to the FDIC for loss share agreements.
Post-acquisition adjustments represent the net change in loss estimates related to acquired loans and covered OREO as a result of changes in expected cash flows and the allowance for loan and lease losses related to those covered loans. For loans covered by loss share agreements, subsequent decreases in the amount expected to be collected from the borrower or collateral liquidation result in a provision for loan and lease losses, an increase in the allowance for loan and lease losses and a proportional adjustment to the receivable from the FDIC for the estimated amount to be reimbursed. Subsequent increases in the amount expected to be collected from the borrower or collateral liquidation result in the reversal of any previously recorded provision for loan and lease losses and related allowance for loan and lease losses and adjustments to the receivable from the FDIC, or prospective adjustment to the accretable yield and the related receivable from the FDIC if no provision for loan and lease losses had been recorded previously. Other adjustments include those resulting from unexpected recoveries of amounts previously charged off.
NOTE H
MORTGAGE SERVICING RIGHTS
Mortgage servicing rights totaled
$16,000
and
$1.8 million
at
December 31, 2013, and 2012
, respectively. During 2013, BancShares sold substantially all of its servicing asset. During 2011, BancShares acquired the rights to service mortgage loans that had previously been sold by United Western. The acquired asset was recorded at its fair value and amortized over the remaining estimated servicing life, which was estimated to be 60 months as of the acquisition date. BancShares does not hedge its mortgage servicing asset.
98
FIRST CITIZENS BANCSHARES, INC. AND SUBSIDIARIES
NOTES TO CONSOLIDATED FINANCIAL STATEMENTS (Continued)
NOTE I
DEPOSITS
Deposits at
December 31
are summarized as follows:
|
2013
|
2012
|
||||||
|
(dollars in thousands)
|
|||||||
|
Demand
|
$
|
5,241,817
|
|
$
|
4,885,700
|
|
|
|
Checking With Interest
|
2,445,972
|
|
2,363,317
|
|
|||
|
Money market accounts
|
6,306,942
|
|
6,357,309
|
|
|||
|
Savings
|
1,004,097
|
|
905,456
|
|
|||
|
Time
|
2,875,238
|
|
3,574,243
|
|
|||
|
Total deposits
|
$
|
17,874,066
|
|
$
|
18,086,025
|
|
|
Time deposits with a minimum denomination of
$100,000
totaled
$1.27 billion
and
$1.61 billion
at
December 31, 2013, and 2012
, respectively.
At
December 31, 2013
, the scheduled maturities of time deposits were:
|
Year
|
Scheduled maturities
|
||
|
(dollars in thousands)
|
|||
|
2014
|
$
|
1,920,998
|
|
|
2015
|
532,711
|
|
|
|
2016
|
296,073
|
|
|
|
2017
|
87,179
|
|
|
|
2018
|
38,277
|
|
|
|
Thereafter
|
—
|
|
|
|
Total time deposits
|
$
|
2,875,238
|
|
NOTE J
SHORT-TERM BORROWINGS
Short-term borrowings at
December 31
are as follows:
|
2013
|
2012
|
||||||
|
(dollars in thousands)
|
|||||||
|
Master notes
|
$
|
411,907
|
|
$
|
399,047
|
|
|
|
Repurchase agreements
|
96,960
|
|
111,907
|
|
|||
|
Notes payable to Federal Home Loan Banks
|
—
|
|
55,000
|
|
|||
|
Federal funds purchased
|
2,551
|
|
2,551
|
|
|||
|
Total short-term borrowings
|
$
|
511,418
|
|
$
|
568,505
|
|
|
At
December 31, 2013
, BancShares and FCB had unused credit lines allowing contingent access to overnight borrowings of up to
$665.0 million
on an unsecured basis. Additionally, under borrowing arrangements with the Federal Home Loan Bank of Atlanta, FCB has access to an additional
$1.14 billion
on a secured basis.
99
NOTE K
LONG-TERM OBLIGATIONS
Long-term obligations at
December 31
include:
|
2013
|
2012
|
||||||
|
(dollars in thousands)
|
|||||||
|
Junior subordinated debenture at 3-month LIBOR plus 1.75 percent maturing June 30, 2036
|
96,392
|
|
96,392
|
|
|||
|
Subordinated notes payable at 5.125 percent maturing June 1, 2015
|
125,000
|
|
125,000
|
|
|||
|
Obligations under capitalized leases extending to June 2026
|
6,515
|
|
10,020
|
|
|||
|
Notes payable to Federal Home Loan Bank of Atlanta with rates ranging from 2.00 percent to 3.88 percent and maturing through September 2021
|
240,283
|
|
170,299
|
|
|||
|
Note payable to the Federal Home Loan Bank of Seattle with a rate of 4.74 percent and a maturity date of July 2017
|
10,000
|
|
10,000
|
|
|||
|
Unamortized acquisition accounting adjustments
|
2,449
|
|
3,069
|
|
|||
|
Other long-term debt
|
30,130
|
|
30,141
|
|
|||
|
Total long-term obligations
|
$
|
510,769
|
|
$
|
444,921
|
|
|
Long-term obligations maturing in each of the five years subsequent to
December 31, 2013
, include:
|
Year
|
Scheduled maturities
|
||
|
(dollars in thousands)
|
|||
|
2014
|
$
|
2,908
|
|
|
2015
|
205,422
|
|
|
|
2016
|
—
|
|
|
|
2017
|
11,005
|
|
|
|
2018
|
121,444
|
|
|
|
Thereafter
|
169,990
|
|
|
|
Total long-term obligations
|
$
|
510,769
|
|
NOTE L
ESTIMATED FAIR VALUES
Fair value estimates are intended to represent the price that would be received to sell an asset or paid to transfer a liability in an orderly transaction between market participants as of the measurement date. Where there is no active market for a financial instrument, BancShares has made estimates using discounted cash flow or other valuation techniques. Inputs to these valuation methods are subjective in nature, involve uncertainties and require significant judgment and therefore cannot be determined with precision. Accordingly, the derived fair value estimates presented below are not necessarily indicative of the amounts BancShares could realize in a current market exchange.
Assets and liabilities are recorded at fair value according to a fair value hierarchy comprised of three levels. The levels are based on the markets in which the assets and liabilities are traded and the reliability of the assumptions used to determine fair value. The level of an asset or liability within the fair value hierarchy is based on the lowest level of input that is significant to the fair value measurement (with level 1 considered highest and level 3 considered lowest). A brief description of each level follows:
|
•
|
Level 1 values are based on quoted prices for identical instruments in active markets.
|
|
•
|
Level 2 values are based on quoted prices for similar instruments in active markets, quoted prices for identical or similar instruments in markets that are not active and model-based valuation techniques for which all significant assumptions are observable in the market.
|
|
•
|
Level 3 values are generated from model-based techniques that use at least one significant assumption not observable in the market. These unobservable assumptions reflect estimates that market participants would use in pricing the asset or liability. Valuation techniques include the use of discounted cash flow models and similar techniques.
|
100
FIRST CITIZENS BANCSHARES, INC. AND SUBSIDIARIES
NOTES TO CONSOLIDATED FINANCIAL STATEMENTS (Continued)
The methodologies used to estimate the fair value of financial assets and financial liabilities are discussed below:
Investment securities
. U.S.Treasury, government agency, mortgage-backed securities and state, county and municipal securities are measured at fair value using significant observable inputs such as benchmark yields, reported trades, broker/dealer quotes, issuer spreads, benchmark securities and bids/offers. The inputs used for these securities are considered level 2 inputs. Equity securities are measured at fair value using observable closing prices. Management also considers the level of market activity by examining the trade volume of each security. Due to the relatively inactive nature of the markets, the inputs used for these securities are considered level 2 inputs.
Loans held for sale.
Fair value for loans held for sale is generally based on market prices for loans with similar characteristics or external valuations. The inputs used in the fair value measurements for loans held for sale are considered level 2 inputs.
Loans and leases (acquired and originated).
For variable rate loans, carrying value is a reasonable estimate of fair value. For fixed rate loans, fair values are estimated based on discounted future cash flows using the current interest rates at which loans with similar terms would be made to borrowers of similar credit quality. Additional valuation adjustments are made for liquidity and credit risk. The inputs used in the fair value measurements for loans and leases are considered level 3 inputs.
Receivable from the FDIC for loss share agreements
. Fair value is estimated based on discounted future cash flows using current discount rates. Due to post-acquisition improvements in expected losses, significant portions of the FDIC receivable will be recovered through amortization of the receivable over the remaining life of the loss share agreement rather than by cash flows from the FDIC. The estimated amounts to be amortized in future periods have no fair value. The inputs used in the fair value measurements for the FDIC receivable are considered level 3 inputs. The FDIC loss share agreements are not transferable and, accordingly, there is no market for this receivable.
FHLB stock
. The carrying amount of FHLB stock is a reasonable estimate of fair value as these securities are not readily marketable and are evaluated for impairment based on the ultimate recoverability of the par value. BancShares considers positive and negative evidence, including the profitability and asset quality of the issuer, dividend payment history and recent redemption experience, when determining the ultimate recoverability of the par value. BancShares believes its investment in FHLB stock is ultimately recoverable at par.
Preferred stock issued under the TARP program
. Preferred securities issued under the Troubled Asset Recovery Program are recorded at cost and are evaluated quarterly for impairment based on the ultimate recoverability of the purchase price. The fair value of these securities is derived from a third-party proprietary model that is considered to be a level 3 input.
Deposits.
For non-time deposits and variable rate time deposits, carrying value is a reasonable estimate of fair value. The fair value of fixed rate time deposits is estimated by discounting future cash flows using the interest rates currently offered for deposits of similar remaining maturities. The inputs used in the fair value measurements for deposits are considered level 2 inputs.
Long-term obligations.
For fixed rate trust preferred securities, the fair values are determined based on recent trades of the actual security. For other long-term obligations, fair values are estimated by discounting future cash flows using current interest rates for similar financial instruments. The inputs used in the fair value measurements for long-term obligations are considered level 2 inputs.
Payable to the FDIC for loss share agreements.
The fair value of the payable to the FDIC for loss share agreements is determined by the projected cash flows based on expected payments to the FDIC in accordance with the loss share agreements. Cash flows are discounted to reflect the timing of the estimated amounts due to the FDIC. The inputs used in the fair value measurements for the payable to the FDIC are considered level 3 inputs. See Note T for more information on the payable to the FDIC.
Interest rate swap
. Under the terms of the existing cash flow hedge, BancShares pays a fixed payment to the counterparty in exchange for receipt of a variable payment that is determined based on the three-month LIBOR rate. The fair value of the cash flow hedge is, therefore, based on projected LIBOR rates for the duration of the hedge, values that, while observable in the market, are subject to adjustment due to pricing considerations for the specific instrument. If the fair value of the swap is a net asset, the risk of default by the counterparty is considered in the determination of fair value and is considered a level 3 input. The inputs used in the fair value measurements of the interest rate swap are considered level 2 inputs.
101
FIRST CITIZENS BANCSHARES, INC. AND SUBSIDIARIES
NOTES TO CONSOLIDATED FINANCIAL STATEMENTS (Continued)
Off-balance-sheet commitments and contingencies.
Carrying amounts are reasonable estimates of the fair values for such financial instruments. Carrying amounts include unamortized fee income and, in some cases, reserves for any credit losses from those financial instruments. These amounts are not material to BancShares' financial position.
For all other financial assets and financial liabilities, the carrying value is a reasonable estimate of the fair value as of
December 31, 2013
, and
December 31, 2012
. The carrying value and fair value for these assets and liabilities are equivalent because they are relatively short term in nature and there is no interest rate or credit risk relating to them that would cause the fair value to differ from the carrying value.
|
|
December 31, 2013
|
December 31, 2012
|
|||||||||||||
|
Carrying value
|
Fair value
|
Carrying value
|
Fair value
|
||||||||||||
|
(dollars in thousands)
|
|||||||||||||||
|
Cash and due from banks
|
$
|
533,599
|
|
$
|
533,599
|
|
$
|
639,730
|
|
$
|
639,730
|
|
|||
|
Overnight investments
|
859,324
|
|
859,324
|
|
443,180
|
|
443,180
|
|
|||||||
|
Investment securities available for sale
|
5,387,703
|
|
5,387,703
|
|
5,226,228
|
|
5,226,228
|
|
|||||||
|
Investment securities held to maturity
|
907
|
|
974
|
|
1,342
|
|
1,448
|
|
|||||||
|
Loans held for sale
|
47,271
|
|
47,956
|
|
86,333
|
|
87,654
|
|
|||||||
|
Acquired loans, net of allowance for loan and lease losses
|
975,906
|
|
956,388
|
|
1,669,263
|
|
1,635,878
|
|
|||||||
|
Originated loans, net of allowance for loan and lease losses
|
11,924,424
|
|
11,589,149
|
|
11,397,069
|
|
11,238,597
|
|
|||||||
|
Receivable from the FDIC for loss share agreements
(1)
|
93,397
|
|
38,438
|
|
270,192
|
|
100,161
|
|
|||||||
|
Income earned not collected
|
48,390
|
|
48,390
|
|
47,666
|
|
47,666
|
|
|||||||
|
Stock issued by:
|
|||||||||||||||
|
Federal Home Loan Bank of Atlanta
|
30,813
|
|
30,813
|
|
36,139
|
|
36,139
|
|
|||||||
|
Federal Home Loan Bank of San Francisco
|
5,756
|
|
5,756
|
|
10,107
|
|
10,107
|
|
|||||||
|
Federal Home Loan Bank of Seattle
|
4,250
|
|
4,250
|
|
4,410
|
|
4,410
|
|
|||||||
|
Preferred stock
|
33,564
|
|
34,786
|
|
40,768
|
|
40,793
|
|
|||||||
|
Deposits
|
17,874,066
|
|
17,898,570
|
|
18,086,025
|
|
18,126,893
|
|
|||||||
|
Short-term borrowings
|
511,418
|
|
511,418
|
|
568,505
|
|
568,505
|
|
|||||||
|
Long-term obligations
|
510,769
|
|
526,037
|
|
444,921
|
|
472,642
|
|
|||||||
|
Payable to the FDIC for loss share agreements
|
109,378
|
|
111,941
|
|
101,641
|
|
111,679
|
|
|||||||
|
Accrued interest payable
|
6,737
|
|
6,737
|
|
9,353
|
|
9,353
|
|
|||||||
|
Interest rate swap
|
7,220
|
|
7,220
|
|
10,398
|
|
10,398
|
|
|||||||
(1)
The fair value of the FDIC receivable excludes receivable related to accretable yield to be amortized in prospective periods.
Among BancShares’ assets and liabilities, investment securities available for sale and interest rate swaps accounted for as cash flow hedges are reported at their fair values on a recurring basis. Certain other assets are adjusted to their fair value on a nonrecurring basis, including loans held for sale, which are carried at the lower of cost or fair value. Impaired loans, OREO, goodwill and other intangible assets are periodically tested for impairment. Loans held for investment, deposits, short-term borrowings and long-term obligations are not reported at fair value. BancShares did not elect to voluntarily report any assets or liabilities at fair value.
102
FIRST CITIZENS BANCSHARES, INC. AND SUBSIDIARIES
NOTES TO CONSOLIDATED FINANCIAL STATEMENTS (Continued)
For assets and liabilities carried at fair value on a recurring basis, the following table provides fair value information as of
December 31, 2013
, and
December 31, 2012
.
|
|
|
Fair value measurements using:
|
|||||||||||||
|
Fair value
|
Level 1
|
Level 2
|
Level 3
|
||||||||||||
|
(dollars in thousands)
|
|||||||||||||||
|
December 31, 2013
|
|||||||||||||||
|
Assets measured at fair value
|
|||||||||||||||
|
Investment securities available for sale
|
|||||||||||||||
|
U.S. Treasury
|
$
|
373,437
|
|
$
|
—
|
|
$
|
373,437
|
|
$
|
—
|
|
|||
|
Government agency
|
2,544,229
|
|
—
|
|
2,544,229
|
|
—
|
|
|||||||
|
Mortgage-backed securities
|
2,446,873
|
|
—
|
|
2,446,873
|
|
—
|
|
|||||||
|
Equity securities
|
22,147
|
|
—
|
|
22,147
|
|
—
|
|
|||||||
|
State, county, municipal
|
187
|
|
—
|
|
187
|
|
—
|
|
|||||||
|
Other
|
830
|
|
—
|
|
830
|
|
—
|
|
|||||||
|
Total
|
$
|
5,387,703
|
|
$
|
—
|
|
$
|
5,387,703
|
|
$
|
—
|
|
|||
|
Liabilities measured at fair value
|
|||||||||||||||
|
Interest rate swaps accounted for as cash flow hedges
|
$
|
7,220
|
|
$
|
—
|
|
$
|
7,220
|
|
$
|
—
|
|
|||
|
December 31, 2012
|
|||||||||||||||
|
Assets measured at fair value
|
|||||||||||||||
|
Investment securities available for sale
|
|||||||||||||||
|
U.S. Treasury
|
$
|
823,632
|
|
$
|
—
|
|
$
|
823,632
|
|
$
|
—
|
|
|||
|
Government agency
|
3,055,204
|
|
—
|
|
3,055,204
|
|
—
|
|
|||||||
|
Mortgage-backed securities
|
1,329,657
|
|
—
|
|
1,329,657
|
|
—
|
|
|||||||
|
Equity securities
|
16,365
|
|
—
|
|
16,365
|
|
—
|
|
|||||||
|
State, county, municipal
|
550
|
|
—
|
|
550
|
|
—
|
|
|||||||
|
Other
|
820
|
|
—
|
|
820
|
|
—
|
|
|||||||
|
Total
|
$
|
5,226,228
|
|
$
|
—
|
|
$
|
5,226,228
|
|
$
|
—
|
|
|||
|
Liabilities measured at fair value
|
|||||||||||||||
|
Interest rate swaps accounted for as cash flow hedges
|
$
|
10,398
|
|
$
|
—
|
|
$
|
10,398
|
|
$
|
—
|
|
|||
During the third quarter of 2013, management reevaluated its fair value leveling methodology and the inputs utilized by the 3rd party pricing services for the current and prior periods. Management concluded that due to the reliance on significant observable inputs, the fair values of its U.S. Treasury, Government agency and other securities should be classified as level 2 rather than the level 1 previously disclosed. Management also concluded that its equity securities should be classified as level 2 rather than the level 1 previously disclosed due to the inactive nature of the markets in which these securities trade.
There were
no
transfers between levels during the years ended
December 31, 2013, and 2012
, other than the reclassification referenced above, which was made for all periods presented.
Certain financial assets and liabilities are carried at fair value on a nonrecurring basis. Loans held for sale are carried at the lower of aggregate cost or fair value and are, therefore, carried at fair value only when fair value is less than the asset cost. Certain impaired loans are also carried at fair value. Noncovered OREO that has been recently remeasured is deemed to be at fair value. For financial assets and liabilities carried at fair value on a nonrecurring basis, the following table provides fair value information as of
December 31, 2013
, and
December 31, 2012
.
103
FIRST CITIZENS BANCSHARES, INC. AND SUBSIDIARIES
NOTES TO CONSOLIDATED FINANCIAL STATEMENTS (Continued)
|
|
|
Fair value measurements using:
|
|||||||||||||
|
Fair value
|
Level 1
|
Level 2
|
Level 3
|
||||||||||||
|
(dollars in thousands)
|
|||||||||||||||
|
December 31, 2013
|
|||||||||||||||
|
Loans held for sale
|
$
|
29,389
|
|
$
|
—
|
|
$
|
29,389
|
|
$
|
—
|
|
|||
|
Originated impaired loans
|
73,517
|
|
—
|
|
—
|
|
73,517
|
|
|||||||
|
Other real estate not covered under loss share agreements remeasured during current year
|
20,526
|
|
—
|
|
—
|
|
20,526
|
|
|||||||
|
Other real estate covered under loss share agreements remeasured during current year
|
37,587
|
|
—
|
|
—
|
|
37,587
|
|
|||||||
|
December 31, 2012
|
|||||||||||||||
|
Loans held for sale
|
65,244
|
|
—
|
|
65,244
|
|
—
|
|
|||||||
|
Originated impaired loans
|
51,644
|
|
—
|
|
—
|
|
51,644
|
|
|||||||
|
Other real estate not covered under loss share agreements remeasured during current year
|
21,113
|
|
—
|
|
—
|
|
21,113
|
|
|||||||
|
Other real estate covered under loss share agreements remeasured during current year
|
59,545
|
|
—
|
|
—
|
|
61,026
|
|
|||||||
The value of loans held for sale are generally based on market prices for loans with similar characteristics or external valuations.
The value of impaired loans is determined by either collateral valuations or discounted present value of the expected cash flow calculations. Collateral values are determined using appraisals or other third-party value estimates of the subject property with discounts generally between 10 and 14 percent applied for estimated holding and selling costs and other external factors that may impact the marketability of the property. Impaired loans are assigned to an asset manager and monitored monthly for significant changes since the last valuation. If significant changes are noted, the asset manager orders a new valuation or adjusts the valuation accordingly. Expected cash flows are determined using expected loss rates developed from historic experience for loans with similar risk characteristics.
OREO is measured and reported at fair value using level 3 inputs for valuations based on unobservable criteria. The values of OREO are determined by collateral valuations. Collateral values are determined using appraisals or other third-party value estimates of the subject property with discounts generally between 10 and 14 percent applied for estimated holding and selling costs and other external factors that may impact the marketability of the property. Changes to the value of the assets between scheduled valuation dates are monitored through continued communication with brokers and monthly reviews by the asset manager assigned to each asset. The asset manager uses the information gathered from brokers and other market sources to identify any significant changes in the market or the subject property as they occur. Valuations are then adjusted or new appraisals are ordered to ensure the reported values reflect the most current information.
No
financial liabilities were carried at fair value on a nonrecurring basis as of
December 31, 2013
, and
December 31, 2012
.
NOTE M
EMPLOYEE BENEFIT PLANS
BancShares sponsors benefit plans for its qualifying employees including a noncontributory defined benefit pension plan, a 401(k) savings plan and an enhanced 401(k) savings plan. These plans are qualified under the Internal Revenue Code. BancShares also maintains agreements with certain executives that provide supplemental benefits that are paid upon death or separation from service at an agreed-upon age.
104
FIRST CITIZENS BANCSHARES, INC. AND SUBSIDIARIES
NOTES TO CONSOLIDATED FINANCIAL STATEMENTS (Continued)
Defined Benefit Pension Plan
Employees who were hired prior to
April 1, 2007
, and who qualify under length of service and other requirements may participate in a noncontributory defined benefit pension plan (Plan). Under the Plan, benefits are based on years of service and average earnings. BancShares made
no
contributions to the plan during
2013
or
2012
, and does not anticipate making any contribution during
2014
.
Obligations and Funded Status
The following table provides the changes in benefit obligation and plan assets and the funded status of the plan at
December 31, 2013, and 2012
.
|
2013
|
2012
|
||||||
|
(dollars in thousands)
|
|||||||
|
Change in benefit obligation
|
|||||||
|
Benefit obligation at January 1
|
$
|
580,938
|
|
$
|
493,648
|
|
|
|
Service cost
|
16,332
|
|
14,241
|
|
|||
|
Interest cost
|
23,686
|
|
23,711
|
|
|||
|
Actuarial (gain) loss
|
(74,060
|
)
|
64,540
|
|
|||
|
Benefits paid
|
(16,218
|
)
|
(15,202
|
)
|
|||
|
Benefit obligation at December 31
|
530,678
|
|
580,938
|
|
|||
|
Change in plan assets
|
|||||||
|
Fair value of plan assets at January 1
|
463,005
|
|
429,505
|
|
|||
|
Actual return on plan assets
|
77,230
|
|
48,702
|
|
|||
|
Employer contributions
|
—
|
|
—
|
|
|||
|
Benefits paid
|
(16,218
|
)
|
(15,202
|
)
|
|||
|
Fair value of plan assets at December 31
|
524,017
|
|
463,005
|
|
|||
|
Funded status at December 31
|
$
|
(6,661
|
)
|
$
|
(117,933
|
)
|
|
The amounts recognized in the consolidated balance sheets as of
December 31, 2013, and 2012
, consist of:
|
2013
|
2012
|
||||||
|
(dollars in thousands)
|
|||||||
|
Other assets
|
$
|
—
|
|
$
|
—
|
|
|
|
Other liabilities
|
(6,661
|
)
|
(117,933
|
)
|
|||
|
Net asset (liability) recognized
|
$
|
(6,661
|
)
|
$
|
(117,933
|
)
|
|
The following table details the amounts recognized in accumulated other comprehensive income at
December 31, 2013, and 2012
:
|
2013
|
2012
|
||||||
|
(dollars in thousands)
|
|||||||
|
Net loss (gain)
|
$
|
16,605
|
|
$
|
157,147
|
|
|
|
Less prior service cost
|
977
|
|
1,187
|
|
|||
|
Accumulated other comprehensive loss, excluding income taxes
|
$
|
17,582
|
|
$
|
158,334
|
|
|
105
FIRST CITIZENS BANCSHARES, INC. AND SUBSIDIARIES
NOTES TO CONSOLIDATED FINANCIAL STATEMENTS (Continued)
The following table provides expected amortization amounts for
2014
.
|
(dollars in thousands)
|
|||
|
Actuarial loss
|
$
|
6,184
|
|
|
Prior service cost
|
210
|
|
|
|
Total
|
$
|
6,394
|
|
The accumulated benefit obligation for the plan at
December 31, 2013, and 2012
, equaled
$448.7 million
and
$485.6 million
, respectively. The Plan uses a measurement date of
December 31
.
The projected benefit obligation exceeded the fair value of plan assets as of
December 31, 2013, and 2012
. The fair value of plan assets exceeded the accumulated benefit obligation as of
December 31, 2013
. The accumulated benefit obligation exceeded the fair value of plan assets as of
December 31, 2012
.
The following table shows the components of periodic benefit cost related to the pension plan and changes in plan assets and benefit obligations recognized in other comprehensive income for the years ended
December 31, 2013, 2012, and 2011
.
|
|
Year ended December 31
|
||||||||||
|
|
2013
|
2012
|
2011
|
||||||||
|
(dollars in thousands)
|
|||||||||||
|
Service cost
|
$
|
16,332
|
|
$
|
14,241
|
|
$
|
13,265
|
|
||
|
Interest cost
|
23,686
|
|
23,711
|
|
23,810
|
|
|||||
|
Expected return on assets
|
(27,733
|
)
|
(28,478
|
)
|
(29,184
|
)
|
|||||
|
Amortization of prior service cost
|
210
|
|
210
|
|
210
|
|
|||||
|
Amortization of net actuarial loss
|
16,985
|
|
11,026
|
|
6,861
|
|
|||||
|
Total net periodic benefit cost
|
29,480
|
|
20,710
|
|
14,962
|
|
|||||
|
Current year actuarial (loss) gain
|
(123,557
|
)
|
44,315
|
|
58,630
|
|
|||||
|
Amortization of actuarial loss
|
(16,985
|
)
|
(11,026
|
)
|
(6,861
|
)
|
|||||
|
Amortization of prior service cost
|
(210
|
)
|
(210
|
)
|
(210
|
)
|
|||||
|
Total recognized in other comprehensive income
|
(140,752
|
)
|
33,079
|
|
51,559
|
|
|||||
|
Total recognized in net periodic benefit cost and other comprehensive income
|
$
|
(111,272
|
)
|
$
|
53,789
|
|
$
|
66,521
|
|
||
The assumptions used to determine the benefit obligations as of
December 31, 2013, and 2012
, are as follows:
|
2013
|
2012
|
||||
|
(dollars in thousands)
|
|||||
|
Discount rate
|
4.90
|
%
|
4.00
|
%
|
|
|
Rate of compensation increase
|
4.00
|
|
4.00
|
|
|
The assumptions used to determine the net periodic benefit cost for the years ended
December 31, 2013, 2012, and 2011
, are as follows:
|
2013
|
2012
|
2011
|
||||||
|
(dollars in thousands)
|
||||||||
|
Discount rate
|
4.00
|
%
|
4.75
|
%
|
5.50
|
%
|
||
|
Rate of compensation increase
|
4.00
|
|
4.00
|
|
4.50
|
|
||
|
Expected long-term return on plan assets
|
7.25
|
|
7.50
|
|
7.75
|
|
||
106
FIRST CITIZENS BANCSHARES, INC. AND SUBSIDIARIES
NOTES TO CONSOLIDATED FINANCIAL STATEMENTS (Continued)
The estimated discount rate, which represents the interest rate that could be obtained for a suitable investment used to fund the benefit obligations, is based on a yield curve developed from high-quality corporate bonds across a full maturity spectrum. The projected cash flows of the pension plan are discounted based on this yield curve and a single discount rate is calculated to achieve the same present value.
The estimated long-term rate of return on plan assets is used to calculate the value of plan assets over time. The methodology utilized to establish the estimated long-term rate of return on plan assets considers the actual return on plan assets for various time horizons since
1999
as a predictor of probable future returns. Historical returns are modified as appropriate by estimates of future market conditions that may positively or negatively affect estimated future returns. The return on plan assets for the
15-year
,
10-year
and
5-year
periods ended
December 31, 2013
, equaled
6.99 percent
,
8.39 percent
and
13.37 percent
, respectively. Based on expectations of modest returns over the next several years, the assumed rate of return for
2013
was
7.25 percent
compared to
7.50 percent
in
2012
.
Plan Assets
BancShares' primary total return objective is to achieve returns that, over the long term, will fund retirement liabilities and provide for the desired plan benefits in a manner that satisfies the fiduciary requirements of the Employee Retirement Income Security Act. The plan assets have a long-term time horizon that runs concurrent with the average life expectancy of the participants. As such, the Plan can assume a time horizon that extends well beyond a full market cycle and can assume a reasonable level of risk. It is expected, however, that both professional investment management and sufficient portfolio diversification will smooth volatility and help to generate a reasonable consistency of return. The investments are broadly diversified among economic sector, industry, quality and size in order to reduce risk and to produce incremental return. Within approved guidelines and restrictions, the investment manager has discretion over the timing and selection of individual investments. Plan assets are currently held by FCB Trust Department.
107
FIRST CITIZENS BANCSHARES, INC. AND SUBSIDIARIES
NOTES TO CONSOLIDATED FINANCIAL STATEMENTS (Continued)
The fair values of pension plan assets at
December 31, 2013, and 2012
, by asset class are as follows:
|
Asset Class
|
Market Value
|
Quoted prices in
Active Markets for Identical Assets (Level 1) |
Significant
Observable Inputs (Level 2) |
Significant
Nonobservable Inputs (Level 3) |
Target Allocation
|
Actual %
of Plan Assets |
||||||||||||||
|
(dollars in thousands)
|
||||||||||||||||||||
|
December 31, 2013
|
||||||||||||||||||||
|
Cash and equivalents
|
$
|
2,517
|
|
$
|
2,517
|
|
$
|
—
|
|
$
|
—
|
|
0 - 1%
|
1
|
%
|
|||||
|
Equity securities
|
55 - 65%
|
62
|
%
|
|||||||||||||||||
|
Large cap
|
218,023
|
|
218,023
|
|
—
|
|
—
|
|
||||||||||||
|
Mid cap
|
10,724
|
|
10,724
|
|
—
|
|
—
|
|
||||||||||||
|
Small cap
|
43,928
|
|
43,928
|
|
—
|
|
—
|
|
||||||||||||
|
International equity (developed)
|
10,535
|
|
10,535
|
|
—
|
|
—
|
|
||||||||||||
|
International equity (emerging)
|
40,643
|
|
40,643
|
|
—
|
|
—
|
|
||||||||||||
|
Fixed income
|
|
|
—
|
|
—
|
|
25-40%
|
28
|
%
|
|||||||||||
|
Investment grade bonds
|
74,501
|
|
—
|
|
74,501
|
|
—
|
|
||||||||||||
|
Intermediate bonds
|
48,746
|
|
—
|
|
48,746
|
|
—
|
|
||||||||||||
|
High-yield corporate bonds
|
10,111
|
|
—
|
|
10,111
|
|
—
|
|
||||||||||||
|
TIPS
|
4,395
|
|
4,395
|
|
—
|
|
—
|
|
||||||||||||
|
International emerging bond
|
10,119
|
|
—
|
|
10,119
|
|
—
|
|
||||||||||||
|
Alternative investments
|
0-10%
|
10
|
%
|
|||||||||||||||||
|
Commodities
|
19,014
|
|
19,014
|
|
—
|
|
—
|
|
||||||||||||
|
Hedge fund composite
|
30,761
|
|
30,761
|
|
|
—
|
|
|||||||||||||
|
Total pension assets
|
$
|
524,017
|
|
$
|
380,540
|
|
$
|
143,477
|
|
$
|
—
|
|
100
|
%
|
||||||
|
December 31, 2012
|
||||||||||||||||||||
|
Cash and equivalents
|
$
|
3,088
|
|
$
|
3,088
|
|
—
|
|
—
|
|
0 - 1%
|
1
|
%
|
|||||||
|
Equity securities
|
55 - 65%
|
56
|
%
|
|||||||||||||||||
|
Large cap
|
172,512
|
|
172,512
|
|
—
|
|
—
|
|
||||||||||||
|
Mid cap
|
21,451
|
|
21,451
|
|
—
|
|
—
|
|
||||||||||||
|
Small cap
|
31,053
|
|
31,053
|
|
—
|
|
—
|
|
||||||||||||
|
International equity (developed)
|
9,537
|
|
9,537
|
|
—
|
|
—
|
|
||||||||||||
|
International equity (emerging)
|
24,276
|
|
24,276
|
|
—
|
|
—
|
|
||||||||||||
|
Fixed income
|
|
|
|
|
|
|
36-44%
|
36
|
%
|
|||||||||||
|
Investment grade bonds
|
71,986
|
|
—
|
|
71,986
|
|
—
|
|
||||||||||||
|
Intermediate bonds
|
59,052
|
|
—
|
|
59,052
|
|
—
|
|
||||||||||||
|
High-yield corporate bonds
|
18,487
|
|
—
|
|
18,487
|
|
—
|
|
||||||||||||
|
TIPS
|
7,613
|
|
7,613
|
|
—
|
|
—
|
|
||||||||||||
|
International emerging bond
|
9,348
|
|
—
|
|
9,348
|
|
—
|
|
||||||||||||
|
Alternative investments
|
|
|
—
|
|
—
|
|
—
|
|
0-8%
|
8
|
%
|
|||||||||
|
Commodities
|
17,376
|
|
17,376
|
|
—
|
|
—
|
|
||||||||||||
|
Hedge fund composite
|
17,226
|
|
17,226
|
|
|
|
—
|
|
||||||||||||
|
Total pension assets
|
$
|
463,005
|
|
$
|
304,132
|
|
$
|
158,873
|
|
$
|
—
|
|
100
|
%
|
||||||
108
FIRST CITIZENS BANCSHARES, INC. AND SUBSIDIARIES
NOTES TO CONSOLIDATED FINANCIAL STATEMENTS (Continued)
Cash Flows
BancShares anticipates making
no
contributions to the pension plan during
2014
. Following are estimated payments to pension plan participants in the indicated periods:
|
Year
|
Projected benefit payments
|
||
|
(dollars in thousands)
|
|||
|
2014
|
$
|
18,070
|
|
|
2015
|
19,662
|
|
|
|
2016
|
21,484
|
|
|
|
2017
|
23,244
|
|
|
|
2018
|
24,937
|
|
|
|
2019-2023
|
150,638
|
|
|
401(k) Savings Plans
Certain employees enrolled in the defined benefit plan are also eligible to participate in a 401(k) savings plan after 31 days of service through deferral of portions of their salary. For employees who participate in the 401(k) savings plan who also continue to accrue additional years of service under the defined benefit plan, based on the employee’s contribution, BancShares matches up to
75 percent
of the employee contribution.
At the end of
2007
, current employees were given the option to continue to accrue additional years of service under the defined benefit plan or to elect to join an enhanced 401(k) savings plan. Under the enhanced 401(k) savings plan, based on the employee’s contribution, BancShares matches up to 100 percent of the employee contribution. In addition to the employer match of the employee contributions, the enhanced 401(k) savings plan provides a guaranteed contribution to plan participants if they remain employed at the end of each calendar year. Employees who elected to enroll in the enhanced 401(k) savings plan discontinued the accrual of additional years of service under the defined benefit plan and became enrolled in the enhanced 401(k) savings plan effective
January 1, 2008
. Eligible employees hired after
January 1, 2008
, have the option to elect to participate in the enhanced 401(k) savings plan.
BancShares made participating contributions to both 401(k) plans totaling
$14.9 million
,
$14.1 million
and
$13.6 million
during
2013, 2012 and 2011
, respectively.
Additional Benefits for Executives and Directors and Officers of Acquired Entities
FCB has entered into contractual agreements with certain executives that provide payments for a period of ten years following separation from service at an agreed-upon age. These agreements also provide a death benefit in the event a participant dies before the term of the agreement ends. FCB has also assumed liability for contractual obligations to directors and officers of previously-acquired entities.
109
FIRST CITIZENS BANCSHARES, INC. AND SUBSIDIARIES
NOTES TO CONSOLIDATED FINANCIAL STATEMENTS (Continued)
The following table provides the accrued liability as of
December 31, 2013, and 2012
, and the changes in the accrued liability during the years then ended:
|
2013
|
2012
|
||||||
|
(dollars in thousands)
|
|||||||
|
Present value of accrued liability as of January 1
|
$
|
25,851
|
|
$
|
25,586
|
|
|
|
Benefit expense
|
959
|
|
462
|
|
|||
|
Benefits paid
|
(3,042
|
)
|
(3,241
|
)
|
|||
|
Benefits forfeited
|
—
|
|
554
|
|
|||
|
Interest cost
|
192
|
|
2,490
|
|
|||
|
Present value of accrued liability as of December 31
|
$
|
23,960
|
|
$
|
25,851
|
|
|
|
Discount rate at December 31
|
4.90
|
%
|
4.00
|
%
|
|||
NOTE N
OTHER NONINTEREST INCOME AND OTHER NONINTEREST EXPENSE
Recoveries of acquired loans previously charged off are included within other noninterest income. These recoveries totaled
$29.7 million
,
$10.5 million
and
$13.5 million
for years ended
December 31, 2013, 2012, and 2011
, respectively.
Other noninterest expense for the years ended
December 31, 2013, 2012, and 2011
, included the following:
|
2013
|
2012
|
2011
|
|||||||||
|
(dollars in thousands)
|
|||||||||||
|
Cardholder processing
|
$
|
9,892
|
|
$
|
11,816
|
|
$
|
11,418
|
|
||
|
Merchant processing
|
35,279
|
|
33,313
|
|
37,196
|
|
|||||
|
Collection
|
21,209
|
|
25,591
|
|
23,237
|
|
|||||
|
Processing fees paid to third parties
|
15,095
|
|
14,454
|
|
16,336
|
|
|||||
|
Cardholder reward programs
|
10,154
|
|
4,325
|
|
11,780
|
|
|||||
|
Telecommunications
|
10,033
|
|
11,131
|
|
12,131
|
|
|||||
|
Consultant
|
9,740
|
|
3,915
|
|
3,021
|
|
|||||
|
Advertising
|
8,286
|
|
3,897
|
|
7,957
|
|
|||||
|
Other
|
73,700
|
|
71,369
|
|
81,860
|
|
|||||
|
Total other noninterest expense
|
$
|
193,388
|
|
$
|
179,811
|
|
$
|
204,936
|
|
||
110
FIRST CITIZENS BANCSHARES, INC. AND SUBSIDIARIES
NOTES TO CONSOLIDATED FINANCIAL STATEMENTS (Continued)
NOTE O
INCOME TAXES
At
December 31
, income tax expense consisted of the following:
|
2013
|
2012
|
2011
|
|||||||||
|
(dollars in thousands)
|
|||||||||||
|
Current tax expense
|
|||||||||||
|
Federal
|
$
|
41,996
|
|
$
|
85,875
|
|
$
|
108,639
|
|
||
|
State
|
7,080
|
|
9,212
|
|
23,101
|
|
|||||
|
Total current tax expense
|
49,076
|
|
95,087
|
|
131,740
|
|
|||||
|
Deferred tax expense (benefit)
|
|||||||||||
|
Federal
|
38,974
|
|
(27,344
|
)
|
(12,127
|
)
|
|||||
|
State
|
8,915
|
|
(7,921
|
)
|
(4,510
|
)
|
|||||
|
Total deferred tax expense (benefit)
|
47,889
|
|
(35,265
|
)
|
(16,637
|
)
|
|||||
|
Total income tax expense
|
$
|
96,965
|
|
$
|
59,822
|
|
$
|
115,103
|
|
||
Income tax expense differed from the amounts computed by applying the federal income tax rate of
35 percent
to pretax income as a result of the following:
|
2013
|
2012
|
2011
|
|||||||||
|
(dollars in thousands)
|
|||||||||||
|
Income taxes at statutory rates
|
$
|
92,633
|
|
$
|
67,959
|
|
$
|
108,546
|
|
||
|
Increase (reduction) in income taxes resulting from:
|
|||||||||||
|
Nontaxable income on loans, leases and investments, net of nondeductible expenses
|
(1,185
|
)
|
(1,309
|
)
|
(1,481
|
)
|
|||||
|
State and local income taxes, including change in valuation allowance, net of federal income tax benefit
|
10,397
|
|
839
|
|
12,084
|
|
|||||
|
Tax credits
|
(5,569
|
)
|
(7,279
|
)
|
(5,166
|
)
|
|||||
|
Other, net
|
689
|
|
(388
|
)
|
1,120
|
|
|||||
|
Total income tax expense
|
$
|
96,965
|
|
$
|
59,822
|
|
$
|
115,103
|
|
||
During the third quarter of 2013, BancShares adjusted its net deferred tax asset as a result of reductions in the North Carolina corporate income tax rate that were enacted July 23, 2013, and will become effective January 1, 2014, and January 1, 2015. The lower corporate income tax rate resulted in a reduction in the deferred tax asset and an increase in current period income tax expense. The lower effective tax rate for 2012 also reflects the impact of a
$6.4 million
credit to income tax expense resulting from the favorable outcome of state tax audits for the period
2008-2010
, net of additional federal taxes.
111
FIRST CITIZENS BANCSHARES, INC. AND SUBSIDIARIES
NOTES TO CONSOLIDATED FINANCIAL STATEMENTS (Continued)
The net deferred tax asset included the following components at
December 31
:
|
2013
|
2012
|
||||||
|
(dollars in thousands)
|
|||||||
|
Allowance for loan and lease losses
|
$
|
90,790
|
|
$
|
124,928
|
|
|
|
Pension liability
|
2,593
|
|
46,178
|
|
|||
|
Executive separation from service agreements
|
9,940
|
|
10,123
|
|
|||
|
State operating loss carryforward
|
79
|
|
652
|
|
|||
|
Unrealized loss on cash flow hedge
|
2,786
|
|
4,106
|
|
|||
|
Net unrealized loss on securities included in accumulated other comprehensive loss
|
6,541
|
|
—
|
|
|||
|
Other
|
17,884
|
|
19,465
|
|
|||
|
Deferred tax asset
|
130,613
|
|
205,452
|
|
|||
|
Accelerated depreciation
|
6,226
|
|
12,465
|
|
|||
|
Lease financing activities
|
10,216
|
|
10,366
|
|
|||
|
Net unrealized gains on securities included in accumulated other comprehensive loss
|
—
|
|
13,292
|
|
|||
|
Net deferred loan fees and costs
|
4,115
|
|
3,714
|
|
|||
|
Intangible asset
|
11,929
|
|
11,897
|
|
|||
|
Gain on FDIC-assisted transactions, deferred for tax purposes
|
57,895
|
|
29,694
|
|
|||
|
Other
|
6,352
|
|
5,373
|
|
|||
|
Deferred tax liability
|
96,733
|
|
86,801
|
|
|||
|
Net deferred tax asset
|
$
|
33,880
|
|
$
|
118,651
|
|
|
No valuation allowance was necessary as of
December 31, 2013
, to reduce BancShares’ gross state deferred tax asset to the amount that is more likely than not to be realized.
BancShares and its subsidiaries' federal income tax returns for 2010 through 2012 remain open for examination. Generally, the state jurisdictions in which BancShares files income tax returns are subject to examination for a period up to four years after returns are filed.
Under GAAP, the benefit of a position taken or expected to be taken in a tax return should be recognized when it is more likely than not that the position will be sustained based on its technical merit. The liability for unrecognized tax benefits was not material at
December 31, 2013, and 2012
, and changes in the liability were not material during
2013, 2012 and 2011
. BancShares does not expect the liability for unrecognized tax benefits to change significantly during
2014
. BancShares recognizes interest and penalties, if any, related to income tax matters in income tax expense, and the amounts recognized during
2013, 2012 and 2011
were not material.
112
FIRST CITIZENS BANCSHARES, INC. AND SUBSIDIARIES
NOTES TO CONSOLIDATED FINANCIAL STATEMENTS (Continued)
NOTE P
TRANSACTIONS WITH RELATED PERSONS
BancShares and FCB have had, and expect to have in the future, banking transactions in the ordinary course of business with directors, officers and their associates (Related Persons) and entities that are controlled by Related Persons.
For those identified as Related Persons as of
December 31, 2013
, the following table provides an analysis of changes in the loans outstanding during
2013
:
|
(dollars in thousands)
|
|||
|
Balance at January 1, 2013
|
$
|
1,311
|
|
|
New loans
|
605
|
|
|
|
Repayments
|
(91
|
)
|
|
|
Balance at December 31, 2013
|
$
|
1,825
|
|
Unfunded loan commitments available to Related Persons totaled
$5.5 million
and
$4.4 million
as of
December 31, 2013, and 2012
, respectively.
During
2013, 2012 and 2011
, fees from processing services included
$21.6 million
,
$33.7 million
and
$34.5 million
, respectively, for services rendered to entities controlled by Related Persons. The amounts recorded from the largest individual institution totaled
$20.4 million
,
$22.8 million
and
$23.5 million
for
2013, 2012 and 2011
, respectively. Prior to 2013, BancShares provided various processing and operational services to other financial institutions, some of which are controlled by Related Persons. During the first quarter of 2013, BancShares sold its rights and most of its obligations under various service agreements with client banks, including two banks that are controlled by Related Persons. BancShares retained the processing services relationship with the largest client bank, which is controlled by Related Persons.
Investment securities available for sale include an investment in a financial institution controlled by Related Persons. This investment had a carrying value of
$21.6 million
and
$16.1 million
at
December 31, 2013, and 2012
, respectively. The investment had a cost of
$452,000
at
December 31, 2013
, and
$452,000
at
December 31, 2012
.
NOTE Q
DERIVATIVE
At
December 31, 2013
, BancShares had an interest rate swap that qualifies as a cash flow hedge under GAAP. For all periods presented, the fair value of the outstanding derivative is included in other liabilities in the consolidated balance sheets, and the net change in fair value is included in the consolidated statements of cash flows under the caption net change in other liabilities.
The following table provides the notional amount of the interest rate swap and the fair value of the liability as of
December 31, 2013, and 2012
.
|
|
December 31, 2013
|
December 31, 2012
|
|||||||||||||
|
|
Notional
amount
|
Estimated fair value of liability
|
Notional
amount
|
Estimated fair value of liability
|
|||||||||||
|
(dollars in thousands)
|
|||||||||||||||
|
2011 interest rate swap hedging variable rate exposure on trust preferred securities 2011-2016
|
$
|
93,500
|
|
$
|
7,220
|
|
$
|
93,500
|
|
$
|
10,398
|
|
|||
113
FIRST CITIZENS BANCSHARES, INC. AND SUBSIDIARIES
NOTES TO CONSOLIDATED FINANCIAL STATEMENTS (Continued)
The interest rate swap is used for interest rate risk management purposes and converts variable-rate exposure on outstanding debt to a fixed rate. The interest rate swap has a notional amount of
$93.5 million
, representing the amount of variable rate trust preferred capital securities issued during 2006 and still outstanding at the swap inception date. The interest rate swap hedges interest payments through June 2016 and requires fixed-rate payments by BancShares at
5.50 percent
in exchange for variable-rate payments of
175
basis points above the three-month LIBOR, which is equal to the interest paid to the holders of the trust preferred capital securities. Settlement of the swap occurs quarterly. As of
December 31, 2013, and 2012
, collateral with a fair value of
$7.0 million
and
$9.7 million
, respectively, was pledged to secure the existing obligation under the interest rate swap.
For cash flow hedges, the effective portion of the gain or loss due to changes in the fair value of the derivative hedging instrument is included in other comprehensive income (loss), while the ineffective portion, representing the excess of the cumulative change in the fair value of the derivative over the cumulative change in expected future discounted cash flows on the hedged transaction, is recorded in the consolidated income statement. BancShares’ interest rate swap has been fully effective since inception. Therefore, changes in the fair value of the interest rate swap have had no impact on net income. For the years ended
December 31, 2013, 2012, and 2011
, BancShares recognized interest expense of
$3.3 million
,
$3.1 million
and
$4.6 million
, respectively, resulting from incremental interest paid to the interest rate swap counterparty, none of which related to ineffectiveness.
The estimated net amount in accumulated other comprehensive loss at
December 31, 2013
, that is expected to be reclassified into earnings within the next 12 months is a net after-tax loss of
$1.9 million
.
BancShares monitors the credit risk of the interest rate swap counterparty.
NOTE R
GOODWILL AND INTANGIBLE ASSETS
There was no goodwill activity during
2013
and
2012
. Goodwill totaled
$102.6 million
at
December 31, 2013, and 2012
, with no impairment recorded during
2013, 2012 and 2011
.
GAAP requires that goodwill be tested each year to determine if goodwill is impaired. The goodwill impairment test requires a two-step method to evaluate and calculate impairment. The first step requires estimation of the reporting unit’s fair value. If the fair value exceeds the carrying value, no further testing is required. If the carrying value exceeds the fair value, a second step is performed to determine whether an impairment charge must be recorded and, if so, the amount of such charge.
BancShares performs annual impairment tests as of
July 31
each year. After the first step for
2013
and
2012
, no further analysis was required as there was no indication of impairment.
The following information relates to other intangible assets, all of which are being amortized over their estimated useful lives:
|
2013
|
2012
|
||||||
|
(dollars in thousands)
|
|||||||
|
Balance at January 1
|
$
|
3,556
|
|
$
|
7,032
|
|
|
|
Amortization
|
(2,309
|
)
|
(3,476
|
)
|
|||
|
Balance at December 31
|
$
|
1,247
|
|
$
|
3,556
|
|
|
114
FIRST CITIZENS BANCSHARES, INC. AND SUBSIDIARIES
NOTES TO CONSOLIDATED FINANCIAL STATEMENTS (Continued)
Intangible assets generated by FDIC-assisted transactions, which represent the estimated fair value of core deposits and other customer relationships that were acquired, are being amortized over a
four
-year life on an accelerated basis. The gross amount of other intangible assets and accumulated amortization as of
December 31, 2013, and 2012
, are:
|
2013
|
2012
|
||||||
|
(dollars in thousands)
|
|||||||
|
Gross balance
|
$
|
18,966
|
|
$
|
18,966
|
|
|
|
Accumulated amortization
|
(17,719
|
)
|
(15,410
|
)
|
|||
|
Carrying value
|
$
|
1,247
|
|
$
|
3,556
|
|
|
Based on current estimated useful lives and carrying values, BancShares anticipates amortization expense for intangible assets in subsequent periods will be:
|
Year
|
Amortization expense
|
||
|
(dollars in thousands)
|
|||
|
2014
|
$
|
1,122
|
|
|
2015
|
125
|
|
|
|
$
|
1,247
|
|
|
NOTE S
SHAREHOLDERS' EQUITY, DIVIDEND RESTRICTIONS AND OTHER REGULATORY MATTERS
Various regulatory agencies have established guidelines that evaluate capital adequacy based on risk-weighted adjusted assets. An additional capital computation evaluates tangible capital based on tangible assets. Minimum capital requirements currently set forth by the regulatory agencies require a tier 1 capital ratio of no less than
4 percent
of risk-weighted assets, a total capital ratio of no less than
8 percent
of risk-weighted assets and a leverage capital ratio of no less than
3 percent
of tangible assets. To meet the FDIC’s well-capitalized standards, the tier 1 and total capital ratios must be at least
6 percent
and
10 percent
, respectively, while the leverage ratio must equal
5 percent
. Failure to meet minimum capital requirements may result in certain actions by regulators that could have a direct material effect on the consolidated financial statements.
Based on the most recent notifications from its regulators, FCB is well-capitalized under the regulatory framework for prompt corrective action. Management believes that as of
December 31, 2013
, BancShares and FCB met all capital adequacy requirements to which they are subject and was not aware of any conditions or events that would affect FCB’s well-capitalized status.
Following is an analysis of capital ratios for BancShares and FCB as of
December 31, 2013, and 2012
:
|
December 31, 2013
|
December 31, 2012
|
||||||||||||||||||
|
Amount
|
Ratio
|
Requirements to be well-capitalized
|
Amount
|
Ratio
|
Requirements to be well-capitalized
|
||||||||||||||
|
(dollars in thousands)
|
|||||||||||||||||||
|
BancShares
|
|||||||||||||||||||
|
Tier 1 capital
|
$
|
2,109,139
|
|
14.92
|
%
|
6.00
|
%
|
$
|
1,949,985
|
|
14.27
|
%
|
6.00
|
%
|
|||||
|
Total capital
|
2,320,792
|
|
16.42
|
%
|
10.00
|
%
|
2,179,370
|
|
15.95
|
%
|
10.00
|
%
|
|||||||
|
Leverage capital
|
2,109,139
|
|
9.82
|
%
|
5.00
|
%
|
1,949,985
|
|
9.23
|
%
|
5.00
|
%
|
|||||||
|
FCB
|
|||||||||||||||||||
|
Tier 1 capital
|
1,983,349
|
|
14.14
|
%
|
6.00
|
%
|
1,942,101
|
|
14.37
|
%
|
6.00
|
%
|
|||||||
|
Total capital
|
2,184,461
|
|
15.57
|
%
|
10.00
|
%
|
2,163,034
|
|
16.00
|
%
|
10.00
|
%
|
|||||||
|
Leverage capital
|
1,983,349
|
|
9.36
|
%
|
5.00
|
%
|
1,942,101
|
|
9.34
|
%
|
5.00
|
%
|
|||||||
115
FIRST CITIZENS BANCSHARES, INC. AND SUBSIDIARIES
NOTES TO CONSOLIDATED FINANCIAL STATEMENTS (Continued)
As of
December 31, 2013
, BancShares had
$93.5 million
of trust preferred capital securities included in tier 1 capital. Beginning
January 1, 2015
,
75 percent
of BancShares' trust preferred capital securities will be excluded from tier 1 capital, with the remaining
25 percent
phased out
January 1, 2016
. Elimination of all trust preferred capital securities from the
December 31, 2013
, capital structure would result in a proforma tier 1 leverage capital ratio of
9.38 percent
, a tier 1 risk-based capital ratio of
14.26 percent
and a total risk-based capital ratio of
15.76 percent
. On a proforma basis assuming disallowance of all trust preferred capital securities, BancShares and FCB continue to remain well-capitalized under current regulatory guidelines.
Tier 2 capital of BancShares and FCB includes qualifying subordinated debt that was issued in 2005 with a scheduled maturity date of June 1, 2015. Under current regulatory guidelines, when subordinated debt is within five years of its scheduled maturity date, issuers must discount the amount included in tier 2 capital by 20 percent for each year until the debt matures. The amount of subordinated debt that qualifies as tier 2 capital totaled
$25.0 million
as of
December 31, 2013
, compared to
$50.0 million
at
December 31, 2012
. Subordinated debt will be completely removed from tier 2 capital in the second quarter of 2014, one year prior to the scheduled maturity of the subordinated debt.
In July 2013, Bank regulatory agencies approved new global regulatory capital guidelines (Basel) aimed at strengthening existing capital requirements for bank holding companies through a combination of higher minimum capital requirements, new capital conservation buffers and more conservative definitions of capital and balance sheet exposure. When fully implemented in January 2019, the rule includes a minimum ratio of common equity tier 1 capital to risk-weighted assets of 4.5 percent and a common equity tier 1 capital conservation buffer of 2.5 percent of risk-weighted assets, totaling 7 percent. The rule also raises the minimum ratio of tier 1 capital to risk-weighted assets from 4 percent to 6 percent and includes a minimum leverage ratio of 4 percent.
Additionally, trust preferred securities and cumulative preferred securities are required to be phased out of tier 1 capital by 2016. The inclusion of accumulated other comprehensive income in tier 1 common equity, as described in the proposed rules, is only applicable for institutions larger than $50 billion in assets.
Management continues to monitor Basel developments and remains committed to managing capital levels in a prudent manner. BancShares' tier 1 common equity ratio based on the current tier 1 capital and risk-weighted assets calculations, excluding trust preferred securities, is
14.26 percent
at
December 31, 2013
, compared to the fully phased-in Federal Reserve standards of
7.00 percent
.
BancShares has two classes of common stock—Class A common and Class B common. Shares of Class A common have
one
vote per share, while shares of Class B common have
16
votes per share.
During the second quarter of 2013, BancShares' board granted authority to purchase up to
100,000
and
25,000
shares of Class A and Class B common stock, respectively, beginning on July 1, 2013, and continuing through June 30, 2014. As of
December 31, 2013
,
no
purchases had occurred pursuant to that authorization.
During 2012, the Board of Directors granted authority to purchase up to
100,000
and
25,000
shares of Class A and Class B common stock, respectively, during the period from July 1, 2012, through June 30, 2013. That authority replaced similar plans approved by the Board during 2011 that were in effect during the twelve months preceding July 1, 2012. Pursuant to those plans, during 2012, BancShares purchased and retired an aggregate of
56,276
shares of Class A common stock and
100
shares of Class B common stock.
Additionally, pursuant to separate authorizations, during 2012, BancShares purchased and retired
606,829
shares of Class B common stock in privately negotiated transactions, including purchases of
593,954
shares during December 2012 from a director and certain of her related interests. The December 2012 stock purchase was approved by BancShares' independent directors, after review and recommendation by a special committee of independent directors.
The Board of Directors of FCB may declare a dividend on a portion of its undivided profits as it deems appropriate, subject to the requirements of the FDIC and the General Statutes of North Carolina, without prior regulatory approval. As of
December 31, 2013
, the amount was
$1.41 billion
. However, to preserve its well-capitalized status, the maximum amount of the dividend was limited to
$781.3 million
. Dividends declared by FCB amounted to
$131.0 million
in
2013
,
$179.6 million
in
2012
and
$82.8 million
in
2011
.
116
FIRST CITIZENS BANCSHARES, INC. AND SUBSIDIARIES
NOTES TO CONSOLIDATED FINANCIAL STATEMENTS (Continued)
BancShares and FCB are subject to various requirements imposed by state and federal banking statutes and regulations, including regulations requiring the maintenance of noninterest-bearing reserve balances at the Federal Reserve Bank. Banks are allowed to reduce the required balances by the amount of vault cash. For
2013
, the requirements averaged
$313.4 million
.
NOTE T
COMMITMENTS AND CONTINGENCIES
To meet the financing needs of its customers, BancShares and its subsidiaries have financial instruments with off-balance sheet risk. These financial instruments include commitments to extend credit, standby letters of credit and recourse obligations on mortgage loans sold. These instruments involve elements of credit, interest rate or liquidity risk.
Commitments to extend credit are legally binding agreements to lend to customers. Commitments generally have fixed expiration dates or other termination clauses and may require payment of fees. Since many of the commitments are expected to expire without being drawn upon, the total commitment amounts do not necessarily represent future liquidity requirements. Established credit standards control the credit risk exposure associated with these commitments. In some cases, BancShares requires that collateral be pledged to secure the commitment, including cash deposits, securities and other assets. At
December 31, 2013
, BancShares had unused commitments totaling
$5.84 billion
, compared to
$5.47 billion
at
December 31, 2012
.
Standby letters of credit are commitments guaranteeing performance of a customer to a third party. Those guarantees are issued primarily to support public and private borrowing arrangements. To minimize its exposure, BancShares’ credit policies govern the issuance of standby letters of credit. At
December 31, 2013
, and
2012
, BancShares had standby letters of credit amounting to
$54.8 million
and
$63.1 million
, respectively. The credit risk related to the issuance of these letters of credit is essentially the same as that involved in extending loans to clients and, therefore, these letters of credit are collateralized when necessary.
Residential mortgage loans are sold with standard representations and warranties relating to documentation and underwriting requirements for the loans. If deficiencies are discovered at any point in the life of the loan, the investor may require BancShares to repurchase the loan. As of
December 31, 2013
, and
2012
, other liabilities included a reserve of
$3.6 million
and
$4.1 million
, respectively, for estimated losses arising from the repurchase of loans under these provisions.
In addition to standard representations and warranties, residential mortgage loans sold with limited recourse liability represent guarantees to repurchase the loans or repay a portion of the sale proceeds in the event of nonperformance by the borrower. The recourse period is generally
120
days or fewer after sale. At
December 31, 2013
, and
2012
, BancShares has sold loans of approximately
$156.1 million
and
$205.9 million
, respectively, for which the recourse period had not yet elapsed.
BancShares has recorded a receivable from the FDIC for the expected reimbursement of losses on assets covered under the various loss share agreements. These loss share agreements impose certain obligations on us that, in the event of noncompliance, could result in the delay or disallowance of some or all of our rights under those agreements. Requests for reimbursement are subject to FDIC review and may be delayed or disallowed for noncompliance. The loss share agreements are subject to interpretation by both the FDIC and FCB, and disagreements may arise regarding coverage of losses, expenses and contingencies.
The loss share agreements for four FDIC-assisted transactions include provisions related to contingent payments that may be owed to the FDIC at the termination of the agreements (clawback liability)
.
The clawback liability represents an estimated payment by BancShares to the FDIC if actual cumulative losses on acquired covered assets are lower than the cumulative losses originally estimated by the FDIC at the time of acquisition. The clawback liability is estimated by discounting estimated future payments and is recorded in the Consolidated Balance Sheets as a payable to the FDIC for loss share agreements. As of
December 31, 2013
, and
2012
, the clawback liability was
$109.4 million
and
$101.6 million
, respectively.
BancShares and various subsidiaries have been named as defendants in legal actions arising from their normal business activities in which damages in various amounts are claimed. BancShares is also exposed to litigation risk relating to the prior business activities of banks from which assets were acquired and liabilities assumed in the various FDIC-assisted transactions. Although the amount of any ultimate liability with respect to such matters cannot be determined, in the opinion of management, any such liability will not have a material effect on BancShares’ consolidated financial statements.
117
FIRST CITIZENS BANCSHARES, INC. AND SUBSIDIARIES
NOTES TO CONSOLIDATED FINANCIAL STATEMENTS (Continued)
NOTE U
ACCUMULATED OTHER COMPREHENSIVE INCOME (LOSS)
Accumulated other comprehensive income (loss) included the following as of
December 31, 2013
, and
December 31, 2012
:
|
|
December 31, 2013
|
December 31, 2012
|
|||||||||||||||||||||
|
|
Accumulated
other
comprehensive
loss
|
Deferred
tax
benefit
|
Accumulated
other
comprehensive
loss,
net of tax
|
Accumulated
other
comprehensive
income (loss)
|
Deferred
tax
expense
(benefit)
|
Accumulated
other
comprehensive
income (loss),
net of tax
|
|||||||||||||||||
|
(dollars in thousands)
|
|||||||||||||||||||||||
|
Unrealized (losses) gains on investment securities available for sale
|
$
|
(16,632
|
)
|
$
|
(6,541
|
)
|
$
|
(10,091
|
)
|
$
|
33,809
|
|
$
|
13,292
|
|
$
|
20,517
|
|
|||||
|
Unrealized loss on cash flow hedge
|
(7,220
|
)
|
(2,786
|
)
|
(4,434
|
)
|
(10,398
|
)
|
(4,106
|
)
|
(6,292
|
)
|
|||||||||||
|
Funded status of defined benefit plan
|
(17,582
|
)
|
(6,839
|
)
|
(10,743
|
)
|
(158,334
|
)
|
(62,003
|
)
|
(96,331
|
)
|
|||||||||||
|
Total
|
$
|
(41,434
|
)
|
$
|
(16,166
|
)
|
$
|
(25,268
|
)
|
$
|
(134,923
|
)
|
$
|
(52,817
|
)
|
$
|
(82,106
|
)
|
|||||
The following table highlights changes in accumulated other comprehensive income (loss) by component for the years ended
December 31, 2013
, and
2012
:
|
Unrealized gains and losses on available-for-sale securities
1
|
Gains and losses on cash flow hedges
1
|
Defined benefit pension items
1
|
Total
|
||||||||||||
|
(dollars in thousands)
|
|||||||||||||||
|
Balance at January 1, 2012
|
$
|
16,115
|
|
$
|
(6,483
|
)
|
$
|
(76,206
|
)
|
$
|
(66,574
|
)
|
|||
|
Other comprehensive income (loss) before reclassifications
|
5,807
|
|
(1,682
|
)
|
(26,961
|
)
|
(22,836
|
)
|
|||||||
|
Amounts reclassified from accumulated other comprehensive income (loss)
|
(1,405
|
)
|
1,873
|
|
6,836
|
|
7,304
|
|
|||||||
|
Net current period other comprehensive income (loss)
|
4,402
|
|
191
|
|
(20,125
|
)
|
(15,532
|
)
|
|||||||
|
Balance at December 31, 2012
|
20,517
|
|
(6,292
|
)
|
(96,331
|
)
|
(82,106
|
)
|
|||||||
|
Other comprehensive income (loss) before reclassifications
|
(30,608
|
)
|
(60
|
)
|
75,082
|
|
44,414
|
|
|||||||
|
Amounts reclassified from accumulated other comprehensive loss
|
—
|
|
1,918
|
|
10,506
|
|
12,424
|
|
|||||||
|
Net current period other comprehensive income (loss)
|
(30,608
|
)
|
1,858
|
|
85,588
|
|
56,838
|
|
|||||||
|
Balance at December 31, 2013
|
$
|
(10,091
|
)
|
$
|
(4,434
|
)
|
$
|
(10,743
|
)
|
$
|
(25,268
|
)
|
|||
1
All amounts are net of tax. Amounts in parentheses indicate debits.
118
FIRST CITIZENS BANCSHARES, INC. AND SUBSIDIARIES
NOTES TO CONSOLIDATED FINANCIAL STATEMENTS (Continued)
|
Details about accumulated other comprehensive loss
|
Amount reclassified from accumulated other comprehensive loss
1
|
Affected line item in the statement where net income is presented
|
||||
|
(dollars in thousands)
|
||||||
|
Year ended December 31, 2013
|
||||||
|
Unrealized gains and losses on available for sale securities
|
||||||
|
$
|
—
|
|
Securities gains (losses)
|
|||
|
—
|
|
Income taxes
|
||||
|
$
|
—
|
|
Net income
|
|||
|
Gains and losses on cash flow hedges
|
||||||
|
Interest rate swap contracts
|
$
|
(3,281
|
)
|
Long-term obligations
|
||
|
1,363
|
|
Income taxes
|
||||
|
$
|
(1,918
|
)
|
Net income
|
|||
|
Amortization of defined benefit pension items
|
||||||
|
Prior service costs
|
$
|
(210
|
)
|
Employee benefits
|
||
|
Actuarial losses
|
(16,985
|
)
|
Employee benefits
|
|||
|
(17,195
|
)
|
Income before income taxes
|
||||
|
6,689
|
|
Income taxes
|
||||
|
$
|
(10,506
|
)
|
Net income
|
|||
|
Total reclassifications for the period
|
$
|
(12,424
|
)
|
|||
|
Year ended December 31, 2012
|
||||||
|
Unrealized gains and losses on available for sale securities
|
||||||
|
$
|
2,322
|
|
Securities gains (losses)
|
|||
|
(917
|
)
|
Income taxes
|
||||
|
$
|
1,405
|
|
Net income
|
|||
|
Gains and losses on cash flow hedges
|
||||||
|
Interest rate swap contracts
|
$
|
(3,095
|
)
|
Long-term obligations
|
||
|
1,222
|
|
Income taxes
|
||||
|
$
|
(1,873
|
)
|
Net income
|
|||
|
Amortization of defined benefit pension items
|
||||||
|
Prior service costs
|
$
|
(210
|
)
|
Employee benefits
|
||
|
Actuarial losses
|
(11,026
|
)
|
Employee benefits
|
|||
|
(11,236
|
)
|
Income before income taxes
|
||||
|
4,400
|
|
Income taxes
|
||||
|
$
|
(6,836
|
)
|
Net income
|
|||
|
Total reclassifications for the period
|
$
|
(7,304
|
)
|
|||
1
Amounts in parentheses indicate debits to profit/loss.
119
FIRST CITIZENS BANCSHARES, INC. AND SUBSIDIARIES
NOTES TO CONSOLIDATED FINANCIAL STATEMENTS (Continued)
NOTE V
SUBSEQUENT EVENTS
On January 1, 2014, FCB completed its merger with 1st Financial Services Corporation (1st Financial) of Hendersonville, NC and its wholly-owned subsidiary, Mountain 1st Bank & Trust Company (Mountain 1st). The merger allows FCB to expand its presence in Western North Carolina. Mountain 1st had 12 branches located in Asheville, Brevard, Columbus, Etowah, Fletcher, Forest City, Hendersonville, Hickory, Marion, Shelby and Waynesville. Following the merger, FCB applied for permission to close seven Mountain 1st branches due to their proximity to existing FCB branches. Once regulatory approvals have been received, customers have been notified and waiting periods have expired, Mountain 1st branches in Asheville, Brevard, Fletcher, Forest City, Hendersonville, Hickory and Marion will be closed, and customer relationships assigned to those branches will be transferred to the nearest FCB branch.
First Citizens paid
$10.0 million
to acquire 1st Financial, including payments of
$8.0 million
to the U.S. Treasury to satisfy 1st Financial's Troubled Asset Relief Program (TARP) obligation and
$2.0 million
paid to the shareholders of 1st Financial.
The 1st Financial merger was accounted for under the acquisition method of accounting. The purchased assets, assumed liabilities and identifiable intangible assets were recorded at their acquisition date estimated fair values. Fair values are subject to refinement for up to one year after the closing date of the transaction as additional information regarding closing date fair values becomes available.
120
FIRST CITIZENS BANCSHARES, INC. AND SUBSIDIARIES
NOTES TO CONSOLIDATED FINANCIAL STATEMENTS (Continued)
The following table provides the carrying value of acquired assets and assumed liabilities, as recorded by 1st Financial, the fair value adjustments calculated at the time of the acquisition, and the resulting fair value recorded by FCB.
|
January 1, 2014
|
|||||||||||
|
As recorded by
1st Financial |
Fair value adjustments
|
As recorded by FCB
|
|||||||||
|
(dollars in thousands)
|
|||||||||||
|
Assets
|
|||||||||||
|
Cash and cash equivalents
|
$
|
28,194
|
|
$
|
—
|
|
$
|
28,194
|
|
||
|
Investment securities available for sale
|
246,890
|
|
(9,452
|
)
|
237,438
|
|
|||||
|
Loans held for sale
|
1,183
|
|
—
|
|
1,183
|
|
|||||
|
Restricted equity securities
|
3,105
|
|
671
|
|
3,776
|
|
|||||
|
Loans
|
338,170
|
|
(21,843
|
)
|
316,327
|
|
|||||
|
Less: allowance for loan losses
|
(7,796
|
)
|
7,796
|
|
—
|
|
|||||
|
Premises and equipment
|
3,871
|
|
(1,185
|
)
|
2,686
|
|
|||||
|
Other real estate owned
|
12,896
|
|
(1,305
|
)
|
11,591
|
|
|||||
|
Intangible asset
|
—
|
|
3,780
|
|
3,780
|
|
|||||
|
Other assets
|
16,811
|
|
(465
|
)
|
16,346
|
|
|||||
|
Total assets acquired
|
$
|
643,324
|
|
$
|
(22,003
|
)
|
$
|
621,321
|
|
||
|
Liabilities
|
|||||||||||
|
Deposits:
|
|||||||||||
|
Noninterest-bearing
|
$
|
152,444
|
|
$
|
—
|
|
$
|
152,444
|
|
||
|
Interest-bearing
|
477,881
|
|
1,546
|
|
479,427
|
|
|||||
|
Total deposits
|
630,325
|
|
1,546
|
|
631,871
|
|
|||||
|
Federal Funds purchased
|
406
|
|
—
|
|
406
|
|
|||||
|
Other liabilities
|
3,392
|
|
167
|
|
3,559
|
|
|||||
|
Total liabilities assumed
|
634,123
|
|
1,713
|
|
635,836
|
|
|||||
|
Net assets acquired
|
$
|
9,201
|
|
$
|
(23,716
|
)
|
(14,515
|
)
|
|||
|
Cash paid to shareholders
|
(2,000
|
)
|
|||||||||
|
Cash paid to acquire TARP securities
|
(8,000
|
)
|
|||||||||
|
Goodwill recorded for 1st Financial
|
$
|
(24,515
|
)
|
||||||||
Goodwill recorded for 1st Financial represents future revenues to be derived, including efficiencies that will result from combining operations, and other non-identifiable intangible assets. The 1st Financial transaction is a taxable asset acquisition, and goodwill resulting from the transaction is deductible for income tax purposes.
Merger costs related to the 1st Financial transaction are estimated to be between
$6.0 million
and
$7.0 million
.
All loans resulting from the 1st Financial transaction were considered to have deteriorated credit quality at the acquisition date, and are therefore accounted for under ASC 310-30.
121
FIRST CITIZENS BANCSHARES, INC. AND SUBSIDIARIES
NOTES TO CONSOLIDATED FINANCIAL STATEMENTS (Continued)
For loans acquired from 1st Financial, the contractually required payments including principal and interest, cash flows expected to be collected and fair values as of the acquisition date were:
|
January 1, 2014
|
|||
|
(dollars in thousands)
|
|||
|
Contractually required payments
|
$
|
413,937
|
|
|
Cash flows expected to be collected
|
400,326
|
|
|
|
Fair value at acquisition date
|
316,327
|
|
|
The recorded fair values of loans acquired in the 1st Financial transaction as of the acquisition date were as follows:
|
January 1, 2014
|
|||
|
(dollars in thousands)
|
|||
|
Commercial:
|
|||
|
Construction and land development
|
$
|
41,516
|
|
|
Commercial mortgage
|
123,925
|
|
|
|
Other commercial real estate
|
6,698
|
|
|
|
Commercial and industrial
|
29,126
|
|
|
|
Total commercial loans
|
201,265
|
|
|
|
Noncommercial:
|
|||
|
Residential mortgage
|
113,177
|
|
|
|
Consumer
|
1,885
|
|
|
|
Total noncommercial loans
|
115,062
|
|
|
|
Total loans acquired from 1st Financial
|
$
|
316,327
|
|
122
FIRST CITIZENS BANCSHARES, INC. AND SUBSIDIARIES
NOTES TO CONSOLIDATED FINANCIAL STATEMENTS (Continued)
NOTE W
PARENT COMPANY FINANCIAL STATEMENTS
|
Parent Company
|
|||||||
|
Condensed Balance Sheets
|
|||||||
|
December 31, 2013
|
December 31, 2012
|
||||||
|
(dollars in thousands)
|
|||||||
|
Assets
|
|||||||
|
Cash
|
$
|
13,047
|
|
$
|
2,131
|
|
|
|
Investment securities available for sale
|
234,488
|
|
237,765
|
|
|||
|
Investment in subsidiaries
|
2,058,505
|
|
1,969,600
|
|
|||
|
Due from subsidiaries
|
145,666
|
|
78,512
|
|
|||
|
Other assets
|
144,998
|
|
83,283
|
|
|||
|
Total assets
|
$
|
2,596,704
|
|
$
|
2,371,291
|
|
|
|
Liabilities and Shareholders' Equity
|
|||||||
|
Short-term borrowings
|
$
|
411,907
|
|
$
|
399,047
|
|
|
|
Long-term obligations
|
96,392
|
|
96,392
|
|
|||
|
Other liabilities
|
11,730
|
|
11,845
|
|
|||
|
Shareholders' equity
|
2,076,675
|
|
1,864,007
|
|
|||
|
Total liabilities and shareholders' equity
|
$
|
2,596,704
|
|
$
|
2,371,291
|
|
|
|
Parent Company
|
|||||||||||
|
Condensed Income Statements
|
|||||||||||
|
Year ended December 31
|
|||||||||||
|
2013
|
2012
|
2011
|
|||||||||
|
(dollars in thousands)
|
|||||||||||
|
Interest income
|
$
|
1,387
|
|
$
|
1,353
|
|
$
|
1,345
|
|
||
|
Interest expense
|
7,065
|
|
15,435
|
|
21,512
|
|
|||||
|
Net interest loss
|
(5,678
|
)
|
(14,082
|
)
|
(20,167
|
)
|
|||||
|
Dividends from subsidiaries
|
131,006
|
|
179,588
|
|
82,812
|
|
|||||
|
Other income
|
3,620
|
|
2,843
|
|
9,699
|
|
|||||
|
Other operating expense
|
2,344
|
|
6,384
|
|
5,298
|
|
|||||
|
Income before income tax benefit and equity in undistributed net income of subsidiaries
|
126,604
|
|
161,965
|
|
67,046
|
|
|||||
|
Income tax benefit
|
(2,095
|
)
|
(8,417
|
)
|
(5,531
|
)
|
|||||
|
Income before equity in undistributed net income of subsidiaries
|
128,699
|
|
170,382
|
|
72,577
|
|
|||||
|
(Excess distributions) equity in undistributed net income of subsidiaries
|
39,000
|
|
(36,034
|
)
|
122,451
|
|
|||||
|
Net income
|
$
|
167,699
|
|
$
|
134,348
|
|
$
|
195,028
|
|
||
123
FIRST CITIZENS BANCSHARES, INC. AND SUBSIDIARIES
NOTES TO CONSOLIDATED FINANCIAL STATEMENTS (Continued)
|
Parent Company
|
|||||||||||
|
Condensed Statements of Cash Flows
|
|||||||||||
|
Year ended December 31
|
|||||||||||
|
2013
|
2012
|
2011
|
|||||||||
|
(dollars in thousands)
|
|||||||||||
|
OPERATING ACTIVITIES
|
|||||||||||
|
Net income
|
$
|
167,699
|
|
$
|
134,348
|
|
$
|
195,028
|
|
||
|
Adjustments
|
|||||||||||
|
Excess distributions (undistributed) net income of subsidiaries
|
(39,000
|
)
|
36,034
|
|
(122,451
|
)
|
|||||
|
Net amortization of premiums and discounts
|
334
|
|
439
|
|
203
|
|
|||||
|
Gain on retirement of long term obligations
|
—
|
|
—
|
|
(9,685
|
)
|
|||||
|
Securities gains
|
—
|
|
(2,274
|
)
|
(62
|
)
|
|||||
|
Gain on sale of other assets
|
(1,331
|
)
|
—
|
|
—
|
|
|||||
|
Other than temporary impairment on securities
|
—
|
|
45
|
|
26
|
|
|||||
|
Change in other assets
|
(61,704
|
)
|
30,761
|
|
(20,951
|
)
|
|||||
|
Change in other liabilities
|
(2,096
|
)
|
(10,148
|
)
|
(1,925
|
)
|
|||||
|
Net cash provided by operating activities
|
63,902
|
|
189,205
|
|
40,183
|
|
|||||
|
INVESTING ACTIVITIES
|
|||||||||||
|
Net change in due from subsidiaries
|
(67,154
|
)
|
42,323
|
|
146,463
|
|
|||||
|
Purchases of investment securities
|
(126,197
|
)
|
(111,409
|
)
|
(220,387
|
)
|
|||||
|
Proceeds from sales, calls, and maturities of securities
|
135,000
|
|
112,625
|
|
75,151
|
|
|||||
|
Investment in subsidiaries
|
1,489
|
|
9,298
|
|
—
|
|
|||||
|
Net cash (used) provided by investing activities
|
(56,862
|
)
|
52,837
|
|
1,227
|
|
|||||
|
FINANCING ACTIVITIES
|
|||||||||||
|
Net change in short-term borrowings
|
12,860
|
|
23,651
|
|
4,046
|
|
|||||
|
Retirement of long-term obligations
|
—
|
|
(155,305
|
)
|
(11,815
|
)
|
|||||
|
Repurchase of common stock
|
(321
|
)
|
(103,624
|
)
|
(24,387
|
)
|
|||||
|
Cash dividends paid
|
(8,663
|
)
|
(15,398
|
)
|
(12,499
|
)
|
|||||
|
Net cash provided (used) by financing activities
|
3,876
|
|
(250,676
|
)
|
(44,655
|
)
|
|||||
|
Net change in cash
|
10,916
|
|
(8,634
|
)
|
(3,245
|
)
|
|||||
|
Cash balance at beginning of year
|
2,131
|
|
10,765
|
|
14,010
|
|
|||||
|
Cash balance at end of year
|
$
|
13,047
|
|
$
|
2,131
|
|
$
|
10,765
|
|
||
|
Cash payments for
|
|||||||||||
|
Interest
|
$
|
6,904
|
|
$
|
25,574
|
|
$
|
20,677
|
|
||
|
Income taxes
|
102,890
|
|
66,453
|
|
91,465
|
|
|||||
124
FIRST CITIZENS BANCSHARES, INC. AND SUBSIDIARIES
NOTES TO CONSOLIDATED FINANCIAL STATEMENTS (Continued)
EXHIBIT INDEX
|
2.1
|
Purchase and Assumption Agreement between Registrant’s subsidiary First-Citizens Bank & Trust Company and Federal Deposit Insurance Corporation dated July 17, 2009 (incorporated by reference from Registrant’s Form 8-K/A filed February 1, 2010 to Form 8-K dated July 17, 2009)
|
|
2.2
|
Purchase and Assumption Agreement between Registrant’s subsidiary First-Citizens Bank & Trust Company and Federal Deposit Insurance Corporation dated September 11, 2009 (incorporated by reference from Registrant’s Form 8-K/A filed December 21, 2009 to Form 8-K dated September 11, 2009)
|
|
2.3
|
Purchase and Assumption Agreement between Registrant’s subsidiary First-Citizens Bank & Trust Company and Federal Deposit Insurance Corporation dated January 29, 2010 (incorporated by reference from Registrant’s Form 8-K/A filed June 9, 2010 to Form 8-K dated January 29, 2010)
|
|
2.4
|
Purchase and Assumption Agreement between Registrant’s subsidiary First-Citizens Bank & Trust Company and Federal Deposit Insurance Corporation dated March 5, 2010 (incorporated by reference from Registrant’s Form 8-K dated March 5, 2010)
|
|
2.5
|
Purchase and Assumption Agreement between Registrant’s subsidiary First-Citizens Bank & Trust Company and Federal Deposit Insurance Corporation dated January 21, 2011 (incorporated by reference from Registrant’s Form 8-K dated January 21, 2011)
|
|
2.6
|
Purchase and Assumption Agreement between Registrant’s subsidiary First-Citizens Bank & Trust Company and Federal Deposit Insurance Corporation dated July 8, 2011 (incorporated by reference from Registrant’s Form 8-K dated July 8, 2011)
|
|
3.1
|
Certificate of Incorporation of the Registrant, as amended (filed herewith)
|
|
3.2
|
Bylaws of the Registrant, as amended (incorporated by reference from Registrant’s Form 8-K dated April 27, 2009)
|
|
4.1
|
Specimen of Registrant’s Class A Common Stock certificate (incorporated by reference from Registrant’s Form 10-K for the year ended December 31, 2008)
|
|
4.2
|
Specimen of Registrant’s Class B Common Stock certificate (incorporated by reference from Registrant’s Form 10-K for the year ended December 31, 2008)
|
|
4.3
|
Indenture dated June 1, 2005 between Registrant’s subsidiary First-Citizens Bank & Trust Company and Deutsche Bank Trust Company Americas, as Trustee (incorporated by reference from Registrant’s Form 8-K dated June 1, 2005)
|
|
4.4
|
First Supplemental Indenture dated June 1, 2005 between Registrant’s subsidiary First-Citizens Bank & Trust Company and Deutsche Bank Trust Company Americas, as Trustee (incorporated by reference from Registrant’s Form 8-K dated June 1, 2005)
|
|
4.5
|
Amended and Restated Trust Agreement of FCB/NC Capital Trust III (incorporated by reference from Registrant’s Form 10-Q for the quarter ended June 30, 2006)
|
|
4.6
|
Guarantee Agreement relating to Registrant’s guarantee of the capital securities of FCB/NC Capital Trust III (incorporated by reference from Registrant’s Form 10-Q for the quarter ended June 30, 2006)
|
|
4.7
|
Junior Subordinated Indenture dated May 18, 2006 between Registrant and Wilmington Trust Company, as Debenture Trustee (incorporated by reference from Registrant’s Form 10-Q for the quarter ended June 30, 2006)
|
|
10.1
|
Executive Consultation, Separation from Service and Death Benefit Agreement between Registrant’s subsidiary First-Citizens Bank & Trust Company and Frank B. Holding, Jr. (incorporated by reference from Registrant’s Form 8-K dated February 18, 2011)
|
|
10.2
|
Executive Consultation, Separation from Service and Death Benefit Agreement between Registrant’s subsidiary First-Citizens Bank & Trust Company and Frank B. Holding (incorporated by reference from Registrant’s Form 8-K dated February 3, 2009)
|
125
|
10.3
|
Executive Consultation, Separation from Service and Death Benefit Agreement between Registrant’s subsidiary First-Citizens Bank & Trust Company and Hope Holding Bryant (incorporated by reference to Registrant’s Form 8-K dated February 18, 2011)
|
|
10.4
|
Executive Consultation, Separation from Service and Death Benefit Agreement between Registrant’s subsidiary First-Citizens Bank & Trust Company and Edward L. Willingham, IV (incorporated by reference to Registrant’s Form 8-K dated February 18, 2011)
|
|
10.5
|
Executive Consultation, Separation from Service and Death Benefit Agreement between Registrant’s subsidiary First-Citizens Bank & Trust Company and Kenneth A. Black (incorporated by reference to Registrant’s Form 8-K dated February 18, 2011)
|
|
10.6
|
Executive Consultation, Separation from Service and Death Benefit Agreement between Registrant’s subsidiary, First-Citizens Bank & Trust Company, as successor by merger to IronStone Bank, and James M. Parker (incorporated by reference from Registrant’s Form 10-Q for the quarter ended September 30, 2007)
|
|
10.7
|
Executive Consultation, Separation from Service and Death Benefit Agreement between Registrant’s subsidiary, First-Citizens Bank & Trust Company, as successor by merger to IronStone Bank, and James M. Parker (incorporated by reference from Registrant’s Form 10-K for the year ended December 31, 2008)
|
|
10.8
|
Executive Consultation, Separation from Service and Death Benefit Agreement between Registrant’s subsidiary, First-Citizens Bank & Trust Company, as successor by merger to IronStone Bank, and James M. Parker (incorporated by reference from Registrant’s Form 8-K dated February 4, 2009)
|
|
10.9
|
Executive Consultation, Separation from Service and Death Benefit Agreement between Registrant’s subsidiary, First-Citizens Bank & Trust Company, as successor by merger to IronStone Bank, and James M. Parker (incorporated by reference from Registrant’s Form 10-K for the year ended December 31, 2010)
|
|
21
|
Subsidiaries of the Registrant (filed herewith)
|
|
24
|
Power of Attorney (filed herewith)
|
|
31.1
|
Certification of Chief Executive Officer (filed herewith)
|
|
31.2
|
Certification of Chief Financial Officer (filed herewith)
|
|
32.1
|
Certification of Chief Executive Officer (filed herewith)
|
|
32.2
|
Certification of Chief Financial Officer (filed herewith)
|
|
99.1
|
Proxy Statement for Registrant’s 2014 Annual Meeting (separately filed)
|
|
*101.INS
|
XBRL Instance Document (filed herewith)
|
|
*101.SCH
|
XBRL Taxonomy Extension Schema (filed herewith)
|
|
*101.CAL
|
XBRL Taxonomy Extension Calculation Linkbase (filed herewith)
|
|
*101.LAB
|
XBRL Taxonomy Extension Label Linkbase (filed herewith)
|
|
*101.PRE
|
XBRL Taxonomy Extension Presentation Linkbase (filed herewith)
|
|
*101.DEF
|
XBRL Taxonomy Definition Linkbase (filed herewith)
|
|
*
|
|
Interactive data files are furnished but not filed for purposes of Sections 11 and 12 of the Securities Act of 1933, as amended, and Section 18 of the Securities Exchange Act of 1934, as amended.
|
126
SIGNATURES
Pursuant to the requirements of Section 13 or 15(d) of the Securities Exchange Act of 1934, the Registrant has duly caused this Annual Report to be signed on its behalf by the undersigned, thereunto duly authorized.
Dated:
February 26, 2014
|
FIRST CITIZENS BANCSHARES, INC. (Registrant)
|
|
|
/S/ FRANK B. HOLDING, JR.
|
|
|
Frank B. Holding, Jr.
Chairman and Chief Executive Officer
|
|
Pursuant to the requirements of the Securities Exchange Act of 1934, this report has been signed below by the following persons, on behalf of the Registrant and in the capacities indicated on
February 26, 2014
.
|
Signature
|
Title
|
Date
|
||
|
/s/ F
RANK
B. H
OLDING
, J
R
.
Frank B. Holding, Jr.
|
Chairman and Chief Executive Officer
|
February 26, 2014
|
||
|
Frank B. Holding
|
Executive Vice Chairman
|
February 26, 2014
|
||
|
/
S
/ G
LENN
D. M
C
C
OY
Glenn D. McCoy
|
Vice President and Chief Financial Officer (principal financial officer)
|
February 26, 2014
|
||
|
/
S
/ L
ORIE
K. R
UPP
Lorie K. Rupp
|
Assistant Vice President and Chief Accounting Officer (principal accounting officer)
|
February 26, 2014
|
||
|
/s/ J
OHN
M. A
LEXANDER
, J
R
. *
John M. Alexander, Jr.
|
Director
|
February 26, 2014
|
||
|
/s/ V
ICTOR
E. B
ELL
, III *
Victor E. Bell, III
|
Director
|
February 26, 2014
|
||
|
/s/ H
OPE
H
OLDING
B
RYANT
*
Hope Holding Bryant
|
Director
|
February 26, 2014
|
||
|
/s/ H
UBERT
M. C
RAIG
, III *
Hubert M. Craig, III
|
Director
|
February 26, 2014
|
||
127
|
Signature
|
Title
|
Date
|
||
|
/s/ H. L
EE
D
URHAM
, J
R
. *
H. Lee Durham, Jr.
|
Director
|
February 26, 2014
|
||
|
/s/ D
ANIEL
L. H
EAVNER
*
Daniel L. Heavner
|
Director
|
February 26, 2014
|
||
|
/s/ L
UCIUS
S. J
ONES
*
Lucius S. Jones
|
Director
|
February 26, 2014
|
||
|
/s/ R
OBERT
E. M
ASON
, IV *
Robert E. Mason, IV
|
Director
|
February 26, 2014
|
||
|
/s/ R
OBERT
T. N
EWCOMB
*
Robert T. Newcomb
|
Director
|
February 26, 2014
|
||
|
/s/ J
AMES
M. P
ARKER
*
James M. Parker
|
Director
|
February 26, 2014
|
||
|
/s/ R
ALPH
K. S
HELTON
*
Ralph K. Shelton
|
Director
|
February 26, 2014
|
||
|
*
|
Glenn D. McCoy hereby signs this Annual Report on Form 10-K on February 26, 2014, on behalf of each of the indicated persons for whom he is attorney-in-fact pursuant to a Power of Attorney filed herewith.
|
|
|
By:
|
/
S
/
GLENN D. MCCOY
|
|
|
Glenn D. McCoy
As Attorney-In-Fact
|
||
128
TABLE OF CONTENTS
Part IItem 1A. Risk FactorsItem 2. PropertiesItem 3. Legal ProceedingsPart IIItem 5. Market For Registrant's Common Equity, Related Stockholder Matters and Issuer Purchases Of Equity SecuritiesItem 7. Management S Discussion and Analysis Of Financial Condition and Results Of OperationsItem 9A. Controls and Procedures