FOUR CORNERS PROPERTY TRUST, INC.
10-Ks and 10-Qs
|
|
|
|
|
|
|
|
|
|
|
|
|
|
|
|
|
|
|
|
|
|
|
|
|
|
|
|
|
|
|
|
|
|
|
|
|
|
UNITED STATES
SECURITIES AND EXCHANGE COMMISSION
Washington, DC 20549
___________________________________________
FORM 10-K
___________________________________________
(Mark One)
|
x
|
ANNUAL REPORT PURSUANT TO SECTION 13 OR 15(d) OF THE SECURITIES EXCHANGE ACT OF 1934
For the fiscal year ended December 31, 2016
|
OR
|
¨
|
TRANSITION REPORT PURSUANT TO SECTION 13 OR 15(d) OF THE SECURITIES EXCHANGE ACT OF 1934
For the transition period from
to
|
Commission File Number: 1-37538
FOUR CORNERS PROPERTY TRUST, INC.
(Exact name of Registrant as specified in its charter)
|
Maryland
|
47-4456296
|
|
|
(State or other jurisdiction of
incorporation or organization)
|
(IRS Employer Identification No.)
|
|
|
591 Redwood Highway, Suite 1150, Mill Valley, California
|
94941
|
|
|
(Address of principal executive offices)
|
(Zip Code)
|
|
Registrant’s telephone number, including area code: (415) 965-8030
Securities registered pursuant to Section 12(b) of the Act:
|
Title of each class
|
Name of each exchange
on which registered
New York Stock Exchange
|
|
|
Common Stock, $0.0001 par value
|
||
Securities registered pursuant to Section 12(g) of the Act: None
Indicate by check mark if the Registrant is a well-known seasoned issuer, as defined in Rule 405 of the Securities Act. Yes
¨
No
x
Indicate by check mark if Registrant is not required to file reports pursuant to Section 13 or 15(d) of the Act. Yes
¨
No
x
Indicate by check mark if the Registrant (1) has filed all reports required to be filed by Section 13 or 15(d) of the Securities Exchange Act of 1934 during the preceding 12 months (or for such shorter period that the Registrant was required to file such reports), and (2) has been subject to such filing requirements for the past 90 days. Yes
x
No
¨
Indicate by check mark whether the Registrant has submitted electronically and posted on its corporate Web site, if any, every Interactive Data File required to be submitted and posted pursuant to Rule 405 of Regulation S-T during the preceding 12 months (or for such shorter period that the Registrant was required to submit and post such files). Yes
x
No
¨
Indicate by check mark if disclosure of delinquent filers pursuant to Item 405 of Regulation S-K is not contained herein, and will not be contained, to the best of Registrant’s knowledge, in definitive proxy or information statements incorporated by reference in Part III of this Form 10-K or any amendment to this Form 10-K.
x
Indicate by check mark whether the Registrant is a large accelerated filer, an accelerated filer, a non-accelerated filer, or a smaller reporting company. See definition of “large accelerated filer,” “accelerated filer” and “smaller reporting company” in Rule 12b-2 of the Exchange Act. (Check one):
Large accelerated filer
x
Non-accelerated filer
¨
Accelerated filer
¨
(Do not check if a smaller reporting company) Smaller reporting company
¨
Indicate by check mark whether the Registrant is a shell company (as defined in Rule 12b-2 of the Act). Yes
¨
No
x
The aggregate market value of Common Stock held by non-affiliates of the Registrant, computed by reference to the closing sales price of such shares on the New York Stock Exchange as of the last business day of the Registrant’s most recently completed second fiscal quarter was approximately: $1,230,657,258.
Number of shares of Common Stock, par value $0.0001, outstanding as of February 27, 2017: 59,973,547.
DOCUMENTS INCORPORATED BY REFERENCE
Portions of the Registrant’s Definitive Proxy Statement for its Annual Meeting of Stockholders to be filed with the Securities and Exchange Commission no later than April 29, 2017 are incorporated by reference into Part III of this Report.
FOUR CORNERS PROPERTY TRUST, INC.
FORM 10 - K
YEAR ENDED DECEMBER 31, 2016
TABLE OF CONTENTS
|
Page
|
||
|
Part 1
|
||
|
Item 1.
|
||
|
Item 1A.
|
||
|
Item 1B.
|
||
|
Item 2.
|
||
|
Item 3.
|
||
|
Item 4.
|
||
|
Part II
|
||
|
Item 5.
|
||
|
Item 6.
|
||
|
Item 7.
|
||
|
Item 7A.
|
||
|
Item 8.
|
||
|
Item 9.
|
||
|
Item 9A.
|
||
|
Item 9B.
|
||
|
Part III
|
||
|
Item 10.
|
||
|
Item 11.
|
||
|
Item 12.
|
||
|
Item 13.
|
||
|
Item 14.
|
||
|
Part IV
|
||
|
Item 15.
|
||
|
Signatures
|
||
Forward-Looking Statements
Statements contained in this Annual Report on Form 10-K, including the documents that are incorporated by reference, that are not historical facts are forward-looking statements within the meaning of Section 27A of the Securities Act of 1933 and Section 21E of the Securities Exchange Act of 1934 (the “Exchange Act”). Also, when Four Corners Property Trust, Inc. uses any of the words “anticipate,” “assume,” “believe,” “estimate,” “expect,” “intend,” or similar expressions, Four Corners Property Trust, Inc. is making forward-looking statements. Although management believes that the expectations reflected in such forward-looking statements are based upon present expectations and reasonable assumptions, actual results could differ materially from those set forth in the forward-looking statements. Certain factors that could cause actual results or events to differ materially from those anticipated or projected are described in “Item 1A. Risk Factors.” of this Annual Report on Form 10-K.
Given these uncertainties, readers are cautioned not to place undue reliance on such statements, which speak only as of the date of this Annual Report on Form 10-K or any document incorporated herein by reference. Four Corners Property Trust, Inc. undertakes no obligation to publicly release any revisions to these forward-looking statements that may be made to reflect events or circumstances after the date of this Annual Report on Form 10-K.
Unless the context indicates otherwise, all references to “FCPT,” the “Company,” “we,” “our” or “us” include Four Corners Property Trust, Inc. and all of its consolidated subsidiaries.
History
We were incorporated as a Maryland corporation on July 2, 2015 as a wholly owned indirect subsidiary of Darden Restaurants, Inc. (together with its consolidated subsidiaries “Darden”). On November 9, 2015, Darden completed a spin-off of FCPT (the “Spin-Off”) pursuant to which Darden contributed to us (i) 100% of the equity interest in entities that owned 418 properties in which Darden operates Olive Garden, LongHorn SteakHouse and other branded restaurants and (ii) six LongHorn Steakhouse restaurants, including the properties or interests associated with such restaurants, located in the San Antonio, Texas area (the “Kerrow Restaurant Operating Business”). In connection with the Spin-Off, Darden distributed our common stock to its common stockholders and, subsequently, we became an independent, publicly traded, self-administered company.
Business Overview
We are a Maryland real estate investment trust (“REIT”) which owns, acquires and leases properties for use in the restaurant and food-service related industries. Substantially all of our business is conducted through Four Corners Operating Partnership, LP (“FCPT OP”), a Delaware limited partnership of which we are a majority limited partner and our wholly owned subsidiary, Four Corners GP, LLC (“FCPT GP”), is its sole general partner. We intend to qualify as a REIT for U.S. federal income tax purposes with the taxable year beginning January 1, 2016.
Our revenues are primarily generated by leasing properties to Darden and other tenants through triple-net lease arrangements under which the tenants are primarily responsible for ongoing costs relating to the properties, including utilities, property taxes, insurance, common area maintenance charges, and maintenance and repair costs. We focus on income producing properties leased to high quality tenants in major markets across the United States. We also generate revenues by operating the LongHorn San Antonio Business pursuant to franchise agreements with Darden.
In addition to managing our existing properties, our strategy includes investing in additional restaurant and food service real estate properties to grow and diversify our existing restaurant portfolio. We expect this acquisition strategy will decrease our reliance on Darden over time. We intend to purchase properties that are well located, occupied by durable restaurant concepts, with creditworthy tenants whose operating cash flow are expected to meaningfully exceed their lease payments to us. We seek to improve the probability of successful tenant renewal at the end of initial lease terms by acquiring properties that have high levels of restaurant operator profitability compare to rent payments and have absolute rent levels that are not artificially higher than market rates.
1
In 2016, FCPT engaged in 13 acquisition transactions for a total investment of $94.1 million in our leasing portfolio. Pursuant to these transactions, we acquired an additional 59 properties, aggregating 184 thousand square feet and representing 13 brands, including Burger King, Taco Bell, Pizza Hut and KFC. During the same period, FCPT sold two properties for $24.8 million. The proceeds from the sales were used for subsequent acquisitions in the 1031 exchange market. As of December 31, 2016, our wholly-owned lease portfolio had the following characteristics:
|
•
|
475 free-standing properties located in 44 states and representing an aggregate leasable area of 3.4 million square feet;
|
|
•
|
100% occupancy;
|
|
•
|
A weighted average remaining lease term of 13.7 years (based on annual base rent);
|
|
•
|
A weighted average annual rent escalator of 1.5% (based on annual base rent); and
|
|
•
|
94% investment grade tenancy (based on annual base rent).
|
Segments
W
e operate in two segments, real estate operations and restaurant operations. Our segments are based on our organizational and management structure, which aligns with how our results are monitored and performance is assessed.
Our real estate operations segment consists of rental revenues primarily generated by leasing restaurant properties to tenants through triple-net lease arrangements under which the tenant is primarily responsible for ongoing costs relating to the properties. It also includes expenses associated with continuing efforts to invest in additional restaurant and food service real estate properties and our corporate operating expenses.
Our restaurant operations segment is conducted through our taxable REIT subsidiary (“TRS”) and consists of our Kerrow Restaurant Operating Business. The associated sales revenues, restaurant expenses and overhead, and depreciation on Kerrow’s six buildings and equipment comprise our restaurant operations.
Our shares of common stock are listed on the New York Stock Exchange under the ticker symbol “FCPT”.
Our executive offices are located at 591 Redwood Highway, Suite 1150, Mill Valley, California 94941, and our telephone number is (415) 965-8030.
At February 24, 2017, we employed 324 individuals.
Competitive Advantage
We believe that we have significant competitive advantages that support our core business of owning and leasing restaurant and food-service related properties as further outlined below.
Leading Nationwide REIT Focused on Restaurant Properties
We are focused on the ownership of properties used in the restaurant industry and have tailored our business strategy to address the needs of restaurant operators. We believe our scale, national reach, restaurant operations experience, and efficient lease structuring will help us achieve operational efficiencies and support future growth opportunities. In contrast to the majority of existing net-lease REITs that are diversified by retail industry and property type, we believe that our focus and expertise in the restaurant sector will generate data and understanding to better support effective investment and leasing decisions.
Large Addressable Market Potential in US Food Service
By virtue of its large scale, we believe that the U.S. restaurant industry offers a sizable pool of attractive property acquisition targets across different types of restaurant properties, including quick service, take-out, casual dining, fast casual, and fine dining, to enable diversified growth for us. FCPT’s addressable market of restaurant real estate is substantial despite FCPT’s narrowed focus within retail sales. According to the Census Bureau and the Bureau of Economic Data, the food service industry had over $620 billion in sales in 2015, of which Quick Service Restaurants (“QSR”) and Casual Dining Restaurants (“CDR”) comprise over $430 billion combined. FCPT plans to focus on acquisitions that shift its portfolio to be more reflective of the national
2
restaurant landscape, targeting QSR and some casual dining concepts, and with less focus on Italian and steak restaurants given the current portfolio concentration of Olive Garden and LongHorn Steakhouse restaurants.
Furthermore, implementation of “asset light” strategies by restaurant companies may provide landlords like us an opportunity to enter into sale-leaseback transactions with the parent company of corporate-operated restaurants for their existing properties and to finance future restaurant development by these restaurant companies.
We also believe there may be other attractive opportunities for growth outside the traditional restaurant sector. This may include one or more of the following: food service distribution facilities, cold storage facilities, retail properties and other triple-net leased real estate.
Uniquely Positioned to Capitalize on Expansion Opportunities
We believe there is a large market opportunity to acquire additional restaurant properties and that a number of restaurant operators would like the opportunity to monetize their real estate holdings while continuing to operate their existing core businesses. We believe that a number of restaurant operators would be willing to enter into transactions designed to monetize their real estate assets through sale-leaseback transactions with an unrelated party not perceived to be a competitor, such as us. These restaurant operators could use the proceeds from the sale of their real estate assets for several different business purposes, including (i) reducing bank loans and lines of credit, (ii) reinvestment in existing operations, or (iii) for new business initiatives including opening new locations or pursuing acquisitions. Sale-leaseback transactions can provide an attractive means for both mature operators as well as fast-growing businesses to repatriate capital into more attractive opportunities. We may also provide such restaurant operators with expansion opportunities that they may not otherwise be in a position to pursue by providing them with capital to expand and enhance their operations at rates that provide both an attractive risk-adjusted return to us and are more attractive to the restaurant or retail operators than they may be able to receive through traditional debt financing arrangements.
Large and Consolidating Restaurant Franchisee Market
Franchisees, which often lease the restaurants that they operate, are potential future partners for us. According to Nation’s Restaurant News 2016 Top 100, franchisees operate over 75% of the Top 100’s aggregate units, representing more than 148,000 restaurants and growing. In addition, the franchise restaurant operation industry is highly fragmented, but it is undergoing consolidation as brands and franchisees recognize the benefits of larger, more professional operators. According to Franchise Times, between 2009 and 2015, the top restaurant franchisees have seen their unit count increase by 7.0% annually. Due to the adoption of an asset-light model, both unit expansion and franchisee consolidation provide significant opportunities for real estate monetization programs and for FCPT to be a preferred, reliable real estate partner as part of these transactions.
Geographically Diverse Asset Portfolio
Properties in our leasing portfolio are located in 44 different states across the continental United States. The leasing portfolio properties in any one state do not account for more than 12% of our total rental revenue. We believe this geographic diversification will limit the effect of changes in any one market on our overall performance.
Financially Secure Principal Tenant
Darden is currently our largest tenant representing approximately 95% of our tenant base. Darden owns and operates seven nationally recognized brands, including the five brands that are represented among the properties we lease to Darden: Olive Garden®, LongHorn Steakhouse®, Bahama Breeze®, Seasons 52® and Wildfish Seafood Grille®. For the twelve-months ended November 27, 2016, Darden reported revenue of approximately $7.0 billion and net cash from operations of $924.1 million. Darden is investment grade rated at BBB/BBB/Baa3 (Fitch/S&P/Moody’s) and its liquidity position, leverage position and ability to generate significant free cash flow should provide it with the ability to pay the annual lease obligations to FCPT for the foreseeable future. Darden is subject to SEC reporting requirements, which provide ongoing transparency regarding its operating and financial performance. For further information, refer to the investor relations section of
www.darden.com
. We do not intend Darden’s website to be an active link or to otherwise incorporate the information contained on its website into this report or other filings with the SEC.
3
Long-Term, Triple-Net Lease Structure
FCPT’s properties are leased to our tenants on a triple-net lease basis with a weighted average initial lease term of approximately 13.7 years and a weighted average annual rent escalator of 1.5% (both weightings based on annual base rent), thereby providing a long-term, stable income stream. Under the leases, the tenant is responsible for maintaining the properties in accordance with prudent industry practice and in compliance with all federal and state standards. The maintenance responsibilities include, among others, maintaining the building, building systems including roofing systems and other improvements. In addition to maintenance requirements, the tenant is also responsible for insurance required to be carried under the leases, taxes levied on or with respect to the properties, payment of common area maintenance charges and all utilities and other services necessary or appropriate for the properties and the business conducted on the properties. At the option of the tenant, the leases will generally allow extensions for a certain number of multi-year renewal terms beyond the initial term and the tenant can elect which of the properties then subject to the leases to renew. The number and duration of the renewal terms for any given property may vary, however, based on the initial term of the relevant lease and other factors.
Management Team with Extensive Real Estate and Net Lease Experience
FCPT has a highly regarded management team with extensive retail net lease and public market REIT experience. The team is led by President and Chief Executive Officer Bill Lenehan and Chief Financial Officer Gerry Morgan. Prior to joining FCPT, Mr. Lenehan was on the Darden Board of Directors and chair of its Real Estate and Finance Committee. Mr. Lenehan also previously served as interim chief executive officer of MI Developments, Inc., now named Granite REIT, an owner of net leased industrial and manufacturing real estate.
Our Business Objectives and Strategy
Our primary goal is to create long-term stockholder value by executing our investment objectives to maximize the value of our assets, to acquire assets with growth and diversification opportunities due to favorable lease structures and attractive submarket demographics, and to provide attractive and growing quarterly cash dividends. We do not currently have a fixed schedule of the number of acquisitions we intend to make over a particular time period, but rather, we intend to pursue those acquisitions that meet our investing and financing objectives where we can earn a return above our weighted-average cost of capital adjusted to reflect counterparty risk.
The key components of our business strategy, beyond managing our properties in accordance with our leases with Darden, include:
Acquire Additional Restaurant Properties:
Initially, we expect to focus on growing and diversifying our property portfolio by acquiring restaurant properties in the Quick Service Restaurant (“QSR”) and some Casual Dining Restaurant (“CDR”) concepts. These transactions may take many forms including triple-net, sale-leaseback transactions with restaurant operators, acquisitions in the 1031 exchange market or acquisitions of portfolios of properties from other REITs and other public and private real estate owners. We will employ a disciplined, opportunistic acquisition strategy and price transactions appropriately based on, among other things, the mix of assets acquired, length and terms of the lease, location and submarket attractiveness, and the credit worthiness of the initial tenant.
Fund Strategic Capital Improvements for Existing and Future Tenants:
We will consider supporting the growth initiatives of our tenant operators by providing capital to them for a variety of purposes, including capacity augmentation projects. If completed, we expect to structure these investments under terms that we deem to be economically attractive to our stockholders, either as lease amendments that produce additional rents or as loans that are repaid by operators during the applicable lease term.
Re-lease Properties:
Over time we will face a re-tenanting risk and opportunity. If our tenants elect to cease operations at any of our properties, we will need to find a replacement tenant at the end of the lease term. We plan to use leasing expertise and relationships developed through our national operations to replace tenants under any expiring leases.
Develop New Tenant Relationships:
Our focus in the restaurant and related food service industry will allow us to cultivate new relationships with potential tenants and restaurant operators in order to expand the mix of tenants operating our properties and, in doing so, reduce our concentration with Darden.
4
Maintain Balance Sheet Strength and Liquidity:
We intend to maintain a capital structure that provides the resources and financial flexibility to support the growth of our business. Our principal sources of liquidity will be our cash generated through operations, our revolving credit facility which has an undrawn capacity as of February 27, 2017 of $305 million, our At-the-Market equity follow-on program filed in December 2016 and access to bank and private placement debt markets. Through disciplined capital spending and working capital management, we intend to maximize our cash flows and maintain our targeted balance sheet and leverage ratios.
Operate the Kerrow Restaurant Operating Business
: We operate the Kerrow Restaurant Operating Business through Kerrow Holdings, LLC (“Kerrow”). Although we intend to derive the majority of our revenue from leasing properties on a triple-net basis to restaurant and retail operators, the Kerrow Restaurant Operating Business will provide us with a diversified revenue stream and equip us with the expertise to better analyze other restaurant properties that could serve as expansion opportunities.
Investment and Financing Policies
Our investment objectives are to increase cash flow, provide quarterly cash dividends, maximize the value of our assets and acquire assets with cash flow growth potential. Initially, we intend to invest primarily in restaurant properties. Over time, we believe we have the potential to diversify into other food service and related property types beyond the restaurant industry.
We expect that future investments in properties, including any improvements or renovations of currently owned or newly-acquired restaurant properties, will be financed, in whole or in part, with cash flow from our operations, borrowings under our $350 revolving credit facility, or the proceeds from issuances of common stock, preferred stock, debt or other securities. Our investment and financing policies and objectives are subject to change periodically at the discretion of our Board of Directors without a vote of stockholders. We also have a shelf registration statement on file with the SEC under which we may issue secured or unsecured indebtedness and equity financing through the instruments and on the terms most attractive to us at such time. In December 2016, the Company entered into an “At-the-Market” (“ATM”) sales agreement under which it can sell common stock with a sales value of up to $150 million through broker-dealers. In January 2017, we achieved an investment grade rating of BBB- from Fitch Ratings.
Flexible UPREIT Structure
We operate in what is commonly referred to as an UPREIT structure, in which substantially all of our properties and assets are held through FCPT OP. It is managed by FCPT GP, which accordingly controls the management and decisions of FCPT OP. Conducting business through FCPT OP allows us flexibility in the manner in which we structure and acquire properties. In particular, an UPREIT structure enables us to acquire additional properties from sellers in exchange for limited partnership units in FCPT OP. As a result, this structure potentially may facilitate our acquisition of assets in a more efficient manner and may allow us to acquire assets that the owner would otherwise be unwilling to sell to us.
Our Portfolio
At December 31, 2016, we owned 481 properties, all within the continental United States. Of these properties, 475 were held for investment and leased to tenants under triple-net leases. These 475 properties had an aggregate leasable area of approximately 3.4 million square feet, were located in 44 states, and had a weighted average remaining lease term of 13.7 years before any lease renewals. The remaining six properties, representing the Kerrow Restaurant Operating Business, are operated by Kerrow subject to franchise agreements with Darden (“Franchise Agreements”). Three of these restaurants are subject to ground leases. See “Item 2. Properties” for additional information about our properties and tenants.
5
The following table summarizes the rental properties by brand as of December 31, 2016:
|
Brand
|
Number of FCPT Properties
|
Total Square Feet (000s)
|
Annual Cash Base Rent $(000s)
|
Percentage of Total Annualized Base Rent
|
Avg. Rent Per Square Foot ($)
|
EBITDAR Coverage
(1)
|
Average Lease Expiration Date Assuming No Renewals
(2)
|
||||||||
|
Olive Garden
|
299
|
|
2,556
|
|
$
|
70,926
|
|
70.2
|
%
|
$
|
28
|
|
4.4x
|
13.8
|
|
|
Longhorn SteakHouse
|
104
|
|
579
|
|
19,229
|
|
19.0
|
%
|
33
|
|
3.9x
|
12.7
|
|
||
|
Other Brands - non-Darden
|
59
|
|
184
|
|
6,130
|
|
6.1
|
%
|
33
|
|
2.8x
|
17.0
|
|
||
|
Other Brands Darden
|
13
|
|
126
|
|
4,688
|
|
4.7
|
%
|
37
|
|
3.6x
|
11.6
|
|
||
|
Total
|
475
|
|
3,445
|
|
$
|
100,973
|
|
100.0
|
%
|
$
|
29
|
|
4.2x
|
13.7
|
|
(1)
EBITDAR Coverage is calculated by dividing our tenants estimated trailing 12-month EBITDAR by annual contractual cash rent paid to FCPT. EBITDAR is defined as earnings before interest, income taxes, depreciation, amortization, and rent. EBITDAR is derived from the most recent data from tenants who disclose this information, representing approximately 98% of our run-rate rental income. FCPT does not independently verify financial information provided by its tenants.
(2) Average Lease Expiration Date (Assuming No Renewals) is defined as the average ending date of the lease if there is no renewal of the initial term of the lease.
6
The following table summarizes the diversification of FCPT’s leased portfolio by state as of December 31, 2016:
|
State
|
# of Properties
|
% of Annual Base Rent
|
||||
|
Florida
|
45
|
|
11.8
|
%
|
||
|
Texas
|
43
|
|
10.8
|
%
|
||
|
Georgia
|
44
|
|
8.4
|
%
|
||
|
Ohio
|
33
|
|
6.4
|
%
|
||
|
Michigan
|
25
|
|
4.1
|
%
|
||
|
Indiana
|
24
|
|
3.4
|
%
|
||
|
Tennessee
|
18
|
|
3.3
|
%
|
||
|
North Carolina
|
17
|
|
3.2
|
%
|
||
|
California
|
10
|
|
3.2
|
%
|
||
|
Pennsylvania
|
13
|
|
3.0
|
%
|
||
|
Illinois
|
17
|
|
2.7
|
%
|
||
|
Virginia
|
14
|
|
2.6
|
%
|
||
|
Wisconsin
|
16
|
|
2.4
|
%
|
||
|
New York
|
9
|
|
2.2
|
%
|
||
|
Maryland
|
10
|
|
2.2
|
%
|
||
|
Kentucky
|
10
|
|
2.0
|
%
|
||
|
Alabama
|
11
|
|
2.0
|
%
|
||
|
Iowa
|
10
|
|
1.9
|
%
|
||
|
South Carolina
|
8
|
|
1.9
|
%
|
||
|
Arizona
|
8
|
|
1.8
|
%
|
||
|
Nevada
|
6
|
|
1.8
|
%
|
||
|
Minnesota
|
8
|
|
1.7
|
%
|
||
|
Oklahoma
|
7
|
|
1.5
|
%
|
||
|
Colorado
|
7
|
|
1.5
|
%
|
||
|
Mississippi
|
7
|
|
1.4
|
%
|
||
|
Arkansas
|
7
|
|
1.3
|
%
|
||
|
Kansas
|
5
|
|
1.3
|
%
|
||
|
Louisiana
|
6
|
|
1.3
|
%
|
||
|
West Virginia
|
5
|
|
1.2
|
%
|
||
|
Missouri
|
6
|
|
1.1
|
%
|
||
|
Other (none greater than 4%)
|
26
|
|
6.3
|
%
|
||
|
Total
|
475
|
|
100.0
|
%
|
||
Leases with Darden
The estimated annual cash rent based on current rates for the leases in place with Darden is approximately $94.8 million. Each November 1, the rent is subject to annual escalation of 1.5%, as well as, in most of the leases, a fair market value adjustment at the start of one of the renewal options. Darden also entered into guaranties, pursuant to which it guarantied the obligations of the tenants under substantially all of the leases entered into in respect of the properties. The properties are leased to one or more of Darden’s operating subsidiaries pursuant to the leases, which are triple-net leases. The leases provide for an average remaining initial term of approximately fourteen years, with no purchase options provided that Darden will have a right of first offer with respect to our sale of any property, if there is no default under the lease, and we will be prohibited from selling any properties to (i) any nationally recognized casual or fine dining brand restaurant or entity operating the same or (ii) any other regionally recognized casual or fine dining brand restaurant or entity operating the same, with 25 or more units. At the option of Darden, the leases will generally allow extensions for a certain number of renewal terms of five years each beyond the initial term and Darden can elect which of our properties then subject to the leases to renew. The number and duration of the renewal terms for any given Property may vary, however, based on the initial term of the relevant lease and other factors.
7
Darden is currently the source of a substantial majority of our revenues, and its financial condition and ability and willingness to satisfy its obligations under the leases and its willingness to renew the leases upon expiration of the initial base term thereof significantly impacts our revenues and our ability to service our indebtedness and to make distributions to our stockholders. There can be no assurance that Darden will have sufficient assets, income and access to financing to enable it to satisfy its obligations under the leases with us, and any inability or unwillingness on its part to do so would have a material adverse effect on our business, financial condition, results of operations and liquidity, on our ability to service our indebtedness and other obligations and on our ability to pay dividends to our shareholders, as required for us to qualify, and maintain our status, as a REIT. We also cannot assure you that Darden will elect to renew the lease arrangements with us upon expiration of the initial base terms or any renewal terms thereof or, if such leases are not renewed, that we can remarket the affected properties on the same or better terms. See “Risk Factors-Risks Related to Our Business - We are dependent on Darden successfully operating its business, and a failure do so could have a material adverse effect on our business, financial position or results of operations. Therefore, we are subject to factors which affect the performance of Darden.”
Franchise Agreements
Pursuant to the Franchise Agreements, Darden grants the right and license to our subsidiary, Kerrow, to operate the Kerrow Restaurant Operating Business. The Franchise Agreements include, among other things, a license to display trademarks, utilize trade secrets and purchase proprietary products from Darden. Other services to be included pursuant to the Franchise Agreements are marketing services, training and access to certain LongHorn® operating procedures. The Franchise Agreements also contain provisions under which Darden may provide certain technical support for the Kerrow Restaurant Operating Business. The fees and conditions of these franchising services are on terms comparable to similar franchising services negotiated on an arm’s length basis and consistent with industry standard provisions.
Competition
We operate in a highly competitive market and face competition from other REITs, investment companies, private equity and hedge fund investors, sovereign funds, restaurant and retail operators, lenders and other investors, some of whom are significantly larger and have greater resources and lower costs of capital. These institutions may accept greater risk or lower returns, allowing them to offer more attractive terms to prospective tenants or for the acquisition of restaurant properties. Our restaurant operations also face active competition with national and regional chains and locally-owned restaurants for guests, management and hourly personnel.
Governmental Regulations Affecting Properties
Property Environmental Considerations
As an owner and operator of real property, we are subject to various federal, state and local environmental and health and safety laws and regulations. Although we do not operate or manage most of our properties, we may be held primarily or jointly and severally liable for costs relating to the investigation and clean-up of any of our current or former properties at or from which there has been a release or threatened release of hazardous material, as well as other affected properties, regardless of whether we knew of or caused the contamination.
In addition to these costs, which are typically not limited by law or regulation and could exceed the property’s value, we or our tenants could be subject to other liabilities, including governmental penalties for violation of environmental, health and safety laws, liabilities for injuries to persons for exposure to hazardous materials, and damages to property or natural resources. Furthermore, some environmental laws can create a lien on the contaminated site in favor of the government for damages and the costs the government incurs in connection with such contamination or can restrict the manner in which a property may be used because of contamination. We also could be liable for the costs of remediating contamination at third party sites, e.g., landfills, where we send waste for disposal without regard to whether we comply with environmental laws in doing so.
Although the leases require our tenants to indemnify us for environmental liabilities, and although we intend to require our other operators and tenants to undertake to indemnify us for certain environmental liabilities, including environmental liabilities they cause, the amount of such liabilities could exceed the financial ability of Darden, or such other tenant or operator to indemnify us. The presence of contamination or the failure to remediate contamination may adversely affect our ability to sell, develop or lease the real estate or to borrow using the real estate as collateral.
8
As of February 24, 2017, we have not been notified by any governmental authority of, nor is management aware of, any non-compliance or liability with respect to environmental laws that management believes would have a material adverse effect on our business, financial position or results of operations.
Americans with Disabilities Act of 1990
The properties, as commercial facilities, are required to comply with Title III of the Americans with Disabilities Act of 1990 and similar state and local laws and regulations (collectively the “ADA”). Investigation of a property may reveal non-compliance with the ADA. The tenant has the primary responsibility for complying with the ADA, but we may incur costs if the tenant does not comply. As of February 24, 2017, we have not been notified by any governmental authority of, nor is management aware of, any non-compliance with the ADA that management believes would have a material adverse effect on our business, financial position or results of operations.
Other Regulations
State and local fire, life-safety and similar entities regulate the use of the properties. The tenant has the primary responsibility for complying with regulations but failure to comply could result in fines by governmental authorities, awards of damages to private litigants, or restrictions to conduct business on such properties.
Insurance
We require that our tenants maintain all customary lines of insurance on our properties and their operations, including comprehensive insurance and hazard insurance. The tenants under the Leases may have the ability to self-insure or use a captive provider with respect to its insurance obligations. We believe that the amount and scope of insurance coverage provided by our policies and the policies maintained by our tenants are customary for similarly situated companies in our industry. However, we cannot make any assurances that Darden or any other tenants in the future will maintain the required insurance coverages, and the failure by any of them to do so could have a material adverse effect on us.
Available Information
All filings we make with the Securities and Exchange Commission (the “SEC”), including this Annual Report on Form 10-K, our quarterly reports on Form 10-Q, and our current reports on Form 8-K, and any amendments to those reports are available for free on our website,
www.fcpt.com,
as soon as
reasonably practicable after they are filed with, or furnished to, the SEC. We do not intend our website to be an active link or to otherwise incorporate the information contained on our website into this report or other filings with the SEC. Our SEC filings are also available to be read or copied at the SEC’s public reference room, located at 100 F Street, N.E., Washington, D.C. 20549. Information regarding the operation of the public reference room can be obtained by calling the SEC at 1-800-SEC-0330. Our filings can also be obtained for free on the SEC’s Internet website at
www.sec.gov.
We are providing our website address solely for the information of investors.
9
Various risks and uncertainties could affect our business. Any of the risks described below or elsewhere in this report or our other filings with the SEC could have a material impact on our business, financial condition or results of operations. It is not possible to predict or identify all risk factors. Additional risks and uncertainties not presently known to us or that we currently believe to be immaterial may also impair our business operations.
Risks Related to Our Business
We are dependent on Darden to make payments to us and fulfill its obligations under its leases, as well as to provide services to us under the Franchise Agreements, and an event that materially and adversely affects Darden’s business, financial position or results of operations could materially and adversely affect our business, financial position or results of operations.
Currently, Darden is our primary lessee in our lease portfolio and, therefore, is the source of substantially all of our revenues. Additionally, because Darden’s leases with us are triple-net leases, we depend on Darden to pay all insurance, taxes, utilities, common area maintenance charges, maintenance and repair expenses and to indemnify, defend and hold us harmless from and against various claims, litigation and liabilities arising in connection with its business, including any environmental liabilities. There can be no assurance that Darden will have sufficient assets, income and access to financing to enable it to satisfy its payment obligations to us under its leases. The inability or unwillingness of Darden to meet its rent obligations to us under any of its leases could materially adversely affect our business, financial position or results of operations, including our ability to pay dividends to our stockholders as required to maintain our status as a REIT. The inability of Darden to satisfy its other obligations under its leases with us, such as the payment of insurance, taxes and utilities could materially and adversely affect the condition of our properties.
Since Darden Restaurants, Inc. is a holding company, it is dependent to an extent on distributions from its direct and indirect subsidiaries in order to satisfy the payment obligations under its leases with us, and the ability of Darden to make such distributions may be adversely impacted in the event of the insolvency or bankruptcy of such entities or by covenants in its debt agreements or otherwise that restrict the amount of the distributions that may be made by such entities. For these reasons, if Darden were to experience a material and adverse effect on its business, financial position or results of operations, our business, financial position or results of operations could also be materially and adversely affected.
Due to our dependence on rental payments from Darden as our primary source of revenues, we may be limited in our ability to enforce our rights under, or to terminate, our leases with Darden. Failure by Darden to comply with the terms of its leases with us could require us to find other lessees for some or all of the properties and there could be a decrease or cessation of rental payments by Darden.
There is no assurance that we would be able to lease any of our properties to other lessees on substantially equivalent or better terms than any of our leases with Darden, or at all, successfully reposition our properties for other uses or sell our properties on terms that are favorable to us. It may be more difficult to find a replacement tenant for a restaurant or retail property than it would be to find a replacement tenant for a general commercial property due to the specialized nature of the business.
In addition, our operation of the Kerrow Restaurant Operating Business depends on the provision of services to us by Darden pursuant to the Franchise Agreements. The Franchise Agreements provide that Darden agrees to provide certain franchising services to our subsidiary, Kerrow. The franchising services include licensing the right to use and display certain trademarks, utilize trade secrets and purchase proprietary products from Darden in connection with the operation of the Kerrow Restaurant Operating Business. Other services provided pursuant to the Franchise Agreements are marketing services, training and access to certain LongHorn operating procedures. The Franchise Agreements also contain provisions under which Darden may provide certain technical support for the Kerrow Restaurant Operating Business.
The risk factor immediately below describes certain risks that may impact the performance of Darden. Additional risks relating to Darden’s business can be found in Darden’s public filings with the SEC. You can get copies of these public filings, for free on Darden’s website,
www.darden.com.
Darden’s SEC filings are also available to be read or copied at the SEC’s public reference room, located at 100 F Street, N.E., Washington, D.C. 20549. Information regarding the operation of the public reference room can be obtained by calling the SEC at 1-800-SEC-0330. Darden’s filings can also be obtained for free on the SEC’s Internet website
10
at
www.sec.gov
.
We are providing Darden’s website address solely for the information of investors. We do not intend Darden’s website to be an active link or to otherwise incorporate the information contained on Darden’s website into this report or other filings with the SEC.
We are dependent on Darden successfully operating its business, and a failure do so could have a material adverse effect on our business, financial position or results of operations. Therefore, we are subject to factors which affect the performance of Darden.
Currently, Darden constitutes approximately 95% of our annual base rent. As a result, we are dependent on Darden successfully operating its business and fulfilling its obligations to us that depends, in part, on the overall performance and profitability of Darden. Factors which may impact the business, financial position or results of operations of Darden include the following:
|
•
|
food safety and food-borne illness concerns throughout the supply chain; health concerns arising from food-related pandemics, outbreaks of flu viruses or other diseases;
|
|
•
|
litigation, including allegations of illegal, unfair or inconsistent employment practices;
|
|
•
|
unfavorable publicity, or a failure to respond effectively to adverse publicity;
|
|
•
|
labor and insurance costs;
|
|
•
|
insufficient guest or employee facing technology, or a failure to maintain a continuous and secure cyber network, free from material failure, interruption or security breach;
|
|
•
|
Darden’s inability or failure to execute a comprehensive business continuity plan following a major natural disaster such as a hurricane or man-made disaster, including terrorism;
|
|
•
|
Darden’s failure to drive both short-term and long-term profitable sales growth through brand relevance, operating excellence, opening new restaurants of existing brands and developing or acquiring new dining brands;
|
|
•
|
a lack of suitable new restaurant locations or a decline in the quality of the locations of Darden’s current restaurants;
|
|
•
|
a failure to identify and execute innovative marketing and guest relationship tactics and ineffective or improper use of social media or other marketing initiatives; an inability or failure to recognize, respond to and effectively manage the accelerated impact of social media;
|
|
•
|
a failure to address cost pressures, including rising costs for commodities, health care and utilities used by Darden’s restaurants, and a failure to effectively deliver cost management activities and achieve economies of scale in purchasing;
|
|
•
|
the impact of shortages or interruptions in the delivery of food and other products from third-party vendors and suppliers;
|
|
•
|
disruptions in the financial markets that may impact consumer spending patterns, affect the availability and cost of credit and increase pension plan expenses;
|
|
•
|
economic and business factors specific to the restaurant industry and other general macroeconomic factors including energy prices and interest rates that are largely out of Darden’s control; and
|
|
•
|
a failure of Darden’s internal controls over financial reporting and future changes in accounting standards.
|
A significant portion of our restaurant properties are Olive Garden properties. Therefore, we are subject to risks associated with having a highly concentrated property brand base.
As of December 31, 2016, our restaurant properties include 299 Olive Garden restaurants. As a result, our success, at least in the short-term, is dependent on the continued success of the Olive Garden brand and, to a lesser extent, Darden’s other restaurant brands. We believe that building brand value is critical to increasing demand and building customer loyalty. Consequently, if market recognition or the positive perception of the Olive Garden or other Darden brands is reduced or compromised, the value associated with Olive Garden or other Darden-branded properties in our portfolio may be adversely affected.
11
We intend to continue to pursue acquisitions of additional properties and seek other strategic opportunities, which may result in the use of a significant amount of management resources or significant costs, and we may not fully realize the potential benefits of such transactions.
In 2016, FCPT acquired 59 properties in 13 transactions for a total investment of $94.1 million which were added to our leasing portfolio. We intend to continue to pursue acquisitions of additional properties and seek acquisitions and other strategic opportunities, including, but not limited to, continuing to expand our tenant base to third parties other than Darden. Accordingly, we may often be engaged in evaluating potential transactions, potential new tenants and other strategic alternatives. In addition, from time to time, we may engage in discussions that may result in one or more transactions. Although there is uncertainty that any of these discussions will result in definitive agreements or the completion of any transaction, we may devote a significant amount of our management resources to such a transaction, which could negatively impact our operations. We may incur significant costs in connection with seeking acquisitions or other strategic opportunities regardless of whether the transaction is completed and in combining our operations if such a transaction is completed. In the event that we consummate an acquisition or strategic alternative in the future, there is no assurance that we would fully realize the potential benefits of such a transaction.
We operate in a highly competitive market and face competition from other REITs, investment companies, private equity and hedge fund investors, sovereign funds, restaurant and retail operators, lenders and other investors, some of whom are significantly larger and have greater resources and lower costs of capital. Increased competition will make it more challenging to identify and successfully capitalize on acquisition opportunities that meet our investment objectives. Our Board of Directors may change our investment objectives at any time without stockholder approval. If we cannot identify and purchase a sufficient quantity of suitable properties at favorable prices or if we are unable to finance acquisitions on commercially favorable terms, our business, financial position or results of operations could be materially and adversely affected. Additionally, the fact that we must distribute 90% of our net taxable income in order to maintain our qualification as a REIT may limit our ability to rely upon rental payments from our leased properties or subsequently acquired properties in order to finance acquisitions and other strategic opportunities. As a result, if debt or equity financing is not available on acceptable terms, our ability to pursue further acquisitions might be limited or curtailed.
Acquisitions of properties we might seek to acquire entail risks associated with real estate investments generally, including that the investment’s performance will fail to meet expectations or that the tenant, operator or manager will underperform.
Our level of indebtedness could materially and adversely affect our financial position, including reducing funds available for other business purposes and reducing our operational flexibility, and we may have future capital needs and may not be able to obtain additional financing on acceptable terms.
We have entered into a $750 million Credit Facility providing for a $400 million term loan due in November 2020 and a $350 million revolving credit facility with an available facility amount through November 2019, each of which are provided by a syndicate of banks and other financial institutions. The term loan facility is fully drawn and the revolving credit facility had drawn $45 million at December 31, 2016, with $305 million remaining capacity. We may incur additional indebtedness in the future to refinance our existing indebtedness, to finance newly-acquired assets or for other purposes. Our governing documents do not contain any limitations on the amount of debt we may incur and we do not have a formal policy limiting the amount of debt we may incur in the future. Subject to the restrictions, if any, set forth in our debt agreements, our Board of Directors may establish and change our leverage policy at any time without stockholder approval. Any significant additional indebtedness could require a substantial portion of our cash flow to make interest and principal payments due on our indebtedness. Greater demands on our cash resources may reduce funds available to us to pay dividends, make capital expenditures and acquisitions, or carry out other aspects of our business strategy. Increased indebtedness can also limit our ability to adjust rapidly to changing market conditions, make us more vulnerable to general adverse economic and industry conditions and create competitive disadvantages for us compared to other companies with relatively lower debt levels. Increased future debt service obligations may limit our operational flexibility, including our ability to acquire assets, finance or refinance our assets, contribute assets to joint ventures or sell assets as needed.
Moreover, our ability to obtain additional financing and satisfy our financial obligations under our indebtedness outstanding from time to time will depend upon our future operating performance, which is subject to then prevailing general economic and credit market conditions, including interest rate levels and the availability of credit generally, and financial, business and other
12
factors, many of which are beyond our control. A worsening of credit market conditions could materially and adversely affect our ability to obtain financing on favorable terms, if at all.
We also may be unable to obtain additional financing or financing on favorable terms or our operating cash flow may be insufficient to satisfy our financial obligations under our indebtedness outstanding from time to time. Among other things, although we received an investment grade credit rating of BBB- from Fitch Ratings in January 2017, any credit rating downgrade could increase our financing costs and could limit our access to financing sources. If financing is not available when needed, or is available on unfavorable terms, we may be unable to complete acquisitions or otherwise take advantage of business opportunities or respond to competitive pressures, any of which could materially and adversely affect our business, financial condition and results of operations.
Covenants in our debt agreements may limit our operational flexibility, and a covenant breach or default could materially and adversely affect our business, financial position or results of operations.
The agreements governing our indebtedness contain customary covenants that may limit our operational flexibility. The credit agreement contains customary affirmative and negative covenants that, among other things, restrict, subject to certain exceptions, the incurrence of debt, the incurrence of secured debt, the ability of Four Corners OP and the guarantors to enter into mergers, consolidations, sales of assets and similar transactions, limitations on distributions and other restricted payments, and limitations on transactions with affiliates and customary reporting obligations.
In addition, we are required to comply with the following financial covenants: (1) total indebtedness to consolidated capitalization value not to exceed 60%; (2) mortgage-secured leverage ratio not to exceed 40%; (3) total secured recourse indebtedness not to exceed 5% of consolidated capitalization value; (4) minimum fixed charge coverage ratio of 1.75 to 1.00; (5) minimum consolidated tangible net worth; (6) unhedged floating rate debt not to exceed 50% of all indebtedness; (7) maximum unencumbered leverage ratio not to exceed 60%; and (8) minimum unencumbered debt service coverage ratio of 1.50 to 1.00. As of December 31, 2016, we are in compliance with our existing financial covenants.
The credit agreement contains customary events of default including, without limitation, payment defaults, violation of covenants and other performance defaults, defaults on payment of indebtedness and monetary obligations, bankruptcy-related defaults, judgment defaults, REIT status default and the occurrence of certain change of control events. Breaches of certain covenants may result in defaults and cross-defaults under certain of our other indebtedness, even if we satisfy our payment obligations to the respective obligee.
Covenants that limit our operational flexibility, as well as covenant breaches or defaults under our debt instruments, could materially and adversely affect our business, financial position or results of operations, or our ability to incur additional indebtedness or refinance existing indebtedness.
An increase in market interest rates could increase our interest costs on existing and future debt and could adversely affect our stock price, and a decrease in market interest rates could lead to additional competition for the acquisition of real estate, which could adversely affect our results of operations.
If interest rates increase, so could our interest costs for any new debt and our variable rate debt obligations pursuant to the credit agreement. This increased cost could make the financing of any acquisition more expensive as well as lower our current period earnings. Rising interest rates could limit our ability to refinance existing debt when it matures or cause us to pay higher interest rates upon refinancing. In addition, an increase in interest rates could decrease the access third parties have to credit, thereby decreasing the amount they are willing to pay to lease our assets and consequently limiting our ability to reposition our portfolio promptly in response to changes in economic or other conditions. Furthermore, the dividend yield on our common stock, as a percentage of the price of such common stock, will influence the price of such common stock. Thus, an increase in market interest rates may lead prospective purchasers of our common stock to expect a higher dividend yield, which could adversely affect the market price of our common stock. In addition, decreases in interest rates may lead to additional competition for the acquisition of real estate due to a reduction in desirable alternative income-producing investments. Increased competition for the acquisition of real estate may lead to a decrease in the yields on real estate we have targeted for acquisition. In such circumstances, if we are not able to offset the decrease in yields by obtaining lower interest costs on our borrowings, our results of operations will be adversely affected.
13
Hedging transactions could have a negative effect on our results of operations.
We have entered into hedging transactions with respect to interest rate exposure on our term loan and we may enter into other hedging transactions, with respect to one or more of our assets or other liabilities. The use of hedging transactions involves certain risks, including: (1) the possibility that the market will move in a manner or direction that would have resulted in a gain for us had a hedging transaction not been used, in which case our performance would have been better had we not engaged in the hedging transaction; (2) the risk of an imperfect correlation between the risk sought to be hedged and the hedging transaction used; (3) the potential illiquidity for the hedging instrument used, which may make it difficult for us to close out or unwind a hedging transaction; (4) the possibility that our counterparty fails to honor its obligations; and (5) the possibility that we may have to post collateral to enter into hedging transactions, which we may lose if we are unable to honor our obligations. Our election to be subject to tax as a REIT will also result in limitations on our income sources, and the hedging strategies available to us will be more limited than those available to companies that are not REITs.
Our pursuit of investments in, and acquisitions or development of, additional properties may be unsuccessful or fail to meet our expectations.
Investments in and acquisitions of restaurant and retail properties and other properties we might seek to acquire entail risks associated with real estate investments generally, including that the investment’s performance will fail to meet expectations, that the cost estimates for necessary property improvements will prove inaccurate or that the tenant, operator or manager will underperform. Real estate development projects present other risks, including construction delays or cost overruns that increase expenses, the inability to obtain required zoning, occupancy and other governmental approvals and permits on a timely basis, and the incurrence of significant development costs prior to completion of the project.
Our charter restricts the ownership and transfer of our outstanding stock, which may have the effect of delaying, deferring or preventing a transaction or change of control of our company.
In order for us to qualify as a REIT, not more than 50% in value of our outstanding shares of stock may be owned, beneficially or constructively, by five or fewer individuals at any time during the last half of each taxable year after the first year for which we elect to be subject to tax and qualify as a REIT. Additionally, at least 100 persons must beneficially own our stock during at least 335 days of a taxable year (other than the first taxable year for which we elect to be subject to tax and qualify as a REIT). Our charter, with certain exceptions, authorizes our Board of Directors to take such actions as are necessary or advisable to preserve our qualification as a REIT. Our charter also provides that, unless exempted by the Board of Directors, no person may own more than 9.8% in value or in number, whichever is more restrictive, of the outstanding shares of our common stock or more than 9.8% in value of the aggregate of the outstanding shares of all classes and series of our stock. The constructive ownership rules are complex and may cause shares of stock owned directly or constructively by a group of related individuals or entities to be constructively owned by one individual or entity. These ownership limits could delay or prevent a transaction or a change in control of us that might involve a premium price for shares of our stock or otherwise be in the best interests of our stockholders. The acquisition of less than 9.8% of our outstanding stock by an individual or entity could cause that individual or entity to own constructively in excess of 9.8% in value of our outstanding stock, and thus violate our charter’s ownership limit. Our charter also prohibits any person from owning shares of our stock that would result in our being “closely held” under Section 856(h) of the Internal Revenue Code of 1986, as amended (the “Code”) or otherwise cause us to fail to qualify as a REIT. In addition, our charter provides that (i) no person shall beneficially own shares of stock to the extent such beneficial ownership of stock would result in us failing to qualify as a “domestically controlled qualified investment entity” within the meaning of Section 897(h) of the Code, and (ii) no person shall beneficially or constructively own shares of stock to the extent such beneficial or constructive ownership would cause us to own, beneficially or constructively, more than a 9.9% interest (as set forth in Section 856(d)(2)(B) of the Code) in a tenant of our real property. Subject to certain exceptions, rents received or accrued by us from a tenant will not be treated as qualifying rent for purposes of the REIT gross income requirements if we or a beneficial or constructive owner of 10% or more of our stock beneficially or constructively owns 10% or more of the total combined voting power of all classes of the tenant’s stock entitled to vote or 10% or more of the total value of all classes of the tenant’s stock. Any attempt to own or transfer shares of our stock in violation of these restrictions may result in the transfer being automatically void. Our charter also provides that shares of our capital stock acquired or held in excess of the ownership limit will be transferred to a trust for the benefit of a charitable beneficiary that we designate, and that any person who acquires shares of our capital stock in violation of the ownership limit will not be entitled to any dividends on the shares or be entitled to vote the shares or receive any proceeds from the subsequent
14
sale of the shares in excess of the lesser of the market price on the day the shares were transferred to the trust or the amount realized from the sale. We or our designee will have the right to purchase the shares from the trustee at this calculated price as well. A transfer of shares of our capital stock in violation of the limit may be void under certain circumstances. Our 9.8% ownership limitation may have the effect of delaying, deferring or preventing a change in control, including an extraordinary transaction (such as a merger, tender offer or sale of all or substantially all of our assets) that might provide a premium price for our stockholders.
Maryland law and provisions in our charter and bylaws may delay or prevent takeover attempts by third parties and therefore inhibit our stockholders from realizing a premium on their stock.
Our charter and bylaws contain, and Maryland law contains, provisions that may deter coercive takeover practices and inadequate takeover bids and encourage prospective acquirors to negotiate with our Board of Directors, rather than to attempt a hostile takeover. Our charter and bylaws, among other things, (1) contain transfer and ownership restrictions on the percentage by number and value of outstanding shares of our stock that may be owned or acquired by any stockholders; (2) permit the Board of Directors, without further action of the stockholders, to increase or decrease the authorized number of shares, issue additional shares, classify or reclassify unissued shares, and issue and fix the terms of one or more classes or series of preferred stock, which may have rights senior to those of the common stock; (3) establish certain advance notice procedures for stockholder proposals and director nominations; and (4) provide that special meetings of stockholders may only be called by the company or upon written request of ten percent in voting power of our outstanding common stock.
Under Maryland law, any written consent of our stockholders must be unanimous. In addition, Maryland law allows a Maryland corporation with a class of equity securities registered under the Exchange Act to amend its charter without stockholder approval to effect a reverse stock split at a ratio of not more than ten shares of stock into one share of stock in any twelve-month period.
If we are not able to hire, or if we lose, key management personnel, we may not be able to successfully manage our business and achieve our objectives.
Our success depends in large part upon the leadership and performance of our executive management team and other key employees and our ability to attract other key personnel to our business. If we are unable to hire, or if we lose the services of, our executive management team or we are not able to hire or we lose other key employees, we may not be able to successfully manage our business or achieve our business objectives.
The failure of any of our tenants to fulfill its maintenance obligations may have a materially adverse effect on our ability to operate and grow our business.
The failure of any of our tenants to fulfill its maintenance obligations may cause us to incur significant and unexpected expenses to remediate any resulting damage to the property. Furthermore, the failure by Darden, any other tenant or any future tenant to adequately maintain a leased property could adversely affect our ability to timely re-lease the property to a new tenant or otherwise monetize our investment in the property if we are forced to make significant repairs or changes to the property as a result of the tenant’s neglect. If we incur significant additional expenses or are delayed in being able to pursue returns on our real estate investments, it may have a materially adverse effect on our ability to operate and grow our business and our ability to achieve our strategic objectives.
We or our tenants may experience uninsured or underinsured losses, which could result in a significant loss of the capital we have invested in a property, decrease anticipated future revenues or cause us to incur unanticipated expense.
Our current lease agreements generally require, and new lease agreements that we enter into are expected to require, that the tenant maintain comprehensive insurance and hazard insurance or self-insure its obligations. However, we cannot assure you that we will continue to require the same levels of insurance coverage under our lease agreements, that such insurance will be available at a reasonable cost in the future or that the insurance coverage provided will fully cover all losses on our properties upon the occurrence of a catastrophic event, nor can we assure you of the future financial viability of the insurers. Certain types of losses, generally of a catastrophic nature, such as earthquakes, hurricanes and floods, may be uninsurable or not economically insurable by us or by our tenants. Insurance coverage may not be sufficient to pay the full current market value or current replacement cost of a loss. Inflation, changes in building codes and ordinances, environmental considerations and other factors might also make it unfeasible to use insurance proceeds to replace the property after such property has been damaged or destroyed. Under such
15
circumstances, the insurance proceeds received might not be adequate to restore the economic position with respect to such property.
While the tenants under our leases generally indemnify, defend and hold us harmless for the foregoing liabilities, there can be no assurance that the respective tenant will have sufficient assets, income or access to financing to enable it to satisfy its payment obligations to us under its lease.
Properties in our leasing portfolio and the Kerrow Restaurant Operating Business are located in 44 states, and if one of our properties experiences a loss that is uninsured or that exceeds policy coverage limits, we could lose the capital invested in the damaged property as well as the anticipated future cash flows from the property. If the damaged property is subject to recourse indebtedness, we could continue to be liable for the indebtedness even if the property is irreparably damaged.
In addition, even if damage to our properties is covered by insurance, a disruption of business caused by a casualty event may result in loss of revenue for our tenants or us. Any business interruption insurance may not fully compensate them or us for such loss of revenue. If one of our tenants experiences such a loss, it may be unable to satisfy its payment obligations to us under its lease with us.
Our relationship with Darden may adversely affect our ability to do business with third-party restaurant operators and other tenants.
Darden is our primary tenant in our lease portfolio, and our revenue consists primarily of rental payments from Darden. We may be viewed by third-party restaurant operators and other potential tenants or parties to sale-leaseback transactions as being closely affiliated with Darden. As these third-party restaurant operators and other potential transaction parties may compete with Darden within the restaurant industry, our perceived affiliation with Darden could make it difficult for us to attract tenants and other transaction partners beyond Darden, particularly in the restaurant industry. If we are unable to diversify our tenant and transaction partner base further beyond Darden, it may have a materially adverse effect on our ability to operate and grow our business and our ability to achieve our strategic objectives.
The ownership by our executive officers and directors of common stock, options or other equity awards of Darden may create, or may create the appearance of, conflicts of interest.
As a result of his former positions with Darden, Mr. Lenehan owns common stock, including restricted stock, in both Darden and FCPT. In addition, there is no restriction on our executive officers and directors acquiring Darden common stock in the future, and, therefore, this ownership of common stock of both Darden and FCPT may be significant. Equity interests in Darden may create, or appear to create, conflicts of interest when any such director or executive officer is faced with decisions that could benefit or affect the equity holders of Darden in ways that do not benefit or affect us in the same manner. As of December 31, 2016, no other executive officer or director of FCPT owns common stock of Darden.
Real estate investments are relatively illiquid and provisions in our lease agreements may adversely impact our ability to sell properties and could adversely impact the price at which we can sell the properties.
Properties in our leasing portfolio and the properties leased to Kerrow represent a substantial portion of our total consolidated assets, and these investments are relatively illiquid. As a result, our ability to sell one or more of our properties or other investments in real estate we may make in response to any changes in economic or other conditions may be limited. If we want to sell a property, we cannot assure you that we will be able to dispose of it in the desired time period, or at all, or that the sale price of a property will exceed the cost of our investment in that property.
In addition, the properties subject to leases with Darden provide them a right of first offer with respect to our sale of any Property, provided there is no default under the lease, and we are prohibited from selling any of our properties to (i) any nationally recognized casual or fine dining brand restaurant or entity operating the same or (ii) any other regionally recognized casual or fine dining brand restaurant or entity operating the same, with 25 or more units. The existence of these provisions in our leases with Darden, which survive for the full term of the relevant lease, could adversely impact our ability to sell any of the Properties and could adversely impact our ability to obtain the highest possible price for any of the Properties. If we seek to sell any of our properties, we would not be able to offer the properties to potential purchasers through a competitive bid process or in a similar manner designed to maximize the value obtained without first offering to sell to Darden and we would be restricted in the potential
16
purchasers who could buy the properties, which may adversely impact our ability to sell any of the properties in a timely manner, or at all, or adversely impact the price we can obtain from such sale.
We are dependent on the restaurant industry and may be susceptible to the risks associated with it, which could materially adversely affect our business, financial position or results of operations.
As the owner of properties serving the restaurant industry, we are impacted by the risks associated with the restaurant industry. Therefore, our success is to some degree dependent on the restaurant industry, which could be adversely affected by economic conditions in general, changes in consumer trends and preferences and other factors over which we, Darden, and any of our other tenants in the restaurant industry have no control. As we are subject to risks inherent in substantial investments in a single industry, a decrease in the restaurant business would likely have a greater adverse effect on our revenues than if we owned a more diversified real estate portfolio.
The restaurant industry is characterized by a high degree of competition among a large number of participants. Competition is intense between national and regional restaurant chains and locally-owned restaurants in most of the markets where our properties are located. As competing properties are constructed, the lease rates we assess for our properties may be negatively impacted upon renewal or new tenant pricing events.
Our tenants’ businesses are subject to government regulations and changes in current or future laws or regulations could restrict their ability to operate both their and our business in the manner currently contemplated.
The restaurant industry is subject to extensive federal, state and local and international laws and regulations. The development and operation of restaurants depend to a significant extent on the selection and acquisition of suitable sites, which are subject to building, zoning, land use, environmental, traffic and other regulations and requirements. Our tenants are subject to licensing and regulation by state and local authorities relating to wages and hours, healthcare, health, sanitation, safety and fire standards and the sale of alcoholic beverages. Our tenants are also subject to, among other laws and regulations, laws and regulations relating to the preparation and sale of food, including regulations regarding product safety, nutritional content and menu labeling. The impact of current laws and regulations, the effect of future changes in laws or regulations that impose additional requirements and the consequences of litigation relating to current or future laws and regulations, or an insufficient or ineffective response to significant regulatory or public policy issues, could have an adverse effect on our tenants’ results of operations, which could also adversely affect our business, results of operations or financial condition as we depend on our tenants for almost the entirety of our revenue.
Environmental compliance costs and liabilities associated with real estate properties owned by us may materially impair the value of those investments.
As an owner and operator of real property, we are subject to various federal, state and local environmental and health and safety laws and regulations. We may be held primarily or jointly and severally liable for costs relating to the investigation and clean-up of any of our current or former properties at or from which there has been a release or threatened release of hazardous materials as well as other affected properties, regardless of whether we knew of or caused the contamination.
In addition to these costs, which are typically not limited by law or regulation and could exceed the property’s value, we or our tenants could be subject to other liabilities, including governmental penalties for violation of environmental, health and safety laws, liabilities for injuries to persons for exposure to hazardous materials, and damages to property or natural resources. Furthermore, some environmental laws can create a lien on the contaminated site in favor of the government for damages and the costs the government incurs in connection with such contamination or can restrict the manner in which a property may be used because of contamination. We also could be liable for the costs of remediating contamination at third party sites, e.g., landfills, where we send waste for disposal without regard to whether we comply with environmental laws in doing so.
The presence of contamination or the failure to remediate contamination may adversely affect our ability to sell, develop or lease the real estate or to borrow using the real estate as collateral.
17
While the tenants under our leases generally indemnify, defend and hold us harmless for the foregoing liabilities, there can be no assurance that the respective tenant will have sufficient assets, income or access to financing to enable it to satisfy its payment obligations to us under its lease.
We may be subject to liabilities and costs associated with the impacts of climate change.
The potential physical impacts of climate change on our properties or operations are highly uncertain and would be particular to the geographic circumstances in areas in which we operate, including Florida, Georgia and Texas. Such impacts may result from changes in rainfall and storm patterns and intensities, water shortages, changing sea levels, rising energy and environmental costs, and changing temperatures. These impacts may adversely impact our business, results of operations and financial condition, including our or our tenants’ ability to obtain property insurance on acceptable terms.
While the tenants under our leases generally indemnify, defend and hold us harmless for the foregoing liabilities, there can be no assurance that the respective tenant will have sufficient assets, income or access to financing to enable it to satisfy its payment obligations to us under its lease.
Compliance with the Americans with Disabilities Act and fire, safety and other regulations may require us to make unanticipated expenditures that materially adversely impact our cash flow.
All of our properties are required to comply with Title III of the Americans with Disabilities Act, or the ADA. The ADA generally requires that buildings be made accessible to people with disabilities. Compliance with the ADA requirements could require, for example, removal of access barriers and non-compliance could result in the imposition of fines by the U.S. Government or an award of damages to private litigants, or both. While the tenants to whom we lease properties are obligated by law to comply with the ADA provisions, under the law we are also legally responsible for our properties’ ADA compliance. If required changes involve greater expenditures than anticipated, or if the changes must be made on a more accelerated basis than anticipated, the ability of our tenants to cover costs could be adversely affected and we could be required to expend our own funds to comply with the provisions of the ADA, which could have an adverse effect on our financial condition and our ability to make distributions. State and local laws may also require modifications to our properties related to access by disabled persons. In addition, we are required to operate our properties in compliance with fire and safety regulations, building codes and other land use regulations, as they may be adopted by governmental agencies and bodies and become applicable to our properties. We may be required to make substantial capital expenditures to comply with those requirements and these expenditures could have a material adverse effect on our cash flow and ability to make distributions to our security holders.
While the tenants under our leases generally indemnify, defend and hold us harmless for the foregoing liabilities, there can be no assurance that the respective tenant will have sufficient assets, income or access to financing to enable it to satisfy its payment obligations to us under its lease.
Our active management and operation of a restaurant business may expose us to potential liabilities beyond those traditionally associated with REITs.
In addition to our real estate investment activities, we also manage and operate the Kerrow Restaurant Operating Business, which consists of six LongHorn Steakhouse
®
restaurants located in the San Antonio, Texas area. Managing and operating the Kerrow Restaurant Operating Business requires us to employ significantly more people than a REIT which did not operate a business of such type and scale. In addition, managing and operating an active restaurant business exposes us to potential liabilities associated with the operation of restaurants. Such potential liabilities are not typically associated with REITs and include potential liabilities for wage and hour violations, guest discrimination, food safety issues including poor food quality, food-borne illness, food tampering, food contamination, workplace injury, and violation of “dram shop” laws (providing an injured party with recourse against an establishment that serves alcoholic beverages to an intoxicated party who then causes injury to himself or a third party). In the event that one or more of the potential liabilities associated with managing and operating an active restaurant business materializes, such liabilities could damage the reputation of the Kerrow Restaurant Operating Business as well as the reputation of FCPT, and could adversely affect our financial position and results of operations, possibly to a material degree.
18
If our security measures are breached, we may face liability and public perception of our services could be diminished, which would negatively impact our ability to attract business partners and advertisers.
Our security measures are not perfect or impenetrable, and we may be unable to anticipate or prevent unauthorized access. A cyber-attack or other security breach could occur due to the actions of outside parties, employee error, malfeasance or a combination of these or other actions. If an actual or perceived breach of our security occurs, we could lose competitively sensitive business information or suffer disruptions to our business operations. In addition, the public perception of the effectiveness of our security measures or services could be harmed, we could lose consumers, business partners and advertisers, and we could suffer financial exposure in connection with remediation efforts, investigations and legal proceedings and changes in our security and system protection measures.
Failure to maintain effective internal control over financial reporting in accordance with Section 404 of the Sarbanes-Oxley Act could materially and adversely affect our business and the market price of our common stock.
Under the Sarbanes-Oxley Act, we must maintain effective disclosure controls and procedures and internal control over financial reporting, which requires significant resources and management oversight. Internal control over financial reporting is complex and may be revised over time to adapt to changes in our business, or changes in applicable accounting rules. We cannot assure you that our internal control over financial reporting will be effective in the future or that a material weakness will not be discovered with respect to a prior period for which we had previously believed that internal controls were effective. Matters impacting our internal controls may cause us to be unable to report our financial data on a timely basis, or may cause us to restate previously issued financial data, and thereby subject us to adverse regulatory consequences, including sanctions or investigations by the SEC, or violations of applicable stock exchange listing rules. There could also be a negative reaction in the financial markets due to a loss of investor confidence in us and the reliability of our financial statements. Confidence in the reliability of our financial statements is also likely to suffer if we or our independent registered public accounting firm reports a material weakness in our internal control over financial reporting. This could materially adversely affect us by, for example, leading to a decline in the market price for our common stock and impairing our ability to raise capital.
Risks Related to Our Common Stock
The market price and trading volume of our common stock may be volatile and may face negative pressure including as a result of future sales or distributions of our common stock.
The market price of our common stock may be volatile in the future. In addition, the trading volume in our common shares may fluctuate and cause significant price variations to occur. It is not possible to accurately predict how investors in our common stock will behave.
Any disposition by a significant stockholder of our common stock, or the perception in the market that such dispositions could occur, may cause the price of our common stock to fall. Any such decline could impair our ability to raise capital through future sales of our common stock. Furthermore, our common stock may not qualify for investment indices, including indices specific to REITs, and any such failure may discourage new investors from investing in our common stock.
Our ability to engage in significant equity issuances will also be limited or restricted after our Spin-Off from Darden in order to preserve the tax-free nature of the Spin-Off. If and when additional funds are raised through the issuance of equity securities, including our common stock, our stockholders may experience significant dilution.
We cannot assure you of our ability to pay dividends in the future.
Our current dividend rate is $0.97 per share per annum. We may pay a portion of our dividends in common stock. In no event will the annual dividend be less than 90% of our REIT taxable income on an annual basis, determined without regard to the dividends paid deduction and excluding any net capital gains. Our ability to pay dividends may be adversely affected by a number of factors, including the risk factors described in this Annual Report on Form 10-K. Dividends will be authorized by our Board of Directors and declared by us based upon a number of factors, including actual results of operations, restrictions under Maryland law or applicable debt covenants, our financial condition, our taxable income, the annual distribution requirements under the REIT provisions of the Code, our operating expenses and other factors our directors deem relevant. We cannot assure you that we will
19
achieve investment results that will allow us to make a specified level of cash dividends or year-to-year increases in cash dividends in the future.
Furthermore, while we are required to pay dividends in order to maintain our REIT status (as described above in the risk factor “--
REIT distribution requirements could adversely affect our ability to execute our business plan”)
, we may elect not to maintain our REIT status, in which case we would no longer be required to pay such dividends. Moreover, even if we do elect to maintain our REIT status, after completing various procedural steps, we may elect to comply with the applicable distribution requirements by distributing, under certain circumstances, a portion of the required amount in the form of shares of our common stock in lieu of cash. If we elect not to maintain our REIT status or to satisfy any required distributions in shares of common stock in lieu of cash, such action could negatively affect our business and financial condition as well as the market price of our common stock. No assurance can be given that we will pay any dividends on shares of our common stock in the future.
Risks Related to Our Taxation as a REIT
If the Spin-Off were to fail to qualify as a tax-free transaction for U.S. federal income tax purposes, Darden and Darden’s shareholders could be subject to significant tax liabilities and, pursuant to indemnification obligations under the Tax Matters Agreement that we entered into with Darden, we could be required to indemnify Darden for material taxes.
Darden has received a private letter ruling (the “IRS Ruling”) from the Internal Revenue Service (the “IRS”) on certain specific issues relevant to the qualification of the Spin-Off as tax-free under Sections 368(a)(1)(D) and 355 of the Code, based on certain facts and representations set forth in such request. Although a private letter ruling from the IRS generally is binding on the IRS, if the factual representations made in the ruling request are untrue or incomplete in any material respect, then Darden will not be able to rely on the IRS Ruling. The IRS Ruling does not address all of the requirements for tax-free treatment of the Spin-Off under Sections 355 and 368(a)(1)(D) of the Code; however, Darden has received an opinion from Skadden, Arps, Slate, Meagher & Flom LLP (“Skadden, Arps”) (the “Spin-Off Tax Opinion”) to the effect that the Spin-Off qualifies as tax-free under Sections 368(a)(1)(D) and 355 of the Code. The Spin-Off Tax Opinion relies on the IRS Ruling as to matters covered by such ruling and is based on, among other things, current law and certain assumptions and representations as to factual matters made by Darden and us. Any change in currently applicable law, which may or may not be retroactive, or the failure of any factual representation or assumption to be true, correct and complete in all material respects, could adversely affect the conclusions reached by counsel in the Spin-Off Tax Opinion. The Spin-Off Tax Opinion is not binding on the IRS or the courts, and the IRS or the courts may not agree with the opinion. The Spin-Off Tax Opinion is expressed as of the date issued and does not cover subsequent periods. An opinion of counsel represents counsel’s best legal judgment based on current law and is not binding on the IRS or any court. We cannot assure you that the IRS will agree with the conclusions set forth in the Spin-Off Tax Opinion, and it is possible that the IRS or another tax authority could adopt a position contrary to one or all of those conclusions and that a court could sustain that contrary position. If any of the facts, representations, assumptions, or undertakings described or made in connection with the IRS Ruling or the Spin-Off Tax Opinion are not correct, are incomplete or have been violated, the IRS Ruling could be revoked retroactively or modified by the IRS, and our ability to rely on the Spin-Off Tax Opinion could be jeopardized. We are not aware of any facts or circumstances, however, that would cause these facts, representations, or assumptions to be untrue or incomplete, or that would cause any of these undertakings to fail to be complied with, in any material respect.
If the Spin-Off ultimately were determined to be taxable, then a shareholder of Darden that received shares of our common stock in the Spin-Off would be treated as having received a distribution of property in an amount equal to the fair market value of such shares on the distribution date and could incur significant income tax liabilities. Such distribution would be taxable to such shareholder as a dividend to the extent of Darden’s current and accumulated earnings and profits (including earnings and profits resulting from the recognition of gain by Darden in the Spin-Off). Any amount that exceeded Darden’s earnings and profits would be treated first as a non-taxable return of capital to the extent of such shareholder’s tax basis in its shares of Darden stock with any remaining amount being taxed as a capital gain. In addition, if the Spin-Off were determined to be taxable, in general, Darden would be required to recognize a taxable gain as if it had sold our common stock in a taxable sale for its fair market value.
Under the terms of the Tax Matters Agreement that we entered into with Darden, we generally will be responsible for any taxes imposed on Darden that arise from the failure of the Spin-Off to qualify as tax-free for U.S. federal income tax purposes to the extent such failure to qualify is attributable to certain actions, events or transactions relating to our stock, assets or business, or a breach of the relevant representations or any covenants made by us in the Tax Matters Agreement, the materials submitted to
20
the IRS in connection with the request for the IRS Ruling or the representations provided in connection with the Spin-Off Tax Opinion. Our indemnification obligations to Darden will not be limited by any maximum amount. If we are required to indemnify Darden under the circumstances set forth in the Tax Matters Agreement, we may also be subject to substantial tax liabilities.
We may not be able to engage in desirable strategic transactions and equity issuances following the Spin-Off because of certain restrictions relating to requirements for tax-free distributions for U.S. federal income tax purposes. In addition, we could be liable for adverse tax consequences resulting from engaging in significant strategic or capital-raising transactions.
To preserve the tax-free treatment to Darden of the Spin-Off, for the two-year period following the Spin-Off, we may be prohibited, except in specific circumstances, from taking certain actions, including: (1) entering into any transaction pursuant to which all or a portion of our stock would be acquired, whether by merger or otherwise, (2) issuing equity securities beyond certain thresholds, or (3) repurchasing our common stock. In addition, we may be prohibited from taking or failing to take any other action that prevents the Spin-Off and related transactions from being tax-free. However, these restrictions are inapplicable in the event that the IRS has granted a favorable ruling to Darden or us or in the event that Darden or we have received an opinion from counsel that we can take such actions under certain safe harbor exceptions without adversely affecting the tax-free status of the Spin-Off and related transactions.
These restrictions may limit our ability to pursue strategic transactions or engage in new business or other transactions that may increase the value of our business.
If we do not qualify as a REIT, or fail to remain qualified as a REIT, we will be subject to U.S. federal income tax as a regular corporation and could face a substantial tax liability, which would reduce the amount of cash available for distribution to our stockholders.
We believe that we were organized and operated and we intend to continue to operate in a manner that will enable us to qualify as a REIT for U.S. federal income tax purposes commencing with our taxable year ended January 1, 2016. Qualification as a REIT involves the application of highly technical and complex provisions of the Internal Revenue Code of 1986, as amended (the “Code”), for which only limited judicial and administrative authorities exist. Even a technical or inadvertent violation could jeopardize our REIT qualification. The determination of various factual matters and circumstances not entirely within our control may affect our ability to qualify as a REIT. Our qualification as a REIT depends on our satisfaction of certain asset, income, organizational, distribution, stockholder ownership and other requirements on a continuing basis. Our ability to satisfy the asset requirements depends upon our analysis of the fair market values of our assets, some of which are not susceptible to a precise determination, and for which we do not obtain independent appraisals. Our compliance with the REIT income and asset requirements also depends upon our ability to successfully manage the composition of our income and assets on an ongoing basis. Moreover, the proper classification of one or more of our investments may be uncertain in some circumstances, which could affect the application of the REIT qualification requirements. In addition, our ability to satisfy the requirements to qualify as a REIT may depend in part on the actions of third parties over which we have no control or only limited influence. Accordingly, there can be no assurance that the IRS will not contend that our investments violate the REIT requirements.
Darden received an opinion of Skadden, Arps, counsel to Darden, with respect to our qualification to be subject to tax as a REIT in connection with the Spin-Off. Investors should be aware, however, that opinions of counsel are not binding on the IRS or any court (the “REIT Tax Opinion”). The REIT Tax Opinion represents only the view of Skadden, Arps, based on its review and analysis of existing law and on certain representations as to factual matters and covenants made by Darden and us, including representations relating to the values of our assets and the sources of our income. The opinion is expressed as of the date issued. Skadden, Arps has no obligation to advise Darden, us or the holders of our common stock of any subsequent change in the matters stated, represented or assumed or of any subsequent change in applicable law. Furthermore, both the validity of the REIT Tax Opinion and our qualification as a REIT will depend on our satisfaction of various complex requirements under the Code, relating to, among other things, the sources of our gross income, the composition and value of our assets, our distribution levels and the diversity of ownership of our shares on a continuing basis, the results of which will not be monitored by Skadden, Arps. Our ability to satisfy the asset tests depends upon our analysis of the characterization and fair market values of our assets, some of which are not susceptible to a precise determination, and for which we will not obtain independent appraisals.
21
If we were to fail to qualify as a REIT in any taxable year, we would be subject to U.S. federal income tax, including any applicable alternative minimum tax, on our taxable income at regular corporate rates, and distributions to stockholders would not be deductible by us in computing our taxable income. Any such corporate tax liability could be substantial and would reduce the amount of cash available for distribution to our stockholders, which in turn could have an adverse impact on the value of, and trading prices for, our common stock. Unless entitled to relief under certain provisions of the Code, we also would be disqualified from taxation as a REIT for the four taxable years following the year during which we initially ceased to qualify as a REIT.
The rule against re-electing REIT status following a loss of such status could also apply to us if it were determined that a former subsidiary of Darden failed to qualify as a REIT for certain taxable years and we were treated as a successor to such entity for U.S. federal income tax purposes. Although Darden has represented to us that it has no knowledge of any fact or circumstance that would cause us to fail to qualify as a REIT and covenanted to use its reasonable best efforts to cure any issue with respect to the REIT status of any such predecessor entity, no assurance can be given that such representation and covenant would prevent us from failing to qualify as a REIT. If we fail to qualify as a REIT due to the REIT status of a predecessor, we would be subject to corporate income tax as described in the preceding paragraph
We could fail to qualify as a REIT if income we receive from Darden and other tenants is not treated as qualifying income.
Under applicable provisions of the Code, we will not be treated as a REIT unless we satisfy various requirements, including requirements relating to the sources of our gross income. Rents received or accrued by us from Darden and other tenants will not be treated as qualifying rent for purposes of these requirements if our leases are not respected as true leases for U.S. federal income tax purposes and are instead treated as service contracts, joint ventures or other types of arrangements. If our leases are not respected as true leases for U.S. federal income tax purposes, we may fail to qualify as a REIT.
In addition, subject to certain exceptions, rents received or accrued by us from Darden will not be treated as qualifying rent for purposes of the REIT gross income requirements if we or a beneficial or constructive owner of 10% or more of our stock beneficially or constructively owns 10% or more of the total combined voting power of all classes of Darden stock entitled to vote or 10% or more of the total value of all classes of Darden stock. Our charter provides for restrictions on ownership and transfer of our shares of stock, including restrictions on such ownership or transfer that would cause the rents received or accrued by us from Darden to be treated as non-qualifying rent for purposes of the REIT gross income requirements. Nevertheless, there can be no assurance that such restrictions will be effective in ensuring that rents received or accrued by us from Darden will not be treated as qualifying rent for purposes of REIT qualification requirements.
Dividends payable by REITs do not qualify for the reduced tax rates available for some dividends.
The maximum U.S. federal income tax rate applicable to income from “qualified dividends” payable to U.S. stockholders that are individuals, trusts and estates is currently 20%. Dividends payable by REITs, however, generally are not eligible for the reduced rates. Although these rules do not adversely affect the taxation of REITs, the more favorable rates applicable to regular corporate qualified dividends could cause investors who are individuals, trusts and estates to perceive investments in REITs to be relatively less attractive than investments in the stocks of non-REIT corporations that pay dividends, which could adversely affect the value of the stock of REITs, including our common stock.
REIT distribution requirements could adversely affect our ability to execute our business plan.
We generally must distribute annually at least 90% of our REIT taxable income, determined without regard to the dividends paid deduction and excluding any net capital gains, in order for us to qualify as a REIT (assuming that certain other requirements are also satisfied). To the extent that we satisfy this distribution requirement and qualify for taxation as a REIT but distribute less than 100% of our REIT taxable income, determined without regard to the dividends paid deduction and including any net capital gains, we will be subject to U.S. federal corporate income tax on our undistributed net taxable income. In addition, we will be subject to a 4% nondeductible excise tax if the actual amount that we distribute to our stockholders in a calendar year is less than a minimum amount specified under U.S. federal tax laws. We intend to continue to make distributions to our stockholders to comply with the REIT requirements of the Code.
Currently our funds from operations are generated primarily by rents paid under our lease agreements. From time to time, we may generate taxable income greater than our cash flow as a result of differences in timing between the recognition of taxable
22
income and the actual receipt of cash or the effect of nondeductible capital expenditures, the creation of reserves or required debt or amortization payments. If we do not have other funds available in these situations, we could be required to borrow funds on unfavorable terms, sell assets at disadvantageous prices or distribute amounts that would otherwise be invested in future acquisitions to make distributions sufficient to enable us to pay out enough of our taxable income to satisfy the REIT distributions requirement and to avoid corporate income tax and the 4% excise tax in a particular year. These alternatives could increase our costs or reduce our equity or adversely impact our ability to raise short and long-term debt. Furthermore, the REIT distribution requirements may increase the financing needed to fund capital expenditures, further growth and expansion initiatives. Thus, compliance with the REIT requirements may hinder our ability to grow, which could adversely affect the value of our common stock.
Even if we qualify as a REIT, we may face other tax liabilities that reduce our cash flow.
Even if we qualify for taxation as a REIT, we may be subject to certain U.S. federal, state, and local taxes on our income and assets, including taxes on any undistributed income and state or local income, property and transfer taxes. Moreover, if we have net income from “prohibited transactions,” that income will be subject to a 100% tax. In general, prohibited transactions are sales or other dispositions of property held primarily for sale to customers in the ordinary course of business. The determination as to whether a particular sale is a prohibited transaction depends on the facts and circumstances related to that sale. While we will undertake sales of assets if those assets become inconsistent with our long-term strategic or return objectives, we do not believe that those sales should be considered prohibited transactions, but there can be no assurance that the IRS would not contend otherwise. The need to avoid prohibited transactions could cause us to forego or defer sales of properties that might otherwise be in our best interest to sell. In addition, any net taxable income earned directly by our TRSs will be subject to U.S. federal, state, and local corporate-level income taxes and we may incur a 100% excise tax on transactions with a TRS if they are not conducted on an arm’s-length basis. Any of these taxes would decrease cash available for distribution to our stockholders.
Complying with the REIT requirements may cause us to forego otherwise attractive acquisition and business opportunities or liquidate otherwise attractive investments.
To qualify as a REIT for U.S. federal income tax purposes, we must ensure that, at the end of each calendar quarter, at least 75% of the value of our assets consists of cash, cash items, government securities and “real estate assets” (as defined in the Code). The remainder of our investments (other than government securities, qualified real estate assets and securities issued by a TRS) generally cannot include more than 10% of the outstanding voting securities of any one issuer or more than 10% of the total value of the outstanding securities of any one issuer. In addition, in general, no more than 5% of the value of our total assets (other than government securities, qualified real estate assets and securities issued by a TRS) can consist of the securities of any one issuer, and no more than 25% (20% effective for taxable years beginning after December 31, 2017) of the value of our total assets can be represented by securities of one or more TRSs and no more than 25% of the value of our assets can be represented by certain debt instruments issued by “publicly offered REITs.” If we fail to comply with these requirements at the end of any calendar quarter, we must correct the failure within thirty days after the end of the calendar quarter or qualify for certain statutory relief provisions to avoid losing our REIT qualification and suffering adverse tax consequences. As a result, we may be required to liquidate or forego otherwise attractive investments. These actions could have the effect of reducing our income and amounts available for distribution to our stockholders.
In addition to the asset tests set forth above, to qualify as a REIT we must continually satisfy tests concerning, among other things, the sources of our income, the amounts we distribute to our stockholders and the ownership of our stock. We may be unable to pursue investments that would be otherwise advantageous to us in order to satisfy the source-of-income or asset-diversification requirements for qualifying as a REIT. Thus, compliance with the REIT requirements may hinder our ability to make certain attractive investments.
REIT ownership limitations may restrict or prevent you from engaging in certain transfers of our common stock.
In order to satisfy the requirements for REIT qualification, no more than 50% in value of all classes or series of our outstanding shares of stock may be owned, actually or constructively, by five or fewer individuals (as defined in the Code to include certain entities) at any time during the last half of each taxable year commencing with our taxable year beginning January 1, 2016. Subject to certain exceptions, rents received or accrued by us from Darden will not be treated as qualifying rent for purposes of the REIT gross income requirements if we or a beneficial or constructive owner of 10% or more of our stock beneficially or constructively
23
owns 10% or more of the total combined voting power of all classes of Darden stock entitled to vote or 10% or more of the total value of all classes of Darden stock. To assist us in satisfying the REIT requirements, our charter contains certain ownership and transfer restrictions on our stock. More specifically, our charter provides that shares of our capital stock acquired or held in excess of the ownership limit will be transferred to a trust for the benefit of a designated charitable beneficiary, and that any person who acquires shares of our capital stock in violation of the ownership limit will not be entitled to any dividends on such shares or be entitled to vote such shares or receive any proceeds from the subsequent sale of such shares in excess of the lesser of the price paid for such shares or the amount realized from the sale (net of any commissions and other expenses of sale). A transfer of shares of our capital stock in violation of the ownership limit will be void ab initio under certain circumstances. Under applicable constructive ownership rules, any shares of stock owned by certain affiliated owners generally would be added together for purposes of the common stock ownership limits, and any shares of a given class or series of preferred stock owned by certain affiliated owners generally would be added together for purposes of the ownership limit on such class or series. Our 9.8% ownership limitation may have the effect of delaying, deferring or preventing a change in control of us, including an extraordinary transaction (such as a merger, tender offer or sale of all or substantially all of our assets) that might provide a premium price for our stockholders. See “
Our charter restricts the ownership and transfer of our outstanding stock, which may have the effect of delaying, deferring or preventing a transaction or change of control of our company”
above.
There are uncertainties relating to the Purging Distribution.
Darden has allocated its accumulated earnings and profits (as determined for U.S. federal income tax purposes) for periods prior to the Spin-Off between Darden and FCPT in a manner that, in its best judgment, is in accordance with the provisions of the Code. The amount of earnings and profits to be distributed is a complex factual and legal determination. We currently believe and intend that our Purging Distribution made on March 2, 2016 has satisfied the requirements relating to the distribution of our pre-REIT accumulated earnings and profits. No assurance can be given, however, that the IRS will agree with our calculation or Darden’s allocation of earnings and profits to FCPT. If the IRS finds additional amounts of pre-REIT earnings and profits, there are procedures generally available to cure any failure to distribute all of our pre-REIT earnings and profits, but there can be no assurance that we will be able to successfully implement such procedures.
We paid the Purging Distribution in a combination of common stock and cash and are permitted to pay other dividends on our common stock in common stock and/or cash. Our stockholders may sell shares of our common stock to pay tax on such dividends, placing downward pressure on the market price of our common stock.
We paid the Purging Distribution in a combination of cash and common stock. Each stockholder was permitted to elect to receive the stockholder’s entire entitlement under the Purging Distribution in either cash or FCPT common stock, subject to the limitation on the amount of cash to be distributed in the aggregate to all of our stockholders (the “Cash Limitation”). The Cash Limitation was approximately 20% of the Purging Distribution declaration (without regard to any cash that may be paid in lieu of fractional shares). In the Purging Distribution and any other distribution paid in a combination of cash and common stock, stockholders will be required to report dividend income as a result of such distribution for both the cash and stock components of the distribution and even though we distributed no cash or only nominal amounts of cash to such shareholder.
If we make any taxable dividend payable in cash and common stock, taxable stockholders receiving such dividends will be required to include the full amount of the dividend as ordinary income to the extent of our current and accumulated earnings and profits, as determined for U.S. federal income tax purposes. As a result, stockholders may be required to pay income tax with respect to such dividends in excess of the cash dividends received. If a U.S. stockholder sells shares of our stock that it receives as a dividend in order to pay this tax, the sales proceeds may be less than the amount included in income with respect to the dividend, depending on the market price of the stock at the time of the sale. Furthermore, with respect to certain non-U.S. stockholders, we may be required to withhold federal income tax with respect to such dividends, including in respect of all or a portion of such dividend that is payable in our stock. If, in any taxable dividend payable in cash and stock, a significant number of our stockholders determine to sell shares of our stock in order to pay taxes owed on dividends, it may be viewed as economically equivalent to a dividend reduction and put downward pressure on the market price of our stock.
24
Complying with the REIT requirements may limit our ability to hedge effectively and may cause us to incur tax liabilities.
The REIT provisions of the Code substantially limit our ability to hedge our assets and liabilities. Income from certain hedging transactions that we may enter into to manage risk of interest rate changes with respect to borrowings made or to be made to acquire or carry real estate assets (each such hedge, a "Borrowing Hedge") or manages the risk of certain currency fluctuations (each such hedge, a "Currency Hedge") does not constitute “gross income” for purposes of the 75% or 95% gross income tests that apply to REITs, provided that certain identification requirements are met. This exclusion from the 95% and 75% gross income tests also applies if we previously entered into a Borrowings Hedge or a Currency Hedge, a portion of the hedged indebtedness or property is disposed of, and in connection with such extinguishment or disposition we enter into a new clearly identified hedging transaction to offset the prior hedging position. To the extent that we enter into other types of hedging transactions or fail to properly identify such transaction as a hedge, the income is likely to be treated as non-qualifying income for purposes of both of the gross income tests. As a result of these rules, we may be required to limit our use of advantageous hedging techniques or implement those hedges through a TRS. This could increase the cost of our hedging activities because the TRS may be subject to tax on gains or expose us to greater risks associated with changes in interest rates that we would otherwise want to bear. In addition, losses in the TRS will generally not provide any tax benefit, except that such losses could theoretically be carried back or forward against past or future taxable income in the TRS.
The ability of our Board of Directors to revoke our REIT election without stockholder approval may cause adverse consequences to our stockholders.
Our charter provides our Board of Directors with the power, under certain circumstances, to revoke or otherwise terminate our REIT election and cause us to be taxed as a regular corporation, without the approval of our stockholders. If we cease to qualify as a REIT, we would become subject to U.S. federal income tax on our net taxable income and we generally would no longer be required to distribute any of our net taxable income to our stockholders, which may have adverse consequences on our total return to our stockholders.
Even if we qualify to be subject to tax as a REIT, we could be subject to tax on any unrealized net built-in gains in our assets held before electing to be treated as a REIT.
Following our REIT election, we will own appreciated assets that were held by Darden, a C corporation, and were acquired by us in the Spin-Off in a transaction in which the adjusted tax basis of the assets in our hands was determined by reference to the adjusted basis of the assets in the hands of the C corporation. If we dispose of any such appreciated assets during the five-year period following the effective date of our REIT election, we will be subject to tax at the highest corporate tax rates on the lesser of (i) the amount of gain that we recognize at the time of the sale or disposition; and (ii) the amount of gain that we would have recognized if we had sold the assets at the time we acquired them (i.e., the effective date of our REIT election ) (such gain referred to as “built-in gains”). We would be subject to this tax liability even if we qualify and maintain our status as a REIT. Any recognized built-in gain will retain its character as ordinary income or capital gain and will be taken into account in determining REIT taxable income and our distribution requirement. Any tax on the recognized built-in gain will reduce REIT taxable income. We may choose not to sell in a taxable transaction appreciated assets we might otherwise sell during the five-year period in which the built-in gain tax applies in order to avoid the built-in gain tax. However, there can be no assurances that such a taxable transaction will not occur. If we sell such assets in a taxable transaction, the amount of corporate tax that we will pay will vary depending on the actual amount of net built-in gain or loss present in those assets as of the time we became a REIT. The amount of tax could be significant. The same rules would apply to any assets we acquire in the future from a C corporation in a carryover basis transaction with built-in gain at the time of the acquisition by us. If we choose to dispose of any assets within the specified period, we will attempt to utilize various tax planning strategies, including Section 1031 of the Code like-kind exchanges, to mitigate the exposure to the built-in-gains tax. Gain from a sale of an asset occurring after the specified period ends will not be subject to this corporate level tax.
Our tax protection agreement could limit our ability to sell or otherwise dispose of certain properties.
In connection with the acquisition of ten properties from U.S. Restaurant Properties, Inc. (“USRP”) in November 2016 in exchange for Operating Partnership units, we entered into a tax protection agreement with affiliates of USRP. The tax protection agreement provides that, if we dispose of any of those ten properties in a taxable transaction through November 2023, we will
25
indemnify the USRP partners for their tax liabilities attributable to the built-in gain that existed with respect to those properties as of the time of the acquisition of those properties in November 2016 (and tax liabilities incurred as a result of the reimbursement payment). Consequently, although it otherwise may be in our best interest to sell one of those properties, these obligations may make it prohibitive for us to do so.
Legislative or other actions affecting REITs could have a negative effect on us.
The rules dealing with U.S. federal income taxation are constantly under review by persons involved in the legislative process and by the IRS and the U.S. Department of the Treasury (the “Treasury”). Legislative and regulatory changes, including comprehensive tax reform, may be more likely in the 115th Congress, which convened in January 2017, because the Presidency and both Houses of Congress will be controlled by the same political party. Changes to the tax laws or interpretations thereof, with or without retroactive application, could materially and adversely affect our investors or us. We cannot predict how changes in the tax laws might affect our investors or us. New legislation, Treasury regulations, administrative interpretations or court decisions could significantly and negatively affect our ability to qualify as a REIT or the U.S. federal income tax consequences to our investors and us of such qualification.
.
26
Not applicable.
Please refer to “Item1. Business.”
In the ordinary course of our business, we are party to various claims and legal proceedings that management believes are routine in nature and incidental to the operation of our business. Management believes that the outcome of these proceedings will not have a material adverse effect upon our operations, financial condition or liquidity.
Not applicable.
27
Our stock began trading on the New York Stock Exchange under the ticker symbol “FCPT” on November 10, 2015 with an opening price of $19.85. No dividends were declared or paid in 2015. On January 7, 2016, our Board of Directors declared two dividends totaling $8.32 per share. These dividends were paid in cash on January 29, 2016 and in cash and shares of our common stock on March 2, 2016 and constitute our Purging Distribution.
For each calendar quarter and year indicated, the following table reflects respective high, low, and closing sales prices for the common stock as quoted by the NYSE and the dividends paid per share in each period.
|
2016
|
First Quarter
|
Second Quarter
|
Third Quarter
|
Fourth Quarter
|
Year
|
|||||||||||||||
|
High
|
$
|
23.56
|
|
$
|
20.59
|
|
$
|
21.79
|
|
$
|
21.13
|
|
$
|
23.56
|
|
|||||
|
Low
|
14.52
|
|
17.38
|
|
19.65
|
|
17.74
|
|
14.52
|
|
||||||||||
|
Close
|
17.95
|
|
20.59
|
|
21.33
|
|
20.52
|
|
20.52
|
|
||||||||||
|
Dividends per share
|
8.56
|
|
0.24
|
|
0.24
|
|
0.24
|
|
9.29
|
|
||||||||||
|
2015
|
First Quarter
|
Second Quarter
|
Third Quarter
|
Fourth Quarter
|
Year
|
|||||||||||||||
|
High
|
N/A
|
N/A
|
N/A
|
$
|
24.20
|
|
$
|
24.20
|
|
|||||||||||
|
Low
|
N/A
|
N/A
|
N/A
|
19.15
|
|
19.15
|
|
|||||||||||||
|
Close
|
N/A
|
N/A
|
N/A
|
24.16
|
|
24.16
|
|
|||||||||||||
|
Dividends per share
|
N/A
|
N/A
|
N/A
|
—
|
|
—
|
|
|||||||||||||
The following table presents the characterizations for tax purposes of such common stock dividends for the year ended December 31, 2016.
|
Record Date
|
Payment Date
|
Total Distribution
($ per share) |
Form 1099
Box 1a Ordinary Taxable Dividend ($ per share) |
Form 1099
Box 1b Qualified Taxable Dividend (1) ($ per share) |
Form 1099
Box 3 Return of Capital ($ per share) |
|||||||||
|
1/19/2016
|
1/29/2016
|
$
|
0.2000
|
|
(2)
|
$
|
0.2000
|
|
$
|
0.2000
|
|
—
|
|
|
|
1/19/2016
|
3/2/2016
|
8.1183
|
|
(2)
|
8.1183
|
|
7.5554
|
|
—
|
|
||||
|
3/31/2016
|
4/15/2016
|
0.2425
|
|
0.2425
|
|
—
|
|
—
|
|
|||||
|
6/30/2016
|
7/15/2016
|
0.2425
|
|
0.1234
|
|
—
|
|
0.1191
|
|
|||||
|
9/30/2016
|
10/14/2016
|
0.2425
|
|
0.0290
|
|
—
|
|
0.2135
|
|
|||||
|
Totals
|
$
|
9.0458
|
|
$
|
8.7132
|
|
$
|
7.7554
|
|
$
|
0.3326
|
|
||
(1) Qualified Taxable Dividends are a subset of, and included in, Ordinary Taxable Dividends.
(2) Reflects special catch-up distributions of cash and stock, which included the remaining amount of the company’s undistributed earnings and profits attributable to all taxable periods ending on or prior to December 31, 2015, which, in accordance with tax rules applicable to real estate investment trust (“REIT”) conversions, the Company was required to pay to its stockholders on or before December 31, 2016 in connection with its conversion to a REIT.
We intend to pay regular quarterly dividends to our stockholders, although future distributions will be declared and paid at the discretion of the Board of Directors and will depend upon cash generated by operating activities, our financial condition, capital requirements, annual distribution requirements under the REIT provision of the Code and such other factors as the Board of Directors deems relevant.
As of February 21, 2017, there were approximately 9,885 registered holders of record of our common stock.
28
Sales of Unregistered Securities
None.
Purchases of Equity Securities by the Company and Affiliated Purchasers
None.
Performance Graph
The following performance graph compares, for the period from November 10, 2015, the date the Company’s shares of common stock began trading on the New York Stock Exchange, through December 31, 2016, the cumulative total stockholder return on the Company’s common stock, based on the market price of the common stock and assuming reinvestments of dividends, with (i) the cumulative total return of the S&P 500 Index, (ii) the cumulative total return of the MSCI US REIT Index (“RMZ”) and (iii) the cumulative total return of Dow Jones Industrial Average.
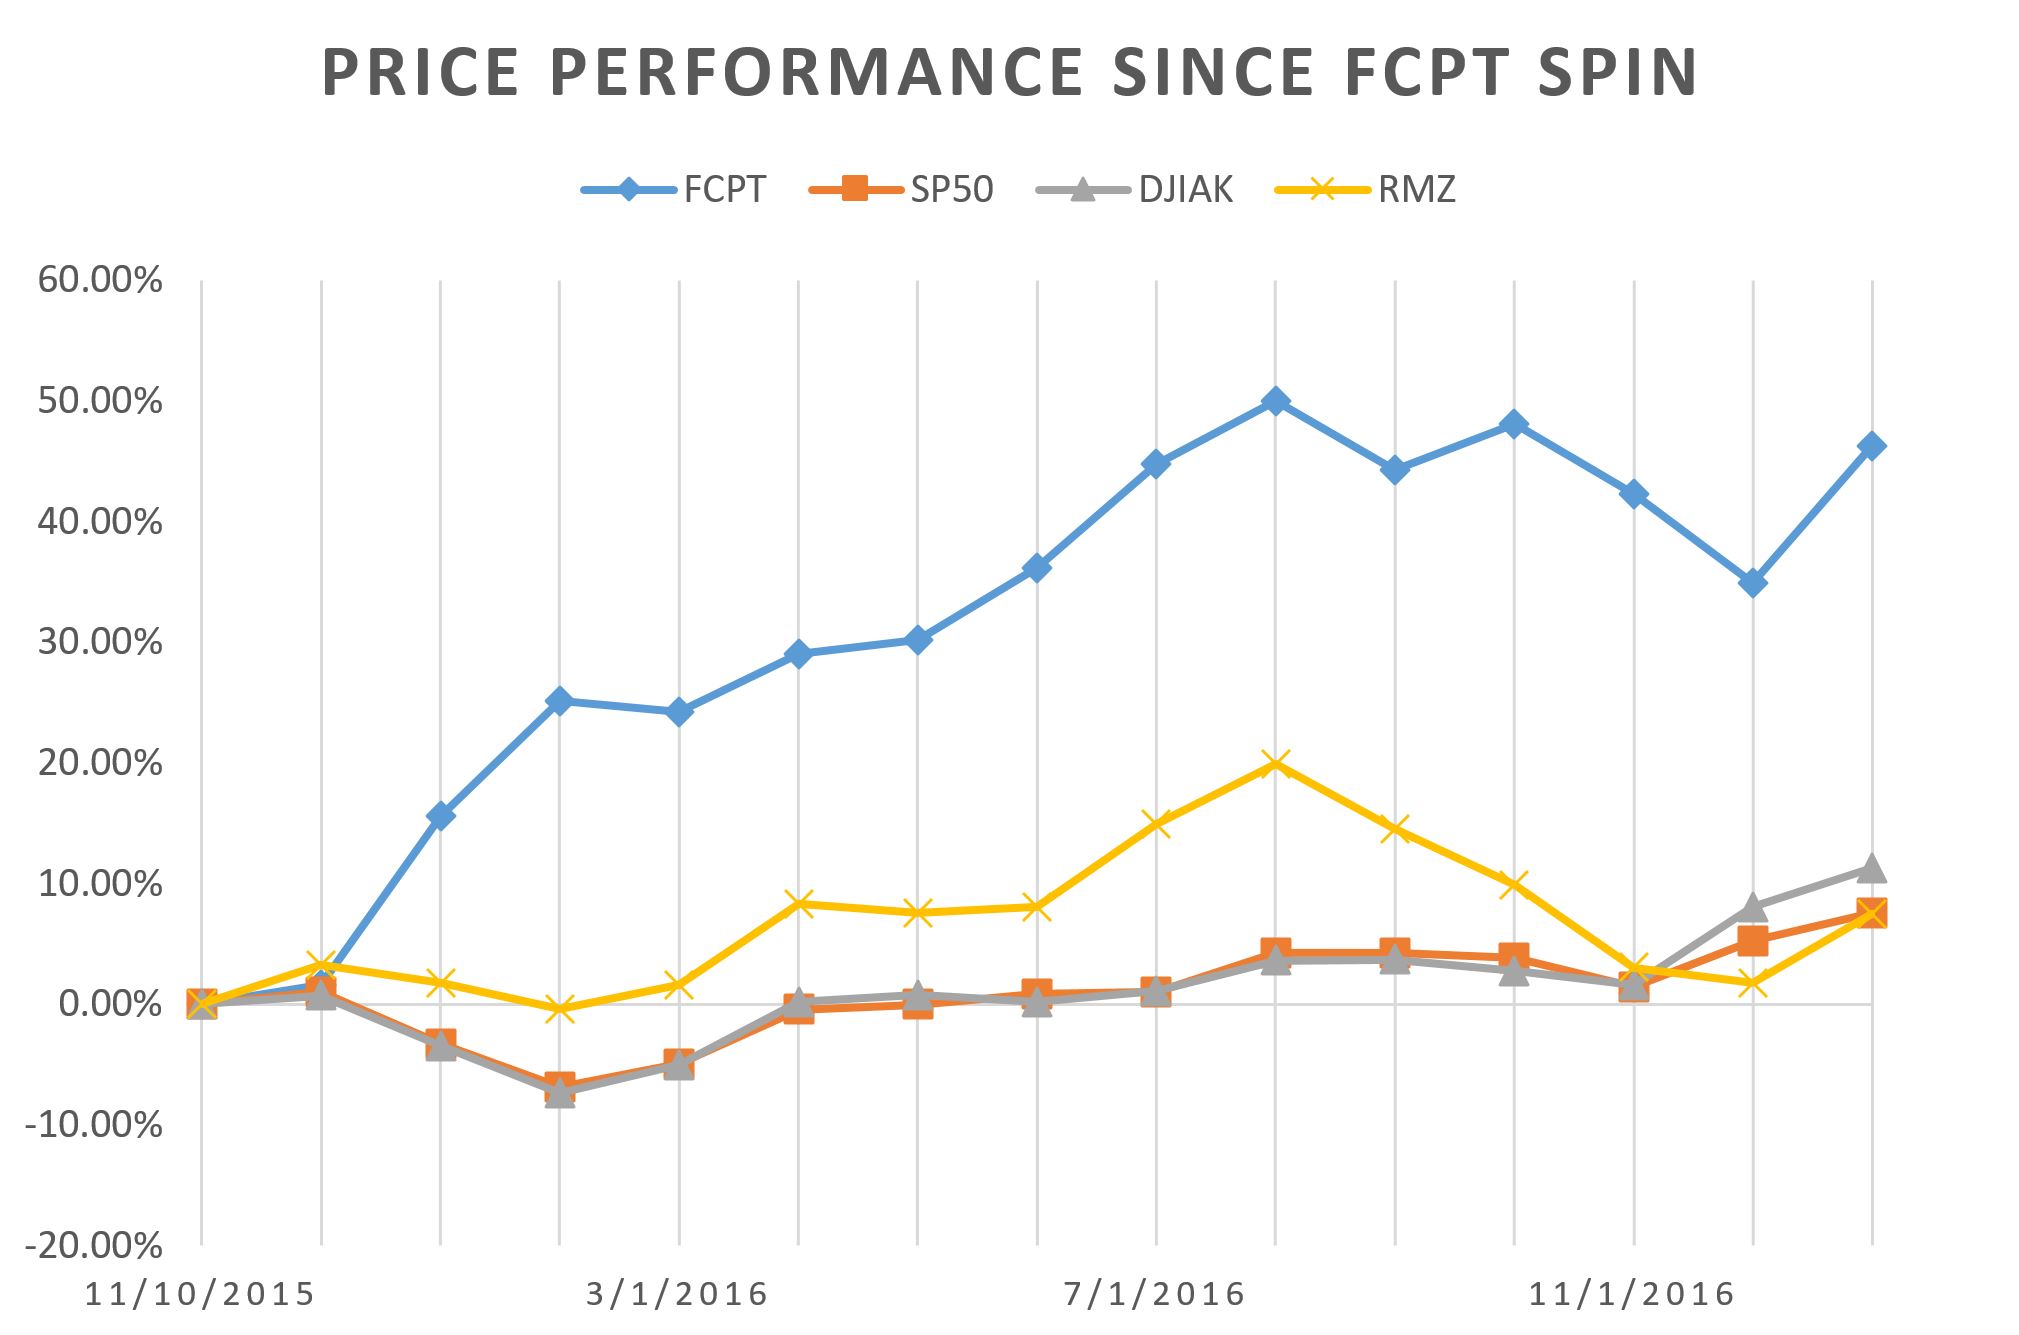
29
The following selected historical financial information should be read in conjunction with "Management's Discussion and Analysis of Financial Condition and Results of Operations" and the historical consolidated and combined financial statements as of December 31, 2016 and 2015 and for the years ended December 31, 2016, 2015, and 2014, and the related notes included elsewhere in this Annual Report on Form 10-K.
The Company completed the Spin-Off on November 9, 2015. Due to the timing of the Spin-off, the Company presents herein consolidated financial data for the Company from the date of consummation of the Spin-off through December 31, 2015 and for the Kerrow Restaurant Operating Business for all periods. Our real estate operations business was not operated by Darden as a stand-alone business and, accordingly, there are no historical results of operations related to that business. The Kerrow Restaurant Operating Business and our real estate operations business were not legal entities, but rather a portion of the real estate assets, liabilities and operations of Darden. The historical financial data for Kerrow Restaurant Operating Business is not necessarily indicative of the Company’ results of operations, cash flows or financial position following the completion of the Spin-Off.
The selected historical financial information as of and for the years ended December 31, 2016, 2015, 2014, 2013, and 2012 has been derived from our audited historical financial statements (except in the case of balance sheet data as of December 31, 2012, which is unaudited). The combined statements of comprehensive income include allocations of certain costs from Darden incurred on the Kerrow Restaurants Operating Business’ behalf. Management considers the allocation methodologies used to be reasonable and appropriate reflections of the historical Darden expenses allocable to the Kerrow Restaurants Operating Business for purposes of the combined financial statements. However, the expenses reflected in the combined financial statements may not be indicative of the actual expenses that would have been incurred during the periods presented if the Kerrow Restaurants Operating Business had operated as a separate, stand-alone entity. Due to the timing of the Spin-Off, the results of operations for the years ended December 31, 2014, 2013, and 2012 reflect the financial condition and results of operations of Kerrow Restaurant Operating Business. The results of operations for the years ended December 31, 2016 and 2015 reflect the financial condition and results of operations of the Company, together with the Kerrow Restaurant Operating Business prior to the Spin-Off.
Operating Data
|
Year Ended December 31,
|
|||||||||||||||||||
|
(In thousands, except per share data)
|
2016
|
2015
|
2014
|
2013
|
2012
|
||||||||||||||
|
Revenues
|
$
|
124,018
|
|
$
|
33,456
|
|
$
|
17,695
|
|
$
|
16,907
|
|
$
|
16,524
|
|
||||
|
Net income (loss)
|
$
|
156,809
|
|
$
|
5,699
|
|
$
|
32
|
|
$
|
29
|
|
$
|
(39
|
)
|
||||
|
Earnings per share:
|
|||||||||||||||||||
|
Basic
|
$
|
2.75
|
|
$
|
0.92
|
|
NA
|
|
NA
|
|
NA
|
|
|||||||
|
Diluted
|
$
|
2.63
|
|
$
|
0.91
|
|
NA
|
|
NA
|
|
NA
|
|
|||||||
|
Cash dividends declared per common stock
|
$
|
0.97
|
|
—
|
|
NA
|
|
NA
|
|
NA
|
|
||||||||
30
|
At December 31,
|
||||||||||||||||||||
|
(In thousands)
|
2016
|
2015
|
2014
|
2013
|
2012 (Unaudited)
|
|||||||||||||||
|
Real estate investments:
|
||||||||||||||||||||
|
Land
|
$
|
421,941
|
|
$
|
404,812
|
|
$
|
3,069
|
|
$
|
3,069
|
|
$
|
3,069
|
|
|||||
|
Buildings, equipment and improvements
|
1,055,624
|
|
992,418
|
|
12,513
|
|
12,502
|
|
12,502
|
|
||||||||||
|
Total real estate investments
|
1,477,565
|
|
1,397,230
|
|
15,582
|
|
15,571
|
|
15,571
|
|
||||||||||
|
Less: accumulated depreciation
|
(583,307
|
)
|
(568,539
|
)
|
(3,860
|
)
|
(3,026
|
)
|
(2,163
|
)
|
||||||||||
|
Total real estate investments, net
|
$
|
894,258
|
|
$
|
828,691
|
|
$
|
11,722
|
|
$
|
12,545
|
|
$
|
13,408
|
|
|||||
|
Total assets
|
$
|
937,151
|
|
$
|
929,437
|
|
$
|
11,949
|
|
$
|
12,807
|
|
$
|
13,630
|
|
|||||
|
Total liabilities
|
467,034
|
|
487,795
|
|
2,951
|
|
2,935
|
|
2,899
|
|
||||||||||
|
Total equity
|
470,117
|
|
441,642
|
|
8,998
|
|
9,872
|
|
10,731
|
|
||||||||||
Other Statistics
|
Year Ended December 31,
|
||||||||||||||||||||
|
(In thousands)
|
2016
|
2015
|
2014
|
2013
|
2012
|
|||||||||||||||
|
Cash flows provided by operating activities
|
$
|
70,939
|
|
$
|
21,693
|
|
$
|
961
|
|
$
|
914
|
|
$
|
806
|
|
|||||
|
Cash flows used in investing activities
|
(59,322
|
)
|
(556
|
)
|
(55
|
)
|
(26
|
)
|
(131
|
)
|
||||||||||
|
Cash flows provided by (used in) financing activities
|
(83,047
|
)
|
76,929
|
|
(906
|
)
|
(888
|
)
|
(675
|
)
|
||||||||||
31
This discussion contains forward-looking statements that involve risks and uncertainties. Our actual results could differ materially from those projected, forecasted or expected in these forward-looking statements as a result of various factors, including those which are discussed below and elsewhere in this information statement. The following discussion and analysis should be read in conjunction with the accompanying consolidated financial statements, related notes included thereto and “Item 1.A., Risk Factors”, appearing elsewhere in this Annual Report on Form 10-K.
Overview
FCPT is a publicly-traded REIT that owns, acquires and leases restaurant and other retail properties on a primarily triple-net basis. Our primary goal is to create long-term shareholder value through the payment of consistent cash dividends and the growth of our cash flow and asset base. To achieve this goal, our business strategy focuses on opportunistic acquisitions and asset and tenant diversification.
On November 9, 2015, in connection with the separation and spin-off of FCPT from Darden, Darden contributed to us 100% of the equity interest in entities that held 418 properties in which Darden operates restaurants, representing five of their brands (the “Four Corners Properties”), and six LongHorn Steakhouse® restaurants located in the San Antonio, Texas area (the “Kerrow Restaurant Operating Business”) and the underlying properties or interests therein associated with the Kerrow Restaurant Operating Business. In exchange, we issued shares of our common stock which Darden distributed to its shareholders.
Currently, we generate revenues primarily by leasing properties to Darden and to other third-party tenants through triple-net lease arrangements under which the tenant is primarily responsible for ongoing costs relating to the properties, including utilities, property taxes, insurance, common area maintenance charges, and maintenance and repair costs (“triple-net”). We also generate revenues by operating the Kerrow Restaurant Operating Business pursuant to franchise agreements with Darden. As of December 31, 2016, our undepreciated gross investment in real estate totaled approximately $1.5 billion.
We have elected to be taxed as a REIT for federal income tax purposes commencing with the taxable year beginning January 1,
2016.
FCPT initiated acquisition activities in the second quarter of 2016, and between July and December 2016 acquired 59 restaurants for a total investment of $94.1 million in 13 separate transactions, representing 13 additional brands, at a blended acquisition cap rate of 6.6%. In addition, during the same period FCPT sold two properties for $24.8 million at a 4.75% cap rate. The proceeds from the sales were used for a subsequent acquisition in the 1031 exchange market.
As of December 31, 2016, FCPT owns 475 properties in its lease portfolio which are 100% unencumbered and represent an aggregate leasable area of approximately 3.4 million square feet. The portfolio is 100% occupied under leases with an average lease term of 13.7 years and has no assets under development.
In addition to managing its existing properties, FCPT’s strategy in 2017 includes investing in additional restaurant and food service real estate properties to gro
w and diversify its portfolio. The Company intends to purchase properties that are well located and occupied by durable restaurant concepts with creditworthy tenants with investment grade ratings, whose operating cash flow are expected to meaningfully exceed their lease payments to FCPT.
32
Results of Operations
The results of operations for the accompanying consolidated and combined financial statements discussed below are derived from our consolidated statements of comprehensive income found elsewhere in this Annual Report on Form 10-K. The following discussion includes the results of our continuing operations as summarized in the table below.
|
Year Ended December 31,
|
||||||||||||
|
(In thousands)
|
2016
|
2015
|
2014
|
|||||||||
|
Revenues:
|
||||||||||||
|
Rental
|
$
|
105,624
|
|
$
|
15,134
|
|
$
|
—
|
|
|||
|
Restaurant
|
18,394
|
|
18,322
|
|
17,695
|
|
||||||
|
Total revenues
|
124,018
|
|
33,456
|
|
17,695
|
|
||||||
|
Operating expenses:
|
||||||||||||
|
General and administrative
|
10,977
|
|
1,856
|
|
—
|
|
||||||
|
Depreciation and amortization
|
20,577
|
|
3,758
|
|
863
|
|
||||||
|
Restaurant expenses
|
17,853
|
|
16,996
|
|
16,942
|
|
||||||
|
Interest expense
|
14,828
|
|
2,203
|
|
—
|
|
||||||
|
Total expenses
|
64,235
|
|
24,813
|
|
17,805
|
|
||||||
|
Other income
|
97
|
|
—
|
|
—
|
|
||||||
|
Realized gain on sale, net
|
16,623
|
|
—
|
|
—
|
|
||||||
|
Income (loss) before income taxes
|
76,503
|
|
8,643
|
|
(110
|
)
|
||||||
|
(Provision for) benefit from income taxes
|
80,347
|
|
(2,944
|
)
|
142
|
|
||||||
|
Net income
|
156,850
|
|
5,699
|
|
32
|
|
||||||
|
Net income attributable to noncontrolling interest
|
(41
|
)
|
—
|
|
—
|
|
||||||
|
Net Income Available to Common Shareholders
|
$
|
156,809
|
|
$
|
5,699
|
|
$
|
32
|
|
|||
We operate in two segments, real estate operations and restaurant operations. Our real estate operations began on November
9,
2015, accordingly, comparisons to prior periods with respect to this segment are not meaningful. Our real estate operations generate rental income associated with leases which we recognize on a straight-line basis to include the effects of base rent escalators.
Rental revenue was $105.6 million, driven principally by recognizing a full year of rental revenue from the initial Darden portfolio. In addition, we acquired 59 properties in 2016 and sold 2 properties in 2016. The net addition to rental income from acquired properties less the impact of sold properties was $1.0 million.
General and administrative expense comprises costs associated with staff, office rent, legal, accounting, information technology and other professional services and other administrative services in association with our lease operations and our REIT structure and reporting requirements.
Depreciation and amortization expense represents the depreciation on real estate investments and the intangible lease assets recognized upon the acquisition of leased properties. Depreciation and amortization increased for 2016 by approximately $16.8 million or 448% principally as a result of the Company having real estate operations for a full 12 month period in 2016 when compared to results for only the period from November 9 through December 31 in 2015.
In the fourth quarter of 2016, we sold two properties and realized a gain of $16.6 million. These sales qualified as 1031 exchanges, and the consideration received was used to purchase other properties in the fourth quarter of 2016.
Interest Expense
On November 9, 2015, immediately preceding the consummation of the Spin-Off, we entered into the Revolving Credit and Term Loan Agreement (the “Loan Agreement”) that provides for borrowings of up to
$750 million
and consists of (1) a
$400
33
million
non-amortizing term loan that matures on November 9, 2020 and (2) a
$350 million
revolving credit facility that provides for loans and letters of credit. At December 31, 2016, the weighted average interest rate on the term loan was
2.36%
. As of December 31, 2016, there were $45.0 million of outstanding borrowings under the revolving credit facility with a weighted average interest rate of
2.46%
and no outstanding letters of credit.
On November 9, 2015, we also
entered into interest rate swaps with aggregate notional values totaling $400 million to hedge the variability associated with the Loan Agreement, fixing our gross interest expense at 3.06%. These swaps are accounted for as cash flow hedges with all interest income/expense recorded as a component of net income and other valuation changes recorded as a component of other comprehensive income.
At December 31, 2016, the average interest rate on the term loan including the cost of the swap agreements and the amortization of upfront costs was 3.5%.
Restaurant Operations
The following table sets forth for our restaurant operating segment revenues and expenses data for the periods indicated. Although we completed the spin-off of FCPT from Darden on November 9, 2015, our restaurant operations segment includes the full operating results for 2015 and 2014.
|
Year Ended December 31,
|
|||||||||||||||||||||
|
2016
|
2015
|
2014
|
|||||||||||||||||||
|
(Dollars in thousands)
|
$
|
% of Revenues
|
$
|
% of Revenues
|
$
|
% of Revenues
|
|||||||||||||||
|
Restaurant revenues
|
$
|
18,394
|
|
100.0
|
%
|
$
|
18,322
|
|
100.0
|
%
|
$
|
17,695
|
|
100.0
|
%
|
||||||
|
Restaurant expenses:
|
|||||||||||||||||||||
|
Food and beverage
|
7,213
|
|
39.2
|
%
|
7,310
|
|
39.9
|
%
|
7,124
|
|
40.3
|
%
|
|||||||||
|
Restaurant labor
|
5,391
|
|
29.3
|
%
|
4,688
|
|
25.6
|
%
|
4,639
|
|
26.2
|
%
|
|||||||||
|
Other restaurant expenses
(1)
|
5,638
|
|
30.7
|
%
|
4,998
|
|
27.3
|
%
|
5,179
|
|
29.3
|
%
|
|||||||||
|
Total restaurant expenses
|
18,242
|
|
99.2
|
%
|
16,996
|
|
92.8
|
%
|
16,942
|
|
95.7
|
%
|
|||||||||
|
Restaurant Operations, Net
|
$
|
152
|
|
|
$
|
1,326
|
|
$
|
753
|
|
|||||||||||
(1) Other restaurant expenses include $389 thousand of intercompany rent paid to FCPT in 2016, which is eliminated for financial reporting purposes.
Year Ended December 31, 2016 versus Year Ended December 31, 2015
Restaurant revenues increased approximately $0.07 million, or 0.39%, in 2016 compared to 2015, driven primarily by a 4.8% increase in the average check offset by a 5.6% decrease in average guest counts. The increase in average check amounts was due to the addition of higher end entrées and price increases during the year. Average annual revenue per restaurant was $3.07 million in 2016 compared to $3.06 million in 2015.
Total restaurant expenses increased approximately $1.2 million or 6.4% in 2016 compared to 2015 due to increased administrative overhead and one-time costs associated with the spin-off. As a percent of revenues, total restaurant expenses increased from 92.8% in 2015 to 99.2% in 2016.
Food and beverage costs decreased approximately $0.1 million, or 0.7% of revenues from 2015 to 2016, due to a focus on inventory management and a decrease in beef prices during 2016.
Restaurant labor costs increased $0.7 million, or 3.7% of revenues in 2016 compared to 2015, due to an increase in hourly wages due to staffing challenges, increased management overhead, and a change in incentive compensation structure.
Other restaurant expenses (which include utilities, common area maintenance charges, repairs and maintenance, credit card fees, lease expense, property tax, workers’ compensation, other restaurant-level operating expenses and administrative costs) increased approximately $0.6 million, or 3.4% of revenues in 2016 compared to 2015, mainly due to the addition of franchise fees, brand fund expenses, rising utility costs, an increase in building/equipment maintenance, and one-time spin expenses.
34
Year Ended December 31, 2015 versus Year Ended December 31, 2014
Restaurant revenues increased $0.6 million, or 3.5%, in 2015 compared to 2014, driven primarily by a 4.3% increase in the average check as well as a 0.8% increase in average guest counts. Average annual revenue per restaurant was $3.06 million in 2015 compared to $2.9 million in 2014.
Total restaurant expenses increased appr
oximately $0.05 million, but lower by 2.9% of revenues due to favorable sales leverage. As a percent of revenues, total restaurant expenses decreased from 95.7% in 2014 to 92.8% in 2015.
Food and beverage costs increased approximately $0.2 million, but lower by 0.4% of revenues from 2014 to 2015, due to increased food costs, primarily beef during the year.
Restaurant labor costs increased approximately $0.05 million, but lower by 0.6% of revenues from 2014 to 2015 primarily as a result of favorable sales leverage.
Other restaurant expenses decreased by approximately $0.2 million or 1.9% of revenues 2015 compared to 2014, primarily as a result of higher workers’ compensation costs, utilities, repairs and maintenance and media costs, partially offset by favorable sales leverage.
Critical Accounting Policies and Estimates
The preparation of FCPT’s consolidated and combined financial statements in conformance with accounting principles generally accepted in the United States of America requires management to make estimates on assumptions that affect the reported amounts of assets, liabilities, revenues and expenses as well as other disclosures in the financial statements. On an ongoing basis, management evaluates its estimates and assumptions; however, actual results may differ from these estimates and assumptions, which in turn could have a material impact on our financial statements. Estimates and assumptions include, among other things, subjective judgments regarding the fair values and useful lives of our properties for depreciation and lease classification purposes, and asset impairment analysis.
A summary of FCPT’s accounting policies and procedures are included in Note 2 of our consolidated and combined financial statements, included in Part II, Item 8 of this Annual Report on Form 10-K. Management believes the following critical accounting policies, among others, affect its more significant estimates and assumptions used in the preparation of our consolidated and combined financial statements.
Real Estate Investments
Real estate investments, net are recorded at cost less accumulated depreciation. Building components are depreciated over estimated useful lives ranging from
seven
to fifty-four years using the straight-line method. Leasehold improvements, which are reflected on our balance sheets as a component of buildings, within land, buildings and equipment, net, are amortized over the lesser of the non-cancelable lease term or the estimated useful lives of the related assets using the straight-line method. Equipment is depreciated over estimated useful lives ranging from
two
to
fifteen
years also using the straight-line method. Real estate development and construction costs for newly constructed restaurants are capitalized in the period in which they are incurred. Gains and losses on the disposal of land, buildings and equipment are included in our accompanying statements of comprehensive income.
Our accounting policies regarding land, buildings and equipment, including leasehold improvements, include our judgments regarding the estimated useful lives of these assets, the residual values to which the assets are depreciated or amortized, the determination of what constitutes a reasonably assured lease term, and the determination as to what constitutes enhancing the value of or increasing the life of existing assets. These judgments and estimates may produce materially different amounts of reported depreciation and amortization expense if different assumptions were used. As discussed further below, these judgments may also impact our need to recognize an impairment charge on the carrying amount of these assets as the cash flows associated with the assets are realized, or as our expectations of estimated future cash flows change.
35
Acquisition of Real Estate
Prior to the fourth quarter of 2016, the Company evaluated the inputs, processes and outputs of each asset acquired to determine if the transaction is a business combination or asset acquisition. As the Company acquired only real estate investments with triple-net leases, it determined there are no inputs or processes associated with the acquired assets and the investments should be accounted for as asset acquisitions. Related transaction costs are generally capitalized and amortized over the useful life of the acquired assets.
In the fourth quarter of 2016, the Company adopted ASU 2017-01, which provided additional guidance for determining whether transactions should be accounted for as asset acquisitions or business combinations. The Company evaluated the acquisitions and concluded that the land, building, site improvements, and in-places leases (if any) were a single asset. The building and property improvements are attached to the land and cannot be physically removed and used separately from the land without incurring significant costs or reducing their fair value. As substantially all of the fair value of the gross assets acquired are concentrated in a single identifiable asset, the acquisitions do not qualify as a business and are accounted for as asset acquisitions. Related transaction costs are generally capitalized and amortized over the useful life of the acquired assets.
The Company allocates the purchase price (including acquisition and closing costs) of real estate acquisitions to land, building, improvements, and equipment based on their relative fair values. In making estimates of fair values for this purpose, the Company uses a third-party specialist that obtains various information about each property, including the pre-acquisition due diligence and leasing activities of the Company.
Lease Intangibles
Lease intangibles, if any, acquired in conjunction with the purchase of real estate represent the value of in-place leases and above- or below-market leases. For real estate acquired subject to existing lease agreements, in-place lease intangibles are valued based on the Company’s estimates of costs related to tenant acquisition and the carrying costs that would be incurred during the time it would take to locate a tenant if the property were vacant, considering current market conditions and costs to execute similar leases at the time of the acquisition. Above- and below-market lease intangibles are recorded based on the present value of the difference between the contractual amounts to be paid pursuant to the leases at the time of acquisition of the real estate and the Company’s estimate of current market lease rates for the property, measured over a period equal to the remaining initial term of the lease.
In-place lease intangibles are amortized on a straight-line basis over the remaining initial term of the related lease and included in depreciation and amortization expense. Above-market lease intangibles are amortized over the remaining initial terms of the respective leases as a decrease in rental revenue. Below market lease intangibles are generally amortized as an increase to rental revenue over the remaining initial term of the respective leases, but may be amortized over the renewal periods if the Company believes it is likely the tenant will exercise the renewal option. Should a lease terminate early, the unamortized portion of any related lease intangible is immediately recognized in impairment loss in the Company’s consolidated and combined statements of operations.
Impairment of Long-Lived Assets
Land, buildings and equipment and certain other assets, including definite-lived intangible assets, are reviewed for impairment whenever events or changes in circumstances indicate that the carrying amount of an asset may not be recoverable. Recoverability of assets to be held and used is measured by a comparison of the carrying amount of the assets to the future undiscounted net cash flows expected to be generated by the assets. Identifiable cash flows are measured at the lowest level for which they are largely independent of the cash flows of other groups of assets and liabilities, generally at the restaurant level. If these assets are determined to be impaired, the amount of impairment recognized is measured by the amount by which the carrying amount of the assets exceeds their fair value. Fair value is generally determined by appraisals or sales prices of comparable assets.
The judgments we make related to the expected useful lives of long-lived assets and our ability to realize undiscounted cash flows in excess of the carrying amounts of these assets are affected by factors such as the ongoing maintenance and improvements of the assets, changes in economic conditions, changes in usage or operating performance, desirability of the restaurant sites and other factors, such as our ability to sell our assets held for sale. As we assess the ongoing expected cash flows and carrying amounts of our long-lived assets, significant adverse changes in these factors could cause us to realize a material impairment loss.
36
Restaurant sites and certain other assets to be disposed of are reported at the lower of their carrying amount or fair value, less estimated costs to sell. Restaurant sites and certain other assets to be disposed of are included in assets held for sale when certain criteria are met. These criteria include the requirement that the likelihood of disposing of these assets within one year is probable. Assets whose disposal is not probable within
one
year remain in land, buildings and equipment until their disposal within one year is probable. Disposals of assets that have a major effect on our operations and financial results or that represent a strategic shift in our operating businesses are reviewed to determine whether those assets would also meet the requirements to be reported as discontinued operations.
Exit or disposal activities include the cost of disposing of the assets and are generally expensed as incurred. Upon disposal of the assets, any gain or loss is recorded in the same caption within our statements of comprehensive income as the original impairment.
Derivative Instruments and Hedging Activities
We enter into derivative instruments for risk management purposes only, including derivatives designated as hedging instruments as required by FASB ASC Topic 815, Derivatives and Hedging, and those utilized as economic hedges. Our use of derivative instruments is currently limited to interest rate hedges. These instruments are generally structured as hedges of the variability of cash flows related to forecasted transactions (cash flow hedges). We do not enter into derivative instruments for trading or speculative purposes, where changes in the cash flows of the derivative are not expected to offset changes in cash flows of the hedged item. All derivatives are recognized on the balance sheet at fair value. For those derivative instruments for which we intend to elect hedge accounting, at the time the derivative contract is entered into, we document all relationships between hedging instruments and hedged items, as well as our risk-management objective and strategy for undertaking the various hedge transactions. This process includes linking all derivatives designated as cash flow hedges to specific assets and liabilities on the consolidated balance sheet or to specific forecasted transactions. We also formally assess, both at the hedge’s inception and on an ongoing basis, whether the derivatives used in hedging transactions are highly effective in offsetting changes in cash flows of hedged items.
To the extent our derivatives are effective in offsetting the variability of the hedged cash flows, and otherwise meet the cash flow hedge accounting criteria in accordance with GAAP, changes in the derivatives’ fair value are not included in current earnings but are included in accumulated other comprehensive income (loss), net of tax. These changes in fair value will be reclassified into earnings at the time of the forecasted transaction. Ineffectiveness measured in the hedging relationship is recorded currently in earnings in the period in which it occurs.
Revenue Recognition
For those triple-net leases that provide for periodic and determinable increases in base rent, base rental revenue is recognized on a straight-line basis over the applicable lease term when collectability is reasonably assured. Recognizing rental income on a straight-line basis generally results in recognized revenues during the first half of a lease term exceeding the cash amounts contractually due from our tenants, creating a straight-line rent receivable.
Income from rent, lease termination fees and all other income is recognized when all of the following criteria are met in accordance with SEC Staff Accounting Bulletin 104: (i) the applicable agreement has been fully executed and delivered; (ii) services have been rendered; (iii) the amount is fixed or determinable; and (iv) collectability is reasonable assured.
New Accounting Standards
If applicable, a discussion of new accounting standards and the possible effects of these standards on our consolidated financial statements is included in Note 2 of our consolidated and combined financial statements, included in Part II, Item 8 of this Annual Report on Form 10-K.
Liquidity and Financial Condition
At December 31, 2016, we had $26.6 million of cash and cash equivalents and $305 million of borrowing capacity under our Credit Facility.
37
On November 9, 2015, immediately preceding the consummation of the Spin-Off, we entered into the $750 million Revolving Credit and Term Loan Agreement which consists of (1) a $400 million non-amortizing term loan that matures on November 9, 2020 and (2) a $350 million revolving credit facility that provides for loans and letters of credits and matures on November 9, 2019. The revolving credit facility provides for a letter of credit sub-limit of $45 million. As of December 31, 2016, we had $45 million of outstanding borrowings under our revolving credit facility and no outstanding letters of credit.
On a short-term basis, our principal demands for funds will be for operating expenses, distributions to stockholders and interest and principal on current and any future debt financings. We expect to fund our operating expenses and other short-term liquidity requirements, capital expenditures, payment of principal and interest on our outstanding indebtedness, property improvements, re-leasing costs and cash distributions to common stockholders, primarily through cash provided by operating activities, and, for acquisitions, investments, and other capital expenditures, from borrowings under our $350 million revolving Credit Facility
.
As of February 27, 2017 we had $45 million outstanding under the revolving Credit Facility.
We have a shelf registration statement on file with the SEC under which we may issue secured or unsecured indebtedness and equity financing through the instruments and on the terms most attractive to us at such time. During 2016, we sold an aggregate
32,513
shares under our ATM program for net proceeds of
$0.64 million
. The net proceeds were employed to fund acquisitions, and for general corporate purposes. As of December 31, 2016, $148.4 million in gross proceeds capacity remained available under the ATM Program.
On a long-term basis, our principal demands for funds include payment of dividends, financing of property acquisitions and scheduled debt maturities.
We plan to meet our long-term capital needs by issuing debt or equity securities or by obtaining asset level financing, subject to market conditions. In addition, we may issue common stock to permanently finance properties that were financed on an intermediate basis by our revolving Credit Facility or other indebtedness. In the future, we may also acquire properties by issuing partnership interests of our operating partnership in exchange for property owned by third parties. Our common partnership interests would be redeemable for cash or shares of our common stock.
We continually evaluate alternative financing and believe that we can obtain financing on reasonable terms. However, we cannot assure you that we will have access to the capital markets at times and at terms that are acceptable to us. We expect that our primary uses of capital will be for property and other asset acquisitions and the funding of tenant improvements and other capital expenditures, and debt refinancing.
Because the properties in our portfolio are generally leased to tenants under triple-net leases, where the tenant is responsible for property operating costs and expenses, our exposure to rising property operating costs due to inflation is mitigated. Interest rates and other factors, such as occupancy, rental rate and the financial condition of our tenants, influence our performance more so than does inflation. Changes in interest rates do not necessarily correlate with inflation rates or changes in inflation rates. As described above, we currently offer leases that provide for payments of base rent with scheduled annual fixed increases.
Contractual Obligations
The following table provides information with respect to our commitments as of December 31, 2016. The table does not reflect available debt extensions.
|
(In millions)
|
Less than 1 Year
|
1 – 3 Years
|
3 – 5 Years
|
More than 5 Years
|
Total
|
|||||||||||||||
|
Notes payable
|
$
|
—
|
|
$
|
—
|
|
$
|
445.0
|
|
$
|
—
|
|
$
|
445.0
|
|
|||||
|
Interest payments on note payable obligations
(1)
|
14.7
|
|
29.2
|
|
11.4
|
|
—
|
|
55.3
|
|
||||||||||
|
Commitments under non-cancellable operating leases
|
0.5
|
|
0.9
|
|
0.4
|
|
—
|
|
1.8
|
|
||||||||||
|
Total Contractual Obligations and Commitments
|
$
|
15.2
|
|
$
|
30.1
|
|
$
|
456.8
|
|
$
|
—
|
|
$
|
502.1
|
|
|||||
38
Off-Balance Sheet Arrangements
At December 31, 2016, there were no off-balance sheet arrangements.
Supplemental Financial Measures
The following table presents a reconciliation of GAAP net income to NARIET funds from operations (“FFO”) and Adjusted funds from operations (“AFFO”) for the year ended December 31, 2016.
|
Year Ended December 31,
|
||||||||
|
(In thousands, except share data)
|
2016
|
2015
|
||||||
|
Net income attributable to shareholders in accordance with GAAP
|
$
|
156,809
|
|
$
|
5,699
|
|
||
|
Depreciation and amortization
|
20,577
|
|
3,758
|
|
||||
|
Deferred tax benefit from REIT election
|
(80,410
|
)
|
—
|
|
||||
|
Realized gain on sales of real estate
|
(16,623
|
)
|
—
|
|
||||
|
NAREIT funds from operations (FFO)
|
80,353
|
|
9,457
|
|
||||
|
Non-cash compensation expense
|
1,550
|
|
13
|
|
||||
|
Amortization of deferred financing costs
|
1,592
|
|
265
|
|
||||
|
Other non-cash interest (income) expense
|
(610
|
)
|
(3
|
)
|
||||
|
Straight-line rent adjustment
|
(10,095
|
)
|
(1,500
|
)
|
||||
|
Adjusted funds from operations (AFFO)
|
$
|
72,790
|
|
$
|
8,232
|
|
||
|
Fully diluted shares outstanding
(1)
|
59,568,067
|
|
6,263,921
|
|
||||
|
FFO per diluted share
|
$
|
1.35
|
|
$
|
1.51
|
|
||
|
AFFO per diluted share
|
$
|
1.22
|
|
$
|
1.31
|
|
||
|
Footnotes:
|
||||||||
|
(1) Weighted average shares outstanding were calculated using the share count in 2015. Prior to November 9th 2015, there were no shares outstanding.
|
||||||||
Non-GAAP Definitions
The certain non-GAAP financial measures included above management believes are helpful in understanding our business, as further described below. Our definition and calculation of non-GAAP financial measures may differ from those of other REITs and therefore may not be comparable. The non-GAAP measures should not be considered an alternative to net income as an indicator of our performance and should be considered only a supplement to net income, and to cash flows from operating, investing or financing activities as a measure of profitability and/or liquidity, computed in accordance with GAAP.
Funds From Operations (“FFO”) is a supplemental measure of our performance which should be considered along with, but not as an alternative to, net income and cash provided by operating activities as a measure of operating performance and liquidity. We calculate FFO in accordance with the standards established by the National Association of Real Estate Investment Trusts (“NAREIT”). FFO represents net income (loss) (computed in accordance with GAAP), excluding gains (or losses) from sales of property and undepreciated land and impairment write-downs of depreciable real estate, plus real estate related depreciation and amortization (excluding amortization of deferred financing costs) and after adjustments for unconsolidated partnerships and joint ventures. We also omit the tax impact of non-FFO producing activities from FFO determined in accordance with the NAREIT definition.
Our management uses FFO as a supplemental performance measure because, in excluding real estate related depreciation and amortization and gains and losses from property dispositions, it provides a performance measure that, when compared year over
39
year, captures trends in occupancy rates, rental rates and operating costs. We offer this measure because we recognize that FFO will be used by investors as a basis to compare our operating performance with that of other REITs. However, because FFO excludes depreciation and amortization and captures neither the changes in the value of our properties that result from use or market conditions, nor the level of capital expenditures and capitalized leasing commissions necessary to maintain the operating performance of our properties, all of which have real economic effect and could materially impact our financial condition and results from operations, the utility of FFO as a measure of our performance is limited. FFO is a non-GAAP measure and should not be considered a measure of liquidity including our ability to pay dividends or make distributions. In addition, our calculations of FFO are not necessarily comparable to FFO as calculated by other REITs that do not use the same definition or implementation guidelines or interpret the standards differently from us. Investors in our securities should not rely on these measures as a substitute for any GAAP measure, including net income
Adjusted Funds From Operations (“AFFO”) is a non-GAAP measure that is used as a supplemental operating measure specifically for comparing year over year ability to fund dividend distribution from operating activities. AFFO is used by us as a basis to address our ability to fund our dividend payments. We calculate adjusted funds from operations by adding to or subtracting from FFO:
|
1.
|
Transaction costs incurred in connection with the acquisition of real estate investments
|
|
2.
|
Non-cash stock-based compensation expense
|
|
3.
|
Amortization of deferred financing costs
|
|
4.
|
Other non-cash interest expense
|
|
5.
|
Non-real estate depreciation
|
|
6.
|
Merger, restructuring and other related costs
|
|
7.
|
Impairment charges
|
|
8.
|
Amortization of capitalized leasing costs
|
|
9.
|
Straight-line rent revenue adjustment
|
|
10.
|
Amortization of above and below market leases
|
|
11.
|
Debt extinguishment gains and losses
|
|
12.
|
Recurring capital expenditures and tenant improvements
|
AFFO is not intended to represent cash flow from operations for the period, and is only intended to provide an additional measure of performance by adjusting the effect of certain items noted above included in FFO. AFFO is a widely reported measure by other REITs; however, other REITs may use different methodologies for calculating AFFO and, accordingly, our AFFO may not be comparable to other REITs.
40
We are exposed to financial market risks, especially interest rate risk. Interest rates are highly sensitive to many factors, including governmental monetary policies, domestic and global economic and political conditions, and other factors which are beyond our control. Our operating results will depend heavily on the difference between the revenue from our assets and the interest expense incurred on our borrowings. We may incur additional variable rate debt in the future, including amounts that we may borrow under our revolving credit facility. We consider certain risks associated with the use of variable rate debt, including those described under “Item 1A. Risk Factors - An increase in market interest rates could increase our interest costs on existing and future debt and could adversely affect our stock price, and a decrease in market interest rates could lead to additional competition for the acquisition of real estate, which could adversely affect our results of operations.” The objective of our interest rate risk management policy is to match fund fixed-rate assets with fixed-rate liabilities and variable-rate assets with variable-rate liabilities. As of December 31, 2016, our assets were primarily long-term, fixed-rate leases (though most have scheduled rental increases during the terms of the leases).
As of December 31, 2016, approximately $400 million of our total indebtedness consisted of five-year variable-rate obligations for which we have entered into swaps that effectively fixed $200 million of our variable rate debt for three years and $200 million for five years, at a weighted average interest rate, excluding amortization of deferred financing costs and debt discounts/premiums, of approximately 3.06%. We intend to continue our practice of employing interest rate derivative contracts, such as interest rate swaps and futures, to reduce our exposure, on specific transactions or on a portfolio basis, to changes in cash flows as a result of interest rate changes. We do not intend to enter into derivative contracts for speculative or trading purposes. We generally intend to utilize derivative instruments to hedge interest rate risk on our liabilities and not use derivatives for other purposes, such as hedging asset-related risks.
We consider certain risks associated with the use of derivative instruments, including those described under “Item 1A. Risk Factors -
Hedging transactions could have a negative effect on our results of operations.”
Due to the hedging transactions described above,
a hypothetical one percentage point decline in interest rates would not have materially affected our consolidated financial position, results of operations or cash flows as of December 31, 2016.
41
Financial Statements and Supplementary Data consist of financial statements as indexed on page F-1.
None.
Evaluation of Disclosure Controls and Procedures
We have established and maintain disclosure controls and procedures, as such term is defined in Rule 13a-15(e) under the Securities Exchange Act of 1934 (the “Exchange Act”), that are designed to ensure that information required to be disclosed by us in the reports that we file or submit under the Exchange Act is recorded, processed, summarized and reported, within the time periods specified in the SEC’s rules and forms. Disclosure controls and procedures include, without limitation, controls and procedures designed to ensure that information required to be disclosed by us in the reports that we file or submit under the Exchange Act is accumulated and communicated to management, including our principal executive and principal financial officers as appropriate, to allow timely decisions regarding required disclosure.
Our management, with participation of our principal executive officer and principal financial officer, evaluated the effectiveness of our disclosure controls and procedures as of December 31, 2016. Based on this evaluation, our principal executive officer and principal financial officer concluded that our disclosure controls and procedures were effective as of December 31, 2016.
Management Report on Internal Control Over Financial Reporting
Our management is responsible for establishing and maintaining adequate internal control over financial reporting. Our internal control system is designed to provide reasonable assurance to our management and Board of Directors regarding the preparation and fair presentation of published financial statements. All internal control systems, no matter how well designed, have inherent limitations. Therefore, even those systems determined to be effective can provide only reasonable assurance with respect to financial statement preparation and presentation.
Our management assessed the effectiveness of our internal control over financial reporting as of December 31, 2016. In making this assessment, it used the criteria set forth by the Committee of Sponsoring Organizations of the Treadway Commission (2013 framework) in Internal Control-Integrated Framework. Based on its assessment and those criteria, our management concluded that, as of December 31, 2016 our internal control over financial reporting is effective.
KPMG LLP, an independent registered public accounti
ng firm, has issued an attestation report, included herein, on the effectiveness of our internal control over financial reporting.
Changes in Internal Control over Financial Reporting
During 2016, the Company enhanced its documentation of certain control activities. The Company has also formalized its policy for the retention of documentation supporting the performance and review of these controls. There have been no changes in our internal control over financial reporting (as defined in Rule 13a-15(f) and 15d-15(f) under the Exchange Act) during the three months ended December 31, 2016 that have materially affected, or that are reasonably likely to materially affect, our internal control over financial reporting.
None.
42
The information required by Item 10 is incorporated herein by reference to the definitive Proxy Statement to be filed with the SEC pursuant to Regulation 14A within 120 days after the end of the fiscal year covered by this Annual Report on Form 10-K.
The information required by Item 11 is incorporated herein by reference to the definitive Proxy Statement to be filed with the SEC pursuant to Regulation 14A within 120 days after the end of the fiscal year covered by this Annual Report on Form 10-K.
The information required by Item 12 is incorporated herein by reference to the definitive Proxy Statement to be filed with the SEC pursuant to Regulation 14A within 120 days after the end of the fiscal year covered by this Annual Report on Form 10-K.
The information required by Item 13 is incorporated herein by reference to the definitive Proxy Statement to be filed with the SEC pursuant to Regulation 14A within 120 days after the end of the fiscal year covered by this Annual Report on Form 10-K.
The information required by Item 14 is incorporated herein by reference to the definitive Proxy Statement to be filed with the SEC pursuant to Regulation 14A within 120 days after the end of the fiscal year covered by this Annual Report on Form 10-K.
43
(a) For Financial Statements, see Index to Financial Statements on page F-1.
(b) For Exhibits, see Index to Exhibits on page E-1.
44
FOUR CORNERS PROPERTY TRUST, INC.
INDEX TO FINANCIAL STATEMENTS
|
Audited Consolidated Financial Statements
|
||
F-1
Report of Independent Registered Public Accounting Firm
The Board of Directors and Stockholders
Four Corners Property Trust, Inc.:
We have audited the accompanying consolidated balance sheets of Four Corners Property Trust, Inc. and subsidiaries as of December 31, 2016 and 2015, and the related consolidated and combined statements of income, comprehensive income, changes in equity, and cash flows for each of the years in the three‑year period ended December 31, 2016. In connection with our audits of the consolidated financial statements, we also have audited the financial statement schedule III - Schedule of Real Estate Assets and Accumulated Depreciation. These consolidated financial statements and financial statement schedule are the responsibility of the Company’s management. Our responsibility is to express an opinion on these consolidated financial statements and financial statement schedule based on our audits.
We conducted our audits in accordance with the standards of the Public Company Accounting Oversight Board (United States). Those standards require that we plan and perform the audit to obtain reasonable assurance about whether the financial statements are free of material misstatement. An audit includes examining, on a test basis, evidence supporting the amounts and disclosures in the financial statements. An audit also includes assessing the accounting principles used and significant estimates made by management, as well as evaluating the overall financial statement presentation. We believe that our audits provide a reasonable basis for our opinion.
In our opinion, the consolidated and combined financial statements referred to above present fairly, in all material respects, the financial position of Four Corners Property Trust, Inc. and subsidiaries as of December 31, 2016 and 2015, and the results of their operations and their cash flows for each of the years in the three‑year period ended December 31, 2016, in conformity with U.S. generally accepted accounting principles. Also in our opinion, the related financial statement schedule, when considered in relation to the basic consolidated and combined financial statements taken as a whole, presents fairly, in all material respects, the information set forth therein.
We also have audited, in accordance with the standards of the Public Company Accounting Oversight Board (United States), Four Corners Property Trust, Inc.’s internal control over financial reporting as of December 31, 2016, based on criteria established in Internal Control - Integrated Framework (2013) issued by the Committee of Sponsoring Organizations of the Treadway Commission (COSO), and our report dated February 27, 2017 expressed an unqualified opinion on the effectiveness of the Company’s internal control over financial reporting.
/s/ KPMG LLP
San Francisco, California
February 27, 2017
F-2
Report of Independent Registered Public Accounting Firm
The Board of Directors and Stockholders
Four Corners Property Trust, Inc.:
We have audited Four Corners Property Trust, Inc.’s internal control over financial reporting as of December 31, 2016, based on criteria established in Internal Control - Integrated Framework (2013) issued by the Committee of Sponsoring Organizations of the Treadway Commission (COSO). Four Corners Property Trust, Inc.’s management is responsible for maintaining effective internal control over financial reporting and for its assessment of the effectiveness of internal control over financial reporting, included in the accompanying Management’s Report on Internal Control over Financial Reporting. Our responsibility is to express an opinion on the Company’s internal control over financial reporting based on our audit.
We conducted our audit in accordance with the standards of the Public Company Accounting Oversight Board (United States). Those standards require that we plan and perform the audit to obtain reasonable assurance about whether effective internal control over financial reporting was maintained in all material respects. Our audit included obtaining an understanding of internal control over financial reporting, assessing the risk that a material weakness exists, and testing and evaluating the design and operating effectiveness of internal control based on the assessed risk. Our audit also included performing such other procedures as we considered necessary in the circumstances. We believe that our audit provides a reasonable basis for our opinion.
A company’s internal control over financial reporting is a process designed to provide reasonable assurance regarding the reliability of financial reporting and the preparation of financial statements for external purposes in accordance with generally accepted accounting principles. A company’s internal control over financial reporting includes those policies and procedures that (1) pertain to the maintenance of records that, in reasonable detail, accurately and fairly reflect the transactions and dispositions of the assets of the company; (2) provide reasonable assurance that transactions are recorded as necessary to permit preparation of financial statements in accordance with generally accepted accounting principles, and that receipts and expenditures of the company are being made only in accordance with authorizations of management and directors of the company; and (3) provide reasonable assurance regarding prevention or timely detection of unauthorized acquisition, use, or disposition of the company’s assets that could have a material effect on the financial statements.
Because of its inherent limitations, internal control over financial reporting may not prevent or detect misstatements. Also, projections of any evaluation of effectiveness to future periods are subject to the risk that controls may become inadequate because of changes in conditions, or that the degree of compliance with the policies or procedures may deteriorate.
In our opinion, Four Corners Property Trust, Inc. maintained, in all material respects, effective internal control over financial reporting as of December 31, 2016, based on criteria established in Internal Control - Integrated Framework (2013) issued by the Committee of Sponsoring Organizations of the Treadway Commission.
We also have audited, in accordance with the standards of the Public Company Accounting Oversight Board (United States), the consolidated balance sheets of Four Corners Property Trust, Inc. and subsidiaries as of December 31, 2016 and 2015, and the related consolidated and combined statements of income, comprehensive income, changes in equity, and cash flows for each of the years in the three-year period ended December 31, 2016, and our report dated February 27, 2017 expressed an unqualified opinion on those consolidated and combined financial statements.
/s/ KPMG LLP
San Francisco, California
February 27, 2017
F-3
FOUR CORNERS PROPERTY TRUST, INC.
CONSOLIDATED BALANCE SHEETS
(In thousands, except share and per share data)
|
December 31,
|
||||||||
|
2016
|
2015
|
|||||||
|
ASSETS
|
||||||||
|
Real estate investments:
|
||||||||
|
Land and improvements
|
$
|
421,941
|
|
$
|
404,812
|
|
||
|
Buildings, equipment and improvements
|
1,055,624
|
|
992,418
|
|
||||
|
Total real estate investments
|
1,477,565
|
|
1,397,230
|
|
||||
|
Less: Accumulated depreciation
|
(583,307
|
)
|
(568,539
|
)
|
||||
|
Total real estate investments, net
|
894,258
|
|
828,691
|
|
||||
|
Cash and cash equivalents
|
26,643
|
|
98,073
|
|
||||
|
Deferred rent
|
11,594
|
|
1,500
|
|
||||
|
Derivative assets
|
837
|
|
165
|
|
||||
|
Other assets
|
3,819
|
|
1,008
|
|
||||
|
Total Assets
|
$
|
937,151
|
|
$
|
929,437
|
|
||
|
LIABILITIES AND EQUITY
|
||||||||
|
Liabilities:
|
||||||||
|
Notes payable, net of deferred financing costs
|
$
|
438,895
|
|
$
|
392,302
|
|
||
|
Dividends payable
|
14,519
|
|
—
|
|
||||
|
Deferred rental revenue
|
7,974
|
|
7,940
|
|
||||
|
Derivative liabilities
|
—
|
|
477
|
|
||||
|
Deferred tax liabilities
|
196
|
|
80,881
|
|
||||
|
Other liabilities
|
5,450
|
|
6,195
|
|
||||
|
Total liabilities
|
467,034
|
|
487,795
|
|
||||
|
Equity:
|
||||||||
|
Preferred stock, par value $0.0001 per share, 25,000,000 authorized, zero shares issued and outstanding.
|
—
|
|
—
|
|
||||
|
Common stock, par value $0.0001 per share; 500,000,000 shares authorized, 59,923,557 and 42,741,995 shares issued and outstanding at December 31, 2016 and 2015, respectively
|
6
|
|
4
|
|
||||
|
Additional paid-in capital
|
438,864
|
|
436,697
|
|
||||
|
Retained earnings
|
25,943
|
|
5,257
|
|
||||
|
Accumulated other comprehensive income (loss)
|
207
|
|
(316
|
)
|
||||
|
Noncontrolling interest
|
5,097
|
|
—
|
|
||||
|
Total equity
|
470,117
|
|
441,642
|
|
||||
|
Total Liabilities and Equity
|
$
|
937,151
|
|
$
|
929,437
|
|
||
The accompanying notes are an integral part of this financial statement.
F-4
FOUR CORNERS PROPERTY TRUST, INC.
(In thousands, except for share and per share data)
|
Year Ended December 31,
|
||||||||||||
|
2016
|
2015
|
2014
|
||||||||||
|
Revenues:
|
||||||||||||
|
Rental revenue
|
$
|
105,624
|
|
$
|
15,134
|
|
$
|
—
|
|
|||
|
Restaurant revenue
|
18,394
|
|
18,322
|
|
17,695
|
|
||||||
|
Total revenues
|
124,018
|
|
33,456
|
|
17,695
|
|
||||||
|
Operating expenses:
|
||||||||||||
|
General and administrative
|
10,977
|
|
1,856
|
|
—
|
|
||||||
|
Depreciation and amortization
|
20,577
|
|
3,758
|
|
863
|
|
||||||
|
Restaurant expenses
|
17,853
|
|
16,996
|
|
16,942
|
|
||||||
|
Interest expense
|
14,828
|
|
2,203
|
|
—
|
|
||||||
|
Total operating expenses
|
64,235
|
|
24,813
|
|
17,805
|
|
||||||
|
Other income
|
97
|
|
—
|
|
—
|
|
||||||
|
Realized gain on sale, net
|
16,623
|
|
—
|
|
—
|
|
||||||
|
Income (loss) before income tax
|
76,503
|
|
8,643
|
|
(110
|
)
|
||||||
|
(Provision for) benefit from income tax
|
80,347
|
|
(2,944
|
)
|
142
|
|
||||||
|
Net income
|
156,850
|
|
5,699
|
|
32
|
|
||||||
|
Net income attributable to noncontrolling interest
|
(41
|
)
|
—
|
|
—
|
|
||||||
|
Net Income Available to Common Shareholders
|
$
|
156,809
|
|
$
|
5,699
|
|
$
|
32
|
|
|||
|
Basic net income per share:
|
$
|
2.75
|
|
$
|
0.92
|
|
NA
|
|
||||
|
Diluted net income per share:
|
$
|
2.63
|
|
$
|
0.91
|
|
NA
|
|
||||
|
Weighted average number of common shares outstanding:
|
||||||||||||
|
Basic
|
56,984,561
|
|
6,206,375
|
|
NA
|
|
||||||
|
Diluted
|
59,568,067
|
|
6,263,921
|
|
NA
|
|
||||||
|
Dividends declared per common share
|
$
|
0.9700
|
|
NA
|
|
NA
|
|
|||||
|
NA – not applicable
|
||||||||||||
The accompanying notes are an integral part of this financial statement.
F-5
FOUR CORNERS PROPERTY TRUST, INC.
CONSOLIDATED AND COMBINED STATEMENTS OF COMPREHENSIVE INCOME
(In thousands)
|
Year Ended December 31,
|
||||||||||||
|
2016
|
2015
|
2014
|
||||||||||
|
Net income
|
$
|
156,850
|
|
$
|
5,699
|
|
$
|
32
|
|
|||
|
Realized and unrealized loss on hedging instruments
|
540
|
|
(316
|
)
|
—
|
|
||||||
|
Comprehensive income
|
157,390
|
|
5,383
|
|
32
|
|
||||||
|
Less: comprehensive income attributable to noncontrolling interest
|
(58
|
)
|
—
|
|
—
|
|
||||||
|
Comprehensive Income Attributable to Common Shareholders
|
$
|
157,332
|
|
$
|
5,383
|
|
$
|
32
|
|
|||
The accompanying notes are an integral part of this financial statement.
F-6
FOUR CORNERS PROPERTY TRUST, INC.
CONSOLIDATED AND COMBINED STATEMENT OF CHANGES IN EQUITY
(In thousands, except share data)
|
Common Stock
|
Additional Paid-in Capital
|
Parent Company Equity
|
Retained Earnings
|
Accumulated Other Comprehensive Income (Loss)
|
Noncontrolling Interest
|
Total
|
|||||||||||||||||||||||||
|
Shares
|
Amount
|
||||||||||||||||||||||||||||||
|
Balance at December 31, 2013
|
—
|
|
$
|
—
|
|
$
|
—
|
|
$
|
9,872
|
|
$
|
—
|
|
$
|
—
|
|
$
|
—
|
|
$
|
9,872
|
|
||||||||
|
Net income
|
—
|
|
—
|
|
—
|
|
32
|
|
—
|
|
—
|
|
—
|
|
32
|
|
|||||||||||||||
|
Net transfers to parent
|
—
|
|
—
|
|
—
|
|
(906
|
)
|
—
|
|
—
|
|
—
|
|
(906
|
)
|
|||||||||||||||
|
Balance at December 31, 2014
|
—
|
|
—
|
|
—
|
|
8,998
|
|
—
|
|
—
|
|
—
|
|
8,998
|
|
|||||||||||||||
|
Contribution in connection with Spin-Off
|
—
|
|
—
|
|
436,697
|
|
(8,998
|
)
|
(442
|
)
|
—
|
|
—
|
|
427,257
|
|
|||||||||||||||
|
Issuance of common stock in connection with Spin-Off
|
42,741,995
|
|
4
|
|
—
|
|
—
|
|
—
|
|
—
|
|
—
|
|
4
|
|
|||||||||||||||
|
Net income
|
—
|
|
—
|
|
—
|
|
—
|
|
5,699
|
|
—
|
|
—
|
|
5,699
|
|
|||||||||||||||
|
Realized and unrealized gain (loss) on derivative instruments
|
—
|
|
—
|
|
—
|
|
—
|
|
—
|
|
(316
|
)
|
—
|
|
(316
|
)
|
|||||||||||||||
|
Balance at December 31, 2015
|
42,741,995
|
|
4
|
|
436,697
|
|
—
|
|
5,257
|
|
(316
|
)
|
—
|
|
441,642
|
|
|||||||||||||||
|
Issuance of OP units
|
—
|
|
—
|
|
—
|
|
—
|
|
—
|
|
5,039
|
|
5,039
|
|
|||||||||||||||||
|
Net income
|
—
|
|
—
|
|
—
|
|
—
|
|
156,809
|
|
—
|
|
41
|
|
156,850
|
|
|||||||||||||||
|
Realized and unrealized gain on derivative instruments
|
—
|
|
—
|
|
—
|
|
—
|
|
—
|
|
523
|
|
17
|
|
540
|
|
|||||||||||||||
|
Earnings and profits distribution
|
17,085,566
|
|
2
|
|
(2
|
)
|
—
|
|
(78,076
|
)
|
—
|
|
—
|
|
(78,076
|
)
|
|||||||||||||||
|
Dividends paid and declared on common stock
|
—
|
|
—
|
|
—
|
|
—
|
|
(58,047
|
)
|
—
|
|
—
|
|
(58,047
|
)
|
|||||||||||||||
|
ATM proceeds, net of issuance costs
|
32,513
|
|
—
|
|
640
|
|
—
|
|
—
|
|
—
|
|
—
|
|
640
|
|
|||||||||||||||
|
Stock-based compensation, net
|
63,483
|
|
—
|
|
1,529
|
|
—
|
|
—
|
|
—
|
|
—
|
|
1,529
|
|
|||||||||||||||
|
Balance at December 31, 2016
|
59,923,557
|
|
$
|
6
|
|
$
|
438,864
|
|
$
|
—
|
|
$
|
25,943
|
|
$
|
207
|
|
$
|
5,097
|
|
$
|
470,117
|
|
||||||||
The accompanying notes are an integral part of this financial statement.
F-7
FOUR CORNERS PROPERTY TRUST, INC.
(In thousands)
|
Year Ended December 31,
|
||||||||||||
|
2016
|
2015
|
2014
|
||||||||||
|
Cash flows - operating activities
|
||||||||||||
|
Net income attributable to common shareholders
|
$
|
156,850
|
|
$
|
5,699
|
|
32
|
|
||||
|
Adjustments to reconcile net income to cash provided by operating activities:
|
||||||||||||
|
Depreciation and amortization
|
20,577
|
|
3,758
|
|
863
|
|
||||||
|
Stock based compensation expense
|
1,550
|
|
101
|
|
117
|
|
||||||
|
(Gain) loss on sale of real estate, net
|
(16,623
|
)
|
25
|
|
15
|
|
||||||
|
Amortization of financing costs
|
1,593
|
|
265
|
|
—
|
|
||||||
|
Deferred income taxes
|
(80,685
|
)
|
1,195
|
|
(194
|
)
|
||||||
|
Changes in assets and liabilities:
|
||||||||||||
|
Deferred rent asset
|
(10,095
|
)
|
(1,500
|
)
|
—
|
|
||||||
|
Deferred rental revenue
|
34
|
|
7,940
|
|
—
|
|
||||||
|
Other assets and liabilities
|
(2,262
|
)
|
4,210
|
|
128
|
|
||||||
|
Net cash provided by operating activities
|
70,939
|
|
21,693
|
|
961
|
|
||||||
|
Cash flows - investing activities
|
||||||||||||
|
Purchases of real estate investments
|
(83,263
|
)
|
(556
|
)
|
(55
|
)
|
||||||
|
Proceeds from sale of real estate investments
|
24,091
|
|
—
|
|
—
|
|
||||||
|
Advance deposits on acquisition of operating real estate
|
(150
|
)
|
—
|
|
—
|
|
||||||
|
Net cash used in investing activities
|
(59,322
|
)
|
(556
|
)
|
(55
|
)
|
||||||
|
Cash flows - financing activities
|
||||||||||||
|
Proceeds from term loan borrowings
|
—
|
|
400,000
|
|
—
|
|
||||||
|
Proceeds from revolving credit facility
|
45,000
|
|
—
|
|
—
|
|
||||||
|
Proceeds from equity issuance (ATM), net of issuance costs
|
640
|
|
—
|
|
—
|
|
||||||
|
Payment of financing costs
|
—
|
|
(7,964
|
)
|
—
|
|
||||||
|
Net distribution to Darden related to the Spin-Off
|
—
|
|
(314,985
|
)
|
—
|
|
||||||
|
Predecessor transfers to parent
|
—
|
|
(122
|
)
|
(906
|
)
|
||||||
|
Payment of dividend to shareholders
|
(121,604
|
)
|
—
|
|
—
|
|
||||||
|
Repayment of debt
|
(7,083
|
)
|
—
|
|
—
|
|
||||||
|
Net cash (used in) provided by financing activities
|
(83,047
|
)
|
76,929
|
|
(906
|
)
|
||||||
|
Net change in cash
|
(71,430
|
)
|
98,066
|
|
—
|
|
||||||
|
Cash and cash equivalents, beginning of year
|
98,073
|
|
7
|
|
7
|
|
||||||
|
Cash and cash equivalents, ending of year
|
$
|
26,643
|
|
$
|
98,073
|
|
$
|
7
|
|
|||
|
Supplemental cash flow information
|
||||||||||||
|
Dividend payable
|
$
|
14,519
|
|
$
|
—
|
|
$
|
—
|
|
|||
|
Cash interest paid
|
13,493
|
|
982
|
|
—
|
|
||||||
|
Cash paid for income taxes
|
2,168
|
|
—
|
|
—
|
|
||||||
|
Non - cash investing and financing activities:
|
||||||||||||
|
Real estate investments, net acquired through Spin-Off
|
$
|
—
|
|
$
|
820,196
|
|
$
|
—
|
|
|||
|
Debt assumed in purchase of real estate investments
|
7,083
|
|
—
|
|
—
|
|
||||||
|
Other assets acquired through Spin-Off at carrying value
|
—
|
|
144
|
|
—
|
|
||||||
|
Other liabilities assumed through Spin-Off at carrying value
|
—
|
|
77,972
|
|
—
|
|
||||||
|
Change in fair value of derivative instruments
|
1,149
|
|
(316
|
)
|
—
|
|
||||||
|
Operating partner units issued in exchange for real estate investments
|
5,039
|
|
—
|
|
—
|
|
||||||
|
Value of shares issued in connection with E&P distribution
|
277,470
|
|
—
|
|
—
|
|
||||||
The accompanying notes are an integral part of this financial statement.
F-8
NOTES TO CONSOLIDATED AND COMBINED FINANCIAL STATEMENTS
Four Corners Property Trust, Inc. (together with its subsidiaries, “FCPT”) is an independent, publicly traded, self-administered company, primarily engaged in the ownership, acquisition and leasing of restaurant properties. Substantially all of our business is conducted through Four Corners Operating Partnership, LP (“FCPT OP”), a Delaware limited partnership of which we are the initial and substantial limited partner. Our wholly owned subsidiary, Four Corners GP, LLC (“FCPT GP”), is its sole general partner.
FCPT was incorporated as a Maryland corporation on July 2, 2015 as a wholly owned indirect subsidiary of Darden Restaurants, Inc., (together with its consolidated subsidiaries “Darden”), for the purpose of owning, acquiring and leasing properties on a triple-net basis, for use in the restaurant and related food service industries. On November 9, 2015, Darden completed a spin-off of FCPT whereby Darden contributed to us
100%
of the equity interest in entities that own
418
properties (the “Properties” or “Property”) in which Darden operates restaurants, representing
five
of their brands, and
six
LongHorn Steakhouse® restaurants located in the San Antonio, Texas area (the “Kerrow Restaurant Operating Business”) along with the underlying properties or interests therein associated with the Kerrow Restaurant Operating Business. In exchange, we issued to Darden all of our common stock and paid to Darden
$315.0 million
in cash. Subsequently, Darden distributed all of our outstanding shares of common stock pro rata to holders of Darden common stock whereby each Darden shareholder received one share of our common stock for every
three
shares of Darden common stock held at the close of business on the record date, which was November 2, 2015, as well as cash in lieu of any fractional shares of our common stock which they would have otherwise received (the “Spin-Off”). The Spin-Off is intended to qualify as tax-free to Darden shareholders for U. S. federal income tax purposes, except for cash paid in lieu of fractional shares.
We intend to elect to be taxed, and have operated and intend to continue to operate in a manner that will allow us to qualify as a real estate investment trust (“REIT”) for U.S. federal income tax purposes commencing with our taxable year beginning January 1, 2016. To qualify as a REIT, we must meet a number of organizational and operational requirements, including a requirement that we distribute at least 90% of our adjusted taxable income to our shareholders, subject to certain adjustments and excluding any net capital gain. As a REIT, we will not be subject to federal corporate income tax on that portion of net income that is distributed to our shareholders. However, FCPT’s taxable REIT subsidiaries (“TRS”) will generally be subject to federal, state, and local income taxes. We will make our REIT election upon the filing of our 2016 tax return.
Any references to “the Company,” “we,” “us,” “our” or “the Successor” refer to FCPT as an independent, publicly traded, self-administered company. Any references to the Kerrow Restaurant Operating Business refer to it as owned by Darden and for all periods prior to November 9, 2015 and as owned by us for periods subsequent to November 9, 2015.
Principles of Consolidation and Basis of Presentation
The accompanying consolidated and combined financial statements include the accounts of FCPT and its subsidiaries. All intercompany accounts and transactions have been eliminated in consolidation.
The consolidated and combined financial statements reflect all adjustments which are, in the opinion of management, necessary to a fair statement of the results for the interim periods presented. These adjustments are considered to be of a normal, recurring nature.
The historical financial statements for the Kerrow Restaurant Operating Business were prepared on a stand-alone basis and were derived from the consolidated financial statements and accounting records of Darden. These statements reflect the historical financial condition and results of operations of Kerrow Restaurant Operating Business in accordance with GAAP. The consolidated and combined financial statements include all revenues and costs allocable to us either through specific identification or allocation, and all assets and liabilities directly attributable to us as derived from the operations of the restaurants. The consolidated and combined statements of comprehensive income include allocations of certain costs from Darden incurred on ou
r behalf. See Note 4 - Related Party Transactions for a further description of allocated expenses.
F-9
NOTES TO CONSOLIDATED AND COMBINED FINANCIAL STATEMENTS (continued)
Noncontrolling Interest
Noncontrolling interest represents the aggregate limited partnership interests in FCPT OP held by third parties. In accordance with GAAP, the noncontrolling interest of FCPT OP is shown as a component of equity on our consolidated balance sheets, and the portion of income (loss) allocable to third parties is shown as net income (loss) attributable to noncontrolling interest in our consolidated and combined statements of operations and consolidated statements of comprehensive income. T
he Company follows the guidance issued by the FASB regarding the classification and measurement of redeemable securities. Accordingly, the Company has determined that the common OP units meet the requirements to be classified as permanent equity.
A reconciliation of equity attributable to noncontrolling interest is disclosed in our consolidated statements of equity.
Reclassifications
Certain amounts previously reported under specific financial statement captions have been reclassified to be consistent with the current period presentation. For the years ended December 31, 2016 and 2015,
we have conformed the prior presentation of the Kerrow Restaurant Operating Business to the current format for comparability purposes.
Use of Estimates
The preparation of these consolidated and combined financial statements requires management to make estimates and assumptions that affect the reported amounts of assets and liabilities and disclosure of contingent assets and liabilities at the date of the financial statements, and the reported amounts of sales and expenses during the reporting period. The estimates and assumptions used in the accompanying consolidated and combined financial statements are based on management’s evaluation of the relevant facts and circumstances as of the date of the combination. Actual results may differ from the estimates and assumptions used in preparing the accompanying financial statements, and such differences could be material.
Real Estate Investments
Real estate investments, net are recorded at cost less accumulated depreciation. Building components are depreciated over estimated useful lives ranging from
seven
to
fifty-four
years using the straight-line method. Leasehold improvements, which are reflected on our balance sheets as a component of buildings, within land, buildings and equipment, net, are amortized over the lesser of the non-cancelable lease term or the estimated useful lives of the related assets using the straight-line method. Equipment is depreciated over estimated useful lives ranging from
two
to
fifteen
years also using the straight-line method. Real estate development and construction costs for newly constructed restaurants are capitalized in the period in which they are incurred. Gains and losses on the disposal of land, buildings and equipment are included in our accompanying statements of comprehensive income.
Our accounting policies regarding land, buildings and equipment, including leasehold improvements, include our judgments regarding the estimated useful lives of these assets, the residual values to which the assets are depreciated or amortized, the determination of what constitutes a reasonably assured lease term, and the determination as to what constitutes enhancing the value of or increasing the life of existing assets. These judgments and estimates may produce materially different amounts of reported depreciation and amortization expense if different assumptions were used. As discussed further below, these judgments may also impact our need to recognize an impairment charge on the carrying amount of these assets as the cash flows associated with the assets are realized, or as our expectations of estimated future cash flows change.
Acquisition of Real Estate
Prior to the fourth quarter of 2016, the Company evaluated the inputs, processes and outputs of each asset acquired to determine if the transaction is a business combination or asset acquisition. As the Company acquired only real estate investments with triple-net leases, it determined there are no inputs or processes associated with the acquired assets and the investments should be accounted for as asset acquisitions. Related transaction costs are generally capitalized and amortized over the useful life of the acquired assets.
In the fourth quarter of 2016, the Company adopted ASU 2017-01, “Business Combinations (Topic 805): Clarifying the Definition of a Business,” which provided additional guidance for determining whether transactions should be accounted for as asset acquisitions or business combinations. The Company evaluated the acquisitions and concluded that the land, building, site improvements, and in-places leases (if any) were a single asset. The building and property improvements are attached to the land
F-10
NOTES TO CONSOLIDATED AND COMBINED FINANCIAL STATEMENTS (continued)
and cannot be physically removed and used separately from the land without incurring significant costs or reducing their fair value. As substantially all of the fair value of the gross assets acquired are concentrated in a single identifiable asset, the acquisitions do not qualify as a business and are accounted for as asset acquisitions. Related transaction costs are generally capitalized and amortized over the useful life of the acquired assets.
The Company allocates the purchase price (including acquisition and closing costs) of real estate acquisitions to land, building, and site improvements based on their relative fair values. In making estimates of fair values for this purpose, the Company uses a third-party specialist that obtains various information about each property, including the pre-acquisition due diligence and leasing activities of the Company.
Lease Intangibles
Lease intangibles, if any, acquired in conjunction with the purchase of real estate represent the value of in-place leases and above- or below-market leases. For real estate acquired subject to existing lease agreements, in-place lease intangibles are valued based on the Company’s estimates of costs related to tenant acquisition and the carrying costs that would be incurred during the time it would take to locate a tenant if the property were vacant, considering current market conditions and costs to execute similar leases at the time of the acquisition. Above- and below-market lease intangibles are recorded based on the present value of the difference between the contractual amounts to be paid pursuant to the leases at the time of acquisition of the real estate and the Company’s estimate of current market lease rates for the property, measured over a period equal to the remaining initial term of the lease.
In-place lease intangibles are amortized on a straight-line basis over the remaining initial term of the related lease and included in depreciation and amortization expense. Above-market lease intangibles are amortized over the remaining initial terms of the respective leases as a decrease in rental revenue. Below market lease intangibles are generally amortized as an increase to rental revenue over the remaining initial term of the respective leases, but may be amortized over the renewal periods if the Company believes it is likely the tenant will exercise the renewal option. Should a lease terminate early, the unamortized portion of any related lease intangible is immediately recognized in impairment loss in the Company’s consolidated statements of operations.
Impairment of Long-Lived Assets
Land, buildings and site improvements and certain other assets, including definite-lived intangible assets, are reviewed for impairment whenever events or changes in circumstances indicate that the carrying amount of an asset may not be recoverable. Recoverability of assets to be held and used is measured by a comparison of the carrying amount of the assets to the future undiscounted net cash flows expected to be generated by the assets. Identifiable cash flows are measured at the lowest level for which they are largely independent of the cash flows of other groups of assets and liabilities, generally at the restaurant level. If these assets are determined to be impaired, the amount of impairment recognized is measured by the amount by which the carrying amount of the assets exceeds their fair value. Fair value is generally determined by appraisals or sales prices of comparable assets.
The judgments we make related to the expected useful lives of long-lived assets and our ability to realize undiscounted cash flows in excess of the carrying amounts of these assets are affected by factors such as the ongoing maintenance and improvements of the assets, changes in economic conditions, changes in usage or operating performance, desirability of the restaurant sites and other factors, such as our ability to sell our assets held for sale. As we assess the ongoing expected cash flows and carrying amounts of our long-lived assets, significant adverse changes in these factors could cause us to realize a material impairment loss.
Restaurant sites and certain other assets to be disposed of are reported at the lower of their carrying amount or fair value, less estimated costs to sell. Restaurant sites and certain other assets to be disposed of are included in assets held for sale when certain criteria are met. These criteria include the requirement that the likelihood of disposing of these assets within one year is probable. Assets whose disposal is not probable within
one
year remain in land, buildings and equipment until their disposal within one year is probable. Disposals of assets that have a major effect on our operations and financial results or that represent a strategic shift in our operating businesses are reviewed to determine whether those assets would also meet the requirements to be reported as discontinued operations.
Exit or disposal activities include the cost of disposing of the assets and are generally expensed as incurred. Upon disposal of the assets, any gain or loss is recorded in the same caption within our statements of comprehensive income as the original impairment.
F-11
NOTES TO CONSOLIDATED AND COMBINED FINANCIAL STATEMENTS (continued)
Cash and Cash Equivalents
We consider all highly liquid investments with a maturity of three months or less when purchased to be cash equivalents. Cash and cash equivalents can consist of cash and money market accounts.
Derivative Instruments and Hedging Activities
We enter into derivative instruments for risk management purposes only, including derivatives designated as hedging instruments as required by FASB ASC Topic 815, Derivatives and Hedging, and those utilized as economic hedges. Our use of derivative instruments is currently limited to interest rate hedges. These instruments are generally structured as hedges of the variability of cash flows related to forecasted transactions (cash flow hedges). We do not enter into derivative instruments for trading or speculative purposes, where changes in the cash flows of the derivative are not expected to offset changes in cash flows of the hedged item. All derivatives are recognized on the balance sheet at fair value. For those derivative instruments for which we intend to elect hedge accounting, at the time the derivative contract is entered into, we document all relationships between hedging instruments and hedged items, as well as our risk-management objective and strategy for undertaking the various hedge transactions. This process includes linking all derivatives designated as cash flow hedges to specific assets and liabilities on the consolidated balance sheet or to specific forecasted transactions. We also formally assess, both at the hedge’s inception and on an ongoing basis, whether the derivatives used in hedging transactions are highly effective in offsetting changes in cash flows of hedged items.
To the extent our derivatives are effective in offsetting the variability of the hedged cash flows, and otherwise meet the cash flow hedge accounting criteria in accordance with GAAP, changes in the derivatives’ fair value are not included in current earnings but are included in accumulated other comprehensive income (loss), net of tax. These changes in fair value will be reclassified into earnings at the time of the forecasted transaction. Ineffectiveness measured in the hedging relationship is recorded in earnings in the period in which it occurs.
See Note 8 - Derivative Financial Instruments for additional information.
Other Assets and Liabilities
Other assets primarily consist of prepaid assets, inventories, and accounts receivable. Other liabilities primarily consist of accrued compensation, accrued operating expenses, and deferred rent obligations on certain operating leases.
Notes Payable
Notes payable are carried at their unpaid principal balance, net of deferred financing costs. This long-term debt is unsecured and interest is paid monthly until it is paid in whole or matures at a future date.
Deferred Financing Costs
Financing costs related to long-term debt are deferred and amortized over the remaining life of the debt using the effective interest method. These costs are presented as a direct deduction from their related liabilities on the balance sheets.
Revenue Recognition
Rental revenue
For those triple-net leases that provide for periodic and determinable increases in base rent, base rental revenue is recognized on a straight-line basis over the applicable lease term when collectability is reasonably assured. Recognizing rental income on a straight-line basis generally results in recognized revenues during the first half of a lease term exceeding the cash amounts contractually due from our tenants, creating a straight-line rent receivable. Taxes collected from lessees and remitted to governmental authorities are presented on a net basis within rental income in our consolidated and combined statements of income.
For those leases that provide for periodic increases in base rent only if certain revenue parameters or other substantive contingencies are met, the increased rental revenue is recognized as the related parameters or contingencies are met, rather than on a straight-line basis over the applicable lease term.
F-12
NOTES TO CONSOLIDATED AND COMBINED FINANCIAL STATEMENTS (continued)
Income from rent, lease termination fees and all other income is recognized when all of the following criteria are met in accordance with SEC Staff Accounting Bulletin 104: (i) the applicable agreement has been fully executed and delivered; (ii) services have been rendered; (iii) the amount is fixed or determinable; and (iv) collectability is reasonable assured.
We assess the collectability of our lease receivables, including straight-line receivables. We base our assessment of the collectability of rent receivables (other than straight-line rent receivables) on several factors, including payment history, the financial strength of the tenant and any guarantors, the value of the underlying collateral, if any, and current economic conditions. If our evaluation of these factors indicates it is probable that we will be unable to recover the full value of the receivable, we provide a reserve against the portion of the receivable that we estimate may not be recovered. We also base our assessment of the collectability of straight-line rent receivables on several factors, including among other things, the financial strength of the tenant and any guarantors, the historical operations and operating trends of the property, the historical payment pattern of the tenant and the type of property. If our evaluation of these factors indicates it is probable that we will be unable to receive the rent payments due in the future, we provide a reserve against the recognized straight-line rent receivable asset for the portion, up to its full value, that we estimate may not be recovered. If we change our assumptions or estimates regarding the collectability of future rent payments required by a lease, we may adjus
t our reserve or reduce the rental revenue recognized in the period we make such change in our assumptions or estimates.
Restaurant revenue
Restaurant revenue represents food and beverage product sold and is presented net of the following discounts: coupons, employee meals, complimentary meals and gift cards. Revenue from restaurant sales is recognized when food and beverage products are sold. We recognize sales from our gift cards when the gift card is redeemed by the customer. Sales taxes collected from customers and remitted to governmental authorities are presented on a net basis within restaurant revenue on our consolidated and combined statements of income.
See Application of New Accounting Standards below for discussion of the application of ASU 2014-09.
Restaurant Expenses
Restaurant expenses include restaurant labor, general and administrative expenses, and food and beverage costs. Food and beverage costs include inventory, warehousing, related purchasing and distribution costs. Vendor allowances received in connection with the purchase of a vendor’s products are recognized as a reduction of the related food and beverage costs as earned. For expenses incurred prior to November 9, 2015, advance payments were made to Darden by the vendors based on estimates of volume to be purchased from the vendors and the terms of the agreement. As we made purchases from the vendors each period, Darden allocated the pro rata portion of allowances earned by us. We recorded these allowances as a reduction of food and beverage costs in the period earned. We considered the allocation methodology and results to be reasonable for the periods prior to November 9, 2015.
Income Taxes
We intend to elect and qualify as a REIT for U.S. federal income tax purposes commencing with the taxable year beginning January 1, 2016. So long as we qualify as a REIT, we generally will not be subject to U.S. federal income tax on our net income that we distribute currently to our stockholders. To maintain our qualification as a REIT, we will be required under the Code to distribute at least 90% of our REIT taxable income (without regard to the deduction for dividends paid and excluding net capital gains) to our stockholders and meet certain other requirements. If we fail to qualify as a REIT in any taxable year, we will be subject to U.S. federal income tax on our taxable income at regular corporate rates. Even if we qualify as a REIT, we may also be subject to certain state, local and franchise taxes. Under certain circumstances, U.S. federal income and excise taxes may be due on our undistributed taxable income.
We were taxed as a C corporation and paid U.S. federal corporate income taxes for our taxable year ending December 31, 2015 and all prior periods. The Kerrow Restaurant Operating Business is a taxable REIT subsidiary and will continued to be taxed as a C corporation.
We provide for federal and state income taxes currently payable as well as for those deferred because of temporary differences between reporting income and expenses for financial statement purposes versus tax purposes. Federal income tax credits are recorded as a reduction of income taxes. Deferred tax assets and liabilities are recognized for the future tax consequences attributable
F-13
NOTES TO CONSOLIDATED AND COMBINED FINANCIAL STATEMENTS (continued)
to differences between the financial statement carrying amounts of existing assets and liabilities and their respective tax bases. Deferred tax assets and liabilities are measured using enacted tax rates expected to apply to taxable income in the years in which those temporary differences are expected to be recovered or settled. The effect on deferred tax assets and liabilities of a change in tax rates is recognized in earnings in the period that includes the enactment date. Interest recognized on reserves for uncertain tax positions is included in interest, net in our consolidated statements of comprehensive income. A corresponding liability for accrued interest is included as a component of other liabilities on our consolidated balance sheets. Penalties, when incurred, are recognized in general and administrative expenses.
We estimate certain components of our provision for income taxes. These estimates include, among other items, depreciation and amortization expense allowable for tax purposes, allowable tax credits for items such as taxes paid on reported employee tip income, effective rates for state and local income taxes and the valuation and tax deductibility of certain other items. We adjust our annual effective income tax rate as additional information on outcomes or events becomes available.
We base our estimates on the best available information at the time that we prepare the provision. We will generally file our annual income tax returns several months after our year end. Income tax returns are subject to audit by state and local governments, generally years after the returns are filed. These returns could be subject to material adjustments or differing interpretations of the tax laws. The major jurisdictions in which we will file income tax returns are the U.S. federal jurisdiction and all states in the U.S. in which we own properties that have an income tax.
Tax accounting guidance requires that a position taken or expected to be taken in a tax return be recognized (or derecognized) in the financial statements when it is more likely than not (i.e., a likelihood of more than 50 percent) that the position would be sustained upon examination by tax authorities. A recognized tax position is then measured at the largest amount of benefit that is greater than 50 percent likely of being realized upon ultimate settlement.
We include within our current tax provision the balance of unrecognized tax benefits related to tax positions for which it is reasonably possible that the total amounts could change during the next 12 months based on the outcome of examinations.
Prior to the Spin-Off, our restaurant operations were included in the consolidated federal income tax return of Darden, as well as certain state tax returns where Darden files on a combined basis. Darden, the predecessor of the Company for accounting purposes (the “Predecessor”) has applied the provisions of FASB ASC Topic 740, Income Taxes, and computed the provision for income taxes on a separate return basis. The separate return method applies the accounting guidance for income taxes to the stand-alone consolidated and combined financial statements as if the Predecessor was a separate taxpayer and a stand-alone enterprise for the periods presented. The calculation of income taxes for the Predecessor on a separate return basis requires a considerable amount of judgment and use of both estimates and allocations. We believe that the assumptions and estimates used to compute these tax amounts are reasonable. However, the Predecessor’s financial statements may not necessarily reflect its income tax expense or tax payments in the future, or what our tax amounts would have been had the Predecessor been a stand-alone enterprise during the periods presented.
Federal and state income taxes payable prior to the Spin-Off were settled through the parent company equity account. The Predecessor provided for taxes that are deferred because of temporary differences between reporting income and expenses for financial statement purposes versus tax purposes. Federal income tax credits have been recorded as a reduction of income taxes. Deferred tax assets and liabilities have been recognized for the future tax consequences attributable to differences between the financial statement carrying amounts of existing assets and liabilities and their respective tax bases. Deferred tax assets and liabilities have been measured using enacted tax rates expected to apply to taxable income in the years in which those temporary differences are expected to be recovered or settled. The effect on deferred tax assets and liabilities of a change in tax rates have been recognized in earnings in the period that includes the enactment date.
In determining the need for a valuation allowance or the need for uncertain tax positions, the Predecessor made certain estimates and assumptions. These estimates and assumptions were based on, among other things, knowledge of the operations, markets, historical trends and likely future changes and, when appropriate, the opinion of advisors with knowledge and expertise in relevant fields. Due to certain risks associated with our estimates and assumptions, actual results could differ.
See Note 9 - Income Taxes for additional information.
F-14
NOTES TO CONSOLIDATED AND COMBINED FINANCIAL STATEMENTS (continued)
Stock-Based Compensation
The Company’s stock-based compensation plan provides for the grant of restricted stock awards (“RSAs”), deferred stock units (“DSUs”), performance-based awards (including performance stock units (“PSUs”)), dividend equivalents, restricted stock units (“RSUs”), and other types of awards to eligible participants. Dividend equivalents rights (“DEUs”) are earned during the vesting period and received upon vesting of award. Upon forfeiture of an award, DEUs earned during the vesting period are also forfeited. We classify stock-based payment awards either as equity awards or liability awards based upon cash settlement options. Equity classified awards are measured based on the fair value on the date of grant. Liability classified awards are remeasured to fair value each reporting period. We recognize costs resulting from the Company’s stock-based compensation awards on a straight-line basis over their vesting periods, which range between
one
and
five
years, less estimated forfeitures. No compensation cost is recognized for awards for which employees do not render the requisite services.
See Note 11 - Stock-based Compensation for additional information.
Earnings Per Share
Basic earnings per share (“EPS”) are computed by dividing net income allocated to common shareholders by the weighted-average number of common shares outstanding for the reporting period. Diluted EPS reflects the potential dilution that could occur if securities or other contracts to issue common stock were exercised or converted into common stock. No effect is shown for any securities that are anti-dilutive. Net income allocated to common shareholders represents net income less income allocated to participating securities. At December 31, 2016, none of the Company’s equity awards qualified as participating securities.
See Note 10 - Equity for additional information.
Fair Value of Financial Instruments
We use a fair value approach to value certain assets and liabilities. Fair value is the price that would be received to sell an asset or paid to transfer a liability in an orderly transaction between market participants at the measurement date. As such, fair value is a market-based measurement that should be determined based on assumptions that market participants would use in pricing an asset or liability. We use a fair value hierarchy, which distinguishes between assumptions based on market data (observable inputs) and an entity's own assumptions (unobservable inputs). The hierarchy consists of three levels:
|
•
|
Level 1 - Quoted market prices in active markets for identical assets or liabilities;
|
|
•
|
Level 2 - Inputs other than level one inputs that are either directly or indirectly observable; and
|
|
•
|
Level 3 - Unobservable inputs developed using estimates and assumptions, which are developed by the reporting entity and reflect those assumptions that a market participant would use.
|
Parent Company Equity
Parent company equity in our consolidated and combined statements of changes in equity represents Darden’s historical investment in us, our accumulated net income after taxes, and the net effect of transactions with, and allocations from Darden.
All intercompany transactions effected through parent company equity in our consolidated balance sheets have been considered cash receipts and payments for purposes of our consolidated statements of cash flows and are reflected in financing activities in the accompanying consolidated statements of cash flows. See Note 4 - Related Party Transactions for additional information.
Application of New Accounting Standards
In May 2014, the FASB issued ASU No. 2014-09, “Revenue from Contracts with Customers”. The standard outlines a single comprehensive revenue recognition model for entities to follow in accounting for revenue from contracts with customers and supersedes most current revenue recognition guidance, including industry-specific guidance. The core principle of the revenue model is that an entity should recognize revenue for the transfer of promised goods or services to customers in an amount that reflects the consideration to which the entity expects to be entitled to receive for those goods or services. On July 9, 2015, the FASB decided to delay the effective date of ASU 2014-09 for one year. The standard is now effective for annual periods beginning after December 15, 2017 and interim periods within those annual periods. Early adoption for annual periods beginning after
F-15
NOTES TO CONSOLIDATED AND COMBINED FINANCIAL STATEMENTS (continued)
December 15, 2016 and interim periods within those annual periods is permitted.
We do not expect adoption of this guidance to have a material impact on our consolidated and combined financial statements or related disclosures.
In February 2015, the FASB issued ASU No. 2015-02, “Consolidation (Topic 810): Amendments to the Consolidation Analysis” which makes certain changes to both the variable interest model and the voting model including changes to (1) the identification of variable interests (fees paid to a decision maker or service provider), (2) the variable interest entity characteristics for a limited partnership or similar entity and (3) the primary beneficiary determination. ASU 2015-02 is effective for us beginning January 1, 2016. Adoption of this guidance has had no material impact on our consolidated and combined financial statements and related disclosures.
In July 2015, the FASB issued
ASU No. 2015-11, “Inventory (Topic 330): Simplifying the Measurement of Inventory,” which applies to inventory that is measured using first-in, first-out or average cost. Under the updated guidance, an entity should measure inventory that is within scope at the lower of cost and net realizable value, which is the estimated selling prices in the ordinary course of business, less reasonably predictable costs of completion, disposal and transportation. Subsequent measurement is unchanged for inventory that is measured using last-in, first-out. This ASU is effective for annual and interim periods beginning after December 15, 2016, and should be applied prospectively with early adoption permitted at the beginning of an interim or annual reporting period.
We do not expect adoption of this guidance to have a material impact on our consolidated and combined financial statements or related disclosures.
In February 2016, the FASB issued ASU No. 2016-02, “Leases (Topic 842)”, which supersedes the existing guidance for lease accounting, Leases (Topic 840). ASU 2016-02 requires lessees to recognize leases on their balance sheets, and leaves lessor accounting largely unchanged. The amendments in this ASU are effective for fiscal years beginning after December 15, 2018 and interim periods within those fiscal years. Early application is permitted for all entities. ASU 2016-02 requires a modified retrospective approach for all leases existing at, or entered into after, the date of initial application, with an option to elect to use certain transition relief. We are currently evaluating the impact of adopting this guidance.
In March 2016, the FASB issued ASU No. 2016-09, “Compensation—Stock Compensation (Topic 718): Improvements to Employee Share-Based Payment Accounting,” which amends how companies account for certain aspects of share-based payments to employees. The new guidance will require all income tax effects of awards to be recognized in the income statement when the awards vest or are settled. It also will allow an employer to repurchase more of an employee’s shares than it can today for tax withholding purposes without triggering liability accounting and to make a policy election to account for forfeitures as they occur. The amendments in this ASU are effective for fiscal years beginning after December 15, 2016 and interim periods within those fiscal years. We do not expect adoption of this guidance to have a material impact on our consolidated and combined financial statements or related disclosures.
In August 2016, the FASB issued ASU No. 2016-15, "Statement of Cash Flows - Classification of Certain Cash Receipts and Cash Payments." ASU 2016-15 provides guidance on certain specific cash flow issues, including, but not limited to, debt prepayment or extinguishment costs, contingent consideration payments made after a business combination and distributions received from equity method investees. ASU 2016-15 is effective for periods beginning after December 15, 2017, with early adoption permitted and shall be applied retrospectively where practicable. We do not expect adoption of this guidance to have a material impact on our consolidated and combined financial statements or related disclosures.
In January 2017, the FASB issued ASU No. 2017-01, “Business Combinations (Topic 805): Clarifying the Definition of a Business.” ASU 2017-01 effective for fiscal years beginning after December 15, 2017, including interim periods within those periods. The amendments in this update provide a screen to determine when a set is not a business. The screen requires that when substantially all of the fair value of the gross assets acquired (or disposed of) is concentrated in a single identifiable asset or a group of similar identifiable assets, the set is not a business. We adopted ASU 2017-01 in the fourth quarter of 2016.
Our tenant base and the restaurant brands operating our properties are highly concentrated. With respect to our tenant base, Darden is the sole tenant of the Properties, which constitute approximately
88%
of the properties we own. In addition, Darden Restaurants, Inc. has guaranteed the obligations of the tenants under substantially all of the Leases entered into in respect of the Properties. As our revenues predominately consist of rental payments under the Leases, we are dependent on Darden for substantially
F-16
all of our leasing revenues. The audited financial statements for Darden can be found in the Investor Relations section at www.darden.com.
We also are subject to concentration risk in terms of the restaurant brands that operate the Properties. With
475
locations in our portfolio, Olive Garden brand restaurants comprise approximately
63%
of the Properties and approximately
70%
of the revenues receive under the Leases, based on the total number of locations leased. Our properties are located in
44
states with concentrations of
10%
or greater in
two
states, Florida (
12%
) and Texas (
11%
).
Financial instruments that potentially subject us to significant concentrations of credit risk consist principally of cash and cash equivalents. We are exposed to credit risk with respect to cash held at various financial institutions, access to our credit facility, and amounts due or payable under our derivative contracts. At December 31, 2016, our exposure to risk related to our derivative instruments totaled
$837 thousand
, and the counterparty to such instruments is an investment grade financial institution. Our credit risk exposure with regard to our cash and the
$305 million
available capacity under the revolver portion of our credit facility is spread among a diversified group of investment grade financial institutions.
Allocation of Darden Corporate Expenses to the Predecessor
Prior to the Spin-Off, we were managed in the normal course of business by Darden and its subsidiaries. All direct costs incurred in connection with our operations for which specific identification was practical have been included in the stand-alone combined financial statements. Additionally, certain shared costs and certain support functions have been allocated to us and reflected as expenses in the stand-alone consolidated and combined financial statements. Management considers the allocation methodologies used to be reasonable and appropriate reflections of the historical Darden expenses allocable to the Predecessor for purposes of the stand-alone financial statements; however, the expenses reflected in the consolidated and combined financial statements may not be indicative of the actual expenses that would have been incurred during the periods presented if we had operated as a separate, stand-alone entity. Management does not believe, however, that it is practicable to estimate what these expenses would have been had we operated as a separate, stand-alone entity, including any expenses associated with obtaining any of these services from unaffiliated entities. Actual costs that would have been incurred had we been a stand-alone entity would depend on multiple factors, including organizational structure and strategic decisions made in various areas, including information technology and infrastructure. In addition, the expenses reflected in the combined financial statements may not be indicative of expenses that will be incurred by us in the future.
The costs allocated to us were made on the basis of operating weeks, net sales or other relevant measures. Corporate expense allocations primarily relate to centralized corporate functions, including advertising, finance, accounting, treasury, tax, legal, internal audit, human resources, facilities, risk management functions, employee benefits and stock based compensation (except for specifically identified stock-based compensation benefits discussed in Note 9 - Stock-Based Compensation). In addition, corporate expenses include, among other costs, maintenance of existing software, technology and websites, development of new or improved software technology, professional fees for legal, accounting, and financial services, non-income taxes and expenses related to litigation, investigations, or similar matters. Corporate expenses allocated to us were
$0.9 million
for the year ended December 31, 2015 and
$1.2 million
for the year ended December 31, 2014 and have been included within restaurant expenses in our combined statements of comprehensive income. All of the corporate allocations of costs are deemed to have been incurred and settled through parent company equity in the period where the costs were recorded. Following the Spin-Off, we have performed these functions using our own resources or purchased services. For an interim period, however, some of these functions were continue to be provided by Darden under transition services agreements. During 2015, Darden earned
$110 thousand
under the transition services agreements.
Subsequent to the Spin-Off on November 9, 2015, Darden is no longer a related party.
F-17
Real Estate Investments
Real estate investments, net, which consist of land, buildings and improvements leased to others subject to triple-net operating leases and those utilized in the operations of Kerrow Restaurant Operating Business is summarized as follows:
|
December 31,
|
||||||||
|
(In thousands)
|
2016
|
2015
|
||||||
|
Land
|
$
|
421,941
|
|
$
|
404,812
|
|
||
|
Buildings and improvements
|
916,444
|
|
851,967
|
|
||||
|
Equipment
|
139,180
|
|
140,451
|
|
||||
|
Total gross real estate investments
|
1,477,565
|
|
1,397,230
|
|
||||
|
Less: accumulated depreciation
|
(583,307
|
)
|
(568,539
|
)
|
||||
|
Total Real Estate Investments, Net
|
$
|
894,258
|
|
$
|
828,691
|
|
||
Operating Leases
The following table presents the scheduled minimum future contractual rent to be received under the remaining non-cancelable term of the operating leases.
Because lease renewal periods are exercisable at the option of the lessee, the table presents future minimum lease payments due during the initial lease term only.
|
December 31,
|
||||
|
(In thousands)
|
2016
|
|||
|
2017
|
$
|
100,973
|
|
|
|
2018
|
102,369
|
|
||
|
2019
|
103,857
|
|
||
|
2020
|
105,349
|
|
||
|
2021
|
106,797
|
|
||
|
Thereafter
|
1,005,191
|
|
||
|
Total Future Minimum Rentals
|
$
|
1,524,536
|
|
|
Other Assets
The components of other assets were as follows:
|
December 31,
|
||||||||
|
(In thousands)
|
2016
|
2015
|
||||||
|
Intangibles lease assets
|
$
|
1,772
|
|
$
|
—
|
|
||
|
Prepaid acquisition costs
|
717
|
|
—
|
|
||||
|
Prepaid assets
|
614
|
|
689
|
|
||||
|
Inventories
|
202
|
|
198
|
|
||||
|
Accounts receivable
|
162
|
|
70
|
|
||||
|
Other
|
352
|
|
51
|
|
||||
|
Total Other Assets
|
$
|
3,819
|
|
$
|
1,008
|
|
||
F-18
Lease Intangibles, Net
The following table details lease intangible assets, net of accumulated amortization, which are included in Other Assets on our consolidated balance sheets:
|
(In thousands)
|
December 31, 2016
|
|||
|
In-place leases
|
$
|
1,809
|
|
|
|
Less: accumulated amortization
|
(37
|
)
|
||
|
Intangible Lease Assets, Net
|
$
|
1,772
|
|
|
The value of in-place leases amortized and included in depreciation and amortization expense was
$37 thousand
for the year ended December 31, 2016. There were no above or below market intangible assets or liabilities at December 31, 2016.
Based on the balance of intangible assets at December 31, 2016, the net aggregate amortization expense for the next five years and thereafter is expected to be as follows:
|
(In thousands)
|
December 31, 2016
|
|||
|
2017
|
$
|
204
|
|
|
|
2018
|
165
|
|
||
|
2019
|
165
|
|
||
|
2020
|
160
|
|
||
|
2021
|
138
|
|
||
|
Thereafter
|
940
|
|
||
|
Total
|
$
|
1,772
|
|
|
Other Liabilities
The components of other liabilities were as follows:
|
December 31,
|
||||||||
|
(In thousands)
|
2016
|
2015
|
||||||
|
Accrued compensation
|
$
|
1,296
|
|
$
|
465
|
|
||
|
Accrued interest expense
|
1,134
|
|
959
|
|
||||
|
Accrued operating expenses
|
759
|
|
915
|
|
||||
|
Accounts payable
|
726
|
|
922
|
|
||||
|
Deferred rent
|
634
|
|
580
|
|
||||
|
Other
|
901
|
|
2,354
|
|
||||
|
Total Other Liabilities
|
$
|
5,450
|
|
$
|
6,195
|
|
||
On November 9, 2015, immediately preceding the consummation of the Spin-Off, we entered into the Revolving Credit and Term Loan Agreement (the “Loan Agreement”) that provides for borrowings of up to
$750 million
and consists of (1) a
$400 million
non-amortizing term loan that matures on November 9, 2020 and (2) a
$350 million
revolving credit facility that provides for loans and letters of credits and matures on November 9, 2019. The revolving credit facility provides for a letter of credit sub-limit of
$45 million
.
The Loan Agreement is a syndicated credit facility that contains an accordion feature such that the aggregate principal amount of the revolving credit facility or term loan can be increased by an additional
$250 million
to an amount not to exceed
$1.0 billion
F-19
in the aggregate, subject to certain conditions, including one or more new or existing lenders agreeing to provide commitments for such increased amounts.
The obligations under the Loan Agreement are secured by a pledge of Four Corners OP’s ownership interests in substantially all of its material subsidiaries, subject to certain exceptions, and are guaranteed, on a joint and several basis, by substantially all of FCPT OP’s material subsidiaries and FCPT, subject to certain exceptions. The collateral will be released if, as a result of growth in the value of our assets following the Spin-Off, the aggregate asset growth capitalization value (as defined in the Loan Agreement) exceeds
$300.0 million
. The Loan Agreement contains customary affirmative and negative covenants that, among other things, require customary reporting obligations, contain obligations to maintain REIT status, and restrict, subject to certain exceptions, the incurrence of debt and liens, the consummation of certain mergers, consolidations and asset sales, the making of distributions and other restricted payments, and entering into transactions with affiliates. In addition, Four Corners OP will be required to comply with the following financial covenants (all terms as defined in the Loan Agreement): (1) total indebtedness to consolidated capitalization value not to exceed
60%
; (2) mortgage-secured leverage ratio not to exceed
40%
; (3) total secured recourse indebtedness not to exceed
5%
of consolidated capitalization value; (4) minimum fixed charge coverage ratio of
1.75
to 1.00; (5) minimum consolidated tangible net worth; (6) unhedged floating rate debt not to exceed
50%
of all indebtedness; (7) maximum unencumbered leverage ratio not to exceed
60%
; and (8) minimum unencumbered debt service coverage ratio of
1.50
to 1.00.
The Loan Agreement also contains customary events of default including, without limitation, payment defaults, violation of covenants cross acceleration to material indebtedness, bankruptcy-related defaults, judgment defaults, and the occurrence of certain change of control events. The occurrence of an event of default will limit the ability of FCPT and FCPT to make distributions and may result in the termination of the credit facility, acceleration of repayment obligations and the exercise of remedies by the Lenders under the Loan Agreement with respect to the collateral.
The term loan and revolving credit facility interest rates are based on either (1) a LIBOR rate plus a margin ranging from
1.70%
to
2.45%
(in the case of the term loan) or
1.75%
to
2.50%
(in the case of the revolving credit facility) or, (2) at our option, an alternate base rate (the “ABR Rate”), plus a margin ranging from
0.70%
to
1.45%
(in the case of the term loan) or
0.75%
to
1.50%
(in the case of the revolving credit facility). The actual applicable margin is determined on a quarterly basis according to our total leverage ratio as defined by the Loan Agreement. The unused commitment fee on the revolving credit facility is
0.25%
or
0.35%
per year, depending on the amount of the unused portion of the revolving credit facility, is computed based on the average daily amount of the unused portion of the revolving credit facility, and is payable quarterly. The interest rate will increase by a rate of
2%
per year over the prevailing interest rate on outstanding borrowings and other amounts due and owing following the occurrence and during the continuation of an event of default. Amounts owing under the Loan Agreement may be prepaid at any time without premium or penalty, subject to customary breakage costs in the case of borrowings with respect to which a LIBOR rate election is in effect.
Immediately preceding the Spin-Off, we drew down the full amount of the term loan using a portion of the proceeds to pay Darden
$315 million
in connection with the Spin-Off. The remainder of the proceeds has been used to pay all of the cash portion of the purging distribution required in connection with qualifying as a REIT, for working capital purposes and for general corporate purposes.
On November 9, 2016, the Company acquired certain real estate investments subject to the assumption of the seller’s mortgage note of approximately
$7.1 million
. Contemporaneously with the acquisition, the Company repaid this mortgage obligation. Based on prevailing rates at the acquisition date, the fair value of the assumed debt approximated its contract value.
At December 31, 2016, the unamortized deferred financing costs were
$6.1 million
and the weighted average interest rate on the term loan was
2.36%
. At December 31, 2015, the unamortized deferred financing costs were
$7.7 million
. During the years ended December 31, 2016 and 2015, amortization of deferred financing costs was
$1.59 million
and
$265 thousand
, respectively. As of December 31, 2016, there was
$45 million
of outstanding borrowings under the revolving credit facility, with a weighted average interest rate of
2.46%
, and no outstanding letters of credit.
On November 10, 2015, we entered into
two
interest rate swaps pursuant to an International Swaps and Derivatives Association Master Agreement with J.P. Morgan Chase Bank, N.A. to economically hedge its exposure in cash flows associated with its variable rate debt obligations described above. One swap has a fixed notional value of
$200 million
that matures on November 9, 2018,
F-20
where the fixed rate paid by Four Corners OP is equal to
1.16%
and the variable rate received resets monthly to the one month LIBOR rate. The second swap has a fixed notional value of
$200 million
that matures on November 9, 2020, where the fixed rate paid by Four Corners OP is equal to
1.56%
and the variable rate received resets monthly to the one month LIBOR rate. These hedging agreements were not entered into for trading purposes and have been designated as cash flow hedges. Changes in the effective portion of the fair value of these hedges will be recorded as a component of other comprehensive income and reclassified into earnings in the same periods during which the hedged transaction affect earnings. Changes in the fair value of the ineffective portion of these hedges are recorded in earnings.
Risk Management Objective of Using Derivatives
We are exposed to certain risks arising from both our business operations and economic conditions. We principally manage our exposures to a wide variety of business and operational risks through management of our core business activities. We manage economic risks, including interest rate, liquidity, and credit risk primarily by managing the amount, sources, and duration of our debt funding and the use of derivative financial instruments. Specifically, we enter into derivative financial instruments to manage exposures that arise from business activities that result in our receipt or payment of future cash amounts, the value of which are determined by interest rates. Our derivative financial instruments are used to manage differences in the amount, timing, and duration of our known or expected cash payments principally related to our borrowings.
Cash Flow Hedges of Interest Rate Risk
Our objectives in using interest rate derivatives are to add stability to interest expense and to manage our exposure to interest rate movements. To accomplish these objectives, we primarily use interest rate swaps as part of our interest rate risk management strategy. Interest rate swaps designated as cash flow hedges involve the receipt of variable amounts from a counterparty in exchange for us making fixed-rate payments over the life of the agreements without exchange of the underlying notional amount. The effective portion of changes in the fair value of derivatives designated and that qualify as cash flow hedges is recorded on our consolidated balance sheet in accumulated other comprehensive income and is subsequently reclassified into earnings in the period that the hedged forecasted transaction affects earnings. During the period November 9, 2015 through December 31, 2016, such derivatives were used to hedge the variable cash flows associated with existing variable-rate debt. The ineffective portion of the change in fair value of the derivatives is recognized directly in earnings. For the years ended December 31, 2016 and 2015, we recorded approximately
$792 thousand
and
$3 thousand
, respectively, of hedge ineffectiveness in earnings attributable to
zero-percent
floor and rounding mismatches in the hedging relationships.
Amounts reported in accumulated other comprehensive income related to derivatives will be reclassified to interest expense as interest payments are made on our variable-rate debt. We estimate that during 2017 an additional
$1.76 million
will be reclassified to earnings as an increase to interest expense.
As of December 31, 2016, we had the following outstanding interest rate derivatives that were designated as cash flow hedges of interest rate risk:
|
Product
|
Number of Instruments
|
Current Notional
|
||
|
Interest Rate Swaps
|
2
|
$400,000,000
|
||
Non-designated Hedges
We do not use derivatives for trading or speculative purposes. During the year ending December 31, 2016 we did not have any derivatives that were not designated as hedges.
F-21
Tabular Disclosure of Fair Values of Derivative Instruments on the Consolidated Balance Sheet
The table below presents the fair value of our derivative financial instruments as well as their classification on the consolidated balance sheet as of December 31, 2016 and 2015.
|
Asset Derivatives
|
Liability Derivatives
|
|||||||||||||||||||
|
Balance Sheet Location
|
Fair Value at December 31,
|
Balance Sheet Location
|
Fair Value at December 31,
|
|||||||||||||||||
|
(Dollars in thousands)
|
2016
|
2015
|
2016
|
2015
|
||||||||||||||||
|
Derivatives designated as hedging instruments:
|
||||||||||||||||||||
|
Interest rate swaps
|
Derivative assets
|
$
|
837
|
|
$
|
165
|
|
Derivative liabilities
|
$
|
—
|
|
$
|
477
|
|
||||||
|
Total
|
$
|
837
|
|
$
|
165
|
|
$
|
—
|
|
$
|
477
|
|
||||||||
Tabular Disclosure of the Effect of Derivative Instruments on the Statements of Comprehensive Income
The table below presents the effect of our derivative financial instruments on the statements of comprehensive income for the years ending December 31, 2016 and 2015.
|
(Dollars in thousands)
|
Amount of Gain or (Loss) Recognized in OCI on Derivative (Effective Portion)
|
Location of Gain or (Loss) Reclassified from Accumulated OCI into Income (Effective Portion)
|
Amount of Gain or (Loss) Reclassified from Accumulated OCI into Income (Effective Portion)
|
Location of Gain or (Loss) Recognized in Income on Derivative (Ineffective Portion and Amount Excluded from Effectiveness Testing)
|
Amount of Gain or (Loss) Recognized in Income on Derivative (Ineffective Portion and Amounts Excluded from Effectiveness Testing)
|
|||||||||||
|
Interest rate swaps
|
||||||||||||||||
|
Year Ended December 31, 2016
|
$
|
(3,226
|
)
|
Interest expense
|
$
|
(3,765
|
)
|
Interest expense
|
$
|
792
|
|
|||||
|
Year Ended December 31, 2015
|
(938
|
)
|
Interest expense
|
(622
|
)
|
Interest expense
|
3
|
|
||||||||
Tabular Disclosure Offsetting Derivatives
The table below presents a gross presentation, the effects of offsetting, and a net presentation of our derivatives as of December 31, 2016 and 2015. The net amounts of derivative assets or liabilities can be reconciled to the tabular disclosure of fair value. The tabular disclosure of fair value provides the location that derivative assets and liabilities are presented on the consolidated balance sheet.
|
Offsetting of Derivative Assets
|
||||||||||||||||||||||||
|
Gross Amounts Offset in the Consolidated Balance Sheet
|
Net Amounts of Assets Presented in the Consolidated Balance Sheet
|
Gross Amounts Not Offset in the Consolidated Balance Sheet
|
||||||||||||||||||||||
|
(In thousands)
|
Gross Amounts of Recognized Assets
|
Financial Instruments
|
Cash Collateral Received
|
Net Amount
|
||||||||||||||||||||
|
December 31, 2016
|
$
|
837
|
|
$
|
—
|
|
$
|
837
|
|
$
|
—
|
|
$
|
—
|
|
$
|
837
|
|
||||||
|
December 31, 2015
|
165
|
|
—
|
|
165
|
|
(165
|
)
|
—
|
|
—
|
|
||||||||||||
F-22
|
Offsetting of Derivative Liabilities
|
|||||||||||||||||||||||
|
Gross Amounts Offset in the Consolidated Balance Sheet
|
Net Amounts of Liabilities Presented in the Consolidated Balance Sheet
|
Gross Amounts Not Offset in the Consolidated Balance Sheet
|
|||||||||||||||||||||
|
(In thousands)
|
Gross Amounts of Recognized Liabilities
|
Financial Instruments
|
Cash Collateral Posted
|
Net Amount
|
|||||||||||||||||||
|
December 31, 2016
|
$
|
—
|
|
—
|
|
$
|
—
|
|
$
|
—
|
|
$
|
—
|
|
$
|
—
|
|
||||||
|
December 31, 2015
|
477
|
|
—
|
|
477
|
|
(165
|
)
|
—
|
|
312
|
|
|||||||||||
Credit-risk-related Contingent Features
The agreement with our derivative counterparty contains a provision where if we default on any of our indebtedness, including default where repayment of the indebtedness has not been accelerated by the lender, then we could also be declared in default on our derivative obligations.
As of December 31, 2016, the fair value of derivatives in an asset position related to these agreements was approximately
$837 thousand
. As of December 31, 2016, we have not posted any collateral related to these agreements. If we or our counterparty had breached any of these provisions at December 31, 2016, we would have received the termination value of approximately
$837 thousand
.
Our operating results, prior to November 9, 2015 were included in Darden’s consolidated U.S. federal and one state income tax return. For purposes of the consolidated financial statements, income tax expense and benefit, and deferred tax balances have been recorded as if we filed tax returns on a stand-alone basis separate from Darden. The separate return method applies the accounting guidance for income taxes to the stand-alone financial statements as if we were a separate taxpayer and a stand-alone enterprise for the periods presented. Income taxes currently receivable are deemed to have been remitted to Darden, in cash, in the period the receivable arose had we been a separate taxpayer.
The components of income (loss) before income taxes and the provision for income taxes and benefit thereon were as follows:
|
Year Ended December 31,
|
||||||||||||
|
(In thousands)
|
2016
|
2015
|
2014
|
|||||||||
|
Income (loss) before income tax
|
$
|
76,503
|
|
$
|
8,643
|
|
$
|
(110
|
)
|
|||
The provision (benefit) for income taxes was as follows:
|
Year Ended December 31,
|
||||||||||||
|
(In thousands)
|
2016
|
2015
|
2014
|
|||||||||
|
Current:
|
||||||||||||
|
Federal
|
$
|
29
|
|
$
|
1,502
|
|
$
|
33
|
|
|||
|
Current state and local
|
317
|
|
247
|
|
19
|
|
||||||
|
Total current
|
346
|
|
1,749
|
|
52
|
|
||||||
|
Deferred:
|
||||||||||||
|
Federal deferred
|
(74,876
|
)
|
1,133
|
|
(194
|
)
|
||||||
|
State deferred
|
(5,817
|
)
|
62
|
|
—
|
|
||||||
|
Total deferred
|
(80,693
|
)
|
1,195
|
|
(194
|
)
|
||||||
|
Total Income Tax Expense (Benefit)
|
$
|
(80,347
|
)
|
$
|
2,944
|
|
$
|
(142
|
)
|
|||
Income taxes receivable settled through the Predecessor’s parent company equity were as follows:
F-23
|
Year Ended December 31,
|
|||||||||
|
(In thousands)
|
2015
|
2014
|
|||||||
|
Income taxes receivable settled through parent company equity
|
$
|
35
|
|
$
|
53
|
|
|||
|
Income taxes payable
|
1,713
|
|
—
|
|
|||||
As we were in a tax receivable position for the year ended December 31, 2014, no income taxes were paid.
The following table is a reconciliation of the U.S. statutory income tax rate to the effective income tax rate included in the accompanying consolidated statements of operations:
|
Year Ended December 31,
|
|||||||||
|
2016
|
2015
|
2014
|
|||||||
|
U.S. statutory rate
|
35.0
|
%
|
34.0
|
%
|
34.0
|
%
|
|||
|
Current benefit or REIT election
(1)
|
(140.4
|
)
|
—
|
|
—
|
|
|||
|
State and local income taxes, net of federal tax benefits
|
0.5
|
|
2.6
|
|
(11.4
|
)
|
|||
|
Benefit of federal income tax credits
|
(0.1
|
)
|
(0.3
|
)
|
177.1
|
|
|||
|
Valuation allowance
|
—
|
|
(0.6
|
)
|
(29.3
|
)
|
|||
|
Permanent differences
|
—
|
|
0.2
|
|
(41.3
|
)
|
|||
|
Effective Income Tax Rate
|
(105.0
|
)%
|
35.9
|
%
|
129.1
|
%
|
|||
(1) The portion of the current benefit attributable to the REIT election is
105.4%
.
The tax effects of temporary differences that gave rise to deferred tax assets and liabilities were as follows:
|
December 31,
|
||||||||||||
|
(In thousands)
|
2016
|
2015
|
2014
|
|||||||||
|
Compensation and employee benefits
|
$
|
67
|
|
$
|
200
|
|
$
|
171
|
|
|||
|
Charitable contribution and credit carryforwards
|
—
|
|
—
|
|
370
|
|
||||||
|
Valuation allowance - carryforward items
|
—
|
|
—
|
|
(140
|
)
|
||||||
|
Lease payable
|
205
|
|
—
|
|
—
|
|
||||||
|
UNICAP
|
20
|
|
8
|
|
4
|
|
||||||
|
Gross deferred tax assets
|
292
|
|
208
|
|
405
|
|
||||||
|
Prepaid expenses
|
—
|
|
(252
|
)
|
||||||||
|
Straight-line rent
|
—
|
|
(549
|
)
|
||||||||
|
Buildings and equipment
(1)
|
(488
|
)
|
(80,288
|
)
|
(1,400
|
)
|
||||||
|
Gross deferred tax liabilities
|
(488
|
)
|
(81,089
|
)
|
(1,400
|
)
|
||||||
|
Net Deferred Tax Liabilities
|
$
|
(196
|
)
|
$
|
(80,881
|
)
|
$
|
(995
|
)
|
|||
(1) Theses buildings and equipment relate to the Kerrow Restaurant Operating Business.
Preferred Stock
At December 31, 2016, the Company was authorized to issue
25,000,000
shares of
$0.0001
par value per share of preferred stock. There were
no
shares issued and outstanding.
Common Stock
At December 31, 2016 the Company was authorized to issue
500,000,000
shares of
$0.0001
par value per share of common stock. Each holder of common stock is entitled to vote on all matters and is entitled to
one vote
for each share held. As of December
F-24
31, 2016, there were
59,923,557
shares of the Company's common stock issued and outstanding.
On January 29, 2016, we paid a cash dividend of
$8.5 million
, representing our estimated earnings and profits that are required to be distributed for the period from November 10, 2015 to December 31, 2015. On March 2, 2016, we paid a
$347.0 million
dividend in cash and shares of common stock (the “Pre-Spin Dividend”), or
$8.12
per share based on approximately
42.7 million
shares outstanding as of January 7, 2016, representing our estimated share of earning and profits that are required to be distributed for the operating period prior to November 9, 2015. An aggregate of
17,085,566
additional shares of common stock were issued in connection with the Pre-Spin Dividend, and cash dividends paid related to the Pre-Spin Dividend totaled
$69.5 million
.
The Company reflects dividends, including those paid in shares, that would otherwise result in negative retained earnings as a reduction to additional paid-in capital. As a result, approximately
$269.5 million
was reflected as a charge to additional paid-in capital related to the distribution above. For calculation of diluted earnings per share, these shares were assumed to have been issued on January 7, 2016.
On April 15, 2016, we paid a cash dividend of
$0.2425
per share, or
$14.5 million
. On July 15, 2016, we paid a cash dividend of
$0.2425
per share, or
$14.5 million
. On October 15, 2016 we paid a dividend of
$0.2425
per share, or
$14.5 million
. In December 2016, we declared a dividend of
$0.2425
per share, which was paid in January 2017 to common stockholders of record as of December 30, 2016.
Common Stock Issuance Under the At-The-Market Program
In December 2016, the Company entered into an “At-the-Market” (“ATM”) sales agreement under which the Company could, at its discretion, sell its common stock with a sales value of up to a maximum of
$150.0 million
through ATM offerings on the NYSE Stock Market (the “Sales Agreement”) through broker-dealers. Through December 31, 2016, we sold
32,513
shares under the ATM offerings at a weighted-average selling price of
$20.01
per share, for net proceeds of approximately
$641 thousand
under the Sales Agreement.
Noncontrolling Interest
During 2016, FCPT OP issued
274,744
OP units as part of the consideration for the acquisitions of
ten
properties.
Generally, common OP Units participate in net income allocations and distributions and entitle their holder the right, subject to the terms set forth in the partnership agreement, to require the Operating Partnership to redeem all or a portion of the Common OP Units held by such limited partner. At the Company’s option, it may satisfy this redemption with cash or by exchanging non-registered shares of FCPT common stock on a one-for-one basis. Prior to the redemption of units, the limited partners participate in net income allocations and distributions.
As of December 31, 2016, FCPT is the owner of approximately
99.5%
of FCPT’s OP units. The remaining
0.5%
, or
274,744
, of FCPT’s OP units are held by an unaffiliated limited partners. No distributions were paid to limited partners during the year ended December 31, 2016.
F-25
Earnings Per Share
The following table presents the computation of basic and diluted net earnings per common share for the years ended December 31, 2016 and 2015.
|
Year Ended December 31,
|
||||||||
|
(In thousands except share and per share data)
|
2016
|
2015
|
||||||
|
Average common shares outstanding – basic
|
56,984,561
|
|
6,206,375
|
|
||||
|
Effect of dilutive stock based compensation
|
16,003
|
|
57,546
|
|
||||
|
Net effect of shares issued with respect to E&P dividend
|
2,567,503
|
|
—
|
|
||||
|
Average common shares outstanding – diluted
|
59,568,067
|
|
6,263,921
|
|
||||
|
Net income
|
$
|
156,850
|
|
$
|
5,699
|
|
||
|
Basic net earnings per share
|
$
|
2.75
|
|
$
|
0.92
|
|
||
|
Diluted net earnings per share
|
$
|
2.63
|
|
$
|
0.91
|
|
||
For the year ended December 31, 2016, the number of outstanding equity awards that were anti-dilutive totaled
149,943
. There were
no
anti-dilutive shares for the year ended December 31, 2015. Income allocated to noncontrolling interests of the Operating Partnership has been excluded from the numerator and exchangeable Operating Partnership units have been omitted from the denominator for the purpose of computing diluted earnings per share since the effect of including these amounts in the numerator and denominator would have no impact. Weighted average exchangeable Operating Partnership units outstanding for the year ended December 31, 2016 were
39,785
.
Spin-Off
On November 9, 2015, in connection with the separation and spin-off of Four Corners from Darden, Darden contributed to us
100%
of the equity interest in entities that held
418
properties in which Darden operates restaurants, representing
five
of their brands (the “Four Corners Properties”), and
six
LongHorn Steakhouse
®
restaurants located in the San Antonio, Texas area (the “Kerrow Restaurant Operating Business”) and the underlying properties or interests therein associated with the Kerrow Restaurant Operating Business. In exchange, we issued to Darden
42,741,995
shares of our common stock, par value
$0.0001
per share and paid to Darden
$315.0
million in cash, which we funded from the proceeds of our term loan borrowings under the Loan Agreement. Subsequently, Darden distributed the
42,741,995
shares of our common stock pro rata to holders of Darden common stock whereby each Darden shareholder received one share of Four Corners common stock for every
three
shares of Darden common stock held at the close of business on the record date, which was November 2, 2015, as well as cash in lieu of any fractional shares of our common stock which they would have otherwise received (the “Spin-Off”). The Spin-Off is intended to qualify as tax-free to Darden shareholders for U. S. federal income tax purposes, except for cash paid in lieu of fractional shares.
Darden obtained a private letter ruling from the IRS regarding the tax-free treatment of the Spin-Off. To preserve that tax-free treatment to Darden, for the
two year
period following the Spin-Off, we may be prohibited, except in specific circumstances, from taking certain actions, including: (1) entering into any transaction pursuant to which all or a portion of our stock would be acquired, whether by merger or otherwise, (2) issuing equity securities beyond certain thresholds, or (3) repurchasing our common stock. In addition, we will be prohibited from taking or failing to take any other action that prevents the Spin-Off and related transactions from being tax-free. These restrictions may limit our ability to pursue strategic transactions or engage in new business or other transactions that may maximize the value of our business. However, these restrictions are inapplicable in the event that the IRS has granted a favorable ruling to Darden or FCPT or in the event that Darden or FCPT has received an opinion from counsel that FCPT can take such actions under certain safe harbor exceptions without adversely affecting the tax-free status of the Spin-Off and related transactions.
On October 20, 2015, the Board of Directors of Four Corners adopted, and Four Corners’ sole shareholder, Rare Hospitality International, Inc., approved, the Four Corners Property Trust, Inc. 2015 Omnibus Incentive Plan (the “Plan”). The Plan provides for the grant of awards of nonqualified stock options, stock appreciation rights, RSAs, RSUs, DSUs, unrestricted stock, dividend equivalent rights, performance shares and other performance-based awards, other equity-based awards, and cash bonus awards
F-26
(each, an “Award” and collectively, the “Awards”) to eligible participants. Subject to adjustment, the maximum number of shares of stock reserved for issuance under the Plan is equal to
2,100,000
shares.
The Plan will terminate on the first to occur of (a) October 20, 2025, which is the tenth anniversary of the effective date of the Plan, (b) the date determined in accordance with the Board’s authority to terminate the Plan, or (c) the date determined in accordance with the provisions of the Plan addressing the effect of a Change in Control (as defined in the Plan). Upon such termination of the Plan, all outstanding Awards will continue to have full force and effect in accordance with the provisions of the terminated Plan and the applicable award agreement (or other documents evidencing such Awards).
At December 31, 2016,
1,902,849
shares of common stock were available for award under the Plan. The unamortized compensation cost of awards issued under the Incentive Plan totaled
$3.12 million
at December 31, 2016 as shown in the following table.
Equity Compensation Costs by Award Type
|
(In thousands)
|
Restricted Stock Units
|
Restricted Stock Awards
|
Performance Stock Units
|
Total
|
||||||||||||
|
Unrecognized compensation cost at January 1, 2016
|
$
|
1,483
|
|
$
|
—
|
|
$
|
—
|
|
$
|
1,483
|
|
||||
|
Equity grants
|
285
|
|
882
|
|
2,020
|
|
3,187
|
|
||||||||
|
Equity grant forfeitures
|
—
|
|
—
|
|
—
|
|
—
|
|
||||||||
|
Equity compensation expense
|
(674
|
)
|
(257
|
)
|
(619
|
)
|
(1,550
|
)
|
||||||||
|
Unrecognized Compensation Cost at December 31, 2016
|
$
|
1,094
|
|
$
|
625
|
|
$
|
1,401
|
|
$
|
3,120
|
|
||||
RSUs
RSUs are granted at a value equal to the
five
-day average closing market price of our common stock on the date of grant and will be settled in stock at the end of their vesting periods, which range between
one
and
three
years, at the then market price of our common stock.
The following table summarizes the activities related to RSUs for the years ended December 31, 2016 and 2015.
|
Year Ended December 31,
|
||||||||||||||
|
2016
|
2015
|
|||||||||||||
|
|
Units
|
Weighted Average Grant Date Fair Value
|
Units
|
Weighted Average Grant Date Fair Value
|
||||||||||
|
Outstanding at beginning of period
|
57,546
|
|
$
|
23.40
|
|
—
|
|
$
|
—
|
|
||||
|
Units granted
|
14,285
|
|
19.95
|
|
57,546
|
|
23.40
|
|
||||||
|
Units vested
|
(6,624
|
)
|
23.40
|
|
—
|
|
—
|
|
||||||
|
Units forfeited
|
—
|
|
—
|
|
—
|
|
—
|
|
||||||
|
Outstanding at End of Period
|
65,207
|
|
22.64
|
|
57,546
|
|
23.40
|
|
||||||
Expenses related to RSUs were
$674 thousand
and
$16 thousand
for the years ended December 31, 2016 and 2015, respectively. This cost will be recognized over a weighted average period of less than
two
years. Restrictions on shares of restricted stock outstanding lapse through 2019. The Company expects all RSUs to vest.
F-27
RSAs
The following table summarizes the activities related to RSAs for the years ended December 31, 2016 and 2015.
|
Year Ended December 31,
|
||||||||||||||
|
2016
|
2015
|
|||||||||||||
|
|
Units
|
Weighted Average Grant Date Fair Value
|
Units
|
Weighted Average Grant Date Fair Value
|
||||||||||
|
Outstanding at beginning of period
|
—
|
|
$
|
—
|
|
—
|
|
$
|
—
|
|
||||
|
Units granted
|
53,589
|
|
16.55
|
|
—
|
|
—
|
|
||||||
|
Units vested
|
—
|
|
—
|
|
—
|
|
—
|
|
||||||
|
Units forfeited
|
(309
|
)
|
16.17
|
|
—
|
|
—
|
|
||||||
|
Outstanding at End of Period
|
53,280
|
|
16.55
|
|
—
|
|
||||||||
Expenses related to RSAs were
$257 thousand
for the year ended December 31, 2016. This cost will be recognized over a weighted average period of less than
two
years. Restrictions on shares of RSAs outstanding lapse through 2019. The Company expects all RSAs to vest.
PSUs
During the year ended December 31, 2016, there were
72,040
PSUs as well as dividend equivalent rights, granted under the Plan. The performance period of this grant runs from January 1, 2016 through December 31, 2018. Pursuant to the performance share award agreement, each participant is eligible to vest in and receive shares of the Company's common stock based on the initial target number of shares granted multiplied by a percentage range between
0%
and
200%
. The percentage range is based on the attainment of a total shareholder return of the Company compared to certain specified peer groups of companies during the performance period. The
fair value of the performance shares was estimated on the date of grant using a Monte Carlo Simulation model.
During the year ended December 31, 2016, PSUs were granted at a weighted average fair values of
$28.05
per unit. During the year ended December 31, 2016, there were no target number of PSUs forfeited due to employee departures. The Company expects all PSUs to vest.
The grant date fair values of PSUs were determined through Monte-Carlo simulations using the following assumptions: our common stock closing price at the grant date, the average closing price of our common stock price for the
20
trading days prior to the grant date and the range of performance-based vesting based on total stockholder return over
three
years from the grant date. For the 2016 PSU grant, the Company used an implied volatility assumption of
19.3%
(based on historical volatility), risk free rates of
0.54
% and
0.91%
(the one-year and three-year Treasury rates on the grant date), and a
0%
dividend yield (the mathematical equivalent to reinvesting the dividends over the three-year performance period as is consistent with the terms of the PSUs).
Expenses related to PSUs were
$619 thousand
for the year ended December 31, 2016.
The carrying amounts of certain of the Company’s financial instruments including cash equivalents, accounts receivable, accounts payable, accrued liabilities, and derivative financial instruments approximate fair value due either to length of maturity or interest rates that approximate prevailing market rates.
Determining which category an asset or liability falls within the hierarchy requires significant judgment. We evaluate hierarchy disclosures each reporting period. The following table presents the assets and liabilities recorded that are reported at fair value on our consolidated balance sheets on a recurring basis.
F-28
Assets and Liabilities Measured at Fair Value on a Recurring Basis
|
December 31, 2016
|
||||||||||||||||
|
(In thousands)
|
Level 1
|
Level 2
|
Level 3
|
Total
|
||||||||||||
|
Assets
|
||||||||||||||||
|
Derivative assets
|
$
|
—
|
|
$
|
837
|
|
$
|
—
|
|
$
|
837
|
|
||||
|
Total
|
$
|
—
|
|
$
|
837
|
|
$
|
—
|
|
$
|
837
|
|
||||
|
Liabilities
|
||||||||||||||||
|
Derivative liabilities
|
$
|
—
|
|
$
|
—
|
|
$
|
—
|
|
$
|
—
|
|
||||
|
Total
|
$
|
—
|
|
$
|
—
|
|
$
|
—
|
|
$
|
—
|
|
||||
|
December 31, 2015
|
||||||||||||||||
|
(In thousands)
|
Level 1
|
Level 2
|
Level 3
|
Total
|
||||||||||||
|
Assets
|
||||||||||||||||
|
Derivative assets
|
$
|
—
|
|
$
|
165
|
|
$
|
—
|
|
$
|
165
|
|
||||
|
Total
|
$
|
—
|
|
$
|
165
|
|
$
|
—
|
|
$
|
165
|
|
||||
|
Liabilities
|
||||||||||||||||
|
Derivative liabilities
|
$
|
—
|
|
$
|
477
|
|
$
|
—
|
|
$
|
477
|
|
||||
|
Total
|
$
|
—
|
|
$
|
477
|
|
$
|
—
|
|
$
|
477
|
|
||||
Derivative Financial Instruments
Currently, we use interest rate swaps to manage our interest rate risk associated with our note payable.
The valuation of these instruments is determined using widely accepted valuation techniques, including discounted cash flow analysis on the expected cash flows of each derivative. This analysis reflects the contractual terms of the derivatives, including the period to maturity, and uses observable market-based inputs, including interest rate curves and implied volatilities. The fair values of interest rate swaps are determined using the market standard methodology of netting the discounted future fixed cash receipts (or payments) and the discounted expected variable cash payments (or receipts). The variable cash payments (or receipts) are based on an expectation of future interest rates (forward curves) derived from observable market interest rate curves.
The fair values of interest rate options are determined using the market standard methodology of discounting the future expected cash receipts that would occur if variable interest rates rise above the strike rate of the caps. The variable interest rates used in the calculation of projected receipts on the cap are based on an expectation of future interest rates derived from observable market interest rate curves and volatilities.
To comply with the provisions of ASC 820, we incorporate credit valuation adjustments to appropriately reflect both our own nonperformance risk and the respective counterparty’s nonperformance risk in the fair value measurements. In adjusting the fair value of our derivative contracts for the effect of nonperformance risk, we have considered the impact of netting and any applicable credit enhancements, such as collateral postings, thresholds, mutual puts and guarantees.
Although we have determined that the majority of the inputs used to value our derivatives fall within Level 2 of the fair value hierarchy, the credit valuation adjustments associated with our derivatives utilize Level 3 inputs, such as estimates of current credit spreads to evaluate the likelihood of default by ourselves and our counterparties. We have determined that the significance of the impact of the credit valuation adjustments made to our derivative contracts, which determination was based on the fair value of each individual contract, was not significant to the overall valuation. As a result, all of our derivatives held as of December 31, 2016 were classified as Level 2 of the fair value hierarchy.
F-29
The following table presents the carrying value and fair value of certain financial liabilities that are recorded on our consolidated balance sheets.
Fair Value of Certain Financial Liabilities
|
December 31, 2016
|
||||||||
|
(In thousands)
|
Carrying Value
|
Fair Value
|
||||||
|
Liabilities
|
||||||||
|
Note payable, excluding deferred offering costs
|
$
|
445,000
|
|
$
|
445,309
|
|
||
The fair value of the note payable is determined using the present value of the contractual cash flows, discounted at the current market cost of debt.
Rentals
Rent expense on ground leases, under which our Kerrow subsidiary is lessee to third-party owners, was
$466 thousand
,
$441 thousand
, and
$441 thousand
for the years ended December 31, 2016, 2015, and 2014, respectively. Rent expense at FCPT was
$154 thousand
and
$18 thousand
for the years ended December 31, 2016 and 2015, respectively.
The annual future lease commitments under non-cancelable operating leases for each of the five years subsequent to December 31, 2016 and thereafter is as follows:
|
(In thousands)
|
December 31, 2016
|
|||
|
2017
|
$
|
515
|
|
|
|
2018
|
518
|
|
||
|
2019
|
407
|
|
||
|
2020
|
280
|
|
||
|
2021
|
97
|
|
||
|
Thereafter
|
—
|
|
||
|
Total Future Lease Commitments
|
$
|
1,817
|
|
|
Litigation
We are subject to private lawsuits, administrative proceedings and claims that arise in the ordinary course of our business. A number of these lawsuits, proceedings and claims may exist at any given time. These matters typically involve claims from guests, employee wage and hour claims and others related to operational issues common to the restaurant industry. We record our best estimate of a loss when the loss is considered probable. When a liability is probable and there is a range of estimated loss with no best estimate in the range, we record the minimum estimated liability related to the lawsuits, proceedings or claims. While the resolution of a lawsuit, proceeding or claim may have an impact on our financial results for the period in which it is resolved, we believe that the maximum liability related to probable lawsuits, proceedings and claims in which we are currently involved, individually and in the aggregate, will not have a material adverse effect on our financial position, results of operations or liquidity.
During 2016 and 2015, we operated in
two
segments: real estate operations and restaurant operations. Prior to the Spin-Off transaction on November 9, 2015, we operated in
one
segment, restaurant operations. Our segments are based on our organizational and management structure, which aligns with how our results are monitored and performance is assessed. The accounting policies of the reportable segments are the same as those described in Note 2 - Summary of Significant Accounting Policies.
F-30
The following tables present financial information by segment for the years ended December 31, 2016 and 2015.
For the Year Ended December 31, 2016
|
(In thousands)
|
Real Estate Operations
|
Restaurant Operations
|
Intercompany
|
Total
|
||||||||||||
|
Revenues:
|
||||||||||||||||
|
Rental income
|
$
|
105,624
|
|
$
|
—
|
|
$
|
—
|
|
$
|
105,624
|
|
||||
|
Intercompany rental income
|
389
|
|
—
|
|
(389
|
)
|
—
|
|
||||||||
|
Restaurant revenues
|
—
|
|
18,394
|
|
—
|
|
18,394
|
|
||||||||
|
Total revenues
|
106,013
|
|
18,394
|
|
(389
|
)
|
124,018
|
|
||||||||
|
Operating expenses:
|
||||||||||||||||
|
General and administrative
|
10,977
|
|
—
|
|
—
|
|
10,977
|
|
||||||||
|
Depreciation and amortization
|
19,933
|
|
644
|
|
—
|
|
20,577
|
|
||||||||
|
Restaurant expenses
|
—
|
|
18,242
|
|
(389
|
)
|
17,853
|
|
||||||||
|
Interest expense
|
14,828
|
|
—
|
|
—
|
|
14,828
|
|
||||||||
|
Total operating expenses
|
45,738
|
|
18,886
|
|
(389
|
)
|
64,235
|
|
||||||||
|
Other income
|
97
|
|
—
|
|
—
|
|
97
|
|
||||||||
|
Realized gain on sale, net
|
16,623
|
|
—
|
|
—
|
|
16,623
|
|
||||||||
|
Income before provision for income taxes
|
76,995
|
|
|
(492
|
)
|
—
|
|
76,503
|
|
|||||||
|
Provision for income taxes
|
80,409
|
|
(62
|
)
|
—
|
|
80,347
|
|
||||||||
|
Net income
|
157,404
|
|
(554
|
)
|
—
|
|
156,850
|
|
||||||||
|
Net income attributable to noncontrolling interest
|
(41
|
)
|
—
|
|
—
|
|
(41
|
)
|
||||||||
|
Net Income Available to Common Shareholders
|
$
|
157,363
|
|
$
|
(554
|
)
|
$
|
—
|
|
$
|
156,809
|
|
||||
For the Year Ended December 31, 2015
|
(In thousands)
|
Real Estate Operations
|
Restaurant Operations
|
Intercompany
|
Total
|
||||||||||||
|
Revenues:
|
||||||||||||||||
|
Rental income
|
$
|
15,134
|
|
$
|
—
|
|
$
|
—
|
|
$
|
15,134
|
|
||||
|
Intercompany rental income
|
65
|
|
—
|
|
(65
|
)
|
—
|
|
||||||||
|
Restaurant revenues
|
—
|
|
18,322
|
|
—
|
|
18,322
|
|
||||||||
|
Total revenues
|
15,199
|
|
18,322
|
|
(65
|
)
|
33,456
|
|
||||||||
|
Operating expenses:
|
||||||||||||||||
|
General and administrative
|
1,856
|
|
—
|
|
—
|
|
1,856
|
|
||||||||
|
Depreciation and amortization
|
2,953
|
|
805
|
|
—
|
|
3,758
|
|
||||||||
|
Restaurant expenses
|
—
|
|
17,061
|
|
(65
|
)
|
16,996
|
|
||||||||
|
Interest expense
|
2,203
|
|
—
|
|
—
|
|
2,203
|
|
||||||||
|
Total operating expenses
|
7,012
|
|
17,866
|
|
(65
|
)
|
24,813
|
|
||||||||
|
Other income
|
—
|
|
—
|
|
—
|
|
—
|
|
||||||||
|
Realized gain on sale, net
|
—
|
|
—
|
|
—
|
|
—
|
|
||||||||
|
Income before provision for income taxes
|
8,187
|
|
456
|
|
—
|
|
8,643
|
|
||||||||
|
Provision for income taxes
|
(2,942
|
)
|
(2
|
)
|
—
|
|
(2,944
|
)
|
||||||||
|
Net Income
|
$
|
5,245
|
|
$
|
454
|
|
$
|
—
|
|
$
|
5,699
|
|
||||
F-31
The following table presents supplemental information by segment at December 31, 2016 and 2015.
December 31, 2016
|
(In thousands)
|
Real Estate Operations
|
Restaurant Operations
|
Total
|
|||||||||
|
Total real estate investments
|
$
|
1,460,967
|
|
$
|
16,598
|
|
$
|
1,477,565
|
|
|||
|
Accumulated depreciation
|
(577,392
|
)
|
(5,915
|
)
|
(583,307
|
)
|
||||||
|
Total real estate investments, net
|
883,575
|
|
10,683
|
|
894,258
|
|
||||||
|
Cash and cash equivalents
|
24,412
|
|
2,231
|
|
26,643
|
|
||||||
|
Total assets
|
923,747
|
|
13,404
|
|
937,151
|
|
||||||
|
Notes payable, net of deferred financing costs
|
438,895
|
|
—
|
|
438,895
|
|
||||||
|
Deferred tax liability
|
—
|
|
196
|
|
196
|
|
||||||
December 31, 2015
|
(In thousands)
|
Real Estate Operations
|
Restaurant Operations
|
Total
|
|||||||||
|
Total real estate investments
|
$
|
1,380,663
|
|
$
|
16,567
|
|
$
|
1,397,230
|
|
|||
|
Accumulated depreciation
|
(563,268
|
)
|
(5,271
|
)
|
(568,539
|
)
|
||||||
|
Total real estate investments, net
|
817,395
|
|
11,296
|
|
828,691
|
|
||||||
|
Cash and cash equivalents
|
95,873
|
|
2,200
|
|
98,073
|
|
||||||
|
Total assets
|
915,543
|
|
13,894
|
|
929,437
|
|
||||||
|
Notes payable, net of deferred financing costs
|
392,302
|
|
—
|
|
392,302
|
|
||||||
|
Deferred tax liability
|
80,881
|
|
—
|
|
80,881
|
|
||||||
On February 14, 2017, FCPT OP, FCPT and certain of its subsidiaries, as guarantors, JPMorgan Chase Bank, N.A., as administrative agent and the lenders party thereto entered into a second amendment (the “Loan Agreement Amendment”) to the Loan Agreement, for the purpose of, among other things, permitting an incurrence of additional unsecured debt in an aggregate principal amount of at least
$50 million
. The Loan Agreement Amendment further provides that, upon the incurrence of such additional unsecured debt, (A) all pledges of equity interests that secure the Loan Agreement, and all subsidiary guarantees of the Loan Agreement, will be released and (B) the financial covenant requirements in relation to maximum leverage and minimum debt service coverage will be adjusted in the manner set forth in the Loan Agreement Amendment. In addition, the Loan Agreement Amendment increases the minimum Consolidated Tangible Net Worth requirement from
$845.7 million
to
$868.9 million
. The Loan Agreement Amendment also contains customary representations and warranties by FCPT OP.
In the first quarter through February 27, 2017, the Company invested
$14.8 million
in acquisitions of
eight
restaurant properties located in
six
states. These properties are 100% occupied under triple-net leases with a weighted average lease term of
12.1
years. The Company funded the acquisitions with cash on hand and the issuance of
174,576
OP units. The Company anticipates accounting for these acquisitions as asset acquisitions in accordance with GAAP. There were no contingent liabilities associated with these transactions at December 31, 2016.
F-32
|
(In thousands, except per share amounts)
|
January 1, 2016 - March 31, 2016
|
April 1, 2016 - June 30, 2016
|
July 1, 2016 - September 30, 2016
|
October 1, 2016 - December 31, 2016
|
||||||||||||
|
Revenues:
|
||||||||||||||||
|
Rental revenue
|
$
|
26,192
|
|
$
|
26,192
|
|
$
|
26,363
|
|
$
|
26,877
|
|
||||
|
Restaurant revenue
|
4,859
|
|
4,701
|
|
4,443
|
|
4,391
|
|
||||||||
|
Total revenues
|
31,051
|
|
30,893
|
|
30,806
|
|
31,268
|
|
||||||||
|
Operating expenses:
|
||||||||||||||||
|
General and administrative
|
3,317
|
|
2,508
|
|
2,608
|
|
2,545
|
|
||||||||
|
Depreciation and amortization
|
5,187
|
|
5,101
|
|
5,059
|
|
5,230
|
|
||||||||
|
Restaurant expense
|
4,698
|
|
4,593
|
|
4,308
|
|
4,254
|
|
||||||||
|
Interest expense
|
4,182
|
|
3,858
|
|
3,549
|
|
3,239
|
|
||||||||
|
Total expenses
|
17,384
|
|
16,060
|
|
15,524
|
|
15,268
|
|
||||||||
|
Other income
|
60
|
|
18
|
|
10
|
|
9
|
|
||||||||
|
Realized gain on sale, net
|
—
|
|
—
|
|
16,623
|
|
||||||||||
|
Income Before Income Taxes
|
$
|
13,727
|
|
$
|
14,851
|
|
$
|
15,292
|
|
$
|
32,632
|
|
||||
|
Earnings per share
(1)
:
|
||||||||||||||||
|
Basic
|
$
|
1.95
|
|
$
|
0.25
|
|
$
|
0.25
|
|
$
|
0.54
|
|
||||
|
Diluted
|
1.61
|
|
0.25
|
|
0.25
|
|
0.54
|
|
||||||||
|
Distributions declared per share
|
0.2425
|
|
0.2425
|
|
0.2425
|
|
0.2425
|
|
||||||||
|
(1) Management has adjusted the Company’s first quarter 2016 basic and diluted earnings per share upward from amounts reported in the first quarter 2016 10-Q for immaterial errors of $0.37 and $0.04, respectively. The errors relate to the determination of the date shares issued in connection with the Company’s purging distribution were considered ‘outstanding’ for basic and diluted earnings per share calculations.
|
||||||||||||||||
|
(In thousands, except per share amounts)
|
January 1, 2015 - March 31, 2015
|
April 1, 2015 - June 30, 2015
|
July 1, 2015 September 30, 2015
|
October 1, 2015 - December 31, 2015
|
||||||||||||
|
Revenues:
|
||||||||||||||||
|
Rental revenue
|
$
|
—
|
|
$
|
—
|
|
$
|
—
|
|
$
|
15,134
|
|
||||
|
Restaurant revenue
|
4,890
|
|
4,624
|
|
4,413
|
|
4,395
|
|
||||||||
|
Total revenues
|
4,890
|
|
4,624
|
|
4,413
|
|
19,529
|
|
||||||||
|
Operating expenses:
|
||||||||||||||||
|
General and administrative
|
—
|
|
—
|
|
—
|
|
1,856
|
|
||||||||
|
Depreciation and amortization
|
212
|
|
185
|
|
208
|
|
3,153
|
|
||||||||
|
Restaurant expense
|
4,513
|
|
4,335
|
|
4,088
|
|
4,060
|
|
||||||||
|
Interest expense
|
—
|
|
—
|
|
—
|
|
2,203
|
|
||||||||
|
Total expenses
|
4,725
|
|
4,520
|
|
4,296
|
|
11,272
|
|
||||||||
|
Income Before Income Taxes
|
$
|
165
|
|
$
|
104
|
|
$
|
117
|
|
$
|
8,257
|
|
||||
|
Earnings per share:
|
||||||||||||||||
|
Basic
|
NA
|
|
NA
|
|
NA
|
|
$
|
0.85
|
|
|||||||
|
Diluted
|
NA
|
|
NA
|
|
NA
|
|
0.84
|
|
||||||||
|
Distributions declared per share
|
NA
|
|
NA
|
|
NA
|
|
NA
|
|
||||||||
|
NA – not applicable
|
||||||||||||||||
F-33
|
FOUR CORNERS PROPERTY, TRUST, INC.
SCHEDULE III
SCHEDULE OF REAL EATATE ASSETS AND ACCUMULATED DEPRECIATION
DECEMBER 31, 2016
(Dollars in thousands)
|
|||||||||||||||||
|
Initial Cost to Company
|
Cost Capitalized Since Acquisition
|
Gross Carrying Value (2)
|
Accumulated Depreciation
|
Construction Date
|
Acquisition Date
|
Life on which Depreciation in latest Statement of Income is Computed
|
|||||||||||
|
Restaurant Property (1)
|
Location
|
Land
|
Buildings and Improvements
|
Equipment
|
Land
|
Building and Improvements
|
Equipment
|
Land
|
Building and Improvements
|
Equipment
|
Total
|
||||||
|
OG
|
Kissimmee, FL
|
$400
|
$710
|
$2
|
$—
|
$1,803
|
$615
|
$400
|
$2,513
|
$617
|
$3,530
|
$2,326
|
1985
|
8/5/1985
|
2 - 42
|
||
|
OG
|
Greenwood, IN
|
400
|
749
|
1
|
—
|
1,883
|
625
|
400
|
2,632
|
626
|
3,658
|
2,088
|
1985
|
7/15/1985
|
2 - 49
|
||
|
OG
|
Indianapolis, IN
|
333
|
755
|
15
|
—
|
1,839
|
541
|
333
|
2,594
|
556
|
3,483
|
1,901
|
1985
|
7/15/1985
|
2 - 49
|
||
|
OG
|
Las Vegas, NV
|
597
|
557
|
12
|
—
|
1,108
|
316
|
597
|
1,665
|
328
|
2,590
|
1,669
|
1986
|
3/31/1986
|
2 - 42
|
||
|
OG
|
Ocala, FL
|
470
|
416
|
11
|
—
|
2,112
|
383
|
470
|
2,528
|
394
|
3,392
|
1,920
|
1986
|
7/14/1986
|
2 - 48
|
||
|
OG
|
Huntsville, AL
|
317
|
719
|
1
|
—
|
1,092
|
338
|
317
|
1,811
|
339
|
2,467
|
1,634
|
1986
|
3/3/1986
|
2 - 36
|
||
|
OG
|
Granger, IN
|
220
|
650
|
15
|
—
|
1,309
|
348
|
220
|
1,959
|
363
|
2,542
|
1,965
|
1986
|
9/8/1986
|
2 - 42
|
||
|
OG
|
Toledo, OH
|
275
|
343
|
6
|
—
|
1,146
|
244
|
275
|
1,489
|
250
|
2,014
|
1,522
|
1986
|
9/15/1986
|
2 - 35
|
||
|
OG
|
Bradenton, FL
|
207
|
837
|
4
|
—
|
1,779
|
602
|
207
|
2,616
|
606
|
3,429
|
2,040
|
1986
|
11/3/1986
|
2 - 48
|
||
|
OG
|
Clearwater, FL
|
717
|
593
|
17
|
—
|
1,521
|
446
|
717
|
2,114
|
463
|
3,294
|
1,830
|
1986
|
12/2/1986
|
2 - 47
|
||
|
OG
|
Lakeland, FL
|
754
|
772
|
24
|
—
|
1,745
|
565
|
754
|
2,517
|
589
|
3,860
|
2,133
|
1987
|
3/16/1987
|
2 - 47
|
||
|
OG
|
Mesquite, TX
|
721
|
772
|
10
|
238
|
1,650
|
435
|
959
|
2,422
|
445
|
3,826
|
2,002
|
1987
|
7/20/1987
|
2 - 46
|
||
|
OG
|
North Richland Hills, TX
|
468
|
1,187
|
19
|
—
|
1,414
|
342
|
468
|
2,601
|
361
|
3,430
|
2,339
|
1986
|
12/15/1986
|
2 - 42
|
||
|
OG
|
Fort Worth, TX
|
654
|
626
|
29
|
—
|
1,273
|
403
|
654
|
1,899
|
432
|
2,985
|
1,769
|
1987
|
5/25/1987
|
2 - 46
|
||
|
OG
|
Indianapolis, IN
|
526
|
82
|
2
|
—
|
2,534
|
406
|
526
|
2,616
|
408
|
3,550
|
1,682
|
1987
|
7/20/1987
|
2 - 49
|
||
|
OG
|
Austin, TX
|
492
|
1,183
|
6
|
—
|
1,690
|
440
|
492
|
2,873
|
446
|
3,811
|
2,535
|
1987
|
1/12/1987
|
2 - 46
|
||
|
OG
|
Morrow, GA
|
446
|
813
|
10
|
—
|
1,448
|
423
|
446
|
2,261
|
433
|
3,140
|
2,168
|
1987
|
3/23/1987
|
2 - 42
|
||
|
OG
|
Fort Myers, FL
|
289
|
1,124
|
14
|
—
|
1,786
|
550
|
289
|
2,910
|
564
|
3,763
|
2,298
|
1987
|
5/25/1987
|
2 - 48
|
||
|
OG
|
Tulsa, OK
|
702
|
637
|
23
|
—
|
1,137
|
291
|
702
|
1,774
|
314
|
2,790
|
1,623
|
1987
|
6/22/1987
|
2 - 42
|
||
|
OG
|
Mobile, AL
|
698
|
872
|
31
|
—
|
1,209
|
479
|
698
|
2,081
|
510
|
3,289
|
1,818
|
1987
|
5/18/1987
|
2 - 42
|
||
|
OG
|
Canton, OH
|
275
|
834
|
8
|
—
|
829
|
426
|
275
|
1,663
|
434
|
2,372
|
1,653
|
1987
|
9/21/1987
|
2 - 40
|
||
|
OG
|
Bakersfield, CA
|
529
|
861
|
54
|
—
|
1,294
|
264
|
529
|
2,155
|
318
|
3,002
|
1,999
|
1987
|
5/25/1987
|
2 - 36
|
||
|
OG
|
Pinellas Park, FL
|
—
|
509
|
1
|
958
|
1,511
|
352
|
958
|
2,020
|
353
|
3,331
|
1,591
|
1987
|
9/28/1987
|
2 - 48
|
||
|
OG
|
Duluth, GA
|
675
|
906
|
18
|
351
|
1,247
|
313
|
1,026
|
2,153
|
331
|
3,510
|
1,993
|
1987
|
11/2/1987
|
2 - 42
|
||
|
OG
|
Middleburg Heights, OH
|
555
|
882
|
18
|
—
|
1,285
|
400
|
555
|
2,167
|
418
|
3,140
|
2,070
|
1988
|
3/7/1988
|
2 - 42
|
||
|
OG
|
Fairview Heights, IL
|
735
|
1,162
|
19
|
—
|
1,163
|
518
|
735
|
2,325
|
537
|
3,597
|
2,245
|
1988
|
5/9/1988
|
2 - 35
|
||
|
OG
|
Orlando, FL
|
—
|
894
|
6
|
1,585
|
1,792
|
614
|
1,585
|
2,686
|
620
|
4,891
|
2,516
|
1988
|
2/1/1988
|
2 - 42
|
||
|
OG
|
Sterling Heights, MI
|
855
|
1,158
|
32
|
—
|
984
|
403
|
855
|
2,142
|
435
|
3,432
|
2,180
|
1988
|
10/17/1988
|
2 - 37
|
||
|
OG
|
Reno, NV
|
—
|
639
|
29
|
1,215
|
1,581
|
560
|
1,215
|
2,220
|
589
|
4,024
|
2,276
|
1988
|
1/18/1988
|
2 - 35
|
||
|
OG
|
Akron, OH
|
577
|
1,048
|
6
|
—
|
879
|
281
|
577
|
1,927
|
287
|
2,791
|
1,730
|
1988
|
4/4/1988
|
2 - 40
|
||
|
OG
|
Grand Rapids, MI
|
—
|
959
|
14
|
749
|
753
|
288
|
749
|
1,712
|
302
|
2,763
|
1,703
|
1988
|
5/9/1988
|
2 - 35
|
||
|
OG
|
Montclair, CA
|
—
|
873
|
44
|
1,231
|
736
|
238
|
1,231
|
1,609
|
282
|
3,122
|
1,643
|
1988
|
9/5/1988
|
2 - 40
|
||
|
OG
|
Knoxville, TN
|
375
|
1,397
|
33
|
—
|
700
|
220
|
375
|
2,097
|
253
|
2,725
|
1,974
|
1988
|
3/14/1988
|
2 - 40
|
||
F-34
|
FOUR CORNERS PROPERTY, TRUST, INC.
SCHEDULE III
SCHEDULE OF REAL EATATE ASSETS AND ACCUMULATED DEPRECIATION
DECEMBER 31, 2016
(Dollars in thousands)
|
|||||||||||||||||
|
Initial Cost to Company
|
Cost Capitalized Since Acquisition
|
Gross Carrying Value (2)
|
Accumulated Depreciation
|
Construction Date
|
Acquisition Date
|
Life on which Depreciation in latest Statement of Income is Computed
|
|||||||||||
|
Restaurant Property (1)
|
Location
|
Land
|
Buildings and Improvements
|
Equipment
|
Land
|
Building and Improvements
|
Equipment
|
Land
|
Building and Improvements
|
Equipment
|
Total
|
||||||
|
OG
|
Fairfield, OH
|
325
|
1,230
|
15
|
—
|
1,303
|
276
|
325
|
2,533
|
291
|
3,149
|
2,240
|
1988
|
3/21/1988
|
2 - 46
|
||
|
OG
|
Toledo, OH
|
—
|
891
|
38
|
652
|
726
|
201
|
652
|
1,617
|
239
|
2,508
|
1,640
|
1988
|
5/23/1988
|
2 - 35
|
||
|
OG
|
Lansing, IL
|
—
|
814
|
18
|
912
|
1,200
|
379
|
912
|
2,014
|
397
|
3,323
|
1,833
|
1988
|
6/20/1988
|
2 - 42
|
||
|
OG
|
Bloomington, MN
|
525
|
1,779
|
20
|
—
|
1,212
|
393
|
525
|
2,991
|
413
|
3,929
|
2,901
|
1988
|
6/28/1988
|
2 - 41
|
||
|
OG
|
Vernon Hills, IL
|
750
|
1,252
|
17
|
—
|
1,289
|
474
|
750
|
2,541
|
491
|
3,782
|
2,229
|
1988
|
10/24/1988
|
2 - 47
|
||
|
OG
|
Augusta, GA
|
402
|
803
|
6
|
—
|
1,118
|
470
|
402
|
1,921
|
476
|
2,799
|
1,766
|
1988
|
7/18/1988
|
2 - 47
|
||
|
OG
|
Chattanooga, TN
|
604
|
760
|
19
|
—
|
937
|
405
|
604
|
1,697
|
424
|
2,725
|
1,646
|
1988
|
6/6/1988
|
2 - 35
|
||
|
OG
|
Flint, MI
|
426
|
1,089
|
14
|
—
|
882
|
234
|
426
|
1,971
|
248
|
2,645
|
1,842
|
1988
|
9/5/1988
|
2 - 35
|
||
|
OG
|
Plantation, FL
|
888
|
982
|
27
|
—
|
1,189
|
392
|
888
|
2,171
|
419
|
3,478
|
1,891
|
1989
|
5/8/1989
|
2 - 42
|
||
|
OG
|
Livonia, MI
|
—
|
459
|
25
|
890
|
2,624
|
331
|
890
|
3,083
|
356
|
4,329
|
2,850
|
1988
|
8/1/1988
|
2 - 37
|
||
|
OG
|
Sarasota, FL
|
1,136
|
725
|
24
|
—
|
1,427
|
570
|
1,136
|
2,152
|
594
|
3,882
|
1,896
|
1988
|
10/10/1988
|
2 - 48
|
||
|
OG
|
Saginaw, MI
|
828
|
813
|
22
|
—
|
787
|
340
|
828
|
1,600
|
362
|
2,790
|
1,596
|
1989
|
7/31/1989
|
2 - 40
|
||
|
OG
|
Irving, TX
|
710
|
647
|
33
|
—
|
1,603
|
309
|
710
|
2,250
|
342
|
3,302
|
1,888
|
1988
|
8/22/1988
|
2 - 46
|
||
|
OG
|
Brandon, FL
|
700
|
967
|
24
|
—
|
1,566
|
577
|
700
|
2,533
|
601
|
3,834
|
2,097
|
1989
|
3/27/1989
|
2 - 47
|
||
|
OG
|
Columbus, OH
|
740
|
909
|
38
|
—
|
1,057
|
232
|
740
|
1,966
|
270
|
2,976
|
1,744
|
1988
|
11/14/1988
|
2 - 40
|
||
|
OG
|
North Olmsted, OH
|
931
|
1,060
|
63
|
—
|
925
|
343
|
931
|
1,985
|
406
|
3,322
|
1,805
|
1988
|
12/5/1988
|
2 - 40
|
||
|
OG
|
York, PA
|
555
|
931
|
31
|
—
|
1,048
|
462
|
555
|
1,979
|
493
|
3,027
|
1,890
|
1989
|
3/6/1989
|
2 - 42
|
||
|
OG
|
Oklahoma City, OK
|
280
|
1,043
|
58
|
—
|
1,095
|
371
|
280
|
2,138
|
429
|
2,847
|
1,752
|
1989
|
1/16/1989
|
2 - 42
|
||
|
OG
|
West Des Moines, IA
|
—
|
377
|
24
|
1,130
|
2,047
|
338
|
1,130
|
2,424
|
362
|
3,916
|
2,081
|
1988
|
12/12/1988
|
2 - 36
|
||
|
OG
|
San Antonio, TX
|
400
|
783
|
17
|
—
|
1,458
|
449
|
400
|
2,241
|
466
|
3,107
|
2,017
|
1989
|
2/13/1989
|
2 - 41
|
||
|
OG
|
Kennesaw, GA
|
754
|
824
|
32
|
—
|
1,233
|
390
|
754
|
2,057
|
422
|
3,233
|
1,704
|
1989
|
5/1/1989
|
2 - 47
|
||
|
OG
|
Portage, MI
|
325
|
1,290
|
32
|
—
|
892
|
266
|
325
|
2,182
|
298
|
2,805
|
1,990
|
1989
|
7/31/1989
|
2 - 35
|
||
|
OG
|
West Dundee, IL
|
828
|
1,167
|
32
|
—
|
964
|
325
|
828
|
2,131
|
357
|
3,316
|
1,962
|
1989
|
8/28/1989
|
2 - 40
|
||
|
OG
|
Saint Peters, MO
|
697
|
930
|
134
|
—
|
1,034
|
292
|
697
|
1,964
|
426
|
3,087
|
1,816
|
1989
|
7/3/1989
|
2 - 35
|
||
|
OG
|
San Antonio, TX
|
—
|
720
|
1
|
677
|
1,330
|
395
|
677
|
2,050
|
396
|
3,123
|
1,804
|
1989
|
5/22/1989
|
2 - 41
|
||
|
OG
|
Corpus Christi, TX
|
—
|
713
|
21
|
880
|
1,463
|
553
|
880
|
2,176
|
574
|
3,630
|
1,884
|
1989
|
7/3/1989
|
2 - 36
|
||
|
OG
|
Houston, TX
|
616
|
746
|
40
|
—
|
1,228
|
492
|
616
|
1,974
|
532
|
3,122
|
1,779
|
1989
|
7/10/1989
|
2 - 39
|
||
|
OG
|
Beaumont, TX
|
608
|
721
|
33
|
—
|
1,163
|
375
|
608
|
1,884
|
408
|
2,900
|
1,723
|
1989
|
8/14/1989
|
2 - 40
|
||
|
OG
|
Winter Haven, FL
|
—
|
832
|
49
|
563
|
1,673
|
543
|
563
|
2,505
|
592
|
3,660
|
2,150
|
1989
|
8/14/1989
|
2 - 47
|
||
|
OG
|
Southgate, MI
|
476
|
1,138
|
31
|
—
|
1,103
|
242
|
476
|
2,241
|
273
|
2,990
|
1,998
|
1990
|
1/22/1990
|
2 - 37
|
||
|
OG
|
Champaign, IL
|
521
|
1,158
|
26
|
—
|
1,009
|
343
|
521
|
2,167
|
369
|
3,057
|
2,017
|
1989
|
10/30/1989
|
2 - 35
|
||
|
OG
|
Orlando, FL
|
787
|
998
|
17
|
—
|
1,877
|
431
|
787
|
2,875
|
448
|
4,110
|
2,279
|
1990
|
1/29/1990
|
2 - 48
|
||
|
OG
|
Fort Wayne, IN
|
700
|
1,045
|
23
|
—
|
927
|
320
|
700
|
1,972
|
343
|
3,015
|
1,790
|
1989
|
12/11/1989
|
2 - 42
|
||
F-35
|
FOUR CORNERS PROPERTY, TRUST, INC.
SCHEDULE III
SCHEDULE OF REAL EATATE ASSETS AND ACCUMULATED DEPRECIATION
DECEMBER 31, 2016
(Dollars in thousands)
|
|||||||||||||||||
|
Initial Cost to Company
|
Cost Capitalized Since Acquisition
|
Gross Carrying Value (2)
|
Accumulated Depreciation
|
Construction Date
|
Acquisition Date
|
Life on which Depreciation in latest Statement of Income is Computed
|
|||||||||||
|
Restaurant Property (1)
|
Location
|
Land
|
Buildings and Improvements
|
Equipment
|
Land
|
Building and Improvements
|
Equipment
|
Land
|
Building and Improvements
|
Equipment
|
Total
|
||||||
|
OG
|
Fargo, ND
|
313
|
864
|
20
|
—
|
680
|
264
|
313
|
1,544
|
284
|
2,141
|
1,453
|
1989
|
12/11/1989
|
2 - 40
|
||
|
OG
|
North Little Rock, AR
|
—
|
437
|
94
|
766
|
1,623
|
293
|
766
|
2,060
|
387
|
3,213
|
1,873
|
1989
|
10/30/1989
|
2 - 42
|
||
|
OG
|
Jacksonville, FL
|
—
|
755
|
39
|
905
|
1,137
|
487
|
905
|
1,892
|
526
|
3,323
|
1,784
|
1990
|
4/30/1990
|
2 - 42
|
||
|
OG
|
Las Vegas, NV
|
1,085
|
1,191
|
47
|
—
|
967
|
310
|
1,085
|
2,158
|
357
|
3,600
|
2,029
|
1990
|
3/26/1990
|
2 - 42
|
||
|
OG
|
Victorville, CA
|
603
|
985
|
31
|
—
|
888
|
271
|
603
|
1,873
|
302
|
2,778
|
1,620
|
1990
|
9/10/1990
|
2 - 42
|
||
|
OG
|
Naples, FL
|
992
|
677
|
40
|
—
|
1,201
|
526
|
992
|
1,878
|
566
|
3,436
|
1,755
|
1990
|
3/26/1990
|
2 - 40
|
||
|
OG
|
Rochester, NY
|
1,104
|
1,113
|
61
|
—
|
1,102
|
376
|
1,104
|
2,215
|
437
|
3,756
|
1,980
|
1990
|
5/14/1990
|
2 - 36
|
||
|
OG
|
Chesapeake, VA
|
506
|
863
|
44
|
—
|
1,046
|
344
|
506
|
1,909
|
388
|
2,803
|
1,824
|
1990
|
3/5/1990
|
2 - 40
|
||
|
OG
|
Maplewood, MN
|
556
|
1,009
|
86
|
—
|
1,126
|
250
|
556
|
2,135
|
336
|
3,027
|
2,029
|
1990
|
4/16/1990
|
2 - 40
|
||
|
OG
|
Fayetteville, NC
|
637
|
856
|
56
|
—
|
879
|
461
|
637
|
1,735
|
517
|
2,889
|
1,682
|
1990
|
2/26/1990
|
2 - 35
|
||
|
OG
|
Lynnwood, WA
|
875
|
1,132
|
66
|
—
|
855
|
316
|
875
|
1,987
|
382
|
3,244
|
1,804
|
1990
|
8/20/1990
|
2 - 35
|
||
|
OG
|
Columbia, MO
|
602
|
983
|
53
|
—
|
1,070
|
327
|
602
|
2,053
|
380
|
3,035
|
1,832
|
1990
|
6/4/1990
|
2 - 42
|
||
|
OG
|
Topeka, KS
|
701
|
812
|
18
|
—
|
1,658
|
381
|
701
|
2,470
|
399
|
3,570
|
2,045
|
1990
|
10/22/1990
|
2 - 47
|
||
|
OG
|
Wichita, KS
|
779
|
802
|
80
|
—
|
1,022
|
274
|
779
|
1,824
|
354
|
2,957
|
1,690
|
1990
|
10/1/1990
|
2 - 42
|
||
|
OG
|
Antioch, TN
|
—
|
811
|
61
|
892
|
628
|
241
|
892
|
1,439
|
302
|
2,633
|
1,407
|
1990
|
10/15/1990
|
2 - 40
|
||
|
OG
|
Greenfield, WI
|
956
|
802
|
29
|
114
|
1,174
|
295
|
1,070
|
1,976
|
324
|
3,370
|
1,777
|
1990
|
8/13/1990
|
2 - 42
|
||
|
OG
|
Orange City, FL
|
551
|
727
|
16
|
—
|
1,163
|
479
|
551
|
1,890
|
495
|
2,936
|
1,528
|
1990
|
10/29/1990
|
2 - 48
|
||
|
OG
|
Terre Haute, IN
|
560
|
1,128
|
34
|
—
|
872
|
355
|
560
|
2,000
|
389
|
2,949
|
1,826
|
1990
|
12/3/1990
|
2 - 35
|
||
|
OG
|
Richmond, VA
|
467
|
1,363
|
93
|
—
|
966
|
399
|
467
|
2,329
|
492
|
3,288
|
2,165
|
1990
|
9/17/1990
|
2 - 42
|
||
|
OG
|
Columbia, SC
|
613
|
782
|
35
|
—
|
1,055
|
230
|
613
|
1,837
|
265
|
2,715
|
1,608
|
1990
|
12/3/1990
|
2 - 42
|
||
|
OG
|
Talleyville, DE
|
737
|
1,278
|
95
|
—
|
805
|
377
|
737
|
2,083
|
472
|
3,292
|
2,075
|
1991
|
4/22/1991
|
2 - 40
|
||
|
OG
|
Littleton, CO
|
750
|
859
|
79
|
—
|
1,324
|
359
|
750
|
2,183
|
438
|
3,371
|
1,977
|
1991
|
1/21/1991
|
2 - 40
|
||
|
OG
|
Miami, FL
|
1,059
|
879
|
89
|
—
|
1,413
|
549
|
1,059
|
2,292
|
638
|
3,989
|
2,110
|
1991
|
1/28/1991
|
2 - 42
|
||
|
OG
|
Roseville, MN
|
754
|
1,106
|
90
|
—
|
784
|
178
|
754
|
1,890
|
268
|
2,912
|
1,688
|
1991
|
3/25/1991
|
2 - 40
|
||
|
OG
|
Colorado Springs, CO
|
—
|
690
|
87
|
571
|
2,173
|
415
|
571
|
2,863
|
502
|
3,936
|
2,585
|
1991
|
1/21/1991
|
2 - 41
|
||
|
OG
|
Aurora, CO
|
803
|
1,169
|
14
|
—
|
1,368
|
343
|
803
|
2,537
|
357
|
3,697
|
2,130
|
1991
|
4/1/1991
|
2 - 41
|
||
|
OG
|
Boise, ID
|
627
|
839
|
76
|
—
|
858
|
386
|
627
|
1,697
|
462
|
2,786
|
1,618
|
1991
|
4/29/1991
|
2 - 42
|
||
|
OG
|
Eastpointe, MI
|
897
|
1,367
|
75
|
—
|
598
|
244
|
897
|
1,965
|
319
|
3,181
|
1,841
|
1991
|
3/25/1991
|
2 - 40
|
||
|
OG
|
Parkersburg, WV
|
454
|
1,096
|
60
|
—
|
723
|
323
|
454
|
1,819
|
383
|
2,656
|
1,707
|
1991
|
2/11/1991
|
2 - 42
|
||
|
OG
|
Clovis, CA
|
489
|
796
|
62
|
—
|
787
|
300
|
489
|
1,583
|
362
|
2,434
|
1,558
|
1991
|
2/18/1991
|
2 - 42
|
||
|
OG
|
Dallas, TX
|
750
|
776
|
36
|
70
|
1,001
|
305
|
820
|
1,777
|
341
|
2,938
|
1,580
|
1991
|
2/25/1991
|
2 - 41
|
||
|
OG
|
Houston, TX
|
723
|
960
|
87
|
—
|
1,234
|
498
|
723
|
2,194
|
585
|
3,502
|
2,074
|
1991
|
5/20/1991
|
2 - 40
|
||
|
OG
|
Columbia, MD
|
1,283
|
1,199
|
92
|
—
|
1,020
|
297
|
1,283
|
2,219
|
389
|
3,891
|
2,046
|
1991
|
11/4/1991
|
2 - 42
|
||
F-36
|
FOUR CORNERS PROPERTY, TRUST, INC.
SCHEDULE III
SCHEDULE OF REAL EATATE ASSETS AND ACCUMULATED DEPRECIATION
DECEMBER 31, 2016
(Dollars in thousands)
|
|||||||||||||||||
|
Initial Cost to Company
|
Cost Capitalized Since Acquisition
|
Gross Carrying Value (2)
|
Accumulated Depreciation
|
Construction Date
|
Acquisition Date
|
Life on which Depreciation in latest Statement of Income is Computed
|
|||||||||||
|
Restaurant Property (1)
|
Location
|
Land
|
Buildings and Improvements
|
Equipment
|
Land
|
Building and Improvements
|
Equipment
|
Land
|
Building and Improvements
|
Equipment
|
Total
|
||||||
|
OG
|
McAllen, TX
|
803
|
857
|
76
|
—
|
1,160
|
476
|
803
|
2,017
|
552
|
3,372
|
1,707
|
1991
|
4/29/1991
|
2 - 42
|
||
|
OG
|
Jacksonville, FL
|
1,124
|
863
|
74
|
—
|
1,185
|
438
|
1,124
|
2,048
|
512
|
3,684
|
1,796
|
1991
|
8/12/1991
|
2 - 42
|
||
|
OG
|
Boardman, OH
|
675
|
993
|
48
|
—
|
1,208
|
329
|
675
|
2,201
|
377
|
3,253
|
2,038
|
1991
|
8/5/1991
|
2 - 38
|
||
|
OG
|
San Bernardino, CA
|
1,393
|
1,210
|
83
|
—
|
756
|
301
|
1,393
|
1,966
|
384
|
3,743
|
1,848
|
1992
|
3/9/1992
|
2 - 42
|
||
|
OG
|
West Melbourne, FL
|
983
|
953
|
22
|
—
|
1,390
|
578
|
983
|
2,343
|
600
|
3,926
|
1,949
|
1991
|
8/19/1991
|
2 - 47
|
||
|
OG
|
Houston, TX
|
627
|
947
|
68
|
—
|
1,084
|
435
|
627
|
2,031
|
503
|
3,161
|
1,893
|
1991
|
11/11/1991
|
2 - 40
|
||
|
OG
|
Palmdale, CA
|
679
|
1,080
|
109
|
—
|
1,093
|
315
|
679
|
2,173
|
424
|
3,276
|
1,887
|
1992
|
8/3/1992
|
2 - 39
|
||
|
OG
|
Woodbridge, VA
|
1,228
|
1,071
|
56
|
—
|
1,163
|
444
|
1,228
|
2,234
|
500
|
3,962
|
2,018
|
1992
|
2/3/1992
|
2 - 41
|
||
|
OG
|
Roanoke, VA
|
607
|
714
|
33
|
—
|
783
|
350
|
607
|
1,497
|
383
|
2,487
|
1,348
|
1991
|
12/9/1991
|
2 - 42
|
||
|
OG
|
Provo, UT
|
702
|
714
|
128
|
—
|
805
|
284
|
702
|
1,519
|
412
|
2,633
|
1,455
|
1991
|
11/11/1991
|
2 - 40
|
||
|
OG
|
Omaha, NE
|
315
|
1,230
|
51
|
—
|
1,642
|
341
|
315
|
2,872
|
392
|
3,579
|
2,161
|
1991
|
10/28/1991
|
2 - 42
|
||
|
OG
|
Pittsburgh, PA
|
1,125
|
1,170
|
65
|
—
|
1,202
|
279
|
1,125
|
2,372
|
344
|
3,841
|
2,000
|
1991
|
12/9/1991
|
2 - 38
|
||
|
OG
|
Harrisburg, PA
|
769
|
837
|
108
|
—
|
1,117
|
328
|
769
|
1,954
|
436
|
3,159
|
1,773
|
1991
|
12/9/1991
|
2 - 35
|
||
|
OG
|
Pineville, NC
|
1,018
|
972
|
71
|
—
|
950
|
281
|
1,018
|
1,922
|
352
|
3,292
|
1,802
|
1992
|
1/27/1992
|
2 - 42
|
||
|
OG
|
Palm Desert, CA
|
607
|
987
|
100
|
—
|
617
|
185
|
607
|
1,604
|
285
|
2,496
|
1,506
|
1992
|
1/27/1992
|
2 - 40
|
||
|
OG
|
Elkhart, IN
|
381
|
724
|
145
|
—
|
683
|
281
|
381
|
1,407
|
426
|
2,214
|
1,446
|
1992
|
2/3/1992
|
2 - 40
|
||
|
OG
|
Lafayette, LA
|
555
|
751
|
69
|
—
|
997
|
304
|
555
|
1,748
|
373
|
2,676
|
1,627
|
1992
|
1/27/1992
|
2 - 42
|
||
|
OG
|
Little Rock, AR
|
335
|
895
|
105
|
—
|
749
|
265
|
335
|
1,644
|
370
|
2,349
|
1,583
|
1992
|
3/9/1992
|
2 - 40
|
||
|
OG
|
Cincinnati, OH
|
842
|
953
|
107
|
—
|
986
|
344
|
842
|
1,939
|
451
|
3,232
|
1,857
|
1992
|
3/16/1992
|
2 - 38
|
||
|
OG
|
Myrtle Beach, SC
|
520
|
872
|
51
|
—
|
845
|
386
|
520
|
1,717
|
437
|
2,674
|
1,566
|
1992
|
3/16/1992
|
2 - 42
|
||
|
OG
|
Louisville, KY
|
492
|
1,571
|
76
|
—
|
869
|
254
|
492
|
2,440
|
330
|
3,262
|
2,104
|
1992
|
6/15/1992
|
2 - 42
|
||
|
OG
|
Highlands Ranch, CO
|
813
|
980
|
49
|
—
|
1,177
|
380
|
813
|
2,157
|
429
|
3,399
|
1,815
|
1992
|
5/11/1992
|
2 - 41
|
||
|
OG
|
Novi, MI
|
866
|
1,629
|
31
|
—
|
867
|
296
|
866
|
2,496
|
327
|
3,689
|
2,188
|
1992
|
5/25/1992
|
2 - 42
|
||
|
OG
|
Longview, TX
|
505
|
816
|
90
|
—
|
1,133
|
290
|
505
|
1,949
|
380
|
2,834
|
1,613
|
1993
|
2/22/1993
|
2 - 45
|
||
|
OG
|
Erie, PA
|
1,078
|
1,412
|
91
|
—
|
1,129
|
408
|
1,078
|
2,541
|
499
|
4,118
|
2,221
|
1992
|
11/2/1992
|
2 - 42
|
||
|
OG
|
Greensburg, PA
|
579
|
1,272
|
143
|
—
|
1,026
|
352
|
579
|
2,298
|
495
|
3,372
|
1,792
|
1992
|
8/31/1992
|
2 - 40
|
||
|
OG
|
Roswell, GA
|
838
|
897
|
79
|
—
|
764
|
339
|
838
|
1,661
|
418
|
2,917
|
1,593
|
1992
|
9/14/1992
|
2 - 40
|
||
|
OG
|
Clarksville, TN
|
302
|
771
|
101
|
—
|
443
|
207
|
302
|
1,214
|
308
|
1,824
|
1,167
|
1992
|
8/3/1992
|
2 - 38
|
||
|
OG
|
Green Bay, WI
|
453
|
789
|
97
|
—
|
675
|
260
|
453
|
1,464
|
357
|
2,274
|
1,461
|
1992
|
9/14/1992
|
2 - 40
|
||
|
OG
|
Cincinnati, OH
|
917
|
939
|
62
|
—
|
1,041
|
360
|
917
|
1,980
|
422
|
3,319
|
1,757
|
1992
|
8/17/1992
|
2 - 38
|
||
|
OG
|
Sioux Falls, SD
|
247
|
1,325
|
78
|
—
|
917
|
217
|
247
|
2,242
|
295
|
2,784
|
1,905
|
1992
|
9/7/1992
|
2 - 40
|
||
|
OG
|
Yakima, WA
|
—
|
1,296
|
124
|
409
|
568
|
294
|
409
|
1,864
|
418
|
2,691
|
1,895
|
1993
|
3/22/1993
|
2 - 40
|
||
|
OG
|
Harlingen, TX
|
453
|
803
|
107
|
—
|
1,013
|
426
|
453
|
1,816
|
533
|
2,802
|
1,444
|
1992
|
10/19/1992
|
2 - 42
|
||
F-37
|
FOUR CORNERS PROPERTY, TRUST, INC.
SCHEDULE III
SCHEDULE OF REAL EATATE ASSETS AND ACCUMULATED DEPRECIATION
DECEMBER 31, 2016
(Dollars in thousands)
|
|||||||||||||||||
|
Initial Cost to Company
|
Cost Capitalized Since Acquisition
|
Gross Carrying Value (2)
|
Accumulated Depreciation
|
Construction Date
|
Acquisition Date
|
Life on which Depreciation in latest Statement of Income is Computed
|
|||||||||||
|
Restaurant Property (1)
|
Location
|
Land
|
Buildings and Improvements
|
Equipment
|
Land
|
Building and Improvements
|
Equipment
|
Land
|
Building and Improvements
|
Equipment
|
Total
|
||||||
|
OG
|
Chico, CA
|
984
|
923
|
95
|
—
|
850
|
308
|
984
|
1,773
|
403
|
3,160
|
1,569
|
1992
|
11/9/1992
|
2 - 40
|
||
|
OG
|
Las Vegas, NV
|
1,055
|
1,005
|
108
|
—
|
849
|
297
|
1,055
|
1,854
|
405
|
3,314
|
1,773
|
1992
|
12/14/1992
|
2 - 42
|
||
|
OG
|
Laurel, MD
|
1,241
|
1,552
|
121
|
—
|
1,403
|
388
|
1,241
|
2,955
|
509
|
4,705
|
2,639
|
1993
|
1/25/1993
|
2 - 42
|
||
|
OG
|
Arlington, TX
|
782
|
766
|
70
|
—
|
795
|
441
|
782
|
1,561
|
511
|
2,854
|
1,513
|
1993
|
3/29/1993
|
2 - 44
|
||
|
OG
|
Racine, WI
|
608
|
1,247
|
140
|
—
|
914
|
198
|
608
|
2,161
|
338
|
3,107
|
1,907
|
1993
|
2/1/1993
|
2 - 40
|
||
|
OG
|
Mesa, AZ
|
551
|
888
|
97
|
—
|
803
|
274
|
551
|
1,691
|
371
|
2,613
|
1,529
|
1993
|
4/12/1993
|
2 - 40
|
||
|
OG
|
Fort Collins, CO
|
809
|
1,105
|
97
|
—
|
1,011
|
350
|
809
|
2,116
|
447
|
3,372
|
2,006
|
1993
|
2/8/1993
|
2 - 41
|
||
|
OG
|
Raleigh, NC
|
855
|
877
|
76
|
—
|
855
|
318
|
855
|
1,732
|
394
|
2,981
|
1,661
|
1993
|
3/8/1993
|
2 - 42
|
||
|
OG
|
Dover, DE
|
614
|
1,055
|
127
|
—
|
656
|
279
|
614
|
1,711
|
406
|
2,731
|
1,566
|
1993
|
4/19/1993
|
2 - 38
|
||
|
OG
|
Lafayette, IN
|
455
|
875
|
98
|
—
|
635
|
221
|
455
|
1,510
|
319
|
2,284
|
1,486
|
1993
|
3/22/1993
|
2 - 40
|
||
|
OG
|
Addison, TX
|
1,221
|
1,746
|
79
|
—
|
1,032
|
374
|
1,221
|
2,778
|
453
|
4,452
|
2,470
|
1993
|
4/26/1993
|
2 - 41
|
||
|
OG
|
Appleton, WI
|
424
|
956
|
117
|
—
|
646
|
216
|
424
|
1,602
|
333
|
2,359
|
1,462
|
1993
|
5/17/1993
|
2 - 40
|
||
|
OG
|
Panama City, FL
|
465
|
957
|
84
|
—
|
1,082
|
400
|
465
|
2,039
|
484
|
2,988
|
1,641
|
1993
|
10/11/1993
|
2 - 42
|
||
|
OG
|
Texas City, TX
|
732
|
1,093
|
97
|
—
|
871
|
319
|
732
|
1,964
|
416
|
3,112
|
1,737
|
1993
|
7/19/1993
|
2 - 44
|
||
|
OG
|
Muncie, IN
|
454
|
1,003
|
92
|
—
|
1,065
|
296
|
454
|
2,068
|
388
|
2,910
|
1,450
|
1993
|
8/23/1993
|
2 - 49
|
||
|
OG
|
Kenner, LA
|
695
|
969
|
86
|
—
|
1,112
|
361
|
695
|
2,081
|
447
|
3,223
|
1,939
|
1993
|
7/5/1993
|
2 - 40
|
||
|
OG
|
Duncanville, TX
|
835
|
1,057
|
91
|
—
|
945
|
370
|
835
|
2,002
|
461
|
3,298
|
1,758
|
1993
|
6/28/1993
|
2 - 40
|
||
|
OG
|
Poughkeepsie, NY
|
873
|
1,613
|
108
|
—
|
823
|
174
|
873
|
2,436
|
282
|
3,591
|
1,921
|
1993
|
11/29/1993
|
2 - 40
|
||
|
OG
|
Billings, MT
|
479
|
1,107
|
89
|
—
|
775
|
301
|
479
|
1,882
|
390
|
2,751
|
1,696
|
1993
|
10/18/1993
|
2 - 42
|
||
|
OG
|
Rochester, NY
|
974
|
1,108
|
101
|
—
|
824
|
243
|
974
|
1,932
|
344
|
3,250
|
1,570
|
1993
|
11/15/1993
|
2 - 42
|
||
|
OG
|
Whitehall, PA
|
936
|
1,291
|
90
|
—
|
1,025
|
331
|
936
|
2,316
|
421
|
3,673
|
2,088
|
1993
|
11/8/1993
|
2 - 36
|
||
|
OG
|
Paducah, KY
|
452
|
1,083
|
82
|
—
|
700
|
288
|
452
|
1,783
|
370
|
2,605
|
1,596
|
1993
|
11/8/1993
|
2 - 40
|
||
|
OG
|
Dearborn, MI
|
542
|
1,219
|
59
|
—
|
713
|
242
|
542
|
1,932
|
301
|
2,775
|
1,680
|
1994
|
1/10/1994
|
2 - 40
|
||
|
OG
|
Bangor, ME
|
357
|
1,120
|
96
|
—
|
1,027
|
282
|
357
|
2,147
|
378
|
2,882
|
1,804
|
1993
|
12/13/1993
|
2 - 42
|
||
|
OG
|
Grand Rapids, MI
|
804
|
866
|
87
|
—
|
637
|
257
|
804
|
1,503
|
344
|
2,651
|
1,424
|
1994
|
1/24/1994
|
2 - 40
|
||
|
OG
|
Peoria, IL
|
668
|
1,204
|
81
|
—
|
914
|
323
|
668
|
2,118
|
404
|
3,190
|
1,772
|
1994
|
2/14/1994
|
2 - 42
|
||
|
OG
|
Newington, NH
|
915
|
1,051
|
103
|
—
|
803
|
355
|
915
|
1,854
|
458
|
3,227
|
1,688
|
1994
|
1/17/1994
|
2 - 42
|
||
|
OG
|
Tyler, TX
|
485
|
1,041
|
92
|
—
|
1,279
|
340
|
485
|
2,320
|
432
|
3,237
|
1,893
|
1994
|
1/17/1994
|
2 - 47
|
||
|
OG
|
Janesville, WI
|
370
|
1,069
|
86
|
—
|
712
|
287
|
370
|
1,781
|
373
|
2,524
|
1,501
|
1994
|
3/7/1994
|
2 - 40
|
||
|
OG
|
Las Vegas, NV
|
879
|
1,344
|
95
|
—
|
596
|
317
|
879
|
1,940
|
412
|
3,231
|
1,699
|
1994
|
3/7/1994
|
2 - 40
|
||
|
OG
|
Middletown, OH
|
424
|
1,044
|
95
|
—
|
863
|
318
|
424
|
1,907
|
413
|
2,744
|
1,717
|
1994
|
3/7/1994
|
2 - 42
|
||
|
OG
|
Concord, NH
|
469
|
1,284
|
115
|
—
|
594
|
194
|
469
|
1,878
|
309
|
2,656
|
1,580
|
1994
|
2/14/1994
|
2 - 38
|
||
|
OG
|
Branson, MO
|
1,056
|
1,893
|
69
|
—
|
785
|
295
|
1,056
|
2,678
|
364
|
4,098
|
2,202
|
1994
|
5/16/1994
|
2 - 40
|
||
|
OG
|
Coon Rapids, MN
|
514
|
1,248
|
67
|
—
|
588
|
245
|
514
|
1,836
|
312
|
2,662
|
1,601
|
1994
|
9/26/1994
|
2 - 40
|
||
|
OG
|
Fairfax, VA
|
985
|
1,127
|
69
|
—
|
1,021
|
406
|
985
|
2,148
|
475
|
3,608
|
1,892
|
1994
|
10/3/1994
|
2 - 42
|
||
F-38
|
FOUR CORNERS PROPERTY, TRUST, INC.
SCHEDULE III
SCHEDULE OF REAL EATATE ASSETS AND ACCUMULATED DEPRECIATION
DECEMBER 31, 2016
(Dollars in thousands)
|
|||||||||||||||||
|
Initial Cost to Company
|
Cost Capitalized Since Acquisition
|
Gross Carrying Value (2)
|
Accumulated Depreciation
|
Construction Date
|
Acquisition Date
|
Life on which Depreciation in latest Statement of Income is Computed
|
|||||||||||
|
Restaurant Property (1)
|
Location
|
Land
|
Buildings and Improvements
|
Equipment
|
Land
|
Building and Improvements
|
Equipment
|
Land
|
Building and Improvements
|
Equipment
|
Total
|
||||||
|
OG
|
Amherst, NY
|
1,215
|
1,394
|
88
|
—
|
891
|
307
|
1,215
|
2,285
|
395
|
3,895
|
1,926
|
1994
|
12/12/1994
|
2 - 38
|
||
|
OG
|
Dallas, TX
|
764
|
1,212
|
55
|
—
|
811
|
281
|
764
|
2,023
|
336
|
3,123
|
1,786
|
1994
|
10/10/1994
|
2 - 44
|
||
|
OG
|
Asheville, NC
|
1,031
|
1,198
|
94
|
—
|
655
|
292
|
1,031
|
1,853
|
386
|
3,270
|
1,656
|
1994
|
10/31/1994
|
2 - 40
|
||
|
OG
|
Waldorf, MD
|
779
|
1,152
|
81
|
—
|
1,258
|
357
|
779
|
2,410
|
438
|
3,627
|
2,094
|
1995
|
5/22/1995
|
2 - 42
|
||
|
OG
|
Fairborn, OH
|
804
|
1,290
|
82
|
—
|
681
|
221
|
804
|
1,971
|
303
|
3,078
|
1,679
|
1995
|
2/20/1995
|
2 - 40
|
||
|
OG
|
Joplin, MO
|
654
|
1,219
|
102
|
—
|
662
|
323
|
654
|
1,881
|
425
|
2,960
|
1,643
|
1995
|
1/9/1995
|
2 - 40
|
||
|
OG
|
Middletown, NY
|
807
|
1,581
|
97
|
—
|
592
|
345
|
807
|
2,173
|
442
|
3,422
|
1,865
|
1995
|
1/30/1995
|
2 - 40
|
||
|
OG
|
Cedar Rapids, IA
|
510
|
1,148
|
105
|
—
|
608
|
311
|
510
|
1,756
|
416
|
2,682
|
1,572
|
1994
|
12/5/1994
|
2 - 40
|
||
|
OG
|
Eau Claire, WI
|
600
|
1,193
|
110
|
—
|
538
|
268
|
600
|
1,731
|
378
|
2,709
|
1,563
|
1995
|
1/23/1995
|
2 - 40
|
||
|
OG
|
Voorhees, NJ
|
804
|
1,696
|
101
|
—
|
600
|
303
|
804
|
2,296
|
404
|
3,504
|
1,964
|
1995
|
2/20/1995
|
2 - 38
|
||
|
OG
|
Henderson, NV
|
1,109
|
1,289
|
74
|
—
|
826
|
383
|
1,109
|
2,115
|
457
|
3,681
|
1,902
|
1995
|
2/20/1995
|
2 - 42
|
||
|
OG
|
Clay, NY
|
782
|
1,705
|
98
|
—
|
866
|
356
|
782
|
2,571
|
454
|
3,807
|
1,992
|
1995
|
4/24/1995
|
2 - 42
|
||
|
OG
|
Norman, OK
|
596
|
1,246
|
96
|
—
|
449
|
172
|
596
|
1,695
|
268
|
2,559
|
1,451
|
1995
|
3/7/1995
|
2 - 38
|
||
|
OG
|
Heath, OH
|
599
|
1,353
|
65
|
—
|
971
|
331
|
599
|
2,324
|
396
|
3,319
|
1,863
|
1995
|
5/22/1995
|
2 - 46
|
||
|
OG
|
Jackson, MI
|
699
|
1,156
|
73
|
—
|
764
|
320
|
699
|
1,920
|
393
|
3,012
|
1,576
|
1995
|
3/20/1995
|
2 - 42
|
||
|
OG
|
Hampton, VA
|
1,074
|
1,061
|
86
|
—
|
674
|
225
|
1,074
|
1,735
|
311
|
3,120
|
1,482
|
1995
|
3/13/1995
|
2 - 40
|
||
|
OG
|
Tempe, AZ
|
703
|
1,131
|
75
|
—
|
746
|
353
|
703
|
1,877
|
428
|
3,008
|
1,736
|
1995
|
5/15/1995
|
2 - 40
|
||
|
OG
|
Waterloo, IA
|
466
|
891
|
79
|
—
|
873
|
331
|
466
|
1,764
|
410
|
2,640
|
1,446
|
1995
|
5/22/1995
|
2 - 42
|
||
|
OG
|
Barboursville, WV
|
1,139
|
1,062
|
84
|
—
|
731
|
203
|
1,139
|
1,793
|
287
|
3,219
|
1,479
|
1995
|
2/27/1995
|
2 - 40
|
||
|
OG
|
Peoria, AZ
|
551
|
1,294
|
81
|
—
|
623
|
242
|
551
|
1,917
|
323
|
2,791
|
1,638
|
1995
|
5/22/1995
|
2 - 38
|
||
|
OG
|
Onalaska, WI
|
603
|
1,283
|
102
|
—
|
339
|
197
|
603
|
1,622
|
299
|
2,524
|
1,432
|
1995
|
4/24/1995
|
2 - 38
|
||
|
OG
|
Grapevine, TX
|
752
|
1,026
|
99
|
—
|
793
|
404
|
752
|
1,819
|
503
|
3,074
|
1,722
|
1995
|
5/8/1995
|
2 - 40
|
||
|
OG
|
Midland, TX
|
400
|
1,340
|
88
|
—
|
566
|
314
|
400
|
1,906
|
402
|
2,708
|
1,606
|
1995
|
10/16/1995
|
2 - 40
|
||
|
OG
|
Spring, TX
|
780
|
1,329
|
80
|
—
|
1,289
|
327
|
780
|
2,618
|
407
|
3,805
|
2,097
|
1995
|
9/11/1995
|
2 - 40
|
||
|
OG
|
Colonie, NY
|
966
|
1,862
|
57
|
—
|
984
|
273
|
966
|
2,846
|
330
|
4,142
|
2,106
|
1995
|
11/27/1995
|
2 - 42
|
||
|
OG
|
Fort Smith, AR
|
527
|
893
|
113
|
—
|
427
|
187
|
527
|
1,320
|
300
|
2,147
|
1,130
|
1996
|
2/19/1996
|
2 - 38
|
||
|
OG
|
Jackson, MS
|
641
|
1,195
|
110
|
—
|
846
|
268
|
641
|
2,041
|
378
|
3,060
|
1,694
|
1996
|
3/25/1996
|
2 - 42
|
||
|
OG
|
Lancaster, OH
|
372
|
846
|
115
|
—
|
603
|
284
|
372
|
1,449
|
399
|
2,220
|
1,246
|
1996
|
5/6/1996
|
2 - 40
|
||
|
OG
|
Lima, OH
|
471
|
930
|
67
|
—
|
387
|
282
|
471
|
1,317
|
349
|
2,137
|
1,154
|
1996
|
5/20/1996
|
2 - 38
|
||
|
OG
|
Williamsburg, VA
|
673
|
1,268
|
31
|
—
|
743
|
202
|
673
|
2,011
|
233
|
2,917
|
1,516
|
1996
|
8/19/1996
|
2 - 40
|
||
|
OG
|
Dubuque, IA
|
518
|
1,103
|
76
|
—
|
391
|
221
|
518
|
1,494
|
297
|
2,309
|
1,056
|
1996
|
5/20/1996
|
2 - 38
|
||
|
OG
|
Zanesville, OH
|
707
|
1,065
|
25
|
—
|
673
|
323
|
707
|
1,738
|
348
|
2,793
|
1,355
|
1996
|
8/5/1996
|
2 - 40
|
||
F-39
|
FOUR CORNERS PROPERTY, TRUST, INC.
SCHEDULE III
SCHEDULE OF REAL EATATE ASSETS AND ACCUMULATED DEPRECIATION
DECEMBER 31, 2016
(Dollars in thousands)
|
|||||||||||||||||
|
Initial Cost to Company
|
Cost Capitalized Since Acquisition
|
Gross Carrying Value (2)
|
Accumulated Depreciation
|
Construction Date
|
Acquisition Date
|
Life on which Depreciation in latest Statement of Income is Computed
|
|||||||||||
|
Restaurant Property (1)
|
Location
|
Land
|
Buildings and Improvements
|
Equipment
|
Land
|
Building and Improvements
|
Equipment
|
Land
|
Building and Improvements
|
Equipment
|
Total
|
||||||
|
OG
|
Frederick, MD
|
638
|
1,276
|
79
|
—
|
787
|
344
|
638
|
2,063
|
423
|
3,124
|
1,606
|
1996
|
10/21/1996
|
2 - 40
|
||
|
OG
|
Westminster, MD
|
595
|
1,741
|
124
|
—
|
452
|
204
|
595
|
2,193
|
328
|
3,116
|
1,598
|
1998
|
4/20/1998
|
2 - 38
|
||
|
OG
|
Hyannis, MA
|
664
|
2,097
|
90
|
—
|
665
|
175
|
664
|
2,762
|
265
|
3,691
|
2,140
|
1997
|
11/17/1997
|
2 - 35
|
||
|
OG
|
Wyomissing, PA
|
963
|
1,926
|
109
|
—
|
498
|
206
|
963
|
2,424
|
315
|
3,702
|
1,838
|
1998
|
5/11/1998
|
2 - 38
|
||
|
OG
|
Eugene, OR
|
761
|
1,486
|
91
|
—
|
356
|
200
|
761
|
1,842
|
291
|
2,894
|
1,495
|
1998
|
5/11/1998
|
2 - 38
|
||
|
OG
|
Savannah, GA
|
952
|
1,781
|
189
|
—
|
660
|
147
|
952
|
2,441
|
336
|
3,729
|
1,720
|
2000
|
4/10/2000
|
2 - 35
|
||
|
OG
|
Mentor, OH
|
—
|
1,955
|
138
|
1,474
|
288
|
241
|
1,474
|
2,243
|
379
|
4,096
|
1,654
|
2000
|
5/22/2000
|
2 - 35
|
||
|
OG
|
Douglasville, GA
|
1,189
|
1,978
|
144
|
—
|
406
|
248
|
1,189
|
2,384
|
392
|
3,965
|
1,773
|
2000
|
5/1/2000
|
2 - 35
|
||
|
OG
|
Buford, GA
|
1,493
|
1,688
|
179
|
—
|
542
|
203
|
1,493
|
2,230
|
382
|
4,105
|
1,624
|
2000
|
5/22/2000
|
2 - 35
|
||
|
OG
|
Maple Grove, MN
|
807
|
1,924
|
176
|
—
|
227
|
124
|
807
|
2,151
|
300
|
3,258
|
1,517
|
2000
|
5/22/2000
|
2 - 35
|
||
|
OG
|
Olathe, KS
|
796
|
2,121
|
109
|
—
|
489
|
256
|
796
|
2,610
|
365
|
3,771
|
1,776
|
2001
|
3/12/2001
|
2 - 36
|
||
|
OG
|
Austin, TX
|
1,239
|
2,295
|
154
|
—
|
168
|
96
|
1,239
|
2,463
|
250
|
3,952
|
1,595
|
2002
|
9/3/2002
|
2 - 37
|
||
|
OG
|
Coeur D’Alene, ID
|
681
|
1,661
|
131
|
—
|
278
|
305
|
681
|
1,939
|
436
|
3,056
|
1,389
|
2001
|
1/29/2001
|
2 - 36
|
||
|
OG
|
Frisco, TX
|
1,029
|
2,038
|
139
|
—
|
279
|
218
|
1,029
|
2,317
|
357
|
3,703
|
1,695
|
2001
|
6/25/2001
|
2 - 36
|
||
|
OG
|
Bolingbrook, IL
|
1,006
|
2,424
|
147
|
—
|
253
|
129
|
1,006
|
2,677
|
276
|
3,959
|
1,795
|
2001
|
7/23/2001
|
2 - 36
|
||
|
OG
|
Muskegon, MI
|
691
|
1,704
|
168
|
—
|
108
|
41
|
691
|
1,812
|
209
|
2,712
|
1,236
|
2001
|
10/8/2001
|
2 - 36
|
||
|
OG
|
Memphis, TN
|
1,142
|
1,790
|
100
|
—
|
246
|
171
|
1,142
|
2,036
|
271
|
3,449
|
1,346
|
2001
|
10/8/2001
|
2 - 36
|
||
|
OG
|
Kennewick, WA
|
763
|
1,980
|
149
|
—
|
259
|
158
|
763
|
2,239
|
307
|
3,309
|
1,572
|
2001
|
5/14/2001
|
2 - 36
|
||
|
OG
|
Round Rock, TX
|
953
|
2,090
|
149
|
—
|
335
|
153
|
953
|
2,425
|
302
|
3,680
|
1,505
|
2002
|
3/25/2002
|
2 - 37
|
||
|
OG
|
Killeen, TX
|
806
|
1,705
|
187
|
—
|
322
|
118
|
806
|
2,027
|
305
|
3,138
|
1,458
|
2002
|
8/5/2002
|
2 - 37
|
||
|
OG
|
Los Angeles, CA
|
1,701
|
2,558
|
202
|
—
|
170
|
70
|
1,701
|
2,728
|
272
|
4,701
|
1,666
|
2003
|
3/24/2003
|
2 - 38
|
||
|
OG
|
Omaha, NE
|
1,202
|
1,778
|
120
|
—
|
217
|
147
|
1,202
|
1,995
|
267
|
3,464
|
1,304
|
2002
|
10/7/2002
|
2 - 37
|
||
|
OG
|
Bloomington, IN
|
947
|
1,747
|
150
|
—
|
419
|
94
|
947
|
2,166
|
244
|
3,357
|
1,372
|
2002
|
11/18/2002
|
2 - 37
|
||
|
OG
|
Dayton, OH
|
677
|
1,675
|
172
|
—
|
210
|
72
|
677
|
1,885
|
244
|
2,806
|
1,203
|
2003
|
5/1/2003
|
2 - 38
|
||
|
OG
|
Fayetteville, AR
|
849
|
1,845
|
160
|
—
|
138
|
79
|
849
|
1,983
|
239
|
3,071
|
1,288
|
2002
|
12/11/2002
|
2 - 37
|
||
|
OG
|
Oklahoma City, OK
|
925
|
2,053
|
158
|
—
|
128
|
43
|
925
|
2,181
|
201
|
3,307
|
1,270
|
2005
|
3/14/2005
|
2 - 40
|
||
|
OG
|
Lithonia, GA
|
1,403
|
1,872
|
174
|
—
|
306
|
122
|
1,403
|
2,178
|
296
|
3,877
|
1,371
|
2002
|
11/18/2002
|
2 - 37
|
||
|
OG
|
Rochester, MN
|
829
|
1,889
|
192
|
—
|
146
|
140
|
829
|
2,035
|
332
|
3,196
|
1,354
|
2002
|
12/16/2002
|
2 - 37
|
||
|
OG
|
Newport News, VA
|
796
|
1,989
|
172
|
—
|
88
|
63
|
796
|
2,077
|
235
|
3,108
|
1,322
|
2003
|
5/5/2003
|
2 - 38
|
||
|
OG
|
Albuquerque, NM
|
771
|
1,716
|
179
|
—
|
131
|
104
|
771
|
1,847
|
283
|
2,901
|
1,182
|
2003
|
5/19/2003
|
2 - 38
|
||
|
OG
|
Fort Gratiot, MI
|
604
|
2,246
|
186
|
—
|
132
|
57
|
604
|
2,378
|
243
|
3,225
|
1,426
|
2003
|
11/17/2003
|
2 - 38
|
||
|
OG
|
Denton, TX
|
869
|
1,946
|
177
|
—
|
182
|
94
|
869
|
2,128
|
271
|
3,268
|
1,423
|
2003
|
6/9/2003
|
2 - 38
|
||
|
OG
|
Lynchburg, VA
|
771
|
2,304
|
125
|
—
|
103
|
54
|
771
|
2,407
|
179
|
3,357
|
1,351
|
2004
|
2/16/2004
|
2 - 39
|
||
|
OG
|
Duluth, MN
|
886
|
2,043
|
173
|
—
|
123
|
58
|
886
|
2,166
|
231
|
3,283
|
1,321
|
2003
|
11/10/2003
|
2 - 38
|
||
F-40
|
FOUR CORNERS PROPERTY, TRUST, INC.
SCHEDULE III
SCHEDULE OF REAL EATATE ASSETS AND ACCUMULATED DEPRECIATION
DECEMBER 31, 2016
(Dollars in thousands)
|
|||||||||||||||||
|
Initial Cost to Company
|
Cost Capitalized Since Acquisition
|
Gross Carrying Value (2)
|
Accumulated Depreciation
|
Construction Date
|
Acquisition Date
|
Life on which Depreciation in latest Statement of Income is Computed
|
|||||||||||
|
Restaurant Property (1)
|
Location
|
Land
|
Buildings and Improvements
|
Equipment
|
Land
|
Building and Improvements
|
Equipment
|
Land
|
Building and Improvements
|
Equipment
|
Total
|
||||||
|
OG
|
Tucson, AZ
|
1,019
|
2,073
|
104
|
—
|
121
|
135
|
1,019
|
2,194
|
239
|
3,452
|
1,241
|
2004
|
9/20/2004
|
2 - 39
|
||
|
OG
|
Columbia, SC
|
1,119
|
2,175
|
161
|
—
|
110
|
85
|
1,119
|
2,285
|
246
|
3,650
|
1,295
|
2005
|
4/5/2005
|
2 - 40
|
||
|
OG
|
Visalia, CA
|
1,151
|
1,830
|
151
|
—
|
133
|
46
|
1,151
|
1,963
|
197
|
3,311
|
1,133
|
2004
|
3/15/2004
|
2 - 39
|
||
|
OG
|
San Antonio, TX
|
932
|
2,582
|
191
|
—
|
190
|
103
|
932
|
2,772
|
294
|
3,998
|
1,509
|
2005
|
6/27/2005
|
2 - 40
|
||
|
OG
|
Anderson, SC
|
903
|
1,841
|
133
|
—
|
181
|
111
|
903
|
2,022
|
244
|
3,169
|
1,258
|
2004
|
3/29/2004
|
2 - 39
|
||
|
OG
|
Lake Charles, LA
|
806
|
2,070
|
161
|
—
|
174
|
87
|
806
|
2,244
|
248
|
3,298
|
1,387
|
2004
|
4/5/2004
|
2 - 39
|
||
|
OG
|
Houma, LA
|
736
|
2,190
|
150
|
—
|
185
|
148
|
736
|
2,375
|
298
|
3,409
|
1,369
|
2005
|
2/14/2005
|
2 - 40
|
||
|
OG
|
Tupelo, MS
|
823
|
2,102
|
193
|
—
|
127
|
82
|
823
|
2,229
|
275
|
3,327
|
1,328
|
2005
|
1/31/2005
|
2 - 40
|
||
|
OG
|
Jackson, TN
|
874
|
1,964
|
151
|
—
|
175
|
36
|
874
|
2,139
|
187
|
3,200
|
1,214
|
2005
|
2/7/2005
|
2 - 40
|
||
|
OG
|
College Station, TX
|
581
|
2,236
|
173
|
—
|
42
|
44
|
581
|
2,278
|
217
|
3,076
|
1,354
|
2005
|
1/24/2005
|
2 - 40
|
||
|
OG
|
Newnan, GA
|
829
|
2,239
|
157
|
—
|
152
|
55
|
829
|
2,391
|
212
|
3,432
|
1,312
|
2005
|
5/23/2005
|
2 - 40
|
||
|
OG
|
Owensboro, KY
|
762
|
2,134
|
173
|
—
|
70
|
57
|
762
|
2,204
|
230
|
3,196
|
1,335
|
2005
|
5/23/2005
|
2 - 40
|
||
|
OG
|
Mesa, AZ
|
598
|
1,844
|
132
|
—
|
110
|
129
|
598
|
1,954
|
261
|
2,813
|
1,117
|
2005
|
10/3/2005
|
2 - 40
|
||
|
OG
|
Southaven, MS
|
1,048
|
2,209
|
158
|
—
|
117
|
50
|
1,048
|
2,326
|
208
|
3,582
|
1,230
|
2005
|
11/21/2005
|
2 - 40
|
||
|
OG
|
Yuma, AZ
|
842
|
2,037
|
160
|
—
|
62
|
87
|
842
|
2,099
|
247
|
3,188
|
1,131
|
2005
|
12/5/2005
|
2 - 40
|
||
|
OG
|
Oakdale, MN
|
956
|
2,355
|
185
|
—
|
30
|
35
|
956
|
2,385
|
220
|
3,561
|
1,297
|
2005
|
12/5/2005
|
2 - 40
|
||
|
OG
|
Garland, TX
|
903
|
2,271
|
156
|
—
|
115
|
94
|
903
|
2,386
|
250
|
3,539
|
1,364
|
2005
|
10/31/2005
|
2 - 40
|
||
|
OG
|
Tarentum, PA
|
1,119
|
2,482
|
148
|
—
|
179
|
47
|
1,119
|
2,661
|
195
|
3,975
|
1,321
|
2006
|
2/20/2006
|
2 - 41
|
||
|
OG
|
Texarkana, TX
|
871
|
2,279
|
151
|
—
|
90
|
87
|
871
|
2,369
|
238
|
3,478
|
1,292
|
2006
|
3/27/2006
|
2 - 41
|
||
|
OG
|
Hot Springs, AR
|
797
|
2,415
|
186
|
—
|
84
|
73
|
797
|
2,499
|
259
|
3,555
|
1,220
|
2006
|
10/23/2006
|
2 - 41
|
||
|
OG
|
Florence, SC
|
—
|
1,817
|
169
|
1,503
|
119
|
84
|
1,503
|
1,936
|
253
|
3,692
|
1,077
|
2006
|
8/21/2006
|
2 - 41
|
||
|
OG
|
Victoria, TX
|
782
|
2,327
|
240
|
—
|
39
|
30
|
782
|
2,366
|
270
|
3,418
|
1,281
|
2007
|
1/15/2007
|
2 - 42
|
||
|
OG
|
Dothan, AL
|
850
|
2,242
|
131
|
—
|
62
|
92
|
850
|
2,304
|
223
|
3,377
|
1,166
|
2006
|
8/28/2006
|
2 - 41
|
||
|
OG
|
San Angelo, TX
|
360
|
2,020
|
157
|
—
|
74
|
104
|
360
|
2,094
|
261
|
2,715
|
1,158
|
2006
|
9/11/2006
|
2 - 41
|
||
|
OG
|
New Braunfels, TX
|
1,049
|
2,162
|
147
|
—
|
32
|
83
|
1,049
|
2,194
|
230
|
3,473
|
1,124
|
2006
|
9/25/2006
|
2 - 41
|
||
|
OG
|
Grove City, OH
|
1,200
|
2,271
|
140
|
—
|
63
|
55
|
1,200
|
2,334
|
195
|
3,729
|
1,184
|
2006
|
9/25/2006
|
2 - 41
|
||
|
OG
|
Opelika, AL
|
878
|
2,255
|
154
|
—
|
54
|
43
|
878
|
2,309
|
197
|
3,384
|
1,156
|
2006
|
11/13/2006
|
2 - 41
|
||
|
OG
|
West Wichita, KS
|
1,227
|
1,801
|
154
|
—
|
84
|
86
|
1,227
|
1,885
|
240
|
3,352
|
943
|
2006
|
11/6/2006
|
2 - 41
|
||
|
OG
|
Pueblo, CO
|
770
|
2,330
|
212
|
—
|
51
|
76
|
770
|
2,381
|
288
|
3,439
|
1,259
|
2007
|
2/5/2007
|
2 - 42
|
||
|
OG
|
Sioux City, IA
|
1,304
|
2,114
|
137
|
—
|
89
|
99
|
1,304
|
2,203
|
236
|
3,743
|
1,125
|
2006
|
12/11/2006
|
2 - 41
|
||
|
OG
|
Detroit, MI
|
1,400
|
2,956
|
234
|
—
|
81
|
87
|
1,400
|
3,037
|
321
|
4,758
|
1,381
|
2007
|
5/21/2007
|
2 - 42
|
||
|
OG
|
Phoenix, AZ
|
753
|
2,153
|
246
|
—
|
97
|
72
|
753
|
2,250
|
318
|
3,321
|
1,211
|
2007
|
4/23/2007
|
2 - 42
|
||
|
OG
|
Jacksonville, NC
|
1,174
|
2,287
|
239
|
—
|
32
|
81
|
1,174
|
2,319
|
320
|
3,813
|
1,201
|
2007
|
11/19/2007
|
2 - 42
|
||
|
OG
|
Columbus, OH
|
995
|
2,286
|
184
|
—
|
61
|
27
|
995
|
2,347
|
211
|
3,553
|
1,087
|
2007
|
12/17/2007
|
2 - 42
|
||
F-41
|
FOUR CORNERS PROPERTY, TRUST, INC.
SCHEDULE III
SCHEDULE OF REAL EATATE ASSETS AND ACCUMULATED DEPRECIATION
DECEMBER 31, 2016
(Dollars in thousands)
|
|||||||||||||||||
|
Initial Cost to Company
|
Cost Capitalized Since Acquisition
|
Gross Carrying Value (2)
|
Accumulated Depreciation
|
Construction Date
|
Acquisition Date
|
Life on which Depreciation in latest Statement of Income is Computed
|
|||||||||||
|
Restaurant Property (1)
|
Location
|
Land
|
Buildings and Improvements
|
Equipment
|
Land
|
Building and Improvements
|
Equipment
|
Land
|
Building and Improvements
|
Equipment
|
Total
|
||||||
|
OG
|
Mount Juliet, TN
|
873
|
2,294
|
212
|
—
|
76
|
47
|
873
|
2,370
|
259
|
3,502
|
1,188
|
2007
|
10/22/2007
|
2 - 42
|
||
|
OG
|
Triadelphia, WV
|
970
|
2,342
|
225
|
—
|
58
|
76
|
970
|
2,400
|
301
|
3,671
|
1,193
|
2007
|
12/17/2007
|
2 - 42
|
||
|
OG
|
Reynoldsburg, OH
|
1,208
|
2,183
|
242
|
—
|
48
|
37
|
1,208
|
2,231
|
279
|
3,718
|
1,088
|
2008
|
4/21/2008
|
2 - 43
|
||
|
OG
|
Florence, KY
|
1,007
|
2,099
|
155
|
—
|
52
|
88
|
1,007
|
2,151
|
243
|
3,401
|
1,062
|
2008
|
8/4/2008
|
2 - 43
|
||
|
OG
|
Cincinnati, OH
|
1,072
|
2,170
|
236
|
—
|
57
|
43
|
1,072
|
2,227
|
279
|
3,578
|
1,108
|
2008
|
4/28/2008
|
2 - 43
|
||
|
OG
|
Bismarck, ND
|
1,156
|
2,319
|
263
|
—
|
31
|
38
|
1,156
|
2,350
|
301
|
3,807
|
1,110
|
2008
|
11/24/2008
|
2 - 43
|
||
|
OG
|
Spring Hill, TN
|
1,295
|
2,269
|
228
|
—
|
29
|
45
|
1,295
|
2,298
|
273
|
3,866
|
992
|
2009
|
2/16/2009
|
2 - 44
|
||
|
OG
|
San Antonio, TX
|
1,359
|
2,492
|
230
|
—
|
23
|
33
|
1,359
|
2,515
|
263
|
4,137
|
1,029
|
2009
|
3/30/2009
|
2 - 44
|
||
|
OG
|
Michigan City, IN
|
762
|
2,646
|
238
|
—
|
17
|
39
|
762
|
2,663
|
277
|
3,702
|
1,086
|
2009
|
7/13/2009
|
2 - 44
|
||
|
OG
|
Broken Arrow, OK
|
1,461
|
2,261
|
231
|
—
|
73
|
57
|
1,461
|
2,334
|
288
|
4,083
|
980
|
2009
|
5/25/2009
|
2 - 44
|
||
|
OG
|
Bossier City, LA
|
1,006
|
2,405
|
264
|
—
|
51
|
32
|
1,006
|
2,456
|
296
|
3,758
|
991
|
2009
|
7/27/2009
|
2 - 44
|
||
|
OG
|
Jacksonville, FL
|
1,006
|
2,001
|
263
|
—
|
21
|
30
|
1,006
|
2,022
|
293
|
3,321
|
859
|
2009
|
10/5/2009
|
2 - 44
|
||
|
OG
|
Richmond, KY
|
1,054
|
1,974
|
236
|
—
|
14
|
32
|
1,054
|
1,988
|
268
|
3,310
|
848
|
2009
|
9/14/2009
|
2 - 44
|
||
|
OG
|
Ankeny, IA
|
704
|
2,218
|
248
|
—
|
9
|
17
|
704
|
2,227
|
265
|
3,196
|
766
|
2011
|
1/10/2011
|
2 - 46
|
||
|
OG
|
Kingsport, TN
|
1,071
|
1,840
|
282
|
—
|
11
|
22
|
1,071
|
1,851
|
304
|
3,226
|
713
|
2010
|
5/3/2010
|
2 - 45
|
||
|
OG
|
Las Cruces, NM
|
839
|
2,201
|
297
|
—
|
15
|
34
|
839
|
2,216
|
331
|
3,386
|
863
|
2010
|
5/10/2010
|
2 - 45
|
||
|
OG
|
Manhattan, KS
|
791
|
2,253
|
237
|
—
|
33
|
69
|
791
|
2,286
|
306
|
3,383
|
914
|
2010
|
4/26/2010
|
2 - 45
|
||
|
OG
|
Pleasant Prairie, WI
|
1,101
|
2,134
|
303
|
—
|
36
|
—
|
1,101
|
2,170
|
303
|
3,574
|
807
|
2010
|
9/27/2010
|
2 - 45
|
||
|
OG
|
Morehead City, NC
|
853
|
1,864
|
315
|
—
|
62
|
23
|
853
|
1,926
|
338
|
3,117
|
782
|
2010
|
7/19/2010
|
2 - 45
|
||
|
OG
|
Louisville, KY
|
—
|
2,072
|
266
|
904
|
12
|
38
|
904
|
2,084
|
304
|
3,292
|
819
|
2010
|
11/1/2010
|
2 - 45
|
||
|
OG
|
Wilson, NC
|
528
|
1,948
|
268
|
—
|
24
|
29
|
528
|
1,972
|
297
|
2,797
|
760
|
2010
|
10/11/2010
|
2 - 45
|
||
|
OG
|
Council Bluffs, IA
|
955
|
2,051
|
254
|
—
|
4
|
32
|
955
|
2,055
|
286
|
3,296
|
748
|
2010
|
10/25/2010
|
2 - 45
|
||
|
OG
|
Queen Creek, AZ
|
875
|
2,377
|
307
|
—
|
30
|
(1)
|
875
|
2,407
|
306
|
3,588
|
742
|
2011
|
1/10/2011
|
2 - 46
|
||
|
OG
|
Utica, NY
|
908
|
2,728
|
362
|
—
|
(470)
|
—
|
908
|
2,258
|
362
|
3,528
|
513
|
2013
|
8/12/2013
|
2 - 48
|
||
|
OG
|
Niagara Falls, NY
|
1,057
|
2,187
|
327
|
—
|
38
|
15
|
1,057
|
2,225
|
342
|
3,624
|
725
|
2011
|
9/19/2011
|
2 - 46
|
||
|
OG
|
Gainesville, GA
|
985
|
1,915
|
274
|
—
|
—
|
5
|
985
|
1,915
|
279
|
3,179
|
637
|
2011
|
6/20/2011
|
2 - 46
|
||
|
OG
|
Cleveland, TN
|
962
|
1,941
|
324
|
—
|
14
|
6
|
962
|
1,955
|
330
|
3,247
|
654
|
2011
|
11/28/2011
|
2 - 46
|
||
|
OG
|
Katy, TX
|
1,602
|
2,170
|
285
|
—
|
—
|
5
|
1,602
|
2,170
|
290
|
4,062
|
632
|
2012
|
4/9/2012
|
2 - 47
|
||
|
OG
|
Beckley, WV
|
1,013
|
2,105
|
314
|
—
|
25
|
1
|
1,013
|
2,130
|
315
|
3,458
|
551
|
2012
|
10/1/2012
|
2 - 47
|
||
|
OG
|
Chicago, IL
|
942
|
2,626
|
337
|
—
|
(484)
|
—
|
942
|
2,142
|
337
|
3,421
|
736
|
2012
|
3/26/2012
|
2 - 47
|
||
|
OG
|
Oklahoma City, OK
|
1,204
|
2,370
|
403
|
—
|
(221)
|
—
|
1,204
|
2,149
|
403
|
3,756
|
527
|
2013
|
4/29/2013
|
2 - 48
|
||
F-42
|
FOUR CORNERS PROPERTY, TRUST, INC.
SCHEDULE III
SCHEDULE OF REAL EATATE ASSETS AND ACCUMULATED DEPRECIATION
DECEMBER 31, 2016
(Dollars in thousands)
|
|||||||||||||||||
|
Initial Cost to Company
|
Cost Capitalized Since Acquisition
|
Gross Carrying Value (2)
|
Accumulated Depreciation
|
Construction Date
|
Acquisition Date
|
Life on which Depreciation in latest Statement of Income is Computed
|
|||||||||||
|
Restaurant Property (1)
|
Location
|
Land
|
Buildings and Improvements
|
Equipment
|
Land
|
Building and Improvements
|
Equipment
|
Land
|
Building and Improvements
|
Equipment
|
Total
|
||||||
|
OG
|
Columbus, OH
|
954
|
2,236
|
324
|
—
|
4
|
—
|
954
|
2,240
|
324
|
3,518
|
493
|
2013
|
3/18/2013
|
2 - 48
|
||
|
BB
|
Orlando, FL
|
2,356
|
2,453
|
62
|
—
|
2,691
|
750
|
2,356
|
5,144
|
812
|
8,312
|
3,523
|
1996
|
2/19/1996
|
2 - 49
|
||
|
BB
|
Raleigh, NC
|
2,507
|
3,230
|
155
|
—
|
918
|
314
|
2,507
|
4,148
|
469
|
7,124
|
2,866
|
1999
|
5/17/1999
|
2 - 38
|
||
|
BB
|
Duluth, GA
|
2,006
|
2,362
|
254
|
—
|
1,378
|
274
|
2,006
|
3,740
|
528
|
6,274
|
2,797
|
1999
|
5/24/1999
|
2 - 38
|
||
|
BB
|
Miami, FL
|
1,731
|
3,427
|
222
|
—
|
1,162
|
422
|
1,731
|
4,589
|
644
|
6,964
|
3,038
|
2000
|
4/4/2000
|
2 - 35
|
||
|
BB
|
Fort Myers, FL
|
1,914
|
2,863
|
186
|
—
|
916
|
398
|
1,914
|
3,779
|
584
|
6,277
|
2,379
|
2000
|
5/16/2000
|
2 - 35
|
||
|
BB
|
Pembroke Pines, FL
|
1,808
|
2,999
|
207
|
—
|
1,039
|
382
|
1,808
|
4,038
|
589
|
6,435
|
2,488
|
2000
|
12/18/2000
|
2 - 35
|
||
|
BB
|
Livonia, MI
|
2,105
|
3,856
|
286
|
—
|
362
|
138
|
2,105
|
4,218
|
424
|
6,747
|
2,852
|
2001
|
2/6/2001
|
2 - 36
|
||
|
BB
|
Sunrise, FL
|
1,515
|
3,251
|
138
|
—
|
450
|
224
|
1,515
|
3,701
|
362
|
5,578
|
2,104
|
2002
|
10/22/2002
|
2 - 37
|
||
|
BB
|
Jacksonville, FL
|
2,235
|
2,295
|
344
|
—
|
50
|
13
|
2,235
|
2,345
|
357
|
4,937
|
948
|
2010
|
3/29/2010
|
2 - 45
|
||
|
BB
|
Orlando, FL
|
1,659
|
2,340
|
356
|
—
|
324
|
41
|
1,659
|
2,664
|
397
|
4,720
|
727
|
2012
|
2/27/2012
|
2 - 47
|
||
|
S52
|
Naples, FL
|
2,912
|
3,619
|
447
|
—
|
7
|
37
|
2,912
|
3,626
|
484
|
7,022
|
1,152
|
2011
|
10/10/2011
|
2 - 46
|
||
|
S52
|
Jacksonville, FL
|
2,216
|
2,729
|
416
|
—
|
6
|
3
|
2,216
|
2,735
|
419
|
5,370
|
919
|
2011
|
10/24/2011
|
2 - 46
|
||
|
LH
|
Tucker, GA
|
1,407
|
923
|
10
|
—
|
339
|
214
|
1,407
|
1,262
|
224
|
2,893
|
919
|
1986
|
10/1/2007
|
2 - 43
|
||
|
LH
|
Snellville, GA
|
1,911
|
925
|
76
|
—
|
422
|
147
|
1,911
|
1,347
|
223
|
3,481
|
948
|
1992
|
10/1/2007
|
2 - 43
|
||
|
LH
|
Macon, GA
|
1,249
|
718
|
30
|
—
|
420
|
204
|
1,249
|
1,138
|
234
|
2,621
|
989
|
1992
|
10/1/2007
|
2 - 44
|
||
|
LH
|
Augusta, GA
|
1,631
|
845
|
46
|
—
|
300
|
103
|
1,631
|
1,145
|
149
|
2,925
|
883
|
1993
|
10/1/2007
|
2 - 42
|
||
|
LH
|
Ocala, FL
|
1,210
|
1,100
|
17
|
—
|
579
|
112
|
1,210
|
1,679
|
129
|
3,018
|
1,284
|
1993
|
10/1/2007
|
2 - 42
|
||
|
LH
|
Altamonte Springs, FL
|
1,649
|
974
|
22
|
—
|
450
|
135
|
1,649
|
1,424
|
157
|
3,230
|
890
|
1994
|
10/1/2007
|
2 - 44
|
||
|
LH
|
Florence, KY
|
—
|
741
|
52
|
1,191
|
347
|
165
|
1,191
|
1,088
|
217
|
2,496
|
749
|
1994
|
10/1/2007
|
2 - 47
|
||
|
LH
|
Gainesville, GA
|
1,537
|
965
|
19
|
—
|
348
|
140
|
1,537
|
1,313
|
159
|
3,009
|
893
|
1995
|
10/1/2007
|
2 - 43
|
||
|
LH
|
Peachtree City, GA
|
1,485
|
1,080
|
9
|
—
|
457
|
159
|
1,485
|
1,537
|
168
|
3,190
|
1,037
|
1995
|
10/1/2007
|
2 - 43
|
||
|
LH
|
Lawrenceville, GA
|
1,865
|
1,116
|
17
|
—
|
451
|
117
|
1,865
|
1,567
|
134
|
3,566
|
979
|
1996
|
10/1/2007
|
2 - 42
|
||
|
LH
|
Jensen Beach, FL
|
1,322
|
1,082
|
33
|
—
|
347
|
153
|
1,322
|
1,429
|
186
|
2,937
|
965
|
1996
|
10/1/2007
|
2 - 42
|
||
|
LH
|
Destin, FL
|
2,053
|
793
|
16
|
—
|
357
|
224
|
2,053
|
1,150
|
240
|
3,443
|
841
|
1996
|
10/1/2007
|
2 - 42
|
||
|
LH
|
Albany, GA
|
1,500
|
988
|
34
|
—
|
422
|
126
|
1,500
|
1,410
|
160
|
3,070
|
852
|
1997
|
10/1/2007
|
2 - 42
|
||
|
LH
|
Dublin, OH
|
1,572
|
1,205
|
18
|
—
|
510
|
259
|
1,572
|
1,715
|
277
|
3,564
|
1,029
|
1997
|
10/1/2007
|
2 - 42
|
||
|
LH
|
Columbia, SC
|
1,677
|
1,291
|
23
|
—
|
495
|
176
|
1,677
|
1,786
|
199
|
3,662
|
1,088
|
1997
|
10/1/2007
|
2 - 42
|
||
|
LH
|
Pineville, NC
|
1,262
|
879
|
11
|
—
|
495
|
195
|
1,262
|
1,374
|
206
|
2,842
|
803
|
1998
|
10/1/2007
|
2 - 44
|
||
|
LH
|
Johns Creek, GA
|
1,694
|
1,089
|
18
|
—
|
203
|
123
|
1,694
|
1,292
|
141
|
3,127
|
760
|
1998
|
10/1/2007
|
2 - 42
|
||
|
LH
|
Greensboro, NC
|
1,438
|
1,017
|
16
|
—
|
270
|
152
|
1,438
|
1,287
|
168
|
2,893
|
694
|
1999
|
10/1/2007
|
2 - 44
|
||
|
LH
|
Huntsville, AL
|
1,443
|
983
|
7
|
—
|
350
|
194
|
1,443
|
1,333
|
201
|
2,977
|
719
|
1999
|
10/1/2007
|
2 - 44
|
||
|
LH
|
Hickory, NC
|
1,333
|
1,029
|
7
|
—
|
313
|
166
|
1,333
|
1,342
|
173
|
2,848
|
667
|
1999
|
10/1/2007
|
2 - 44
|
||
|
LH
|
Tampa, FL
|
1,488
|
1,078
|
6
|
—
|
297
|
189
|
1,488
|
1,375
|
195
|
3,058
|
813
|
2000
|
10/1/2007
|
2 - 35
|
||
F-43
|
FOUR CORNERS PROPERTY, TRUST, INC.
SCHEDULE III
SCHEDULE OF REAL EATATE ASSETS AND ACCUMULATED DEPRECIATION
DECEMBER 31, 2016
(Dollars in thousands)
|
|||||||||||||||||
|
Initial Cost to Company
|
Cost Capitalized Since Acquisition
|
Gross Carrying Value (2)
|
Accumulated Depreciation
|
Construction Date
|
Acquisition Date
|
Life on which Depreciation in latest Statement of Income is Computed
|
|||||||||||
|
Restaurant Property (1)
|
Location
|
Land
|
Buildings and Improvements
|
Equipment
|
Land
|
Building and Improvements
|
Equipment
|
Land
|
Building and Improvements
|
Equipment
|
Total
|
||||||
|
LH
|
Clarksville, TN
|
1,662
|
1,097
|
15
|
—
|
449
|
112
|
1,662
|
1,546
|
127
|
3,335
|
754
|
1999
|
10/1/2007
|
2 - 43
|
||
|
LH
|
Orlando, FL
|
1,165
|
749
|
21
|
—
|
264
|
137
|
1,165
|
1,013
|
158
|
2,336
|
599
|
2000
|
10/1/2007
|
2 - 35
|
||
|
LH
|
Concord, NH
|
1,329
|
935
|
7
|
—
|
359
|
172
|
1,329
|
1,294
|
179
|
2,802
|
582
|
2000
|
10/1/2007
|
2 - 35
|
||
|
LH
|
Orlando, FL
|
1,492
|
1,277
|
52
|
—
|
297
|
150
|
1,492
|
1,574
|
202
|
3,268
|
801
|
2000
|
10/1/2007
|
2 - 35
|
||
|
LH
|
Medina, OH
|
1,189
|
820
|
12
|
—
|
268
|
168
|
1,189
|
1,088
|
180
|
2,457
|
574
|
2000
|
10/1/2007
|
2 - 35
|
||
|
LH
|
Hoover, AL
|
1,401
|
966
|
17
|
—
|
350
|
160
|
1,401
|
1,316
|
177
|
2,894
|
683
|
2001
|
10/1/2007
|
2 - 36
|
||
|
LH
|
Boardman, OH
|
954
|
673
|
17
|
—
|
285
|
151
|
954
|
958
|
168
|
2,080
|
484
|
2001
|
10/1/2007
|
2 - 36
|
||
|
LH
|
Prattville, AL
|
1,481
|
1,016
|
27
|
—
|
336
|
134
|
1,481
|
1,352
|
161
|
2,994
|
690
|
2001
|
10/1/2007
|
2 - 36
|
||
|
LH
|
Bensalem, PA
|
1,645
|
600
|
17
|
—
|
346
|
160
|
1,645
|
946
|
177
|
2,768
|
475
|
2001
|
10/1/2007
|
2 - 36
|
||
|
LH
|
Lee’s Summit, MO
|
1,705
|
1,219
|
34
|
—
|
285
|
88
|
1,705
|
1,504
|
122
|
3,331
|
654
|
2002
|
10/1/2007
|
2 - 37
|
||
|
LH
|
Germantown, MD
|
1,439
|
1,069
|
27
|
—
|
306
|
138
|
1,439
|
1,375
|
165
|
2,979
|
684
|
2002
|
10/1/2007
|
2 - 37
|
||
|
LH
|
Independence, OH
|
1,241
|
686
|
26
|
—
|
231
|
106
|
1,241
|
917
|
132
|
2,290
|
445
|
2002
|
10/1/2007
|
2 - 37
|
||
|
LH
|
Hiram, GA
|
1,639
|
1,033
|
25
|
—
|
374
|
130
|
1,639
|
1,407
|
155
|
3,201
|
677
|
2002
|
10/1/2007
|
2 - 37
|
||
|
LH
|
Louisville, KY
|
1,405
|
980
|
18
|
—
|
238
|
113
|
1,405
|
1,218
|
131
|
2,754
|
550
|
2002
|
10/1/2007
|
2 - 37
|
||
|
LH
|
Bowie, MD
|
1,871
|
1,230
|
21
|
—
|
257
|
147
|
1,871
|
1,487
|
168
|
3,526
|
682
|
2002
|
10/1/2007
|
2 - 37
|
||
|
LH
|
Waldorf, MD
|
1,929
|
1,167
|
26
|
—
|
245
|
162
|
1,929
|
1,412
|
188
|
3,529
|
667
|
2002
|
10/1/2007
|
2 - 37
|
||
|
LH
|
West Palm Beach, FL
|
1,781
|
1,228
|
27
|
—
|
297
|
132
|
1,781
|
1,525
|
159
|
3,465
|
692
|
2002
|
10/1/2007
|
2 - 37
|
||
|
LH
|
Columbia, MD
|
1,918
|
1,439
|
40
|
—
|
268
|
161
|
1,918
|
1,707
|
201
|
3,826
|
774
|
2003
|
10/1/2007
|
2 - 38
|
||
|
LH
|
East Point, GA
|
1,052
|
1,232
|
21
|
—
|
291
|
143
|
1,052
|
1,523
|
164
|
2,739
|
710
|
2003
|
10/1/2007
|
2 - 38
|
||
|
LH
|
Lexington, KY
|
1,251
|
874
|
16
|
—
|
238
|
162
|
1,251
|
1,112
|
178
|
2,541
|
557
|
2003
|
10/1/2007
|
2 - 42
|
||
|
LH
|
Winter Haven, FL
|
1,285
|
1,149
|
39
|
—
|
276
|
124
|
1,285
|
1,425
|
163
|
2,873
|
655
|
2003
|
10/1/2007
|
2 - 38
|
||
|
LH
|
Jacksonville, FL
|
795
|
1,302
|
32
|
—
|
210
|
128
|
795
|
1,512
|
160
|
2,467
|
670
|
2003
|
10/1/2007
|
2 - 38
|
||
|
LH
|
Daphne, AL
|
1,130
|
757
|
30
|
—
|
308
|
111
|
1,130
|
1,065
|
141
|
2,336
|
573
|
2003
|
10/1/2007
|
2 - 38
|
||
|
LH
|
Anderson, SC
|
1,445
|
990
|
41
|
—
|
240
|
111
|
1,445
|
1,230
|
152
|
2,827
|
582
|
2004
|
10/1/2007
|
2 - 39
|
||
|
LH
|
Palm Harbor, FL
|
1,406
|
917
|
32
|
—
|
263
|
93
|
1,406
|
1,180
|
125
|
2,711
|
596
|
2004
|
10/1/2007
|
2 - 39
|
||
|
LH
|
West Chester, OH
|
1,371
|
927
|
31
|
—
|
248
|
79
|
1,371
|
1,175
|
110
|
2,656
|
574
|
2004
|
10/1/2007
|
2 - 39
|
||
|
LH
|
Jefferson City, MO
|
1,342
|
875
|
60
|
—
|
196
|
68
|
1,342
|
1,071
|
128
|
2,541
|
518
|
2004
|
10/1/2007
|
2 - 39
|
||
|
LH
|
Chantilly, VA
|
1,568
|
882
|
50
|
—
|
262
|
66
|
1,568
|
1,144
|
116
|
2,828
|
520
|
2004
|
10/1/2007
|
2 - 39
|
||
|
LH
|
Dawsonville, GA
|
1,084
|
1,321
|
51
|
—
|
188
|
100
|
1,084
|
1,509
|
151
|
2,744
|
668
|
2004
|
10/1/2007
|
2 - 39
|
||
|
LH
|
Opelika, AL
|
1,427
|
1,244
|
36
|
—
|
202
|
58
|
1,427
|
1,446
|
94
|
2,967
|
660
|
2004
|
10/1/2007
|
2 - 39
|
||
|
LH
|
Indianapolis, IN
|
1,298
|
854
|
55
|
—
|
211
|
51
|
1,298
|
1,065
|
106
|
2,469
|
526
|
2005
|
10/1/2007
|
2 - 40
|
||
|
LH
|
Grove City, OH
|
1,566
|
1,067
|
53
|
—
|
191
|
61
|
1,566
|
1,258
|
114
|
2,938
|
581
|
2005
|
10/1/2007
|
2 - 40
|
||
|
LH
|
Springfield, IL
|
1,573
|
1,451
|
65
|
—
|
182
|
79
|
1,573
|
1,633
|
144
|
3,350
|
747
|
2005
|
10/1/2007
|
2 - 40
|
||
|
LH
|
Covington, GA
|
887
|
1,212
|
70
|
—
|
45
|
49
|
887
|
1,257
|
119
|
2,263
|
570
|
2005
|
10/1/2007
|
2 - 40
|
||
F-44
|
FOUR CORNERS PROPERTY, TRUST, INC.
SCHEDULE III
SCHEDULE OF REAL EATATE ASSETS AND ACCUMULATED DEPRECIATION
DECEMBER 31, 2016
(Dollars in thousands)
|
|||||||||||||||||
|
Initial Cost to Company
|
Cost Capitalized Since Acquisition
|
Gross Carrying Value (2)
|
Accumulated Depreciation
|
Construction Date
|
Acquisition Date
|
Life on which Depreciation in latest Statement of Income is Computed
|
|||||||||||
|
Restaurant Property (1)
|
Location
|
Land
|
Buildings and Improvements
|
Equipment
|
Land
|
Building and Improvements
|
Equipment
|
Land
|
Building and Improvements
|
Equipment
|
Total
|
||||||
|
LH
|
West Homestead, PA
|
1,418
|
947
|
79
|
—
|
33
|
91
|
1,418
|
980
|
170
|
2,568
|
474
|
2005
|
10/1/2007
|
2 - 40
|
||
|
LH
|
Carrollton, GA
|
1,192
|
1,227
|
75
|
—
|
15
|
49
|
1,192
|
1,242
|
124
|
2,558
|
582
|
2005
|
10/1/2007
|
2 - 40
|
||
|
LH
|
Tarentum, PA
|
1,414
|
931
|
91
|
—
|
84
|
46
|
1,414
|
1,015
|
137
|
2,566
|
494
|
2005
|
10/1/2007
|
2 - 40
|
||
|
LH
|
Commerce, GA
|
1,335
|
1,466
|
65
|
—
|
57
|
84
|
1,335
|
1,523
|
149
|
3,007
|
628
|
2006
|
10/1/2007
|
2 - 41
|
||
|
LH
|
East Ellijay, GA
|
1,126
|
1,272
|
70
|
—
|
21
|
82
|
1,126
|
1,293
|
152
|
2,571
|
588
|
2006
|
10/1/2007
|
2 - 41
|
||
|
LH
|
Acworth, GA
|
1,941
|
1,255
|
70
|
—
|
23
|
82
|
1,941
|
1,278
|
152
|
3,371
|
565
|
2006
|
10/1/2007
|
2 - 41
|
||
|
LH
|
Peoria, IL
|
1,299
|
848
|
81
|
—
|
143
|
46
|
1,299
|
991
|
127
|
2,417
|
503
|
2006
|
10/1/2007
|
2 - 41
|
||
|
LH
|
Hixson, TN
|
1,676
|
1,263
|
84
|
—
|
40
|
44
|
1,676
|
1,303
|
128
|
3,107
|
574
|
2006
|
10/1/2007
|
2 - 41
|
||
|
LH
|
Fredericksburg, VA
|
1,734
|
1,174
|
89
|
—
|
42
|
35
|
1,734
|
1,216
|
124
|
3,074
|
603
|
2006
|
10/1/2007
|
2 - 41
|
||
|
LH
|
Morgantown, WV
|
1,223
|
812
|
89
|
—
|
27
|
44
|
1,223
|
839
|
133
|
2,195
|
458
|
2006
|
10/1/2007
|
2 - 41
|
||
|
LH
|
Florence, SC
|
1,628
|
1,352
|
90
|
—
|
28
|
35
|
1,628
|
1,380
|
125
|
3,133
|
568
|
2006
|
10/1/2007
|
2 - 41
|
||
|
LH
|
Portage, IN
|
901
|
1,652
|
105
|
—
|
59
|
26
|
901
|
1,711
|
131
|
2,743
|
707
|
2006
|
10/1/2007
|
2 - 41
|
||
|
LH
|
Macon, GA
|
1,052
|
1,840
|
97
|
—
|
135
|
38
|
1,052
|
1,975
|
135
|
3,162
|
852
|
2007
|
10/1/2007
|
2 - 42
|
||
|
LH
|
Panama City Beach, FL
|
1,379
|
1,736
|
99
|
—
|
47
|
95
|
1,379
|
1,783
|
194
|
3,356
|
818
|
2007
|
10/1/2007
|
2 - 42
|
||
|
LH
|
LaGrange, GA
|
979
|
1,527
|
111
|
—
|
36
|
52
|
979
|
1,563
|
163
|
2,705
|
719
|
2007
|
10/1/2007
|
2 - 42
|
||
|
LH
|
Calhoun, GA
|
765
|
1,760
|
109
|
—
|
(4)
|
36
|
765
|
1,756
|
145
|
2,666
|
770
|
2007
|
10/1/2007
|
2 - 42
|
||
|
LH
|
Dublin, GA
|
389
|
1,910
|
140
|
—
|
27
|
23
|
389
|
1,937
|
163
|
2,489
|
764
|
2008
|
1/14/2008
|
2 - 43
|
||
|
LH
|
Monroe, GA
|
966
|
1,549
|
164
|
—
|
30
|
13
|
966
|
1,579
|
177
|
2,722
|
652
|
2008
|
4/28/2008
|
2 - 43
|
||
|
LH
|
Denham Springs, LA
|
1,306
|
2,049
|
283
|
—
|
35
|
12
|
1,306
|
2,084
|
295
|
3,685
|
1,041
|
2008
|
8/25/2008
|
2 - 43
|
||
|
LH
|
Cornelia, GA
|
106
|
1,542
|
281
|
282
|
52
|
8
|
388
|
1,594
|
289
|
2,271
|
782
|
2008
|
12/1/2008
|
2 - 43
|
||
|
LH
|
Richmond, VA
|
1,442
|
1,758
|
207
|
—
|
24
|
9
|
1,442
|
1,782
|
216
|
3,440
|
771
|
2009
|
2/23/2009
|
2 - 44
|
||
|
LH
|
Hanover, MD
|
1,437
|
2,258
|
252
|
—
|
45
|
2
|
1,437
|
2,303
|
254
|
3,994
|
675
|
2011
|
5/16/2011
|
2 - 46
|
||
|
LH
|
Orlando, FL
|
1,406
|
1,701
|
253
|
—
|
23
|
6
|
1,406
|
1,724
|
259
|
3,389
|
649
|
2010
|
3/8/2010
|
2 - 45
|
||
|
LH
|
San Antonio, TX
|
907
|
1,504
|
—
|
—
|
698
|
758
|
907
|
2,202
|
758
|
3,867
|
1,155
|
2010
|
1/18/2010
|
2 - 40
|
||
|
LH
|
Conyers, GA
|
589
|
1,797
|
198
|
—
|
30
|
21
|
589
|
1,827
|
219
|
2,635
|
672
|
2010
|
8/2/2010
|
2 - 45
|
||
|
LH
|
San Antonio, TX
|
1,206
|
1,583
|
—
|
—
|
245
|
754
|
1,206
|
1,828
|
754
|
3,788
|
1,049
|
2010
|
7/5/2010
|
2 - 40
|
||
|
LH
|
Thomasville, GA
|
730
|
1,688
|
229
|
—
|
19
|
5
|
730
|
1,707
|
234
|
2,671
|
684
|
2010
|
4/19/2010
|
2 - 45
|
||
|
LH
|
San Antonio, TX
|
947
|
1,436
|
—
|
—
|
444
|
811
|
947
|
1,880
|
811
|
3,638
|
1,119
|
2010
|
5/10/2010
|
2 - 40
|
||
|
LH
|
Whitehall, PA
|
1,307
|
1,901
|
270
|
—
|
24
|
7
|
1,307
|
1,925
|
277
|
3,509
|
689
|
2010
|
12/6/2010
|
2 - 45
|
||
|
LH
|
Fort Smith, AR
|
953
|
1,610
|
252
|
—
|
23
|
10
|
953
|
1,633
|
262
|
2,848
|
620
|
2010
|
11/1/2010
|
2 - 45
|
||
F-45
|
FOUR CORNERS PROPERTY, TRUST, INC.
SCHEDULE III
SCHEDULE OF REAL EATATE ASSETS AND ACCUMULATED DEPRECIATION
DECEMBER 31, 2016
(Dollars in thousands)
|
|||||||||||||||||
|
Initial Cost to Company
|
Cost Capitalized Since Acquisition
|
Gross Carrying Value (2)
|
Accumulated Depreciation
|
Construction Date
|
Acquisition Date
|
Life on which Depreciation in latest Statement of Income is Computed
|
|||||||||||
|
Restaurant Property (1)
|
Location
|
Land
|
Buildings and Improvements
|
Equipment
|
Land
|
Building and Improvements
|
Equipment
|
Land
|
Building and Improvements
|
Equipment
|
Total
|
||||||
|
LH
|
Jackson, TN
|
1,398
|
1,257
|
204
|
—
|
16
|
8
|
1,398
|
1,273
|
212
|
2,883
|
507
|
2010
|
7/19/2010
|
2 - 45
|
||
|
LH
|
San Antonio, TX
|
—
|
1,382
|
735
|
—
|
248
|
52
|
—
|
1,630
|
787
|
2,417
|
1,024
|
2010
|
10/11/2010
|
2 - 40
|
||
|
LH
|
New Braunfels, TX
|
—
|
1,330
|
681
|
—
|
146
|
42
|
—
|
1,476
|
723
|
2,199
|
893
|
2011
|
1/24/2011
|
2 - 40
|
||
|
LH
|
San Antonio, TX
|
—
|
278
|
383
|
—
|
35
|
(12)
|
—
|
313
|
371
|
684
|
680
|
2011
|
6/20/2011
|
2 - 40
|
||
|
LH
|
Kingsland, GA
|
849
|
1,564
|
236
|
—
|
13
|
5
|
849
|
1,577
|
241
|
2,667
|
525
|
2011
|
4/25/2011
|
2 - 46
|
||
|
LH
|
Jonesboro, AR
|
902
|
1,704
|
234
|
—
|
15
|
1
|
902
|
1,719
|
235
|
2,856
|
581
|
2011
|
4/25/2011
|
2 - 46
|
||
|
LH
|
McAllen, TX
|
1,128
|
1,600
|
284
|
—
|
13
|
13
|
1,128
|
1,613
|
297
|
3,038
|
576
|
2011
|
3/28/2011
|
2 - 46
|
||
|
LH
|
Council Bluffs, IA
|
869
|
1,827
|
236
|
—
|
31
|
7
|
869
|
1,858
|
243
|
2,970
|
595
|
2011
|
5/31/2011
|
2 - 46
|
||
|
LH
|
Tupelo, MS
|
771
|
1,717
|
236
|
—
|
13
|
1
|
771
|
1,730
|
237
|
2,738
|
502
|
2011
|
8/29/2011
|
2 - 46
|
||
|
LH
|
Champaign, IL
|
1,499
|
1,725
|
267
|
—
|
4
|
3
|
1,499
|
1,729
|
270
|
3,498
|
533
|
2011
|
10/10/2011
|
2 - 46
|
||
|
LH
|
Rapid City, SD
|
965
|
1,869
|
252
|
—
|
2
|
3
|
965
|
1,871
|
255
|
3,091
|
608
|
2011
|
10/10/2011
|
2 - 46
|
||
|
LH
|
West Melbourne, FL
|
1,144
|
1,858
|
266
|
—
|
4
|
3
|
1,144
|
1,862
|
269
|
3,275
|
564
|
2011
|
11/21/2011
|
2 - 46
|
||
|
LH
|
Athens, GA
|
970
|
1,744
|
289
|
—
|
35
|
13
|
970
|
1,779
|
302
|
3,051
|
443
|
2012
|
10/29/2012
|
2 - 47
|
||
|
LH
|
Flowood, MS
|
1,088
|
1,803
|
327
|
34
|
—
|
2
|
1,122
|
1,803
|
329
|
3,254
|
588
|
2012
|
2/6/2012
|
2 - 47
|
||
|
LH
|
Deptford, NJ
|
1,799
|
1,694
|
287
|
—
|
3
|
(2)
|
1,799
|
1,697
|
285
|
3,781
|
489
|
2012
|
3/26/2012
|
2 - 47
|
||
|
LH
|
McAllen, TX
|
1,339
|
1,775
|
319
|
—
|
3
|
12
|
1,339
|
1,778
|
331
|
3,448
|
547
|
2012
|
2/27/2012
|
2 - 47
|
||
|
LH
|
Wilkes Barre, PA
|
859
|
2,227
|
278
|
—
|
6
|
—
|
859
|
2,233
|
278
|
3,370
|
370
|
2014
|
1/27/2014
|
2 - 49
|
||
|
LH
|
Morehead City, NC
|
975
|
1,941
|
340
|
—
|
2
|
1
|
975
|
1,943
|
341
|
3,259
|
462
|
2013
|
1/14/2013
|
2 - 48
|
||
|
LH
|
Columbus, MS
|
1,155
|
1,993
|
256
|
—
|
4
|
4
|
1,155
|
1,997
|
260
|
3,412
|
418
|
2013
|
2/18/2013
|
2 - 48
|
||
|
LH
|
Sandusky, OH
|
1,081
|
2,027
|
263
|
—
|
—
|
2
|
1,081
|
2,027
|
265
|
3,373
|
428
|
2013
|
4/22/2013
|
2 - 48
|
||
|
LH
|
Coralville, IA
|
953
|
2,135
|
288
|
—
|
—
|
(3)
|
953
|
2,135
|
285
|
3,373
|
450
|
2013
|
5/13/2013
|
2 - 48
|
||
|
LH
|
Cincinnati, OH
|
1,205
|
1,758
|
291
|
—
|
—
|
3
|
1,205
|
1,758
|
294
|
3,257
|
351
|
2013
|
8/26/2013
|
2 - 48
|
||
|
LH
|
Cleveland, TN
|
1,054
|
1,776
|
337
|
—
|
—
|
1
|
1,054
|
1,776
|
338
|
3,168
|
396
|
2013
|
5/13/2013
|
2 - 48
|
||
|
LH
|
Minot, ND
|
887
|
2,230
|
314
|
—
|
15
|
17
|
887
|
2,245
|
331
|
3,463
|
412
|
2013
|
9/23/2013
|
2 - 48
|
||
|
LH
|
Bethlehem, GA
|
936
|
1,684
|
286
|
—
|
—
|
—
|
936
|
1,684
|
286
|
2,906
|
284
|
2014
|
1/20/2014
|
2 - 49
|
||
|
WFG
|
San Antonio, TX
|
—
|
—
|
8
|
2,790
|
2,069
|
69
|
2,790
|
2,069
|
77
|
4,936
|
379
|
2008
|
11/14/2011
|
2 - 43
|
||
|
PH
|
Joliet, IL
|
173
|
890
|
—
|
—
|
—
|
—
|
173
|
890
|
—
|
1,063
|
9
|
1970
|
7/18/2016
|
5 - 45
|
||
|
PH
|
Morris, IL
|
248
|
533
|
—
|
—
|
—
|
—
|
248
|
533
|
—
|
781
|
9
|
1972
|
7/18/2016
|
5 - 40
|
||
|
PH
|
Yorkville, IL
|
200
|
581
|
—
|
—
|
—
|
—
|
200
|
581
|
—
|
781
|
9
|
1976
|
7/18/2016
|
5 - 40
|
||
|
PH
|
Lowell, IN
|
258
|
611
|
—
|
—
|
—
|
—
|
258
|
611
|
—
|
869
|
10
|
1978
|
7/18/2016
|
5 - 40
|
||
|
PH
|
Schereville, IN
|
243
|
942
|
—
|
—
|
—
|
—
|
243
|
942
|
—
|
1,185
|
12
|
1975
|
7/18/2016
|
5 - 40
|
||
|
PH
|
Portage, IN
|
330
|
1,016
|
—
|
—
|
—
|
—
|
330
|
1,016
|
—
|
1,346
|
14
|
2002
|
7/18/2016
|
5 - 40
|
||
|
WEN
|
Odessa, TX
|
822
|
1,327
|
—
|
—
|
—
|
—
|
822
|
1,327
|
—
|
2,149
|
18
|
1995
|
8/2/2016
|
10 - 45
|
||
|
ARB
|
Birch Run, MI
|
590
|
777
|
—
|
—
|
—
|
—
|
590
|
777
|
—
|
1,367
|
5
|
1991
|
11/9/2016
|
10 - 40
|
||
F-46
|
FOUR CORNERS PROPERTY, TRUST, INC.
SCHEDULE III
SCHEDULE OF REAL EATATE ASSETS AND ACCUMULATED DEPRECIATION
DECEMBER 31, 2016
(Dollars in thousands)
|
|||||||||||||||||
|
Initial Cost to Company
|
Cost Capitalized Since Acquisition
|
Gross Carrying Value (2)
|
Accumulated Depreciation
|
Construction Date
|
Acquisition Date
|
Life on which Depreciation in latest Statement of Income is Computed
|
|||||||||||
|
Restaurant Property (1)
|
Location
|
Land
|
Buildings and Improvements
|
Equipment
|
Land
|
Building and Improvements
|
Equipment
|
Land
|
Building and Improvements
|
Equipment
|
Total
|
||||||
|
ARB
|
Brighton, MI
|
456
|
990
|
—
|
—
|
—
|
—
|
456
|
990
|
—
|
1,446
|
5
|
1987
|
11/9/2016
|
10 - 40
|
||
|
BK
|
Madisonville, KY
|
1,071
|
1,257
|
—
|
—
|
—
|
—
|
1,071
|
1,257
|
—
|
2,328
|
7
|
1986
|
11/9/2016
|
10 - 45
|
||
|
DEN
|
Amherst, OH
|
460
|
998
|
—
|
—
|
—
|
—
|
460
|
998
|
—
|
1,458
|
6
|
1971
|
11/9/2016
|
10 - 40
|
||
|
FAZ
|
Lafayette, IN
|
244
|
522
|
—
|
—
|
—
|
—
|
244
|
522
|
—
|
766
|
4
|
1996
|
11/9/2016
|
5 - 40
|
||
|
SNS
|
Peru, IL
|
560
|
813
|
—
|
—
|
—
|
—
|
560
|
813
|
—
|
1,373
|
6
|
1996
|
11/9/2016
|
5 - 40
|
||
|
SNS
|
Vero Beach, FL
|
435
|
930
|
—
|
—
|
—
|
—
|
435
|
930
|
—
|
1,365
|
6
|
1998
|
11/9/2016
|
10 - 40
|
||
|
WEN
|
Wheat Ridge, CO
|
453
|
467
|
—
|
—
|
—
|
—
|
453
|
467
|
—
|
920
|
4
|
1978
|
11/9/2016
|
5 - 40
|
||
|
WEN
|
Warren, MI
|
323
|
946
|
—
|
—
|
—
|
—
|
323
|
946
|
—
|
1,269
|
5
|
2003
|
11/9/2016
|
10 - 40
|
||
|
ZAX
|
Snellville, GA
|
859
|
1,168
|
—
|
—
|
—
|
—
|
859
|
1,168
|
—
|
2,027
|
6
|
2003
|
11/9/2016
|
10 - 45
|
||
|
BK
|
Keysville, VA
|
571
|
1,424
|
—
|
—
|
—
|
—
|
571
|
1,424
|
—
|
1,995
|
6
|
1996
|
10/28/2016
|
10 - 50
|
||
|
BK
|
Roxboro, NC
|
601
|
2,089
|
—
|
—
|
—
|
—
|
601
|
2,089
|
—
|
2,690
|
9
|
1989
|
10/28/2016
|
10 - 50
|
||
|
BK
|
Oxford, NC
|
449
|
1,892
|
—
|
—
|
—
|
—
|
449
|
1,892
|
—
|
2,341
|
8
|
1982
|
10/28/2016
|
10 - 50
|
||
|
BK
|
Huntsville, AL
|
460
|
1,549
|
—
|
—
|
—
|
—
|
460
|
1,549
|
—
|
2,009
|
7
|
2000
|
10/28/2016
|
10 - 50
|
||
|
BK
|
Amory, MS
|
570
|
2,159
|
—
|
—
|
—
|
—
|
570
|
2,159
|
—
|
2,729
|
8
|
2016
|
10/28/2016
|
14 - 54
|
||
|
BK
|
Monterey, TN
|
429
|
1,611
|
—
|
—
|
—
|
—
|
429
|
1,611
|
—
|
2,040
|
—
|
2000
|
12/28/2016
|
10 - 50
|
||
|
BK
|
Crossville, TN
|
397
|
1,873
|
—
|
—
|
—
|
—
|
397
|
1,873
|
—
|
2,270
|
—
|
1987
|
12/28/2016
|
10 - 50
|
||
|
BK
|
Livingston, TN
|
481
|
1,354
|
—
|
—
|
—
|
—
|
481
|
1,354
|
—
|
1,835
|
—
|
2015
|
12/28/2016
|
13 - 53
|
||
|
BK
|
Mount Juliet, TN
|
683
|
1,101
|
—
|
—
|
—
|
—
|
683
|
1,101
|
—
|
1,784
|
—
|
1988
|
12/28/2016
|
7 - 40
|
||
|
ARB
|
Rocky Mount, NC
|
261
|
1,405
|
—
|
—
|
—
|
—
|
261
|
1,405
|
—
|
1,666
|
12
|
2004
|
9/6/2016
|
10 - 45
|
||
|
ARB
|
Roanoke Rapids, NC
|
288
|
1,563
|
—
|
—
|
—
|
—
|
288
|
1,563
|
—
|
1,851
|
15
|
2003
|
9/6/2016
|
10 - 45
|
||
|
KFC
|
Detroit, MI
|
294
|
916
|
—
|
—
|
—
|
—
|
294
|
916
|
—
|
1,210
|
8
|
1997
|
9/14/2016
|
5 - 43
|
||
|
KFC
|
Auburn Hills, MI
|
98
|
925
|
—
|
—
|
—
|
—
|
98
|
925
|
—
|
1,023
|
9
|
2002
|
9/14/2016
|
5 - 43
|
||
|
KFC
|
Detroit, MI
|
75
|
732
|
—
|
—
|
—
|
—
|
75
|
732
|
—
|
807
|
8
|
1984
|
9/14/2016
|
5 - 40
|
||
|
KFC
|
Detroit, MI
|
323
|
635
|
—
|
—
|
—
|
—
|
323
|
635
|
—
|
958
|
8
|
1984
|
9/14/2016
|
5 - 40
|
||
|
BWW
|
Burlington, IA
|
137
|
2,530
|
—
|
—
|
—
|
—
|
137
|
2,530
|
—
|
2,667
|
21
|
2010
|
9/15/2016
|
10 - 49
|
||
|
BWW
|
Galesburg, IL
|
157
|
2,510
|
—
|
—
|
—
|
—
|
157
|
2,510
|
—
|
2,667
|
23
|
2009
|
9/15/2016
|
10 - 46
|
||
|
BWW
|
Macomb, IL
|
138
|
2,528
|
—
|
—
|
—
|
—
|
138
|
2,528
|
—
|
2,666
|
22
|
2009
|
9/15/2016
|
10 - 48
|
||
|
DQ
|
Tulsa, OK
|
797
|
1,606
|
—
|
—
|
—
|
—
|
797
|
1,606
|
—
|
2,403
|
7
|
2015
|
10/20/2016
|
14 - 54
|
||
|
TB
|
Newburgh, IN
|
139
|
1,069
|
—
|
—
|
—
|
—
|
139
|
1,069
|
—
|
1,208
|
4
|
1994
|
11/15/2016
|
14 - 53
|
||
|
KFC
|
Altoona, WI
|
195
|
1,714
|
—
|
—
|
—
|
—
|
195
|
1,714
|
—
|
1,909
|
8
|
1993
|
11/10/2016
|
10 - 45
|
||
|
KFC
|
LaCrosse, WI
|
216
|
893
|
—
|
—
|
—
|
—
|
216
|
893
|
—
|
1,109
|
6
|
1979
|
11/10/2016
|
5 - 40
|
||
|
KFC
|
Rice Lake, WI
|
215
|
1,045
|
—
|
—
|
—
|
—
|
215
|
1,045
|
—
|
1,260
|
6
|
1991
|
11/10/2016
|
5 - 40
|
||
|
KFC
|
Chippewa Falls, WI
|
167
|
924
|
—
|
—
|
—
|
—
|
167
|
924
|
—
|
1,091
|
5
|
2003
|
11/10/2016
|
5 - 40
|
||
F-47
|
FOUR CORNERS PROPERTY, TRUST, INC.
SCHEDULE III
SCHEDULE OF REAL EATATE ASSETS AND ACCUMULATED DEPRECIATION
DECEMBER 31, 2016
(Dollars in thousands)
|
|||||||||||||||||
|
Initial Cost to Company
|
Cost Capitalized Since Acquisition
|
Gross Carrying Value (2)
|
Accumulated Depreciation
|
Construction Date
|
Acquisition Date
|
Life on which Depreciation in latest Statement of Income is Computed
|
|||||||||||
|
Restaurant Property (1)
|
Location
|
Land
|
Buildings and Improvements
|
Equipment
|
Land
|
Building and Improvements
|
Equipment
|
Land
|
Building and Improvements
|
Equipment
|
Total
|
||||||
|
KFC
|
LaCrosse, WI
|
245
|
1,042
|
—
|
—
|
—
|
—
|
245
|
1,042
|
—
|
1,287
|
6
|
1972
|
11/10/2016
|
5 - 40
|
||
|
KFC
|
Stevens Point, WI
|
92
|
697
|
—
|
—
|
—
|
—
|
92
|
697
|
—
|
789
|
4
|
1984
|
11/10/2016
|
5 - 40
|
||
|
KFC
|
Wisconsin Rapids, WI
|
179
|
1,928
|
—
|
—
|
—
|
—
|
179
|
1,928
|
—
|
2,107
|
8
|
1991
|
11/10/2016
|
10 - 45
|
||
|
KFC
|
Wausau, WI
|
126
|
1,387
|
—
|
—
|
—
|
—
|
126
|
1,387
|
—
|
1,513
|
6
|
1979
|
11/10/2016
|
10 - 45
|
||
|
KFC
|
Escanaba, MI
|
143
|
1,362
|
—
|
—
|
—
|
—
|
143
|
1,362
|
—
|
1,505
|
6
|
1985
|
11/10/2016
|
10 - 43
|
||
|
KFC
|
Menominee, MI
|
93
|
862
|
—
|
—
|
—
|
—
|
93
|
862
|
—
|
955
|
5
|
1995
|
11/10/2016
|
10 - 40
|
||
|
KFC
|
Goshen, IN
|
95
|
1,041
|
—
|
—
|
—
|
—
|
95
|
1,041
|
—
|
1,136
|
6
|
1976
|
11/10/2016
|
5 - 40
|
||
|
KFC
|
South Bend, IN
|
141
|
868
|
—
|
—
|
—
|
—
|
141
|
868
|
—
|
1,009
|
6
|
1970
|
11/10/2016
|
5 - 40
|
||
|
KFC
|
South Bend, IN
|
155
|
774
|
—
|
—
|
—
|
—
|
155
|
774
|
—
|
929
|
5
|
1973
|
11/10/2016
|
5 - 40
|
||
|
KFC
|
Mishawaka, IN
|
72
|
1,510
|
—
|
—
|
—
|
—
|
72
|
1,510
|
—
|
1,582
|
6
|
1978
|
11/10/2016
|
10 - 45
|
||
|
KFC
|
Kokomo, IN
|
118
|
1,093
|
—
|
—
|
—
|
—
|
118
|
1,093
|
—
|
1,211
|
5
|
1994
|
11/10/2016
|
10 - 40
|
||
|
KFC
|
Kokomo, IN
|
141
|
1,798
|
—
|
—
|
—
|
—
|
141
|
1,798
|
—
|
1,939
|
8
|
1994
|
11/10/2016
|
10 - 45
|
||
|
ARB
|
South Hill, VA
|
538
|
1,283
|
—
|
—
|
—
|
—
|
538
|
1,283
|
—
|
1,821
|
6
|
2002
|
11/3/2016
|
10 - 50
|
||
|
ARB
|
Wake Forest, NC
|
805
|
1,344
|
—
|
—
|
—
|
—
|
805
|
1,344
|
—
|
2,149
|
7
|
2005
|
11/3/2016
|
9 - 49
|
||
|
HAR
|
Gadsden, AL
|
464
|
1,064
|
—
|
—
|
—
|
—
|
464
|
1,064
|
—
|
1,528
|
3
|
1985
|
12/15/2016
|
10 - 40
|
||
|
HAR
|
Baxley, GA
|
644
|
1,258
|
—
|
—
|
—
|
—
|
644
|
1,258
|
—
|
1,902
|
4
|
1983
|
12/15/2016
|
10 - 40
|
||
|
HAR
|
Vidalia, GA
|
364
|
1,232
|
—
|
—
|
—
|
—
|
364
|
1,232
|
—
|
1,596
|
3
|
2007
|
12/15/2016
|
10 - 50
|
||
|
HAR
|
Hazlehurst, GA
|
461
|
1,516
|
—
|
—
|
—
|
—
|
461
|
1,516
|
—
|
1,977
|
3
|
2013
|
12/15/2016
|
12 - 52
|
||
|
N/A
|
Mill Valley, CA
|
—
|
—
|
28
|
—
|
25
|
—
|
—
|
25
|
28
|
53
|
8
|
N/A
|
N/A
|
2 - 7
|
||
|
Total
|
$398,009
|
$663,675
|
$48,217
|
$23,932
|
$252,797
|
$90,935
|
$421,941
|
$916,472
|
$139,152
|
$1,477,565
|
$583,307
|
||||||
(1)
OG refers to Olive Garden
®
properties.
BB refers to Bahama Breeze
®
properties.
S52 refers to Seasons 52
®
properties.
LH refers to LongHorn Steakhouse
®
properties.
WFG refers to the Wildfish Seafood Grille
®
property.
PH refers to the Pizza Hut
®
properties.
WEN refers to the Wendy’s
®
properties.
ARB refers to the Arby’s
®
properties.
F-48
BK refers to the Burger King
®
properties.
DEN refers to the Denny’s
®
property.
FAZ refers to the Fazoli’s
®
property.
SNS refers to the Steak N’ Shake
®
properties.
ZAX refers to the Zaxby’s
®
property.
KFC refers to the KFC
®
properties.
BWW refers to the Buffalo Wild Wings
®
properties.
DQ refers to the Dairy Queen
®
property.
TB refers to the Taco Bell
®
property.
HAR refers to the Hardee’s
®
properties.
(2) Aggregate cost for income tax purposes is
$1.42 billion
(unaudited) with a net book value of
$0.65 billion
(unaudited)
F-49
SCHEDULE III
REAL ESTATE ASSETS AND ACCUMULATED DEPRECIATION
(Dollars in thousands)
|
December 31, 2016
|
|||
|
Carrying Costs
|
|||
|
Balance - beginning of period
|
$
|
1,397,230
|
|
|
Additions placed in service
|
93,576
|
|
|
|
Dispositions
|
(13,240
|
)
|
|
|
Balance - end of year
|
$
|
1,477,566
|
|
|
Accumulated Depreciation
|
|||
|
Balance - beginning of year
|
$
|
(568,539
|
)
|
|
2016 depreciation expense
|
(20,540
|
)
|
|
|
Dispositions
|
5,772
|
|
|
|
Balance - end of year
|
$
|
(583,307
|
)
|
F-50
INDEX TO EXHIBITS
|
Exhibit Number
|
Description
|
|
|
3.1
|
Articles of Amendment and Restatement of Four Corners Property Trust, Inc. (incorporated by reference to Exhibit 3.1 to the Company’s Current Report on Form 8-K filed on October 27, 2015).
|
|
|
3.2
|
Amended and Restated Bylaws of Four Corners Property Trust, Inc. (incorporated by reference to Exhibit 3.2 to the Company’s Current Report on Form 8-K filed on October 27, 2015).
|
|
|
4.1
|
Specimen Stock Certificate of Four Corners Property Trust, Inc. (incorporated by reference to Exhibit 4.1 to the Company Registration Statement on Form 10/A filed on October 5, 2015).
|
|
|
10.1
|
Limited Partnership Agreement of Four Corners Operating Partnership, LP dated August 11, 2015 (incorporated by reference to Exhibit 10.6 to the Company’s Registration Statement on Form 10/A filed on October 5, 2015).
|
|
|
10.2
|
Amended and Restated Agreement of Limited Partnership of Four Corners Operating Partnership, L.P., dated November 7, 2016 (incorporated by reference to Exhibit 10.1 to the Company’s Current Report on Form 8-K filed on November 10, 2016).
|
|
|
10.3
|
Offer Letter for William H. Lenehan, President and Chief Executive Officer, dated August 5, 2015† (incorporated by reference to Exhibit 10.8 to the Company’s Registration Statement on Form 10/A filed on October 5, 2015).
|
|
|
10.4
|
Offer Letter for Gerald R. Morgan, Chief Financial Officer, dated September 21, 2015† (incorporated by reference to Exhibit 10.9 to the Company’s Registration Statement on Form 10/A filed on October 5, 2015).
|
|
|
10.5
|
Offer Letter for James L. Brat, General Counsel, dated September 17, 2015† (incorporated by reference to Exhibit 10.10 to the Company’s Registration Statement on Form 10/A filed on October 5, 2015).
|
|
|
10.6
|
Tax Matters Agreement, dated as of November 9, 2015, by and between Darden Restaurants, Inc. and Four Corners Property Trust, Inc. (incorporated by reference to Exhibit 10.1 to the Company’s Current Report on Form 8-K filed on November 10, 2015).
|
|
|
10.7
|
Revolving Credit and Term Loan, dated as of November 9, 2015, among Four Corners Operating Partnership, LP, Four Corners Property Trust, Inc., the lenders party thereto and JPMorgan Chase Bank, N.A., as Administrative Agent (incorporated by reference to Exhibit 10.4 to the Company’s Current Report on Form 8-K filed on November 10, 2015).
|
|
|
10.8
|
Omnibus Amendment and Waiver, dated as of August 2, 2016, among Four Corners Operating Partnership, L.P., the Guarantors party thereto, the Lenders party thereto and JPMorgan Chase Bank, N.A., as Administrative Agent (incorporated by reference to Exhibit 10.1 to the Company’s Current Report on Form 8-K filed on August 4, 2016).
|
|
|
10.9
|
Four Corners Property Trust, Inc. 2015 Omnibus Incentive Plan† (incorporated by reference to Exhibit 10.5 to the Company’s Current Report on Form 8-K filed on November 10, 2015).
|
|
|
10.10
|
Amendment No. 1 to the Four Corners Property Trust, Inc. 2015 Omnibus Incentive Plan† (incorporated by reference to Exhibit 10.3 to the Company’s Current Report on Form 8-K filed December 24, 2015).
|
|
|
10.11
|
Form of Lease (incorporated by reference to Exhibit 10.1 to the Company’s Registration Statement on Form 10/A filed on October 5, 2015).
|
|
|
10.12
|
Form of Guaranty by Darden Restaurants, Inc. in respect of certain Leases (incorporated by reference to Exhibit 10.2 to the Company’s Registration Statement on Form 10/A filed on October 5, 2015).
|
|
|
10.13
|
Guaranty, dated August 2, 2016, by Four Corners Property Trust, Inc. and Four Corners GP, LLC, for the benefit of JP Morgan Chase Bank, N.A., as Administrative Agent (incorporated by reference to Exhibit 10.2 to the Company’s Current Report on Form 8-K filed on August 4, 2016).
|
|
|
10.13
|
Form of Franchise Agreement (incorporated by reference to Exhibit 10.1 to the Company’s Registration Statement on Form 10/A filed on October 5, 2015).
|
|
|
10.14
|
Form of Restricted Stock Unit Award Agreement for Non-Employee Directors (incorporated by reference to Exhibit 10.1 to the Company’s Current Report on Form 8-K filed on December 24, 2015).
|
|
E-
1
|
10.15
|
Form of FY 2015 Restricted Stock Unit Award Agreement (incorporated by reference to Exhibit 10.2 to the Company’s Current Report on Form 8-K filed on December 24, 2015).
|
|
|
10.16
|
Form of Performance-based Restricted Stock Award Agreement (incorporated by reference to Exhibit 10.1 to the Company’s Current Report on Form 8-K filed on February 9, 2016).
|
|
|
10.17
|
Form of Restricted Stock Award Agreement (incorporated by reference to Exhibit 10.2 to the Company’s Current Report on Form 8-K filed on February 9, 2016).
|
|
|
21.1
|
List of Subsidiaries of Four Corners Property Trust, Inc.
|
|
|
23.1
|
Consent of Independent Accountants
|
|
|
31 (a)
|
Certification of Principal Executive Officer Pursuant to Rules 13a-14(a) and 15d-14(a) under the Securities Exchange Act of 1934, as Adopted Pursuant to Section 302 of the Sarbanes-Oxley Act of 2002.
|
|
|
31 (b)
|
Certification of Principal Financial Officer Pursuant to Rules 13a-14(a) and 15d-14(a) under the Securities Exchange Act of 1934, as Adopted Pursuant to Section 302 of the Sarbanes-Oxley Act of 2002.
|
|
|
32 (a)
|
Certification of Principal Executive Officer Pursuant to 18 U.S.C. Section 1350, as Adopted Pursuant to Section 906 of the Sarbanes-Oxley Act of 2002.
|
|
|
32 (b)
|
Certification of Principal Financial Officer Pursuant to 18 U.S.C. Section 1350, as Adopted Pursuant to Section 906 of the Sarbanes-Oxley Act of 2002.
|
|
|
99.1
|
Form of Lease (incorporated by reference to Exhibit 99.1 to the Company’s Current Report on Form 10-K filed on March 22, 2016).
|
|
|
101.INS
|
XBRL Instance Document
|
|
|
101.SCH
|
XBRL Taxonomy Extension Schema Document
|
|
|
101.CAL
|
XBRL Taxonomy Extension Calculation Linkbase Document
|
|
|
101.DEF
|
XBRL Taxonomy Extension Definition Linkbase Document
|
|
|
101.LAB
|
XBRL Taxonomy Extension Label Linkbase Document
|
|
|
101.PRE
|
XBRL Taxonomy Extension Presentation Linkbase Document
|
|
† Denotes a management contract or compensatory plan, contract or arrangement.
E-
2
SIGNATURE
Pursuant to the requirements of Section 13 or 15(d) of the Securities Exchange Act of 1934, the registrant has duly caused this report to be signed on its behalf by the undersigned, thereunto duly authorized.
|
FOUR CORNERS PROPERTY TRUST, INC.
|
|||
|
Dated:
|
February 27, 2017
|
By:
|
/s/ William H. Lenehan
|
|
President and Chief Executive Officer
|
|||
Pursuant to the requirements of the Securities Exchange Act of 1934, this report has been signed below by the following persons on behalf of the Registrant and in the capacities and on the dates indicated.
|
Signature
|
Title
|
Date
|
|
/S/ WILLIAM H. LENEHAN
William H. Lenehan
|
Director and Chief Executive Officer
(Principal Executive Officer)
|
February 27, 2017
|
|
/S/ GERALD R. MORGAN
Gerald R. Morgan
|
Chief Financial Officer
(Principal Financial Officer and Principal Accounting Officer)
|
February 27, 2017
|
|
/S/ JOHN MOODY
John Moody
|
Director and Chairman of the Board of Directors
|
February 27, 2017
|
|
/S/ DOUGLAS B. HANSEN, JR.
Douglas B. Hansen, Jr.
|
Director
|
February 27, 2017
|
|
/S/ MARRAN H. OGILVIE
Marran H. Ogilvie
|
Director
|
February 27, 2017
|
|
/S/ PAUL E. SZUREK
Paul E. Szurek
|
Director
|
February 27, 2017
|
E-
3
TABLE OF CONTENTS
Part IItem 1. BusinessItem 1A. Risk FactorsItem 1B. Unresolved Staff CommentsItem 2. PropertiesItem 3. Legal ProceedingsItem 4. Mine Safety DisclosuresPart IIItem 5. Market For Registrant S Common Equity, Related Stockholder Matters and Issuer Purchases Of Equity SecuritiesItem 6. Selected Financial DataItem 7. Management S Discussion and Analysis Of Financial Condition and Results Of OperationsItem 7A. Quantitative and Qualitative Disclosures About Market RiskItem 8. Financial Statements and Supplementary DataItem 9. Changes in and Disagreements with Accountants on Accounting and Financial DisclosuresItem 9A. Controls and ProceduresItem 9B. Other InformationPart IIIItem 10. Directors, Executive Officers and Corporate GovernanceItem 11. Executive CompensationItem 12. Security Ownership Of Certain Owners and Management and Related Stockholder MattersItem 13. Certain Relationships and Related Transactions, and Director IndependenceItem 14. Principal Accounting Fees and ServicesPart IVItem 15. Exhibits, Financial Statement SchedulesNote 1 OrganizationNote 2 Summary Of Significant Accounting PoliciesNote 3 Concentration Of Credit RiskNote 4 Related Party TransactionsNote 5 Real Estate Investments, NetNote 6 Supplemental Detail For Certain Components Of Consolidated Balance SheetNote 7 Notes PayableNote 8 Derivative Financial InstrumentsNote 9 Income TaxesNote 10 EquityNote 11 Stock-based CompensationNote 12 Fair Value MeasurementsNote 13 Commitments and ContingenciesNote 14 SegmentsNote 15 Subsequent EventsNote 16 Selected Quarterly Financial Data (unaudited)