FREEPORT-MCMORAN INC
10-Ks and 10-Qs
|
|
|
|
|
|
|
|
|
|
|
|
|
|
|
|
|
|
|
|
|
|
|
|
|
|
|
|
|
|
|
|
|
|
|
|
|
|
|
|
|
|
|
|
|
|
|
|
|
|
|
|
|
|
|
|
|
|
|
|
|
||
|
UNITED STATES
|
||
|
SECURITIES AND EXCHANGE COMMISSION
|
||
|
Washington, D.C. 20549
|
||
|
|
||
|
FORM 10-K
|
||
|
|
||
|
(Mark One)
|
||
|
[X] ANNUAL REPORT PURSUANT TO SECTION 13 OR 15(d) OF THE SECURITIES EXCHANGE ACT OF 1934
|
||
|
For the fiscal year ended December 31, 2012
|
||
|
OR
|
||
|
[ ] TRANSITION REPORT PURSUANT TO SECTION 13 OR 15(d) OF THE SECURITIES EXCHANGE ACT OF 1934
|
||
|
For the transition period from
|
|
to
|
|
Commission File Number: 001-11307-01
|
||
|
Freeport-McMoRan Copper & Gold Inc.
|
||
|
(Exact name of registrant as specified in its charter)
|
||
|
Delaware
|
74-2480931
|
|
(State or other jurisdiction of
incorporation or organization)
|
(I.R.S. Employer Identification No.)
|
|
|
|
|
333 North Central Avenue
|
|
|
Phoenix, Arizona
|
85004-2189
|
|
(Address of principal executive offices)
|
(Zip Code)
|
|
|
|
|
(602) 366-8100
|
|
|
(Registrant's telephone number, including area code)
|
|
Securities registered pursuant to Section 12(b) of the Act:
|
Title of each class
|
|
Name of each exchange on which registered
|
|
Common Stock, par value $0.10 per share
|
|
New York Stock Exchange
|
Securities registered pursuant to Section 12(g) of the Act: None
Indicate by check mark if the registrant is a well-known seasoned issuer, as defined in Rule 405 of the Securities Act
þ
Yes
¨
No
Indicate by check mark if the registrant is not required to file reports pursuant to Section 13 or Section 15(d) of the Act.
¨
Yes
þ
No
Indicate by check mark whether the registrant (1) has filed all reports required to be filed by Section 13 or 15(d) of the Securities Exchange Act of 1934 during the preceding 12 months (or for such shorter period that the registrant was required to file such reports), and (2) has been subject to such filing requirements for the past 90 days.
þ
Yes
¨
No
Indicate by check mark whether the registrant has submitted electronically and posted on its corporate Web site, if any, every Interactive Data File required to be submitted and posted pursuant to Rule 405 of Regulation S-T (§ 232.405 of this chapter) during the preceding 12 months (or for such shorter period that the registrant was required to submit and post such files).
þ
Yes
¨
No
Indicate by check mark if disclosure of delinquent filers pursuant to Item 405 of Regulation S-K (§229.405 of this chapter) is not contained herein, and will not be contained, to the best of the registrant’s knowledge, in definitive proxy or information statements incorporated by reference in Part III of this Form 10-K or any amendment to this Form 10-K.
þ
Indicate by check mark whether the registrant is a large accelerated filer, an accelerated filer, a non-accelerated filer or a smaller reporting company. See the definitions of “large accelerated filer,” “accelerated filer” and “smaller reporting company” in Rule 12b-2 of the Exchange Act.
þ
Large accelerated filer
¨
Accelerated filer
¨
Non-accelerated filer
¨
Smaller reporting company
Indicate by check mark whether the registrant is a shell company (as defined in Rule 12b-2 of the Act).
¨
Yes
þ
No
The aggregate market value of common stock held by non-affiliates of the registrant was
$33.0 billion
on
February 15, 2013
, and
$32.1 billion
on June 29, 2012.
Common stock issued and outstanding was
949,530,599
shares on
February 15, 2013
, and
949,186,881
shares on
June 29, 2012
.
DOCUMENTS INCORPORATED BY REFERENCE
|
Portions of our proxy statement for our 2013 annual meeting of stockholders are incorporated by reference into Part III (Items 10, 11, 12, 13 and 14) of this report.
|
FREEPORT-McMoRan COPPER & GOLD INC.
|
TABLE OF CONTENTS
|
|
|
|
|
|
|
Page
|
|
|
|
|
|
|
|
|
|
|
|
|
|
|
|
|
|
|
|
|
|
|
|
|
|
|
|
i
Items 1. and 2. Business and Properties.
All of our periodic reports filed with the Securities and Exchange Commission (SEC) pursuant to Section 13(a) or 15(d) of the Securities Exchange Act of 1934, as amended, are available, free of charge, through our website, www.fcx.com, including our annual reports on Form 10-K, quarterly reports on Form 10-Q, current reports on Form 8-K and any amendments to those reports. These reports and amendments are available through our website as soon as reasonably practicable after we electronically file or furnish such material to the SEC.
References to “we,” “us” and “our” refer to Freeport-McMoRan Copper & Gold Inc. (FCX) and its consolidated subsidiaries. References to “Notes” refer to the Notes to Consolidated Financial Statements included herein (refer to Item 8), and references to “MD&A” refer to Management's Discussion and Analysis of Financial Condition and Results of Operations included herein (refer to Item 7).
PROPOSED ACQUISTIONS
In December 2012, FCX announced definitive merger agreements to acquire, in separate transactions, Plains Exploration & Production Company (PXP) and McMoRan Exploration Co. (MMR). Completion of each transaction is subject to receipt of PXP and MMR shareholder approval of their respective transactions, regulatory approvals (including United States (U.S.) antitrust clearance under the Hart-Scott Rodino Act) and other customary conditions. On December 26, 2012, the U.S. Federal Trade Commission granted early termination of the Hart-Scott Rodino waiting period with respect to both transactions. The PXP transaction is not conditioned on the closing of the MMR transaction, and the MMR transaction is not conditioned on the closing of the PXP transaction. PXP and MMR shareholder meetings to approve the respective transactions will be scheduled upon the effectiveness of the respective registration statements filed with the SEC. The transactions are expected to close in second-quarter 2013, subject to satisfaction of all conditions to closing.
Additionally in January 2013, FCX, through a newly formed joint venture, entered into a definitive agreement to acquire a cobalt chemical refinery in Kokkola, Finland, and the related sales and marketing business. The acquisition is subject to customary closing conditions, including regulatory approvals, and is expected to close in second-quarter 2013.
The information contained in this Form 10-K does not reflect the impact of us acquiring PXP, MMR or the cobalt chemical business. Refer to Notes
1
and
20
for further discussion of these proposed acquisitions.
GENERAL
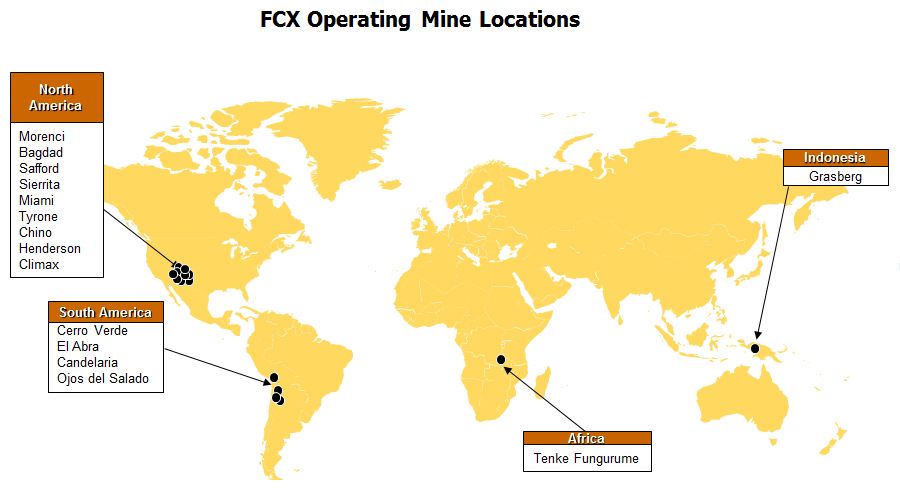
We are a leading international mining company with headquarters in Phoenix, Arizona, and incorporated under the laws of the state of Delaware on November 10, 1987. We are one of the world’s largest copper, gold and molybdenum mining companies in terms of reserves and production. Our portfolio of assets includes the Grasberg minerals district in Indonesia, significant mining operations in North and South America, and the Tenke Fungurume minerals district in the Democratic Republic of Congo (DRC). The Grasberg minerals district contains one of the largest copper and gold reserves in the world based on the latest available reserve data provided by third-party industry consultants.
We have significant reserves, resources and future development opportunities within our portfolio of assets. At
December 31, 2012
, consolidated recoverable proven and probable reserves totaled
116.5 billion
pounds of copper,
32.5 million
ounces of gold,
3.42 billion
pounds of molybdenum,
321.4 million
ounces of silver and
0.84 billion
pounds of cobalt. Approximately
33 percent
of our copper reserves are in North America,
33 percent
are in South America,
27 percent
are in Indonesia and
7 percent
are in Africa. Approximately
95 percent
of our gold reserves are in Indonesia, with our remaining gold reserves primarily in South America. Approximately
79 percent
of our molybdenum reserves are in North America, with our remaining molybdenum reserves in South America. Refer to “Ore Reserves” for further discussion.
1
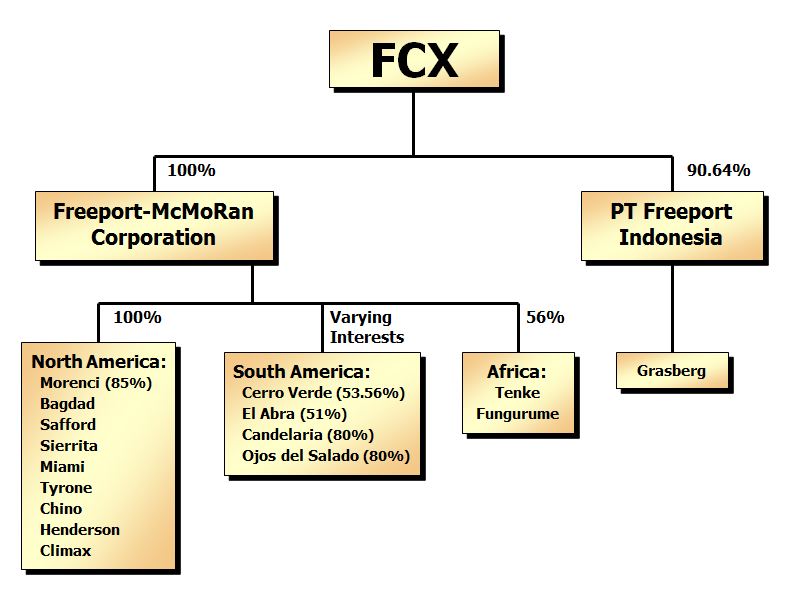
In North America, we currently operate seven copper mines – Morenci, Bagdad, Safford, Sierrita and Miami in Arizona, and Tyrone and Chino in New Mexico, and two molybdenum mines – Henderson and Climax in Colorado. Certain of our North America copper mines (Sierrita, Bagdad, Morenci and Chino) also produce molybdenum concentrates.
In South America, we operate four copper mines – Cerro Verde in Peru, and El Abra, Candelaria and Ojos del Salado in Chile. In addition to copper, the Cerro Verde mine also produces molybdenum concentrates, and the Candelaria and Ojos del Salado mines produce gold and silver.
In Indonesia, PT Freeport Indonesia operates the mines in the Grasberg minerals district. In addition to copper, the Grasberg minerals district also produces significant quantities of gold and silver.
In Africa, Tenke Fungurume Mining S.A.R.L. (TFM) operates the mines in the Tenke Fungurume minerals district (the Tenke mines). In addition to copper, Tenke produces cobalt hydroxide.
A summary of our consolidated copper, gold and molybdenum production for the year
2012
by geographic location follows:
|
Copper
|
Gold
|
Molybdenum
|
|||||||
|
North America
|
37
|
%
|
1
|
%
|
91
|
%
|
a
|
||
|
South America
|
34
|
%
|
9
|
%
|
9
|
%
|
|||
|
Indonesia
|
19
|
%
|
90
|
%
|
N/A
|
|
|||
|
Africa
|
10
|
%
|
N/A
|
|
N/A
|
|
|||
a. For the year
2012
,
53 percent
of our consolidated molybdenum production in North America was from the Henderson and Climax primary molybdenum mines. The Climax molybdenum mine began commercial production in May 2012.
Refer to "Production Data" for further information.
The locations of our operating mines are shown on the map below. For information about our operating segments and financial data by geographic area refer to Note
17
.
2
The diagram below shows our ownership interest in our operating mines at
December 31, 2012
.
COPPER, GOLD AND MOLYBDENUM
A brief discussion of our primary metals appears below. For further discussion of historical market prices of these metals refer to MD&A.
Copper
Copper is an internationally traded commodity, and its prices are determined by the major metals exchanges – the London Metal Exchange (LME), New York Mercantile Exchange (COMEX) and Shanghai Futures Exchange (SHFE). Prices on these exchanges generally reflect the worldwide balance of copper supply and demand, and can be volatile and cyclical. During
2012
, LME spot copper prices ranged from a low of
$3.29
per pound to a high of
$3.93
per pound, averaged
$3.61
per pound and closed at
$3.59
per pound on
December 31, 2012
.
In general, demand for copper reflects the rate of underlying world economic growth, particularly in industrial production and construction. According to Wood Mackenzie, a widely followed independent metals market consultant, copper’s end-use markets (and their estimated shares of total consumption) are:
|
Electrical applications
|
34
|
%
|
|
Construction
|
31
|
%
|
|
Industrial machinery
|
13
|
%
|
|
Transportation
|
13
|
%
|
|
Consumer products
|
9
|
%
|
Gold
Gold is used for jewelry, coinage and bullion as well as various industrial and electronic applications. Gold can be readily sold on numerous markets throughout the world. Benchmark prices are generally based on London Bullion Market Association (London) quotations. During
2012
, London PM gold prices ranged from a low of
$1,540
per ounce to a high of
$1,792
per ounce, averaged
$1,669
per ounce and closed at
$1,658
per ounce on
December 31, 2012
.
Molybdenum
Molybdenum is a key alloying element in steel and the raw material for several chemical-grade products used in catalysts, lubrication, smoke suppression, corrosion inhibition and pigmentation. Molybdenum, as a high-purity metal, is also used in electronics such as flat-panel displays and in super alloys used in aerospace. Molybdenum’s
3
end-use markets (and their estimated shares of total consumption) according to the International Molybdenum Association are:
|
Construction steel
|
40
|
%
|
|
Stainless steel
|
20
|
%
|
|
Chemicals
|
14
|
%
|
|
Tool and high-speed steel
|
10
|
%
|
|
Cast iron
|
7
|
%
|
|
Molybdenum metal
|
5
|
%
|
|
Superalloys
|
4
|
%
|
Reference prices for molybdenum are available in several publications, including
Metals Week
,
Ryan’s Notes
and
Metal Bulletin
. During
2012
, the weekly average price of molybdenum quoted by
Metals Week
ranged from a low of
$10.90
per pound to a high of
$14.80
per pound, averaged
$12.74
per pound and was
$11.60
per pound on
December 31, 2012
.
PRODUCTS AND SALES
FCX’s consolidated revenues for
2012
primarily included sales of copper (
79 percent
), gold (
10 percent
) and molybdenum (
7 percent
). PT Freeport Indonesia’s sales to PT Smelting (PT Freeport Indonesia's 25 percent owned copper smelter and refinery in Indonesia - refer to "Smelting Facilities" for further discussion) represented
11 percent
of our consolidated revenues in
2012
and
2011
, and
12 percent
in
2010
. No other customer accounted for more than 10 percent of our consolidated revenues in any of the past three years.
Refer to Note
17
for a summary of our consolidated revenues and operating income by business segment and geographic area.
Copper Products
We are one of the world’s leading producers of copper concentrate, cathode and continuous cast copper rod. During
2012
,
46 percent
of our mined copper was sold in concentrate,
28 percent
as cathode and
26 percent
as rod from our North America operations.
Our copper ores are generally processed either by smelting and refining or by solution extraction and electrowinning (SX/EW). Before being subject to the smelting and refining process, ore is crushed and treated to produce a copper concentrate with copper content of approximately 20 to 30 percent. Copper concentrate is then smelted (
i.e.
, subjected to extreme heat) to produce copper anodes, which weigh between 800 and 900 pounds each and have an average copper content of 99.5 percent. The anodes are further treated by electrolytic refining to produce copper cathodes, which weigh between 100 and 350 pounds each and have an average copper content of 99.99 percent. Our copper cathodes are used as the raw material input for copper rod, brass mill products and for other uses. For ore subject to the SX/EW process, copper is extracted from the ore by dissolving it with a weak sulphuric acid solution. The copper content of the solution is increased in two additional solution-extraction stages and then the copper-bearing solution undergoes an electrowinning process to produce cathode that is 99.99 percent copper.
Copper Concentrate
. We produce copper concentrate at eight of our mines, of which PT Freeport Indonesia is our largest producer. In North America, copper concentrate is produced at our Morenci, Bagdad, Sierrita and Chino mines, and is generally shipped to our Miami smelter in Arizona. In South America, we produce copper concentrate at our Cerro Verde, Candelaria and Ojos del Salado mines.
Copper Cathode
. We produce copper cathode at our electrolytic refinery located in El Paso, Texas, and at 10 of our mines. In North America, SX/EW cathode is produced from our Morenci, Bagdad, Safford, Sierrita, Miami, Tyrone and Chino mines; in South America from our Cerro Verde and El Abra mines; and from our Tenke mines in Africa
.
Atlantic Copper S.L.U. (Atlantic Copper, our wholly owned copper smelting and refining unit in Spain - refer to "Smelting Facilities" for further discussion) and PT Smelting also produce copper cathode.
Continuous Cast Copper Rod
. We manufacture continuous cast copper rod at our facilities in El Paso, Texas; Norwich, Connecticut; and Miami, Arizona, primarily using copper cathode produced at our North America copper mines.
4
Other Copper Products
. We produce specialty copper products at our Bayway operations in Elizabeth, New Jersey. These products include specialty copper alloys in the forms of rod, bar and strip. We manufacture electrode wire for use in welding steel cans at our Norwich, Connecticut, and El Paso, Texas, facilities. We also produce copper sulfate pentahydrate for use in agricultural and industrial applications at our facility in Sierrita, Arizona. These facilities primarily use copper cathode produced at our North America mines to manufacture their end products.
Copper Sales
North America
. The majority of the copper produced at our North America copper mines and refined in our El Paso, Texas, refinery is consumed at our rod plants. The remainder of our North America copper production is sold in the form of copper cathode or copper concentrate under U.S. dollar-denominated annual contracts. Cathode and rod contract prices are generally based on the prevailing COMEX monthly average spot price for the month of shipment and include a premium. Generally, copper rod is sold to wire and cable manufacturers, while cathode is sold to rod, brass or tube fabricators. Additionally, during
2012
six percent of our North America mines' copper sales volumes were shipped to Atlantic Copper.
South America
.
Production from our South America mines is sold as copper concentrate or copper cathode under U.S. dollar-denominated, annual and multi-year contracts. Our South America mines generally sell approximately 60 to 70 percent of their copper production in concentrate and the rest as cathode. During
2012
, 15 percent of our South America mines' copper sales volumes were shipped to Atlantic Copper.
Substantially all of South America’s copper concentrate and cathode sales contracts provide final copper pricing in a specified future month (generally one to four months from the shipment date) primarily based on quoted LME monthly average spot copper prices. Revenues from South America’s concentrate sales are recorded net of treatment and refining charges (
i.e.,
fees paid to smelters and refiners that are generally negotiated annually), including any applicable price participation charges that are based on the market price of copper. In addition, because a portion of the metals contained in copper concentrates is unrecoverable from the smelting process, revenues from South America’s concentrate sales are also recorded net of allowances for unrecoverable metals, which are a negotiated term of the contracts and vary by customer.
Indonesia
.
PT Freeport Indonesia sells its production in the form of copper concentrate, which contains significant quantities of gold and silver, under U.S. dollar-denominated, long-term contracts. PT Freeport Indonesia also sells a small amount of copper concentrates in the spot market.
A summary of PT Freeport Indonesia’s aggregate percentage concentrate sales to PT Smelting, Atlantic Copper and to third parties for the last three years follows:
|
|
2012
|
2011
|
2010
|
|||||
|
PT Smelting
|
52
|
%
|
44
|
%
|
36
|
%
|
||
|
Atlantic Copper
|
11
|
%
|
10
|
%
|
21
|
%
|
||
|
Third parties
|
37
|
%
|
46
|
%
|
43
|
%
|
||
|
|
100
|
%
|
100
|
%
|
100
|
%
|
||
Substantially all of PT Freeport Indonesia's concentrate sales contracts provide final copper pricing in a specified future month (generally one to four months from the shipment date) primarily based on quoted LME monthly average spot copper prices. Revenues from PT Freeport Indonesia's concentrate sales are recorded net of royalties, treatment and refining charges, and allowances for unrecoverable metals.
Africa
. TFM sells its production in the form of copper cathode under U.S. dollar-denominated contracts. Substantially all of TFM's cathode sales provide final copper pricing in the month after the shipment date based on quoted LME monthly average spot copper prices. Revenues from TFM's cathode sales are recorded net of royalties and also include adjustments for point-of-sale transportation costs that are negotiated in customer contracts.
Europe
.
Atlantic Copper sells copper cathode directly to rod and brass mills, primarily located in Europe. Atlantic Copper has occasionally sold copper cathode to merchants. Copper cathode is generally sold under annual contracts and priced based on the LME monthly average spot price for the month of arrival at the buyer’s facilities.
Our copper mining operations provide Atlantic Copper with at least half of its concentrate requirements at market prices.
5
Following is a summary of Atlantic Copper's concentrate purchases from our copper mining operations and third parties for the last three years:
|
|
2012
|
2011
|
2010
|
|||||
|
North America copper mines
|
16
|
%
|
2
|
%
|
—
|
%
|
||
|
South America mining
|
31
|
%
|
30
|
%
|
25
|
%
|
||
|
Indonesia mining
|
10
|
%
|
17
|
%
|
28
|
%
|
||
|
Third parties
|
43
|
%
|
51
|
%
|
47
|
%
|
||
|
|
100
|
%
|
100
|
%
|
100
|
%
|
||
Gold Products and Sales
We also produce gold, primarily from the Grasberg minerals district. Gold is primarily sold as a component of our copper concentrate or in slimes, which are a product of the smelting and refining process. Gold generally is priced at the average London price for a specified month near the month of shipment. Revenues from gold sold as a component of our copper concentrate are recorded net of treatment and refining charges. Revenues from gold sold in slimes are recorded net of refining charges.
Molybdenum Products and Sales
We are the world’s largest producer of molybdenum and molybdenum-based chemicals. In addition to production from our Henderson and Climax molybdenum mines, we produce molybdenum concentrate at certain of our North America copper mines, and at our Cerro Verde copper mine in Peru.
The majority of our molybdenum concentrates are processed in our own conversion facilities. Technical-grade oxide is produced from molybdenum concentrates in Sierrita, Arizona; Fort Madison, Iowa; and Rotterdam, the Netherlands. Ferromolybdenum is produced from technical-grade oxide in Stowmarket, United Kingdom, through a metallothermic reduction process. High-quality molybdenum concentrates are converted into molybdenum chemicals at Fort Madison and Rotterdam. Molybdenum generally is priced based on the average
Metals Week
price for the month prior to the month of shipment.
Cobalt, Silver and Other Products and Sales
We produce cobalt hydroxide at the Tenke mines. Cobalt hydroxide is priced at a discount to the average monthly low price published by
Metal Bulletin
for a specified month near the month of shipment. We produce silver as a component of our copper concentrate or in slimes. Silver generally is priced at the average London Bullion Market Association price for a specified month near the month of shipment. Sales of cobalt hydroxide, silver and other
metals, such as rhenium and magnetite, do not represent a significant component of our total consolidated revenues.
MINES
Following are maps and descriptions of our mining operations in North America (including both copper and molybdenum operations), South America, Indonesia and Africa.
North America
In the U.S., most of the land occupied by our copper and molybdenum mines, concentrators, SX/EW facilities, smelter, refinery, rod mills, molybdenum roasters and processing facilities is generally owned by us or is located on unpatented mining claims owned by us. Certain portions of our Bagdad, Sierrita, Miami, Tyrone, Chino, Cobre, Henderson and Climax operations are located on government-owned land and are operated under a Mine Plan of Operations or other use permit. Various federal and state permits or leases on government land are held for purposes incidental to mine operations.
6
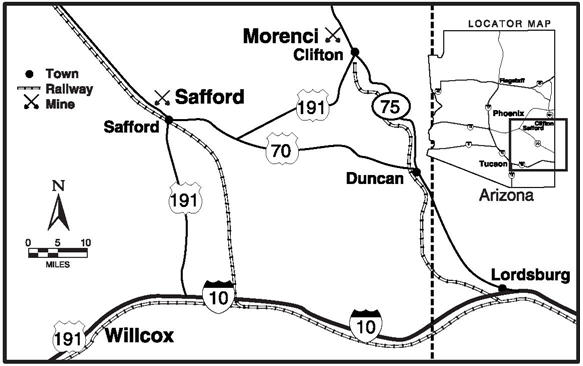
Morenci
We own an 85 percent undivided interest in Morenci, with the remaining 15 percent owned by affiliates of Sumitomo Corporation. Each partner takes in kind its share of Morenci’s production.
Morenci is an open-pit copper mining complex that has been in continuous operation since 1939 and previously was mined through underground workings. Morenci is located in Greenlee County, Arizona, approximately 50 miles northeast of Safford on U.S. Highway 191. The site is accessible by a paved highway and a railway spur.
The Morenci mine is a porphyry copper deposit that has oxide and secondary sulfide mineralization, and primary sulfide mineralization. The predominant oxide copper mineral is chrysocolla. Chalcocite is the most important secondary copper sulfide mineral with chalcopyrite as the dominant primary copper sulfide.
The Morenci operation consists of a 50,000 metric ton-per-day concentrator, that produces copper and molybdenum concentrates; a 68,000 metric ton-per-day crushed-ore leach pad and stacking system; a low-grade run-of-mine (ROM) leaching system; four SX plants; and three EW tank houses that produce copper cathode. Total EW tank house capacity is approximately 900 million pounds of copper per year. Morenci’s concentrate leach, direct-electrowinning facility was commissioned in third-quarter 2007 and processed copper concentrate until early 2009 when it was placed on care-and-maintenance status. The available mining fleet consists of one hundred and three 236-metric ton and nine 363-metric ton haul trucks loaded by 12 shovels with bucket sizes ranging from 47 to 57 cubic meters, which are capable of moving over 800,000 metric tons of material per day.
During 2011, we completed the ramp up of Morenci's mining rates to 635,000 metric tons of ore per day and milling rates to approximately 50,000 metric tons of ore per day. We are currently engaged in a project to expand mining and milling capacity at Morenci to process additional sulfide ore identified through exploratory drilling. The project is targeting incremental annual production of approximately 225 million pounds of copper in 2014 (an approximate 40 percent increase from 2012) through increases in mining rates to
815,000
metric tons of ore per day and milling rates to 115,000 metric tons of ore per day. Refer to “Development Projects and Exploration” for further discussion.
Morenci’s production, including our joint venture partner’s share, totaled
632 million
pounds of copper and
3 million
pounds of molybdenum in
2012
,
614 million
pounds of copper and
2 million
pounds of molybdenum in
2011
and
514 million
pounds of copper in
2010
.
Morenci is located in a desert environment with rainfall averaging 13 inches per year. The highest bench elevation is 2,000 meters above sea level and the ultimate pit bottom is expected to have an elevation of 840 meters above sea level. The Morenci operation encompasses approximately 64,750 acres, comprising approximately 50,800 acres of patented mining claims and other fee lands, approximately 10,900 acres of unpatented mining claims and approximately 3,050 acres of land held by state or federal permits, easements and rights-of-way.
The Morenci operation's electrical power is primarily sourced from Tucson Electric Power Company, Arizona Public Service Company and the Luna Energy facility (in which we own a one-third interest) in Deming, New Mexico. Although we believe the Morenci operation has sufficient water sources to support current operations, we are a party to litigation that may impact our water rights claims or rights to continued use of currently available water supplies, which could adversely affect our water supply for the Morenci operation. Refer to Item 1A. "Risk Factors" and Item 3. “Legal Proceedings,” for further discussion.
7
Bagdad
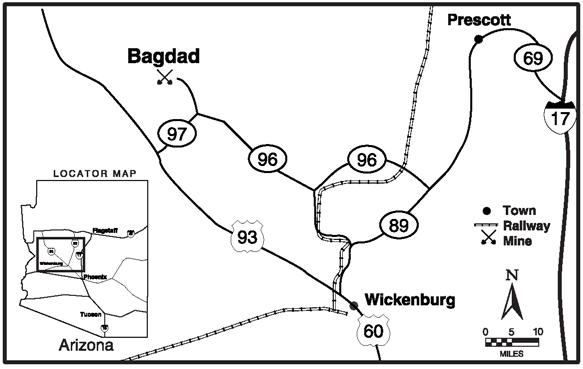
Our wholly owned Bagdad mine is an open-pit copper and molybdenum mining complex located in Yavapai County in west-central Arizona. It is approximately 60 miles west of Prescott and 100 miles northwest of Phoenix. The property can be reached by Arizona Highway 96, which ends at the town of Bagdad. The closest railroad is at Hillside, Arizona, approximately 24 miles southeast on Arizona Highway 96. The open-pit mining operation has been ongoing since 1945, and prior mining was conducted through underground workings.
The Bagdad mine is a porphyry copper deposit containing both sulfide and oxide mineralization. Chalcopyrite and molybdenite are the dominant primary sulfides and are the primary economic minerals in the mine. Chalcocite is the most common secondary copper sulfide mineral, and the predominant oxide copper minerals are chrysocolla, malachite and azurite.
The Bagdad operation consists of a 75,000 metric ton-per-day concentrator that produces copper and molybdenum concentrates, an SX/EW plant that can produce up to 25 million pounds per year of copper cathode from solution generated by low-grade stockpile leaching, and a pressure leach plant to process molybdenum concentrates. The available mining fleet consists of thirty 235-metric ton haul trucks loaded by five shovels with bucket sizes ranging from 40 to 56 cubic meters, which are capable of moving over 200,000 metric tons of material per day.
Bagdad’s production totaled
197 million
pounds of copper and
10 million
pounds of molybdenum in
2012
,
194 million
pounds of copper and
10 million
pounds of molybdenum in
2011
, and
203 million
pounds of copper and
7 million
pounds of molybdenum in
2010
.
Bagdad is located in a desert environment with rainfall averaging 15 inches per year. The highest bench elevation is 1,200 meters above sea level and the ultimate pit bottom is expected to be 310 meters above sea level. The Bagdad operation encompasses approximately 21,750 acres, comprising approximately 21,150 acres of patented mining claims and other fee lands, and approximately 600 acres of unpatented mining claims.
Bagdad receives electrical power from Arizona Public Service Company. Although we believe the Bagdad operation has sufficient water sources to support current operations, we are a party to litigation that may set legal precedents, which could adversely affect our water rights at Bagdad and at our other properties in Arizona. Refer to Item 1A. "Risk Factors" and Item 3. “Legal Proceedings,” for further discussion.
8
Safford
Our wholly owned Safford mine has been in operation since 2007 and is an open-pit copper mining complex located in Graham County, Arizona, approximately eight miles north of the town of Safford and 170 miles east of Phoenix. The site is accessible by paved county road off U.S. Highway 70.
The Safford mine includes two copper deposits that have oxide mineralization overlaying primary copper sulfide mineralization. The predominant oxide copper minerals are chrysocolla and copper-bearing iron oxides with the predominant copper sulfide material being chalcopyrite.
The property is a mine-for-leach project and produces copper cathodes. The operation consists of two open pits feeding a crushing facility with a capacity of 103,000 metric tons per day. The crushed ore is delivered to a single leach pad by a series of overland and portable conveyors. Leach solutions feed a SX/EW facility with a capacity of 240 million pounds of copper per year. A sulphur burner plant is also in operation at Safford, providing a cost-effective source of sulphuric acid used in SX/EW operations. The available mining fleet consists of twenty 235-metric ton haul trucks loaded by four shovels with bucket sizes ranging from 31 to 34 cubic meters, which are capable of moving an average of 225,000 metric tons of material per day.
Safford’s copper production totaled
175 million
pounds in
2012
,
151 million
pounds in
2011
and
143 million
pounds in
2010
.
Safford is located in a desert environment with rainfall averaging 10 inches per year. The highest bench elevation is 1,250 meters above sea level and the ultimate pit bottom is expected to have an elevation of 750 meters above sea level. The Safford operation encompasses approximately 25,000 acres, comprising approximately 21,000 acres of patented lands, approximately 3,950 acres of unpatented lands, and approximately 50 acres of land held by federal permit.
The Safford operation’s electrical power is primarily sourced from Tucson Electric Power Company, Arizona Public Service Company and the Luna Energy facility. Although we believe the Safford operation has sufficient water sources to support current operations, we are a party to litigation that may impact our water right claims or rights to continued use of currently available water supplies, which could adversely affect our water supply for the Safford operation. Refer to Item 1A. "Risk Factors" and Item 3. “Legal Proceedings,” for further discussion.
9
Sierrita
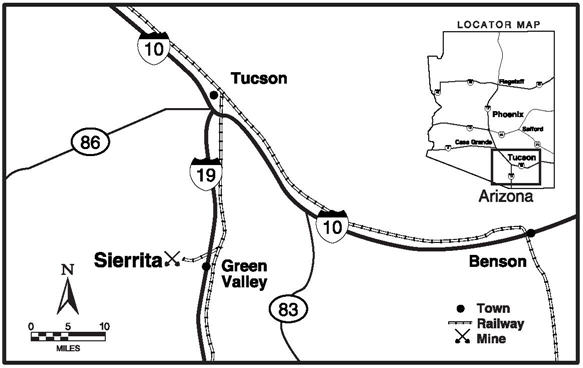
Our wholly owned Sierrita mine has been in operation since 1959 and is an open-pit copper and molybdenum mining complex located in Pima County, Arizona, approximately 20 miles southwest of Tucson and seven miles west of the town of Green Valley and Interstate Highway 19. The site is accessible by a paved highway and by rail.
The Sierrita mine is a porphyry copper deposit that has oxide and secondary sulfide mineralization, and primary sulfide mineralization. The predominant oxide copper minerals are malachite, azurite and chrysocolla. Chalcocite is the most important secondary copper sulfide mineral, and chalcopyrite and molybdenite are the dominant primary sulfides.
The Sierrita operation includes a 102,000 metric ton-per-day concentrator that produces copper and molybdenum concentrates. Sierrita also produces copper from a ROM oxide-leaching system. Cathode copper is plated at the Twin Buttes EW facility, which has a design capacity of approximately 50 million pounds of copper per year. In 2004, a copper sulfate crystal plant began production, which has the capacity to produce 40 million pounds of copper sulfate per year. The Sierrita operation also has molybdenum facilities consisting of a leaching circuit, two molybdenum roasters and a packaging facility. The molybdenum facilities process molybdenum concentrate produced by Sierrita, from our other mines and from third-party sources. The available mining fleet consists of twenty-five 235-metric ton haul trucks loaded by four shovels with bucket sizes ranging from 34 to 56 cubic meters, which are capable of moving an average of 200,000 metric tons of material per day.
Sierrita’s production totaled
157 million
pounds of copper and
21 million
pounds of molybdenum in
2012
,
177 million
pounds of copper and
23 million
pounds of molybdenum in
2011
, and
147 million
pounds of copper and
18 million
pounds of molybdenum in
2010
.
Sierrita is located in a desert environment with rainfall averaging 12 inches per year. The highest bench elevation is 1,160 meters above sea level and the ultimate pit bottom is expected to be 440 meters above sea level. The Sierrita operation, including the adjacent Twin Buttes site (refer to "Development Projects and Exploration" for further discussion), encompasses approximately 37,650 acres, comprising approximately 13,300 acres of patented mining claims, and approximately 24,350 acres of split-estate lands.
Sierrita receives electrical power through long-term contracts with the Tucson Electric Power Company. Although we believe the Sierrita operation has sufficient water sources to support current operations, we are a party to litigation that may impact our water rights claims or rights to continued use of currently available water supplies, which could adversely affect our water supply for the Sierrita operation. Refer to Item 1A. "Risk Factors" and Item 3. “Legal Proceedings,” for further discussion.
10
Miami
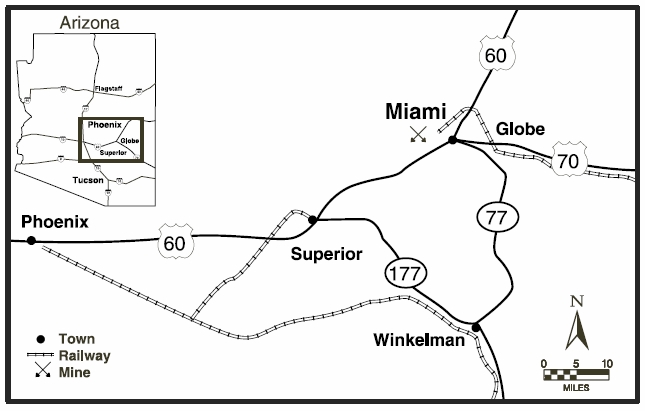
Our wholly owned Miami mine is an open-pit copper mining complex located in Gila County, Arizona, approximately 90 miles east of Phoenix and six miles west of the city of Globe on U.S. Highway 60. The site is accessible by a paved highway and by rail.
The Miami mine is a porphyry copper deposit that has leachable oxide and secondary sulfide mineralization. The predominant oxide copper minerals are chrysocolla, copper-bearing clays, malachite and azurite. Chalcocite and covellite are the most important secondary copper sulfide minerals.
Since about 1915, the Miami mining operation had processed copper ore using both flotation and leaching technologies. Current operations include leaching by the SX/EW process. The design capacity of the SX/EW plant is 200 million pounds of copper per year. The available mining fleet consists of twenty 227-metric ton haul trucks loaded by three shovels with bucket sizes ranging from 31 to 34 cubic meters, which are capable of moving an average of 93,000 metric tons of material per day.
Miami’s copper production totaled
66 million
pounds in both
2012
and
2011
, and
18 million
pounds in
2010
.
Miami is located in a desert environment with rainfall averaging 18 inches per year. The highest bench elevation is 1,390 meters above sea level, and the ultimate pit bottom will have an elevation of 810 meters above sea level. The Miami operation encompasses approximately 9,100 acres, comprising approximately 8,750 acres of patented mining claims and other fee lands, and approximately 350 acres of unpatented mining claims.
Miami receives electrical power through long-term contracts with the Salt River Project and natural gas through long-term contracts with El Paso Natural Gas as the transporter. Although we believe the Miami operation has sufficient water sources to support current operations, we are a party to litigation that may impact our water right claims or rights to continued use of currently available water supplies, which could adversely affect our water supply for the Miami operation. Refer to Item 1A. "Risk Factors" and Item 3. “Legal Proceedings,” for further discussion.
11
Tyrone and Chino
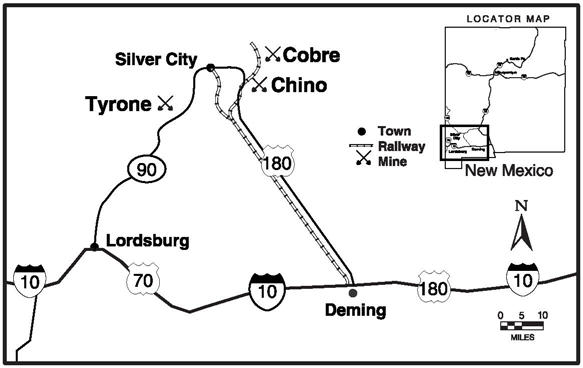
Tyrone
Our wholly owned Tyrone mine is an open-pit copper mining complex which has been in operation since 1967. It is located in southwestern New Mexico in Grant County, approximately 10 miles south of Silver City, New Mexico, along State Highway 90. The site is accessible by paved road and rail.
The Tyrone mine is a porphyry copper deposit. Mineralization is predominantly secondary sulfide consisting of chalcocite with leachable oxide mineralization consisting of chrysocolla.
Copper processing facilities consist of a SX/EW operation with a maximum capacity of approximately 100 million pounds of copper cathodes per year. The available mining fleet consists of twenty-one 240-metric ton haul trucks loaded by three shovels with bucket sizes ranging from 17 to 47 cubic meters, which are capable of moving an average of 136,000 metric tons of material per day.
Tyrone’s copper production totaled
83 million
pounds in
2012
,
76 million
pounds in
2011
and
82 million
pounds in
2010
.
Tyrone is located in a desert environment with rainfall averaging 16 inches per year. The highest bench elevation is 2,000 meters above sea level and the ultimate pit bottom is expected to have an elevation of 1,500 meters above sea level. The Tyrone operation encompasses approximately 35,200 acres, comprising 18,750 acres of patented mining claims and other fee lands, and 16,450 acres of unpatented mining claims.
Tyrone receives electrical power from the Luna Energy facility and from the open market. We believe the Tyrone operation has sufficient water resources to support current operations.
Chino
Our wholly owned Chino mine is an open-pit copper mining complex located in southwestern New Mexico in Grant County, approximately 15 miles east of the town of Silver City off of State Highway 180. The mine is accessible by paved roads and by rail. Chino has been in operation since 1910.
The Chino mine is a porphyry copper deposit with adjacent copper skarn deposits. There is leachable oxide and secondary sulfide mineralization, and millable primary sulfide mineralization. The predominant oxide copper minerals are chrysocolla and azurite. Chalcocite is the most important secondary copper sulfide mineral, and chalcopyrite and molybdenite the dominant primary sulfides.
The Chino operation consists of a 36,000 metric ton-per-day concentrator that produces copper and molybdenum concentrates, and a 150 million pound-per-year SX/EW plant that produces copper cathode from solution generated by ROM leaching. The available mining fleet consists of thirty-four 240-metric ton haul trucks loaded by four shovels with bucket sizes ranging from 42 to 48 cubic meters, which are capable of moving an average of 218,000 metric tons of material per day.
During 2011, we restarted mining and milling activities at the Chino mine. Ramp up activities at Chino are continuing, with production of approximately 250 million pounds of copper per year targeted in 2014. Chino's production totaled
144 million
pounds of copper and
2 million
pounds of molybdenum in
2012
,
69 million
pounds of copper in
2011
and
34 million
pounds of copper in
2010
from residual leaching operations.
12
Chino is located in a desert environment with rainfall averaging 16 inches per year. The highest bench elevation is 2,250 meters above sea level, and the ultimate pit bottom is expected to be 1,500 meters above sea level. The Chino operation encompasses approximately 118,600 acres, comprising approximately 113,200 acres of patented mining claims and other fee lands, and approximately 5,400 acres of unpatented mining claims.
Chino receives power from the Luna Energy facility and from the open market. We believe Chino has sufficient water resources to support current operations.
Henderson and Climax
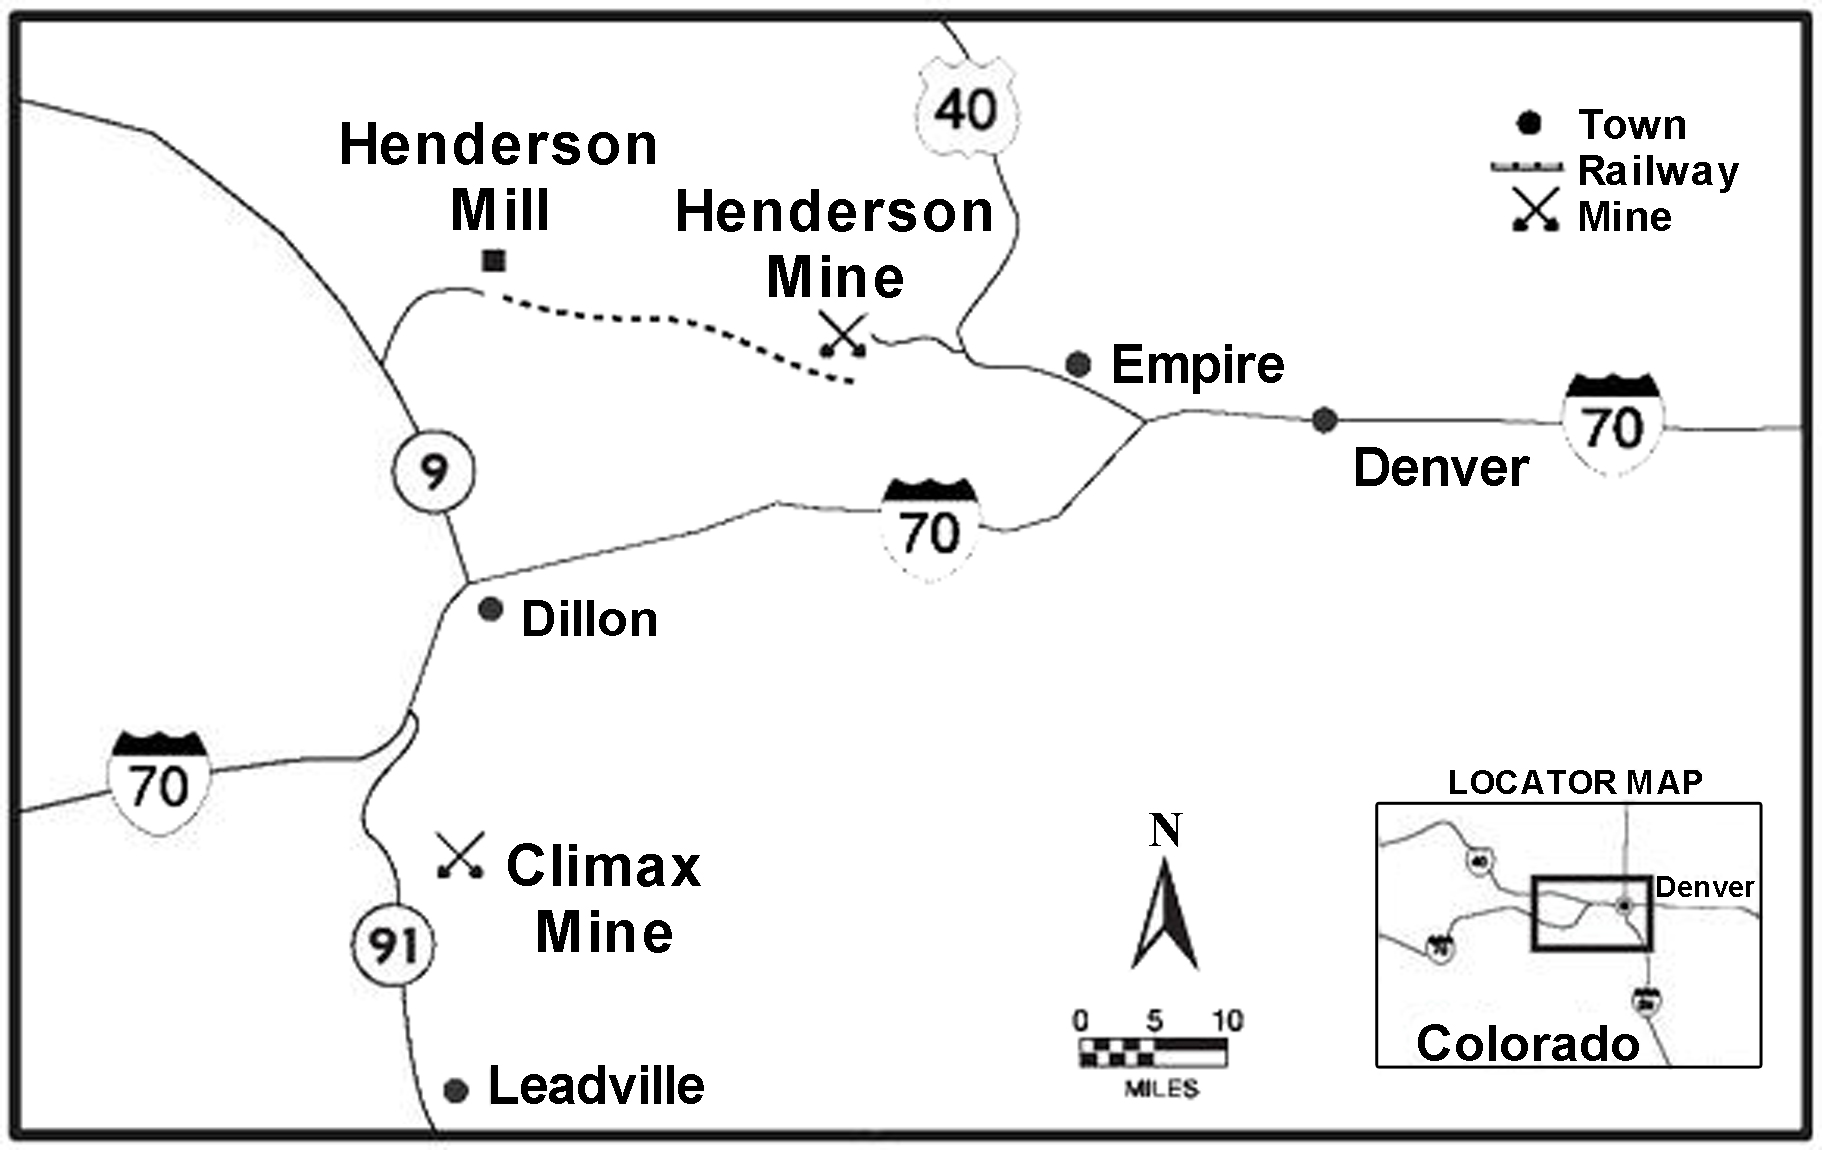
Henderson
Our wholly owned Henderson molybdenum mine has been in operation since 1976 and is located approximately 42 miles west of Denver, Colorado, off U.S. Highway 40. Nearby communities include the towns of Empire, Georgetown and Idaho Springs. The Henderson mill site is located approximately 15 miles west of the mine and is accessible from Colorado State Highway 9. The Henderson mine and mill are connected by a 10-mile conveyor tunnel under the Continental Divide and an additional five-mile surface conveyor. The tunnel portal is located five miles east of the mill.
The Henderson mine is a porphyry molybdenum deposit with molybdenite as the primary sulfide mineral.
The Henderson operation consists of a large block-cave underground mining complex feeding a concentrator with a current capacity of approximately 32,000 metric tons per day. Henderson has the capacity to produce approximately 40 million pounds of molybdenum per year. The majority of the molybdenum concentrate produced is shipped to our Fort Madison, Iowa, processing facility. The available underground mining equipment fleet consists of thirteen 9-metric ton load-haul-dump (LHD) units and six 73-metric ton haul trucks, which deliver ore to a gyratory crusher feeding a series of three overland conveyors to the mill stockpiles.
Henderson’s molybdenum production totaled
34 million
pounds in
2012
,
38 million
pounds in
2011
and
40 million
pounds in
2010
.
The Henderson mine is located in a mountain region with the main access shaft at 3,180 meters above sea level. The main production levels are currently at elevations of 2,200 and 2,350 meters above sea level. This region experiences significant snowfall during the winter months.
The Henderson mine and mill operations encompass approximately 11,900 acres, comprising approximately 11,850 acres of patented mining claims and other fee lands, and an approximate 50-acre easement with the U.S. Forest Service for the surface portion of the conveyor corridor.
Henderson operations receive electrical power through long-term contracts with Xcel Energy and natural gas through long-term contracts with Anadarko Energy Services Company (and effective March 1, 2013, Seminole Energy Services Company) with Xcel Energy as the transporter. We believe the Henderson operation has sufficient water resources to support current operations.
13
Climax
Our wholly owned Climax mine is located 13 miles northeast of Leadville, Colorado, off Colorado State Highway 91 at the top of Fremont Pass. The mine is accessible by paved roads
.
The Climax ore body is a porphyry molybdenum deposit with molybdenite as the primary sulfide mineral.
The Climax open-pit mine, which was commissioned in second-quarter 2012, includes a 25,000 metric ton-per-day mill facility. Molybdenum production from Climax totaled
7 million
pounds in 2012 and is targeted to produce 20 million pounds for 2013, with the potential to produce 30 million pounds per year, depending on market conditions. The fleet consists of two hydraulic shovels and seven 177-metric ton haul trucks.
The Climax mine is located in a mountain region with snowfall averaging 23 feet per year. The highest bench elevation is approximately 4,050 meters above sea level, and the ultimate pit bottom is expected to have an elevation of approximately 3,100 meters above sea level. The operations encompass approximately 14,350 acres.
Climax operations receive electrical power through long-term contracts with Xcel Energy and natural gas through long-term contracts with Anadarko Energy Services Company (and effective March 1, 2013, Seminole Energy Services Company), with Xcel Energy as the transporter. We believe the Climax operation has sufficient water resources to support current operations.
Other North America Mines
In addition to the currently operating mines described above, we have four non-operating copper mines – Ajo, Bisbee and Tohono in Arizona, and Cobre in New Mexico – that have been on care-and-maintenance status for several years and would require additional capital investment, which could be significant, to return them to operating status.
We also own the Twin Buttes copper mine, which ceased operations in 1994 and is adjacent to our Sierrita mine in Arizona. Refer to "Development Projects and Exploration" for further discussion.
South America
At our operations in South America, mine properties and facilities are controlled through mining claims or concessions under the general mining laws of the relevant country. The claims or concessions are owned or controlled by the operating companies in which we or our subsidiaries have a controlling ownership interest. Roads, power lines and aqueducts are controlled by easements.
Cerro Verde

We have a 53.56 percent ownership interest in Cerro Verde, with the remaining 46.44 percent held by SMM Cerro Verde Netherlands B.V. (21.0 percent), Compañia de Minas Buenaventura S.A.A. (19.58 percent) and other stockholders whose shares are publicly traded on the Lima Stock Exchange (5.86 percent).
Cerro Verde is an open-pit copper and molybdenum mining complex that has been in operation since 1976 and is located 20 miles southwest of Arequipa, Peru. The site is accessible by paved highway. A majority of Cerro Verde’s
14
copper cathode production is sold locally and the remaining copper cathodes and concentrate production are transported approximately 70 miles by truck and rail to the Port of Matarani for shipment to international markets.
The Cerro Verde mine is a porphyry copper deposit that has oxide and secondary sulfide mineralization, and primary sulfide mineralization. The predominant oxide copper minerals are brochantite, chrysocolla, malachite and copper “pitch.” Chalcocite and covellite are the most important secondary copper sulfide minerals. Chalcopyrite and molybdenite are the dominant primary sulfides.
Cerro Verde’s current operation consists of an open-pit copper mine, a 120,000 metric ton-per-day concentrator and SX/EW leaching facilities. Leach copper production is derived from a 39,000 metric ton-per-day crushed leach facility and a ROM leach system. This leaching operation has a capacity of approximately 200 million pounds of copper per year. The available fleet consists of thirty-two 230-metric ton haul trucks loaded by four electric shovels with bucket sizes ranging in size from 33 to 53 cubic meters and one hydraulic shovel with a bucket size of 21 cubic meters, which are capable of moving an average of 337,000 metric tons of material per day.
Cerro Verde’s production totaled
595 million
pounds of copper and
8 million
pounds of molybdenum in
2012
,
647 million
pounds of copper and
10 million
pounds of molybdenum in
2011
, and
668 million
pounds of copper and
7 million
pounds of molybdenum in
2010
.
Refer to “Development Projects and Exploration” for further discussion of the large-scale expansion at Cerro Verde that would expand the concentrator facilities to 360,000 metric tons of ore per day and provide incremental annual production of approximately 600 million pounds of copper and 15 million pounds of molybdenum beginning in 2016.
Cerro Verde is located in a desert environment with rainfall averaging 1.5 inches per year and is in an active seismic zone. The highest bench elevation is 2,753 meters above sea level and the ultimate pit bottom is expected to be 1,568 meters above sea level. Cerro Verde has a mining concession covering approximately 157,000 acres plus approximately 25 acres of owned property, and approximately 80 acres of rights-of-way outside the mining concession area.
Cerro Verde receives electrical power under long-term contracts with Kallpa Generación SA and Empresa de Generación Eléctrica de Arequipa. Water for our Cerro Verde processing operations comes from renewable sources through a series of storage reservoirs on the Rio Chili watershed that collect water primarily from seasonal precipitation. Cerro Verde’s participation in the Pillones Reservoir Project has secured water rights that we believe will be sufficient to support Cerro Verde’s current operations.
Cerro Verde has also reached an agreement with the Regional Government of Arequipa, the National Government, Servicio de Agua Potable y Alcantarillado de Arequipa S.A. (SEDAPAR) and other local institutions to allow it to finance the engineering and construction of a wastewater treatment plant for Arequipa, should Cerro Verde proceed with plans for a large-scale expansion. Once Cerro Verde obtains a license for the treated water, it would be used to supplement its existing water supplies to support the potential concentrator expansion.
For further discussion of risks associated with the availability of water, see Item 1A. “Risk Factors.”
El Abra
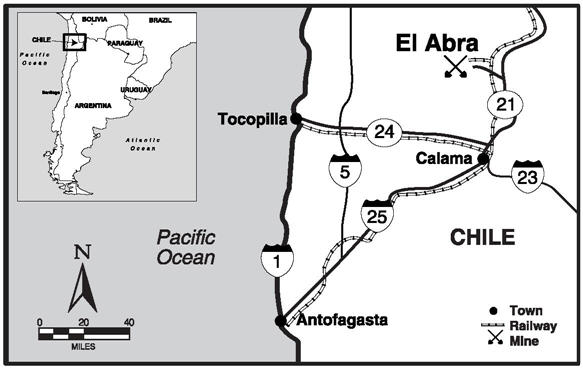
15
We own a 51 percent interest in El Abra, and the remaining 49 percent interest is held by the state-owned copper enterprise Corporación Nacional del Cobre de Chile (CODELCO).
El Abra is an open-pit copper mining complex that has been in operation since 1996 and is located 47 miles north of Calama in Chile’s El Loa province, Region II. The site is accessible by paved highway and by rail.
The El Abra mine is a porphyry copper deposit that has sulfide and oxide mineralization. The predominant primary sulfide copper minerals are bornite and chalcopyrite. There is a minor amount of secondary sulfide mineralization
as chalcocite. The oxide copper minerals are chrysocolla and pseudomalachite. There are lesser amounts of copper-bearing clays and tenorite.
The El Abra operation consists of an open-pit copper mine and a SX/EW facility with a capacity of 500 million pounds of copper cathode per year from a 125,000 metric ton-per-day crushed leach circuit and a similar-sized ROM leaching operation. The available fleet consists of forty 220-metric ton haul trucks loaded by four shovels with buckets ranging in size from 26 to 41 cubic meters, which are capable of moving an average of 223,000 metric tons of material per day.
During 2011, we commenced production from El Abra’s sulfide ores. Production from the sulfide ore is replacing the depleting oxide copper production. El Abra’s copper production totaled
338 million
pounds in
2012
,
274 million
pounds in
2011
and
320 million
pounds in
2010
.
We are also engaged in pre-feasibility studies for a potential large-scale milling operation at El Abra to process additional sulfide material and to achieve higher recoveries. Exploration results at El Abra have identified a significant sulfide resource.
El Abra is located in a desert environment with rainfall averaging less than one inch per year and is in an active seismic zone. The highest bench elevation is 4,180 meters above sea level and the ultimate pit bottom is expected to be 3,430 meters above sea level. El Abra controls a total of approximately 151,300 acres of mining claims covering the ore deposit, stockpiles, process plant, and water wellfield and pipeline. In addition, El Abra has land surface rights for the road between the processing plant and the mine, the water wellfield, power transmission lines and for the water pipeline from the Salar de Ascotán aquifer.
El Abra currently receives electrical power under a long-term contract with Electroandina. Water for our El Abra processing operations comes from pumping of groundwater from the Salar de Ascotán aquifer pursuant to regulatory approval. We believe El Abra has sufficient water rights to support current operations. For a discussion of risks associated with the availability of water, see Item 1A. “Risk Factors.”
Candelaria and Ojos del Salado
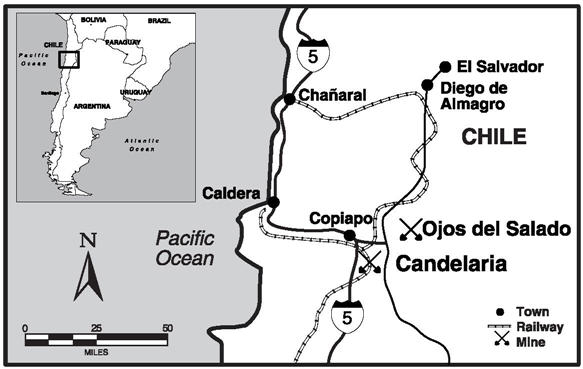
Candelaria
We have an 80 percent ownership interest in Candelaria, with the remaining 20 percent interest owned by affiliates of Sumitomo Corporation.
Candelaria’s open-pit copper mine has been in operation since 1993 and the underground mine has been in operation since 2005. The Candelaria copper mining complex is located approximately 12 miles south of Copiapó in northern Chile’s Atacama province, Region III. The site is accessible by two maintained dirt roads, one coming
16
through the Tierra Amarilla community and the other off of Route 5 of the International Pan-American Highway. Copper concentrates are transported by truck to the Punta Padrones port facility located in Caldera, approximately 50 miles northwest of the mine.
The Candelaria mine is an iron oxide, copper and gold deposit. Primary sulfide mineralization consists of chalcopyrite.
The Candelaria operation consists of an open-pit copper mine and a 6,000 metric ton-per-day underground copper mine, which is mined by sublevel stoping, feeding a 75,000 metric ton-per-day concentrator. The available fleet consists of forty-eight 225-metric ton haul trucks loaded by six shovels with bucket sizes ranging from 28 to 43 cubic meters, which are capable of moving 250,000 metric tons of material per day.
Candelaria’s production totaled
271 million
pounds of copper and
69 thousand
ounces of gold in
2012
,
327 million
pounds of copper and
85 thousand
ounces of gold in
2011
, and
300 million
pounds of copper and
76 thousand
ounces of gold in
2010
.
Candelaria is located in a desert environment with rainfall averaging less than one inch per year and is in an active seismic zone. The highest bench elevation is 675 meters above sea level and the ultimate pit bottom is expected to be 32 meters below sea level. The Candelaria property encompasses approximately 13,400 acres, including approximately 125 acres for the port facility in Caldera. The remaining property consists of mineral rights owned by us in which the surface is not owned but is controlled by us, which is consistent with Chilean law.
Candelaria receives electrical power through long-term contracts with AES Gener S.A., a local energy company. Candelaria’s water supply comes from well fields in the area of Tierra Amarilla and Copiapó that draw water from the Copiapó River aquifer. Because of rapid depletion of that aquifer in recent years, Candelaria is expanding its sources of water supply. During 2010, we completed construction of a pipeline to bring water from a nearby water treatment facility. In addition, we have substantially completed the construction of a desalination plant and pipeline that will supply Candelaria’s longer term water needs. For further discussion of risks associated with the availability of water, see Item 1A. “Risk Factors.”
Ojos del Salado
We have an 80 percent ownership interest in Ojos del Salado, with the remaining 20 percent interest owned by affiliates of Sumitomo Corporation.
The Ojos del Salado operation began commercial production in 1929 and consists of two underground copper mines (Santos and Alcaparrosa) and a 3,800 metric ton-per-day concentrator. The operation is located approximately 10 miles east of Copiapó in northern Chile’s Atacama province, Region III, and is accessible by paved highway. The Ojos del Salado mines are iron oxide and copper and gold deposits. Primary sulfide mineralization consists of chalcopyrite.
The Ojos del Salado operation has a capacity of 3,800 metric tons per day of ore from the Santos underground mine and 4,000 metric tons of ore per day from the Alcaparrosa underground mine. The ore from both mines is mined by sublevel stoping since both the ore and enclosing rocks are competent. The broken ore is removed from the stopes using scoops and loaded into an available fleet of twenty-six 28-metric ton trucks, which transport the ore to the surface. The ore from the Santos mine is hauled directly to the Ojos del Salado mill for processing, and the ore from the Alcaparrosa mine is reloaded into six 54-metric ton trucks and hauled seven miles to the Candelaria mill for processing. The Ojos del Salado concentrator has the capacity to produce over 30 million pounds of copper and 9 thousand ounces of gold per year. Tailings from the Ojos del Salado mill are pumped to the Candelaria tailings facility for final deposition. The Candelaria facility has sufficient capacity for the remaining Ojos del Salado tailings.
Ojos del Salado’s production totaled
53 million
pounds of copper and
14 thousand
ounces of gold in
2012
,
58 million
pounds of copper and
16 thousand
ounces of gold in
2011
, and
66 million
pounds of copper and
17 thousand
ounces of gold in
2010
.
Ojos del Salado is located in a desert environment with rainfall averaging less than one inch per year and is in an active seismic zone. The highest underground level is at an elevation of 500 meters above sea level, with the lowest underground level at 150 meters above sea level. The Ojos del Salado mineral rights encompass approximately 15,800 acres, which includes approximately 6,800 acres of owned land in and around the Ojos del
17
Salado underground mines and plant site. The remaining property consists of mineral rights owned by us in which the surface is not owned but is controlled by us, which is consistent with Chilean law.
Ojos del Salado receives electrical power through long-term contracts with AES Gener S.A. Ojos del Salado’s water supply comes from well fields in the area of Tierra Amarilla and Copiapó that draw water from the Copiapó River aquifer. For a discussion of risks associated with the availability of water, see Item 1A. “Risk Factors.”
Indonesia

Ownership
. PT Freeport Indonesia is a limited liability company organized under the laws of the Republic of Indonesia and incorporated in Delaware. We directly own 81.28 percent of the outstanding common stock of PT Freeport Indonesia and indirectly own 9.36 percent through our wholly owned subsidiary, PT Indocopper Investama; the Indonesian government owns the remaining 9.36 percent.
We have established certain unincorporated joint ventures with Rio Tinto plc (Rio Tinto), under which Rio Tinto has a 40 percent interest in certain assets and future production exceeding specified annual amounts of copper, gold and silver. Refer to Note 2 for further discussion of our joint ventures with Rio Tinto.
We also conduct exploration activities in Papua through two other entities: PT Irja Eastern Minerals (Eastern Minerals), of which we own 100 percent, and PT Nabire Bakti Mining (PTNBM).
Contracts of Work
. PT Freeport Indonesia conducts its current exploration and mining operations in Indonesia through a Contract of Work (COW) with the Indonesian government. The COW governs our rights and obligations relating to taxes, exchange controls, royalties, repatriation and other matters, and was concluded pursuant to the 1967 Foreign Capital Investment Law, which expresses Indonesia’s foreign investment policy and provides basic guarantees of remittance rights and protection against nationalization, a framework for economic incentives and basic rules regarding other rights and obligations of foreign investors. Specifically, the COW provides that the Indonesian government will not nationalize or expropriate PT Freeport Indonesia’s mining operations. Any disputes regarding the provisions of the COW are subject to international arbitration. We have experienced no disputes requiring arbitration during the more than 40 years we have operated in Indonesia.
PT Freeport Indonesia’s original COW was entered into in 1967 and was replaced by a new COW in 1991. The initial term of the current COW expires in 2021, but can be extended for two 10-year periods subject to Indonesian government approval, which pursuant to the COW cannot be withheld or delayed unreasonably. The COW allows us to conduct exploration, mining and production activities in the 24,700-acre Block A area, which is where all of PT Freeport Indonesia’s proven and probable mineral reserves and current mining operations are located. Under the COW, PT Freeport Indonesia also conducts exploration activities in the Block B area. We expect the Block B area to be reduced to approximately 413,000 acres once the Department of Energy and Mineral Resources (DEMR)
18
formally accepts PT Freeport Indonesia's relinquishment of approximately 89,000 acres. Further relinquishments may result from the COW evaluation process discussed below and in Note
14
.
PT Freeport Indonesia pays royalties on copper, gold and silver under its COW, and has agreed to pay additional royalties to the Indonesian government that are not required under its COW. The additional royalties provide further support to the local governments and to the people of the Indonesian province of Papua. PT Freeport Indonesia’s share of the combined royalties totaled
$93 million
in
2012
,
$137 million
in
2011
and
$156 million
in
2010
.
Eastern Minerals is allowed to conduct exploration in Papua through a joint venture agreement under a separate COW. We expect Eastern Minerals' exploration area to be reduced to approximately 183,000 acres once the DEMR formally accepts Eastern Minerals' relinquishment of approximately 264,000 acres, and further relinquishments may result from the COW evaluation process discussed below and in Note
14
. We have requested suspension of activities for the COW from the DEMR while awaiting receipt of permits from the Indonesian government's Department of Forestry that would allow Eastern Minerals to resume exploration activities. We have not received a response to this request from the DEMR.
Under a joint venture agreement through PTNBM, we are allowed to conduct exploration activities under a separate COW in an area in three parcels contiguous to PT Freeport Indonesia’s Block B and one of Eastern Minerals’ blocks. We expect PTNBM's exploration area to be reduced to approximately 200,000 acres once the DEMR formally accepts PTNBM's relinquishment of approximately 293,000 acres, and further relinquishments may result from the COW evaluation process discussed below and in Note
14
. We have also requested suspension of activities for the COW from the DEMR while awaiting receipt of permits from the Indonesian government's Department of Forestry that would allow us to resume exploration activities. We have not received a response to this request from the DEMR.
In 2009, Indonesia enacted a new mining law, which will operate under a licensing system as opposed to the contract of work system that applies to PT Freeport Indonesia, Eastern Minerals and PTNBM. In 2011 and 2010, the Indonesian government promulgated regulations under the 2009 mining law and certain provisions that address existing contracts of work. The laws and regulations provide that contracts of work will continue to be honored until their expiration. However, the regulations attempt to apply certain provisions of the new law to existing contracts of work and may seek to apply the licensing system to any extension periods of contracts of work, even though the terms of PT Freeport Indonesia's COW provide for two 10-year extension periods subject to Indonesian government approval, which pursuant to the COW cannot be withheld or delayed unreasonably. In February 2012, a new regulation was adopted that would require mining companies in Indonesia to process all minerals domestically and possibly ban export of concentrates and other unrefined minerals. PT Freeport Indonesia's COW includes specific provisions providing the right of PT Freeport Indonesia to export product, subject to giving priority to domestic smelting facilities, on a market basis. In connection with the obligations under its COW, in 1995, PT Freeport Indonesia constructed the only copper smelter and refinery in Indonesia, which is owned and operated by PT Smelting (refer to "Smelting Facilities" for further discussion).
In January 2012, the President of Indonesia issued a decree calling for the creation of a team of Ministers to evaluate contracts of work for adjustment to the 2009 Mining Law, and accordingly, to take steps to assess and negotiate size of work areas, government revenues and domestic processing of minerals. We have had discussions with officials of the Indonesian government and are working cooperatively to complete this evaluation process and to obtain an extension of the COW beyond 2021, as provided under the terms of the COW. The COW can only be modified by mutual agreement between PT Freeport Indonesia and the Indonesian government.
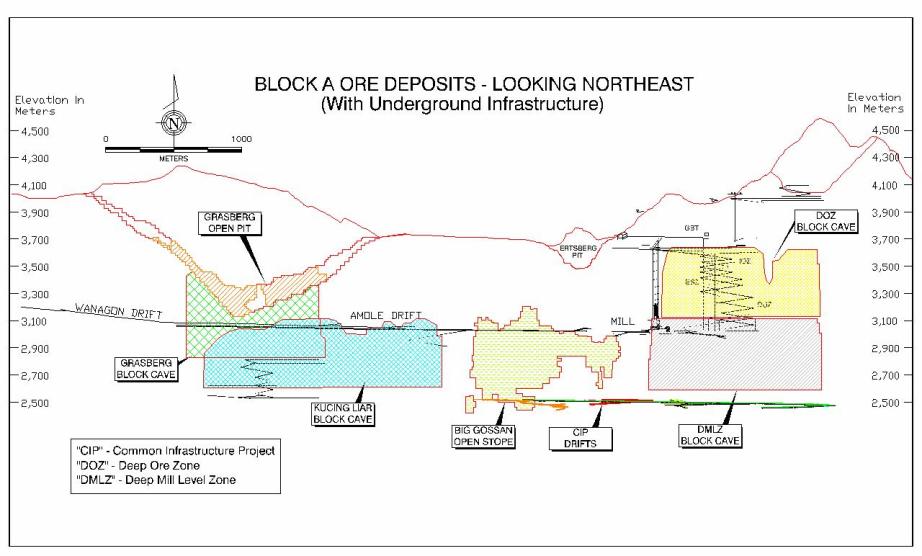
Grasberg Minerals District
. PT Freeport Indonesia operates in the remote highlands of the Sudirman Mountain Range in the province of Papua, Indonesia, which is on the western half of the island of New Guinea. We and our predecessors have been the only operator of exploration and mining activities in Block A since 1967.
The Grasberg minerals district currently has three mines in operation: the Grasberg open pit, the Deep Ore Zone (DOZ) underground mine and the Big Gossan underground mine. We also have several projects in progress in the Grasberg minerals district, primarily related to the development of the large-scale, high-grade underground ore bodies located beneath and nearby the Grasberg open pit. In aggregate, these underground ore bodies are expected to ramp up over several years to approximately 240,000 metric tons of ore per day following the currently anticipated transition from the Grasberg open pit in 2017. Refer to “Development Projects and Exploration” for further discussion.
19
PT Freeport Indonesia’s production, including our joint venture partner’s share, totaled
695 million
pounds of copper and
862 thousand
ounces of gold in
2012
,
882 million
pounds of copper and
1.4 million
ounces of gold in
2011
and
1.3 billion
pounds of copper and
2.0 million
ounces of gold in
2010
.
Our principal source of power for all our Indonesian operations is a coal-fired power plant that we built in 1998. Diesel generators supply peaking and backup electrical power generating capacity. A combination of naturally occurring mountain streams and water derived from our underground operations provides water for our operations. Our Indonesian operations are in an active seismic zone and experience average annual rainfall of approximately 200 inches.
Grasberg Open Pit
We began open-pit mining of the Grasberg ore body in 1990. Open-pit operations are expected to continue through 2016. Production in the open pit is currently at the 3,190- to 3,940- meter elevation level and totaled 43 million metric tons of ore in
2012
, which provided 72 percent of PT Freeport Indonesia's
2012
mill feed.
The current equipment fleet consists of over 500 units. The larger mining equipment directly associated with production includes an available fleet of 157 haul trucks with payloads ranging from 218 to 330 metric tons and 16 shovels with bucket sizes ranging from 30 to 42 cubic meters, which mined an average of 399,000 metric tons of material per day during
2012
, 486,000 metric tons per day in
2011
and 701,000 metric tons per day in
2010
.
Grasberg crushing and conveying systems are integral to the mine and provide the capacity to transport up to 250,000 metric tons per day of Grasberg ore to the mill and 150,000 metric tons per day of overburden to the overburden stockpiles. The remaining overburden is moved by haul trucks.
DOZ underground mine
The DOZ ore body lies vertically below the now depleted Intermediate Ore Zone. We began production from the DOZ ore body in 1989 using open stope mining methods, but suspended production in 1991 in favor of production from the Grasberg open pit. Production resumed in September 2000 using the block-cave method and is at the 3,110-meter elevation level. Production from the DOZ mine averaged
44,600
metric tons of ore per day for the year
2012
(
51,200
metric tons of ore per day in
fourth-quarter
2012
) and is expected to ramp up to the design rate of 80,000 metric tons of ore per day in 2013, following completion of ongoing panel repairs, resulting from the temporary shutdown and suspension of operations in fourth-quarter 2011 and early 2012. Production at the DOZ mine is expected to continue through 2019.
The DOZ mine fleet consists of over 200 pieces of mobile heavy equipment, which is capable of mining an average of 80,000 metric tons of material per day. The primary mining equipment directly associated with production and development includes an available fleet of 44 LHD units and 20 haul trucks. Each production LHD unit typically carry approximately 11 metric tons of ore. Using ore passes and chutes, the LHD units transfer ore into 55-metric ton capacity haul trucks. The trucks dump into two gyratory crushers and the ore is then conveyed to the surface stockpiles for processing.
During
2012
, we completed over 1,600 meters of development drifting in support of the block-cave mining method for the DOZ mine. The success of the development of the DOZ mine, one of the world’s largest underground mines, provides confidence in the future development of PT Freeport Indonesia’s large-scale undeveloped underground ore bodies.
Big Gossan underground mine
The Big Gossan mine lies underground and adjacent to the current mill site. It is a tabular, near vertical ore body with approximate dimensions of 1,200 meters along strike and 800 meters down dip with varying thicknesses from 20 meters to 120 meters. The mine utilizes a blasthole stoping method with delayed paste backfill. Stopes of varying sizes are mined and the ore dropped down passes to a truck haulage level. Trucks are chute loaded and transport the ore to a jaw crusher. The crushed ore is then hoisted vertically via a two-skip production shaft to a level where it is loaded onto a conveyor belt. The belt carries the ore to one of the main underground conveyors where the ore is transferred and conveyed to the surface stockpiles for processing.
The Big Gossan mine averaged
1,600
metric tons of ore per day for the year
2012
(
2,100
metric tons of ore per day in fourth-quarter
2012
) and is expected to ramp up to full rates of 7,000 metric tons of ore per day in 2014.
20
Big Gossan has over 70 pieces of mobile heavy equipment, which includes 11 loaders and 8 trucks used in development and production activities.
Description of Ore Bodies
.
Our Indonesia ore bodies are located within and around two main igneous intrusions, the Grasberg monzodiorite and the Ertsberg diorite. The host rocks of these ore bodies include both carbonate and clastic rocks that form the ridge crests and upper flanks of the Sudirman Range, and the igneous rocks of monzonitic to dioritic composition that intrude them. The igneous-hosted ore bodies (the Grasberg open pit and block cave, and portions of the DOZ block cave) occur as vein stockworks and disseminations of copper sulfides, dominated by chalcopyrite and, to a lesser extent, bornite. The sedimentary-rock hosted ore bodies (portions of the DOZ and all of the Big Gossan) occur as “magnetite-rich, calcium/magnesian skarn” replacements, whose location and orientation are strongly influenced by major faults and by the chemistry of the carbonate rocks along the margins of the intrusions.
The copper mineralization in these skarn deposits is dominated by chalcopyrite, but higher bornite concentrations are common. Moreover, gold occurs in significant concentrations in all of the district’s ore bodies, though rarely visible to the naked eye. These gold concentrations usually occur as inclusions within the copper sulfide minerals, though, in some deposits, these concentrations can also be strongly associated with pyrite.
The following diagram indicates the relative elevations (in meters) of our reported ore bodies.
21
The following map, which encompasses an area of approximately 42 square kilometers (approximately 16 square miles), indicates the relative positions and sizes of our reported ore bodies and their locations.
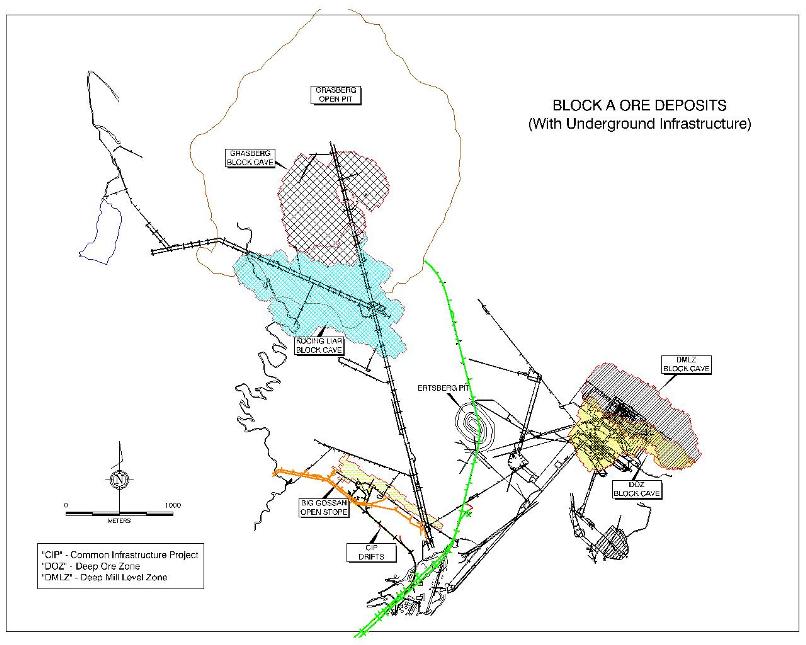
Africa
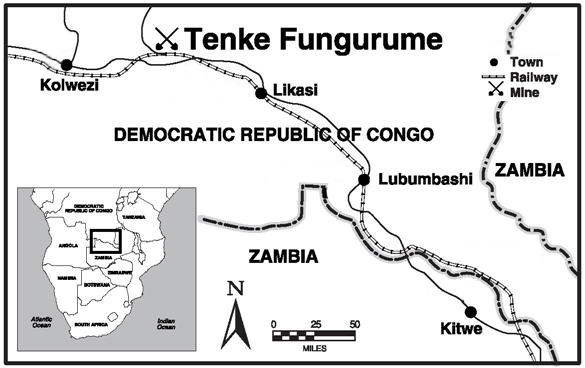
TFM is organized under the laws of the DRC. We own an effective 56 percent interest in TFM, with the remaining ownership interests held by Lundin Mining Corporation (Lundin) (an effective 24 percent interest) and La Générale des Carrières et des Mines (Gécamines), which is wholly owned by the DRC government (a 20 percent non-dilutable interest).
TFM is entitled to mine in the DRC under an Amended and Restated Mining Convention (ARMC) with the DRC government. The original Mining Convention was entered into in 1996 and was replaced with the ARMC in 2005 and further amended in 2010 (approved in 2011). The current ARMC will remain in effect for as long as the Tenke concessions are exploitable.
Effective March 26, 2012, the DRC government issued a Presidential Decree approving modifications to TFM's bylaws following a review (completed in 2010) of TFM's existing mining contracts. Among other changes to the amended ARMC, FCX's effective ownership in TFM was reduced from 57.75 percent to 56 percent.
22
TFM pays a royalty of 2 percent of net revenues under the ARMC, which totaled
$25 million
in
2012
,
$24 million
in
2011
and
$20 million
in
2010
.
The Tenke Fungurume deposits are located in the Katanga province of the DRC approximately 110 miles northwest of Lubumbashi and are accessible by partially paved roads and by rail. The deposits are sediment-hosted copper and cobalt deposits with oxide, mixed oxide-sulfide and sulfide mineralization. The dominant oxide minerals are malachite, pseudomalachite and heterogenite. Important sulfide minerals consist of bornite, carrollite, chalcocite and chalcopyrite.
Initial copper production commenced at the Tenke mines in late March 2009; targeted copper production rates were achieved in September 2009; and the cobalt and sulphuric acid plants were commissioned in third-quarter 2009. Copper and cobalt are recovered through an agitation-leach plant. An expansion of the project to optimize the current plant and increase capacity was substantially completed in fourth-quarter 2012. The expanded mill is capable of throughput of 14,000 metric tons of ore per day, and expanded processing facilities will enable the addition of approximately 150 million pounds of copper production per year. The expansion project included mill upgrades, additional mining equipment, a new tankhouse and an additional sulphuric acid plant (which is expected to be completed in 2015).
The current equipment fleet includes one 10-cubic meter mass excavator, three 17-cubic meter mass excavators, three 12-cubic meter front-end loaders, eleven 7-cubic meter front-end loaders, thirty-two 91-metric ton haul trucks and eighteen 45-metric ton haul trucks.
Production from the Tenke mines totaled
348 million
pounds of copper and
26 million
pounds of cobalt in
2012
,
281 million
pounds of copper and
25 million
pounds of cobalt in
2011
and
265 million
pounds of copper and
20 million
pounds of cobalt in
2010
.
We continue to engage in drilling activities, exploration analyses and metallurgical testing to evaluate the potential of the highly prospective Tenke Fungurume minerals district. These analyses are being incorporated into future plans to evaluate opportunities for expansion. Future expansions are subject to a number of factors, including economic and market conditions and the business and investment climate in the DRC.
The Tenke Fungurume minerals district is located in a tropical region; however, temperatures are moderated by its higher altitudes. Weather in this region is characterized by a dry season and a wet season, each lasting about six months with average rainfall of 47 inches per year. The highest bench elevation is expected to be 1,518 meters above sea level and the ultimate pit bottom is expected to be 1,110 meters above sea level. The Tenke Fungurume deposits are covered by six exploitation permits totaling approximately 394,450 acres.
TFM has entered into long-term power supply and infrastructure funding agreements with La Société Nationale d’Electricité, the state-owned electric utility company serving the region. The results of a recent water exploration program, as well as the regional geological and hydro-geological conditions, indicate that adequate water is available during the expected life of the operation.
23
PRODUCTION DATA
|
|
Years Ended December 31,
|
|
|||||||||||||
|
COPPER
(millions of recoverable pounds)
|
2012
|
2011
|
2010
|
|
2009
|
|
2008
|
|
|||||||
|
(FCX’s net interest in %)
|
|
|
|
|
|
|
|
|
|||||||
|
North America
|
|
|
|
|
|
|
|
|
|||||||
|
Morenci (85%)
a
|
537
|
|
522
|
|
437
|
|
|
428
|
|
|
626
|
|
|
||
|
Bagdad (100%)
|
197
|
|
194
|
|
203
|
|
|
225
|
|
|
227
|
|
|
||
|
Safford (100%)
|
175
|
|
151
|
|
143
|
|
|
184
|
|
|
133
|
|
|
||
|
Sierrita (100%)
|
157
|
|
177
|
|
147
|
|
|
170
|
|
|
188
|
|
|
||
|
Miami (100%)
|
66
|
|
66
|
|
18
|
|
|
16
|
|
|
19
|
|
|||
|
Tyrone (100%)
|
83
|
|
76
|
|
82
|
|
|
86
|
|
|
76
|
|
|
||
|
Chino (100%)
|
144
|
|
69
|
|
34
|
|
|
36
|
|
|
155
|
|
|
||
|
Other (100%)
|
4
|
|
3
|
|
3
|
|
|
2
|
|
|
6
|
|
|
||
|
Total North America
|
1,363
|
|
1,258
|
|
1,067
|
|
|
1,147
|
|
1,430
|
|
||||
|
South America
|
|
|
|
|
|
|
|
|
|||||||
|
Cerro Verde (53.56%)
|
595
|
|
647
|
|
668
|
|
662
|
|
694
|
|
|
||||
|
El Abra (51%)
|
338
|
|
274
|
|
320
|
|
358
|
|
366
|
|
|
||||
|
Candelaria/Ojos del Salado (80%)
|
324
|
|
385
|
|
366
|
|
370
|
|
446
|
|
|
||||
|
Total South America
|
1,257
|
|
1,306
|
|
1,354
|
|
1,390
|
|
1,506
|
|
|||||
|
Indonesia
|
|
|
|
|
|
|
|
|
|||||||
|
Grasberg (90.64%)
b
|
695
|
|
846
|
|
1,222
|
|
1,412
|
|
1,094
|
|
|
||||
|
Africa
|
|
|
|
|
|
|
|
|
|||||||
|
Tenke Fungurume (56%)
c
|
348
|
|
281
|
|
265
|
|
154
|
|
—
|
|
|
||||
|
Consolidated
|
3,663
|
|
3,691
|
|
3,908
|
|
4,103
|
|
4,030
|
|
|
||||
|
Less noncontrolling interests
|
723
|
|
710
|
|
766
|
|
754
|
|
693
|
|
|
||||
|
Net
|
2,940
|
|
2,981
|
|
3,142
|
|
3,349
|
|
3,337
|
|
|
||||
|
GOLD
(thousands of recoverable ounces)
|
|
|
|
|
|
|
|
|
|||||||
|
(FCX’s net interest in %)
|
|
|
|
|
|
|
|
|
|||||||
|
North America (100%)
a
|
13
|
|
10
|
|
7
|
|
4
|
|
14
|
|
|
||||
|
South America (80%)
|
83
|
|
101
|
|
93
|
|
92
|
|
114
|
|
|||||
|
Indonesia (90.64%)
b
|
862
|
|
1,272
|
|
1,786
|
|
2,568
|
|
1,163
|
|
|
||||
|
Consolidated
|
958
|
|
1,383
|
|
1,886
|
|
|
2,664
|
|
|
1,291
|
|
|||
|
Less noncontrolling interests
|
98
|
|
139
|
|
186
|
|
258
|
|
132
|
|
|
||||
|
Net
|
860
|
|
1,244
|
|
1,700
|
|
2,406
|
|
1,159
|
|
|
||||
|
MOLYBDENUM
(millions of recoverable pounds)
|
|
|
|
|
|
|
|
|
|||||||
|
(FCX’s net interest in %)
|
|
|
|
|
|
|
|
|
|||||||
|
Henderson (100%)
|
34
|
|
38
|
|
40
|
|
27
|
|
40
|
|
|||||
|
Climax (100%)
d
|
7
|
|
—
|
|
—
|
|
—
|
|
—
|
|
|||||
|
North America copper mines (100%)
a
|
36
|
|
35
|
|
25
|
|
25
|
|
30
|
|
|||||
|
Cerro Verde (53.56%)
|
8
|
|
10
|
|
7
|
|
2
|
|
3
|
|
|
||||
|
Consolidated
|
85
|
|
83
|
|
72
|
|
54
|
|
73
|
|
|||||
|
Less noncontrolling interest
|
4
|
|
5
|
|
3
|
|
1
|
|
1
|
|
|
||||
|
Net
|
81
|
|
78
|
|
69
|
|
53
|
|
72
|
|
|
||||
|
COBALT
(millions of contained pounds)
|
|||||||||||||||
|
(FCX's net interest in %)
|
|||||||||||||||
|
Consolidated
- Tenke Fungurume (56%)
c
|
26
|
|
25
|
|
20
|
|
—
|
|
—
|
|
|||||
|
Less noncontrolling interests
|
11
|
|
11
|
|
8
|
|
—
|
|
—
|
|
|
||||
|
Net
|
15
|
|
14
|
|
12
|
|
—
|
|
—
|
|
|
||||
|
a.
|
Amounts are net of Morenci’s 15 percent joint venture partner interest.
|
|
b.
|
Amounts are net of Grasberg’s joint venture partner’s interest, which varies in accordance with terms of the joint venture agreement.
|
|
c.
|
Initial copper production commenced at the Tenke mines in March 2009. Effective March 26, 2012, FCX's effective ownership interest in TFM was prospectively reduced from 57.75 percent to 56 percent.
|
|
d.
|
The Climax molybdenum mine began commercial operations in May 2012.
|
24
SALES DATA
|
|
Years Ended December 31,
|
|
||||||||||||||||||
|
COPPER
(millions of recoverable pounds)
|
2012
|
2011
|
2010
|
|
2009
|
|
2008
|
|
||||||||||||
|
(FCX’s net interest in %)
|
|
|
|
|
|
|
|
|||||||||||||
|
North America
|
|
|
|
|
|
|
|
|||||||||||||
|
Morenci (85%)
a
|
532
|
|
521
|
|
434
|
|
459
|
|
|
646
|
|
|
||||||||
|
Bagdad (100%)
|
196
|
|
201
|
|
206
|
|
225
|
|
|
226
|
|
|
||||||||
|
Safford (100%)
|
175
|
|
147
|
|
155
|
|
176
|
|
|
107
|
|
|
||||||||
|
Sierrita (100%)
|
162
|
|
175
|
|
152
|
|
172
|
|
|
184
|
|
|
||||||||
|
Miami (100%)
|
68
|
|
59
|
|
17
|
|
16
|
|
|
20
|
|
|||||||||
|
Tyrone (100%)
|
82
|
|
79
|
|
83
|
|
85
|
|
|
71
|
|
|
||||||||
|
Chino (100%)
|
132
|
|
62
|
|
35
|
|
52
|
|
|
174
|
|
|
||||||||
|
Other (100%)
|
4
|
|
3
|
|
3
|
|
2
|
|
|
6
|
|
|
||||||||
|
Total North America
|
1,351
|
|
1,247
|
|
1,085
|
|
1,187
|
|
1,434
|
|
||||||||||
|
South America
|
|
|
|
|
|
|
|
|||||||||||||
|
Cerro Verde (53.56%)
|
589
|
|
657
|
|
654
|
|
667
|
|
701
|
|
|
|||||||||
|
El Abra (51%)
|
338
|
|
276
|
|
315
|
|
361
|
|
365
|
|
|
|||||||||
|
Candelaria/Ojos del Salado (80%)
|
318
|
|
389
|
|
366
|
|
366
|
|
455
|
|
|
|||||||||
|
Total South America
|
1,245
|
|
1,322
|
|
1,335
|
|
1,394
|
|
1,521
|
|
||||||||||
|
Indonesia
|
|
|
|
|
|
|
|
|||||||||||||
|
Grasberg (90.64%)
b
|
716
|
|
846
|
|
1,214
|
|
1,400
|
|
1,111
|
|
|
|||||||||
|
Africa
|
|
|
|
|
|
|
|
|||||||||||||
|
Tenke Fungurume (56%)
c
|
336
|
|
283
|
|
262
|
|
130
|
|
—
|
|
|
|||||||||
|
Consolidated sales from mines
|
3,648
|
|
3,698
|
|
3,896
|
|
4,111
|
|
4,066
|
|
|
|||||||||
|
Less noncontrolling interests
|
717
|
|
717
|
|
756
|
|
746
|
|
699
|
|
|
|||||||||
|
Net
|
2,931
|
|
2,981
|
|
3,140
|
|
3,365
|
|
3,367
|
|
|
|||||||||
|
Consolidated sales from mines
|
3,648
|
|
3,698
|
|
3,896
|
|
4,111
|
|
4,066
|
|
|
|||||||||
|
Purchased copper
|
125
|
|
223
|
|
182
|
|
166
|
|
483
|
|
|
|||||||||
|
Total copper sales, including purchases
|
3,773
|
|
3,921
|
|
4,078
|
|
4,277
|
|
4,549
|
|
|
|||||||||
|
Average realized price per pound
|
$
|
3.60
|
|
$
|
3.86
|
|
$
|
3.59
|
|
$
|
2.60
|
|
$
|
2.69
|
|
|||||
|
GOLD
(thousands of recoverable ounces)
|
|
|
|
|
|
|
|
|||||||||||||
|
(FCX’s net interest in %)
|
|
|
|
|
|
|
|
|||||||||||||
|
North America (100%)
a
|
13
|
|
7
|
|
5
|
|
6
|
|
16
|
|
|
|||||||||
|
South America (80%)
|
82
|
|
101
|
|
93
|
|
90
|
|
116
|
|
||||||||||
|
Indonesia (90.64%)
b
|
915
|
|
1,270
|
|
1,765
|
|
2,543
|
|
1,182
|
|
|
|||||||||
|
Consolidated sales from mines
|
1,010
|
|
1,378
|
|
1,863
|
|
2,639
|
|
1,314
|
|
||||||||||
|
Less noncontrolling interests
|
102
|
|
139
|
|
184
|
|
256
|
|
134
|
|
|
|||||||||
|
Net
|
908
|
|
1,239
|
|
1,679
|
|
2,383
|
|
1,180
|
|
|
|||||||||
|
Consolidated sales from mines
|
1,010
|
|
1,378
|
|
1,863
|
|
2,639
|
|
1,314
|
|
|
|||||||||
|
Purchased gold
|
2
|
|
1
|
|
1
|
|
1
|
|
2
|
|
|
|||||||||
|
Total gold sales, including purchases
|
1,012
|
|
1,379
|
|
1,864
|
|
2,640
|
|
1,316
|
|
|
|||||||||
|
Average realized price per ounce
|
$
|
1,665
|
|
$
|
1,583
|
|
$
|
1,271
|
|
$
|
993
|
|
$
|
861
|
|
|||||
|
MOLYBDENUM
(millions of recoverable pounds)
|
|
|
|
|
|
|
|
|||||||||||||
|
Consolidated sales from mines
|
83
|
|
79
|
|
67
|
|
58
|
|
71
|
|
||||||||||
|
Less noncontrolling interests
|
4
|
|
4
|
|
3
|
|
1
|
|
1
|
|
|
|||||||||
|
Net
|
79
|
|
75
|
|
64
|
|
57
|
|
70
|
|
|
|||||||||
|
Consolidated sales from mines
|
83
|
|
79
|
|
67
|
|
58
|
|
71
|
|
|
|||||||||
|
Purchased molybdenum
|
—
|
|
—
|
|
2
|
|
6
|
|
8
|
|
|
|||||||||
|
Total molybdenum sales, including purchases
|
83
|
|
79
|
|
69
|
|
64
|
|
79
|
|
|
|||||||||
|
Average realized price per pound
|
$
|
14.26
|
|
$
|
16.98
|
|
$
|
16.47
|
|
$
|
12.36
|
|
$
|
30.55
|
|
|
||||
|
COBALT
(millions of contained pounds)
|
||||||||||||||||||||
|
(FCX's net interest in %)
|
||||||||||||||||||||
|
Consolidated
-
Tenke Fungurume (56%)
c
|
25
|
|
25
|
|
20
|
|
—
|
|
—
|
|
||||||||||
|
Less noncontrolling interests
|
11
|
|
10
|
|
8
|
|
—
|
|
|
|
||||||||||
|
Net
|
14
|
|
15
|
|
12
|
|
—
|
|
—
|
|
||||||||||
|
Average realized price per pound
|
$
|
7.83
|
|
$
|
9.99
|
|
$
|
10.95
|
|
$
|
—
|
|
$
|
—
|
|
|||||
|
a.
|
Amounts are net of Morenci’s joint venture partner’s 15 percent interest.
|
|
b.
|
Amounts are net of Grasberg’s joint venture partner’s interest, which varies in accordance with terms of the joint venture agreement.
|
|
c.
|
Initial copper production commenced at the Tenke mines in March 2009. Effective March 26, 2012, FCX's effective ownership interest in TFM was prospectively reduced from 57.75 percent to 56 percent.
|
25
DEVELOPMENT PROJECTS AND EXPLORATION
We have several projects and potential opportunities to expand production volumes, extend mine lives and develop large-scale underground ore bodies. Our near-term major development projects, which will require substantial additional capital investment, are presented below. Also refer to MD&A for further discussion of these projects, our other development projects and exploration activities.
Considering the long-term nature and large size of our development projects, actual costs and timing could vary from estimates. We continue to review our mine development and processing plans to maximize the value of our reserves.
Morenci
. We are engaged in a project to expand mining and milling capacity at Morenci to process additional sulfide ores identified through exploratory drilling. The approximate $1.4 billion project is targeting incremental annual production of approximately 225 million pounds of copper in 2014 through an increase in milling rates from 50,000 metric tons of ore per day to 115,000 metric tons of ore per day, and mining rates from 700,000 short tons per day (635,000 metric tons per day) to 900,000 short tons per day (
815,000
metric tons per day). Engineering activities are progressing and construction activities are under way.
Twin Buttes
. In December 2009, we purchased the Twin Buttes copper mine, which ceased operations in 1994 and is adjacent to our Sierrita mine. The purchase provides significant synergies in the Sierrita minerals district, including the potential for expanded mining activities and access to material that can be used for Sierrita tailings and stockpile reclamation purposes. We are conducting drilling on the property and metallurgical studies to support a feasibility study expected to commence in 2013.
Cerro Verde
. We are engaged in a large-scale expansion at Cerro Verde. The approximate $4.4 billion project would expand the concentrator facilities from 120,000 metric tons of ore per day to 360,000 metric tons of ore per day and provide incremental annual production of approximately 600 million pounds of copper and 15 million pounds of molybdenum beginning in 2016. Cerro Verde received approval of the environmental impact assessment in fourth-quarter 2012. Detailed engineering and procurement of long-lead items are under way, and construction is expected to commence in 2013.
El Abra
. We are engaged in pre-feasibility studies for a potential large-scale milling operation at El Abra to process additional sulfide material and to achieve higher recoveries. Exploration results at El Abra have identified a significant sulfide resource.
Grasberg
. We have several projects in progress in the Grasberg minerals district, primarily related to the development of large-scale, high-grade underground ore bodies located beneath and nearby the Grasberg open pit. In aggregate, these ore bodies are expected to ramp up over several years to approximately 240,000 metric tons of ore per day following the currently anticipated transition from the Grasberg open pit in 2017. Development of the Deep Mill Level Zone (DMLZ) is advancing. The DMLZ is expected to commence production in 2015 and the Grasberg Block Cave mine is scheduled to commence production in 2017. Over the next five years, estimated aggregate capital spending on these projects is currently expected to average $715 million per year ($565 million per year net to PT Freeport Indonesia). Refer to MD&A for further discussion of these projects and the Common Infrastructure project.
In addition to the near-term development projects in progress in the Grasberg minerals district, we also have an additional long-term underground mine development project in the Grasberg minerals district for the Kucing Liar ore body, which lies on the southern flank of and underneath the southern portion of the Grasberg open pit at the 2,605-meter elevation level. We expect to mine the Kucing Liar ore body using the block-cave method; aggregate capital cost estimates for development of the Kucing Liar ore body are projected to approximate $2 billion (which are expected to be made between 2019 and 2031). Additionally, our current mine development plans include approximately $3 billion of capital expenditures at our processing facilities to optimize the handling of underground ore types once the Grasberg open-pit operations cease (we expect substantially all of these expenditures to be made between 2016 and 2034).
26
SMELTING FACILITIES
Atlantic Copper
. Our wholly owned Atlantic Copper smelter and refinery is located on land concessions from the Huelva, Spain, port authorities, which expire in 2027.
The design capacity of the smelter is approximately 300,000 metric tons of copper per year and the refinery currently has a capacity of 285,000 metric tons of copper per year. During
2012
, Atlantic Copper treated approximately 1.1 million metric tons of concentrate and scrap and produced 295,200 metric tons of copper anodes from its smelter and 274,400 metric tons of copper cathodes from its refinery.
In May 2011, Atlantic Copper successfully completed a scheduled 26-day maintenance turnaround. Major maintenance turnarounds (which take approximately 50 days to complete) typically are expected to occur approximately every eight years for Atlantic Copper, with short-term maintenance turnarounds in the interim. The next long-term maintenance turnaround is scheduled for the second half of 2013.
We made no capital contributions to Atlantic Copper in 2012 and $202 million in 2011. No capital contributions were made for the years 2005 through 2010. We also loan funds to Atlantic Copper from time to time. At
December 31, 2012
, loans to Atlantic Copper totaled
$434 million
.
PT Smelting
. PT Freeport Indonesia’s 1991 COW required us to construct or cause to be constructed a smelter in Indonesia if we and the Indonesian government determined that such a project would be economically viable. In 1995, following the completion of a feasibility study, we entered into agreements relating to the formation of PT Smelting, an Indonesian company, and the construction of the copper smelter and refinery in Gresik, Indonesia. PT Smelting owns and operates the smelter and refinery. PT Freeport Indonesia, Mitsubishi Materials Corporation (Mitsubishi Materials), Mitsubishi Corporation Unimetals Ltd. (Mitsubishi) and JX Nippon Mining & Metals Corporation (Nippon) own 25 percent, 60.5 percent, 9.5 percent, and 5 percent, respectively, of the outstanding PT Smelting common stock.
PT Freeport Indonesia’s contract with PT Smelting provides for the supply of 100 percent of the copper concentrate requirements (subject to a minimum or maximum rate) necessary for PT Smelting to produce 205,000 metric tons of copper annually on a priority basis. PT Freeport Indonesia also sells copper concentrate to PT Smelting (at market rates) for quantities in excess of 205,000 metric tons of copper annually. Refer to Note 2 for further discussion of our investment in PT Smelting.
During
2012
, PT Smelting treated 855,500 metric tons of concentrate and produced 198,400 metric tons of copper anodes from its smelter and 197,200 metric tons of copper cathodes from its refinery.
In May 2012, PT Smelting completed a scheduled 30-day maintenance turnaround. Major maintenance turnarounds (which range from two weeks to a month to complete) typically are expected to occur approximately every two years for PT Smelting, with significantly shorter term maintenance turnarounds in the interim. The next major maintenance turnaround is scheduled for 2014.
Miami Smelter
. We own and operate a smelter at our Miami, Arizona, mining operation. The smelter has been in production for approximately 100 years and has been upgraded numerous times during that period to implement new technologies, to improve production and to comply with air quality requirements. Additionally, new air quality regulations for sulphur dioxide emissions will require the Miami smelter to implement additional new technologies to meet these requirements or limit its operations (refer to Item 1A. “Risk Factors” for further discussion).
The Miami smelter processes copper concentrate primarily from our Arizona copper mines. Concentrate processed through the smelter totaled approximately 620,000 metric tons in
2012
. In addition, because sulphuric acid is a by-product of smelting concentrates, the Miami smelter is also the most significant source of sulphuric acid for our North America leaching operations.
Major maintenance turnarounds (which take approximately three weeks to complete) typically occur approximately every 14 months for the Miami smelter, with shorter term maintenance turnarounds in the interim.
27
OTHER PROPERTIES AND INVESTMENTS
Rod & Refining Operations
. Our Rod & Refining operations consist of conversion facilities located in North America, including a refinery in El Paso, Texas; rod mills in El Paso, Texas, Norwich, Connecticut, and Miami, Arizona; and a specialty copper products facility in Bayway, New Jersey. We refine our copper anode production from our Miami smelter at our El Paso refinery. The El Paso refinery has the potential to operate at an annual production capacity of about 900 million pounds of copper cathode, which is sufficient to refine all of the copper anode we produce at Miami. Our El Paso refinery also produces nickel carbonate, copper telluride, and autoclaved slimes material containing gold, silver, platinum and palladium.
Molybdenum Conversion Facilities
. We process molybdenum concentrates at our conversion plants in the U.S. and Europe into such products as technical-grade molybdic oxide, ferromolybdenum, pure molybdic oxide, ammonium molybdates, molybdenum disulfide and molybdenum metal powder. We operate molybdenum roasters in Sierrita, Arizona; Fort Madison, Iowa; and Rotterdam, the Netherlands.
The conversion facility located at our Sierrita copper mine consists of two molybdenum roasters that process molybdenum concentrates produced at our mines and on a toll basis for third parties. The facility produces molybdenum oxide and related products. In addition, our Bagdad copper mine has a pressure leach plant that processes molybdenum concentrates.
The Fort Madison facility consists of two molybdenum roasters, a sulphur dioxide conversion plant, a metallurgical (technical oxide) packaging facility, and a chemical conversion plant, which includes a wet-chemicals plant, sublimation equipment and molybdenum disulfide processing and packaging. In the chemical plant, molybdic oxide is further refined into various high-purity molybdenum chemicals for a wide range of uses by chemical and catalyst manufacturers. In addition to metallurgical oxide products, the Fort Madison facility produces ammonium dimolybdate, pure molybdic oxide, ammonium heptamolybdate, ammonium octamolybdate, sodium molybdate, sublimed pure molybdic oxide and molybdenum disulfide.
The Rotterdam facility consists of a molybdenum roaster, sulphuric acid plant, metallurgical packaging
facility and chemical conversion plant. The plant produces metallurgical products primarily for third parties. Ammonium dimolybdate and pure molybdic oxide are produced in the wet-chemicals plant.
We also produce ferromolybdenum for customers worldwide at our conversion plant located in Stowmarket, United Kingdom. The plant is operated both as an internal and external customer tolling facility.
McMoRan Exploration Co. (MMR)
. MMR is engaged in the exploration, development and production of oil and natural gas in the shallow waters of the Gulf of Mexico Shelf. In December 2010, we purchased 500,000 shares of MMR’s 5.75% Convertible Perpetual Preferred Stock for an aggregate purchase price of $500 million (refer to Note
6
for further discussion). In connection with the purchase, we entered into a registration rights agreement and a stockholder agreement with MMR. Several of our directors and executive officers also serve as directors or executive officers of MMR, and our wholly owned subsidiary FM Services Company (FM Services) provides certain executive, technical administrative, accounting, financial, tax and other services to us and to MMR on a cost-reimbursement basis. Refer to Part III, Item 13. “Certain Relationships and Related Transactions, and Director Independence,” for additional information. Also refer to Note
1
for discussion of FCX's proposed acquisition of MMR.
SOURCES AND AVAILABILITY OF RAW MATERIALS
Our copper mining operations require significant energy, principally diesel, electricity, coal and natural gas, most of which is obtained from third parties under long-term contracts. Energy represented approximately
21 percent
of our
2012
consolidated copper production costs and included purchases of approximately
255 million
gallons of diesel fuel;
6,800
gigawatt hours of electricity at our North America, South America and Africa copper mining operations (we generate all of our power at our Indonesia mining operation);
700 thousand
metric tons of coal for our coal power plant in Indonesia; and
1 million
MMBTU (million British thermal units) of natural gas at certain of our North America mines. For
2013
, we estimate energy costs will approximate
21 percent
of our consolidated copper production costs.
28
Sulphuric acid is used in the SX/EW process and is produced as a by-product of the smelting process at our smelters and from our sulphur burners at the Safford and Tenke mines. Sulphuric acid needs in excess of the sulphuric acid produced by our operations are purchased from third parties.
Our mining operations also require significant quantities of water for mining, ore processing and related support facilities. Although we believe our mining operations have sufficient water rights, the loss of water rights for any of our mines, in whole or in part, or shortages of water to which we have rights, could require us to curtail or shut down mining operations. For a further discussion of risks and legal proceedings associated with the availability of water, refer to Item 1A. “Risk Factors” and Item 3. “Legal Proceedings.”
COMPETITION
The top 10 producers of copper comprise approximately 50 percent of total worldwide mined copper production. We currently rank second among those producers at approximately eight percent of total worldwide estimated mined copper production. Our competitive position is based on the quality and grade of our ore bodies and our ability to manage costs compared with other producers. We have a diverse portfolio of mining operations with varying ore grades and cost structures. Our costs are driven by the location, grade and nature of our ore bodies and the level of input costs, including energy, labor and equipment. The metals markets are cyclical and our ability to maintain our competitive position over the long term is based on our ability to acquire and develop quality deposits, hire and retain a skilled workforce and to manage our costs.
LABOR MATTERS
At
December 31, 2012
, we employed approximately 34,000 people (approximately 12,700 in Indonesia, 11,800 in North America, 5,400 in South America, 3,200 in Africa and 900 in Europe and other locations). Additionally, we have contractors that have personnel at many of our operations, including approximately 10,700 at our Grasberg
minerals district, 10,400 at our South America mining operations, 4,000 at our Tenke Fungurume minerals district, 1,600 in North America and 400 at Atlantic Copper.
The number of employees represented by unions at December 31, 2012, and the expiration date of the applicable union agreements are listed below. Refer to Item 1A. "Risk Factors" for further information on labor agreements.
|
Location
|
Number of Unions
|
Number of
Union-
Represented Employees
|
Expiration Date
|
||||
|
PT Freeport Indonesia – Indonesia
|
1
|
|
8,774
|
|
September 2013
|
||
|
Tenke Fungurume – DRC
|
6
|
|
3,216
|
|
August 2013
|
a
|
|
|
Cerro Verde – Peru
|
2
|
|
1,674
|
|
August 2014
|
||
|
El Abra – Chile
|
2
|
|
969
|
|
May 2016
|
||
|
Candelaria – Chile
|
2
|
|
908
|
|
December 2016
|
||
|
Atlantic Copper – Spain
|
2
|
|
422
|
|
December 2011
|
b
|
|
|
Chino – New Mexico
|
1
|
|
344
|
|
November 2014
|
||
|
Rotterdam – The Netherlands
|
2
|
|
57
|
|
March 2015
|
||
|
Bayway – New Jersey
|
1
|
|
40
|
|
April 2013
|
||
|
Aurex – Chile
|
1
|
|
41
|
|
December 2013
|
||
|
Stowmarket – United Kingdom
|
1
|
|
39
|
|
May 2014
|
||
a. In September 2012, TFM negotiated a 4-year salary scale with union-represented employees.
b. Negotiations are in progress while employees continue to work under the provisions of the expired contract.
29
ENVIRONMENTAL AND RECLAMATION MATTERS
The cost of complying with environmental laws is a fundamental and substantial cost of our business. For information about environmental regulation, litigation and related costs, refer to Item 1A. “Risk Factors”, and Notes 1 and
13
.
COMMUNITY AND HUMAN RIGHTS
We have adopted policies that govern our working relationships with the communities where we operate and are designed to guide our practices and programs in a manner that respects basic human rights and the culture of the local people impacted by our operations. We continue to make significant expenditures on community development, education, training and cultural programs, which include:
|
•
|
comprehensive job training programs
|
|
•
|
basic education programs
|
|
•
|
public health programs, including malaria control and HIV testing
|
|
•
|
agricultural assistance programs
|
|
•
|
small and medium enterprise development programs
|
|
•
|
cultural preservation programs
|
|
•
|
water and sewage treatment projects
|
|
•
|
clean water access
|
|
•
|
charitable donations
|
In December 2000, we endorsed the joint U.S. State Department-British Foreign Office Voluntary Principles on Human Rights and Security (Voluntary Principles). Several major natural resources companies and international human rights organizations participated in developing the Voluntary Principles and have endorsed them. We participated in developing these principles and they are incorporated into our human rights policy.
We are assessing how to best integrate the United Nations Guiding Principles on Business and Human Rights into our existing human rights policy. We joined a multi-industry human rights working group to help us learn from peer companies and determine the best way to integrate human rights due diligence into our business practices and to support our Voluntary Principles program.
We believe that our social and economic development programs are responsive to the issues raised by the local communities near our areas of operation and should help us maintain good relations with the surrounding communities and avoid disruptions of mining operations. As part of our ongoing, annual commitment to sustainable community development, we have made significant investments in social programs, including in-kind support and administration, across our global operations. Over the last three years, these investments have averaged approximately $180 million per year. Nevertheless, social and political instability in the areas of our operations may adversely impact our mining operations. Refer to Item 1A. “Risk Factors” for further discussion.
South America
. Cerro Verde has provided a variety of community support projects over the years. Following engagements with regional and local governments, civic leaders and development agencies, in 2006, Cerro Verde committed to support the costs for a new potable water treatment plant to serve Arequipa. In addition, an agreement was reached with the Peruvian government for development of a water storage and distribution network, which was financed by the Cerro Verde Civil Association (the Association). The Association manages contributions made by Cerro Verde for projects that focus on education, training, health, cultural preservation and basic infrastructure.
In 2011, Cerro Verde reached agreement with the Regional Government of Arequipa, the National Government, SEDAPAR and other local institutions to allow it to finance the engineering and construction of a wastewater treatment plant for Arequipa, should Cerro Verde proceed with plans for the large-scale expansion. Treating this water would improve the Rio Chili's water quality, enhance agriculture products grown in the area and reduce waterborne illnesses.
Additionally, during 2006, the Peruvian government announced that all mining companies operating in Peru would be required to make annual contributions to local development funds for a five-year period (covering the years 2006 through 2010) when copper prices exceeded certain levels that were adjusted annually. The contribution, which expired in 2010, was equal to 3.75 percent of after-tax profits.
30
Indonesia
. In 1996, PT Freeport Indonesia established the Freeport Partnership Fund for Community Development (the Partnership Fund), through which PT Freeport Indonesia has made available funding and technical assistance to support community development initiatives in the areas of health, education and economic development of the area. PT Freeport Indonesia has committed through 2016 to provide one percent of its annual revenue for the development of the local people in its area of operation through the Partnership Fund. Our share of contributions to the Partnership Fund totaled
$39 million
in
2012
,
$50 million
in
2011
and
$64 million
in
2010
.
The Amungme and Kamoro Community Development Organization (
Lembaga Pembangunan Masyarakat Amungme dan Kamoro
or LPMAK) oversees disbursement of the program funds we contribute to the Partnership Fund. LPMAK is governed by a board of commissioners and a board of directors, which are comprised of representatives from the local Amungme and Kamoro tribal communities, government leaders, church leaders, and one representative of PT Freeport Indonesia on each board. The Amungme and Kamoro people are original inhabitants of the land in our area of operations.
Security Matters
.
Consistent with our COW in Indonesia and the requirement to protect our employees and property, we have taken appropriate steps to provide a safe and secure working environment. As part of its security program, PT Freeport Indonesia maintains its own internal security department, which is unarmed and performs functions such as protecting company facilities, monitoring shipments of supplies and products, assisting in traffic control and aiding in emergency response operations. The security department has received human rights training and each member is required to certify his or her compliance with our human rights policy.
PT Freeport Indonesia’s share of costs for its internal civilian security department totaled $52 million for
2012
, $37 million for
2011
and $28 million for
2010
.
PT Freeport Indonesia, and all businesses and residents of Indonesia, rely on the Indonesian government for the maintenance of public order, upholding the rule of law and the protection of personnel and property. The Grasberg minerals district has been designated by the Indonesian government as one of Indonesia’s vital national assets. This designation results in the police, and to a lesser extent, the military, playing a significant role in protecting the area of our operations. The Indonesian government is responsible for employing police and military personnel and directing their operations.
From the outset of PT Freeport Indonesia’s operations, the Indonesian government has looked to PT Freeport Indonesia to provide logistical and infrastructure support and assistance for these necessary services because of the limited resources of the Indonesian government and the remote location of and lack of development in Papua. PT Freeport Indonesia’s financial support for the Indonesian government security institutions assigned to the operations area represents a prudent response to its requirements to protect its workforce and property, better
ensuring that personnel are properly fed and lodged, and have the logistical resources to patrol PT Freeport Indonesia’s roads and secure its operating area. In addition, the provision of such support is consistent with PT Freeport Indonesia’s obligations under the COW, reflects our philosophy of responsible corporate citizenship, and is in keeping with our commitment to pursue practices that will promote human rights.
PT Freeport Indonesia’s share of support costs for the government-provided security was $22 million in
2012
, and $14 million for each of the years
2011
and
2010
. This supplemental support consists of various infrastructure and other costs, such as food, housing, fuel, travel, vehicle repairs, allowances to cover incidental and administrative costs, and community assistance programs conducted by the military and police.
Refer to Item 1A. "Risk Factors" for further discussion of security risks in Indonesia.
Africa
. TFM has committed to assist the communities living within its concession in the Katanga province of the DRC. Initiatives include an integrated malaria control program, construction and operational support for six elementary schools, as well as renovation and construction of an additional four schools, installation of over 70 clean water wells, a public sanitation (latrines and hand washing) program reaching over 2,000 households, a mobile clinic for rural villages, and economic development programs supporting micro-credit and development of local entrepreneurs, contractors, and farmers. We have also made significant investments in infrastructure in the region that will have lasting benefits to the country, including upgrading a portion of a national road and the regional power generation and transmission systems.
31
TFM has also committed to contribute 0.3 percent of net sales revenue from production to a community development fund to assist the local communities with development of local infrastructure and related services. This fund will be a platform to work jointly with the local government and community to further assist them to fulfill their local development plans, meet basic community needs and promote good governance. Community development fund contributions totaled
$4 million
in both
2012
and
2011
, and
$3 million
in
2010
.
Security Matters
. TFM maintains an unarmed internal security department. The national government also has assigned Mines Police to the TFM concession area. The Mines Police are a division of the Congolese National Police and are responsible for maintaining security in mining concessions throughout the DRC. TFM provides food, housing, monetary allowances and logistical support as well as direct payments to the government for the provision of the security assigned to the concession area. The total cost to TFM for this support, including in-kind support, totaled less than $1 million in each of the years
2012
,
2011
and
2010
.
TFM also participates in monthly security coordination meetings with host country security personnel, other mining companies, and representatives from the United Nations to discuss security issues and concerns.
ORE RESERVES
Recoverable proven and probable reserves summarized below and detailed on the following pages have been calculated as of
December 31, 2012
, in accordance with Industry Guide 7 as required by the Securities Exchange Act of 1934. Proven and probable reserves may not be comparable to similar information regarding mineral reserves disclosed in accordance with the guidance of other countries. Proven and probable reserves were determined by the use of mapping, drilling, sampling, assaying and evaluation methods generally applied in the mining industry, as more fully discussed below. The term “reserve,” as used in the reserve data presented here, means that part of a mineral deposit that can be economically and legally extracted or produced at the time of the reserve determination. The term “proven reserves” means reserves for which (1) quantity is computed from dimensions revealed in outcrops, trenches, workings or drill holes; (2) grade and/or quality are computed from the results of detailed sampling; and (3) the sites for inspection, sampling and measurements are spaced so closely and the geologic character is sufficiently defined that size, shape, depth and mineral content of reserves are well established. The term “probable reserves” means reserves for which quantity and grade are computed from information similar to that used for proven reserves but the sites for sampling are farther apart or are otherwise less adequately spaced. The degree of assurance, although lower than that for proven reserves, is high enough to assume continuity between points of observation.
Our reserve estimates are based on the latest available geological and geotechnical studies. We conduct ongoing studies of our ore bodies to optimize economic values and to manage risk. We revise our mine plans and estimates of recoverable proven and probable mineral reserves as required in accordance with the latest available studies. Our estimates of recoverable proven and probable reserves are prepared by and are the responsibility of our employees; a majority of these estimates are reviewed and verified by independent experts in mining, geology and reserve determination.
Estimated recoverable proven and probable reserves at
December 31, 2012
, were determined using long-term average prices of
$2.00
per pound for copper,
$750
per ounce for gold and
$10
per pound for molybdenum, consistent with the long-term average prices used at year-end
2011
and
2010
. For the three-year period ended
December 31, 2012
, LME spot copper prices averaged
$3.67
per pound, London PM gold prices averaged
$1,480
per ounce, and the weekly average price of molybdenum quoted by
Metals Week
averaged
$14.64
per pound.
32
The recoverable proven and probable reserves presented in the table below represent the estimated metal quantities from which we expect to be paid after application of estimated metallurgical recovery rates and smelter recovery rates, where applicable. Recoverable reserves are the part of a mineral deposit that we estimate can be economically and legally extracted or produced at the time of the reserve determination.
|
|
Recoverable Proven and Probable Reserves at December 31, 2012
|
|||||||||||||
|
Copper
a
(billion pounds)
|
Gold
(million ounces)
|
Molybdenum
(billion pounds)
|
Silver
b
(million ounces)
|
Cobalt
b
(billion pounds)
|
||||||||||
|
North America
|
38.8
|
|
0.4
|
|
2.69
|
|
94.0
|
|
—
|
|
||||
|
South America
|
38.8
|
|
1.2
|
|
0.73
|
|
110.8
|
|
—
|
|
||||
|
Indonesia
|
31.0
|
|
30.9
|
|
—
|
|
116.6
|
|
—
|
|
||||
|
Africa
|
7.9
|
|
—
|
|
—
|
|
—
|
|
0.84
|
|
||||
|
Consolidated basis
c
|
116.5
|
|
32.5
|
|
3.42
|
|
321.4
|
|
0.84
|
|
||||
|
Net equity interest
d
|
93.2
|
|
29.4
|
|
3.08
|
|
264.2
|
|
0.47
|
|
||||
|
a.
|
Recoverable copper reserves include
2.9 billion
pounds in leach stockpiles and
1.4 billion
pounds in mill stockpiles (refer to “Mill and Leach Stockpiles” for further discussion).
|
|
b.
|
Determined using long-term average prices of
$15
per ounce for silver and
$10
per pound for cobalt
,
consistent with the long-term average prices used at year-end
2011
and
2010
.
|
|
c.
|
Consolidated basis reserves represent estimated metal quantities after reduction for joint venture partner interests at the Morenci mine in North America and at the Grasberg minerals district in Indonesia.
|
|
d.
|
Net equity interest reserves represent estimated consolidated basis metal quantities further reduced for noncontrolling interest ownership.
|
33
|
Recoverable Proven and Probable Reserves
|
||||||||||||||||||||||||||||||||||||||
|
Estimated at December 31, 2012
|
||||||||||||||||||||||||||||||||||||||
|
|
|
Proven Reserves
|
Probable Reserves
|
|||||||||||||||||||||||||||||||||||
|
|
|
|
Average Ore Grade
|
|
Average Ore Grade
|
|||||||||||||||||||||||||||||||||
|
|
Processing
|
Million
|
Copper
|
Gold
|
|
Moly
|
Silver
|
Cobalt
|
Million
|
Copper
|
Gold
|
|
Moly
|
Silver
|
Cobalt
|
|||||||||||||||||||||||
|
|
Method
|
metric tons
|
%
|
g/t
|
|
%
|
g/t
|
%
|
metric tons
|
%
|
g/t
|
|
%
|
g/t
|
%
|
|||||||||||||||||||||||
|
North America
|
|
|
|
|
|
|
|
|
|
|
|
|
|
|
|
|||||||||||||||||||||||
|
Morenci
|
Mill
|
680
|
|
0.50
|
|
—
|
|
|
0.021
|
|
—
|
|
—
|
|
5
|
|
0.45
|
|
—
|
|
|
0.015
|
|
—
|
|
—
|
|
|||||||||||
|
|
Crushed leach
|
417
|
|
0.52
|
|
—
|
|
|
—
|
|
—
|
|
—
|
|
5
|
|
0.47
|
|
—
|
|
|
—
|
|
—
|
|
—
|
|
|||||||||||
|
|
ROM leach
|
2,826
|
|
0.18
|
|
—
|
|
|
—
|
|
—
|
|
—
|
|
85
|
|
0.15
|
|
—
|
|
|
—
|
|
—
|
|
—
|
|
|||||||||||
|
Bagdad
|
Mill
|
1,016
|
|
0.34
|
|
—
|
|
a
|
0.021
|
|
1.59
|
|
—
|
|
225
|
|
0.30
|
|
—
|
|
a
|
0.018
|
|
1.59
|
|
—
|
|
|||||||||||
|
|
ROM leach
|
267
|
|
0.12
|
|
—
|
|
—
|
|
—
|
|
—
|
|
223
|
|
0.10
|
|
—
|
|
—
|
|
—
|
|
—
|
|
|||||||||||||
|
Safford
|
Crushed leach
|
117
|
|
0.43
|
|
—
|
|
—
|
|
—
|
|
—
|
|
69
|
|
0.41
|
|
—
|
|
—
|
|
—
|
|
—
|
|
|||||||||||||
|
Sierrita
|
Mill
|
2,407
|
|
0.24
|
|
—
|
|
a
|
0.026
|
|
1.43
|
|
—
|
|
299
|
|
0.21
|
|
—
|
|
a
|
0.020
|
|
1.28
|
|
—
|
|
|||||||||||
|
|
ROM leach
|
10
|
|
0.19
|
|
—
|
|
—
|
|
—
|
|
—
|
|
7
|
|
0.18
|
|
—
|
|
|
—
|
|
—
|
|
—
|
|
||||||||||||
|
Miami
|
ROM leach
|
33
|
|
0.52
|
|
—
|
|
—
|
|
—
|
|
—
|
|
8
|
|
0.43
|
|
—
|
|
|
—
|
|
—
|
|
—
|
|
||||||||||||
|
Tyrone
|
ROM leach
|
129
|
|
0.29
|
|
—
|
|
—
|
|
—
|
|
—
|
|
9
|
|
0.20
|
|
—
|
|
|
—
|
|
—
|
|
—
|
|
||||||||||||
|
Chino
|
Mill
|
106
|
|
0.57
|
|
0.04
|
|
0.010
|
|
0.48
|
|
—
|
|
64
|
|
0.56
|
|
0.04
|
|
|
0.005
|
|
0.47
|
|
—
|
|
||||||||||||
|
|
ROM leach
|
164
|
|
0.31
|
|
—
|
|
—
|
|
—
|
|
—
|
|
57
|
|
0.28
|
|
—
|
|
|
—
|
|
—
|
|
—
|
|
||||||||||||
|
Henderson
|
Mill
|
111
|
|
—
|
|
—
|
|
0.172
|
|
—
|
|
—
|
|
2
|
|
—
|
|
—
|
|
|
0.169
|
|
—
|
|
—
|
|
||||||||||||
|
Climax
|
Mill
|
74
|
|
—
|
|
—
|
|
0.183
|
|
—
|
|
—
|
|
124
|
|
—
|
|
—
|
|
|
0.152
|
|
—
|
|
—
|
|
||||||||||||
|
Cobre
b
|
ROM leach
|
70
|
|
0.40
|
|
—
|
|
—
|
|
—
|
|
—
|
|
3
|
|
0.29
|
|
—
|
|
|
—
|
|
—
|
|
—
|
|
||||||||||||
|
|
|
8,427
|
|
0.27
|
|
—
|
|
a
|
0.016
|
|
0.61
|
|
—
|
|
1,185
|
|
0.22
|
|
—
|
|
a
|
0.025
|
|
0.65
|
|
—
|
|
|||||||||||
|
South America
|
|
|
|
|
|
|
|
|
|
|
|
|
|
|
||||||||||||||||||||||||
|
Cerro Verde
|
Mill
|
995
|
|
0.40
|
|
—
|
|
0.016
|
|
1.64
|
|
—
|
|
2,997
|
|
0.37
|
|
—
|
|
0.014
|
|
1.51
|
|
—
|
|
|||||||||||||
|
|
Crushed leach
|
43
|
|
0.52
|
|
—
|
|
—
|
|
—
|
|
—
|
|
65
|
|
0.42
|
|
—
|
|
—
|
|
—
|
|
—
|
|
|||||||||||||
|
|
ROM leach
|
22
|
|
0.21
|
|
—
|
|
—
|
|
—
|
|
—
|
|
72
|
|
0.20
|
|
—
|
|
—
|
|
—
|
|
—
|
|
|||||||||||||
|
El Abra
|
Crushed leach
|
417
|
|
0.51
|
|
—
|
|
—
|
|
—
|
|
—
|
|
111
|
|
0.44
|
|
—
|
|
—
|
|
—
|
|
—
|
|
|||||||||||||
|
|
ROM leach
|
137
|
|
0.33
|
|
—
|
|
—
|
|
—
|
|
—
|
|
60
|
|
0.22
|
|
—
|
|
—
|
|
—
|
|
—
|
|
|||||||||||||
|
Candelaria
|
Mill
|
302
|
|
0.57
|
|
0.13
|
|
—
|
|
2.03
|
|
—
|
|
13
|
|
0.60
|
|
0.15
|
|
—
|
|
2.20
|
|
—
|
|
|||||||||||||
|
Ojos del Salado
|
Mill
|
3
|
|
1.07
|
|
0.29
|
|
—
|
|
4.39
|
|
—
|
|
2
|
|
0.83
|
|
0.16
|
|
—
|
|
3.36
|
|
—
|
|
|||||||||||||
|
|
|
1,919
|
|
0.44
|
|
0.02
|
|
0.008
|
|
1.17
|
|
—
|
|
3,320
|
|
0.37
|
|
—
|
|
a
|
0.013
|
|
1.38
|
|
—
|
|
||||||||||||
|
Indonesia
|
|
|
|
|
|
|
|
|
|
|
|
|
|
|
|
|||||||||||||||||||||||
|
Grasberg open pit
|
Mill
|
162
|
|
0.99
|
|
1.18
|
|
—
|
|
2.67
|
|
—
|
|
96
|
|
0.75
|
|
0.63
|
|
—
|
|
2.05
|
|
—
|
|
|||||||||||||
|
Deep Ore Zone
|
Mill
|
57
|
|
0.58
|
|
0.72
|
|
—
|
|
2.45
|
|
—
|
|
119
|
|
0.56
|
|
0.71
|
|
—
|
|
2.29
|
|
—
|
|
|||||||||||||
|
Big Gossan
|
Mill
|
14
|
|
2.47
|
|
1.11
|
|
—
|
|
15.97
|
|
—
|
|
40
|
|
2.18
|
|
0.92
|
|
—
|
|
13.09
|
|
—
|
|
|||||||||||||
|
Grasberg Block Cave
b
|
Mill
|
349
|
|
1.22
|
|
1.01
|
|
—
|
|
3.73
|
|
—
|
|
650
|
|
0.90
|
|
0.65
|
|
—
|
|
3.44
|
|
—
|
|
|||||||||||||
|
Kucing Liar
b
|
Mill
|
149
|
|
1.33
|
|
1.13
|
|
—
|
|
7.58
|
|
—
|
|
271
|
|
1.20
|
|
1.03
|
|
—
|
|
6.06
|
|
—
|
|
|||||||||||||
|
Deep Mill Level Zone
b
|
Mill
|
69
|
|
0.92
|
|
0.74
|
|
—
|
|
4.61
|
|
—
|
|
448
|
|
0.83
|
|
0.70
|
|
—
|
|
4.14
|
|
—
|
|
|||||||||||||
|
|
|
800
|
|
1.15
|
|
1.03
|
|
—
|
|
4.43
|
|
—
|
|
1,624
|
|
0.93
|
|
0.74
|
|
—
|
|
4.14
|
|
—
|
|
|||||||||||||
|
Africa
|
|
|
|
|
|
|
|
|
|
|
|
|
|
|
|
|||||||||||||||||||||||
|
Tenke Fungurume
|
Agitation leach
|
52
|
|
3.49
|
|
—
|
|
|
—
|
|
—
|
|
0.39
|
|
67
|
|
3.09
|
|
—
|
|
|
—
|
|
—
|
|
0.32
|
|
|||||||||||
|
Total FCX - 100% Basis
|
|
11,198
|
|
0.38
|
|
0.08
|
|
0.013
|
|
0.97
|
|
—
|
|
a
|
6,196
|
|
0.52
|
|
0.19
|
|
0.012
|
|
1.95
|
|
—
|
|
a
|
|||||||||||
|
a.
|
Grade not shown because of rounding.
|
|
b.
|
Undeveloped reserves that would require additional capital investment, which could be significant, to bring into production.
|
The reserve table above and the tables on the following pages utilize the abbreviations described below:
|
•
|
g/t – grams per metric ton
|
|
•
|
Moly – Molybdenum
|
|
•
|
ROM – Run of Mine
|
34
|
Recoverable Proven and Probable Reserves
|
||||||||||||||||||||||||||||||||||
|
Estimated at December 31, 2012
|
||||||||||||||||||||||||||||||||||
|
(continued)
|
||||||||||||||||||||||||||||||||||
|
|
|
|
Average Ore Grade
|
Recoveries
a
|
||||||||||||||||||||||||||||||
|
|
|
Proven and
|
|
|
|
|
|
|
|
|
|
|
|
|||||||||||||||||||||
|
|
|
Probable
|
|
|
|
|
|
|
|
|
|
|
|
|||||||||||||||||||||
|
|
Processing
|
Million
|
Copper
|
Gold
|
|
Moly
|
Silver
|
Cobalt
|
Copper
|
Gold
|
Moly
|
Silver
|
Cobalt
|
|||||||||||||||||||||
|
|
Method
|
metric tons
|
%
|
g/t
|
|
%
|
g/t
|
%
|
%
|
%
|
%
|
%
|
%
|
|||||||||||||||||||||
|
North America
|
|
|
|
|
|
|
|
|
|
|
|
|
|
|||||||||||||||||||||
|
Morenci
|
Mill
|
685
|
|
0.50
|
|
—
|
|
0.021
|
|
—
|
|
—
|
|
79.3
|
|
—
|
|
47.1
|
|
—
|
|
—
|
|
|||||||||||
|
|
Crushed leach
|
422
|
|
0.52
|
|
—
|
|
—
|
|
—
|
|
—
|
|
78.1
|
|
—
|
|
—
|
|
—
|
|
—
|
|
|||||||||||
|
|
ROM leach
|
2,911
|
|
0.18
|
|
—
|
|
—
|
|
—
|
|
—
|
|
44.3
|
|
—
|
|
—
|
|
—
|
|
—
|
|
|||||||||||
|
Bagdad
|
Mill
|
1,241
|
|
0.34
|
|
—
|
|
b
|
0.021
|
|
1.59
|
|
—
|
|
85.8
|
|
59.1
|
|
70.8
|
|
49.3
|
|
—
|
|
||||||||||
|
|
ROM leach
|
490
|
|
0.12
|
|
—
|
|
—
|
|
—
|
|
—
|
|
24.2
|
|
—
|
|
—
|
|
—
|
|
—
|
|
|||||||||||
|
Safford
|
Crushed leach
|
186
|
|
0.42
|
|
—
|
|
—
|
|
—
|
|
—
|
|
65.9
|
|
—
|
|
—
|
|
—
|
|
—
|
|
|||||||||||
|
Sierrita
|
Mill
|
2,706
|
|
0.23
|
|
—
|
|
b
|
0.025
|
|
1.41
|
|
—
|
|
83.9
|
|
60.0
|
|
75.7
|
|
49.3
|
|
—
|
|
||||||||||
|
|
ROM leach
|
17
|
|
0.19
|
|
—
|
|
—
|
|
—
|
|
—
|
|
52.3
|
|
—
|
|
—
|
|
—
|
|
—
|
|
|||||||||||
|
Miami
|
ROM leach
|
41
|
|
0.51
|
|
—
|
|
—
|
|
—
|
|
—
|
|
61.8
|
|
—
|
|
—
|
|
—
|
|
—
|
|
|||||||||||
|
Tyrone
|
ROM leach
|
138
|
|
0.28
|
|
—
|
|
—
|
|
—
|
|
—
|
|
60.1
|
|
—
|
|
—
|
|
—
|
|
—
|
|
|||||||||||
|
Chino
|
Mill
|
170
|
|
0.57
|
|
0.04
|
|
0.008
|
|
0.48
|
|
—
|
|
78.8
|
|
77.9
|
|
44.0
|
|
78.5
|
|
—
|
|
|||||||||||
|
|
ROM leach
|
221
|
|
0.30
|
|
—
|
|
—
|
|
—
|
|
—
|
|
42.9
|
|
—
|
|
—
|
|
—
|
|
—
|
|
|||||||||||
|
Henderson
|
Mill
|
113
|
|
—
|
|
—
|
|
0.172
|
|
—
|
|
—
|
|
—
|
|
—
|
|
84.7
|
|
—
|
|
—
|
|
|||||||||||
|
Climax
|
Mill
|
198
|
|
—
|
|
—
|
|
0.164
|
|
—
|
|
—
|
|
—
|
|
—
|
|
88.9
|
|
—
|
|
—
|
|
|||||||||||
|
Cobre
c
|
ROM leach
|
73
|
|
0.39
|
|
—
|
|
—
|
|
—
|
|
—
|
|
50.7
|
|
—
|
|
—
|
|
—
|
|
—
|
|
|||||||||||
|
|
|
9,612
|
|
|
|
|
|
|
|
|
|
|
|
|
||||||||||||||||||||
|
South America
|
|
|
|
|
|
|
|
|
|
|
|
|
|
|||||||||||||||||||||
|
Cerro Verde
|
Mill
|
3,992
|
|
0.38
|
|
—
|
|
0.015
|
|
1.54
|
|
—
|
|
86.2
|
|
—
|
|
54.3
|
|
44.9
|
|
—
|
|
|||||||||||
|
|
Crushed leach
|
108
|
|
0.46
|
|
—
|
|
—
|
|
—
|
|
—
|
|
79.7
|
|
—
|
|
—
|
|
—
|
|
—
|
|
|||||||||||
|
|
ROM leach
|
94
|
|
0.20
|
|
—
|
|
—
|
|
—
|
|
—
|
|
48.7
|
|
—
|
|
—
|
|
—
|
|
—
|
|
|||||||||||
|
El Abra
|
Crushed leach
|
528
|
|
0.49
|
|
—
|
|
—
|
|
—
|
|
—
|
|
57.0
|
|
—
|
|
—
|
|
—
|
|
—
|
|
|||||||||||
|
|
ROM leach
|
197
|
|
0.30
|
|
—
|
|
—
|
|
—
|
|
—
|
|
26.4
|
|
—
|
|
—
|
|
—
|
|
—
|
|
|||||||||||
|
Candelaria
|
Mill
|
315
|
|
0.57
|
|
0.13
|
|
—
|
|
2.03
|
|
—
|
|
89.2
|
|
71.9
|
|
—
|
|
76.3
|
|
—
|
|
|||||||||||
|
Ojos del Salado
|
Mill
|
5
|
|
0.98
|
|
0.24
|
|
—
|
|
3.99
|
|
—
|
|
90.3
|
|
60.9
|
|
—
|
|
65.7
|
|
—
|
|
|||||||||||
|
|
|
5,239
|
|
|
|
|
|
|
|
|
|
|
|
|
||||||||||||||||||||
|
Indonesia
|
|
|
|
|
|
|
|
|
|
|
|
|
|
|||||||||||||||||||||
|
Grasberg open pit
|
Mill
|
258
|
|
0.90
|
|
0.98
|
|
—
|
|
2.44
|
|
—
|
|
83.7
|
|
80.6
|
|
—
|
|
42.9
|
|
—
|
|
|||||||||||
|
Deep Ore Zone
|
Mill
|
176
|
|
0.57
|
|
0.71
|
|
—
|
|
2.34
|
|
—
|
|
86.7
|
|
77.5
|
|
—
|
|
64.2
|
|
—
|
|
|||||||||||
|
Big Gossan
|
Mill
|
54
|
|
2.26
|
|
0.97
|
|
—
|
|
13.84
|
|
—
|
|
91.6
|
|
66.1
|
|
—
|
|
63.8
|
|
—
|
|
|||||||||||
|
Grasberg Block Cave
c
|
Mill
|
999
|
|
1.01
|
|
0.78
|
|
—
|
|
3.54
|
|
—
|
|
84.2
|
|
64.8
|
|
—
|
|
57.2
|
|
—
|
|
|||||||||||
|
Kucing Liar
c
|
Mill
|
420
|
|
1.25
|
|
1.07
|
|
—
|
|
6.60
|
|
—
|
|
85.8
|
|
46.3
|
|
—
|
|
38.5
|
|
—
|
|
|||||||||||
|
Deep Mill Level Zone
c
|
Mill
|
517
|
|
0.84
|
|
0.70
|
|
—
|
|
4.20
|
|
—
|
|
87.1
|
|
79.0
|
|
—
|
|
64.6
|
|
—
|
|
|||||||||||
|
|
|
2,424
|
|
|
|
|
|
|
|
|
|
|
|
|||||||||||||||||||||
|
Africa
|
|
|
|
|
|
|
|
|
|
|
|
|
|
|||||||||||||||||||||
|
Tenke Fungurume
|
Agitation leach
|
119
|
|
3.26
|
|
—
|
|
—
|
|
—
|
|
0.35
|
|
86.0
|
|
—
|
|
—
|
|
—
|
|
75.6
|
|
|||||||||||
|
Total FCX - 100% Basis
|
|
17,394
|
|
|
|
|
|
|
|
|
|
|
|
|
||||||||||||||||||||
|
a.
|
Recoveries are net of estimated mill and smelter losses.
|
|
b.
|
Grade not shown because of rounding.
|
|
c.
|
Undeveloped reserves that would require additional capital investment, which could be significant, to bring into production.
|
35
|
Recoverable Proven and Probable Reserves
|
||||||||||||||||||
|
Estimated at December 31, 2012
|
||||||||||||||||||
|
(continued)
|
||||||||||||||||||
|
|
|
|
Recoverable Reserves
|
|||||||||||||||
|
|
|
|
Copper
|
Gold
|
Moly
|
Silver
|
Cobalt
|
|||||||||||
|
|
FCX’s
|
Processing
|
billion
|
million
|
billion
|
million
|
billion
|
|||||||||||
|
|
Interest
|
Method
|
lbs.
|
ozs.
|
lbs.
|
ozs.
|
lbs.
|
|||||||||||
|
North America
|
|
|
|
|
|
|
|
|||||||||||
|
Morenci
|
85%
|
Mill
|
6.0
|
|
—
|
|
0.15
|
|
—
|
|
—
|
|
||||||
|
|
|
Crushed leach
|
3.8
|
|
—
|
|
—
|
|
—
|
|
—
|
|
||||||
|
|
|
ROM leach
|
5.0
|
|
—
|
|
—
|
|
—
|
|
—
|
|
||||||
|
Bagdad
|
100%
|
Mill
|
7.9
|
|
0.1
|
|
0.40
|
|
31.4
|
|
—
|
|
||||||
|
|
|
ROM leach
|
0.3
|
|
—
|
|
—
|
|
—
|
|
—
|
|
||||||
|
Safford
|
100%
|
Crushed leach
|
1.2
|
|
—
|
|
—
|
|
—
|
|
—
|
|
||||||
|
Sierrita
|
100%
|
Mill
|
11.7
|
|
0.1
|
|
1.15
|
|
60.6
|
|
—
|
|
||||||
|
|
|
ROM leach
|
—
|
|
a
|
—
|
|
—
|
|
—
|
|
—
|
|
|||||
|
Miami
|
100%
|
ROM leach
|
0.3
|
|
—
|
|
—
|
|
—
|
|
—
|
|
||||||
|
Tyrone
|
100%
|
ROM leach
|
0.5
|
|
—
|
|
—
|
|
—
|
|
—
|
|
||||||
|
Chino
|
100%
|
Mill
|
1.7
|
|
0.2
|
|
0.01
|
|
2.0
|
|
—
|
|
||||||
|
|
|
ROM leach
|
0.6
|
|
—
|
|
—
|
|
—
|
|
—
|
|
||||||
|
Henderson
|
100%
|
Mill
|
—
|
|
—
|
|
0.36
|
|
—
|
|
—
|
|
||||||
|
Climax
|
100%
|
Mill
|
—
|
|
—
|
|
0.64
|
|
—
|
|
—
|
|
||||||
|
Cobre
|
100%
|
ROM leach
|
0.3
|
|
—
|
|
—
|
|
—
|
|
—
|
|
||||||
|
|
|
|
39.3
|
|
0.4
|
|
2.71
|
|
94.0
|
|
—
|
|
||||||
|
Recoverable metal in stockpiles
b
|
|
1.8
|
|
—
|
|
—
|
|
a
|
—
|
|
—
|
|
||||||
|
100% operations
|
|
41.1
|
|
0.4
|
|
2.71
|
|
94.0
|
|
—
|
|
|||||||
|
Consolidated
c
|
|
38.8
|
|
0.4
|
|
2.69
|
|
94.0
|
|
—
|
|
|||||||
|
Net equity interest
d
|
|
38.8
|
|
0.4
|
|
2.69
|
|
94.0
|
|
—
|
|
|||||||
|
South America
|
|
|
|
|
|
|
|
|||||||||||
|
Cerro Verde
|
53.56%
|
Mill
|
28.5
|
|
—
|
|
0.71
|
|
89.0
|
|
—
|
|
||||||
|
|
|
Crushed leach
|
0.9
|
|
—
|
|
—
|
|
—
|
|
—
|
|
||||||
|
|
|
ROM leach
|
0.2
|
|
—
|
|
—
|
|
—
|
|
—
|
|
||||||
|
El Abra
|
51%
|
Crushed leach
|
3.3
|
|
—
|
|
—
|
|
—
|
|
—
|
|
||||||
|
|
|
ROM leach
|
0.3
|
|
—
|
|
—
|
|
—
|
|
—
|
|
||||||
|
Candelaria
|
80%
|
Mill
|
3.5
|
|
1.0
|
|
—
|
|
15.7
|
|
—
|
|
||||||
|
Ojos del Salado
|
80%
|
Mill
|
0.1
|
|
—
|
|
a
|
—
|
|
0.4
|
|
—
|
|
|||||
|
|
|
|
36.8
|
|
1.0
|
|
0.71
|
|
105.1
|
|
—
|
|
||||||
|
Recoverable metal in stockpiles
b
|
|
2.0
|
|
0.2
|
|
0.02
|
|
5.7
|
|
—
|
|
|||||||
|
100% operations
|
|
38.8
|
|
1.2
|
|
0.73
|
|
110.8
|
|
—
|
|
|||||||
|
Consolidated
c
|
|
38.8
|
|
1.2
|
|
0.73
|
|
110.8
|
|
—
|
|
|||||||
|
Net equity interest
d
|
|
21.8
|
|
1.0
|
|
0.39
|
|
64.5
|
|
—
|
|
|||||||
|
Indonesia
|
|
|
|
|
|
|
|
|||||||||||
|
Grasberg open pit
|
e
|
Mill
|
4.3
|
|
6.5
|
|
—
|
|
8.7
|
|
—
|
|
||||||
|
Deep Ore Zone
|
e
|
Mill
|
1.9
|
|
3.1
|
|
—
|
|
8.5
|
|
—
|
|
||||||
|
Big Gossan
|
e
|
Mill
|
2.5
|
|
1.1
|
|
—
|
|
15.4
|
|
—
|
|
||||||
|
Grasberg Block Cave
|
e
|
Mill
|
18.8
|
|
16.2
|
|
—
|
|
65.1
|
|
—
|
|
||||||
|
Kucing Liar
|
e
|
Mill
|
9.9
|
|
6.7
|
|
—
|
|
34.3
|
|
—
|
|
||||||
|
Deep Mill Level Zone
|
e
|
Mill
|
8.3
|
|
9.2
|
|
—
|
|
45.1
|
|
—
|
|
||||||
|
100% operations
|
|
45.7
|
|
42.8
|
|
—
|
|
177.1
|
|
—
|
|
|||||||
|
Consolidated
c
|
|
31.0
|
|
30.9
|
|
—
|
|
116.6
|
|
—
|
|
|||||||
|
Net equity interest
d
|
|
28.1
|
|
28.0
|
|
—
|
|
105.7
|
|
—
|
|
|||||||
|
Africa
|
|
|
|
|
|
|
|
|||||||||||
|
Tenke Fungurume
|
56%
|
Agitation leach
|
7.3
|
|
—
|
|
—
|
|
—
|
|
0.69
|
|
||||||
|
Recoverable metal in stockpiles
b
|
|
0.6
|
|
—
|
|
—
|
|
—
|
|
0.15
|
|
|||||||
|
100% operations
|
|
7.9
|
|
—
|
|
—
|
|
—
|
|
0.84
|
|
|||||||
|
Consolidated
c
|
|
7.9
|
|
—
|
|
—
|
|
—
|
|
0.84
|
|
|||||||
|
Net equity interest
d
|
|
4.5
|
|
—
|
|
—
|
|
—
|
|
0.47
|
|
|||||||
|
Total FCX – 100% basis
|
|
133.5
|
|
44.4
|
|
3.44
|
|
381.9
|
|
0.84
|
|
|||||||
|
Total FCX – Consolidated basis
c
|
|
116.5
|
|
32.5
|
|
3.42
|
|
321.4
|
|
0.84
|
|
|||||||
|
Total FCX – Net equity interest
d
|
|
93.2
|
|
29.4
|
|
3.08
|
|
264.2
|
|
0.47
|
|
|||||||
|
a.
|
Amounts not shown because of rounding.
|
|
b.
|
Refer to "Mill and Leach Stockpiles" for additional information.
|
|
c.
|
Consolidated basis represents estimated metal quantities after reduction for joint venture partner interests at the Morenci mine in North America and at the Grasberg minerals district in Indonesia.
|
|
d.
|
Net equity interest represents estimated consolidated basis metal quantities further reduced for noncontrolling interest ownership.
|
|
e.
|
Our joint venture agreement with Rio Tinto provides that PT Freeport Indonesia will receive cash flow from specified annual amounts of copper, gold and silver through 2021, calculated by reference to its proven and probable reserves as of December 31, 1994, and 60 percent of all remaining cash flow.
|
36
In defining our open-pit reserves, we apply a “variable cutoff grade” strategy. The objective of this strategy is to maximize the net present value of our operations. We use a break-even cutoff grade to define the in-situ reserves for our underground ore bodies. The break-even cutoff grade is defined for a metric ton of ore as that equivalent copper grade, once produced and sold, that generates sufficient revenue to cover all operating and administrative costs associated with our production.
Our copper mines may contain other commercially recoverable metals, such as gold, molybdenum, silver and cobalt. We value all commercially recoverable metals in terms of a copper equivalent percentage to determine a single cutoff grade. Copper equivalent percentage is used to express the relative value of multi-metal ores in terms of one metal. The calculation expresses the relative value of the ore using estimates of contained metal quantities, metals prices as used for reserve determination, recovery rates, treatment charges and royalties. Our molybdenum properties use a molybdenum cutoff grade.
The table below shows the minimum cutoff grade by process for each of our existing ore bodies as of
December 31, 2012
:
|
Copper Equivalent Cutoff Grade (Percent)
|
Molybdenum
Cutoff Grade
(Percent)
|
||||||
|
Mill
|
Crushed or
Agitation Leach
|
ROM
Leach
|
Mill
|
||||
|
North America
|
|
|
|
|
|||
|
Morenci
|
0.25
|
0.19
|
0.03
|
—
|
|||
|
Bagdad
|
0.20
|
—
|
0.01
|
—
|
|||
|
Safford
|
—
|
0.12
|
—
|
—
|
|||
|
Sierrita
|
0.18
|
—
|
0.07
|
—
|
|||
|
Miami
|
—
|
—
|
0.05
|
—
|
|||
|
Tyrone
|
—
|
—
|
0.05
|
—
|
|||
|
Chino
|
0.20
|
—
|
0.08
|
—
|
|||
|
Henderson
|
—
|
—
|
—
|
0.12
|
|||
|
Climax
|
—
|
—
|
—
|
0.06
|
|||
|
Cobre
|
—
|
—
|
0.17
|
—
|
|||
|
South America
|
|
|
|
|
|||
|
Cerro Verde
|
0.17
|
0.19
|
0.14
|
—
|
|||
|
El Abra
|
—
|
0.11
|
0.08
|
—
|
|||
|
Candelaria
|
0.24
|
—
|
—
|
—
|
|||
|
Ojos del Salado
|
0.64
|
—
|
—
|
—
|
|||
|
Indonesia
|
|
|
|
|
|||
|
Grasberg open pit
|
0.25
|
—
|
—
|
—
|
|||
|
Deep Ore Zone
|
0.70
|
—
|
—
|
—
|
|||
|
Big Gossan
|
1.80
|
—
|
—
|
—
|
|||
|
Grasberg Block Cave
|
0.69
|
—
|
—
|
—
|
|||
|
Kucing Liar
|
0.80
|
—
|
—
|
—
|
|||
|
Deep Mill Level Zone
|
0.71
|
—
|
—
|
—
|
|||
|
Africa
|
|
|
|
|
|||
|
Tenke Fungurume
|
—
|
1.23
|
—
|
—
|
|||
37
Drill hole spacing data is used by mining professionals, such as geologists and geological engineers, in determining the suitability of data coverage (on a relative basis) in a given deposit type and mining method scenario so as to achieve a given level of confidence in the resource estimate. Drill hole spacing is only one of several criteria necessary to establish resource classification. Drilling programs are typically designed to achieve an optimum sample spacing to support the level of confidence in results that apply to a particular stage of development of a mineral deposit.
The following table sets forth the average drill hole spacing based on average sample distance or drill pattern spacing for proven and probable ore reserves by process type:
|
|
|
Average Drill Hole Spacing (in Meters)
|
|||||||
|
|
|
Proven
|
Probable
|
||||||
|
|
Mining Unit
|
Mill
|
Leach
|
Mill
|
Leach
|
||||
|
North America
|
|
|
|
|
|
||||
|
Morenci
|
Open Pit
|
86
|
86
|
122
|
122
|
||||
|
Bagdad
|
Open Pit
|
86
|
86
|
122
|
122
|
||||
|
Safford
|
Open Pit
|
—
|
86
|
—
|
122
|
||||
|
Sierrita
|
Open Pit
|
73
|
37
|
120
|
75
|
||||
|
Miami
|
Open Pit
|
—
|
61
|
—
|
91
|
||||
|
Tyrone
|
Open Pit
|
—
|
86
|
—
|
86
|
||||
|
Chino
|
Open Pit
|
43
|
86
|
86
|
122
|
||||
|
Henderson
|
Block Cave
|
38
|
—
|
85
|
—
|
||||
|
Climax
|
Open Pit
|
61
|
—
|
122
|
—
|
||||
|
Cobre
|
Open Pit
|
—
|
61
|
—
|
91
|
||||
|
South America
|
|
|
|
|
|
||||
|
Cerro Verde
|
Open Pit
|
50
|
50
|
100
|
100
|
||||
|
El Abra
|
Open Pit
|
—
|
75
|
—
|
120
|
||||
|
Candelaria
|
Open Pit
|
35
|
—
|
70
|
—
|
||||
|
Ojos del Salado
|
Sublevel Stoping
|
25
|
—
|
50
|
—
|
||||
|
Indonesia
|
|
|
|
|
|
||||
|
Grasberg
|
Open Pit
|
32
|
—
|
88
|
—
|
||||
|
Deep Ore Zone
|
Block Cave
|
23
|
—
|
58
|
—
|
||||
|
Big Gossan
|
Open Stope
|
14
|
—
|
44
|
—
|
||||
|
Grasberg
|
Block Cave
|
30
|
—
|
78
|
—
|
||||
|
Kucing Liar
|
Block Cave
|
39
|
—
|
100
|
—
|
||||
|
Deep Mill Level Zone
|
Block Cave
|
21
|
—
|
80
|
—
|
||||
|
Africa
|
|
|
|
|
|
||||
|
Tenke Fungurume
|
Open Pit
|
—
|
50
|
—
|
100
|
||||
38
Production Sequencing
The following chart illustrates our current plans for sequencing and producing our proven and probable reserves at each of our ore bodies and the years in which we currently expect production from each ore body. The chart also shows the term of PT Freeport Indonesia’s COW. Production volumes are typically lower in the first few years for each ore body as development activities are ongoing and as the mine ramps up to full production and production volumes may also be lower as the mine reaches the end of its life. The ultimate timing of the start of production from our undeveloped mines is dependent upon a number of factors, including the results of our exploration and development efforts, and may vary from the dates shown below. In addition, we develop our mine plans based on maximizing the net present value from the ore bodies. Significant additional capital expenditures will be required at many of these mines in order to achieve the life-of-mine plans reflected below.
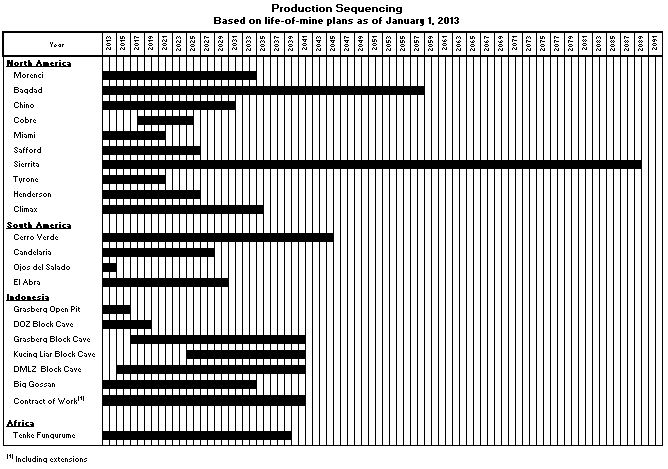
Mill and Leach Stockpiles
Mill and leach stockpiles generally contain lower grade ores that have been extracted from the ore body and are available for copper recovery. For mill stockpiles, recovery is through milling, concentrating, smelting and refining or, alternatively, by concentrate leaching. For leach stockpiles, recovery is through exposure to acidic solutions that dissolve contained copper and deliver it in solution to extraction processing facilities.
Because it is generally impracticable to determine copper contained in mill and leach stockpiles by physical count, reasonable estimation methods are employed. The quantity of material delivered to mill and leach stockpiles is based on surveyed volumes of mined material and daily production records. Sampling and assaying of blasthole cuttings determine the estimated copper grades of material delivered to mill and leach stockpiles.
Expected copper recovery rates for mill stockpiles are determined by metallurgical testing. The recoverable copper in mill stockpiles, once entered into the production process, can be produced into copper concentrate almost immediately.
39
Expected copper recovery rates for leach stockpiles are determined using small-scale laboratory tests, small- to large-scale column testing (which simulates the production-scale process), historical trends and other factors, including mineralogy of the ore and rock type. Ultimate recovery of copper contained in leach stockpiles can vary significantly from a low percentage to more than 90 percent depending on several variables, including type of copper recovery, mineralogy and particle size of the rock. For newly placed material on active stockpiles, as much as 70 percent of the copper ultimately recoverable may be extracted during the first year, and the remaining copper may be recovered over many years.
Processes and recovery rates are monitored continuously, and recovery rate estimates are adjusted periodically as additional information becomes available and as related technology changes.
Following are our stockpiles and the estimated recoverable copper contained within those stockpiles as of
December 31, 2012
:
|
Recoverable
|
||||||||||||
|
Millions of
|
Average
|
Recovery
|
Copper
|
|||||||||
|
Metric Tons
|
Grade (%)
|
Rate (%)
|
(billion pounds)
|
|||||||||
|
Mill stockpiles
|
||||||||||||
|
Cerro Verde
|
103
|
|
0.40
|
|
81.8
|
|
0.7
|
|
||||
|
Candelaria
|
94
|
|
0.36
|
|
83.3
|
|
0.7
|
|
||||
|
197
|
|
|
|
|
|
1.4
|
|
|||||
|
Leach stockpiles
|
||||||||||||
|
Morenci
|
5,188
|
|
0.25
|
|
2.1
|
|
0.6
|
|
||||
|
Bagdad
|
479
|
|
0.26
|
|
2.7
|
|
0.1
|
|
||||
|
Safford
|
135
|
|
0.44
|
|
19.6
|
|
0.2
|
|
||||
|
Sierrita
|
650
|
|
0.15
|
|
12.2
|
|
0.3
|
|
||||
|
Miami
|
471
|
|
0.38
|
|
2.0
|
|
0.1
|
|
||||
|
Tyrone
|
1,053
|
|
0.28
|
|
2.4
|
|
0.1
|
|
||||
|
Chino
|
1,617
|
|
0.26
|
|
4.7
|
|
a
|
0.4
|
|
a
|
||
|
Cerro Verde
|
428
|
|
0.53
|
|
2.7
|
|
0.1
|
|
||||
|
El Abra
|
452
|
|
0.40
|
|
11.5
|
|
0.5
|
|
||||
|
Tenke Fungurume
|
22
|
|
1.21
|
|
92.5
|
|
0.6
|
|
||||
|
10,495
|
|
3.0
|
|
|||||||||
|
Total FCX - 100% basis
|
4.4
|
|
||||||||||
|
Total FCX - Consolidated basis
b
|
4.3
|
|
||||||||||
|
Total FCX - Net equity interest
c
|
3.3
|
|
||||||||||
|
a.
|
During 2012, we completed an assessment of estimated future recovery rates within the current mine plan at our Chino leaching operations, which resulted in a downward revision of these rates and a corresponding reduction of 594 million pounds of estimated recoverable copper in Chino's leach stockpiles.
|
|
b.
|
Consolidated basis represents estimated metal quantities after reduction for our joint venture partner’s interest in the Morenci mine in North America.
|
|
c.
|
Net equity interest represents estimated consolidated basis metal quantities further reduced for noncontrolling interest ownership.
|
MINERALIZED MATERIAL
We hold various properties containing mineralized material that we believe could be brought into production should market conditions warrant. However, permitting and significant capital expenditures would be required before operations could commence at these properties. Mineralized material is a mineralized body that has been delineated by appropriately spaced drilling and/or underground sampling to support the reported tonnage and average metal grades. Such a deposit cannot qualify as recoverable proven and probable reserves until legal and economic feasibility are confirmed based upon a comprehensive evaluation of development costs, unit costs, grades, recoveries and other material factors. Estimated mineralized materials as presented on the following page were assessed using prices of
$2.20
per pound for copper,
$1,000
per ounce for gold and
$12
per pound for molybdenum.
40
|
Mineralized Material
|
||||||||||||||||||||||||||||||||
|
Estimated at December 31, 2012
|
||||||||||||||||||||||||||||||||
|
|
|
Milling Material
|
Leaching Material
|
Total Mineralized Material
|
||||||||||||||||||||||||||||
|
|
|
Million
|
|
|
|
Million
|
|
Million
|
|
|
|
|||||||||||||||||||||
|
|
FCX’s
|
metric
|
Copper
|
Gold
|
Moly
|
metric
|
Copper
|
metric
|
Copper
|
Gold
|
Moly
|
|||||||||||||||||||||
|
|
Interest
|
tons
|
%
|
g/t
|
%
|
tons
|
%
|
tons
|
%
|
g/t
|
%
|
|||||||||||||||||||||
|
North America
|
|
|
|
|
|
|
|
|
|
|
|
|||||||||||||||||||||
|
Morenci
|
85%
|
596
|
|
0.35
|
|
—
|
|
0.020
|
|
2,278
|
|
0.21
|
|
2,874
|
|
0.24
|
|
—
|
|
0.004
|
|
|||||||||||
|
Bagdad
a
|
100%
|
523
|
|
0.29
|
|
—
|
|
b
|
0.019
|
|
50
|
|
0.11
|
|
573
|
|
0.27
|
|
—
|
|
b
|
0.017
|
|
|||||||||
|
Safford
a
|
100%
|
480
|
|
0.52
|
|
0.09
|
|
0.004
|
|
171
|
|
0.24
|
|
651
|
|
0.44
|
|
0.08
|
|
0.003
|
|
|||||||||||
|
Sierrita
a
|
100%
|
1,588
|
|
0.18
|
|
—
|
|
b
|
0.022
|
|
21
|
|
0.15
|
|
1,609
|
|
0.18
|
|
—
|
|
b
|
0.021
|
|
|||||||||
|
Miami
|
100%
|
—
|
|
—
|
|
—
|
|
—
|
|
11
|
|
0.50
|
|
11
|
|
0.50
|
|
—
|
|
—
|
|
|||||||||||
|
Tyrone
|
100%
|
—
|
|
—
|
|
—
|
|
—
|
|
98
|
|
0.28
|
|
98
|
|
0.28
|
|
—
|
|
—
|
|
|||||||||||
|
Chino
|
100%
|
62
|
|
0.49
|
|
—
|
|
0.013
|
|
22
|
|
0.30
|
|
84
|
|
0.44
|
|
—
|
|
0.011
|
|
|||||||||||
|
Henderson
|
100%
|
159
|
|
—
|
|
—
|
|
0.148
|
|
—
|
|
—
|
|
159
|
|
—
|
|
—
|
|
0.148
|
|
|||||||||||
|
Climax
|
100%
|
390
|
|
—
|
|
—
|
|
0.156
|
|
—
|
|
—
|
|
390
|
|
—
|
|
—
|
|
0.156
|
|
|||||||||||
|
Cobre
|
100%
|
39
|
|
0.51
|
|
—
|
|
—
|
|
4
|
|
0.25
|
|
43
|
|
0.48
|
|
—
|
|
—
|
|
|||||||||||
|
Ajo
a
|
100%
|
948
|
|
0.32
|
|
0.06
|
|
0.006
|
|
—
|
|
—
|
|
948
|
|
0.32
|
|
0.06
|
|
0.006
|
|
|||||||||||
|
Cochise/Bisbee
|
100%
|
—
|
|
—
|
|
—
|
|
—
|
|
276
|
|
0.44
|
|
276
|
|
0.44
|
|
—
|
|
—
|
|
|||||||||||
|
Lone Star
|
100%
|
—
|
|
—
|
|
—
|
|
—
|
|
656
|
|
0.44
|
|
656
|
|
0.44
|
|
—
|
|
—
|
|
|||||||||||
|
Sanchez
|
100%
|
—
|
|
—
|
|
—
|
|
—
|
|
175
|
|
0.29
|
|
175
|
|
0.29
|
|
—
|
|
—
|
|
|||||||||||
|
Tohono
|
100%
|
204
|
|
0.70
|
|
—
|
|
—
|
|
258
|
|
0.64
|
|
462
|
|
0.67
|
|
—
|
|
—
|
|
|||||||||||
|
Twin Buttes
a
|
100%
|
445
|
|
0.40
|
|
—
|
|
0.025
|
|
53
|
|
0.21
|
|
498
|
|
0.38
|
|
—
|
|
0.022
|
|
|||||||||||
|
South America
|
|
|
|
|
|
|
|
|
|
|
|
|||||||||||||||||||||
|
Cerro Verde
a
|
53.56%
|
595
|
|
0.37
|
|
—
|
|
0.015
|
|
42
|
|
0.47
|
|
637
|
|
0.38
|
|
—
|
|
0.014
|
|
|||||||||||
|
El Abra
|
51%
|
1,484
|
|
0.43
|
|
—
|
|
—
|
|
316
|
|
0.25
|
|
1,800
|
|
0.40
|
|
—
|
|
—
|
|
|||||||||||
|
Candelaria
a
|
80%
|
68
|
|
0.55
|
|
0.13
|
|
—
|
|
—
|
|
—
|
|
68
|
|
0.55
|
|
0.13
|
|
—
|
|
|||||||||||
|
Indonesia
|
|
|
|
|
|
|
|
|
|
|
|
|||||||||||||||||||||
|
Grasberg minerals district
a
|
54.38%
c
|
2,341
|
|
0.63
|
|
0.55
|
|
—
|
|
—
|
|
—
|
|
2,341
|
|
0.63
|
|
0.55
|
|
—
|
|
|||||||||||
|
Africa
|
|
|
|
|
|
|
|
|
|
|
|
|||||||||||||||||||||
|
Tenke Fungurume
d
|
56%
|
72
|
|
3.60
|
|
—
|
|
—
|
|
18
|
|
3.22
|
|
90
|
|
3.52
|
|
—
|
|
—
|
|
|||||||||||
|
Kisanfu
d
|
95%
|
56
|
|
2.33
|
|
—
|
|
—
|
|
52
|
|
2.94
|
|
108
|
|
2.62
|
|
—
|
|
—
|
|
|||||||||||
|
Total FCX - 100% basis
|
|
10,050
|
|
0.43
|
|
0.14
|
|
0.017
|
|
4,501
|
|
0.34
|
|
14,551
|
|
0.40
|
|
0.10
|
|
0.012
|
|
|||||||||||
|
Total FCX - Consolidated basis
e
|
|
9,024
|
|
|
|
|
4,159
|
|
|
13,183
|
|
|
|
|
||||||||||||||||||
|
Total FCX - Net equity interest
f
|
|
7,842
|
|
|
|
|
3,974
|
|
|
11,815
|
|
|
|
|
||||||||||||||||||
|
a.
|
Stated tonnage also includes silver at Bagdad (1.1 g/t), Safford (1.6 g/t), Sierrita (1.1 g/t), Ajo (0.9 g/t), Twin Buttes (2.1 g/t), Cerro Verde (1.4 g/t), Candelaria (1.9 g/t) and the Grasberg minerals district (3.4 g/t).
|
|
b.
|
Amounts not shown because of rounding.
|
|
c.
|
FCX's interest in the Grasberg minerals district reflects our 60 percent joint venture ownership further reduced by noncontrolling interest ownership.
|
|
d.
|
Stated tonnage also includes cobalt at Tenke Fungurume (0.31 percent) and Kisanfu (1.08 percent).
|
|
e.
|
Consolidated basis represents estimated mineralized materials after reduction for our joint venture partners' interest in the Morenci mine and the Grasberg minerals district.
|
|
f.
|
Net equity interest represents estimated consolidated basis mineralized material further reduced for noncontrolling interest ownership.
|
41
This report contains “forward-looking statements” within the meaning of United States (U.S.) federal securities laws. Forward-looking statements are all statements other than statements of historical facts, such as statements regarding projected ore grades and milling rates, projected production and sales volumes, projected unit net cash costs, projected operating cash flows, projected capital expenditures, exploration efforts and results, mine production and development plans, the impact of deferred intercompany profits on earnings, liquidity, other financial commitments and tax rates, the impact of copper, gold, molybdenum and cobalt price changes, availability of power, water, labor and equipment, reclamation and closure costs and plans, environmental liabilities and expenditures, litigation contingencies and results, future dividend payments, reserve estimates, risks associated with the completion of pending acquisitions, and anticipated political, economic and social conditions in our areas of operations. We undertake no obligation to update any forward-looking statements. Readers are cautioned that forward-looking statements are not guarantees of future performance and our actual results may differ materially from those anticipated, projected or assumed in the forward-looking statements. Important factors that could cause our actual results to differ materially from those anticipated in the forward-looking statements include the following.
Financial risks
Extended declines in the market prices of copper, gold and/or molybdenum could adversely affect our earnings and cash flows and, if sustained, could adversely affect our ability to repay debt. Fluctuations in the market prices of copper, gold or molybdenum can cause significant volatility in our financial performance and adversely affect the trading prices of our debt and common stock.
Our financial results vary with fluctuations in metal market prices, including copper, gold and molybdenum (for further information about the market prices of these commodities, refer to discussion below and in Item 7. “Management's Discussion and Analysis of Financial Condition and Results of Operations”). An extended decline in the market prices of these commodities could adversely affect our financial results, or our ability to repay our debt and meet our other fixed obligations, and depress the trading prices of our common stock and of our publicly traded debt securities.
Additionally, if market prices for the metals we produce decline for a sustained period of time, we may have to revise our operating plans, including curtailing production, reducing operating costs and capital expenditures and discontinuing certain exploration and development programs. We may be unable to decrease our costs in an amount sufficient to offset reductions in revenues, and may incur losses.
Substantially all of our copper concentrate and cathode sales contracts provide final copper pricing in a specified future month (generally one to four months from the shipment date) based primarily on quoted London Metal Exchange (LME) monthly average spot copper prices. Accordingly, in times of rising copper prices, our revenues benefit from adjustments to the final pricing of provisionally priced sales pursuant to contracts entered into in prior periods; in times of falling copper prices, the opposite occurs.
Copper prices have fluctuated historically, with LME spot copper prices ranging from a low of
$2.76
to a high of
$4.60
per pound during the three years ended
December 31, 2012
. Copper prices are affected by numerous factors beyond our control, including:
|
•
|
The strength of the U.S. economy and the economies of other industrialized and developing nations, including China, which has become the largest consumer of refined copper in the world;
|
|
•
|
Available supplies of copper from mine production and inventories;
|
|
•
|
Sales by holders and producers of copper;
|
|
•
|
Demand for industrial products containing copper;
|
|
•
|
Investment activity, including speculation, in copper as a commodity;
|
|
•
|
The availability and cost of substitute materials; and
|
|
•
|
Currency exchange fluctuations, including the relative strength or weakness of the U.S. dollar.
|
42
Gold prices have also fluctuated historically, with the London PM gold price ranging from a low of
$1,058
to a high of
$1,895
per ounce during the three years ended
December 31, 2012
. Gold prices are affected by numerous factors beyond our control, including:
|
•
|
The strength of the U.S. economy and the economies of other industrialized and developing nations, including China and India;
|
|
•
|
Global or regional political or economic crises;
|
|
•
|
The relative strength or weakness of the U.S. dollar and other currencies;
|
|
•
|
Expectations with respect to the rate of inflation;
|
|
•
|
Interest rates;
|
|
•
|
Purchases and sales of gold by governments, central banks and other holders;
|
|
•
|
Demand for jewelry containing gold; and
|
|
•
|
Investment activity, including speculation, in gold as a commodity.
|
Molybdenum prices also fluctuate, with the
Metals Week
Molybdenum Dealer Oxide weekly average price ranging from a low of
$10.90
to a high of
$18.60
per pound during the three years ended
December 31, 2012
. Molybdenum prices are affected by numerous factors beyond our control, including:
|
•
|
The worldwide balance of molybdenum demand and supply;
|
|
•
|
Rates of global economic growth, especially construction and infrastructure activity that requires significant amounts of steel;
|
|
•
|
The volume of molybdenum produced as a by-product of copper production;
|
|
•
|
Inventory levels;
|
|
•
|
Currency exchange fluctuations, including the relative strength or weakness of the U.S. dollar; and
|
|
•
|
Production costs of U.S. and foreign competitors.
|
Under U.S. federal and state laws that require closure and reclamation plans for our mines, we generally are required to provide financial assurance sufficient to allow a third party to implement those plans if we are unable to do so. The U.S. Environmental Protection Agency (EPA) and state agencies may also seek financial assurance for investigation and remediation actions under the Comprehensive Environmental Response, Compensation, and Liability Act (CERCLA) or equivalent state regulations.
The failure to comply with these requirements could have a material adverse effect on us.
We are required by U.S. federal and state laws to provide financial assurance sufficient to allow a third party to implement approved closure and reclamation plans if we are unable to do so. These laws are complex and vary from jurisdiction to jurisdiction. The laws govern the determination of the scope and cost of the closure and reclamation obligations and the amount and forms of financial assurance. EPA and state agencies may also seek financial assurance for investigation and remediation actions under CERCLA or equivalent state regulations.
In July 2009, EPA published a Priority Notice of Action identifying classes of facilities within the hardrock mining industry for which the agency will develop financial responsibility requirements consistent with the degree and duration of risk associated with the production, transportation, treatment, storage or disposal of hazardous substances. In EPA's semi-annual regulatory agenda published on January 8, 2013, EPA indicated that it intends to propose regulations regarding hardrock mining financial responsibility in May 2014. It is uncertain how the new requirements, if promulgated, will affect the amount and form of our existing and future financial assurance obligations.
43
The amount of financial assurance we are required to provide will vary with changes in laws, regulations and reclamation and closure requirements and cost estimates. As of
December 31, 2012
, our financial assurance obligations associated with closure and reclamation costs totaled
$970 million
, of which
$601 million
was in the form of parent company guarantees and financial capability demonstrations. Our ability to continue to provide financial assurance in the form of parent guarantees and financial capability demonstrations depends on our ability to meet financial tests. Certain of the ratios in these tests are significantly more rigorous for companies that do not have an investment grade rating from a state-approved ratings service. We are currently rated investment grade by Standard & Poor's Rating Services (S&P), Fitch Ratings and Moody's Investors Service (Moody's). If we fail to maintain our investment grade rating, we would be subject to these more rigorous tests, in which case the regulatory agencies may require us to provide alternative forms of financial assurance, such as letters of credit, surety bonds or collateral. Depending on our financial condition and market conditions, these other forms of financial assurance may be difficult or costly to provide. Issuance of letters of credit under our credit facilities would reduce our available liquidity. Failure to provide the required financial assurance could result in the closure of mines. As of
December 31, 2012
, we had limited financial assurance obligations associated with CERCLA-related remediation obligations, although EPA and certain states are increasing the use of financial assurance requirements for such obligations.
For additional information and for discussion of mine closure laws impacting our international operations, refer to the environmental risk factor "Mine closure regulations impose substantial costs on our operations."
Movements in foreign currency exchange rates could negatively affect our operating results.
The functional currency for most of our operations is the U.S. dollar. All of our revenues and a significant portion of our costs are denominated in U.S. dollars; however, some costs and certain asset and liability accounts are denominated in local currencies, including the Indonesian rupiah, Australian dollar, Chilean peso, Peruvian nuevo sol, euro and South African rand. Generally, our results are positively affected when the U.S. dollar strengthens in relation to those foreign currencies and adversely affected when the U.S. dollar weakens in relation to those foreign currencies. Refer to Item 7A. “Quantitative and Qualitative Disclosures about Market Risk” for a summary of the estimated impact of changes in foreign currency rates on our annual operating costs.
From time to time, we may implement currency hedges intended to reduce our exposure to changes in foreign currency exchange. However, our hedging strategies may not be successful, and any of our unhedged foreign exchange payments will continue to be subject to market fluctuations.
International risks
Our international operations are subject to political, social and geographic risks of doing business in foreign countries.
We are a global mining company with substantial assets located outside of the U.S. We conduct international mining operations in Indonesia, Peru, Chile and the Democratic Republic of Congo (DRC). Accordingly, in addition to the usual risks associated with conducting business in foreign countries, our business may be adversely affected by political, economic and social uncertainties in each of these countries. Such risks include:
|
•
|
Renegotiation, cancellation or forced modification of existing contracts,
|
|
•
|
Expropriation or nationalization of property,
|
|
•
|
Changes in a foreign country's laws, regulations and policies, including those relating to labor, taxation, royalties, divestment, imports, exports, trade regulations, currency and environmental matters,
|
|
•
|
Political instability, bribery, extortion, corruption, civil strife, acts of war, guerrilla activities, insurrection and terrorism,
|
|
•
|
Foreign exchange controls, and
|
|
•
|
The risk of having to submit to the jurisdiction of a foreign court or arbitration panel or having to enforce the judgment of a foreign court or arbitration panel against a sovereign nation within its own territory.
|
44
Our insurance does not cover most losses caused by the above described risks. Accordingly, our exploration, development and production activities outside of the U.S. could be substantially affected by factors beyond our control, some of which could materially and adversely affect our financial position or results of operations.
Our international operations must comply with the U.S. Foreign Corrupt Practices Act and similar anti-corruption and anti-bribery laws of the foreign jurisdictions in which we operate. There has been a substantial increase in the global enforcement of these laws. Although we have a compliance program in place designed to reduce the likelihood of violations of such laws, any violation could result in significant criminal or civil sanctions.
We are involved in several significant tax proceedings and other tax matters with the Indonesian and Peruvian tax authorities (refer to Note
13
for further discussion of these matters).
Because our Grasberg minerals district is our most significant operating asset, our business may continue to be adversely affected by political, economic and social uncertainties and security risks in Indonesia.
Indonesia has faced political and social uncertainties, including separatist movements and civil and religious strife in a number of provinces. In particular, several separatist groups are opposing Indonesian rule over the province of Papua, where our Grasberg minerals district is located, and have sought political independence for the province. In response, Indonesia enacted regional autonomy laws, which became effective January 1, 2001. The manner in which those laws are being implemented and the degree of political and economic autonomy that they may bring to individual provinces, including Papua, are uncertain and are ongoing issues in Indonesian politics. In Papua, there have been sporadic attacks on civilians by separatists and sporadic but highly publicized conflicts between separatists and the Indonesian military. Social, economic and political instability in Papua could materially and adversely affect us if it results in damage to our property or interruption of our activities.
Maintaining a good working relationship with the Indonesian government is important to us because our mining operations there are among Indonesia's most significant business enterprises and are conducted pursuant to a Contract of Work (COW) with the Indonesian government. Partially because of their significance to Indonesia's economy, the environmentally sensitive area in which they are located, and the number of people employed, our operations are occasionally the subject of criticism in the Indonesian press and in political debates, and have been the target of protests and occasional violence.
Between July 2009 and
February 15, 2013
, there were
37
shooting incidents in and around the Grasberg minerals district, including along the road leading to our mining and milling operations, which resulted in
15
fatalities and
57
injuries. The investigation of these matters is continuing. We have taken precautionary measures, including limiting the use of the roads to secured convoys. The Indonesian government has responded with additional security forces and expressed a commitment to protect the safety of the community and our operations. Prolonged limitations on access to the road could adversely affect operations at the mine. The safety of our workforce is a critical concern, and PT Freeport Indonesia is working cooperatively with the Indonesian government to address security issues.
During 2011, PT Freeport Indonesia was adversely affected by labor disruptions, including an eight-day work stoppage in July 2011 and an approximate three-month strike that concluded in December 2011. The strike involved civil unrest, transportation blockades, sabotage of important operating facilities and violence. Additionally, during first-quarter 2012, PT Freeport Indonesia experienced work interruptions in connection with its efforts to resume normal operations and temporarily suspended operations.
Large numbers of illegal miners have continued to operate along the river used to transport the tailings from the mill to the lowlands in PT Freeport Indonesia's government-approved tailings management area. The illegal miners have periodically clashed with police who have attempted to move them away from our facilities. In 2006, the illegal miners temporarily blocked the road leading to the Grasberg mine and mill in protest, and PT Freeport Indonesia temporarily suspended mining and milling operations as a precautionary measure.
We cannot predict whether additional incidents will occur that could disrupt or suspend our Indonesian operations. If additional violence or other disruptive incidents occur, it could adversely affect our business and profitability in ways that we cannot predict at this time.
45
We will not mine all of our ore reserves in Indonesia before the initial term of our COW expires.
PT Freeport Indonesia is entitled to mine in Indonesia under its COW with the Indonesian government. The initial term of the current COW expires in 2021, but can be extended for two 10-year periods subject to Indonesian government approval, which pursuant to the COW cannot be withheld or delayed unreasonably. Our proven and probable ore reserves in Indonesia reflect estimates of minerals that can be recovered through the end of 2041 and our current mine plan has been developed, and our operations are based on the assumption that we will receive the two 10-year extensions. As a result, we will not mine all of these ore reserves during the initial term of the current COW, and there can be no assurance that the Indonesian government will approve the extensions. Prior to the end of 2021, we expect to mine 28 percent of aggregate proven and probable recoverable ore at
December 31, 2012
, representing 34 percent of PT Freeport Indonesia's share of recoverable copper reserves and 46 percent of its share of recoverable gold reserves.
We have had discussions with the Indonesian government regarding the implications of the 2009 mining law, and are working cooperatively to complete the government's contract of work evaluation process and to obtain an extension of the COW beyond 2021, as provided under the terms of the COW (refer to Part I, Items 1 and 2., "Business and Properties - Mines, Indonesia" for further discussion). The outcome of these discussions may result in revisions to certain terms of the COW.
Our COWs in Indonesia are subject to termination if we do not comply with our contractual obligations, and if a dispute arises, we may have to submit to the jurisdiction of a foreign court or arbitration panel.
PT Freeport Indonesia's COW and other COWs in which we have an interest were entered into under Indonesia's 1967 Foreign Capital Investment Law, which provides guarantees of remittance rights and protection against nationalization. Our COWs can be terminated by the Indonesia government if we do not satisfy our contractual obligations, which include the payment of royalties and taxes to the government and the satisfaction of certain mining, environmental, safety and health requirements.
Certain forestry laws and designations as well as prevailing environmental laws and regulations may conflict with or overlap with the mining rights established under our COW. Although our COW grants to PT Freeport Indonesia the unencumbered right to operate in accordance with the COW, certain government agencies could seek to impose additional restrictions on PT Freeport Indonesia that could affect exploration and operating requirements.
At times, certain government officials and others in Indonesia have questioned the validity of contracts entered into by the Indonesian government prior to May 1998 (
i.e.,
during the Suharto regime, which lasted over 30 years), including PT Freeport Indonesia's COW, which was signed in December 1991. We cannot provide assurance that the validity of, or our compliance with, the COWs will not be challenged for political or other reasons. PT Freeport Indonesia's COW and our other COWs require that disputes with the Indonesian government be submitted to international arbitration. Accordingly, if a dispute arises under the COWs, we face the risk of having to submit to the jurisdiction of a foreign court or arbitration panel, and if we prevail in such a dispute, we will face the additional risk of having to enforce the judgment of a foreign court or arbitration panel against Indonesia within its own territory.
The Tenke Fungurume minerals district is located in the Katanga province of the DRC, and may be adversely affected by security risks and political, economic and social instability in the DRC.
During 2009, we completed construction activities and commenced copper and cobalt production at the Tenke Fungurume (Tenke) mine located in the DRC. Since gaining independence in 1960, the DRC has undergone outbreaks of violence, changes in national leadership and financial crises. These factors heighten the risk of abrupt changes in the national policy toward foreign investors, which in turn could result in unilateral modification of concessions or contracts, increased taxation, denial of permits or permit renewals or expropriation of assets. As part of a review of all mining contracts by the Ministry of Mines (the Ministry) in the DRC, in February 2008, we received notification that the Ministry wished to renegotiate several material provisions of Tenke Fungurume Mining S.A.R.L.'s (TFM) mining concessions. In October 2010, the DRC government concluded its review of TFM's existing mining contracts and confirmed that they are in good standing. In connection with the review, TFM made several commitments that were reflected in amendments to its mining contracts, which were signed by the parties in December 2010, approved by a ministerial council in March 2011, and a Presidential Decree was issued in April 2011. In addition, effective March 26, 2012, the DRC government issued a Presidential Decree approving
46
modifications to TFM's bylaws. Among other changes to the Amended and Restated Mining Convention (ARMC), FCX's effective ownership in TFM was reduced from 57.75 percent to 56 percent.
Political, economic, social and security risks in the DRC are generally outside of our control and could adversely affect our business. These risks include legal and regulatory uncertainties; exposure to an environment of governmental corruption and bribery; attempts to increase taxes or claims for fees and penalties by governmental officials, including retroactive claims; security risks resulting from political instability in the DRC; and risk of loss due to civil strife, acts of war, guerrilla activities, insurrection and terrorism.
In addition to ongoing conflict in the eastern region of the DRC, there have been a limited number of reported acts of violence in the Katanga province where the Tenke Fungurme minerals district is located. The safety of our workforce at all of our operations is our highest priority, and TFM works cooperatively with government officials to address security issues; however, no assurance can be given that conflict or random acts of violence will not occur near or impact TFM's operations.
Accordingly, the Tenke Fungurume minerals district and its future development projects may be substantially affected by factors beyond our control, any of which could adversely affect our operating results, interrupt our operations or result in a loss of all or part of our investment in the DRC.
Terrorist attacks and violence near our operations and throughout the world and the potential for additional future terrorist acts and violence have created economic and political uncertainties that could materially and adversely affect our business.
Refer to the international risk factor “Because our Grasberg minerals district is our most significant operating asset, our business may continue to be adversely affected by political, economic and social uncertainties in Indonesia” for more information about a series of shooting incidents near our Grasberg minerals district.
In July 2009, two suicide bombers set off explosions inside of the JW Marriott and Ritz-Carlton hotels in Jakarta, Indonesia, that killed nine people and injured 53 others, including two of our Indonesia-based executives.
In October 2005, three suicide bombers killed 19 people and wounded over 100 in the Indonesian province of Bali, which is 1,500 miles west of our mining and milling operations. In September 2004, 11 people were killed and over 200 injured by a car bomb detonated in front of the Australian embassy in Jakarta. In August 2003, 12 people were killed and over 100 were injured by a car bomb detonated outside of the JW Marriott Hotel in Jakarta, Indonesia. In October 2002, a bombing killed 202 people in Bali. Indonesian authorities arrested 35 people in connection with this bombing and 29 of those arrested have been tried and convicted. The same international terrorist organizations are suspected in each of these incidents. In November 2005, Indonesian police raided a house in East Java that resulted in the death of other accused terrorists linked to the bombings discussed above. Our mining and milling operations were not interrupted by these incidents, but PT Freeport Indonesia's corporate office in Jakarta had to relocate for several months following the bombing in front of the Australian embassy. In addition to the Bali, JW Marriott Hotel and Australian embassy bombings, there have been anti-American demonstrations in certain sections of Indonesia reportedly led by radical Islamic activists.
No assurance can be given that additional terrorist incidents and acts of violence will not occur. If there were to be additional terrorist incidents or acts of violence, particularly at or near our operations, there could be no assurance that the occurrence of such events would not have a material adverse impact on our business and results of operations.
Operational risks
Our business is subject to operational risks that could adversely affect our business.
Mines by their nature are subject to many operational risks, some of which are outside of our control. These operational risks, which could adversely affect our business, operating results and cash flows, include the following:
|
•
|
Earthquakes, floods and other natural disasters;
|
|
•
|
The occurrence of unusual weather or operating conditions and other force majeure events;
|
47
|
•
|
The failure of equipment or processes to operate in accordance with specifications, design or expectations;
|
|
•
|
Accidents;
|
|
•
|
Wall failures and rock slides in our open-pit mines, and structural collapses in our underground mines;
|
|
•
|
Interruption of energy supply;
|
|
•
|
Lower than expected ore grades or recovery rates;
|
|
•
|
Metallurgical and other processing problems;
|
|
•
|
Unanticipated ground and water conditions;
|
|
•
|
Adverse claims to water rights, adverse outcomes of pending water adjudications and shortages of water to which we have rights;
|
|
•
|
Adjacent land ownership or usage that results in constraints on current or future mine operations;
|
|
•
|
Delays in the receipt of or failure to receive necessary government authorizations, approvals or permits;
|
|
•
|
Delays in transportation and disruptions of supply routes; and
|
|
•
|
The inability to obtain satisfactory insurance coverage.
|
Managing the volume of waste rock, leach material and tailings produced in our mining operations also presents significant environmental, safety and engineering challenges and risks. We maintain large leach pads and tailings impoundments containing viscous material, which must be monitored for structural stability and leakages; our tailings impoundments in arid areas must have effective programs to suppress fugitive dust emissions; and we must effectively monitor and treat acid rock drainage. In Indonesia, we use a river transport system for tailings management, which presents other risks, as discussed elsewhere in these risk factors. The failure to adequately manage these risks could result in significant personal injury, loss of life, property damage and damage to the environment, both in and around our areas of operations, as well as damage to production facilities and delays in or curtailments of production.
Our business may also be impacted by information technology disruptions. Cybersecurity incidents, in particular, are evolving and include, but are not limited to, malicious software, attempts to gain unauthorized access to data and other electronic security breaches that could lead to disruptions in systems, unauthorized release of confidential or otherwise protected information and the corruption of data. We have experienced cybersecurity incidents in the past and may experience them in the future. We believe that we have implemented appropriate measures to mitigate potential risks to our technology and our operations from these information technology disruptions. However, given the unpredictability of the timing, nature and scope of information technology disruptions, we could potentially be subject to production downtimes, operational delays, the compromising of confidential or otherwise protected information, destruction or corruption of data, security breaches, other manipulation or improper use of our systems and networks or financial losses from remedial actions, any of which could have a material adverse effect on our cash flows, competitive position, financial condition or results of operations.
Labor unrest and activism could disrupt our operations and may adversely affect our business, financial condition, results of operations and prospects.
As further described in Part I, Items 1 and 2., “Business and Properties - Labor Matters,” we are party to labor agreements with various unions that represent employees at our operations. Labor agreements are negotiated on a periodic basis, and the risk exists that labor agreements may not be renewed on reasonably satisfactory terms to us or at all. We cannot predict what issues may be raised by the collective bargaining units representing our employees and, if raised, whether negotiations concerning those issues will be concluded successfully. Our production and sales volumes could be significantly reduced and our business, financial condition and results of operations adversely affected by significant reductions in productivity or protracted work stoppages at one or more
48
of our operations. Additionally, if we enter into a new labor agreement with any union that significantly increases our labor costs relative to our competitors, our ability to compete may be materially and adversely affected.
During 2011, PT Freeport Indonesia was adversely affected by labor disruptions, including an eight-day work stoppage in July 2011 and an approximate three-month strike that concluded in December 2011. The strike involved civil unrest, transportation blockades, sabotage of important operating facilities and violence. Additionally, during first-quarter 2012, PT Freeport Indonesia experienced work interruptions in connection with its efforts to resume normal operations and temporarily suspended operations.
In fourth-quarter 2011, there was an approximate two-month labor strike at Cerro Verde during the negotiation of a new labor agreement. The strike did not have a significant impact on production, and a new three-year agreement with the union was reached in late December 2011.
As of
December 31, 2012
, approximately
50 percent
of our labor force was covered by collective bargaining agreements, and approximately
35 percent
of our labor force is covered by agreements that will expire within one year.
If we do not successfully negotiate new collective bargaining agreements with our union workers, we may incur prolonged strikes and other work stoppages at our mining operations, which could adversely affect our business, financial condition and results of operations.
Our mining production depends on the availability of sufficient water supplies.
Our operations require significant quantities of water for mining, ore processing and related support facilities. Our operations in North and South America are in areas where water is scarce and competition among users for continuing access to water is significant. Continuous production at our mines is dependent on our ability to maintain our water rights and claims, and the continuing physical availability of the water supplies.
At our North America operations, certain of our water supplies are supported by surface water rights, which give us the right to use public waters for a statutorily defined beneficial use at a designated location. In Arizona, we are a participant in two active general stream adjudications in which, for over 30 years, the Arizona courts have been attempting to quantify and prioritize surface water claims for two of the state's largest river systems, which affect four of our operating mines (Morenci, Safford, Sierrita and Miami). The legal precedent set in these proceedings may also affect our Bagdad mine. Groundwater has historically been treated differently from surface water under Arizona law, which has generally allowed land owners to pump at will, subject to the doctrine of reasonable use. However, court decisions in one of the adjudications have concluded that groundwater pumping may affect surface water, thereby bringing the pumping within the jurisdiction of the general stream adjudications. The effort to define the boundaries between groundwater and surface water remains contested, however, and is currently a primary focus of one of those adjudications. Because groundwater accounts for approximately 40 percent of Arizona’s water supplies, the re-characterization of any significant portion of that water as surface water could jeopardize the ability of consumers, farmers, ranchers, municipalities, and industrial users like us, to continue to access water supplies that have been relied on for decades. Because we are a significant user of groundwater in Arizona, we are an active participant in the adjudication proceedings.
In Colorado, our surface water and groundwater rights are subject to adjudication and we are involved in legal proceedings to resolve disputes regarding priority and administration of rights, including priority of some of our rights for the Climax molybdenum mine. In New Mexico, our surface water and groundwater rights are fully licensed or have been fully adjudicated.
Water for our Cerro Verde mining operation comes from renewable sources through a series of storage reservoirs on the Rio Chili watershed that collect water primarily from seasonal precipitation. Due to occasional drought conditions and the possibility that climate change will reduce precipitation levels, temporary supply shortages are possible that could affect our current and planned Cerro Verde operations. Cerro Verde has been conducting water studies to assess opportunities for additional supplies to support current operations and potential future expansion projects. Cerro Verde has reached an agreement with the Regional Government of Arequipa, the National Government, Servicio de Agua Potable y Alcantarillado de Arequipa S.A. (SEDAPAR) and other local institutions to allow it to finance the engineering and construction of a wastewater treatment plant, should Cerro Verde proceed with plans for a large-scale concentrator expansion. Once Cerro Verde obtains a license for the treated water, it would be used to supplement its existing water supplies to support the concentrator expansion.
49
Water for our El Abra mining operation comes from the continued pumping of groundwater from the Salar de Ascotán aquifer. In 2010, El Abra obtained regulatory approval, subject to certain conditions, for the continued pumping of groundwater from the Salar de Ascotán aquifer for its sulfide processing plant, which began operations in 2011. We believe that El Abra has sufficient water rights to support current operations, however, a change to the sulfide ore project, such as increased production or mill processing, would require additional water beyond our sulfide groundwater pumping, which is permitted through 2021. El Abra is also conducting studies to assess the feasibility of constructing a desalination plant near the Pacific Ocean to treat seawater for possible increased sulfide ore production or mill processing.
Water for our Candelaria and Ojos del Salado mining operations is drawn from the Copiapó River aquifer. Because of rapid depletion of this aquifer in recent years, Candelaria is expanding its sources of water supply. During 2010, we completed construction of a pipeline to convey reclaimed water from a nearby water treatment facility to our Candelaria mine. In addition, we have substantially completed the construction of a desalination plant and pipeline that will supply Candelaria’s longer term water needs.
Although each of our operations currently has access to sufficient water supplies to support current operational demands, some supplies are subject to unresolved claims by others, and additional supplies that may be needed to support expanded operations are expensive, in short supply, and can be difficult to access because of logistical and legal obstacles. Moreover, we cannot predict the potential outcome of pending or future legal proceedings on our water rights, claims and uses. The loss of a water right, loss of continued use of a currently available water supply, or inability to expand our water resources could materially and adversely affect our mining operations, by significantly increasing the cost of water, forcing us to curtail operations, preventing us from expanding operations or forcing premature closures, thereby increasing and/or accelerating costs or foregoing profitable operations.
Increased production costs could reduce our profitability and cash flow.
Our copper mining operations require significant energy, principally diesel, electricity, coal and natural gas. For the year
2012
, energy represented approximately
21 percent
of our consolidated copper production costs. An inability to procure sufficient energy at reasonable prices could adversely affect our profits, cash flow and growth opportunities.
Our consolidated copper production costs are also affected by the prices of commodities we consume or use in our operations, such as sulphuric acid, grinding media, steel, reagents, liners, tires, explosives and diluents. The prices of such commodities are influenced by supply and demand trends affecting the mining industry in general and other factors outside our control and such prices are at times subject to volatile movements. Increases in the cost of these commodities could make our operations less profitable. Increases in the costs of commodities that we consume or use may also significantly affect the capital costs of new projects.
Also refer to the environmental risk factor “Regulation of greenhouse gas emissions and climate change issues may increase our costs and adversely affect our operations and markets” for discussion of the potential for increased energy costs.
In addition to the usual risks encountered in the mining industry, our Indonesia operations involve additional risks because they are located on unusually difficult terrain in a very remote area.
The Grasberg minerals district is located in steep mountainous terrain in a remote area of Indonesia. Because of these conditions, we have had to overcome special engineering difficulties and develop extensive infrastructure facilities. In addition, the area receives considerable rainfall, which has led to periodic floods and mudslides. The mine site is also in an active seismic area and has experienced earth tremors from time to time. Our insurance may not sufficiently cover an unexpected natural or operating disaster.
In April 2011, two PT Freeport Indonesia employees died in an accident when a portion of the Deep Ore Zone (DOZ) mine experienced an uncontrolled muck flow. The area was temporarily shut down during the investigation of the accident.
In September 2008, a small scale failure encompassing approximately 75,000 metric tons of material occurred at our Grasberg open pit. There were no injuries or property damage. The event caused a delay in our access to the
50
high-grade section of the open pit and, as a result, a portion of the metal expected to be mined in the second half of 2008 was deferred to future periods.
In March 2006, a mud/topsoil slide involving approximately 75,000 metric tons of material occurred from a mountain ridge above service facilities supporting PT Freeport Indonesia's mining facilities. Three contract workers were fatally injured in the event. The material damaged a mess hall and an adjacent area. As a result of investigations by PT Freeport Indonesia and the Indonesian Department of Energy and Mineral Resources, we conducted geotechnical studies to identify and address any potential hazards to workers and facilities from slides. The existing early warning system for potential slides, based upon rainfall and other factors, has also been expanded.
In October 2003, a slippage of material occurred in a section of the Grasberg open pit, resulting in eight fatalities. In December 2003, a debris flow involving a relatively small amount of loose material occurred in the same section of the open pit resulting in only minor property damage. The events caused us to alter our short-term mine sequencing plans; normal production activities resumed in second-quarter 2004.
No assurance can be given that similar events will not occur in the future.
In addition to the usual risks encountered in the mining industry, our Africa mining operation involves additional risks because it is located in a remote area of the DRC.
The Tenke Fungurume minerals district is located in a remote area of the DRC and is subject to additional challenges, including:
|
•
|
Severely limited infrastructure, including road, bridge and rail access that is in disrepair and receives minimal maintenance;
|
|
•
|
Limited and possibly unreliable energy supply from antiquated equipment and from power distribution corridors that are not maintained;
|
|
•
|
Challenges in obtaining experienced personnel;
|
|
•
|
Security risks; and
|
|
•
|
Limited health care in an area plagued by disease and other potential endemic health issues, including malaria, cholera and HIV.
|
Additionally, due to limited rail access, we currently truck a significant portion of the production from the Tenke mines approximately 1,900 miles to ports in South Africa. The Tenke Fungurume minerals district and its future development may be substantially affected by factors beyond our control, which could adversely affect their contribution to our operating results and increase the cost of future development.
The volume and grade of ore reserves that we recover and our rate of production may be more or less than anticipated.
Our ore reserve amounts are determined in accordance with Industry Guide 7 as required by the Securities Exchange Age of 1934, and are estimates of the mineral deposits that can be economically and legally extracted or produced at the time of the reserve determination. The determination of reserves involves numerous uncertainties with respect to the ultimate geology of the ore bodies, including quantities, grades and recovery rates, and estimates may change as new data becomes available. Estimating the quantity and grade of reserves requires us to determine the size, shape and depth or our ore bodies by analyzing geological data, such as samplings of drill holes, tunnels and other underground workings. In addition to the geology of our mines, assumptions are required to determine the economic feasibility of mining these reserves, including estimates of future commodity prices and demand, the mining methods we use and the related costs incurred to develop and mine our reserves. A sustained decrease in commodity prices may result in a reduction in economically recoverable ore reserves. These factors may result in variations in the volumes of mineral reserves that we report from period to period.
There are also uncertainties inherent in estimating quantities of ore reserves and copper recovered from mill and leach stockpiles. The quantity of copper delivered to mill and leach stockpiles is based on surveyed volumes of mined material and daily production records. Sampling and assaying of blasthole cuttings determine the estimated
51
copper grade contained in the material delivered to the mill and leach stockpiles. Processes and recovery rates are monitored regularly, and recovery rate estimates are adjusted periodically as additional information becomes available and as related technology changes. Accordingly, the volume and grade of ore reserves recovered, rates of production and copper recovered from stockpiles may be less than anticipated.
We must continually replace reserves depleted by production. Our exploration activities may not result in additional discoveries.
Our ability to replenish our ore reserves is important to our long-term viability. Produced ore reserves must be replaced by further delineation of existing ore bodies or by locating new deposits in order to maintain production levels over the long term. Exploration is highly speculative in nature. Our exploration projects involve many risks, require substantial expenditures and may not result in the discovery of sufficient additional mineral deposits that can be mined profitably. Once a site with mineralization is discovered, it may take several years from the initial phases of drilling until production is possible, during which time the economic feasibility of production may change. Substantial expenditures are required to establish recoverable proven and probable reserves and to construct mining and processing facilities. As a result, there is no assurance that current or future exploration programs will be successful. There is a risk that depletion of reserves will not be offset by discoveries or acquisitions.
Development projects are inherently risky and may require more capital than anticipated, which could adversely affect our business.
There are many risks and uncertainties inherent in all development projects. The economic feasibility of development projects is based on many factors, including the accuracy of estimated reserves, metallurgical recoveries, capital and operating costs and estimated future prices of the relevant minerals. The capital expenditures and time required to develop new mines or other projects are considerable, and changes in costs or construction schedules can adversely affect project economics. Moreover, underground mining is generally more expensive than surface mining as a result of higher capital costs, including costs for modern mining equipment and construction of extensive ventilation systems. Therefore, it is possible that actual costs and economic returns may differ materially from our estimates. Refer to Item 7. “Management's Discussion and Analysis of Financial Condition and Results of Operations” for further discussion of our current development projects.
New development projects have no operating history upon which to base estimates of future cash flow. These development projects also require the successful completion of feasibility studies, acquisition of governmental permits, acquisition of land, power and water, and ensuring that appropriate community infrastructure is developed by third parties to support such projects. It is possible that we could fail to obtain the government approvals necessary for the operation of a project, in which case, the project may not proceed, either on its original timing or at all. It is not unusual for new mining operations to experience unexpected problems during the start-up phase, resulting in delays in producing revenue and increases in capital expenditures.
The development of underground mines is subject to additional risks, including the following:
|
•
|
Unanticipated geologic, geotechnical and hydrogeologic conditions;
|
|
•
|
Challenges related to hiring and training personnel required for underground mining activities;
|
|
•
|
Larger than expected dilution of ore associated with block caving and stoping mining methods; and
|
|
•
|
Unanticipated delays in the development of major access and supporting infrastructure due to engineering changes, late delivery of critical components and longer than planned construction periods.
|
Some of these risks could result in delays to production startup and a loss or reduction in minable tons. There can be no assurance that the occurrence of such events or conditions would not have a material adverse impact on our business and results of operations.
52
Environmental risks
Our operations are subject to complex and evolving environmental laws and regulation. Compliance with environmental regulatory requirements involves significant costs and may constrain our expansion opportunities.
Our mining, development, exploration and production activities, both in the U.S. and internationally, are subject to extensive laws and regulations governing occupational health, mine safety, generation, transportation and disposal of hazardous toxic substances, waste disposal, air emissions and water discharges, remediation of the environment, protection of endangered and protected species, and other related matters. Compliance with these laws and regulations imposes substantial costs, which we expect will continue to increase over time because of increased regulatory oversight, adoption of increasingly stringent environmental standards, as well as other factors.
For example, under the Clean Air Act, EPA recently lowered the National Ambient Air Quality Standards (NAAQS) for sulfur dioxide. The area around our smelter in Miami, Arizona, has sulfur dioxide levels in excess of the new standard, and the smelter is the primary contributor to those levels. As a result, we will be required to limit the smelter’s operations or install expensive pollution control equipment that will significantly reduce those emissions. Additionally, any expansion of the smelter will be constrained by, or be significantly more expensive because of, these new standards.
In addition, EPA has recently proposed rules that, if effective, would reclassify some mineral processing materials as “hazardous waste” under the Federal Resource Conservation and Recovery Act, which would reverse long-standing EPA regulatory determinations and subject the industry to significant new and costly waste management requirements.
We also believe there has generally been more aggressive application of the Endangered Species Act, resulting in increases in the number of protected species and expansive designations of their critical habitat, which may make obtaining federal permits and securing additional water resources more time-consuming, unpredictable and expensive.
Other regulation under consideration by environmental regulatory agencies include provisions that would impose additional restrictions on waterway discharges, and regulate environmental impacts of radioactive materials associated with mining operations and expand regulation of solid wastes, among other things.
Adoption of these or similar new environmental regulations or more stringent application of existing regulations may materially increase our costs and constrain our U.S. expansion opportunities.
In addition to compliance with environmental regulation at our operating sites, we incur significant costs for remediating environmental conditions on properties that have not been operated in many years.
Freeport-McMoRan Corporation (FMC), and many of its affiliates and predecessor companies have been involved in exploration, mining, milling, smelting and manufacturing in the U.S. for more than a century. Activities that occurred in the late 19th century and the 20th century prior to the advent of modern environmental laws were not subject to environmental regulation and were conducted before American industrial companies understood the long-term effects of their operations on the surrounding environment. With the passage of CERCLA in 1980, companies like FMC became legally responsible for environmental remediation on properties previously owned or operated by them, irrespective of when the damage to the environment occurred or who caused it. That liability is often shared on a joint and several basis with all other owners and operators, meaning that each owner or operator of the property is fully responsible for the clean-up, although in many cases some or all of the other historical owners or operators no longer exist, do not have the financial ability to respond or cannot be found. As a result, because of our acquisition of FMC in 2007, many of the subsidiary companies we now own are responsible for a wide variety of environmental remediation projects throughout the U.S., and we expect to spend substantial sums annually for many years to address those remediation issues. We are also subject to claims where the release of hazardous substances is alleged to have damaged natural resources. At
December 31, 2012
, we had more than
100
active remediation projects (including damaged natural resource claims) in the U.S. in
28
states.
53
At
December 31, 2012
, we had
$1.2 billion
recorded in our consolidated balance sheet for environmental obligations attributed to CERCLA or analogous state programs and for estimated future costs associated with environmental matters at closed facilities or closed portions of certain operating facilities. Our environmental obligation estimates are primarily based upon:
|
•
|
Our knowledge and beliefs about complex scientific and historical facts and circumstances that in many cases involve events that occurred many decades ago;
|
|
•
|
Our beliefs and assumptions regarding the nature, extent and duration of remediation activities that we will be required to undertake and the estimated costs of those remediation activities, which are subject to varying interpretations; and
|
|
•
|
Our beliefs regarding the requirements that are imposed on us by existing laws and regulations and, in some cases, the expected clarification of uncertain regulatory requirements that could materially affect our environmental obligation estimates.
|
Significant adjustments to these estimates are likely to occur in the future as additional information becomes available. The actual environmental costs ultimately may exceed our current and future accruals for these costs, and any such changes could be material.
In addition, remediation standards imposed by EPA and state environmental agencies have generally become more stringent over time. For example, in some cases, EPA has applied increasingly costly requirements regarding remediation of contaminated water bottom sediments. Continued application of these types of standards could have an adverse impact on our ultimate cleanup costs at the Newtown Creek site in New York City. Additionally, imposition of more stringent remediation standards poses a risk that additional remediation work could be required at sites that we have already remediated to the satisfaction of the responsible governmental agencies, and may increase the risk of toxic tort litigation.
Refer to Note
13
for further discussion of our environmental obligations.
During
2012
, we incurred environmental capital expenditures and other environmental costs (including our joint venture partners' shares) to comply with applicable environmental laws and regulations that affect our operations of
$612 million
, compared with
$387 million
in
2011
and
$372 million
in
2010
. For
2013
, we expect to incur approximately
$600 million
of aggregate environmental capital expenditures and other environmental costs. The timing and amounts of estimated payments could change as a result of changes in regulatory requirements, changes in scope and costs of reclamation activities, the settlement of environmental matters and as actual spending occurs.
An adverse ruling in one or more pending legal proceedings involving environmental matters could have a material adverse effect on us.
As described in Note 13, we are a defendant in numerous, and in some cases significant, litigation matters involving alleged environmental contamination, alleged environmental toxic torts and complex interpretations of environmental regulations. An adverse ruling in one or more of those matters could have a material adverse effect on our results of operations, financial condition and cash flow.
Our Indonesia mining operations create difficult and costly environmental challenges, and future changes in environmental laws, or unanticipated environmental impacts from those operations, could require us to incur increased costs.
Mining operations on the scale of our Indonesia operations involve significant environmental risks and challenges. Our primary challenge is to dispose of the large amount of crushed and ground rock material, called tailings, that results from the process by which we physically separate the copper-, gold- and silver-bearing materials from the ore that we mine. Our tailings management plan, which has been approved by the Indonesian government, uses the river system near our mine to transport the tailings to an engineered area in the lowlands where the tailings and natural sediments are managed in a deposition area. Lateral levees have been constructed to help contain the footprint of the tailings and to limit their impact in the lowlands.
54
Another major environmental challenge is managing overburden, which is the rock that must be moved aside in the mining process to reach the ore. In the presence of air, water and naturally occurring bacteria, some overburden can generate acid rock drainage, or acidic water containing dissolved metals that, if not properly managed, can adversely affect the environment.
From time to time, certain Indonesian government officials have raised questions with respect to our tailings and overburden management plans, including a suggestion that we implement a pipeline system rather than our river transport system for tailings management and disposition. Because our Indonesia mining operations are remotely located in steep mountainous terrain and in an active seismic area, a pipeline system would be costly, difficult to construct and maintain, and more prone to catastrophic failure, and could therefore involve significant potentially adverse environmental issues. Based on our own studies and others conducted by third parties, we do not believe that a pipeline system is necessary or practical.
In connection with obtaining our environmental approvals from the Indonesian government, we committed to perform a one-time environmental risk assessment on the impacts of our tailings management plan. We completed this extensive environmental risk assessment with more than 90 scientific studies conducted over four years and submitted it to the Indonesian government in December 2002. We developed the risk assessment study using internationally recognized methods with input from an independent review panel, which included representatives from the Indonesian government, academia and non-governmental organizations. The risks identified during this process were in line with our impact projections of the tailings management program contained in our environmental approval documents.
Since 2005, PT Freeport Indonesia has participated in the Indonesian government's PROPER (Program for Pollution Control, Evaluation and Rating) program. The last PROPER audit where the Indonesian Ministry of Environment issued PT Freeport Indonesia a rating was in 2010, for which a Blue rating was issued acknowledging PT Freeport Indonesia's environmental management practices as being in compliance with the laws and regulations in Indonesia. In 2011, a PROPER audit of PT Freeport Indonesia was performed, however the Indonesian Ministry of Environment did not issue a rating for PT Freeport Indonesia. A PROPER audit of PT Freeport Indonesia was not performed in 2012 because of security conditions that existed.
Mine closure regulations impose substantial costs on our operations.
Our U.S. operations are subject to various federal and state permitting requirements that include mine closure and mined-land reclamation obligations. These requirements are complex and vary depending upon the jurisdiction. The laws govern the determination of the scope and cost of the closure and reclamation obligations and the amount and forms of financial assurance sufficient to allow a third party to meet the obligations of those plans if we are unable to do so. In general, our U.S. mines are required to review estimated closure and reclamation costs on either a periodic basis or at the time of significant permit modifications and post increasing amounts of financial assurance as required. It is uncertain how potential EPA requirements for financial assurance will affect the timing of periodic closure cost reviews or the scope of closure activities.
In July 2011, the Chilean senate passed legislation regulating mine closure, which became effective November 2012 and established new requirements for closure plans. Our Chilean operations will be required to update closure plans and provide financial assurance for these obligations. Revised closure plans for our Chilean mine sites are due in November 2014.
Cerro Verde is subject to regulation under the Mine Closure Law administered by the Peruvian Ministry of Energy and Mines. Under the closure regulations, mines must submit a closure plan that includes the reclamation methods, closure cost estimates, methods of control and verification, closure and post-closure plans and financial assurance. The updated closure plan for the Cerro Verde mine expansion must be submitted to the Peruvian regulatory authorities in December 2013.
In December 2009, PT Freeport Indonesia submitted its revised mine closure plan to the Department of Energy and Minerals Resources for review and has addressed comments received during the course of this review process. In December 2010, the President of Indonesia issued a regulation regarding mine reclamation and closure, which requires a company to provide a mine closure guarantee in the form of a time deposit placed in a state-owned bank in Indonesia. In accordance with its COW, PT Freeport Indonesia is working with the Department of Energy and
55
Mineral Resources to review these requirements, including discussions of other options for the mine closure guarantee.
We cannot predict at this time the cost of these closure plans or the levels or forms of financial assurance that may be required, which amounts could be substantial.
At
December 31, 2012
, we had asset retirement obligations (AROs) of
$1.1 billion
recorded in our consolidated balance sheet. ARO cost estimates may increase or decrease significantly in the future as a result of changes in closure regulations, changes in engineering designs and technology, permit modifications or updates, changes in mine plans, inflation or other factors and as actual reclamation spending occurs. Refer to Note 13 for further discussion.
Regulation of greenhouse gas emissions and climate change issues may increase our costs and adversely affect our operations and markets.
Many scientists believe that emissions from the combustion of carbon-based fuels contribute to greenhouse effects and, therefore, contribute to climate change. In 2012, our worldwide total greenhouse gas emissions, measured as carbon dioxide equivalent emissions, were approximately 10 million metric tons, divided between direct (59 percent) and indirect (41 percent) emissions. Most of our direct emissions are from fuel combustion in haul trucks, followed by the combustion of fuels to provide energy for roasting, smelting and other processes. Indirect emissions are generally the emissions of outside providers from whom we purchase electricity for use in our operations. Our direct emissions are in Indonesia (54 percent), North America (28 percent), South America (11 percent), and Europe and Africa (7 percent). Our indirect emissions are in North America (73 percent), South America (24 percent) and Europe (3 percent).
A number of governments have introduced or are contemplating regulatory initiatives designed to control and reduce greenhouse gas emissions. In June 2010, the EPA issued final regulations under the Clean Air Act for the control of greenhouse gases from new large stationary sources and major modifications to existing large stationary sources. This and other federal greenhouse gas regulations have been challenged in judicial proceedings. Certain of our operations, including the Miami smelter, could be materially affected by these regulations if plant expansions exceed applicable thresholds. In addition, anticipated future EPA regulations covering large fossil fuel fired power plants may materially increase energy costs at our operations. The U.S. may also become a party to international agreements to reduce greenhouse gas emissions, which could lead to new regulations affecting our U.S. operations. The December 1997 Kyoto Protocol established greenhouse gas emission targets for developed countries that ratified the Protocol. In 2012, parties to the Kyoto Protocol agreed to a second commitment period beyond the original December 2012 expiration date. Although the U.S. has not ratified the Kyoto Protocol, the U.S. continues to participate in global climate summits that may lead to an agreement in the future.
Since 2006, we have participated in the Carbon Disclosure Project, which is a voluntary initiative that promotes standardized reporting of greenhouse gas emissions and reduction efforts. In 2009, we formed a multi-departmental greenhouse gas task force to pursue ways to improve the energy efficiency of our operations and reduce greenhouse gas emissions, including evaluating potential reductions in emissions from our haul trucks. However, because of longer and steeper mining hauls as our open pits expand and deepen, and increases in use of electricity as we increase production capacity, we expect increases in our total greenhouse gas emissions.
From a medium and long-term perspective, we are likely to experience increased costs relating to our greenhouse gas emissions as a result of regulatory initiatives in the U.S. and other countries in which we operate. In addition, the cost of electricity that we purchase from others may increase if our suppliers incur increased costs from the regulation of their greenhouse gas emissions. We cannot predict the magnitude of any increased costs at this time, given the wide scope of potential regulatory changes in the many countries in which we operate.
The potential physical impacts of climate change on our operations are highly uncertain, and would vary by operation based on particular geographic circumstances. These may include changes in rainfall patterns, water shortages, changing sea levels, changing storm patterns and intensities, and changing temperatures. These effects may adversely impact the cost, production and financial performance of our operations.
56
Other risks
If market prices for our commodities decline, the carrying values of inventories and long-lived assets may be impaired, which could require charges to operating income that could be material.
Declines in the market price of copper, among other factors, could cause us to record lower of cost or market (LCM) inventory adjustments and could also result in a write-down of the carrying value of long-lived assets, which would potentially have a material adverse impact on our results of operations and stockholders' equity, but would have no effect on cash flows.
During fourth-quarter 2008, we concluded that the then-current economic environment and significant declines in copper and molybdenum prices represented significant adverse changes in our business requiring us to evaluate our long-lived assets and goodwill for impairment. As a result, we recorded significant impairment and LCM inventory charges. Refer to Item 6. "Selected Financial Data" for a summary of these charges.
Unanticipated litigation or negative developments in pending litigation could have a material adverse effect on our results of operations and financial condition.
We are a party to the litigation described in Note 13 and in Item 3. “Legal Proceedings” and a number of other litigation matters, including asbestos exposure cases, disputes over the allocation of environmental remediation obligations at Superfund and other sites, disputes over water rights and disputes with regulatory authorities. The outcome of litigation is inherently uncertain and adverse developments or outcomes can result in significant monetary damages, penalties or injunctive relief against us, limitations on our property rights, or regulatory interpretations that increase our operating costs. If any of these disputes results in a substantial monetary judgment against us or an adverse legal interpretation is settled on unfavorable terms, or otherwise affects our operations, it could have a material adverse effect on our operating results and financial condition.
We depend on our senior management team and other key employees, and the loss of any of these employees could adversely affect our business.
Our success depends in part on our ability to attract, retain and motivate senior management and other key employees. Achieving this objective may be difficult because of many factors, including fluctuations in global economic and industry conditions, competitors' hiring practices, cost reduction activities, and the effectiveness of our compensation programs. Competition for qualified personnel can be very intense. We must continue to recruit, retain and motivate senior management and other key employees to maintain our current business and support our future projects. A loss of such personnel could prevent us from capitalizing on business opportunities, and our operating results could be adversely affected.
Our holding company structure may impact your ability to receive dividends
.
We are a holding company with no material assets other than the capital stock of our subsidiaries. As a result, our ability to repay our indebtedness and pay dividends is dependent on the generation of cash flow by our subsidiaries and their ability to make such cash available to us, by dividend, loan, debt repayment or otherwise. Our subsidiaries do not have any obligation to make funds available to us to repay our indebtedness or pay dividends. Dividends from subsidiaries that are not wholly owned are shared with other equity owners. Cash at our international operations is also subject to foreign withholding taxes upon repatriation into the U.S.
In addition, our subsidiaries may not be able to, or be permitted to, make distributions to enable us to repay our indebtedness or pay dividends. Each of our subsidiaries is a distinct legal entity and, under certain circumstances, legal and contractual restrictions, as well as the financial condition and operating requirements of our subsidiaries, may limit our ability to obtain cash from our subsidiaries. Our rights to participate in any distribution of our subsidiaries' assets upon their liquidation, reorganization or insolvency would generally be subject to the prior claims of the subsidiaries' creditors, including any trade creditors.
57
Anti-takeover provisions in our charter documents and Delaware law may make an acquisition of us more difficult.
Anti-takeover provisions in our charter documents and Delaware law may make an acquisition of us more difficult. These provisions:
|
•
|
Authorize our Board of Directors (the Board) to issue preferred stock without stockholder approval and to designate the rights, preferences and privileges of each class; if issued, such preferred stock would increase the number of outstanding shares of our capital stock and could include terms that may deter an acquisition of us;
|
|
•
|
Establish advance notice requirements for nominations to the Board or for proposals that can be presented at stockholder meetings;
|
|
•
|
Limit removal of directors for cause only;
|
|
•
|
Limit who may call stockholder meetings; and
|
|
•
|
Require the approval of the holders of two thirds of our outstanding common stock to enter into certain business combination transactions, subject to certain exceptions, including if the consideration to be received by our common stockholders in the transaction is deemed to be a fair price.
|
These provisions may discourage potential takeover attempts, discourage bids for our common stock at a premium over market price or adversely affect the market price of, and the voting and other rights of the holders of, our common stock. These provisions could also discourage proxy contests and make it more difficult for stockholders to elect directors other than the candidates nominated by the Board.
In addition, because we are incorporated in Delaware, we are governed by the provisions of Section 203 of the Delaware General Corporation Law, which may prohibit large stockholders from consummating a merger with, or acquisition of, us.
These provisions may deter an acquisition of us that might otherwise be attractive to stockholders.
Risks associated with the proposed acquisitions of Plains Exploration & Production Company (PXP) and McMoRan Exploration Co. (MMR)
Our proposed acquisitions of PXP and MMR may present certain risks to our business and operations.
On December 5, 2012, we announced definitive merger agreements to acquire PXP and MMR. The proposed acquisitions present numerous risks, including the following:
|
•
|
The possibility that the expected benefits of each transaction may not materialize in the timeframe expected or at all, or may be more costly to achieve than anticipated;
|
|
•
|
That either or both of the transactions may not be timely completed, or completed at all;
|
|
•
|
Our ability to obtain financing required in connection with the transactions, and the increase in our indebtedness that would result from entering into such financing;
|
|
•
|
That prior to the completion of the transactions or thereafter, our business or the respective businesses of PXP and MMR may not perform as expected due to transaction-related uncertainty or other factors;
|
|
•
|
That the parties are unable to successfully implement integration strategies following closing of the transactions;
|
|
•
|
That required approvals to consummate the mergers, including the required approvals of the stockholders of each of PXP and MMR, are not obtained or other closing conditions are not satisfied in a timely manner or at all;
|
58
|
•
|
Stockholder reaction to the proposed acquisitions;
|
|
•
|
Risks associated with the ownership and operation of oil and gas assets and the other assets of each of PXP and MMR, which differ from those in the mining industry and include, among others, risks relating to oil and gas exploration, drilling and development (including ultra deep drilling) and operating in the deep water of the Gulf of Mexico;
|
|
•
|
Our ability to retain key employees of each of the parties; and
|
|
•
|
Whether or not one or both of the transactions are completed, the proposed acquisitions may require diversion of the attention of our management and other key employees from ongoing business activities, including the pursuit of other opportunities that could be beneficial to us.
|
In addition, we have incurred substantial costs in connection with the proposed acquisitions, a significant amount of which are required to be paid whether or not the transactions are completed. One or more of these factors could negatively affect our business, financial condition or results of operations.
Refer to Note
1
for further discussion of the proposed acquisitions of PXP and MMR.
Pending litigation against us, PXP and MMR could result in injunctions preventing completion of either or both of the proposed acquisitions and the payment of damages in the event one or both of the transactions is completed.
In connection with the proposed acquisitions, stockholders of each of FCX, PXP and MMR have filed numerous derivative lawsuits against us and class action lawsuits against us, PXP and MMR, among others. Among other remedies, the plaintiffs in these lawsuits seek to enjoin the proposed acquisitions. We may be subject to additional stockholder lawsuits during the pendency of the proposed acquisitions. These lawsuits could prevent or delay completion of one or both of the proposed acquisitions and result in substantial costs to us, including any costs associated with the indemnification of directors. The defense or settlement of any lawsuit or claim that remains unresolved may adversely affect our business, financial condition or results of operations.
Refer to Note
13
for further discussion of shareholder litigation that could have a material adverse effect on our results of operations and financial condition.
Consummating the PXP merger, but failing to complete the MMR merger could have consequences under the Clayton Antitrust Act (the Clayton Act) and negatively affect the combined company's future business and financial results.
If the PXP merger is completed, but the MMR merger is not completed, then the boards of directors and executive management of FCX and MMR may need to be reconstituted in order to comply with the Clayton Act. Subject to certain de minimis exceptions, Section 8 of the Clayton Act prohibits individuals from serving as directors or officers of two competing corporations when each corporation has capital, surplus and undivided profits in excess of $27.8 million. Currently, FCX and MMR share overlapping board and management members, an overlap that is expected to continue even after the PXP merger is consummated, unless the MMR merger is also consummated. In the event that the PXP merger closes without the MMR merger also closing, the U.S. Department of Justice or Federal Trade Commission could investigate whether the combined company and MMR are competitors for purposes of the Clayton Act, and could seek to eliminate the interlock by securing resignation of the interlocked individuals or by pursuing injunctive relief. Private plaintiffs could also bring suits against the combined company seeking an injunction against the interlock. The potential distraction from operations, loss of key executive talent and cost of litigation could adversely affect the combined company's business, financial condition or result of operations.
Not applicable.
59
We are involved in numerous legal proceedings that arise in the ordinary course of our business or are associated with environmental issues arising from legacy operations conducted over the years by Freeport-McMoRan Corporation (FMC) and its affiliates. We are also involved periodically in inquiries, investigations and other proceedings initiated by or involving government agencies, some of which may result in adverse judgments, settlements, fines, penalties, injunctions or other relief. Management does not believe, based on currently available information, that the outcome of any legal proceeding will have a material adverse effect on our financial condition; although individual outcomes could be material to our operating results for a particular period, depending on the nature and magnitude of the outcome and the operating results for the period. Below is a discussion of our material water rights legal proceedings. Refer to Note 13 for discussion of our other material legal proceedings.
Water Rights
Our operations in the western United States (U.S.) require significant quantities of water for mining, ore processing and related support facilities. Continuous operation of our mines is dependent on our ability to maintain our water rights and claims and the continuing physical availability of the water supplies. In the arid western U.S., water rights are often contested, and disputes over water rights are generally time-consuming, expensive and not necessarily dispositive unless they resolve both actual and potential claims. The loss of a water right, loss of continued use of a currently available water supply, or inability to expand our water resources could materially and adversely affect our mining operations by significantly increasing the cost of water, forcing us to curtail operations, preventing us from expanding operations or forcing premature closures, thereby increasing and/or accelerating costs and foregoing profitable operations.
At our North America operations, certain of our water supplies are supported by surface water rights, which give us the right to use public waters for a statutorily defined beneficial use at a designated location. In Arizona, we are a participant in two active general stream adjudications in which, for over 30 years, the Arizona courts have been attempting to quantify and prioritize surface water claims for two of the state's largest river systems, which affect four of our operating mines (Morenci, Safford, Sierrita and Miami). The legal precedent set in these proceedings may also affect our Bagdad mine. Groundwater has historically been treated differently from surface water under Arizona law, which has generally allowed land owners to pump at will, subject to the doctrine of reasonable use. However, court decisions in one of the adjudications have concluded that groundwater pumping may affect surface water, thereby bringing the pumping within the jurisdiction of the general stream adjudications. The effort to define the boundaries between groundwater and surface water remains contested, however, and is currently the principal focus of one of those adjudications. Because groundwater accounts for approximately 40 percent of Arizona's water supplies, the re-characterization of any significant portion of that water as surface water could jeopardize the ability of consumers, farmers, ranchers, municipalities, and industrial users like us, to continue to access water supplies that have been relied on for decades. Because we are a significant user of groundwater in Arizona, we are an active participant in the adjudication proceedings.
In Re the General Adjudication of All Rights to Use Water in the Little Colorado Water System and Sources
, Apache County, Superior Court, No. 6417, filed on or about February 17, 1978. The principal parties, in addition to us, include: the state of Arizona; the Salt River Project; the Arizona Public Service Company; the Navajo Nation, the Hopi Indian Tribe; the San Juan Southern Paiute Tribe; and the U.S. on behalf of those tribes, on its own behalf, and on behalf of the White Mountain Apache Tribe.
In Re The General Adjudication of All Rights to Use Water in the Gila River System and Sources
,
Maricopa County, Superior Court, Cause Nos. W-1 (Salt), W-2 (Verde), W-3 (Upper Gila), and W-4 (San Pedro). This case was originally initiated in 1974 with the filing of a petition with the Arizona State Land Department and was consolidated and transferred to the Maricopa County Superior Court in 1981. The principal parties, in addition to us, include: the state of Arizona; the Gila Valley Irrigation District; the Franklin Irrigation District; the San Carlos Irrigation and Drainage District; the Salt River Project; the San Carlos Apache Tribe; the Gila River Indian Community (GRIC); and the U.S. on behalf of those tribes, on its own behalf, and on behalf of the White Mountain Apache Tribe, the Fort McDowell Mohave-Apache Indian Community, the Salt River Pima-Maricopa Indian Community, and the Payson Community of Yavapai Apache Indians.
60
The Maricopa County Superior Court issued a decision in 2005 in the Gila River adjudication that directed the Arizona Department of Water Resources (ADWR) to prepare detailed recommendations regarding the delineation of the “sub-flow” zone of the San Pedro River basin, a tributary of the Gila River. According to the court, the sub-flow zone is the subsurface area adjacent to the river where the court may find that groundwater is connected to the surface water such that groundwater pumping may reduce surface flows. Although we have minimal interests in the San Pedro River basin, a decision that re-characterizes groundwater in that basin as surface water may set a precedent for other river systems in Arizona that could have material implications for many commercial, industrial, municipal and agricultural users of groundwater, including our Arizona operations.
ADWR produced its recommendations in June 2009, and those recommendations were objected to by numerous parties on both sides of the issue. ADWR responded to those objections in January 2011. Following a three-day hearing held in late January 2012, at which various parties provided testimony and oral argument regarding the strengths and weaknesses of ADWR's technical approach to characterizing underground flows as groundwater or surface water, the court directed ADWR to submit a further report detailing the additional work it deemed necessary to properly delineate the San Pedro River basin subflow zone. On October 12, 2012, the court issued an order instructing ADWR to conduct additional technical work and issue revised subflow zone maps for the San Pedro River basin. On October 17, 2012, the Arizona Supreme Court announced the appointment of a replacement for the judge who had presided over the case for more than 10 years as a result of his appointment to the federal bankruptcy court. The new presiding judge is the fourth judge to preside over the case since its inception almost 40 years ago. On January 10, 2013, the new presiding judge heard oral arguments regarding the additional work to be performed by ADWR in order to develop revised subflow zone maps for the San Pedro River basin and issued an order instructing ADWR to complete additional technical work and submit a new report by April 1, 2014. Given the legal and technical complexity of this adjudication, its long history, and its long-term legal, economic and political implications, it is difficult to predict the timing or the outcome of this issue or of the overall adjudication. If we are unable to satisfactorily resolve the issues being addressed in this adjudication, our ability to pump groundwater could be diminished or curtailed, and our operations at Morenci, Safford, Sierrita, Miami and Bagdad could be adversely affected.
Prior to January 1, 1983, various Indian tribes filed suits in the U.S. District Court in Arizona claiming superior rights to water being used by many other water users, including us, and claiming damages for prior use in derogation of their allegedly superior rights. These federal proceedings have been stayed pending the Arizona Superior Court adjudications.
In 1998, we and several other parties entered into a water rights settlement agreement with GRIC, one of the largest claimants in the Gila River Adjudication, that was later included in a comprehensive water rights settlement under the Arizona Water Settlements Act of 2004. Finalization of the GRIC settlement is subject to contingencies, and the comprehensive settlement has been challenged by other parties. If we are unable to resolve the contingencies in the GRIC settlement and defeat the third-party challenges, our water rights in the Gila River watershed could be diminished, and our operations at Morenci, Safford, Sierrita and Miami could be adversely affected.
United States v. Gila Valley Irrigation District
, United States District Court, District of Arizona, was initiated in 1925 by the U.S. to settle conflicting claims to water rights in portions of the Gila River watershed. A decree settling the claims of various parties was entered in 1935, after we were dismissed from the case without prejudice. In 1988, GRIC intervened, challenging uses of water in the Gila River watershed, which may affect our ability to divert water from Eagle Creek, Chase Creek or the San Francisco River for operation of our Morenci mine, pursuant to decreed rights and an agreement between us and the Gila Valley Irrigation District. Our Morenci operations also purchased farm lands with water rights in 1997, 1998 and 2008 that could be affected by the outcome of this proceeding. Impairment of our water claims in the Gila River watershed could adversely affect the operations of our Morenci and Safford mines.
The safety and health of all employees is our highest priority. Management believes that safety and health considerations are integral to, and compatible with, all other functions in the organization and that proper safety and health management will enhance production and reduce costs. Our approach towards the health and safety of our workforce is to continuously improve performance through implementing robust management systems and providing adequate training, safety incentive and occupational health programs.
61
Our objective is zero work place injuries and occupational illnesses. We measure progress toward achieving our objective against regularly established benchmarks, including measuring company-wide Total Recordable Incident Rates (TRIR). During 2012, our TRIR (including contractors) was 0.58 per 200,000 man-hours worked, compared to the preliminary metal mining sector industry average reported by the U.S. Mine Safety and Health Administration (MSHA) for 2012 of 2.25 per 200,000 man-hours worked. Our TRIR (including contractors) was 0.61 per 200,000 man-hours worked in
2011
and 0.65 per 200,000 man-hours worked in
2010
, compared to MSHA’s metal mining sector industry average of 2.29 per 200,000 man-hours worked in
2011
and 2.53 per 200,000 man-hours worked in
2010
.
Refer to Exhibit 95.1 for mine safety disclosures required in accordance with Section 1503(a) of the Dodd-Frank Wall Street Reform and Consumer Protection Act.
Executive Officers of the Registrant.
Certain information as of
February 15, 2013
, about our executive officers is set forth in the following table and accompanying text:
|
Name
|
Age
|
Position or Office
|
||
|
James R. Moffett
|
74
|
Chairman of the Board
|
||
|
Richard C. Adkerson
|
66
|
Director, President and Chief Executive Officer
|
||
|
Michael J. Arnold
|
60
|
Executive Vice President and Chief Administrative Officer
|
||
|
Kathleen L. Quirk
|
49
|
Executive Vice President, Chief Financial Officer and Treasurer
|
||
James R. Moffett
has served as Chairman of the Board since May 1992. Mr. Moffett previously served as the Chief Executive Officer from July 1995 until December 2003. He has also served as Co-Chairman of the Board of McMoRan Exploration Co. (MMR) since September 1998, and President and Chief Executive Officer since May 2010.
Richard C. Adkerson
has served as President since January 2008 and also from April 1997 to March 2007, Chief Executive Officer since December 2003 and a director since October 2006. Mr. Adkerson previously served as Chief Financial Officer from October 2000 to December 2003. Mr. Adkerson has also served as Co-Chairman of the Board of MMR since September 1998.
Michael J. Arnold
has served as Executive Vice President since March 2007 and
Chief Administrative Officer since December 2003.
Kathleen L. Quirk
has served as Executive Vice President since March 2007, Chief Financial Officer since December 2003 and Treasurer since February 2000. Ms. Quirk previously served as Senior Vice President from December 2003 to March 2007. Ms. Quirk has also served as the Senior Vice President of MMR since April 2002 and as Treasurer since January 2000.
62
Unregistered Sales of Equity Securities
None.
Common Stock
Our common shares trade on the New York Stock Exchange (NYSE) under the symbol “FCX.” The FCX share price is reported daily in the financial press under “FMCG” in most listings of NYSE securities. The table below shows the NYSE composite tape common share price ranges during
2012
and
2011
:
|
|
2012
|
2011
|
||||||
|
|
High
|
Low
|
High
|
Low
|
||||
|
First Quarter
|
$48.96
|
$36.76
|
$61.35
|
$46.20
|
||||
|
Second Quarter
|
$39.43
|
$31.16
|
$58.75
|
$46.06
|
||||
|
Third Quarter
|
$43.65
|
$31.08
|
$56.78
|
$30.37
|
||||
|
Fourth Quarter
|
$42.89
|
$30.54
|
$43.50
|
$28.85
|
||||
At
February 15, 2013
, there were 15,844 holders of record of our common stock.
Common Stock Dividends
The declaration of dividends is at the discretion of the FCX Board of Directors (the Board) and will depend on our financial results, cash requirements, future prospects and other factors deemed relevant by the Board. In February 2012, the Board authorized an increase in the cash dividend on our common stock to the current annual rate of $1.25 per share ($0.3125 per share quarterly). The Board also authorized a supplemental common stock dividend that was paid in June 2011. Below is a summary of dividends on FCX common stock for
2012
and
2011
:
|
|
2012
|
|||||
|
|
Per Share
Amount
|
Record Date
|
Payment Date
|
|||
|
First Quarter
|
$0.25
|
01/13/2012
|
02/01/2012
|
|||
|
Second Quarter
|
$0.3125
|
04/13/2012
|
05/01/2012
|
|||
|
Third Quarter
|
$0.3125
|
07/13/2012
|
08/01/2012
|
|||
|
Fourth Quarter
|
$0.3125
|
10/15/2012
|
11/01/2012
|
|||
|
|
2011
|
|||||
|
|
Per Share
Amount
|
Record Date
|
Payment Date
|
|||
|
First Quarter
|
$0.25
|
01/15/2011
|
02/01/2011
|
|||
|
Second Quarter
|
$0.25
|
04/15/2011
|
05/01/2011
|
|||
|
Supplemental Dividend
|
$0.50
|
05/15/2011
|
06/01/2011
|
|||
|
Third Quarter
|
$0.25
|
07/15/2011
|
08/01/2011
|
|||
|
Fourth Quarter
|
$0.25
|
10/15/2011
|
11/01/2011
|
|||
On December 26, 2012, the Board declared a regular quarterly dividend of $0.3125 per share, which was paid on February 1, 2013, to common stockholders of record at the close of business on January 15, 2013.
63
Issuer Purchases of Equity Securities
The following table sets forth information with respect to shares of FCX common stock purchased by us during the three months ended December 31, 2012:
|
Period
|
(a) Total
Number of
Shares Purchased
|
(b) Average
Price Paid Per Share
|
(c) Total Number of
Shares Purchased as Part of Publicly Announced Plans or Programs
a
|
(d) Maximum Number of Shares That May
Yet Be Purchased Under the Plans or Programs
a
|
|||||||||
|
October 1-31, 2012
|
—
|
|
|
$
|
—
|
|
—
|
|
23,685,500
|
|
|||
|
November 1-30, 2012
|
—
|
|
—
|
|
—
|
|
23,685,500
|
|
|||||
|
December 1-31, 2012
|
—
|
|
|
—
|
|
—
|
|
23,685,500
|
|
||||
|
Total
|
—
|
|
|
—
|
|
—
|
|
23,685,500
|
|
||||
|
a.
|
On July 21, 2008, the Board approved an increase in our open-market share purchase program for up to 30 million shares. The program does not have an expiration date.
|
64
FREEPORT-McMoRan COPPER & GOLD INC.
SELECTED FINANCIAL AND OPERATING DATA
|
|
Years Ended December 31,
|
|
||||||||||||||||||
|
|
2012
|
|
2011
|
|
2010
|
|
2009
|
2008
|
||||||||||||
|
FCX CONSOLIDATED FINANCIAL DATA
|
(In millions, except per share amounts)
|
|
||||||||||||||||||
|
Revenues
|
$
|
18,010
|
|
|
$
|
20,880
|
|
|
$
|
18,982
|
|
|
$
|
15,040
|
|
|
$
|
17,796
|
|
|
|
Operating income (loss)
|
5,814
|
|
a,b
|
9,140
|
|
b
|
9,068
|
|
6,503
|
|
c,d
|
(12,710
|
)
|
c,d,e
|
||||||
|
Net income (loss)
|
3,980
|
|
5,747
|
|
5,544
|
|
3,534
|
|
(10,450
|
)
|
|
|||||||||
|
Net income (loss) attributable to FCX common stockholders
|
3,041
|
|
a,b,f,g
|
4,560
|
|
b,f,g
|
4,273
|
|
f
|
2,527
|
|
c,d,f
|
(11,341
|
)
|
c,d,e,f
|
|||||
|
Basic net income (loss) per share attributable to FCX common stockholders
|
$
|
3.20
|
|
|
$
|
4.81
|
|
|
$
|
4.67
|
|
|
$
|
3.05
|
|
$
|
(14.86
|
)
|
|
|
|
Basic weighted-average common shares outstanding
|
949
|
|
|
947
|
|
|
915
|
|
|
829
|
|
|
763
|
|
|
|||||
|
Diluted net income (loss) per share attributable to FCX common stockholders
|
$
|
3.19
|
|
a,b,f,g
|
$
|
4.78
|
|
b,f,g
|
$
|
4.57
|
|
f
|
$
|
2.93
|
|
c,d,f
|
$
|
(14.86
|
)
|
c,d,e,f
|
|
Diluted weighted-average common shares outstanding
|
954
|
|
|
955
|
|
|
949
|
|
|
938
|
|
|
763
|
|
|
|||||
|
Dividends declared per share of common stock
|
$
|
1.25
|
|
|
$
|
1.50
|
|
|
$
|
1.125
|
|
|
$
|
0.075
|
|
|
$
|
0.6875
|
|
|
|
Operating cash flows
h
|
3,774
|
|
6,620
|
|
6,273
|
|
4,397
|
|
3,370
|
|
||||||||||
|
Capital expenditures
|
3,494
|
|
2,534
|
|
1,412
|
|
1,587
|
|
2,708
|
|
||||||||||
|
At December 31:
|
|
|
|
|
|
|
|
|
|
|
||||||||||
|
Cash and cash equivalents
|
$
|
3,705
|
|
|
$
|
4,822
|
|
|
$
|
3,738
|
|
|
$
|
2,656
|
|
|
$
|
872
|
|
|
|
Property, plant, equipment and development costs, net
|
20,999
|
|
|
18,449
|
|
|
16,785
|
|
|
16,195
|
|
|
16,002
|
|
|
|||||
|
Total assets
|
35,440
|
|
|
32,070
|
|
|
29,386
|
|
|
25,996
|
|
|
23,353
|
|
|
|||||
|
Total debt, including current portion
|
3,527
|
|
|
3,537
|
|
|
4,755
|
|
|
6,346
|
|
|
7,351
|
|
|
|||||
|
Total FCX stockholders’ equity
|
17,543
|
|
|
15,642
|
|
|
12,504
|
|
|
9,119
|
|
|
5,773
|
|
|
|||||
The selected consolidated financial data shown above is derived from our audited consolidated financial statements. These historical results are not necessarily indicative of results that you can expect for any future period. You should read this data in conjunction with Management’s Discussion and Analysis of Financial Condition and Results of Operations and our Consolidated Financial Statements and Notes thereto contained in this annual report.
|
a.
|
Includes a gain of
$59 million
(
$31 million
to net income attributable to common stockholders or
$0.03
per share) for the settlement of the insurance claim for business interruption and property damage relating to the 2011 incidents affecting PT Freeport Indonesia's concentrate pipelines.
|
|
b.
|
Includes charges totaling
$16 million
(
$8 million
to net income attributable to common stockholders or
$0.01
per share) associated with labor agreement costs at Candelaria in
2012
and
$116 million
(
$50 million
to net income attributable to common stockholders or
$0.05
per share) primarily associated with bonuses for new labor agreements and other employee costs at PT Freeport Indonesia, Cerro Verde and El Abra in
2011
.
|
|
c.
|
Includes charges totaling $23 million ($18 million to net income attributable to common stockholders or $0.02 per share) associated with restructuring charges in 2009 and $17.0 billion ($12.7 billion to net loss attributable to common stockholders or $16.60 per share) associated with impairment and restructuring charges in 2008.
|
|
d.
|
Includes charges for lower of cost or market inventory adjustments totaling $19 million ($15 million to net income attributable to common stockholders or $0.02 per share) in 2009 and $782 million ($479 million to net loss attributable to common stockholders or $0.63 per share) in 2008.
|
|
e.
|
Includes purchase accounting impacts related to the acquisition of FMC totaling $1.0 billion ($622 million to net loss attributable to common stockholders or $0.82 per share).
|
|
f.
|
Includes net losses on early extinguishment and conversion of debt totaling
$149 million
(
$0.16
per share) in
2012
,
$60 million
(
$0.06
per share) in 2011,
$71 million
(
$0.07
per share) in 2010,
$43 million
(
$0.04
per share) in 2009 and
$5 million
(
$0.01
per share) in 2008; 2008 also includes charges totaling $22 million ($0.03 per share) associated with privately negotiated transactions to induce conversion of a portion of our 5½% Convertible Perpetual Preferred Stock into FCX common stock.
|
|
g.
|
Includes a net tax credit of
$98 million
, net of noncontrolling interests (
$0.11
per share), associated with adjustments to Cerro Verde's deferred income taxes in 2012, and a tax charge of
$49 million
, net of noncontrolling interests (
$0.05
per share), for additional taxes associated with Cerro Verde's election to pay a special mining burden during the remaining term of its current stability agreement in 2011.
|
|
h.
|
Net of working capital uses and other tax payments totaling
$1.4 billion
in
2012
,
$461 million
in
2011
,
$834 million
in 2010, $770 million in 2009 and $965 million in 2008.
|
65
FREEPORT-McMoRan COPPER & GOLD INC.
SELECTED FINANCIAL AND OPERATING DATA (Continued)
|
|
Years Ended December 31,
|
|
||||||||||||||||||
|
|
2012
|
2011
|
2010
|
2009
|
2008
|
|||||||||||||||
|
FCX CONSOLIDATED MINING OPERATING DATA
|
|
|||||||||||||||||||
|
Copper (recoverable)
|
|
|
|
|
|
|
|
|||||||||||||
|
Production (millions of pounds)
|
3,663
|
|
3,691
|
|
3,908
|
|
4,103
|
|
4,030
|
|
|
|||||||||
|
Production (thousands of metric tons)
|
1,662
|
|
1,674
|
|
1,773
|
|
1,861
|
|
|
1,828
|
|
|
||||||||
|
Sales, excluding purchases (millions of pounds)
|
3,648
|
|
3,698
|
|
3,896
|
|
4,111
|
|
4,066
|
|
|
|||||||||
|
Sales, excluding purchases (thousands of metric tons)
|
1,655
|
|
1,678
|
|
1,767
|
|
1,865
|
|
1,844
|
|
|
|||||||||
|
Average realized price per pound
|
$
|
3.60
|
|
$
|
3.86
|
|
$
|
3.59
|
|
$
|
2.60
|
|
$
|
2.69
|
|
|||||
|
Gold (thousands of recoverable ounces)
|
|
|
|
|
|
|
|
|||||||||||||
|
Production
|
958
|
|
1,383
|
|
1,886
|
|
2,664
|
|
1,291
|
|
||||||||||
|
Sales, excluding purchases
|
1,010
|
|
1,378
|
|
1,863
|
|
2,639
|
|
1,314
|
|
||||||||||
|
Average realized price per ounce
|
$
|
1,665
|
|
$
|
1,583
|
|
$
|
1,271
|
|
$
|
993
|
|
$
|
861
|
|
|||||
|
Molybdenum (millions of recoverable pounds)
|
|
|
|
|
|
|
|
|||||||||||||
|
Production
|
85
|
|
83
|
|
72
|
|
54
|
|
73
|
|
||||||||||
|
Sales, excluding purchases
|
83
|
|
79
|
|
67
|
|
58
|
|
71
|
|
||||||||||
|
Average realized price per pound
|
$
|
14.26
|
|
$
|
16.98
|
|
$
|
16.47
|
|
$
|
12.36
|
|
$
|
30.55
|
|
|||||
|
NORTH AMERICA COPPER MINES
|
||||||||||||||||||||
|
Operating Data, Net of Joint Venture Interest
|
|
|
|
|
|
|
|
|||||||||||||
|
Copper (recoverable)
|
|
|
|
|
|
|
|
|||||||||||||
|
Production (millions of pounds)
|
1,363
|
|
1,258
|
|
1,067
|
|
1,147
|
|
1,430
|
|
||||||||||
|
Production (thousands of metric tons)
|
618
|
|
571
|
|
484
|
|
520
|
|
|
649
|
|
|
||||||||
|
Sales, excluding purchases (millions of pounds)
|
1,351
|
|
1,247
|
|
1,085
|
|
1,187
|
|
1,434
|
|
||||||||||
|
Sales, excluding purchases (thousands of metric tons)
|
613
|
|
566
|
|
492
|
|
538
|
|
650
|
|
||||||||||
|
Average realized price per pound
|
$
|
3.64
|
|
$
|
3.99
|
|
$
|
3.42
|
|
$
|
2.38
|
|
$
|
3.07
|
|
|||||
|
Molybdenum (millions of recoverable pounds)
|
|
|
|
|
|
|
|
|||||||||||||
|
Production
|
36
|
|
35
|
|
25
|
|
25
|
|
30
|
|
|
|||||||||
|
100% Operating Data
|
|
|
|
|
|
|
|
|||||||||||||
|
Solution extraction/electrowinning (SX/EW) operations
|
|
|
|
|
|
|
|
|||||||||||||
|
Leach ore placed in stockpiles (metric tons per day)
|
998,600
|
|
888,300
|
|
648,800
|
|
589,400
|
|
1,095,200
|
|
|
|||||||||
|
Average copper ore grade (percent)
|
0.22
|
|
0.24
|
|
0.24
|
|
0.29
|
|
0.22
|
|
|
|||||||||
|
Copper production (millions of recoverable pounds)
|
866
|
|
801
|
|
746
|
|
859
|
|
943
|
|
|
|||||||||
|
Mill operations
|
|
|
|
|
|
|
|
|||||||||||||
|
Ore milled (metric tons per day)
|
239,600
|
|
222,800
|
|
189,200
|
|
169,900
|
|
249,600
|
|
|
|||||||||
|
Average ore grade (percent):
|
|
|
|
|
|
|
|
|||||||||||||
|
Copper
|
0.37
|
|
0.38
|
|
0.32
|
|
0.33
|
|
0.40
|
|
|
|||||||||
|
Molybdenum
|
0.03
|
|
0.03
|
|
0.03
|
|
0.02
|
|
0.02
|
|
|
|||||||||
|
Copper recovery rate (percent)
|
83.9
|
|
83.1
|
|
83.0
|
|
86.0
|
|
82.9
|
|
|
|||||||||
|
Copper production (millions of recoverable pounds)
|
592
|
|
549
|
|
398
|
|
364
|
|
599
|
|
|
|||||||||
|
SOUTH AMERICA MINING
|
|
|||||||||||||||||||
|
Copper (recoverable)
|
|
|
|
|
|
|
|
|||||||||||||
|
Production (millions of pounds)
|
1,257
|
|
1,306
|
|
1,354
|
|
1,390
|
|
1,506
|
|
|
|||||||||
|
Production (thousands of metric tons)
|
570
|
|
592
|
|
614
|
|
631
|
|
|
683
|
|
|
||||||||
|
Sales (millions of pounds)
|
1,245
|
|
1,322
|
|
1,335
|
|
1,394
|
|
1,521
|
|
|
|||||||||
|
Sales (thousands of metric tons)
|
565
|
|
600
|
|
606
|
|
632
|
|
690
|
|
|
|||||||||
|
Average realized price per pound
|
$
|
3.58
|
|
$
|
3.77
|
|
$
|
3.68
|
|
$
|
2.70
|
|
|
$
|
2.57
|
|
|
|||
|
Gold (thousands of recoverable ounces)
|
|
|
|
|
|
|
|
|||||||||||||
|
Production
|
83
|
|
101
|
|
93
|
|
92
|
|
114
|
|
|
|||||||||
|
Sales
|
82
|
|
101
|
|
93
|
|
90
|
|
116
|
|
|
|||||||||
|
Average realized price per ounce
|
$
|
1,673
|
|
$
|
1,580
|
|
$
|
1,263
|
|
$
|
982
|
|
|
$
|
853
|
|
|
|||
|
Molybdenum (millions of recoverable pounds)
|
|
|
|
|
|
|
|
|||||||||||||
|
Production
|
8
|
|
10
|
|
7
|
|
2
|
|
3
|
|
|
|||||||||
|
SX/EW operations
|
|
|
|
|
|
|
|
|||||||||||||
|
Leach ore placed in stockpiles (metric tons per day)
|
229,300
|
|
245,200
|
|
268,800
|
|
258,200
|
|
279,700
|
|
|
|||||||||
|
Average copper ore grade (percent)
|
0.55
|
|
0.50
|
|
0.41
|
|
0.45
|
|
0.45
|
|
|
|||||||||
|
Copper production (millions of recoverable pounds)
|
457
|
|
439
|
|
504
|
|
565
|
|
560
|
|
|
|||||||||
|
Mill operations
|
|
|
|
|
|
|
||||||||||||||
|
Ore milled (metric tons per day)
|
191,400
|
|
189,200
|
|
188,800
|
|
181,300
|
|
181,400
|
|
||||||||||
|
Average ore grade:
|
|
|
|
|
|
|
||||||||||||||
|
Copper (percent)
|
0.60
|
|
0.66
|
|
0.65
|
|
0.66
|
|
0.75
|
|
||||||||||
|
Gold (grams per metric ton)
|
0.10
|
|
0.12
|
|
0.10
|
|
0.10
|
|
0.13
|
|
||||||||||
|
Molybdenum (percent)
|
0.02
|
|
0.02
|
|
0.02
|
|
0.02
|
|
0.02
|
|
||||||||||
|
Copper recovery rate (percent)
|
90.1
|
|
89.6
|
|
90.0
|
|
88.9
|
|
89.2
|
|
||||||||||
|
Copper production (millions of recoverable pounds)
|
800
|
|
867
|
|
850
|
|
825
|
|
946
|
|
||||||||||
66
FREEPORT-McMoRan COPPER & GOLD INC.
SELECTED FINANCIAL AND OPERATING DATA (Continued)
|
|
Years Ended December 31,
|
|
||||||||||||||||||
|
|
2012
|
2011
|
|
2010
|
2009
|
2008
|
||||||||||||||
|
INDONESIA MINING
|
||||||||||||||||||||
|
Operating Data, Net of Joint Venture Interest
|
|
|
|
|
|
|
||||||||||||||
|
Copper (recoverable)
|
|
|
|
|
|
|
||||||||||||||
|
Production (millions of pounds)
|
695
|
|
846
|
|
1,222
|
|
1,412
|
|
1,094
|
|
||||||||||
|
Production (thousands of metric tons)
|
315
|
|
384
|
|
554
|
|
640
|
|
496
|
|
||||||||||
|
Sales (millions of pounds)
|
716
|
|
846
|
|
1,214
|
|
1,400
|
|
1,111
|
|
||||||||||
|
Sales (thousands of metric tons)
|
325
|
|
384
|
|
551
|
|
635
|
|
504
|
|
||||||||||
|
Average realized price per pound
|
$
|
3.58
|
|
$
|
3.85
|
|
|
$
|
3.69
|
|
$
|
2.65
|
|
$
|
2.36
|
|
||||
|
Gold (thousands of recoverable ounces)
|
|
|
|
|
|
|
||||||||||||||
|
Production
|
862
|
|
1,272
|
|
1,786
|
|
2,568
|
|
1,163
|
|
||||||||||
|
Sales
|
915
|
|
1,270
|
|
1,765
|
|
2,543
|
|
1,182
|
|
||||||||||
|
Average realized price per ounce
|
$
|
1,664
|
|
$
|
1,583
|
|
$
|
1,271
|
|
$
|
994
|
|
$
|
861
|
|
|||||
|
100% Operating Data
|
|
|
|
|
|
|
||||||||||||||
|
Ore milled (metric tons per day):
a
|
||||||||||||||||||||
|
Grasberg open pit
|
118,800
|
|
112,900
|
|
149,800
|
|
166,300
|
|
129,800
|
|
||||||||||
|
Deep Ore Zone underground mine
|
44,600
|
|
51,700
|
|
79,600
|
|
72,000
|
|
63,100
|
|
||||||||||
|
Big Gossan underground mine
|
1,600
|
|
1,500
|
|
800
|
|
—
|
|
—
|
|
||||||||||
|
Total
|
165,000
|
|
166,100
|
|
230,200
|
|
238,300
|
|
192,900
|
|
||||||||||
|
Average ore grade:
|
|
|
|
|
|
|
||||||||||||||
|
Copper (percent)
|
0.62
|
|
0.79
|
|
0.85
|
|
0.98
|
|
0.83
|
|
||||||||||
|
Gold (grams per metric ton)
|
0.59
|
|
0.93
|
|
0.90
|
|
1.30
|
|
0.66
|
|
||||||||||
|
Recovery rates (percent):
|
|
|
|
|
|
|
||||||||||||||
|
Copper
|
88.7
|
|
88.3
|
|
88.9
|
|
90.6
|
|
90.1
|
|
||||||||||
|
Gold
|
75.7
|
|
81.2
|
|
81.7
|
|
83.7
|
|
79.9
|
|
||||||||||
|
Production (recoverable):
|
|
|
|
|
|
|
||||||||||||||
|
Copper (millions of pounds)
|
695
|
|
882
|
|
1,330
|
|
1,641
|
|
1,109
|
|
||||||||||
|
Gold (thousands of ounces)
|
862
|
|
1,444
|
|
1,964
|
|
2,984
|
|
1,163
|
|
||||||||||
|
AFRICA MINING
|
||||||||||||||||||||
|
Copper (recoverable)
|
|
|
|
|
|
|
||||||||||||||
|
Production (millions of pounds)
|
348
|
|
281
|
|
265
|
|
154
|
|
b
|
—
|
|
|||||||||
|
Production (thousands of metric tons)
|
158
|
|
127
|
|
120
|
|
70
|
|
b
|
—
|
|
|||||||||
|
Sales (millions of pounds)
|
336
|
|
283
|
|
262
|
|
130
|
|
b
|
—
|
|
|||||||||
|
Sales (thousands of metric tons)
|
152
|
|
128
|
|
119
|
|
59
|
|
b
|
—
|
|
|||||||||
|
Average realized price per pound
|
$
|
3.51
|
|
$
|
3.74
|
|
$
|
3.45
|
|
$
|
2.85
|
|
b
|
—
|
|
|||||
|
Cobalt (millions of contained pounds)
|
|
|
|
|
|
|||||||||||||||
|
Production
|
26
|
|
25
|
|
20
|
|
—
|
|
—
|
|
||||||||||
|
Sales
|
25
|
|
25
|
|
20
|
|
—
|
|
—
|
|
||||||||||
|
Average realized price per pound
|
$
|
7.83
|
|
$
|
9.99
|
|
$
|
10.95
|
|
—
|
|
—
|
|
|||||||
|
Ore milled (metric tons per day)
|
13,000
|
|
11,100
|
|
10,300
|
|
7,300
|
|
b
|
—
|
|
|||||||||
|
Average ore grade (percent):
|
|
|
|
|
|
|||||||||||||||
|
Copper
|
3.62
|
|
3.41
|
|
3.51
|
|
3.69
|
|
b
|
—
|
|
|||||||||
|
Cobalt
|
0.37
|
|
0.40
|
|
0.40
|
|
—
|
|
—
|
|
||||||||||
|
Copper recovery rate (percent)
|
92.4
|
|
92.5
|
|
91.4
|
|
92.1
|
|
b
|
—
|
|
|||||||||
|
MOLYBDENUM OPERATIONS
|
||||||||||||||||||||
|
Molybdenum (millions of recoverable pounds)
|
||||||||||||||||||||
|
Production
|
41
|
|
c
|
38
|
|
40
|
|
27
|
|
40
|
|
|||||||||
|
Sales, excluding purchases
d
|
83
|
|
79
|
|
67
|
|
58
|
|
71
|
|
||||||||||
|
Average realized price per pound
|
$
|
14.26
|
|
$
|
16.98
|
|
$
|
16.47
|
|
$
|
12.36
|
|
$
|
30.55
|
|
|||||
|
Henderson molybdenum mine
|
|
|
|
|
|
|
||||||||||||||
|
Ore milled (metric tons per day)
|
20,800
|
|
22,300
|
|
22,900
|
|
14,900
|
|
24,100
|
|
||||||||||
|
Average molybdenum ore grade (percent)
|
0.23
|
|
0.24
|
|
0.25
|
|
0.25
|
|
0.23
|
|
||||||||||
|
Molybdenum production (millions of recoverable pounds)
|
34
|
|
38
|
|
40
|
|
27
|
|
40
|
|
||||||||||
|
a.
|
Amounts represent the approximate average daily throughput processed at PT Freeport Indonesia’s mill facilities from each producing mine.
|
|
b.
|
Results for 2009 represent mining operations that began production in March 2009.
|
|
c.
|
Includes production of
7 million
pounds from the Climax molybdenum mine, which began commercial operations in May 2012.
|
|
d.
|
Includes sales of molybdenum produced at our North and South America copper mines.
|
67
Ratio of Earnings to Fixed Charges
For the ratio of earnings to fixed charges calculation, earnings consist of income (loss) from continuing operations before income taxes, noncontrolling interests in consolidated subsidiaries, equity in affiliated companies’ net earnings, cumulative effect of accounting changes and fixed charges. Fixed charges include interest and that portion of rent deemed representative of interest. For the ratio of earnings to fixed charges and preferred stock dividends calculation, we assumed that our preferred stock dividend requirements were equal to the pre-tax earnings that would be required to cover those dividend requirements. We computed those pre-tax earnings using the effective tax rate for each year. Our ratio of earnings to fixed charges was as follows for the years presented:
|
|
Years Ended December 31,
|
||||||||
|
|
2012
|
2011
|
|
2010
|
2009
|
2008
|
|||
|
Ratio of earnings to fixed charges
|
19.8x
|
20.7x
|
16.3x
|
9.3x
|
-
a
|
||||
|
Ratio of earnings to fixed charges
|
|
|
|
|
|
||||
|
and preferred stock dividends
|
19.8x
|
20.7x
|
13.9x
|
6.1x
|
-
b
|
||||
|
a.
|
As a result of the loss recorded in 2008, the ratio coverage was less than 1:1. We would have needed to generate additional earnings of $13.4 billion to achieve coverage of 1:1 in 2008.
|
|
b.
|
As a result of the loss recorded in 2008, the ratio coverage was less than 1:1. We would have needed to generate additional earnings of $13.8 billion to achieve coverage of 1:1 in 2008.
|
68
Items 7. and 7A. Management's Discussion and Analysis of Financial Condition and Results of Operations and Quantitative and Qualitative Disclosures About Market Risk.
In Management’s Discussion and Analysis of Financial Condition and Results of Operations and Quantitative and Qualitative Disclosures About Market Risk, “we,” “us” and “our” refer to Freeport-McMoRan Copper & Gold Inc. (FCX) and its consolidated subsidiaries. The results of operations reported and summarized below are not necessarily indicative of future operating results (refer to “Cautionary Statement” for further discussion). References to “Notes” are Notes included in our Notes to Consolidated Financial Statements. Throughout Management's Discussion and Analysis of Financial Condition and Results of Operations and Quantitative and Qualitative Disclosures About Market Risk, all references to earnings or losses per share are on a diluted basis, unless otherwise noted.
PROPOSED ACQUISTIONS
In December 2012, we announced definitive agreements to acquire, in separate transactions, Plains Exploration & Production Company (PXP) and McMoRan Exploration Co. (MMR). Completion of each transaction is subject to receipt of PXP and MMR stockholder approval of their respective transaction, regulatory approvals (including United States (U.S.) antitrust clearance under the Hart-Scott-Rodino Act) and other customary conditions. On December 26, 2012, the U.S. Federal Trade Commission granted early termination of the Hart-Scott-Rodino waiting period with respect to both transactions. The PXP transaction is not conditioned on the closing of the MMR transaction, and the MMR transaction is not conditioned on the closing of the PXP transaction. PXP and MMR shareholder meetings to approve the respective transactions will be scheduled upon the effectiveness of the respective registration statements filed with the U.S. Securities and Exchange Commission. The transactions are expected to close in second-quarter 2013, subject to satisfaction of all conditions to closing.
Additionally in January 2013, FCX, through a newly formed joint venture, entered into a definitive agreement to acquire a cobalt chemical refinery in Kokkola, Finland, and the related sales and marketing business. The acquisition is subject to customary closing conditions, including regulatory approvals, and is expected to close in second-quarter 2013.
The information contained in Management's Discussion and Analysis of Financial Condition and Results of Operations and Quantitative and Qualitative Disclosures about Market Risk does not reflect our acquisitions of PXP, MMR or the cobalt chemical business. Refer to Notes
1
and
20
for further discussion of these proposed acquisitions.
OVERVIEW
We are one of the world’s largest copper, gold and molybdenum mining companies in terms of reserves and production. Our portfolio of assets includes the Grasberg minerals district in Indonesia, significant mining operations in North and South America, and the Tenke Fungurume (Tenke) minerals district in the Democratic Republic of Congo (DRC). The Grasberg minerals district contains one of the largest copper and gold reserves in the world based on the latest available reserve data provided by third-party industry consultants. We also operate Atlantic Copper, our wholly owned copper smelting and refining unit in Spain.
We have significant reserves, resources and future development opportunities within our portfolio of assets. At
December 31, 2012
, our estimated consolidated recoverable proven and probable reserves totaled
116.5 billion
pounds of copper,
32.5 million
ounces of gold and
3.42 billion
pounds of molybdenum, which were determined using long-term average prices of
$2.00
per pound for copper,
$750
per ounce for gold and
$10
per pound for molybdenum. Refer to “Critical Accounting Estimates – Mineral Reserves” for further discussion.
69
A summary of our consolidated copper, gold and molybdenum production for the year
2012
by geographic location follows:
|
Copper
|
Gold
|
Molybdenum
|
|||||||
|
North America
|
37
|
%
|
1
|
%
|
91
|
%
|
a
|
||
|
South America
|
34
|
%
|
9
|
%
|
9
|
%
|
|||
|
Indonesia
|
19
|
%
|
90
|
%
|
N/A
|
|
|||
|
Africa
|
10
|
%
|
N/A
|
|
N/A
|
|
|||
|
a.
|
For
2012
,
53 percent
of our consolidated molybdenum production in North America was from the Henderson and Climax primary molybdenum mines. The Climax molybdenum mine began commercial production in May 2012.
|
Copper production from the Grasberg, Morenci and Cerro Verde mines totaled
50 percent
of our consolidated copper production in
2012
. Refer to “Operations” for further discussion of our mining operations.
We are progressing on major development projects, including the development of the underground ore bodies at Grasberg, and the expansion projects at Morenci and Cerro Verde. Studies are also under way to evaluate a major mill project at El Abra and various mill projects to process significant sulfide ore in North America. The advancement of these studies is designed to position us to invest in production growth within our existing portfolio of assets. Refer to “Operations” for further discussion of our current operating and development activities.
At
December 31, 2012
, we had
$3.7 billion
in consolidated cash and
$3.5 billion
in long-term debt. In February 2012, we sold $3.0 billion in senior notes in three tranches with a weighted average interest rate of approximately three percent. We used the proceeds from this offering, plus cash on hand, to redeem the remaining $3.0 billion of our 8.375% Senior Notes. Refer to "Capital Resources and Liquidity - Financing Activities" and to Note
9
for further discussion of these transactions.
In February 2013, we entered into a new senior unsecured revolving credit facility, which will refinance and replace our existing revolving credit facility upon completion of the proposed acquisition of PXP. No amounts are currently available to us under the new revolving credit facility. Refer to Note 20 for further discussion.
In February 2012, our Board of Directors (the Board) authorized an increase in the cash dividend on our common stock to an annual rate of $1.25 per share ($0.3125 per share quarterly), and we paid dividends on our common stock totaling
$1.1 billion
in 2012. Refer to Note
11
for further discussion.
At current copper prices, we expect to produce significant operating cash flows, and to use our cash to invest in our development projects and return cash to shareholders through dividends on our common stock.
Refer to “Consolidated Results” for discussion of items impacting our consolidated results for the years ended
December 31, 2012
,
2011
and
2010
.
OUTLOOK
We view the long-term outlook for our business positively, supported by limitations on supplies of copper and by the requirements for copper in the world’s economy. We will continue to adjust our operating strategy as market conditions change. Our financial results vary as a result of fluctuations in market prices for copper, gold and molybdenum and other factors. World market prices for these commodities have fluctuated historically and are affected by numerous factors beyond our control. Because we cannot control the price of our products, the key measures that management focuses on in operating our business are sales volumes, unit net cash costs and operating cash flow. Discussion of the outlook for each of these measures follows.
70
Sales Volumes.
Following are our projected consolidated sales volumes for
2013
and actual consolidated sales volumes for
2012
:
|
2013
|
2012
|
|||||
|
(Projected)
|
(Actual)
|
|||||
|
Copper
(millions of recoverable pounds):
|
|
|
|
|||
|
North America copper mines
|
1,445
|
|
|
1,351
|
|
|
|
South America mining
|
1,325
|
|
|
1,245
|
|
|
|
Indonesia mining
|
1,120
|
|
|
716
|
|
|
|
Africa mining
|
410
|
|
|
336
|
|
|
|
|
4,300
|
|
3,648
|
|
||
|
Gold
(thousands of recoverable ounces):
|
|
|
|
|||
|
Indonesia mining
|
1,240
|
|
|
915
|
|
|
|
North and South America mining
|
140
|
|
95
|
|
||
|
|
1,380
|
|
|
1,010
|
|
|
|
Molybdenum
(millions of recoverable pounds)
|
90
|
|
a
|
83
|
|
|
|
a.
|
Includes projected sales of
40 million
pounds of molybdenum produced at our North and South America copper mines.
|
Projected copper sales for
2013
are expected to be higher than
2012
sales, primarily reflecting access to higher grade ore in Indonesia and South America and higher production in North America and Africa. Projected
2013
gold sales volumes are expected to be higher than
2012
, primarily reflecting higher ore grades at Grasberg. Molybdenum sales in
2013
are expected to be higher than
2012
, primarily reflecting higher production from our Climax molybdenum mine. Projected sales volumes are dependent on a number of factors, including achievement of targeted mining rates, the successful operation of production facilities, the impact of weather conditions and other factors.
Unit Net Cash Costs.
We expect to gain access to higher grade ore at Grasberg in late
2013
, which will result in higher copper and gold production volumes (approximately 29 percent of
2013
consolidated copper sales volumes and 37 percent of consolidated gold sales volumes are expected in fourth-quarter
2013
). Quarterly unit net cash costs vary with fluctuations in sales volumes and average realized prices for gold and molybdenum, and are expected to be lower in late 2013 as we gain access to higher grade ore at Grasberg. Assuming average prices of
$1,700
per ounce of gold and
$11
per pound of molybdenum and achievement of current
2013
sales volume and cost estimates, consolidated unit net cash costs (net of by-product credits) are expected to average
$1.35
per pound in
2013
. The impact of price changes in
2013
on consolidated unit net cash costs would approximate
$0.015
per pound for each
$50
per ounce change in the average price of gold and
$0.015
per pound for each
$2
per pound change in the average price of molybdenum. Refer to “Consolidated Results – Production and Delivery Costs” for further discussion of consolidated production and delivery costs.
Operating Cash Flows.
Our operating cash flows vary with prices realized from copper, gold and molybdenum sales, our sales volumes, production costs, income taxes and other working capital changes and other factors. Based on current sales volumes and cost estimates and assuming average prices of
$3.65
per pound of copper,
$1,700
per ounce of gold and
$11
per pound of molybdenum in
2013
, consolidated operating cash flows, excluding results of pending acquisitions, are estimated to approximate
$7 billion
in
2013
(including an estimated
$450 million
from net working capital sources and other tax payments). Projected operating cash flows for the year
2013
also reflect estimated taxes of $2.6 billion (refer to “Consolidated Results – Provision for Income Taxes” for discussion of our projected annual consolidated effective tax rate for
2013
). The impact of price changes in
2013
on operating cash flows would approximate
$350 million
for each
$0.10
per pound change in the average price of copper,
$55 million
for each
$50
per ounce change in the average price of gold and
$110 million
for each
$2
per pound change in the average price of molybdenum.
71
COPPER, GOLD AND MOLYBDENUM MARKETS
World prices for copper, gold and molybdenum can fluctuate significantly. During the period from January 2003 through January 2013, the London Metal Exchange (LME) spot copper price varied from a low of
$0.70
per pound in 2003 to a record high of
$4.60
per pound in February 2011; the London Bullion Market Association (London) gold price fluctuated from a low of
$320
per ounce in 2003 to a record high of
$1,895
per ounce in September 2011; and the
Metals Week
Molybdenum Dealer Oxide weekly average price ranged from a low of
$3.28
per pound in 2003 to a high of
$39.25
per pound in 2005. Copper, gold and molybdenum prices are affected by numerous factors beyond our control as described further in our “Risk Factors” contained in Part I, Item 1A of our Form 10-K for the year ended
December 31, 2012
.
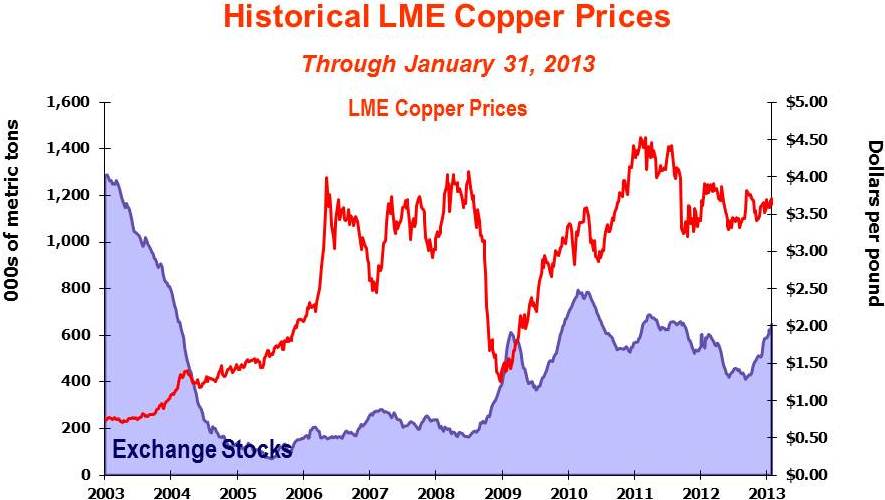
This graph presents LME spot copper prices and combined reported stocks of copper at the LME, the New York Mercantile Exchange (COMEX) and the Shanghai Futures Exchange from January 2003 through January 2013. From 2006 through most of 2008, limited supplies, combined with growing demand from China and other emerging economies, resulted in high copper prices and low levels of inventories. In late 2008, slowing consumption, turmoil in the U.S. financial markets and concerns about the global economy led to a sharp decline in copper prices, which reached a low of $1.26 per pound in December 2008. Higher copper prices since that time are attributable to a combination of continuing demand from developing economies and pro-growth monetary and fiscal policy decisions in Europe, China and the U.S. During
2012
, LME spot copper prices ranged from
$3.29
per pound to
$3.93
per pound, averaged
$3.61
per pound and closed at
$3.59
per pound on
December 31, 2012
. Global exchange inventories increased during the second half of 2012, but remain low and represent less than two weeks of global demand.
We believe the underlying long-term fundamentals of the copper business remain positive, supported by the significant role of copper in the global economy and a challenging supply environment. Future copper prices are expected to be volatile and are likely to be influenced by demand from China and emerging markets, economic activity in the U.S. and other industrialized countries, the timing of the development of new supplies of copper and production levels of mines and copper smelters. The LME spot copper price closed at
$3.72
per pound on
February 15, 2013
.
72
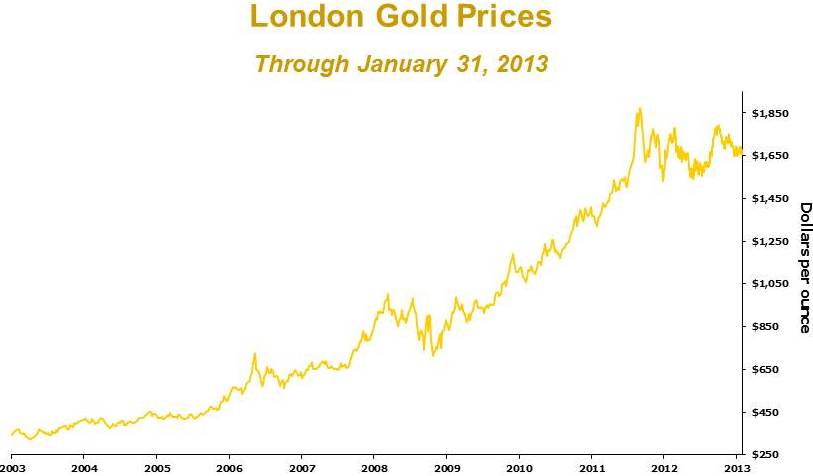
This graph presents London PM gold prices from January 2003 through January 2013. During
2012
, gold prices ranged from
$1,540
per ounce to
$1,792
per ounce, averaging
$1,669
per ounce and closing at
$1,658
per ounce on
December 31, 2012
. We believe the outlook for gold remains positive amid an uncertain outlook for global growth and the prospects for future inflation associated with accommodative monetary policies and elevated sovereign debt levels. Gold prices closed at
$1,612
per ounce on
February 15, 2013
.
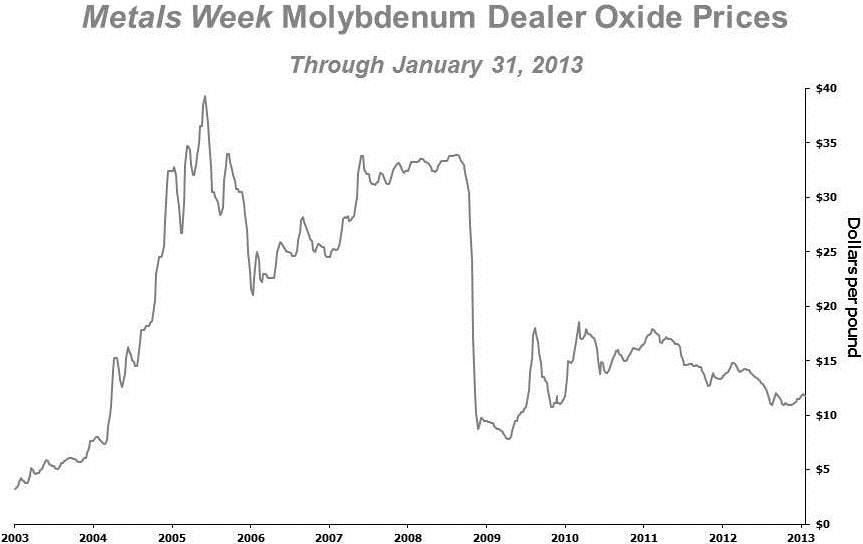
This graph presents the
Metals Week
Molybdenum Dealer Oxide weekly average price from January 2003 through January 2013. In late 2008, molybdenum prices declined significantly as a result of the financial market turmoil and a decline in demand. During
2012
, the weekly average price of molybdenum ranged from
$10.90
per pound to
$14.80
per pound, averaged
$12.74
per pound and was
$11.60
per pound on
December 31, 2012
. Average
Metals Week
Molybdenum Dealer Oxide prices were lower in
2012
, compared with
2011
, reflecting weaker demand and cautious buying activity. The
Metals Week
Molybdenum Dealer Oxide weekly average price was
$11.27
per pound on
February 15, 2013
.
73
CRITICAL ACCOUNTING ESTIMATES
Management’s Discussion and Analysis of Financial Condition and Results of Operations is based on our consolidated financial statements, which have been prepared in conformity with generally accepted accounting principles (GAAP) in the U.S. The preparation of these statements requires that we make estimates and assumptions that affect the reported amounts of assets, liabilities, revenues and expenses. We base these estimates on historical experience and on assumptions that we consider reasonable under the circumstances; however, reported results could differ from those based on the current estimates under different assumptions or conditions. The areas requiring the use of management’s estimates are also discussed in Note
1
under the subheading “Use of Estimates.” Management has reviewed the following discussion of its development and selection of critical accounting estimates with the Audit Committee of our Board.
Mineral Reserves
.
Recoverable proven and probable reserves are the part of a mineral deposit that can be economically and legally extracted or produced at the time of the reserve determination. The determination of reserves involves numerous uncertainties with respect to the ultimate geology of the ore bodies, including quantities, grades and recovery rates. Estimating the quantity and grade of reserves requires us to determine the size, shape and depth of our ore bodies by analyzing geological data, such as samplings of drill holes, tunnels and other underground workings. In addition to the geology of our mines, assumptions are required to determine the economic feasibility of mining these reserves, including estimates of future commodity prices and demand, the mining methods we use and the related costs incurred to develop and mine our reserves. Our estimates of recoverable proven and probable reserves are prepared by and are the responsibility of our employees. A majority of these estimates are reviewed annually and verified by independent experts in mining, geology and reserve determination.
At
December 31, 2012
, our consolidated recoverable proven and probable reserves included
116.5 billion
pounds of copper,
32.5 million
ounces of gold and
3.42 billion
pounds of molybdenum, which were determined using long-
term average prices of
$2.00
per pound for copper,
$750
per ounce for gold and
$10.00
per pound for molybdenum, consistent with the prices used at year-end 2011 and 2010. The following table summarizes changes in our estimated consolidated recoverable proven and probable copper, gold and molybdenum reserves during
2012
and
2011
:
|
Copper
(billion
pounds)
|
Gold
(million
ounces)
|
Molybdenum
(billion
pounds)
|
|||||
|
Consolidated reserves at December 31, 2010
|
120.5
|
|
35.5
|
3.39
|
|||
|
Net additions/revisions
|
2.9
|
|
(0.2)
|
0.11
|
|||
|
Production
|
(3.7
|
)
|
(1.4)
|
(0.08)
|
|||
|
Consolidated reserves at December 31, 2011
|
119.7
|
|
33.9
|
3.42
|
|||
|
Net additions/revisions
|
0.5
|
|
(0.4)
|
0.08
|
|||
|
Production
|
(3.7
|
)
|
(1.0)
|
(0.08)
|
|||
|
Consolidated reserves at December 31, 2012
|
116.5
|
|
32.5
|
3.42
|
|||
Refer to Note
18
for further information regarding estimated recoverable proven and probable reserves.
As discussed in Note
1
, we depreciate our life-of-mine mining and milling assets and values assigned to proven and probable reserves using the unit-of-production (UOP) method based on our estimated recoverable proven and probable reserves, and also have other assets that are depreciated on a straight-line basis over their estimated useful lives. Because the economic assumptions used to estimate reserves change from period to period and additional geological data is generated during the course of operations, estimates of reserves may change, which could have a significant impact on our results of operations, including changes to prospective depreciation rates and asset carrying values. Excluding impacts associated with changes in the levels of finished goods inventories and based on projected copper sales volumes for
2013
, if estimated copper reserves at our mines were 10 percent higher at
December 31, 2012
, we estimate that our annual depreciation, depletion and amortization expense for
2013
would decrease by $49 million ($25 million to net income attributable to common stockholders), and a 10 percent decrease in copper reserves would increase depreciation, depletion and amortization expense by $60 million ($32 million to net income attributable to common stockholders). We perform annual assessments of our existing assets in connection with the review of mine operating and development plans. If it is determined that
74
assigned asset lives do not reflect the expected remaining period of benefit, any change could affect prospective depreciation rates.
As discussed below and in Note
1
, we review and evaluate our long-lived assets for impairment when events or changes in circumstances indicate that the related carrying amount of such assets may not be recoverable, and changes to our estimates of recoverable proven and probable reserves could have an impact on our assessment of asset recoverability.
Recoverable Copper in Stockpiles
.
We record, as inventory, applicable costs for copper contained in mill and leach stockpiles that are expected to be processed in the future based on proven processing technologies. Mill and leach stockpiles are evaluated periodically to ensure that they are stated at the lower of cost or market. Accounting for recoverable copper from mill and leach stockpiles represents a critical accounting estimate because (i) it is impracticable to determine copper contained in mill and leach stockpiles by physical count, thus requiring management to employ reasonable estimation methods and (ii) recovery rates from leach stockpiles can vary significantly. The quantity of material delivered to mill and leach stockpiles is based on surveyed volumes of mined material and daily production records. Sampling and assaying of blasthole cuttings determine the estimated copper grade contained in the material delivered to the mill and leach stockpiles.
Expected copper recovery rates for mill stockpiles are determined by metallurgical testing. The recoverable copper in mill stockpiles, once entered into the production process, can be produced into copper concentrate almost immediately.
Expected copper recovery rates for leach stockpiles are determined using small-scale laboratory tests, small- to large-scale column testing (which simulates the production-scale process), historical trends and other factors,
including mineralogy of the ore and rock type. Ultimate recovery of copper contained in leach stockpiles can vary significantly from a low percentage to more than
90 percent
depending on several variables, including type of copper recovery, mineralogy and particle size of the rock. For newly placed material on active stockpiles, as much as
70 percent
of the copper ultimately recoverable may be extracted during the first year, and the remaining copper may be recovered over many years.
Processes and recovery rates are monitored regularly, and recovery rate estimates are adjusted periodically as additional information becomes available and as related technology changes. Adjustments to recovery rates will typically result in a future impact to the value of the material removed from the stockpiles at a revised weighted-average cost per pound of recoverable copper. During third-quarter 2012, we completed an assessment of estimated future recovery rates within the current mine plan at our Chino leaching operations resulting in a downward revision of those rates and a corresponding reduction of 594 million pounds of estimated recoverable copper in leach stockpiles at Chino. At
December 31, 2012
, estimated consolidated recoverable copper was
2.9 billion
pounds in leach stockpiles (with a carrying value of
$2.9 billion
) and
1.4 billion
pounds in mill stockpiles (with a carrying value of
$719 million
).
Environmental Obligations
.
Our mining, exploration, production and historical operating activities are subject to stringent laws and regulations governing the protection of the environment, and compliance with those laws requires significant expenditures. Environmental expenditures are expensed or capitalized, depending upon their future economic benefits. The guidance provided by U.S. GAAP requires that liabilities for contingencies be recorded when it is probable that obligations have been incurred and the cost can be reasonably estimated. Refer to Note
1
for discussion of our accounting policy for environmental expenditures.
Accounting for environmental obligations represents a critical accounting estimate because changes to environmental laws and regulations and/or circumstances affecting our operations could result in significant changes to our estimates, which could have a significant impact on our results of operations. We perform a comprehensive annual review of our environmental obligations and also review changes in facts and circumstances associated with these obligations at least quarterly. Judgments and estimates are based upon available facts, existing technology, presently enacted laws and regulations, remediation experience, whether or not we are a potentially responsible party (PRP), the ability of other PRPs to pay their allocated portions and take into consideration reasonably possible outcomes. Our cost estimates can change substantially as additional information becomes available regarding the nature or extent of site contamination, updated cost assumptions (including increases and decreases to cost estimates), changes in the anticipated scope and timing of remediation activities, the settlement of environmental matters, required remediation methods and actions by or against governmental agencies or private parties.
75
At
December 31, 2012
, environmental obligations recorded in our consolidated balance sheet totaled
$1.2 billion
, which reflect obligations for environmental liabilities attributed to the Comprehensive Environmental Response, Compensation, and Liability Act (CERCLA) or analogous state programs and for estimated future costs associated with environmental matters.
Following is a summary of changes in our estimated environmental obligations for the years ended December 31 (in millions):
|
|
2012
|
2011
|
2010
|
||||||||
|
Balance at beginning of year
|
$
|
1,453
|
|
$
|
1,422
|
|
$
|
1,464
|
|
||
|
Accretion expense
a
|
80
|
|
88
|
|
97
|
|
|||||
|
Additions
|
70
|
|
132
|
|
19
|
|
|||||
|
Reductions
b
|
(182
|
)
|
(68
|
)
|
—
|
|
|||||
|
Spending
|
(199
|
)
|
(121
|
)
|
(158
|
)
|
|||||
|
Balance at end of year
|
$
|
1,222
|
|
$
|
1,453
|
|
$
|
1,422
|
|
||
|
a.
|
Represents accretion of the fair value of environmental obligations assumed in the acquisition of Freeport-McMoRan Corporation (FMC), which were determined on a discounted cash flow basis.
|
|
b.
|
Reductions primarily reflected adjustments for changes in the anticipated scope and timing of environmental remediation projects and the settlement of environmental matters.
|
Refer to Note
13
for further discussion of environmental obligations.
Reclamation and Closure Costs
.
Reclamation is an ongoing activity that occurs throughout the life of a mine. We record the fair value of our estimated asset retirement obligations (AROs) associated with tangible long-lived assets in the period incurred. Fair value is measured as the present value of cash flow estimates after considering inflation and then applying a market risk premium. Our cost estimates are reflected on a third-party cost basis and comply with our legal obligation to retire tangible long-lived assets in the period incurred. These cost estimates may differ from financial assurance cost estimates for reclamation activities because of a variety of factors, including obtaining updated cost estimates for reclamation activities, the timing of reclamation activities, changes in scope and the exclusion of certain costs not considered reclamation and closure costs. Refer to Note
1
for further discussion of our accounting policy for reclamation and closure costs.
Generally, ARO activities are specified by regulations or in permits issued by the relevant governing authority, and management judgment is required to estimate the extent and timing of expenditures based on life-of-mine planning. Accounting for reclamation and closure costs represents a critical accounting estimate because (i) we will not incur most of these costs for a number of years, requiring us to make estimates over a long period, (ii) reclamation and closure laws and regulations could change in the future and/or circumstances affecting our operations could change, either of which could result in significant changes to our current plans, (iii) calculating the fair value of our AROs requires management to estimate projected cash flows, make long-term assumptions about inflation rates, determine our credit-adjusted, risk-free interest rates and determine market risk premiums that are appropriate for our operations and (iv) given the magnitude of our estimated reclamation and closure costs, changes in any or all of these estimates could have a significant impact on our results of operations.
At least annually, we review our ARO estimates for changes in the projected timing of certain reclamation costs, changes in cost estimates and additional AROs incurred during the period. Following is a summary of changes in our AROs for the years ended December 31 (in millions):
|
|
2012
|
2011
|
2010
|
|||||||||
|
Balance at beginning of year
|
$
|
921
|
|
$
|
856
|
|
$
|
731
|
|
|||
|
Liabilities incurred
|
6
|
|
9
|
|
5
|
|
||||||
|
Revisions to cash flow estimates
a
|
211
|
|
48
|
|
105
|
|
||||||
|
Accretion expense
|
55
|
|
58
|
|
54
|
|
||||||
|
Spending
|
(47
|
)
|
(49
|
)
|
(38
|
)
|
||||||
|
Foreign currency translation adjustment
|
—
|
|
(1
|
)
|
(1
|
)
|
||||||
|
Balance at end of year
|
$
|
1,146
|
|
$
|
921
|
|
$
|
856
|
|
|||
|
a.
|
Revisions to cash flow estimates are primarily related to updated closure plans that included revised cost estimates and accelerated timing of certain closure activities.
|
76
Refer to Note
13
for further discussion of reclamation and closure costs.
Deferred Taxes
.
In preparing our annual consolidated financial statements, we estimate the actual amount of taxes currently payable or receivable as well as deferred tax assets and liabilities attributable to temporary differences between the financial statement carrying amounts of existing assets and liabilities and their respective tax bases. Deferred income tax assets and liabilities are measured using enacted tax rates expected to apply to taxable income in the years in which these temporary differences are expected to be recovered or settled. The effect on deferred tax assets and liabilities of a change in tax rates or laws is recognized in income in the period in which such changes are enacted.
A valuation allowance is provided for those deferred tax assets for which it is more likely than not that the related benefits will not be realized. In determining the amount of the valuation allowance, we consider estimated future taxable income as well as feasible tax planning strategies in each jurisdiction. If we determine that we will not realize all or a portion of our deferred tax assets, we will increase our valuation allowance. Conversely, if we determine that we will ultimately be able to realize all or a portion of the related benefits for which a valuation allowance has been provided, all or a portion of the related valuation allowance will be reduced.
Our valuation allowances totaled
$2.4 billion
at
December 31, 2012
and
2011
, and covered all of our U.S. foreign tax credit carryforwards, and a portion of our foreign net operating loss carryforwards, U.S. state net operating loss carryforwards, U.S. state deferred tax assets, U.S. capital loss carryforwards and U.S. minimum tax credit carryforwards. These valuation allowances include
$82 million
at
December 31, 2012
, and
$80 million
at
December 31, 2011
, for tax benefits that, if recognized, would be credited directly to other comprehensive income.
Refer to Note
12
for further discussion.
Impairment of Assets.
We evaluate our long-lived assets (to be held and used) for impairment when events or changes in circumstances indicate that the related carrying amount of such assets may not be recoverable. In evaluating our long-lived assets for recoverability, estimates of after-tax undiscounted future cash flows of our individual mining operations are used, with impairment losses measured by reference to fair value. As quoted market prices are unavailable for our individual mining operations, fair value is determined through the use of discounted estimated future cash flows. The estimated cash flows used to assess recoverability of our long-lived assets and measure fair value of our mining operations are derived from current business plans, which are developed using near-term price forecasts reflective of the current price environment and management's projections for long-term average metal prices. In addition to near and long-term metal price assumptions, other key assumptions include commodity-based and other input costs; proven and probable reserves, including the timing and cost to develop and produce the reserves; and the use of appropriate escalation and discount rates.
Because the cash flows used to assess recoverability of our long-lived assets and measure fair value of our mining operations require us to make several estimates and assumptions that are subject to risk and uncertainty, changes in these estimates and assumptions could result in the impairment of our long-lived asset values. Events that could result in impairment of our long-lived assets include, but are not limited to, decreases in future metal prices, decreases in estimated recoverable proven and probable reserves and any event that might otherwise have a material adverse effect on mine site production levels or costs.
Refer to Note
4
for further discussion.
77
CONSOLIDATED RESULTS
|
|
Years Ended December 31,
|
|
||||||||||
|
|
2012
|
|
2011
|
|
2010
|
|
||||||
|
Financial Data
(in millions, except per share amounts)
|
|
|
|
|
|
|
||||||
|
Revenues
a,b
|
$
|
18,010
|
|
|
$
|
20,880
|
|
|
$
|
18,982
|
|
|
|
Operating income
a
|
5,814
|
|
c,d,e
|
9,140
|
|
c,e
|
9,068
|
|
c
|
|||
|
Net income attributable to FCX common stockholders
f
|
3,041
|
|
c,d,e,g,h
|
4,560
|
|
c,e,g,h
|
4,273
|
|
c,g
|
|||
|
Diluted net income per share attributable to FCX
|
|
|
|
|
|
|
||||||
|
common stockholders
f
|
$
|
3.19
|
|
c,d,e,g,h
|
$
|
4.78
|
|
c,e,g,h
|
$
|
4.57
|
|
c,g
|
|
Diluted weighted-average common shares outstanding
|
954
|
|
|
955
|
|
|
949
|
|
|
|||
|
Mining Operating Data
|
|
|
|
|
|
|
||||||
|
Copper
(recoverable)
|
|
|
|
|
|
|
||||||
|
Production (millions of pounds)
|
3,663
|
|
3,691
|
|
3,908
|
|
|
|||||
|
Sales, excluding purchases (millions of pounds)
|
3,648
|
|
3,698
|
|
3,896
|
|
|
|||||
|
Average realized price per pound
|
$
|
3.60
|
|
$
|
3.86
|
|
$
|
3.59
|
|
|
||
|
Site production and delivery costs per pound
i
|
$
|
2.00
|
|
$
|
1.72
|
|
$
|
1.40
|
|
|
||
|
Unit net cash costs per pound
i
|
$
|
1.48
|
|
$
|
1.01
|
|
$
|
0.79
|
|
|
||
|
Gold
(recoverable)
|
|
|
|
|
|
|
||||||
|
Production (thousands of ounces)
|
958
|
|
1,383
|
|
1,886
|
|
|
|||||
|
Sales, excluding purchases (thousands of ounces)
|
1,010
|
|
1,378
|
|
1,863
|
|
|
|||||
|
Average realized price per ounce
|
$
|
1,665
|
|
$
|
1,583
|
|
$
|
1,271
|
|
|
||
|
Molybdenum
(recoverable)
|
|
|
|
|
|
|
||||||
|
Production (millions of pounds)
|
85
|
|
83
|
|
72
|
|
|
|||||
|
Sales, excluding purchases (millions of pounds)
|
83
|
|
79
|
|
67
|
|
|
|||||
|
Average realized price per pound
|
$
|
14.26
|
|
$
|
16.98
|
|
$
|
16.47
|
|
|
||
|
a.
|
Refer to Note
17
for a summary of revenues and operating income by business segment.
|
|
b.
|
Includes the impact of adjustments to provisionally priced concentrate and cathode sales recognized in prior years. Refer to “Revenues” and “Disclosures About Market Risks – Commodity Price Risk” for further discussion.
|
|
c.
|
Includes net (credits) charges for adjustments to environmental obligations and related litigation reserves totaling
$(62) million
(
$(40) million
to net income attributable to common stockholders or
$(0.04)
per share) in
2012
,
$107 million
(
$86 million
to net income attributable to common stockholders or
$0.09
per share) in
2011
and
$19 million
(
$15 million
to net income attributable to common stockholders or
$0.02
per share) in 2010.
|
|
d.
|
Includes a gain of
$59 million
(
$31 million
to net income attributable to common stockholders or
$0.03
per share) for the settlement of the insurance claim for business interruption and property damage relating to the 2011 incidents affecting PT Freeport Indonesia's concentrate pipelines.
|
|
e.
|
Includes charges totaling
$16 million
(
$8 million
to net income attributable to common stockholders or
$0.01
per share) associated with labor agreement costs at Candelaria in
2012
, and
$116 million
(
$50 million
to net income attributable to common stock or
$0.05
per share) primarily associated with bonuses for new labor agreements and other employee costs at PT Freeport Indonesia, Cerro Verde and El Abra in
2011
.
|
|
f.
|
We defer recognizing profits on intercompany sales until final sales to third parties occur. Refer to "Operations - Atlantic Copper Smelting & Refining" for a summary of net impacts from changes in these deferrals.
|
|
g.
|
Includes net losses on early extinguishment of debt totaling
$149 million
(
$0.16
per share) in 2012,
$60 million
(
$0.06
per share) in 2011, and
$71 million
(
$0.07
per share) in 2010. Refer to Note
9
for further discussion.
|
|
h.
|
The 2012 period includes a net tax credit of
$98 million
, net of noncontrolling interests (
$0.11
per share), associated with adjustments to Cerro Verde's deferred income taxes. The 2011 period includes a tax charge of
$49 million
, net of noncontrolling interests (
$0.05
per share), for additional taxes associated with Cerro Verde's election to pay a special mining burden during the remaining term of its current stability agreement. Refer to Note
12
and "Provision for Income Taxes" below for further discussion of these amounts.
|
|
i.
|
Reflects per pound weighted-average production and delivery costs and unit net cash costs (net of by-product credits) for all copper mines, before net noncash and other costs. For reconciliations of the per pound costs by operating division to production and delivery costs applicable to sales reported in our consolidated financial statements, refer to “Operations – Unit Net Cash Costs” and to “Product Revenues and Production Costs.”
|
78
Revenues
Consolidated revenues totaled
$18.0 billion
in
2012
,
$20.9 billion
in
2011
and
$19.0 billion
in
2010
, and included the sale of copper concentrates, copper cathodes, copper rod, gold, molybdenum and other metals by our North and South America copper mines, the sale of copper concentrates (which also contain significant quantities of gold and silver) by our Indonesia mining operations, the sale of copper cathodes and cobalt hydroxide by our Africa mining operations, the sale of molybdenum in various forms by our Molybdenum operations, and the sale of copper cathodes, copper anodes, and gold in anodes and slimes by Atlantic Copper. Our mining revenues for
2012
included sales of copper (
79 percent
), gold (
10 percent
) and molybdenum (
7 percent
).
Following is a summary of year-to-year changes in our consolidated revenues (in millions):
|
|
2012
|
|
2011
|
||||
|
Consolidated revenues – prior year
|
$
|
20,880
|
|
$
|
18,982
|
|
|
|
(Lower) higher price realizations from mining operations:
|
|
|
|||||
|
Copper
|
(948
|
)
|
999
|
|
|||
|
Gold
|
82
|
|
430
|
|
|||
|
Molybdenum
|
(225
|
)
|
40
|
|
|||
|
Silver
|
(44
|
)
|
121
|
|
|||
|
Cobalt
|
(54
|
)
|
(24
|
)
|
|||
|
(Lower) higher sales volumes from mining operations:
|
|||||||
|
Copper
|
(194
|
)
|
(711
|
)
|
|||
|
Gold
|
(583
|
)
|
(616
|
)
|
|||
|
Molybdenum
|
61
|
|
206
|
|
|||
|
Silver
|
(38
|
)
|
27
|
|
|||
|
Cobalt
|
(6
|
)
|
59
|
|
|||
|
Favorable (unfavorable) impacts of net adjustments for prior year
|
|||||||
|
provisionally priced sales
|
132
|
|
(4
|
)
|
|||
|
(Lower) higher purchased copper
|
(469
|
)
|
299
|
|
|||
|
(Lower) higher Atlantic Copper revenues
|
(275
|
)
|
493
|
|
|||
|
Other, including intercompany eliminations
|
(309
|
)
|
579
|
|
|||
|
Consolidated revenues – current year
|
$
|
18,010
|
|
$
|
20,880
|
|
|
Price Realizations
Our consolidated revenues can vary significantly as a result of fluctuations in the market prices of copper, gold, molybdenum, silver and cobalt. Following is a summary of our average realized prices for the years ended December 31:
|
|
2012
|
|
2011
|
|
2010
|
|
||||||
|
Copper (per pound)
|
$
|
3.60
|
|
$
|
3.86
|
|
$
|
3.59
|
|
|
||
|
Gold (per ounce)
|
$
|
1,665
|
|
$
|
1,583
|
|
$
|
1,271
|
|
|||
|
Molybdenum (per pound)
|
$
|
14.26
|
|
$
|
16.98
|
|
$
|
16.47
|
|
|||
|
Silver (per ounce)
|
$
|
30.06
|
|
$
|
36.24
|
|
$
|
21.40
|
|
|||
|
Cobalt (per pound)
|
$
|
7.83
|
|
$
|
9.99
|
|
$
|
10.95
|
|
|||
Sales Volumes
2012
Compared with
2011
.
Consolidated sales volumes totaled
3.65 billion
pounds of copper,
1.0 million
ounces of gold and
83 million
pounds of molybdenum in
2012
, compared with
3.70 billion
pounds of copper,
1.4 million
ounces of gold and
79 million
pounds of molybdenum in
2011
. Lower consolidated copper and gold sales volumes in
2012
primarily reflected lower volumes in Indonesia and South America, partly offset by increased copper production in North America and Africa. Refer to “Operations” for further discussion of sales volumes at our operating divisions.
2011
Compared with
2010
.
Consolidated sales volumes totaled
3.70 billion
pounds of copper,
1.4 million
ounces of gold and
79 million
pounds of molybdenum in
2011
, compared with
3.90 billion
pounds of copper,
1.9 million
ounces of gold and
67 million
pounds of molybdenum in
2010
. Lower consolidated copper sales volumes in
2011
primarily reflected lower sales volumes in Indonesia, partly offset by higher sales volumes in North America. Lower consolidated gold sales volumes primarily reflected lower production in Indonesia. Copper and gold sales for 2011 were impacted by PT Freeport Indonesia labor disruptions in fourth-quarter 2011. Higher consolidated molybdenum sales volumes in
2011
primarily reflected improved demand.
79
Provisionally Priced Copper Sales
Substantially all of our copper concentrate and cathode sales contracts provide final copper pricing in a specified future month (generally one to four months from the shipment date) based primarily on quoted LME monthly average spot copper prices (refer to “Disclosures About Market Risks – Commodity Price Risk” for further discussion). Following are the favorable (unfavorable) impacts of net adjustments to the prior years' provisionally priced copper sales for the years ended December 31 (in millions, except per share amounts):
|
|
2012
|
|
2011
|
|
2010
|
|
||||||
|
Revenues
|
$
|
101
|
|
$
|
(12
|
)
|
$
|
(24
|
)
|
|
||
|
Net income attributable to FCX common stockholders
|
$
|
43
|
|
$
|
(5
|
)
|
$
|
(10
|
)
|
|||
|
Net income per share of FCX common stock
|
$
|
0.05
|
|
$
|
(0.01
|
)
|
$
|
(0.01
|
)
|
|||
Provisionally priced sales adjustments also reflected adjustments to provisionally priced gold sales resulting in a favorable impact of $4 million in 2012, an unfavorable impact of $13 million in 2011 and a favorable impact of less than $1 million in 2010.
Purchased Copper
From time to time, we purchase copper cathode for processing by our Rod & Refining segment when production from our North America copper mines does not meet customer demand.
Atlantic Copper Revenues
The decrease in Atlantic Copper’s revenues in 2012, compared with 2011, primarily reflected lower gold volumes. The increase in Atlantic Copper's revenues in 2011, compared with 2010, primarily reflected higher copper and gold revenues associated with higher prices.
Production and Delivery Costs
2012
Compared with
2011
Consolidated production and delivery costs totaled
$10.4 billion
in
2012
, compared with
$9.9 billion
in
2011
. Higher production and delivery costs for
2012
primarily reflected higher costs at our mining operations, partly offset by lower costs of concentrate purchases at Atlantic Copper associated with lower copper prices and lower volumes and lower costs of cathode purchases in North America.
Consolidated unit site production and delivery costs, before net noncash and other costs, for our copper mining operations averaged
$2.00
per pound of copper in
2012
, compared with
$1.72
per pound of copper in
2011
. Higher unit site production and delivery costs in
2012
primarily reflected lower copper sales volumes in Indonesia and higher mining costs in North and South America. Assuming achievement of current
2013
volume and cost estimates, consolidated site production and delivery costs are expected to average $1.89 per pound of copper for
2013
. Lower projected unit site production and delivery costs for 2013, compared to 2012, primarily reflect the benefit of increased projected copper volumes at Grasberg. Refer to “Operations – Unit Net Cash Costs” for further discussion of unit net cash costs associated with our operating divisions, and to “Product Revenues and Production Costs” for reconciliations of per pound costs by operating division to production and delivery costs applicable to sales reported in our consolidated financial statements.
Our copper mining operations require significant energy, principally diesel, electricity, coal and natural gas. Energy costs approximated
21 percent
of our consolidated copper production costs in
2012
, and included purchases of approximately
255 million
gallons of diesel fuel;
6,800
gigawatt hours of electricity at our North America, South America and Africa copper mining operations (we generate all of our power at our Indonesia mining operation);
700 thousand
metric tons of coal for our coal power plant in Indonesia; and
1 million
MMBTU (million British thermal units) of natural gas at certain of our North America mines. For
2013
, we estimate energy costs will approximate
21 percent
of our consolidated copper production costs.
2011
Compared with
2010
Consolidated production and delivery costs totaled
$9.9 billion
in
2011
, compared with
$8.3 billion
in
2010
. Higher production and delivery costs for
2011
primarily reflect increased mining and milling activities in North America, higher input costs at our mining operations, higher costs of concentrate purchases at Atlantic Copper associated with higher copper and gold prices, and higher costs of copper cathode purchases in North America associated with higher copper prices.
80
Consolidated unit site production and delivery costs, before net noncash and other costs, for our copper mining operations averaged
$1.72
per pound of copper in
2011
, compared with
$1.40
per pound of copper in
2010
. Higher unit site production and delivery costs in
2011
primarily reflected lower copper sales volumes in Indonesia and increased mining and input costs in North and South America and Africa. Consolidated site production and delivery costs in 2011 also included $116 million ($0.03 per pound) primarily related to bonuses for new labor agreements and other employee costs in Indonesia and South America.
Depreciation, Depletion and Amortization
Consolidated depreciation, depletion and amortization expense totaled
$1.2 billion
in
2012
and
$1.0 billion
in
2011
and
2010
. Depreciation will vary under the UOP method as a result of changes in sales volumes and the related UOP rates at our individual mines. Higher depreciation, depletion and amortization expense in
2012
primarily reflected additions of assets depreciated on a straight-line basis in North and South America.
Selling, General and Administrative Expenses
Consolidated selling, general and administrative expenses totaled
$431 million
in
2012
,
$415 million
in
2011
and
$381 million
in
2010
. Higher selling, general and administrative expenses in
2012
, compared with
2011
, primarily reflected transaction costs associated with pending acquisitions. Higher selling, general and administrative expenses in 2011, compared with 2010, primarily reflected higher charitable contributions.
Exploration and Research Expenses
Consolidated exploration and research expenses totaled
$285 million
in
2012
,
$271 million
in
2011
and
$143 million
in
2010
. We are actively conducting exploration activities near our existing mines with a focus on opportunities to expand reserves that will support additional future production capacity in the large mineral districts where we currently operate. Favorable exploration results indicate opportunities for what we believe could be significant future potential reserve additions in North and South America and in the Tenke minerals district. The drilling data in North America continues to indicate the potential for expanded sulfide production.
For
2013
, exploration and research expenditures are expected to total approximately
$275 million
, including approximately
$235 million
for exploration. Exploration activities will continue to focus primarily on the potential for future reserve additions in our existing minerals districts. Approximately one third of the 2013 budget is associated with greenfield exploration projects.
Environmental Obligations and Shutdown Costs
Environmental obligation costs (credits) reflect net revisions to our long-term environmental obligations, which will vary from period to period because of changes to environmental laws and regulations, the settlement of environmental matters and/or circumstances affecting our operations that could result in significant changes in our estimates (refer to "Critical Accounting Estimates - Environmental Obligations" for further discussion). Shutdown costs include care and maintenance costs and any litigation, remediation or related expenditures associated with closed facilities or operations.
Environmental obligations and shutdown costs totaled a net credit of
$(22) million
in
2012
, and net charges of
$134 million
in
2011
and
$19 million
in
2010
. Refer to Note
13
for further discussion of environmental obligations and litigation matters.
Gain on Insurance Settlement
Gain on insurance settlement totaled
$59 million
(
$31 million
to net income attributable to common stockholders or
$0.03
per share) and reflected the settlement of the insurance claim for business interruption and property damage relating to the 2011 incidents affecting PT Freeport Indonesia's concentrate pipelines.
Interest Expense, Net
Consolidated interest expense (excluding capitalized interest) totaled
$267 million
in
2012
,
$421 million
in
2011
and
$528 million
in
2010
. The reduction in interest expense primarily reflects the impact of the first-quarter 2012 refinancing transaction and the impact of debt repayments during 2011 and 2010 (refer to Note
9
for discussion of debt repayments).
Capitalized interest is primarily related to our development projects and totaled
$81 million
in
2012
,
$109 million
in
2011
and
$66 million
in
2010
. Refer to "Operations" for further discussion of current development projects.
81
During
2012
, we recorded losses on early extinguishment of debt totaling
$168 million
(
$149 million
to net income attributable to common stockholders or
$0.16
per share) associated with the redemption of our remaining 8.375% Senior Notes.
During
2011
, we recorded losses on early extinguishment of debt totaling
$68 million
(
$60 million
to net income attributable to common stockholders or
$0.06
per share) associated with the redemption of our 8.25% Senior Notes, the revolving credit facilities that were replaced in March 2011 and open-market purchases of our 9.50% Senior Notes.
During
2010
, we recorded losses on early extinguishment of debt totaling
$81 million
(
$71 million
to net income attributable to common stockholders or
$0.07
per share) associated with the redemption of our Senior Floating Rate Notes and open-market purchases of our 8.25%, 8.375% and 9.50% Senior Notes.
Refer to Note
9
for further discussion of these transactions.
Provision for Income Taxes
Following is a summary of the approximate amounts in the calculation of our consolidated provision for income taxes for the year ended December 31 (in millions, except percentages):
|
2012
|
||||||||||
|
Income
a
|
Effective
Tax Rate
|
Income Tax
(Provision)
Benefit
|
||||||||
|
U.S.
|
$
|
1,539
|
|
23%
|
$
|
(350
|
)
|
|||
|
South America
|
2,211
|
|
36%
|
(791
|
)
|
b
|
||||
|
Indonesia
|
1,287
|
|
39%
|
(497
|
)
|
|||||
|
Africa
|
357
|
|
31%
|
(112
|
)
|
|||||
|
Eliminations and other
|
93
|
|
N/A
|
6
|
|
|||||
|
5,487
|
|
32%
|
d
|
(1,744
|
)
|
|||||
|
Deferred tax liability adjustment
c
|
N/A
|
|
N/A
|
$
|
234
|
|
||||
|
Consolidated FCX
|
$
|
5,487
|
|
28%
|
$
|
(1,510
|
)
|
|||
|
a.
|
Represents income by geographic location before income taxes and equity in affiliated companies’ net earnings.
|
|
b.
|
In July 2012, Sociedad Minera Cerro Verde S.A.A. (Cerro Verde) signed a new 15-year mining stability agreement with the Peruvian government, which is expected to become effective when the current mining stability agreement expires on December 31, 2013. In connection with the new mining stability agreement, Cerro Verde's income tax rate will increase from 30 percent to 32 percent. As a result of the change in the income tax rate, we recognized additional deferred tax expense of
$29 million
(
$25 million
net of noncontrolling interests) in 2012, which relates primarily to the assets recorded in connection with the 2007 acquisition of FMC.
|
|
c.
|
With the exception of Tenke Fungurume Mining S.A.R.L. (TFM), we have not elected to permanently reinvest earnings from our foreign subsidiaries, and we have recorded deferred tax liabilities for foreign earnings that are available to be repatriated to the U.S. Cerro Verde previously recorded deferred Peruvian income tax liabilities for income taxes that would become payable if the reinvested profits used to fund the initial Cerro Verde sulfide expansion are distributed prior to the expiration of Cerro Verde's current stability agreement on December 31, 2013. Because reinvested profits at Cerro Verde are not expected to be distributed prior to December 31, 2013, a net deferred tax liability totaling
$234 million
(
$123 million
net of noncontrolling interests) was reversed and recognized as an income tax benefit in 2012.
|
|
d.
|
Our consolidated effective income tax rate is a function of the combined effective tax rates for the jurisdictions in which we operate. Accordingly, variations in the relative proportions of jurisdictional income can result in fluctuations to our consolidated effective income tax rate. Assuming average prices of
$3.65
per pound for copper,
$1,700
per ounce for gold,
$11
per pound for molybdenum and achievement of current sales volume and cost estimates, we estimate our annual consolidated effective tax rate for 2013 (excluding impacts from the pending acquisitions) will approximate 34 percent to
35 percent
.
|
82
Following is a summary of the approximate amounts in the calculation of our consolidated provision for income taxes for the years ended December 31 (in millions, except percentages):
|
2011
|
2010
|
|||||||||||||||||||
|
Income
a
|
Effective
Tax Rate |
Income Tax
Provision |
Income
(Loss)
a
|
Effective
Tax Rate
|
Income Tax
(Provision)
Benefit
|
|||||||||||||||
|
U.S.
|
$
|
2,112
|
|
23%
|
$
|
(478
|
)
|
$
|
1,307
|
|
19%
|
$
|
(244
|
)
|
||||||
|
South America
|
3,017
|
|
36%
|
(1,075
|
)
|
b
|
2,995
|
|
33%
|
(999
|
)
|
|||||||||
|
Indonesia
|
2,923
|
|
43%
|
(1,256
|
)
|
4,069
|
|
42%
|
(1,709
|
)
|
||||||||||
|
Africa
|
357
|
|
34%
|
(120
|
)
|
395
|
|
30%
|
(118
|
)
|
||||||||||
|
Eliminations and other
|
409
|
|
N/A
|
(158
|
)
|
(254
|
)
|
N/A
|
87
|
|
||||||||||
|
Consolidated FCX
|
$
|
8,818
|
|
35%
|
$
|
(3,087
|
)
|
$
|
8,512
|
|
35%
|
$
|
(2,983
|
)
|
||||||
|
a.
|
Represents income (loss) by geographic location before income taxes and equity in affiliated companies’ net earnings.
|
|
b.
|
In September 2011, Peru enacted a new mining tax and royalty regime and also created a special mining burden that companies with stability agreements can elect to pay. Cerro Verde elected to pay this special mining burden during the remaining term of its stability agreement. As a result, Cerro Verde recognized additional current and deferred tax expense of
$53 million
(
$49 million
net of noncontrolling interests) in 2011. The deferred portion of this accrual relates primarily to the assets recorded in connection with the 2007 acquisition of FMC.
|
Refer to Note
12
for further discussion of income taxes.
OPERATIONS
North America Copper Mines
We currently operate seven copper mines in North America – Morenci, Bagdad, Safford, Sierrita and Miami in Arizona, and Tyrone and Chino in New Mexico. All of these mining operations are wholly owned, except for Morenci, an unincorporated joint venture in which we own an 85 percent undivided interest.
The North America copper mines include open-pit mining, sulfide ore concentrating, leaching and solution extraction/electrowinning (SX/EW) operations. Molybdenum concentrate is also produced by certain of our North America copper mines (Sierrita, Bagdad, Morenci and Chino)
.
A majority of the copper produced at our North America copper mines is cast into copper rod by our Rod & Refining operations. The remainder of our North America copper sales is in the form of copper cathode or copper concentrate, a portion of which is shipped to Atlantic Copper, an affiliated smelter.
Operating and Development Activities.
We have increased production at our North America copper mines, reflecting the restart of certain mining and milling operations and the increase of mining rates at Morenci and Chino. Ramp up activities at Chino are continuing, with annual production of approximately 250 million pounds of copper targeted in 2014, compared with 144 million pounds of copper in 2012. We continue to evaluate opportunities to invest in additional production capacity at our North America copper mines in response to positive exploration results in recent years.
Morenci Mill Expansion.
We are engaged in a project to expand mining and milling capacity at Morenci to process additional sulfide ores identified through exploratory drilling. The approximate $1.4 billion project is targeting incremental annual production of approximately 225 million pounds of copper in 2014 (an approximate 40 percent increase from 2012) through an increase in milling rates from 50,000 metric tons of ore per day to approximately 115,000 metric tons of ore per day, and mining rates from 700,000 short tons per day to 900,000 short tons per day. Engineering activities are progressing and construction activities are under way. Project costs of $294 million have been incurred as of
December 31, 2012
($267 million during
2012
).
83
Operating Data.
Following is summary operating data for the North America copper mines for the years ended December 31:
|
|
2012
|
|
2011
|
|
2010
|
||||||
|
Operating Data, Net of Joint Venture Interest
|
|
|
|
||||||||
|
Copper
(millions of recoverable pounds)
|
|
|
|
||||||||
|
Production
|
1,363
|
|
1,258
|
|
1,067
|
|
|||||
|
Sales, excluding purchases
|
1,351
|
|
1,247
|
|
1,085
|
|
|||||
|
Average realized price per pound
|
$
|
3.64
|
|
$
|
3.99
|
|
$
|
3.42
|
|
||
|
Molybdenum
(millions of recoverable pounds)
|
|
|
|
||||||||
|
Production
a
|
36
|
|
35
|
|
25
|
|
|||||
|
100% Operating Data
|
|
|
|
||||||||
|
SX/EW operations
|
|
|
|
||||||||
|
Leach ore placed in stockpiles (metric tons per day)
|
998,600
|
|
888,300
|
|
648,800
|
|
|||||
|
Average copper ore grade (percent)
|
0.22
|
|
0.24
|
|
0.24
|
|
|||||
|
Copper production (millions of recoverable pounds)
|
866
|
|
801
|
|
746
|
|
|||||
|
Mill operations
|
|
|
|
||||||||
|
Ore milled (metric tons per day)
|
239,600
|
|
222,800
|
|
189,200
|
|
|||||
|
Average ore grade (percent):
|
|||||||||||
|
Copper
|
0.37
|
|
0.38
|
|
0.32
|
|
|||||
|
Molybdenum
|
0.03
|
|
0.03
|
|
0.03
|
|
|||||
|
Copper recovery rate (percent)
|
83.9
|
|
83.1
|
|
83.0
|
|
|||||
|
Copper production (millions of recoverable pounds)
|
592
|
|
549
|
|
398
|
|
|||||
|
a.
|
Reflects molybdenum production from certain of our North America copper mines. Sales of molybdenum are reflected in the Molybdenum division.
|
2012
Compared with
2011
Copper sales volumes from our North America copper mines increased to
1.35 billion
pounds in
2012
, compared with
1.25 billion
pounds in
2011
, primarily reflecting increased production at the Chino mine.
Copper sales volumes from our North America copper mines are expected to approximate
1.45 billion
pounds in
2013
. Higher projected copper sales volumes in
2013
, compared with
2012
, primarily reflect higher production at Morenci and Chino. Refer to "Outlook" for projected molybdenum sales volumes.
2011
Compared with
2010
Copper sales volumes from our North America copper mines increased to
1.25 billion
pounds in
2011
, compared with
1.09 billion
pounds in
2010
, primarily reflecting increased production at the Morenci, Miami and Chino mines.
Unit Net Cash Costs.
Unit net cash costs per pound of copper is a measure intended to provide investors with information about the cash-generating capacity of our mining operations expressed on a basis relating to the primary metal product for our respective operations. We use this measure for the same purpose and for monitoring operating performance by our mining operations. This information differs from measures of performance determined in accordance with U.S. GAAP and should not be considered in isolation or as a substitute for measures of performance determined in accordance with U.S. GAAP. This measure is presented by other metals mining companies, although our measure may not be comparable to similarly titled measures reported by other companies.
84
Gross Profit per Pound of Copper and Molybdenum
The following tables summarize unit net cash costs and gross profit per pound at our North America copper mines for the years ended December 31. Refer to “Product Revenues and Production Costs” for an explanation of the “by-product” and “co-product” methods and a reconciliation of unit net cash costs per pound to production and delivery costs applicable to sales reported in our consolidated financial statements.
|
|
2012
|
2011
|
|||||||||||||||||||||
|
|
By-
|
Co-Product Method
|
By-
|
Co-Product Method
|
|||||||||||||||||||
|
Product
Method
|
Copper
|
Molyb-
denum
a
|
Product
Method
|
Copper
|
Molyb-
denum
a
|
||||||||||||||||||
|
Revenues, excluding adjustments
|
$
|
3.64
|
|
$
|
3.64
|
|
$
|
13.00
|
|
$
|
3.99
|
|
$
|
3.99
|
|
$
|
15.72
|
|
|||||
|
Site production and delivery, before net noncash
|
|
|
|
|
|
|
|||||||||||||||||
|
and other costs shown below
|
1.91
|
|
1.75
|
|
6.32
|
|
1.78
|
|
1.60
|
|
6.86
|
|
|||||||||||
|
By-product credits
a
|
(0.36
|
)
|
—
|
|
—
|
|
(0.48
|
)
|
—
|
|
—
|
|
|||||||||||
|
Treatment charges
|
0.12
|
|
0.11
|
|
—
|
|
0.11
|
|
0.10
|
|
—
|
|
|||||||||||
|
Unit net cash costs
|
1.67
|
|
1.86
|
|
6.32
|
|
1.41
|
|
1.70
|
|
6.86
|
|
|||||||||||
|
Depreciation, depletion and amortization
|
0.26
|
|
0.24
|
|
0.48
|
|
0.21
|
|
0.20
|
|
0.39
|
|
|||||||||||
|
Noncash and other costs, net
|
0.10
|
|
0.10
|
|
0.09
|
|
0.13
|
|
0.13
|
|
0.09
|
|
|||||||||||
|
Total unit costs
|
2.03
|
|
2.20
|
|
6.89
|
|
1.75
|
|
2.03
|
|
7.34
|
|
|||||||||||
|
Revenue adjustments, primarily for pricing on prior period open sales
|
0.01
|
|
0.01
|
|
—
|
|
—
|
|
—
|
|
—
|
|
|||||||||||
|
Gross profit per pound
|
$
|
1.62
|
|
$
|
1.45
|
|
$
|
6.11
|
|
$
|
2.24
|
|
$
|
1.96
|
|
$
|
8.38
|
|
|||||
|
Copper sales (millions of recoverable pounds)
|
1,347
|
|
1,347
|
|
|
1,244
|
|
1,244
|
|
|
|||||||||||||
|
Molybdenum sales (millions of recoverable pounds)
b
|
|
|
36
|
|
|
|
35
|
|
|||||||||||||||
|
a.
|
Molybdenum credits and revenues reflect volumes produced at market-based pricing.
|
|
b.
|
Reflects molybdenum produced by certain of our North America copper mines.
|
Our North America copper mines have varying cost structures because of differences in ore grades and characteristics, processing costs, by-products and other factors. During
2012
, average unit net cash costs (net of by-product credits) for the North America copper mines ranged from $1.13 per pound to $2.15 per pound at the individual mines and averaged
$1.67
per pound. Average unit net cash costs (net of by-product credits) for our North America copper mines increased to
$1.67
per pound of copper in
2012
, compared with
$1.41
per pound in
2011
, primarily reflecting increased mining and milling activities and lower molybdenum credits, partly offset by higher copper sales volumes.
Because certain assets are depreciated on a straight-line basis, North America's average unit depreciation rate varies with asset additions and the level of copper production and sales.
Assuming achievement of current sales volume and cost estimates and an average price of
$11
per pound of molybdenum for
2013
, we estimate that average unit net cash costs (net of by-product credits) for our North America copper mines would approximate
$1.82
per pound of copper in
2013
. North America's average unit net cash costs for
2013
would change by approximately
$0.04
per pound for each
$2
per pound change in the average price of molybdenum during
2013
. North America's unit net cash costs for
2013
are expected to be higher than
2012
because of lower molybdenum credits and higher mining rates.
85
|
|
2011
|
2010
|
|||||||||||||||||||||
|
|
By-
|
Co-Product Method
|
By-
|
Co-Product Method
|
|||||||||||||||||||
|
Product
Method
|
Copper
|
Molyb-
denum
a
|
Product
Method
|
Copper
|
Molyb-
denum
a
|
||||||||||||||||||
|
Revenues, excluding adjustments
|
$
|
3.99
|
|
$
|
3.99
|
|
$
|
15.72
|
|
$
|
3.42
|
|
$
|
3.42
|
|
$
|
15.60
|
|
|||||
|
Site production and delivery, before net noncash
|
|
|
|
|
|
|
|||||||||||||||||
|
and other costs shown below
|
1.78
|
|
1.60
|
|
6.86
|
|
1.50
|
|
1.35
|
|
7.95
|
|
|||||||||||
|
By-product credits
a
|
(0.48
|
)
|
—
|
|
—
|
|
(0.35
|
)
|
—
|
|
—
|
|
|||||||||||
|
Treatment charges
|
0.11
|
|
0.10
|
|
—
|
|
0.09
|
|
0.09
|
|
—
|
|
|||||||||||
|
Unit net cash costs
|
1.41
|
|
1.70
|
|
6.86
|
|
1.24
|
|
1.44
|
|
7.95
|
|
|||||||||||
|
Depreciation, depletion and amortization
|
0.21
|
|
0.20
|
|
0.39
|
|
0.24
|
|
0.22
|
|
0.54
|
|
|||||||||||
|
Noncash and other costs, net
|
0.13
|
|
0.13
|
|
0.09
|
|
0.20
|
|
0.20
|
|
0.03
|
|
|||||||||||
|
Total unit costs
|
1.75
|
|
2.03
|
|
7.34
|
|
1.68
|
|
1.86
|
|
8.52
|
|
|||||||||||
|
Revenue adjustments, primarily for pricing on prior period open sales
|
—
|
|
—
|
|
—
|
|
—
|
|
—
|
|
—
|
|
|||||||||||
|
Gross profit per pound
|
$
|
2.24
|
|
$
|
1.96
|
|
$
|
8.38
|
|
$
|
1.74
|
|
$
|
1.56
|
|
$
|
7.08
|
|
|||||
|
Copper sales (millions of recoverable pounds)
|
1,244
|
|
1,244
|
|
|
1,082
|
|
1,082
|
|
|
|||||||||||||
|
Molybdenum sales (millions of recoverable pounds)
b
|
|
|
35
|
|
|
|
25
|
|
|||||||||||||||
|
a.
|
Molybdenum credits and revenues reflect volumes produced at market-based pricing.
|
|
b.
|
Reflects molybdenum produced by certain of our North America copper mines.
|
Unit net cash costs (net of by-product credits) for our North America copper mines increased to
$1.41
per pound of copper in
2011
, compared with
$1.24
per pound in
2010
, primarily reflecting increased mining and milling activities and higher input costs, partly offset by higher molybdenum credits.
South America Mining
We operate four copper mines in South America – Cerro Verde in Peru, and El Abra, Candelaria and Ojos del Salado in Chile. We own a 53.56 percent interest in Cerro Verde, a 51 percent interest in El Abra, and an 80 percent interest in both Candelaria and Ojos del Salado.
South America mining includes open-pit and underground mining, sulfide ore concentrating, leaching and SX/EW operations. Production from our South America mines is sold as copper concentrate or copper cathode under long-term contracts. Our South America mines ship a portion of their copper concentrate inventories to Atlantic Copper, an affiliated smelter. In addition to copper, the Cerro Verde mine produces molybdenum concentrates, and the Candelaria and Ojos del Salado mines produce gold and silver.
Operating and Development Activities.
Cerro Verde Expansion.
At Cerro Verde, we are engaged in a large-scale expansion. The approximate $4.4 billion project would expand the concentrator facilities from 120,000 metric tons of ore per day to 360,000 metric tons of ore per day and provide incremental annual production of approximately 600 million pounds of copper and 15 million pounds of molybdenum beginning in 2016. Considering the long-term nature and large size of the project, actual costs could vary from these estimates. Cerro Verde received approval of the environmental impact assessment in fourth-quarter 2012. Detailed engineering and long-lead item procurement are under way, including $492 million of costs incurred to date. Construction is expected to commence in 2013.
An agreement has been reached with the Regional Government of Arequipa, the National Government, Servicio de Agua Potable y Alcantarillado de Arequipa S.A. (SEDAPAR) and other local institutions to allow Cerro Verde to finance the engineering and construction of a wastewater treatment plant for Arequipa, should Cerro Verde proceed with the expansion. Once Cerro Verde obtains a license for the treated water it would be used to supplement existing water supplies to support the concentrator expansion.
El Abra Sulfide.
During 2011, we commenced production from El Abra’s sulfide ores. Production from the sulfide ore is replacing the depleting oxide copper production. We are also engaged in pre-feasibility studies for a potential large-scale milling operation at El Abra to process additional sulfide material and to achieve higher recoveries. Exploration results at El Abra have identified a significant sulfide resource.
86
Candelaria Water.
As part of our overall strategy to supply water to the Candelaria mine, we completed construction of a pipeline to bring water from a nearby water treatment facility. In addition, we have substantially completed the construction of a desalination plant and pipeline that will supply Candelaria’s longer term water needs, at a cost of approximately $315 million.
Operating Data.
Following is summary operating data for the South America mining operations for the years ended December 31.
|
|
2012
|
|
2011
|
|
2010
|
||||||
|
Copper
(millions of recoverable pounds)
|
|
|
|
||||||||
|
Production
|
1,257
|
|
1,306
|
|
1,354
|
|
|||||
|
Sales
|
1,245
|
|
1,322
|
|
1,335
|
|
|||||
|
Average realized price per pound
|
$
|
3.58
|
|
$
|
3.77
|
|
$
|
3.68
|
|
||
|
Gold
(thousands of recoverable ounces)
|
|
|
|
||||||||
|
Production
|
83
|
|
101
|
|
93
|
|
|||||
|
Sales
|
82
|
|
101
|
|
93
|
|
|||||
|
Average realized price per ounce
|
$
|
1,673
|
|
$
|
1,580
|
|
$
|
1,263
|
|
||
|
Molybdenum
(millions of recoverable pounds)
|
|
|
|
||||||||
|
Production
a
|
8
|
|
10
|
|
7
|
|
|||||
|
SX/EW operations
|
|
|
|
||||||||
|
Leach ore placed in stockpiles (metric tons per day)
|
229,300
|
|
245,200
|
|
268,800
|
|
|||||
|
Average copper ore grade (percent)
|
0.55
|
|
0.50
|
|
0.41
|
|
|||||
|
Copper production (millions of recoverable pounds)
|
457
|
|
439
|
|
504
|
|
|||||
|
Mill operations
|
|
|
|
||||||||
|
Ore milled (metric tons per day)
|
191,400
|
|
189,200
|
|
188,800
|
|
|||||
|
Average ore grade:
|
|||||||||||
|
Copper (percent)
|
0.60
|
|
0.66
|
|
0.65
|
|
|||||
|
Gold (grams per metric ton)
|
0.10
|
|
0.12
|
|
0.10
|
|
|||||
|
Molybdenum (percent)
|
0.02
|
|
0.02
|
|
0.02
|
|
|||||
|
Copper recovery rate (percent)
|
90.1
|
|
89.6
|
|
90.0
|
|
|||||
|
Copper production (millions of recoverable pounds)
|
800
|
|
867
|
|
850
|
|
|||||
|
a.
|
Reflects molybdenum production from the Cerro Verde mine. Sales of molybdenum are reflected in the Molybdenum division.
|
2012
Compared with
2011
Copper sales volumes from our South America mining operations totaled
1.25 billion
pounds in
2012
, compared with
1.32 billion
in
2011
, primarily reflecting lower ore grades at Candelaria and Cerro Verde, partly offset by higher mining rates and ore grades at El Abra.
Consolidated copper sales volumes from our South America mines are expected to approximate
1.33 billion
pounds in
2013
. Higher projected copper sales volumes in
2013
, compared with
2012
, primarily reflect the mining of higher grade ore at Candelaria. Refer to "Outlook" for projected gold and molybdenum sales volumes.
2011
Compared with
2010
Copper sales volumes from our South America mining operations totaled
1.32 billion
pounds in
2011
and
1.34 billion
pounds in
2010
, primarily reflecting lower mining rates at El Abra as it transitions from oxide to sulfide ores, partially offset by higher grade ore at Candelaria.
Unit Net Cash Costs.
Unit net cash costs per pound of copper is a measure intended to provide investors with information about the cash-generating capacity of our mining operations expressed on a basis relating to the primary metal product for our respective operations. We use this measure for the same purpose and for monitoring operating performance by our mining operations. This information differs from measures of performance determined in accordance with U.S. GAAP and should not be considered in isolation or as a substitute for measures of performance determined in accordance with U.S. GAAP. This measure is presented by other metals mining companies, although our measure may not be comparable to similarly titled measures reported by other companies.
87
Gross Profit per Pound of Copper
The following tables summarize unit net cash costs and gross profit per pound at our South America mining operations for the years ended December 31. Unit net cash costs per pound of copper are reflected under the by-product and co-product methods as the South America mining operations also had small amounts of molybdenum, gold and silver sales. Refer to “Product Revenues and Production Costs” for an explanation of the “by-product” and “co-product” methods and a reconciliation of unit net cash costs per pound to production and delivery costs applicable to sales reported in our consolidated financial statements.
|
|
2012
|
2011
|
|||||||||||||
|
By-Product
Method
|
Co-Product
Method
|
By-Product
Method
|
Co-Product
Method
|
||||||||||||
|
Revenues, excluding adjustments
|
$
|
3.58
|
|
$
|
3.58
|
|
$
|
3.77
|
|
$
|
3.77
|
|
|||
|
Site production and delivery, before net noncash
|
|
|
|
|
|||||||||||
|
and other costs shown below
|
1.60
|
|
a
|
1.49
|
|
1.38
|
|
a
|
1.27
|
|
|||||
|
By-product credits
|
(0.26
|
)
|
—
|
|
(0.35
|
)
|
—
|
|
|||||||
|
Treatment charges
|
0.16
|
|
0.16
|
|
0.17
|
|
0.17
|
|
|||||||
|
Unit net cash costs
|
1.50
|
|
1.65
|
|
1.20
|
|
1.44
|
|
|||||||
|
Depreciation, depletion and amortization
|
0.23
|
|
0.22
|
|
0.20
|
|
0.18
|
|
|||||||
|
Noncash and other costs, net
|
0.09
|
|
0.06
|
|
0.06
|
|
0.05
|
|
|||||||
|
Total unit costs
|
1.82
|
|
1.93
|
|
1.46
|
|
1.67
|
|
|||||||
|
Revenue adjustments, primarily for pricing on
|
|||||||||||||||
|
prior period open sales
|
0.09
|
|
0.09
|
|
0.01
|
|
—
|
|
|||||||
|
Gross profit per pound
|
$
|
1.85
|
|
$
|
1.74
|
|
$
|
2.32
|
|
$
|
2.10
|
|
|||
|
Copper sales (millions of recoverable pounds)
|
1,245
|
|
1,245
|
|
1,322
|
|
1,322
|
|
|||||||
|
a.
|
Includes
$16 million
($0.01 per pound) associated with labor agreement costs at Candelaria in 2012, and
$50 million
($0.04 per pound) for bonuses paid at Cerro Verde and El Abra pursuant to new labor agreements in 2011.
|
Our South America mines have varying cost structures because of differences in ore grades and characteristics, processing costs, by-products and other factors. During
2012
, unit net cash costs (net of by-product credits) for the South America mines ranged from $1.30 per pound to $1.72 per pound at the individual mines and averaged
$1.50
per pound. Average unit net cash costs (net of by-product credits) for our South America mining operations increased to
$1.50
per pound of copper in
2012
, compared with
$1.20
per pound in
2011
, primarily reflecting higher mining and input costs, lower by-product credits and lower sales volumes.
Because certain assets are depreciated on a straight-line basis, South America's unit depreciation rate varies with asset additions and the level of copper production and sales.
Revenue adjustments primarily result from changes in prices on provisionally priced copper sales recognized in prior years. Refer to “Consolidated Results - Revenues” for further discussion of adjustments to prior year provisionally priced copper sales.
Assuming achievement of current sales volume and cost estimates and average prices of
$1,700
per ounce of gold and
$11
per pound of molybdenum in
2013
, we estimate that average unit net cash costs (net of by-product credits) for our South America mining operations would approximate
$1.50
per pound of copper in
2013
.
88
|
|
2011
|
2010
|
|||||||||||||
|
By-Product
Method
|
Co-Product
Method
|
By-Product
Method
|
Co-Product
Method
|
||||||||||||
|
Revenues, excluding adjustments
|
$
|
3.77
|
|
$
|
3.77
|
|
$
|
3.68
|
|
$
|
3.68
|
|
|||
|
Site production and delivery, before net noncash
|
|
|
|
|
|||||||||||
|
and other costs shown below
|
1.38
|
|
a
|
1.27
|
|
1.21
|
|
1.14
|
|
||||||
|
By-product credits
|
(0.35
|
)
|
—
|
|
(0.21
|
)
|
—
|
|
|||||||
|
Treatment charges
|
0.17
|
|
0.17
|
|
0.15
|
|
0.15
|
|
|||||||
|
Unit net cash costs
|
1.20
|
|
1.44
|
|
1.15
|
|
1.29
|
|
|||||||
|
Depreciation, depletion and amortization
|
0.20
|
|
0.18
|
|
0.19
|
|
0.18
|
|
|||||||
|
Noncash and other costs, net
|
0.06
|
|
0.05
|
|
0.05
|
|
0.05
|
|
|||||||
|
Total unit costs
|
1.46
|
|
1.67
|
|
1.39
|
|
1.52
|
|
|||||||
|
Revenue adjustments, primarily for pricing on
|
|||||||||||||||
|
prior period open sales
|
0.01
|
|
—
|
|
(0.01
|
)
|
(0.01
|
)
|
|||||||
|
Gross profit per pound
|
$
|
2.32
|
|
$
|
2.10
|
|
$
|
2.28
|
|
$
|
2.15
|
|
|||
|
Copper sales (millions of recoverable pounds)
|
1,322
|
|
1,322
|
|
1,335
|
|
1,335
|
|
|||||||
|
a.
|
Includes
$50 million
($0.04 per pound) for bonuses paid at Cerro Verde and El Abra pursuant to new labor agreements.
|
Unit net cash costs (net of by-product credits) for our South America mining operations increased to
$1.20
per pound of copper in
2011
, compared with
$1.15
per pound in
2010
, primarily reflecting higher input costs and the impact of bonuses paid pursuant to new labor agreements, partially offset by higher by-product credits.
Indonesia Mining
Indonesia mining includes PT Freeport Indonesia’s Grasberg minerals district. We own 90.64 percent of PT Freeport Indonesia, including 9.36 percent owned through our wholly owned subsidiary, PT Indocopper Investama. As discussed in Note
14
, we have agreed to consider a potential sale of our interest in PT Indocopper Investama at fair market value. PT Freeport Indonesia is currently engaged in discussions with the Indonesian government related to its Contract of Work and intends to conclude that process before proceeding with any further discussions about the potential sale of an interest in PT Indocopper Investama.
PT Freeport Indonesia produces copper concentrates, which contain significant quantities of gold and silver. Substantially all of PT Freeport Indonesia’s copper concentrates are sold under long-term contracts, of which approximately one-half is sold to affiliated smelters, Atlantic Copper and PT Smelting (PT Freeport Indonesia’s 25-percent owned copper smelter and refinery in Indonesia - refer to Note
2
for further discussion), and the remainder to other third-party customers.
We have established certain unincorporated joint ventures with Rio Tinto plc (Rio Tinto), under which Rio Tinto has a 40 percent interest in certain assets and future production exceeding specified annual amounts of copper, gold and silver. Refer to Note
2
for further discussion of our joint ventures with Rio Tinto plc and to Note
14
for further discussion of PT Freeport Indonesia's Contract of Work with the Government of Indonesia. Refer to "Risk Factors" contained in Part I, Item 1A of our annual report on Form 10-K for the year ended
December 31, 2012
, for discussion of risks associated with operations in Indonesia.
Operating and Development Activities.
We have several projects in progress in the Grasberg minerals district, primarily related to the development of large-scale, high-grade underground ore bodies. In aggregate, these underground ore bodies are expected to ramp up over several years to approximately 240,000 metric tons of ore per day following the currently anticipated transition from the Grasberg open pit in 2017. Over the next five years, aggregate capital spending on these projects is currently expected to average
$715 million
per year (
$565 million
per year net to PT Freeport Indonesia). Considering the long-term nature and large size of these projects, actual costs could vary from these estimates.
89
The following provides additional information on the continued development of the Common Infrastructure project, the Grasberg Block Cave underground mine and development of the Deep Mill Level Zone (DMLZ) ore body that lies below the Deep Ore Zone (DOZ) underground mine.
Common Infrastructure and Grasberg Block Cave Mine.
In 2004, PT Freeport Indonesia commenced its Common Infrastructure project to provide access to its large undeveloped underground ore bodies located in the Grasberg minerals district through a tunnel system located approximately 400 meters deeper than its existing underground tunnel system. In addition to providing access to our underground ore bodies, the tunnel system will enable PT Freeport Indonesia to conduct future exploration in prospective areas associated with currently identified ore bodies. The tunnel system was completed to the Big Gossan terminal, and the Big Gossan mine was brought into production in fourth-quarter 2010. Development of the DMLZ and Grasberg Block Cave is advancing.
The Grasberg Block Cave underground mine accounts for more than 40 percent of our recoverable proven and probable reserves in Indonesia. Production at the Grasberg Block Cave mine is currently scheduled to commence in 2017, at the end of mining the Grasberg open pit, which is currently expected at the end of 2016. Targeted production rates once the Grasberg Block Cave mining operation reaches full capacity are expected to approximate 160,000 metric tons of ore per day.
Aggregate mine development capital for the Grasberg Block Cave mine and associated Common Infrastructure is expected to approximate $4.4 billion (incurred from 2008 to 2021), with PT Freeport Indonesia’s share totaling approximately $4.1 billion. Aggregate project costs totaling $860 million have been incurred through
December 31, 2012
($291 million during
2012
).
DMLZ.
The DMLZ ore body lies below the DOZ mine at the 2,590-meter elevation and represents the downward continuation of mineralization in the Ertsberg East Skarn system and neighboring Ertsberg porphyry. We plan to mine the ore body using a block-cave method with production beginning in 2015. Drilling efforts continue to determine the extent of this ore body. Aggregate mine development capital costs for the DMLZ mine are expected to approximate $2.3 billion (incurred from 2009 to 2020), with PT Freeport Indonesia’s share totaling approximately $1.4 billion. Aggregate project costs totaling $510 million have been incurred through
December 31, 2012
($241 million during
2012
). Targeted production rates once the DMLZ mining operation reaches full capacity are expected to approximate 80,000 metric tons of ore per day.
Other Matters.
PT Freeport Indonesia is engaged in discussions with officials of the Indonesian government on its operations, future plans and Contract of Work (COW). We are working cooperatively with the government in its review of PT Freeport Indonesia's COW and to obtain an extension of our COW beyond 2021, as provided under the terms of the COW. Refer to Note
14
for further discussion of PT Freeport Indonesia's COW.
Between July 2009 and
February 15, 2013
, there were
37
shooting incidents in and around the Grasberg minerals district, including along the road leading to our mining and milling operations, which resulted in
15
fatalities and
57
injuries. The investigation of these matters is continuing. We have taken precautionary measures, including limiting use of the road to secured convoys. The Indonesian government has responded with additional security forces and expressed a commitment to protect the safety of the community and our operations. Prolonged limitations on access to the road could adversely affect operations at the mine. The safety of our workforce is a critical concern, and PT Freeport Indonesia is working cooperatively with the Indonesian government to address security issues. Refer to "Risk Factors" contained in Part I, Item 1A of our annual report on Form 10-K for the year ended
December 31, 2012
, for further discussion.
90
Operating Data.
Following is summary operating data for our Indonesia mining operations for the years ended December 31.
|
|
2012
|
|
2011
|
|
2010
|
||||||
|
Operating Data, Net of Joint Venture Interest
|
|
|
|
||||||||
|
Copper
(millions of recoverable pounds)
|
|
|
|
||||||||
|
Production
|
695
|
|
846
|
|
1,222
|
|
|||||
|
Sales
|
716
|
|
846
|
|
1,214
|
|
|||||
|
Average realized price per pound
|
$
|
3.58
|
|
$
|
3.85
|
|
$
|
3.69
|
|
||
|
Gold
(thousands of recoverable ounces)
|
|
|
|
||||||||
|
Production
|
862
|
|
1,272
|
|
1,786
|
|
|||||
|
Sales
|
915
|
|
1,270
|
|
1,765
|
|
|||||
|
Average realized price per ounce
|
$
|
1,664
|
|
$
|
1,583
|
|
$
|
1,271
|
|
||
|
100% Operating Data
|
|
|
|
||||||||
|
Ore milled (metric tons per day):
a
|
|
|
|
||||||||
|
Grasberg open pit
|
118,800
|
|
112,900
|
|
149,800
|
|
|||||
|
DOZ underground mine
b
|
44,600
|
|
51,700
|
|
79,600
|
|
|||||
|
Big Gossan underground mine
c
|
1,600
|
|
1,500
|
|
800
|
|
|||||
|
Total
|
165,000
|
|
166,100
|
|
230,200
|
|
|||||
|
Average ore grade:
|
|
|
|
||||||||
|
Copper (percent)
|
0.62
|
|
0.79
|
|
0.85
|
|
|||||
|
Gold (grams per metric ton)
|
0.59
|
|
0.93
|
|
0.90
|
|
|||||
|
Recovery rates (percent):
|
|||||||||||
|
Copper
|
88.7
|
|
88.3
|
|
88.9
|
|
|||||
|
Gold
|
75.7
|
|
81.2
|
|
81.7
|
|
|||||
|
Production (recoverable):
|
|||||||||||
|
Copper (millions of pounds)
|
695
|
|
882
|
|
1,330
|
|
|||||
|
Gold (thousands of ounces)
|
862
|
|
1,444
|
|
1,964
|
|
|||||
|
a.
|
Amounts represent the approximate average daily throughput processed at PT Freeport Indonesia’s mill facilities from each producing mine.
|
|
b.
|
Production from the DOZ underground mine is expected to ramp up to the design rate of 80,000 metric tons of ore per day by year end 2013, following completion of ongoing panel repairs resulting from the temporary shutdown and suspension of operations in fourth-quarter 2011 and early 2012.
|
|
c.
|
Production from the Big Gossan underground mine is expected to ramp up to 7,000 metric tons of ore per day in 2014.
|
2012
Compared with
2011
Sales volumes from our Indonesia mining operations declined to
716 million
pounds of copper and
915 thousand
ounces of gold in
2012
, compared with
846 million
pounds of copper and
1.3 million
ounces of gold in
2011
. Lower copper and gold sales volumes in
2012
primarily reflected lower ore grades.
At the Grasberg mine, the sequencing of mining areas with varying ore grades causes fluctuations in the timing of ore production resulting in varying quarterly and annual sales of copper and gold. Consolidated sales volumes from our Indonesia mining operations are expected to approximate
1.1 billion
pounds of copper and
1.2 million
ounces of gold for
2013
. We expect sales from Indonesia to increase in fourth-quarter
2013
as PT Freeport Indonesia gains access to higher ore grades and achieves the targeted ramp up in production from the DOZ mine. Approximately 33 percent of projected copper sales and 38 percent of projected gold sales from our Indonesia mining operations are currently expected in fourth-quarter 2013.
2011
Compared with
2010
Sales volumes from our Indonesia mining operations declined to
846 million
pounds of copper and
1.3 million
ounces of gold in
2011
, compared with
1.2 billion
pounds of copper and
1.8 million
ounces of gold in
2010
. Lower copper and gold sales volumes in
2011
primarily reflected the impact of labor-related disruptions and the temporary suspension of milling operations in fourth-quarter 2011 because of damage to the concentrate pipelines.
91
Unit Net Cash Costs.
Unit net cash costs per pound of copper is a measure intended to provide investors with information about the cash-generating capacity of our mining operations expressed on a basis relating to the primary metal product for our respective operations. We use this measure for the same purpose and for monitoring operating performance by our mining operations. This information differs from measures of performance determined in accordance with U.S. GAAP and should not be considered in isolation or as a substitute for measures of performance determined in accordance with U.S. GAAP. This measure is presented by other metal mining companies, although our measure may not be comparable to similarly titled measures reported by other companies.
Gross Profit per Pound of Copper/per Ounce of Gold
The following tables summarize the unit net cash costs (credits) and gross profit per pound of copper and per ounce of gold at our Indonesia mining operations for the years ended December 31. Refer to “Production Revenues and Production Costs” for an explanation of “by-product” and “co-product” methods and a reconciliation of unit net cash costs (credits) per pound to production and delivery costs applicable to sales reported in our consolidated financial statements.
|
|
2012
|
2011
|
|||||||||||||||||||||
|
|
By-
|
Co-Product Method
|
By-
|
Co-Product Method
|
|||||||||||||||||||
|
Product
Method
|
Copper
|
Gold
|
Product
Method
|
Copper
|
Gold
|
||||||||||||||||||
|
Revenues, excluding adjustments
|
$
|
3.58
|
|
$
|
3.58
|
|
$
|
1,664
|
|
$
|
3.85
|
|
$
|
3.85
|
|
$
|
1,583
|
|
|||||
|
Site production and delivery, before net noncash
|
|
|
|
|
|
|
|||||||||||||||||
|
and other costs shown below
|
3.12
|
|
1.93
|
|
894
|
|
2.21
|
|
a
|
1.34
|
|
551
|
|
||||||||||
|
Gold and silver credits
|
(2.22
|
)
|
—
|
|
—
|
|
(2.47
|
)
|
—
|
|
—
|
|
|||||||||||
|
Treatment charges
|
0.21
|
|
0.13
|
|
61
|
|
0.19
|
|
0.11
|
|
46
|
|
|||||||||||
|
Royalty on metals
|
0.13
|
|
0.08
|
|
38
|
|
0.16
|
|
0.10
|
|
41
|
|
|||||||||||
|
Unit net cash costs
|
1.24
|
|
2.14
|
|
993
|
|
0.09
|
|
1.55
|
|
638
|
|
|||||||||||
|
Depreciation and amortization
|
0.30
|
|
0.18
|
|
85
|
|
0.25
|
|
0.16
|
|
63
|
|
|||||||||||
|
Noncash and other costs, net
|
0.11
|
|
0.07
|
|
33
|
|
0.04
|
|
0.02
|
|
10
|
|
|||||||||||
|
Total unit costs
|
1.65
|
|
2.39
|
|
1,111
|
|
0.38
|
|
1.73
|
|
711
|
|
|||||||||||
|
Revenue adjustments, primarily for pricing on
|
|||||||||||||||||||||||
|
prior period open sales
|
0.02
|
|
0.02
|
|
3
|
|
(0.01
|
)
|
(0.01
|
)
|
(13
|
)
|
|||||||||||
|
PT Smelting intercompany profit
|
(0.05
|
)
|
(0.03
|
)
|
(15
|
)
|
0.13
|
|
0.08
|
|
32
|
|
|||||||||||
|
Gross profit per pound/ounce
|
$
|
1.90
|
|
$
|
1.18
|
|
$
|
541
|
|
$
|
3.59
|
|
$
|
2.19
|
|
$
|
891
|
|
|||||
|
Copper sales (millions of recoverable pounds)
|
716
|
|
716
|
|
|
846
|
|
846
|
|
|
|||||||||||||
|
Gold sales (thousands of recoverable ounces)
|
|
|
915
|
|
|
|
1,270
|
|
|||||||||||||||
|
a.
|
Includes
$66 million
($0.08 per pound) for bonuses and other strike-related costs.
|
Because of the fixed nature of a large portion of PT Freeport Indonesia's costs, unit costs vary from period to period depending on volumes of copper and gold sold, as well as average realized gold prices during the period. Unit net cash costs (net of gold and silver credits) for our Indonesia mining operations averaged
$1.24
per pound of copper in
2012
, compared with
$0.09
per pound in
2011
. Higher unit net cash costs primarily reflected lower copper and gold sales volumes.
Treatment charges vary with the volume of metals sold and the price of copper, and royalties vary with the volume of metals sold and the prices of copper and gold.
Because certain assets are depreciated on a straight-line basis, PT Freeport Indonesia’s unit depreciation rate
varies with asset additions and the level of copper production and sales.
Revenue adjustments primarily result from changes in prices on provisionally priced copper sales recognized in prior years. Refer to “Consolidated Results - Revenues” for further discussion of adjustments to prior year provisionally priced copper sales.
Assuming achievement of current sales volume and cost estimates, and an average gold price of
$1,700
per ounce for
2013
, we estimate that average unit net cash costs for Indonesia (net of gold and silver credits) would approximate
$0.68
per pound of copper for the year
2013
. Indonesia's unit net cash costs for
2013
would change by
$0.055
per pound for each
$50
per ounce change in the average price of gold during
2013
. Quarterly unit net
92
cash costs are expected to vary significantly with variations in quarterly metal sales volumes, as well as average realized gold prices during the period. Indonesia's unit net cash costs for first-quarter
2013
are expected to approximate $1.57 per pound of copper and are expected to be lower in future periods as volumes increase.
|
|
2011
|
2010
|
|||||||||||||||||||||
|
|
By-
|
Co-Product Method
|
By-
|
Co-Product Method
|
|||||||||||||||||||
|
Product
Method
|
Copper
|
Gold
|
Product
Method
|
Copper
|
Gold
|
||||||||||||||||||
|
Revenues, excluding adjustments
|
$
|
3.85
|
|
$
|
3.85
|
|
$
|
1,583
|
|
$
|
3.69
|
|
$
|
3.69
|
|
$
|
1,271
|
|
|||||
|
Site production and delivery, before net noncash
|
|
|
|
|
|
|
|||||||||||||||||
|
and other costs shown below
|
2.21
|
|
a
|
1.34
|
|
551
|
|
1.53
|
|
1.01
|
|
347
|
|
||||||||||
|
Gold and silver credits
|
(2.47
|
)
|
—
|
|
—
|
|
(1.92
|
)
|
—
|
|
—
|
|
|||||||||||
|
Treatment charges
|
0.19
|
|
0.11
|
|
46
|
|
0.22
|
|
0.15
|
|
50
|
|
|||||||||||
|
Royalty on metals
|
0.16
|
|
0.10
|
|
41
|
|
0.13
|
|
0.08
|
|
29
|
|
|||||||||||
|
Unit net cash costs (credits)
|
0.09
|
|
1.55
|
|
638
|
|
(0.04
|
)
|
1.24
|
|
426
|
|
|||||||||||
|
Depreciation and amortization
|
0.25
|
|
0.16
|
|
63
|
|
0.21
|
|
0.14
|
|
48
|
|
|||||||||||
|
Noncash and other costs, net
|
0.04
|
|
0.02
|
|
10
|
|
0.04
|
|
0.02
|
|
9
|
|
|||||||||||
|
Total unit costs
|
0.38
|
|
1.73
|
|
711
|
|
0.21
|
|
1.40
|
|
483
|
|
|||||||||||
|
Revenue adjustments, primarily for pricing on
|
|||||||||||||||||||||||
|
prior period open sales
|
(0.01
|
)
|
(0.01
|
)
|
(13
|
)
|
(0.01
|
)
|
(0.01
|
)
|
1
|
|
|||||||||||
|
PT Smelting intercompany profit
|
0.13
|
|
0.08
|
|
32
|
|
(0.03
|
)
|
(0.02
|
)
|
(8
|
)
|
|||||||||||
|
Gross profit per pound/ounce
|
$
|
3.59
|
|
$
|
2.19
|
|
$
|
891
|
|
$
|
3.44
|
|
$
|
2.26
|
|
$
|
781
|
|
|||||
|
Copper sales (millions of recoverable pounds)
|
846
|
|
846
|
|
|
1,214
|
|
1,214
|
|
|
|||||||||||||
|
Gold sales (thousands of recoverable ounces)
|
|
|
1,270
|
|
|
|
1,765
|
|
|||||||||||||||
|
a.
|
Includes
$66 million
($0.08 per pound) for bonuses and other strike-related costs.
|
Unit net cash costs (net of gold and silver credits) for our Indonesia mining operations averaged
$0.09
per pound of copper in
2011
, compared with a net credit of
$0.04
per pound in
2010
. Higher unit net cash costs primarily reflected lower copper sales volumes and the impact of bonuses and other strike-related costs, partially offset by higher gold and silver credits.
Africa Mining
Africa mining includes TFM's Tenke minerals district. We hold an effective 56 percent interest in the Tenke copper and cobalt mining concessions in the Katanga province of the DRC and are the operator of TFM. As further discussed in Note
14
, effective March 26, 2012, the DRC government issued a Presidential Decree approving modifications to TFM's bylaws, and our and Lundin Mining Corporation's ownership interest in TFM totals 80 percent (previously 82.5 percent) and La Générale des Carrières et des Mines' (Gécamines) ownership interest totals 20 percent (previously 17.5 percent).
The Tenke operation includes surface mining, leaching and SX/EW operations. Copper production from the Tenke minerals district is sold as copper cathode. In addition to copper, the Tenke minerals district produces cobalt hydroxide.
Refer to "Risk Factors" contained in Part I, Item 1A of our annual report on Form 10-K for the year ended
December 31, 2012
, for discussion of risks associated with operations in Africa.
Operating and Development Activities.
Our investment in the initial project approximated $2 billion, and we have received intercompany loan repayments, including interest, of approximately $840 million through
December 31, 2012
.
An expansion of the project to optimize the current plant and increase capacity was substantially completed in 2012. The expanded mill is capable of throughput of 14,000 metric tons of ore per day, and expanded processing facilities will enable the addition of approximately 150 million pounds of copper production per year. The approximate $850 million expansion project is being completed within budget and included mill upgrades, additional mining equipment, a new tankhouse and an additional sulphuric acid plant (which is expected to be completed in 2015). This expansion project was funded primarily with cash generated from operations.
93
We continue to engage in drilling activities, exploration analyses and metallurgical testing to evaluate the potential of the highly prospective minerals district at Tenke. These analyses are being incorporated in future plans to evaluate opportunities for expansion. Future expansions are subject to a number of factors, including economic and market conditions and the business and investment climate in the DRC.
Operating Data.
Following is summary operating data for our Africa mining operations for the years ended December 31.
|
|
2012
|
2011
|
2010
|
|||||||||
|
Copper
(millions of recoverable pounds)
|
|
|
|
|||||||||
|
Production
|
348
|
|
281
|
|
265
|
|
|
|||||
|
Sales
|
336
|
|
283
|
|
262
|
|
|
|||||
|
Average realized price per pound
a
|
$
|
3.51
|
|
$
|
3.74
|
|
$
|
3.45
|
|
|
||
|
Cobalt
(millions of recoverable pounds)
|
|
|
|
|||||||||
|
Production
|
26
|
|
25
|
|
20
|
|
||||||
|
Sales
|
25
|
|
25
|
|
20
|
|
||||||
|
Average realized price per pound
|
$
|
7.83
|
|
$
|
9.99
|
|
$
|
10.95
|
|
|||
|
Ore milled (metric tons per day)
|
13,000
|
|
11,100
|
|
10,300
|
|
|
|||||
|
Average ore grade (percent):
|
|
|||||||||||
|
Copper
|
3.62
|
|
3.41
|
|
3.51
|
|
|
|||||
|
Cobalt
|
0.37
|
|
0.40
|
|
0.40
|
|
||||||
|
Copper recovery rate (percent)
|
92.4
|
|
92.5
|
|
91.4
|
|
|
|||||
|
a.
|
Includes point-of-sale transportation costs as negotiated in customer contracts.
|
2012
Compared with
2011
During 2012, Tenke achieved record mining, milling and production rates. Copper sales volumes from our Africa mining operations increased to
336 million
pounds of copper in
2012
, compared with
283 million
pounds of copper in
2011
, primarily reflecting higher mining and milling rates principally related to the ramp-up of the expansion project.
Consolidated sales volumes from our Africa mining operations are expected to approximate
410 million
pounds of copper and
30 million
pounds of cobalt in
2013
.
2011
Compared with
2010
Copper sales volumes from our Africa mining operations increased to
283 million
pounds of copper in
2011
, compared with
262 million
pounds of copper in
2010
, primarily reflecting higher production in
2011
.
Unit Net Cash Costs.
Unit net cash costs per pound of copper is a measure intended to provide investors with information about the cash-generating capacity of our mining operations expressed on a basis relating to the primary metal product for our respective operations. We use this measure for the same purpose and for monitoring operating performance by our mining operations. This information differs from measures of performance determined in accordance with U.S. GAAP and should not be considered in isolation or as a substitute for measures of performance determined in accordance with U.S. GAAP. This measure is presented by other metals mining companies, although our measure may not be comparable to similarly titled measures reported by other companies.
94
Gross Profit per Pound of Copper and Cobalt
The following tables summarize the unit net cash costs and gross profit per pound of copper and cobalt at our Africa mining operations for the years ended December 31. Refer to “Production Revenues and Production Costs” for an explanation of “by-product” and “co-product” methods and a reconciliation of unit net cash costs per pound to production and delivery costs applicable to sales reported in our consolidated financial statements.
|
|
2012
|
2011
|
|||||||||||||||||||||
|
|
By-Product
|
|
Co-Product Method
|
By-Product
|
Co-Product Method
|
||||||||||||||||||
|
|
Method
|
|
Copper
|
Cobalt
|
Method
|
Copper
|
Cobalt
|
||||||||||||||||
|
Revenues, excluding adjustments
a
|
$
|
3.51
|
|
$
|
3.51
|
|
$
|
7.83
|
|
$
|
3.74
|
|
$
|
3.74
|
|
$
|
9.99
|
|
|||||
|
Site production and delivery, before net noncash
|
|
|
|
|
|||||||||||||||||||
|
and other costs shown below
|
1.49
|
|
1.39
|
|
4.86
|
|
1.57
|
|
1.39
|
|
5.58
|
|
|||||||||||
|
Cobalt credits
b
|
(0.33
|
)
|
—
|
|
—
|
|
(0.58
|
)
|
—
|
|
—
|
|
|||||||||||
|
Royalty on metals
|
0.07
|
|
0.06
|
|
0.12
|
|
0.08
|
|
0.07
|
|
0.16
|
|
|||||||||||
|
Unit net cash costs
|
1.23
|
|
1.45
|
|
4.98
|
|
1.07
|
|
1.46
|
|
5.74
|
|
|||||||||||
|
Depreciation, depletion and amortization
|
0.52
|
|
0.47
|
|
0.67
|
|
0.50
|
|
0.42
|
|
0.78
|
|
|||||||||||
|
Noncash and other costs, net
|
0.09
|
|
0.08
|
|
0.11
|
|
0.20
|
|
0.18
|
|
0.32
|
|
|||||||||||
|
Total unit costs
|
1.84
|
|
2.00
|
|
5.76
|
|
1.77
|
|
2.06
|
|
6.84
|
|
|||||||||||
|
Revenue adjustments, primarily for pricing on
|
|||||||||||||||||||||||
|
prior period open sales
|
0.02
|
|
0.02
|
|
0.09
|
|
—
|
|
—
|
|
0.06
|
|
|||||||||||
|
Gross profit per pound
|
$
|
1.69
|
|
$
|
1.53
|
|
$
|
2.16
|
|
$
|
1.97
|
|
$
|
1.68
|
|
$
|
3.21
|
|
|||||
|
Copper sales (millions of recoverable pounds)
|
336
|
|
|
336
|
|
|
283
|
|
283
|
|
|||||||||||||
|
Cobalt sales (millions of contained pounds)
|
|
|
|
25
|
|
25
|
|
||||||||||||||||
|
a.
|
Includes point-of-sale transportation costs as negotiated in customer contracts.
|
|
b.
|
Net of cobalt downstream processing and freight costs.
|
Unit net cash costs (net of cobalt credits) for our Africa mining operations of
$1.23
per pound of copper in
2012
were higher than unit net cash costs of
$1.07
per pound of copper in
2011
primarily reflecting higher mining and input costs (including sulphuric acid and energy) and lower cobalt credits, partly offset by higher volumes.
Assuming achievement of current sales volume and cost estimates and an average cobalt price of
$12
per pound for
2013
, we estimate that average unit net cash costs (net of cobalt credits) would approximate
$1.03
per pound of copper in
2013
. Africa's unit net cash costs for
2013
would change by
$0.09
per pound for each
$2
per pound change in the average price of cobalt during
2013
.
|
|
2011
|
2010
|
|||||||||||||||||||||
|
|
By-Product
|
Co-Product Method
|
By-Product
|
Co-Product Method
|
|||||||||||||||||||
|
Method
|
Copper
|
Cobalt
|
Method
|
Copper
|
Cobalt
|
||||||||||||||||||
|
Revenues, excluding adjustments
a
|
$
|
3.74
|
|
$
|
3.74
|
|
$
|
9.99
|
|
$
|
3.45
|
|
$
|
3.45
|
|
$
|
10.95
|
|
|||||
|
Site production and delivery, before net noncash
|
|
|
|
||||||||||||||||||||
|
and other costs shown below
|
1.57
|
|
1.39
|
|
5.58
|
|
1.40
|
|
1.23
|
|
5.78
|
|
|||||||||||
|
Cobalt credits
b
|
(0.58
|
)
|
—
|
|
—
|
|
(0.58
|
)
|
—
|
|
—
|
|
|||||||||||
|
Royalty on metals
|
0.08
|
|
0.07
|
|
0.16
|
|
0.08
|
|
0.06
|
|
0.19
|
|
|||||||||||
|
Unit net cash costs
|
1.07
|
|
1.46
|
|
5.74
|
|
0.90
|
|
1.29
|
|
5.97
|
|
|||||||||||
|
Depreciation, depletion and amortization
|
0.50
|
|
0.42
|
|
0.78
|
|
0.49
|
|
0.41
|
|
1.03
|
|
|||||||||||
|
Noncash and other costs, net
|
0.20
|
|
0.18
|
|
0.32
|
|
0.19
|
|
0.17
|
|
0.39
|
|
|||||||||||
|
Total unit costs
|
1.77
|
|
2.06
|
|
6.84
|
|
1.58
|
|
1.87
|
|
7.39
|
|
|||||||||||
|
Revenue adjustments, primarily for pricing on
|
|||||||||||||||||||||||
|
prior period open sales
|
—
|
|
—
|
|
0.06
|
|
—
|
|
—
|
|
0.18
|
|
|||||||||||
|
Gross profit per pound
|
$
|
1.97
|
|
$
|
1.68
|
|
$
|
3.21
|
|
$
|
1.87
|
|
$
|
1.58
|
|
$
|
3.74
|
|
|||||
|
Copper sales (millions of recoverable pounds)
|
283
|
|
283
|
|
262
|
|
262
|
|
|||||||||||||||
|
Cobalt sales (millions of contained pounds)
|
25
|
|
20
|
|
|||||||||||||||||||
|
a.
|
Includes point-of-sale transportation costs as negotiated in customer contracts.
|
95
|
b.
|
Net of cobalt downstream processing and freight costs.
|
Unit net cash costs (net of cobalt credits) for our Africa mining operations of
$1.07
per pound of copper in
2011
were higher than unit net cash costs of
$0.90
per pound of copper in
2010
reflecting increased mining and milling activity and higher input costs.
Molybdenum
We are an integrated producer of molybdenum, with mining, sulfide ore concentrating, roasting and processing facilities that produce high-purity, molybdenum-based chemicals, molybdenum metal powder and metallurgical products, which are sold to customers around the world. Our molybdenum operations include the wholly owned Henderson underground mine and Climax open-pit mine in Colorado and related conversion facilities. The Henderson and Climax mines produce high-purity, chemical-grade molybdenum concentrates, which are typically further processed into value-added molybdenum chemical products. The Molybdenum operations also include a sales company that purchases and sells molybdenum from our primary molybdenum mines and from our North and South America copper mines that also produce molybdenum concentrates; and related conversion facilities that, at times, roast and/or process material on a toll basis for third parties.
Operating and Development Activities.
The Climax molybdenum mine was commissioned in second-quarter 2012, and includes a new 25,000 metric ton per day mill facility. Climax production in 2012 totaled
7 million
pounds of molybdenum and is targeted to produce 20 million pounds of molybdenum for 2013, with potential to produce 30 million pounds of molybdenum per year, depending on market conditions. We intend to operate our Climax and Henderson mines in a flexible manner to meet market requirements. The cost of the initial phase of the project approximated $760 million.
Operating Data.
Following is summary operating data for the Molybdenum operations for the years ended December 31.
|
|
2012
|
2011
|
2010
|
||||||||
|
Molybdenum
(millions of recoverable pounds)
|
|
|
|
||||||||
|
Production
a
|
41
|
|
38
|
|
40
|
|
|||||
|
Sales, excluding purchases
b
|
83
|
|
79
|
|
67
|
|
|||||
|
Average realized price per pound
|
$
|
14.26
|
|
$
|
16.98
|
|
$
|
16.47
|
|
||
|
Henderson molybdenum mine
|
|
|
|
||||||||
|
Ore milled (metric tons per day)
|
20,800
|
|
22,300
|
|
22,900
|
|
|||||
|
Average molybdenum ore grade (percent)
|
0.23
|
|
0.24
|
|
0.25
|
|
|||||
|
Molybdenum production (millions of recoverable pounds)
|
34
|
|
38
|
|
40
|
|
|||||
|
a.
|
The 2012 period includes production from the Climax molybdenum mine totaling
7 million
pounds reflecting production since the start of commercial operations in May 2012. The 2011 and 2010 periods reflect production only from the Henderson molybdenum mine.
|
|
b.
|
Includes sales of molybdenum produced at our North and South America copper mines.
|
2012
Compared with
2011
Consolidated molybdenum sales volumes increased to
83 million
pounds in
2012
, compared with
79 million
pounds for
2011
primarily reflecting the incremental production from the Climax molybdenum mine that began commercial operations in May 2012.
For the year
2013
, we expect molybdenum sales volumes to approximate
90 million
pounds, of which approximately
40 million
pounds represents production from our North and South America copper mines.
2011
Compared with
2010
Consolidated molybdenum sales volumes increased to
79 million
pounds in
2011
, compared with
67 million
pounds in
2010
,
primarily reflecting improved demand.
Unit Net Cash Costs.
Unit net cash costs per pound of molybdenum is a measure intended to provide investors with information about the cash-generating capacity of our mining operations expressed on a basis relating to the primary metal product for our respective operations. We use this measure for the same purpose and for monitoring operating performance by our mining operations. This information differs from measures of performance determined in accordance with U.S. GAAP and should not be considered in isolation or as a substitute for measures of
96
performance determined in accordance with U.S. GAAP. This measure is presented by other metals mining companies, although our measure may not be comparable to similarly titled measures reported by other companies.
Gross Profit per Pound of Molybdenum
The following table summarizes the unit net cash costs and gross profit per pound of molybdenum at our Henderson molybdenum mine for the years ended December 31. Refer to “Product Revenues and Production Costs” for a reconciliation of unit net cash costs per pound to production and delivery costs applicable to sales reported in our consolidated financial statements.
|
|
2012
|
2011
|
2010
|
|
||||||||
|
Revenues, excluding adjustments
|
$
|
14.27
|
|
$
|
16.42
|
|
$
|
15.89
|
|
|
||
|
Site production and delivery, before net noncash
|
|
|
|
|
||||||||
|
and other costs shown below
|
6.19
|
|
5.46
|
|
4.82
|
|
|
|||||
|
Treatment charges and other
|
0.88
|
|
0.88
|
|
1.08
|
|
|
|||||
|
Unit net cash costs
|
7.07
|
|
6.34
|
|
5.90
|
|
|
|||||
|
Depreciation, depletion and amortization
|
0.97
|
|
0.96
|
|
0.83
|
|
|
|||||
|
Noncash and other costs, net
|
0.24
|
|
0.04
|
|
0.03
|
|
||||||
|
Total unit costs
|
8.28
|
|
7.34
|
|
6.76
|
|
|
|||||
|
Gross profit per pound
a
|
$
|
5.99
|
|
$
|
9.08
|
|
$
|
9.13
|
|
|
||
|
Molybdenum sales (millions of recoverable pounds)
b
|
34
|
|
38
|
|
40
|
|
|
|||||
|
a.
|
Gross profit reflects sales of Henderson production to our molybdenum sales company based on volumes produced at market-based pricing. On a consolidated basis, the Molybdenum division includes profits on sales as they are made to third parties and realizations based on actual contract terms. As a result, the actual gross profit realized will differ from the amounts reported in this table.
|
|
b.
|
Reflects molybdenum produced by the Henderson molybdenum mine.
|
Henderson’s unit net cash costs were
$7.07
per pound of molybdenum in
2012
,
$6.34
per pound in
2011
and
$5.90
per pound in
2010
. Henderson's increased unit net cash costs year over year, primarily reflected lower production volumes and higher input costs.
Assuming achievement of current sales volume and cost estimates, we estimate unit net cash costs for primary molybdenum mines to average
$7.00
per pound of molybdenum in
2013
(reflecting approximately
$7.50
per pound for Henderson and
$6.50
per pound for Climax).
Atlantic Copper Smelting & Refining
Atlantic Copper, our wholly owned subsidiary located in Spain, smelts and refines copper concentrates and markets refined copper and precious metals in slimes. During
2012
, Atlantic Copper purchased approximately
31 percent
of its concentrate requirements from our South America mining operations, approximately
16 percent
from our North America copper mines and approximately
10 percent
from our Indonesia mining operations. Through this form of downstream integration, we are assured placement of a significant portion of our concentrate production.
Smelting and refining charges consist of a base rate and, in certain contracts, price participation based on copper prices. Treatment charges for smelting and refining copper concentrates represent a cost to our mining operations, and income to Atlantic Copper and PT Smelting. Thus, higher treatment and refining charges benefit our smelter operations and adversely affect our mining operations. Our North America copper mines are less significantly affected by changes in treatment and refining charges because these operations are largely integrated with our wholly owned smelter located in Miami, Arizona.
In May 2011, Atlantic Copper successfully completed a scheduled 26-day maintenance turnaround, which had a $30 million impact on production and delivery costs (refer to Note
17
for Atlantic Copper's operating results). Atlantic Copper's major maintenance turnarounds (which take approximately 50 days to complete) typically occur approximately every eight years, with short-term maintenance turnarounds in the interim. Atlantic Copper is planning a major maintenance turnaround in the second half of 2013.
We defer recognizing profits on sales from our mining operations to Atlantic Copper and on 25 percent of Indonesia mining sales to PT Smelting until final sales to third parties occur. Our net deferred profits on our inventories at
97
Atlantic Copper and PT Smelting to be recognized in future periods’ net income after taxes and noncontrolling interests totaled
$121 million
at
December 31, 2012
. Changes in these deferrals attributable to variability in intercompany volumes resulted in net reductions to net income attributable to common stockholders of
$80 million
(
$0.08
per share) in
2012
, compared with net additions of
$156 million
(
$0.16
per share) in
2011
and net reductions of
$67 million
(
$0.07
per share) in
2010
. Quarterly variations in ore grades, the timing of intercompany shipments and changes in product prices will result in variability in our net deferred profits and quarterly earnings.
CAPITAL RESOURCES AND LIQUIDITY
Our operating cash flows vary with prices realized from copper, gold and molybdenum sales, our sales volumes, production costs, income taxes, other working capital changes and other factors. Strong operating performance and favorable copper and gold prices have enabled us to enhance our financial and liquidity position, reduce debt and pay cash dividends to shareholders, while pursuing growth opportunities. We view the long-term outlook for our business positively, supported by limitations on supplies of copper and by the requirements for copper in the world’s economy, and will continue to adjust our operating strategy as market conditions change. The discussion of our capital resources and liquidity below does not reflect pending acquisitions (refer to Note 20 for further discussion of financing for the pending acquisitions of PXP and MMR).
Cash and Debt
At
December 31, 2012
, we had consolidated cash and cash equivalents of
$3.7 billion
. The following table reflects the U.S. and international components of consolidated cash and cash equivalents at
December 31, 2012
and
2011
(in billions):
|
|
2012
|
2011
|
|||||
|
Cash at domestic companies
a
|
$
|
1.3
|
|
$
|
2.4
|
|
|
|
Cash at international operations
|
2.4
|
|
2.4
|
|
|||
|
Total consolidated cash and cash equivalents
|
3.7
|
|
4.8
|
|
|||
|
Less: Noncontrolling interests’ share
|
(0.8
|
)
|
(0.8
|
)
|
|||
|
Cash, net of noncontrolling interests’ share
|
2.9
|
|
4.0
|
|
|||
|
Less: Withholding taxes and other
|
(0.2
|
)
|
(0.1
|
)
|
|||
|
Net cash available
|
$
|
2.7
|
|
$
|
3.9
|
|
|
|
a.
|
Includes cash at the parent company and our North America operations.
|
Cash held at our international operations is generally used to support our foreign operations' capital expenditures, operating expenses, working capital and other tax payments or other cash needs. At
December 31, 2012
, management believed that sufficient liquidity was available in the U.S. With the exception of TFM, we have not elected to permanently reinvest earnings from our foreign subsidiaries, and we have recorded deferred tax liabilities for foreign earnings that are available to be repatriated to the U.S. From time to time, our foreign subsidiaries distribute earnings to the U.S. through dividends that are subject to applicable withholding taxes and noncontrolling interests' share.
Total debt was
$3.5 billion
at
December 31, 2012
and
2011
, and
$4.8 billion
at
December 31, 2010
. We have a senior unsecured revolving credit facility, which is available until March 30, 2016, in an aggregate principal amount of
$1.5 billion
, with
$500 million
available to PT Freeport Indonesia. At
December 31, 2012
, we had
no
borrowings and
$43 million
of letters of credit issued under the facilities, resulting in availability of approximately
$1.5 billion
(
$957 million
of which could be used for additional letters of credit). The revolving credit facility contains covenants that are typical for investment-grade companies, including limitations on liens and subsidiary debt (see Note
9
for further discussion).
In February 2013, we entered into a new senior unsecured revolving credit facility, which will refinance and replace our existing revolving credit facility upon completion of the proposed acquisition of PXP. No amounts are currently available to us under the new revolving credit facility. Refer to Note 20 for further discussion.
Operating Activities
During
2012
, we generated operating cash flows totaling
$3.8 billion
, net of
$1.4 billion
for working capital uses and other tax payments. Operating cash flows in
2011
totaled
$6.6 billion
, net of
$461 million
for working capital uses and other tax payments. Operating cash flows in
2010
totaled
$6.3 billion
, net of
$834 million
for working capital uses and other tax payments.
98
Lower operating cash flows for
2012
, compared with
2011
, primarily reflected lower copper and gold sales volumes, lower copper price realizations and an increase in working capital uses and other tax payments, primarily associated with changes in accounts receivable, partly offset by timing of payments for accounts payable and accrued liabilities. As discussed in "Consolidated Results - Revenues," substantially all of our copper concentrate and cathode sales contracts are provisionally priced; accordingly, the period-end forward price is a major determinate of recorded revenues and the resulting receivables. At
December 31, 2012
, our provisionally priced copper sales were recorded at an average of
$3.59
per pound of copper, compared with
$3.44
per pound at
December 31, 2011
.
Higher operating cash flows for
2011
, compared with
2010
, primarily reflected a decrease in working capital uses and other tax payments, primarily associated with decreases in accounts receivable (at
December 31, 2011
, our provisionally priced copper sales were recorded at an average of
$3.44
per pound of copper, compared with $4.36 per pound at
December 31, 2010
), partly offset by higher tax payments and the timing of payments for accounts payable and accrued liabilities.
Excluding impacts for pending acquisitions, and based on current mine plans and subject to future copper, gold and molybdenum prices, we expect estimated operating cash flows for the year
2013
plus available cash to be sufficient to fund our budgeted capital expenditures, dividends, noncontrolling interest distributions and other cash requirements for the year. Refer to “Outlook” for further discussion of projected operating cash flows for the year
2013
.
Investing Activities
Capital Expenditures.
Capital expenditures, including capitalized interest, totaled
$3.5 billion
in
2012
(including $2.2 billion for major projects),
$2.5 billion
in
2011
(including $1.4 billion for major projects) and
$1.4 billion
in
2010
(including $0.7 billion for major projects). The increase in capital expenditures in
2012
, compared with
2011
, primarily reflected higher capital spending associated with the expansion projects at Tenke, Cerro Verde and Morenci, and the underground development projects at Grasberg. The increase in capital expenditures in
2011
, compared with
2010
, primarily reflected higher capital spending for construction on the Climax molybdenum mine, the underground development projects at Grasberg and the expansion project at Tenke.
Excluding amounts for pending acquisitions, capital expenditures for the year
2013
are expected to approximate
$4.6 billion
, including
$2.8 billion
for major projects and
$1.8 billion
for sustaining capital. Major projects for 2013 primarily include underground development activities at Grasberg and the expansion projects at Cerro Verde and Morenci. We are also considering additional investments at several of our sites. Capital spending plans will continue to be reviewed and adjusted in response to changes in market conditions and other factors. Refer to “Operations” for further discussion.
Investment in MMR.
In December 2010, we completed the purchase of 500,000 shares of MMR’s 5.75% Convertible Perpetual Preferred Stock for an aggregate purchase price of $500 million. Dividends received in 2012 and 2011 were recorded as a return of investment because of MMR's reported losses. Refer to Note
6
for further discussion and to Note 1 for discussion of the proposed acquisition of MMR.
Financing Activities
Debt Transactions.
In February 2012, we sold $3.0 billion in senior notes in three tranches with a weighted-average interest rate of approximately three percent. Net proceeds from this offering, plus cash on hand, were used to redeem the remaining $3.0 billion of our 8.375% Senior Notes.
During 2011, we redeemed the remaining $1.1 billion of our outstanding 8.25% Senior Notes. In addition, we made open-market purchases of
$35 million
of our 9.5% Senior Notes and repaid the remaining $84 million of our 8.75% Senior Notes.
During 2010, we redeemed all of our $1 billion Senior Floating Rate Notes, and also made open-market purchases of
$565 million
of our senior notes.
Refer to Note
9
for further discussion of these debt repayment transactions.
99
Dividends and Other Equity Transactions.
We paid dividends on our common stock totaling
$1.1 billion
in
2012
,
$1.4 billion
in
2011
(including $474 million for a supplemental dividend on our common stock paid in June 2011) and
$885 million
in
2010
(including $472 million for a supplemental dividend on our common stock paid in December 2010).
The current annual dividend rate for our common stock is $1.25 per share (
$0.3125
per share quarterly). Refer to Note
11
for further discussion. The declaration of dividends is at the discretion of the Board and will depend upon our financial results, cash requirements, future prospects, the impact of proposed acquisitions and other factors deemed relevant by the Board. The Board will continue to review our financial policy on an ongoing basis.
During 2010, our 6¾% Mandatory Convertible Preferred Stock converted into 78.9 million shares of our common stock (refer to Note
11
for further discussion). As a result, we no longer have requirements to pay preferred stock dividends. Preferred stock dividends paid totaled $95 million in 2010.
Cash dividends and other distributions paid to noncontrolling interests totaled
$113 million
in
2012
,
$391 million
in
2011
and
$816 million
in
2010
, reflecting dividends and distributions paid to the noncontrolling interest owners of PT Freeport Indonesia and our South America mines. Lower noncontrolling interest payments in 2012 compared with 2011, primarily reflected lower dividends to the noncontrolling interest holders of PT Freeport Indonesia as a result of lower production in 2012. Lower noncontrolling interest payments in 2011, compared with 2010, primarily reflected lower dividends to the noncontrolling interest holders of Cerro Verde related to capital retained for the expansion project.
CONTRACTUAL OBLIGATIONS
We have contractual and other long-term obligations, including debt maturities, which we expect to fund with available cash, projected operating cash flows, availability under our revolving credit facility or future financing transactions, if necessary. A summary of these various obligations at
December 31, 2012
, follows (in millions):
|
Total
|
2013
|
2014 to
2015
|
2016 to
2017
|
Thereafter
|
|||||||||||||||
|
Reclamation and environmental obligations
a
|
$
|
5,243
|
|
$
|
246
|
|
$
|
471
|
|
$
|
329
|
|
$
|
4,197
|
|
||||
|
Debt maturities
|
3,527
|
|
2
|
|
500
|
|
500
|
|
2,525
|
|
|||||||||
|
Take-or-pay contracts
b
|
2,200
|
|
976
|
|
731
|
|
286
|
|
207
|
|
|||||||||
|
Scheduled interest payment obligations
c
|
1,289
|
|
121
|
|
241
|
|
226
|
|
701
|
|
|||||||||
|
Operating lease obligations
|
205
|
|
32
|
|
38
|
|
31
|
|
104
|
|
|||||||||
|
Total
d
|
$
|
12,464
|
|
$
|
1,377
|
|
$
|
1,981
|
|
$
|
1,372
|
|
$
|
7,734
|
|
||||
|
a.
|
Represents estimated cash payments, on an undiscounted and unescalated basis, associated with reclamation and environmental activities. The timing and the amount of these payments could change as a result of changes in regulatory requirements, changes in scope and timing of reclamation activities, the settlement of environmental matters and as actual spending occurs. Refer to Note
13
for additional discussion of environmental and reclamation matters.
|
|
b.
|
Represents contractual obligations for purchases of goods or services that are defined by us as agreements that are enforceable and legally binding and that specify all significant terms. Take-or-pay contracts primarily comprise the procurement of copper concentrates (
$799 million
), electricity (
$524 million
) and transportation services (
$448 million
). Some of our take-or-pay contracts are settled based on the prevailing market rate for the service or commodity purchased, and in some cases, the amount of the actual obligation may change over time because of market conditions. Obligations for copper concentrates provide for deliveries of specified volumes to Atlantic Copper at market-based prices. Electricity obligations are primarily for contractual minimum demand at the South America and Tenke mines. Transportation obligations are primarily for South America contracted ocean freight and for North America rail freight.
|
|
c.
|
Scheduled interest payment obligations were calculated using stated coupon rates for fixed-rate debt and interest rates applicable at
December 31, 2012
, for variable-rate debt.
|
|
d.
|
This table excludes certain other obligations in our consolidated balance sheets, including estimated funding for pension obligations as the funding may vary from year to year based on changes in the fair value of plan assets and actuarial assumptions, accrued liabilities totaling
$107 million
that relate to unrecognized tax benefits where the timing of settlement is not determinable; Atlantic Copper's obligations for retired employees totaling $38 million (refer to Note
10
); and PT Freeport Indonesia's reclamation and closure cash fund obligation totaling $17 million (refer to Note
13
).This table also excludes purchase orders for the purchase of inventory and other goods and services, as purchase orders typically represent authorizations to purchase rather than binding agreements.
|
100
In addition to our debt maturities and other contractual obligations discussed above, we have other commitments, which we expect to fund with available cash, projected operating cash flows, available credit facilities or future financing transactions, if necessary. These include (i) PT Freeport Indonesia’s commitment to provide one percent of its annual revenue for the development of the local people in its area of operations through the Freeport Partnership Fund for Community Development, (ii) TFM's commitment to provide 0.3 percent of its annual revenue for the development of the local people in its area of operations and (iii) other commercial commitments, including standby letters of credit, surety bonds and guarantees. Refer to Notes
13
and
14
for further discussion.
CONTINGENCIES
Environmental
The cost of complying with environmental laws is a fundamental and substantial cost of our business. At
December 31, 2012
, we had
$1.2 billion
recorded in our consolidated balance sheets for environmental obligations attributed to CERCLA or analogous state programs and for estimated future costs associated with environmental obligations that are considered probable based on specific facts and circumstances.
During
2012
, we incurred environmental capital expenditures and other environmental costs (including our joint venture partners’ shares) of
$612 million
for programs to comply with applicable environmental laws and regulations that affect our operations, compared to
$387 million
in
2011
and
$372 million
in
2010
. The increase in environmental costs in 2012, compared with 2011 and 2010, primarily relates to higher expenditures for land and settlements of environmental matters (see Note
13
for further discussion). For
2013
, we expect to incur approximately
$600 million
of aggregate environmental capital expenditures and other environmental costs, which are part of our overall
2013
operating budget. The timing and amount of estimated payments could change as a result of changes in regulatory requirements, changes in scope and timing of reclamation activities, the settlement of environmental matters and as actual spending occurs.
Refer to Note
13
for further information about environmental regulation, including significant environmental matters.
Asset Retirement Obligations
We recognize AROs as liabilities when incurred, with the initial measurement at fair value. These obligations, which are initially estimated based on discounted cash flow estimates, are accreted to full value over time through charges to income. Reclamation costs for disturbances are recorded as an ARO in the period of disturbance. Our cost estimates are reflected on a third-party cost basis and comply with our legal obligation to retire tangible, long-lived assets. At
December 31, 2012
, we had
$1.1 billion
recorded in our consolidated balance sheets for AROs. Spending on AROs totaled
$47 million
in
2012
,
$49 million
in
2011
and
$38 million
in
2010
. For
2013
, we expect to incur approximately
$55 million
for aggregate ARO payments. Refer to Note
13
for further discussion of reclamation and closure costs.
Litigation and Other Contingencies
Refer to Note
13
and "Legal Proceedings" contained in Part I, Item 3 of our annual report on Form 10-K for the year ended
December 31, 2012
, for further discussion of contingencies associated with legal proceedings and other matters.
DISCLOSURES ABOUT MARKET RISKS
Commodity Price Risk
Our consolidated revenues include the sale of copper concentrates, copper cathodes, copper rod, gold, molybdenum and other metals by our North and South America mines, the sale of copper concentrates (which also contain significant quantities of gold and silver) by our Indonesia mining operations, the sale of copper cathodes and cobalt hydroxide by our Africa mining operations, the sale of molybdenum in various forms by our molybdenum operations, and the sale of copper cathodes, copper anodes and gold in anodes and slimes by Atlantic Copper. Our financial results can vary significantly as a result of fluctuations in the market prices of copper, gold, molybdenum, silver and cobalt. World market prices for these commodities have fluctuated historically and are affected by numerous factors beyond our control. Because we cannot control the price of our products, the key measures that management focuses on in operating our business are sales volumes, unit net cash costs and operating cash flow. Refer to “Outlook” for further discussion of projected sales volumes, unit net cash costs and operating cash flows for
2013
.
101
For
2012
,
46 percent
of our mined copper was sold in concentrate,
28 percent
as cathode and
26 percent
as rod from our North America operations. Substantially all of our copper concentrate and cathode sales contracts provide final copper pricing in a specified future month (generally one to four months from the shipment date) based primarily on quoted LME monthly average spot copper prices. We receive market prices based on prices in the specified future period, which results in price fluctuations recorded through revenues until the date of settlement. We record revenues and invoice customers at the time of shipment based on then-current LME prices, which results in an embedded derivative on our provisionally priced concentrate and cathode sales that is adjusted to fair value through earnings each period, using the period-end forward prices, until the date of final pricing. To the extent final prices are higher or lower than what was recorded on a provisional basis, an increase or decrease to revenues is recorded each reporting period until the date of final pricing. Accordingly, in times of rising copper prices, our revenues benefit from adjustments to the final pricing of provisionally priced sales pursuant to contracts entered into in prior periods; in times of falling copper prices, the opposite occurs.
Following are the favorable (unfavorable) impacts of net adjustments to the prior years' provisionally priced copper sales for the years ended December 31 (in millions, except per share amounts):
|
|
2012
|
|
2011
|
|
2010
|
|
||||||
|
Revenues
|
$
|
101
|
|
$
|
(12
|
)
|
$
|
(24
|
)
|
|
||
|
Net income attributable to FCX common stockholders
|
$
|
43
|
|
$
|
(5
|
)
|
$
|
(10
|
)
|
|||
|
Net income per share of FCX common stock
|
$
|
0.05
|
|
$
|
(0.01
|
)
|
$
|
(0.01
|
)
|
|||
At
December 31, 2012
, we had provisionally priced copper sales at our copper mining operations, primarily South America and Indonesia, totaling
341 million
pounds of copper (net of intercompany sales and noncontrolling interests) recorded at an average price of
$3.59
per pound, subject to final pricing over the next several months. We estimate that each $0.05 change in the price realized from the
December 31, 2012
, provisional price recorded would have a net impact on our
2013
consolidated revenues of approximately
$24 million
(
$11 million
to net income attributable to common stockholders). The LME spot copper price closed at
$3.72
per pound on
February 15, 2013
.
On limited past occasions, in response to market conditions, we have entered into copper and gold price protection contracts for a portion of our expected future mine production to mitigate the risk of adverse price fluctuations. We do not currently intend to enter into similar hedging programs in the future.
Foreign Currency Exchange Risk
The functional currency for most of our operations is the U.S. dollar. All of our revenues and a significant portion of our costs are denominated in U.S. dollars; however, some costs and certain asset and liability accounts are denominated in local currencies, including the Indonesian rupiah, Australian dollar, Chilean peso, Peruvian nuevo sol, and euro. Generally, our results are positively affected when the U.S. dollar strengthens in relation to those foreign currencies and adversely affected when the U.S. dollar weakens in relation to those foreign currencies.
Following is a summary of estimated annual payments and the impact of changes in foreign currency rates on our annual operating costs:
|
Exchange Rate per $1
at December 31,
|
Estimated Annual Payments
|
10% Change in
Exchange Rate
(in millions)
a
|
||||||||||||||||||||
|
|
2012
|
2011
|
2010
|
(in local currency)
|
(in millions)
b
|
Increase
|
Decrease
|
|||||||||||||||
|
Indonesia
|
|
|
|
|
|
|
|
|||||||||||||||
|
Rupiah
|
9,622
|
|
9,060
|
|
8,990
|
|
5.3 trillion
|
$
|
551
|
|
$
|
(50
|
)
|
$
|
61
|
|
||||||
|
Australian dollar
|
0.93
|
|
0.98
|
|
0.98
|
|
230 million
|
$
|
246
|
|
$
|
(22
|
)
|
$
|
27
|
|
||||||
|
South America
|
|
|
|
|||||||||||||||||||
|
Chilean peso
|
480
|
|
519
|
|
468
|
|
300 billion
|
$
|
625
|
|
$
|
(57
|
)
|
$
|
69
|
|
||||||
|
Peruvian nuevo sol
|
2.55
|
|
2.70
|
|
2.81
|
|
380 million
|
$
|
149
|
|
$
|
(14
|
)
|
$
|
17
|
|
||||||
|
Atlantic Copper
|
|
|
|
|||||||||||||||||||
|
Euro
|
0.76
|
|
0.77
|
|
0.75
|
|
140 million
|
$
|
185
|
|
$
|
(17
|
)
|
$
|
21
|
|
||||||
|
a.
|
Reflects the estimated impact on annual operating costs assuming a 10 percent increase or decrease in the exchange rate reported at
December 31, 2012
.
|
|
b.
|
Based on
December 31, 2012
, exchange rates.
|
102
Interest Rate Risk
At
December 31, 2012
, we had total debt of
$3.5 billion
, of which approximately five percent was variable-rate debt with interest rates based on the London Interbank Offered Rate (LIBOR) or the Euro Interbank Offered Rate (EURIBOR). The table below presents average interest rates for our scheduled maturities of principal for our outstanding debt and the related fair values at
December 31, 2012
(in millions, except percentages):
|
|
2013
|
2014
|
2015
|
2016
|
2017
|
Thereafter
|
Fair Value
|
||||||||||||||||||||
|
Fixed-rate debt
|
$
|
—
|
|
$
|
—
|
|
$
|
500
|
|
$
|
—
|
|
$
|
500
|
|
$
|
2,357
|
|
$
|
3,419
|
|
||||||
|
Average interest rate
|
—
|
%
|
—
|
%
|
1.4
|
%
|
—
|
%
|
2.2
|
%
|
4.2
|
%
|
3.5
|
%
|
|||||||||||||
|
Variable-rate debt
|
$
|
2
|
|
$
|
—
|
|
$
|
—
|
|
$
|
—
|
|
$
|
—
|
|
$
|
168
|
|
$
|
170
|
|
||||||
|
Average interest rate
|
—
|
%
|
a
|
—
|
%
|
—
|
%
|
—
|
%
|
—
|
%
|
4.0
|
%
|
4.0
|
%
|
||||||||||||
|
a.
|
Less than 0.01%.
|
NEW ACCOUNTING STANDARDS
We do not expect the provisions of recently issued accounting standards to have a significant impact on our future financial statements and disclosures.
OFF-BALANCE SHEET ARRANGEMENTS
Refer to Note
14
for discussion of off-balance sheet arrangements.
PRODUCT REVENUES AND PRODUCTION COSTS
Unit net cash costs per pound of copper and molybdenum are measures intended to provide investors with information about the cash-generating capacity of our mining operations expressed on a basis relating to the primary metal product for the respective operations. We use this measure for the same purpose and for monitoring operating performance by our mining operations. This information differs from measures of performance determined in accordance with U.S. GAAP and should not be considered in isolation or as a substitute for measures of performance determined in accordance with U.S. GAAP. This measure is presented by other metals mining companies, although our measures may not be comparable to similarly titled measures reported by other companies.
We present gross profit per pound of copper in the following tables using both a “by-product” method and a “co-product” method. We use the by-product method in our presentation of gross profit per pound of copper because (i) the majority of our revenues are copper revenues, (ii) we mine ore, which contains copper, gold, molybdenum and other metals, (iii) it is not possible to specifically assign all of our costs to revenues from the copper, gold, molybdenum and other metals we produce, (iv) it is the method used to compare mining operations in certain industry publications and (v) it is the method used by our management and the Board to monitor operations. In the co-product method presentation below, shared costs are allocated to the different products based on their relative revenue values, which will vary to the extent our metals sales volumes and realized prices change.
We show revenue adjustments for prior period open sales as separate line items. Because these adjustments do not result from current period sales, we have reflected these separately from revenues on current period sales. Noncash and other costs consist of items such as stock-based compensation costs, start-up costs, write-offs of equipment and/or unusual charges. They are removed from site production and delivery costs in the calculation of unit net cash costs. As discussed above, gold, molybdenum and other metal revenues at copper mines are reflected as credits against site production and delivery costs in the by-product method. Following are presentations under both the by-product and co-product methods together with reconciliations to amounts reported in our consolidated financial statements.
103
North America Copper Mines Product Revenues and Production Costs
|
Year Ended December 31, 2012
|
|
|
|||||||||||||||||
|
(In millions)
|
By-Product
|
Co-Product Method
|
|||||||||||||||||
|
Method
|
Copper
|
Molybdenum
a
|
Other
b
|
Total
|
|||||||||||||||
|
Revenues, excluding adjustments
|
$
|
4,908
|
|
$
|
4,908
|
|
$
|
468
|
|
$
|
91
|
|
$
|
5,467
|
|
||||
|
Site production and delivery, before net noncash
|
|
|
|
|
|
||||||||||||||
|
and other costs shown below
|
2,572
|
|
2,357
|
|
227
|
|
60
|
|
2,644
|
|
|||||||||
|
By-product credits
a
|
(487
|
)
|
—
|
|
—
|
|
—
|
|
—
|
|
|||||||||
|
Treatment charges
|
161
|
|
147
|
|
—
|
|
14
|
|
161
|
|
|||||||||
|
Net cash costs
|
2,246
|
|
2,504
|
|
227
|
|
74
|
|
2,805
|
|
|||||||||
|
Depreciation, depletion and amortization
|
346
|
|
323
|
|
18
|
|
5
|
|
346
|
|
|||||||||
|
Noncash and other costs, net
|
138
|
|
134
|
|
3
|
|
1
|
|
138
|
|
|||||||||
|
Total costs
|
2,730
|
|
2,961
|
|
248
|
|
80
|
|
3,289
|
|
|||||||||
|
Revenue adjustments, primarily for pricing on prior period open sales
|
4
|
|
4
|
|
—
|
|
—
|
|
4
|
|
|||||||||
|
Gross profit
|
$
|
2,182
|
|
$
|
1,951
|
|
$
|
220
|
|
$
|
11
|
|
$
|
2,182
|
|
||||
|
|
|
|
|
|
|||||||||||||||
|
Reconciliation to Amounts Reported
|
|||||||||||||||||||
|
|
|
Depreciation,
|
|
|
|||||||||||||||
|
|
|
Production
|
Depletion and
|
|
|
||||||||||||||
|
|
Revenues
|
and Delivery
|
Amortization
|
|
|
||||||||||||||
|
Totals presented above
|
$
|
5,467
|
|
$
|
2,644
|
|
$
|
346
|
|
|
|
||||||||
|
Treatment charges
|
N/A
|
|
161
|
|
N/A
|
|
|
|
|||||||||||
|
Net noncash and other costs
|
N/A
|
|
138
|
|
N/A
|
|
|
|
|||||||||||
|
Revenue adjustments, primarily for pricing on prior period open sales
|
4
|
|
N/A
|
|
N/A
|
|
|
|
|||||||||||
|
Eliminations and other
|
19
|
|
69
|
|
16
|
|
|
|
|||||||||||
|
North America copper mines
|
5,490
|
|
3,012
|
|
362
|
|
|
|
|||||||||||
|
South America mining
|
4,728
|
|
2,114
|
|
287
|
|
|
|
|||||||||||
|
Indonesia mining
|
3,921
|
|
2,349
|
|
212
|
|
|
|
|||||||||||
|
Africa mining
|
1,359
|
|
615
|
|
176
|
|
|
|
|||||||||||
|
Molybdenum
|
1,255
|
|
1,033
|
|
65
|
|
|
|
|||||||||||
|
Rod & Refining
|
5,016
|
|
4,993
|
|
9
|
|
|
|
|||||||||||
|
Atlantic Copper Smelting & Refining
|
2,709
|
|
2,640
|
|
42
|
|
|
|
|||||||||||
|
Corporate, other & eliminations
|
(6,468
|
)
|
(6,374
|
)
|
26
|
|
|
|
|||||||||||
|
As reported in FCX’s consolidated financial statements
|
$
|
18,010
|
|
$
|
10,382
|
|
$
|
1,179
|
|
|
|
||||||||
|
a.
|
Molybdenum credits and revenues reflect volumes produced at market-based pricing.
|
|
b.
|
Includes gold and silver product revenues and production costs
.
|
104
North America Copper Mines Product Revenues and Production Costs (continued)
|
Year Ended December 31, 2011
|
|
|
|||||||||||||||||
|
(In millions)
|
By-Product
|
Co-Product Method
|
|||||||||||||||||
|
Method
|
Copper
|
|
Molybdenum
a
|
Other
b
|
Total
|
||||||||||||||
|
Revenues, excluding adjustments
|
$
|
4,968
|
|
$
|
4,968
|
|
$
|
546
|
|
$
|
111
|
|
$
|
5,625
|
|
||||
|
Site production and delivery, before net noncash
|
|
|
|
|
|
|
|||||||||||||
|
and other costs shown below
|
2,213
|
|
1,987
|
|
238
|
|
46
|
|
2,271
|
|
|||||||||
|
By-product credits
a
|
(599
|
)
|
—
|
|
—
|
|
—
|
|
—
|
|
|||||||||
|
Treatment charges
|
138
|
|
132
|
|
—
|
|
6
|
|
138
|
|
|||||||||
|
Net cash costs
|
1,752
|
|
2,119
|
|
238
|
|
52
|
|
2,409
|
|
|||||||||
|
Depreciation, depletion and amortization
|
264
|
|
247
|
|
13
|
|
4
|
|
264
|
|
|||||||||
|
Noncash and other costs, net
|
166
|
|
161
|
|
4
|
|
1
|
|
166
|
|
|||||||||
|
Total costs
|
2,182
|
|
2,527
|
|
255
|
|
57
|
|
2,839
|
|
|||||||||
|
Revenue adjustments, primarily for pricing on prior period open sales
|
(1
|
)
|
(1
|
)
|
—
|
|
—
|
|
(1
|
)
|
|||||||||
|
Gross profit
|
$
|
2,785
|
|
$
|
2,440
|
|
$
|
291
|
|
$
|
54
|
|
$
|
2,785
|
|
||||
|
Reconciliation to Amounts Reported
|
|
|
|
|
|
|
|||||||||||||
|
|
|
|
Depreciation,
|
|
|
||||||||||||||
|
|
|
Production
|
|
Depletion and
|
|
|
|||||||||||||
|
|
Revenues
|
and Delivery
|
|
Amortization
|
|
|
|||||||||||||
|
Totals presented above
|
$
|
5,625
|
|
$
|
2,271
|
|
$
|
264
|
|
|
|
||||||||
|
Treatment charges
|
N/A
|
|
138
|
|
|
N/A
|
|
|
|
||||||||||
|
Net noncash and other costs
|
N/A
|
|
166
|
|
|
N/A
|
|
|
|
||||||||||
|
Revenue adjustments, primarily for pricing on prior period open sales
|
(1
|
)
|
N/A
|
|
|
N/A
|
|
|
|
||||||||||
|
Eliminations and other
|
9
|
|
54
|
|
15
|
|
|
|
|||||||||||
|
North America copper mines
|
5,633
|
|
2,629
|
|
|
279
|
|
|
|
||||||||||
|
South America mining
|
5,258
|
|
1,905
|
|
|
258
|
|
|
|
||||||||||
|
Indonesia mining
|
5,046
|
|
1,791
|
|
|
215
|
|
|
|
||||||||||
|
Africa mining
|
1,289
|
|
591
|
|
|
140
|
|
|
|
||||||||||
|
Molybdenum
|
1,424
|
|
1,036
|
|
60
|
|
|
|
|||||||||||
|
Rod & Refining
|
5,549
|
|
5,527
|
|
|
8
|
|
|
|
||||||||||
|
Atlantic Copper Smelting & Refining
|
2,984
|
|
2,991
|
|
|
40
|
|
|
|
||||||||||
|
Corporate, other & eliminations
|
(6,303
|
)
|
(6,572
|
)
|
22
|
|
|
|
|||||||||||
|
As reported in FCX’s consolidated financial statements
|
$
|
20,880
|
|
$
|
9,898
|
|
$
|
1,022
|
|
|
|
||||||||
|
a.
|
Molybdenum credits and revenues reflect volumes produced at market-based pricing.
|
|
b.
|
Includes gold and silver product revenues and production costs.
|
105
North America Copper Mines Product Revenues and Production Costs (continued)
|
Year Ended December 31, 2010
|
|
|
|
||||||||||||||||
|
(In millions)
|
By-Product
|
|
Co-Product Method
|
||||||||||||||||
|
Method
|
|
Copper
|
|
Molybdenum
a
|
Other
b
|
Total
|
|||||||||||||
|
Revenues, excluding adjustments
|
$
|
3,702
|
|
$
|
3,702
|
|
$
|
383
|
|
$
|
58
|
|
$
|
4,143
|
|
||||
|
Site production and delivery, before net noncash
|
|
|
|
|
|
|
|
||||||||||||
|
and other costs shown below
|
1,621
|
|
1,456
|
|
195
|
|
29
|
|
1,680
|
|
|||||||||
|
By-product credits
a
|
(382
|
)
|
—
|
|
—
|
|
—
|
|
—
|
|
|||||||||
|
Treatment charges
|
105
|
|
102
|
|
—
|
|
3
|
|
105
|
|
|||||||||
|
Net cash costs
|
1,344
|
|
1,558
|
|
195
|
|
32
|
|
1,785
|
|
|||||||||
|
Depreciation, depletion and amortization
|
256
|
|
241
|
|
13
|
|
2
|
|
256
|
|
|||||||||
|
Noncash and other costs, net
|
218
|
|
217
|
|
1
|
|
—
|
|
218
|
|
|||||||||
|
Total costs
|
1,818
|
|
2,016
|
|
209
|
|
34
|
|
2,259
|
|
|||||||||
|
Revenue adjustments, primarily for pricing on prior period open sales
|
(2
|
)
|
(2
|
)
|
—
|
|
—
|
|
(2
|
)
|
|||||||||
|
Gross profit
|
$
|
1,882
|
|
$
|
1,684
|
|
$
|
174
|
|
$
|
24
|
|
$
|
1,882
|
|
||||
|
|
|
|
|
|
|
|
|||||||||||||
|
Reconciliation to Amounts Reported
|
|||||||||||||||||||
|
|
|
|
|
Depreciation,
|
|
|
|||||||||||||
|
|
|
|
Production
|
|
Depletion and
|
|
|
||||||||||||
|
|
Revenues
|
|
and Delivery
|
|
Amortization
|
|
|
||||||||||||
|
Totals presented above
|
$
|
4,143
|
|
$
|
1,680
|
|
$
|
256
|
|
|
|
||||||||
|
Treatment charges
|
N/A
|
|
|
105
|
|
|
N/A
|
|
|
|
|||||||||
|
Net noncash and other costs
|
N/A
|
|
|
218
|
|
N/A
|
|
|
|
||||||||||
|
Revenue adjustments, primarily for pricing on prior period open sales
|
(2
|
)
|
N/A
|
|
|
N/A
|
|
|
|
||||||||||
|
Eliminations and other
|
32
|
|
49
|
|
17
|
|
|
|
|||||||||||
|
North America copper mines
|
4,173
|
|
|
2,052
|
|
|
273
|
|
|
|
|||||||||
|
South America mining
|
4,991
|
|
|
1,678
|
|
|
250
|
|
|
|
|||||||||
|
Indonesia mining
|
6,377
|
|
|
1,946
|
|
|
257
|
|
|
|
|||||||||
|
Africa mining
|
1,106
|
|
|
488
|
|
|
128
|
|
|
|
|||||||||
|
Molybdenum
|
1,205
|
|
|
784
|
|
51
|
|
|
|
||||||||||
|
Rod & Refining
|
4,470
|
|
|
4,442
|
|
|
8
|
|
|
|
|||||||||
|
Atlantic Copper Smelting & Refining
|
2,491
|
|
|
2,470
|
|
|
38
|
|
|
|
|||||||||
|
Corporate, other & eliminations
|
(5,831
|
)
|
(5,525
|
)
|
31
|
|
|
|
|||||||||||
|
As reported in FCX’s consolidated financial statements
|
$
|
18,982
|
|
|
$
|
8,335
|
|
$
|
1,036
|
|
|
|
|||||||
|
a.
|
Molybdenum credits and revenues reflect volumes produced at market-based pricing.
|
|
b.
|
Includes gold and silver product revenues and production costs.
|
106
South America Mining Product Revenues and Production Costs
|
Year Ended December 31, 2012
|
|
|
|
|
|||||||||||
|
(In millions)
|
By-Product
|
Co-Product Method
|
|||||||||||||
|
Method
|
Copper
|
Other
|
Total
|
||||||||||||
|
Revenues, excluding adjustments
|
$
|
4,462
|
|
$
|
4,462
|
|
$
|
355
|
|
a
|
$
|
4,817
|
|
||
|
Site production and delivery, before net noncash
|
|
|
|
|
|||||||||||
|
and other costs shown below
|
1,995
|
|
b
|
1,846
|
|
173
|
|
2,019
|
|
||||||
|
By-product credits
|
(331
|
)
|
—
|
|
—
|
|
—
|
|
|||||||
|
Treatment charges
|
202
|
|
202
|
|
—
|
|
202
|
|
|||||||
|
Net cash costs
|
1,866
|
|
2,048
|
|
173
|
|
2,221
|
|
|||||||
|
Depreciation, depletion and amortization
|
287
|
|
272
|
|
15
|
|
287
|
|
|||||||
|
Noncash and other costs, net
|
110
|
|
75
|
|
35
|
|
110
|
|
|||||||
|
Total costs
|
2,263
|
|
2,395
|
|
223
|
|
2,618
|
|
|||||||
|
Revenue adjustments, primarily for pricing on prior period open sales
|
106
|
|
106
|
|
—
|
|
106
|
|
|||||||
|
Gross profit
|
$
|
2,305
|
|
$
|
2,173
|
|
$
|
132
|
|
$
|
2,305
|
|
|||
|
Reconciliation to Amounts Reported
|
|
|
|
|
|||||||||||
|
|
|
Depreciation,
|
|
||||||||||||
|
|
|
Production
|
Depletion and
|
|
|||||||||||
|
|
Revenues
|
and Delivery
|
Amortization
|
|
|||||||||||
|
Totals presented above
|
$
|
4,817
|
|
$
|
2,019
|
|
$
|
287
|
|
|
|||||
|
Treatment charges
|
(202
|
)
|
N/A
|
|
N/A
|
|
|
||||||||
|
Net noncash and other costs
|
N/A
|
|
110
|
|
N/A
|
|
|
||||||||
|
Revenue adjustments, primarily for pricing on prior period open sales
|
106
|
|
N/A
|
|
N/A
|
|
|
||||||||
|
Eliminations and other
|
7
|
|
(15
|
)
|
—
|
|
|
||||||||
|
South America mining
|
4,728
|
|
2,114
|
|
287
|
|
|
||||||||
|
North America copper mines
|
5,490
|
|
3,012
|
|
362
|
|
|
||||||||
|
Indonesia mining
|
3,921
|
|
2,349
|
|
212
|
|
|
||||||||
|
Africa mining
|
1,359
|
|
615
|
|
176
|
|
|
||||||||
|
Molybdenum
|
1,255
|
|
1,033
|
|
65
|
|
|
||||||||
|
Rod & Refining
|
5,016
|
|
4,993
|
|
9
|
|
|
||||||||
|
Atlantic Copper Smelting & Refining
|
2,709
|
|
2,640
|
|
42
|
|
|
||||||||
|
Corporate, other & eliminations
|
(6,468
|
)
|
(6,374
|
)
|
26
|
|
|
||||||||
|
As reported in FCX’s consolidated financial statements
|
$
|
18,010
|
|
$
|
10,382
|
|
$
|
1,179
|
|
|
|||||
|
a.
|
Includes gold sales of
82 thousand
ounces (
$1,673
per ounce average realized price) and silver sales of
3.2 million
ounces (
$30.33
per ounce average realized price); also includes sales of Cerro Verde production to our molybdenum sales company of
8 million
pounds (
$10.58
per pound average realized price), which reflects molybdenum produced at market-based pricing.
|
|
b.
|
Includes charges totaling
$16 million
associated with labor agreement costs at Candelaria.
|
107
South America Mining Product Revenues and Production Costs (continued)
|
Year Ended December 31, 2011
|
|
|
|
|
|
||||||||||
|
(In millions)
|
By-Product
|
Co-Product Method
|
|||||||||||||
|
Method
|
Copper
|
|
Other
|
Total
|
|||||||||||
|
Revenues, excluding adjustments
|
$
|
4,989
|
|
$
|
4,989
|
|
$
|
477
|
|
a
|
$
|
5,466
|
|
||
|
Site production and delivery, before net noncash
|
|
|
|
|
|
||||||||||
|
and other costs shown below
|
1,826
|
|
b
|
1,679
|
|
172
|
|
1,851
|
|
||||||
|
By-product credits
|
(452
|
)
|
—
|
|
—
|
|
—
|
|
|||||||
|
Treatment charges
|
219
|
|
219
|
|
—
|
|
219
|
|
|||||||
|
Net cash costs
|
1,593
|
|
1,898
|
|
172
|
|
2,070
|
|
|||||||
|
Depreciation, depletion and amortization
|
258
|
|
242
|
|
16
|
|
258
|
|
|||||||
|
Noncash and other costs, net
|
82
|
|
75
|
|
7
|
|
82
|
|
|||||||
|
Total costs
|
1,933
|
|
2,215
|
|
195
|
|
2,410
|
|
|||||||
|
Revenue adjustments, primarily for pricing on prior period open sales
|
15
|
|
(4
|
)
|
19
|
|
15
|
|
|||||||
|
Gross profit
|
$
|
3,071
|
|
$
|
2,770
|
|
$
|
301
|
|
$
|
3,071
|
|
|||
|
Reconciliation to Amounts Reported
|
|
|
|
|
|
||||||||||
|
|
|
|
Depreciation,
|
|
|||||||||||
|
|
|
Production
|
|
Depletion and
|
|
||||||||||
|
|
Revenues
|
and Delivery
|
|
Amortization
|
|
||||||||||
|
Totals presented above
|
$
|
5,466
|
|
$
|
1,851
|
|
$
|
258
|
|
|
|||||
|
Treatment charges
|
(219
|
)
|
N/A
|
|
|
N/A
|
|
|
|||||||
|
Net noncash and other costs
|
N/A
|
|
82
|
|
|
N/A
|
|
|
|||||||
|
Revenue adjustments, primarily for pricing on prior period open sales
|
15
|
|
N/A
|
|
|
N/A
|
|
|
|||||||
|
Eliminations and other
|
(4
|
)
|
(28
|
)
|
—
|
|
|
||||||||
|
South America mining
|
5,258
|
|
1,905
|
|
|
258
|
|
|
|||||||
|
North America copper mines
|
5,633
|
|
2,629
|
|
|
279
|
|
|
|||||||
|
Indonesia mining
|
5,046
|
|
1,791
|
|
|
215
|
|
|
|||||||
|
Africa mining
|
1,289
|
|
591
|
|
|
140
|
|
|
|||||||
|
Molybdenum
|
1,424
|
|
1,036
|
|
60
|
|
|
||||||||
|
Rod & Refining
|
5,549
|
|
5,527
|
|
8
|
|
|
||||||||
|
Atlantic Copper Smelting & Refining
|
2,984
|
|
2,991
|
|
40
|
|
|
||||||||
|
Corporate, other & eliminations
|
(6,303
|
)
|
(6,572
|
)
|
22
|
|
|
||||||||
|
As reported in FCX’s consolidated financial statements
|
$
|
20,880
|
|
$
|
9,898
|
|
$
|
1,022
|
|
|
|||||
|
a.
|
Includes gold sales of
101 thousand
ounces (
$1,580
per ounce average realized price) and silver sales of
3.2 million
ounces (
$36.81
per ounce average realized price); also includes sales of Cerro Verde production to our molybdenum sales company of
10 million
pounds (
$13.78
per pound average realized price), which reflects molybdenum produced at market-based pricing.
|
|
b.
|
Includes $50 million for bonuses paid at Cerro Verde and El Abra pursuant to new labor agreements.
|
108
South America Mining Product Revenues and Production Costs (continued)
|
Year Ended December 31, 2010
|
|
|
|
|
|
|
|||||||||
|
(In millions)
|
By-Product
|
|
Co-Product Method
|
||||||||||||
|
Method
|
|
Copper
|
|
Other
|
Total
|
||||||||||
|
Revenues, excluding adjustments
|
$
|
4,911
|
|
$
|
4,911
|
|
$
|
299
|
|
a
|
$
|
5,210
|
|
||
|
Site production and delivery, before net noncash
|
|
|
|
|
|
|
|||||||||
|
and other costs shown below
|
1,613
|
|
|
1,521
|
|
110
|
|
1,631
|
|
||||||
|
By-product credits
|
(281
|
)
|
—
|
|
—
|
|
—
|
|
|||||||
|
Treatment charges
|
207
|
|
|
207
|
|
—
|
|
207
|
|
||||||
|
Net cash costs
|
1,539
|
|
|
1,728
|
|
110
|
|
1,838
|
|
||||||
|
Depreciation, depletion and amortization
|
249
|
|
|
237
|
|
12
|
|
249
|
|
||||||
|
Noncash and other costs, net
|
63
|
|
58
|
|
5
|
|
63
|
|
|||||||
|
Total costs
|
1,851
|
|
|
2,023
|
|
127
|
|
2,150
|
|
||||||
|
Revenue adjustments, primarily for pricing on prior period open sales
|
(14
|
)
|
|
(14
|
)
|
—
|
|
(14
|
)
|
||||||
|
Gross profit
|
$
|
3,046
|
|
|
$
|
2,874
|
|
$
|
172
|
|
$
|
3,046
|
|
||
|
Reconciliation to Amounts Reported
|
|
|
|
|
|
|
|||||||||
|
|
|
|
|
Depreciation,
|
|
||||||||||
|
|
|
|
Production
|
|
Depletion and
|
|
|||||||||
|
|
Revenues
|
|
and Delivery
|
|
Amortization
|
|
|||||||||
|
Totals presented above
|
$
|
5,210
|
|
$
|
1,631
|
|
$
|
249
|
|
|
|||||
|
Treatment charges
|
(207
|
)
|
N/A
|
|
|
N/A
|
|
|
|||||||
|
Net noncash and other costs
|
N/A
|
|
|
63
|
|
N/A
|
|
|
|||||||
|
Revenue adjustments, primarily for pricing on prior period open sales
|
(14
|
)
|
|
N/A
|
|
|
N/A
|
|
|
||||||
|
Eliminations and other
|
2
|
|
(16
|
)
|
1
|
|
|
||||||||
|
South America mining
|
4,991
|
|
|
1,678
|
|
|
250
|
|
|
||||||
|
North America copper mines
|
4,173
|
|
|
2,052
|
|
|
273
|
|
|
||||||
|
Indonesia mining
|
6,377
|
|
|
1,946
|
|
|
257
|
|
|
||||||
|
Africa mining
|
1,106
|
|
|
488
|
|
|
128
|
|
|
||||||
|
Molybdenum
|
1,205
|
|
|
784
|
|
51
|
|
|
|||||||
|
Rod & Refining
|
4,470
|
|
|
4,442
|
|
|
8
|
|
|
||||||
|
Atlantic Copper Smelting & Refining
|
2,491
|
|
|
2,470
|
|
|
38
|
|
|
||||||
|
Corporate, other & eliminations
|
(5,831
|
)
|
(5,525
|
)
|
31
|
|
|
||||||||
|
As reported in FCX’s consolidated financial statements
|
$
|
18,982
|
|
|
$
|
8,335
|
|
$
|
1,036
|
|
|
||||
|
a.
|
Includes gold sales of
93 thousand
ounces (
$1,263
per ounce average realized price) and silver sales of
2.7 million
ounces (
$20.53
per ounce average realized price); also includes sales of Cerro Verde production to our molybdenum sales company of
7 million
pounds (
$14.12
per pound average realized price), which reflects molybdenum produced at market-based pricing.
|
109
Indonesia Mining Product Revenues and Production Costs
|
Year Ended December 31, 2012
|
|
|
|||||||||||||||||
|
(In millions)
|
By-Product
|
Co-Product Method
|
|||||||||||||||||
|
Method
|
Copper
|
Gold
|
Silver
|
Total
|
|||||||||||||||
|
Revenues, excluding adjustments
|
$
|
2,564
|
|
$
|
2,564
|
|
$
|
1,522
|
|
$
|
64
|
|
a
|
$
|
4,150
|
|
|||
|
Site production and delivery, before net noncash
|
|
|
|
|
|
||||||||||||||
|
and other costs shown below
|
2,230
|
|
1,378
|
|
818
|
|
34
|
|
2,230
|
|
|||||||||
|
Gold and silver credits
|
(1,589
|
)
|
—
|
|
—
|
|
—
|
|
—
|
|
|||||||||
|
Treatment charges
|
152
|
|
94
|
|
56
|
|
2
|
|
152
|
|
|||||||||
|
Royalty on metals
|
93
|
|
58
|
|
34
|
|
1
|
|
93
|
|
|||||||||
|
Net cash costs
|
886
|
|
1,530
|
|
908
|
|
37
|
|
2,475
|
|
|||||||||
|
Depreciation and amortization
|
212
|
|
131
|
|
78
|
|
3
|
|
212
|
|
|||||||||
|
Noncash and other costs, net
|
82
|
|
50
|
|
30
|
|
2
|
|
82
|
|
|||||||||
|
Total costs
|
1,180
|
|
1,711
|
|
1,016
|
|
42
|
|
2,769
|
|
|||||||||
|
Revenue adjustments, primarily for pricing on prior period open sales
|
13
|
|
13
|
|
3
|
|
—
|
|
16
|
|
|||||||||
|
PT Smelting intercompany loss
|
(37
|
)
|
(23
|
)
|
(13
|
)
|
(1
|
)
|
(37
|
)
|
|||||||||
|
Gross profit
|
$
|
1,360
|
|
$
|
843
|
|
$
|
496
|
|
$
|
21
|
|
$
|
1,360
|
|
||||
|
Reconciliation to Amounts Reported
|
|
|
|
|
|
||||||||||||||
|
|
|
Depreciation,
|
|
|
|||||||||||||||
|
|
|
Production
|
Depletion and
|
|
|
||||||||||||||
|
|
Revenues
|
and Delivery
|
Amortization
|
|
|
||||||||||||||
|
Totals presented above
|
$
|
4,150
|
|
$
|
2,230
|
|
$
|
212
|
|
|
|
||||||||
|
Treatment charges
|
(152
|
)
|
N/A
|
|
N/A
|
|
|
|
|||||||||||
|
Royalty on metals
|
(93
|
)
|
N/A
|
|
N/A
|
|
|
|
|||||||||||
|
Net noncash and other costs
|
N/A
|
|
82
|
|
N/A
|
|
|
|
|||||||||||
|
Revenue adjustments, primarily for pricing on prior period open sales
|
16
|
|
N/A
|
|
N/A
|
|
|
|
|||||||||||
|
PT Smelting intercompany loss
|
N/A
|
|
37
|
|
N/A
|
|
|||||||||||||
|
Indonesia mining
|
3,921
|
|
2,349
|
|
212
|
|
|
|
|||||||||||
|
North America copper mines
|
5,490
|
|
3,012
|
|
362
|
|
|
|
|||||||||||
|
South America mining
|
4,728
|
|
2,114
|
|
287
|
|
|
|
|||||||||||
|
Africa mining
|
1,359
|
|
615
|
|
176
|
|
|
|
|||||||||||
|
Molybdenum
|
1,255
|
|
1,033
|
|
65
|
|
|
|
|||||||||||
|
Rod & Refining
|
5,016
|
|
4,993
|
|
9
|
|
|
|
|||||||||||
|
Atlantic Copper Smelting & Refining
|
2,709
|
|
2,640
|
|
42
|
|
|
|
|||||||||||
|
Corporate, other & eliminations
|
(6,468
|
)
|
(6,374
|
)
|
26
|
|
|
|
|||||||||||
|
As reported in FCX’s consolidated financial statements
|
$
|
18,010
|
|
$
|
10,382
|
|
$
|
1,179
|
|
|
|
||||||||
a. Includes silver sales of
2.1 million
ounces (
$30.70
per ounce average realized price).
110
Indonesia Mining Product Revenues and Production Costs (continued)
|
Year Ended December 31, 2011
|
|
|
|||||||||||||||||
|
(In millions)
|
By-Product
|
Co-Product Method
|
|||||||||||||||||
|
Method
|
Copper
|
|
Gold
|
Silver
|
Total
|
||||||||||||||
|
Revenues, excluding adjustments
|
$
|
3,261
|
|
$
|
3,261
|
|
$
|
2,011
|
|
$
|
97
|
|
a
|
$
|
5,369
|
|
|||
|
Site production and delivery, before net noncash
|
|
|
|
|
|
|
|||||||||||||
|
and other costs shown below
|
1,869
|
|
b
|
1,135
|
|
700
|
|
34
|
|
1,869
|
|
||||||||
|
Gold and silver credits
|
(2,090
|
)
|
—
|
|
—
|
|
—
|
|
—
|
|
|||||||||
|
Treatment charges
|
156
|
|
95
|
|
58
|
|
3
|
|
156
|
|
|||||||||
|
Royalty on metals
|
137
|
|
83
|
|
52
|
|
2
|
|
137
|
|
|||||||||
|
Net cash costs
|
72
|
|
1,313
|
|
810
|
|
39
|
|
2,162
|
|
|||||||||
|
Depreciation and amortization
|
215
|
|
131
|
|
80
|
|
4
|
|
215
|
|
|||||||||
|
Noncash and other costs, net
|
33
|
|
20
|
|
12
|
|
1
|
|
33
|
|
|||||||||
|
Total costs
|
320
|
|
1,464
|
|
902
|
|
44
|
|
2,410
|
|
|||||||||
|
Revenue adjustments, primarily for pricing on prior period open sales
|
(12
|
)
|
(12
|
)
|
(18
|
)
|
—
|
|
(30
|
)
|
|||||||||
|
PT Smelting intercompany profit
|
111
|
|
67
|
|
41
|
|
3
|
|
111
|
|
|||||||||
|
Gross profit
|
$
|
3,040
|
|
$
|
1,852
|
|
$
|
1,132
|
|
$
|
56
|
|
$
|
3,040
|
|
||||
|
Reconciliation to Amounts Reported
|
|
|
|
|
|
|
|||||||||||||
|
|
|
|
Depreciation,
|
|
|
||||||||||||||
|
|
|
Production
|
|
Depletion and
|
|
|
|||||||||||||
|
|
Revenues
|
and Delivery
|
|
Amortization
|
|
|
|||||||||||||
|
Totals presented above
|
$
|
5,369
|
|
$
|
1,869
|
|
$
|
215
|
|
|
|
||||||||
|
Treatment charges
|
(156
|
)
|
N/A
|
|
|
N/A
|
|
|
|
||||||||||
|
Royalty on metals
|
(137
|
)
|
N/A
|
|
|
N/A
|
|
|
|
||||||||||
|
Net noncash and other costs
|
N/A
|
|
33
|
|
|
N/A
|
|
|
|
||||||||||
|
Revenue adjustments, primarily for pricing on prior period open sales
|
(30
|
)
|
N/A
|
|
|
N/A
|
|
|
|
||||||||||
|
PT Smelting intercompany profit
|
N/A
|
|
(111
|
)
|
N/A
|
|
|||||||||||||
|
Indonesia mining
|
5,046
|
|
1,791
|
|
|
215
|
|
|
|
||||||||||
|
North America copper mines
|
5,633
|
|
2,629
|
|
|
279
|
|
|
|
||||||||||
|
South America mining
|
5,258
|
|
1,905
|
|
|
258
|
|
|
|
||||||||||
|
Africa mining
|
1,289
|
|
591
|
|
|
140
|
|
|
|
||||||||||
|
Molybdenum
|
1,424
|
|
1,036
|
|
60
|
|
|
|
|||||||||||
|
Rod & Refining
|
5,549
|
|
5,527
|
|
|
8
|
|
|
|
||||||||||
|
Atlantic Copper Smelting & Refining
|
2,984
|
|
2,991
|
|
|
40
|
|
|
|
||||||||||
|
Corporate, other & eliminations
|
(6,303
|
)
|
(6,572
|
)
|
22
|
|
|
|
|||||||||||
|
As reported in FCX’s consolidated financial statements
|
$
|
20,880
|
|
$
|
9,898
|
|
$
|
1,022
|
|
|
|
||||||||
|
a.
|
Includes silver sales of
2.7 million
ounces (
$36.18
per ounce average realized price).
|
|
b.
|
Includes $66 million associated with bonuses and other strike-related costs.
|
111
Indonesia Mining Product Revenues and Production Costs (continued)
|
Year Ended December 31, 2010
|
|
|
|||||||||||||||||
|
(In millions)
|
By-Product
|
Co-Product Method
|
|||||||||||||||||
|
Method
|
Copper
|
|
Gold
|
Silver
|
Total
|
||||||||||||||
|
Revenues, excluding adjustments
|
$
|
4,475
|
|
$
|
4,475
|
|
$
|
2,243
|
|
$
|
90
|
|
a
|
$
|
6,808
|
|
|||
|
Site production and delivery, before net noncash
|
|
|
|
|
|
|
|||||||||||||
|
and other costs shown below
|
1,856
|
|
1,220
|
|
612
|
|
24
|
|
1,856
|
|
|||||||||
|
Gold and silver credits
|
(2,334
|
)
|
—
|
|
—
|
|
—
|
|
—
|
|
|||||||||
|
Treatment charges
|
270
|
|
178
|
|
89
|
|
3
|
|
270
|
|
|||||||||
|
Royalty on metals
|
156
|
|
102
|
|
51
|
|
3
|
|
156
|
|
|||||||||
|
Net cash (credits) costs
|
(52
|
)
|
1,500
|
|
752
|
|
30
|
|
2,282
|
|
|||||||||
|
Depreciation and amortization
|
257
|
|
169
|
|
85
|
|
3
|
|
257
|
|
|||||||||
|
Noncash and other costs, net
|
48
|
|
31
|
|
16
|
|
1
|
|
48
|
|
|||||||||
|
Total costs
|
253
|
|
1,700
|
|
853
|
|
34
|
|
2,587
|
|
|||||||||
|
Revenue adjustments, primarily for pricing on prior period open sales
|
(6
|
)
|
(6
|
)
|
1
|
|
—
|
|
(5
|
)
|
|||||||||
|
PT Smelting intercompany loss
|
(42
|
)
|
(28
|
)
|
(14
|
)
|
—
|
|
(42
|
)
|
|||||||||
|
Gross profit
|
$
|
4,174
|
|
$
|
2,741
|
|
$
|
1,377
|
|
$
|
56
|
|
$
|
4,174
|
|
||||
|
Reconciliation to Amounts Reported
|
|
|
|
|
|
|
|||||||||||||
|
|
|
|
Depreciation,
|
|
|
||||||||||||||
|
|
|
Production
|
|
Depletion and
|
|
|
|||||||||||||
|
|
Revenues
|
and Delivery
|
|
Amortization
|
|
|
|||||||||||||
|
Totals presented above
|
$
|
6,808
|
|
$
|
1,856
|
|
$
|
257
|
|
|
|
||||||||
|
Treatment charges
|
(270
|
)
|
N/A
|
|
|
N/A
|
|
|
|
||||||||||
|
Royalty on metals
|
(156
|
)
|
N/A
|
|
|
N/A
|
|
|
|
||||||||||
|
Net noncash and other costs
|
N/A
|
|
48
|
|
|
N/A
|
|
|
|
||||||||||
|
Revenue adjustments, primarily for pricing on prior period open sales
|
(5
|
)
|
N/A
|
|
|
N/A
|
|
|
|
||||||||||
|
PT Smelting intercompany loss
|
N/A
|
|
42
|
|
N/A
|
|
|||||||||||||
|
Indonesia mining
|
6,377
|
|
|
1,946
|
|
|
257
|
|
|
|
|||||||||
|
North America copper mines
|
4,173
|
|
|
2,052
|
|
|
273
|
|
|
|
|||||||||
|
South America mining
|
4,991
|
|
|
1,678
|
|
|
250
|
|
|
|
|||||||||
|
Africa mining
|
1,106
|
|
|
488
|
|
|
128
|
|
|
|
|||||||||
|
Molybdenum
|
1,205
|
|
|
784
|
|
51
|
|
|
|
||||||||||
|
Rod & Refining
|
4,470
|
|
|
4,442
|
|
|
8
|
|
|
|
|||||||||
|
Atlantic Copper Smelting & Refining
|
2,491
|
|
|
2,470
|
|
|
38
|
|
|
|
|||||||||
|
Corporate, other & eliminations
|
(5,831
|
)
|
(5,525
|
)
|
31
|
|
|
|
|||||||||||
|
As reported in FCX’s consolidated financial statements
|
$
|
18,982
|
|
|
$
|
8,335
|
|
$
|
1,036
|
|
|
|
|||||||
|
a.
|
Includes silver sales of
4.1 million
ounces (
$21.99
per ounce average realized price).
|
112
Africa Mining Product Revenues and Production Costs
|
Year Ended December 31, 2012
|
|
|
|
|
|||||||||||
|
(In millions)
|
By-Product
|
Co-Product Method
|
|||||||||||||
|
Method
|
Copper
|
Cobalt
|
Total
|
||||||||||||
|
Revenues, excluding adjustments
a
|
$
|
1,179
|
|
$
|
1,179
|
|
$
|
194
|
|
$
|
1,373
|
|
|||
|
Site production and delivery, before net noncash
|
|
|
|
|
|||||||||||
|
and other costs shown below
|
501
|
|
465
|
|
121
|
|
586
|
|
|||||||
|
Cobalt credits
b
|
(112
|
)
|
—
|
|
—
|
|
—
|
|
|||||||
|
Royalty on metals
|
25
|
|
22
|
|
3
|
|
25
|
|
|||||||
|
Net cash costs
|
414
|
|
487
|
|
124
|
|
611
|
|
|||||||
|
Depreciation, depletion and amortization
|
176
|
|
160
|
|
16
|
|
176
|
|
|||||||
|
Noncash and other costs, net
|
29
|
|
26
|
|
3
|
|
29
|
|
|||||||
|
Total costs
|
619
|
|
673
|
|
143
|
|
816
|
|
|||||||
|
Revenue adjustments, primarily for pricing on prior period open sales
|
8
|
|
8
|
|
3
|
|
11
|
|
|||||||
|
Gross profit
|
$
|
568
|
|
$
|
514
|
|
$
|
54
|
|
$
|
568
|
|
|||
|
Reconciliation to Amounts Reported
|
|
|
|
|
|||||||||||
|
|
|
Depreciation,
|
|
||||||||||||
|
|
|
Production
|
Depletion and
|
|
|||||||||||
|
|
Revenues
|
and Delivery
|
Amortization
|
|
|||||||||||
|
Totals presented above
|
$
|
1,373
|
|
$
|
586
|
|
$
|
176
|
|
|
|||||
|
Royalty on metals
|
(25
|
)
|
N/A
|
|
N/A
|
|
|
||||||||
|
Net noncash and other costs
|
N/A
|
|
29
|
|
N/A
|
|
|
||||||||
|
Revenue adjustments, primarily for pricing on prior period open sales
|
11
|
|
N/A
|
|
N/A
|
|
|
||||||||
|
Africa mining
|
1,359
|
|
615
|
|
176
|
|
|
||||||||
|
North America copper mines
|
5,490
|
|
3,012
|
|
362
|
|
|
||||||||
|
South America mining
|
4,728
|
|
2,114
|
|
287
|
|
|
||||||||
|
Indonesia mining
|
3,921
|
|
2,349
|
|
212
|
|
|
||||||||
|
Molybdenum
|
1,255
|
|
1,033
|
|
65
|
|
|
||||||||
|
Rod & Refining
|
5,016
|
|
4,993
|
|
9
|
|
|
||||||||
|
Atlantic Copper Smelting & Refining
|
2,709
|
|
2,640
|
|
42
|
|
|
||||||||
|
Corporate, other & eliminations
|
(6,468
|
)
|
(6,374
|
)
|
26
|
|
|
||||||||
|
As reported in FCX’s consolidated financial statements
|
$
|
18,010
|
|
$
|
10,382
|
|
$
|
1,179
|
|
|
|||||
|
a.
|
Includes point-of-sale transportation costs as negotiated in customer contracts.
|
|
b.
|
Net of cobalt downstream processing and freight costs.
|
113
Africa Mining Product Revenues and Production Costs (continued)
|
Year Ended December 31, 2011
|
|
|
|
|
|||||||||||
|
(In millions)
|
By-Product
|
Co-Product Method
|
|||||||||||||
|
Method
|
Copper
|
Cobalt
|
Total
|
||||||||||||
|
Revenues, excluding adjustments
a
|
$
|
1,059
|
|
$
|
1,059
|
|
$
|
253
|
|
$
|
1,312
|
|
|||
|
Site production and delivery, before net noncash
|
|
|
|
|
|||||||||||
|
and other costs shown below
|
444
|
|
393
|
|
141
|
|
534
|
|
|||||||
|
Cobalt credits
b
|
(165
|
)
|
—
|
|
—
|
|
—
|
|
|||||||
|
Royalty on metals
|
24
|
|
20
|
|
4
|
|
24
|
|
|||||||
|
Net cash costs
|
303
|
|
413
|
|
145
|
|
558
|
|
|||||||
|
Depreciation, depletion and amortization
|
140
|
|
120
|
|
20
|
|
140
|
|
|||||||
|
Noncash and other costs, net
|
57
|
|
49
|
|
8
|
|
57
|
|
|||||||
|
Total costs
|
500
|
|
582
|
|
173
|
|
755
|
|
|||||||
|
Revenue adjustments, primarily for pricing on prior period open sales
|
(1
|
)
|
(1
|
)
|
2
|
|
1
|
|
|||||||
|
Gross profit
|
$
|
558
|
|
$
|
476
|
|
$
|
82
|
|
$
|
558
|
|
|||
|
Reconciliation to Amounts Reported
|
|
|
|
|
|||||||||||
|
|
|
Depreciation,
|
|
||||||||||||
|
|
|
Production
|
Depletion and
|
|
|||||||||||
|
|
Revenues
|
and Delivery
|
Amortization
|
|
|||||||||||
|
Totals presented above
|
$
|
1,312
|
|
$
|
534
|
|
$
|
140
|
|
|
|||||
|
Royalty on metals
|
(24
|
)
|
N/A
|
|
N/A
|
|
|
||||||||
|
Net noncash and other costs
|
N/A
|
|
57
|
|
N/A
|
|
|
||||||||
|
Revenue adjustments, primarily for pricing on prior period open sales
|
1
|
|
N/A
|
|
N/A
|
|
|
||||||||
|
Africa mining
|
1,289
|
|
591
|
|
|
140
|
|
|
|||||||
|
North America copper mines
|
5,633
|
|
2,629
|
|
|
279
|
|
|
|||||||
|
South America mining
|
5,258
|
|
1,905
|
|
|
258
|
|
|
|||||||
|
Indonesia mining
|
5,046
|
|
1,791
|
|
|
215
|
|
|
|||||||
|
Molybdenum
|
1,424
|
|
1,036
|
|
60
|
|
|
||||||||
|
Rod & Refining
|
5,549
|
|
5,527
|
|
8
|
|
|
||||||||
|
Atlantic Copper Smelting & Refining
|
2,984
|
|
2,991
|
|
40
|
|
|
||||||||
|
Corporate, other & eliminations
|
(6,303
|
)
|
(6,572
|
)
|
22
|
|
|
||||||||
|
As reported in FCX’s consolidated financial statements
|
$
|
20,880
|
|
$
|
9,898
|
|
$
|
1,022
|
|
|
|||||
|
a.
|
Includes point-of-sale transportation costs as negotiated in customer contracts.
|
|
b.
|
Net of cobalt downstream processing and freight costs.
|
114
Africa Mining Product Revenues and Production Costs (continued)
|
Year Ended December 31, 2010
|
|
|
|
|
|||||||||||
|
(In millions)
|
By-Product
|
Co-Product Method
|
|||||||||||||
|
Method
|
Copper
|
Cobalt
|
Total
|
||||||||||||
|
Revenues, excluding adjustments
a
|
$
|
904
|
|
$
|
904
|
|
$
|
218
|
|
$
|
1,122
|
|
|||
|
Site production and delivery, before net noncash
|
|
|
|
|
|||||||||||
|
and other costs shown below
|
366
|
|
323
|
|
115
|
|
438
|
|
|||||||
|
Cobalt credits
b
|
(150
|
)
|
—
|
|
—
|
|
—
|
|
|||||||
|
Royalty on metals
|
20
|
|
16
|
|
4
|
|
20
|
|
|||||||
|
Net cash costs
|
236
|
|
339
|
|
119
|
|
458
|
|
|||||||
|
Depreciation, depletion and amortization
|
128
|
|
107
|
|
21
|
|
128
|
|
|||||||
|
Noncash and other costs, net
|
50
|
|
43
|
|
7
|
|
50
|
|
|||||||
|
Total costs
|
414
|
|
489
|
|
147
|
|
636
|
|
|||||||
|
Revenue adjustments, primarily for pricing on prior period open sales
|
—
|
|
—
|
|
4
|
|
4
|
|
|||||||
|
Gross profit
|
$
|
490
|
|
$
|
415
|
|
$
|
75
|
|
$
|
490
|
|
|||
|
Reconciliation to Amounts Reported
|
|
|
|
|
|||||||||||
|
|
|
Depreciation,
|
|
||||||||||||
|
|
|
Production
|
Depletion and
|
|
|||||||||||
|
|
Revenues
|
and Delivery
|
Amortization
|
|
|||||||||||
|
Totals presented above
|
$
|
1,122
|
|
$
|
438
|
|
$
|
128
|
|
|
|||||
|
Royalty on metals
|
(20
|
)
|
N/A
|
|
N/A
|
|
|
||||||||
|
Net noncash and other costs
|
N/A
|
|
50
|
|
N/A
|
|
|
||||||||
|
Revenue adjustments, primarily for pricing on prior period open sales
|
4
|
|
N/A
|
|
N/A
|
|
|
||||||||
|
Africa mining
|
1,106
|
|
488
|
|
|
128
|
|
|
|||||||
|
North America copper mines
|
4,173
|
|
2,052
|
|
|
273
|
|
|
|||||||
|
South America mining
|
4,991
|
|
1,678
|
|
|
250
|
|
|
|||||||
|
Indonesia mining
|
6,377
|
|
1,946
|
|
|
257
|
|
|
|||||||
|
Molybdenum
|
1,205
|
|
784
|
|
51
|
|
|
||||||||
|
Rod & Refining
|
4,470
|
|
4,442
|
|
8
|
|
|
||||||||
|
Atlantic Copper Smelting & Refining
|
2,491
|
|
2,470
|
|
38
|
|
|
||||||||
|
Corporate, other & eliminations
|
(5,831
|
)
|
(5,525
|
)
|
31
|
|
|
||||||||
|
As reported in FCX’s consolidated financial statements
|
$
|
18,982
|
|
$
|
8,335
|
|
$
|
1,036
|
|
|
|||||
|
a.
|
Includes point-of-sale transportation costs as negotiated in customer contracts.
|
|
b.
|
Net of cobalt downstream processing and freight costs.
|
115
Henderson Molybdenum Mine Product Revenues and Production Costs
|
|
Years Ended December 31,
|
|||||||||||
|
(In millions)
|
2012
|
2011
|
|
2010
|
||||||||
|
Revenues, excluding adjustments
|
$
|
484
|
|
$
|
628
|
|
|
$
|
637
|
|
||
|
Site production and delivery, before net noncash
|
|
|
|
|
||||||||
|
and other costs shown below
|
210
|
|
209
|
|
|
193
|
|
|||||
|
Treatment charges and other
|
30
|
|
33
|
|
|
43
|
|
|||||
|
Net cash costs
|
240
|
|
242
|
|
|
236
|
|
|||||
|
Depreciation, depletion and amortization
|
33
|
|
37
|
|
|
34
|
|
|||||
|
Noncash and other costs, net
|
8
|
|
2
|
|
|
1
|
|
|||||
|
Total costs
|
281
|
|
281
|
|
|
271
|
|
|||||
|
Gross profit
a
|
$
|
203
|
|
$
|
347
|
|
|
$
|
366
|
|
||
|
Reconciliation to Amounts Reported
|
|
|
Depreciation,
|
|||||||||
|
|
Production
|
|
Depletion and
|
|||||||||
|
Year Ended December 31, 2012
|
Revenues
|
and Delivery
|
|
Amortization
|
||||||||
|
Totals presented above
|
$
|
484
|
|
$
|
210
|
|
$
|
33
|
|
|||
|
Treatment charges and other
|
(30
|
)
|
N/A
|
|
|
N/A
|
|
|||||
|
Net noncash and other costs
|
N/A
|
|
8
|
|
|
N/A
|
|
|||||
|
Henderson mine
|
454
|
|
218
|
|
33
|
|
||||||
|
Other molybdenum operations and eliminations
b
|
801
|
|
815
|
|
32
|
|
||||||
|
Molybdenum
|
1,255
|
|
1,033
|
|
65
|
|
||||||
|
North America copper mines
|
5,490
|
|
3,012
|
|
362
|
|
||||||
|
South America mining
|
4,728
|
|
2,114
|
|
287
|
|
||||||
|
Indonesia mining
|
3,921
|
|
2,349
|
|
212
|
|
||||||
|
Africa mining
|
1,359
|
|
615
|
|
176
|
|
||||||
|
Rod & Refining
|
5,016
|
|
4,993
|
|
9
|
|
||||||
|
Atlantic Copper Smelting & Refining
|
2,709
|
|
2,640
|
|
42
|
|
||||||
|
Corporate, other & eliminations
|
(6,468
|
)
|
(6,374
|
)
|
26
|
|
||||||
|
As reported in FCX’s consolidated financial statements
|
$
|
18,010
|
|
$
|
10,382
|
|
$
|
1,179
|
|
|||
|
Year Ended December 31, 2011
|
|
|
|
|
||||||||
|
Totals presented above
|
$
|
628
|
|
$
|
209
|
|
$
|
37
|
|
|||
|
Treatment charges and other
|
(33
|
)
|
N/A
|
|
|
N/A
|
|
|||||
|
Net noncash and other costs
|
N/A
|
|
2
|
|
|
N/A
|
|
|||||
|
Henderson mine
|
595
|
|
211
|
|
37
|
|
||||||
|
Other molybdenum operations and eliminations
b
|
829
|
|
825
|
|
23
|
|
||||||
|
Molybdenum
|
1,424
|
|
1,036
|
|
|
60
|
|
|||||
|
North America copper mines
|
5,633
|
|
2,629
|
|
|
279
|
|
|||||
|
South America mining
|
5,258
|
|
1,905
|
|
|
258
|
|
|||||
|
Indonesia mining
|
5,046
|
|
1,791
|
|
|
215
|
|
|||||
|
Africa mining
|
1,289
|
|
591
|
|
|
140
|
|
|||||
|
Rod & Refining
|
5,549
|
|
5,527
|
|
|
8
|
|
|||||
|
Atlantic Copper Smelting & Refining
|
2,984
|
|
2,991
|
|
|
40
|
|
|||||
|
Corporate, other & eliminations
|
(6,303
|
)
|
(6,572
|
)
|
22
|
|
||||||
|
As reported in FCX’s consolidated financial statements
|
$
|
20,880
|
|
$
|
9,898
|
|
$
|
1,022
|
|
|||
|
Year Ended December 31, 2010
|
|
|
|
|
||||||||
|
Totals presented above
|
$
|
637
|
|
$
|
193
|
|
$
|
34
|
|
|||
|
Treatment charges and other
|
(43
|
)
|
N/A
|
|
|
N/A
|
|
|||||
|
Net noncash and other costs
|
N/A
|
|
1
|
|
|
N/A
|
|
|||||
|
Henderson mine
|
594
|
|
194
|
|
34
|
|
||||||
|
Other molybdenum operations and eliminations
b
|
611
|
|
590
|
|
17
|
|
||||||
|
Molybdenum
|
1,205
|
|
|
784
|
|
|
51
|
|
||||
|
North America copper mines
|
4,173
|
|
|
2,052
|
|
|
273
|
|
||||
|
South America mining
|
4,991
|
|
|
1,678
|
|
|
250
|
|
||||
|
Indonesia mining
|
6,377
|
|
|
1,946
|
|
|
257
|
|
||||
|
Africa mining
|
1,106
|
|
|
488
|
|
|
128
|
|
||||
|
Rod & Refining
|
4,470
|
|
|
4,442
|
|
|
8
|
|
||||
|
Atlantic Copper Smelting & Refining
|
2,491
|
|
|
2,470
|
|
|
38
|
|
||||
|
Corporate, other & eliminations
|
(5,831
|
)
|
(5,525
|
)
|
31
|
|
||||||
|
As reported in FCX’s consolidated financial statements
|
$
|
18,982
|
|
|
$
|
8,335
|
|
$
|
1,036
|
|
||
116
|
a.
|
Gross profit reflects sales of Henderson production to our molybdenum sales company based on volumes produced at market-based pricing. On a consolidated basis, the Molybdenum division includes profits on sales as they are made to third parties and realizations based on actual contract terms. As a result, the actual gross profit realized will differ from the amounts reported in this table.
|
|
b.
|
Primarily includes amounts associated with the molybdenum sales company, which includes sales of molybdenum produced by our North and South America copper mines. Also includes the results of the Climax molybdenum mine, which commenced commercial production in May 2012.
|
CAUTIONARY STATEMENT
Our discussion and analysis contains forward-looking statements in which we discuss factors we believe may affect our future performance. Forward-looking statements are all statements other than statements of historical facts, such as those statements regarding projected ore grades and milling rates, projected production and sales volumes, projected unit net cash costs, projected operating cash flows, projected capital expenditures, exploration efforts and results, mine production and development plans, the impact of deferred intercompany profits on earnings, liquidity, other financial commitments and tax rates, the impact of copper, gold, molybdenum and cobalt price changes, future dividend payments and potential share purchases. The words “anticipates,” “may,” “can,” “plans,” “believes,” “estimates,” “expects,” “projects,” “intends,” “likely,” “will,” “should,” “to be,” and any similar expressions are intended to identify those assertions as forward-looking statements. The declaration of dividends is at the discretion of our Board and will depend on our financial results, cash requirements, future prospects, the impact of proposed acquisitions and other factors deemed relevant by the Board.
We caution readers that forward-looking statements are not guarantees of future performance and our actual results may differ materially from those anticipated, projected or assumed in the forward-looking statements. Important factors that can cause our actual results to differ materially from those anticipated in the forward-looking statements include commodity prices, mine sequencing, production rates, industry risks, regulatory changes, political risks,
the outcome of ongoing discussions with the Indonesian government, the potential effects of violence in Indonesia, the resolution of administrative disputes in the DRC, weather- and climate-related risks, labor relations, environmental risks, litigation results, currency translation risks, risks associated with the completion of pending acquisitions and other factors described in more detail under the heading “Risk Factors” in our annual report on Form 10-K for the year ended
December 31, 2012
, filed with the SEC as updated by our subsequent filings with the SEC.
Investors are cautioned that many of the assumptions on which our forward-looking statements are based are likely to change after our forward-looking statements are made, including for example commodity prices, which we cannot control, and production volumes and costs, some aspects of which we may or may not be able to control. Further, we may make changes to our business plans that could or will affect our results. We caution investors that we do not intend to update our forward-looking statements more frequently than quarterly notwithstanding any changes in our assumptions, changes in our business plans, our actual experience or other changes, and we undertake no obligation to update any forward-looking statements.
117
MANAGEMENT’S REPORT ON INTERNAL CONTROL OVER FINANCIAL REPORTING
Freeport-McMoRan Copper & Gold Inc.’s (the Company’s) management is responsible for establishing and maintaining adequate internal control over financial reporting. Internal control over financial reporting is defined in Rule 13a-15(f) or 15d-15(f) under the Securities Exchange Act of 1934 as a process designed by, or under the supervision of, the Company’s principal executive and principal financial officers and effected by the Company’s Board of Directors, management and other personnel, to provide reasonable assurance regarding the reliability of financial reporting and the preparation of financial statements for external purposes in accordance with generally accepted accounting principles and includes those policies and procedures that:
|
•
|
Pertain to the maintenance of records that in reasonable detail accurately and fairly reflect the transactions and dispositions of the Company’s assets;
|
|
•
|
Provide reasonable assurance that transactions are recorded as necessary to permit preparation of financial statements in accordance with generally accepted accounting principles, and that receipts and expenditures of the Company are being made only in accordance with authorizations of management and directors of the Company; and
|
|
•
|
Provide reasonable assurance regarding prevention or timely detection of unauthorized acquisition, use or disposition of the Company’s assets that could have a material effect on the financial statements.
|
Because of its inherent limitations, internal control over financial reporting may not prevent or detect misstatements. Projections of any evaluation of effectiveness to future periods are subject to the risk that controls may become inadequate because of changes in conditions, or that the degree of compliance with the policies or procedures may deteriorate.
Our management, including our principal executive officer and principal financial officer, assessed the effectiveness of our internal control over financial reporting as of the end of the fiscal year covered by this annual report on Form 10-K. In making this assessment, our management used the criteria set forth in Internal Control-Integrated Framework issued by the Committee of Sponsoring Organizations of the Treadway Commission (COSO). Based on our management’s assessment, management concluded that, as of
December 31, 2012
, our Company’s internal control over financial reporting is effective based on the COSO criteria.
Ernst & Young LLP, an independent registered public accounting firm, who audited the Company’s consolidated financial statements included in this Form 10-K, has issued an attestation report on the Company’s internal control over financial reporting, which is included herein.
|
/s/ Richard C. Adkerson
|
|
/s/ Kathleen L. Quirk
|
|
Richard C. Adkerson
|
|
Kathleen L. Quirk
|
|
President and Chief Executive Officer
|
|
Executive Vice President,
|
|
|
|
Chief Financial Officer and Treasurer
|
118
REPORT OF INDEPENDENT REGISTERED PUBLIC ACCOUNTING FIRM
TO THE BOARD OF DIRECTORS AND STOCKHOLDERS OF
FREEPORT-McMoRan COPPER & GOLD INC.
We have audited Freeport-McMoRan Copper & Gold Inc.’s internal control over financial reporting as of
December 31, 2012
, based on criteria established in
Internal Control-Integrated Framework issued by the Committee of Sponsoring Organizations of the Treadway Commission (the COSO criteria). Freeport-McMoRan Copper & Gold Inc.’s management is responsible for maintaining effective internal control over financial reporting, and for its assessment of the effectiveness of internal control over financial reporting included in the accompanying Management’s Report on Internal Control Over Financial Reporting. Our responsibility is to express an opinion on the company’s internal control over financial reporting based on our audit.
We conducted our audit in accordance with the standards of the Public Company Accounting Oversight Board (United States). Those standards require that we plan and perform the audit to obtain reasonable assurance about whether effective internal control over financial reporting was maintained in all material respects. Our audit included obtaining an understanding of internal control over financial reporting, assessing the risk that a material weakness exists, testing and evaluating the design and operating effectiveness of internal control based on the assessed risk, and performing such other procedures as we considered necessary in the circumstances. We believe that our audit provides a reasonable basis for our opinion.
A company’s internal control over financial reporting is a process designed to provide reasonable assurance regarding the reliability of financial reporting and the preparation of financial statements for external purposes in accordance with generally accepted accounting principles. A company’s internal control over financial reporting includes those policies and procedures that (1) pertain to the maintenance of records that, in reasonable detail, accurately and fairly reflect the transactions and dispositions of the assets of the company; (2) provide reasonable assurance that transactions are recorded as necessary to permit preparation of financial statements in accordance with generally accepted accounting principles, and that receipts and expenditures of the company are being made only in accordance with authorizations of management and directors of the company; and (3) provide reasonable assurance regarding prevention or timely detection of unauthorized acquisition, use or disposition of the company’s assets that could have a material effect on the financial statements.
Because of its inherent limitations, internal control over financial reporting may not prevent or detect misstatements. Also, projections of any evaluation of effectiveness to future periods are subject to the risk that controls may become inadequate because of changes in conditions, or that the degree of compliance with the policies or procedures may deteriorate.
In our opinion, Freeport-McMoRan Copper & Gold Inc. maintained, in all material respects, effective internal control over financial reporting as of
December 31, 2012
, based on the COSO criteria.
We also have audited, in accordance with the standards of the Public Company Accounting Oversight Board (United States), the consolidated balance sheets of Freeport-McMoRan Copper & Gold Inc. as of December 31,
2012
and
2011
and the related consolidated statements of income, comprehensive income, equity and cash flows for each of the three years in the period ended
December 31, 2012
, and our report dated
February 22, 2013
expressed an unqualified opinion thereon.
/s/ Ernst & Young LLP
Phoenix, Arizona
February 22, 2013
119
REPORT OF INDEPENDENT REGISTERED PUBLIC ACCOUNTING FIRM
TO THE BOARD OF DIRECTORS AND STOCKHOLDERS OF
FREEPORT-McMoRan COPPER & GOLD INC.
We have audited the accompanying consolidated balance sheets of Freeport-McMoRan Copper & Gold Inc. as of
December 31, 2012
and
2011
, and the related consolidated statements of income, comprehensive income, equity and cash flows for each of the three years in the period ended
December 31, 2012
. These financial statements are the responsibility of the company’s management. Our responsibility is to express an opinion on these financial statements based on our audits.
We conducted our audits in accordance with the standards of the Public Company Accounting Oversight Board (United States). Those standards require that we plan and perform the audit to obtain reasonable assurance about whether the financial statements are free of material misstatement. An audit includes examining, on a test basis, evidence supporting the amounts and disclosures in the financial statements. An audit also includes assessing the accounting principles used and significant estimates made by management, as well as evaluating the overall financial statement presentation. We believe that our audits provide a reasonable basis for our opinion.
In our opinion, the financial statements referred to above present fairly, in all material respects, the consolidated financial position of Freeport-McMoRan Copper & Gold Inc. at
December 31, 2012
and
2011
, and the consolidated results of its operations and its cash flows for each of the three years in the period ended
December 31, 2012
, in conformity with U.S. generally accepted accounting principles.
We also have audited, in accordance with the standards of the Public Company Accounting Oversight Board (United States), Freeport-McMoRan Copper & Gold Inc.’s internal control over financial reporting as of
December 31, 2012
, based on criteria established in Internal Control-Integrated Framework issued by the Committee of Sponsoring Organizations of the Treadway Commission and our report dated
February 22, 2013
expressed an unqualified opinion thereon.
/s/ Ernst & Young LLP
Phoenix, Arizona
February 22, 2013
120
FREEPORT-McMoRan COPPER & GOLD INC.
|
|
Years Ended December 31,
|
||||||||||
|
|
2012
|
2011
|
2010
|
||||||||
|
|
(In millions, except per share amounts)
|
||||||||||
|
Revenues
|
$
|
18,010
|
|
$
|
20,880
|
|
$
|
18,982
|
|
||
|
Cost of sales:
|
|
|
|
||||||||
|
Production and delivery
|
10,382
|
|
9,898
|
|
8,335
|
|
|||||
|
Depreciation, depletion and amortization
|
1,179
|
|
1,022
|
|
1,036
|
|
|||||
|
Total cost of sales
|
11,561
|
|
10,920
|
|
9,371
|
|
|||||
|
Selling, general and administrative expenses
|
431
|
|
415
|
|
381
|
|
|||||
|
Exploration and research expenses
|
285
|
|
271
|
|
143
|
|
|||||
|
Environmental obligations and shutdown costs
|
(22
|
)
|
134
|
|
19
|
|
|||||
|
Gain on insurance settlement
|
(59
|
)
|
—
|
|
—
|
|
|||||
|
Total costs and expenses
|
12,196
|
|
11,740
|
|
9,914
|
|
|||||
|
Operating income
|
5,814
|
|
9,140
|
|
9,068
|
|
|||||
|
Interest expense, net
|
(186
|
)
|
(312
|
)
|
(462
|
)
|
|||||
|
Losses on early extinguishment of debt
|
(168
|
)
|
(68
|
)
|
(81
|
)
|
|||||
|
Other income (expense), net
|
27
|
|
58
|
|
(13
|
)
|
|||||
|
Income before income taxes and equity in affiliated
|
|
|
|
||||||||
|
companies’ net earnings
|
5,487
|
|
8,818
|
|
8,512
|
|
|||||
|
Provision for income taxes
|
(1,510
|
)
|
(3,087
|
)
|
(2,983
|
)
|
|||||
|
Equity in affiliated companies’ net earnings
|
3
|
|
16
|
|
15
|
|
|||||
|
Net income
|
3,980
|
|
5,747
|
|
5,544
|
|
|||||
|
Net income attributable to noncontrolling interests
|
(939
|
)
|
(1,187
|
)
|
(1,208
|
)
|
|||||
|
Preferred dividends
|
—
|
|
—
|
|
(63
|
)
|
|||||
|
Net income attributable to FCX common stockholders
|
$
|
3,041
|
|
$
|
4,560
|
|
$
|
4,273
|
|
||
|
Net income per share attributable to FCX common stockholders:
|
|
|
|
||||||||
|
Basic
|
$
|
3.20
|
|
$
|
4.81
|
|
$
|
4.67
|
|
||
|
Diluted
|
$
|
3.19
|
|
$
|
4.78
|
|
$
|
4.57
|
|
||
|
Weighted-average common shares outstanding:
|
|
|
|
||||||||
|
Basic
|
949
|
|
947
|
|
915
|
|
|||||
|
Diluted
|
954
|
|
955
|
|
949
|
|
|||||
|
Dividends declared per share of common stock
|
$
|
1.25
|
|
$
|
1.50
|
|
$
|
1.125
|
|
||
The accompanying Notes to Consolidated Financial Statements are an integral part of these consolidated financial statements.
121
FREEPORT-McMoRan COPPER & GOLD INC.
CONSOLIDATED STATEMENTS OF COMPREHENSIVE INCOME
|
Years Ended December 31,
|
|||||||||||
|
2012
|
2011
|
2010
|
|||||||||
|
(In millions)
|
|||||||||||
|
Net income
|
$
|
3,980
|
|
$
|
5,747
|
|
$
|
5,544
|
|
||
|
Other comprehensive loss, net of taxes:
|
|||||||||||
|
Defined benefit plans:
|
|||||||||||
|
Actuarial losses arising during the period
|
(66
|
)
|
(137
|
)
|
(55
|
)
|
|||||
|
Amortization of unrecognized amounts included in net
|
|||||||||||
|
periodic benefit costs
|
26
|
|
15
|
|
15
|
|
|||||
|
Adjustment to deferred tax valuation allowance
|
(1
|
)
|
(20
|
)
|
(14
|
)
|
|||||
|
Translation adjustments arising during the period
|
(1
|
)
|
(2
|
)
|
—
|
|
|||||
|
Unrealized gains (losses) on securities arising during the period
|
—
|
|
(1
|
)
|
2
|
|
|||||
|
Other comprehensive loss
|
(42
|
)
|
(145
|
)
|
(52
|
)
|
|||||
|
Total comprehensive income
|
3,938
|
|
5,602
|
|
5,492
|
|
|||||
|
Total comprehensive income attributable to noncontrolling
|
|||||||||||
|
interests
|
(938
|
)
|
(1,184
|
)
|
(1,206
|
)
|
|||||
|
Total comprehensive income attributable to FCX common
|
|||||||||||
|
stockholders
|
$
|
3,000
|
|
$
|
4,418
|
|
$
|
4,286
|
|
||
The accompanying Notes to Consolidated Financial Statements are an integral part of these consolidated financial statements.
122
FREEPORT-McMoRan COPPER & GOLD INC.
|
|
Years Ended December 31,
|
|||||||||||
|
|
2012
|
2011
|
2010
|
|||||||||
|
|
(In millions)
|
|||||||||||
|
Cash flow from operating activities:
|
|
|
|
|||||||||
|
Net income
|
$
|
3,980
|
|
$
|
5,747
|
|
$
|
5,544
|
|
|||
|
Adjustments to reconcile net income to net cash provided by
|
|
|
|
|||||||||
|
operating activities:
|
|
|
|
|||||||||
|
Depreciation, depletion and amortization
|
1,179
|
|
1,022
|
|
1,036
|
|
||||||
|
Stock-based compensation
|
100
|
|
117
|
|
121
|
|
||||||
|
Pension plans contributions
|
(140
|
)
|
(46
|
)
|
(22
|
)
|
||||||
|
Net charges for reclamation and environmental obligations,
|
|
|
|
|||||||||
|
including accretion
|
22
|
|
208
|
|
167
|
|
||||||
|
Payments for reclamation and environmental obligations
|
(246
|
)
|
(170
|
)
|
(196
|
)
|
||||||
|
Losses on early extinguishment of debt
|
168
|
|
68
|
|
81
|
|
||||||
|
Deferred income taxes
|
269
|
|
523
|
|
286
|
|
||||||
|
Increase in long-term mill and leach stockpiles
|
(269
|
)
|
(262
|
)
|
(103
|
)
|
||||||
|
Other, net
|
128
|
|
(126
|
)
|
193
|
|
||||||
|
(Increases) decreases in working capital and other tax payments:
|
|
|
|
|||||||||
|
Accounts receivable
|
(365
|
)
|
1,246
|
|
(680
|
)
|
||||||
|
Inventories
|
(729
|
)
|
(431
|
)
|
(593
|
)
|
||||||
|
Other current assets
|
(76
|
)
|
(57
|
)
|
(24
|
)
|
||||||
|
Accounts payable and accrued liabilities
|
209
|
|
(387
|
)
|
331
|
|
||||||
|
Accrued income taxes and other tax payments
|
(456
|
)
|
(832
|
)
|
132
|
|
||||||
|
Net cash provided by operating activities
|
3,774
|
|
6,620
|
|
6,273
|
|
||||||
|
Cash flow from investing activities:
|
|
|
|
|||||||||
|
Capital expenditures:
|
|
|
|
|||||||||
|
North America copper mines
|
(827
|
)
|
(495
|
)
|
(233
|
)
|
||||||
|
South America
|
(931
|
)
|
(603
|
)
|
(470
|
)
|
||||||
|
Indonesia
|
(843
|
)
|
(648
|
)
|
(436
|
)
|
||||||
|
Africa
|
(539
|
)
|
(193
|
)
|
(100
|
)
|
||||||
|
Molybdenum
|
(258
|
)
|
(461
|
)
|
(89
|
)
|
||||||
|
Other
|
(96
|
)
|
(134
|
)
|
(84
|
)
|
||||||
|
Investment in McMoRan Exploration Co.
|
29
|
|
25
|
|
(500
|
)
|
||||||
|
Other, net
|
2
|
|
(26
|
)
|
43
|
|
||||||
|
Net cash used in investing activities
|
(3,463
|
)
|
(2,535
|
)
|
(1,869
|
)
|
||||||
|
Cash flow from financing activities:
|
|
|
|
|||||||||
|
Repayments of debt
|
(3,186
|
)
|
(1,313
|
)
|
(1,724
|
)
|
||||||
|
Proceeds from debt
|
3,029
|
|
48
|
|
70
|
|
||||||
|
Cash dividends paid:
|
|
|
|
|||||||||
|
Common stock
|
(1,129
|
)
|
(1,423
|
)
|
(885
|
)
|
||||||
|
Preferred stock
|
—
|
|
—
|
|
(95
|
)
|
||||||
|
Noncontrolling interests
|
(113
|
)
|
(391
|
)
|
(816
|
)
|
||||||
|
Debt financing costs
|
(51
|
)
|
(10
|
)
|
—
|
|
||||||
|
Contributions from noncontrolling interests
|
15
|
|
62
|
|
28
|
|
||||||
|
Net (payments for) proceeds from stock-based awards
|
(1
|
)
|
3
|
|
81
|
|
||||||
|
Excess tax benefit from stock-based awards
|
8
|
|
23
|
|
19
|
|
||||||
|
Net cash used in financing activities
|
(1,428
|
)
|
(3,001
|
)
|
(3,322
|
)
|
||||||
|
Net (decrease) increase in cash and cash equivalents
|
(1,117
|
)
|
1,084
|
|
1,082
|
|
||||||
|
Cash and cash equivalents at beginning of year
|
4,822
|
|
3,738
|
|
2,656
|
|
||||||
|
Cash and cash equivalents at end of year
|
$
|
3,705
|
|
$
|
4,822
|
|
$
|
3,738
|
|
|||
The accompanying Notes to Consolidated Financial Statements are an integral part of these consolidated financial statements.
123
FREEPORT-McMoRan COPPER & GOLD INC.
|
|
December 31,
|
||||||
|
|
2012
|
2011
|
|||||
|
|
(In millions, except par values)
|
||||||
|
ASSETS
|
|
|
|||||
|
Current assets:
|
|
|
|||||
|
Cash and cash equivalents
|
$
|
3,705
|
|
$
|
4,822
|
|
|
|
Trade accounts receivable
|
927
|
|
892
|
|
|||
|
Income taxes receivable
|
436
|
|
70
|
|
|||
|
Other accounts receivable
|
266
|
|
180
|
|
|||
|
Inventories:
|
|
|
|||||
|
Mill and leach stockpiles
|
1,672
|
|
1,289
|
|
|||
|
Materials and supplies, net
|
1,504
|
|
1,354
|
|
|||
|
Product
|
1,400
|
|
1,226
|
|
|||
|
Other current assets
|
387
|
|
214
|
|
|||
|
Total current assets
|
10,297
|
|
10,047
|
|
|||
|
Property, plant, equipment and development costs, net
|
20,999
|
|
18,449
|
|
|||
|
Long-term mill and leach stockpiles
|
1,955
|
|
1,686
|
|
|||
|
Long-term receivables
|
769
|
|
675
|
|
|||
|
Other assets
|
1,420
|
|
1,213
|
|
|||
|
Total assets
|
$
|
35,440
|
|
$
|
32,070
|
|
|
|
LIABILITIES AND EQUITY
|
|
|
|||||
|
Current liabilities:
|
|
|
|||||
|
Accounts payable and accrued liabilities
|
$
|
2,324
|
|
$
|
2,194
|
|
|
|
Current portion of deferred income taxes
|
384
|
|
103
|
|
|||
|
Dividends payable
|
299
|
|
240
|
|
|||
|
Current portion of reclamation and environmental obligations
|
241
|
|
236
|
|
|||
|
Accrued income taxes
|
93
|
|
163
|
|
|||
|
Current portion of debt
|
2
|
|
4
|
|
|||
|
Total current liabilities
|
3,343
|
|
2,940
|
|
|||
|
Long-term debt, less current portion
|
3,525
|
|
3,533
|
|
|||
|
Deferred income taxes
|
3,490
|
|
3,255
|
|
|||
|
Reclamation and environmental obligations, less current portion
|
2,127
|
|
2,138
|
|
|||
|
Other liabilities
|
1,644
|
|
1,651
|
|
|||
|
Total liabilities
|
14,129
|
|
13,517
|
|
|||
|
Equity:
|
|
|
|||||
|
FCX stockholders’ equity:
|
|
|
|||||
|
Common stock, par value $0.10, 1,073 shares and 1,071 shares
|
|
|
|||||
|
issued, respectively
|
107
|
|
107
|
|
|||
|
Capital in excess of par value
|
19,119
|
|
19,007
|
|
|||
|
Retained earnings
|
2,399
|
|
546
|
|
|||
|
Accumulated other comprehensive loss
|
(506
|
)
|
(465
|
)
|
|||
|
Common stock held in treasury – 124 shares and 123 shares, respectively,
|
|||||||
|
at cost
|
(3,576
|
)
|
(3,553
|
)
|
|||
|
Total FCX stockholders’ equity
|
17,543
|
|
15,642
|
|
|||
|
Noncontrolling interests
|
3,768
|
|
2,911
|
|
|||
|
Total equity
|
21,311
|
|
18,553
|
|
|||
|
Total liabilities and equity
|
$
|
35,440
|
|
$
|
32,070
|
|
|
The accompanying Notes to Consolidated Financial Statements are an integral part of these consolidated financial statements.
124
FREEPORT-McMoRan COPPER & GOLD INC.
CONSOLIDATED STATEMENTS OF EQUITY
|
|
FCX Stockholders’ Equity
|
|||||||||||||||||||||||||||||||||||||||||||
|
Mandatory
Convertible
Preferred Stock
|
Common Stock
|
Retained Earnings(Accumu-lated Deficit)
|
Accumu-
lated
Other Compre-hensive
Loss
|
Common Stock
Held in Treasury
|
Total FCX
Stock-
holders’
Equity
|
|||||||||||||||||||||||||||||||||||||||
|
Number
of
Shares
|
At Par
Value
|
Number
of
Shares
|
At Par
Value
|
Capital in
Excess of
Par Value
|
Number
of
Shares
|
At
Cost
|
Non-
controlling
Interests
|
Total
Equity
|
||||||||||||||||||||||||||||||||||||
|
|
(In millions)
|
|||||||||||||||||||||||||||||||||||||||||||
|
Balance at January 1, 2010
|
29
|
|
$
|
2,875
|
|
981
|
|
$
|
98
|
|
$
|
15,637
|
|
$
|
(5,805
|
)
|
$
|
(273
|
)
|
122
|
|
$
|
(3,413
|
)
|
$
|
9,119
|
|
$
|
1,638
|
|
$
|
10,757
|
|
|||||||||||
|
Conversions of 6¾% Mandatory Convertible Preferred Stock
|
(29
|
)
|
(2,875
|
)
|
79
|
|
8
|
|
2,867
|
|
—
|
|
—
|
|
—
|
|
—
|
|
—
|
|
—
|
|
—
|
|
||||||||||||||||||||
|
Conversions of 7% Convertible Senior Notes
|
—
|
|
—
|
|
—
|
|
—
|
|
1
|
|
—
|
|
—
|
|
—
|
|
—
|
|
1
|
|
—
|
|
1
|
|
||||||||||||||||||||
|
Exercised and issued stock-based awards
|
—
|
|
—
|
|
7
|
|
1
|
|
109
|
|
—
|
|
—
|
|
—
|
|
—
|
|
110
|
|
—
|
|
110
|
|
||||||||||||||||||||
|
Stock-based compensation
|
—
|
|
—
|
|
—
|
|
—
|
|
129
|
|
—
|
|
—
|
|
—
|
|
—
|
|
129
|
|
—
|
|
129
|
|
||||||||||||||||||||
|
Tax benefit for stock-based awards
|
—
|
|
—
|
|
—
|
|
—
|
|
8
|
|
—
|
|
—
|
|
—
|
|
—
|
|
8
|
|
—
|
|
8
|
|
||||||||||||||||||||
|
Tender of shares for stock-based awards
|
—
|
|
—
|
|
—
|
|
—
|
|
—
|
|
—
|
|
—
|
|
—
|
|
(28
|
)
|
(28
|
)
|
—
|
|
(28
|
)
|
||||||||||||||||||||
|
Dividends on common stock
|
—
|
|
—
|
|
—
|
|
—
|
|
—
|
|
(1,058
|
)
|
—
|
|
—
|
|
—
|
|
(1,058
|
)
|
—
|
|
(1,058
|
)
|
||||||||||||||||||||
|
Dividends on preferred stock
|
—
|
|
—
|
|
—
|
|
—
|
|
—
|
|
(63
|
)
|
—
|
|
—
|
|
—
|
|
(63
|
)
|
—
|
|
(63
|
)
|
||||||||||||||||||||
|
Dividends to noncontrolling interests
|
—
|
|
—
|
|
—
|
|
—
|
|
—
|
|
—
|
|
—
|
|
—
|
|
—
|
|
—
|
|
(816
|
)
|
(816
|
)
|
||||||||||||||||||||
|
Contributions from noncontrolling interests
|
—
|
|
—
|
|
—
|
|
—
|
|
—
|
|
—
|
|
—
|
|
—
|
|
—
|
|
—
|
|
28
|
|
28
|
|
||||||||||||||||||||
|
Total comprehensive income (loss)
|
—
|
|
—
|
|
—
|
|
—
|
|
—
|
|
4,336
|
|
(50
|
)
|
—
|
|
—
|
|
4,286
|
|
1,206
|
|
5,492
|
|
||||||||||||||||||||
|
Balance at December 31, 2010
|
—
|
|
—
|
|
1,067
|
|
107
|
|
18,751
|
|
(2,590
|
)
|
(323
|
)
|
122
|
|
(3,441
|
)
|
12,504
|
|
2,056
|
|
14,560
|
|
||||||||||||||||||||
|
Exercised and issued stock-based awards
|
—
|
|
—
|
|
4
|
|
—
|
|
48
|
|
—
|
|
—
|
|
—
|
|
—
|
|
48
|
|
—
|
|
48
|
|
||||||||||||||||||||
|
Stock-based compensation
|
—
|
|
—
|
|
—
|
|
—
|
|
117
|
|
—
|
|
—
|
|
—
|
|
—
|
|
117
|
|
—
|
|
117
|
|
||||||||||||||||||||
|
Tax benefit for stock-based awards
|
—
|
|
—
|
|
—
|
|
—
|
|
24
|
|
—
|
|
—
|
|
—
|
|
—
|
|
24
|
|
—
|
|
24
|
|
||||||||||||||||||||
|
Tender of shares for stock-based awards
|
—
|
|
—
|
|
—
|
|
—
|
|
67
|
|
—
|
|
—
|
|
1
|
|
(112
|
)
|
(45
|
)
|
—
|
|
(45
|
)
|
||||||||||||||||||||
|
Dividends on common stock
|
—
|
|
—
|
|
—
|
|
—
|
|
—
|
|
(1,424
|
)
|
—
|
|
—
|
|
—
|
|
(1,424
|
)
|
—
|
|
(1,424
|
)
|
||||||||||||||||||||
|
Dividends to noncontrolling interests
|
—
|
|
—
|
|
—
|
|
—
|
|
—
|
|
—
|
|
—
|
|
—
|
|
—
|
|
—
|
|
(391
|
)
|
(391
|
)
|
||||||||||||||||||||
|
Contributions from noncontrolling interests
|
—
|
|
—
|
|
—
|
|
—
|
|
—
|
|
—
|
|
—
|
|
—
|
|
—
|
|
—
|
|
62
|
|
62
|
|
||||||||||||||||||||
|
Total comprehensive income (loss)
|
—
|
|
—
|
|
—
|
|
—
|
|
—
|
|
4,560
|
|
(142
|
)
|
—
|
|
—
|
|
4,418
|
|
1,184
|
|
5,602
|
|
||||||||||||||||||||
|
Balance at December 31, 2011
|
—
|
|
—
|
|
1,071
|
|
107
|
|
19,007
|
|
546
|
|
(465
|
)
|
123
|
|
(3,553
|
)
|
15,642
|
|
2,911
|
|
18,553
|
|
||||||||||||||||||||
|
Exercised and issued stock-based awards
|
—
|
|
—
|
|
2
|
|
—
|
|
15
|
|
—
|
|
—
|
|
—
|
|
—
|
|
15
|
|
—
|
|
15
|
|
||||||||||||||||||||
|
Stock-based compensation
|
—
|
|
—
|
|
—
|
|
—
|
|
100
|
|
—
|
|
—
|
|
—
|
|
—
|
|
100
|
|
—
|
|
100
|
|
||||||||||||||||||||
|
Tax benefit for stock-based awards
|
—
|
|
—
|
|
—
|
|
—
|
|
7
|
|
—
|
|
—
|
|
—
|
|
—
|
|
7
|
|
—
|
|
7
|
|
||||||||||||||||||||
|
Tender of shares for stock-based awards
|
—
|
|
—
|
|
—
|
|
—
|
|
7
|
|
—
|
|
—
|
|
1
|
|
(23
|
)
|
(16
|
)
|
—
|
|
(16
|
)
|
||||||||||||||||||||
|
Dividends on common stock
|
—
|
|
—
|
|
—
|
|
—
|
|
—
|
|
(1,188
|
)
|
—
|
|
—
|
|
—
|
|
(1,188
|
)
|
—
|
|
(1,188
|
)
|
||||||||||||||||||||
|
Dividends to noncontrolling interests
|
—
|
|
—
|
|
—
|
|
—
|
|
—
|
|
—
|
|
—
|
|
—
|
|
—
|
|
—
|
|
(113
|
)
|
(113
|
)
|
||||||||||||||||||||
|
Change in ownership interests
|
—
|
|
—
|
|
—
|
|
—
|
|
(17
|
)
|
—
|
|
—
|
|
—
|
|
—
|
|
(17
|
)
|
17
|
|
—
|
|
||||||||||||||||||||
|
Contributions from noncontrolling interests
|
—
|
|
—
|
|
—
|
|
—
|
|
—
|
|
—
|
|
—
|
|
—
|
|
—
|
|
—
|
|
15
|
|
15
|
|
||||||||||||||||||||
|
Total comprehensive income (loss)
|
—
|
|
—
|
|
—
|
|
—
|
|
—
|
|
3,041
|
|
(41
|
)
|
—
|
|
—
|
|
3,000
|
|
938
|
|
3,938
|
|
||||||||||||||||||||
|
Balance at December 31, 2012
|
—
|
|
$
|
—
|
|
1,073
|
|
$
|
107
|
|
$
|
19,119
|
|
$
|
2,399
|
|
$
|
(506
|
)
|
124
|
|
$
|
(3,576
|
)
|
$
|
17,543
|
|
$
|
3,768
|
|
$
|
21,311
|
|
|||||||||||
The accompanying Notes to Consolidated Financial Statements are an integral part of these consolidated financial statements.
125
FREEPORT-McMoRan COPPER & GOLD INC.
NOTES TO CONSOLIDATED FINANCIAL STATEMENTS
Basis of Presentation.
The consolidated financial statements of Freeport-McMoRan Copper & Gold Inc. (FCX) include the accounts of those subsidiaries where FCX directly or indirectly has more than
50 percent
of the voting rights and has the right to control significant management decisions. The most significant entities that FCX consolidates include its
90.64 percent
-owned subsidiary PT Freeport Indonesia and its wholly owned subsidiaries, Freeport-McMoRan Corporation (FMC) and Atlantic Copper, S.L.U. (Atlantic Copper). FCX’s unincorporated joint ventures with Rio Tinto plc (Rio Tinto) and Sumitomo Metal Mining Arizona, Inc. (Sumitomo) are reflected using the proportionate consolidation method (refer to Note
2
for further discussion). All significant intercompany transactions have been eliminated. Dollar amounts in tables are stated in millions, except per share amounts.
Investments in unconsolidated companies owned
20 percent
or more are recorded using the equity method. Investments in companies owned less than
20 percent
, and for which FCX does not exercise significant influence, are carried at cost.
Proposed Acquisitions.
On
December 5, 2012
, FCX announced definitive agreements to acquire, in separate transactions, Plains Exploration & Production Company (PXP) and McMoRan Exploration Co. (MMR). PXP per-share consideration is equivalent to
0.6531
shares of FCX's common stock and
$25.00
in cash (approximately
$3.4 billion
in cash and
91 million
shares of FCX common stock). MMR per-share consideration consists of
$14.75
in cash (approximately
$3.4 billion
in cash, or
$2.1 billion
net of MMR interests owned by FCX and PXP) and
1.15
units of a royalty trust, which will hold a five percent overriding royalty interest in future production from MMR's existing shallow water ultra-deep prospects. As further discussed in Note
20
, FCX has
$5.5 billion
in interim financing commitments and
$4.0 billion
available under a five-year bank term loan to fund the cash portion of the merger consideration for both transactions and repay certain of PXP's and MMR's outstanding debt. FCX is pursuing permanent financing for an additional
$5.5 billion
to replace the remaining interim financing commitments.
Completion of each transaction is subject to receipt of PXP and MMR stockholder approval of their respective transactions, regulatory approvals (including the United States (U.S.) antitrust clearance under the Hart-Scott-Rodino Act) and other customary conditions. On December 26, 2012, the U.S. Federal Trade Commission granted early termination of the Hart-Scott-Rodino waiting period with respect to both transactions. The PXP transaction is not conditioned on the closing of the MMR transaction, and the MMR transaction is not conditioned on the closing of the PXP transaction. PXP and MMR shareholder meetings to approve the respective transactions will be scheduled upon the effectiveness of the respective registration statements filed with the U.S. Securities and Exchange Commission. The transactions are expected to close in second-quarter 2013, subject to satisfaction of all conditions to closing.
Additionally in January 2013, FCX, through a newly formed joint venture, entered into a definitive agreement to acquire a cobalt chemical refinery in Kokkola, Finland, and the related sales and marketing business (refer to Note
20
for further discussion).
The information contained in the consolidated financial statements and the notes herein does not reflect FCX's acquisition of PXP, MMR or the cobalt chemical business.
Business Segments.
FCX has organized its operations into five primary divisions – North America copper mines, South America mining, Indonesia mining, Africa mining and Molybdenum operations. Notwithstanding this structure, FCX internally reports information on a mine-by-mine basis. Therefore, FCX concluded that its operating segments include individual mines or operations. Operating segments that meet certain thresholds are reportable segments (refer to Note 17 for further discussion).
Use of Estimates.
The preparation of FCX’s financial statements in conformity with accounting principles generally accepted in the U.S. requires management to make estimates and assumptions that affect the amounts reported in these financial statements and accompanying notes. The more significant areas requiring the use of management estimates include mineral reserve estimation; useful asset lives for depreciation, depletion and amortization; environmental obligations; reclamation and closure costs; estimates of recoverable copper in mill and leach stockpiles; pension, postretirement, postemployment and other employee benefits; deferred taxes and valuation allowances; reserves for contingencies and litigation; and asset impairment, including estimates used to derive future cash flows associated with those assets. Actual results could differ from those estimates.
126
Foreign Currencies.
For foreign subsidiaries whose functional currency is the U.S. dollar, monetary assets and liabilities denominated in the local currency are translated at current exchange rates, and non-monetary assets and liabilities, such as inventories, property, plant, equipment and development costs, are translated at historical rates. Gains and losses resulting from translation of such account balances are included in operating results, as are gains and losses from foreign currency transactions.
For foreign subsidiaries whose functional currency is the local currency, assets and liabilities are translated at current exchange rates, while revenues and expenses are translated at average rates in effect for the period. The related translation gains and losses are included in accumulated other comprehensive loss within equity.
Cash Equivalents.
Highly liquid investments purchased with maturities of three months or less are considered cash equivalents.
Inventories.
The components of inventories include mill and leach stockpiles, materials and supplies, and product inventories. Product inventories mostly include finished goods (primarily concentrates and cathodes) at mining operations, and concentrates and work-in-process at Atlantic Copper’s smelting and refining operations (refer to Note
3
for further discussion). Mill and leach stockpiles, and inventories of materials and supplies, as well as salable products, are stated at the lower of weighted-average cost or market. Costs of finished goods and work-in-process (
i.e.
, not materials and supplies) inventories include labor and benefits, supplies, energy, depreciation, depletion, amortization, site overhead costs and other necessary costs associated with the extraction and processing of ore, including, depending on the process, mining, haulage, milling, concentrating, smelting, leaching, solution extraction, refining, roasting and chemical processing. Corporate general and administrative costs are not included in inventory costs.
Work-in-Process.
In-process inventories include mill and leach stockpiles at mining operations and Atlantic Copper's in-process product inventories. In-process inventories represent materials that are currently in the process of being converted to a salable product. Conversion processes for mining operations vary depending on the nature of the copper ore and the specific mining operation. For sulfide ores, processing includes milling and concentrating and results in the production of copper and molybdenum concentrates or, alternatively, copper cathode by concentrate leaching. For oxide ores and certain secondary sulfide ores, processing includes leaching of stockpiles, solution extraction and electrowinning (SX/EW) and results in the production of copper cathodes. In-process stockpile material is measured based on assays of the material included in these processes and projected recoveries. In-process inventories are valued based on the costs incurred to various points in the process, including depreciation relating to associated process facilities.
Both mill and leach stockpiles generally contain lower grade ores that have been extracted from the ore body and are available for copper recovery. For mill stockpiles, recovery is through milling, concentrating, smelting and refining or, alternatively, by concentrate leaching. For leach stockpiles, recovery is through exposure to acidic solutions that dissolve contained copper and deliver it in solution to extraction processing facilities. The recorded cost of mill and leach stockpiles includes mining and haulage costs incurred to deliver ore to stockpiles, depreciation, depletion, amortization and site overhead costs. Material is removed from the stockpiles at a weighted-average cost per pound.
Because it is generally impracticable to determine copper contained in mill and leach stockpiles by physical count, reasonable estimation methods are employed. The quantity of material delivered to mill and leach stockpiles is based on surveyed volumes of mined material and daily production records. Sampling and assaying of blasthole cuttings determine the estimated copper grade of the material delivered to mill and leach stockpiles.
Expected copper recovery rates for mill stockpiles are determined by metallurgical testing. The recoverable copper in mill stockpiles, once entered into the production process, can be produced into copper concentrate almost immediately.
Expected copper recovery rates for leach stockpiles are determined using small-scale laboratory tests, small- to large-scale column testing (which simulates the production-scale process), historical trends and other factors, including mineralogy of the ore and rock type. Ultimate recovery of copper contained in leach stockpiles can vary significantly from a low percentage to more than
90 percent
depending on several variables, including type of copper recovery, mineralogy and particle size of the rock. For newly placed material on active stockpiles, as much
127
as
70 percent
of the copper ultimately recoverable may be extracted during the first year, and the remaining copper may be recovered over many years.
Processes and recovery rates for mill and leach stockpiles are monitored regularly, and recovery rate estimates are adjusted periodically as additional information becomes available and as related technology changes. Adjustments to recovery rates will typically result in a future impact to the value of the material removed from the stockpiles at a revised weighted-average cost per pound of recoverable copper.
For Atlantic Copper, in-process inventories represent copper concentrates at various stages of conversion into anodes and cathodes. Atlantic Copper’s in-process inventories are valued at the weighted-average cost of the material fed to the smelting and refining process plus in-process conversion costs.
Finished Goods.
Finished goods include salable products (
e.g.
, copper and molybdenum concentrates, copper anodes, copper cathodes, copper rod, copper wire, molybdenum oxide, high-purity molybdenum chemicals and other metallurgical products). Finished goods are valued based on the weighted-average cost of source material plus applicable conversion costs relating to associated process facilities.
Property, Plant, Equipment and Development Costs.
Property, plant, equipment and development costs are carried at cost. Mineral exploration costs, as well as drilling and other costs incurred for the purpose of converting mineral resources to proven and probable reserves or identifying new mineral resources at development or production stage properties, are charged to expense as incurred. Development costs are capitalized beginning after proven and probable reserves have been established. Development costs include costs incurred resulting from mine pre-production activities undertaken to gain access to proven and probable reserves, including shafts, adits, drifts, ramps, permanent excavations, infrastructure and removal of overburden. Additionally, interest expense allocable to the cost of developing mining properties and to constructing new facilities is capitalized until assets are ready for their intended use.
Expenditures for replacements and improvements are capitalized. Costs related to periodic scheduled maintenance (
i.e.
, turnarounds) are expensed as incurred. Depreciation for mining and milling life-of-mine assets, infrastructure and other common costs is determined using the unit-of-production method based on total estimated recoverable proven and probable copper reserves (for primary copper mines) and proven and probable molybdenum reserves (for primary molybdenum mines). Development costs and acquisition costs for proven and probable reserves that relate to a specific ore body are depreciated using the unit-of-production method based on estimated recoverable proven and probable reserves for the ore body benefited. Depreciation, depletion and amortization using the unit-of-production method is recorded upon extraction of the recoverable copper or molybdenum from the ore body, at which time it is allocated to inventory cost and then included as a component of cost of goods sold. Other assets are depreciated on a straight-line basis over estimated useful lives of up to
30
years for buildings and
three
to
25
years for machinery and equipment, and mobile equipment.
Included in property, plant, equipment and development costs is value beyond proven and probable reserves (VBPP), primarily resulting from FCX’s acquisition of FMC in 2007. The concept of VBPP has been interpreted differently by different mining companies. FCX’s VBPP is attributable to (i) mineralized material, which includes measured and indicated amounts, that FCX believes could be brought into production with the establishment or modification of required permits and should market conditions and technical assessments warrant, (ii) inferred mineral resources and (iii) exploration potential, as further defined below.
Mineralized material is a mineralized body that has been delineated by appropriately spaced drilling and/or underground sampling to support reported tonnage and average grade of minerals. Such a deposit does not qualify as proven and probable reserves until legal and economic feasibility are confirmed based upon a comprehensive evaluation of development costs, unit costs, grades, recoveries and other material factors. Inferred mineral resources are that part of a mineral resource for which the overall tonnages, grades and mineral contents can be estimated with a reasonable level of confidence based on geological evidence and apparent geological and grade continuity after applying economic parameters. An inferred mineral resource has a lower level of confidence than that applying to an indicated mineral resource. Exploration potential is the estimated value of potential mineral deposits that FCX has the legal right to access. The value assigned to exploration potential was determined by interpreting the known exploration information and exploration results, including geological data and/or geological information, that were available as of the acquisition date.
128
Carrying amounts assigned to VBPP are not charged to expense until the VBPP becomes associated with additional proven and probable reserves and the reserves are produced or the VBPP is determined to be impaired. Additions to proven and probable reserves for properties with VBPP will carry with them the value assigned to VBPP at the date acquired, less any impairment amounts.
Asset Impairment.
FCX reviews and evaluates its long-lived assets for impairment when events or changes in circumstances indicate that the related carrying amounts may not be recoverable. Long-lived assets are evaluated for impairment under the two-step model. An impairment is considered to exist if total estimated future cash flows on an undiscounted basis are less than the carrying amount of the asset. Once it is determined that an impairment exists, an impairment loss is measured as the amount by which the asset carrying value exceeds its fair value. Fair value is generally determined using valuation techniques, such as estimated future cash flows.
In evaluating mining operations’ long-lived assets for recoverability, estimates of after-tax undiscounted future cash flows of FCX’s individual mining operations are used, with impairment losses measured by reference to fair value. As quoted market prices are unavailable for FCX’s individual mining operations, fair value is determined through the use of discounted estimated future cash flows. Estimated cash flows used to assess recoverability of long-lived assets and measure the fair value of FCX’s mining operations are derived from current business plans, which are developed using near-term price forecasts reflective of the current price environment and management’s projections for long-term average metal prices. Estimates of future cash flows include near- and long-term metal price assumptions; estimates of commodity-based and other input costs; proven and probable reserve estimates, including any costs to develop the reserves and the timing of producing the reserves; and the use of appropriate current escalation and discount rates.
Deferred Mining Costs.
Stripping costs (
i.e.
, the costs of removing overburden and waste material to access mineral deposits) incurred during the production phase of a mine are considered variable production costs and are included as a component of inventory produced during the period in which stripping costs are incurred. Major development expenditures, including stripping costs to prepare unique and identifiable areas outside the current mining area for future production that are considered to be pre-production mine development, are capitalized and amortized on the unit-of-production method based on estimated recoverable proven and probable reserves for the ore body benefited. However, where a second or subsequent pit or major expansion is considered to be a continuation of existing mining activities, stripping costs are accounted for as a current production cost and a component of the associated inventory.
Environmental Expenditures.
Environmental expenditures are expensed or capitalized, depending upon their future economic benefits. Accruals for such expenditures are recorded when it is probable that obligations have been incurred and the costs can be reasonably estimated. Environmental obligations attributed to the Comprehensive Environmental Response, Compensation, and Liability Act (CERCLA) or analogous state programs are considered probable when a claim is asserted, or is probable of assertion, and FCX, or any of its subsidiaries, have been associated with the site. Other environmental remediation obligations are considered probable based on specific facts and circumstances. FCX’s estimates of these costs are based on an evaluation of various factors, including currently available facts, existing technology, presently enacted laws and regulations, remediation experience, whether or not FCX is a potentially responsible party (PRP) and the ability of other PRPs to pay their allocated portions. With the exception of those obligations assumed in the acquisition of FMC that were recorded at estimated fair values (refer to Note 13 for further discussion), environmental obligations are recorded on an undiscounted basis. Where the available information is sufficient to estimate the amount of the obligation, that estimate has been used. Where the information is only sufficient to establish a range of probable liability and no point within the range is more likely than any other, the lower end of the range has been used. Possible recoveries of some of these costs from other parties are not recognized in the consolidated financial statements until they become probable. Legal costs associated with environmental remediation (such as fees to outside law firms for work relating to determining the extent and type of remedial actions and the allocation of costs among PRPs) are included as part of the estimated obligation. Environmental obligations assumed in the acquisition of FMC, which were initially estimated on a discounted basis, are accreted to full value over time through charges to interest expense. Adjustments arising from changes in amounts and timing of estimated costs and settlements may result in increases and decreases in these obligations and are calculated on a discounted basis if they were initially estimated on a discounted basis. Unless these adjustments qualify for capitalization, changes in environmental obligations are charged to operating income when they occur.
FCX performs a comprehensive review of its environmental obligations annually and also reviews changes in facts and circumstances associated with these obligations at least quarterly.
129
Asset Retirement Obligations.
FCX records the fair value of estimated asset retirement obligations (AROs) associated with tangible long-lived assets in the period incurred. Retirement obligations associated with long-lived assets are those for which there is a legal obligation to settle under existing or enacted law, statute, written or oral contract or by legal construction. These obligations, which are initially estimated based on discounted cash flow estimates, are accreted to full value over time through charges to cost of sales. In addition, asset retirement costs (ARCs) are capitalized as part of the related asset’s carrying value and are depreciated (primarily on a unit-of-production basis) over the asset’s respective useful life. Reclamation costs for disturbances are recognized as an ARO and as a related ARC in the period of the disturbance. FCX’s AROs consist primarily of costs associated with mine reclamation and closure activities. These activities, which are site specific, generally include costs for earthwork, revegetation, water treatment and demolition (refer to Note
13
for further discussion). At least annually, FCX reviews its ARO estimates for changes in the projected timing of certain reclamation costs, changes in cost estimates and additional AROs incurred during the period.
Litigation Contingencies.
At least quarterly, FCX assesses the likelihood of any adverse judgments or outcomes related to legal matters (including pending or threatened litigation matters), as well as ranges of potential losses. A determination of the amount of the reserve required, if any, for litigation contingencies is made after analysis of known issues. FCX records reserves related to legal matters for which it believes it is probable that a loss has been incurred and the amount of such loss can be reasonably estimated. Where the available information is sufficient to estimate the amount of the obligation, that estimate has been used. Where the information is only sufficient to establish a range of probable liability and no point within the range is more likely than any other, the lower end of the range has been used. With respect to other matters, for which management has concluded that a loss is only reasonably possible or remote, or not reasonably estimable, no liability has been recorded. For losses assessed as reasonably possible, FCX discloses the nature of the contingency and an estimate of the possible loss or range of loss or states that such an estimate cannot be made. Costs incurred to defend claims are charged to expense as incurred.
Litigation is inherently unpredictable, and it is difficult to project the outcome of particular matters with reasonable certainty; therefore, the actual amount of any loss could differ from the litigation contingencies reflected in FCX's consolidated financial statements. Refer to Note
13
for further discussion of FCX's litigation contingencies
.
Income Taxes.
FCX accounts for deferred income taxes utilizing an asset and liability method, whereby deferred tax assets and liabilities are recognized based on the tax effects of temporary differences between the financial statements and the tax basis of assets and liabilities, as measured by current enacted tax rates (refer to Note
12
for further discussion). When appropriate, FCX evaluates the need for a valuation allowance to reduce deferred tax assets to estimated recoverable amounts. The effect on deferred income tax assets and liabilities of a change in tax rates or laws is recognized in income in the period in which such changes are enacted.
FCX accounts for uncertain income tax positions using a threshold and measurement attribute for the financial statement recognition and measurement of a tax position taken or expected to be taken in a tax return. FCX’s policy associated with uncertain tax positions is to record accrued interest in interest expense and accrued penalties in other income and expenses rather than in the provision for income taxes (refer to Note
12
for further discussion).
With the exception of Tenke Fungurume Mining S.A.R.L. (TFM or Tenke) in the Democratic Republic of Congo (DRC), income taxes are provided on the earnings of FCX’s material foreign subsidiaries under the assumption that these earnings will be distributed. FCX has determined that undistributed earnings related to TFM are reinvested indefinitely or have been allocated toward specifically identifiable needs of the local operations. FCX has not provided for other differences between the book and tax carrying amounts of its TFM investment as FCX considers its ownership position to be permanent in duration, and quantification of the related deferred tax liability is not practicable.
Derivative Instruments.
FCX and its subsidiaries may enter into derivative contracts to manage certain risks resulting from fluctuations in commodity prices (primarily copper and gold), foreign currency exchange rates and interest rates by creating offsetting market exposures. Derivative instruments (including certain derivative instruments embedded in other contracts) are recorded in the balance sheet as either an asset or liability measured at its fair value. The accounting for changes in the fair value of a derivative instrument depends on the intended use of the derivative and the resulting designation. Refer to Note
15
for a summary of FCX’s outstanding derivative instruments at
December 31, 2012
, and a discussion of FCX’s risk management strategies for those designated as hedges.
130
Revenue Recognition.
FCX sells its products pursuant to sales contracts entered into with its customers. Revenue for all FCX’s products is recognized when title and risk of loss pass to the customer and when collectibility is reasonably assured. The passing of title and risk of loss to the customer are based on terms of the sales contract, generally upon shipment or delivery of product.
Revenues from FCX’s concentrate and cathode sales are recorded based on a provisional sales price or a final sales price calculated in accordance with the terms specified in the relevant sales contract. Revenues from concentrate sales are recorded net of treatment and all refining charges (including price participation, if applicable, as discussed below) and the impact of derivative contracts. Moreover, because a portion of the metals contained in copper concentrates is unrecoverable as a result of the smelting process, FCX’s revenues from concentrate sales are also recorded net of allowances based on the quantity and value of these unrecoverable metals. These allowances are a negotiated term of FCX’s contracts and vary by customer. Treatment and refining charges represent payments or price adjustments to smelters and refiners and are either fixed or, in certain cases, vary with the price of copper (referred to as price participation).
Under the long-established structure of sales agreements prevalent in the industry, copper contained in concentrate and cathode is generally provisionally priced at the time of shipment. The provisional prices are finalized in a specified future month (generally one to four months from the shipment date) based on quoted monthly average spot copper prices on the London Metal Exchange (LME) or the New York Mercantile Exchange (COMEX). FCX receives market prices based on prices in the specified future month, which results in price fluctuations recorded to revenues until the date of settlement. FCX records revenues and invoices customers at the time of shipment based on then-current LME or COMEX prices, which results in an embedded derivative (
i.e.
, a pricing mechanism that is finalized after the time of delivery) that is required to be bifurcated from the host contract. The host contract is the sale of the metals contained in the concentrates or cathodes at the then-current LME or COMEX price. FCX applies the normal purchases and normal sales scope exception in accordance with derivatives and hedge accounting guidance to the host contract in its concentrate or cathode sales agreements since these contracts do not allow for net settlement and always result in physical delivery. The embedded derivative does not qualify for hedge accounting and is adjusted to fair value through earnings each period, using the period-end forward prices, until the date of final pricing.
Gold sales are priced according to individual contract terms, generally the average London Bullion Market Association (London PM) price for a specified month near the month of shipment.
Substantially all of FCX’s
2012
molybdenum sales were priced based on prices published in
Metals Week
,
Ryan’s Notes
or
Metal Bulletin
, plus conversion premiums for products that undergo additional processing, such as ferromolybdenum and molybdenum chemical products. The majority of these sales use the average price of the previous month quoted by the applicable publication. FCX’s remaining molybdenum sales generally have pricing that is either based on the current month published prices or a fixed price.
PT Freeport Indonesia concentrate sales and TFM metal sales are subject to certain royalties, which are recorded as a reduction to revenues (refer to Note
14
for further discussion).
Stock-Based Compensation.
Compensation costs for share-based payments to employees, including stock options, are measured at fair value and charged to expense over the requisite service period for awards that are expected to vest. The fair value of stock options is determined using the Black-Scholes-Merton option valuation model. The fair value for restricted stock units is based on FCX's stock price on the date of grant or an appropriate valuation model. The fair value for cash-settled stock appreciation rights (SARs) is the intrinsic value on the reporting or exercise date. FCX estimates forfeitures at the time of grant and revises those estimates in subsequent periods through the final vesting date of the awards if actual forfeitures differ from those estimates. FCX has elected to recognize compensation costs for stock option awards that vest over several years on a straight-line basis over the vesting period. Refer to Note
11
for further discussion.
131
Earnings Per Share.
FCX’s basic net income per share of common stock was calculated by dividing net income attributable to FCX common stockholders by the weighted-average shares of common stock outstanding during the year. A reconciliation of net income and weighted-average shares of common stock outstanding for purposes of calculating diluted net income per share for the years ended
December 31
follows:
|
|
2012
|
2011
|
2010
|
|
||||||||
|
Net income
|
$
|
3,980
|
|
$
|
5,747
|
|
$
|
5,544
|
|
|||
|
Net income attributable to noncontrolling interests
|
(939
|
)
|
(1,187
|
)
|
(1,208
|
)
|
||||||
|
Preferred dividends
|
—
|
|
—
|
|
(63
|
)
|
||||||
|
Net income attributable to FCX common stockholders
|
3,041
|
|
4,560
|
|
4,273
|
|
||||||
|
Plus income impact of assumed conversion of
|
|
|
|
|||||||||
|
6¾% Mandatory Convertible Preferred Stock
a
|
—
|
|
—
|
|
63
|
|
||||||
|
Diluted net income attributable to FCX common
|
|
|
|
|
||||||||
|
stockholders
|
$
|
3,041
|
|
$
|
4,560
|
|
$
|
4,336
|
|
|||
|
Weighted-average shares of common stock outstanding
|
949
|
|
947
|
|
915
|
|
|
|||||
|
Add shares issuable upon conversion, exercise or vesting
|
|
|
|
|
||||||||
|
of (refer to Note 11):
|
|
|
|
|||||||||
|
6¾% Mandatory Convertible Preferred Stock
a
|
—
|
|
—
|
|
26
|
|
||||||
|
Dilutive stock options
|
4
|
|
b
|
7
|
|
b
|
6
|
|
||||
|
Restricted stock units
|
1
|
|
1
|
|
2
|
|
||||||
|
Weighted-average shares of common stock outstanding for
|
|
|
|
|
||||||||
|
purposes of calculating diluted net income per share
|
954
|
|
955
|
|
949
|
|
|
|||||
|
Diluted net income per share attributable to FCX
|
|
|
|
|
||||||||
|
common stockholders
|
$
|
3.19
|
|
$
|
4.78
|
|
$
|
4.57
|
|
|||
|
a.
|
All outstanding 6¾% Mandatory Convertible Preferred Stock automatically converted on May 1, 2010, into FCX common stock at a conversion rate of
2.7432
shares of FCX common stock.
|
|
b.
|
Excluded shares of common stock associated with outstanding stock options with exercise prices less than the average market price of FCX's common stock that were anti-dilutive based on the treasury stock method of approximately
one million
for the year ended
December 31, 2012
, and
two million
for the year ended
December 31, 2011
.
|
Outstanding stock options with exercise prices greater than the average market price of FCX’s common stock during the year are excluded from the computation of diluted net income per share of common stock. Excluded amounts were
17 million
stock options with a weighted-average exercise price of
$44.73
per option in
2012
;
4 million
stock options with a weighted-average exercise price of
$53.91
per option in
2011
; and
10 million
stock options with a weighted-average exercise price of
$38.56
per option in
2010
.
New Accounting Standards.
In May 2011, the Financial Accounting Standards Board (FASB) issued an Accounting Standards Update (ASU) in connection with guidance for fair value measurements and disclosures. This ASU clarifies the FASB's intent on current guidance, modifies and changes certain guidance and principles, and expands disclosures concerning Level 3 fair value measurements in the fair value hierarchy (including quantitative information about significant unobservable inputs within Level 3 of the fair value hierarchy). In addition, this ASU requires disclosure of the fair value hierarchy for assets and liabilities not measured at fair value in the statement of financial position, but whose fair value is required to be disclosed. FCX adopted this guidance effective January 1, 2012.
In June 2011, FASB issued an ASU in connection with guidance on the presentation of comprehensive income. The objective of this ASU is to improve the comparability, consistency and transparency of financial reporting and to increase the prominence of items reported in other comprehensive income. This ASU requires an entity to present the components of net income and other comprehensive income and total comprehensive income (includes net income) either in a single continuous statement of comprehensive income or in two separate but consecutive statements. This ASU eliminates the option to present the components of other comprehensive income as part of the statement of equity, but does not change the items that must be reported in other comprehensive income. FCX adopted this ASU and presented total comprehensive income in a separate statement for all periods reported in these financial statements. Additionally, in December 2011, FASB deferred the effective date in this ASU for presenting reclassification adjustments for each component of accumulated other comprehensive income in both net income and other comprehensive income on the face of the financial statements.
132
Ownership in Subsidiaries.
FMC is a fully integrated producer of copper and molybdenum, with mines in North America, South America and the Tenke minerals district in the DRC, and copper and molybdenum conversion facilities. At
December 31, 2012
, FMC’s operating copper mines in North America were Morenci, Bagdad, Safford, Sierrita and Miami located in Arizona, and Tyrone and Chino located in New Mexico. FCX has an
85 percent
interest in Morenci (refer to “Joint Ventures – Sumitomo”) and owns
100 percent
of the other North America copper mines. In addition to copper, certain of FMC's North America copper mines also produce molybdenum concentrates. FMC also owns
100 percent
of the Henderson and Climax molybdenum mines located in Colorado. At
December 31, 2012
, operating copper mines in South America were Cerro Verde (
53.56 percent
owned) located in Peru, and El Abra (
51 percent
owned), Candelaria (
80 percent
owned) and Ojos del Salado (
80 percent
owned) located in Chile. In addition to copper, certain of FMC's South America copper mines also produce molybdenum concentrates, gold and silver. At
December 31, 2012
, FMC owned an effective
56 percent
interest in the Tenke minerals district in the DRC (refer to Note 14 for discussion of the change in ownership interest in 2012). In addition to copper, the Tenke minerals district also produces cobalt hydroxide. At
December 31, 2012
, FMC’s net assets totaled
$18.2 billion
and its accumulated deficit totaled
$10.5 billion
. FCX had
$27 million
in intercompany loans outstanding to FMC at
December 31, 2012
.
FCX’s direct ownership in PT Freeport Indonesia totals
81.28 percent
(refer to "Joint Ventures – Rio Tinto"). PT Indocopper Investama, an Indonesian company, owns
9.36 percent
of PT Freeport Indonesia, and FCX owns
100 percent
of PT Indocopper Investama. At
December 31, 2012
, PT Freeport Indonesia’s net assets totaled
$4.1 billion
and its retained earnings totaled
$3.9 billion
. As of
December 31, 2012
, FCX had
no
loans outstanding to PT Freeport Indonesia.
FCX owns
100 percent
of the outstanding Atlantic Copper common stock. At
December 31, 2012
, Atlantic Copper’s net liabilities totaled
$57 million
and its accumulated deficit totaled
$451 million
. FCX had
$434 million
in intercompany loans outstanding to Atlantic Copper at
December 31, 2012
.
FCX owns an
85.71 percent
interest in PT Puncakjaya Power (Puncakjaya Power), the owner of assets supplying power to PT Freeport Indonesia’s operations, including the 3x65 megawatt coal-fired power facilities. PT Freeport Indonesia purchases power from Puncakjaya Power under infrastructure asset financing arrangements. At
December 31, 2012
, FCX did not have any loans outstanding to Puncakjaya Power, PT Freeport Indonesia had infrastructure asset financing obligations payable to Puncakjaya Power totaling
$71 million
, and Puncakjaya Power had a receivable from PT Freeport Indonesia for
$91 million
, including Rio Tinto’s share. FCX consolidates PT Freeport Indonesia and Puncakjaya Power. FCX’s consolidated balance sheets reflect receivables of
$20 million
(
$3 million
in other accounts receivable and
$17 million
in long-term receivables) at
December 31, 2012
, and
$23 million
(
$3 million
in other accounts receivable and
$20 million
in long-term receivables) at
December 31, 2011
, for Rio Tinto’s share of Puncakjaya Power’s receivable from PT Freeport Indonesia as provided for in FCX’s joint venture agreement with Rio Tinto.
Joint Ventures.
FCX has the following unincorporated joint ventures with third parties.
Rio Tinto.
FCX and Rio Tinto have established certain unincorporated joint ventures. Under the joint venture arrangements, Rio Tinto has a
40 percent
interest in PT Freeport Indonesia’s Contract of Work and the option to participate in
40 percent
of any other future exploration projects in Papua, Indonesia.
Pursuant to the joint venture agreement, Rio Tinto has a
40 percent
interest in certain assets and future production exceeding specified annual amounts of copper, gold and silver through 2021 in Block A of PT Freeport Indonesia’s Contract of Work, and, after 2021, a
40 percent
interest in all production from Block A. All of PT Freeport Indonesia’s proven and probable reserves and its mining operations are located in the Block A area. Operating, nonexpansion capital and administrative costs are shared proportionately between PT Freeport Indonesia and Rio Tinto based on the ratio of (i) the incremental revenues from production from PT Freeport Indonesia’s expansion completed in 1998 to (ii) total revenues from production from Block A, including production from PT Freeport Indonesia’s previously existing reserves. PT Freeport Indonesia will continue to receive
100 percent
of the cash flow from specified annual amounts of copper, gold and silver through 2021 calculated by reference to its proven and probable reserves as of December 31, 1994, and
60 percent
of all remaining cash flow. The agreement provides for adjustments to the specified annual amounts of copper, gold and silver attributable 100 percent to PT Freeport Indonesia upon the occurrence of certain events that cause an interruption in production to occur, including events such as the business interruption and property damage relating to the 2011 incidents affecting PT
133
Freeport Indonesia's concentrate pipelines. As a result of these incidents, the 2011 specified amounts, before smelter recoveries, attributable 100 percent to PT Freeport Indonesia were reduced by
228 million
pounds for copper and
224 thousand
ounces for gold, which will be offset by identical increases in future periods. The payable to Rio Tinto for its share of joint venture cash flows was
$4 million
at
December 31, 2012
, and
$45 million
at
December 31, 2011
.
Under the joint venture arrangements, Rio Tinto funded
$100 million
in 1996 for approved exploration costs in the areas covered by Contracts of Work held by FCX subsidiaries. Agreed-upon exploration costs in the joint venture areas are shared
60 percent
by FCX and
40 percent
by Rio Tinto. Since September 2008, Rio Tinto is no longer participating in exploration joint ventures in the PT Nabire Bakti Mining and PT Irja Eastern Minerals Contract of Work areas in Indonesia. As a result, as long as Rio Tinto continues not to fund these exploration projects, FCX has the option to fund
100 percent
of future exploration costs in these areas and Rio Tinto's interest in these areas will decline over time in accordance with the joint venture agreement. Rio Tinto has the option to resume participation in PT Irja Eastern Minerals on a monthly basis and in PT Nabire Bakti Mining on an annual basis. Rio Tinto continues to participate in exploration joint ventures in PT Freeport Indonesia's Contract of Work areas.
Sumitomo.
FCX owns an
85 percent
undivided interest in Morenci via an unincorporated joint venture. The remaining
15 percent
is owned by Sumitomo, a jointly owned subsidiary of Sumitomo Metal Mining Co., Ltd. and Sumitomo Corporation. Each partner takes in kind its share of Morenci’s production. FMC purchased
69 million
pounds of Morenci’s copper cathode from Sumitomo for
$250 million
during
2012
. FCX had a receivable from Sumitomo of
$49 million
at
December 31, 2012
, and
$12 million
at
December 31, 2011
.
Investment in PT Smelting
. PT Smelting, an Indonesian company, operates a smelter and refinery in Gresik, Indonesia. PT Smelting's production capacity is
275,000
metric tons of copper per year. PT Freeport Indonesia owns
25 percent
of the outstanding PT Smelting common stock, which is accounted for using the equity method (refer to Note
6
for further discussion).
PT Freeport Indonesia’s contract with PT Smelting provides for the supply of
100 percent
of the copper concentrate requirements necessary for PT Smelting to produce
205,000
metric tons of copper annually (essentially the smelter’s original design capacity) on a priority basis. For the first
15
years of PT Smelting’s commercial operations, beginning December 1998, PT Freeport Indonesia agreed that the combined treatment and refining charges would approximate market rates, but will not fall below specified minimum rates. The minimum rate, applicable to the period April 27, 2008, to April 27, 2014, is determined annually and must be sufficient to cover PT Smelting’s annual cash operating costs (net of credits and including costs of debt service) for
205,000
metric tons of copper. The maximum rate is
$0.30
per pound. PT Freeport Indonesia also sells copper concentrate to PT Smelting at market rates, which are not subject to a minimum or maximum rate, for quantities in excess of
205,000
metric tons of copper annually.
FCX’s investment in PT Smelting (net of PT Freeport Indonesia's share of profits on sales to PT Smelting still in PT Smelting's inventory totaling
$39 million
at
December 31, 2012
, and
$2 million
at
December 31, 2011
) totaled
$89 million
at
December 31, 2012
, and
$125 million
at
December 31, 2011
. PT Smelting had project-specific debt, nonrecourse to PT Freeport Indonesia, totaling
$240 million
at
December 31, 2012
, and
$320 million
at
December 31, 2011
. PT Freeport Indonesia had a trade receivable from PT Smelting totaling
$152 million
at
December 31, 2012
, and
$116 million
at
December 31, 2011
.
134
The components of inventories, excluding mill and leach stockpiles, follow:
|
|
December 31,
|
||||||
|
|
2012
|
2011
|
|||||
|
Mining operations:
a
|
|
|
|||||
|
Raw materials
|
$
|
2
|
|
$
|
1
|
|
|
|
Finished goods
b
|
904
|
|
769
|
|
|||
|
Atlantic Copper:
|
|
|
|||||
|
Raw materials (concentrates)
|
235
|
|
260
|
|
|||
|
Work-in-process
|
252
|
|
187
|
|
|||
|
Finished goods
|
7
|
|
9
|
|
|||
|
Total product inventories
|
$
|
1,400
|
|
$
|
1,226
|
|
|
|
Total materials and supplies, net
c
|
$
|
1,504
|
|
$
|
1,354
|
|
|
|
a.
|
FCX's mining operations also have work-in-process inventories (
i.e
., mill and leach stockpiles), which are summarized below.
|
|
b.
|
Primarily included molybdenum concentrates and copper concentrates, anodes, cathodes and rod.
|
|
c.
|
Materials and supplies inventory was net of obsolescence reserves totaling
$27 million
at
December 31, 2012
, and
$26 million
at
December 31, 2011
.
|
A summary of mill and leach stockpiles follows:
|
|
December 31, 2012
|
||||||||||||||||||
|
North
America
|
South
America
|
Indonesia
|
Africa
|
Total
|
|||||||||||||||
|
Current:
|
|
|
|
|
|
||||||||||||||
|
Mill stockpiles
|
$
|
53
|
|
$
|
23
|
|
$
|
28
|
|
$
|
—
|
|
$
|
104
|
|
||||
|
Leach stockpiles
|
1,208
|
|
271
|
|
—
|
|
89
|
|
1,568
|
|
|||||||||
|
Total current mill and leach stockpiles
|
$
|
1,261
|
|
$
|
294
|
|
$
|
28
|
|
$
|
89
|
|
$
|
1,672
|
|
||||
|
Long-term:
a
|
|
|
|
|
|
||||||||||||||
|
Mill stockpiles
|
$
|
5
|
|
$
|
610
|
|
$
|
—
|
|
$
|
—
|
|
$
|
615
|
|
||||
|
Leach stockpiles
|
741
|
|
363
|
|
—
|
|
236
|
|
1,340
|
|
|||||||||
|
Total long-term mill and leach stockpiles
|
$
|
746
|
|
$
|
973
|
|
$
|
—
|
|
$
|
236
|
|
$
|
1,955
|
|
||||
|
|
December 31, 2011
|
||||||||||||||||||
|
North
America
|
South
America
|
Indonesia
|
Africa
|
Total
|
|||||||||||||||
|
Current:
|
|
|
|
|
|
||||||||||||||
|
Mill stockpiles
|
$
|
40
|
|
$
|
11
|
|
$
|
18
|
|
$
|
—
|
|
$
|
69
|
|
||||
|
Leach stockpiles
|
963
|
|
216
|
|
—
|
|
41
|
|
1,220
|
|
|||||||||
|
Total current mill and leach stockpiles
|
$
|
1,003
|
|
$
|
227
|
|
$
|
18
|
|
$
|
41
|
|
$
|
1,289
|
|
||||
|
Long-term:
a
|
|
|
|
|
|
||||||||||||||
|
Mill stockpiles
|
$
|
—
|
|
$
|
535
|
|
$
|
—
|
|
$
|
—
|
|
$
|
535
|
|
||||
|
Leach stockpiles
|
718
|
|
284
|
|
—
|
|
149
|
|
1,151
|
|
|||||||||
|
Total long-term mill and leach stockpiles
|
$
|
718
|
|
$
|
819
|
|
$
|
—
|
|
$
|
149
|
|
$
|
1,686
|
|
||||
|
a.
|
Estimated metals in stockpiles not expected to be recovered within the next 12 months.
|
135
The components of net property, plant, equipment and development costs follow:
|
|
December 31,
|
||||||
|
|
2012
|
2011
|
|||||
|
Proven and probable reserves
|
$
|
4,630
|
|
$
|
4,572
|
|
|
|
VBPP
|
1,067
|
|
1,071
|
|
|||
|
Development and other
|
3,821
|
|
3,447
|
|
|||
|
Buildings and infrastructure
|
3,811
|
|
3,151
|
|
|||
|
Machinery and equipment
|
9,472
|
|
8,171
|
|
|||
|
Mobile equipment
|
3,447
|
|
2,859
|
|
|||
|
Construction in progress
|
3,402
|
|
2,704
|
|
|||
|
Property, plant, equipment and development costs
|
29,650
|
|
25,975
|
|
|||
|
Accumulated depreciation, depletion and amortization
|
(8,651
|
)
|
(7,526
|
)
|
|||
|
Property, plant, equipment and development costs, net
|
$
|
20,999
|
|
$
|
18,449
|
|
|
FCX recorded
$2.2 billion
for VBPP in connection with the FMC acquisition in 2007 and transferred
none
to proven and probable reserves during
2012
,
$23 million
during
2011
and
$739 million
prior to
2011
. Cumulative impairments of VBPP total
$481 million
, of which
$4 million
was recorded in
2012
,
$6 million
in
2011
and
none
in
2010
.
Capitalized interest is primarily related to FCX's capital projects and totaled
$81 million
in
2012
,
$109 million
in
2011
and
$66 million
in
2010
.
The components of long-term receivables follow:
|
December 31,
|
|||||||
|
2012
|
2011
|
||||||
|
Income taxes
|
$
|
339
|
|
$
|
295
|
|
|
|
Loan to a DRC public electric utility
|
149
|
|
138
|
|
|||
|
Disputed tax assessments (refer to Note 13)
|
148
|
|
109
|
|
|||
|
Loan to La Générale des Carrières et des Mines (related party)
|
32
|
|
30
|
|
|||
|
Other
|
101
|
|
103
|
|
|||
|
Total long-term receivables
|
$
|
769
|
|
$
|
675
|
|
|
136
The components of other assets follow:
|
|
December 31,
|
||||||
|
|
2012
|
2011
|
|||||
|
Investments:
|
|
|
|||||
|
MMR
a
|
$
|
446
|
|
$
|
475
|
|
|
|
PT Smelting
b
|
89
|
|
125
|
|
|||
|
Available-for-sale securities
|
46
|
|
9
|
|
|||
|
Other
|
51
|
|
49
|
|
|||
|
Intangible assets
c
|
334
|
|
325
|
|
|||
|
Deferred tax assets
|
220
|
|
2
|
|
|||
|
Trust assets
d
|
163
|
|
152
|
|
|||
|
Debt issue costs
|
26
|
|
40
|
|
|||
|
Other
|
45
|
|
36
|
|
|||
|
Total other assets
|
$
|
1,420
|
|
$
|
1,213
|
|
|
|
a.
|
In December 2010, FCX purchased
500,000
shares of MMR’s
5.75%
Convertible Perpetual Preferred Stock (the MMR Preferred Stock) for an aggregate purchase price of
$500 million
. The MMR Preferred Stock is initially convertible into
62.5
shares of MMR common stock per share of MMR Preferred Stock (an aggregate of
31.25 million
shares of MMR common stock), at an initial conversion price of
$16
per share of MMR common stock. FCX's investment in MMR is recorded at cost. Dividends received are recorded as a return of investment because of MMR's reported losses. Several of FCX’s directors and executive officers also serve as directors or executive officers of MMR. Refer to Note 1 for discussion of the proposed acquisition of MMR.
|
|
b.
|
FCX's
25 percent
ownership in PT Smelting is recorded using the equity method. Amounts were reduced by unrecognized profits on sales from PT Freeport Indonesia to PT Smelting totaling
$39 million
at
December 31, 2012
, and
$2 million
at
December 31, 2011
.
|
|
c.
|
Intangible assets were net of accumulated amortization totaling
$71 million
at
December 31, 2012
, and
$62 million
at
December 31, 2011
.
|
|
d.
|
Included
$161 million
at
December 31, 2012
, and
$151 million
at
December 31, 2011
, of legally restricted funds for AROs related to properties in New Mexico (refer to Note
13
for further discussion).
|
Additional information regarding accounts payable and accrued liabilities follows:
|
|
December 31,
|
||||||
|
|
2012
|
2011
|
|||||
|
Accounts payable
|
$
|
1,568
|
|
$
|
1,353
|
|
|
|
Salaries, wages and other compensation
|
287
|
|
257
|
|
|||
|
Pension, postretirement, postemployment and other employee benefits
a
|
140
|
|
180
|
|
|||
|
Deferred revenue
|
94
|
|
69
|
|
|||
|
Other accrued taxes
|
92
|
|
92
|
|
|||
|
Accrued interest
b
|
35
|
|
69
|
|
|||
|
Rio Tinto's share of joint venture cash flows
|
4
|
|
45
|
|
|||
|
Other
|
104
|
|
129
|
|
|||
|
Total accounts payable and accrued liabilities
|
$
|
2,324
|
|
$
|
2,194
|
|
|
|
a.
|
Refer to Note
8
for long-term portion and Note
10
for further discussion.
|
|
b.
|
Third-party interest paid, net of capitalized interest, was
$111 million
in
2012
,
$225 million
in
2011
and
$365 million
in
2010
.
|
137
Additional information regarding other liabilities follows:
|
|
December 31,
|
||||||
|
|
2012
|
2011
|
|||||
|
Pension, postretirement, postemployment and other employment benefits
a
|
$
|
1,307
|
|
$
|
1,277
|
|
|
|
Reserve for uncertain tax benefits
|
107
|
|
128
|
|
|||
|
Insurance claim reserve (refer to Note 13)
|
44
|
|
50
|
|
|||
|
Atlantic Copper contractual obligation to insurance company (refer to Note 10)
|
33
|
|
39
|
|
|||
|
Other
|
153
|
|
157
|
|
|||
|
Total other liabilities
|
$
|
1,644
|
|
$
|
1,651
|
|
|
|
a.
|
Refer to Note
7
for current portion and Note
10
for further discussion.
|
The components of debt follow:
|
|
December 31,
|
||||||
|
|
2012
|
2011
|
|||||
|
Revolving Credit Facility
|
$
|
—
|
|
$
|
—
|
|
|
|
Senior Notes:
|
|
|
|||||
|
3.55% Senior Notes due 2022
|
1,995
|
|
—
|
|
|||
|
1.40% Senior Notes due 2015
|
500
|
|
—
|
|
|||
|
2.15% Senior Notes due 2017
|
500
|
|
—
|
|
|||
|
8.375% Senior Notes due 2017
|
—
|
|
3,011
|
|
|||
|
9½% Senior Notes due 2031
|
130
|
|
131
|
|
|||
|
6
1
/
8
% Senior Notes due 2034
|
115
|
|
115
|
|
|||
|
7
1
/
8
% Debentures due 2027
|
115
|
|
115
|
|
|||
|
Other (including equipment capital leases and
|
|
|
|||||
|
short-term borrowings)
|
172
|
|
165
|
|
|||
|
Total debt
|
3,527
|
|
3,537
|
|
|||
|
Less current portion of debt
|
(2
|
)
|
(4
|
)
|
|||
|
Long-term debt
|
$
|
3,525
|
|
$
|
3,533
|
|
|
Revolving Credit Facility.
FCX entered into a senior unsecured revolving credit facility on
March 30, 2011
, which replaced the existing revolving credit facilities that were scheduled to mature on
March 19, 2012
. FCX recognized a loss on early extinguishment of debt totaling
$7 million
(
$6 million
to net income attributable to FCX common stockholders) during 2011 associated with this transaction. The revolving credit facility is available until
March 30, 2016
, in an aggregate principal amount of
$1.5 billion
, with
$500 million
available to PT Freeport Indonesia. At
December 31, 2012
, FCX had
no
borrowings and
$43 million
of letters of credit issued under the revolving credit facility, resulting in availability of approximately
$1.5 billion
, of which
$957 million
could be used for additional letters of credit.
Interest on the revolving credit facility is generally based on the
London Interbank Offered Rate
(LIBOR) plus
1.75 percent
, subject to an increase or decrease in the interest rate margin based on the credit ratings assigned to FCX's senior unsecured debt by Standard & Poor’s Rating Services and Moody’s Investors Service.
The obligations of FCX and PT Freeport Indonesia under the revolving credit facility are not guaranteed by any subsidiaries and are unsecured; however, FCX may at any time designate any subsidiary (other than PT Freeport Indonesia) as a subsidiary guarantor.
138
Senior Notes.
In February 2012, FCX sold
$500 million
of
1.40%
Senior Notes due 2015,
$500 million
of
2.15%
Senior Notes due 2017 and
$2.0 billion
of
3.55%
Senior Notes due 2022 for total net proceeds of
$2.97 billion
. Interest on the
1.40%
Senior Notes is payable semiannually on
February 13 and August 13
. Interest on the
2.15%
Senior Notes and the
3.55%
Senior Notes is payable semiannually on
March 1 and September 1
. The
1.40%
Senior Notes and the
2.15%
Senior Notes are redeemable in whole or in part, at the option of FCX, at a make-whole redemption price prior to the redemption date. The
3.55%
Senior Notes are redeemable in whole or in part, at the option of FCX, at a make-whole redemption price prior to December 1, 2021, and thereafter at
100 percent
of principal. These senior notes rank equally with FCX's other existing and future unsecured and unsubordinated indebtedness.
In March 2007, in connection with financing FCX’s acquisition of FMC, FCX sold
$3.5 billion
of
8.375%
Senior Notes due April 2017,
$1.5 billion
of
8.25%
Senior Notes due April 2015 and
$1.0 billion
of Senior Floating Rate Notes due April 2015 for total net proceeds of
$5.9 billion
. During 2010, FCX purchased in open-market transactions
$218 million
of the
8.25%
Senior Notes for
$237 million
and
$329 million
of the
8.375%
Senior Notes for
$358 million
, which resulted in losses on early extinguishment of debt totaling
$55 million
(
$48 million
to net income attributable to FCX common stockholders). On
April 1, 2010
, FCX redeemed all of its
$1 billion
of outstanding Senior Floating Rates Notes for which holders received
101 percent
of the principal amount together with accrued and unpaid interest. As a result of this redemption, FCX recorded a loss on early extinguishment of debt totaling
$22 million
(
$20 million
to net income attributable to FCX common stockholders) during 2010. On
April 1, 2011
, FCX redeemed all its remaining
$1.1 billion
of outstanding
8.25%
Senior Notes for which holders received
104.125
percent of the principal amount together with accrued and unpaid interest. As a result of this redemption, FCX recorded a loss on early extinguishment of debt totaling
$55 million
(
$49 million
to net income attributable to FCX common stockholders) during 2011. On
March 14, 2012
, FCX redeemed the remaining
$3.0 billion
of its outstanding
8.375%
Senior Notes due 2017, for which holders received
104.553 percent
of the principal amount together with the accrued and unpaid interest. As a result of this redemption, FCX recorded a loss on early extinguishment of debt of
$168 million
(
$149 million
to net income attributable to FCX common stockholders) during 2012.
In March 2007, in connection with the acquisition of FMC, FCX assumed the 9½% Senior Notes due 2031, the 6
1
/
8
% Senior Notes due March 2034 and the 7
1
/
8
% Debentures due November 2027 with a stated value of
$462 million
. These senior notes and debentures bear interest payable semiannually and are redeemable in whole or in part, at the option of FCX, at a make-whole redemption price. The carrying value of these senior notes and debentures were increased by a net
$32 million
to reflect the fair market value at the acquisition date. The net increase in value is being amortized over the term of these senior notes and debentures and recorded as a net reduction to interest expense. During 2010, FCX purchased in an open-market transaction
$18 million
of the 9½% Senior Notes for
$26 million
and recorded losses on early extinguishment of debt totaling
$4 million
(
$3 million
to net income attributable to FCX common stockholders). During 2011, FCX purchased in an open-market transaction
$35 million
of the 9½% Senior Notes for
$49 million
and recorded losses on early extinguishment of debt totaling
$6 million
(
$5 million
to net income attributable to FCX common stockholders). At
December 31, 2012
, the outstanding principal amount of these senior notes and debentures was
$346 million
.
All of FCX’s senior notes are unsecured.
Restrictive Covenants.
FCX's credit facility and senior notes contain certain restrictive covenants. The credit facility includes covenants that are typical for investment-grade companies, including limitations on liens and subsidiary debt. The credit facility also includes financial ratios governing maximum total leverage and minimum interest coverage. The senior notes contain limitations on liens that are generally typical for investment-grade companies.
Maturities.
Maturities of debt instruments based on the amounts and terms outstanding at
December 31, 2012
, total
$2 million
in 2013,
$500 million
in 2015,
$500 million
in 2017 and
$2,525 million
thereafter.
139
Pension Plans.
Following is a discussion of FCX’s pension plans.
FMC Plans.
FMC has trusteed, non-contributory pension plans covering substantially all of its U.S. employees and some employees of its international subsidiaries hired before 2007. The applicable FMC plan design determines the manner in which benefits are calculated for any particular group of employees. For certain of these plans, benefits are calculated based on final average monthly compensation and years of service. In the case of other plans, benefits are calculated based on a fixed amount for each year of service. Participants in the FMC plans generally vest in their accrued benefits after five years of service. Non-bargained FMC employees hired after December 31, 2006, are not eligible to participate in the FMC U.S. pension plan.
FCX’s funding policy for these plans provides that contributions to pension trusts shall be at least equal to the minimum funding requirements of the Employee Retirement Income Security Act of 1974, as amended, for U.S. plans; or, in the case of international plans, the minimum legal requirements that may be applicable in the various countries. Additional contributions also may be made from time to time.
FCX’s policy for determining asset-mix targets for the Freeport-McMoRan Corporation Defined Benefit Master Trust (Master Trust) includes the periodic development of asset and liability studies to determine expected long-term rates of return and expected risk for various investment portfolios. FCX’s retirement plan administration and investment committee considers these studies in the formal establishment of asset-mix targets. FCX’s investment objective emphasizes the need to maintain a well-diversified investment program through both the allocation of the Master Trust assets among asset classes and the selection of investment managers whose various styles are fundamentally complementary to one another and serve to achieve satisfactory rates of return. Diversification, by asset class and by investment manager, is FCX’s principal means of reducing volatility and exercising prudent investment judgment. FCX’s present target asset allocation approximates
49 percent
equity investments (
39 percent
global equities,
6 percent
emerging markets equities and
4 percent
U.S. equities),
40 percent
fixed income (
16 percent
long-term treasury STRIPS or "separate trading or registered interest and principal securities,"
5 percent
international fixed income,
5 percent
high yield,
4 percent
treasury inflation-protection securities,
4 percent
long-term U.S. treasury/agency bonds,
3 percent
long-term high-credit quality corporate bonds and
3 percent
emerging markets fixed income) and
11 percent
alternative investments (
5 percent
real estate investment trusts,
3 percent
private equity and
3 percent
private real estate).
The expected rate of return on plan assets is evaluated at least annually, taking into consideration asset allocation, historical returns on the types of assets held in the Master Trust and the current economic environment. Based on these factors, FCX expects the pension assets will earn an average of
7.5 percent
per annum beginning January 1, 2013. The
7.5 percent
estimation was based on a passive return on a compound basis of
6.7 percent
and a premium for active management of
0.8 percent
reflecting the target asset allocation and current investment array.
For estimation purposes, FCX assumes the long-term asset mix for these plans generally will be consistent with the current mix. Changes in the asset mix could impact the amount of recorded pension income or expense, the funded status of the plans and the need for future cash contributions. A lower-than-expected return on assets also would decrease plan assets and increase the amount of recorded pension expense in future years. When calculating the expected return on plan assets, FCX uses the market value of assets.
140
Among the assumptions used to estimate the benefit obligation is a discount rate used to calculate the present value of expected future benefit payments for service to date. The discount rate assumption for FCX’s U.S. plans is designed to reflect yields on high-quality, fixed-income investments for a given duration. The determination of the discount rate for these plans is based on expected future benefit payments for service to date together with the Mercer Pension Discount Curve - Above Mean Yield. The Mercer Pension Discount Curve - Above Mean Yield is constructed from the bonds in the Mercer Pension Discount Curve that have a yield higher than the regression mean yield curve. The Mercer Pension Discount Curve consists of spot (
i.e.
, zero coupon) interest rates at one-half year increments for each of the next
30
years and is developed based on pricing and yield information for high-quality corporate bonds. Prior to December 31, 2012, FCX determined its discount rate using the Mercer Pension Discount Curve. Changes in the discount rate are reflected in FCX’s benefit obligation and, therefore, in future pension costs.
Other FCX Plans.
In February 2004, FCX established an unfunded Supplemental Executive Retirement Plan (SERP) for its two most senior executive officers. The SERP provides for retirement benefits payable in the form of a joint and survivor annuity or an equivalent lump sum. The annuity will equal a percentage of the executive’s highest average compensation for any consecutive three-year period during the five years immediately preceding the earlier of the executive’s retirement or completion of
25
years of credited service. The SERP benefit will be reduced by the value of all benefits paid or due under any defined benefit or defined contribution plan sponsored by FM Services Company, FCX’s wholly owned subsidiary, FCX or its predecessor, but not including accounts funded exclusively by deductions from participant’s pay. FCX also has an unfunded pension plan for its directors and an excess benefits plan for its executives, both of which no longer accrue benefits.
PT Freeport Indonesia Plan.
PT Freeport Indonesia has a defined benefit pension plan denominated in Indonesian rupiah covering substantially all of its Indonesian national employees. PT Freeport Indonesia funds the plan and invests the assets in accordance with Indonesian pension guidelines. The pension obligation was valued at an exchange rate of
9,622
rupiah to one U.S. dollar on
December 31, 2012
, and
9,060
rupiah to one U.S. dollar on
December 31, 2011
. Indonesian labor laws enacted in 2003 require that companies provide a minimum level of benefits to employees upon employment termination based on the reason for termination and the employee’s years of service. PT Freeport Indonesia’s pension benefit disclosures include benefits related to this law. PT Freeport Indonesia’s expected rate of return on plan assets is evaluated at least annually, taking into consideration its long-range estimated return for the plan based on the asset mix. Based on these factors, PT Freeport Indonesia expects its pension assets will earn an average of
7.5 percent
per annum beginning January 1, 2013.
Atlantic Copper Plan.
Atlantic Copper has a contractual obligation denominated in euros to supplement amounts paid to certain retired Spanish national employees. As required by Spanish law, beginning in August 2002, Atlantic Copper began funding
7.2 million
euros (
$9 million
based on a
December 31, 2012
, exchange rate of
$1.32
per euro) annually for
15
years to an approved insurance company for its estimated
72 million
euro contractual obligation to the retired employees. The insurance company invests the plan assets in accordance with Spanish regulations, and Atlantic Copper has no control over these investments.
Plan Information.
FCX uses a measurement date of
December 31
for its plans. Information for those plans where the accumulated benefit obligations exceed the plan assets follows:
|
|
December 31,
|
||||||
|
|
2012
|
2011
|
|||||
|
Projected benefit obligation
|
$
|
2,247
|
|
$
|
2,055
|
|
|
|
Accumulated benefit obligation
|
2,031
|
|
1,874
|
|
|||
|
Fair value of plan assets
|
1,443
|
|
1,261
|
|
|||
141
Information on the FCX (including FMC’s plans and FCX’s SERP, director and excess benefits plans), PT Freeport Indonesia and Atlantic Copper plans as of
December 31
follows:
|
FCX
|
PT Freeport
Indonesia
|
Atlantic Copper
|
|||||||||||||||||||||
|
|
2012
|
2011
|
2012
|
2011
|
2012
|
2011
|
|||||||||||||||||
|
Change in benefit obligation:
|
|
|
|
|
|
|
|||||||||||||||||
|
Benefit obligation at beginning
|
|
|
|
|
|
|
|||||||||||||||||
|
of year
|
$
|
1,791
|
|
$
|
1,598
|
|
$
|
206
|
|
$
|
135
|
|
$
|
65
|
|
$
|
71
|
|
|||||
|
Service cost
|
27
|
|
24
|
|
17
|
|
13
|
|
—
|
|
—
|
|
|||||||||||
|
Interest cost
|
79
|
|
83
|
|
14
|
|
11
|
|
2
|
|
3
|
|
|||||||||||
|
Actuarial losses
|
142
|
|
172
|
|
25
|
|
55
|
|
—
|
|
—
|
|
|||||||||||
|
Foreign exchange losses (gains)
|
1
|
|
(1
|
)
|
(13
|
)
|
(1
|
)
|
—
|
|
(1
|
)
|
|||||||||||
|
Benefits paid
|
(86
|
)
|
(85
|
)
|
(9
|
)
|
(7
|
)
|
(7
|
)
|
(8
|
)
|
|||||||||||
|
Benefit obligation at end of year
|
1,954
|
|
1,791
|
|
240
|
|
206
|
|
60
|
|
65
|
|
|||||||||||
|
Change in plan assets:
|
|
|
|
|
|
|
|||||||||||||||||
|
Fair value of plan assets at
|
|
|
|
|
|
|
|||||||||||||||||
|
beginning of year
|
1,141
|
|
1,112
|
|
107
|
|
97
|
|
26
|
|
23
|
|
|||||||||||
|
Actual return on plan assets
|
140
|
|
88
|
|
12
|
|
9
|
|
—
|
|
—
|
|
|||||||||||
|
Employer contributions
a
|
105
|
|
26
|
|
26
|
|
9
|
|
9
|
|
11
|
|
|||||||||||
|
Foreign exchange losses
|
—
|
|
—
|
|
(6
|
)
|
(1
|
)
|
(1
|
)
|
—
|
|
|||||||||||
|
Benefits paid
|
(86
|
)
|
(85
|
)
|
(9
|
)
|
(7
|
)
|
(7
|
)
|
(8
|
)
|
|||||||||||
|
Fair value of plan assets at end
|
|
|
|
|
|
|
|||||||||||||||||
|
of year
|
1,300
|
|
1,141
|
|
130
|
|
107
|
|
27
|
|
26
|
|
|||||||||||
|
Funded status
|
$
|
(654
|
)
|
$
|
(650
|
)
|
$
|
(110
|
)
|
$
|
(99
|
)
|
$
|
(33
|
)
|
$
|
(39
|
)
|
|||||
|
Accumulated benefit obligation
|
$
|
1,842
|
|
$
|
1,701
|
|
$
|
136
|
|
$
|
115
|
|
$
|
60
|
|
$
|
65
|
|
|||||
|
Weighted-average assumptions
|
|
|
|
|
|
|
|||||||||||||||||
|
used to determine benefit obligations:
|
|
|
|
|
|
|
|||||||||||||||||
|
Discount rate
b
|
4.10
|
%
|
4.60
|
%
|
6.25
|
%
|
7.00
|
%
|
6.77
|
%
|
6.77
|
%
|
|||||||||||
|
Rate of compensation increase
c
|
3.75
|
%
|
3.75
|
%
|
8.00
|
%
|
8.00
|
%
|
NA
|
|
NA
|
|
|||||||||||
|
Balance sheet classification of
|
|
|
|
|
|
|
|||||||||||||||||
|
funded status:
|
|
|
|
|
|
|
|||||||||||||||||
|
Other assets
|
$
|
7
|
|
$
|
6
|
|
$
|
—
|
|
$
|
—
|
|
$
|
—
|
|
$
|
—
|
|
|||||
|
Accounts payable and
|
|
|
|
|
|
|
|||||||||||||||||
|
accrued liabilities
|
(4
|
)
|
(4
|
)
|
—
|
|
—
|
|
—
|
|
—
|
|
|||||||||||
|
Other liabilities
|
(657
|
)
|
(652
|
)
|
(110
|
)
|
(99
|
)
|
(33
|
)
|
(39
|
)
|
|||||||||||
|
Total
|
$
|
(654
|
)
|
$
|
(650
|
)
|
$
|
(110
|
)
|
$
|
(99
|
)
|
$
|
(33
|
)
|
$
|
(39
|
)
|
|||||
|
a.
|
Employer contributions for
2013
are expected to approximate
$27 million
for the FCX plans,
$27 million
for the PT Freeport Indonesia plan (based on a
December 31, 2012
, exchange rate of
9,622
Indonesian rupiah to one U.S. dollar) and
$9 million
for the Atlantic Copper plan (based on a
December 31, 2012
, exchange rate of
$1.32
per euro).
|
|
b.
|
The discount rate shown in
2012
and
2011
for the FCX plans related to all plans except the SERP plan. The SERP plan’s discount rate in
2012
and
2011
was
4.00 percent
.
|
|
c.
|
The rate of compensation increase shown for the FCX plans related only to the FMC plans.
|
142
The weighted-average assumptions used to determine net periodic benefit cost and the components of net periodic benefit cost for FCX’s pension plans (FMC’s plans and FCX’s SERP, director and excess benefits plans) for the years ended
December 31
follow:
|
|
2012
|
2011
|
2010
|
||||||||
|
Weighted-average assumptions:
|
|
|
|
||||||||
|
Discount rate:
|
|
|
|
||||||||
|
FMC plans
|
4.60
|
%
|
5.40
|
%
|
5.80
|
%
|
|||||
|
FCX SERP
|
4.00
|
%
|
4.00
|
%
|
4.00
|
%
|
|||||
|
Expected return on plan assets
a
|
7.50
|
%
|
8.00
|
%
|
8.50
|
%
|
|||||
|
Rate of compensation increase
a
|
3.75
|
%
|
3.75
|
%
|
4.25
|
%
|
|||||
|
Service cost
|
$
|
27
|
|
$
|
24
|
|
$
|
26
|
|
||
|
Interest cost
|
79
|
|
83
|
|
82
|
|
|||||
|
Expected return on plan assets
|
(86
|
)
|
(86
|
)
|
(87
|
)
|
|||||
|
Amortization of prior service cost
|
(1
|
)
|
(1
|
)
|
(1
|
)
|
|||||
|
Amortization of net actuarial losses
|
33
|
|
19
|
|
22
|
|
|||||
|
Net periodic benefit cost
|
$
|
52
|
|
$
|
39
|
|
$
|
42
|
|
||
|
a.
|
The assumptions shown relate only to the FMC plans.
|
The weighted-average assumptions used to determine net periodic benefit cost and the components of net periodic benefit cost for PT Freeport Indonesia’s pension plan for the years ended
December 31
follow:
|
|
2012
|
2011
|
2010
|
||||||||
|
Weighted-average assumptions:
|
|
|
|
||||||||
|
Discount rate
|
7.00
|
%
|
8.50
|
%
|
10.50
|
%
|
|||||
|
Expected return on plan assets
|
9.25
|
%
|
9.25
|
%
|
8.25
|
%
|
|||||
|
Rate of compensation increase
|
8.00
|
%
|
8.00
|
%
|
8.00
|
%
|
|||||
|
Service cost
|
$
|
17
|
|
$
|
13
|
|
$
|
8
|
|
||
|
Interest cost
|
14
|
|
11
|
|
8
|
|
|||||
|
Expected return on plan assets
|
(9
|
)
|
(9
|
)
|
(7
|
)
|
|||||
|
Amortization of prior service cost
|
1
|
|
1
|
|
1
|
|
|||||
|
Amortization of net actuarial loss
|
7
|
|
3
|
|
—
|
|
|||||
|
Net periodic benefit cost
|
$
|
30
|
|
$
|
19
|
|
$
|
10
|
|
||
Included in accumulated other comprehensive loss are the following amounts that have not been recognized in net periodic pension cost as of December 31:
|
2012
|
2011
|
||||||||||||||
|
|
Before Taxes
|
After Taxes and Noncontrolling Interests
|
Before Taxes
|
After Taxes and Noncontrolling Interests
|
|||||||||||
|
Prior service credits
|
$
|
(2
|
)
|
$
|
(1
|
)
|
$
|
(2
|
)
|
$
|
(1
|
)
|
|||
|
Net actuarial loss
|
705
|
|
429
|
|
642
|
|
390
|
|
|||||||
|
$
|
703
|
|
$
|
428
|
|
$
|
640
|
|
$
|
389
|
|
||||
Actuarial losses in excess of
10 percent
of the greater of the projected benefit obligation or market-related value of plan assets are amortized over the expected average remaining future service period of the current active participants. The amount expected to be recognized in
2013
net periodic pension cost for actuarial losses is
$47 million
(
$29 million
net of tax and noncontrolling interests).
FCX does not expect to have any plan assets returned to it in
2013
. Plan assets are classified within a fair value hierarchy that prioritizes the inputs to valuation techniques used to measure fair value. The hierarchy gives the highest priority to unadjusted quoted prices in active markets for identical assets or liabilities (Level 1), then to significant observable inputs (Level 2) and the lowest priority to significant unobservable inputs (Level 3). For further discussion of the different levels of the fair value hierarchy, refer to Note
16
.
143
A summary of the fair value hierarchy for pension plan assets associated with the FCX plans follows:
|
|
Fair Value at December 31, 2012
|
||||||||||||||
|
|
Total
|
Level 1
|
Level 2
|
Level 3
|
|||||||||||
|
Commingled/collective funds:
|
|
|
|
|
|||||||||||
|
Global equity
|
$
|
481
|
|
$
|
—
|
|
$
|
481
|
|
$
|
—
|
|
|||
|
U.S. real estate securities
|
61
|
|
—
|
|
61
|
|
—
|
|
|||||||
|
U.S. small-cap equity
|
52
|
|
—
|
|
52
|
|
—
|
|
|||||||
|
Real estate property
|
41
|
|
—
|
|
—
|
|
41
|
|
|||||||
|
Short-term investments
|
40
|
|
—
|
|
40
|
|
—
|
|
|||||||
|
Open-ended mutual funds:
|
|||||||||||||||
|
Government bonds
|
48
|
|
48
|
|
—
|
|
—
|
|
|||||||
|
Emerging markets equity
|
41
|
|
41
|
|
—
|
|
—
|
|
|||||||
|
Corporate bonds
|
23
|
|
23
|
|
—
|
|
—
|
|
|||||||
|
Mutual funds:
|
|||||||||||||||
|
Foreign bonds
|
54
|
|
54
|
|
—
|
|
—
|
|
|||||||
|
Emerging markets bond
|
37
|
|
37
|
|
—
|
|
—
|
|
|||||||
|
Emerging markets equity
|
28
|
|
28
|
|
—
|
|
—
|
|
|||||||
|
Fixed income:
|
|
|
|
|
|||||||||||
|
Government bonds
|
241
|
|
—
|
|
241
|
|
—
|
|
|||||||
|
Corporate bonds
|
82
|
|
—
|
|
82
|
|
—
|
|
|||||||
|
Private equity investments
|
45
|
|
—
|
|
—
|
|
45
|
|
|||||||
|
Other investments
|
33
|
|
1
|
|
32
|
|
—
|
|
|||||||
|
Total investments
|
1,307
|
|
$
|
232
|
|
$
|
989
|
|
$
|
86
|
|
||||
|
Cash and receivables
|
5
|
|
|||||||||||||
|
Payables
|
(12
|
)
|
|||||||||||||
|
Total pension plan net assets
|
$
|
1,300
|
|
||||||||||||
|
|
Fair Value at December 31, 2011
|
||||||||||||||
|
|
Total
|
Level 1
|
Level 2
|
Level 3
|
|||||||||||
|
Commingled/collective funds:
|
|
|
|
||||||||||||
|
Global equity
|
$
|
408
|
|
$
|
—
|
|
$
|
408
|
|
$
|
—
|
|
|||
|
U.S. real estate securities
|
52
|
|
—
|
|
52
|
|
—
|
|
|||||||
|
U.S. small-cap equity
|
45
|
|
—
|
|
45
|
|
—
|
|
|||||||
|
Real estate property
|
35
|
|
—
|
|
—
|
|
35
|
|
|||||||
|
Short-term investments
|
22
|
|
—
|
|
22
|
|
—
|
|
|||||||
|
Open-ended mutual funds:
|
|||||||||||||||
|
Government bonds
|
50
|
|
50
|
|
—
|
|
—
|
|
|||||||
|
Emerging markets equity
|
36
|
|
36
|
|
—
|
|
—
|
|
|||||||
|
Corporate bonds
|
22
|
|
22
|
|
—
|
|
—
|
|
|||||||
|
Mutual funds:
|
|||||||||||||||
|
Foreign bonds
|
43
|
|
43
|
|
—
|
|
—
|
|
|||||||
|
Emerging markets bond
|
32
|
|
32
|
|
—
|
|
—
|
|
|||||||
|
Emerging markets equity
|
24
|
|
24
|
|
—
|
|
—
|
|
|||||||
|
Fixed income:
|
|||||||||||||||
|
Government bonds
|
233
|
|
—
|
|
233
|
|
—
|
|
|||||||
|
Corporate bonds
|
73
|
|
—
|
|
73
|
|
—
|
|
|||||||
|
Private equity investments
|
50
|
|
—
|
|
—
|
|
50
|
|
|||||||
|
Other investments
|
23
|
|
—
|
|
23
|
|
—
|
|
|||||||
|
Total investments
|
1,148
|
|
$
|
207
|
|
$
|
856
|
|
$
|
85
|
|
||||
|
Cash and receivables
|
6
|
|
|||||||||||||
|
Payables
|
(13
|
)
|
|||||||||||||
|
Total pension plan net assets
|
$
|
1,141
|
|
||||||||||||
144
Following is a description of the pension plan asset categories and the valuation techniques used to measure fair value. There have been no changes to the techniques used to measure fair value.
Commingled/collective funds are managed by several fund managers and are valued at the net asset value per unit of the fund. For most of these funds, the majority of the underlying assets are actively traded equity securities; however, the unit level is considered to be at the fund level. These funds (except the real estate property funds) require less than a month's notice for redemptions and, as such, are classified within Level 2 of the fair value hierarchy. Real estate property funds are valued at net realizable value using information from independent appraisal firms, who have knowledge and expertise about the current market values of real property in the same vicinity as the investments. Redemptions of the real estate property funds are allowed once per quarter, subject to available cash and, as such, are classified within Level 3 of the fair value hierarchy.
Open-ended mutual funds are managed by registered investment companies and are valued at the daily published net asset value of shares/units held. Because redemptions and purchases of shares/units occur at the net asset value without any adjustments to the published net asset value that is provided on an ongoing basis (active-market criteria are met), these investments are classified within Level 1 of the fair value hierarchy.
Mutual funds are valued at the closing price reported on the active market on which the individual securities are traded and, as such, are classified within Level 1 of the fair value hierarchy.
Fixed income investments include government and corporate bonds held directly by the Master Trust or through commingled funds. Fixed income securities are valued using a bid evaluation or a mid evaluation and, as such, are classified within Level 2 of the fair value hierarchy. A bid evaluation is an estimated price at which a dealer would pay for a security. A mid evaluation is the average of the estimated price at which a dealer would sell a security and the estimated price at which a dealer would pay for a security. These evaluations are based on quoted prices, if available, or models that use observable inputs.
Private equity investments are valued at net realizable value using information from general partners and, as such, are classified within Level 3 of the fair value hierarchy because of the inherent restrictions on redemptions that may affect the ability to sell the investments at their net asset value in the near term.
A summary of changes in the fair value of FCX’s Level 3 pension plan assets for the years ended
December 31
follow:
|
Private
Equity Investments |
Real
Estate
Property
|
Total
|
|||||||||
|
Balance at January 1, 2011
|
$
|
46
|
|
$
|
28
|
|
$
|
74
|
|
||
|
Actual return on plan assets:
|
|||||||||||
|
Realized (losses) gains
|
(2
|
)
|
2
|
|
—
|
|
|||||
|
Net unrealized gains related to
|
|||||||||||
|
assets still held at the end of the year
|
5
|
|
5
|
|
10
|
|
|||||
|
Purchases
|
5
|
|
—
|
|
5
|
|
|||||
|
Settlements, net
|
(4
|
)
|
—
|
|
(4
|
)
|
|||||
|
Balance at December 31, 2011
|
50
|
|
35
|
|
85
|
|
|||||
|
Actual return on plan assets:
|
|
|
|
||||||||
|
Realized gains
|
—
|
|
2
|
|
2
|
|
|||||
|
Net unrealized (losses) gains related to
|
|
|
|
||||||||
|
assets still held at the end of the year
|
(5
|
)
|
4
|
|
(1
|
)
|
|||||
|
Purchases
|
4
|
|
—
|
|
4
|
|
|||||
|
Settlements, net
|
(4
|
)
|
—
|
|
(4
|
)
|
|||||
|
Balance at December 31, 2012
|
$
|
45
|
|
$
|
41
|
|
$
|
86
|
|
||
145
A summary of the fair value hierarchy for pension plan assets associated with the PT Freeport Indonesia plan follows:
|
|
Fair Value at December 31, 2012
|
||||||||||||||
|
|
Total
|
Level 1
|
Level 2
|
Level 3
|
|||||||||||
|
Common stocks
|
$
|
32
|
|
$
|
32
|
|
$
|
—
|
|
$
|
—
|
|
|||
|
Government bonds
|
27
|
|
27
|
|
—
|
|
—
|
|
|||||||
|
Mutual funds
|
10
|
|
10
|
|
—
|
|
—
|
|
|||||||
|
Total investments
|
69
|
|
$
|
69
|
|
$
|
—
|
|
$
|
—
|
|
||||
|
Cash and receivables
a
|
61
|
|
|||||||||||||
|
Total pension plan net assets
|
$
|
130
|
|
||||||||||||
|
|
Fair Value at December 31, 2011
|
||||||||||||||
|
|
Total
|
Level 1
|
Level 2
|
Level 3
|
|||||||||||
|
Common stocks
|
$
|
29
|
|
$
|
29
|
|
$
|
—
|
|
$
|
—
|
|
|||
|
Government bonds
|
22
|
|
22
|
|
—
|
|
—
|
|
|||||||
|
Total investments
|
51
|
|
$
|
51
|
|
$
|
—
|
|
$
|
—
|
|
||||
|
Cash and receivables
a
|
56
|
|
|||||||||||||
|
Total pension plan net assets
|
$
|
107
|
|
||||||||||||
|
a.
|
Cash consisted primarily of short-term time deposits.
|
Following is a description of the valuation techniques used for pension plan assets measured at fair value associated with the PT Freeport Indonesia plan. There have been no changes to the techniques used to measure fair value.
Common stocks, government bonds and mutual funds are valued at the closing price reported on the active market on which the individual securities are traded.
The techniques described above may produce a fair value calculation that may not be indicative of net realizable value or reflective of future fair values. Furthermore, while FCX believes its valuation techniques are appropriate and consistent with other market participants, the use of different techniques or assumptions to determine the fair value of certain financial instruments could result in a different fair value measurement at the reporting date.
The expected benefit payments for FCX’s (including FMC’s plans and FCX’s SERP, director and excess benefits plans) and PT Freeport Indonesia’s pension plans follow:
|
FCX
|
PT Freeport
Indonesia
a
|
||||||
|
2013
|
$
|
89
|
|
$
|
14
|
|
|
|
2014
|
141
|
|
10
|
|
|||
|
2015
|
92
|
|
11
|
|
|||
|
2016
|
95
|
|
11
|
|
|||
|
2017
|
98
|
|
15
|
|
|||
|
2018 through 2022
|
536
|
|
130
|
|
|||
|
a.
|
Based on a
December 31, 2012
, exchange rate of
9,622
Indonesian rupiah to one U.S. dollar.
|
Atlantic Copper’s plan is administered by a third-party insurance company, and Atlantic Copper is not provided asset allocations. Atlantic Copper's expected benefit payments by a third-party insurance company are
$7 million
per year (based on a
December 31, 2012
, exchange rate of
$1.32
per euro).
Postretirement and Other Benefits.
FCX also provides postretirement medical and life insurance benefits for certain U.S. employees and, in some cases, employees of certain international subsidiaries. These postretirement benefits vary among plans, and many plans require contributions from retirees. The expected cost of providing such postretirement benefits is accrued during the years employees render service.
146
The discount rate for FCX’s postretirement medical and life insurance benefit plans was determined on the same basis as FCX’s pension plans. Information on the postretirement benefit plans as of
December 31
follows:
|
|
2012
|
2011
|
|||||
|
Change in benefit obligation:
|
|
|
|||||
|
Benefit obligation at beginning of year
|
$
|
223
|
|
$
|
240
|
|
|
|
Service cost
|
1
|
|
1
|
|
|||
|
Interest cost
|
9
|
|
11
|
|
|||
|
Actuarial losses (gains)
|
2
|
|
(7
|
)
|
|||
|
Benefits paid, net of employee and joint venture partner
|
|
|
|||||
|
contributions, and Medicare Part D subsidy
|
(22
|
)
|
(22
|
)
|
|||
|
Benefit obligation at end of year
|
213
|
|
223
|
|
|||
|
Change in plan assets:
|
|
|
|||||
|
Fair value of plan assets at beginning of year
|
—
|
|
—
|
|
|||
|
Employer and partner contributions
|
25
|
|
25
|
|
|||
|
Employee contributions
|
10
|
|
12
|
|
|||
|
Benefits paid
|
(35
|
)
|
(37
|
)
|
|||
|
Fair value of plan assets at end of year
|
—
|
|
—
|
|
|||
|
Funded status
|
$
|
(213
|
)
|
$
|
(223
|
)
|
|
|
Discount rate assumption
|
3.50
|
%
|
4.20
|
%
|
|||
|
Balance sheet classification of funded status:
|
|
|
|||||
|
Accounts payable and accrued liabilities
|
$
|
(21
|
)
|
$
|
(23
|
)
|
|
|
Other liabilities
|
(192
|
)
|
(200
|
)
|
|||
|
Total
|
$
|
(213
|
)
|
$
|
(223
|
)
|
|
Included in accumulated other comprehensive loss are amounts not recognized in net periodic benefit cost for unrecognized actuarial gains of
$2 million
(
$1 million
net of tax and noncontrolling interests) at
December 31, 2012
, and
$4 million
(
$3 million
net of tax and noncontrolling interests) at
December 31, 2011
. No amount is expected to be recognized in net periodic benefit cost in
2013
for unrecognized actuarial gains.
Expected benefit payments for these plans total
$21 million
for
2013
,
$19 million
for
2014
,
$18 million
for
2015
,
$17 million
for
2016
,
$16 million
for
2017
and
$76 million
for
2018 through 2022
.
The weighted-average assumptions used to determine net periodic benefit cost and the components of net periodic benefit cost for FCX’s postretirement benefits for the years ended December 31 follow:
|
|
2012
|
2011
|
2010
|
||||||||
|
Weighted-average assumptions:
|
|
|
|
||||||||
|
Discount rate
|
4.20
|
%
|
4.90
|
%
|
5.20
|
%
|
|||||
|
Service cost
|
$
|
1
|
|
$
|
1
|
|
$
|
1
|
|
||
|
Interest cost
|
9
|
|
11
|
|
13
|
|
|||||
|
Net periodic benefit cost
|
$
|
10
|
|
$
|
12
|
|
$
|
14
|
|
||
The assumed medical-care trend rates at December 31 follow:
|
|
2012
|
2011
|
|||
|
Medical-care cost trend rate assumed for
|
|
|
|||
|
the next year
|
7.75
|
%
|
8.00
|
%
|
|
|
Rate to which the cost trend rate is assumed
|
|
|
|||
|
to decline (the ultimate trend rate)
|
4.25
|
%
|
4.50
|
%
|
|
|
Year that the rate reaches the ultimate trend rate
|
2027
|
|
2026
|
|
|
147
The effect of a one-percent increase or decrease in the medical-care cost trend rates assumed for postretirement medical benefits would result in increases or decreases of less than
$1 million
in the aggregate service and interest cost components; for the postretirement benefit obligation, the effect of a one-percent increase is approximately
$6 million
and the effect of a one-percent decrease is approximately
$5 million
.
FCX has a number of postemployment plans covering severance, long-term disability income, continuation of health and life insurance coverage for disabled employees or other welfare benefits. The accumulated postemployment benefit consisted of a current portion of
$8 million
(included in accounts payable and accrued liabilities) and a long-term portion of
$69 million
(included in other liabilities) at
December 31, 2012
, and a current portion of
$7 million
(included in accounts payable and accrued liabilities) and a long-term portion of
$57 million
(included in other liabilities) at
December 31, 2011
.
FCX also sponsors savings plans for the majority of its U.S. employees. The plans allow employees to contribute a portion of their pre-tax income in accordance with specified guidelines. These savings plans are principally qualified 401(k) plans for all U.S. salaried and non-bargained hourly employees. In these plans, participants exercise control and direct the investment of their contributions and account balances among various investment options. FCX contributes to these plans at varying rates and matches a percentage of employee pre-tax deferral contributions up to certain limits, which vary by plan. For employees whose eligible compensation exceeds certain levels, FCX provides an unfunded defined contribution plan, which has a liability balance of
$59 million
at
December 31, 2012
, and
$56 million
at
December 31, 2011
.
The costs charged to operations for employee savings plans totaled
$43 million
in
2012
,
$35 million
in
2011
and
$36 million
in
2010
. FCX has other employee benefit plans, certain of which are related to FCX’s financial results, which are recognized in operating costs.
FCX’s authorized shares of capital stock total
1.85 billion
shares, consisting of
1.8 billion
shares of common stock and
50 million
shares of preferred stock.
Common Stock.
At
December 31, 2012
,
23.7 million
shares remain available for purchase under FCX's open-market share purchase program, which does not have an expiration date. There have been no purchases under this program since 2008. The timing of future purchases of FCX’s common stock is dependent on many factors, including FCX’s operating results, cash flows and financial position; copper, molybdenum and gold prices; the impact of the proposed acquisitions; the price of FCX’s common stock; and general economic and market conditions.
FCX’s Board of Directors (the Board) authorized increases in the cash dividend on FCX’s common stock to an annual rate of
$0.60
per share in April 2010, then to an annual rate of
$1.00
per share in October 2010 and then to the current annual rate of
$1.25
per share in February 2012. The Board also declared two supplemental cash dividends of
$0.50
per share, which were paid in December 2010 and June 2011. On
December 26, 2012
, the Board declared a regular quarterly dividend of
$0.3125
per share, which was paid on
February 1, 2013
, to common shareholders of record at the close of business on
January 15, 2013
. The declaration of dividends is at the discretion of the Board and will depend on FCX's financial results, cash requirements, future prospects and other factors deemed relevant by the Board.
Preferred Stock.
On
March 28, 2007
, FCX sold
28.75 million
shares of
6¾%
Mandatory Convertible Preferred Stock for net proceeds of
$2.8 billion
. The
6¾%
Mandatory Convertible Preferred Stock was automatically converted on
May 1, 2010
, into
78.9 million
shares of FCX common stock.
Stock Award Plans.
FCX currently has awards outstanding under its stock-based compensation plans, including two FMC plans resulting from the 2007 acquisition. As of
December 31, 2012
, only two plans, both of which are stockholder approved and are discussed below, have awards available for grant.
The 2003 Stock Incentive Plan (the 2003 Plan) provides for the issuance of stock options, SARs, restricted stock, restricted stock units and other stock-based awards. The 2003 Plan allows FCX to grant awards for up to
16 million
common shares to eligible participants. In 2006, FCX’s stockholders approved the 2006 Stock Incentive Plan (the 2006 Plan), and FCX’s stockholders approved amendments to the plan in 2007 primarily to increase the number of shares available for grants and in 2010 to permit grants to outside directors. The 2006 Plan provides for the issuance of stock options, SARs, restricted stock, restricted stock units and other stock-based awards for up to
74
148
million
common shares. As of
December 31, 2012
, shares available for grant totaled
32.1 million
under the 2006 Plan and
2,446
shares under the 2003 Plan.
Stock-Based Compensation Cost.
Compensation cost charged against earnings for stock-based awards for the years ended
December 31
follows:
|
|
2012
|
2011
|
2010
|
|
||||||||
|
Stock options awarded to employees (including directors)
|
$
|
82
|
|
$
|
84
|
|
$
|
84
|
|
|
||
|
Stock options awarded to nonemployees
|
2
|
|
1
|
|
5
|
|
|
|||||
|
Restricted stock units awarded to employees
|
|
|||||||||||
|
(including directors)
|
16
|
|
32
|
|
30
|
|
|
|||||
|
Restricted stock awards to employees
|
—
|
|
—
|
|
1
|
|
|
|||||
|
SARs
|
—
|
|
(2
|
)
|
2
|
|
||||||
|
Total stock-based compensation cost
a
|
100
|
|
115
|
|
122
|
|
||||||
|
Tax benefit
|
(36
|
)
|
(42
|
)
|
(45
|
)
|
||||||
|
Noncontrolling interests’ share
|
(3
|
)
|
(4
|
)
|
(3
|
)
|
||||||
|
Impact on net income
|
$
|
61
|
|
$
|
69
|
|
$
|
74
|
|
|
||
|
a.
|
Amounts were before Rio Tinto’s share of the cost of employee exercises of in-the-money stock options, which decreased consolidated selling, general and administrative expenses by
$3 million
in
2011
and
$4 million
in
2010
. There was
no
Rio Tinto sharing in 2012.
|
FCX did not capitalize any stock-based compensation costs to property, plant, equipment and development costs during the years ended
December 31, 2012
,
2011
and
2010
.
Stock Options and SARs.
Stock options and SARs granted under the plans generally expire
10
years after the date of grant and vest in
25 percent
annual increments beginning one year from the date of grant. The plans and award agreements provide that participants will receive the following year’s vesting after retirement and provide for accelerated vesting if there is a change in control (as defined in the plans). Therefore, FCX accelerates one year of amortization for retirement-eligible employees.
A summary of options outstanding as of
December 31, 2012
, including
39,336
SARs, and changes during the year ended
December 31, 2012
, follows:
|
Number of
Options
|
Weighted-
Average
Option Price
|
Weighted-
Average
Remaining
Contractual
Term (years)
|
Aggregate
Intrinsic
Value
|
|||||||||
|
Balance at January 1
|
27,967,145
|
|
$
|
34.90
|
|
|
||||||
|
Granted
|
5,050,500
|
|
46.32
|
|
|
|||||||
|
Exercised
|
(1,300,273
|
)
|
16.68
|
|
|
|||||||
|
Expired/Forfeited
|
(244,813
|
)
|
45.23
|
|
|
|||||||
|
Balance at December 31
|
31,472,559
|
|
37.40
|
|
6.4
|
$
|
102
|
|
||||
|
Vested and exercisable at December 31
|
17,731,809
|
|
$
|
34.41
|
|
5.3
|
$
|
65
|
|
|||
Summaries of options outstanding, including SARs, and changes during the years ended
December 31
follow:
|
|
2011
|
2010
|
|||||||||||
|
Number of
Options
|
Weighted-
Average
Option
Price
|
Number of
Options
|
Weighted-
Average
Option
Price
|
||||||||||
|
Balance at January 1
|
26,930,444
|
|
$
|
30.22
|
|
24,921,594
|
|
$
|
27.59
|
|
|||
|
Granted
|
4,230,500
|
|
55.43
|
|
8,303,000
|
|
36.15
|
|
|||||
|
Exercised
|
(3,044,174
|
)
|
21.88
|
|
(6,081,650
|
)
|
27.54
|
|
|||||
|
Expired/Forfeited
|
(149,625
|
)
|
37.61
|
|
(212,500
|
)
|
30.29
|
|
|||||
|
Balance at December 31
|
27,967,145
|
|
34.90
|
|
26,930,444
|
|
30.22
|
|
|||||
149
The fair value of each option award is estimated on the date of grant using the Black-Scholes-Merton option valuation model. Expected volatility is based on implied volatilities from traded options on FCX’s common stock and historical volatility of FCX’s common stock. FCX uses historical data to estimate future option exercises, forfeitures and expected life of the options. When appropriate, separate groups of employees who have similar historical exercise behavior are considered separately for valuation purposes. The expected dividend rate is calculated using the annual dividend (excluding supplemental dividends) at the date of grant. The risk-free interest rate is based on Federal Reserve rates in effect for bonds with maturity dates equal to the expected term of the option at the grant date. Information related to stock options, including SARs, during the years ended
December 31
follows:
|
|
2012
|
2011
|
2010
|
||||||||
|
Weighted-average assumptions used to value stock option awards:
|
|||||||||||
|
Expected volatility
|
52.0
|
%
|
50.9
|
%
|
51.9
|
%
|
|||||
|
Expected life of options (in years)
|
4.54
|
|
4.34
|
|
4.61
|
|
|||||
|
Expected dividend rate
|
3.1
|
%
|
1.8
|
%
|
0.8
|
%
|
|||||
|
Risk-free interest rate
|
0.7
|
%
|
1.6
|
%
|
2.2
|
%
|
|||||
|
Weighted-average grant date fair value (per share)
|
$
|
15.60
|
|
$
|
20.58
|
|
$
|
15.33
|
|
||
|
Intrinsic value of options exercised
|
$
|
34
|
|
$
|
101
|
|
$
|
129
|
|
||
|
Fair value of options vested
|
$
|
77
|
|
$
|
89
|
|
$
|
61
|
|
||
As of
December 31, 2012
, FCX had
$90 million
of total unrecognized compensation cost related to unvested stock options expected to be recognized over a weighted-average period of
1.5
years.
Restricted Stock Units.
FCX has an annual incentive plan for its executive officers that requires a portion of each executive officer's annual bonus be paid in restricted stock units. The maximum annual incentive award pool is a percentage of FCX’s consolidated operating cash flows adjusted for changes in working capital and other tax payments for the preceding year and funding of the pool is subject to a performance condition. Grants of restricted stock units before 2012 vest ratably over
three
years and provide that the FCX executive officers will receive the following year’s vesting upon retirement provided the performance condition is met. The fair value of these restricted stock unit grants was estimated based on projected operating cash flows for the applicable year and was charged to expense ratably over
three
years, beginning with the year during which the cash flows were generated as performance of services commenced in the calendar year preceding the date of grant. In February 2012, the terms of restricted stock unit awards under the annual incentive plan were revised. Beginning with 2012 grants, the level of restricted stock units granted will continue to be based on FCX's consolidated operating cash flows adjusted for changes in working capital and other tax payments for the preceding year, but the award will vest after three years subject to FCX attaining a five-year average return on investment (a performance condition defined in the award agreement) of at least
six
percent. The awards will also be subject to a
20
percent reduction if FCX performs below a group of its peers as defined in the award agreement. The fair value of the awards is estimated using an appropriate valuation model. The awards continue to vest after the recipients retirement or death; therefore, since all of FCX's executive officers are retirement eligible, FCX charges the cost of these awards to expense in the year the cash flows are generated as performance of services is only required in the calendar year preceding the date of grant.
FCX also granted other restricted stock units that vest over a period of
four
years to its directors. The plans and award agreements provide for accelerated vesting of all restricted stock units if there is a change of control (as defined in the plans). The fair value of the restricted stock units is amortized over the
four
-year vesting period or the period until the director becomes retirement-eligible, whichever is shorter. Upon a director’s retirement, all of their unvested restricted stock units immediately vest. For retirement-eligible directors, the fair value of restricted stock units is recognized in earnings on the date of grant.
Dividends and interest on restricted stock units accrue and are paid upon the award’s vesting.
150
A summary of outstanding restricted stock units as of
December 31, 2012
, and activity during the year ended
December 31, 2012
, follows:
|
Number of
Restricted
Stock Units
|
Weighted-
Average
Remaining
Contractual
Term (years)
|
Aggregate
Intrinsic
Value
|
||||||
|
Balance at January 1
|
1,265,276
|
|
|
|
||||
|
Granted
|
306,194
|
|
|
|
||||
|
Vested
|
(681,772
|
)
|
|
|
||||
|
Balance at December 31
|
889,698
|
|
2.6
|
$
|
30
|
|
||
The total grant-date fair value of restricted stock units granted during the year ended
December 31, 2012
, was
$14 million
. The total intrinsic value of restricted stock units vested was
$28 million
during
2012
,
$69 million
during
2011
and
$50 million
during
2010
. As of
December 31, 2012
, FCX had
$1 million
of total unrecognized compensation cost related to unvested restricted stock units expected to be recognized.
Other Information.
The following table includes amounts related to exercises of stock options and vesting of restricted stock units and restricted stock awards during the years ended
December 31
:
|
|
2012
|
2011
|
2010
|
||||||||
|
FCX shares tendered to pay the exercise price
|
|
|
|
||||||||
|
and/or the minimum required taxes
a
|
515,558
|
|
936,811
|
|
934,099
|
|
|||||
|
Cash received from stock option exercises
|
$
|
15
|
|
$
|
48
|
|
$
|
109
|
|
||
|
Actual tax benefit realized for tax deductions
|
$
|
16
|
|
$
|
45
|
|
$
|
50
|
|
||
|
Amounts FCX paid for employee taxes
|
$
|
16
|
|
$
|
45
|
|
$
|
28
|
|
||
|
a.
|
Under terms of the related plans, upon exercise of stock options and vesting of restricted stock units and restricted stock awards, employees may tender FCX shares to FCX to pay the exercise price and/or the minimum required taxes.
|
Accumulated Other Comprehensive Loss.
A summary of changes in the balances of each component of accumulated other comprehensive loss follows:
|
Unrealized Gains/(Losses) on Securities
|
Translation Adjustment
|
Defined Benefit Plans
|
Deferred Tax Valuation Allowance
|
Total
|
|||||||||||||||
|
Balance at January 1, 2010
|
$
|
(5
|
)
|
$
|
8
|
|
$
|
(231
|
)
|
$
|
(45
|
)
|
$
|
(273
|
)
|
||||
|
Amounts arising during the period
a
|
2
|
|
—
|
|
(53
|
)
|
(14
|
)
|
(65
|
)
|
|||||||||
|
Amounts reclassified
b
|
—
|
|
—
|
|
15
|
|
—
|
|
15
|
|
|||||||||
|
Balance at December 31, 2010
|
(3
|
)
|
8
|
|
(269
|
)
|
(59
|
)
|
(323
|
)
|
|||||||||
|
Amounts arising during the period
a
|
(1
|
)
|
(2
|
)
|
(134
|
)
|
(20
|
)
|
(157
|
)
|
|||||||||
|
Amounts reclassified
b
|
—
|
|
—
|
|
15
|
|
—
|
|
15
|
|
|||||||||
|
Balance at December 31, 2011
|
(4
|
)
|
6
|
|
(388
|
)
|
(79
|
)
|
(465
|
)
|
|||||||||
|
Amounts arising during the period
a
|
—
|
|
(1
|
)
|
(65
|
)
|
(1
|
)
|
(67
|
)
|
|||||||||
|
Amounts reclassified
b
|
—
|
|
—
|
|
26
|
|
—
|
|
26
|
|
|||||||||
|
Balance at December 31, 2012
|
$
|
(4
|
)
|
$
|
5
|
|
$
|
(427
|
)
|
$
|
(80
|
)
|
$
|
(506
|
)
|
||||
|
a.
|
Amounts arising during the period were net of tax benefits of
$39 million
for
2012
,
$81 million
for
2011
and
$34 million
for
2010
.
|
|
b.
|
Amounts reclassified from accumulated other comprehensive loss were related to amortization of actuarial losses, which were net of taxes of
$15 million
for
2012
, and
$8 million
for
2011
and
2010
.
|
151
Geographic sources of income before income taxes and equity in affiliated companies’ net earnings for the years ended
December 31
consist of the following:
|
|
2012
|
2011
|
2010
|
||||||||
|
United States
|
$
|
1,539
|
|
$
|
2,112
|
|
$
|
1,307
|
|
||
|
Foreign
|
3,948
|
|
6,706
|
|
7,205
|
|
|||||
|
Total
|
$
|
5,487
|
|
$
|
8,818
|
|
$
|
8,512
|
|
||
FCX’s provision for income taxes for the years ended
December 31
consists of the following:
|
|
2012
|
2011
|
2010
|
||||||||
|
Current income taxes:
|
|
|
|
||||||||
|
Federal
|
$
|
238
|
|
$
|
394
|
|
$
|
207
|
|
||
|
State
|
7
|
|
21
|
|
27
|
|
|||||
|
Foreign
|
1,002
|
|
1,934
|
|
2,500
|
|
|||||
|
Total current
|
1,247
|
|
2,349
|
|
2,734
|
|
|||||
|
Deferred income taxes (benefits):
|
|
|
|
||||||||
|
Federal
|
87
|
|
82
|
|
20
|
|
|||||
|
State
|
18
|
|
(19
|
)
|
(10
|
)
|
|||||
|
Foreign
|
363
|
|
622
|
|
239
|
|
|||||
|
Total deferred
|
468
|
|
685
|
|
249
|
|
|||||
|
Changes in Peruvian taxes
|
(205
|
)
|
a,b
|
53
|
|
c
|
—
|
|
|||
|
Provision for income taxes
|
$
|
1,510
|
|
$
|
3,087
|
|
$
|
2,983
|
|
||
|
a.
|
In July 2012, Sociedad Minera Cerro Verde S.A.A. (Cerro Verde) signed a new
15
-year mining stability agreement with the Peruvian government, which is expected to become effective when the current mining stability agreement expires on December 31, 2013. In connection with the new mining stability agreement, Cerro Verde's income tax rate will increase from
30 percent
to
32 percent
. As a result of the change in the income tax rate, FCX recognized additional deferred tax expense of
$29 million
(
$25 million
net of noncontrolling interests) in 2012, which relates primarily to the assets recorded in connection with the 2007 acquisition of FMC.
|
|
b.
|
With the exception of TFM, FCX has not elected to permanently reinvest earnings from its foreign subsidiaries and has recorded deferred tax liabilities for foreign earnings that are available to be repatriated to the U.S. Cerro Verde previously recorded deferred Peruvian income tax liabilities for income taxes that would become payable if the reinvested profits used to fund the initial Cerro Verde sulfide expansion are distributed prior to the expiration of Cerro Verde's current stability agreement on December 31, 2013. Because reinvested profits at Cerro Verde are not expected to be distributed prior to December 31, 2013, a net deferred income tax liability of
$234 million
(
$123 million
net of noncontrolling interests) was reversed and recognized as an income tax benefit in 2012.
|
|
c.
|
In September 2011, Peru enacted a new mining tax and royalty regime and also created a special mining burden that companies with stability agreements can elect to pay. Cerro Verde elected to pay this special mining burden during the remaining term of its stability agreement. As a result, Cerro Verde recognized additional current (
$14 million
) and deferred (
$39 million
) tax expense totaling
$53 million
(
$49 million
net of noncontrolling interests) for the year 2011. The deferred portion of this accrual related primarily to the assets recorded in connection with the 2007 acquisition of FMC.
|
152
A reconciliation of the U.S. federal statutory tax rate to FCX’s effective income tax rate for the years ended
December 31
follows:
|
|
2012
|
2011
|
2010
|
|||||||||||||||||
|
|
Amount
|
Percent
|
Amount
|
Percent
|
Amount
|
Percent
|
||||||||||||||
|
U.S. federal statutory tax rate
|
$
|
1,920
|
|
35
|
%
|
$
|
3,086
|
|
35
|
%
|
$
|
2,979
|
|
35
|
%
|
|||||
|
Foreign tax credit limitation
|
110
|
|
2
|
|
163
|
|
2
|
|
93
|
|
1
|
|
||||||||
|
Percentage depletion
|
(263
|
)
|
(5
|
)
|
(283
|
)
|
(3
|
)
|
(263
|
)
|
(3
|
)
|
||||||||
|
Withholding and other impacts on
|
||||||||||||||||||||
|
foreign earnings
|
(221
|
)
|
a
|
(4
|
)
|
170
|
|
2
|
|
174
|
|
2
|
|
|||||||
|
Valuation allowance on minimum
|
|
|
||||||||||||||||||
|
tax credits
|
(9
|
)
|
—
|
|
(47
|
)
|
(1
|
)
|
18
|
|
—
|
|
||||||||
|
State income taxes
|
17
|
|
—
|
|
—
|
|
—
|
|
17
|
|
—
|
|
||||||||
|
Other items, net
|
(44
|
)
|
—
|
|
(2
|
)
|
—
|
|
(35
|
)
|
—
|
|
||||||||
|
Provision for income taxes
|
$
|
1,510
|
|
28
|
%
|
$
|
3,087
|
|
35
|
%
|
$
|
2,983
|
|
35
|
%
|
|||||
|
a.
|
Included the reversal of Cerro Verde's deferred income tax liability of
$234 million
.
|
FCX paid federal, state, local and foreign income taxes totaling
$1.8 billion
in
2012
,
$3.4 billion
in
2011
and
$2.6 billion
in
2010
. FCX received refunds of federal, state, local and foreign income taxes of
$69 million
in
2012
,
$15 million
in
2011
and
$26 million
in
2010
.
The components of deferred taxes follow:
|
|
December 31,
|
||||||
|
|
2012
|
2011
|
|||||
|
Deferred tax assets:
|
|
|
|||||
|
Foreign tax credits
|
$
|
2,022
|
|
$
|
2,011
|
|
|
|
Accrued expenses
|
910
|
|
962
|
|
|||
|
Minimum tax credits
|
474
|
|
406
|
|
|||
|
Net operating loss carryforwards
|
343
|
|
356
|
|
|||
|
Employee benefit plans
|
315
|
|
245
|
|
|||
|
Inventory
|
118
|
|
161
|
|
|||
|
Other
|
256
|
|
276
|
|
|||
|
Deferred tax assets
|
4,438
|
|
4,417
|
|
|||
|
Valuation allowances
|
(2,443
|
)
|
(2,393
|
)
|
|||
|
Net deferred tax assets
|
1,995
|
|
2,024
|
|
|||
|
Deferred tax liabilities:
|
|
|
|||||
|
Property, plant, equipment and development costs
|
(4,563
|
)
|
(4,227
|
)
|
|||
|
Undistributed earnings
|
(884
|
)
|
(1,010
|
)
|
|||
|
Other
|
(60
|
)
|
(72
|
)
|
|||
|
Total deferred tax liabilities
|
(5,507
|
)
|
(5,309
|
)
|
|||
|
Net deferred tax liabilities
|
$
|
(3,512
|
)
|
$
|
(3,285
|
)
|
|
At
December 31, 2012
, FCX had U.S. foreign tax credit carryforwards of
$2.0 billion
that will expire between
2013
and
2022
, and U.S. minimum tax credits carryforwards of
$474 million
that can be carried forward indefinitely, but may be used only to the extent that regular tax exceeds the alternative minimum tax in any given year.
At
December 31, 2012
, FCX had (i) DRC net operating loss carryforwards of
$468 million
that can be carried forward indefinitely, (ii) U.S. net state operating loss carryforwards of
$508 million
that expire between
2013
and
2032
, and (iii) Spanish net operating loss carryforwards of
$578 million
that expire between
2015
and
2029
.
153
On the basis of available information at
December 31, 2012
, FCX has provided valuation allowances for certain of its deferred tax assets where FCX believes it is more likely than not that some portion or all of such assets will not be realized. Valuation allowances totaled
$2.4 billion
at
December 31, 2012
and
2011
, and covered all of FCX’s U.S. foreign tax credit carryforwards, and a portion of its foreign net operating loss carryforwards, U.S. state net operating loss carryforwards, U.S. state deferred tax assets, U.S. capital loss carryforwards and U.S. minimum tax credit carryforwards. These valuation allowances include
$82 million
at
December 31, 2012
, for tax benefits that, if recognized, would be credited directly to other comprehensive income.
The
$50 million
increase in the valuation allowance during
2012
was primarily a result of an increase in FCX's U.S. foreign tax credit carryforwards, U.S. state deferred tax assets, U.S. capital loss carryforwards and U.S. state net operating loss carryforwards.
In 2010, the Chilean legislature approved an increase in mining royalty taxes to help fund earthquake reconstruction activities, education and health programs. Mining royalty taxes at FCX’s El Abra and Candelaria mines were stabilized through 2017 at a rate of
4 percent
. However, under the legislation, FCX opted to transfer from its stabilized rate to the sliding scale of
4
to
9 percent
(depending on a defined operational margin) for the years 2010 through 2012 and will return to its
4 percent
rate for the years 2013 through 2017. Beginning in 2018 and through 2023, rates will move to a sliding scale of
5
to
14 percent
.
A summary of the activities associated with FCX’s reserve for unrecognized tax benefits, interest and penalties follows:
|
Unrecognized
Tax Benefits
|
Interest
|
Penalties
|
|||||||||
|
Balance at January 1, 2011
|
$
|
200
|
|
$
|
33
|
|
$
|
—
|
|
||
|
Additions:
|
|||||||||||
|
Prior year tax positions
|
25
|
|
*
|
|
*
|
|
|||||
|
Current year tax positions
|
16
|
|
*
|
|
*
|
|
|||||
|
Interest and penalties
|
—
|
|
7
|
|
—
|
|
|||||
|
Decreases:
|
|||||||||||
|
Prior year tax positions
|
(34
|
)
|
*
|
|
*
|
|
|||||
|
Current year tax positions
|
(8
|
)
|
*
|
|
*
|
|
|||||
|
Lapse of statute of limitations
|
(53
|
)
|
*
|
|
*
|
|
|||||
|
Interest and penalties
|
—
|
|
(6
|
)
|
—
|
|
|||||
|
Balance at December 31, 2011
|
146
|
|
34
|
|
—
|
|
|||||
|
Additions:
|
|
|
|
||||||||
|
Prior year tax positions
|
17
|
|
*
|
|
*
|
|
|||||
|
Current year tax positions
|
24
|
|
*
|
|
*
|
|
|||||
|
Interest and penalties
|
—
|
|
3
|
|
—
|
|
|||||
|
Decreases:
|
|||||||||||
|
Prior year tax positions
|
(37
|
)
|
*
|
|
*
|
|
|||||
|
Current year tax positions
|
—
|
|
*
|
|
*
|
|
|||||
|
Settlements with tax authorities
|
(11
|
)
|
*
|
|
*
|
|
|||||
|
Lapse of statute of limitations
|
(1
|
)
|
*
|
|
*
|
|
|||||
|
Interest and penalties
|
—
|
|
(6
|
)
|
—
|
|
|||||
|
Balance at December 31, 2012
|
$
|
138
|
|
$
|
31
|
|
$
|
—
|
|
||
* Amounts not allocated.
The reserve for unrecognized tax benefits of
$138 million
at
December 31, 2012
, included
$119 million
(
$63 million
net of income tax benefits) that, if recognized, would reduce FCX’s provision for income taxes.
154
Changes to the reserve for unrecognized tax benefits associated with current year tax positions were primarily related to uncertainties associated with FCX
'
s cost recovery methods and deductibility of contributions. Changes in the reserve for unrecognized tax benefits associated with prior year tax positions were primarily related to uncertainties associated with cost recovery methods. There continues to be uncertainty related to the timing of settlements with taxing authorities, but if additional settlements are agreed upon during the year 2013, FCX could experience a change in its reserve for unrecognized tax benefits.
FCX or its subsidiaries file income tax returns in the U.S. federal jurisdiction and various state and foreign jurisdictions. The tax years for FCX's major tax jurisdictions that remain subject to examination are as follows:
|
Jurisdiction
|
Years Under Examination
|
Additional Open Years
|
||
|
U.S. Federal
|
2007-2010
|
2011-2012
|
||
|
Indonesia
|
2005-2008, 2011
|
2009-2010, 2012
|
||
|
Peru
|
2002-2010
|
2011-2012
|
||
|
Chile
|
2010-2011
|
2012
|
||
Environmental.
FCX incurred environmental capital expenditures and other environmental costs (including joint venture partners’ shares) to comply with applicable environmental laws and regulations that affect its operations totaling
$612 million
in
2012
,
$387 million
in
2011
and
$372 million
in
2010
.
FCX subsidiaries that operate in the U.S. are subject to various federal, state and local environmental laws and regulations that govern emissions of air pollutants; discharges of water pollutants; and generation, handling, storage and disposal of hazardous substances, hazardous wastes and other toxic materials. FCX subsidiaries that operate in the U.S. also are subject to potential liabilities arising under CERCLA or similar state laws that impose responsibility on current and previous owners and operators of a facility for the cleanup of hazardous substances released from the facility into the environment, including damages to natural resources, irrespective of when the damage to the environment occurred or who caused it. This cleanup liability also extends to persons who arranged for the disposal of hazardous substances or transported the hazardous substances to a disposal site selected by the transporter. This liability often is shared on a joint and several basis meaning that each responsible party is fully responsible for the cleanup, although in many cases some or all of the other historical owners or operators no longer exist, do not have the financial ability to respond or cannot be found. As a result, because of FCX’s acquisition of FMC in 2007, many of the subsidiary companies FCX now owns are responsible for a wide variety of environmental remediation projects throughout the U.S. FCX expects to spend substantial sums annually for many years to address those remediation issues. Certain FCX subsidiaries have been advised by the U.S. Environmental Protection Agency (EPA), the Department of the Interior, the Department of Agriculture and several state agencies that, under CERCLA or similar state laws and regulations, they may be liable for costs of responding to environmental conditions at a number of sites that have been or are being investigated to determine whether releases of hazardous substances have occurred and, if so, to develop and implement remedial actions to address environmental concerns. FCX is also subject to claims where the release of hazardous substances is alleged to have damaged natural resources (NRD). As of
December 31, 2012
, FCX had more than
100
active remediation projects, including NRD claims, in the U.S. in
28
states.
A summary of changes in environmental obligations for the years ended
December 31
follows:
|
|
2012
|
2011
|
2010
|
||||||||
|
Balance at beginning of year
|
$
|
1,453
|
|
$
|
1,422
|
|
$
|
1,464
|
|
||
|
Accretion expense
a
|
80
|
|
88
|
|
97
|
|
|||||
|
Additions
|
70
|
|
132
|
|
19
|
|
|||||
|
Reductions
b
|
(182
|
)
|
(68
|
)
|
—
|
|
|||||
|
Spending
|
(199
|
)
|
(121
|
)
|
(158
|
)
|
|||||
|
Balance at end of year
|
1,222
|
|
1,453
|
|
1,422
|
|
|||||
|
Less current portion
|
(186
|
)
|
(205
|
)
|
(138
|
)
|
|||||
|
Long-term portion
|
$
|
1,036
|
|
$
|
1,248
|
|
$
|
1,284
|
|
||
|
a.
|
Represented accretion of the fair value of environmental obligations assumed in the 2007 acquisition of FMC, which were determined on a discounted cash flow basis.
|
|
b.
|
Reductions primarily reflected adjustments for changes in the anticipated scope and timing of environmental remediation projects and the settlement of environmental matters.
|
155
Estimated environmental cash payments (on an undiscounted and unescalated basis) total
$186 million
in
2013
,
$225 million
in
2014
,
$124 million
in
2015
,
$107 million
in
2016
,
$110 million
in
2017
and
$1.7 billion
thereafter. The amount and timing of these estimated payments could change as a result of changes in regulatory requirements, changes in scope and timing of remediation activities, the settlement of environmental matters and as actual spending occurs.
FCX was required to record FMC’s environmental obligations at fair value on the acquisition date in accordance with business combination accounting guidance. Significant adjustments to these obligations may occur in the future. New environmental obligations will be recorded as described in Note 1 under “Environmental Expenditures.” At
December 31, 2012
, FCX’s environmental obligations totaled
$1.2 billion
, including
$1.1 billion
recorded on a discounted basis for those obligations assumed in the FMC acquisition at fair value. On an undiscounted and unescalated basis, these obligations totaled
$2.4 billion
. FCX estimates it is reasonably possible that these obligations could range between
$2.1 billion
and
$2.7 billion
on an undiscounted and unescalated basis.
FCX believes that there may be potential claims for recovery from third parties, including the U.S. government and other PRPs. These potential recoveries are not recognized unless realization is considered probable.
At
December 31, 2012
, the most significant environmental obligations were associated with the Pinal Creek site in Arizona; the Newtown Creek site in New York City; historical smelter sites principally located in Arizona, Kansas, New Jersey, Oklahoma and Pennsylvania; and uranium mining sites in the western U.S. The recorded environmental obligations for these sites totaled
$1.0 billion
at
December 31, 2012
. A discussion of these sites follows.
Pinal Creek.
The Pinal Creek site was listed under the Arizona Department of Environmental Quality’s (ADEQ) Water Quality Assurance Revolving Fund program in 1989 for contamination in the shallow alluvial aquifers within the Pinal Creek drainage near Miami, Arizona. Since that time, environmental remediation was performed by members of the Pinal Creek Group (PCG), consisting of FMC Miami, Inc. (Miami), a wholly owned subsidiary of FMC, and two other companies. In 1998, the District Court approved a Consent Decree between the PCG members and the state of Arizona resolving all matters related to an enforcement action contemplated by the state of Arizona against the PCG members with respect to groundwater contamination. The Consent Decree committed the PCG members to complete the remediation work outlined in the Consent Decree, and that work continues at this time and is expected to continue for many years in the future. Miami also was a party to litigation entitled
Pinal Creek Group, et al. v. Newmont Mining Corporation, et al.
, United States District Court, District of Arizona, Case No. CIV 91-1764 PHX DAE (LOA), filed on May 1, 1991. Pursuant to a settlement in 2010, Miami paid
$40 million
to certain members of the PCG to settle the allocation of previously incurred costs, and agreed to take full responsibility for future groundwater remediation at the Pinal Creek site, with limited exceptions. The settlement did not result in a change to the obligation, which was estimated at fair value when assumed in the FMC acquisition. During 2011, the obligation was increased by
$31 million
to reflect changes in remediation capping designs that incorporate best practices for side slope regrading and cap thickness.
Newtown Creek.
From the 1930s until 1964, Phelps Dodge Refining Corporation (PDRC), a subsidiary of FMC, operated a smelter, and from the 1930s until 1984, it operated a refinery on the banks of Newtown Creek (the creek), which is a 3.5-mile-long waterway that forms part of the boundary between Brooklyn and Queens in New York City. Heavy industrialization along the banks of the creek and discharges from the City of New York’s sewer system over more than a century resulted in significant environmental contamination of the waterway. The New York Attorney General previously notified several companies, including PDRC, about possible obligations to clean up contaminated sediments in the creek. In March and April 2010, EPA notified PDRC and five others that EPA considers them to be PRPs under CERCLA. The notified parties began working with EPA to identify other PRPs, and EPA proposed that the notified parties perform a Remedial Investigation/Feasibility Study (RI/FS) at their expense and reimburse EPA for its oversight costs. EPA is not expected to propose a remedy until after a RI/FS is completed, which is expected to take several years. On September 29, 2010, EPA designated the creek as a Superfund site. Effective July 18, 2011, PDRC and five other parties entered an Administrative Order on Consent (AOC) to perform a RI/FS to assess the nature and extent of environmental contamination in the creek and identify potential remedial options. The parties
'
RI/FS work under the AOC and their identification of other PRPs are ongoing. FCX's financial obligation for this matter was estimated at fair value when it was assumed in the FMC acquisition and is included in FCX's aggregate environmental obligations. The actual costs of fulfilling this remedial obligation and the allocation of costs among PRPs are uncertain and subject to change based on the results of the RI/FS, the remediation remedy ultimately selected by EPA and related allocation determinations. Depending on the overall cost and the portion allocated to PDRC, that share could be material to FCX.
156
Historical Smelter Sites
. FMC and its predecessors at various times owned or operated copper and zinc smelters in several states, including Arizona, Kansas, New Jersey, Oklahoma and Pennsylvania. For some of these smelter sites, certain FCX subsidiaries have been advised by EPA or state agencies that they may be liable for costs of investigating and, if appropriate, remediating environmental conditions associated with the smelters. At other sites, certain FCX subsidiaries have entered into state voluntary remediation programs to investigate and, if appropriate, remediate site conditions associated with the smelters. The historical smelter sites are in various stages of assessment and remediation. The two most significant environmental obligations for historical smelter sites relate to Blackwell, Oklahoma, and Bisbee, Arizona. Adjustments to the environmental obligations for historical smelter sites, which principally were estimated at fair value when assumed in the FMC acquisition, totaled a reduction of
$47 million
in 2012, primarily because of changes in estimated timing of obligations, and an increase of
$36 million
in 2011, primarily at the Blackwell, Oklahoma, site (refer to discussion below).
Blackwell.
From 1918 to 1974, Blackwell Zinc Company, Inc. (BZC), an indirect subsidiary of FCX, owned and operated a zinc smelter in Blackwell, Oklahoma. In 1974, the smelter was demolished and the property deeded to the Blackwell Industrial Authority. Pursuant to an administrative order with the state of Oklahoma, BZC undertook remedial actions in Blackwell in 1996 and 1997, including sampling the nearby residential and commercial properties, and removing soils on properties that were found to have metal concentrations above state-established cleanup standards. From 1997 to 2003, BZC investigated the nature and extent of groundwater contamination potentially attributable to the former smelter and evaluated options for remedying such contamination. In 2003, the state of Oklahoma adopted a cleanup plan requiring the installation of a groundwater extraction and treatment system and the closure of domestic groundwater wells within the groundwater plume area. BZC completed the construction of a groundwater extraction and treatment system, with system startup and initial discharge of treated water occurring in October 2010.
Between 2007 through 2012, FCX, on behalf of BZC, completed a voluntary soil remediation program by inviting property owners in and around Blackwell to have soil at their properties sampled for the presence of smelter-related contaminants, and offering to remediate properties whose soils were found to have metal concentrations above state-established cleanup standards. As part of this program, FCX sampled soils on approximately
90 percent
of the residential properties in Blackwell and remediated soils on about
600
properties. All of these soil sampling and remediation activities were coordinated with, and supervised by, the state of Oklahoma.
On May 23, 2012, the Board of Commissioners of Kay County, Oklahoma, filed suit in Oklahoma District Court against FCX and several affiliates, including BZC, entitled
Board of Commissioners of the County of Kay, Oklahoma v. Freeport-McMoRan Copper & Gold Inc., et al.
, United States District Court, Western District of Oklahoma, Case No. 5:12-cv-00601-C. On May 25, 2012, the case was removed to the United States District Court for the Western District of Oklahoma, and trial is set for October 2013. The suit alleges BZC permitted large quantities of smelter waste to be used as road building and fill material throughout Kay County over a period of decades and seeks unspecified financial assistance for removing and covering much of the material, and unspecified damages for the alleged public nuisance created by the presence of the material. FCX has asserted a counter claim against Kay County for contribution under CERCLA. Separate from the litigation, in fourth-quarter 2012, BZC entered into a Consent Agreement and Final Order with the Oklahoma Department of Environmental Quality and Kay County to conduct an assessment of smelter material present on Kay County's roads, bridges and associated rights-of-way. Sampling is expected to be completed in 2013.
Bisbee.
From the 1880s until 1975, FMC and certain predecessor and subsidiary entities operated a copper mine near Bisbee, Arizona. A series of smelters operated in Bisbee from approximately 1879 through 1908. In 2000, FMC entered the Bisbee area into the Arizona Voluntary Remediation Program (VRP) administered by ADEQ. In 2008, FMC expanded the VRP project to include other communities near Bisbee and commenced a voluntary community outreach program inviting property owners to have soils at their properties sampled for the presence of smelter and mine-related metals. For property owners whose soils are found to have metal concentrations above ADEQ-established cleanup standards, FMC has offered to remove the impacted soils and replace them with clean soils. For those property owners who requested sampling, approximately
40 percent
require some level of cleanup. At
December 31, 2012
, approximately
60 percent
of the properties whose owners agreed to have their soil cleaned up was completed.
157
Uranium Mining Sites.
During a period between 1940 and the early 1970s, certain FMC predecessor entities were involved in uranium exploration and mining in the western U.S. Similar exploration and mining activities by other companies have caused environmental impacts that have warranted remediation, and EPA and local authorities are currently evaluating the need for significant cleanup activities in the region. To date, FMC has undertaken remediation at a limited number of sites associated with these predecessor entities. An initiative to gather additional information about sites in the region is ongoing, and information gathered under this initiative was submitted to EPA Region 9 during the second and third quarters of 2008 and the fourth quarter of 2009 in response to an information request by EPA regarding uranium mining activities on Navajo Nation properties. FCX utilized the results of FMC’s remediation experience, in combination with historical and updated information to initially estimate the fair value of uranium-related liabilities assumed in the FMC acquisition.
Asset Retirement Obligations (AROs).
FCX’s ARO cost estimates are reflected on a third-party cost basis and comply with FCX’s legal obligation to retire tangible, long-lived assets.
A summary of changes in FCX’s AROs for the years ended
December 31
follows:
|
|
2012
|
2011
|
2010
|
||||||||
|
Balance at beginning of year
|
$
|
921
|
|
$
|
856
|
|
$
|
731
|
|
||
|
Liabilities incurred
|
6
|
|
9
|
|
5
|
|
|||||
|
Revisions to cash flow estimates
a
|
211
|
|
48
|
|
105
|
|
|||||
|
Accretion expense
|
55
|
|
58
|
|
54
|
|
|||||
|
Spending
|
(47
|
)
|
(49
|
)
|
(38
|
)
|
|||||
|
Foreign currency translation adjustment
|
—
|
|
(1
|
)
|
(1
|
)
|
|||||
|
Balance at end of year
|
1,146
|
|
921
|
|
856
|
|
|||||
|
Less current portion
|
(55
|
)
|
(31
|
)
|
(69
|
)
|
|||||
|
Long-term portion
|
$
|
1,091
|
|
$
|
890
|
|
$
|
787
|
|
||
|
a.
|
Revisions to cash flow estimates were primarily related to updated closure plans that included revised cost estimates and accelerated timing of certain closure activities.
|
ARO costs may increase or decrease significantly in the future as a result of changes in regulations, changes in engineering designs and technology, permit modifications or updates, changes in mine plans, inflation or other factors and as actual reclamation spending occurs. ARO activities and expenditures generally are made over an extended period of time commencing near the end of the mine life; however, certain reclamation activities may be accelerated if legally required or if determined to be economically beneficial.
Legal requirements in New Mexico, Arizona, Colorado and other states require financial assurance to be provided for the estimated costs of reclamation and closure, including groundwater quality protection programs. FCX has satisfied financial assurance requirements by using a variety of mechanisms, such as performance guarantees, financial capability demonstrations, trust funds, surety bonds, letters of credit and collateral. The applicable regulations specify financial strength tests that are designed to confirm a company’s or guarantor’s financial capability to fund estimated reclamation and closure costs. The amount of financial assurance FCX is required to provide will vary with changes in laws, regulations and reclamation and closure requirements, and cost estimates. At
December 31, 2012
, FCX’s financial assurance obligations associated with these closure and reclamation costs totaled
$970 million
, of which
$601 million
was in the form of guarantees issued by FCX and financial capability demonstrations. At
December 31, 2012
, FCX had trust assets totaling
$161 million
(included in other assets), which are legally restricted to fund a portion of its AROs for properties in New Mexico as required by New Mexico regulatory authorities.
New Mexico Environmental and Reclamation Programs.
FCX’s New Mexico operations are regulated under the New Mexico Water Quality Act and regulations adopted under that act by the Water Quality Control Commission (WQCC). The New Mexico Environment Department (NMED) has required each of these operations to submit closure plans for NMED’s approval. The closure plans must include measures to assure meeting groundwater quality standards following the closure of discharging facilities and to abate any groundwater or surface water contamination. In March 2009, the Tyrone operation appealed the WQCC Final Order, dated February 4, 2009, regarding location of the “places of withdrawal of water,” a legal criterion used to determine where groundwater quality standards must be met at FCX’s New Mexico mining sites. In December 2010, FCX's Tyrone mine entered into a settlement agreement with NMED that calls for a stay of the appeal while NMED and the WQCC complete several administrative actions, including renewal of Tyrone’s closure permit consistent with the terms of the
158
settlement, review and approval of a groundwater abatement plan and adoption of alternative abatement standards, and adoption of new groundwater discharge permit rules for copper mines. If the administrative actions are concluded consistent with the terms of the settlement agreement within the period of the stay, then Tyrone will move to dismiss the appeal. In December 2012, Tyrone and NMED agreed to extend the period to conclude the administrative actions through December 31, 2013. The Court of Appeals also extended the stay for another year. Finalized closure plan requirements, including those resulting from the actions to be taken under the settlement agreement, could result in increases in closure costs for FCX's New Mexico operations.
FCX’s New Mexico operations also are subject to regulation under the 1993 New Mexico Mining Act (the Mining Act) and the related rules that are administered by the Mining and Minerals Division (MMD) of the New Mexico Energy, Minerals and Natural Resources Department. Under the Mining Act, mines are required to obtain approval of plans describing the reclamation to be performed following cessation of mining operations. At
December 31, 2012
, FCX had accrued reclamation and closure costs of
$476 million
for its New Mexico operations. As stated above, additional accruals may be required based on the state’s review of FCX’s updated closure plans and any resulting permit conditions, and the amount of those accruals could be material.
Arizona Environmental and Reclamation Programs.
FCX’s Arizona properties are subject to regulatory oversight in several areas. ADEQ has adopted regulations for its aquifer protection permit (APP) program that require permits for, among other things, certain facilities, activities and structures used for mining, concentrating and smelting and require compliance with aquifer water quality standards at an applicable point of compliance well or location. The APP program also may require mitigation and discharge reduction or elimination of some discharges.
An application for an APP requires a description of a closure strategy that will meet applicable groundwater protection requirements following cessation of operations and an estimate of the cost to implement the closure strategy. An APP may specify closure requirements, which may include post-closure monitoring and maintenance. A more detailed closure plan must be submitted within 90 days after a permitted entity notifies ADEQ of its intent to cease operations. A permit applicant must demonstrate its financial ability to meet the closure costs estimated in the APP.
Portions of Arizona mining facilities that operated after January 1, 1986, also are subject to the Arizona Mined Land Reclamation Act (AMLRA). AMLRA requires reclamation to achieve stability and safety consistent with post-mining land use objectives specified in a reclamation plan. Reclamation plans must be approved by the State Mine Inspector and must include an estimate of the cost to perform the reclamation measures specified in the plan.
FCX will continue to evaluate options for future reclamation and closure activities at its operating and non-operating sites, which are likely to result in adjustments to FCX’s ARO liabilities. At
December 31, 2012
, FCX had accrued reclamation and closure costs of
$240 million
for its Arizona operations.
Colorado Reclamation Programs.
FCX
'
s Colorado operations are regulated by the Colorado Mined Land Reclamation Act (Reclamation Act) and regulations promulgated thereunder. Under the Reclamation Act, mines are required to obtain approval of reclamation plans describing the reclamation of lands affected by mining operations to be performed during mining or upon cessation of mining operations. As of
December 31, 2012
, FCX had accrued reclamation and closure costs of
$47 million
for its Colorado operations.
Chilean Reclamation and Closure Programs.
In July 2011, the Chilean senate passed legislation regulating mine closure, which establishes new requirements for closure plans and became effective in November 2012. FCX's Chilean operations will be required to update closure plans and provide financial assurance for these obligations. FCX cannot predict at this time the cost of these closure plans or the levels or forms of financial assurance that may be required. Revised closure plans for the Chilean mine sites are due in November 2014. At
December 31, 2012
, FCX had accrued reclamation and closure costs of
$54 million
for its Chilean operations.
Peruvian Reclamation and Closure Programs
. Cerro Verde is subject to regulation under the Mine Closure Law administered by the Peruvian Ministry of Energy and Mines. Under the closure regulations, mines must submit a closure plan that includes the reclamation methods, closure cost estimates, methods of control and verification, closure and post-closure plans and financial assurance. The updated closure plan for the Cerro Verde mine expansion must be submitted to the Peruvian regulatory authorities in December 2013. At
December 31, 2012
, Cerro Verde had accrued reclamation and closure costs of
$89 million
and had financial assurance obligations associated with these reclamation and closure costs totaling
$9 million
in the form of letters of credit.
159
Indonesian Reclamation and Closure Programs.
The ultimate amount of reclamation and closure costs to be incurred at PT Freeport Indonesia’s operations will be determined based on applicable laws and regulations and PT Freeport Indonesia’s assessment of appropriate remedial activities in the circumstances, after consultation with governmental authorities, affected local residents and other affected parties and cannot currently be projected with precision. Estimates of the ultimate reclamation and closure costs PT Freeport Indonesia will incur in the future involve complex issues requiring integrated assessments over a period of many years and are subject to revision over time as more complete studies are performed. Some reclamation costs will be incurred during mining activities, while most closure costs and the remaining reclamation costs will be incurred at the end of mining activities, which are currently estimated to continue for nearly
30
years. At
December 31, 2012
, PT Freeport Indonesia had accrued reclamation and closure costs of
$195 million
and a long-term receivable for Rio Tinto’s share of the obligation of
$18 million
(included in long-term receivables).
In 1996, PT Freeport Indonesia began contributing to a cash fund (
$16 million
balance at
December 31, 2012
) designed to accumulate at least
$100 million
(including interest) by the end of its Indonesia mining activities. PT Freeport Indonesia plans to use this fund, including accrued interest, to pay mine closure and reclamation costs. Any costs in excess of the
$100 million
fund would be funded by operational cash flow or other sources.
In December 2009, PT Freeport Indonesia submitted its revised mine closure plan to the Department of Energy and Mineral Resources for review and has addressed comments received during the course of this review process. In December 2010, the President of Indonesia issued a regulation regarding mine reclamation and closure, which requires a company to provide a mine closure guarantee in the form of a time deposit placed in a state-owned bank in Indonesia. In accordance with its Contract of Work, PT Freeport Indonesia is working with the Department of Energy and Mineral Resources to review these requirements, including discussion of other options for the mine closure guarantee.
Litigation.
FCX is involved in numerous legal proceedings that arise in the ordinary course of business or are associated with environmental issues arising from legacy operations conducted over the years by FMC and its affiliates as discussed in this note under “Environmental.” FCX is also involved periodically in other reviews, investigations and proceedings by government agencies, some of which may result in adverse judgments, settlements, fines, penalties, injunctions or other relief. Management does not believe, based on currently available information, that the outcome of any legal proceeding reported below will have a material adverse effect on FCX's financial condition, although individual outcomes could be material to FCX's operating results for a particular period, depending on the nature and magnitude of the outcome and the operating results for the period. Refer to Note 1 for further discussion of FCX's accounting policy for litigation contingencies.
Asbestos Claims.
Since approximately 1990, FMC and various subsidiaries have been named as defendants in a large number of lawsuits that claim personal injury either from exposure to asbestos allegedly contained in electrical wire products produced or marketed many years ago or from asbestos contained in buildings and facilities located at properties owned or operated by FMC affiliates, or from alleged asbestos in talc products. Many of these suits involve a large number of codefendants. Based on litigation results to date and facts currently known, FCX believes there is a reasonable possibility that losses may have been incurred related to these matters; however, FCX also believes that the amounts of any such losses, individually or in the aggregate, are not material to its consolidated financial statements. There can be no assurance, however, that future developments will not alter this conclusion.
Yonkers Site
. From 1932 until 1984, an affiliate of FMC owned and operated a cable manufacturing facility on the Hudson River in Yonkers, New York. FMC sold that operation in 1984, and it was subsequently sold to BICC Cables Corporation (BICC). BICC closed the facility in 1996. In 2005, Blackacre Partners OPS, LLC (Blackacre) began environmental cleanup work at the site using funding provided by FMC and BICC. One Point Street, Inc. (OPS), a real estate developer, has current title to the site.
On September 9, 2011, OPS filed a complaint in the United States District Court for the Southern District of New York, which it amended on March 1, 2012. The amended complaint alleged that FMC, BICC and Blackacre failed to timely and diligently complete remediation of the site in breach of alleged obligations under CERCLA and New York Environmental Conservation Law, and under the contractual agreements among the parties. In fourth-quarter 2012, this matter was settled, and OPS will be completing the limited remaining cleanup work at the site using funds provided by FMC and BICC.
160
Columbian Chemicals Company (Columbian) Claims.
Columbian, formerly a subsidiary of FMC, has notified FCX of various indemnification claims arising out of the 2005 agreement pursuant to which Columbian was sold. The principal outstanding claims relate to (1) multiple mass tort suits pending against Columbian in West Virginia state court for alleged personal injury and property damage resulting from exposure to carbon black (the Carbon Black claims) and (2) an investigation being conducted by EPA of potential Clean Air Act violations during the period Columbian was owned by FMC (the Clean Air Act matter). In April 2012, Columbian filed suit in New York state court (
Columbian Chemicals Company and Columbian Chemicals Acquisition LLC v. Freeport-McMoRan Corporation f/k/a Phelps Dodge Corporation
, County of New York, Supreme Court of the State of New York, Index No. 600999/2010), that alleged, among other things, that the Carbon Black claims are the responsibility of FMC, and are not subject to the aggregate cap under the 2005 agreement pursuant to which Columbian was sold. In July 2012, FCX and Columbian reached a settlement pursuant to which the litigation was dismissed with prejudice and all outstanding disputes regarding the extent of FCX's indemnity obligations to Columbian were fully resolved. Under the terms of the settlement, FCX's remaining possible exposure is to indemnify Columbian for incurred losses related only to the Carbon Black claims and the Clean Air Act matter. The cap, net of amounts reserved and paid, totaled
$122 million
at December 31, 2012. FMC cannot estimate Columbian
'
s exposure, if any, for the Carbon Black claims or the Clean Air Act matter.
Shareholder Litigation
. Thirteen derivative actions challenging the PXP merger and/or the MMR merger were filed on behalf of FCX by purported FCX stockholders. Ten were filed in the Court of Chancery of the State of Delaware and three were filed in the Superior Court of the State of Arizona, County of Maricopa. On January 25, 2013, the Delaware Court of Chancery consolidated the Delaware actions into a single action,
In Re Freeport-McMoRan Copper & Gold Inc. Derivative Litigation
, No. 8145-VCN, and discovery is proceeding in that action. On January 17, 2013, the Arizona Superior Court consolidated two of the Arizona actions into
In Re Freeport-McMoRan Derivative Litigation
, No. CV2012-018351. A third Arizona complaint,
Harris v. Adkerson et al.
, No. CV2013-004163, was consolidated with the first two Arizona actions on February 8, 2013. The actions name some or all of the following as defendants: the directors and certain officers of FCX, two FCX subsidiaries, PXP and certain of its directors, and MMR and certain of its directors and officers. The actions allege, among other things, that the FCX directors breached their fiduciary duties to FCX stockholders because they, among other things, pursued their own interests at the expense of stockholders in approving the PXP and MMR mergers. The complaints also allege that some or all of the following parties aided and abetted the wrongful acts allegedly committed by the directors and certain officers of FCX: two FCX subsidiaries, PXP and certain of its directors, and MMR and certain of its directors and officers. The actions seek as relief, among other things, an injunction barring or rescinding both the PXP merger and the MMR merger and requiring submission of the proposed PXP merger and MMR merger to a vote of FCX stockholders, damages, and attorneys' fees and costs.
Three putative class actions challenging the PXP merger were filed on behalf of PXP stockholders in the Court of Chancery of the State of Delaware. On January 15, 2013, the Court of Chancery consolidated the actions into a single action,
In Re Plains Exploration & Production Company Stockholder Litigation
, No. 8090-VCN, and discovery is proceeding in that action. The action names as defendants PXP, the directors of PXP, FCX, and an FCX subsidiary. The action alleges that PXP's directors breached their fiduciary duties because they, among other things, pursued their own interests at the expense of stockholders and failed to maximize stockholder value with respect to the merger, and that FCX and an FCX subsidiary aided and abetted the breach of fiduciary duties by PXP's directors. The action seeks as relief an injunction barring or rescinding the PXP merger, damages, and attorneys' fees and costs.
In addition, ten putative class actions challenging the MMR merger were filed on behalf of MMR stockholders. Nine were filed in the Court of Chancery of the State of Delaware. On January 25, 2012, the Court of Chancery consolidated the actions into a single action,
In Re McMoRan Exploration Co. Stockholder Litigation
, No. 8132-VCN, and discovery is proceeding in that action. One action was also filed in the Civil District Court for the Parish of Orleans of the State of Louisiana:
Langley v. Moffett et al.
, No. 2012-11904, filed December 19, 2012. Each of the actions names some or all of the following as defendants, in addition to MMR and its directors: FCX, two FCX subsidiaries, the Gulf Coast Ultra Deep Royalty Trust and PXP. The actions allege that MMR's directors breached their fiduciary duties because they, among other things, pursued their own interests at the expense of stockholders and failed to maximize stockholder value with respect to the merger, and that PXP, FCX, or both, aided and abetted the breach of fiduciary duty by MMR's directors. The Delaware action also asserts claims derivatively on behalf of MMR. The actions seek, among other things, injunctive relief barring or rescinding the MMR merger, damages, and attorneys' fees and costs.
FCX intends to vigorously defend itself in these matters.
161
Tax Matters.
Cerro Verde Tax Proceedings.
SUNAT, the Peruvian national tax authority, has assessed mining royalties on materials processed by the Cerro Verde concentrator that commenced operations in late 2006. These assessments cover the period October 2006 to December 2007 and the years 2008 and 2009. SUNAT has issued rulings denying Cerro Verde’s protest of the assessments. Cerro Verde has appealed these decisions and currently has three cases pending before the Peruvian Tax Court. Cerro Verde is challenging these royalties because it believes its stability agreement provides an exemption for all minerals extracted from its mining concession, irrespective of the method used for processing those minerals. Although FCX believes its interpretation of the stability agreement is correct, if Cerro Verde is ultimately found responsible for these assessments, it will also be liable for interest, which accrues at rates that range from approximately
7
to
18 percent
based on the year accrued and the currency in which the amounts would be payable. At
December 31, 2012
, the aggregate amount of the assessments, including interest and penalties, totaled
$218 million
. SUNAT may continue to assess mining royalties annually until this matter is resolved by the Peruvian Tax Tribunal.
Cerro Verde is also challenging various income and value-added tax assessments from SUNAT covering the years 2002 through 2008 and has cases pending before the Peruvian Tax Court. At December 31, 2012, the approximate amount of these assessments, including interest and penalties, totaled
$180 million
.
Indonesia Tax Matters.
The Indonesian tax authorities issued assessments for various audit exceptions on PT Freeport Indonesia's tax returns as follows (in millions):
|
Date of Assessment
|
Tax Return Year
|
Tax Assessment
|
Interest Assessment
|
Total
|
||||||||||
|
October 2010
|
2005
|
$
|
106
|
|
$
|
52
|
|
$
|
158
|
|
||||
|
November 2011
|
2006
|
22
|
|
10
|
|
32
|
|
|||||||
|
March 2012
|
2007
|
91
|
|
44
|
|
135
|
|
|||||||
|
Total
|
$
|
219
|
|
$
|
106
|
|
$
|
325
|
|
|||||
PT Freeport Indonesia has filed objections to the assessments because it believes it has properly paid its taxes. During first-quarter 2012, PT Freeport Indonesia's objections to the assessments related to 2005 were substantially all rejected by the Indonesian tax authorities and, in May 2012, appeals were filed with the Indonesian Tax Court. As of
December 31, 2012
, PT Freeport Indonesia has paid
$182 million
(of which
$148 million
is included in long-term receivables) for the disputed tax assessments related to 2005, 2006 and 2007. PT Freeport Indonesia is working with the Indonesian tax authorities to resolve these matters and expects to receive additional assessments from the Indonesian tax authorities for their audit of its 2008 tax return.
In December 2009, PT Freeport Indonesia was notified by the Large Taxpayer's Office of the Government of Indonesia of its view that PT Freeport Indonesia is obligated to pay value added taxes on certain goods imported after the year 2000. The amount of such taxes and related penalties under this view would be significant. PT Freeport Indonesia believes that, pursuant to the terms of its Contract of Work, it is only required to pay value added taxes on these types of goods imported after December 30, 2009. PT Freeport Indonesia has not received a formal assessment and is working with the applicable government authorities to resolve this matter.
Letters of Credit, Bank Guarantees and Surety Bonds.
Letters of credit and bank guarantees totaled
$98 million
at
December 31, 2012
, primarily for reclamation and environmental obligations, workers’ compensation insurance programs, tax and customs obligations, and other commercial obligations. In addition, FCX had surety bonds totaling
$159 million
at
December 31, 2012
, associated with reclamation and closure (
$137 million
), self-insurance bonds primarily for workers’ compensation (
$18 million
) and other bonds (
$4 million
).
Insurance.
FCX purchases a variety of insurance products to mitigate potential losses. The various insurance products typically have specified deductible amounts or self-insured retentions and policy limits. FCX generally is self-insured for U.S. workers’ compensation, but purchases excess insurance up to statutory limits. An actuarial analysis is performed twice a year for various FCX casualty programs, including workers’ compensation, to estimate required insurance reserves. Insurance reserves totaled
$52 million
at
December 31, 2012
, which consisted of a current portion of
$8 million
(included in accounts payable and accrued liabilities) and a long-term portion of
$44 million
(included in other liabilities).
162
FCX maintains property damage and business interruption insurance related to its operations. FCX and its insurers entered into an insurance settlement agreement in December 2012. The insurers agreed to pay an aggregate of
$63 million
, including PT Freeport Indonesia's joint venture partner's share, for the settlement of the insurance claim for business interruption and property damage relating to the 2011 incidents affecting PT Freeport Indonesia's concentrate pipelines. As a result of the settlement, FCX recorded a gain of
$59 million
(
$31 million
to net income attributable to FCX common stockholders) in 2012.
Operating Leases.
FCX leases various types of properties, including offices and equipment. A summary of future minimum rentals under non-cancelable leases at
December 31, 2012
, follows:
|
2013
|
$
|
32
|
|
|
2014
|
19
|
|
|
|
2015
|
19
|
|
|
|
2016
|
16
|
|
|
|
2017
|
15
|
|
|
|
Thereafter
|
104
|
|
|
|
Total payments
|
$
|
205
|
|
|
|
|
||
Minimum payments under operating leases have not been reduced by aggregate minimum sublease rentals, which are minimal. Total aggregate rental expense under operating leases was
$77 million
in
2012
,
$70 million
in
2011
and
$64 million
in
2010
.
Contractual Obligations.
Based on applicable prices at
December 31, 2012
, FCX has unconditional purchase obligations of
$2.2 billion
, primarily comprising the procurement of copper concentrates (
$799 million
), electricity (
$524 million
) and transportation services (
$448 million
) that are essential to its operations worldwide. Some of FCX’s unconditional purchase obligations are settled based on the prevailing market rate for the service or commodity purchased. In some cases, the amount of the actual obligation may change over time because of market conditions. Obligations for copper concentrates provide for deliveries of specified volumes to Atlantic Copper at market-based prices. Electricity obligations are primarily for contractual minimum demand at the South America and Tenke mines. Transportation obligations are primarily for South America contracted ocean freight and for North America rail freight.
FCX’s future commitments associated with unconditional purchase obligations total
$976 million
in
2013
,
$499 million
in
2014
,
$232 million
in
2015
,
$152 million
in
2016
,
$134 million
in
2017
and
$207 million
thereafter. During the three-year period ended
December 31, 2012
, FCX fulfilled its minimum contractual purchase obligations or negotiated settlements in those situations in which it terminated an agreement containing an unconditional obligation.
Mining Contracts.
Indonesia.
FCX is entitled to mine in Indonesia under the Contract of Work between PT Freeport Indonesia and the Government of Indonesia. The original Contract of Work was entered into in 1967 and was replaced with a new Contract of Work in 1991. The initial term of the current Contract of Work expires in 2021 but can be extended by PT Freeport Indonesia for
two
10
-year periods subject to Indonesian government approval, which pursuant to the Contract of Work cannot be withheld or delayed unreasonably. Given the importance of contracts of work under the Indonesian legal system and PT Freeport Indonesia’s approximately
40
years of working with the Indonesian government, which included entering into the Contract of Work in 1991 well before the expiration of the 1967 Contract of Work, PT Freeport Indonesia fully expects that the government will approve the extensions as long as it continues to comply with the terms of the Contract of Work.
In July 2004, FCX received a request from the Indonesian Department of Energy and Mineral Resources that it offer to sell shares in PT Indocopper Investama to Indonesian nationals at fair market value. In response to this request and in view of the potential benefits of having additional Indonesian ownership in the operations, FCX agreed, at the time, to consider a potential sale of an interest in PT Indocopper Investama at fair market value. Neither its Contract of Work nor Indonesian law requires FCX to divest any portion of its ownership in PT Freeport Indonesia or PT Indocopper Investama. In May 2008, FCX signed a Memorandum of Understanding with the Papua provincial government (the Province) whereby the parties agreed to work cooperatively to determine the feasibility of an acquisition by the Province of the PT Indocopper Investama shares at market value. PT Freeport Indonesia is currently engaged in discussions with the Indonesian government related to its Contract of Work and intends to
163
conclude that process before proceeding with any further discussions about the potential sale of an interest in PT Indocopper Investama.
The copper royalty rate payable by PT Freeport Indonesia under its Contract of Work varies from
1.5 percent
of copper net revenue at a copper price of
$0.90
or less per pound to
3.5 percent
at a copper price of
$1.10
or more per pound. The Contract of Work royalty rate for gold and silver sales is at a fixed rate of
1.0 percent
.
A large part of the mineral royalties under Indonesian government regulations is designated to the provinces from which the minerals are extracted. In connection with its fourth concentrator mill expansion completed in 1998, PT Freeport Indonesia agreed to pay the Government of Indonesia additional royalties (royalties not required by the Contract of Work) to provide further support to the local governments and the people of the Indonesian province of Papua. The additional royalties are paid on production exceeding specified annual amounts of copper, gold and silver expected to be generated when PT Freeport Indonesia’s milling facilities operate above
200,000
metric tons of ore per day. The additional royalty for copper equals the Contract of Work royalty rate, and for gold and silver equals twice the Contract of Work royalty rates. Therefore, PT Freeport Indonesia’s royalty rate on copper net revenues from production above the agreed levels is double the Contract of Work royalty rate, and the royalty rates on gold and silver sales from production above the agreed levels are triple the Contract of Work royalty rates.
The combined royalties, including the additional royalties that became effective January 1, 1999, totaled
$93 million
in
2012
,
$137 million
in
2011
and
$156 million
in
2010
.
In 2009, Indonesia enacted a new mining law, which will operate under a licensing system as opposed to the contract of work system that applies to PT Freeport Indonesia. In 2011 and 2010, the Government of Indonesia promulgated regulations under the 2009 mining law and certain provisions that address existing contracts of work. The laws and regulations provide that contracts of work will continue to be honored until their expiration. However, the regulations attempt to apply certain provisions of the new law to existing contracts of work and may seek to apply the licensing system to any extension periods of contracts of work, even though the terms of PT Freeport Indonesia’s Contract of Work provide for two 10-year extension periods subject to Indonesian government approval, which pursuant to the Contract of Work cannot be withheld or delayed unreasonably. In February 2012, a new regulation was adopted that would require mining companies in Indonesia to process all minerals domestically and possibly ban export of concentrates and other unrefined minerals. PT Freeport Indonesia's Contract of Work includes specific provisions providing the right of PT Freeport Indonesia to export product, subject to giving priority to domestic smelting facilities, on a market basis. In connection with the obligations under its Contract of Work, in 1995, PT Freeport Indonesia constructed the only copper smelter and refinery in Indonesia (which is owned and operated by PT Smelting - refer to Note 2 for further discussion).
Indonesian government officials have periodically undertaken reviews regarding FCX's compliance with Indonesian environmental laws and regulations and the terms of the Contract of Work. In January 2012, the President of Indonesia issued a decree calling for the creation of a team of Ministers to evaluate contracts of work for adjustment to the 2009 Mining Law, and accordingly, to take steps to assess and negotiate size of work areas, government revenues and domestic processing of minerals. FCX has had discussions with officials of the Indonesian government and is working cooperatively to complete this evaluation and to obtain an extension of the Contract of Work beyond 2021, as provided under the terms of the Contract of Work. The Contract of Work can only be modified by mutual agreement between PT Freeport Indonesia and the Government of Indonesia.
Africa.
FCX is entitled to mine in the DRC under an Amended and Restated Mining Convention (ARMC) between TFM and the Government of the DRC. The original Mining Convention was entered into in 1996, was replaced with the ARMC in 2005 and was further amended in 2010 (approved in 2011). The current ARMC will remain in effect for as long as the Tenke concession is exploitable. The royalty rate payable by TFM under the ARMC is
two percent
of net revenue. These mining royalties totaled
$25 million
in
2012
,
$24 million
in
2011
and
$20 million
in
2010
.
Effective March 26, 2012, the DRC government issued a Presidential Decree approving the modifications to TFM's bylaws following a review (completed in 2010) of TFM's existing mining contracts. Among other changes to the amended ARMC, FCX's effective ownership interest in TFM was reduced from
57.75 percent
to
56 percent
and
$50 million
of TFM's stockholder loan payable to a subsidiary of FMC was converted to equity.
Community Development Programs.
FCX has adopted policies that govern its working relationships with the communities where it operates. These policies are designed to guide its practices and programs in a manner that
164
respects basic human rights and the culture of the local people impacted by FCX’s operations. FCX continues to make significant expenditures on community development, education, training and cultural programs.
In 1996, PT Freeport Indonesia established the Freeport Partnership Fund for Community Development (Partnership Fund) through which PT Freeport Indonesia has made available funding and technical assistance to support community development initiatives in the area of health, education and economic development of the area. PT Freeport Indonesia has committed through 2016 to provide
one percent
of its annual revenue for the development of the local people in its area of operations through the Partnership Fund. PT Freeport Indonesia charged
$39 million
in
2012
,
$50 million
in
2011
and
$64 million
in
2010
to cost of sales for this commitment.
During 2006, the Peruvian government announced that all mining companies operating in Peru would be required to make annual contributions to local development funds for a
five
-year period (covering the years 2006 through 2010) when copper prices exceeded certain levels that were adjusted annually. The contribution, which expired in 2010, was equal to
3.75 percent
of after-tax profits, of which
2.75 percent
was contributed to a local mining fund and
1.00 percent
to a regional mining fund. The charge to cost of sales for these local mining fund contributions totaled
$41 million
in
2010
. Cerro Verde's final contribution to these funds was made in early 2011.
TFM has committed to assist the communities living within its concession in the Katanga province of the DRC. TFM will contribute
0.3 percent
of net sales revenue from production to a community development fund to assist the local communities with development of local infrastructure and related services, such as those pertaining to health, education and economic development. TFM charged
$4 million
in both
2012
and
2011
, and
$3 million
in
2010
to cost of sales for this commitment.
Guarantees.
FCX provides certain financial guarantees (including indirect guarantees of the indebtedness of others) and indemnities.
At its Morenci mine in Arizona, FCX has a venture agreement dated February 7, 1986, with Sumitomo, which includes a put and call option guarantee clause. FCX holds an
85 percent
undivided interest in the Morenci complex. Under certain conditions defined in the venture agreement, Sumitomo has the right to sell its
15 percent
share to FCX. Likewise, under certain conditions, FCX has the right to purchase Sumitomo’s share of the venture. At
December 31, 2012
, the maximum potential payment FCX is obligated to make to Sumitomo upon exercise of the put option (or FCX’s exercise of its call option) totaled approximately
$143 million
based on calculations defined in the venture agreement. At
December 31, 2012
, FCX had not recorded any liability in its consolidated financial statements in connection with this guarantee as FCX does not believe, based on information available, that it is probable that any amounts will be paid under this guarantee as the fair value of Sumitomo’s
15 percent
share is in excess of the exercise price.
Prior to its acquisition by FCX, FMC and its subsidiaries have, as part of merger, acquisition, divestiture and other transactions, from time to time, indemnified certain sellers, buyers or other parties related to the transaction from and against certain liabilities associated with conditions in existence (or claims associated with actions taken) prior to the closing date of the transaction. As part of these transactions, FMC indemnified the counterparty from and against certain excluded or retained liabilities existing at the time of sale that would otherwise have been transferred to the party at closing. These indemnity provisions generally now require FCX to indemnify the party against certain liabilities that may arise in the future from the pre-closing activities of FMC for assets sold or purchased. The indemnity classifications include environmental, tax and certain operating liabilities, claims or litigation existing at closing and various excluded liabilities or obligations. Most of these indemnity obligations arise from transactions that closed many years ago, and given the nature of these indemnity obligations, it is not possible to estimate the maximum potential exposure. Except as described in the following sentence, FCX does not consider any of such obligations as having a probable likelihood of payment that is reasonably estimable, and accordingly, has not recorded any obligations associated with these indemnities. With respect to FCX’s environmental indemnity obligations, any expected costs from these guarantees are accrued when potential environmental obligations are considered by management to be probable and the costs can be reasonably estimated.
165
FCX does not purchase, hold or sell derivative financial instruments unless there is an existing asset or obligation, or it anticipates a future activity that is likely to occur and will result in exposure to market risks, which FCX intends to offset or mitigate. FCX does not enter into any derivative financial instruments for speculative purposes, but has entered into derivative financial instruments in limited instances to achieve specific objectives. These objectives principally relate to managing risks associated with commodity price changes, foreign currency exchange rates and interest rates.
Commodity Contracts.
From time to time, FCX has entered into forward, futures and swap contracts to hedge the market risk associated with fluctuations in the prices of commodities it purchases and sells. Derivative financial instruments used by FCX to manage its risks do not contain credit risk-related contingent provisions. As of
December 31, 2012
and
2011
, FCX had no price protection contracts relating to its mine production. A summary of FCX’s derivative contracts and programs follows.
Derivatives Designated as Hedging Instruments – Fair Value Hedges
Copper Futures and Swap Contracts.
Some of FCX’s U.S. copper rod customers request a fixed market price instead of the COMEX average copper price in the month of shipment. FCX hedges this price exposure in a manner that allows it to receive the COMEX average price in the month of shipment while the customers pay the fixed price they requested. FCX accomplishes this by entering into copper futures and swap contracts and then liquidating the copper futures contracts and settling the copper swap contracts during the month of shipment, which generally results in FCX receiving the COMEX average copper price in the month of shipment. Hedging gains or losses from these copper futures and swap contracts are recorded in revenues. FCX did not have any significant gains or losses during the three years ended
December 31, 2012
, resulting from hedge ineffectiveness. At
December 31, 2012
, FCX held copper futures and swap contracts that qualified for hedge accounting for
52 million
pounds at an average contract price of
$3.57
per pound, with maturities through
January 2014
.
A summary of gains (losses) recognized in revenues for derivative financial instruments related to commodity contracts that are designated and qualify as fair value hedge transactions, along with the unrealized gains (losses) on the related hedged item (firm sales commitments) for the years ended
December 31
follows:
|
|
2012
|
2011
|
2010
|
||||||||
|
Unrealized gains (losses):
|
|||||||||||
|
Derivative financial instruments
|
$
|
15
|
|
$
|
(28
|
)
|
$
|
7
|
|
||
|
Hedged item
|
(15
|
)
|
28
|
|
(7
|
)
|
|||||
|
Realized gains (losses):
|
|||||||||||
|
Matured derivative financial instruments
|
(2
|
)
|
(28
|
)
|
37
|
|
|||||
Derivatives Not Designated as Hedging Instruments
Embedded derivatives and derivative financial instruments that do not meet the criteria to qualify for hedge accounting are discussed below.
Embedded Derivatives.
As described in Note 1 under “Revenue Recognition,” certain FCX copper concentrate, copper cathode and gold sales contracts provide for provisional pricing primarily based on the LME price (copper) or the COMEX price (copper) and the London PM price (gold) at the time of shipment as specified in the contract. Similarly, FCX purchases copper under contracts that provide for provisional pricing. Sales and purchases with a provisional sales price contain an embedded derivative (
i.e.
, the price settlement mechanism that is settled after the time of delivery) that is required to be bifurcated from the host contract. The host contract is the sale or purchase of the metals contained in the concentrates or cathodes at the then-current LME or COMEX price (copper) or the London PM price (gold) as defined in the contract. Mark-to-market price fluctuations recorded through the settlement date are reflected in revenues for sales contracts and in cost of sales as production and delivery costs for purchase contracts.
166
A summary of FCX’s embedded derivatives at
December 31, 2012
, follows:
|
Open
|
Average Price
Per Unit
|
Maturities
|
||||||||||
|
|
Positions
|
Contract
|
Market
|
Through
|
||||||||
|
Embedded derivatives in provisional sales contracts:
|
|
|
|
|
||||||||
|
Copper (millions of pounds)
|
541
|
|
$
|
3.57
|
|
$
|
3.59
|
|
May 2013
|
|||
|
Gold (thousands of ounces)
|
104
|
|
1,703
|
|
1,666
|
|
April 2013
|
|||||
|
Embedded derivatives in provisional purchase contracts:
|
|
|
|
|
||||||||
|
Copper (millions of pounds)
|
203
|
|
3.61
|
|
3.59
|
|
March 2013
|
|||||
Copper Forward Contracts.
Atlantic Copper enters into forward copper contracts designed to hedge its copper price risk whenever its physical purchases and sales pricing periods do not match. These economic hedge transactions are intended to hedge against changes in copper prices, with the mark-to-market hedging gains or losses recorded in cost of sales. At
December 31, 2012
, Atlantic Copper held net forward copper purchase contracts for
13 million
pounds at an average contract price of
$3.62
per pound, with maturities through
February 2013
.
A summary of the realized and unrealized gains (losses) recognized in income before income taxes and equity in affiliated companies’ net earnings for commodity contracts that do not qualify as hedge transactions, including embedded derivatives, for the years ended
December 31
follows:
|
|
2012
|
2011
|
2010
|
||||||||
|
Embedded derivatives in provisional sales contracts
a
|
$
|
77
|
|
$
|
(519
|
)
|
$
|
619
|
|
||
|
Embedded derivatives in provisional purchase contracts
b
|
—
|
|
—
|
|
(2
|
)
|
|||||
|
Copper forward contracts
b
|
15
|
|
(2
|
)
|
(30
|
)
|
|||||
|
a.
|
Amounts recorded in revenues.
|
|
b.
|
Amounts recorded in cost of sales as production and delivery costs.
|
Unsettled Derivative Financial Instruments
A summary of the fair values of unsettled derivative financial instruments recorded on the consolidated balance sheets follows:
|
|
December 31,
|
||||||
|
|
2012
|
2011
|
|||||
|
Derivatives designated as hedging instruments
|
|
|
|||||
|
Commodity contracts:
|
|
|
|||||
|
Copper futures and swap contracts:
a
|
|
|
|||||
|
Asset position
b
|
$
|
5
|
|
$
|
3
|
|
|
|
Liability position
c
|
1
|
|
13
|
|
|||
|
Derivatives not designated as hedging instruments
|
|
|
|||||
|
Commodity contracts:
|
|
|
|||||
|
Embedded derivatives in provisional sales/purchase contracts:
d
|
|
|
|||||
|
Asset position
|
$
|
36
|
|
$
|
72
|
|
|
|
Liability position
|
27
|
|
82
|
|
|||
|
Copper forward contracts:
|
|
|
|||||
|
Asset position
b
|
—
|
|
2
|
|
|||
|
a.
|
FCX had paid
$7 million
to brokers at
December 31, 2012
, and
$31 million
at
December 31, 2011
, for margin requirements (recorded in other current assets). In addition, FCX held
$3 million
in margin funding from customers at
December 31, 2011
(recorded in accounts payable and accrued liabilities).
|
|
b.
|
Amounts recorded in other current assets.
|
|
c.
|
Amounts recorded in accounts payable and accrued liabilities.
|
|
d.
|
Amounts are recorded by counterparty either as a net accounts receivable or a net accounts payable.
|
167
Credit Risk.
FCX is exposed to credit loss when financial institutions with which FCX has entered into derivative transactions (commodity, foreign exchange and interest rate swaps) are unable to pay. To minimize the risk of such losses, FCX uses counterparties that meet certain credit requirements and periodically reviews the creditworthiness of these counterparties. FCX does not anticipate that any of the counterparties it deals with will default on their obligations. As of
December 31, 2012
, FCX did not have any significant credit exposure associated with derivative transactions.
Other Financial Instruments.
Other financial instruments include cash and cash equivalents, accounts receivable, trust assets, investment securities, accounts payable and accrued liabilities, dividends payable and long-term debt. Refer to Note 16 for the fair values of these financial instruments.
Fair value accounting guidance includes a hierarchy that prioritizes the inputs to valuation techniques used to measure fair value. The hierarchy gives the highest priority to unadjusted quoted prices in active markets for identical assets or liabilities (Level 1 inputs) and the lowest priority to unobservable inputs (Level 3 inputs).
|
Level 1
|
Unadjusted quoted prices in active markets that are accessible at the measurement date for identical, unrestricted assets or liabilities;
|
|
Level 2
|
Quoted prices in markets that are not active, quoted prices for similar assets or liabilities in active markets, inputs other than quoted prices that are observable for the asset or liability, or inputs that are derived principally from or corroborated by observable market data by correlation or other means; and
|
|
Level 3
|
Prices or valuation techniques that require inputs that are both significant to the fair value measurement and unobservable (supported by little or no market activity).
|
FCX did not have any significant transfers in or out of Levels 1, 2, or 3 in 2012.
168
The carrying value for certain FCX financial instruments (
i.e.
, cash, accounts receivable, accounts payable and accrued liabilities, and dividends payable) approximate fair value because of their short-term nature and generally negligible credit losses. A summary of the carrying amount and fair value of FCX’s other financial instruments follows:
|
|
At December 31, 2012
|
||||||||||||||||||
|
Carrying
|
Fair Value
|
||||||||||||||||||
|
|
Amount
|
Total
|
Level 1
|
Level 2
|
Level 3
|
||||||||||||||
|
Assets
|
|
|
|
|
|||||||||||||||
|
Cash equivalents:
a
|
|
|
|
|
|||||||||||||||
|
Money market funds
|
$
|
2,991
|
|
$
|
2,991
|
|
$
|
2,991
|
|
$
|
—
|
|
$
|
—
|
|
||||
|
Investment securities (current and long-term):
|
|
|
|
|
|||||||||||||||
|
MMR investment
b
|
446
|
|
539
|
|
—
|
|
539
|
|
—
|
|
|||||||||
|
U.S. core fixed income fund
a, c
|
22
|
|
22
|
|
—
|
|
22
|
|
—
|
|
|||||||||
|
Money market funds
a, c
|
16
|
|
16
|
|
16
|
|
—
|
|
—
|
|
|||||||||
|
Equity securities
a, c
|
8
|
|
8
|
|
8
|
|
—
|
|
—
|
|
|||||||||
|
Total investment securities
|
492
|
|
585
|
|
24
|
|
561
|
|
—
|
|
|||||||||
|
Trust assets (long-term):
a, c
|
|
|
|
|
|||||||||||||||
|
U.S. core fixed income fund
|
50
|
|
50
|
|
—
|
|
50
|
|
—
|
|
|||||||||
|
Government mortgage-backed securities
|
36
|
|
36
|
|
—
|
|
36
|
|
—
|
|
|||||||||
|
Corporate bonds
|
30
|
|
30
|
|
—
|
|
30
|
|
—
|
|
|||||||||
|
Government bonds and notes
|
24
|
|
24
|
|
—
|
|
24
|
|
—
|
|
|||||||||
|
Asset-backed securities
|
15
|
|
15
|
|
—
|
|
15
|
|
—
|
|
|||||||||
|
Money market funds
|
7
|
|
7
|
|
7
|
|
—
|
|
—
|
|
|||||||||
|
Municipal bonds
|
1
|
|
1
|
|
—
|
|
1
|
|
—
|
|
|||||||||
|
Total trust assets
|
163
|
|
163
|
|
7
|
|
156
|
|
—
|
|
|||||||||
|
Derivatives:
a
|
|
|
|
|
|||||||||||||||
|
Embedded derivatives in provisional sales/purchase
|
|
|
|
|
|||||||||||||||
|
contracts in an asset position
d
|
36
|
|
36
|
|
—
|
|
36
|
|
—
|
|
|||||||||
|
Copper futures and swap contracts
e
|
5
|
|
5
|
|
5
|
|
—
|
|
—
|
|
|||||||||
|
Total derivative assets
|
41
|
|
41
|
|
5
|
|
36
|
|
—
|
|
|||||||||
|
Total assets
|
$
|
3,780
|
|
$
|
3,027
|
|
$
|
753
|
|
$
|
—
|
|
|||||||
|
Liabilities
|
|
|
|
|
|||||||||||||||
|
Derivatives:
a
|
|
|
|
|
|||||||||||||||
|
Embedded derivatives in provisional sales/purchase
|
|
|
|
|
|||||||||||||||
|
contracts in a liability position
d
|
$
|
27
|
|
$
|
27
|
|
$
|
—
|
|
$
|
27
|
|
$
|
—
|
|
||||
|
Copper futures and swap contracts
f
|
1
|
|
1
|
|
1
|
|
—
|
|
—
|
|
|||||||||
|
Total derivative liabilities
|
28
|
|
28
|
|
1
|
|
27
|
|
—
|
|
|||||||||
|
Long-term debt, including current portion
g
|
3,527
|
|
3,589
|
|
—
|
|
3,589
|
|
—
|
|
|||||||||
|
Total liabilities
|
$
|
3,617
|
|
$
|
1
|
|
$
|
3,616
|
|
$
|
—
|
|
|||||||
169
|
At December 31, 2011
|
|||||||||||||||||||
|
|
Carrying
|
Fair Value
|
|||||||||||||||||
|
|
Amount
|
Total
|
Level 1
|
Level 2
|
Level 3
|
||||||||||||||
|
Assets
|
|
|
|
|
|||||||||||||||
|
Cash equivalents:
a
|
|
|
|
|
|||||||||||||||
|
Money market funds
|
$
|
4,007
|
|
$
|
4,007
|
|
$
|
4,007
|
|
$
|
—
|
|
$
|
—
|
|
||||
|
Investment securities (current and long-term):
|
|
|
|
|
|||||||||||||||
|
MMR investment
b
|
475
|
|
507
|
|
—
|
|
507
|
|
—
|
|
|||||||||
|
Equity securities
a, c
|
9
|
|
9
|
|
9
|
|
—
|
|
—
|
|
|||||||||
|
Money market funds
a, c
|
2
|
|
2
|
|
2
|
|
—
|
|
—
|
|
|||||||||
|
Total investment securities
|
486
|
|
518
|
|
11
|
|
507
|
|
—
|
|
|||||||||
|
Trust assets (long-term):
a,c
|
|
|
|
|
|||||||||||||||
|
Government mortgage-backed securities
|
47
|
|
47
|
|
—
|
|
47
|
|
—
|
|
|||||||||
|
U.S. core fixed income fund
|
46
|
|
46
|
|
—
|
|
46
|
|
—
|
|
|||||||||
|
Government bonds and notes
|
21
|
|
21
|
|
—
|
|
21
|
|
—
|
|
|||||||||
|
Corporate bonds
|
19
|
|
19
|
|
—
|
|
19
|
|
—
|
|
|||||||||
|
Asset-backed securities
|
9
|
|
9
|
|
—
|
|
9
|
|
—
|
|
|||||||||
|
Money market funds
|
9
|
|
9
|
|
9
|
|
—
|
|
—
|
|
|||||||||
|
Municipal bonds
|
1
|
|
1
|
|
—
|
|
1
|
|
—
|
|
|||||||||
|
Total trust assets
|
152
|
|
152
|
|
9
|
|
143
|
|
—
|
|
|||||||||
|
Derivatives:
a
|
|
|
|
|
|
|
|
|
|||||||||||
|
Embedded derivatives in provisional sales/purchase
|
|
|
|
|
|
|
|
|
|||||||||||
|
contracts in an asset position
d
|
72
|
|
72
|
|
—
|
|
72
|
|
—
|
|
|||||||||
|
Copper futures and swap contracts
e
|
3
|
|
3
|
|
3
|
|
—
|
|
—
|
|
|||||||||
|
Copper forward contracts
e
|
2
|
|
2
|
|
1
|
|
1
|
|
—
|
|
|||||||||
|
Total derivative assets
|
77
|
|
77
|
|
4
|
|
73
|
|
—
|
|
|||||||||
|
Total assets
|
$
|
4,754
|
|
$
|
4,031
|
|
$
|
723
|
|
$
|
—
|
|
|||||||
|
Liabilities
|
|
|
|
|
|
|
|
|
|||||||||||
|
Derivatives:
a
|
|
|
|
|
|
|
|
|
|||||||||||
|
Embedded derivatives in provisional sales/purchase
|
|
|
|
|
|
|
|
|
|||||||||||
|
contracts in a liability position
d
|
$
|
82
|
|
$
|
82
|
|
$
|
—
|
|
$
|
82
|
|
$
|
—
|
|
||||
|
Copper futures and swap contracts
f
|
13
|
|
13
|
|
11
|
|
2
|
|
—
|
|
|||||||||
|
Total derivative liabilities
|
95
|
|
95
|
|
11
|
|
84
|
|
—
|
|
|||||||||
|
Long-term debt, including current portion
g
|
3,537
|
|
3,797
|
|
—
|
|
3,797
|
|
—
|
|
|||||||||
|
Total liabilities
|
$
|
3,892
|
|
$
|
11
|
|
$
|
3,881
|
|
$
|
—
|
|
|||||||
|
a.
|
Recorded at fair value.
|
|
b.
|
Recorded at cost and included in other assets.
|
|
c.
|
Current portion included in other current assets and long-term portion included in other assets.
|
|
d.
|
Embedded derivatives are recorded in accounts receivable and/or accounts payable and accrued liabilities.
|
|
e.
|
Included in other current assets.
|
|
f.
|
Included in accounts payable and accrued liabilities.
|
|
g.
|
Recorded at cost except for long-term debt acquired in the FMC acquisition, which was recorded at fair value at the acquisition date.
|
170
Valuation Techniques
Money market funds are classified within Level 1 of the fair value hierarchy because they are valued using quoted market prices in active markets.
MMR's
5.75%
Convertible Perpetual Preferred Stock is not actively traded; therefore, FCX's investment in the MMR 5.75% Convertible Perpetual Preferred Stock is valued based on a pricing simulation model that uses the quoted market prices of MMR's publicly traded common stock as the most significant observable input and other inputs, such as expected volatility, expected settlement date, and risk-free interest rate. Therefore, this investment is classified within Level 2 of the fair value hierarchy.
Fixed income securities (government securities, U.S. core fixed income funds, corporate bonds and asset-backed securities) are valued using a bid evaluation or a mid evaluation. A bid evaluation is an estimated price at which a dealer would pay for a security. A mid evaluation is the average of the estimated price at which a
dealer would sell a security and the estimated price at which a dealer would pay for a security. These evaluations are based on quoted prices, if available, or models that use observable inputs and, as such, are classified within Level 2 of the fair value hierarchy.
Equity securities are valued at the closing price reported on the active market on which the individual securities are traded and, as such, are classified within Level 1 of the fair value hierarchy.
FCX’s embedded derivatives on provisional copper concentrate, copper cathode and gold purchases and sales have critical inputs of quoted monthly LME or COMEX copper forward prices and the London PM gold forward price at each reporting date based on the month of maturity; however, FCX's contracts themselves are not traded on an exchange. As a result, these derivatives are classified within Level 2 of the fair value hierarchy.
FCX’s derivative financial instruments for copper futures and swap contracts and copper forward contracts that are traded on the respective exchanges are classified within Level 1 of the fair value hierarchy because they are valued using quoted monthly COMEX or LME forward prices at each reporting date based on the month of maturity (refer to Note
15
for further discussion). Certain of these contracts are traded on the over-the-counter market and are classified within Level 2 of the fair value hierarchy.
Long-term debt, including current portion, is not actively traded and is valued using prices obtained from a readily available pricing source and, as such, is classified within Level 2 of the fair value hierarchy.
The techniques described above may produce a fair value calculation that may not be indicative of net realizable value or reflective of future fair values. Furthermore, while FCX believes its valuation techniques are appropriate and consistent with other market participants, the use of different techniques or assumptions to determine fair value of certain financial instruments could result in a different fair value measured at the reporting date. There have been no changes in the techniques used at
December 31, 2012
.
FCX has organized its operations into five primary divisions – North America copper mines, South America mining, Indonesia mining, Africa mining and Molybdenum operations. Notwithstanding this structure, FCX internally reports information on a mine-by-mine basis. Therefore, FCX concluded that its operating segments include individual mines or operations. Operating segments that meet certain thresholds are reportable segments. Further discussion of the reportable segments included in FCX’s primary operating divisions, as well as FCX’s other reported segments – Rod & Refining and Atlantic Copper Smelting & Refining – follows. Refer to Note 2 for information on FCX’s ownership interests.
Intersegment Sales.
Intersegment sales between FCX’s operations are based on similar arms-length transactions with third parties at the time of the sale. Intersegment sales may not be reflective of the actual prices ultimately realized because of a variety of factors, including additional processing, timing of sales to unaffiliated customers and transportation premiums.
171
FCX defers recognizing profits on sales from its mining operations to Atlantic Copper and on 25 percent of Indonesia mining sales to PT Smelting until final sales to third parties occur. Quarterly variations in ore grades, the timing of intercompany shipments and changes in product prices result in variability in FCX's net deferred profits and quarterly earnings.
Allocations.
FCX allocates certain operating costs, expenses and capital expenditures to the operating divisions and individual segments. However, not all costs and expenses applicable to a mine or operation are allocated. U.S. federal and state income taxes are recorded and managed at the corporate level, whereas foreign income taxes are recorded and managed at the applicable country. In addition, most exploration and research activities are managed at the corporate level, and those costs along with some selling, general and administrative costs are not allocated to the operating divisions or segments. Accordingly, the following segment information reflects management determinations that may not be indicative of what the actual financial performance of each operating division or segment would be if it was an independent entity.
North America Copper Mines.
FCX has seven operating copper mines in North America – Morenci, Bagdad, Safford, Sierrita and Miami in Arizona, and Tyrone and Chino in New Mexico. The North America copper mines include open-pit mining, sulfide ore concentrating, leaching and SX/EW operations. A majority of the copper produced at the North America copper mines is cast into copper rod by FCX’s Rod & Refining operations. The North America copper mines include the Morenci copper mine as a reportable segment.
Morenci.
The Morenci open-pit mine, located in southeastern Arizona, produces copper cathodes and copper concentrates. In addition to copper, the Morenci mine also produces molybdenum concentrates. The Morenci mine produced
39 percent
of FCX’s North America copper during
2012
.
Other Mines.
Other mines include FCX’s other operating southwestern U.S. copper mines – Bagdad, Safford, Sierrita, Miami, Tyrone and Chino. In addition to copper, certain of these mines (Sierrita, Bagdad and Chino) also produce molybdenum concentrates.
South America.
South America mining includes four operating copper mines – Cerro Verde in Peru, and El Abra, Candelaria and Ojos del Salado in Chile. These operations include open-pit and underground mining, sulfide ore concentrating, leaching and SX/EW operations. South America mining includes the Cerro Verde copper mine as a reportable segment.
Cerro Verde.
The Cerro Verde open-pit copper mine, located near Arequipa, Peru, produces copper cathodes and copper concentrates. In addition to copper, the Cerro Verde mine also produces molybdenum concentrates. The Cerro Verde mine produced
47 percent
of FCX’s South America copper during
2012
.
Other Mines.
Other mines include FCX’s Chilean copper mines – El Abra, Candelaria and Ojos del Salado. In addition to copper, the Candelaria and Ojos del Salado mines also produce gold and silver.
Indonesia.
Indonesia mining includes PT Freeport Indonesia’s Grasberg minerals district. PT Freeport Indonesia produces copper concentrates, which contain significant quantities of gold and silver.
Africa.
Africa mining includes the Tenke minerals district. The Tenke operation includes surface mining, leaching and SX/EW operations and produces copper cathodes. In addition to copper, the Tenke operation produces cobalt hydroxide.
Molybdenum.
The Molybdenum segment is an integrated producer of molybdenum, with mining, sulfide ore concentrating, roasting and processing facilities that produce high-purity, molybdenum-based chemicals, molybdenum metal powder and metallurgical products, which are sold to customers around the world, and includes the wholly owned Henderson underground mine and Climax open-pit mine in Colorado and related conversion facilities. The Henderson and Climax mines produce high-purity, chemical-grade molybdenum concentrates, which are typically further processed into value-added molybdenum chemical products. This segment also includes a sales company that purchases and sells molybdenum from FCX's primary molybdenum mines and from FCX’s North and South America copper mines that also produce molybdenum concentrates; and related conversion facilities that, at times, roast and/or processes material on a toll basis for third parties.
172
Rod & Refining.
The Rod & Refining segment consists of copper conversion facilities located in North America, and includes a refinery, three rod mills and a specialty copper products facility. These operations process copper produced at FCX’s North America copper mines and purchased copper into copper cathode, rod and custom copper shapes. At times these operations refine copper and produce copper rod and shapes for customers on a toll basis. Toll arrangements require the tolling customer to deliver appropriate copper-bearing material to FCX’s facilities for processing into a product that is returned to the customer, who pays FCX for processing its material into the specified products.
Atlantic Copper Smelting & Refining.
Atlantic Copper, FCX’s wholly owned smelting unit in Spain, smelts and refines copper concentrates and markets refined copper and precious metals in slimes. During
2012
, Atlantic Copper purchased approximately
31 percent
of its concentrate requirements from the South America mining operations, approximately
16 percent
from the North America copper mines and approximately
10 percent
from PT Freeport Indonesia at market prices.
Product Revenue
FCX revenues attributable to the products it produced for the years ended December 31 follow:
|
|
2012
|
2011
|
2010
|
||||||||
|
Refined copper products
|
$
|
9,699
|
|
$
|
10,297
|
|
$
|
9,203
|
|
||
|
Copper in concentrates
a
|
4,589
|
|
5,938
|
|
5,674
|
|
|||||
|
Gold
|
1,741
|
|
2,429
|
|
2,370
|
|
|||||
|
Molybdenum
|
1,187
|
|
1,348
|
|
1,143
|
|
|||||
|
Other
|
794
|
|
868
|
|
592
|
|
|||||
|
Total
|
$
|
18,010
|
|
$
|
20,880
|
|
$
|
18,982
|
|
||
|
a.
|
Amounts are net of treatment and refining charges totaling
$311 million
for
2012
,
$362 million
for
2011
and
$413 million
for
2010
.
|
Geographic Area
Information concerning financial data by geographic area follows:
|
Years Ended December 31,
|
|||||||||||
|
|
2012
|
2011
|
2010
|
||||||||
|
Revenues:
a
|
|
|
|
||||||||
|
United States
|
$
|
6,285
|
|
$
|
7,176
|
|
$
|
5,295
|
|
||
|
Japan
|
2,181
|
|
2,501
|
|
3,428
|
|
|||||
|
Indonesia
|
2,054
|
|
2,266
|
|
2,266
|
|
|||||
|
Spain
|
1,581
|
|
1,643
|
|
1,483
|
|
|||||
|
Switzerland
|
731
|
|
1,219
|
|
1,063
|
|
|||||
|
Chile
|
704
|
|
741
|
|
759
|
|
|||||
|
China
|
579
|
|
942
|
|
795
|
|
|||||
|
Korea
|
525
|
|
561
|
|
745
|
|
|||||
|
Other
|
3,370
|
|
3,831
|
|
3,148
|
|
|||||
|
Total
|
$
|
18,010
|
|
$
|
20,880
|
|
$
|
18,982
|
|
||
|
a.
|
Revenues are attributed to countries based on the location of the customer.
|
|
December 31,
|
|||||||||||
|
|
2012
|
2011
|
2010
|
||||||||
|
Long-lived assets:
a
|
|
|
|
||||||||
|
United States
|
$
|
8,689
|
|
$
|
7,899
|
|
$
|
7,101
|
|
||
|
Indonesia
|
5,127
|
|
4,469
|
|
3,475
|
|
|||||
|
Democratic Republic of Congo
|
3,926
|
|
3,497
|
|
3,220
|
|
|||||
|
Peru
|
3,933
|
|
3,265
|
|
3,203
|
|
|||||
|
Chile
|
2,587
|
|
2,242
|
|
1,892
|
|
|||||
|
Spain
|
231
|
|
257
|
|
266
|
|
|||||
|
Other
|
96
|
|
68
|
|
48
|
|
|||||
|
Total
|
$
|
24,589
|
|
$
|
21,697
|
|
$
|
19,205
|
|
||
|
a.
|
Long-lived assets exclude deferred tax assets and intangible assets.
|
173
Major Customers.
Sales to PT Smelting totaled
$2.1 billion
(
11 percent
of FCX's consolidated revenues) in
2012
and
$2.3 billion
in
2011
and
2010
(
11 percent
and
12 percent
, respectively, of FCX's consolidated revenues). Refer to Note 2 for further discussion of FCX’s investment in PT Smelting.
Labor Matters
.
As of
December 31, 2012
, approximately
50 percent
of FCX's labor force was covered by collective bargaining agreements, and approximately
35 percent
of FCX's labor force is covered by agreements that will expire within one year.
Business Segments
Business segments data for the years ended
December 31
are presented in the following tables.
174
Business Segments
|
|
North America Copper Mines
|
South America
|
Indonesia
|
|
Africa
|
|
|
|
|
|
|
|||||||||||||||||||||||||||||||||||||||||
|
Morenci
|
Other
Mines
|
Total
|
Cerro
Verde
|
Other
Mines
|
Total
|
Grasberg
|
Tenke
|
Molyb-
denum
|
Rod &
Refining
|
Atlantic
Copper
Smelting
& Refining
|
Corporate,
Other &
Elimi-
nations
|
FCX
Total
|
||||||||||||||||||||||||||||||||||||||||
|
Year Ended December 31, 2012
|
|
|
|
|
|
|
|
|
|
|
|
|
|
|
|
|||||||||||||||||||||||||||||||||||||
|
Revenues:
|
|
|
|
|
|
|
|
|
|
|
|
|
|
|
|
|||||||||||||||||||||||||||||||||||||
|
Unaffiliated customers
|
$
|
156
|
|
$
|
50
|
|
$
|
206
|
|
$
|
1,767
|
|
$
|
2,143
|
|
$
|
3,910
|
|
$
|
3,611
|
|
a
|
$
|
1,349
|
|
$
|
1,255
|
|
$
|
4,989
|
|
$
|
2,683
|
|
$
|
7
|
|
$
|
18,010
|
|
||||||||||||
|
Intersegment
|
1,846
|
|
3,438
|
|
5,284
|
|
388
|
|
430
|
|
818
|
|
310
|
|
10
|
|
—
|
|
27
|
|
26
|
|
(6,475
|
)
|
—
|
|
||||||||||||||||||||||||||
|
Production and delivery
|
1,076
|
|
1,936
|
|
3,012
|
|
813
|
|
1,301
|
|
2,114
|
|
2,349
|
|
615
|
|
1,033
|
|
4,993
|
|
2,640
|
|
(6,374
|
)
|
10,382
|
|
||||||||||||||||||||||||||
|
Depreciation, depletion and amortization
|
122
|
|
240
|
|
362
|
|
139
|
|
148
|
|
287
|
|
212
|
|
176
|
|
65
|
|
9
|
|
42
|
|
26
|
|
1,179
|
|
||||||||||||||||||||||||||
|
Selling, general and administrative expenses
|
2
|
|
2
|
|
4
|
|
3
|
|
3
|
|
6
|
|
121
|
|
6
|
|
13
|
|
—
|
|
19
|
|
262
|
|
431
|
|
||||||||||||||||||||||||||
|
Exploration and research expenses
|
1
|
|
—
|
|
1
|
|
—
|
|
—
|
|
—
|
|
—
|
|
—
|
|
3
|
|
—
|
|
—
|
|
281
|
|
285
|
|
||||||||||||||||||||||||||
|
Environmental obligations and shutdown costs
|
(11
|
)
|
38
|
|
27
|
|
—
|
|
—
|
|
—
|
|
—
|
|
—
|
|
—
|
|
—
|
|
—
|
|
(49
|
)
|
(22
|
)
|
||||||||||||||||||||||||||
|
Gain on insurance settlement
|
—
|
|
—
|
|
—
|
|
—
|
|
—
|
|
—
|
|
(59
|
)
|
—
|
|
—
|
|
—
|
|
—
|
|
—
|
|
(59
|
)
|
||||||||||||||||||||||||||
|
Operating income (loss)
|
812
|
|
1,272
|
|
2,084
|
|
1,200
|
|
1,121
|
|
2,321
|
|
1,298
|
|
562
|
|
141
|
|
14
|
|
8
|
|
(614
|
)
|
5,814
|
|
||||||||||||||||||||||||||
|
Interest expense, net
|
1
|
|
5
|
|
6
|
|
7
|
|
—
|
|
7
|
|
5
|
|
1
|
|
—
|
|
—
|
|
12
|
|
155
|
|
186
|
|
||||||||||||||||||||||||||
|
Provision for income taxes
|
—
|
|
—
|
|
—
|
|
228
|
|
b
|
329
|
|
557
|
|
b
|
497
|
|
112
|
|
—
|
|
—
|
|
—
|
|
344
|
|
1,510
|
|
||||||||||||||||||||||||
|
Total assets at December 31, 2012
|
2,445
|
|
5,834
|
|
8,279
|
|
5,821
|
|
4,342
|
|
10,163
|
|
6,591
|
|
4,622
|
|
2,634
|
|
242
|
|
992
|
|
1,917
|
|
35,440
|
|
||||||||||||||||||||||||||
|
Capital expenditures
|
266
|
|
561
|
|
827
|
|
558
|
|
373
|
|
931
|
|
843
|
|
539
|
|
258
|
|
6
|
|
16
|
|
74
|
|
3,494
|
|
||||||||||||||||||||||||||
|
Year Ended December 31, 2011
|
|
|
|
|
|
|
|
|
|
|
|
|
|
|
|
|||||||||||||||||||||||||||||||||||||
|
Revenues:
|
|
|
|
|
|
|
|
|
|
|
|
|
|
|
|
|||||||||||||||||||||||||||||||||||||
|
Unaffiliated customers
|
$
|
418
|
|
$
|
180
|
|
$
|
598
|
|
$
|
2,115
|
|
$
|
2,457
|
|
$
|
4,572
|
|
$
|
4,504
|
|
a
|
$
|
1,282
|
|
$
|
1,424
|
|
$
|
5,523
|
|
$
|
2,969
|
|
$
|
8
|
|
$
|
20,880
|
|
||||||||||||
|
Intersegment
|
1,697
|
|
3,338
|
|
5,035
|
|
417
|
|
269
|
|
686
|
|
542
|
|
7
|
|
—
|
|
26
|
|
15
|
|
(6,311
|
)
|
—
|
|
||||||||||||||||||||||||||
|
Production and delivery
|
984
|
|
1,645
|
|
2,629
|
|
827
|
|
1,078
|
|
1,905
|
|
1,791
|
|
591
|
|
1,036
|
|
5,527
|
|
2,991
|
|
(6,572
|
)
|
9,898
|
|
||||||||||||||||||||||||||
|
Depreciation, depletion and amortization
|
116
|
|
163
|
|
279
|
|
135
|
|
123
|
|
258
|
|
215
|
|
140
|
|
60
|
|
8
|
|
40
|
|
22
|
|
1,022
|
|
||||||||||||||||||||||||||
|
Selling, general and administrative expenses
|
2
|
|
2
|
|
4
|
|
4
|
|
3
|
|
7
|
|
124
|
|
8
|
|
15
|
|
—
|
|
22
|
|
235
|
|
415
|
|
||||||||||||||||||||||||||
|
Exploration and research expenses
|
7
|
|
—
|
|
7
|
|
—
|
|
—
|
|
—
|
|
—
|
|
—
|
|
3
|
|
—
|
|
—
|
|
261
|
|
271
|
|
||||||||||||||||||||||||||
|
Environmental obligations and shutdown costs
|
4
|
|
(15
|
)
|
(11
|
)
|
—
|
|
—
|
|
—
|
|
—
|
|
—
|
|
—
|
|
1
|
|
—
|
|
144
|
|
134
|
|
||||||||||||||||||||||||||
|
Operating income (loss)
|
1,002
|
|
1,723
|
|
2,725
|
|
1,566
|
|
1,522
|
|
3,088
|
|
2,916
|
|
550
|
|
310
|
|
13
|
|
(69
|
)
|
(393
|
)
|
9,140
|
|
||||||||||||||||||||||||||
|
Interest expense, net
|
2
|
|
6
|
|
8
|
|
1
|
|
—
|
|
1
|
|
8
|
|
6
|
|
—
|
|
—
|
|
15
|
|
274
|
|
312
|
|
||||||||||||||||||||||||||
|
Provision for income taxes
|
—
|
|
—
|
|
—
|
|
553
|
|
522
|
|
1,075
|
|
1,256
|
|
120
|
|
—
|
|
—
|
|
—
|
|
636
|
|
3,087
|
|
||||||||||||||||||||||||||
|
Total assets at December 31, 2011
|
2,006
|
|
5,086
|
|
7,092
|
|
5,110
|
|
3,604
|
|
8,714
|
|
5,349
|
|
3,890
|
|
2,434
|
|
259
|
|
1,109
|
|
3,223
|
|
32,070
|
|
||||||||||||||||||||||||||
|
Capital expenditures
|
95
|
|
400
|
|
495
|
|
198
|
|
405
|
|
603
|
|
648
|
|
193
|
|
461
|
|
10
|
|
32
|
|
92
|
|
2,534
|
|
||||||||||||||||||||||||||
|
a.
|
Included PT Freeport Indonesia's sales to PT Smelting totaling
$2.1 billion
in 2012 and
$2.3 billion
in 2011.
|
|
b.
|
Included a credit of
$234 million
for the reversal of a net deferred tax liability. Refer to Note 12 for further discussion.
|
175
|
|
North America Copper Mines
|
South America
|
Indonesia
|
|
Africa
|
|
|
|
|
|
||||||||||||||||||||||||||||||||||||||||||
|
Morenci
|
Other
Mines
|
Total
|
Cerro
Verde
|
Other
Mines
|
Total
|
Grasberg
|
Tenke
|
Molyb-
denum
|
Rod &
Refining
|
Atlantic
Copper
Smelting
& Refining
|
Corporate,
Other &
Elimi-
nations
|
FCX
Total
|
||||||||||||||||||||||||||||||||||||||||
|
Year Ended December 31, 2010
|
|
|
|
|
|
|
|
|
|
|
|
|
|
|
||||||||||||||||||||||||||||||||||||||
|
Revenues:
|
|
|
|
|
|
|
|
|
|
|
|
|
|
|
||||||||||||||||||||||||||||||||||||||
|
Unaffiliated customers
|
$
|
59
|
|
$
|
52
|
|
$
|
111
|
|
$
|
1,957
|
|
$
|
2,449
|
|
$
|
4,406
|
|
$
|
5,230
|
|
a
|
$
|
1,106
|
|
$
|
1,205
|
|
$
|
4,444
|
|
$
|
2,473
|
|
$
|
7
|
|
$
|
18,982
|
|
||||||||||||
|
Intersegment
|
1,465
|
|
2,597
|
|
4,062
|
|
453
|
|
132
|
|
585
|
|
1,147
|
|
|
—
|
|
—
|
|
26
|
|
18
|
|
(5,838
|
)
|
—
|
|
|||||||||||||||||||||||||
|
Production and delivery
|
691
|
|
1,361
|
|
2,052
|
|
705
|
|
973
|
|
1,678
|
|
1,946
|
|
|
488
|
|
784
|
|
4,442
|
|
2,470
|
|
(5,525
|
)
|
8,335
|
|
|||||||||||||||||||||||||
|
Depreciation, depletion and amortization
|
134
|
|
139
|
|
273
|
|
148
|
|
102
|
|
250
|
|
257
|
|
|
128
|
|
51
|
|
8
|
|
38
|
|
31
|
|
1,036
|
|
|||||||||||||||||||||||||
|
Selling, general and administrative expenses
|
—
|
|
—
|
|
—
|
|
—
|
|
—
|
|
—
|
|
117
|
|
|
—
|
|
11
|
|
—
|
|
20
|
|
233
|
|
381
|
|
|||||||||||||||||||||||||
|
Exploration and research expenses
|
—
|
|
—
|
|
—
|
|
—
|
|
—
|
|
—
|
|
—
|
|
|
—
|
|
2
|
|
—
|
|
—
|
|
141
|
|
143
|
|
|||||||||||||||||||||||||
|
Environmental obligations and shutdown costs
|
—
|
|
—
|
|
—
|
|
—
|
|
—
|
|
—
|
|
—
|
|
—
|
|
—
|
|
1
|
|
—
|
|
18
|
|
19
|
|
||||||||||||||||||||||||||
|
Operating income (loss)
|
699
|
|
1,149
|
|
1,848
|
|
1,557
|
|
1,506
|
|
3,063
|
|
4,057
|
|
|
490
|
|
357
|
|
19
|
|
(37
|
)
|
(729
|
)
|
9,068
|
|
|||||||||||||||||||||||||
|
Interest expense, net
|
4
|
|
10
|
|
14
|
|
—
|
|
—
|
|
—
|
|
—
|
|
5
|
|
—
|
|
—
|
|
10
|
|
433
|
|
462
|
|
||||||||||||||||||||||||||
|
Provision for income taxes
|
—
|
|
—
|
|
—
|
|
516
|
|
483
|
|
999
|
|
1,709
|
|
|
118
|
|
—
|
|
—
|
|
—
|
|
157
|
|
2,983
|
|
|||||||||||||||||||||||||
|
Total assets at December 31, 2010
|
1,940
|
|
4,477
|
|
6,417
|
|
4,272
|
|
3,263
|
|
7,535
|
|
6,048
|
|
|
3,640
|
|
1,897
|
|
311
|
|
1,317
|
|
2,221
|
|
29,386
|
|
|||||||||||||||||||||||||
|
Capital expenditures
|
47
|
|
186
|
|
233
|
|
106
|
|
364
|
|
470
|
|
436
|
|
|
100
|
|
89
|
|
7
|
|
28
|
|
49
|
|
1,412
|
|
|||||||||||||||||||||||||
|
a.
|
Included PT Freeport Indonesia's sales to PT Smelting totaling
$2.3 billion
.
|
176
Recoverable proven and probable reserves have been calculated as of
December 31, 2012
, in accordance with Industry Guide 7 as required by the Securities Exchange Act of 1934. FCX’s proven and probable reserves may not be comparable to similar information regarding mineral reserves disclosed in accordance with the guidance in other countries. Proven and probable reserves were determined by the use of mapping, drilling, sampling, assaying and evaluation methods generally applied in the mining industry, as more fully discussed below. The term “reserve,” as used in the reserve data presented here, means that part of a mineral deposit that can be economically and legally extracted or produced at the time of the reserve determination. The term “proven reserves” means reserves for which (i) quantity is computed from dimensions revealed in outcrops, trenches, workings or drill holes; (ii) grade and/or quality are computed from the results of detailed sampling; and (iii) the sites for inspection, sampling and measurements are spaced so closely and the geologic character is sufficiently defined that size, shape, depth and mineral content of reserves are well established. The term “probable reserves” means reserves for which quantity and grade are computed from information similar to that used for proven reserves but the sites for sampling are farther apart or are otherwise less adequately spaced. The degree of assurance, although lower than that for proven reserves, is high enough to assume continuity between points of observation.
FCX’s reserve estimates are based on the latest available geological and geotechnical studies. FCX conducts ongoing studies of its ore bodies to optimize economic values and to manage risk. FCX revises its mine plans and estimates of proven and probable mineral reserves as required in accordance with the latest available studies.
Estimated recoverable proven and probable reserves at
December 31, 2012
, were determined using long-term average prices of
$2.00
per pound for copper,
$750
per ounce for gold and
$10
per pound for molybdenum, consistent with the long-term average prices used at year-end
2011
and
2010
. For the three-year period ended
December 31, 2012
, LME spot copper prices averaged
$3.67
per pound, London PM gold prices averaged
$1,480
per ounce and the weekly average price for molybdenum quoted by
Metals Week
averaged
$14.64
per pound.
The recoverable proven and probable reserves presented in the table below represent the estimated metal quantities from which FCX expects to be paid after application of estimated metallurgical recovery rates and smelter recovery rates, where applicable. Recoverable reserves are that part of a mineral deposit that FCX estimates can be economically and legally extracted or produced at the time of the reserve determination.
|
Recoverable Proven and Probable Reserves
|
||||||||
|
December 31, 2012
|
||||||||
|
Copper
a
(billion pounds)
|
Gold
(million ounces)
|
Molybdenum
(billion pounds)
|
||||||
|
North America
|
38.8
|
|
0.4
|
|
2.69
|
|
||
|
South America
|
38.8
|
|
1.2
|
|
0.73
|
|
||
|
Indonesia
|
31.0
|
|
30.9
|
|
—
|
|
||
|
Africa
|
7.9
|
|
—
|
|
—
|
|
||
|
Consolidated basis
b
|
116.5
|
|
32.5
|
|
3.42
|
|
||
|
Net equity interest
c
|
93.2
|
|
29.4
|
|
3.08
|
|
||
|
a.
|
Consolidated recoverable copper reserves included
2.9 billion
pounds in leach stockpiles and
1.4 billion
pounds in mill stockpiles.
|
|
b.
|
Consolidated basis reserves represented estimated metal quantities after reduction for joint venture partner interests at the Morenci mine in North America and the Grasberg minerals district in Indonesia. Excluded from the table above were FCX’s estimated recoverable proven and probable reserves of
0.84 billion
pounds of cobalt at Tenke and
321.4 million
ounces of silver in Indonesia, South America and North America, which were determined using long-term average prices of
$10
per pound for cobalt and
$15
per ounce for silver.
|
|
c.
|
Net equity interest reserves represented estimated consolidated basis metal quantities further reduced for noncontrolling interest ownership. Excluded from the table above were FCX’s estimated recoverable proven and probable reserves of
0.47 billion
pounds of cobalt at Tenke and
264.2 million
ounces of silver in Indonesia, South America and North America.
|
177
|
|
100% Basis
|
||||||||||||||||||
|
Average Ore Grade
Per Metric Ton
|
Recoverable Proven and
Probable Reserves
a
|
||||||||||||||||||
|
Ore
(million
|
Copper
|
Gold
|
Molybdenum
|
Copper
(billion
|
Gold
(million
|
Molybdenum
(billion
|
|||||||||||||
|
Year-End
|
metric tons)
|
(%)
|
(grams)
|
|
(%)
|
pounds)
|
ounces)
|
|
pounds)
|
||||||||||
|
2008
|
14,067
|
|
0.48
|
0.17
|
|
|
0.01
|
118.8
|
|
53.4
|
|
|
2.49
|
|
|||||
|
2009
|
13,807
|
|
0.49
|
0.17
|
|
|
0.01
|
120.9
|
|
49.8
|
|
|
2.60
|
|
|||||
|
2010
|
18,516
|
|
0.42
|
0.12
|
|
|
0.01
|
137.9
|
|
47.9
|
|
|
3.41
|
|
|||||
|
2011
|
17,739
|
|
0.43
|
0.12
|
|
|
0.01
|
136.7
|
|
46.1
|
|
|
3.43
|
|
|||||
|
2012
|
17,394
|
|
0.43
|
0.12
|
|
|
0.01
|
133.5
|
|
44.4
|
|
|
3.44
|
|
|||||
|
By Area at December 31, 2012:
|
|
|
|
|
|
|
|
|
|||||||||||
|
North America
|
|
|
|
|
|
|
|
|
|
||||||||||
|
Developed and producing:
|
|
|
|
|
|
|
|
|
|||||||||||
|
Morenci
|
4,018
|
|
0.27
|
—
|
|
|
—
|
b
|
15.4
|
|
—
|
|
|
0.15
|
|
||||
|
Bagdad
|
1,731
|
|
0.27
|
—
|
|
b
|
0.01
|
8.3
|
|
0.1
|
|
|
0.40
|
|
|||||
|
Safford
|
186
|
|
0.42
|
—
|
|
—
|
1.4
|
|
—
|
|
|
—
|
|
||||||
|
Sierrita
|
2,723
|
|
0.23
|
—
|
|
b
|
0.03
|
12.0
|
|
0.1
|
|
|
1.15
|
|
|||||
|
Miami
|
41
|
|
0.51
|
—
|
|
|
—
|
0.4
|
|
—
|
|
|
—
|
|
|||||
|
Tyrone
|
138
|
|
0.28
|
—
|
|
|
—
|
0.6
|
|
—
|
|
|
—
|
|
|||||
|
Chino
|
391
|
|
0.42
|
0.02
|
|
—
|
b
|
2.7
|
|
0.2
|
|
|
0.01
|
|
|||||
|
Henderson
|
113
|
|
—
|
—
|
|
|
0.17
|
—
|
|
—
|
|
|
0.36
|
|
|||||
|
Climax
|
198
|
|
—
|
—
|
|
|
0.16
|
—
|
|
—
|
|
|
0.64
|
|
|||||
|
Undeveloped:
|
|
|
|
|
|
|
|
|
|||||||||||
|
Cobre
|
73
|
|
0.39
|
—
|
|
|
—
|
0.3
|
|
—
|
|
|
—
|
|
|||||
|
South America
|
|
|
|
|
|
|
|
|
|
||||||||||
|
Developed and producing:
|
|
|
|
|
|
|
|
|
|||||||||||
|
Cerro Verde
|
4,194
|
|
0.37
|
—
|
|
|
0.01
|
30.4
|
|
—
|
|
|
0.73
|
|
|||||
|
El Abra
|
725
|
|
0.44
|
—
|
|
|
—
|
4.1
|
|
—
|
|
|
—
|
|
|||||
|
Candelaria
|
315
|
|
0.57
|
0.13
|
|
|
—
|
4.2
|
|
1.2
|
|
|
—
|
|
|||||
|
Ojos del Salado
|
5
|
|
0.98
|
0.24
|
|
|
—
|
0.1
|
|
—
|
|
b
|
—
|
|
|||||
|
Indonesia
|
|
|
|
|
|
|
|
|
|||||||||||
|
Developed and producing:
|
|
|
|
|
|
|
|
||||||||||||
|
Grasberg open pit
|
258
|
|
0.90
|
0.98
|
|
|
—
|
4.3
|
|
6.5
|
|
|
—
|
|
|||||
|
Deep Ore Zone
|
176
|
|
0.57
|
0.71
|
|
|
—
|
1.9
|
|
3.1
|
|
|
—
|
|
|||||
|
Big Gossan
|
54
|
|
2.26
|
0.97
|
|
|
—
|
2.5
|
|
1.1
|
|
|
—
|
|
|||||
|
Undeveloped:
|
|
|
|
|
|
|
|
|
|||||||||||
|
Grasberg block cave
|
999
|
|
1.01
|
0.78
|
|
|
—
|
18.8
|
|
16.2
|
|
|
—
|
|
|||||
|
Kucing Liar
|
420
|
|
1.25
|
1.07
|
|
|
—
|
9.9
|
|
6.7
|
|
|
—
|
|
|||||
|
Deep Mill Level Zone
|
517
|
|
0.84
|
0.70
|
|
|
—
|
8.3
|
|
9.2
|
|
|
—
|
|
|||||
|
Africa
|
|
|
|
|
|
|
|
|
|||||||||||
|
Developed and producing:
|
|
|
|
|
|
|
|
||||||||||||
|
Tenke
|
119
|
|
3.26
|
—
|
|
|
—
|
7.9
|
|
—
|
|
|
—
|
|
|||||
|
Total 100% basis
|
17,394
|
0.43
|
0.12
|
|
|
0.01
|
133.5
|
|
44.4
|
|
|
3.44
|
|
||||||
|
Consolidated basis
c
|
|
|
|
|
|
116.5
|
|
32.5
|
|
|
3.42
|
|
|||||||
|
FCX’s equity share
d
|
|
|
|
|
|
93.2
|
|
29.4
|
|
|
3.08
|
|
|||||||
|
a.
|
Included estimated recoverable metals contained in stockpiles.
|
|
b.
|
Amounts not shown because of rounding.
|
|
c.
|
Consolidated basis reserves represented estimated metal quantities after reduction for joint venture partner interests at the Morenci mine in North America and the Grasberg minerals district in Indonesia.
|
|
d.
|
Net equity interest reserves represented estimated consolidated basis metal quantities further reduced for noncontrolling interest ownership.
|
178
|
First
Quarter
|
Second
Quarter
|
Third
Quarter
|
Fourth
Quarter
|
Year
|
||||||||||||||||
|
2012
|
|
|
|
|
|
|
|
|
|
|
||||||||||
|
Revenues
|
$
|
4,605
|
|
|
$
|
4,475
|
|
|
$
|
4,417
|
|
|
$
|
4,513
|
|
$
|
18,010
|
|
||
|
Operating income
|
1,734
|
|
|
1,311
|
|
|
1,411
|
|
1,358
|
|
a,b
|
5,814
|
|
a,b
|
||||||
|
Net income
|
1,001
|
|
894
|
|
1,140
|
|
c
|
945
|
|
3,980
|
|
c
|
||||||||
|
Net income attributable to noncontrolling
|
|
|
|
|
|
|
||||||||||||||
|
interests
|
237
|
|
|
184
|
|
|
316
|
|
c
|
202
|
|
939
|
|
c
|
||||||
|
Net income attributable to FCX common
|
|
|
|
|
|
|
|
|||||||||||||
|
stockholders
|
764
|
|
d
|
710
|
|
824
|
|
c
|
743
|
|
a,b
|
3,041
|
|
a,b,c,d
|
||||||
|
Basic net income per share attributable
|
|
|
|
|
|
|||||||||||||||
|
to FCX common stockholders
|
0.81
|
|
0.75
|
|
0.87
|
|
0.78
|
|
3.20
|
|
||||||||||
|
Diluted net income per share attributable
|
|
|
|
|
||||||||||||||||
|
to FCX common stockholders
|
0.80
|
|
d
|
0.74
|
|
0.86
|
|
c
|
0.78
|
|
a,b
|
3.19
|
|
a,b,c,d
|
||||||
|
2011
|
|
|
|
|
|
|
|
|
|
|
||||||||||
|
Revenues
|
$
|
5,709
|
|
|
$
|
5,814
|
|
|
$
|
5,195
|
|
|
$
|
4,162
|
|
|
$
|
20,880
|
|
|
|
Operating income
|
2,936
|
|
2,757
|
|
|
2,150
|
|
|
1,297
|
|
e
|
9,140
|
|
e
|
||||||
|
Net income
|
1,861
|
|
1,726
|
|
1,294
|
|
866
|
|
5,747
|
|
||||||||||
|
Net income attributable to noncontrolling
|
|
|
|
|
|
|
|
|
|
|||||||||||
|
interests
|
362
|
|
|
358
|
|
|
241
|
|
|
226
|
|
|
1,187
|
|
|
|||||
|
Net income attributable to FCX common
|
|
|
|
|
|
|
|
|
|
|
||||||||||
|
stockholders
|
1,499
|
|
f
|
1,368
|
|
f
|
1,053
|
|
g
|
640
|
|
e
|
4,560
|
|
e,f,g
|
|||||
|
Basic net income per share attributable
|
|
|
|
|
|
|
|
|
|
|
||||||||||
|
to FCX common stockholders
|
1.58
|
|
1.44
|
|
1.11
|
|
|
0.67
|
|
4.81
|
|
|||||||||
|
Diluted net income per share attributable
|
|
|
|
|
|
|
|
|
|
|||||||||||
|
to FCX common stockholders
|
1.57
|
|
f
|
1.43
|
|
f
|
1.10
|
|
g
|
0.67
|
|
e
|
4.78
|
|
e,f,g
|
|||||
|
a.
|
Included a gain of
$59 million
(
$31 million
to net income attributable to FCX common stockholders or
$0.03
per share) in the fourth quarter and for the year for the settlement of the insurance claim for business interruption and property damage relating to the 2011 incidents affecting PT Freeport Indonesia's concentrate pipelines. Refer to Note 13 for further discussion.
|
|
b.
|
Included a charge of
$16 million
(
$8 million
to net income attributable to FCX common stockholders or
$0.01
per share) in the fourth quarter and for the year associated with labor agreements at Candelaria. Also included charges of
$9 million
(
$7 million
to net income attributable to FCX common stockholders or
$0.01
per share) for costs associated with the PXP and MMR transactions.
|
|
c.
|
Included a net tax benefit of
$208 million
(
$108 million
attributable to noncontrolling interests and
$100 million
to net income attributable to FCX common stockholders or
$0.11
per share) in the third quarter and
$205 million
(
$107 million
attributable to noncontrolling interests and
$98 million
to net income attributable to FCX common stockholders or
$0.11
per share) for the year associated with adjustments to Cerro Verde's deferred income taxes. Refer to Note
12
for further discussion.
|
|
d.
|
Included losses on early extinguishment of debt totaling
$149 million
(
$0.16
per share) in the first quarter and for the year. Refer to Note 9 for further discussion.
|
|
e.
|
Included charges totaling
$116 million
(
$50 million
to net income attributable to common stock or
$0.05
per share) in the fourth quarter and for the year primarily associated with bonuses for new labor agreements and other employee costs at PT Freeport Indonesia, Cerro Verde and El Abra.
|
|
f.
|
Included losses on early extinguishment of debt totaling
$6 million
(
$0.01
per share) in the first quarter,
$54 million
(
$0.06
per share) in the second quarter and
$60 million
(
$0.06
per share) for the year. Refer to Note 9 for further discussion.
|
|
g.
|
Included additional taxes of
$50 million
(
$0.05
per share) in the third quarter and
$49 million
(
$0.05
per share) for the year associated with Cerro Verde's election to pay a special mining burden during the remaining term of its current stability agreement. Refer to Note 12 for further discussion.
|
179
On
January 21, 2013
, FCX, through a newly formed joint venture, entered into a definitive agreement with OM Group, Inc. to acquire a large-scale cobalt refinery located in Kokkola, Finland, and the related sales and marketing business. The acquisition would provide direct end-market access for the cobalt hydroxide production at Tenke. FCX will be the operator of the joint venture with an effective
56 percent
ownership interest, with the remaining effective ownership interests held by its partners in TFM, including
24 percent
by Lundin Mining Corporation and
20 percent
by La Générale des Carrières et des Mines (Gécamines). Under the terms of the agreement, initial consideration of
$325 million
(subject to working capital adjustments) will be paid at closing, with the potential for additional consideration of up to
$110 million
over a period of
three
years, contingent upon the achievement of revenue-based performance targets. The acquisition is subject to customary closing conditions, including required regulatory approvals, and is expected to close in second-quarter 2013.
On
February 14, 2013
, FCX entered into an agreement for a bank term loan (the Term Loan) in connection with the proposed acquisitions of PXP and MMR. No amounts are currently available to FCX under the Term Loan. The Term Loan will be drawn at the closing of the acquisitions and will provide for an aggregate principal amount of up to
$4.0 billion
that may be used to fund the cash portion of the merger consideration for both transactions, to refinance certain of PXP's and MMR's outstanding debt, or for general corporate purposes.
The Term Loan will mature in annual amounts equal to
10 percent
in the second year,
15 percent
in the third year and
20 percent
in the fourth year of the aggregate principal amount, and the remainder will mature
five years from the date of the first borrowing
. The Term Loan will bear interest determined by reference to FCX's credit ratings (currently
LIBOR
plus
1.50 percent
). In connection with the completion of the Term Loan, FCX's interim financing commitments associated with the proposed acquisitions of PXP and MMR were reduced from
$9.5 billion
to
$5.5 billion
. FCX is pursuing permanent financing for an additional
$5.5 billion
to replace the remaining interim financing commitments.
Also on
February 14, 2013
, FCX and PT Freeport Indonesia entered into a new senior unsecured revolving credit facility, which will refinance and replace FCX's existing revolving credit facility upon completion of the proposed acquisition of PXP. No amounts are currently available to FCX under the new revolving credit facility. At the closing of the acquisition of PXP, the new revolving credit facility will be available for
five
years in an aggregate principal amount of
$3.0 billion
, with
$500 million
available to PT Freeport Indonesia.
The Term Loan and new revolving credit facility both contain customary affirmative covenants and representations, and also contain a number of negative covenants that, among other things, restrict, subject to certain exceptions, the ability of FCX's subsidiaries that are not borrowers or guarantors to incur additional indebtedness (including guarantee obligations) and FCX's ability or the ability of FCX's subsidiaries to: create liens on assets; enter into sale and leaseback transactions; engage in mergers, liquidations and dissolutions; and sell assets. The Term Loan and new revolving credit facility also contain financial ratios governing maximum total leverage and minimum interest coverage.
FCX evaluated events after
December 31, 2012
, and through the date the financial statements were issued, and determined any events or transactions occurring during this period that would require recognition or disclosure are appropriately addressed in these financial statements.
Not applicable.
(a)
Evaluation of disclosure controls and procedures
. Our chief executive officer and chief financial officer, with the participation of management, have evaluated the effectiveness of our “disclosure controls and procedures” (as defined in Rules 13a-15(e) and 15d-15(e) under the Securities Exchange Act of 1934) as of the end of the period covered by this annual report on Form 10-K. Based on their evaluation, they have concluded that our disclosure controls and procedures are effective as of the end of the period covered by this report.
180
(b)
Changes in internal controls
. During second-quarter 2011, we began a phased implementation of a new enterprise resource planning (ERP) information technology system to upgrade our information technology infrastructure and enhance operating efficiency and effectiveness. Implementation has been completed at our North America, South America, Africa and Indonesia mining operations, and we expect implementation of the ERP system to be completed at all of our operations over an approximate two-year period. During each phase of the implementation, an appropriate level of training of employees, testing of the system and monitoring of the financial results recorded in the system is conducted. Management has updated our system of internal control over financial reporting for the impacted operating business units.
With the exception of the ERP implementation described above, there has been no change in our internal control over financial reporting that occurred in the quarterly period covered by this report that materially affected, or is reasonably likely to materially affect, our internal control over financial reporting.
(c) Management’s annual report on internal control over financial reporting and the report thereon of Ernst & Young LLP are included herein under Item 8. “Financial Statements and Supplemental Data.”
Not applicable.
The information set forth under the captions “Information About Director Nominees” and “Section 16(a) Beneficial Ownership Reporting Compliance” of our definitive proxy statement to be filed with the Securities and Exchange Commission (SEC), relating to our
2013
annual meeting of stockholders, is incorporated herein by reference. The information required by Item 10 regarding our executive officers appears in a separately captioned heading after Item 4 in Part I of this report.
The information set forth under the captions “Director Compensation” and “Executive Officer Compensation” of our definitive proxy statement to be filed with the SEC, relating to our
2013
annual meeting of stockholders, is incorporated herein by reference.
The information set forth under the captions “Stock Ownership of Directors and Executive Officers” and “Stock Ownership of Certain Beneficial Owners” of our definitive proxy statement to be filed with the SEC, relating to our
2013
annual meeting of stockholders, is incorporated herein by reference.
Equity Compensation Plan Information
We have equity compensation plans pursuant to which our common stock may be issued to employees and non-employees as compensation pursuant to outstanding equity awards. Only the following two plans, both of which were previously approved by our stockholders, have shares available for future grant: the 2003 Stock Incentive Plan and the 2006 Stock Incentive Plan, which was amended and restated in 2007 and 2010.
181
The following table presents information regarding these equity compensation plans as of
December 31, 2012
:
|
Number of Securities
To be Issued Upon
Exercise of
Outstanding Options,
Warrants and Rights
(a)
|
Weighted-Average
Exercise Price of
Outstanding Options,
Warrants and Rights
(b)
|
Number of Securities
Remaining Available for
Future Issuance Under
Equity Compensation Plans
(Excluding Securities
Reflected in Column (a))
(c)
|
|||||||
|
Equity compensation plans
|
|
|
|
|
|
||||
|
approved by security holders
|
32,322,921
|
|
a
|
$
|
37.43
|
|
32,112,614
|
|
b
|
|
Equity compensation plans not
|
|
|
|
|
|
||||
|
approved by security holders
|
—
|
|
|
—
|
|
—
|
|
|
|
|
Total
|
32,322,921
|
|
a
|
37.43
|
|
32,112,614
|
|
b
|
|
|
a.
|
Includes shares issuable upon the vesting of 788,198 restricted stock units, and the termination of deferrals with respect to 101,500 restricted stock units that were vested as of
December 31, 2012
. These awards are not reflected in column (b) as they do not have an exercise price. The number of securities to be issued in column (a) does not include
39,336
outstanding stock appreciation rights, which are payable solely in cash.
|
|
b.
|
As of
December 31, 2012
, there were
32,110,168
shares remaining available for future issuance under the 2006 Stock Incentive Plan, all of which could be issued pursuant to awards of stock options or stock appreciation rights, and only 12,274,606 of which could be issued pursuant to awards of restricted stock, restricted stock units or “Other Stock-Based Awards,” which awards are valued in whole or in part on the value of the shares of common stock. In addition, there were
2,446
shares remaining available for future issuance under the 2003 Stock Incentive Plan, all of which could be issued pursuant to awards of stock options, stock appreciation rights, restricted stock or “Other Stock-Based Awards.”
|
The information set forth under the caption “Certain Transactions” of our definitive proxy statement to be filed with the SEC, relating to our
2013
annual meeting of stockholders, is incorporated herein by reference.
The information set forth under the caption “Independent Registered Public Accounting Firm” of our definitive proxy statement to be filed with the SEC, relating to our
2013
annual meeting of stockholders, is incorporated herein by reference.
(a)(1).
Financial Statements.
The consolidated statements of income, comprehensive income, cash flows and equity, and the consolidated balance sheets are included as part of Item 8. “Financial Statements and Supplementary Data.”
(a)(2).
Financial Statement Schedules.
Reference is made to the Index to Financial Statements appearing on page F-1 hereof.
(a)(3).
Exhibits.
Reference is made to the Exhibit Index beginning on page E-1 hereof.
182
SIGNATURES
Pursuant to the requirements of Section 13 of the Securities Exchange Act of 1934, the registrant has duly caused this report to be signed on its behalf by the undersigned, thereunto duly authorized, on
February 22, 2013
.
Freeport-McMoRan Copper & Gold Inc.
By:
/s/ Richard C. Adkerson
Richard C. Adkerson
President, Chief Executive Officer
and Director
Pursuant to the requirements of the Securities Exchange Act of 1934, this report has been signed by the following persons on behalf of the registrant in the capacities indicated on
February 22, 2013
.
|
*
|
Chairman of the Board
|
|
James R. Moffett
|
|
|
|
|
|
*
|
Vice Chairman of the Board
|
|
B. M. Rankin, Jr.
|
|
|
|
|
|
/s/ Richard C. Adkerson
|
President, Chief Executive Officer and Director
|
|
Richard C. Adkerson
|
(Principal Executive Officer)
|
|
|
|
|
/s/ Kathleen L. Quirk
|
Executive Vice President, Chief Financial Officer and Treasurer
|
|
Kathleen L. Quirk
|
(Principal Financial Officer)
|
|
|
|
|
*
|
Vice President and Controller - Financial Reporting
|
|
C. Donald Whitmire, Jr.
|
(Principal Accounting Officer)
|
|
|
|
|
*
|
Director
|
|
Robert J. Allison, Jr.
|
|
|
|
|
|
*
|
Director
|
|
Robert A. Day
|
|
|
|
|
|
*
|
Director
|
|
Gerald J. Ford
|
|
|
|
|
|
*
|
Director
|
|
H. Devon Graham, Jr.
|
|
|
|
|
|
|
|
S - 1
|
*
|
Director
|
|
Charles C. Krulak
|
|
|
|
|
|
*
|
Director
|
|
Bobby Lee Lackey
|
|
|
|
|
|
*
|
Director
|
|
Jon C. Madonna
|
|
|
|
|
|
*
|
Director
|
|
Dustan E. McCoy
|
|
|
|
|
|
*
|
Director
|
|
Stephen H. Siegele
|
|
|
|
|
|
|
|
|
|
|
|
* By: /s/ Richard C. Adkerson
|
|
|
Richard C. Adkerson
|
|
|
Attorney-in-Fact
|
|
S - 2
FREEPORT-McMoRan COPPER & GOLD INC.
INDEX TO FINANCIAL STATEMENTS
Our financial statements and the notes thereto, and the report of Ernst & Young LLP included in our
2012
annual report are incorporated herein by reference.
|
|
Page
|
|
Report of Independent Registered Public Accounting Firm
|
F-1
|
|
Schedule II-Valuation and Qualifying Accounts
|
F-2
|
Schedules other than the one listed above have been omitted since they are either not required, not applicable or the required information is included in the financial statements or notes thereto.
REPORT OF INDEPENDENT REGISTERED PUBLIC ACCOUNTING FIRM
TO THE BOARD OF DIRECTORS AND STOCKHOLDERS OF
FREEPORT-McMoRan COPPER & GOLD INC.
We have audited the consolidated financial statements of Freeport-McMoRan Copper & Gold Inc. as of
December 31, 2012
and
2011
and for each of the three years in the period ended
December 31, 2012
, and have issued our report thereon dated
February 22, 2013
. Our audits also included the financial statement schedule listed in the index above for this Form 10-K. The schedule listed in the index above is the responsibility of the company’s management. Our responsibility is to express an opinion based on our audits.
In our opinion, the financial statement schedule referred to above, when considered in relation to the basic consolidated financial statements taken as a whole, presents fairly in all material respects the information set forth therein.
/s/ Ernst & Young LLP
Phoenix, Arizona
February 22, 2013
F - 1
FREEPORT-McMoRan COPPER & GOLD INC.
SCHEDULE II - VALUATION AND QUALIFYING ACCOUNTS
(In millions)
|
|
|
Additions
|
|
|
|
|||||||||||||||
|
|
Balance at
|
Charged to
|
Charged to
|
Other
|
|
Balance at
|
||||||||||||||
|
|
Beginning of
|
Costs and
|
Other
|
Additions
|
|
End of
|
||||||||||||||
|
|
Year
|
Expense
|
Accounts
|
(Deductions)
|
|
Year
|
||||||||||||||
|
Reserves and allowances deducted
|
|
|
|
|
|
|
||||||||||||||
|
from asset accounts:
|
|
|
|
|
|
|
||||||||||||||
|
Materials and supplies inventory allowances
|
|
|
|
|
|
|
||||||||||||||
|
Year Ended December 31, 2012
|
$
|
26
|
|
$
|
7
|
|
$
|
—
|
|
$
|
(6
|
)
|
a
|
$
|
27
|
|
||||
|
Year Ended December 31, 2011
|
26
|
|
4
|
|
—
|
|
(4
|
)
|
a
|
26
|
|
|||||||||
|
Year Ended December 31, 2010
|
21
|
|
11
|
|
—
|
|
(6
|
)
|
a
|
26
|
|
|||||||||
|
Valuation allowance for deferred tax assets
|
|
|
|
|
|
|
||||||||||||||
|
Year Ended December 31, 2012
|
$
|
2,393
|
|
$
|
49
|
|
$
|
1
|
|
$
|
—
|
|
|
$
|
2,443
|
|
||||
|
Year Ended December 31, 2011
|
2,226
|
|
146
|
|
21
|
|
—
|
|
|
2,393
|
|
|||||||||
|
Year Ended December 31, 2010
|
2,157
|
|
55
|
|
14
|
|
—
|
|
|
2,226
|
|
|||||||||
|
Reserves for non-income taxes:
|
|
|
|
|
|
|
||||||||||||||
|
Year Ended December 31, 2012
|
$
|
73
|
|
$
|
21
|
|
$
|
(2
|
)
|
$
|
(12
|
)
|
b
|
$
|
80
|
|
||||
|
Year Ended December 31, 2011
|
73
|
|
12
|
|
(2
|
)
|
(10
|
)
|
b
|
73
|
|
|||||||||
|
Year Ended December 31, 2010
|
47
|
|
29
|
|
—
|
|
(3
|
)
|
b
|
73
|
|
|||||||||
|
a.
|
Primarily represents write-offs of obsolete materials and supplies inventories.
|
|
b.
|
Represents amounts paid or adjustments to reserves based on revised estimates.
|
F - 2
|
FREEPORT-McMoRan COPPER & GOLD INC.
|
|||||
|
EXHIBIT INDEX
|
|||||
|
|
|
Filed
|
|
|
|
|
Exhibit
|
|
with this
|
Incorporated by Reference
|
||
|
Number
|
Exhibit Title
|
Form 10-K
|
Form
|
File No.
|
Date Filed
|
|
2.1
|
Agreement and Plan of Merger dated as of November 18, 2006, by and among Freeport-McMoRan Copper & Gold Inc. (FCX), Phelps Dodge Corporation and Panther Acquisition Corporation.
|
|
8-K
|
333-139252
|
11/20/2006
|
|
2.2
|
Agreement and Plan of Merger by and among Plains Exploration & Production Company, Freeport-McMoRan Copper & Gold Inc. and IMONC LLC, dated as of December 5, 2012.
|
8-K
|
001-11307-01
|
12/6/2012
|
|
|
2.3
|
Agreement and Plan of Merger by and among McMoRan Exploration Co., Freeport-McMoRan Copper & Gold Inc. and INAVN Corp., dated as of December 5, 2012.
|
8-K
|
001-11307-01
|
12/6/2012
|
|
|
3.1
|
Composite Certificate of Incorporation of FCX.
|
|
10-Q
|
001-11307-01
|
8/6/2010
|
|
3.2
|
Amended and Restated By-Laws of FCX, as amended through January 10, 2013.
|
|
8-K
|
001-11307-01
|
1/17/2013
|
|
4.1
|
Indenture dated as of March 19, 2007, from FCX to The Bank of New York, as Trustee, with respect to the 8.375% Senior Notes due 2017, and the Senior Floating Rate Notes due 2015.
|
|
8-K
|
001-11307-01
|
3/19/2007
|
|
4.2
|
Indenture dated as of February 13, 2012 between Freeport-McMoRan Copper & Gold Inc. and U.S. Bank National Association, as trustee.
|
8-K
|
001-11307-01
|
2/13/2012
|
|
|
4.3
|
First Supplemental Indenture dated as of February 13, 2012 between Freeport-McMoRan Copper & Gold Inc. and U.S. Bank National Association, as trustee.
|
8-K
|
001-11307-01
|
2/13/2012
|
|
|
4.4
|
Second Supplemental Indenture dated as of February 13, 2012 between Freeport-McMoRan Copper & Gold Inc. and U.S. Bank National Association, as trustee.
|
8-K
|
001-11307-01
|
2/13/2012
|
|
|
4.5
|
Third Supplemental Indenture dated as of February 13, 2012 between Freeport-McMoRan Copper & Gold Inc. and U.S. Bank National Association, as trustee.
|
8-K
|
001-11307-01
|
2/13/2012
|
|
|
10.1
|
Credit Agreement dated as of March 4, 2011, among FCX, the Lenders party thereto, the Issuing Banks party thereto, JP Morgan Chase Bank, N.A. as Administrative Agent and Bank of America, N.A., as Syndication Agent.
|
10-Q
|
001-11307-01
|
5/6/2011
|
|
|
10.2
|
Contract of Work dated December 30, 1991, between the Government of the Republic of Indonesia and PT Freeport Indonesia.
|
|
S-3
|
333-72760
|
11/5/2001
|
|
10.3
|
Contract of Work dated August 15, 1994, between the Government of the Republic of Indonesia and PT Irja Eastern Minerals Corporation.
|
|
S-3
|
333-72760
|
11/5/2001
|
|
10.4
|
Participation Agreement dated as of October 11, 1996, between PT Freeport Indonesia and P.T. RTZ-CRA Indonesia (a subsidiary of Rio Tinto PLC) with respect to a certain contract of work.
|
|
S-3
|
333-72760
|
11/5/2001
|
|
10.5
|
Agreement dated as of October 11, 1996, to Amend and Restate Trust Agreement among PT Freeport Indonesia, FCX, the RTZ Corporation PLC (now Rio Tinto PLC), P.T. RTZ-CRA Indonesia, RTZ Indonesian Finance Limited and First Trust of New York, National Association, and The Chase Manhattan Bank, as Administrative Agent, JAA Security Agent and Security Agent.
|
|
8-K
|
001-09916
|
11/13/1996
|
|
10.6
|
Concentrate Purchase and Sales Agreement dated effective December 11, 1996, between PT Freeport Indonesia and PT Smelting.
|
|
S-3
|
333-72760
|
11/5/2001
|
E - 1
|
FREEPORT-McMoRan COPPER & GOLD INC.
|
|||||
|
EXHIBIT INDEX
|
|||||
|
|
|
Filed
|
|
|
|
|
Exhibit
|
|
with this
|
Incorporated by Reference
|
||
|
Number
|
Exhibit Title
|
Form 10-K
|
Form
|
File No.
|
Date Filed
|
|
10.7
|
Second Amended and Restated Joint Venture and Shareholders’ Agreement dated as of December 11, 1996, among Mitsubishi Materials Corporation, Nippon Mining and Metals Company, Limited and PT Freeport Indonesia.
|
|
S-3
|
333-72760
|
11/5/2001
|
|
10.8
|
Participation Agreement, dated as of March 16, 2005, among Phelps Dodge Corporation, Cyprus Amax Minerals Company, a Delaware corporation, Cyprus Metals Company, a Delaware corporation, Cyprus Climax Metals Company, a Delaware corporation, Sumitomo Corporation, a Japanese corporation, Summit Global Management, B.V., a Dutch corporation, Sumitomo Metal Mining Co., Ltd., a Japanese corporation, Compañia de Minas Buenaventura S.A.A., a Peruvian sociedad anonima abierta, and Sociedad Minera Cerro Verde S.A.A., a Peruvian sociedad anonima abierta.
|
|
8-K
|
001-00082
|
3/22/2005
|
|
10.9
|
Shareholders Agreement, dated as of June 1, 2005, among Phelps Dodge Corporation, Cyprus Climax Metals Company, a Delaware corporation, Sumitomo Corporation, a Japanese corporation, Sumitomo Metal Mining Co., Ltd., a Japanese corporation, Summit Global Management B.V., a Dutch corporation, SMM Cerro Verde Netherlands, B.V., a Dutch corporation, Compañia de Minas Buenaventura S.A.A., a Peruvian sociedad anonima abierta, and Sociedad Minera Cerro Verde S.A.A., a Peruvian sociedad anonima abierta.
|
|
8-K
|
001-00082
|
6/7/2005
|
|
10.10
|
Master Agreement and Plan of Merger among Columbian Chemicals Company, Columbian Chemicals Acquisition LLC, Columbian Chemicals Merger Sub, Inc. and Phelps Dodge Corporation, dated November 15, 2005.
|
|
10-K
|
001-00082
|
2/27/2006
|
|
10.11
|
Reclamation and Remediation Trust Agreement between Phelps Dodge Corporation and Wells Fargo Delaware Trust Company, dated December 22, 2005.
|
|
10-K
|
001-00082
|
2/27/2006
|
|
10.12
|
Amended and Restated Mining Convention dated as of September 28, 2005, among the Democratic Republic of Congo, La Générale des Carrières et des Mines, Lundin Holdings Ltd. (now TF Holdings Limited) and Tenke Fungurume Mining S.A.R.L.
|
|
8-K
|
001-11307-01
|
9/2/2008
|
|
10.13
|
Addendum No.1 to the Amended and Restated Mining Convention dated as of September 28, 2005, among the Democratic Repbulic of Congo, La Générale des Carrières et des Mines, TF Holdings Limited and Tenke Fungurume Mining S.A.R.L., dated as of December 11, 2010
|
10-Q
|
001-11307-01
|
5/6/2011
|
|
|
10.14
|
Amended and Restated Shareholders Agreement dated as of September 28, 2005, by and between La Générale des Carrières et des Mines and Lundin Holdings Ltd. (now TF Holdings Limited) and its subsidiaries.
|
|
8-K
|
001-11307-01
|
9/2/2008
|
|
10.15
|
Addendum No.1 to the Amended and Restated Shareholders Agreement dated as of September 28, 2005, among La Générale des Carrières et des Mines and TF Holdings Limited, Chui Ltd., Faru Ltd., Mboko Ltd., Tembo Ltd., and Tenke Fungurume Mining S.A.R.L., dated as of December 11, 2010.
|
10-Q
|
001-11307-01
|
5/6/2011
|
|
|
10.16
|
Stock Purchase Agreement dated September 19, 2010, by and among Freeport-McMoRan Copper & Gold Inc., Freeport-McMoRan Preferred LLC and McMoRan Exploration Co.
|
|
10-Q
|
001-11307-01
|
11/5/2010
|
|
10.17
|
Registration Rights Agreement by and between Freeport-McMoRan Preferred LLC and McMoRan Exploration Co.
|
|
8-K
|
001-11307-01
|
12/30/2010
|
E - 2
|
FREEPORT-McMoRan COPPER & GOLD INC.
|
|||||
|
EXHIBIT INDEX
|
|||||
|
|
|
Filed
|
|
|
|
|
Exhibit
|
|
with this
|
Incorporated by Reference
|
||
|
Number
|
Exhibit Title
|
Form 10-K
|
Form
|
File No.
|
Date Filed
|
|
10.18
|
Stockholder Agreement by and among McMoRan Exploration Co., Freeport-McMoRan Copper & Gold Inc. and Freeport-McMoRan Preferred LLC.
|
|
8-K
|
001-11307-01
|
12/30/2010
|
|
10.19
|
Term Loan Agreement dated as of February 14, 2013, among Freeport-McMoRan Copper & Gold Inc., JPMorgan Chase Bank, N.A., as administrative agent, Bank of America, N.A., as syndication agent, HSBC Bank USA, National Association, Mizuho Corporate Bank, Ltd., Sumitomo Mitsui Banking Corporation, The Bank of Nova Scotia and The Bank of Tokyo-Mitsubishi UFJ, Ltd., as co-documentation agents, and each of the lenders party thereto. Upon consummation of the acquisition of Plains Exploration & Production Company (PXP), the PXP surviving entity, will join the Term Loan as a borrower thereunder.
|
8-K
|
001-11307-01
|
2/15/2013
|
|
|
10.20
|
Revolving Credit Agreement dated as of February 14, 2013, among Freeport-McMoRan Copper & Gold Inc., PT Freeport Indonesia, JPMorgan Chase Bank, N.A., as administrative agent and the swingline lender, Bank of America, N.A., as syndication agent, BNP Paribas, Citibank, N.A., HSBC Bank USA, National Association, Muzho Corporate Bank, Ltd., Sumitomo Mitsui Banking Corporation, The Bank of Nova Scotia and The Bank of Tokyo-Mitsubishi UFJ, Ltd., as co-documentation agents, and each of the lenders and issuing banks party thereto. Upon consummation of the acquisition of Plains Exploration & Production Company (PXP), the PXP surviving entity, will join the Revolving Credit Facility as a borrower thereunder.
|
8-K
|
001-11307-01
|
2/15/2013
|
|
|
10.21
|
Voting and Support Agreement, dated as of December 5, 2012, by and between Plains Exploration & Production Company, Freeport-McMoRan Copper & Gold Inc. and McMoRan Exploration Co.
|
8-K
|
001-11307-01
|
12/6/2012
|
|
|
10.22
|
Letter Agreement, dated as of December 5, 2012, by and among James C. Flores, Plains Exploration & Production Company and Freeport-McMoRan Copper & Gold Inc.
|
8-K
|
001-11307-01
|
12/6/2012
|
|
|
10.23
|
Letter Agreement, dated as of December 5, 2012, by and among Doss R. Bourgeois, Plains Exploration & Production Company and Freeport-McMoRan Copper & Gold Inc.
|
8-K
|
001-11307-01
|
12/6/2012
|
|
|
10.24
|
Letter Agreement, dated as of December 5, 2012, by and among Winston M. Talbert, Plains Exploration & Production Company and Freeport-McMoRan Copper & Gold Inc.
|
8-K
|
001-11307-01
|
12/6/2012
|
|
|
10.25
|
Letter Agreement, dated as of December 5, 2012, by and among John F. Wombwell, Plains Exploration & Production Company and Freeport-McMoRan Copper & Gold Inc.
|
8-K
|
001-11307-01
|
12/6/2012
|
|
|
10.26*
|
FCX Director Compensation.
|
|
10-Q
|
001-11307-01
|
5/6/2011
|
|
10.27*
|
Amended and Restated Agreement for Consulting Services between FMS and B. M. Rankin, Jr. effective as of January 1, 2010.
|
|
10-K
|
001-11307-01
|
2/26/2010
|
|
10.28*
|
Amended and Restated Executive Employment Agreement dated effective as of December 2, 2008, between FCX and James R. Moffett.
|
|
10-K
|
001-11307-01
|
2/26/2009
|
|
10.29*
|
Amended and Restated Change of Control Agreement dated effective as of December 2, 2008, between FCX and James R. Moffett.
|
|
10-K
|
001-11307-01
|
2/26/2009
|
E - 3
|
FREEPORT-McMoRan COPPER & GOLD INC.
|
|||||
|
EXHIBIT INDEX
|
|||||
|
|
|
Filed
|
|
|
|
|
Exhibit
|
|
with this
|
Incorporated by Reference
|
||
|
Number
|
Exhibit Title
|
Form 10-K
|
Form
|
File No.
|
Date Filed
|
|
10.31*
|
Amended and Restated Executive Employment Agreement dated effective as of December 2, 2008, between FCX and Richard C. Adkerson.
|
|
10-K
|
001-11307-01
|
2/26/2009
|
|
10.32*
|
Amendment to Amended and Restated Executive Employment Agreement dated December 2, 2008, by and between FCX and Richard C. Adkerson, dated April 27, 2011.
|
8-K
|
001-11307-01
|
4/29/2011
|
|
|
10.33*
|
Amended and Restated Executive Employment Agreement dated effective as of December 2, 2008, between FCX and Kathleen L. Quirk.
|
|
10-K
|
001-11307-01
|
2/26/2009
|
|
10.34*
|
Amendment to Amended and Restated Executive Employment Agreement dated December 2, 2008, by and between FCX and Kathleen L. Quirk, dated April 27, 2011.
|
8-K
|
001-11307-01
|
4/29/2011
|
|
|
10.35*
|
FCX Executive Services Program
|
10-K
|
001-11307-01
|
2/27/2012
|
|
|
10.36*
|
FCX Supplemental Executive Retirement Plan, as amended and restated.
|
|
8-K
|
001-11307-01
|
2/5/2007
|
|
10.37*
|
FCX Supplemental Executive Capital Accumulation Plan.
|
|
10-Q
|
001-11307-01
|
5/12/2008
|
|
10.38*
|
FCX Supplemental Executive Capital Accumulation Plan Amendment One.
|
|
10-Q
|
001-11307-01
|
5/12/2008
|
|
10.39*
|
FCX Supplemental Executive Capital Accumulation Plan Amendment Two.
|
|
10-K
|
001-11307-01
|
2/26/2009
|
|
10.40*
|
FCX 2005 Supplemental Executive Capital Accumulation Plan.
|
|
10-K
|
001-11307-01
|
2/26/2009
|
|
10.41*
|
FCX 2005 Supplemental Executive Capital Accumulation Plan Amendment One.
|
|
10-K
|
001-11307-01
|
2/26/2010
|
|
10.42*
|
FCX 1995 Stock Option Plan for Non-Employee Directors, as amended and restated.
|
|
10-Q
|
001-11307-01
|
5/10/2007
|
|
10.43*
|
FCX Amended and Restated 1999 Stock Incentive Plan, as amended and restated.
|
|
10-Q
|
001-11307-01
|
5/10/2007
|
|
10.44*
|
FCX 2003 Stock Incentive Plan, as amended and restated.
|
|
10-Q
|
001-11307-01
|
5/10/2007
|
|
10.45*
|
Form of Amendment No. 1 to Notice of Grant of Nonqualified Stock Options and Stock Appreciation Rights under the 2004 Director Compensation Plan.
|
|
8-K
|
001-11307-01
|
5/5/2006
|
|
10.46*
|
FCX 2004 Director Compensation Plan, as amended and restated.
|
|
10-Q
|
001-11307-01
|
8/6/2010
|
|
10.47*
|
FCX 2005 Annual Incentive Plan, as amended and restated.
|
|
10-K
|
001-11307-01
|
2/26/2009
|
|
10.48*
|
FCX Amended and Restated 2006 Stock Incentive Plan.
|
|
8-K
|
001-11307-01
|
6/14/2010
|
|
10.49*
|
Form of Notice of Grant of Nonqualified Stock Options for grants under the FCX 1999 Stock Incentive Plan, the 2003 Stock Incentive Plan and the 2006 Stock Incentive Plan.
|
|
10-K
|
001-11307-01
|
2/29/2008
|
|
10.50*
|
Form of Notice of Grant of Restricted Stock Units for grants under the FCX 1999 Stock Incentive Plan, the 2003 Stock Incentive Plan and the 2006 Stock Incentive Plan.
|
|
10-K
|
001-11307-01
|
2/26/2010
|
|
10.51*
|
Form of Notice of Grant of Nonqualified Stock Options and Restricted Stock Units under the 2006 Stock Incentive Plan (for grants made to non-management directors and advisory directors).
|
|
8-K
|
001-11307-01
|
6/14/2010
|
E - 4
|
FREEPORT-McMoRan COPPER & GOLD INC.
|
|||||
|
EXHIBIT INDEX
|
|||||
|
|
|
Filed
|
|
|
|
|
Exhibit
|
|
with this
|
Incorporated by Reference
|
||
|
Number
|
Exhibit Title
|
Form 10-K
|
Form
|
File No.
|
Date Filed
|
|
10.52*
|
Form of Performance-Based Restricted Stock Unit Agreement for grants under the FCX 1999 Stock Incentive Plan, the 2003 Stock Incentive Plan and the 2006 Stock Incentive Plan, (Form used for awards granted prior to 2010).
|
|
10-K
|
001-11307-01
|
2/29/2008
|
|
10.53*
|
Form of Notice of Grant of Performance-Based Restricted Stock Units for grants under the FCX 2003 Stock Incentive Plan and the 2006 Stock Incentive Plan.
|
|
8-K
|
001-11307-01
|
2/5/2010
|
|
10.54*
|
Form of Restricted Stock Unit Agreement (form used in connection with participant elections) for grants under the FCX 1999 Stock Incentive Plan, the 2003 Stock Incentive Plan and the 2006 Stock Incentive Plan.
|
|
10-K
|
001-11307-01
|
2/29/2008
|
|
10.55*
|
Form of Performance-Based Restricted Stock Unit Agreement (form used in connection with participant elections) for grants under the FCX 1999 Stock Incentive Plan, the 2003 Stock Incentive Plan and the 2006 Stock Incentive Plan.
|
|
10-K
|
001-11307-01
|
2/29/2008
|
|
10.56*
|
FCX 2009 Annual Incentive Plan
|
|
8-K
|
001-11307-01
|
6/17/2009
|
|
10.57*
|
Form of Nonqualified Stock Options Grant Agreement (effective February 2012).
|
10-K
|
001-11307-01
|
2/27/2012
|
|
|
10.58*
|
Form of Restricted Stock Unit Agreement (effective February 2012).
|
10-K
|
001-11307-01
|
2/27/2012
|
|
|
10.59*
|
Form of Performance-Based Restricted Stock Unit Agreement (effective February 2012).
|
10-K
|
001-11307-01
|
2/27/2012
|
|
|
FCX Computation of Ratio of Earnings to Fixed Charges.
|
X
|
|
|
|
|
|
14.1
|
FCX Principles of Business Conduct.
|
|
10-K
|
001-11307-01
|
2/29/2008
|
|
Subsidiaries of FCX.
|
X
|
|
|
|
|
|
Consent of Ernst & Young LLP.
|
X
|
|
|
|
|
|
Certified resolution of the Board of Directors of FCX authorizing this report to be signed on behalf of any officer or director pursuant to a Power of Attorney.
|
X
|
|
|
|
|
|
Powers of Attorney pursuant to which this report has been signed on behalf of certain officers and directors of FCX.
|
X
|
|
|
|
|
|
Certification of Principal Executive Officer pursuant to Rule 13a-14(a)/15d – 14(a).
|
X
|
|
|
|
|
|
Certification of Principal Financial Officer pursuant to Rule 13a-14(a)/15d – 14(a).
|
X
|
|
|
|
|
|
Certification of Principal Executive Officer pursuant to 18 U.S.C. Section 1350.
|
X
|
|
|
|
|
|
Certification of Principal Financial Officer pursuant to 18 U.S.C Section 1350.
|
X
|
|
|
|
|
|
Mine Safety Disclosure
|
X
|
|
|
|
|
|
Asset and Stock Purchase Agreement among OMG Harjavalta Chemicals Holding BV, OMG Americas, Inc., OM Group, Inc., Koboltti Chemicals Holdings Limited and solely for purposes of Section 10.13 and Exhibit A, Freeport-McMoRan Corporation, dated as of January 21, 2013.
|
X
|
||||
E - 5
|
FREEPORT-McMoRan COPPER & GOLD INC.
|
|||||
|
EXHIBIT INDEX
|
|||||
|
|
|
Filed
|
|
|
|
|
Exhibit
|
|
with this
|
Incorporated by Reference
|
||
|
Number
|
Exhibit Title
|
Form 10-K
|
Form
|
File No.
|
Date Filed
|
|
101.INS
|
XBRL Instance Document
|
X
|
|
|
|
|
101.SCH
|
XBRL Taxonomy Extension Schema
|
X
|
|
|
|
|
101.CAL
|
XBRL Taxonomy Extension Calculation Linkbase
|
X
|
|
|
|
|
101.DEF
|
XBRL Taxonomy Extension Definition Linkbase
|
X
|
|
|
|
|
101.LAB
|
XBRL Taxonomy Extension Label Linkbase
|
X
|
|
|
|
|
101.PRE
|
XBRL Taxonomy Extension Presentation Linkbase
|
X
|
|
|
|
Note: Certain instruments with respect to long-term debt of FCX have not been filed as exhibits to this Annual Report on Form 10-K since the total amount of securities authorized under any such instrument does not exceed 10 percent of the total assets of FCX and its subsidiaries on a consolidated basis. FCX agrees to furnish a copy of each such instrument upon request of the Securities and Exchange Commission.
* Indicates management contract or compensatory plan or arrangement.
E - 6
TABLE OF CONTENTS
Part IItem 1A. Risk FactorsItem 1B. Unresolved Staff CommentsItem 3. Legal ProceedingsItem 4. Mine Safety DisclosuresPart IIItem 5. Market For Registrant S Common Equity, Related Stockholder Matters and Issuer Purchases Of Equity SecuritiesItem 6. Selected Financial DataItem 8. Financial Statements and Supplementary DataNote 1. Summary Of Significant Accounting PoliciesNote 2. Ownership in Subsidiaries, Joint Ventures and Investment in Pt SmeltingNote 3. Inventories, Including Long-term Mill and Leach StockpilesNote 4. Property, Plant, Equipment and Development Costs, NetNote 5. Long-term ReceivablesNote 6. Other AssetsNote 7. Accounts Payable and Accrued LiabilitiesNote 8. Other LiabilitiesNote 9. DebtNote 10. Employee BenefitsNote 11. Stockholders Equity and Stock-based CompensationNote 12. Income TaxesNote 13. ContingenciesNote 14. Commitments and GuaranteesNote 15. Financial InstrumentsNote 16. Fair Value MeasurementNote 17. Business SegmentsNote 18: Supplementary Mineral Reserve Information (unaudited)Note 19. Quarterly Financial Information (unaudited)Note 20. Subsequent EventsItem 9. Changes in and Disagreements with Accountants on Accounting and Financial DisclosureItem 9A. Controls and ProceduresItem 9B. Other InformationPart IIIItem 10. Directors, Executive Officers and Corporate GovernanceItem 11. Executive CompensationItem 12. Security Ownership Of Certain Beneficial Owners and Management and Related Stockholder MattersItem 13. Certain Relationships and Related Transactions, and Director IndependenceItem 14. Principal Accounting Fees and ServicesPart IVItem 15. Exhibits, Financial Statement Schedules