FREEPORT-MCMORAN INC
10-Ks and 10-Qs
|
|
|
|
|
|
|
|
|
|
|
|
|
|
|
|
|
|
|
|
|
|
|
|
|
|
|
|
|
|
|
|
|
|
|
|
|
|
|
|
|
|
|
|
|
|
|
|
|
|
|
|
|
|
|
|
|
|
|
|
UNITED STATES
|
||
|
SECURITIES AND EXCHANGE COMMISSION
|
||
|
Washington, D.C. 20549
|
||
|
|
||
|
FORM 10-Q
|
||
|
|
||
|
(Mark One)
|
||
|
[X] QUARTERLY REPORT PURSUANT TO SECTION 13 OR 15(d) OF THE SECURITIES EXCHANGE ACT OF 1934
|
||
|
For the quarterly period ended September 30, 2013
|
||
|
OR
|
||
|
[ ] TRANSITION REPORT PURSUANT TO SECTION 13 OR 15(d) OF THE SECURITIES EXCHANGE ACT OF 1934
|
||
|
For the transition period from
|
|
to
|
|
Commission File Number: 001-11307-01
|
||
Freeport-McMoRan Copper & Gold Inc.
(Exact name of registrant as specified in its charter)
|
Delaware
|
74-2480931
|
|
(State or other jurisdiction of
|
(I.R.S. Employer Identification No.)
|
|
incorporation or organization)
|
|
|
|
|
|
333 North Central Avenue
|
|
|
Phoenix, AZ
|
85004-2189
|
|
(Address of principal executive offices)
|
(Zip Code)
|
|
(602) 366-8100
|
|
|
(Registrant's telephone number, including area code)
|
|
Indicate by check mark whether the registrant (1) has filed all reports required to be filed by Section 13 or 15(d) of the Securities Exchange Act of 1934 during the preceding 12 months (or for such shorter period that the registrant was required to file such reports), and (2) has been subject to such filing requirements for the past 90 days.
þ
Yes
¨
No
Indicate by check mark whether the registrant has submitted electronically and posted on its corporate website, if any, every Interactive Data File required to be submitted and posted pursuant to Rule 405 of Regulation S-T (§ 232.405 of this chapter) during the preceding 12 months (or for such shorter period that the registrant was required to submit and post such files).
þ
Yes
¨
No
Indicate by check mark whether the registrant is a large accelerated filer, an accelerated filer, a non-accelerated filer, or a smaller reporting company. See the definitions of “large accelerated filer,” “accelerated filer” and “smaller reporting company” in Rule 12b-2 of the Exchange Act.
Large accelerated filer
þ
Accelerated filer
¨
Non-accelerated filer
¨
Smaller reporting company
¨
Indicate by check mark whether the registrant is a shell company (as defined in Rule 12b-2 of the Exchange Act).
¨
Yes
þ
No
On
October 31, 2013
, there were issued and outstanding
1,038,155,157
shares of the registrant’s common stock, par value
$0.10
per share.
FREEPORT-McMoRan COPPER & GOLD INC.
TABLE OF CONTENTS
|
|
|
|
|
Page
|
|
|
|
|
|
|
|
|
|
|
|
|
|
|
|
|
|
|
|
|
|
|
|
|
|
|
|
|
|
|
|
|
|
|
|
|
|
|
|
|
|
|
|
|
|
|
|
|
|
|
|
|
|
|
|
|
|
|
|
|
.
2
|
|
FINANCIAL INFORMATION
|
|
Item 1.
|
Financial Statements
.
|
FREEPORT-McMoRan COPPER & GOLD INC.
CONDENSED CONSOLIDATED BALANCE SHEETS (Unaudited)
|
September 30,
2013 |
December 31,
2012 |
||||||
|
|
(In millions)
|
||||||
|
ASSETS
|
|
|
|||||
|
Current assets:
|
|
|
|||||
|
Cash and cash equivalents
|
$
|
2,219
|
|
$
|
3,705
|
|
|
|
Trade accounts receivable
|
1,749
|
|
927
|
|
|||
|
Other accounts receivable
|
480
|
|
702
|
|
|||
|
Inventories:
|
|
||||||
|
Materials and supplies, net
|
1,762
|
|
1,504
|
|
|||
|
Mill and leach stockpiles
|
1,744
|
|
1,672
|
|
|||
|
Product
|
1,347
|
|
1,400
|
|
|||
|
Other current assets
|
305
|
|
387
|
|
|||
|
Total current assets
|
9,606
|
|
10,297
|
|
|||
|
Property, plant, equipment and development costs, net
|
46,647
|
|
20,999
|
|
|||
|
Long-term mill and leach stockpiles
|
2,304
|
|
1,955
|
|
|||
|
Goodwill
|
1,932
|
|
—
|
|
|||
|
Other assets
|
2,109
|
|
2,189
|
|
|||
|
Total assets
|
$
|
62,598
|
|
$
|
35,440
|
|
|
|
LIABILITIES AND EQUITY
|
|
|
|||||
|
Current liabilities:
|
|
|
|||||
|
Accounts payable and accrued liabilities
|
$
|
3,698
|
|
$
|
2,708
|
|
|
|
Dividends payable
|
332
|
|
299
|
|
|||
|
Current portion of reclamation and environmental obligations
|
257
|
|
241
|
|
|||
|
Accrued income taxes
|
141
|
|
93
|
|
|||
|
Current portion of debt
|
70
|
|
2
|
|
|||
|
Total current liabilities
|
4,498
|
|
3,343
|
|
|||
|
Long-term debt, less current portion
|
21,053
|
|
3,525
|
|
|||
|
Deferred income taxes
|
6,922
|
|
3,490
|
|
|||
|
Reclamation and environmental obligations, less current portion
|
3,077
|
|
2,127
|
|
|||
|
Other liabilities
|
1,774
|
|
1,644
|
|
|||
|
Total liabilities
|
37,324
|
|
14,129
|
|
|||
|
Redeemable noncontrolling interest
|
720
|
|
—
|
|
|||
|
Equity:
|
|
|
|||||
|
FCX stockholders’ equity:
|
|
|
|||||
|
Common stock
|
117
|
|
107
|
|
|||
|
Capital in excess of par value
|
22,092
|
|
19,119
|
|
|||
|
Retained earnings
|
2,361
|
|
2,399
|
|
|||
|
Accumulated other comprehensive loss
|
(484
|
)
|
(506
|
)
|
|||
|
Common stock held in treasury
|
(3,681
|
)
|
(3,576
|
)
|
|||
|
Total FCX stockholders’ equity
|
20,405
|
|
17,543
|
|
|||
|
Noncontrolling interests
|
4,149
|
|
3,768
|
|
|||
|
Total equity
|
24,554
|
|
21,311
|
|
|||
|
Total liabilities and equity
|
$
|
62,598
|
|
$
|
35,440
|
|
|
The accompanying notes are an integral part of these consolidated financial statements.
3
FREEPORT-McMoRan COPPER & GOLD INC.
CONSOLIDATED STATEMENTS OF INCOME (Unaudited)
|
Three Months Ended
|
Nine Months Ended
|
||||||||||||||
|
September 30,
|
September 30,
|
||||||||||||||
|
|
2013
|
2012
|
2013
|
2012
|
|||||||||||
|
(In millions, except per share amounts)
|
|||||||||||||||
|
Revenues
|
$
|
6,165
|
|
$
|
4,417
|
|
$
|
15,036
|
|
$
|
13,497
|
|
|||
|
Cost of sales:
|
|
|
|||||||||||||
|
Production and delivery
|
3,332
|
|
2,592
|
|
8,904
|
|
7,642
|
|
|||||||
|
Depreciation, depletion and amortization
|
919
|
|
298
|
|
1,778
|
|
856
|
|
|||||||
|
Total cost of sales
|
4,251
|
|
2,890
|
|
10,682
|
|
8,498
|
|
|||||||
|
Selling, general and administrative expenses
|
158
|
|
110
|
|
457
|
|
311
|
|
|||||||
|
Mining exploration and research expenses
|
57
|
|
79
|
|
173
|
|
214
|
|
|||||||
|
Environmental obligations and shutdown costs
|
(8
|
)
|
(73
|
)
|
23
|
|
18
|
|
|||||||
|
Total costs and expenses
|
4,458
|
|
3,006
|
|
11,335
|
|
9,041
|
|
|||||||
|
Operating income
|
1,707
|
|
1,411
|
|
3,701
|
|
4,456
|
|
|||||||
|
Interest expense, net
|
(162
|
)
|
(42
|
)
|
(351
|
)
|
(148
|
)
|
|||||||
|
Losses on early extinguishment of debt
|
—
|
|
—
|
|
(45
|
)
|
(168
|
)
|
|||||||
|
Gain on investment in McMoRan Exploration Co.
|
—
|
|
—
|
|
128
|
|
—
|
|
|||||||
|
Other income (expense), net
|
3
|
|
(15
|
)
|
13
|
|
23
|
|
|||||||
|
Income before income taxes and equity in affiliated companies' net earnings (losses)
|
1,548
|
|
1,354
|
|
3,446
|
|
4,163
|
|
|||||||
|
Provision for income taxes
|
(499
|
)
|
(215
|
)
|
(967
|
)
|
(1,128
|
)
|
|||||||
|
Equity in affiliated companies’ net earnings (losses)
|
(1
|
)
|
1
|
|
3
|
|
—
|
|
|||||||
|
Net income
|
1,048
|
|
1,140
|
|
2,482
|
|
3,035
|
|
|||||||
|
Net income and preferred dividends attributable to noncontrolling interests
|
(227
|
)
|
(316
|
)
|
(531
|
)
|
(737
|
)
|
|||||||
|
Net income attributable to FCX common stockholders
|
$
|
821
|
|
$
|
824
|
|
$
|
1,951
|
|
$
|
2,298
|
|
|||
|
Net income per share attributable to FCX common stockholders:
|
|
||||||||||||||
|
Basic
|
$
|
0.79
|
|
$
|
0.87
|
|
$
|
1.97
|
|
$
|
2.42
|
|
|||
|
Diluted
|
$
|
0.79
|
|
$
|
0.86
|
|
$
|
1.96
|
|
$
|
2.41
|
|
|||
|
Weighted-average common shares outstanding:
|
|
|
|||||||||||||
|
Basic
|
1,038
|
|
949
|
|
989
|
|
949
|
|
|||||||
|
Diluted
|
1,043
|
|
953
|
|
993
|
|
953
|
|
|||||||
|
Dividends declared per share of common stock
|
$
|
0.3125
|
|
$
|
0.3125
|
|
$
|
1.9375
|
|
$
|
0.9375
|
|
|||
The accompanying notes are an integral part of these consolidated financial statements.
4
FREEPORT-McMoRan COPPER & GOLD INC.
CONSOLIDATED STATEMENTS OF COMPREHENSIVE INCOME (Unaudited)
|
Three Months Ended
|
Nine Months Ended
|
||||||||||||||
|
September 30,
|
September 30,
|
||||||||||||||
|
2013
|
2012
|
2013
|
2012
|
||||||||||||
|
(In millions)
|
|||||||||||||||
|
Net income
|
$
|
1,048
|
|
$
|
1,140
|
|
$
|
2,482
|
|
$
|
3,035
|
|
|||
|
Other comprehensive income, net of taxes:
|
|||||||||||||||
|
Defined benefit plans:
|
|||||||||||||||
|
Amortization of unrecognized amounts included in net periodic benefit costs
|
6
|
|
7
|
|
18
|
|
22
|
|
|||||||
|
Adjustment to deferred tax valuation allowance
|
—
|
|
—
|
|
—
|
|
5
|
|
|||||||
|
Unrealized (losses) gains on securities arising during the period
|
(1
|
)
|
1
|
|
(1
|
)
|
—
|
|
|||||||
|
Translation adjustments arising during the period
|
5
|
|
—
|
|
4
|
|
(1
|
)
|
|||||||
|
Other comprehensive income
|
10
|
|
8
|
|
21
|
|
26
|
|
|||||||
|
Total comprehensive income
|
1,058
|
|
1,148
|
|
2,503
|
|
3,061
|
|
|||||||
|
Total comprehensive income and preferred dividends attributable to noncontrolling interests
|
(226
|
)
|
(315
|
)
|
(530
|
)
|
(737
|
)
|
|||||||
|
Total comprehensive income attributable to FCX common stockholders
|
$
|
832
|
|
$
|
833
|
|
$
|
1,973
|
|
$
|
2,324
|
|
|||
The accompanying notes are an integral part of these consolidated financial statements.
5
FREEPORT-McMoRan COPPER & GOLD INC.
CONSOLIDATED STATEMENTS OF CASH FLOWS (Unaudited)
|
Nine Months Ended
|
|||||||
|
September 30,
|
|||||||
|
|
2013
|
2012
|
|||||
|
|
(In millions)
|
||||||
|
Cash flow from operating activities:
|
|
|
|||||
|
Net income
|
$
|
2,482
|
|
$
|
3,035
|
|
|
|
Adjustments to reconcile net income to net cash provided by operating activities:
|
|
|
|||||
|
Depreciation, depletion and amortization
|
1,778
|
|
856
|
|
|||
|
Net losses on oil and gas derivative contracts
|
205
|
|
—
|
|
|||
|
Gain on investment in McMoRan Exploration Co. (MMR)
|
(128
|
)
|
—
|
|
|||
|
Stock-based compensation
|
94
|
|
77
|
|
|||
|
Pension plans contributions
|
(62
|
)
|
(114
|
)
|
|||
|
Net charges for reclamation and environmental obligations, including accretion
|
98
|
|
64
|
|
|||
|
Payments for reclamation and environmental obligations
|
(166
|
)
|
(148
|
)
|
|||
|
Losses on early extinguishment of debt
|
45
|
|
168
|
|
|||
|
Deferred income taxes
|
169
|
|
223
|
|
|||
|
Increase in long-term mill and leach stockpiles
|
(348
|
)
|
(184
|
)
|
|||
|
Other, net
|
65
|
|
71
|
|
|||
|
(Increases) decreases in working capital and other tax payments, excluding amounts from acquisitions:
|
|
||||||
|
Accounts receivable
|
51
|
|
(603
|
)
|
|||
|
Inventories
|
(66
|
)
|
(581
|
)
|
|||
|
Other current assets
|
162
|
|
(33
|
)
|
|||
|
Accounts payable and accrued liabilities
|
(596
|
)
|
78
|
|
|||
|
Accrued income taxes and other tax payments
|
(40
|
)
|
(400
|
)
|
|||
|
Net cash provided by operating activities
|
3,743
|
|
2,509
|
|
|||
|
Cash flow from investing activities:
|
|
|
|||||
|
Capital expenditures:
|
|
|
|||||
|
North America copper mines
|
(795
|
)
|
(568
|
)
|
|||
|
South America
|
(734
|
)
|
(659
|
)
|
|||
|
Indonesia
|
(720
|
)
|
(624
|
)
|
|||
|
Africa
|
(155
|
)
|
(428
|
)
|
|||
|
Molybdenum mines
|
(128
|
)
|
(189
|
)
|
|||
|
Oil and gas operations
|
(928
|
)
|
—
|
|
|||
|
Other
|
(163
|
)
|
(50
|
)
|
|||
|
Acquisition of Plains Exploration & Production Company, net of cash acquired
|
(3,465
|
)
|
—
|
|
|||
|
Acquisition of MMR, net of cash acquired
|
(1,628
|
)
|
—
|
|
|||
|
Acquisition of cobalt chemical business, net of cash acquired
|
(348
|
)
|
—
|
|
|||
|
Restricted cash and other, net
|
(24
|
)
|
(19
|
)
|
|||
|
Net cash used in investing activities
|
(9,088
|
)
|
(2,537
|
)
|
|||
|
Cash flow from financing activities:
|
|
|
|||||
|
Proceeds from debt
|
11,229
|
|
3,023
|
|
|||
|
Repayments of debt
|
(4,816
|
)
|
(3,179
|
)
|
|||
|
Redemption of MMR preferred stock
|
(227
|
)
|
—
|
|
|||
|
Cash dividends and distributions paid:
|
|
||||||
|
Common stock
|
(1,957
|
)
|
(832
|
)
|
|||
|
Noncontrolling interests
|
(157
|
)
|
(76
|
)
|
|||
|
Contributions from noncontrolling interests
|
—
|
|
15
|
|
|||
|
Debt financing costs
|
(113
|
)
|
(22
|
)
|
|||
|
Net payments for stock-based awards
|
(101
|
)
|
(3
|
)
|
|||
|
Excess tax benefit from stock-based awards
|
1
|
|
7
|
|
|||
|
Net cash provided by (used in) financing activities
|
3,859
|
|
(1,067
|
)
|
|||
|
Net decrease in cash and cash equivalents
|
(1,486
|
)
|
(1,095
|
)
|
|||
|
Cash and cash equivalents at beginning of year
|
3,705
|
|
4,822
|
|
|||
|
Cash and cash equivalents at end of period
|
$
|
2,219
|
|
$
|
3,727
|
|
|
The accompanying notes are an integral part of these consolidated financial statements.
6
FREEPORT-McMoRan COPPER & GOLD INC.
CONSOLIDATED STATEMENT OF EQUITY (Unaudited)
|
|
FCX Stockholders’ Equity
|
|
|
||||||||||||||||||||||||||||||||||
|
Common Stock
|
Retained
Earnings |
Accumu-
lated Other Compre- hensive Loss |
Common Stock
Held in Treasury
|
Total FCX
Stock-holders' Equity |
|||||||||||||||||||||||||||||||||
|
Number
of
Shares
|
At Par
Value
|
Capital in
Excess of
Par Value
|
Number
of
Shares
|
At
Cost
|
Non-
controlling
Interests
|
Total
Equity
|
|||||||||||||||||||||||||||||||
|
|
(In millions)
|
||||||||||||||||||||||||||||||||||||
|
Balance at December 31, 2012
|
1,073
|
|
$
|
107
|
|
$
|
19,119
|
|
$
|
2,399
|
|
$
|
(506
|
)
|
124
|
|
$
|
(3,576
|
)
|
$
|
17,543
|
|
$
|
3,768
|
|
$
|
21,311
|
|
|||||||||
|
Common stock issued to acquire Plains Exploration & Production Co.
|
91
|
|
9
|
|
2,822
|
|
—
|
|
—
|
|
—
|
|
—
|
|
2,831
|
|
—
|
|
2,831
|
|
|||||||||||||||||
|
Exchange of employee stock-based awards in connection with acquisitions
|
—
|
|
—
|
|
67
|
|
—
|
|
—
|
|
—
|
|
—
|
|
67
|
|
—
|
|
67
|
|
|||||||||||||||||
|
Exercised and issued stock-based awards
|
1
|
|
1
|
|
4
|
|
—
|
|
—
|
|
—
|
|
—
|
|
5
|
|
—
|
|
5
|
|
|||||||||||||||||
|
Stock-based compensation
|
—
|
|
—
|
|
89
|
|
—
|
|
—
|
|
—
|
|
—
|
|
89
|
|
—
|
|
89
|
|
|||||||||||||||||
|
Reserve on tax benefit for stock-based awards
|
—
|
|
—
|
|
(2
|
)
|
—
|
|
—
|
|
—
|
|
—
|
|
(2
|
)
|
—
|
|
(2
|
)
|
|||||||||||||||||
|
Tender of shares for stock-based awards
|
—
|
|
—
|
|
—
|
|
—
|
|
—
|
|
3
|
|
(105
|
)
|
(105
|
)
|
—
|
|
(105
|
)
|
|||||||||||||||||
|
Dividends on common stock
|
—
|
|
—
|
|
—
|
|
(1,989
|
)
|
—
|
|
—
|
|
—
|
|
(1,989
|
)
|
—
|
|
(1,989
|
)
|
|||||||||||||||||
|
Dividends to noncontrolling interests
|
—
|
|
—
|
|
—
|
|
—
|
|
—
|
|
—
|
|
—
|
|
—
|
|
(144
|
)
|
(144
|
)
|
|||||||||||||||||
|
Noncontrolling interests' share of contributed capital in subsidiary
|
—
|
|
—
|
|
(7
|
)
|
—
|
|
—
|
|
—
|
|
—
|
|
(7
|
)
|
7
|
|
—
|
|
|||||||||||||||||
|
Redeemable noncontrolling interest
|
—
|
|
—
|
|
—
|
|
—
|
|
—
|
|
—
|
|
—
|
|
—
|
|
(12
|
)
|
(12
|
)
|
|||||||||||||||||
|
Total comprehensive income
|
—
|
|
—
|
|
—
|
|
1,951
|
|
22
|
|
—
|
|
—
|
|
1,973
|
|
530
|
|
2,503
|
|
|||||||||||||||||
|
Balance at September 30, 2013
|
1,165
|
|
$
|
117
|
|
$
|
22,092
|
|
$
|
2,361
|
|
$
|
(484
|
)
|
127
|
|
$
|
(3,681
|
)
|
$
|
20,405
|
|
$
|
4,149
|
|
$
|
24,554
|
|
|||||||||
The accompanying notes are an integral part of these consolidated financial statements.
7
FREEPORT-McMoRan COPPER & GOLD INC.
NOTES TO CONSOLIDATED FINANCIAL STATEMENTS (Unaudited)
1. GENERAL INFORMATION
The accompanying unaudited consolidated financial statements have been prepared in accordance with the instructions to Form 10-Q and do not include all information and disclosures required by generally accepted accounting principles (GAAP) in the United States (U.S.). Therefore, this information should be read in conjunction with Freeport-McMoRan Copper & Gold Inc.’s (FCX) consolidated financial statements and notes contained in its annual report on Form 10-K for the year ended December 31, 2012. The information furnished herein reflects all adjustments that are, in the opinion of management, necessary for a fair statement of the results for the interim periods reported. With the exception of certain adjustments associated with the acquisition of Plains Exploration & Production Company (PXP) and McMoRan Exploration Co. (MMR), collectively known as Freeport-McMoRan Oil & Gas (FM O&G), all such adjustments are, in the opinion of management, of a normal recurring nature. Operating results for the
three
-month and
nine
-month periods ended
September 30, 2013
, are not necessarily indicative of the results that may be expected for the year ending
December 31, 2013
.
As further discussed in Note 2, FCX completed its acquisitions of PXP on
May 31, 2013
, and MMR on
June 3, 2013
. The financial results for the
nine months ended
September 30, 2013
, include PXP
'
s results beginning
June 1, 2013
, and MMR
'
s results beginning
June 4, 2013
.
2. ACQUISITIONS
Oil and Gas.
PXP and MMR are both wholly owned consolidated subsidiaries of FCX. These acquisitions added a portfolio of oil and gas assets to FCX
'
s global mining business, creating a U.S.-based natural resource company. The portfolio of oil and gas assets includes oil production facilities and growth potential in the Deepwater Gulf of Mexico (GOM), oil production from the onshore Eagle Ford shale play in Texas, oil production facilities onshore and offshore California, onshore natural gas resources in the Haynesville shale play in Louisiana, and a position in the emerging shallow water, ultra-deep gas trend on the Shelf of the GOM and onshore in South Louisiana. The acquisitions have been accounted for under the acquisition method as required by Accounting Standards Codification (ASC) Topic 805,
“
Business Combinations
,”
with FCX as the acquirer. As further discussed in Note
7
, FCX issued
$6.5 billion
of unsecured senior notes in March 2013 for net proceeds of
$6.4 billion
, which was used, together with borrowings under a
$4.0 billion
unsecured
five
-year bank term loan, to fund the cash portion of the merger consideration for both transactions, to repay certain indebtedness of PXP and for general corporate purposes.
In the PXP acquisition, FCX acquired PXP for per-share consideration equivalent to
0.6531
shares of FCX common stock and
$25.00
in cash. PXP stockholders had the right to elect to receive merger consideration in the form of cash or shares of FCX common stock, subject to the proration provisions in the merger agreement. Based on the final results of the merger consideration elections and as set forth in the merger agreement, FCX issued
91 million
shares of its common stock and paid
$3.8 billion
in cash (which includes
$411 million
for the value of the
$3
per share special dividend paid to PXP stockholders on
May 31, 2013
).
Following is a summary of the
$6.6 billion
purchase price for PXP (in millions, except the exchange ratio and closing share price):
|
Number of shares of PXP common stock acquired
|
132.280
|
|
a
|
|
|
Exchange ratio of FCX common stock for each PXP share
|
0.6531
|
|
||
|
86.392
|
|
|||
|
Shares of FCX common stock issued for certain PXP equity awards
|
4.769
|
|
||
|
Total shares of FCX common stock issued
|
91.161
|
|
||
|
Closing share price of FCX common stock at May 31, 2013
|
$
|
31.05
|
|
|
|
FCX stock consideration
|
$
|
2,831
|
|
|
|
Cash consideration
|
3,725
|
|
b
|
|
|
Employee stock-based awards, primarily cash-settled stock-based awards
|
78
|
|
||
|
Total purchase price
|
$
|
6,634
|
|
|
|
a.
|
Adjusted for cash paid in lieu of fractional shares.
|
|
b.
|
Cash consideration includes the payment of
$25.00
in cash for each PXP share (
$3.3 billion
), cash paid in lieu of any fractional shares of FCX common stock, cash paid for certain equity awards (
$7 million
), and the value of the
$3
per share PXP special cash dividend (
$411 million
) paid on
May 31, 2013
.
|
8
In the MMR acquisition, for each MMR share owned, MMR shareholders received
$14.75
in cash and
1.15
units of a royalty trust, which holds a
five percent
overriding royalty interest in future production from MMR's ultra-deep exploration prospects that existed as of
December 5, 2012
, the date of the merger agreement. MMR conveyed the royalty interests to the royalty trust immediately prior to the effective time of the merger, and they were "carved out" of the mineral interests that were acquired by FCX and not considered part of purchase consideration.
Prior to
June 3, 2013
, FCX owned
500,000
shares of MMR
'
s
5.75%
Convertible Perpetual Preferred Stock, Series 2, which was accounted for under the cost method and recorded on FCX's balance sheet at
$432 million
on
May 31, 2013
. Through its acquisition of PXP on
May 31, 2013
, FCX acquired
51 million
shares of MMR
'
s common stock, which had a fair value of
$848 million
on that date based upon the closing market price of MMR's common stock (
$16.63
per share,
i.e.
,
Level 1 measurement). As a result of FCX obtaining control of MMR on
June 3, 2013
, FCX remeasured its ownership interests in MMR to a fair value of
$1.4 billion
in accordance with ASC Topic 805, resulting in a gain of
$128 million
that was recorded in second-quarter 2013. Fair value was calculated using the closing quoted market price of MMR
'
s common stock on
June 3, 2013
, of
$16.75
per share (
i.e.
,
Level 1 measurement for the common stock and Level 2 measurement for the preferred stock).
Following is a summary of the
$3.1 billion
purchase price for MMR (in millions, except the closing share price):
|
Number of shares of MMR common stock acquired
|
112.362
|
|
a
|
|
|
Cash consideration of $14.75 per share
|
$
|
14.75
|
|
|
|
Cash consideration paid by FCX
|
$
|
1,657
|
|
|
|
Employee stock-based awards
|
63
|
|
||
|
Total
|
1,720
|
|
||
|
Fair value of FCX's investment in 51 million shares of MMR common stock acquired on
|
||||
|
May 31, 2013, through the acquisition of PXP
|
854
|
|
||
|
Fair value of FCX's investment in MMR's 5.75% Convertible Perpetual Preferred Stock, Series 2
|
554
|
|
||
|
Total purchase price
|
$
|
3,128
|
|
|
a. Excluded
51 million
shares of MMR common stock owned by FCX through its acquisition of PXP on
May 31, 2013
.
The final valuation of assets acquired, liabilities assumed and redeemable noncontrolling interest is not complete and the net adjustments to those values may result in changes to goodwill and other carrying amounts initially assigned to the assets, liabilities and redeemable noncontrolling interest based on the preliminary fair value analysis. The following table summarizes the preliminary purchase price allocations for PXP and MMR (in millions):
|
PXP
|
MMR
|
Eliminations
|
Total
|
||||||||||||
|
Current assets
|
$
|
1,192
|
|
$
|
98
|
|
$
|
—
|
|
$
|
1,290
|
|
|||
|
Oil and gas properties - full cost method:
|
|||||||||||||||
|
Subject to depletion
|
11,447
|
|
756
|
|
—
|
|
12,203
|
|
|||||||
|
Not subject to depletion
|
9,431
|
|
1,686
|
|
—
|
|
11,117
|
|
|||||||
|
Property, plant and equipment
|
261
|
|
1
|
|
—
|
|
262
|
|
|||||||
|
Investment in MMR
a
|
848
|
|
—
|
|
(848
|
)
|
—
|
|
|||||||
|
Other assets
|
12
|
|
421
|
|
—
|
|
433
|
|
|||||||
|
Current liabilities
|
(907
|
)
|
(174
|
)
|
—
|
|
(1,081
|
)
|
|||||||
|
Debt (current and long-term)
|
(10,631
|
)
|
(620
|
)
|
—
|
|
(11,251
|
)
|
|||||||
|
Deferred income taxes
b
|
(3,956
|
)
|
—
|
|
—
|
|
(3,956
|
)
|
|||||||
|
Other long-term liabilities
|
(805
|
)
|
(258
|
)
|
—
|
|
(1,063
|
)
|
|||||||
|
Redeemable noncontrolling interest
|
(713
|
)
|
(259
|
)
|
—
|
|
(972
|
)
|
|||||||
|
Total fair value, excluding goodwill
|
6,179
|
|
1,651
|
|
(848
|
)
|
6,982
|
|
|||||||
|
Goodwill
|
455
|
|
1,477
|
|
—
|
|
1,932
|
|
|||||||
|
Total purchase price
|
$
|
6,634
|
|
$
|
3,128
|
|
$
|
(848
|
)
|
$
|
8,914
|
|
|||
|
a.
|
PXP owned
51 million
shares of MMR common stock, which was eliminated in FCX's condensed consolidated balance sheet at the acquisition date of MMR.
|
|
b.
|
Deferred income taxes have been recognized based on the estimated fair value adjustments to net assets using a
38 percent
tax rate, which reflected the
35 percent
federal statutory rate and a
3 percent
weighted-average of the applicable statutory state tax rates (net of federal benefit).
|
9
In accordance with the acquisition method of accounting, the purchase price from FCX's acquisitions of both PXP and MMR has been allocated on a preliminary basis to the assets acquired, liabilities assumed and redeemable noncontrolling interest based on their estimated fair values on the respective acquisition dates. The estimated fair values were based on preliminary estimates and are subject to change as FCX completes its analysis. The fair value estimates were based on, but not limited to quoted market prices, where available; expected future cash flows based on estimated reserve quantities; costs to produce and develop reserves; current replacement cost for similar capacity for certain fixed assets; market rate assumptions for contractual obligations; appropriate discount rates and growth rates, and oil and gas forward prices. The excess of the total consideration over the estimated fair value of the amounts initially assigned to the identifiable assets acquired, liabilities assumed and redeemable noncontrolling interest has been recorded as goodwill. Goodwill recorded in connection with the acquisitions will not be deductible for income tax purposes.
The fair value measurement of the oil and gas properties, asset retirement obligations included in other liabilities (refer to Note
8
for further discussion) and redeemable noncontrolling interest were based, in part, on significant inputs not observable in the market (as discussed above) and thus represents a Level 3 measurement. The fair value measurement of long-term debt, including the current portion, was based on prices obtained from a readily available pricing source and thus represents a Level 2 measurement.
As of
September 30, 2013
, FCX had not identified any material pre-acquisition contingencies where the related asset, liability or impairment is probable and the amount of the asset, liability or impairment can be reasonably estimated. Prior to the end of the purchase price allocation period, if information becomes available that an asset existed, a liability had been incurred or an asset had been impaired as of the applicable acquisition date, and the amounts can be reasonably estimated, such items will be included in the applicable purchase price allocations.
Goodwill arose on these acquisitions principally because of limited drilling activities to date and the absence of production history and material reserve data associated with the very large geologic potential of an emerging trend targeting deep-seated structures in the shallow waters of the GOM and onshore analogous to large discoveries in the deepwater GOM and other proven basins' prospects. In addition, goodwill also resulted from the requirement to recognize deferred taxes on the difference between the fair value and the tax basis of the acquired assets.
A summary of third-quarter 2013 adjustments to the preliminary fair values assigned to assets acquired, liabilities assumed and redeemable noncontrolling interest from the acquisitions follows (in millions):
|
PXP
|
MMR
|
Total
|
||||||||||
|
Increase in current assets (primarily current deferred income tax asset)
|
$
|
182
|
|
$
|
2
|
|
$
|
184
|
|
|||
|
(Decrease) in oil and gas properties - full cost method:
|
||||||||||||
|
Subject to depletion
|
—
|
|
(45
|
)
|
(45
|
)
|
||||||
|
Not subject to depletion
|
(204
|
)
|
(6
|
)
|
(210
|
)
|
||||||
|
Increase in other assets (deferred income tax asset)
|
—
|
|
22
|
|
22
|
|
||||||
|
Net (increase) in deferred income tax liability
|
(85
|
)
|
—
|
|
(85
|
)
|
||||||
|
Net decrease in other liabilities (primarily warrants)
|
70
|
|
—
|
|
70
|
|
||||||
|
Decrease in redeemable noncontrolling interest
|
36
|
|
—
|
|
36
|
|
||||||
|
Increase in goodwill
|
1
|
|
27
|
|
28
|
|
||||||
The third-quarter 2013 adjustments to the preliminary purchase price allocations were primarily associated with revised estimated fair values of oil and gas properties, which also resulted in adjustments to the fair value of warrants, redeemable noncontrolling interest and deferred income taxes. In addition, an adjustment was recorded to reclassify
$162 million
of deferred income taxes to current assets.
In
third-quarter
2013
, FM O&G contributed revenue of
$1.2 billion
and operating income of
$274 million
to FCX's consolidated results; for the four-month period from June 1, 2013, to
September 30, 2013
, FM O&G contributed revenue of
$1.5 billion
and operating income of
$338 million
.
FCX's acquisition-related costs of
$76 million
for the first
nine
months of
2013
were included in selling, general and administrative expense in the consolidated statements of income
.
In addition, FCX deferred debt issuance costs of
$96 million
in connection with the debt financings of the acquisitions (refer to Note 7 for further discussion of the debt financings), which are included in other assets in the condensed consolidated balance sheet as of
September 30, 2013
.
10
Redeemable Noncontrolling Interest - PXP.
In 2011, PXP issued (i)
450,000
shares of Plains Offshore Operations Inc. (Plains Offshore)
8%
Convertible Preferred Stock (Preferred Stock) for gross proceeds of
$450 million
and (ii) non-detachable warrants with an exercise price of
$20
per share to purchase in aggregate
9.1 million
shares of Plains Offshore's common stock. In addition, Plains Offshore issued
87 million
shares of Plains Offshore Class A common stock, which will be held in escrow until the conversion and cancellation of the Preferred Stock or the exercise of the warrants. Plains Offshore holds certain of FM O&G's oil and gas properties and assets located in the GOM in water depths of
500
feet or more, including the Lucius oil field and the Phobos prospect, but excluding the properties acquired by PXP in 2012 from BP Exploration & Production Inc., BP America Production Company and Shell Offshore Inc. The Preferred Stock represents a
20 percent
equity interest in Plains Offshore and is entitled to a dividend of
8 percent
per annum, payable quarterly, of which
2 percent
may be deferred (
$20 million
of accumulated deferred dividends as of
September 30, 2013
). The shares of Preferred Stock also fully participate, on an as-converted basis at
four
times, in cash dividends distributed to any class of common stockholders of Plains Offshore. Plains Offshore has not distributed any dividends to its common stockholders.
The holders of the Preferred Stock (preferred holders) have the right, at any time at their option, to convert any or all of such holder's shares of Preferred Stock and exercise any of the associated non-detachable warrants into shares of Class A common stock of Plains Offshore, at an initial conversion/exercise price of
$20
per share; the conversion price is subject to adjustment as a result of certain events. Furthermore, Plains Offshore has the right to convert all or a portion of the outstanding shares of Preferred Stock if certain events occur more than 180 days after an initial public offering or a qualified public offering of Plains Offshore. FM O&G also has a right to purchase shares of Plains Offshore preferred stock, common stock and warrants under certain circumstances in order to permit the consolidation of Plains Offshore for federal income tax purposes. Additionally, at any time on or after November 17, 2016, the fifth anniversary of the closing date, FM O&G may exercise a call right to purchase all, but not less than all, of the outstanding shares of Preferred Stock and associated non-detachable warrants for cash, at a price equal to the liquidation preference described below.
At any time after November 17, 2015, the fourth anniversary of the closing date, a majority of the preferred holders may cause Plains Offshore to use its commercially reasonable efforts to consummate an exit event. An exit event, as defined in the stockholders agreement, means, at the sole option of Plains Offshore (i) the purchase by FM O&G or the redemption by Plains Offshore of all the preferred stock, warrants and common stock held by the preferred holders for the aggregate fair value thereof; (ii) a sale of Plains Offshore or a sale of all or substantially all of its assets, in each case in an arms' length transaction with a third party, at the highest price available after reasonable marketing efforts by Plains Offshore; or (iii) a qualified initial public offering. In the event that Plains Offshore fails to consummate an exit event prior to the applicable exit event deadline, the conversion price of the Preferred Stock and the exercise price of the warrants will immediately and automatically be adjusted such that all issued and outstanding shares of Preferred Stock on an as-converted basis taken together with shares of Plains Offshore common stock issuable upon exercise of the warrants, in the aggregate, will constitute
49 percent
of the common equity securities of Plains Offshore on a fully diluted basis. In addition, FM O&G would be required to purchase
$300 million
of junior preferred stock in Plains Offshore.
The preferred holders are entitled to vote on all matters on which Plains Offshore common stockholders are entitled to vote.
In the event of liquidation of Plains Offshore, each preferred holder is entitled to receive the liquidation preference before any payment or distribution is made on any Plains Offshore junior preferred stock or common stock. A liquidation event includes any of the following events: (i) the liquidation, dissolution or winding up of Plains Offshore, whether voluntary or involuntary, (ii) a sale, consolidation or merger of Plains Offshore in which the stockholders immediately prior to such event do not own at least a majority of the outstanding shares of the surviving entity, or (iii) a sale or other disposition of all or substantially all of Plains Offshore's assets to a person other than FM O&G or its affiliates. The liquidation preference, as defined in the stockholders agreement, is equal to (i) the greater of (a)
1.25
times the initial offering price and (b) the sum of (1) the fair market value of the shares of common stock issuable upon conversion of the Preferred Stock and (2) the applicable tax adjustment amount, plus (ii) any accrued dividends and accumulated dividends.
The non-detachable warrants may be exercised at any time on the earlier of (i) November 17, 2019, the eighth anniversary of the original issue date or (ii) a termination event. A termination event is defined as the occurrence of any of (a) the conversion of the Preferred Stock, (b) the redemption of the Preferred Stock, (c) the repurchase by FM O&G or any of its affiliates of the Preferred Stock or (d) a liquidation event of Plains Offshore, described above. The non-detachable warrants are considered to be embedded derivative instruments for accounting purposes and
11
have been assessed as not being clearly and closely related to the related Preferred Stock. Therefore, the warrants are classified as a long-term liability in the accompanying condensed consolidated balance sheet and will be adjusted to fair value each reporting period with adjustments recorded in other income (expense). The fair value measurement of the warrants was based on significant inputs not observable in the market (refer to Note 10 for discussion of valuation technique) and thus represents a Level 3 measurement.
The Preferred Stock of Plains Offshore is classified as temporary equity because of its redemption features and is therefore reported outside of permanent equity in FCX's condensed consolidated balance sheet. The redeemable noncontrolling interest totaled
$719 million
as of September 30, 2013. Remeasurement of the redeemable noncontrolling interest represents its initial carrying amount adjusted for any noncontrolling interest's share of net income (loss) or changes to the redemption value. Additionally, the carrying amount will be further increased by amounts representing dividends not currently declared or paid, but which are payable under the redemption features described above. Future mark-to-market adjustments to the redemption value, subject to a minimum balance of the original recorded value (
$713 million
) on May 31, 2013, shall be reflected in retained earnings and earnings per share. FM O&G will accrete changes in the redemption value over the period from the date FCX acquired PXP to the earliest redemption date.
Redeemable Noncontrolling Interest - MMR.
The enhanced "make-whole" conversion rates triggered by FCX's acquisition of MMR expired on
July 9, 2013
, for MMR's
8%
Convertible Perpetual Preferred Stock (
8%
Preferred Stock) and
5.75%
Convertible Perpetual Preferred Stock, Series 1 (
5.75%
Preferred Stock). A summary of the conversion activity follows (in millions):
|
8%
|
5.75%
|
|||||||
|
Preferred
|
Preferred
|
|||||||
|
Stock
|
Stock
|
|||||||
|
Acquisition-date (June 3, 2013) fair value
|
$
|
30
|
|
$
|
229
|
|
||
|
Less June 2013 conversions
|
29
|
|
200
|
|
||||
|
Less July 2013 conversions
|
—
|
|
29
|
|
||||
|
Remaining balance at make-whole expiration dates
|
$
|
1
|
|
$
|
—
|
|
||
|
Royalty trust units released upon conversions:
|
||||||||
|
June 2013 conversions
|
2.0
|
|
13.7
|
|
||||
|
July 2013 conversions
|
—
|
|
2.0
|
|
||||
|
Total
|
2.0
|
|
15.7
|
|
||||
The conversions of the
8%
Preferred Stock and
5.75%
Preferred Stock required cash payments of
$227 million
and the release of royalty trust units with a fair value of
$31 million
at the acquisition date.
Unaudited Pro Forma Consolidated Financial Information
.
The following unaudited pro forma financial information has been prepared to reflect the acquisitions of PXP and MMR. The unaudited pro forma financial information combines the historical statements of income of FCX, PXP and MMR (including the pro forma effects of PXP's GOM acquisition that was completed on November 30, 2012) for the three-month period ended September 30, 2012, and the nine-month periods ended
September 30, 2013
and
2012
, giving effect to the mergers as if they had occurred on January 1, 2012. The historical consolidated financial information has been adjusted to reflect factually supportable items that are directly attributable to the acquisitions.
|
Three Months Ended
|
Nine Months Ended
|
|||||||||||||||
|
September 30,
|
September 30,
|
|||||||||||||||
|
2013
|
2012
|
2013
|
2012
|
|||||||||||||
|
(in millions, except per share amounts)
|
||||||||||||||||
|
Revenues
|
$
|
6,165
|
|
$
|
5,406
|
|
$
|
17,190
|
|
$
|
16,955
|
|
||||
|
Operating income
|
1,707
|
|
1,575
|
|
4,617
|
|
5,081
|
|
||||||||
|
Income from continuing operations
|
1,048
|
|
898
|
|
2,762
|
|
3,161
|
|
||||||||
|
Net income attributable to FCX common stockholders
|
821
|
|
573
|
|
2,213
|
|
2,397
|
|
||||||||
|
Net income per share attributable to FCX common stockholders:
|
||||||||||||||||
|
Basic
|
$
|
0.79
|
|
$
|
0.55
|
|
$
|
2.13
|
|
$
|
2.30
|
|
||||
|
Diluted
|
0.79
|
|
0.55
|
|
2.12
|
|
2.29
|
|
||||||||
12
The above unaudited pro forma consolidated information has been prepared for illustrative purposes only and is not intended to be indicative of the results of operations that actually would have occurred, or the results of operations expected in future periods, had the events reflected herein occurred on the dates indicated. The most significant pro forma adjustments to income from continuing operations for the nine-month period ended September 30, 2013, were to exclude
$519 million
of acquisition-related costs, the net tax benefit of
$183 million
of acquisition-related adjustments and the
$128 million
gain on the investment in MMR and to include them in the nine-month period ended September 30, 2012. Additionally, for the nine-month period ended
September 30, 2013
, the pro forma consolidated information excluded a
$77 million
gain on the sale of MMR oil and gas properties because of the full cost method of accounting.
Cobalt Chemical Refinery Business.
On
March 29, 2013
, FCX, through a newly formed consolidated joint venture, completed the acquisition of a cobalt chemical refinery in Kokkola, Finland, and the related sales and marketing business. The acquisition provides direct end-market access for the cobalt hydroxide production at Tenke Fungurume Mining S.A.R.L. (TFM or Tenke). The joint venture operates under the name Freeport Cobalt, and FCX is the operator with an effective
56 percent
ownership interest. The remaining effective ownership interest is held by FCX's partners in TFM, including
24 percent
by Lundin Mining Corporation (Lundin) and
20 percent
by La Générale des Carrières et des Mines (Gécamines). Consideration paid was
$382 million
, which included
$34 million
for cash acquired, and was funded
70 percent
by FCX and
30 percent
by Lundin. Under the terms of the acquisition agreement, there is also the potential for additional consideration of up to
$110 million
over a period of
three
years, contingent upon the achievement of revenue-based performance targets. The initial estimates of the fair value of assets acquired and liabilities assumed included in FCX's consolidated financial statements as of
September 30, 2013
, are not final.
3. SIGNIFICANT ACCOUNTING POLICIES
As a result of the acquisitions of PXP and MMR, the following supplements the significant accounting policies contained in FCX's annual report on Form 10-K for the year ended
December 31, 2012
.
Basis of Presentation.
FCX began consolidating its wholly owned subsidiaries, PXP and MMR, effective
June 1, 2013
, and
June 4, 2013
, respectively. PXP's and MMR's financial information consolidates the results of operations and the assets and liabilities for their majority-owned subsidiaries. Investments in unincorporated joint ventures, as well as individual interests in oil and gas exploration, development and production activities, are reflected using the proportionate consolidation method. All significant intercompany transactions have been eliminated.
Use of Estimates.
As a result of the acquisitions of PXP and MMR, other significant areas requiring the use of management estimates include oil and gas reserve estimation; timing of transfers of oil and gas properties not subject to amortization into the full cost pool; determination of fair value of assets acquired, liabilities assumed and redeemable noncontrolling interest, and recognition of goodwill and deferred taxes in connection with business combinations; and valuation of derivative instruments. Actual results could differ from those estimates. In particular, initial estimates of acquisition fair values are preliminary and subject to change as the related valuations are finalized.
Goodwill.
Goodwill has an indefinite useful life and is not amortized, but rather is tested for impairment at least annually, unless events occur or circumstances change between annual tests that would more likely than not reduce the fair value of a related reporting unit below its carrying value. Impairment occurs when the carrying amount of goodwill exceeds its implied fair value. FCX uses a discounted cash flow model to determine if the carrying value of the reporting unit, including goodwill, is less than the fair value of the reporting unit. FCX's approach to allocating goodwill includes the identification of the reporting unit it believes has contributed to the excess purchase price and includes consideration of the reporting unit's potential for future growth. Goodwill arose with FCX's acquisitions of PXP and MMR, which has been allocated to the oil and gas reporting unit. Events affecting oil and gas prices may cause a decrease in the fair value of the reporting unit, and FCX could have an impairment of its goodwill in future periods. When a sale of oil and gas properties occurs, goodwill is allocated to that property based on the relationship of the fair value of the property sold to the total reporting unit's fair value. A significant sale of oil and gas properties may represent a triggering event that requires goodwill to be evaluated for impairment.
13
Oil and Gas Properties.
FCX follows the full cost method of accounting whereby all costs associated with oil and gas property acquisitions, exploration and development activities are capitalized. Such costs include internal general and administrative costs, such as payroll and related benefits and costs directly attributable to employees engaged in acquisition, exploration and development activities. General and administrative costs associated with production, operations, marketing and general corporate activities are charged to expense as incurred. Capitalized costs, along with estimated future costs to develop proved reserves and asset retirement costs that are not already included in oil and gas properties, net of related salvage value, are amortized to expense under the unit-of-production method using engineers' estimates of proved oil and gas reserves. The costs of unproved oil and gas properties are excluded from amortization until the properties are evaluated. Interest is capitalized on oil and gas properties not subject to amortization and in the process of development. Proceeds from the sale of oil and gas properties are accounted for as reductions to capitalized costs unless such sale causes a
25 percent
or greater change in the total proved reserves of oil and gas attributable to a cost center, in which case a gain or loss is recognized.
As of September 30, 2013, property, plant, equipment and development costs, net on the condensed consolidated balance sheet included
$12.2 billion
for oil and gas properties subject to depletion and
$11.1 billion
for oil and gas properties not subject to depletion.
Under the U.S. Securities and Exchange Commission's (SEC) full cost accounting rules, FCX reviews the carrying value of its oil and gas properties each quarter on a country-by-country basis, with each country representing a cost center. FCX's oil and gas operations currently have one cost center, the U.S. Under these rules, capitalized costs of oil and gas properties (net of accumulated depreciation, depletion and amortization, and related deferred income taxes) for each cost center may not exceed a “ceiling” equal to:
|
•
|
the present value, discounted at
10 percent
, of estimated future net cash flows from proved oil and gas reserves, net of estimated future income taxes; plus
|
|
•
|
the cost of unproved properties not being amortized; plus
|
|
•
|
the lower of cost or estimated fair value of unproved properties included in the costs being amortized (net of related tax effects).
|
These rules generally require that FCX price its future oil and gas production at the trailing twelve-month average of the first-day-of-the-month reference prices as adjusted for location and quality differentials. FCX reference prices are West Texas Intermediate (WTI) for oil and the Henry Hub spot price for gas. Such prices are utilized except where different prices are fixed and determinable from applicable contracts for the remaining term of those contracts. The reserve estimates exclude the effect of any oil and gas derivatives FCX has in place. The estimated future net cash flows exclude future cash outflows associated with settling asset retirement obligations included in the net book value of the oil and gas properties. The rules require an impairment if the capitalized costs exceed this “ceiling.” At September 30, 2013, the ceiling with respect to FCX's oil and gas properties exceeded the net capitalized costs, and therefore, no impairment was recorded.
14
4. EARNINGS PER SHARE
FCX’s basic net income per share of common stock was calculated by dividing net income attributable to FCX common stockholders by the weighted-average shares of common stock outstanding during the period. Following is a reconciliation of net income and weighted-average shares of common stock outstanding for purposes of calculating diluted net income per share (in millions, except per share amounts):
|
Three Months Ended
|
Nine Months Ended
|
|||||||||||||||
|
September 30,
|
September 30,
|
|||||||||||||||
|
|
2013
|
2012
|
2013
|
2012
|
||||||||||||
|
Net income
|
$
|
1,048
|
|
$
|
1,140
|
|
$
|
2,482
|
|
$
|
3,035
|
|
||||
|
Net income attributable to noncontrolling interests
|
(218
|
)
|
(316
|
)
|
(519
|
)
|
(737
|
)
|
||||||||
|
Preferred dividends on redeemable noncontrolling interest
|
(9
|
)
|
—
|
|
(12
|
)
|
—
|
|
||||||||
|
Net income attributable to FCX common stockholders
|
$
|
821
|
|
$
|
824
|
|
$
|
1,951
|
|
$
|
2,298
|
|
||||
|
Weighted-average shares of common stock outstanding
|
1,038
|
|
949
|
|
989
|
|
949
|
|
||||||||
|
Add shares issuable upon exercise or vesting of
|
|
|
||||||||||||||
|
dilutive stock options and restricted stock units
|
5
|
|
4
|
|
4
|
|
4
|
|
a
|
|||||||
|
Weighted-average shares of common stock outstanding
|
||||||||||||||||
|
for purposes of calculating diluted net income per share
|
1,043
|
|
953
|
|
993
|
|
953
|
|
||||||||
|
Diluted net income per share attributable to FCX common stockholders
|
$
|
0.79
|
|
$
|
0.86
|
|
$
|
1.96
|
|
$
|
2.41
|
|
||||
|
a.
|
Excluded shares of common stock associated with outstanding stock options with exercise prices less than the average market price of FCX's common stock that were anti-dilutive based on the treasury stock method totaled approximately
one million
for the
nine
months ended
September 30, 2012
.
|
Outstanding stock options with exercise prices greater than the average market price of FCX’s common stock during the period are excluded from the computation of diluted net income per share of common stock. Excluded amounts were
34 million
stock options with a weighted-average exercise price of
$40.11
per option for
third-quarter
2013
, and approximately
32 million
stock options with a weighted average exercise price of
$40.63
for the
nine
months ended
September 30, 2013
. Stock options for approximately
24 million
shares with a weighted-average exercise price of
$42.52
per option were excluded for
third-quarter
2012
, and stock options for approximately
19 million
shares with a weighted-average exercise price of
$43.80
were excluded for the
nine
months ended
September 30, 2012
.
5. INVENTORIES, INCLUDING LONG-TERM MILL AND LEACH STOCKPILES
The components of inventories, excluding mill and leach stockpiles, follow (in millions):
|
September 30,
2013 |
December 31, 2012
|
||||||
|
Raw materials (primarily concentrates)
|
$
|
154
|
|
$
|
237
|
|
|
|
Work-in-process
a
|
80
|
|
252
|
|
|||
|
Finished goods
b
|
1,113
|
|
911
|
|
|||
|
Total product inventories
|
$
|
1,347
|
|
$
|
1,400
|
|
|
|
Total materials and supplies, net
c
|
$
|
1,762
|
|
$
|
1,504
|
|
|
|
a.
|
FCX's mining operations also have work-in-process inventories that are included in mill and leach stockpiles.
|
|
b.
|
Primarily included molybdenum concentrates and copper concentrates, anodes, cathodes and rod.
|
|
c.
|
Materials and supplies inventory was net of obsolescence reserves totaling
$30 million
at
September 30, 2013
, and
$27 million
at
December 31, 2012
.
|
15
A summary of mill and leach stockpiles follows (in millions):
|
September 30,
2013 |
December 31, 2012
|
||||||
|
Current:
|
|
|
|||||
|
Mill stockpiles
|
$
|
85
|
|
$
|
104
|
|
|
|
Leach stockpiles
|
1,659
|
|
1,568
|
|
|||
|
Total current mill and leach stockpiles
|
$
|
1,744
|
|
$
|
1,672
|
|
|
|
Long-term:
a
|
|
|
|||||
|
Mill stockpiles
|
$
|
672
|
|
$
|
615
|
|
|
|
Leach stockpiles
|
1,632
|
|
1,340
|
|
|||
|
Total long-term mill and leach stockpiles
|
$
|
2,304
|
|
$
|
1,955
|
|
|
|
a.
|
Metals in stockpiles not expected to be recovered within the next 12 months.
|
6. INCOME TAXES
Geographic sources of FCX's provision for income taxes follow (in millions):
|
Three Months Ended
|
Nine Months Ended
|
|||||||||||||||
|
September 30,
|
September 30,
|
|||||||||||||||
|
|
2013
|
2012
|
2013
|
2012
|
||||||||||||
|
United States operations
|
$
|
99
|
|
$
|
98
|
|
$
|
76
|
|
a
|
$
|
291
|
|
|||
|
International operations
|
400
|
|
117
|
|
b
|
891
|
|
837
|
|
b
|
||||||
|
Total
|
$
|
499
|
|
$
|
215
|
|
$
|
967
|
|
$
|
1,128
|
|
||||
|
a.
|
As a result of second-quarter 2013 oil and gas acquisitions, FCX recognized a net tax benefit of
$183 million
consisting of income tax benefits of
$190 million
associated with net reductions in FCX's valuation allowances and
$69 million
related to the release of the deferred tax liability on PXP's investment in MMR common stock, partially offset by income tax expense of
$76 million
associated with the write off of deferred tax assets related to environmental liabilities.
|
|
b.
|
Included a net tax benefit of
$234 million
associated with an adjustment to Cerro Verde's deferred income tax liability.
|
Excluding the net tax benefit of
$183 million
for acquisition-related adjustments in 2013 and Cerro Verde's net deferred tax liability adjustment of
$234 million
in 2012, FCX’s consolidated effective income tax rate was
33 percent
for the
first nine months of
2013
and
2012
. Variations in the relative proportions of jurisdictional income can result in fluctuations to FCX’s consolidated effective income tax rate.
16
At
September 30, 2013
, FCX had
$21.1 billion
in debt, which included
$10.5 billion
of acquisition-related debt and
$7.1 billion
of debt assumed in the acquisitions of PXP and MMR. As of September 30, 2013, debt included
$683 million
of fair value adjustments related to the debt assumed in the acquisitions of PXP and MMR. All of FCX's debt is unsecured.
A summary of the changes in debt for the
nine
months ended
September 30, 2013
, follows (in millions):
|
Balance at December 31, 2012
|
$
|
3,527
|
|
|
|
Additions:
|
||||
|
Acquisition-related debt:
|
||||
|
Bank term loan
|
4,000
|
|
||
|
2.375% Senior Notes due 2018
|
1,500
|
|
||
|
3.100% Senior Notes due 2020
|
1,000
|
|
||
|
3.875% Senior Notes due 2023
|
1,999
|
|
||
|
5.450% Senior Notes due 2043
|
1,991
|
|
||
|
PXP debt assumed at the acquisition date (initially recorded at fair value):
|
||||
|
Amended credit facility:
|
||||
|
Revolving line of credit
|
1,469
|
|
||
|
Five-year term loan due 2017
|
750
|
|
||
|
Seven-year term loan due 2019
|
1,250
|
|
||
|
7⅝% Senior Notes due 2018
|
415
|
|
||
|
6⅛% Senior Notes due 2019
|
823
|
|
||
|
8⅝% Senior Notes due 2019
|
451
|
|
||
|
7⅝% Senior Notes due 2020
|
339
|
|
||
|
6½% Senior Notes due 2020
|
1,658
|
|
||
|
6⅝% Senior Notes due 2021
|
663
|
|
||
|
6¾% Senior Notes due 2022
|
1,118
|
|
||
|
6⅞% Senior Notes due 2023
|
1,695
|
|
||
|
MMR debt assumed at the acquisition date (initially recorded at fair value):
|
||||
|
11.875% Senior Notes due 2014
|
314
|
|
||
|
4% Convertible Senior Notes due 2017
|
237
|
|
||
|
5¼% Convertible Senior Notes due 2013
|
69
|
|
||
|
FCX's borrowings under the revolving credit facility
|
200
|
|
||
|
PXP's additional borrowings under the amended credit facility
|
396
|
|
||
|
Other borrowings and changes
|
75
|
|
||
|
Subtotal
|
25,939
|
|
||
|
Less cash repayments and payments for conversions:
|
||||
|
FCX's revolving credit facility
|
200
|
|
||
|
PXP's amended credit facility
|
3,865
|
|
||
|
MMR's 4% Convertible Senior Notes due 2017
|
209
|
|
||
|
PXP's 7⅝% Senior Notes due 2018
|
415
|
|
||
|
Other
|
127
|
|
||
|
Total debt balance at September 30, 2013
|
21,123
|
|
||
|
Less current portion
|
(70
|
)
|
||
|
Long-term debt
|
$
|
21,053
|
|
|
Revolving Credit Facility.
On
February 14, 2013
, FCX and PT Freeport Indonesia entered into a new senior unsecured
$3.0 billion
revolving credit facility, which replaced FCX's existing revolving credit facility (scheduled to mature on March
30, 2016) upon completion of the acquisition of PXP. On May 31, 2013, in connection with the PXP acquisition, FCX satisfied all conditions under its new senior unsecured
$3.0 billion
revolving credit facility, and Freeport-McMoRan Oil & Gas, LLC (FM O&G LLC, the successor entity of PXP) joined the revolving credit facility as a borrower. The new revolving credit facility is available until
May 31, 2018
, in an aggregate principal amount of
$3.0 billion
, with
$500 million
available to PT Freeport Indonesia. At September 30, 2013, FCX had
no
borrowings and
$46 million
of letters of credit issued under the revolving credit facility, resulting in availability of approximately
17
$3.0 billion
, of which
$1.5 billion
could be used for additional letters of credit. Interest on the new revolving credit facility (currently London Interbank Offered Rate (
LIBOR
) plus
1.50 percent
or the alternate base rate (
ABR
) plus
0.50 percent
) is determined by reference to FCX's credit rating.
Lines of Credit.
During third-quarter 2013, FCX entered into uncommitted lines of credit totaling
$450 million
with three financial institutions. These unsecured lines allow FCX to borrow at a spread over LIBOR or the respective financial institution's cost of funds with terms and pricing that are more favorable than FCX's revolving credit facility. As of September 30, 2013, there were
no
borrowings drawn on these lines of credit.
Acquisition-Related Debt.
In connection with financing FCX
'
s acquisitions of PXP and MMR, FCX used the proceeds from the issuance of
$6.5 billion
of unsecured senior notes and a
$4.0 billion
unsecured
five
-year bank term loan (the Term Loan) to fund the cash portion of the merger consideration for both transactions, to repay certain indebtedness of PXP and for general corporate purposes.
Senior Notes.
On
March 7, 2013
, in connection with the financing of FCX's then-pending acquisitions of PXP and MMR, FCX issued
$6.5 billion
of unsecured senior notes in four tranches. FCX sold
$1.5 billion
of
2.375%
Senior Notes due March 2018 (
5
-year notes),
$1.0 billion
of
3.100%
Senior Notes due March 2020 (
7
-year notes),
$2.0 billion
of
3.875%
Senior Notes due March 2023 (
10
-year notes) and
$2.0 billion
of
5.450%
Senior Notes due March 2043 (
30
-year notes) for total net proceeds of
$6.4 billion
. Interest on these notes is payable semiannually on
March 15 and September 15
, beginning
September 15, 2013
.
Bank Term Loan
. On
February 14, 2013
, FCX entered into an agreement for a
$4.0 billion
unsecured Term Loan in connection with the then-pending acquisitions of PXP and MMR. Upon closing the PXP acquisition, FCX borrowed
$4.0 billion
under the Term Loan, and FM O&G LLC joined the Term Loan as a borrower. The Term Loan will amortize in equal quarterly installments during the second, third and fourth years of the loan in annual amounts equal to
10 percent
,
15 percent
and
20 percent
, respectively, of the original aggregate principal amount, and the remainder will mature
five years from the date of the first borrowing
on May 31, 2013). At FCX's option, the Term Loan bears interest at either an adjusted LIBOR or an alternate base rate (as defined under the Term Loan agreement) plus a spread determined by reference to FCX's credit ratings (currently
LIBOR
plus
1.50 percent
or
ABR
plus
0.50 percent
).
PXP Debt Assumed.
At the close of the acquisition of PXP, FCX assumed long-term debt with a stated value of
$9.9 billion
, which was increased by
$762 million
to reflect the acquisition-date fair market value of these obligations. The fair value adjustments will be amortized over the term of the senior notes and recorded as a reduction of interest expense. Following is a brief description of the debt assumed in the PXP acquisition.
PXP's 6⅛%
Senior Notes due 2019, 8⅝%
Senior Notes due 2019, 7⅝%
Senior Notes due 2020, 6½%
Senior Notes due 2020, 6⅝% Senior Notes due 2021, 6¾%
Senior Notes due 2022 and 6⅞%
Senior Notes due 2023 had a total stated value of
$6.4 billion
(including the 7⅝% Senior Notes due 2018 that were repaid in June 2013), which was increased by
$716 million
to reflect the acquisition-date fair market value of these senior notes. Interest on these notes is payable semiannually. These senior notes are redeemable in whole or in part, at the option of FCX, at make-whole redemption prices prior to the dates stated below, and beginning on the dates below at specified redemption prices. In addition, up to
35 percent
of the principal amount of certain of these notes may be redeemed at specified redemption prices with all or a portion of the proceeds of an equity contribution.
|
Debt Instrument
|
Date
|
|
|
6⅛% Senior Notes due 2019
|
June 15, 2016
|
|
|
8⅝% Senior Notes due 2019
|
October 15, 2014
|
|
|
7⅝% Senior Notes due 2020
|
April 1, 2015
|
|
|
6½% Senior Notes due 2020
|
November 15, 2015
|
|
|
6⅝% Senior Notes due 2021
|
May 1, 2016
|
|
|
6¾% Senior Notes due 2022
|
February 1, 2017
|
|
|
6⅞% Senior Notes due 2023
|
February 15, 2018
|
|
18
MMR Debt Assumed.
At the close of the acquisition of MMR, FCX assumed long-term debt with a stated value of
$558 million
, which was increased by
$62 million
to reflect the acquisition-date fair market value of these obligations. The fair value adjustments will be amortized over the term of the senior notes and recorded as a reduction of interest expense. Following is a brief description of the debt assumed in the MMR acquisition.
Interest on MMR's 11.875% Senior Notes due 2014 is payable semiannually, and these notes are redeemable in whole or in part, at the option of FCX, at specified redemption prices. These notes are callable at par in November 2013 (refer to Note 12 for discussion of the redemption of these notes). During June and July 2013, holders of MMR's 4% Convertible Senior Notes due 2017 converted their notes into merger consideration totaling
$237 million
, including cash payments of
$209 million
and
16.3 million
royalty trust units with a fair value of
$28 million
at the acquisition date. Interest on MMR's 5¼% Convertible Senior Notes due 2013 was payable semiannually (refer to Note 12 for discussion of the conversion of these notes in October 2013).
Repayments.
In connection with the acquisition of PXP, FCX repaid the
$3.9 billion
outstanding under PXP's amended credit facility. Additionally, during June 2013, FCX redeemed all of PXP's 7⅝% Senior Notes due 2018, which were recorded at fair value on the date of acquisition, for
$415 million
.
On
March 14, 2012
, FCX redeemed the remaining
$3.0 billion
of its outstanding
8.375%
Senior Notes due 2017, for which holders received
104.553 percent
of the principal amount together with the accrued and unpaid interest. As a result of this redemption, FCX recorded a loss on early extinguishment of debt of
$168 million
(
$149 million
to net income attributable to FCX common stockholders) for the first nine months of 2012.
Other.
During the first nine months of 2013, FCX recorded a loss on early extinguishment of debt of
$45 million
(
$36 million
to net income attributable to FCX common stockholders) for financing costs incurred for the terminated
$9.5 billion
acquisition bridge loan facility, which was entered into in December 2012 to provide interim financing for the acquisitions of PXP and MMR but was replaced with other financing.
In February 2012, FCX sold
$500 million
of
1.40%
Senior Notes due 2015,
$500 million
of
2.15%
Senior Notes due 2017 and
$2.0 billion
of
3.55%
Senior Notes due 2022 for total net proceeds of
$2.97 billion
. Interest on these notes is payable semiannually.
Guarantees.
In connection with the acquisition of PXP, FCX guaranteed the PXP senior notes, and the guarantees by certain PXP subsidiaries were released. At the time of FCX's acquisition of MMR, FCX guaranteed MMR's 11.875% Senior Notes due 2014, and the guarantees by certain MMR subsidiaries were released. Refer to Note 14 for a discussion of FCX's senior notes guaranteed by FM O&G LLC.
Restrictive Covenants.
The Term Loan and new revolving credit facility both contain customary affirmative covenants and representations, and also contain a number of negative covenants that, among other things, restrict, subject to certain exceptions, the ability of FCX's subsidiaries that are not borrowers or guarantors to incur additional indebtedness (including guarantee obligations) and FCX's ability or the ability of FCX's subsidiaries to: create liens on assets; enter into sale and leaseback transactions; engage in mergers, liquidations and dissolutions; and sell assets. The Term Loan and new revolving credit facility also contain financial ratios governing maximum total leverage and minimum interest coverage. The FCX senior notes contain limitations on liens that are generally typical for investment grade companies.
Maturities.
Maturities of debt instruments based on the amounts and terms outstanding at
September 30, 2013
, total
$67 million
for the remainder of 2013;
$614 million
in 2014;
$1.1 billion
in 2015,
$750 million
in 2016,
$700 million
in 2017 and
$17.9 billion
thereafter.
Consolidated interest expense (excluding capitalized interest) totaled
$223 million
in
third-quarter
2013
,
$56 million
in
third-quarter
2012
,
$465 million
for the
first nine months of
2013
and
$210 million
for the
first nine months of
2012
. Capitalized interest totaled
$61 million
in
third-quarter
2013
,
$14 million
in
third-quarter
2012
,
$114 million
for the
first nine months of
2013
and
$62 million
for the
first nine months of
2012
.
19
8. CONTINGENCIES AND COMMITMENTS
Asset Retirement Obligations (AROs).
A summary of changes in FCX's AROs (included in reclamation and environmental obligations in the condensed consolidated balance sheet) for the
nine
months ended September 30, 2013, follows (in millions):
|
Balance at December 31, 2012
|
$
|
1,146
|
|
||
|
Liabilities assumed in the acquisitions of PXP and MMR
a
|
1,024
|
|
|||
|
Liabilities incurred
|
15
|
|
|||
|
Settlements and revisions to cash flow estimates, net
|
(3
|
)
|
|||
|
Accretion expense
|
66
|
|
|||
|
Spending
|
(62
|
)
|
|||
|
Other
|
(3
|
)
|
|||
|
Balance at September 30, 2013
|
2,183
|
|
|||
|
Less: current portion
|
(125
|
)
|
|||
|
Long-term portion
|
$
|
2,058
|
|
||
|
a.
|
The fair value of AROs assumed in the acquisitions of PXP and MMR (
$741 million
and
$283 million
, respectively) were estimated based on projected cash flows, an estimated long-term annual inflation rate of
2.5 percent
, and discount rates based on FCX's estimated credit-adjusted, risk-free interest rates ranging from
1.3 percent
to
6.3 percent
.
|
The following discussion updates previously reported information regarding AROs included in Note 13 of FCX's annual report on Form 10-K for the year ended
December 31, 2012
, to reflect the acquisitions of PXP and MMR. Consistent with oil and gas industry practices, substantially all of the oil and gas leases require that, upon termination of economic production, the working interest owners plug and abandon non-producing wellbores, remove platforms, tanks, production equipment and flow lines and restore the wellsite. Typically, when producing oil and gas assets are purchased, the purchaser assumes the obligation to plug and abandon wells and facilities that are part of such assets. However, in some instances, an indemnity may be received with respect to those costs. FCX cannot be assured that it will be able to collect on these indemnities. In connection with the acquisitions of PXP and MMR, the most significant asset retirement obligations were related to the oil and gas properties located in the GOM.
Litigation.
The following information includes a discussion of updates to previously reported legal proceedings included in Note 13 of FCX’s annual report on Form 10-K for the year ended
December 31, 2012
, and Notes 8 and 9 of FCX’s quarterly report on Form 10-Q for the quarters ended June 30, 2013, and March 31, 2013, respectively.
Shareholder Litigation.
On July 19, 2013, the plaintiffs in
In Re Freeport-McMoRan Copper & Gold, Inc. Derivative Litigation
, No. 8145-VCN, pending in the Delaware Court of Chancery, filed a second amended consolidated complaint and voluntarily dismissed without prejudice the aiding and abetting claims against most of the defendants. On October 10, 2013, FCX and the other defendants filed a motion to dismiss the second amended consolidated complaint.
On August 14, 2013, the parties in
In Re Plains Exploration & Production Company Stockholder Litigation
, No. 8090-VCN, entered into a stipulation that provided for dismissal with prejudice as to the named plaintiffs and without prejudice as to the non-present class members. The court approved the stipulation on August 15, 2013.
On October 11, 2013, the court held a hearing to consider the evidence in support of the proposed settlement of
In Re McMoRan Exploration Co. Stockholder Litigation
, No. 8132-VCN. On October 16, 2013, the court entered an order approving the settlement, the terms of which are not material to FCX.
Tax and Other Matters.
Cerro Verde Royalty Dispute.
As reported in Note 13 of FCX's annual report on Form 10-K for the year ended December 31, 2012, SUNAT, the Peruvian national tax authority, has assessed mining royalties on ore processed by the Cerro Verde concentrator that commenced operations in late 2006. These assessments cover the period October 2006 to December 2007 and the years 2008 and 2009. In July 2013, the Peruvian Tax Tribunal issued two decisions affirming SUNAT's assessments for the period October 2006 through December 2008. Decisions by the Tax Tribunal end the administrative stage of the appeal procedures for the assessments. In September 2013, Cerro Verde filed judiciary appeals related to the assessments because it continues to believe that its 1998 stability agreement provides an exemption for all minerals extracted from its mining concession, irrespective of the method used for processing those minerals. Although FCX believes its interpretation of the stability agreement is correct, if Cerro Verde is ultimately found responsible for these assessments, it will also be
20
liable for interest, which accrues at rates that range from approximately
7
to
18 percent
based on the year accrued and the currency in which the amounts would be payable.
On October 1, 2013, SUNAT served Cerro Verde with a demand for payment totaling
492 million
Peruvian nuevo soles (
$176 million
based on current exchange rates, including interest and penalties of
$104 million
) based on the Peruvian Tax Tribunal’s July 2013 decisions. As permitted by law, Cerro Verde requested and was granted an installment payment program that defers payment for six months and thereafter satisfies the amount via sixty-six equal monthly payments. On July 19, 2013, a hearing on SUNAT's assessment for 2009 was held, but no decision has been issued by the Tax Tribunal for that year. As of September 30, 2013, the aggregate amount of the assessments, including interests and penalties, for the year 2009 was
200 million
Peruvian nuevo soles (
$72 million
based on current exchange rates). SUNAT may make additional assessments for mining royalties and associated penalties and interest for the years 2010 through 2013, which Cerro Verde will contest; FCX believes any such assessments for the years 2010 through 2013, if made, would in the aggregate be similar to the aggregate assessments received for the periods October 2006 through December 2009. No assessments can be issued for years after 2013, as Cerro Verde’s current stability agreement expires on December 31, 2013, and Cerro Verde will begin paying royalties on all of its production in January 2014 under its new 15-year stability agreement. No amounts were accrued as of September 30, 2013, because Cerro Verde believes its stability agreement exempts it from these royalties.
Indonesia Tax Matters.
PT Freeport Indonesia has received assessments from the Indonesian tax authorities for additional taxes and interest related to various audit exceptions for the years 2005, 2006, 2007, 2008 and 2011. During first-quarter 2013, PT Freeport Indonesia received assessments from the Indonesian tax authorities for additional taxes of
$59 million
and interest of
$55 million
related to various audit exceptions for 2008. During second-quarter 2013, the Indonesian tax authorities agreed to refund
$291 million
(
$320 million
was included in other accounts receivable in the condensed consolidated balance sheet at December 31, 2012) associated with overpayments made by PT Freeport Indonesia for 2011. PT Freeport Indonesia filed objections for
$22 million
of the remaining 2011 overpayments that it believes it is due. Additionally, the Indonesian tax authorities withheld
$126 million
of the 2011 overpayment for unrelated assessments from 2005 and 2007, which PT Freeport Indonesia is disputing. A refund of
$165 million
was received in July 2013. PT Freeport Indonesia has filed objections to the 2005, 2006, 2007, 2008 and 2011 assessments because it believes it has properly determined and paid its taxes. As of
September 30, 2013
, FCX had
$284 million
included in other assets for amounts paid on disputed tax assessments, which it believes are collectible, including the
$126 million
discussed above for the 2011 refunds.
Contractual Obligations.
The following information updates previously reported contractual obligations included in Note 14 of FCX's annual report on Form 10-K for the year ended December 31, 2012, to reflect the acquisitions of PXP and MMR. As is common within the oil and gas industry, FCX has various commitments and operating agreements associated with oil and gas exploration, development and production activities, gathering and transportation, and oilfield and other services. As of
September 30, 2013
, aggregate future obligations under these agreements total
$2.3 billion
, primarily comprising minimum commitments of
$1.5 billion
for two ultra-deepwater drillships currently under construction and expected to be delivered in late 2014 and early 2015 for the GOM drilling campaign and
$472 million
associated with the deferred premium costs and future interest expected to be accrued on crude oil option contracts, which will be paid once the options settle (refer to Note
9
for further discussion). FCX's future commitments associated with these oil and gas unconditional purchase obligations total
$72 million
for the remainder of 2013,
$340 million
in 2014,
$704 million
in 2015,
$565 million
in 2016,
$493 million
in 2017 and
$166 million
thereafter.
9. FINANCIAL INSTRUMENTS
FCX does not purchase, hold or sell derivative financial instruments unless there is an existing asset or obligation, or it anticipates a future activity that is likely to occur and will result in exposure to market risks, which FCX intends to offset or mitigate. FCX does not enter into any derivative financial instruments for speculative purposes, but has entered into derivative financial instruments in limited instances to achieve specific objectives. These objectives principally relate to managing risks associated with commodity price changes, foreign currency exchange rates and interest rates.
Commodity Contracts.
From time to time, FCX has entered into forward, futures and swap contracts to hedge the market risk associated with fluctuations in the prices of copper and gold commodities it purchases and sells. As a result of the acquisition of PXP, FCX assumed a variety of oil and gas commodity derivatives, such as swaps, collars, puts, calls and various combinations of these instruments, to hedge the exposure to the volatility of oil and gas commodity prices.
21
Derivative financial instruments used by FCX to manage its risks do not contain credit risk-related contingent provisions. A discussion of FCX’s derivative commodity contracts and programs follows.
Commodity Derivatives Designated as Hedging Instruments – Fair Value Hedges
Copper Futures and Swap Contracts.
Some of FCX's U.S. copper rod customers request a fixed market price instead of the Commodity Exchange Inc. (COMEX), a division of the New York Mercantile Exchange (NYMEX), average copper price in the month of shipment. FCX hedges this price exposure in a manner that allows it to receive the COMEX average price in the month of shipment while the customers pay the fixed price they requested. FCX accomplishes this by entering into copper futures and swap contracts and then liquidating the copper futures contracts and settling the copper swap contracts during the month of shipment, which generally results in FCX receiving the COMEX average copper price in the month of shipment. Hedging gains or losses from these copper futures and swap contracts are recorded in revenues. FCX did not have any significant gains or losses during the
three
-month or
nine
-month periods ended
September 30, 2013
and
2012
, resulting from hedge ineffectiveness. At
September 30, 2013
, FCX held copper futures and swap contracts that qualified for hedge accounting for
41 million
pounds at an average contract price of
$3.28
per pound, with maturities through
November 2014
.
A summary of gains (losses) recognized in revenues for derivative financial instruments related to commodity contracts that are designated and qualify as fair value hedge transactions, along with the unrealized gains (losses) on the related hedged item (firm sales commitments) follows (in millions):
|
|
Three Months Ended
|
Nine Months Ended
|
|||||||||||||
|
September 30,
|
September 30,
|
||||||||||||||
|
|
2013
|
2012
|
2013
|
2012
|
|||||||||||
|
Copper futures and swap contracts:
|
|
|
|||||||||||||
|
Unrealized (losses) gains:
|
|
|
|||||||||||||
|
Derivative financial instruments
|
$
|
16
|
|
$
|
13
|
|
$
|
(2
|
)
|
$
|
20
|
|
|||
|
Hedged item
|
(16
|
)
|
(13
|
)
|
2
|
|
(20
|
)
|
|||||||
|
Realized (losses) gains:
|
|
|
|||||||||||||
|
Matured derivative financial instruments
|
(3
|
)
|
1
|
|
(17
|
)
|
(3
|
)
|
|||||||
Commodity Derivatives Not Designated as Hedging Instruments
Embedded Derivatives.
As described in Note 1 to FCX’s annual report on Form 10-K for the year ended
December 31, 2012
, under “Revenue Recognition,” certain FCX copper concentrate, copper cathode and gold sales contracts provide for provisional pricing primarily based on the London Metal Exchange (LME) price (copper) or the COMEX price (copper) and the London Bullion Market Association (London PM) price (gold) at the time of shipment as specified in the contract. Similarly, FCX purchases copper under contracts that provide for provisional pricing. FCX applies the normal purchases and normal sales scope exception in accordance with derivatives and hedge accounting guidance to the host sales agreements since the contracts do not allow for net settlement and always result in physical delivery. Sales and purchases with a provisional sales price contain an embedded derivative (
i.e.
, the price settlement mechanism that is settled after the time of delivery) that is required to be bifurcated from the host contract. The host contract is the sale or purchase of the metals contained in the concentrates or cathodes at the then-current LME or COMEX price (copper) or the London PM price (gold) as defined in the contract. Mark-to-market price fluctuations recorded through the settlement date are reflected in revenues for sales contracts and in cost of sales as production and delivery costs for purchase contracts.
A summary of FCX’s embedded commodity derivatives at
September 30, 2013
, follows:
|
Open Positions
|
Average Price
Per Unit
|
Maturities Through
|
||||||||||
|
|
Contract
|
Market
|
||||||||||
|
Embedded derivatives in provisional sales contracts:
|
|
|
|
|
||||||||
|
Copper (millions of pounds)
|
555
|
|
$
|
3.22
|
|
$
|
3.31
|
|
February 2014
|
|||
|
Gold (thousands of ounces)
|
161
|
|
1,356
|
|
1,332
|
|
January 2014
|
|||||
|
Embedded derivatives in provisional purchase contracts:
|
|
|
|
|||||||||
|
Copper (millions of pounds)
|
52
|
|
3.17
|
|
3.31
|
|
January 2014
|
|||||
22
Oil and Gas Contracts.
As a result of the acquisition of PXP, FCX assumed PXP's 2013, 2014 and 2015 economic hedge positions that consisted of crude oil options, and crude oil and natural gas swaps. The crude oil and natural gas derivatives do not qualify or are not designated as hedging instruments and are recorded at fair value with the mark-to-market gains and losses recorded in revenues.
The crude oil options were entered into by PXP to protect the realized price of a portion of expected future sales in order to limit the effects of crude oil price decreases. These contracts are composed of crude oil put spreads (consisting of put options with a floor limit) and crude oil three-way collars (consisting of a put option with a floor limit and a call option with a ceiling). The premiums associated with put options are deferred until the settlement period. At
September 30, 2013
, the deferred option premiums and accrued interest associated with the crude oil option contracts totaled
$461 million
, which was included as a component of the fair value of the crude oil options contracts. At
September 30, 2013
, the outstanding crude oil option contracts, all of which settle monthly, follow:
|
Average Price (per Bbl)
a
|
|||||||||||||||||||||||
|
Period
|
Instrument Type
|
Daily Volumes (MBbls)
|
Ceiling
|
Floor
|
Floor Limit
|
Average Deferred Premium
(per Bbl)
|
Index
|
||||||||||||||||
|
2013
|
|||||||||||||||||||||||
|
Oct - Dec
|
Three-way collars
b
|
25
|
|
$
|
124.29
|
|
$
|
100
|
|
$
|
80
|
|
$
|
—
|
|
Brent
|
|||||||
|
Oct - Dec
|
Put options
c
|
17
|
|
N/A
|
|
90
|
|
70
|
|
6.25
|
|
Brent
|
|||||||||||
|
Oct - Dec
|
Put options
c
|
13
|
|
N/A
|
|
100
|
|
80
|
|
6.80
|
|
Brent
|
|||||||||||
|
Oct - Dec
|
Three-way collars
b
|
5
|
|
126.08
|
|
90
|
|
70
|
|
—
|
|
Brent
|
|||||||||||
|
2014
|
|||||||||||||||||||||||
|
Jan - Dec
|
Put options
c
|
75
|
|
N/A
|
|
90
|
|
70
|
|
5.74
|
|
Brent
|
|||||||||||
|
Jan - Dec
|
Put options
c
|
30
|
|
N/A
|
|
95
|
|
75
|
|
6.09
|
|
Brent
|
|||||||||||
|
Jan - Dec
|
Put options
c
|
5
|
|
N/A
|
|
100
|
|
80
|
|
7.11
|
|
Brent
|
|||||||||||
|
2015
|
|||||||||||||||||||||||
|
Jan - Dec
|
Put options
c
|
84
|
|
N/A
|
|
90
|
|
70
|
|
6.89
|
|
Brent
|
|||||||||||
|
a.
|
The average strike prices do not reflect any premiums to purchase the put options.
|
|
b.
|
If the index price is less than the per barrel floor, FCX receives the difference between the per barrel floor and the index price up to a maximum of
$20
per barrel. FCX pays the difference between the index price and the per barrel ceiling if the index price is greater than the per barrel ceiling. If the index price is at or above the per barrel floor and at or below the per barrel ceiling, no cash settlement is required.
|
|
c.
|
If the index price is less than the per barrel floor, FCX receives the difference between the per barrel floor and the index price up to a maximum of
$20
per barrel less the option premium. If the index price is at or above the per barrel floor, FCX pays the option premium and no cash settlement is received.
|
In addition, at September 30, 2013, outstanding crude oil swaps with a weighted-average swap price of
$109.23
per barrel cover approximately
4
million barrels (MMBbls) of crude oil, and natural gas swaps with a weighted-average swap price of
$4.13
per million British thermal units (MMBTU) cover approximately
47
million MMBTUs of natural gas.
At
September 30, 2013
, the outstanding crude oil and natural gas swap contracts, all of which settle monthly, follow:
|
Daily
|
Weighted-Average
|
Maturities
|
|||||||||
|
Volumes
|
Fixed Price
|
Index
|
Through
|
||||||||
|
2013 crude oil swaps (MBbls)
a
|
40
|
|
$
|
109.23
|
|
Brent
|
December 2013
|
||||
|
2013 natural gas swaps (MMBtu)
a
|
110,000
|
|
4.27
|
|
Henry Hub
|
December 2013
|
|||||
|
2014 natural gas swaps (MMBtu)
a
|
100,000
|
|
4.09
|
|
Henry Hub
|
December 2014
|
|||||
|
a.
|
If the index price is less than the fixed price, FCX receives the difference between the fixed price and the index price. FCX pays the difference between the index price and the fixed price if the index price is greater than the fixed price.
|
23
Copper Forward Contracts.
Atlantic Copper, FCX’s wholly owned smelting and refining unit in Spain, enters into forward copper contracts designed to hedge its copper price risk whenever its physical purchases and sales pricing periods do not match. These economic hedge transactions are intended to hedge against changes in copper prices, with the mark-to-market hedging gains or losses recorded in cost of sales. At
September 30, 2013
, Atlantic Copper held net forward copper sales contracts for
14 million
pounds at an average contract price of
$3.25
per pound, with maturities through
November 2013
.
A summary of the realized and unrealized gains (losses) recognized in income before income taxes and equity in affiliated companies’ net earnings (losses) for commodity contracts that do not qualify or are not designated as hedge transactions, including embedded derivatives, follows (in millions):
|
|
Three Months Ended
|
Nine Months Ended
|
|||||||||||||
|
September 30,
|
September 30,
|
||||||||||||||
|
|
2013
|
2012
|
2013
|
2012
|
|||||||||||
|
Embedded derivatives in provisional copper and gold
|
|||||||||||||||
|
sales contracts
a
|
$
|
141
|
|
$
|
164
|
|
$
|
(147
|
)
|
$
|
188
|
|
|||
|
Crude oil options and swaps
a
|
(173
|
)
|
—
|
|
(227
|
)
|
—
|
|
|||||||
|
Natural gas swaps
a
|
3
|
|
—
|
|
22
|
|
—
|
|
|||||||
|
Copper forward contracts
b
|
—
|
|
5
|
|
3
|
|
17
|
|
|||||||
|
a.
|
Amounts recorded in revenues.
|
|
b.
|
Amounts recorded in cost of sales as production and delivery costs.
|
Unsettled Commodity Derivative Financial Instruments
A summary of the fair values of unsettled commodity derivative financial instruments follows (in millions):
|
September 30,
2013 |
December 31, 2012
|
|||||||
|
Commodity Derivative Assets:
|
|
|
||||||
|
Derivatives designated as hedging instruments:
|
|
|
||||||
|
Copper futures and swap contracts:
a
|
$
|
3
|
|
$
|
5
|
|
||
|
Derivatives not designated as hedging instruments:
|
|
|
||||||
|
Embedded derivatives in provisional copper and gold
|
||||||||
|
sales/purchase contracts
|
51
|
|
36
|
|
||||
|
Crude oil and natural gas swaps
|
24
|
|
—
|
|
||||
|
Total derivative assets
|
$
|
78
|
|
$
|
41
|
|
||
|
Commodity Derivative Liabilities:
|
||||||||
|
Derivatives designated as hedging instruments:
|
||||||||
|
Copper futures and swap contracts
a
|
$
|
1
|
|
$
|
1
|
|
||
|
Derivatives not designated as hedging instruments:
|
||||||||
|
Embedded derivatives in provisional copper and gold
|
||||||||
|
sales/purchase contracts
|
13
|
|
27
|
|
||||
|
Crude oil options
|
218
|
|
—
|
|
||||
|
Copper forward contracts
|
1
|
|
—
|
|
||||
|
Total derivative liabilities
|
$
|
233
|
|
$
|
28
|
|
||
|
a.
|
FCX paid
$3 million
to brokers at
September 30, 2013
, and
$7 million
at
December 31, 2012
, for margin requirements (recorded in other current assets).
|
24
FCX's commodity contracts have netting arrangements with counterparties with which the right of offset exists, and it is FCX's policy to offset balances by counterparty on the balance sheet. FCX's embedded derivatives on provisional sales/purchases are netted with the corresponding outstanding receivable/payable balances. A summary of these unsettled commodity contracts that are offset in the balance sheet follows (in millions):
|
Assets
|
Liabilities
|
|||||||||||||||
|
September 30, 2013
|
December 31, 2012
|
September 30, 2013
|
December 31, 2012
|
|||||||||||||
|
Gross amounts recognized:
|
||||||||||||||||
|
Commodity contracts:
|
||||||||||||||||
|
Embedded derivatives on provisional
|
||||||||||||||||
|
sales/purchase contracts
|
$
|
51
|
|
$
|
36
|
|
$
|
13
|
|
$
|
27
|
|
||||
|
Crude oil and natural gas derivatives
|
24
|
|
—
|
|
218
|
|
—
|
|
||||||||
|
Copper derivatives
|
3
|
|
5
|
|
2
|
|
1
|
|
||||||||
|
78
|
|
41
|
|
233
|
|
28
|
|
|||||||||
|
Less gross amounts of offset:
|
||||||||||||||||
|
Commodity contracts:
|
||||||||||||||||
|
Embedded derivatives on provisional
|
||||||||||||||||
|
sales/purchase contracts
|
4
|
|
8
|
|
4
|
|
8
|
|
||||||||
|
Crude oil and natural gas derivatives
|
20
|
|
—
|
|
20
|
|
—
|
|
||||||||
|
Copper derivatives
|
1
|
|
—
|
|
1
|
|
—
|
|
||||||||
|
25
|
|
8
|
|
25
|
|
8
|
|
|||||||||
|
Net amounts presented in balance sheet:
|
||||||||||||||||
|
Commodity contracts:
|
||||||||||||||||
|
Embedded derivatives on provisional
|
||||||||||||||||
|
sales/purchase contracts
|
47
|
|
28
|
|
9
|
|
19
|
|
||||||||
|
Crude oil and natural gas derivatives
|
4
|
|
—
|
|
198
|
|
—
|
|
||||||||
|
Copper derivatives
|
2
|
|
5
|
|
1
|
|
1
|
|
||||||||
|
$
|
53
|
|
$
|
33
|
|
$
|
208
|
|
$
|
20
|
|
|||||
|
Balance sheet classification:
|
||||||||||||||||
|
Trade accounts receivable
|
$
|
46
|
|
$
|
24
|
|
$
|
1
|
|
$
|
9
|
|
||||
|
Other current assets
|
6
|
|
5
|
|
—
|
|
—
|
|
||||||||
|
Other assets
|
—
|
|
—
|
|
—
|
|
—
|
|
||||||||
|
Accounts payable and accrued liabilities
|
1
|
|
4
|
|
116
|
|
11
|
|
||||||||
|
Other liabilities
|
—
|
|
—
|
|
91
|
|
—
|
|
||||||||
|
$
|
53
|
|
$
|
33
|
|
$
|
208
|
|
$
|
20
|
|
|||||
Credit Risk.
FCX is exposed to credit loss when financial institutions with which FCX has entered into derivative transactions (commodity, foreign exchange and interest rate swaps) are unable to pay. To minimize the risk of such losses, FCX uses counterparties that meet certain credit requirements and periodically reviews the creditworthiness of these counterparties. FCX does not anticipate that any of the counterparties it deals with will default on their obligations. As of
September 30, 2013
, the maximum amount of credit exposure associated with derivative transactions was
$50 million
.
Other Financial Instruments.
Other financial instruments include cash and cash equivalents, accounts receivable, investment securities, trust assets, accounts payable and accrued liabilities, dividends payable and long-term debt. The carrying value for cash and cash equivalents (which included time deposits of
$239 million
at
September 30, 2013
, and
$514 million
at December 31, 2012), accounts receivable, accounts payable and accrued liabilities, and dividends payable approximates fair value because of their short-term nature and generally negligible credit losses (refer to Note
10
for the fair values of investment securities, trust assets and long-term debt).
In addition,
FCX has non-detachable warrants, which are considered to be embedded derivative instruments, associated with the Plains Offshore Preferred Stock (refer to Note
2
for further discussion and Note
10
for the fair value of these instruments).
25
10. FAIR VALUE MEASUREMENT
Fair value accounting guidance includes a hierarchy that prioritizes the inputs to valuation techniques used to measure fair value. The hierarchy gives the highest priority to unadjusted quoted prices in active markets for identical assets or liabilities (Level 1 inputs) and the lowest priority to unobservable inputs (Level 3 inputs). FCX recognizes transfers between levels at the end of the reporting period. FCX did not have any significant transfers in or out of Level 1, 2, or 3 for
third
-quarter
2013
.
A summary of the carrying amount and fair value of FCX’s financial instruments other than cash and cash equivalents, accounts receivable, accounts payable and accrued liabilities, and dividends payable follows (in millions):
|
At September 30, 2013
|
|||||||||||||||||||
|
|
Carrying
|
Fair Value
|
|||||||||||||||||
|
|
Amount
|
Total
|
Level 1
|
Level 2
|
Level 3
|
||||||||||||||
|
Assets
|
|
|
|
|
|||||||||||||||
|
Investment securities (current and long-term):
a, b, c
|
|||||||||||||||||||
|
Money market funds
|
$
|
82
|
|
$
|
82
|
|
$
|
82
|
|
$
|
—
|
|
$
|
—
|
|
||||
|
U.S. core fixed income fund
|
21
|
|
21
|
|
—
|
|
21
|
|
—
|
|
|||||||||
|
Equity securities
|
4
|
|
4
|
|
4
|
|
—
|
|
—
|
|
|||||||||
|
Total investment securities
|
107
|
|
107
|
|
86
|
|
21
|
|
—
|
|
|||||||||
|
Trust assets (long-term):
a, c
|
|
|
|
|
|||||||||||||||
|
U.S. core fixed income fund
|
48
|
|
48
|
|
—
|
|
48
|
|
—
|
|
|||||||||
|
Government mortgage-backed securities
|
37
|
|
37
|
|
—
|
|
37
|
|
—
|
|
|||||||||
|
Corporate bonds
|
26
|
|
26
|
|
—
|
|
26
|
|
—
|
|
|||||||||
|
Government bonds and notes
|
24
|
|
24
|
|
—
|
|
24
|
|
—
|
|
|||||||||
|
Asset-backed securities
|
15
|
|
15
|
|
—
|
|
15
|
|
—
|
|
|||||||||
|
Money market funds
|
7
|
|
7
|
|
7
|
|
—
|
|
—
|
|
|||||||||
|
Municipal bonds
|
1
|
|
1
|
|
—
|
|
1
|
|
—
|
|
|||||||||
|
Total trust assets
|
158
|
|
158
|
|
7
|
|
151
|
|
—
|
|
|||||||||
|
Derivatives:
a, d
|
|
|
|
|
|||||||||||||||
|
Embedded derivatives in provisional sales/purchase
|
|||||||||||||||||||
|
contracts in a gross asset position
|
51
|
|
51
|
|
—
|
|
51
|
|
—
|
|
|||||||||
|
Crude oil and natural gas swaps
|
24
|
|
24
|
|
—
|
|
24
|
|
—
|
|
|||||||||
|
Copper futures and swap contracts
|
3
|
|
3
|
|
3
|
|
—
|
|
—
|
|
|||||||||
|
Total derivative assets
|
78
|
|
78
|
|
3
|
|
75
|
|
—
|
|
|||||||||
|
Total assets
|
$
|
343
|
|
$
|
96
|
|
$
|
247
|
|
$
|
—
|
|
|||||||
|
Liabilities
|
|
|
|
|
|||||||||||||||
|
Derivatives:
a
|
|
|
|
|
|||||||||||||||
|
Embedded derivatives in provisional sales/purchase
|
|||||||||||||||||||
|
contracts in a gross liability position
d
|
$
|
13
|
|
$
|
13
|
|
$
|
—
|
|
$
|
13
|
|
$
|
—
|
|
||||
|
Crude oil options
d
|
218
|
|
218
|
|
—
|
|
—
|
|
218
|
|
|||||||||
|
Copper futures and swap contracts
d
|
1
|
|
1
|
|
1
|
|
—
|
|
—
|
|
|||||||||
|
Copper forward contracts
d
|
1
|
|
1
|
|
1
|
|
—
|
|
—
|
|
|||||||||
|
Plains Offshore warrants
e
|
11
|
|
11
|
|
—
|
|
—
|
|
11
|
|
|||||||||
|
Total derivative liabilities
|
244
|
|
244
|
|
2
|
|
13
|
|
229
|
|
|||||||||
|
Long-term debt, including current portion
f
|
21,123
|
|
20,411
|
|
—
|
|
20,411
|
|
—
|
|
|||||||||
|
Total liabilities
|
$
|
20,655
|
|
$
|
2
|
|
$
|
20,424
|
|
$
|
229
|
|
|||||||
26
|
At December 31, 2012
|
|||||||||||||||||||
|
|
Carrying
|
Fair Value
|
|||||||||||||||||
|
|
Amount
|
Total
|
Level 1
|
Level 2
|
Level 3
|
||||||||||||||
|
Assets
|
|
|
|
|
|||||||||||||||
|
Investment securities (current and long-term):
|
|||||||||||||||||||
|
MMR investment
g
|
$
|
446
|
|
$
|
539
|
|
$
|
—
|
|
$
|
539
|
|
$
|
—
|
|
||||
|
U.S. core fixed income fund
a, c
|
22
|
|
22
|
|
—
|
|
22
|
|
—
|
|
|||||||||
|
Money market funds
a, c
|
16
|
|
16
|
|
16
|
|
—
|
|
—
|
|
|||||||||
|
Equity securities
a, c
|
8
|
|
8
|
|
8
|
|
—
|
|
—
|
|
|||||||||
|
Total investment securities
|
492
|
|
585
|
|
24
|
|
561
|
|
—
|
|
|||||||||
|
Trust assets (long-term):
a, c
|
|
|
|
|
|||||||||||||||
|
U.S. core fixed income fund
|
50
|
|
50
|
|
—
|
|
50
|
|
—
|
|
|||||||||
|
Government mortgage-backed securities
|
36
|
|
36
|
|
—
|
|
36
|
|
—
|
|
|||||||||
|
Corporate bonds
|
30
|
|
30
|
|
—
|
|
30
|
|
—
|
|
|||||||||
|
Government bonds and notes
|
24
|
|
24
|
|
—
|
|
24
|
|
—
|
|
|||||||||
|
Asset-backed securities
|
15
|
|
15
|
|
—
|
|
15
|
|
—
|
|
|||||||||
|
Money market funds
|
7
|
|
7
|
|
7
|
|
—
|
|
—
|
|
|||||||||
|
Municipal bonds
|
1
|
|
1
|
|
—
|
|
1
|
|
—
|
|
|||||||||
|
Total trust assets
|
163
|
|
163
|
|
7
|
|
156
|
|
—
|
|
|||||||||
|
Derivatives:
a, d
|
|
|
|
|
|||||||||||||||
|
Embedded derivatives in provisional sales/purchase
|
|||||||||||||||||||
|
contracts in a gross asset position
|
36
|
|
36
|
|
—
|
|
36
|
|
—
|
|
|||||||||
|
Copper futures and swaps contracts
|
5
|
|
5
|
|
5
|
|
—
|
|
—
|
|
|||||||||
|
Total derivative assets
|
41
|
|
41
|
|
5
|
|
36
|
|
—
|
|
|||||||||
|
Total assets
|
$
|
789
|
|
$
|
36
|
|
$
|
753
|
|
$
|
—
|
|
|||||||
|
Liabilities
|
|
|
|
|
|||||||||||||||
|
Derivatives:
a, d
|
|||||||||||||||||||
|
Embedded derivatives in provisional sales/purchase
|
|||||||||||||||||||
|
contracts in a gross liability position
|
$
|
27
|
|
$
|
27
|
|
$
|
—
|
|
$
|
27
|
|
$
|
—
|
|
||||
|
Copper futures and swap contracts
|
1
|
|
1
|
|
1
|
|
—
|
|
—
|
|
|||||||||
|
Total derivative liabilities
|
28
|
|
28
|
|
1
|
|
27
|
|
—
|
|
|||||||||
|
Long-term debt, including current portion
f
|
3,527
|
|
3,589
|
|
—
|
|
3,589
|
|
—
|
|
|||||||||
|
Total liabilities
|
$
|
3,617
|
|
$
|
1
|
|
$
|
3,616
|
|
$
|
—
|
|
|||||||
|
a.
|
Recorded at fair value.
|
|
b.
|
Investment securities excluded
$30 million
of time deposits at
September 30, 2013
.
|
|
c.
|
Current portion included in other current assets and long-term portion included in other assets.
|
|
d.
|
Crude oil options are net of
$461 million
for deferred premiums and accrued interest at
September 30, 2013
. Refer to Note
9
for further discussion and balance sheet classifications.
|
|
e.
|
Included in other liabilities. Refer to Note
2
for further discussion.
|
|
f.
|
Recorded at cost except for debt assumed in the PXP, MMR and Freeport-McMoRan Corporation acquisitions, which were recorded at fair value at the respective acquisition dates.
|
|
g.
|
Recorded at cost and included in other assets.
|
Valuation Techniques
Money market funds are classified within Level 1 of the fair value hierarchy because they are valued using quoted market prices in active markets.
Fixed income securities (U.S. core fixed income funds, government securities, corporate bonds, asset-backed securities and municipal bonds) are valued using a bid evaluation or a mid evaluation. A bid evaluation is an estimated price at which a dealer would pay for a security. A mid evaluation is the average of the estimated price at which a dealer would sell a security and the estimated price at which a dealer would pay for a security. These evaluations are based on quoted prices, if available, or models that use observable inputs and, as such, are classified within Level 2 of the fair value hierarchy.
27
Equity securities are valued at the closing price reported on the active market on which the individual securities are traded and, as such, are classified within Level 1 of the fair value hierarchy.
FCX’s embedded derivatives on provisional copper concentrate, copper cathode and gold purchases and sales have critical inputs of quoted monthly LME or COMEX copper forward prices and the London PM gold forward price at each reporting date based on the month of maturity; however, FCX's contracts themselves are not traded on an exchange. As a result, these derivatives are classified within Level 2 of the fair value hierarchy.
FCX
'
s derivative financial instruments for crude oil options are valued using an option pricing model, which uses various inputs including IntercontinentalExchange, Inc. (ICE) crude oil prices, volatilities, interest rates and contract terms. FCX
'
s derivative financial instruments for crude oil and natural gas swaps are valued using a pricing model that has various inputs including NYMEX and ICE price quotations, interest rates and contract terms. Valuations are adjusted for credit quality, using the counterparties
'
credit quality for asset balances and FCX
'
s credit quality for liability balances. For asset balances, FCX uses the credit default swap value for counterparties when available or the spread between the risk-free interest rate and the yield rate on the counterparties
'
publicly traded debt for similar instruments (which considers the impact of netting agreements on counterparty credit risk, including whether the position with the counterparty is a net asset or net liability)
.
The 2013 and 2014 crude oil and natural gas swaps are classified within Level 2 of the fair value hierarchy because the inputs used in the valuation models are directly or indirectly observable for substantially the full term of the instruments. The 2013, 2014 and 2015 crude oil options are classified within Level 3 of the fair value hierarchy because the inputs used in the valuation models are not observable for substantially the full term of the instruments. The significant unobservable inputs used in the fair value measurement of the crude oil options are implied volatilities and deferred premiums. Significant increases (decreases) in implied volatilities in isolation would result in a significantly higher (lower) fair value measurement. The implied volatilities ranged from
18 percent
to
46 percent
, with a weighted average of
25 percent
. The deferred premiums ranged from
$5.15
per Bbl to
$7.22
per Bbl, with a weighted average of
$6.35
per Bbl. Refer to Note
9
for further discussion of these derivative financial instruments
.
FCX’s derivative financial instruments for copper futures and swap contracts and copper forward contracts that are traded on the respective exchanges are classified within Level 1 of the fair value hierarchy because they are valued using quoted monthly COMEX or LME prices at each reporting date based on the month of maturity (refer to Note
9
for further discussion). Certain of these contracts are traded on the over-the-counter market and are classified within Level 2 of the fair value hierarchy based on COMEX and LME forward prices.
The fair value of warrants associated with the Plains Offshore Preferred Stock was determined with an option pricing model that used unobservable inputs. The inputs used in the valuation model are the estimated fair value of the underlying Plains Offshore common stock, expected exercise price, expected term, expected volatility and risk-free interest rate. The assumptions used in the valuation model are highly subjective because the common stock of Plains Offshore is not publicly traded. As a result, these warrants are classified within Level 3 of the fair value hierarchy. The expected volatilities ranged from
20 percent
to
54 percent
, with a weighted average of
28 percent
. Refer to Note
2
for further discussion of the Plains Offshore warrants.
Long-term debt, including the current portion, is valued using prices obtained from a readily available pricing source and, as such, is classified within Level 2 of the fair value hierarchy.
At December 31, 2012, FCX's investment in MMR's
5.75%
Convertible Perpetual Preferred Stock, Series 2 (MMR investment) was not actively traded; therefore, FCX valued its MMR investment based on a pricing simulation model that used the quoted market prices of MMR
'
s publicly traded common stock as the most significant observable input and other inputs, such as expected volatility, expected settlement date and risk-free interest rate. Therefore, this investment was classified within Level 2 of the fair value hierarchy. FCX's shares of MMR's 5.75% Convertible Perpetual Preferred Stock, Series 2 were canceled in connection with the acquisition of MMR.
28
A summary of the changes in the fair value of FCX
'
s Level 3 instruments follows (in millions):
|
Crude Oil
|
Plains Offshore
|
|||||||
|
Options
|
Warrants
|
|||||||
|
Fair value at December 31, 2012
|
$
|
—
|
|
$
|
—
|
|
||
|
Derivative financial instruments assumed in the PXP acquisition
|
(83
|
)
|
(12
|
)
|
||||
|
Net unrealized (losses) gains included in earnings related to
|
||||||||
|
assets and liabilities still held at the end of the period
|
(135
|
)
|
a
|
1
|
|
b
|
||
|
Fair value at September 30, 2013
|
$
|
(218
|
)
|
$
|
(11
|
)
|
||
|
a.
|
Realized and unrealized (losses) gains are recorded in revenue. There were no realized gains for the first nine months of
2013
.
|
|
b.
|
Realized and unrealized (losses) gains are recorded in other income. There were no realized gains for the first nine months of
2013
.
|
The techniques described above may produce a fair value calculation that may not be indicative of net realizable value or reflective of future fair values. Furthermore, while FCX believes its valuation techniques are appropriate and consistent with other market participants, the use of different techniques or assumptions to determine fair value of certain financial instruments could result in a different fair value measurement at the reporting date. There have been no changes in the techniques used at
September 30, 2013
, except for warrants (refer to Note
2
for discussion of warrants).
Refer to Note
2
for the levels within the fair value hierarchy associated with other assets acquired, liabilities assumed and redeemable noncontrolling interest related to second-quarter 2013 acquisitions.
11. NEW ACCOUNTING STANDARD
In December 2011, the Financial Accounting Standards Board (FASB) issued an ASU that requires companies to disclose information regarding offsetting and other arrangements for derivatives and other financial instruments. Additionally, in January 2013, FASB issued an ASU that limited the scope of the balance sheet offsetting disclosures to derivatives, repurchase agreements and securities lending transactions to the extent that they are (i) offset in the financial statements or (ii) subject to an enforceable master netting arrangement or similar arrangement. FCX adopted this guidance effective January 1, 2013.
12. SUBSEQUENT EVENTS
FCX evaluated events after
September 30, 2013
, and through the date the consolidated financial statements were issued, and determined any events or transactions occurring during this period that would require recognition or disclosure are appropriately addressed in these consolidated financial statements.
Environmental.
Following is an update to a previously reported environmental litigation matter included in Note 13 of FCX's annual report on Form 10-K for the year ended December 31, 2012.
Blackwell.
In October 2013, the parties to the suit entitled
Board of Commissioners of the County of Kay, Oklahoma v. Freeport-McMoRan Copper & Gold Inc., et. al.
, pending in the United States District Court for the Western District of Oklahoma, agreed in principle to settle the suit for an amount that is not material to FCX, subject to negotiation of a final agreement with the Oklahoma Department of Environmental Quality and completion of definitive settlement documents. On October 12, 2013, the court administratively dismissed the case on that basis.
Debt.
In October 2013, holders of MMR's outstanding 5¼% Convertible Senior Notes due 2013 converted their notes into merger consideration totaling
$67 million
, including cash payments of
$59 million
and
4.6 million
royalty trust units with a fair value of
$8 million
at the acquisition date.
On October 15, 2013, FCX announced its intent to redeem the
$299 million
of MMR's outstanding
11.875%
Senior Notes due 2014 on
November 15, 2013
. Holders of record will receive the principal amount together with accrued and unpaid interest. FCX expects to record a gain of
$8 million
in fourth-quarter 2013 in connection with this redemption.
29
Exploration Commitment.
FM O&G has a definitive agreement to participate in an exploration program offshore the Kingdom of Morocco. In October 2013, FM O&G obtained Moroccan government approval and made a payment of
$15 million
to farm-in to Pura Vida Energy’s
75 percent
working interest in the approximate
2.7 million
acre Mazagan permit area in the Essaouira Basin offshore Morocco. FM O&G will earn a
52 percent
working interest and act as operator in exchange for funding
100 percent
of the costs of certain specified exploration activities, including a commitment to fund and drill
two
wells, subject to a maximum commitment of
$215 million
(excluding the
$15 million
payment to Pura Vida Energy). Drilling is expected to commence late 2014 or early 2015.
13. BUSINESS SEGMENTS
Subsequent to the acquisitions of PXP and MMR, FCX has organized its operations into six primary divisions – North America copper mines, South America mining, Indonesia mining, Africa mining, Molybdenum mines and Oil & Gas operations. Notwithstanding this structure, FCX internally reports information on a mine-by-mine basis for its mining operations. Therefore, FCX concluded that its operating segments include individual mines or operations relative to its mining operations. For oil and gas operations, operating segments are determined on a country-by-country basis and all of FCX's oil and gas operations are in the U.S. Operating segments that meet certain thresholds are reportable segments.
Beginning in first-quarter 2013, the Molybdenum operations division was revised to report only FCX's two molybdenum mines in North America - the Henderson underground mine and the Climax open-pit mine, both in Colorado - as a division (
i.e.
Molybdenum mines). The molybdenum sales company and related conversion facilities are included with Other Mining & Eliminations in the following segment tables. FCX revised its segment disclosures for the
three
and
nine
months ended
September 30, 2012
, to conform with the current period presentation.
Oil & Gas Operations.
FCX's oil and gas operations include oil production facilities and growth potential in the Deepwater GOM, oil production from the onshore Eagle Ford shale play in Texas, oil production facilities onshore and offshore California, onshore natural gas resources in the Haynesville shale play in Louisiana, and a position in the emerging shallow water, ultra-deep gas trend on the Shelf of the GOM and onshore in South Louisiana. All of the operations are considered one operating segment.
Intersegment Sales.
Intersegment sales between FCX’s mining operations are based on similar arms-length transactions with third parties at the time of the sale. Intersegment sales may not be reflective of the actual prices ultimately realized because of a variety of factors, including additional processing, timing of sales to unaffiliated customers and transportation premiums.
FCX defers recognizing profits on sales from its mining operations to Atlantic Copper and on
25 percent
of PT Freeport Indonesia's sales to PT Smelting until final sales to third parties occur. Quarterly variations in ore grades, the timing of intercompany shipments and changes in product prices result in variability in FCX's net deferred profits and quarterly earnings.
Allocations.
FCX allocates certain operating costs, expenses and capital expenditures to its operating divisions and individual segments. However, not all costs and expenses applicable to an operation are allocated. U.S. federal and state income taxes are recorded and managed at the corporate level, whereas foreign income taxes are recorded and managed at the applicable country level. In addition, most mining exploration and research activities are managed at the corporate level, and those costs along with some selling, general and administrative costs are not allocated to the operating divisions or individual segments. Accordingly, the following segment information reflects management determinations that may not be indicative of what the actual financial performance of each operating division or segment would be if it was an independent entity.
30
Business Segments
|
(In millions)
|
Mining Operations
|
||||||||||||||||||||||||||||||||||||||||||||||||||||||||||||||
|
North America Copper Mines
|
South America
|
Indonesia
|
Africa
|
|
|
|
|
|
|||||||||||||||||||||||||||||||||||||||||||||||||||||||
|
|
Atlantic
|
Other
|
Corporate,
|
||||||||||||||||||||||||||||||||||||||||||||||||||||||||||||
|
Molyb-
|
Copper
|
Mining
|
Other
|
||||||||||||||||||||||||||||||||||||||||||||||||||||||||||||
|
Other
|
Cerro
|
Other
|
denum
|
Rod &
|
Smelting
|
& Elimi-
|
Total
|
Oil & Gas
|
& Elimi-
|
FCX
|
|||||||||||||||||||||||||||||||||||||||||||||||||||||
|
Morenci
|
Mines
|
Total
|
Verde
|
Mines
|
Total
|
Grasberg
|
Tenke
|
Mines
|
Refining
|
& Refining
|
nations
|
Mining
|
Operations
|
nations
|
Total
|
||||||||||||||||||||||||||||||||||||||||||||||||
|
Three Months Ended September 30, 2013
|
|
|
|
|
|
|
|
|
|
|
|
|
|
||||||||||||||||||||||||||||||||||||||||||||||||||
|
Revenues:
|
|
|
|
|
|
|
|
|
|
|
|
|
|
||||||||||||||||||||||||||||||||||||||||||||||||||
|
Unaffiliated customers
|
$
|
100
|
|
$
|
145
|
|
$
|
245
|
|
$
|
434
|
|
$
|
618
|
|
$
|
1,052
|
|
$
|
1,108
|
|
a
|
$
|
406
|
|
$
|
—
|
|
$
|
1,247
|
|
$
|
514
|
|
$
|
417
|
|
b
|
$
|
4,989
|
|
$
|
1,176
|
|
c
|
$
|
—
|
|
$
|
6,165
|
|
||||||||||||
|
Intersegment
|
375
|
|
681
|
|
1,056
|
|
27
|
|
60
|
|
87
|
|
3
|
|
14
|
|
121
|
|
6
|
|
2
|
|
(1,289
|
)
|
—
|
|
—
|
|
—
|
|
—
|
|
|||||||||||||||||||||||||||||||
|
Production and delivery
|
287
|
|
520
|
|
807
|
|
175
|
|
319
|
|
494
|
|
617
|
|
190
|
|
82
|
|
1,245
|
|
523
|
|
(916
|
)
|
3,042
|
|
288
|
|
2
|
|
3,332
|
|
|||||||||||||||||||||||||||||||
|
Depreciation, depletion and amortization
|
35
|
|
67
|
|
102
|
|
35
|
|
50
|
|
85
|
|
60
|
|
64
|
|
21
|
|
2
|
|
10
|
|
9
|
|
353
|
|
563
|
|
3
|
|
919
|
|
|||||||||||||||||||||||||||||||
|
Selling, general and administrative expenses
|
—
|
|
1
|
|
1
|
|
—
|
|
2
|
|
2
|
|
29
|
|
3
|
|
—
|
|
—
|
|
5
|
|
5
|
|
45
|
|
51
|
|
62
|
|
158
|
|
|||||||||||||||||||||||||||||||
|
Mining exploration and research expenses
|
—
|
|
2
|
|
2
|
|
—
|
|
—
|
|
—
|
|
1
|
|
—
|
|
—
|
|
—
|
|
—
|
|
52
|
|
55
|
|
—
|
|
2
|
|
57
|
|
|||||||||||||||||||||||||||||||
|
Environmental obligations and shutdown costs
|
—
|
|
5
|
|
5
|
|
—
|
|
—
|
|
—
|
|
—
|
|
—
|
|
—
|
|
—
|
|
—
|
|
(13
|
)
|
(8
|
)
|
—
|
|
—
|
|
(8
|
)
|
|||||||||||||||||||||||||||||||
|
Operating income (loss)
|
153
|
|
231
|
|
384
|
|
251
|
|
307
|
|
558
|
|
404
|
|
163
|
|
18
|
|
6
|
|
(22
|
)
|
(9
|
)
|
1,502
|
|
274
|
|
(69
|
)
|
1,707
|
|
|||||||||||||||||||||||||||||||
|
Interest expense, net
|
—
|
|
—
|
|
—
|
|
—
|
|
—
|
|
—
|
|
—
|
|
—
|
|
—
|
|
—
|
|
4
|
|
20
|
|
24
|
|
74
|
|
64
|
|
162
|
|
|||||||||||||||||||||||||||||||
|
Provision for income taxes
|
—
|
|
—
|
|
—
|
|
92
|
|
102
|
|
194
|
|
173
|
|
33
|
|
—
|
|
—
|
|
—
|
|
—
|
|
400
|
|
—
|
|
99
|
|
499
|
|
|||||||||||||||||||||||||||||||
|
Total assets at September 30, 2013
|
2,915
|
|
5,734
|
|
8,649
|
|
6,440
|
|
4,090
|
|
10,530
|
|
7,399
|
|
4,862
|
|
2,094
|
|
308
|
|
691
|
|
1,267
|
|
35,800
|
|
26,347
|
|
451
|
|
62,598
|
|
|||||||||||||||||||||||||||||||
|
Capital expenditures
|
172
|
|
80
|
|
252
|
|
224
|
|
40
|
|
264
|
|
209
|
|
52
|
|
46
|
|
1
|
|
20
|
|
51
|
|
895
|
|
738
|
|
12
|
|
1,645
|
|
|||||||||||||||||||||||||||||||
|
Three Months Ended September 30, 2012
|
|
|
|
|
|
|
|
|
|
|
|
|
|
||||||||||||||||||||||||||||||||||||||||||||||||||
|
Revenues:
|
|
|
|
|
|
|
|
|
|
|
|
|
|
||||||||||||||||||||||||||||||||||||||||||||||||||
|
Unaffiliated customers
|
$
|
39
|
|
$
|
9
|
|
$
|
48
|
|
$
|
504
|
|
$
|
491
|
|
$
|
995
|
|
$
|
845
|
|
a
|
$
|
365
|
|
$
|
—
|
|
$
|
1,221
|
|
$
|
633
|
|
$
|
309
|
|
b
|
$
|
4,416
|
|
$
|
—
|
|
$
|
1
|
|
$
|
4,417
|
|
|||||||||||||
|
Intersegment
|
456
|
|
811
|
|
1,267
|
|
71
|
|
126
|
|
197
|
|
146
|
|
2
|
|
129
|
|
7
|
|
5
|
|
(1,753
|
)
|
—
|
|
—
|
|
—
|
|
—
|
|
|||||||||||||||||||||||||||||||
|
Production and delivery
|
268
|
|
475
|
|
743
|
|
197
|
|
333
|
|
530
|
|
603
|
|
172
|
|
88
|
|
1,222
|
|
624
|
|
(1,392
|
)
|
2,590
|
|
—
|
|
2
|
|
2,592
|
|
|||||||||||||||||||||||||||||||
|
Depreciation, depletion and amortization
|
31
|
|
57
|
|
88
|
|
39
|
|
35
|
|
74
|
|
54
|
|
42
|
|
15
|
|
2
|
|
11
|
|
10
|
|
296
|
|
—
|
|
2
|
|
298
|
|
|||||||||||||||||||||||||||||||
|
Selling, general and administrative expenses
|
—
|
|
1
|
|
1
|
|
1
|
|
1
|
|
2
|
|
31
|
|
2
|
|
—
|
|
—
|
|
4
|
|
4
|
|
44
|
|
—
|
|
66
|
|
110
|
|
|||||||||||||||||||||||||||||||
|
Mining exploration and research expenses
|
1
|
|
—
|
|
1
|
|
—
|
|
—
|
|
—
|
|
—
|
|
—
|
|
—
|
|
—
|
|
—
|
|
78
|
|
79
|
|
—
|
|
—
|
|
79
|
|
|||||||||||||||||||||||||||||||
|
Environmental obligations and shutdown costs
|
—
|
|
—
|
|
—
|
|
—
|
|
—
|
|
—
|
|
—
|
|
—
|
|
—
|
|
—
|
|
—
|
|
(69
|
)
|
(69
|
)
|
—
|
|
(4
|
)
|
(73
|
)
|
|||||||||||||||||||||||||||||||
|
Operating income (loss)
|
195
|
|
287
|
|
482
|
|
338
|
|
248
|
|
586
|
|
303
|
|
151
|
|
26
|
|
4
|
|
(1
|
)
|
(75
|
)
|
1,476
|
|
—
|
|
(65
|
)
|
1,411
|
|
|||||||||||||||||||||||||||||||
|
Interest expense, net
|
1
|
|
—
|
|
1
|
|
—
|
|
—
|
|
—
|
|
—
|
|
—
|
|
—
|
|
—
|
|
3
|
|
21
|
|
25
|
|
—
|
|
17
|
|
42
|
|
|||||||||||||||||||||||||||||||
|
Provision for (benefit from) income taxes
|
—
|
|
—
|
|
—
|
|
(88
|
)
|
d
|
72
|
|
(16
|
)
|
111
|
|
28
|
|
—
|
|
—
|
|
—
|
|
—
|
|
123
|
|
—
|
|
92
|
|
215
|
|
||||||||||||||||||||||||||||||
|
Total assets at September 30, 2012
|
2,297
|
|
5,403
|
|
7,700
|
|
5,704
|
|
4,232
|
|
9,936
|
|
6,393
|
|
4,490
|
|
1,979
|
|
330
|
|
1,192
|
|
719
|
|
32,739
|
|
—
|
|
1,778
|
|
34,517
|
|
|||||||||||||||||||||||||||||||
|
Capital expenditures
|
108
|
|
164
|
|
272
|
|
180
|
|
87
|
|
267
|
|
237
|
|
131
|
|
41
|
|
2
|
|
4
|
|
15
|
|
969
|
|
—
|
|
2
|
|
971
|
|
|||||||||||||||||||||||||||||||
|
a.
|
Included PT Freeport Indonesia’s sales to PT Smelting totaling
$458 million
in
third-quarter
2013
and
$520 million
in
third-quarter
2012
.
|
|
b.
|
Included revenues from FCX's molybdenum sales company, which included sales of molybdenum produced by the molybdenum mines and by certain of the North and South America copper mines.
|
|
c.
|
Included net charges of
$158 million
for unrealized losses on oil and gas derivative contracts that were assumed in connection with FCX's acquisition of PXP. For further discussion, refer to Note 9.
|
|
d.
|
Included a credit of
$234 million
for the reversal of a net deferred tax liability. For further discussion, refer to Note 6.
|
31
|
(In millions)
|
Mining Operations
|
||||||||||||||||||||||||||||||||||||||||||||||||||||||||||||||
|
North America Copper Mines
|
South America
|
Indonesia
|
Africa
|
|
|
|
|
|
|||||||||||||||||||||||||||||||||||||||||||||||||||||||
|
Atlantic
|
Other
|
Corporate,
|
|||||||||||||||||||||||||||||||||||||||||||||||||||||||||||||
|
Molyb-
|
Copper
|
Mining
|
Other
|
||||||||||||||||||||||||||||||||||||||||||||||||||||||||||||
|
Other
|
Cerro
|
Other
|
denum
|
Rod &
|
Smelting
|
& Elimi-
|
Total
|
Oil & Gas
|
& Elimi-
|
FCX
|
|||||||||||||||||||||||||||||||||||||||||||||||||||||
|
Morenci
|
Mines
|
Total
|
Verde
|
Mines
|
Total
|
Grasberg
|
Tenke
|
Mines
|
Refining
|
& Refining
|
nations
|
Mining
|
Operations
|
nations
|
Total
|
||||||||||||||||||||||||||||||||||||||||||||||||
|
Nine Months Ended September 30, 2013
|
|
|
|
|
|
|
|
|
|
|
|
|
|
||||||||||||||||||||||||||||||||||||||||||||||||||
|
Revenues:
|
|
|
|
|
|
|
|
|
|
|
|
|
|
||||||||||||||||||||||||||||||||||||||||||||||||||
|
Unaffiliated customers
|
$
|
218
|
|
$
|
266
|
|
$
|
484
|
|
$
|
1,035
|
|
$
|
1,631
|
|
$
|
2,666
|
|
$
|
2,443
|
|
a
|
$
|
1,199
|
|
$
|
—
|
|
$
|
3,842
|
|
$
|
1,730
|
|
$
|
1,157
|
|
b
|
$
|
13,521
|
|
$
|
1,512
|
|
c
|
$
|
3
|
|
$
|
15,036
|
|
||||||||||||
|
Intersegment
|
1,255
|
|
2,256
|
|
3,511
|
|
222
|
|
216
|
|
438
|
|
190
|
|
24
|
|
408
|
|
20
|
|
12
|
|
(4,603
|
)
|
—
|
|
—
|
|
—
|
|
—
|
|
|||||||||||||||||||||||||||||||
|
Production and delivery
|
885
|
|
1,574
|
|
2,459
|
|
535
|
|
950
|
|
1,485
|
|
1,743
|
|
560
|
|
240
|
|
3,835
|
|
1,726
|
|
(3,531
|
)
|
8,517
|
|
377
|
|
10
|
|
8,904
|
|
|||||||||||||||||||||||||||||||
|
Depreciation, depletion and amortization
|
105
|
|
207
|
|
312
|
|
105
|
|
137
|
|
242
|
|
173
|
|
179
|
|
62
|
|
7
|
|
32
|
|
31
|
|
1,038
|
|
732
|
|
8
|
|
1,778
|
|
|||||||||||||||||||||||||||||||
|
Selling, general and administrative expenses
|
1
|
|
3
|
|
4
|
|
2
|
|
3
|
|
5
|
|
82
|
|
9
|
|
—
|
|
—
|
|
14
|
|
23
|
|
137
|
|
65
|
|
255
|
|
457
|
|
|||||||||||||||||||||||||||||||
|
Mining exploration and research expenses
|
—
|
|
3
|
|
3
|
|
—
|
|
—
|
|
—
|
|
1
|
|
—
|
|
—
|
|
—
|
|
—
|
|
161
|
|
165
|
|
—
|
|
8
|
|
173
|
|
|||||||||||||||||||||||||||||||
|
Environmental obligations and shutdown costs
|
—
|
|
(1
|
)
|
(1
|
)
|
—
|
|
—
|
|
—
|
|
—
|
|
—
|
|
—
|
|
—
|
|
—
|
|
24
|
|
23
|
|
—
|
|
—
|
|
23
|
|
|||||||||||||||||||||||||||||||
|
Operating income (loss)
|
482
|
|
736
|
|
1,218
|
|
615
|
|
757
|
|
1,372
|
|
634
|
|
475
|
|
106
|
|
20
|
|
(30
|
)
|
(154
|
)
|
3,641
|
|
338
|
|
(278
|
)
|
3,701
|
|
|||||||||||||||||||||||||||||||
|
Interest expense, net
|
3
|
|
1
|
|
4
|
|
2
|
|
—
|
|
2
|
|
12
|
|
2
|
|
—
|
|
—
|
|
12
|
|
60
|
|
92
|
|
100
|
|
159
|
|
351
|
|
|||||||||||||||||||||||||||||||
|
Provision for income taxes
|
—
|
|
—
|
|
—
|
|
215
|
|
257
|
|
472
|
|
289
|
|
99
|
|
—
|
|
—
|
|
—
|
|
—
|
|
860
|
|
—
|
|
107
|
|
d
|
967
|
|
||||||||||||||||||||||||||||||
|
Capital expenditures
|
529
|
|
266
|
|
795
|
|
596
|
|
138
|
|
734
|
|
720
|
|
155
|
|
128
|
|
3
|
|
39
|
|
91
|
|
2,665
|
|
928
|
|
30
|
|
3,623
|
|
|||||||||||||||||||||||||||||||
|
Nine Months Ended September 30, 2012
|
|
|
|
|
|
|
|
|
|
|
|
|
|
||||||||||||||||||||||||||||||||||||||||||||||||||
|
Revenues:
|
|
|
|
|
|
|
|
|
|
|
|
|
|
||||||||||||||||||||||||||||||||||||||||||||||||||
|
Unaffiliated customers
|
$
|
157
|
|
$
|
20
|
|
$
|
177
|
|
$
|
1,285
|
|
$
|
1,563
|
|
$
|
2,848
|
|
$
|
2,673
|
|
a
|
$
|
985
|
|
$
|
—
|
|
$
|
3,802
|
|
$
|
2,023
|
|
$
|
984
|
|
b
|
$
|
13,492
|
|
$
|
—
|
|
$
|
5
|
|
$
|
13,497
|
|
|||||||||||||
|
Intersegment
|
1,374
|
|
2,646
|
|
4,020
|
|
349
|
|
265
|
|
614
|
|
224
|
|
9
|
|
389
|
|
20
|
|
22
|
|
(5,298
|
)
|
—
|
|
—
|
|
—
|
|
—
|
|
|||||||||||||||||||||||||||||||
|
Production and delivery
|
803
|
|
1,387
|
|
2,190
|
|
575
|
|
908
|
|
1,483
|
|
1,704
|
|
456
|
|
237
|
|
3,800
|
|
1,988
|
|
(4,218
|
)
|
7,640
|
|
—
|
|
2
|
|
7,642
|
|
|||||||||||||||||||||||||||||||
|
Depreciation, depletion and amortization
|
95
|
|
179
|
|
274
|
|
102
|
|
106
|
|
208
|
|
153
|
|
114
|
|
38
|
|
7
|
|
31
|
|
25
|
|
850
|
|
—
|
|
6
|
|
856
|
|
|||||||||||||||||||||||||||||||
|
Selling, general and administrative expenses
|
1
|
|
2
|
|
3
|
|
2
|
|
3
|
|
5
|
|
91
|
|
5
|
|
—
|
|
—
|
|
14
|
|
12
|
|
130
|
|
—
|
|
181
|
|
311
|
|
|||||||||||||||||||||||||||||||
|
Mining exploration and research expenses
|
1
|
|
—
|
|
1
|
|
—
|
|
—
|
|
—
|
|
—
|
|
—
|
|
—
|
|
—
|
|
—
|
|
213
|
|
214
|
|
—
|
|
—
|
|
214
|
|
|||||||||||||||||||||||||||||||
|
Environmental obligations and shutdown costs
|
—
|
|
—
|
|
—
|
|
—
|
|
—
|
|
—
|
|
—
|
|
—
|
|
—
|
|
—
|
|
—
|
|
22
|
|
22
|
|
(4
|
)
|
18
|
|
|||||||||||||||||||||||||||||||||
|
Operating income (loss)
|
631
|
|
1,098
|
|
1,729
|
|
955
|
|
811
|
|
1,766
|
|
949
|
|
419
|
|
114
|
|
15
|
|
12
|
|
(368
|
)
|
4,636
|
|
—
|
|
(180
|
)
|
4,456
|
|
|||||||||||||||||||||||||||||||
|
Interest expense, net
|
1
|
|
—
|
|
1
|
|
5
|
|
—
|
|
5
|
|
3
|
|
—
|
|
—
|
|
—
|
|
9
|
|
63
|
|
81
|
|
—
|
|
67
|
|
148
|
|
|||||||||||||||||||||||||||||||
|
Provision for income taxes
|
—
|
|
—
|
|
—
|
|
131
|
|
e
|
244
|
|
375
|
|
387
|
|
79
|
|
—
|
|
—
|
|
—
|
|
—
|
|
841
|
|
—
|
|
287
|
|
1,128
|
|
||||||||||||||||||||||||||||||
|
Capital expenditures
|
204
|
|
364
|
|
568
|
|
365
|
|
294
|
|
659
|
|
624
|
|
428
|
|
189
|
|
5
|
|
11
|
|
41
|
|
2,525
|
|
—
|
|
(7
|
)
|
2,518
|
|
|||||||||||||||||||||||||||||||
|
a.
|
Included PT Freeport Indonesia’s sales to PT Smelting totaling
$1.2 billion
for the
first nine months of
2013
and
$1.5 billion
for the
first nine months of
2012
.
|
|
b.
|
Included revenues from FCX's molybdenum sales company, which included sales of molybdenum produced by the molybdenum mines and by certain of the North and South America copper mines.
|
|
c.
|
Included net charges of
$194 million
for unrealized losses on oil and gas derivative contracts that were assumed in connection with FCX's acquisition of PXP. For further discussion, refer to Note 9.
|
|
d.
|
Included
$183 million
of net benefits resulting from second-quarter 2013 oil and gas acquisitions.
|
|
e.
|
Included a credit of
$234 million
for the reversal of a net deferred tax liability. For further discussion, refer to Note 6.
|
32
14. GUARANTOR FINANCIAL STATEMENTS
As further discussed in Note 7, in March 2013, FCX completed the sale of
$6.5 billion
of senior notes. These notes, along with FCX's senior notes sold in February 2012, are fully and unconditionally guaranteed on a senior basis jointly and severally by FM O&G LLC, as guarantor, which is a
100 percent
owned subsidiary of FCX. The guarantee is an unsecured obligation of the guarantor and ranks equal in right of payment with all existing and future indebtedness of FCX, including indebtedness under the revolving credit facility. The guarantee ranks senior in right of payment with all future subordinated obligations and is effectively subordinated in right of payment to any debt of FCX's subsidiaries that are not subsidiary guarantors.
The following condensed consolidating financial information includes information regarding FCX, as issuer, FM O&G LLC, as guarantor, and all other non-guarantor subsidiaries of FCX. Included are the condensed consolidating balance sheet at
September 30, 2013
, and the related condensed consolidating statements of income for the
three
and
nine
months ended
September 30, 2013
, and the condensed consolidating statement of cash flows for the
nine
months ended
September 30, 2013
, which should be read in conjunction with FCX's notes to the consolidated financial statements:
FREEPORT-McMoRan COPPER & GOLD INC.
September 30, 2013
(In millions)
|
FCX
|
FM O&G LLC
|
Non-guarantor
|
Consolidated
|
||||||||||||||||
|
Issuer
|
Guarantor
|
Subsidiaries
|
Eliminations
|
FCX
|
|||||||||||||||
|
ASSETS
|
|||||||||||||||||||
|
Current assets:
|
|||||||||||||||||||
|
Cash and cash equivalents
|
$
|
—
|
|
$
|
2
|
|
$
|
2,217
|
|
$
|
—
|
|
$
|
2,219
|
|
||||
|
Accounts receivable
|
706
|
|
964
|
|
1,966
|
|
(1,407
|
)
|
2,229
|
|
|||||||||
|
Inventories
|
—
|
|
18
|
|
4,835
|
|
—
|
|
4,853
|
|
|||||||||
|
Other current assets
|
49
|
|
31
|
|
225
|
|
—
|
|
305
|
|
|||||||||
|
Total current assets
|
755
|
|
1,015
|
|
9,243
|
|
(1,407
|
)
|
9,606
|
|
|||||||||
|
Property, plant, equipment and
|
|||||||||||||||||||
|
development costs, net
|
28
|
|
8,865
|
|
37,754
|
|
—
|
|
46,647
|
|
|||||||||
|
Investment in consolidated subsidiaries
|
30,314
|
|
9,596
|
|
—
|
|
(39,910
|
)
|
—
|
|
|||||||||
|
Goodwill
|
—
|
|
455
|
|
1,477
|
|
—
|
|
1,932
|
|
|||||||||
|
Other assets
|
7,448
|
|
4,219
|
|
4,401
|
|
(11,655
|
)
|
4,413
|
|
|||||||||
|
Total assets
|
$
|
38,545
|
|
$
|
24,150
|
|
$
|
52,875
|
|
$
|
(52,972
|
)
|
$
|
62,598
|
|
||||
|
LIABILITIES AND EQUITY
|
|||||||||||||||||||
|
Current liabilities
|
$
|
911
|
|
$
|
726
|
|
$
|
4,268
|
|
$
|
(1,407
|
)
|
$
|
4,498
|
|
||||
|
Long-term debt, less current portion
|
13,484
|
|
10,049
|
|
5,421
|
|
(7,901
|
)
|
21,053
|
|
|||||||||
|
Deferred income taxes
a
|
3,718
|
|
—
|
|
3,204
|
|
—
|
|
6,922
|
|
|||||||||
|
Reclamation and environmental obligations,
|
|||||||||||||||||||
|
less current portion
|
—
|
|
281
|
|
2,796
|
|
—
|
|
3,077
|
|
|||||||||
|
Other liabilities
|
27
|
|
3,447
|
|
2,054
|
|
(3,754
|
)
|
1,774
|
|
|||||||||
|
Total liabilities
|
18,140
|
|
14,503
|
|
17,743
|
|
(13,062
|
)
|
37,324
|
|
|||||||||
|
Redeemable noncontrolling interest
|
—
|
|
—
|
|
720
|
|
—
|
|
720
|
|
|||||||||
|
Equity:
|
|||||||||||||||||||
|
Stockholders' equity
|
20,405
|
|
9,647
|
|
30,684
|
|
(40,331
|
)
|
20,405
|
|
|||||||||
|
Noncontrolling interests
|
—
|
|
—
|
|
3,728
|
|
421
|
|
4,149
|
|
|||||||||
|
Total equity
|
20,405
|
|
9,647
|
|
34,412
|
|
(39,910
|
)
|
24,554
|
|
|||||||||
|
Total liabilities and equity
|
$
|
38,545
|
|
$
|
24,150
|
|
$
|
52,875
|
|
$
|
(52,972
|
)
|
$
|
62,598
|
|
||||
|
a.
|
All U.S. related deferred income taxes are recorded at the parent company.
|
33
FREEPORT-McMoRan COPPER & GOLD INC.
Three and Nine Months Ended September 30, 2013
(In millions)
|
Three Months Ended September 30, 2013
|
|||||||||||||||||||
|
FCX
|
FM O&G LLC
|
Non-guarantor
|
Consolidated
|
||||||||||||||||
|
Issuer
|
Guarantor
|
Subsidiaries
|
Eliminations
|
FCX
|
|||||||||||||||
|
Revenues
|
$
|
—
|
|
$
|
512
|
|
$
|
5,653
|
|
$
|
—
|
|
$
|
6,165
|
|
||||
|
Cost of sales
|
1
|
|
415
|
|
3,835
|
|
—
|
|
4,251
|
|
|||||||||
|
Other operating costs and expenses
|
10
|
|
37
|
|
160
|
|
—
|
|
207
|
|
|||||||||
|
Total costs and expenses
|
11
|
|
452
|
|
3,995
|
|
—
|
|
4,458
|
|
|||||||||
|
Operating (loss) income
|
(11
|
)
|
60
|
|
1,658
|
|
—
|
|
1,707
|
|
|||||||||
|
Interest expense, net
|
(94
|
)
|
(51
|
)
|
(40
|
)
|
23
|
|
(162
|
)
|
|||||||||
|
Other income (expense), net
|
24
|
|
—
|
|
2
|
|
(23
|
)
|
3
|
|
|||||||||
|
(Loss) income before income taxes and equity
|
|||||||||||||||||||
|
in affiliated companies' net earnings (losses)
|
(81
|
)
|
9
|
|
1,620
|
|
—
|
|
1,548
|
|
|||||||||
|
Benefit from (provision for) income taxes
|
35
|
|
(5
|
)
|
(529
|
)
|
—
|
|
(499
|
)
|
|||||||||
|
Equity in affiliated companies' net earnings (losses)
|
867
|
|
187
|
|
47
|
|
(1,102
|
)
|
(1
|
)
|
|||||||||
|
Net income (loss)
|
821
|
|
191
|
|
1,138
|
|
(1,102
|
)
|
1,048
|
|
|||||||||
|
Net income and preferred dividends attributable to noncontrolling interests
|
—
|
|
—
|
|
(202
|
)
|
(25
|
)
|
(227
|
)
|
|||||||||
|
Net income (loss) attributable to FCX
|
|||||||||||||||||||
|
common stockholders
|
$
|
821
|
|
$
|
191
|
|
$
|
936
|
|
$
|
(1,127
|
)
|
$
|
821
|
|
||||
|
Nine Months Ended September 30, 2013
|
|||||||||||||||||||
|
FCX
|
FM O&G LLC
|
Non-guarantor
|
Consolidated
|
||||||||||||||||
|
Issuer
|
Guarantor
|
Subsidiaries
|
Eliminations
|
FCX
|
|||||||||||||||
|
Revenues
|
$
|
—
|
|
$
|
674
|
|
$
|
14,362
|
|
$
|
—
|
|
$
|
15,036
|
|
||||
|
Cost of sales
|
2
|
|
541
|
|
10,139
|
|
—
|
|
10,682
|
|
|||||||||
|
Other operating costs and expenses
|
104
|
|
46
|
|
503
|
|
—
|
|
653
|
|
|||||||||
|
Total costs and expenses
|
106
|
|
587
|
|
10,642
|
|
—
|
|
11,335
|
|
|||||||||
|
Operating (loss) income
|
(106
|
)
|
87
|
|
3,720
|
|
—
|
|
3,701
|
|
|||||||||
|
Interest expense, net
|
(222
|
)
|
(63
|
)
|
(104
|
)
|
38
|
|
(351
|
)
|
|||||||||
|
Losses on early extinguishment of debt
|
(45
|
)
|
—
|
|
—
|
|
—
|
|
(45
|
)
|
|||||||||
|
Gain on investment in MMR
|
128
|
|
—
|
|
—
|
|
—
|
|
128
|
|
|||||||||
|
Other income (expense), net
|
39
|
|
—
|
|
12
|
|
(38
|
)
|
13
|
|
|||||||||
|
(Loss) income before income taxes and equity
|
|||||||||||||||||||
|
in affiliated companies' net earnings (losses)
|
(206
|
)
|
24
|
|
3,628
|
|
—
|
|
3,446
|
|
|||||||||
|
Benefit from (provision for) income taxes
|
61
|
|
(10
|
)
|
(1,018
|
)
|
—
|
|
(967
|
)
|
|||||||||
|
Equity in affiliated companies' net earnings (losses)
|
2,096
|
|
207
|
|
1
|
|
(2,301
|
)
|
3
|
|
|||||||||
|
Net income (loss)
|
1,951
|
|
221
|
|
2,611
|
|
(2,301
|
)
|
2,482
|
|
|||||||||
|
Net income and preferred dividends attributable to noncontrolling interests
|
—
|
|
—
|
|
(494
|
)
|
(37
|
)
|
(531
|
)
|
|||||||||
|
Net income (loss) attributable to FCX
|
|||||||||||||||||||
|
common stockholders
|
$
|
1,951
|
|
$
|
221
|
|
$
|
2,117
|
|
$
|
(2,338
|
)
|
$
|
1,951
|
|
||||
34
FREEPORT-McMoRan COPPER & GOLD INC.
Nine Months Ended September 30, 2013
(In millions)
|
FCX
|
FM O&G LLC
|
Non-guarantor
|
Consolidated
|
||||||||||||||||
|
Issuer
|
Guarantor
|
Subsidiaries
|
Eliminations
|
FCX
|
|||||||||||||||
|
Cash flow from operating activities:
|
|||||||||||||||||||
|
Net income (loss)
|
$
|
1,951
|
|
$
|
221
|
|
$
|
2,611
|
|
$
|
(2,301
|
)
|
$
|
2,482
|
|
||||
|
Adjustments to reconcile net income (loss) to net
|
|||||||||||||||||||
|
cash provided by operating activities:
|
|||||||||||||||||||
|
Depreciation, depletion and amortization
|
3
|
|
341
|
|
1,434
|
|
—
|
|
1,778
|
|
|||||||||
|
Net losses on oil and gas derivative contracts
|
—
|
|
205
|
|
—
|
|
—
|
|
205
|
|
|||||||||
|
Losses on early extinguishment of debt
|
45
|
|
—
|
|
—
|
|
—
|
|
45
|
|
|||||||||
|
Gain on investment in MMR
|
(128
|
)
|
—
|
|
—
|
|
—
|
|
(128
|
)
|
|||||||||
|
Equity in earnings of consolidated subsidiaries
|
(2,096
|
)
|
(207
|
)
|
2
|
|
2,301
|
|
—
|
|
|||||||||
|
Other, net
|
8
|
|
(15
|
)
|
(143
|
)
|
—
|
|
(150
|
)
|
|||||||||
|
(Increases) decreases in working capital and other tax
|
|||||||||||||||||||
|
payments, excluding amounts from the acquisitions:
|
|||||||||||||||||||
|
Accounts receivable, inventories and other
|
|||||||||||||||||||
|
current assets
|
89
|
|
30
|
|
28
|
|
—
|
|
147
|
|
|||||||||
|
Accounts payable, accrued liabilities and accrued
|
|||||||||||||||||||
|
income taxes and other tax payments
|
23
|
|
488
|
|
(1,147
|
)
|
—
|
|
(636
|
)
|
|||||||||
|
Net cash (used in) provided by operating activities
|
(105
|
)
|
1,063
|
|
2,785
|
|
—
|
|
3,743
|
|
|||||||||
|
Cash flow from investing activities:
|
|||||||||||||||||||
|
Capital expenditures
|
—
|
|
(621
|
)
|
(3,002
|
)
|
—
|
|
(3,623
|
)
|
|||||||||
|
Acquisitions, net of cash acquired
|
(5,437
|
)
|
—
|
|
(4
|
)
|
—
|
|
(5,441
|
)
|
|||||||||
|
Intercompany loans
|
793
|
|
—
|
|
(1,095
|
)
|
302
|
|
—
|
|
|||||||||
|
Dividends from consolidated subsidiary
|
321
|
|
—
|
|
—
|
|
(321
|
)
|
—
|
|
|||||||||
|
Other, net
|
14
|
|
32
|
|
(70
|
)
|
—
|
|
(24
|
)
|
|||||||||
|
Net cash (used in) provided by investing activities
|
(4,309
|
)
|
(589
|
)
|
(4,171
|
)
|
(19
|
)
|
(9,088
|
)
|
|||||||||
|
Cash flow from financing activities:
|
|||||||||||||||||||
|
Proceeds from debt
|
11,085
|
|
—
|
|
144
|
|
—
|
|
11,229
|
|
|||||||||
|
Repayments of debt and redemption of MMR preferred stock
|
(4,501
|
)
|
(416
|
)
|
(126
|
)
|
—
|
|
(5,043
|
)
|
|||||||||
|
Intercompany loans
|
—
|
|
(56
|
)
|
358
|
|
(302
|
)
|
—
|
|
|||||||||
|
Cash dividends paid:
|
|||||||||||||||||||
|
Common stock
|
(1,957
|
)
|
—
|
|
(321
|
)
|
321
|
|
(1,957
|
)
|
|||||||||
|
Noncontrolling interests
|
—
|
|
—
|
|
(157
|
)
|
—
|
|
(157
|
)
|
|||||||||
|
Other, net
|
(213
|
)
|
—
|
|
—
|
|
—
|
|
(213
|
)
|
|||||||||
|
Net cash provided by (used in) financing activities
|
4,414
|
|
(472
|
)
|
(102
|
)
|
19
|
|
3,859
|
|
|||||||||
|
Net increase (decrease) in cash and cash equivalents
|
—
|
|
2
|
|
(1,488
|
)
|
—
|
|
(1,486
|
)
|
|||||||||
|
Cash and cash equivalents at beginning of period
|
—
|
|
—
|
|
3,705
|
|
—
|
|
3,705
|
|
|||||||||
|
Cash and cash equivalents at end of period
|
$
|
—
|
|
$
|
2
|
|
$
|
2,217
|
|
$
|
—
|
|
$
|
2,219
|
|
||||
35
REPORT OF INDEPENDENT REGISTERED PUBLIC ACCOUNTING FIRM
TO THE BOARD OF DIRECTORS AND STOCKHOLDERS OF
FREEPORT-McMoRan COPPER & GOLD INC.
We have reviewed the condensed consolidated balance sheet of Freeport-McMoRan Copper & Gold Inc. as of
September 30, 2013
, and the related consolidated statements of income and comprehensive income for the
three
- and
nine
-month periods ended
September 30, 2013
and
2012
, the consolidated statements of cash flows for the
nine
-month periods ended
September 30, 2013
and
2012
, and the consolidated statement of equity for the
nine
-month period ended
September 30, 2013
. These financial statements are the responsibility of the Company’s management.
We conducted our review in accordance with the standards of the Public Company Accounting Oversight Board (United States). A review of interim financial information consists principally of applying analytical procedures and making inquiries of persons responsible for financial and accounting matters. It is substantially less in scope than an audit conducted in accordance with the standards of the Public Company Accounting Oversight Board (United States), the objective of which is the expression of an opinion regarding the financial statements taken as a whole. Accordingly, we do not express such an opinion.
Based on our review, we are not aware of any material modifications that should be made to the condensed consolidated financial statements referred to above for them to be in conformity with U.S. generally accepted accounting principles.
We have previously audited, in accordance with the standards of the Public Company Accounting Oversight Board (United States), the consolidated balance sheet of Freeport-McMoRan Copper & Gold Inc. as of
December 31, 2012
, and the related consolidated statements of income, comprehensive income, cash flows, and equity for the year then ended (not presented herein), and we expressed an unqualified audit opinion on those consolidated financial statements in our report dated February 22, 2013. In our opinion, the accompanying condensed consolidated balance sheet of Freeport-McMoRan Copper & Gold Inc. as of
December 31, 2012
, is fairly stated, in all material respects, in relation to the consolidated balance sheet from which it has been derived.
/s/ ERNST & YOUNG LLP
Phoenix, Arizona
November 6, 2013
36
|
Item 2.
|
Management's Discussion and Analysis of Financial Condition and Results of Operations.
|
In Management’s Discussion and Analysis of Financial Condition and Results of Operations, “we,” “us” and “our” refer to Freeport-McMoRan Copper & Gold Inc. (FCX) and its consolidated subsidiaries. You should read this discussion in conjunction with our financial statements, the related Management’s Discussion and Analysis of Financial Condition and Results of Operations and the discussion of our Business and Properties in our annual report on Form 10-K for the year ended
December 31, 2012
, filed with the United States (U.S.) Securities and Exchange Commission (SEC). The results of operations reported and summarized below are not necessarily indicative of future operating results (refer to "Cautionary Statement" for further discussion). In particular, the financial results for the first nine months of 2013 include the results of Freeport-McMoRan Oil & Gas (FM O&G) only since June 1, 2013. References to “Notes” are Notes included in our Notes to Consolidated Financial Statements. Throughout Management's Discussion and Analysis of Financial Condition and Results of Operations all references to earnings or losses per share are on a diluted basis, unless otherwise noted.
OVERVIEW
During second-quarter 2013, we completed the acquisitions of Plains Exploration & Production Company (PXP) and McMoRan Exploration Co. (MMR). Refer to Note
2
for further discussion of the oil and gas acquisitions, including a summary of the preliminary purchase price allocations. With these acquisitions, we are a premier U.S.-based natural resource company with an industry leading global portfolio of mineral assets, significant oil and gas resources and a growing production profile. We are the world's largest publicly traded copper producer. Our portfolio of assets includes the Grasberg minerals district in Indonesia, one of the world's largest copper and gold deposits, significant mining operations in North and South America, the Tenke Fungurume (Tenke) minerals district in the Democratic Republic of Congo (DRC) and significant oil and natural gas assets in North America, including reserves in the Deepwater Gulf of Mexico (GOM), onshore and offshore California and in the Eagle Ford and Haynesville shale plays, and an industry leading position in the emerging shallow water, ultra-deep gas trend on the Shelf of the GOM and onshore in South Louisiana.
Our results for the
third quarter
and first
nine
months of
2013
, compared with the
2012
periods, primarily benefited from higher copper sales volumes, partly offset by lower metals price realizations, and include the results of FM O&G beginning June 1, 2013. Third-quarter 2013 results also benefited from higher gold sales volumes in Indonesia. Refer to "Consolidated Results" for further discussion of our consolidated financial results for the
three
- and
nine
-month periods ended
September 30, 2013
, and
2012
.
At
September 30, 2013
, we had
$2.2 billion
in consolidated cash and cash equivalents and
$21.1 billion
in total debt, including $10.5 billion of acquisition-related debt and $7.1 billion of debt assumed in connection with the oil and gas acquisitions. Refer to Note
7
and "Capital Resources and Liquidity" for further discussion.
We are taking steps to achieve significant reductions and deferrals of capital expenditures, operating, exploration and other costs. Refer to "Capital Resources and Liquidity" for further discussion.
At current copper and oil prices, we expect to produce significant operating cash flows, and to use our cash to invest in our development projects, reduce debt and return cash to shareholders through dividends on our common stock.
OUTLOOK
We view the long-term outlook for our business positively, supported by limitations on supplies of copper and oil and by the requirements for copper and oil in the world’s economy. Our financial results vary as a result of fluctuations in market prices primarily for copper, gold, molybdenum and oil, as well as other factors. World market prices for these commodities have fluctuated historically and are affected by numerous factors beyond our control. Because we cannot control the price of our products, the key measures that management focuses on in operating our business are sales volumes, unit net cash costs for our mining operations, cash production costs per barrel of oil equivalent (BOE) for our oil and gas operations and operating cash flow. Discussion of the outlook for each of these measures follows.
37
Sales Volumes.
Following are our projected consolidated sales volumes for
2013
:
|
Copper
(millions of recoverable pounds):
|
|
||
|
North America copper mines
|
1,440
|
|
|
|
South America mining
|
1,300
|
|
|
|
Indonesia mining
|
860
|
|
|
|
Africa mining
|
460
|
|
|
|
|
4,060
|
|
|
|
Gold
(millions of recoverable ounces):
|
|
||
|
Indonesia mining
|
1.0
|
|
|
|
North and South America mining
|
0.1
|
|
|
|
|
1.1
|
|
|
|
Molybdenum
(millions of recoverable pounds)
a
|
92
|
|
|
|
Oil Equivalents
(million BOE, or MMBOE)
b
|
37.5
|
|
|
|
a.
|
Projected molybdenum sales include
48 million
pounds produced at our molybdenum mines and
44 million
pounds produced at our North and South America copper mines.
|
|
b.
|
Reflects projected sales of oil and gas for the period June 1, 2013, to December 31, 2013.
|
Consolidated sales for
fourth-quarter
2013
are expected to approximate
1.1 billion
pounds of copper,
390 thousand
ounces of gold,
21 million
pounds of molybdenum and
16
MMBOE. Projected sales volumes are dependent on a number of factors, including operational performance, the impact of weather conditions and other factors.
Mining Unit Net Cash Costs.
Assuming average prices of
$1,300
per ounce of gold and
$9.50
per pound of molybdenum for
fourth-quarter
2013
, and achievement of current sales volume and cost estimates, consolidated unit net cash costs (net of by-product credits) for our copper mining operations are expected to average
$1.58
per pound of copper for
2013
. Quarterly unit net cash costs vary with fluctuations in sales volumes and average realized prices (primarily gold and molybdenum prices). Unit net cash costs are expected to decline in 2014, compared to the 2013 average, as we gain access to higher grade ore in Indonesia. Refer to “Consolidated Results – Production and Delivery Costs” for further discussion of consolidated production and delivery costs for our mining operations.
Oil and Gas Cash Production Costs per BOE.
Based on current sales volume and cost estimates for
fourth-quarter
2013
, cash production costs per BOE are expected to approximate
$17
per BOE for the period from June 1, 2013 to December 31,
2013
. Refer to “Operations – Oil and Gas” for further discussion of oil and gas production and delivery costs.
Operating Cash Flow.
Our operating cash flows vary with prices realized from copper, gold, molybdenum and oil sales, our sales volumes, production costs, income taxes and other working capital changes and other factors. Based on current sales volume and cost estimates and assuming average prices of
$3.25
per pound of copper,
$1,300
per ounce of gold,
$9.50
per pound of molybdenum and
$110
per barrel of Brent crude oil for
fourth-quarter
2013
, consolidated operating cash flows are estimated to approximate
$6 billion
(net of
$0.3 billion
in net working capital uses and changes in other tax payments) for the year
2013
. Projected operating cash flows for the year
2013
also reflect estimated taxes of
$1.5 billion
, which is net of a net income tax benefit of
$183 million
for acquisition related adjustments (refer to “Consolidated Results – Provision for Income Taxes” for further discussion of our projected consolidated effective annual tax rate for
2013
). The impact of price changes during
fourth-quarter
2013
on operating cash flows would approximate
$90 million
for each
$0.10
per pound change in the average price of copper,
$15 million
for each
$50
per ounce change in the average price of gold,
$15 million
for each
$2
per pound change in the average price of molybdenum and
$30 million
for each
$5
per barrel change in the price of Brent crude oil between $100 per barrel and $125 per barrel.
38
MARKETS
Metals.
World prices for copper, gold and molybdenum can fluctuate significantly. During the period from January 2003 through October
2013
, the London Metal Exchange (LME) spot copper price varied from a low of
$0.70
per pound in 2003 to a record high of
$4.60
per pound in 2011, the London Bullion Market Association (London) PM gold price fluctuated from a low of
$320
per ounce in 2003 to a record high of
$1,895
per ounce in 2011, and the
Metals Week
Molybdenum Dealer Oxide weekly average price ranged from a low of
$3.28
per pound in 2003 to a record high of
$39.25
per pound in 2005. Copper, gold and molybdenum prices are affected by numerous factors beyond our control as described further in our “Risk Factors” contained in Part I, Item 1A of our annual report on Form 10-K for the year ended
December 31, 2012
, as updated by our subsequent SEC filings.
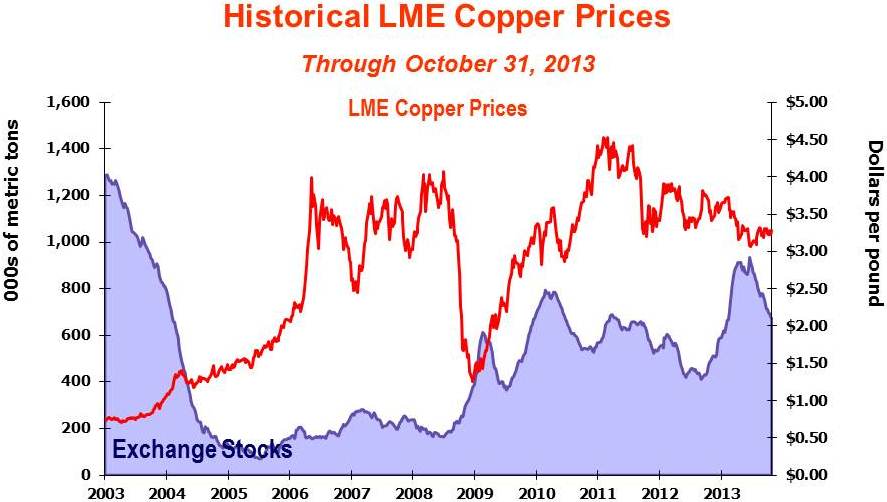
This graph presents LME spot copper prices and the combined reported stocks of copper at the LME, Commodity Exchange Inc. (COMEX), a division of the New York Mercantile Exchange (NYMEX), and the Shanghai Futures Exchange from January 2003 through October
2013
. From 2006 through most of 2008, limited supplies, combined with growing demand from China and other emerging economies, resulted in high copper prices and low levels of inventories. In late 2008, slowing consumption, turmoil in the U.S. financial markets and concerns about the global economy led to a sharp decline in copper prices, which reached a low of $1.26 per pound in December 2008. Higher copper prices since that time are attributable to a combination of demand from developing economies and pro-growth monetary and fiscal policy decisions in Europe, China and the U.S. During
third-quarter
2013
, LME spot copper prices ranged from a low of
$3.05
per pound to a high of
$3.33
per pound, averaged
$3.21
per pound, and closed at
$3.31
per pound on
September 30, 2013
.
We believe the underlying long-term fundamentals of the copper business remain positive, supported by the significant role of copper in the global economy and a challenging long-term supply environment. Future copper prices are expected to be volatile and are likely to be influenced by demand from China and emerging markets, economic activity in the U.S. and other industrialized countries, the timing of the development of new supplies of copper and production levels of mines and copper smelters. LME spot copper prices closed at
$3.28
per pound on
October 31, 2013
.
39

This graph presents London PM gold prices from January 2003 through October
2013
. During
third-quarter
2013
, gold prices ranged from a low of
$1,213
per ounce to a high of
$1,420
per ounce, averaged
$1,326
per ounce and closed at
$1,327
per ounce on
September 30, 2013
. Gold prices closed at
$1,324
per ounce on
October 31, 2013
.
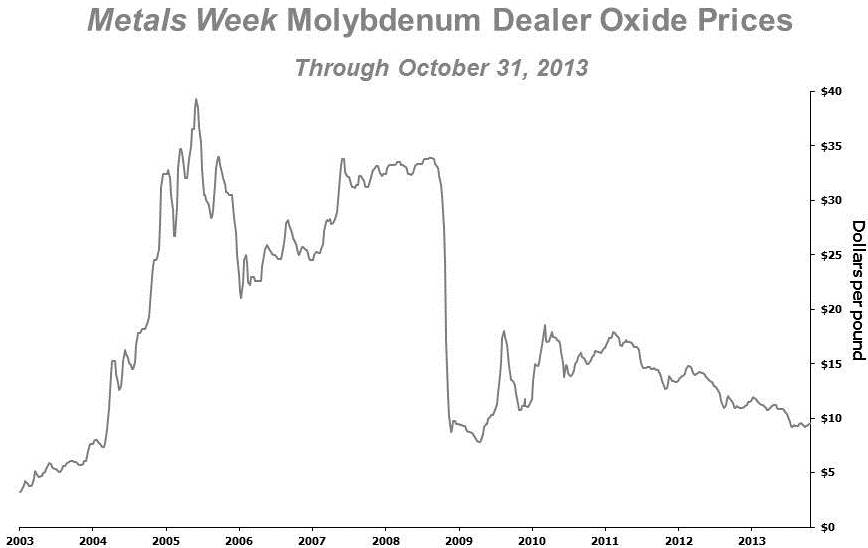
This graph presents the
Metals Week
Molybdenum Dealer Oxide weekly average prices from January 2003 through October
2013
. During
third-quarter
2013
, the weekly average price of molybdenum ranged from a low of
$9.18
per pound to a high of
$10.07
per pound, averaged
$9.42
per pound and was
$9.18
on
September 30, 2013
. Market conditions for molybdenum have declined in 2013 because of weak demand in the metallurgical sector and increased supply. The
Metals Week
Molybdenum Dealer Oxide weekly average price was
$9.59
per pound on
October 31, 2013
.
40
Energy.
Market prices for crude oil and natural gas can fluctuate significantly. During the period from January 2003 through October
2013
, the Brent crude oil price ranged from a low of
$23.26
per barrel in 2003 to a high of
$146.08
per barrel in 2008 and the NYMEX natural gas price fluctuated from a low of
$1.91
per million British thermal units (MMBtu) in 2012 to a high of
$15.38
per MMBtu in 2005. Crude oil and natural gas prices are affected by numerous factors beyond our control as described further in our “Risk Factors” contained in Part II, Item 1A of this quarterly report on Form 10-Q for the period ended September 30, 2013.
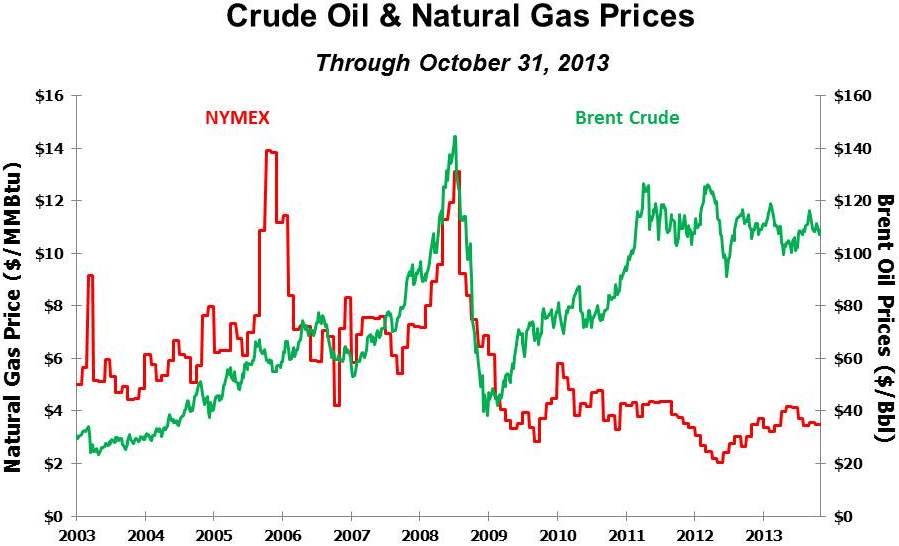
This graph presents Brent crude oil prices and NYMEX natural gas contract prices from January 2003 through October 2013. Oil prices reached a record high in July 2008 as economic growth in emerging economies and the U.S. created high global demand for oil and lower inventories. By the end of 2008, financial turmoil in the U.S. contributed to a global economic slowdown and a decline in many commodity prices, including oil which reached a low of $36.61 per barrel in December 2008. Crude oil prices have rebounded since 2008, supported by a gradually improving global economy and demand outlook. [Recently, prospects for increased North American oil supplies led by U.S. shale production and weaker global growth expectations have weighed on the markets]. During
third-quarter
2013
, the Brent crude oil price ranged from a low of
$103.00
per barrel to a high of
$116.61
per barrel, averaged
$109.59
per barrel and was
$108.37
per barrel on
September 30, 2013
. The Brent crude oil price was
$108.84
per barrel on October 31, 2013.
CRITICAL ACCOUNTING POLICIES AND ESTIMATES
Management’s discussion and analysis of financial condition and results of operations are based on our consolidated financial statements, which have been prepared in conformity with generally accepted accounting principles (GAAP) in the U.S. The preparation of these statements requires that we make estimates and assumptions that affect the reported amounts of assets, liabilities, revenues and expenses. We base these estimates on historical experience and on assumptions that we consider reasonable under the circumstances; however, reported results could differ from those based on the current estimates under different assumptions or conditions. As a result of the acquisitions of PXP and MMR, the following provides updates to the critical accounting policies and estimates presented in our annual report on Form 10-K for the year ended December 31, 2012.
Oil and Gas Reserves
.
Proved oil and gas reserves are those quantities of oil and natural gas which, by analysis of geoscience and engineering data, can be estimated with reasonable certainty to be economically producible from a given date forward, from known reservoirs, and under existing economic conditions, operating methods, and government regulations. The term “reasonable certainty” means a high degree of confidence that the quantities of oil and natural gas actually recovered will equal or exceed the estimate. Engineering estimates of proved oil and natural gas reserves directly impact financial accounting estimates, including depreciation, depletion and amortization and the full cost ceiling limitation. Estimates of total proved reserves are determined using methods prescribed by the SEC, including the use of an average price calculated as the trailing twelve-month average of the
41
first-day-of-the-month reference price as adjusted for location and quality differentials. Actual future prices and costs may be materially higher or lower than the average prices and costs as of the date of the estimate.
There are numerous uncertainties inherent in estimating quantities and values of proved reserves and in projecting future rates of production and the amount and timing of development expenditures, including many factors beyond our control. Future development and abandonment costs are determined annually for each of our properties based upon its geographic location, type of production structure, water depth, reservoir depth and characteristics, currently available procedures and consultations with engineering consultants. Because these costs typically extend many years into the future, estimating these future costs is difficult and requires management to make judgments that are subject to future revisions based upon numerous factors, including changing technology and the political and regulatory environment. Reserve engineering is a subjective process of estimating the recovery from underground accumulations of oil and gas that cannot be measured in an exact manner and the accuracy of any reserve estimate is a function of the quality of available data and of engineering and geological interpretation and judgment. Because all reserve estimates are subjective, the quantities of oil and gas that are ultimately recovered, production and operating costs, the amount and timing of future development expenditures and future oil and gas sales prices may all differ from those assumed in our estimates.
Changes to estimates of proved reserves could result in changes to the prospective depletion rate for our oil and gas operations, which could have a significant impact on our results of operations. Based on our estimated proved reserves and our net oil and gas properties subject to amortization at September 30, 2013, a 10 percent increase in our costs subject to depletion would increase our depletion rate by approximately $3.37 per BOE and a 10 percent reduction to proved reserves would increase our depletion rate by approximately $3.75 per BOE. Changes in estimates of proved oil and gas reserves may also affect our assessment of the impairments of oil and gas properties and goodwill. We believe that if our aggregate estimated proved reserves were significantly revised, such a revision could have a material impact on our results of operations.
Impairments of Oil and Gas Properties.
As discussed in Note 3, we follow the full cost method of accounting whereby all costs associated with oil and gas property acquisition, exploration and development activities are capitalized and amortized to expense under the unit-of-production (UOP) method using estimates of proved oil and natural gas reserves. Additionally, at September 30, 2013, we had
$11.1 billion
of costs for unproved oil and gas properties, which are excluded from amortization. These costs will be transferred into the amortization base as the properties are evaluated and proved reserves are established or if impairment is determined. We assess our unproved properties at least annually, and if impairment is indicated, the amount of the impairment is added to the amortization base. Accordingly, an impairment of unproved properties does not immediately result in the recognition of a charge to the consolidated statements of income, but rather increases the costs subject to amortization. The transfer of costs into the amortization base involves a significant amount of judgment and may be subject to changes over time based on our drilling plans and results, geological and geophysical evaluations, the assignment of proved reserves, and other factors.
We review the carrying value of our oil and gas properties each quarter on a country-by-country basis in accordance with full cost accounting rules. In evaluating our oil and gas properties for impairment, estimates of future cash flows are used (refer to Note 3 for further discussion of the ceiling test calculation). Additionally, SEC rules require that we price our future oil and gas production at the trailing twelve-month average of the first-day-of-the-month reference prices adjusted for location and quality differentials. Such prices are utilized except where different prices are fixed and determinable from applicable contracts for the remaining term of those contracts. The pricing in ceiling test impairment calculations required by full cost accounting may cause results that are not in line with market conditions that exist at the end of an accounting period. For example, in periods of increasing oil and gas prices, the use of a twelve-month average price in the ceiling test calculation may result in an impairment. Conversely, in times of declining prices, ceiling test calculations may not result in an impairment. At
September 30, 2013
, with respect to our U.S. oil and gas properties, our only cost center, the "ceiling" exceeded net capitalized costs by 11 percent, and thus we did not record an impairment.
Because the ceiling test used to evaluate impairment of our oil and gas properties requires us to make several estimates and assumptions that are subject to risk and uncertainty, changes in these estimates and assumptions could result in the impairment of our oil and gas properties. Events that could result in impairment of our oil and gas properties include, but are not limited to, decreases in future oil and natural gas prices, decreases in estimated proved oil and gas reserves and any event that might otherwise have a material adverse effect on our oil and gas production levels or costs. Any potential future impairment charge would not have an impact on our operating cash flows.
42
Goodwill.
At September 30, 2013, the carrying value of goodwill related to our oil and gas operations totaled
$1.9 billion
(refer to Note 3 for further discussion). The final valuation of assets acquired, liabilities assumed and noncontrolling interests is not complete and the carrying amounts initially assigned to the assets, liabilities and noncontrolling interests may change as the fair value analyses are completed. Any adjustments to the recorded values of the assets acquired, liabilities assumed and noncontrolling interests in the acquisitions of PXP and MMR could impact the amount of goodwill recorded. In accordance with accounting rules, goodwill resulting from a business combination is assigned to the acquiring entity's reporting units that are expected to benefit from the business combination. The reporting unit to which goodwill is allocated under full cost accounting is the associated full cost pool. As discussed in Note 3, our oil and gas operations currently have one cost center, the U.S; therefore, goodwill has been allocated to the oil and gas reporting unit.
Goodwill is required to be evaluated for impairment at least annually. We will review goodwill for impairment during the fourth quarter of each year, and between annual evaluations if events occur or circumstances change that may indicate that the fair value of the reporting unit is below its carrying amount.
Because cash flows used to assess recoverability of goodwill will require us to make several estimates and assumptions that are subject to risk and uncertainty, changes in these estimates and assumptions could result in the impairment of recorded goodwill. Additionally, because projected oil and gas prices represent a critical assumption used in evaluating goodwill for impairment, future decreases in oil and gas prices could result in impairment of goodwill. Other events that could indicate impairment of goodwill assigned to our U.S. oil and gas reporting unit include, but are not limited, a decrease in estimated oil and gas reserves, sales of oil and gas properties, a significant adverse change in the economic or business climate and any event that might otherwise have a material adverse affect on our oil and gas production volumes or future development costs. Furthermore, as our U.S. full cost pool represents a depleting asset, absent net increases in the fair value of the reporting unit, the amount of recorded goodwill could be impaired at a future date; any future goodwill impairment charge would not have an impact on our operating cash flows.
43
CONSOLIDATED RESULTS
|
Three Months Ended
|
Nine Months Ended
|
|||||||||||||||
|
|
September 30,
|
September 30,
|
||||||||||||||
|
|
2013
a
|
2012
|
2013
a
|
2012
|
||||||||||||
|
Financial Data
(in millions, except per share amounts)
|
|
|
||||||||||||||
|
Revenues
b,c
|
$
|
6,165
|
|
d
|
$
|
4,417
|
|
$
|
15,036
|
|
d
|
$
|
13,497
|
|
||
|
Operating income
b
|
$
|
1,707
|
|
d,e
|
$
|
1,411
|
|
e
|
$
|
3,701
|
|
d,e,f
|
$
|
4,456
|
|
e
|
|
Net income attributable to FCX common stockholders
g
|
$
|
821
|
|
d,e
|
$
|
824
|
|
e,h
|
$
|
1,951
|
|
d,e,f,i,j
|
$
|
2,298
|
|
e,h,j
|
|
Diluted net income per share attributable to FCX common stockholders
|
$
|
0.79
|
|
d,e
|
$
|
0.86
|
|
e,h
|
$
|
1.96
|
|
d,e,f,i,j
|
$
|
2.41
|
|
e,h,j
|
|
Diluted weighted-average common shares outstanding
|
1,043
|
|
953
|
|
993
|
|
953
|
|
||||||||
|
Operating cash flows
k
|
$
|
1,878
|
|
|
$
|
526
|
|
|
$
|
3,743
|
|
|
$
|
2,509
|
|
|
|
Capital expenditures
|
$
|
1,645
|
|
$
|
971
|
|
$
|
3,623
|
|
$
|
2,518
|
|
||||
|
Mining Operating Data
|
|
|
|
|||||||||||||
|
Copper
(millions of recoverable pounds)
|
|
|
|
|||||||||||||
|
Production
|
1,063
|
|
938
|
|
2,952
|
|
2,658
|
|
||||||||
|
Sales, excluding purchases
|
1,041
|
|
922
|
|
2,946
|
|
2,676
|
|
||||||||
|
Average realized price per pound
|
$
|
3.28
|
|
$
|
3.64
|
|
$
|
3.31
|
|
$
|
3.63
|
|
||||
|
Site production and delivery costs per pound
l
|
$
|
1.85
|
|
$
|
2.03
|
|
$
|
1.96
|
|
$
|
2.00
|
|
||||
|
Unit net cash costs per pound
l
|
$
|
1.46
|
|
$
|
1.62
|
|
$
|
1.62
|
|
$
|
1.46
|
|
||||
|
Gold
(thousands of recoverable ounces)
|
|
|
|
|||||||||||||
|
Production
|
327
|
|
204
|
|
713
|
|
707
|
|
||||||||
|
Sales, excluding purchases
|
305
|
|
202
|
|
692
|
|
756
|
|
||||||||
|
Average realized price per ounce
|
$
|
1,329
|
|
$
|
1,728
|
|
$
|
1,395
|
|
$
|
1,666
|
|
||||
|
Molybdenum
(millions of recoverable pounds)
|
|
|
|
|||||||||||||
|
Production
|
25
|
|
20
|
|
71
|
|
61
|
|
||||||||
|
Sales, excluding purchases
|
23
|
|
21
|
|
71
|
|
62
|
|
||||||||
|
Average realized price per pound
|
$
|
11.21
|
|
$
|
13.62
|
|
$
|
12.12
|
|
$
|
14.79
|
|
||||
|
Oil and Gas Operating Data
|
||||||||||||||||
|
Oil Equivalents
|
||||||||||||||||
|
Sales volumes:
|
||||||||||||||||
|
MMBOE
|
16.5
|
|
21.5
|
|
||||||||||||
|
MBOE per day
|
179
|
|
176
|
|
||||||||||||
|
Cash operating margin per BOE
m
:
|
||||||||||||||||
|
Realized revenues
|
$
|
80.93
|
|
$
|
79.40
|
|
||||||||||
|
Cash production costs
|
16.80
|
|
16.76
|
|
||||||||||||
|
Cash operating margin
|
$
|
64.13
|
|
$
|
62.64
|
|
||||||||||
|
a.
|
Includes the results of FM O&G. The first nine months of 2013 includes FM O&G's results beginning June 1, 2013.
|
|
b.
|
Refer to Note
13
for a summary of revenues and operating income by business segment, including the results of our recently acquired oil and gas operations.
|
|
c.
|
Includes adjustments to provisionally priced concentrate and cathode sales recognized in prior periods. Refer to “Revenues” for further discussion.
|
|
d.
|
Includes charges for unrealized losses on oil and gas derivative contracts totaling
$158 million
(
$98 million
to net income attributable to FCX common stockholders or
$0.09
per share) in
third-quarter
2013
and
$194 million
(
$120 million
to net income attributable to FCX common stockholders or
$0.12
per share) for the
first nine months of
2013
(reflecting the four months from June 1, 2013, to September 30, 2013).
|
|
e.
|
Includes net credits for adjustments to environmental obligations and related litigation reserves totaling
$22 million
(
$14 million
to net income attributable to FCX common stockholders or
$0.01
per share) in
third-quarter
2013
,
$85 million
(
$68 million
to net income attributable to FCX common stockholders or
$0.07
per share) in
third-quarter
2012
,
$14 million
(
$7 million
to net income attributable to FCX common stockholders or
$0.01
per share) for the
first nine months of
2013
and
$19 million
(
$16 million
to net income attributable FCX common stockholders or
$0.02
per share) for the
first nine months of
2012
.
|
|
f.
|
The
first nine months of
2013
include charges of
$76 million
(
$47 million
to net income attributable to FCX common stockholders or
$0.05
per share) for transaction and other costs principally associated with our oil and gas acquisitions.
|
44
|
g.
|
We defer recognizing profits on intercompany sales until final sales to third parties occur. Refer to "Operations - Smelting & Refining" for a summary of net impacts from changes in these deferrals.
|
|
h.
|
The
2012
periods include a net credit of
$100 million
, net of noncontrolling interests, (
$0.11
per share) associated with adjustments to deferred income taxes. For further discussion, refer to Note 4 and "Provision for Income Taxes," below for further discussion of these amounts.
|
|
i.
|
The
first nine months of
2013
include gains associated with our oil and gas acquisitions, including (i)
$128 million
to net income attributable to FCX common stockholders ($0.13 per share) primarily related to our preferred stock investment in and the subsequent acquisition of MMR, and (ii)
$183 million
to net income attributable to FCX common stockholders (
$0.18
per share) associated with net reductions in our deferred tax liabilities and deferred tax asset valuation allowances.
|
|
j.
|
Includes losses on early extinguishment of debt totaling
$36 million
to net income attributable to FCX common stockholders (
$0.04
per share) for the
first nine months of
2013
related to the termination of the acquisition bridge loan facilities and
$149 million
to net income attributable to FCX common stockholders (
$0.16
per share) for the
first nine months of
2012
associated with the redemption of our remaining
8.375%
senior notes. Refer to Note
7
for further discussion.
|
|
k.
|
Includes net working capital uses and changes in other tax payments of
$294 million
for
third-quarter
2013
,
$765 million
for
third-quarter
2012
,
$489 million
for the
first nine months of
2013
and
$1.5 billion
for the
first nine months of
2012
.
|
|
l.
|
Reflects per pound weighted-average production and delivery costs and unit net cash costs (net of by-product credits) for all copper mines, excluding net noncash and other costs. For reconciliations of the per pound unit costs by operating division to production and delivery costs applicable to sales reported in our consolidated financial statements, refer to “Product Revenues and Production Costs.”
|
|
m.
|
Cash operating margin for our oil and gas operations reflects realized revenues less cash production costs. Realized revenues exclude unrealized gains (losses) on derivative contracts and cash production costs exclude accretion and other costs. For reconciliations of realized revenues and cash production costs per BOE to revenues and production and delivery costs reported in our consolidated financial statements, refer to "Product Revenues and Production Costs."
|
Revenues
Consolidated revenues totaled
$6.2 billion
in
third-quarter
2013
and
$15.0 billion
for the
first nine months of
2013
, compared with
$4.4 billion
in
third-quarter
2012
and
$13.5 billion
for the
first nine months of
2012
, and primarily included the sale of copper concentrates, copper cathodes, copper rod, gold, molybdenum, silver and cobalt hydroxide, and beginning June 1, 2013, oil, natural gas and natural gas liquids (NGLs). Following is a summary of changes in our consolidated revenues between periods (in millions):
|
Three Months Ended September 30,
|
Nine Months Ended September 30,
|
||||||
|
Consolidated revenues - 2012 periods
|
$
|
4,417
|
|
$
|
13,497
|
|
|
|
Mining operations:
|
|||||||
|
Higher (lower) sales volumes from mining operations:
|
|||||||
|
Copper
|
431
|
|
980
|
|
|||
|
Gold
|
178
|
|
(107
|
)
|
|||
|
Molybdenum
|
29
|
|
127
|
|
|||
|
Lower price realizations from mining operations:
|
|
||||||
|
Copper
|
(375
|
)
|
(943
|
)
|
|||
|
Gold
|
(121
|
)
|
(187
|
)
|
|||
|
Molybdenum
|
(56
|
)
|
(190
|
)
|
|||
|
Favorable (unfavorable) impact of net adjustments for prior period provisionally priced sales for mining operations
|
42
|
|
(133
|
)
|
|||
|
Higher revenues from purchased copper
|
108
|
|
275
|
|
|||
|
Other, including intercompany eliminations
|
336
|
|
205
|
|
|||
|
Oil and gas operations:
|
|||||||
|
Oil and gas revenues, excluding losses on derivative contracts
|
1,346
|
|
1,717
|
|
|||
|
Unrealized losses on oil and gas derivative contracts
|
(170
|
)
|
(205
|
)
|
|||
|
Consolidated revenues - 2013 periods
|
$
|
6,165
|
|
$
|
15,036
|
|
|
Mining Sales Volumes
Consolidated copper sales volumes increased to
1.0 billion
pounds in
third-quarter
2013
and
2.9 billion
pounds for the
first nine months of
2013
, compared with
922 million
pounds in
third-quarter
2012
and
2.7 billion
pounds for the
first nine months of
2012
, reflecting improved volumes throughout our global mining operations.
45
Consolidated gold sales volumes increased to
305 thousand
ounces in
third-quarter
2013
, compared with
202 thousand
ounces in
third-quarter
2012
, primarily reflecting anticipated higher ore grades in Indonesia. For the
first nine months of
2013
, consolidated gold volumes totaled
692 thousand
ounces, compared with
756 thousand
ounces for the
first nine months of
2012
, primarily reflecting timing of shipments.
Consolidated molybdenum sales volumes increased to
23 million
pounds in
third-quarter
2013
and
71 million
pounds for the
first nine months of
2013
, compared with
21 million
pounds in
third-quarter
2012
and
62 million
pounds for the
first nine months of
2012
.
Refer to “Operations” for further discussion of sales volumes at our mining operations.
Metal Price Realizations
Our consolidated revenues can vary significantly as a result of fluctuations in the market prices of copper, gold, molybdenum. Following is a summary of our average price realizations from mining operations for the
third quarters
and
first nine months of
2013
and
2012
:
|
Three Months Ended
|
Nine Months Ended
|
||||||||||||||
|
September 30,
|
September 30,
|
||||||||||||||
|
|
2013
|
|
2012
|
2013
|
|
2012
|
|||||||||
|
Copper (per pound)
|
$
|
3.28
|
|
$
|
3.64
|
|
$
|
3.31
|
|
$
|
3.63
|
|
|||
|
Gold (per ounce)
|
$
|
1,329
|
|
$
|
1,728
|
|
$
|
1,395
|
|
$
|
1,666
|
|
|||
|
Molybdenum (per pound)
|
$
|
11.21
|
|
$
|
13.62
|
|
$
|
12.12
|
|
$
|
14.79
|
|
|||
We experienced lower price realizations from our mining operations for the 2013 periods, compared with the 2012 periods. Refer to "Markets" for further discussion.
Provisionally Priced Copper Sales
During the
first nine months of
2013
,
47 percent
of our mined copper was sold in concentrate,
29 percent
as cathode and
24 percent
as rod from our North America operations. Substantially all of our copper concentrate and cathode sales contracts provide final copper pricing in a specified future month (generally one to four months from the shipment date) based primarily on quoted LME monthly average spot copper prices. We receive market prices based on prices in the specified future period, which results in price fluctuations recorded through revenues until the date of settlement. We record revenues and invoice customers at the time of shipment based on then-current LME prices, which results in an embedded derivative on our provisionally priced concentrate and cathode sales that is adjusted to fair value through earnings each period, using the period-end forward prices, until final pricing on the date of settlement. To the extent final prices are higher or lower than what was recorded on a provisional basis, an increase or decrease to revenues is recorded each reporting period until the date of final pricing. Accordingly, in times of rising copper prices, our revenues benefit from adjustments to the final pricing of provisionally priced sales pursuant to contracts entered into in prior periods; in times of falling copper prices, the opposite occurs.
Following is a summary of the favorable (unfavorable) impacts of net adjustments to the prior periods' provisionally priced copper sales for the
third quarters
and
first nine months of
2013
and
2012
(in millions, except per share amounts):
|
Three Months Ended
|
Nine Months Ended
|
||||||||||||||
|
September 30,
|
September 30,
|
||||||||||||||
|
|
2013
|
|
2012
|
2013
|
|
2012
|
|||||||||
|
Revenues
|
$
|
73
|
|
$
|
24
|
|
$
|
(26
|
)
|
$
|
101
|
|
|||
|
Net income attributable to FCX common stockholders
|
$
|
35
|
|
$
|
12
|
|
$
|
(12
|
)
|
$
|
43
|
|
|||
|
Net income per share attributable to FCX common stockholders
|
$
|
0.03
|
|
$
|
0.01
|
|
$
|
(0.01
|
)
|
$
|
0.05
|
|
|||
At
September 30, 2013
, we had provisionally priced copper sales at our copper mining operations, primarily South America and Indonesia, totaling
403 million
pounds of copper (net of intercompany sales and noncontrolling interests) recorded at an average of
$3.31
per pound, subject to final pricing over the next several months. We estimate that each $0.05 change in the price realized from the
September 30, 2013
, provisional price recorded would have an approximate
$13 million
impact on
2013
net income attributable to common stockholders. The LME spot copper price closed at
$3.28
per pound on
October 31, 2013
.
46
Purchased Copper
From time to time, we purchase copper cathode for processing by our Rod & Refining segment when production from our North America copper mines does not meet customer demand.
Oil & Gas Revenues
Consolidated sales from our oil and gas operations of
16.5
MMBOE during
third-quarter
2013
included
11.5 million
barrels (MMBbls) of crude oil,
23.6 billion
cubic feet (Bcf) of natural gas and
1.0
MMBbls of NGLs. Consolidated sales of
21.5
MMBOE for the four months from June 1, 2013, to
September 30, 2013
, included
14.9
MMBbls of crude oil,
31.3
Bcf of natural gas and
1.3
MMBbls of NGLs. Refer to “Operations” for further discussion of sales volumes at our oil and gas operations.
Our oil and gas operations use various derivative contracts to manage exposure to commodity price risk for a substantial portion of its oil and gas production. In connection with the acquisition of PXP, FCX assumed derivative contracts for 2013, 2014 and 2015 that consist of crude oil options, and crude oil and natural gas swaps. These oil and gas derivative contracts do not qualify or are not designated as hedging instruments; accordingly, they are recorded at fair value with the mark-to-market gains and losses recorded in revenues each period. Net charges for realized losses on oil and gas derivative contracts totaled
$12 million
in
third-quarter
2013
and
$11 million
for the four months from June 1, 2013, to
September 30, 2013
. Additionally, following is a summary of net charges for unrealized losses on oil and gas derivative contracts for the
2013
periods (in millions, except per share amounts):
|
Four Months From
|
||||||||
|
Three Months Ended
|
June 1, 2013, to
|
|||||||
|
September 30, 2013
|
September 30, 2013
|
|||||||
|
Revenues
|
$
|
(158
|
)
|
$
|
(194
|
)
|
||
|
Net income attributable to FCX common stockholders
|
$
|
(98
|
)
|
$
|
(120
|
)
|
||
|
Net income per share attributable to FCX common stockholders
|
$
|
(0.09
|
)
|
$
|
(0.12
|
)
|
||
Refer to Note 9 and "Disclosure About Market Risks - Commodity Price Risk" for further discussion of the oil and gas derivative contracts.
Production and Delivery Costs
Consolidated production and delivery costs increased to
$3.3 billion
in
third-quarter
2013
and
$8.9 billion
for the
first nine months of
2013
, compared with
$2.6 billion
in
third-quarter
2012
and
$7.6 billion
for the
first nine months of
2012
. Excluding production and delivery costs associated with oil and gas operations of
$288 million
for
third-quarter
2013
and
$377 million
for the four months from June 1, 2013, to
September 30, 2013
, higher production and delivery costs for our mining operations primarily reflected higher production in North America, Africa and Indonesia, partly offset by lower operating costs in Indonesia.
Consolidated unit site production and delivery costs (before net noncash and other costs) for our copper mining operations were
$1.85
per pound of copper in
third-quarter
2013
and
$1.96
for the
first nine months of
2013
, compared with
$2.03
per pound of copper in
third-quarter
2012
and
$2.00
per pound for the
first nine months of
2012
. Lower consolidated unit site production and delivery costs in the 2013 periods primarily reflects higher copper volumes in Indonesia and Africa and ongoing cost control efforts. Assuming achievement of current volume and cost estimates, consolidated unit site production and delivery costs are expected to average $1.89 per pound in fourth-quarter 2013 and
$1.94
per pound of copper for the year
2013
. Refer to “Operations – Unit Net Cash Costs” for further discussion of unit net cash costs associated with our operating divisions, and to “Product Revenues and Production Costs” for reconciliations of per pound costs by operating division to production and delivery costs applicable to sales reported in our consolidated financial statements.
Our copper mining operations require significant energy, principally diesel, electricity, coal and natural gas. Energy costs approximated 21 percent of our consolidated copper production costs in
2012
and are expected to approximate 20 percent for the year
2013
, including purchases of approximately 265 million gallons of diesel fuel; 7,300 gigawatt hours of electricity at our North America, South America and Africa copper mining operations (we generate all of our power at our Indonesia mining operation); 695 thousand metric tons of coal for our coal power plant in Indonesia; and 1 MMBtu of natural gas at certain of our North America mines.
47
Depreciation, Depletion and Amortization
Consolidated depreciation, depletion and amortization expense totaled
$919 million
in
third-quarter
2013
and
$1.8 billion
for the
first nine months of
2013
(which included
$563 million
in
third-quarter
2013
and
$732 million
for the four months from June 1, 2013, to
September 30, 2013
, for our oil and gas operations) compared with
$298 million
in
third-quarter
2012
and
$856 million
for the
first nine months of
2012
. Our mining depreciation will vary under the UOP method as a result of changes in sales volumes and the related UOP rates at our individual mines, which have increased because of asset additions. Higher depreciation, depletion and amortization for our mining operations in the
2013
periods primarily reflected higher production and asset additions mostly in North America and Africa.
Selling, General and Administrative Expenses
Consolidated selling, general and administrative expenses totaled
$158 million
in
third-quarter
2013
,
$457 million
for the
first nine months of
2013
,
$110 million
in
third-quarter
2012
and
$311 million
for the
first nine months of
2012
. Excluding selling, general and administrative expenses associated with oil and gas operations of
$51 million
in
third-quarter
2013
and
$65 million
for the four months from June 1, 2013, to
September 30, 2013
, higher expense for the
first nine months of
2013
, compared with the
first nine months of
2012
primarily reflected transaction and related costs associated with acquisitions.
Mining Exploration and Research Expenses
Consolidated exploration and research expenses for our mining operations totaled
$57 million
in
third-quarter
2013
and
$173 million
for the
first nine months of
2013
, compared to
$79 million
in
third-quarter
2012
and
$214 million
for the
first nine months of
2012
. We are actively conducting exploration activities near our existing mines with a focus on opportunities to expand reserves that will support additional future production capacity in the large mineral districts where we currently operate. Exploration results indicate opportunities for what we believe could be significant future potential reserve additions in North and South America and in the Tenke minerals district. The drilling data in North America continues to indicate the potential for expanded sulfide production.
For the year
2013
, exploration and research expenditures for our mining operations are expected to approximate
$215 million
, including
$185 million
for exploration. Mining exploration activities will continue to focus primarily on the potential for future reserve additions in our existing mineral districts.
As discussed in Note 3, under the full cost method of accounting, exploration costs for our oil and gas operations are capitalized as oil and natural gas properties within property, plant, equipment and development costs on our consolidated balance sheets.
Environmental Obligations and Shutdown Costs
Environmental obligation costs reflect net revisions to our long-term environmental obligations, which will vary from period to period because of changes to environmental laws and regulations, the settlement of environmental matters and/or circumstances affecting our operations that could result in significant changes in our estimates. Shutdown costs include care and maintenance costs and any litigation, remediation or related expenditures associated with closed facilities or operations. Net (credits) charges for environmental obligations and shutdown costs totaled
$(8) million
in
third-quarter
2013
and
$23 million
for the
first nine months of
2013
, compared with
$(73) million
in
third-quarter
2012
and
$18 million
for the
first nine months of
2012
. Refer to Note
8
and "Contingencies" for further discussion of environmental obligations and litigation matters associated with closed facilities or operations.
Interest Expense, Net
Consolidated interest expense (excluding capitalized interest) increased to
$223 million
in
third-quarter
2013
and
$465 million
for the
first nine months of
2013
, compared with
$56 million
in
third-quarter
2012
and
$210 million
for the
first nine months of
2012
, primarily reflecting additional interest expense associated with acquisition-related debt. Refer to Note
7
for further discussion.
Capitalized interest is primarily related to the level of expenditures for our development projects and average interest rates on our borrowings, and totaled
$61 million
in
third-quarter
2013
and
$114 million
for the
first nine months of
2013
, compared to
$14 million
in
third-quarter
2012
and
$62 million
for the
first nine months of
2012
. The increase in the
2013
periods compared with the
2012
periods primarily reflects the addition of capitalized interest associated with expenditures for our oil and gas properties totaling $36 million in
third-quarter
2013
and $47 million for the four months from June 1, 2013 to September 30, 2013. Refer to “Capital Resources and Liquidity - Investing Activities” for further discussion of current development projects.
48
Losses on Early Extinguishment of Debt
Losses on early extinguishment of debt totaled
$45 million
for the
first nine months of
2013
related to the termination of the bridge loan facilities for the PXP and MMR acquisitions, and
$168 million
for the
first nine months of
2012
related to the redemption of our remaining outstanding
8.375%
Senior Notes. Refer to Note
7
for further discussion.
Gain on Investment in MMR
Gain on investment in MMR totaled
$128 million
for
first nine months of
2013
primarily related to our 2010 preferred stock investment in and the subsequent acquisition of MMR. Refer to Note 2 for further discussion.
Provision for Income Taxes
Following is a summary of the approximate amounts in the calculation of our consolidated provision for income taxes for the
first nine months of
2013
and
2012
(in millions, except percentages):
|
Nine Months Ended
|
Nine Months Ended
|
|||||||||||||||||||
|
September 30, 2013
|
September 30, 2012
|
|||||||||||||||||||
|
Income
a
|
Effective
Tax Rate
|
Income Tax
(Provision) Benefit
|
Income
a
|
Effective
Tax Rate
|
Income Tax
(Provision) Benefit
|
|||||||||||||||
|
U.S.
|
$
|
1,007
|
|
26%
|
$
|
(259
|
)
|
$
|
1,231
|
|
24%
|
$
|
(291
|
)
|
||||||
|
South America
|
1,325
|
|
36%
|
(472
|
)
|
1,675
|
|
36%
|
(609
|
)
|
||||||||||
|
Indonesia
|
622
|
|
46%
|
(289
|
)
|
940
|
|
41%
|
(387
|
)
|
||||||||||
|
Africa
|
320
|
|
31%
|
(99
|
)
|
263
|
|
30%
|
(79
|
)
|
||||||||||
|
Eliminations and other
|
172
|
|
N/A
|
(31
|
)
|
54
|
|
N/A
|
10
|
|
||||||||||
|
Annualized rate adjustment
b
|
—
|
|
N/A
|
—
|
|
—
|
|
N/A
|
(6
|
)
|
||||||||||
|
3,446
|
|
33%
|
e
|
(1,150
|
)
|
4,163
|
|
33%
|
(1,362
|
)
|
||||||||||
|
Adjustments
|
—
|
|
N/A
|
183
|
|
c
|
—
|
|
N/A
|
234
|
|
d
|
||||||||
|
Consolidated FCX
|
$
|
3,446
|
|
28%
|
$
|
(967
|
)
|
$
|
4,163
|
|
27%
|
$
|
(1,128
|
)
|
||||||
|
a.
|
Represents income by geographic location before income taxes and equity in affiliated companies’ net earnings (losses).
|
|
b.
|
In accordance with applicable accounting rules, we adjust our interim provision for income taxes equal to our estimated annualized tax rate.
|
|
c.
|
Reflects net reductions in our deferred tax liabilities and deferred tax asset valuation allowances resulting from the second-quarter 2013 oil and gas acquisitions.
|
|
d.
|
Reflects the reversal of a net deferred tax liability totaling
$234 million
(
$123 million
net of noncontrolling interest) related to reinvested profits at Cerro Verde that are not expected to be distributed prior to expiration of its stability agreement on December 31, 2013.
|
|
e.
|
Our consolidated effective income tax rate is a function of the combined effective tax rates for the jurisdictions in which we operate. Accordingly, variations in the relative proportions of jurisdictional income result in fluctuations to FCX's consolidated effective income tax rate. Assuming average prices of
$3.25
per pound for copper,
$1,300
per ounce for gold,
$9.50
per pound for molybdenum and Brent crude oil of
$110
per barrel for
fourth-quarter
2013
and achievement of current sales volume and cost estimates, we estimate that our consolidated effective tax rate will approximate 35 percent in fourth-quarter 2013 and
34 percent
for the year 2013 (excluding the impact of the acquisition-related adjustments).
|
OPERATIONS
North America Copper Mines
We operate seven open-pit copper mines in North America – Morenci, Bagdad, Safford, Sierrita and Miami in Arizona, and Chino and Tyrone in New Mexico. All of the North America mining operations are wholly owned, except for Morenci. We record our 85 percent joint venture interest in Morenci using the proportionate consolidation method.
The North America copper mines include open-pit mining, sulfide ore concentrating, leaching and solution extraction/electrowinning (SX/EW) operations. A majority of the copper produced at our North America copper mines is cast into copper rod by our Rod & Refining segment. The remainder of our North America copper sales is in the form of copper cathode or copper concentrate, a portion of which is shipped to Atlantic Copper (our wholly owned copper smelter). Molybdenum concentrate is also produced by certain of our North America copper mines (Sierrita, Bagdad, Morenci and Chino).
49
Operating and Development Activities.
We have increased production from our North America copper mines in recent years and we continue to evaluate a number of opportunities to invest in additional production capacity following positive exploration results. Future investments will be undertaken based on the results of economic and technical feasibility studies and taking into consideration market conditions.
Morenci Mill Expansion.
We are expanding mining and milling capacity to process additional sulfide ores identified through exploratory drilling. The project is targeting incremental annual production of approximately 225 million pounds of copper in 2014 (an approximate 40 percent increase from 2012) through an increase in milling rates from 50,000 metric tons of ore per day to approximately 115,000 metric tons of ore per day and mining rates from 700,000 short tons per day to 900,000 short tons per day. The targeted increase in mining rates has been achieved and construction activities for the new mill and related facilities are being advanced. Construction is over 40 percent complete and the project is on track for completion in the first half of 2014. At
September 30, 2013
,
$0.8 billion
had been incurred for this project (
$0.5 billion
during the
first nine months of
2013
), with approximately $0.8 billion remaining to be incurred.
Operating Data.
Following is summary operating data for the North America copper mines for the
third quarters
and
first nine months of
2013
and
2012
:
|
Three Months Ended
|
Nine Months Ended
|
||||||||||||||
|
September 30,
|
September 30,
|
||||||||||||||
|
|
2013
|
2012
|
2013
|
2012
|
|||||||||||
|
Operating Data, Net of Joint Venture Interest
|
|
|
|||||||||||||
|
Copper
(millions of recoverable pounds)
|
|
|
|||||||||||||
|
Production
|
354
|
|
337
|
|
1,046
|
|
1,005
|
|
|||||||
|
Sales, excluding purchases
|
363
|
|
331
|
|
1,088
|
|
1,030
|
|
|||||||
|
Average realized price per pound
|
$
|
3.27
|
|
$
|
3.58
|
|
$
|
3.37
|
|
$
|
3.66
|
|
|||
|
Molybdenum
(millions of recoverable pounds)
|
|
|
|||||||||||||
|
Production
a
|
9
|
|
8
|
|
26
|
|
27
|
|
|||||||
|
100% Operating Data
|
|
|
|||||||||||||
|
SX/EW operations
|
|
|
|||||||||||||
|
Leach ore placed in stockpiles (metric tons per day)
|
993,100
|
|
922,100
|
|
1,015,400
|
|
967,700
|
|
|||||||
|
Average copper ore grade (percent)
|
0.22
|
|
0.22
|
|
0.22
|
|
0.22
|
|
|||||||
|
Copper production (millions of recoverable pounds)
|
216
|
|
211
|
|
651
|
|
639
|
|
|||||||
|
Mill operations
|
|
|
|||||||||||||
|
Ore milled (metric tons per day)
|
247,400
|
|
242,700
|
|
246,300
|
|
235,700
|
|
|||||||
|
Average ore grade (percent):
|
|
||||||||||||||
|
Copper
|
0.38
|
|
0.37
|
|
0.39
|
|
0.37
|
|
|||||||
|
Molybdenum
|
0.03
|
|
0.03
|
|
0.03
|
|
0.03
|
|
|||||||
|
Copper recovery rate (percent)
|
86.3
|
|
85.4
|
|
84.6
|
|
83.5
|
|
|||||||
|
Copper production (millions of recoverable pounds)
|
163
|
|
150
|
|
469
|
|
436
|
|
|||||||
|
a.
|
Refer to "Consolidated Results" for our consolidated molybdenum sales volumes, which includes sales of molybdenum produced at the North America copper mines.
|
Copper sales volumes from our North America copper mines increased to
363 million
pounds in
third-quarter
2013
and
1.1 billion
pounds for the
first nine months of
2013
, compared with
331 million
pounds in
third-quarter
2012
and
1.0 billion
pounds for the
first nine months of
2012
, primarily because of higher mining and milling rates.
For the year
2013
, copper sales volumes from our North America copper mines are expected to approximate
1.44 billion
pounds, compared with
1.35 billion
pounds in
2012
. North America copper production is expected to continue to improve in 2014 following the completion of the Morenci mill expansion project. Refer to "Outlook" for projected molybdenum sales volumes.
Unit Net Cash Costs.
Unit net cash costs per pound of copper is a measure intended to provide investors with information about the cash-generating capacity of our mining operations expressed on a basis relating to the
50
primary metal product for our respective operations. We use this measure for the same purpose and for monitoring operating performance by our mining operations. This information differs from measures of performance determined in accordance with U.S. GAAP and should not be considered in isolation or as a substitute for measures of performance determined in accordance with U.S. GAAP. This measure is presented by other metals mining companies, although our measure may not be comparable to similarly titled measures reported by other companies.
Gross Profit per Pound of Copper and Molybdenum
The following tables summarize unit net cash costs and gross profit per pound at our North America copper mines for the
third quarters
and
first nine months of
2013
and
2012
. Refer to “Product Revenues and Production Costs” for an explanation of the “by-product” and “co-product” methods and a reconciliation of unit net cash costs per pound to production and delivery costs applicable to sales reported in our consolidated financial statements.
|
Three Months Ended
|
Three Months Ended
|
|||||||||||||||||||||||
|
|
September 30, 2013
|
September 30, 2012
|
||||||||||||||||||||||
|
|
By- Product Method
|
Co-Product Method
|
By- Product Method
|
Co-Product Method
|
||||||||||||||||||||
|
Copper
|
Molyb-
denum
|
Copper
|
Molyb-
denum
|
|||||||||||||||||||||
|
Revenues, excluding adjustments
|
$
|
3.27
|
|
$
|
3.27
|
|
$
|
10.24
|
|
a
|
$
|
3.58
|
|
$
|
3.58
|
|
$
|
12.58
|
|
a
|
||||
|
Site production and delivery, before net noncash and other costs shown below
|
2.00
|
|
1.94
|
|
4.01
|
|
1.97
|
|
1.77
|
|
8.60
|
|
||||||||||||
|
By-product credits
|
(0.24
|
)
|
—
|
|
—
|
|
(0.32
|
)
|
—
|
|
—
|
|
||||||||||||
|
Treatment charges
|
0.10
|
|
0.09
|
|
—
|
|
0.12
|
|
0.12
|
|
—
|
|
||||||||||||
|
Unit net cash costs
|
1.86
|
|
2.03
|
|
4.01
|
|
1.77
|
|
1.89
|
|
8.60
|
|
||||||||||||
|
Depreciation, depletion and amortization
|
0.27
|
|
0.27
|
|
0.24
|
|
0.25
|
|
0.23
|
|
0.63
|
|
||||||||||||
|
Noncash and other costs, net
|
0.08
|
|
0.07
|
|
0.03
|
|
0.12
|
|
0.11
|
|
0.15
|
|
||||||||||||
|
Total unit costs
|
2.21
|
|
2.37
|
|
4.28
|
|
2.14
|
|
2.23
|
|
9.38
|
|
||||||||||||
|
Revenue adjustments, primarily for pricing on prior period open sales
|
0.02
|
|
0.02
|
|
—
|
|
0.01
|
|
0.01
|
|
—
|
|
||||||||||||
|
Gross profit per pound
|
$
|
1.08
|
|
$
|
0.92
|
|
$
|
5.96
|
|
$
|
1.45
|
|
$
|
1.36
|
|
$
|
3.20
|
|
||||||
|
Copper sales (millions of recoverable pounds)
|
362
|
|
362
|
|
330
|
|
330
|
|
|
|||||||||||||||
|
Molybdenum sales (millions of recoverable pounds)
a
|
9
|
|
|
|
8
|
|
||||||||||||||||||
|
Nine Months Ended
|
Nine Months Ended
|
|||||||||||||||||||||||
|
|
September 30, 2013
|
September 30, 2012
|
||||||||||||||||||||||
|
|
By- Product Method
|
Co-Product Method
|
By- Product Method
|
Co-Product Method
|
||||||||||||||||||||
|
Copper
|
Molyb-
denum
|
Copper
|
Molyb-
denum
|
|||||||||||||||||||||
|
Revenues, excluding adjustments
|
$
|
3.37
|
|
$
|
3.37
|
|
$
|
11.03
|
|
a
|
$
|
3.66
|
|
$
|
3.66
|
|
$
|
13.58
|
|
a
|
||||
|
Site production and delivery, before net noncash and other costs shown below
|
2.03
|
|
1.97
|
|
3.99
|
|
1.88
|
|
1.74
|
|
6.18
|
|
||||||||||||
|
By-product credits
|
(0.25
|
)
|
—
|
|
—
|
|
(0.37
|
)
|
—
|
|
—
|
|
||||||||||||
|
Treatment charges
|
0.10
|
|
0.10
|
|
—
|
|
0.12
|
|
0.11
|
|
—
|
|
||||||||||||
|
Unit net cash costs
|
1.88
|
|
2.07
|
|
3.99
|
|
1.63
|
|
1.85
|
|
6.18
|
|
||||||||||||
|
Depreciation, depletion and amortization
|
0.28
|
|
0.27
|
|
0.25
|
|
0.26
|
|
0.24
|
|
0.45
|
|
||||||||||||
|
Noncash and other costs, net
|
0.08
|
|
0.08
|
|
0.03
|
|
0.10
|
|
0.09
|
|
0.07
|
|
||||||||||||
|
Total unit costs
|
2.24
|
|
2.42
|
|
4.27
|
|
1.99
|
|
2.18
|
|
6.70
|
|
||||||||||||
|
Revenue adjustments, primarily for pricing on prior period open sales
|
—
|
|
—
|
|
—
|
|
0.01
|
|
—
|
|
—
|
|
||||||||||||
|
Gross profit per pound
|
$
|
1.13
|
|
$
|
0.95
|
|
$
|
6.76
|
|
$
|
1.68
|
|
$
|
1.48
|
|
$
|
6.88
|
|
||||||
|
Copper sales (millions of recoverable pounds)
|
1,084
|
|
1,084
|
|
1,027
|
|
1,027
|
|
|
|||||||||||||||
|
Molybdenum sales (millions of recoverable pounds)
a
|
26
|
|
|
27
|
|
|||||||||||||||||||
|
a.
|
Reflects sales of molybdenum produced by certain of the North America copper mines to our molybdenum sales company at market-based pricing.
|
Our North America copper mines have varying cost structures because of differences in ore grades and characteristics, processing costs, by-product credits and other factors. Average unit net cash costs (net of by-
51
product credits) of
$1.86
per pound of copper in
third-quarter
2013
and
$1.88
per pound for the
first nine months of
2013
were higher than unit net cash costs of
$1.77
per pound in
third-quarter
2012
and
$1.63
per pound for the
first nine months of
2012
, primarily reflecting lower molybdenum credits. The first nine months of 2013 also reflected increased costs from higher mining and milling rates.
Because certain assets are depreciated on a straight-line basis, North America's average unit depreciation rate may vary with asset additions and the level of copper production and sales.
Assuming achievement of current sales volume and cost estimates and an average price of
$9.50
per pound of molybdenum for
fourth-quarter
2013
, average unit net cash costs (net of by-product credits) for our North America copper mines are expected to approximate
$1.86
per pound of copper for the year
2013
, compared with
$1.67
per pound in
2012
.
South America Mining
We operate four copper mines in South America – Cerro Verde in Peru, and El Abra, Candelaria and Ojos del Salado in Chile. We own a 53.56 percent interest in Cerro Verde, a 51 percent interest in El Abra, and an 80 percent interest in the Candelaria and Ojos del Salado mining complex. All operations in South America are consolidated in our financial statements.
South America mining includes open-pit and underground mining, sulfide ore concentrating, leaching and SX/EW operations. Production from our South America mines is sold as copper concentrate or copper cathode under long-term contracts. Our South America mines ship a portion of their copper concentrate inventories to Atlantic Copper (our wholly owned copper smelter). In addition to copper, the Candelaria and Ojos del Salado mines produce gold and silver, and the Cerro Verde mine produces molybdenum concentrates.
Operating and Development Activities.
Cerro Verde Expansion.
Construction activities associated with a large-scale expansion at Cerro Verde are in progress. Engineering is approximately 80 percent complete and earthworks have commenced. The project will expand the concentrator facilities from 120,000 metric tons of ore per day to 360,000 metric tons of ore per day and provide incremental annual production of approximately 600 million pounds of copper and 15 million pounds of molybdenum beginning in 2016. Considering the long-term nature and large size of the project, actual costs could vary from these estimates. At
September 30, 2013
,
$1.1 billion
had been incurred for this project (
$0.6 billion
during the
first nine months of
2013
), with approximately $3.5 billion remaining to be incurred. Project cost estimates, based on current labor contract rates, have been revised from $4.4 billion to $4.6 billion following advanced engineering and an updated cost review. Efforts are underway to mitigate cost escalation associated with this expansion project.
An agreement has been reached with the Regional Government of Arequipa, the National Government, Servicio de Agua Potable y Alcantarillado de Arequipa S.A. (SEDAPAR) and other local institutions to allow Cerro Verde to finance the engineering and construction of a wastewater treatment plant for the city of Arequipa. Once Cerro Verde obtains a license for the treated water it would be used to supplement existing water supplies to support the concentrator expansion.
El Abra Sulfide.
We continue to evaluate a potential large-scale milling operation at El Abra to process additional sulfide material and to achieve higher recoveries. Exploration results in recent years at El Abra indicate a significant sulfide resource, which could potentially support a major mill project. Future investments will be dependent on technical studies, economic factors and global copper market conditions.
52
Operating Data.
Following is summary operating data for our South America mining operations for the
third quarters
and
first nine months of
2013
and
2012
:
|
Three Months Ended
|
Nine Months Ended
|
||||||||||||||
|
September 30,
|
September 30,
|
||||||||||||||
|
|
2013
|
2012
|
2013
|
2012
|
|||||||||||
|
Copper
(millions of recoverable pounds)
|
|
|
|||||||||||||
|
Production
|
347
|
|
311
|
|
944
|
|
908
|
|
|||||||
|
Sales
|
323
|
|
308
|
|
923
|
|
895
|
|
|||||||
|
Average realized price per pound
|
$
|
3.30
|
|
$
|
3.68
|
|
$
|
3.30
|
|
$
|
3.63
|
|
|||
|
Gold
(thousands of recoverable ounces)
|
|
|
|||||||||||||
|
Production
|
30
|
|
20
|
|
70
|
|
57
|
|
|||||||
|
Sales
|
26
|
|
21
|
|
68
|
|
56
|
|
|||||||
|
Average realized price per ounce
|
$
|
1,335
|
|
$
|
1,736
|
|
$
|
1,415
|
|
$
|
1,678
|
|
|||
|
Molybdenum
(millions of recoverable pounds)
|
|
|
|||||||||||||
|
Production
a
|
4
|
|
2
|
|
8
|
|
6
|
|
|||||||
|
SX/EW operations
|
|
|
|||||||||||||
|
Leach ore placed in stockpiles (metric tons per day)
|
287,500
|
|
248,100
|
|
276,600
|
|
229,100
|
|
|||||||
|
Average copper ore grade (percent)
|
0.48
|
|
0.55
|
|
0.49
|
|
0.55
|
|
|||||||
|
Copper production (millions of recoverable pounds)
|
110
|
|
115
|
|
329
|
|
346
|
|
|||||||
|
Mill operations
|
|
||||||||||||||
|
Ore milled (metric tons per day)
|
189,900
|
|
191,400
|
|
191,000
|
|
190,000
|
|
|||||||
|
Average ore grade:
|
|
||||||||||||||
|
Copper (percent)
|
0.71
|
|
0.59
|
|
0.62
|
|
0.58
|
|
|||||||
|
Gold (grams per metric ton)
|
0.14
|
|
0.09
|
|
0.11
|
|
0.09
|
|
|||||||
|
Molybdenum (percent)
|
0.03
|
|
0.02
|
|
0.02
|
|
0.02
|
|
|||||||
|
Copper recovery rate (percent)
|
90.5
|
|
90.7
|
|
90.4
|
|
89.5
|
|
|||||||
|
Copper production (millions of recoverable pounds)
|
237
|
|
196
|
|
615
|
|
562
|
|
|||||||
|
a.
|
Refer to "Consolidated Results" for our consolidated molybdenum sales volumes, which includes sales of molybdenum produced at Cerro Verde.
|
Consolidated copper sales volumes from South America totaled
323 million
pounds in
third-quarter
2013
and
923 million
pounds for the
first nine months of
2013
, compared to
308 million
pounds in
third-quarter
2012
and
895 million
pounds for the
first nine months of
2012
, primarily reflecting increased production at Candelaria associated with higher ore grades, partly offset by lower ore grades and timing of shipments at Cerro Verde.
For the year
2013
, consolidated sales volumes from South America mines are expected to approximate
1.3 billion
pounds of copper compared with sales of
1.25 billion
pounds of copper in
2012
, primarily reflecting higher grade ore at Candelaria. Refer to "Outlook" for projected gold and molybdenum sales volumes.
Unit Net Cash Costs.
Unit net cash costs per pound of copper is a measure intended to provide investors with information about the cash-generating capacity of our mining operations expressed on a basis relating to the primary metal product for our respective operations. We use this measure for the same purpose and for monitoring operating performance by our mining operations. This information differs from measures of performance determined in accordance with U.S. GAAP and should not be considered in isolation or as a substitute for measures of performance determined in accordance with U.S. GAAP. This measure is presented by other metals mining companies, although our measure may not be comparable to similarly titled measures reported by other companies.
53
Gross Profit per Pound of Copper
The following tables summarize unit net cash costs and gross profit per pound at the South America mining operations for the
third quarters
and
first nine months of
2013
and
2012
. Unit net cash costs per pound of copper are reflected under the by-product and co-product methods as the South America mining operations also had small amounts of molybdenum, gold and silver sales. Refer to “Product Revenues and Production Costs” for an explanation of the “by-product” and “co-product” methods and a reconciliation of unit net cash costs per pound to production and delivery costs applicable to sales reported in our consolidated financial statements.
|
Three Months Ended
|
Three Months Ended
|
||||||||||||||
|
|
September 30, 2013
|
September 30, 2012
|
|||||||||||||
|
By-Product
Method
|
Co-Product
Method
|
By-Product
Method
|
Co-Product
Method
|
||||||||||||
|
Revenues, excluding adjustments
|
$
|
3.30
|
|
$
|
3.30
|
|
$
|
3.68
|
|
$
|
3.68
|
|
|||
|
Site production and delivery, before net noncash and other costs shown below
|
1.49
|
|
1.40
|
|
1.63
|
|
1.51
|
|
|||||||
|
By-product credits
|
(0.22
|
)
|
—
|
|
(0.25
|
)
|
—
|
|
|||||||
|
Treatment charges
|
0.16
|
|
0.16
|
|
0.17
|
|
0.17
|
|
|||||||
|
Unit net cash costs
|
1.43
|
|
1.56
|
|
1.55
|
|
1.68
|
|
|||||||
|
Depreciation, depletion and amortization
|
0.26
|
|
0.25
|
|
0.24
|
|
0.23
|
|
|||||||
|
Noncash and other costs, net
|
0.05
|
|
0.02
|
|
0.07
|
|
0.04
|
|
|||||||
|
Total unit costs
|
1.74
|
|
1.83
|
|
1.86
|
|
1.95
|
|
|||||||
|
Revenue adjustments, primarily for pricing on prior period open sales
|
0.15
|
|
0.15
|
|
0.07
|
|
0.07
|
|
|||||||
|
Gross profit per pound
|
$
|
1.71
|
|
$
|
1.62
|
|
$
|
1.89
|
|
$
|
1.80
|
|
|||
|
Copper sales (millions of recoverable pounds)
|
323
|
|
323
|
|
308
|
|
308
|
|
|||||||
|
Nine Months Ended
|
Nine Months Ended
|
||||||||||||||
|
|
September 30, 2013
|
September 30, 2012
|
|||||||||||||
|
By-Product
Method
|
Co-Product
Method
|
By-Product
Method
|
Co-Product
Method
|
||||||||||||
|
Revenues, excluding adjustments
|
$
|
3.30
|
|
$
|
3.30
|
|
$
|
3.63
|
|
$
|
3.63
|
|
|||
|
Site production and delivery, before net noncash and other costs shown below
|
1.57
|
|
1.46
|
|
1.58
|
|
1.46
|
|
|||||||
|
By-product credits
|
(0.25
|
)
|
—
|
|
(0.26
|
)
|
—
|
|
|||||||
|
Treatment charges
|
0.17
|
|
0.17
|
|
0.16
|
|
0.16
|
|
|||||||
|
Unit net cash costs
|
1.49
|
|
1.63
|
|
1.48
|
|
1.62
|
|
|||||||
|
Depreciation, depletion and amortization
|
0.26
|
|
0.24
|
|
0.24
|
|
0.22
|
|
|||||||
|
Noncash and other costs, net
|
0.04
|
|
0.01
|
|
0.07
|
|
0.05
|
|
|||||||
|
Total unit costs
|
1.79
|
|
1.88
|
|
1.79
|
|
1.89
|
|
|||||||
|
Revenue adjustments, primarily for pricing on prior period open sales
|
(0.04
|
)
|
(0.04
|
)
|
0.12
|
|
0.12
|
|
|||||||
|
Gross profit per pound
|
$
|
1.47
|
|
$
|
1.38
|
|
$
|
1.96
|
|
$
|
1.86
|
|
|||
|
Copper sales (millions of recoverable pounds)
|
923
|
|
923
|
|
895
|
|
895
|
|
|||||||
Our South America mines have varying cost structures because of differences in ore grades and characteristics, processing costs, by-product credits and other factors. Unit net cash costs (net of by-product credits) averaged
$1.43
per pound of copper in
third-quarter
2013
, compared with
$1.55
per pound in
third-quarter
2012
, primarily reflecting higher volumes and lower energy costs. For the
first nine months of
2013
, average unit net cash costs of
$1.49
per pound were similar to average unit net cash costs of
$1.48
per pound for the
first nine months of
2012
.
Because certain assets are depreciated on a straight-line basis, South America's unit depreciation rate may vary with asset additions and the level of copper production and sales.
Revenue adjustments primarily result from changes in prices on provisionally priced copper sales recognized in prior periods. Refer to “Consolidated Results - Revenues” for further discussion of adjustments to prior period provisionally priced copper sales.
54
Assuming achievement of current sales volume and cost estimates and average prices of
$1,300
per ounce of gold and
$9.50
per pound of molybdenum for
fourth-quarter
2013
, we estimate that average unit net cash costs (net of by-product credits) for our South America mining operations would approximate
$1.46
per pound of copper for the year
2013
, compared with
$1.50
per pound in
2012
.
Indonesia Mining
Indonesia mining includes PT Freeport Indonesia’s Grasberg minerals district. We own 90.64 percent of PT Freeport Indonesia, including 9.36 percent owned through our wholly owned subsidiary, PT Indocopper Investama. As previously reported in Note 14 of our annual report on Form 10-K for the year ended
December 31, 2012
, we have agreed to consider a potential sale of our interest in PT Freeport Indocopper Investama at fair market value. PT Freeport Indonesia is currently engaged in discussions with the Indonesian government related to its Contract of Work (COW) and intends to conclude that process before proceeding with a potential sale of an interest in PT Indocopper Investama.
PT Freeport Indonesia produces copper concentrates, which contain significant quantities of gold and silver. Substantially all of PT Freeport Indonesia’s copper concentrates are sold under long-term contracts, of which approximately one-half is sold to Atlantic Copper (our wholly owned copper smelter) and PT Smelting (PT Freeport Indonesia’s 25-percent owned copper smelter and refinery in Indonesia) and the remainder to third-party customers.
We have established certain unincorporated joint ventures with Rio Tinto plc (Rio Tinto), under which Rio Tinto has a 40 percent interest in certain assets and future production exceeding specified annual amounts of copper, gold and silver. Refer to Note 2 in our annual report on Form 10-K for the year ended
December 31, 2012
, for discussion of our joint ventures with Rio Tinto.
On October 22, 2013, PT Freeport Indonesia entered into a new biennial Collective Labor Agreement. The terms include wage increases of 10 percent per year for the two-year period and enhanced pension and other benefits.
Operating and Development Activities.
We have several projects in progress in the Grasberg minerals district related to the development of the large-scale, long-lived, high-grade underground ore bodies. In aggregate, these underground ore bodies are expected to ramp up over several years to produce approximately 240,000 metric tons of ore per day following the transition from the Grasberg open pit, currently anticipated to occur in 2017. Over the next five years, estimated aggregate capital spending on these projects is currently expected to average $800 million per year ($630 million per year net to PT Freeport Indonesia). Considering the long-term nature and large size of these projects, actual costs could vary from these estimates.
The following provides additional information on the continued development of the Common Infrastructure project, the Grasberg Block Cave underground mine and development of the Deep Mill Level Zone (DMLZ) ore body that lies below the Deep Ore Zone (DOZ) underground mine.
Common Infrastructure and Grasberg Block Cave.
In 2004, PT Freeport Indonesia commenced its Common Infrastructure project to provide access to its large undeveloped underground ore bodies located in the Grasberg minerals district through a tunnel system located approximately 400 meters deeper than its existing underground tunnel system. In addition to providing access to our underground ore bodies, the tunnel system will enable PT Freeport Indonesia to conduct future exploration in prospective areas associated with currently identified ore bodies. The tunnel system was completed to the Big Gossan terminal, and the Big Gossan mine was brought into production in fourth-quarter 2010. Development of the DMLZ and Grasberg Block Cave underground mines is advancing using the Common Infrastructure project tunnels as access.
The Grasberg Block Cave underground mine accounts for more than 40 percent of our recoverable proven and probable reserves in Indonesia. Production at the Grasberg Block Cave mine is expected to commence in 2017, at the end of mining the Grasberg open pit (currently expected to occur at the end of 2016). Targeted production rates once the Grasberg Block Cave mining operation reaches full capacity are expected to approximate 160,000 metric tons of ore per day.
55
Aggregate mine development capital for the Grasberg Block Cave mine and associated Common Infrastructure is expected to approximate [$4.4 billion] (incurred between 2008 and 2021), with PT Freeport Indonesia’s share totaling approximately [$4.1 billion]. Aggregate project costs totaling
$1.2 billion
have been incurred through
September 30, 2013
(
$0.3 billion
during the
first nine months of
2013
).
Deep Mill Level Zone Mine.
The DMLZ ore body lies below the DOZ mine at the 2,590-meter elevation and represents the downward continuation of mineralization in the Ertsberg East Skarn system and neighboring Ertsberg porphyry. We plan to mine the ore body using a block-cave method with production beginning in 2015. Targeted production rates once the DMLZ mining operation reaches full capacity are expected to approximate 80,000 metric tons of ore per day. Drilling efforts continue to determine the extent of this ore body. Aggregate mine development capital costs for the DMLZ mine are expected to approximate [$2.3 billion] (incurred between 2009 to 2020), with PT Freeport Indonesia’s share totaling approximately [$1.4 billion]. Aggregate project costs totaling
$0.7 billion
have been incurred through
September 30, 2013
(
$0.2 billion
during the
first nine months of
2013
).
Operating Data.
Following is summary operating data for our Indonesia mining operations for the
third quarters
and
first nine months of
2013
and
2012
:
|
Three Months Ended
|
Nine Months Ended
|
||||||||||||||
|
September 30,
|
September 30,
|
||||||||||||||
|
|
2013
|
2012
|
2013
|
2012
|
|||||||||||
|
Operating Data, Net of Joint Venture Interest
|
|
|
|||||||||||||
|
Copper
(millions of recoverable pounds)
|
|
|
|||||||||||||
|
Production
|
253
|
|
199
|
|
611
|
|
495
|
|
|||||||
|
Sales
|
237
|
|
195
|
|
593
|
|
512
|
|
|||||||
|
Average realized price per pound
|
$
|
3.30
|
|
$
|
3.72
|
|
$
|
3.27
|
|
$
|
3.64
|
|
|||
|
Gold
(thousands of recoverable ounces)
|
|
|
|||||||||||||
|
Production
|
297
|
|
182
|
|
640
|
|
641
|
|
|||||||
|
Sales
|
278
|
|
178
|
|
620
|
|
691
|
|
|||||||
|
Average realized price per ounce
|
$
|
1,330
|
|
$
|
1,728
|
|
$
|
1,393
|
|
$
|
1,665
|
|
|||
|
100% Operating Data
|
|
|
|||||||||||||
|
Ore milled (metric tons per day):
a
|
|
|
|||||||||||||
|
Grasberg open pit
|
149,000
|
|
136,500
|
|
122,700
|
|
116,700
|
|
|||||||
|
DOZ underground mine
b
|
47,600
|
|
48,300
|
|
45,900
|
|
42,300
|
|
|||||||
|
Big Gossan underground mine
c
|
1,600
|
|
1,900
|
|
2,000
|
|
1,400
|
|
|||||||
|
Total
|
198,200
|
|
186,700
|
|
170,600
|
|
160,400
|
|
|||||||
|
Average ore grades:
|
|
|
|||||||||||||
|
Copper (percent)
|
0.74
|
|
0.63
|
|
0.71
|
|
0.61
|
|
|||||||
|
Gold (grams per metric ton)
|
0.65
|
|
0.46
|
|
0.57
|
|
0.60
|
|
|||||||
|
Recovery rates (percent):
|
|
||||||||||||||
|
Copper
|
89.7
|
|
87.7
|
|
89.1
|
|
88.6
|
|
|||||||
|
Gold
|
80.3
|
|
71.4
|
|
76.3
|
|
76.7
|
|
|||||||
|
Production (recoverable):
|
|
||||||||||||||
|
Copper (millions of pounds)
|
253
|
|
199
|
|
611
|
|
495
|
|
|||||||
|
Gold (thousands of ounces)
|
297
|
|
182
|
|
640
|
|
641
|
|
|||||||
|
a.
|
Amounts represent the approximate average daily throughput processed at PT Freeport Indonesia’s mill facilities from each producing mine.
|
|
b.
|
Production from the DOZ underground mine is expected to ramp up to the design rate of 80,000 metric tons of ore per day by mid-2014.
|
|
c.
|
Production from the Big Gossan underground mine is expected to ramp up to 7,000 metric tons of ore per day by 2016.
|
Third-quarter
2013
copper and gold sales volumes benefited from improved operational performance with the resumption of mining operations at PT Freeport Indonesia following the 38-day temporary suspension in second-quarter
2013
.
56
Indonesia's copper sales volumes increased to
237 million
pounds for
third-quarter
2013
and
593 million
pounds for the
first nine months of
2013
, compared with
195 million
pounds for
third-quarter
2012
and
512 million
pounds for the
first nine months of
2012
, primarily reflecting higher copper ore grades and increased mill rates.
Indonesia's gold sales volumes totaled
278 thousand
ounces for
third-quarter
2013
, compared with
178 thousand
ounces for
third-quarter
2012
primarily reflecting anticipated higher ore grades. Lower gold sales volumes of
620 thousand
ounces for the
first nine months of
2013
, compared with
691 thousand
ounces for the
first nine months of
2012
, were primarily because of timing of shipments.
At the Grasberg mine, the sequencing in mining areas with varying ore grades causes fluctuations in quarterly and annual production of copper and gold. Consolidated sales volumes from our Indonesia mining operations are expected to approximate
0.9 billion
pounds of copper and
1.0 million
ounces of gold for
2013
, compared with
0.7 billion
pounds of copper and
0.9 million
ounces of gold in
2012
. Ore grades at our Indonesia mining operations improved from levels experienced in recent quarters, and PT Freeport Indonesia expects to mine higher grade ores in 2014 through 2016, compared with average ore grades in 2012 and 2013.
Unit Net Cash Costs.
Unit net cash costs per pound of copper is a measure intended to provide investors with information about the cash-generating capacity of our mining operations expressed on a basis relating to the primary metal product for our respective operations. We use this measure for the same purpose and for monitoring operating performance by our mining operations. This information differs from measures of performance determined in accordance with U.S. GAAP and should not be considered in isolation or as a substitute for measures of performance determined in accordance with U.S. GAAP. This measure is presented by other metals mining companies, although our measure may not be comparable to similarly titled measures reported by other companies.
Gross Profit per Pound of Copper and per Ounce of Gold
The following tables summarize the unit net cash costs and gross profit per pound of copper and per ounce of gold at our Indonesia mining operations for the
third quarters
and
first nine months of
2013
and
2012
. Refer to “Production Revenues and Production Costs” for an explanation of “by-product” and “co-product” methods and a reconciliation of unit net cash costs per pound to production and delivery costs applicable to sales reported in our consolidated financial statements.
|
Three Months Ended
|
Three Months Ended
|
||||||||||||||||||||||
|
|
September 30, 2013
|
September 30, 2012
|
|||||||||||||||||||||
|
|
By-Product Method
|
Co-Product Method
|
By-Product Method
|
Co-Product Method
|
|||||||||||||||||||
|
|
Copper
|
Gold
|
Copper
|
Gold
|
|||||||||||||||||||
|
Revenues, excluding adjustments
|
$
|
3.30
|
|
$
|
3.30
|
|
$
|
1,330
|
|
$
|
3.72
|
|
$
|
3.72
|
|
$
|
1,728
|
|
|||||
|
Site production and delivery, before net noncash and other costs shown below
|
2.30
|
|
1.54
|
|
621
|
|
2.96
|
|
2.05
|
|
951
|
|
|||||||||||
|
Gold and silver credits
|
(1.65
|
)
|
—
|
|
—
|
|
(1.66
|
)
|
—
|
|
—
|
|
|||||||||||
|
Treatment charges
|
0.23
|
|
0.15
|
|
62
|
|
0.22
|
|
0.15
|
|
72
|
|
|||||||||||
|
Royalty on metals
|
0.11
|
|
0.08
|
|
31
|
|
0.13
|
|
0.09
|
|
42
|
|
|||||||||||
|
Unit net cash costs
|
0.99
|
|
1.77
|
|
714
|
|
1.65
|
|
2.29
|
|
1,065
|
|
|||||||||||
|
Depreciation and amortization
|
0.25
|
|
0.17
|
|
68
|
|
0.27
|
|
0.19
|
|
88
|
|
|||||||||||
|
Noncash and other costs, net
|
0.15
|
|
0.10
|
|
40
|
|
0.05
|
|
0.04
|
|
15
|
|
|||||||||||
|
Total unit costs
|
1.39
|
|
2.04
|
|
822
|
|
1.97
|
|
2.52
|
|
1,168
|
|
|||||||||||
|
Revenue adjustments, primarily for pricing on prior period open sales
|
0.08
|
|
0.08
|
|
17
|
|
0.04
|
|
0.04
|
|
11
|
|
|||||||||||
|
PT Smelting intercompany loss
|
(0.15
|
)
|
(0.10
|
)
|
(41
|
)
|
(0.08
|
)
|
(0.05
|
)
|
(25
|
)
|
|||||||||||
|
Gross profit per pound/ounce
|
$
|
1.84
|
|
$
|
1.24
|
|
$
|
484
|
|
$
|
1.71
|
|
$
|
1.19
|
|
$
|
546
|
|
|||||
|
Copper sales (millions of recoverable pounds)
|
237
|
|
237
|
|
|
195
|
|
195
|
|
|
|||||||||||||
|
Gold sales (thousands of recoverable ounces)
|
|
|
278
|
|
|
|
178
|
|
|||||||||||||||
57
|
Nine Months Ended
|
Nine Months Ended
|
||||||||||||||||||||||
|
|
September 30, 2013
|
September 30, 2012
|
|||||||||||||||||||||
|
|
By-Product Method
|
Co-Product Method
|
By-Product Method
|
Co-Product Method
|
|||||||||||||||||||
|
|
Copper
|
Gold
|
Copper
|
Gold
|
|||||||||||||||||||
|
Revenues, excluding adjustments
|
$
|
3.27
|
|
$
|
3.27
|
|
$
|
1,393
|
|
$
|
3.64
|
|
$
|
3.64
|
|
$
|
1,665
|
|
|||||
|
Site production and delivery, before net noncash and other costs shown below
|
2.74
|
|
1.87
|
|
795
|
|
3.20
|
|
1.95
|
|
892
|
|
|||||||||||
|
Gold and silver credits
|
(1.52
|
)
|
—
|
|
—
|
|
(2.34
|
)
|
—
|
|
—
|
|
|||||||||||
|
Treatment charges
|
0.23
|
|
0.16
|
|
67
|
|
0.21
|
|
0.13
|
|
58
|
|
|||||||||||
|
Royalty on metals
|
0.12
|
|
0.08
|
|
36
|
|
0.13
|
|
0.08
|
|
37
|
|
|||||||||||
|
Unit net cash costs
|
1.57
|
|
2.11
|
|
898
|
|
1.20
|
|
2.16
|
|
987
|
|
|||||||||||
|
Depreciation and amortization
|
0.29
|
|
0.20
|
|
85
|
|
0.30
|
|
0.18
|
|
83
|
|
|||||||||||
|
Noncash and other costs, net
|
0.21
|
|
0.14
|
|
60
|
|
0.08
|
|
0.05
|
|
22
|
|
|||||||||||
|
Total unit costs
|
2.07
|
|
2.45
|
|
1,043
|
|
1.58
|
|
2.39
|
|
1,092
|
|
|||||||||||
|
Revenue adjustments, primarily for pricing on prior period open sales
|
—
|
|
—
|
|
(2
|
)
|
0.03
|
|
0.03
|
|
4
|
|
|||||||||||
|
PT Smelting intercompany profit (loss)
|
0.01
|
|
0.01
|
|
1
|
|
(0.06
|
)
|
(0.04
|
)
|
(15
|
)
|
|||||||||||
|
Gross profit per pound/ounce
|
$
|
1.21
|
|
$
|
0.83
|
|
$
|
349
|
|
$
|
2.03
|
|
$
|
1.24
|
|
$
|
562
|
|
|||||
|
Copper sales (millions of recoverable pounds)
|
593
|
|
593
|
|
|
512
|
|
512
|
|
|
|||||||||||||
|
Gold sales (thousands of recoverable ounces)
|
|
|
620
|
|
|
|
691
|
|
|||||||||||||||
A significant portion of PT Freeport Indonesia's costs are fixed and unit costs vary depending on production volumes. Indonesia's unit net cash costs (net of gold and silver credits) decreased to
$0.99
per pound of copper in
third-quarter
2013
, compared with
$1.65
per pound in
third-quarter
2012
, primarily reflecting higher volumes and lower operating costs.
Average unit net cash costs at PT Freeport Indonesia averaged
$1.57
per pound for the
first nine months of
2013
, compared with
$1.20
per pound for the
first nine months of
2012
, primarily reflecting lower gold credits, partly offset by higher copper sales volumes.
Treatment charges vary with the volume of metals sold and the price of copper, and royalties vary with the volume of metals sold and the prices of copper and gold.
Because certain assets are depreciated on a straight-line basis, PT Freeport Indonesia’s unit depreciation rate
varies with the level of copper production and sales.
Revenue adjustments primarily result from changes in prices on provisionally priced copper sales recognized in prior periods. Refer to “Consolidated Results - Revenues” for further discussion of adjustments to prior period provisionally priced copper sales.
Intercompany profit (loss) from sales to PT Smelting represents the elimination of 25 percent of PT Freeport Indonesia's sales to PT Smelting.
Assuming achievement of current sales volume and cost estimates, and an average gold price of
$1,300
per ounce for
fourth-quarter
2013
, we estimate that Indonesia's unit net cash costs (net of gold and silver credits) are expected to approximate
$1.46
per pound of copper for the year
2013
, compared with $1.24 for the year 2012. Indonesia's projected unit net cash costs would change by approximately
$0.03
per pound for each
$50
per ounce change in the average price of gold for
fourth-quarter
2013
. Because of the fixed nature of a large portion of Indonesia's costs, unit costs vary from quarter to quarter depending on copper and gold volumes. Indonesia's unit net cash costs are expected to decline in future periods as it continues to gain access to higher grade ore.
Africa Mining
Africa mining includes Tenke Fungurume Mining S.A.R.L.'s (TFM) Tenke minerals district. We hold an effective 56 percent interest in the Tenke copper and cobalt mining concessions in the Katanga province of the DRC through our consolidated subsidiary TFM and are the operator of Tenke.
58
The Tenke operation includes surface mining, leaching and SX/EW operations. Copper production from the Tenke minerals district is sold as copper cathode. In addition to copper, the Tenke minerals district produces cobalt hydroxide.
Operating and Development Activities.
TFM completed its second phase expansion project in early 2013, which included optimizing the current plant and increasing mine, mill and processing capacity. The expanded mill has a design capacity of 14,000 metric tons of ore per day, enabling an increase in Tenke's copper production by an estimated 150 million pounds to over 430 million pounds per year. The expanded mill facility is performing well, with average throughput rates for the
first nine months of
2013
averaging
14,700
metric tons of ore per day. The addition of a second sulphuric acid plant is expected to be completed in 2016.
During third-quarter 2013, our Africa mining operations experienced several power interruptions which impacted operating rates. While the situation has improved, TFM is working closely with its power provider and DRC authorities to address the situation.
We continue to engage in exploration activities and metallurgical testing to evaluate the potential of the highly prospective Tenke minerals district. These analyses are being incorporated in future plans for potential expansions of production capacity. Future expansions are subject to a number of factors, including economic and market conditions, and the business and investment climate in the DRC.
Operating Data.
Following is summary operating data for our Africa mining operations for the
third quarters
and
first nine months of
2013
and
2012
:
|
Three Months Ended
|
Nine Months Ended
|
||||||||||||||
|
September 30,
|
September 30,
|
||||||||||||||
|
|
2013
|
2012
|
2013
|
2012
|
|||||||||||
|
Copper
(millions of recoverable pounds)
|
|
|
|||||||||||||
|
Production
|
109
|
|
91
|
|
351
|
|
250
|
|
|||||||
|
Sales
|
118
|
|
88
|
|
342
|
|
239
|
|
|||||||
|
Average realized price per pound
a
|
$
|
3.19
|
|
$
|
3.55
|
|
$
|
3.22
|
|
$
|
3.54
|
|
|||
|
Cobalt
(millions of contained pounds)
|
|
|
|||||||||||||
|
Production
|
8
|
|
8
|
|
19
|
|
20
|
|
|||||||
|
Sales
|
6
|
|
8
|
|
17
|
|
19
|
|
|||||||
|
Average realized price per pound
|
$
|
8.57
|
|
$
|
8.24
|
|
$
|
8.10
|
|
$
|
8.36
|
|
|||
|
Ore milled (metric tons per day)
|
14,500
|
|
13,600
|
|
14,700
|
|
12,900
|
|
|||||||
|
Average ore grades (percent):
|
|
||||||||||||||
|
Copper
|
3.94
|
|
3.60
|
|
4.32
|
|
3.56
|
|
|||||||
|
Cobalt
|
0.43
|
|
0.38
|
|
0.36
|
|
0.37
|
|
|||||||
|
Copper recovery rate (percent)
|
91.6
|
|
92.9
|
|
91.7
|
|
91.6
|
|
|||||||
|
a.
|
Includes point-of-sale transportation costs as negotiated in customer contracts.
|
Copper sales from TFM increased to
118 million
pounds in
third-quarter
2013
and
342 million
pounds for the
first nine months of
2013
, compared to
88 million
pounds in
third-quarter
2012
and
239 million
pounds for the
first nine months of
2012
, primarily reflecting increased mining and milling rates and higher ore grades.
For the year
2013
, we expect sales volumes from TFM to approximate
460 million
pounds of copper and
24 million
pounds of cobalt, compared with
336 million
pounds of copper and
25 million
pounds of cobalt in
2012
.
Unit Net Cash Costs.
Unit net cash costs per pound of copper is a measure intended to provide investors with information about the cash-generating capacity of our mining operations expressed on a basis relating to the primary metal product for our respective operations. We use this measure for the same purpose and for monitoring operating performance by our mining operations. This information differs from measures of performance determined in accordance with U.S. GAAP and should not be considered in isolation or as a substitute for measures of performance determined in accordance with U.S. GAAP. This measure is presented by other metals mining companies, although our measure may not be comparable to similarly titled measures reported by other companies.
59
Gross Profit per Pound of Copper and Cobalt
The following tables summarize the unit net cash costs and gross profit per pound of copper and cobalt at our Africa mining operations for the
third quarters
and
first nine months of
2013
and
2012
. Refer to “Production Revenues and Production Costs” for an explanation of “by-product” and “co-product” methods and a reconciliation of unit net cash costs per pound to production and delivery costs applicable to sales reported in our consolidated financial statements.
|
Three Months Ended
|
Three Months Ended
|
||||||||||||||||||||||
|
|
September 30, 2013
|
September 30, 2012
|
|||||||||||||||||||||
|
|
By-Product Method
|
Co-Product Method
|
By-Product Method
|
Co-Product Method
|
|||||||||||||||||||
|
|
Copper
|
Cobalt
|
Copper
|
Cobalt
|
|||||||||||||||||||
|
Revenues, excluding adjustments
a
|
$
|
3.19
|
|
$
|
3.19
|
|
$
|
8.57
|
|
$
|
3.55
|
|
$
|
3.55
|
|
$
|
8.24
|
|
|||||
|
Site production and delivery, before net noncash and other costs shown below
|
1.43
|
|
1.38
|
|
4.14
|
|
1.63
|
|
1.45
|
|
4.96
|
|
|||||||||||
|
Cobalt credits
b
|
(0.27
|
)
|
—
|
|
—
|
|
(0.48
|
)
|
—
|
|
—
|
|
|||||||||||
|
Royalty on metals
|
0.07
|
|
0.06
|
|
0.13
|
|
0.08
|
|
0.07
|
|
0.14
|
|
|||||||||||
|
Unit net cash costs
|
1.23
|
|
1.44
|
|
4.27
|
|
1.23
|
|
1.52
|
|
5.10
|
|
|||||||||||
|
Depreciation, depletion and amortization
|
0.55
|
|
0.48
|
|
1.37
|
|
0.49
|
|
0.43
|
|
0.64
|
|
|||||||||||
|
Noncash and other costs, net
|
0.02
|
|
0.02
|
|
0.06
|
|
0.07
|
|
0.06
|
|
0.08
|
|
|||||||||||
|
Total unit costs
|
1.80
|
|
1.94
|
|
5.70
|
|
1.79
|
|
2.01
|
|
5.82
|
|
|||||||||||
|
Revenue adjustments, primarily for pricing on prior period open sales
|
0.03
|
|
0.03
|
|
(0.27
|
)
|
(0.02
|
)
|
(0.02
|
)
|
0.05
|
|
|||||||||||
|
Gross profit per pound
|
$
|
1.42
|
|
$
|
1.28
|
|
$
|
2.60
|
|
$
|
1.74
|
|
$
|
1.52
|
|
$
|
2.47
|
|
|||||
|
Copper sales (millions of recoverable pounds)
|
118
|
|
118
|
|
|
88
|
|
88
|
|
|
|||||||||||||
|
Cobalt sales (millions of contained pounds)
|
|
|
6
|
|
|
|
8
|
|
|||||||||||||||
|
Nine Months Ended
|
Nine Months Ended
|
||||||||||||||||||||||
|
|
September 30, 2013
|
September 30, 2012
|
|||||||||||||||||||||
|
|
By-Product Method
|
Co-Product Method
|
By-Product Method
|
Co-Product Method
|
|||||||||||||||||||
|
|
Copper
|
Cobalt
|
Copper
|
Cobalt
|
|||||||||||||||||||
|
Revenues, excluding adjustments
a
|
$
|
3.22
|
|
$
|
3.22
|
|
$
|
8.10
|
|
$
|
3.54
|
|
$
|
3.54
|
|
$
|
8.36
|
|
|||||
|
Site production and delivery, before net noncash and other costs shown below
|
1.43
|
|
1.36
|
|
4.40
|
|
1.54
|
|
1.43
|
|
5.05
|
|
|||||||||||
|
Cobalt credits
b
|
(0.26
|
)
|
—
|
|
—
|
|
(0.39
|
)
|
—
|
|
—
|
|
|||||||||||
|
Royalty on metals
|
0.06
|
|
0.06
|
|
0.14
|
|
0.08
|
|
0.06
|
|
0.13
|
|
|||||||||||
|
Unit net cash costs
|
1.23
|
|
1.42
|
|
4.54
|
|
1.23
|
|
1.49
|
|
5.18
|
|
|||||||||||
|
Depreciation, depletion and amortization
|
0.52
|
|
0.48
|
|
0.97
|
|
0.48
|
|
0.42
|
|
0.68
|
|
|||||||||||
|
Noncash and other costs, net
|
0.06
|
|
0.05
|
|
0.09
|
|
0.09
|
|
0.08
|
|
0.12
|
|
|||||||||||
|
Total unit costs
|
1.81
|
|
1.95
|
|
5.60
|
|
1.80
|
|
1.99
|
|
5.98
|
|
|||||||||||
|
Revenue adjustments, primarily for pricing on prior period open sales
|
0.01
|
|
0.01
|
|
0.14
|
|
0.03
|
|
0.03
|
|
0.12
|
|
|||||||||||
|
Gross profit per pound
|
$
|
1.42
|
|
$
|
1.28
|
|
$
|
2.64
|
|
$
|
1.77
|
|
$
|
1.58
|
|
$
|
2.50
|
|
|||||
|
Copper sales (millions of recoverable pounds)
|
342
|
|
342
|
|
|
239
|
|
239
|
|
|
|||||||||||||
|
Cobalt sales (millions of contained pounds)
|
|
|
17
|
|
|
|
19
|
|
|||||||||||||||
|
a.
|
Includes point-of-sale transportation costs as negotiated in customer contracts.
|
|
b.
|
Net of cobalt downstream processing and freight costs.
|
Unit net cash costs (net of cobalt credits) for our Africa operations of
$1.23
per pound of copper in both the
third quarter
and
first nine months of
2013
were consistent with unit net cash costs of
$1.23
per pound in both the
third quarter
and
first nine months of
2012
, as lower cobalt credits were offset by higher copper sales volumes.
60
Assuming achievement of current sales volume and cost estimates, and an average cobalt market price of
$12
per pound for
fourth-quarter
2013
, average unit net cash costs (net of cobalt credits) are expected to approximate
$1.24
per pound of copper for the year
2013
, compared with
$1.23
per pound in
2012
. Africa's projected unit net cash costs would change by
$0.02
per pound for each
$2
per pound change in the average price of cobalt during
fourth-quarter
2013
.
Molybdenum Mines
We have two wholly owned molybdenum mines in North America – the Henderson underground mine and the Climax open-pit mine, both in Colorado. The Henderson and Climax mines produce high-purity, chemical-grade molybdenum concentrates, which are typically further processed into value-added molybdenum chemical products. The majority of the molybdenum concentrates produced at the Henderson and Climax mines, as well as from certain of our North and South America copper mines, are processed at our own conversion facilities.
Operating Data.
Following is summary operating data for the molybdenum mines for the
third quarters
and
first nine months of
2013
and
2012
:
|
Three Months Ended
|
Nine Months Ended
|
||||||||||
|
September 30,
|
September 30,
|
||||||||||
|
|
2013
|
2012
|
2013
|
2012
|
|||||||
|
Molybdenum mines operating data
|
|
|
|||||||||
|
Molybdenum production (millions of recoverable pounds)
|
12
|
|
10
|
|
37
|
|
28
|
|
|||
|
Ore milled (metric tons per day)
a
|
34,700
|
|
21,400
|
|
36,500
|
|
21,100
|
|
|||
|
Average molybdenum ore grade (percent)
a
|
0.20
|
|
0.23
|
|
0.19
|
|
0.23
|
|
|||
|
a.
|
The 2013 periods reflect operating data for the Henderson and Climax mines; the
2012
periods reflect the operating data of only the Henderson mine as start-up activities were still underway for the Climax mine.
|
Market conditions for molybdenum have declined in 2013 resulting from weak demand in the metallurgical sector and increased supply. We continually review market conditions and may make adjustments to our primary molybdenum production as market conditions warrant.
Refer to "Consolidated Results" for our consolidated molybdenum operating data, which includes sales of molybdenum produced at our molybdenum mines and at our North and South America copper mines, and refer to "Outlook" for projected consolidated molybdenum sales volumes.
Unit Net Cash Costs.
Unit net cash costs per pound of molybdenum is a measure intended to provide investors with information about the cash-generating capacity of our mining operations expressed on a basis relating to the primary metal product for our respective operations. We use this measure for the same purpose and for monitoring operating performance by our mining operations. This information differs from measures of performance determined in accordance with U.S. GAAP and should not be considered in isolation or as a substitute for measures of performance determined in accordance with U.S. GAAP. This measure is presented by other metals mining companies, although our measure may not be comparable to similarly titled measures reported by other companies.
61
Gross Profit per Pound of Molybdenum
The following table summarizes the average unit net cash costs and gross profit per pound of molybdenum at the Henderson and Climax molybdenum mines for the
third quarter
and
first nine months of
2013
and at the Henderson mine for the
third quarter
and first
nine
months of
2012
. Refer to “Product Revenues and Production Costs” for a reconciliation of unit net cash costs per pound to production and delivery costs applicable to sales reported in our consolidated financial statements.
|
Three Months Ended
|
Nine Months Ended
|
||||||||||||||
|
September 30,
|
September 30,
|
||||||||||||||
|
|
2013
a
|
2012
a
|
2013
a
|
2012
a
|
|||||||||||
|
Revenues, excluding adjustments
b
|
$
|
10.92
|
|
$
|
13.69
|
|
$
|
11.87
|
|
$
|
14.61
|
|
|||
|
Site production and delivery, before net noncash and other costs shown below
|
6.27
|
|
6.23
|
|
6.15
|
|
6.06
|
|
|||||||
|
Treatment charges and other
|
0.88
|
|
0.88
|
|
0.93
|
|
0.88
|
|
|||||||
|
Unit net cash costs
|
7.15
|
|
7.11
|
|
7.08
|
|
6.94
|
|
|||||||
|
Depreciation, depletion and amortization
|
1.71
|
|
1.00
|
|
1.66
|
|
0.95
|
|
|||||||
|
Noncash and other costs, net
|
0.54
|
|
0.52
|
|
0.29
|
|
0.21
|
|
|||||||
|
Total unit costs
|
9.40
|
|
8.63
|
|
9.03
|
|
8.10
|
|
|||||||
|
Gross profit
|
$
|
1.52
|
|
$
|
5.06
|
|
$
|
2.84
|
|
$
|
6.51
|
|
|||
|
Molybdenum production (millions of recoverable pounds)
b
|
12
|
|
9
|
|
37
|
|
26
|
|
|||||||
|
a.
|
The 2013 periods reflect operating data for the Henderson and Climax mines; the
2012
periods reflect the results of only the Henderson mine as startup activities were still underway for the Climax mine.
|
|
b.
|
Revenues reflect sales of the molybdenum mines' production to our molybdenum sales company at market-based pricing. On a consolidated basis, realizations are based on actual contract terms of sales made to third parties. As a result, our consolidated average realized price per pound of molybdenum (refer to "Consolidated Results") will differ from the amounts reported in this table.
|
Average unit net cash costs for our molybdenum mines totaled
$7.15
per pound of molybdenum in
third-quarter
2013
and
$7.08
per pound for the
first nine months of
2013
, compared with Henderson's unit net cash costs of
$7.11
per pound in
third-quarter
2012
and
$6.94
per pound for the
first nine months of
2012
. Assuming achievement of current sales volume and cost estimates, unit net cash costs for our molybdenum mines are expected to average approximately
$7.15
per pound of molybdenum for the year
2013
.
Smelting & Refining
Atlantic Copper, our wholly owned subsidiary located in Spain, smelts and refines copper concentrates and markets refined copper and precious metals in slimes. During the
first nine months of
2013
, Atlantic Copper purchased 32 percent of its concentrate requirements from our South America mining operations, 15 percent from our Indonesia mining operations and 14 percent from our North America copper mines, with the remainder purchased from third parties. Through this form of downstream integration, we are assured placement of a significant portion of our concentrate production.
Smelting and refining charges consist of a base rate and, in certain contracts, price participation based on copper prices. Treatment charges for smelting and refining copper concentrates represent a cost to our mining operations, and income to Atlantic Copper and PT Smelting. Thus, higher treatment and refining charges benefit our smelter operations and adversely affect our mining operations.
In September 2013, Atlantic Copper began a 67-day major maintenance turnaround, which is expected to have an impact of approximately $50 million on its 2013 results of operations (mostly incurred in fourth-quarter 2013).
We defer recognizing profits on sales from our mining operations to Atlantic Copper and on 25 percent of Indonesia mining's sales to PT Smelting (PT Freeport Indonesia's 25 percent-owned Indonesian smelting unit) until final sales to third parties occur. Changes in these deferrals attributable to variability in intercompany volumes resulted in net additions (reductions) to net income attributable to common stockholders totaling
$2 million
in
third-quarter
2013
and
$28 million
for the
first nine months of
2013
, compared with
$(34) million
in
third-quarter
2012
and
$(69) million
for the
first nine months of
2012
. Our net deferred profits on our inventories at Atlantic Copper and PT Smelting to be recognized in future periods’ net income attributable to common stockholders totaled
$40 million
at
September 30, 2013
. We expect intercompany sales to Atlantic Copper to increase during fourth-quarter 2013,
62
compared with third-quarter 2013, following completion of Atlantic Copper’s maintenance turnaround. Based on current estimates, we expect deferred profits attributable to intercompany sales to result in a reduction to net income approximating $50 million in fourth-quarter 2013. Quarterly variations in ore grades, the timing of intercompany shipments and changes in product prices will result in variability in our net deferred profits and quarterly earnings.
Oil and Gas Operations
During second-quarter 2013, we completed acquisitions of PXP and MMR (collectively FM O&G), adding an attractive oil and gas portfolio to our global mining business. Our oil and gas operations provide exposure to energy markets with positive fundamentals, strong margins and cash flows and a large resource base with financially attractive exploration and development investment opportunities. The portfolio of assets includes significant oil production facilities and growth potential in the Deepwater GOM, strong oil production from the onshore Eagle Ford shale play in Texas, established oil production facilities onshore and offshore California, large onshore natural gas resources in the Haynesville shale play in Louisiana, and an industry leading position in the emerging shallow water, ultra-deep gas trend on the Shelf of the GOM and onshore in South Louisiana. More than 90 percent of our oil and gas revenues are from oil and NGLs.
Exploration, Operating and Development Activities.
Our oil and gas operations have significant proved, probable and possible reserves with financially attractive organic growth opportunities. The portfolio includes a broad range of relatively low-risk development opportunities and high-potential exploration prospects. The business is being managed to reinvest its cash flows in projects with attractive rates of returns and risk profiles.
Capital expenditures for our oil and gas operations totaled
$0.9 billion
for the four months from June 1, 2013, to
September 30, 2013
, including
$299 million
incurred for Eagle Ford, $256 million for the GOM (principally Deepwater),
$110 million
for California and $104 million for the ultra-deep gas trend. Capital expenditures for our oil and gas operations, which are expected to be funded by its operating cash flows, are projected to approximate $1.5 billion for the period from June 1, 2013, to December 31, 2013, including approximately
$0.4 billion
incurred for the Deepwater GOM,
$0.5 billion
for Eagle Ford and
$0.2 billion
for the ultra-deep gas trend.
Gulf of Mexico.
Multiple development and exploration opportunities have been identified in the Deepwater GOM that are expected to benefit from tieback opportunities to available production capacity at the FM O&G operated large-scale Holstein, Marlin and Horn Mountain deepwater production platforms. Third-quarter 2013 production performance benefited from successful well stimulation activities and lower than expected downtime. In third-quarter 2013, FM O&G conducted activities to prepare the platform rig at Holstein for drilling in 2014.
At the Lucius development in Keathley Canyon (in which FM O&G has a 23.33 percent working interest) the sixth planned well, which encountered approximately 600 net feet of oil pay in the Pliocene with all sands full to base, has been drilled and is currently being completed. The geologic results from the six wells drilled confirm a significant oil resource. During third-quarter 2013, the truss spar hull was anchored in place. The sanctioned development of Lucius is a subsea development consisting of a truss spar hull located in 7,200 feet of water with a topside capacity of 80 MBbls of oil per day and 450 MMcf of gas per day. First production is anticipated in the second half of 2014.
Eagle Ford.
FM O&G has an attractive position in an oil and NGLs rich section of the Eagle Ford shale play, located in South Texas. Production from the field has grown significantly in recent years and averaged
46
MBOE per day in third-quarter
2013
. At the end of third-quarter
2013
, there were seven drilling rigs operating (of which four were operated by FM O&G) and 35 wells were drilled but waiting on completion or connection to pipelines. The current drilling program decreases the number of drilling rigs which FM O&G operates to three in fourth-quarter 2013.
California.
Development plans are principally focused on maintaining stable production levels in our long established producing fields principally onshore in California. Production averaged 39 MBOE per day in third-quarter 2013, with 95 percent from oil.
Haynesville.
We have rights to a substantial natural gas resource, estimated to exceed five trillion cubic feet (Tcf), located in the Haynesville shale play in North Louisiana. Drilling activities in recent years have been significantly reduced as a result of low natural gas prices. The field is currently being operated to maximize cash flows in a low natural gas price environment. FM O&G has flexibility to manage its drilling program and large resource to benefit from potentially higher future natural gas prices.
63
Ultra-deep Trend.
FM O&G has an industry leading position in the emerging ultra-deep trend with a significant onshore and offshore lease acreage position with high quality prospects and the potential to develop a significant long-term, low-cost source of natural gas. Data from seven wells drilled to date indicate the presence of geologic formations that are analogous to productive formations in the Deepwater GOM and onshore in the Gulf Coast region. The near-term focus is on further defining the trend onshore. FM O&G currently has one onshore ultra-deep exploration prospect in-progress, and plans to complete and perform production tests on three wells in 2014, including one onshore well.
The Lomond North exploratory well in the Highlander area (in which FM O&G has a 72 percent working interest) is currently drilling below 27,500 feet towards a proposed total depth of 30,000 feet to evaluate Lower Wilcox and Cretaceous objectives below the salt weld. The Lineham Creek exploration well (in which FM O&G has a 36 percent working interest) located in Cameron Parish was sidetracked and drilled to 24,600 feet. The results of the Lineham Creek well are under review, and FM O&G plans to propose a completion operation in the sands above 24,000 feet under the operating agreement. During 2014, FM O&G also plans to complete the Davy Jones No. 2 well (in which FM O&G has a 75 percent working interest) located on South Marsh Island Block 234, and the Blackbeard West No. 2 well (in which FM O&G has a 69 percent working interest) located on Ship Shoal Block 188.
Gulf of Mexico Shelf.
During third-quarter 2013, we initiated a process to evaluate alternatives for our shelf
oil and gas properties, including a possible divestment. Evaluation of these alternatives is ongoing.
Financial and Operating Data.
Following is summary operating results for the oil and gas operations for the
third
-quarter 2013 and the four months from June 1, 2013, to September 30,
2013
:
|
Four Months From
|
|||||||||
|
Three Months Ended
|
June 1, 2013 to
|
||||||||
|
September 30, 2013
|
September 30, 2013
|
||||||||
|
Sales Volumes
|
|||||||||
|
Oil (MMBbls)
|
11.5
|
|
14.9
|
|
|||||
|
Natural gas (Bcf)
|
23.6
|
|
31.3
|
|
|||||
|
NGLs (MMBbls)
|
1.0
|
|
1.3
|
|
|||||
|
MMBOE
|
16.5
|
|
21.5
|
|
|||||
|
Average Realizations
a
|
|||||||||
|
Oil (per barrel)
|
$
|
104.33
|
|
$
|
102.76
|
|
|||
|
Natural gas
(per MMbtu)
|
$
|
3.97
|
|
$
|
3.94
|
|
|||
|
NGLs (per barrel)
|
$
|
37.16
|
|
$
|
36.70
|
|
|||
|
Gross Profit per BOE
|
|||||||||
|
Realized revenues
a
|
$
|
80.93
|
|
$
|
79.40
|
|
|||
|
Less: Cash production costs
a
|
16.80
|
|
16.76
|
|
|||||
|
Cash operating margin
a
|
64.13
|
|
62.64
|
|
|||||
|
Less: Depreciation, depletion and amortization
|
34.15
|
|
34.07
|
|
|||||
|
Less: Accretion and other costs
|
0.70
|
|
0.80
|
|
|||||
|
Revenue adjustments for unrealized losses on derivative contracts
|
(9.58
|
)
|
(9.04
|
)
|
|||||
|
Other net adjustments
|
0.06
|
|
0.04
|
|
|||||
|
Gross profit
|
$
|
19.76
|
|
$
|
18.77
|
|
|||
|
a.
|
Cash operating margin for our oil and gas operations reflects realized revenues less cash production costs. Realized revenues exclude unrealized gains (losses) on derivative contracts and cash production costs exclude accretion and other costs. For reconciliations of realized revenues (including average realizations for oil, natural gas and NGLs) and cash production costs per BOE to revenues and production and delivery costs reported in our consolidated financial statements, refer to "Product Revenues and Production Costs."
|
Realized revenues for our oil and gas operations averaged
$80.93
per BOE in
third-quarter
2013
and
$79.40
per BOE for the four months from June 1, 2013, to September 30,
2013
. Cash production costs averaged
$16.80
per BOE in
third-quarter
2013
and
$16.76
per BOE for the four months from June 1, 2013, to September 30,
2013
. Based on current sales volume and cost estimates for
fourth-quarter
2013, cash production costs are expected to approximate
$17
per BOE for the period from June 1, 2013, to December 31, 2013.
64
Our average realized price for crude oil was
$104.33
per barrel in
third-quarter
2013
and
$102.76
per barrel for the four months from June 1, 2013, to September 30,
2013
. Excluding the impact of derivative contracts, our average realized price for crude oil was
$106.00
per barrel in
third-quarter
2013
(
97 percent
of the average Brent crude oil price of
$109.59
per barrel) and
$103.96
per barrel for the four months from June 1, 2013, to September 30,
2013
(96 percent of the average Brent crude oil price of $108.15 per barrel).
The NYMEX gas prices for the July, August and September 2013 contracts averaged
$3.58
per MMBtu. Our average realized price for natural gas was
$3.97
per MMBtu in
third-quarter
2013
and
$3.94
per MMBtu for the four months from June 1, 2013, to September 30,
2013
. Excluding the impact of derivative contracts, our average realized price for natural gas was
$3.67
per MMBtu in
third-quarter
2013
and
$3.70
per MMBtu for the four months from June 1, 2013, to September 30,
2013
.
The following table presents average sales volumes per day by region for our oil and gas operations for third-quarter 2013 and the four months from June 1, 2013, to September 30,
2013
:
|
Four Months From
|
|||
|
Three Months Ended
|
June 1, 2013, to
|
||
|
September 30, 2013
|
September 30, 2013
|
||
|
Sales Volumes (MBOE per day):
|
|||
|
GOM
a
|
73
|
71
|
|
|
Eagle Ford
|
46
|
45
|
|
|
California
|
39
|
38
|
|
|
Haynesville/Madden/Other
|
21
|
22
|
|
|
Total oil and gas operations
|
179
|
176
|
|
|
a.
|
Includes sales from properties on the GOM Shelf and in the Deepwater GOM. Production from the GOM Shelf totaled 13 MBOE per day (18 percent of the GOM total) for both third-quarter 2013 and the four months from June 1, 2013, to September 30, 2013.
|
Daily sales volumes averaged
179
MBOE in
third-quarter
2013
, including
125
MBbls of crude oil per day,
256
MMcf of natural gas per day and
11
MBbls of NGLs per day; and averaged
176
MBOE for the period June 1, 2013, to September 30, 2013, including
122
MBbls of crude oil per day,
258
MMcf of natural gas per day and
11
MBbls of NGLs per day.
CAPITAL RESOURCES AND LIQUIDITY
Our operating cash flows vary with prices realized from copper, gold, molybdenum and oil, our sales volumes, production costs, income taxes, other working capital changes and other factors. We are taking steps to achieve significant reductions and deferrals of capital expenditures, operating, exploration and other costs following our July 2013 announcement of $1.9 billion in targeted reductions for 2013 and 2014. We are reviewing our portfolio of assets for opportunities to accelerate our deleveraging plans through potential asset sales, joint venture transactions or further adjustments to capital spending plans.
Cash
Following is a summary of the U.S. and international components of consolidated cash and cash equivalents, including cash available to the parent company, net of noncontrolling interests' share, taxes and other costs at
September 30, 2013
, and
December 31, 2012
(in billions):
|
September 30, 2013
|
December 31, 2012
|
||||||
|
Cash at domestic companies
|
$
|
0.1
|
|
$
|
1.3
|
|
|
|
Cash at international operations
|
2.1
|
|
2.4
|
|
|||
|
Total consolidated cash and cash equivalents
|
2.2
|
|
3.7
|
|
|||
|
Less: Noncontrolling interests’ share
|
(0.8
|
)
|
(0.8
|
)
|
|||
|
Cash, net of noncontrolling interests’ share
|
1.4
|
|
2.9
|
|
|||
|
Less: Withholding taxes and other
|
(0.1
|
)
|
(0.2
|
)
|
|||
|
Net cash available
|
$
|
1.3
|
|
$
|
2.7
|
|
|
Cash held at our international operations is generally used to support our foreign operations' capital expenditures, operating expenses, working capital and other tax payments, or other cash needs. Management believes that sufficient liquidity is available in the U.S. from cash balances and availability from our revolving credit facility and
65
uncommitted lines of credit (refer to Note 7). With the exception of TFM, we have not elected to permanently reinvest earnings from our foreign subsidiaries, and we have recorded deferred tax liabilities for foreign earnings that are available to be repatriated to the U.S. From time to time, our foreign subsidiaries distribute earnings to the U.S. through dividends, which are subject to applicable withholding taxes and noncontrolling interests' share.
Debt
Following is a summary of total debt and related weighted-average interest rates at
September 30, 2013
:
|
Weighted-
|
||||||
|
September 30, 2013
|
Average
|
|||||
|
(in billions)
|
Interest Rate
|
|||||
|
Acquisition-related debt
|
$
|
10.5
|
|
a
|
3.1%
|
|
|
Assumed debt of PXP and MMR
|
7.1
|
|
b
|
7.0%
|
||
|
FCX's previously existing debt
|
3.5
|
|
3.5%
|
|||
|
$
|
21.1
|
|
4.4%
|
|||
a. Proceeds from the issuance of $6.5 billion of senior notes and a $4.0 billion unsecured term loan were used to finance the acquisitions of PXP and MMR, repay certain PXP debt and for general corporate purposes. Refer to Note 7 for further discussion.
b. Refer to Note 7 for further discussion of repayments of debt assumed in the acquisitions of PXP and MMR.
We are targeting reductions in total debt to $12 billion over the next three years. We will continue to review our portfolio of assets and will consider opportunities to accelerate our deleveraging plans through potential asset sales, joint venture transactions or further adjustments to capital spending plans.
Upon closing of the PXP acquisition, we replaced our revolving credit facility that was scheduled to expire in March 2016 with a new
$3.0 billion
senior unsecured revolving credit facility, which is available through May 2018. At
September 30, 2013
, we had no borrowings outstanding and
$46 million
of letters of credit issued under our revolving credit facility, resulting in availability of
$3.0 billion
.
During third-quarter 2013, we entered into uncommitted unsecured lines of credit with three financial institutions totaling
$450 million
, which have terms and pricing that are more favorable than our revolving credit faciility. As of September 30, 2013, there were no borrowings drawn on these lines of credit.
On October 15, 2013, we announced our intent to redeem the $0.3 billion of MMR's outstanding 11.875% Senior Notes due 2014 on November 15, 2013. Holders will receive the principal amount together with accrued and unpaid interest to the redemption date. FCX expects to use the proceeds from its revolving credit facility to redeem a substantial portion of these senior notes.
Refer to Notes
7
and
12
for further discussion of our debt.
Operating Activities
During the
first nine months of
2013
, we generated operating cash flows totaling
$3.7 billion
(net of
$0.5 billion
for working capital uses and changes in other tax payments), compared with operating cash flows for the
first nine months of
2012
of
$2.5 billion
(net of
$1.5 billion
for working capital uses and changes in other tax payments). Operating cash flows for the first nine months of 2013 benefited from our oil and gas operations, partly offset by reductions in Atlantic Copper's trade accounts payable balances leading up to its major maintenance turnaround that began in September 2013. Operating cash flows for first nine months of 2012 reflected increases in receivable balances, primarily as a result of PT Freeport Indonesia restarting its operations following the 2011 suspension of operations, increases in inventories and timing of income tax payments.
Based on current operating plans and subject to future copper, gold, molybdenum and oil prices, we expect estimated operating cash flows for the year
2013
plus available cash to be sufficient to fund our budgeted capital expenditures, dividends, noncontrolling interest distributions and other cash requirements for the year. Refer to “Outlook” for further discussion of projected operating cash flows for the year
2013
.
66
Investing Activities
Capital Expenditures.
Capital expenditures, including capitalized interest, totaled
$3.6 billion
for the
first nine months of
2013
(including
$0.9 billion
for oil and gas operations since June 1, 2013), compared with
$2.5 billion
for the
first nine months of
2012
. Increased capital expenditures for the
first nine months of
2013
associated with the expansion projects at Morenci and Cerro Verde and our underground development activities at Grasberg, were partly offset by decreased spending at Tenke and at the Climax mine. Refer to “Operations” for further discussion.
Capital expenditures are expected to approximate
$5.5 billion
for the year
2013
, including
$2.4 billion
for major projects at our mining operations and
$1.5 billion
for our oil and gas operations (for the period from June 1, 2013, to December 31, 2013). Major projects at our mining operations for
2013
primarily include the expansion projects at Cerro Verde and Morenci and underground development activities at Grasberg. Capital expenditures for our oil and gas operations are expected to be funded by its operating cash flows. Capital spending plans remain under review and will be revised as market conditions warrant. Refer to "Operations" for further discussion.
Acquisitions.
In second-quarter 2013, we paid $3.5 billion in cash (net of $315 million of cash acquired) for the acquisition of PXP and $1.6 billion in cash (net of $29 million of cash acquired) for the acquisition of MMR.
In first-quarter 2013, we paid
$348 million
(net of
$34 million
of cash acquired) to fund the acquisition of a cobalt chemical refinery in Kokkola, Finland, and the related sales and marketing business. The acquisition was funded
70 percent
by us and
30 percent
by Lundin.
Refer to Note
2
for further discussion of these acquisitions.
Financing Activities
Debt Transactions.
In first-quarter 2013, we sold
$6.5 billion
of senior notes in four tranches with a weighted-average interest rate of
3.9 percent
, and in second-quarter 2013, we borrowed $4.0 billion under an unsecured bank term loan with an interest rate of LIBOR plus 1.50 percent. Net proceeds from these borrowings were used to fund the acquisitions of PXP and MMR, repay certain debt of PXP and for general corporate purposes.
In first-quarter 2012, we sold
$3.0 billion
of senior notes in three tranches with a weighted-average interest rate of 3.0 percent. Net proceeds from this offering, plus cash on hand, were used to redeem the remaining
$3.0 billion
of our
8.375%
Senior Notes.
Refer to Note
7
for further discussion of these transactions.
Dividends and Other Equity Transactions.
We paid dividends on our common stock totaling
$2.0 billion
for the
first nine months of
2013
(which included $1.0 billion for a supplemental dividend of $1.00 per share paid on July 1, 2013) and
$832 million
for the
first nine months of
2012
. The current annual dividend rate for our common stock is $1.25 per share (
$0.3125
per share quarterly). The declaration of dividends is at the discretion of the Board and will depend upon our financial results, cash requirements, future prospects and other factors deemed relevant by the Board. The Board will continue to review our financial policy on an ongoing basis.
Cash dividends and other distributions paid to noncontrolling interests totaled
$157 million
for the
first nine months of
2013
and
$76 million
for the
first nine months of
2012
. These payments will vary based on the cash requirements of our consolidated subsidiaries.
Conversion of MMR's 8% Convertible Perpetual Preferred Stock and 5.75% Convertible Perpetual Preferred Stock, Series 1 required cash payments of
$227 million
during the first nine months of 2013. Refer to Note 2 for further discussion.
67
CONTRACTUAL OBLIGATIONS
In connection with the second-quarter 2013 oil and gas acquisitions, contractual obligations (including debt) have increased. The following table, as of
September 30, 2013
, reflects an update to the similar table presented in our annual report on Form 10-K for the year ended
December 31, 2012
, and the effect such obligations are expected to have on our liquidity and cash flows in future periods for those obligations with significant changes (in millions):
|
Total
|
Fourth-quarter 2013
|
2014 to
2015
|
2016 to
2017
|
Thereafter
|
|||||||||||||||
|
Debt maturities
|
$
|
21,123
|
|
$
|
67
|
|
$
|
1,664
|
|
$
|
1,450
|
|
$
|
17,942
|
|
||||
|
Scheduled interest payment obligations
a
|
9,095
|
|
170
|
|
1,730
|
|
1,639
|
|
5,556
|
|
|||||||||
|
Reclamation and environmental obligations
b
|
6,853
|
|
112
|
|
521
|
|
412
|
|
5,808
|
|
|||||||||
|
Take-or-pay contracts
c
|
4,417
|
|
598
|
|
2,014
|
|
1,395
|
|
410
|
|
|||||||||
|
Total
d
|
$
|
41,488
|
|
$
|
947
|
|
$
|
5,929
|
|
$
|
4,896
|
|
$
|
29,716
|
|
||||
|
a.
|
Scheduled interest payment obligations were calculated using stated coupon rates for fixed-rate debt and interest rates applicable at
September 30, 2013
, for variable-rate debt.
|
|
b.
|
Represents estimated cash payments, on an undiscounted and unescalated basis, associated with reclamation and environmental activities (including $1.6 billion for our recently acquired oil and gas operations). The timing and the amount of these payments could change as a result of changes in regulatory requirements, changes in scope and timing of reclamation activities, the settlement of environmental matters and as actual spending occurs. Refer to Note 8 (and also to Note 13 in our annual report on Form 10-K for the year ended
December 31, 2012
), for additional discussion of reclamation and environmental matters.
|
|
c.
|
Represents contractual obligations for purchases of goods or service agreements enforceable and legally binding and that specify all significant terms, including
$2.3 billion
assumed in connection with the acquired oil and gas operations, primarily comprising minimum commitments for ultra-deepwater drillships for the GOM drilling campaign (
$1.5 billion
) and deferred premiums costs and future interest expected to be accrued on the crude oil option contracts (
$0.5 billion
). The remaining take-or-pay contracts primarily are comprised of the procurement of copper concentrates ($0.8 billion), electricity ($0.5 billion) and transportation services ($0.5 billion). Some of our take-or-pay contracts are settled based on the prevailing market rate for the service or commodity purchased, and in some cases, the amount of the actual obligation may change over time because of market conditions. Obligations for copper concentrates provide for deliveries of specified volumes to Atlantic Copper at market-based prices. Electricity obligations are primarily for contractual minimum demand at the South America and Tenke mines. Transportation obligations are primarily for South America contracted ocean freight and for North America rail freight.
|
|
d.
|
This table excludes operating lease obligations and certain other obligations in our consolidated balance sheets, including estimated funding for pension obligations as the funding may vary from year to year based on changes in the fair value of plan assets and actuarial assumptions, accrued liabilities that relate to unrecognized tax benefits where the timing of settlement is not determinable; and others that are further described in our annual report on Form 10-K for the year ended December 31, 2012. This table also excludes purchase orders for the purchase of inventory and other goods and services, as purchase orders typically represent authorizations to purchase rather than binding agreements.
|
CONTINGENCIES
Environmental and Reclamation Matters
Our current and historical operating activities are subject to stringent laws and regulations governing the protection of the environment. We perform a comprehensive annual review of our environmental and reclamation obligations and also review changes in facts and circumstances associated with these obligations at least quarterly. During second-quarter
2013
, we assumed
$1.0 billion
of closure obligations associated with our acquired oil and gas operations. Updated cost assumptions, including increases and decreases to cost estimates, changes in the anticipated scope and timing of remediation activities and settlement of environmental matters may result in revisions to certain of our environmental obligations. We recorded net reductions to environmental obligations totaling
$28 million
in
third-quarter
2013
and
$27 million
for the
first nine months of
2013
, compared with
$82 million
in the
third-quarter
2012
and
$36 million
during the
first nine months of
2012
.
Refer to Note 8 and 12 (and also to Note 13 in our annual report on Form 10-K for the year ended
December 31, 2012
), for further information regarding our reclamation and environmental obligations.
Litigation and Other Contingencies
Other than as disclosed in Notes
8
and 12, and contained in "Legal Proceedings" in Part II, Item 1. of this quarterly report, there have been no material changes to our contingencies associated with legal proceedings and other
68
matters since year-end
2012
. Refer to Note 13 and "Legal Proceedings" contained in Part I, Item 3. of our annual report on Form 10-K for the year ended
December 31, 2012
, for further information regarding legal proceedings and other matters.
DISCLOSURE ABOUT MARKET RISKS
During second-quarter 2013, we completed the acquisitions of PXP and MMR. Accordingly, the following presents updated disclosures about market risks contained in our annual report on Form 10-K for the year ended December 31, 2012.
Commodity Price Risk
In addition to the commodity price risk associated with the market prices of copper, gold and molybdenum, as described in our annual report on Form 10-K for the year ended December 31, 2012, our financial results may vary with fluctuations in oil prices. Market prices for crude oil have fluctuated historically and are affected by numerous factors beyond our control. Because we cannot control the price of our products, including oil, the key measure that management focuses on in operating our business are sales volumes, production costs and operating cash flows. Refer to “Outlook” for further discussion of projected sales volumes, unit net cash costs for our mining operations, cash production costs per BOE for our oil and gas operations and operating cash flows.
Our recently acquired oil and gas operations have historically used derivative contracts to manage commodity price risk for a substantial portion of its oil and gas production. In connection with the acquisition of PXP, we assumed PXP's 2013, 2014 and 2015 derivative contracts that consist of crude oil options, and crude oil and natural gas swaps. As a result, we may not benefit fully from increases in oil and gas prices above the maximum fixed amount specified in the derivative contracts. Because the oil and gas derivative contracts do not qualify or are not designated as hedging instruments, they are recorded at fair value with the mark-to-market gains and losses recorded in revenues. We expect fluctuations in our consolidated statements of income as changes occur in the index prices. Refer to "Consolidated Results - Revenues" for losses on oil and gas derivative contracts recognized in
third-quarter
2013
and for the four months from June 1, 2013, to September 30, 2013.
Following presents the estimated (increase) decrease in net liability of a 10 percent change in Brent crude oil and NYMEX forward prices on the fair values of outstanding oil and natural gas derivative contracts, compared with the forward prices used to determine the fair values at
September 30, 2013
:
|
10% Increase
|
10% Decrease
|
||||||
|
Crude oil puts
|
$
|
(115
|
)
|
$
|
197
|
|
|
|
Crude oil collars
|
(4
|
)
|
10
|
|
|||
|
Crude oil swaps
|
(39
|
)
|
39
|
|
|||
|
Natural gas swaps
|
(17
|
)
|
17
|
|
|||
|
$
|
(175
|
)
|
$
|
263
|
|
||
Refer to Note 9 for further discussion of our oil and gas derivative contracts.
These contracts may expose us to the risk of financial loss in certain circumstances. Our derivative arrangements provide us protection on the underlying volumes if prices decline below the prices at which these derivatives are set, but ceiling prices in our derivatives may cause us to receive less revenue on the volumes than we would receive in the absence of derivatives.
NEW ACCOUNTING STANDARDS
We do not expect the impact of recently issued accounting standards to have a significant impact on our future financial statements and disclosures.
69
PRODUCT REVENUES AND PRODUCTION COSTS
Mining Product Revenues and Unit Net Cash Cost.
Unit net cash costs per pound of copper and molybdenum are measures intended to provide investors with information about the cash-generating capacity of our mining operations expressed on a basis relating to the primary metal product for the respective operations. We use this measure for the same purpose and for monitoring operating performance by our mining operations. This information differs from measures of performance determined in accordance with U.S. GAAP and should not be considered in isolation or as a substitute for measures of performance determined in accordance with U.S. GAAP. This measure is presented by other metals mining companies, although our measures may not be comparable to similarly titled measures reported by other companies.
We present gross profit per pound of copper in the following tables using both a “by-product” method and a “co-product” method. We use the by-product method in our presentation of gross profit per pound of copper because (i) the majority of our revenues are copper revenues, (ii) we mine ore, which contains copper, gold, molybdenum and other metals, (iii) it is not possible to specifically assign all of our costs to revenues from the copper, gold, molybdenum and other metals we produce, (iv) it is the method used to compare mining operations in certain industry publications and (v) it is the method used by our management and the Board to monitor operations. In the co-product method presentation below, shared costs are allocated to the different products based on their relative revenue values, which will vary to the extent our metals sales volumes and realized prices change.
We show revenue adjustments for prior period open sales as separate line items. Because these adjustments do not result from current period sales, we have reflected these separately from revenues on current period sales. Noncash and other costs consist of items such as stock-based compensation costs, start-up costs, write-offs of equipment and/or unusual charges. They are removed from site production and delivery costs in the calculation of unit net cash costs. As discussed above, gold, molybdenum and other metal revenues at copper mines are reflected as credits against site production and delivery costs in the by-product method. The following schedules for our mining operations are presentations under both the by-product and co-product methods together with reconciliations to amounts reported in our consolidated financial statements.
Oil & Gas Product Revenues and Cash Production Costs per Unit.
Realized revenues and cash production costs per unit are measures intended to provide investors with information about the cash operating margin of our oil and gas operations expressed on a basis relating to each product sold. We use this measure for the same purpose and for monitoring operating performance by our oil and gas operations. This information differs from measures of performance determined in accordance with U.S. GAAP and should not be considered in isolation or as a substitute for measures of performance determined in accordance with U.S. GAAP. Our measures may not be comparable to similarly titled measures reported by other companies.
We show revenue adjustments from derivative contracts as separate line items. Because these adjustments do not result from oil and gas sales, these gains and losses have been reflected separately from revenues on current period sales. Additionally, accretion and other costs are removed from production and delivery costs in the calculation of cash production costs per BOE. The following schedules include calculations of oil and gas product revenues and cash production costs together with a reconciliation to amounts reported in our consolidated financial statements.
70
North America Copper Mines Product Revenues and Production Costs
|
Three Months Ended September 30, 2013
|
|
|
|||||||||||||||||
|
(In millions)
|
By-Product
|
Co-Product Method
|
|||||||||||||||||
|
Method
|
Copper
|
Molybdenum
a
|
Other
b
|
Total
|
|||||||||||||||
|
Revenues, excluding adjustments
|
$
|
1,183
|
|
$
|
1,183
|
|
$
|
89
|
|
$
|
27
|
|
$
|
1,299
|
|
||||
|
Site production and delivery, before net noncash and other costs shown below
|
725
|
|
701
|
|
35
|
|
18
|
|
754
|
|
|||||||||
|
By-product credits
|
(87
|
)
|
—
|
|
—
|
|
—
|
|
—
|
|
|||||||||
|
Treatment charges
|
35
|
|
34
|
|
—
|
|
1
|
|
35
|
|
|||||||||
|
Net cash costs
|
673
|
|
735
|
|
35
|
|
19
|
|
789
|
|
|||||||||
|
Depreciation, depletion and amortization
|
100
|
|
97
|
|
2
|
|
1
|
|
100
|
|
|||||||||
|
Noncash and other costs, net
|
27
|
|
27
|
|
—
|
|
—
|
|
27
|
|
|||||||||
|
Total costs
|
800
|
|
859
|
|
37
|
|
20
|
|
916
|
|
|||||||||
|
Revenue adjustments, primarily for pricing on prior period open sales
|
9
|
|
9
|
|
—
|
|
—
|
|
9
|
|
|||||||||
|
Gross profit
|
$
|
392
|
|
$
|
333
|
|
$
|
52
|
|
$
|
7
|
|
$
|
392
|
|
||||
|
Copper sales (millions of recoverable pounds)
|
362
|
|
362
|
|
|||||||||||||||
|
Molybdenum sales (millions of recoverable pounds)
a
|
9
|
|
|||||||||||||||||
|
Gross profit per pound of copper and molybdenum:
|
|||||||||||||||||||
|
Revenues, excluding adjustments
|
$
|
3.27
|
|
$
|
3.27
|
|
$
|
10.24
|
|
||||||||||
|
Site production and delivery, before net noncash
|
|||||||||||||||||||
|
and other costs shown below
|
2.00
|
|
1.94
|
|
4.01
|
|
|||||||||||||
|
By-product credits
a
|
(0.24
|
)
|
—
|
|
—
|
|
|||||||||||||
|
Treatment charges
|
0.10
|
|
0.09
|
|
—
|
|
|||||||||||||
|
Unit net cash costs
|
1.86
|
|
2.03
|
|
4.01
|
|
|||||||||||||
|
Depreciation, depletion and amortization
|
0.27
|
|
0.27
|
|
0.24
|
|
|||||||||||||
|
Noncash and other costs, net
|
0.08
|
|
0.07
|
|
0.03
|
|
|||||||||||||
|
Total unit costs
|
2.21
|
|
2.37
|
|
4.28
|
|
|||||||||||||
|
Revenue adjustments, primarily for pricing
|
|||||||||||||||||||
|
on prior period open sales
|
0.02
|
|
0.02
|
|
—
|
|
|||||||||||||
|
Gross profit per pound
|
$
|
1.08
|
|
$
|
0.92
|
|
$
|
5.96
|
|
||||||||||
|
Reconciliation to Amounts Reported
|
|
|
|
|
|
||||||||||||||
|
(In millions)
|
Revenues
|
Production and Delivery
|
Depreciation, Depletion and Amortization
|
|
|
||||||||||||||
|
Totals presented above
|
$
|
1,299
|
|
$
|
754
|
|
$
|
100
|
|
|
|
||||||||
|
Treatment charges
|
—
|
|
35
|
|
—
|
|
|
|
|||||||||||
|
Net noncash and other costs
|
—
|
|
27
|
|
—
|
|
|
|
|||||||||||
|
Revenue adjustments, primarily for pricing on prior period open sales
|
9
|
|
—
|
|
—
|
|
|
|
|||||||||||
|
Eliminations and other
|
(7
|
)
|
(9
|
)
|
2
|
|
|
|
|||||||||||
|
North America copper mines
|
1,301
|
|
807
|
|
102
|
|
|
|
|||||||||||
|
Other mining & eliminations
c
|
3,688
|
|
2,235
|
|
251
|
|
|||||||||||||
|
Total mining
|
4,989
|
|
3,042
|
|
353
|
|
|||||||||||||
|
Oil & gas operations
|
1,176
|
|
288
|
|
563
|
|
|||||||||||||
|
Corporate, other & eliminations
|
—
|
|
2
|
|
3
|
|
|
|
|||||||||||
|
As reported in FCX’s consolidated financial statements
|
$
|
6,165
|
|
$
|
3,332
|
|
$
|
919
|
|
|
|
||||||||
|
a.
|
Reflects sales of molybdenum produced by certain of the North America copper mines to our molybdenum sales company at market-based pricing.
|
|
b.
|
Includes gold and silver product revenues and production costs.
|
|
c.
|
Represents the combined total for all other mining operations and the related eliminations, as presented in Note
13
.
|
71
North America Copper Mines Product Revenues and Production Costs (continued)
|
Three Months Ended September 30, 2012
|
|
|
|||||||||||||||||
|
(In millions)
|
By-Product
|
Co-Product Method
|
|||||||||||||||||
|
Method
|
Copper
|
Molybdenum
a
|
Other
b
|
Total
|
|||||||||||||||
|
Revenues, excluding adjustments
|
$
|
1,183
|
|
$
|
1,183
|
|
$
|
103
|
|
$
|
21
|
|
$
|
1,307
|
|
||||
|
Site production and delivery, before net noncash and other costs shown below
|
649
|
|
584
|
|
71
|
|
13
|
|
668
|
|
|||||||||
|
By-product credits
|
(105
|
)
|
—
|
|
—
|
|
—
|
|
—
|
|
|||||||||
|
Treatment charges
|
40
|
|
39
|
|
—
|
|
1
|
|
40
|
|
|||||||||
|
Net cash costs
|
584
|
|
623
|
|
71
|
|
14
|
|
708
|
|
|||||||||
|
Depreciation, depletion and amortization
|
84
|
|
78
|
|
5
|
|
1
|
|
84
|
|
|||||||||
|
Noncash and other costs, net
|
40
|
|
38
|
|
1
|
|
1
|
|
40
|
|
|||||||||
|
Total costs
|
708
|
|
739
|
|
77
|
|
16
|
|
832
|
|
|||||||||
|
Revenue adjustments, primarily for pricing on prior period open sales
|
5
|
|
5
|
|
—
|
|
—
|
|
5
|
|
|||||||||
|
Gross profit
|
$
|
480
|
|
$
|
449
|
|
$
|
26
|
|
$
|
5
|
|
$
|
480
|
|
||||
|
Copper sales (millions of recoverable pounds)
|
330
|
|
330
|
|
|||||||||||||||
|
Molybdenum sales (millions of recoverable pounds)
a
|
8
|
|
|||||||||||||||||
|
Gross profit per pound of copper and molybdenum:
|
|||||||||||||||||||
|
Revenues, excluding adjustments
|
$
|
3.58
|
|
$
|
3.58
|
|
$
|
12.58
|
|
||||||||||
|
Site production and delivery, before net noncash
|
|||||||||||||||||||
|
and other costs shown below
|
1.97
|
|
1.77
|
|
8.60
|
|
|||||||||||||
|
By-product credits
a
|
(0.32
|
)
|
—
|
|
—
|
|
|||||||||||||
|
Treatment charges
|
0.12
|
|
0.12
|
|
—
|
|
|||||||||||||
|
Unit net cash costs
|
1.77
|
|
1.89
|
|
8.60
|
|
|||||||||||||
|
Depreciation, depletion and amortization
|
0.25
|
|
0.23
|
|
0.63
|
|
|||||||||||||
|
Noncash and other costs, net
|
0.12
|
|
0.11
|
|
0.15
|
|
|||||||||||||
|
Total unit costs
|
2.14
|
|
2.23
|
|
9.38
|
|
|||||||||||||
|
Revenue adjustments, primarily for pricing
|
|||||||||||||||||||
|
on prior period open sales
|
0.01
|
|
0.01
|
|
—
|
|
|||||||||||||
|
Gross profit per pound
|
$
|
1.45
|
|
$
|
1.36
|
|
$
|
3.20
|
|
||||||||||
|
Reconciliation to Amounts Reported
|
|
|
|
|
|
||||||||||||||
|
(In millions)
|
Revenues
|
Production and Delivery
|
Depreciation, Depletion and Amortization
|
|
|
||||||||||||||
|
Totals presented above
|
$
|
1,307
|
|
$
|
668
|
|
$
|
84
|
|
|
|
||||||||
|
Treatment charges
|
—
|
|
40
|
|
—
|
|
|
|
|||||||||||
|
Net noncash and other costs
|
—
|
|
40
|
|
—
|
|
|
|
|||||||||||
|
Revenue adjustments, primarily for pricing on prior period open sales
|
5
|
|
—
|
|
—
|
|
|
|
|||||||||||
|
Eliminations and other
|
3
|
|
(5
|
)
|
4
|
|
|
|
|||||||||||
|
North America copper mines
|
1,315
|
|
743
|
|
88
|
|
|
|
|||||||||||
|
Other mining & eliminations
c
|
3,101
|
|
1,847
|
|
208
|
|
|||||||||||||
|
Total mining
|
4,416
|
|
2,590
|
|
296
|
|
|||||||||||||
|
Oil & gas operations
|
—
|
|
—
|
|
—
|
|
|||||||||||||
|
Corporate, other & eliminations
|
1
|
|
2
|
|
2
|
|
|
|
|||||||||||
|
As reported in FCX’s consolidated financial statements
|
$
|
4,417
|
|
$
|
2,592
|
|
$
|
298
|
|
|
|
||||||||
|
a.
|
Reflects sales of molybdenum produced by certain of the North America copper mines to our molybdenum sales company at market-based pricing.
|
|
b.
|
Includes gold and silver product revenues and production costs.
|
|
c.
|
Represents the combined total for all other mining operations and the related eliminations, as presented in Note
13
.
|
72
North America Copper Mines Product Revenues and Production Costs (continued)
|
Nine Months Ended September 30, 2013
|
|
|
|||||||||||||||||
|
(In millions)
|
By-Product
|
Co-Product Method
|
|||||||||||||||||
|
Method
|
Copper
|
Molybdenum
a
|
Other
b
|
Total
|
|||||||||||||||
|
Revenues, excluding adjustments
|
$
|
3,655
|
|
$
|
3,655
|
|
$
|
280
|
|
$
|
80
|
|
$
|
4,015
|
|
||||
|
Site production and delivery, before net noncash and other costs shown below
|
2,201
|
|
2,130
|
|
101
|
|
56
|
|
2,287
|
|
|||||||||
|
By-product credits
|
(274
|
)
|
—
|
|
—
|
|
—
|
|
—
|
|
|||||||||
|
Treatment charges
|
112
|
|
109
|
|
—
|
|
3
|
|
112
|
|
|||||||||
|
Net cash costs
|
2,039
|
|
2,239
|
|
101
|
|
59
|
|
2,399
|
|
|||||||||
|
Depreciation, depletion and amortization
|
303
|
|
293
|
|
6
|
|
4
|
|
303
|
|
|||||||||
|
Noncash and other costs, net
|
88
|
|
87
|
|
1
|
|
—
|
|
88
|
|
|||||||||
|
Total costs
|
2,430
|
|
2,619
|
|
108
|
|
63
|
|
2,790
|
|
|||||||||
|
Revenue adjustments, primarily for pricing on prior period open sales
|
(4
|
)
|
(4
|
)
|
—
|
|
—
|
|
(4
|
)
|
|||||||||
|
Gross profit
|
$
|
1,221
|
|
$
|
1,032
|
|
$
|
172
|
|
$
|
17
|
|
$
|
1,221
|
|
||||
|
Copper sales (millions of recoverable pounds)
|
1,084
|
|
1,084
|
|
|||||||||||||||
|
Molybdenum sales (millions of recoverable pounds)
a
|
26
|
|
|||||||||||||||||
|
Gross profit per pound of copper and molybdenum:
|
|||||||||||||||||||
|
Revenues, excluding adjustments
|
$
|
3.37
|
|
$
|
3.37
|
|
$
|
11.03
|
|
||||||||||
|
Site production and delivery, before net noncash
|
|||||||||||||||||||
|
and other costs shown below
|
2.03
|
|
1.97
|
|
3.99
|
|
|||||||||||||
|
By-product credits
a
|
(0.25
|
)
|
—
|
|
—
|
|
|||||||||||||
|
Treatment charges
|
0.10
|
|
0.10
|
|
—
|
|
|||||||||||||
|
Unit net cash costs
|
1.88
|
|
2.07
|
|
3.99
|
|
|||||||||||||
|
Depreciation, depletion and amortization
|
0.28
|
|
0.27
|
|
0.25
|
|
|||||||||||||
|
Noncash and other costs, net
|
0.08
|
|
0.08
|
|
0.03
|
|
|||||||||||||
|
Total unit costs
|
2.24
|
|
2.42
|
|
4.27
|
|
|||||||||||||
|
Revenue adjustments, primarily for pricing
|
|||||||||||||||||||
|
on prior period open sales
|
—
|
|
—
|
|
—
|
|
|||||||||||||
|
Gross profit per pound
|
$
|
1.13
|
|
$
|
0.95
|
|
$
|
6.76
|
|
||||||||||
|
Reconciliation to Amounts Reported
|
|
|
|
|
|
||||||||||||||
|
(In millions)
|
Revenues
|
Production and Delivery
|
Depreciation, Depletion and Amortization
|
|
|
||||||||||||||
|
Totals presented above
|
$
|
4,015
|
|
$
|
2,287
|
|
$
|
303
|
|
|
|
||||||||
|
Treatment charges
|
—
|
|
112
|
|
—
|
|
|
|
|||||||||||
|
Net noncash and other costs
|
—
|
|
88
|
|
—
|
|
|
|
|||||||||||
|
Revenue adjustments, primarily for pricing on prior period open sales
|
(4
|
)
|
—
|
|
—
|
|
|
|
|||||||||||
|
Eliminations and other
|
(16
|
)
|
(28
|
)
|
9
|
|
|
|
|||||||||||
|
North America copper mines
|
3,995
|
|
2,459
|
|
312
|
|
|
|
|||||||||||
|
Other mining & eliminations
c
|
9,526
|
|
6,058
|
|
726
|
|
|||||||||||||
|
Total mining
|
13,521
|
|
8,517
|
|
1,038
|
|
|||||||||||||
|
Oil & gas operations
|
1,512
|
|
377
|
|
732
|
|
|||||||||||||
|
Corporate, other & eliminations
|
3
|
|
10
|
|
8
|
|
|
|
|||||||||||
|
As reported in FCX’s consolidated financial statements
|
$
|
15,036
|
|
$
|
8,904
|
|
$
|
1,778
|
|
|
|
||||||||
|
a.
|
Reflects sales of molybdenum produced by certain of the North America copper mines to our molybdenum sales company at market-based pricing.
|
|
b.
|
Includes gold and silver product revenues and production costs.
|
|
c.
|
Represents the combined total for all other mining operations and the related eliminations, as presented in Note
13
.
|
73
North America Copper Mines Product Revenues and Production Costs (continued)
|
Nine Months Ended September 30, 2012
|
|
|
|||||||||||||||||
|
(In millions)
|
By-Product
|
Co-Product Method
|
|||||||||||||||||
|
Method
|
Copper
|
Molybdenum
a
|
Other
b
|
Total
|
|||||||||||||||
|
Revenues, excluding adjustments
|
$
|
3,755
|
|
$
|
3,755
|
|
$
|
363
|
|
$
|
63
|
|
$
|
4,181
|
|
||||
|
Site production and delivery, before net noncash and other costs shown below
|
1,932
|
|
1,782
|
|
165
|
|
37
|
|
1,984
|
|
|||||||||
|
By-product credits
|
(374
|
)
|
—
|
|
—
|
|
—
|
|
—
|
|
|||||||||
|
Treatment charges
|
120
|
|
115
|
|
—
|
|
5
|
|
120
|
|
|||||||||
|
Net cash costs
|
1,678
|
|
1,897
|
|
165
|
|
42
|
|
2,104
|
|
|||||||||
|
Depreciation, depletion and amortization
|
262
|
|
247
|
|
12
|
|
3
|
|
262
|
|
|||||||||
|
Noncash and other costs, net
|
98
|
|
95
|
|
2
|
|
1
|
|
98
|
|
|||||||||
|
Total costs
|
2,038
|
|
2,239
|
|
179
|
|
46
|
|
2,464
|
|
|||||||||
|
Revenue adjustments, primarily for pricing on prior period open sales
|
6
|
|
6
|
|
—
|
|
—
|
|
6
|
|
|||||||||
|
Gross profit
|
$
|
1,723
|
|
$
|
1,522
|
|
$
|
184
|
|
$
|
17
|
|
$
|
1,723
|
|
||||
|
Copper sales (millions of recoverable pounds)
|
1,027
|
|
1,027
|
|
|||||||||||||||
|
Molybdenum sales (millions of recoverable pounds)
a
|
27
|
|
|||||||||||||||||
|
Gross profit per pound of copper and molybdenum:
|
|||||||||||||||||||
|
Revenues, excluding adjustments
|
$
|
3.66
|
|
$
|
3.66
|
|
$
|
13.58
|
|
||||||||||
|
Site production and delivery, before net noncash
|
|||||||||||||||||||
|
and other costs shown below
|
1.88
|
|
1.74
|
|
6.18
|
|
|||||||||||||
|
By-product credits
a
|
(0.37
|
)
|
—
|
|
—
|
|
|||||||||||||
|
Treatment charges
|
0.12
|
|
0.11
|
|
—
|
|
|||||||||||||
|
Unit net cash costs
|
1.63
|
|
1.85
|
|
6.18
|
|
|||||||||||||
|
Depreciation, depletion and amortization
|
0.26
|
|
0.24
|
|
0.45
|
|
|||||||||||||
|
Noncash and other costs, net
|
0.10
|
|
0.09
|
|
0.07
|
|
|||||||||||||
|
Total unit costs
|
1.99
|
|
2.18
|
|
6.70
|
|
|||||||||||||
|
Revenue adjustments, primarily for pricing
|
|||||||||||||||||||
|
on prior period open sales
|
0.01
|
|
—
|
|
—
|
|
|||||||||||||
|
Gross profit per pound
|
$
|
1.68
|
|
$
|
1.48
|
|
$
|
6.88
|
|
||||||||||
|
Reconciliation to Amounts Reported
|
|
|
|
|
|
||||||||||||||
|
(In millions)
|
Revenues
|
Production and Delivery
|
Depreciation, Depletion and Amortization
|
|
|
||||||||||||||
|
Totals presented above
|
$
|
4,181
|
|
$
|
1,984
|
|
$
|
262
|
|
|
|
||||||||
|
Treatment charges
|
—
|
|
120
|
|
—
|
|
|
|
|||||||||||
|
Net noncash and other costs
|
—
|
|
98
|
|
—
|
|
|
|
|||||||||||
|
Revenue adjustments, primarily for pricing on prior period open sales
|
6
|
|
—
|
|
—
|
|
|
|
|||||||||||
|
Eliminations and other
|
10
|
|
(12
|
)
|
12
|
|
|
|
|||||||||||
|
North America copper mines
|
4,197
|
|
2,190
|
|
274
|
|
|
|
|||||||||||
|
Other mining & eliminations
c
|
9,295
|
|
5,450
|
|
576
|
|
|||||||||||||
|
Total mining
|
13,492
|
|
7,640
|
|
850
|
|
|||||||||||||
|
Oil & gas operations
|
—
|
|
—
|
|
—
|
|
|||||||||||||
|
Corporate, other & eliminations
|
5
|
|
2
|
|
6
|
|
|
|
|||||||||||
|
As reported in FCX’s consolidated financial statements
|
$
|
13,497
|
|
$
|
7,642
|
|
$
|
856
|
|
|
|
||||||||
|
a.
|
Reflects sales of molybdenum produced by certain of the North America copper mines to our molybdenum sales company at market-based pricing.
|
|
b.
|
Includes gold and silver product revenues and production costs.
|
|
c.
|
Represents the combined total for all other mining operations and the related eliminations, as presented in Note
13
.
|
74
South America Mining Product Revenues and Production Costs
|
Three Months Ended September 30, 2013
|
|
|
|
|
|||||||||||
|
(In millions)
|
By-Product
|
Co-Product Method
|
|||||||||||||
|
Method
|
Copper
|
Other
|
Total
|
||||||||||||
|
Revenues, excluding adjustments
|
$
|
1,065
|
|
$
|
1,065
|
|
$
|
79
|
|
a
|
$
|
1,144
|
|
||
|
Site production and delivery, before net noncash and other costs shown below
|
483
|
|
453
|
|
35
|
|
488
|
|
|||||||
|
By-product credits
|
(74
|
)
|
—
|
|
—
|
|
—
|
|
|||||||
|
Treatment charges
|
52
|
|
52
|
|
—
|
|
52
|
|
|||||||
|
Net cash costs
|
461
|
|
505
|
|
35
|
|
540
|
|
|||||||
|
Depreciation, depletion and amortization
|
85
|
|
80
|
|
5
|
|
85
|
|
|||||||
|
Noncash and other costs, net
|
14
|
|
5
|
|
9
|
|
14
|
|
|||||||
|
Total costs
|
560
|
|
590
|
|
49
|
|
639
|
|
|||||||
|
Revenue adjustments, primarily for pricing on prior period open sales
|
49
|
|
49
|
|
—
|
|
49
|
|
|||||||
|
Gross profit
|
$
|
554
|
|
$
|
524
|
|
$
|
30
|
|
$
|
554
|
|
|||
|
Copper sales (millions of recoverable pounds)
|
323
|
|
323
|
|
|||||||||||
|
Gross profit per pound of copper:
|
|||||||||||||||
|
Revenues, excluding adjustments
|
$
|
3.30
|
|
$
|
3.30
|
|
|||||||||
|
Site production and delivery, before net noncash
|
|||||||||||||||
|
and other costs shown below
|
1.49
|
|
1.40
|
|
|||||||||||
|
By-product credits
|
(0.22
|
)
|
—
|
|
|||||||||||
|
Treatment charges
|
0.16
|
|
0.16
|
|
|||||||||||
|
Unit net cash costs
|
1.43
|
|
1.56
|
|
|||||||||||
|
Depreciation, depletion and amortization
|
0.26
|
|
0.25
|
|
|||||||||||
|
Noncash and other costs, net
|
0.05
|
|
0.02
|
|
|||||||||||
|
Total unit costs
|
1.74
|
|
1.83
|
|
|||||||||||
|
Revenue adjustments, primarily for pricing
|
|||||||||||||||
|
on prior period open sales
|
0.15
|
|
0.15
|
|
|||||||||||
|
Gross profit per pound
|
$
|
1.71
|
|
$
|
1.62
|
|
|||||||||
|
Reconciliation to Amounts Reported
|
|
|
|
|
|||||||||||
|
(In millions)
|
Revenues
|
Production and Delivery
|
Depreciation, Depletion and Amortization
|
|
|||||||||||
|
Totals presented above
|
$
|
1,144
|
|
$
|
488
|
|
$
|
85
|
|
|
|||||
|
Treatment charges
|
(52
|
)
|
—
|
|
—
|
|
|
||||||||
|
Net noncash and other costs
|
—
|
|
14
|
|
—
|
|
|
||||||||
|
Revenue adjustments, primarily for pricing on prior period open sales
|
49
|
|
—
|
|
—
|
|
|
||||||||
|
Eliminations and other
|
(2
|
)
|
(8
|
)
|
—
|
|
|
||||||||
|
South America mining
|
1,139
|
|
494
|
|
85
|
|
|
||||||||
|
Other mining & eliminations
b
|
3,850
|
|
2,548
|
|
268
|
|
|||||||||
|
Total mining
|
4,989
|
|
3,042
|
|
353
|
|
|||||||||
|
Oil & gas operations
|
1,176
|
|
288
|
|
563
|
|
|||||||||
|
Corporate, other & eliminations
|
—
|
|
2
|
|
3
|
|
|
||||||||
|
As reported in FCX’s consolidated financial statements
|
$
|
6,165
|
|
$
|
3,332
|
|
$
|
919
|
|
|
|||||
|
a.
|
Includes gold sales of
26 thousand
ounces (
$1,335
per ounce average realized price) and silver sales of
841 thousand
ounces (
$15.20
per ounce average realized price). Also reflects sales of molybdenum produced by Cerro Verde to our molybdenum sales company at market-based pricing.
|
|
b.
|
Represents the combined total for all other mining operations and the related eliminations, as presented in Note
13
.
|
75
South America Mining Product Revenues and Production Costs (continued)
|
Three Months Ended September 30, 2012
|
|
|
|
|
|||||||||||
|
(In millions)
|
By-Product
|
Co-Product Method
|
|||||||||||||
|
Method
|
Copper
|
Other
|
Total
|
||||||||||||
|
Revenues, excluding adjustments
|
$
|
1,132
|
|
$
|
1,132
|
|
$
|
84
|
|
a
|
$
|
1,216
|
|
||
|
Site production and delivery, before net noncash and other costs shown below
|
503
|
|
464
|
|
45
|
|
509
|
|
|||||||
|
By-product credits
|
(78
|
)
|
—
|
|
—
|
|
—
|
|
|||||||
|
Treatment charges
|
52
|
|
52
|
|
—
|
|
52
|
|
|||||||
|
Net cash costs
|
477
|
|
516
|
|
45
|
|
561
|
|
|||||||
|
Depreciation, depletion and amortization
|
74
|
|
71
|
|
3
|
|
74
|
|
|||||||
|
Noncash and other costs, net
|
22
|
|
14
|
|
8
|
|
22
|
|
|||||||
|
Total costs
|
573
|
|
601
|
|
56
|
|
657
|
|
|||||||
|
Revenue adjustments, primarily for pricing on prior period open sales
|
23
|
|
23
|
|
—
|
|
23
|
|
|||||||
|
Gross profit
|
$
|
582
|
|
$
|
554
|
|
$
|
28
|
|
$
|
582
|
|
|||
|
Copper sales (millions of recoverable pounds)
|
308
|
|
308
|
|
|||||||||||
|
Gross profit per pound of copper:
|
|||||||||||||||
|
Revenues, excluding adjustments
|
$
|
3.68
|
|
$
|
3.68
|
|
|||||||||
|
Site production and delivery, before net noncash
|
|||||||||||||||
|
and other costs shown below
|
1.63
|
|
1.51
|
|
|||||||||||
|
By-product credits
|
(0.25
|
)
|
—
|
|
|||||||||||
|
Treatment charges
|
0.17
|
|
0.17
|
|
|||||||||||
|
Unit net cash costs
|
1.55
|
|
1.68
|
|
|||||||||||
|
Depreciation, depletion and amortization
|
0.24
|
|
0.23
|
|
|||||||||||
|
Noncash and other costs, net
|
0.07
|
|
0.04
|
|
|||||||||||
|
Total unit costs
|
1.86
|
|
1.95
|
|
|||||||||||
|
Revenue adjustments, primarily for pricing
|
|||||||||||||||
|
on prior period open sales
|
0.07
|
|
0.07
|
|
|||||||||||
|
Gross profit per pound
|
$
|
1.89
|
|
$
|
1.80
|
|
|||||||||
|
Reconciliation to Amounts Reported
|
|
|
|
|
|||||||||||
|
(In millions)
|
Revenues
|
Production and Delivery
|
Depreciation, Depletion and Amortization
|
|
|||||||||||
|
Totals presented above
|
$
|
1,216
|
|
$
|
509
|
|
$
|
74
|
|
|
|||||
|
Treatment charges
|
(52
|
)
|
—
|
|
—
|
|
|
||||||||
|
Net noncash and other costs
|
—
|
|
22
|
|
—
|
|
|
||||||||
|
Revenue adjustments, primarily for pricing on prior period open sales
|
23
|
|
—
|
|
—
|
|
|
||||||||
|
Eliminations and other
|
5
|
|
(1
|
)
|
—
|
|
|
||||||||
|
South America mining
|
1,192
|
|
530
|
|
74
|
|
|
||||||||
|
Other mining & eliminations
b
|
3,224
|
|
2,060
|
|
222
|
|
|||||||||
|
Total mining
|
4,416
|
|
2,590
|
|
296
|
|
|||||||||
|
Oil & gas operations
|
—
|
|
—
|
|
—
|
|
|||||||||
|
Corporate, other & eliminations
|
1
|
|
2
|
|
2
|
|
|
||||||||
|
As reported in FCX’s consolidated financial statements
|
$
|
4,417
|
|
$
|
2,592
|
|
$
|
298
|
|
|
|||||
|
a.
|
Includes gold sales of
21 thousand
ounces (
$1,736
per ounce average realized price) and silver sales of
811 thousand
ounces (
$27.99
per ounce average realized price). Also reflects sales of molybdenum produced by Cerro Verde to our molybdenum sales company at market-based pricing.
|
|
b.
|
Represents the combined total for all other mining operations and the related eliminations, as presented in Note
13
.
|
76
South America Mining Product Revenues and Production Costs (continued)
|
Nine Months Ended September 30, 2013
|
|
|
|
|
|||||||||||
|
(In millions)
|
By-Product
|
Co-Product Method
|
|||||||||||||
|
Method
|
Copper
|
Other
|
Total
|
||||||||||||
|
Revenues, excluding adjustments
|
$
|
3,042
|
|
$
|
3,042
|
|
$
|
245
|
|
a
|
$
|
3,287
|
|
||
|
Site production and delivery, before net noncash and other costs shown below
|
1,453
|
|
1,349
|
|
119
|
|
1,468
|
|
|||||||
|
By-product credits
|
(230
|
)
|
—
|
|
—
|
|
—
|
|
|||||||
|
Treatment charges
|
151
|
|
151
|
|
—
|
|
151
|
|
|||||||
|
Net cash costs
|
1,374
|
|
1,500
|
|
119
|
|
1,619
|
|
|||||||
|
Depreciation, depletion and amortization
|
242
|
|
228
|
|
14
|
|
242
|
|
|||||||
|
Noncash and other costs, net
|
38
|
|
11
|
|
27
|
|
38
|
|
|||||||
|
Total costs
|
1,654
|
|
1,739
|
|
160
|
|
1,899
|
|
|||||||
|
Revenue adjustments, primarily for pricing on prior period open sales
|
(29
|
)
|
(29
|
)
|
—
|
|
(29
|
)
|
|||||||
|
Gross profit
|
$
|
1,359
|
|
$
|
1,274
|
|
$
|
85
|
|
$
|
1,359
|
|
|||
|
Copper sales (millions of recoverable pounds)
|
923
|
|
923
|
|
|||||||||||
|
Gross profit per pound of copper:
|
|||||||||||||||
|
Revenues, excluding adjustments
|
$
|
3.30
|
|
$
|
3.30
|
|
|||||||||
|
Site production and delivery, before net noncash
|
|||||||||||||||
|
and other costs shown below
|
1.57
|
|
1.46
|
|
|||||||||||
|
By-product credits
|
(0.25
|
)
|
—
|
|
|||||||||||
|
Treatment charges
|
0.17
|
|
0.17
|
|
|||||||||||
|
Unit net cash costs
|
1.49
|
|
1.63
|
|
|||||||||||
|
Depreciation, depletion and amortization
|
0.26
|
|
0.24
|
|
|||||||||||
|
Noncash and other costs, net
|
0.04
|
|
0.01
|
|
|||||||||||
|
Total unit costs
|
1.79
|
|
1.88
|
|
|||||||||||
|
Revenue adjustments, primarily for pricing
|
|||||||||||||||
|
on prior period open sales
|
(0.04
|
)
|
(0.04
|
)
|
|||||||||||
|
Gross profit per pound
|
$
|
1.47
|
|
$
|
1.38
|
|
|||||||||
|
Reconciliation to Amounts Reported
|
|
|
|
|
|||||||||||
|
(In millions)
|
Revenues
|
Production and Delivery
|
Depreciation, Depletion and Amortization
|
|
|||||||||||
|
Totals presented above
|
$
|
3,287
|
|
$
|
1,468
|
|
$
|
242
|
|
|
|||||
|
Treatment charges
|
(151
|
)
|
—
|
|
—
|
|
|
||||||||
|
Net noncash and other costs
|
—
|
|
38
|
|
—
|
|
|
||||||||
|
Revenue adjustments, primarily for pricing on prior period open sales
|
(29
|
)
|
—
|
|
—
|
|
|
||||||||
|
Eliminations and other
|
(3
|
)
|
(21
|
)
|
—
|
|
|
||||||||
|
South America mining
|
3,104
|
|
1,485
|
|
242
|
|
|
||||||||
|
Other mining & eliminations
b
|
10,417
|
|
7,032
|
|
796
|
|
|||||||||
|
Total mining
|
13,521
|
|
8,517
|
|
1,038
|
|
|||||||||
|
Oil & gas operations
|
1,512
|
|
377
|
|
732
|
|
|||||||||
|
Corporate, other & eliminations
|
3
|
|
10
|
|
8
|
|
|
||||||||
|
As reported in FCX’s consolidated financial statements
|
$
|
15,036
|
|
$
|
8,904
|
|
$
|
1,778
|
|
|
|||||
|
a.
|
Includes gold sales of
68 thousand
ounces (
$1,415
per ounce average realized price) and silver sales of
2.6 million
ounces (
$22.51
per ounce average realized price). Also reflects sales of molybdenum produced by Cerro Verde to our molybdenum sales company at market-based pricing.
|
|
b.
|
Represents the combined total for all other mining operations and the related eliminations, as presented in Note
13
.
|
77
South America Mining Product Revenues and Production Costs (continued)
|
Nine Months Ended September 30, 2012
|
|
|
|
|
|||||||||||
|
(In millions)
|
By-Product
|
Co-Product Method
|
|||||||||||||
|
Method
|
Copper
|
Other
|
Total
|
||||||||||||
|
Revenues, excluding adjustments
|
$
|
3,247
|
|
$
|
3,247
|
|
$
|
249
|
|
a
|
$
|
3,496
|
|
||
|
Site production and delivery, before net noncash and other costs shown below
|
1,411
|
|
1,307
|
|
122
|
|
1,429
|
|
|||||||
|
By-product credits
|
(231
|
)
|
—
|
|
—
|
|
—
|
|
|||||||
|
Treatment charges
|
147
|
|
147
|
|
—
|
|
147
|
|
|||||||
|
Net cash costs
|
1,327
|
|
1,454
|
|
122
|
|
1,576
|
|
|||||||
|
Depreciation, depletion and amortization
|
208
|
|
197
|
|
11
|
|
208
|
|
|||||||
|
Noncash and other costs, net
|
63
|
|
41
|
|
22
|
|
63
|
|
|||||||
|
Total costs
|
1,598
|
|
1,692
|
|
155
|
|
1,847
|
|
|||||||
|
Revenue adjustments, primarily for pricing on prior period open sales
|
105
|
|
105
|
|
—
|
|
105
|
|
|||||||
|
Gross profit
|
$
|
1,754
|
|
$
|
1,660
|
|
$
|
94
|
|
$
|
1,754
|
|
|||
|
Copper sales (millions of recoverable pounds)
|
895
|
|
895
|
|
|||||||||||
|
Gross profit per pound of copper:
|
|||||||||||||||
|
Revenues, excluding adjustments
|
$
|
3.63
|
|
$
|
3.63
|
|
|||||||||
|
Site production and delivery, before net noncash
|
|||||||||||||||
|
and other costs shown below
|
1.58
|
|
1.46
|
|
|||||||||||
|
By-product credits
|
(0.26
|
)
|
—
|
|
|||||||||||
|
Treatment charges
|
0.16
|
|
0.16
|
|
|||||||||||
|
Unit net cash costs
|
1.48
|
|
1.62
|
|
|||||||||||
|
Depreciation, depletion and amortization
|
0.24
|
|
0.22
|
|
|||||||||||
|
Noncash and other costs, net
|
0.07
|
|
0.05
|
|
|||||||||||
|
Total unit costs
|
1.79
|
|
1.89
|
|
|||||||||||
|
Revenue adjustments, primarily for pricing
|
|||||||||||||||
|
on prior period open sales
|
0.12
|
|
0.12
|
|
|||||||||||
|
Gross profit per pound
|
$
|
1.96
|
|
$
|
1.86
|
|
|||||||||
|
Reconciliation to Amounts Reported
|
|
|
|
|
|||||||||||
|
(In millions)
|
Revenues
|
Production and Delivery
|
Depreciation, Depletion and Amortization
|
|
|||||||||||
|
Totals presented above
|
$
|
3,496
|
|
$
|
1,429
|
|
$
|
208
|
|
|
|||||
|
Treatment charges
|
(147
|
)
|
—
|
|
—
|
|
|
||||||||
|
Net noncash and other costs
|
—
|
|
63
|
|
—
|
|
|
||||||||
|
Revenue adjustments, primarily for pricing on prior period open sales
|
105
|
|
—
|
|
—
|
|
|
||||||||
|
Eliminations and other
|
8
|
|
(9
|
)
|
—
|
|
|
||||||||
|
South America mining
|
3,462
|
|
1,483
|
|
208
|
|
|
||||||||
|
Other mining & eliminations
b
|
10,030
|
|
6,157
|
|
642
|
|
|||||||||
|
Total mining
|
13,492
|
|
7,640
|
|
850
|
|
|||||||||
|
Oil & gas operations
|
—
|
|
—
|
|
—
|
|
|||||||||
|
Corporate, other & eliminations
|
5
|
|
2
|
|
6
|
|
|
||||||||
|
As reported in FCX’s consolidated financial statements
|
$
|
13,497
|
|
$
|
7,642
|
|
$
|
856
|
|
|
|||||
|
a.
|
Includes gold sales of
56 thousand
ounces (
$1,678
per ounce average realized price) and silver sales of
2.2 million
ounces (
$28.84
per ounce average realized price). Also reflects sales of molybdenum produced by Cerro Verde to our molybdenum sales company at market-based pricing.
|
|
b.
|
Represents the combined total for all other mining operations and the related eliminations, as presented in Note
13
.
|
78
Indonesia Mining Product Revenues and Production Costs
|
Three Months Ended September 30, 2013
|
|
|
|||||||||||||||||
|
(In millions)
|
By-Product
|
Co-Product Method
|
|||||||||||||||||
|
Method
|
Copper
|
Gold
|
Silver
|
Total
|
|||||||||||||||
|
Revenues, excluding adjustments
|
$
|
782
|
|
$
|
782
|
|
$
|
370
|
|
$
|
16
|
|
a
|
$
|
1,168
|
|
|||
|
Site production and delivery, before net noncash and other costs shown below
|
545
|
|
365
|
|
173
|
|
7
|
|
545
|
|
|||||||||
|
Gold and silver credits
|
(391
|
)
|
—
|
|
—
|
|
—
|
|
—
|
|
|||||||||
|
Treatment charges
|
54
|
|
36
|
|
18
|
|
—
|
|
54
|
|
|||||||||
|
Royalty on metals
|
27
|
|
18
|
|
8
|
|
1
|
|
27
|
|
|||||||||
|
Net cash costs
|
235
|
|
419
|
|
199
|
|
8
|
|
626
|
|
|||||||||
|
Depreciation and amortization
|
60
|
|
40
|
|
19
|
|
1
|
|
60
|
|
|||||||||
|
Noncash and other costs, net
|
36
|
|
24
|
|
11
|
|
1
|
|
36
|
|
|||||||||
|
Total costs
|
331
|
|
483
|
|
229
|
|
10
|
|
722
|
|
|||||||||
|
Revenue adjustments, primarily for pricing on prior period open sales
|
19
|
|
19
|
|
4
|
|
1
|
|
24
|
|
|||||||||
|
PT Smelting intercompany loss
|
(36
|
)
|
(24
|
)
|
(11
|
)
|
(1
|
)
|
(36
|
)
|
|||||||||
|
Gross profit
|
$
|
434
|
|
$
|
294
|
|
$
|
134
|
|
$
|
6
|
|
$
|
434
|
|
||||
|
Copper sales (millions of recoverable pounds)
|
237
|
|
237
|
|
|||||||||||||||
|
Gold sales (thousands of recoverable ounces)
|
278
|
|
|||||||||||||||||
|
Gross profit per pound of copper/per ounce of gold:
|
|||||||||||||||||||
|
Revenues, excluding adjustments
|
$
|
3.30
|
|
$
|
3.30
|
|
$
|
1,330
|
|
||||||||||
|
Site production and delivery, before net noncash
|
|||||||||||||||||||
|
and other costs shown below
|
2.30
|
|
1.54
|
|
621
|
|
|||||||||||||
|
Gold and silver credits
|
(1.65
|
)
|
—
|
|
—
|
|
|||||||||||||
|
Treatment charges
|
0.23
|
|
0.15
|
|
62
|
|
|||||||||||||
|
Royalty on metals
|
0.11
|
|
0.08
|
|
31
|
|
|||||||||||||
|
Unit net cash costs
|
0.99
|
|
1.77
|
|
714
|
|
|||||||||||||
|
Depreciation and amortization
|
0.25
|
|
0.17
|
|
68
|
|
|||||||||||||
|
Noncash and other costs, net
|
0.15
|
|
0.10
|
|
40
|
|
|||||||||||||
|
Total unit costs
|
1.39
|
|
2.04
|
|
822
|
|
|||||||||||||
|
Revenue adjustments, primarily for pricing on
|
|||||||||||||||||||
|
prior period open sales
|
0.08
|
|
0.08
|
|
17
|
|
|||||||||||||
|
PT Smelting intercompany loss
|
(0.15
|
)
|
(0.10
|
)
|
(41
|
)
|
|||||||||||||
|
Gross profit per pound/ounce
|
$
|
1.84
|
|
$
|
1.24
|
|
$
|
484
|
|
||||||||||
|
Reconciliation to Amounts Reported
|
|
|
|
|
|
||||||||||||||
|
(In millions)
|
Revenues
|
Production and Delivery
|
Depreciation, Depletion and Amortization
|
|
|
||||||||||||||
|
Totals presented above
|
$
|
1,168
|
|
$
|
545
|
|
$
|
60
|
|
|
|
||||||||
|
Treatment charges
|
(54
|
)
|
—
|
|
—
|
|
|
|
|||||||||||
|
Royalty on metals
|
(27
|
)
|
—
|
|
—
|
|
|
|
|||||||||||
|
Net noncash and other costs
|
—
|
|
36
|
|
—
|
|
|
|
|||||||||||
|
Revenue adjustments, primarily for pricing on prior period open sales
|
24
|
|
—
|
|
—
|
|
|
|
|||||||||||
|
PT Smelting intercompany loss
|
—
|
|
36
|
|
—
|
|
|||||||||||||
|
Indonesia mining
|
1,111
|
|
617
|
|
60
|
|
|
|
|||||||||||
|
Other mining & eliminations
b
|
3,878
|
|
2,425
|
|
293
|
|
|||||||||||||
|
Total mining
|
4,989
|
|
3,042
|
|
353
|
|
|||||||||||||
|
Oil & gas operations
|
1,176
|
|
288
|
|
563
|
|
|||||||||||||
|
Corporate, other & eliminations
|
—
|
|
2
|
|
3
|
|
|
|
|||||||||||
|
As reported in FCX’s consolidated financial statements
|
$
|
6,165
|
|
$
|
3,332
|
|
$
|
919
|
|
|
|
||||||||
|
a.
|
Includes silver sales of
761 thousand
ounces (
$21.46
per ounce average realized price).
|
|
b.
|
Represents the combined total for all other mining operations and the related eliminations, as presented in Note
13
.
|
79
Indonesia Mining Product Revenues and Production Costs (continued)
|
Three Months Ended September 30, 2012
|
|
|
|||||||||||||||||
|
(In millions)
|
By-Product
|
Co-Product Method
|
|||||||||||||||||
|
Method
|
Copper
|
Gold
|
Silver
|
Total
|
|||||||||||||||
|
Revenues, excluding adjustments
|
$
|
729
|
|
$
|
729
|
|
$
|
307
|
|
$
|
15
|
|
a
|
$
|
1,051
|
|
|||
|
Site production and delivery, before net noncash and other costs shown below
|
578
|
|
401
|
|
169
|
|
8
|
|
578
|
|
|||||||||
|
Gold and silver credits
|
(324
|
)
|
—
|
|
—
|
|
—
|
|
—
|
|
|||||||||
|
Treatment charges
|
44
|
|
30
|
|
13
|
|
1
|
|
44
|
|
|||||||||
|
Royalty on metals
|
25
|
|
18
|
|
7
|
|
—
|
|
25
|
|
|||||||||
|
Net cash costs
|
323
|
|
449
|
|
189
|
|
9
|
|
647
|
|
|||||||||
|
Depreciation and amortization
|
54
|
|
37
|
|
16
|
|
1
|
|
54
|
|
|||||||||
|
Noncash and other costs, net
|
9
|
|
7
|
|
2
|
|
—
|
|
9
|
|
|||||||||
|
Total costs
|
386
|
|
493
|
|
207
|
|
10
|
|
710
|
|
|||||||||
|
Revenue adjustments, primarily for pricing on prior period open sales
|
7
|
|
7
|
|
2
|
|
—
|
|
9
|
|
|||||||||
|
PT Smelting intercompany loss
|
(16
|
)
|
(11
|
)
|
(5
|
)
|
—
|
|
(16
|
)
|
|||||||||
|
Gross profit
|
$
|
334
|
|
$
|
232
|
|
$
|
97
|
|
$
|
5
|
|
$
|
334
|
|
||||
|
Copper sales (millions of recoverable pounds)
|
195
|
|
195
|
|
|||||||||||||||
|
Gold sales (thousands of recoverable ounces)
|
178
|
||||||||||||||||||
|
Gross profit per pound of copper/per ounce of gold:
|
|||||||||||||||||||
|
Revenues, excluding adjustments
|
$
|
3.72
|
|
$
|
3.72
|
|
$
|
1,728
|
|
||||||||||
|
Site production and delivery, before net noncash
|
|||||||||||||||||||
|
and other costs shown below
|
2.96
|
|
2.05
|
|
951
|
|
|||||||||||||
|
Gold and silver credits
|
(1.66
|
)
|
—
|
|
—
|
|
|||||||||||||
|
Treatment charges
|
0.22
|
|
0.15
|
|
72
|
|
|||||||||||||
|
Royalty on metals
|
0.13
|
|
0.09
|
|
42
|
|
|||||||||||||
|
Unit net cash costs
|
1.65
|
|
2.29
|
|
1,065
|
|
|||||||||||||
|
Depreciation and amortization
|
0.27
|
|
0.19
|
|
88
|
|
|||||||||||||
|
Noncash and other costs, net
|
0.05
|
|
0.04
|
|
15
|
|
|||||||||||||
|
Total unit costs
|
1.97
|
|
2.52
|
|
1,168
|
|
|||||||||||||
|
Revenue adjustments, primarily for pricing on
|
|||||||||||||||||||
|
prior period open sales
|
0.04
|
|
0.04
|
|
11
|
|
|||||||||||||
|
PT Smelting intercompany loss
|
(0.08
|
)
|
(0.05
|
)
|
(25
|
)
|
|||||||||||||
|
Gross profit per pound/ounce
|
$
|
1.71
|
|
$
|
1.19
|
|
$
|
546
|
|
||||||||||
|
Reconciliation to Amounts Reported
|
|
|
|
|
|
||||||||||||||
|
(In millions)
|
Revenues
|
Production and Delivery
|
Depreciation, Depletion and Amortization
|
|
|
||||||||||||||
|
Totals presented above
|
$
|
1,051
|
|
$
|
578
|
|
$
|
54
|
|
|
|
||||||||
|
Treatment charges
|
(44
|
)
|
—
|
|
—
|
|
|
|
|||||||||||
|
Royalty on metals
|
(25
|
)
|
—
|
|
—
|
|
|
|
|||||||||||
|
Net noncash and other costs
|
—
|
|
9
|
|
—
|
|
|
|
|||||||||||
|
Revenue adjustments, primarily for pricing on prior period open sales
|
9
|
|
—
|
|
—
|
|
|
|
|||||||||||
|
PT Smelting intercompany loss
|
—
|
|
16
|
|
—
|
|
|||||||||||||
|
Indonesia mining
|
991
|
|
603
|
|
54
|
|
|
|
|||||||||||
|
Other mining & eliminations
b
|
3,425
|
|
1,987
|
|
242
|
|
|||||||||||||
|
Total mining
|
4,416
|
|
2,590
|
|
296
|
|
|||||||||||||
|
Oil & gas operations
|
—
|
|
—
|
|
—
|
|
|||||||||||||
|
Corporate, other & eliminations
|
1
|
|
2
|
|
2
|
|
|
|
|||||||||||
|
As reported in FCX’s consolidated financial statements
|
$
|
4,417
|
|
$
|
2,592
|
|
$
|
298
|
|
|
|
||||||||
|
a.
|
Includes silver sales of
469 thousand
ounces (
$33.04
per ounce average realized price).
|
|
b.
|
Represents the combined total for all other mining operations and the related eliminations, as presented in Note
13
.
|
80
Indonesia Mining Product Revenues and Production Costs (continued)
|
Nine Months Ended September 30, 2013
|
|
|
|||||||||||||||||
|
(In millions)
|
By-Product
|
Co-Product Method
|
|||||||||||||||||
|
Method
|
Copper
|
Gold
|
Silver
|
Total
|
|||||||||||||||
|
Revenues, excluding adjustments
|
$
|
1,938
|
|
$
|
1,938
|
|
$
|
864
|
|
$
|
40
|
|
a
|
$
|
2,842
|
|
|||
|
Site production and delivery, before net noncash and other costs shown below
|
1,623
|
|
1,107
|
|
493
|
|
23
|
|
1,623
|
|
|||||||||
|
Gold and silver credits
|
(903
|
)
|
—
|
|
—
|
|
—
|
|
—
|
|
|||||||||
|
Treatment charges
|
135
|
|
92
|
|
41
|
|
2
|
|
135
|
|
|||||||||
|
Royalty on metals
|
74
|
|
50
|
|
23
|
|
1
|
|
74
|
|
|||||||||
|
Net cash costs
|
929
|
|
1,249
|
|
557
|
|
26
|
|
1,832
|
|
|||||||||
|
Depreciation and amortization
|
173
|
|
118
|
|
53
|
|
2
|
|
173
|
|
|||||||||
|
Noncash and other costs, net
|
123
|
|
84
|
|
37
|
|
2
|
|
123
|
|
|||||||||
|
Total costs
|
1,225
|
|
1,451
|
|
647
|
|
30
|
|
2,128
|
|
|||||||||
|
Revenue adjustments, primarily for pricing on prior period open sales
|
1
|
|
1
|
|
(1
|
)
|
—
|
|
—
|
|
|||||||||
|
PT Smelting intercompany profit
|
3
|
|
2
|
|
1
|
|
—
|
|
3
|
|
|||||||||
|
Gross profit
|
$
|
717
|
|
$
|
490
|
|
$
|
217
|
|
$
|
10
|
|
$
|
717
|
|
||||
|
Copper sales (millions of recoverable pounds)
|
593
|
|
593
|
|
|||||||||||||||
|
Gold sales (thousands of recoverable ounces)
|
620
|
|
|||||||||||||||||
|
Gross profit per pound of copper/per ounce of gold:
|
|||||||||||||||||||
|
Revenues, excluding adjustments
|
$
|
3.27
|
|
$
|
3.27
|
|
$
|
1,393
|
|
||||||||||
|
Site production and delivery, before net noncash
|
|||||||||||||||||||
|
and other costs shown below
|
2.74
|
|
1.87
|
|
795
|
|
|||||||||||||
|
Gold and silver credits
|
(1.52
|
)
|
—
|
|
—
|
|
|||||||||||||
|
Treatment charges
|
0.23
|
|
0.16
|
|
67
|
|
|||||||||||||
|
Royalty on metals
|
0.12
|
|
0.08
|
|
36
|
|
|||||||||||||
|
Unit net cash costs
|
1.57
|
|
2.11
|
|
898
|
|
|||||||||||||
|
Depreciation and amortization
|
0.29
|
|
0.20
|
|
85
|
|
|||||||||||||
|
Noncash and other costs, net
|
0.21
|
|
0.14
|
|
60
|
|
|||||||||||||
|
Total unit costs
|
2.07
|
|
2.45
|
|
1,043
|
|
|||||||||||||
|
Revenue adjustments, primarily for pricing on
|
|||||||||||||||||||
|
prior period open sales
|
—
|
|
—
|
|
(2
|
)
|
|||||||||||||
|
PT Smelting intercompany profit
|
0.01
|
|
0.01
|
|
1
|
|
|||||||||||||
|
Gross profit per pound/ounce
|
$
|
1.21
|
|
$
|
0.83
|
|
$
|
349
|
|
||||||||||
|
Reconciliation to Amounts Reported
|
|
|
|
|
|
||||||||||||||
|
(In millions)
|
Revenues
|
Production and Delivery
|
Depreciation, Depletion and Amortization
|
|
|
||||||||||||||
|
Totals presented above
|
$
|
2,842
|
|
$
|
1,623
|
|
$
|
173
|
|
|
|
||||||||
|
Treatment charges
|
(135
|
)
|
—
|
|
—
|
|
|
|
|||||||||||
|
Royalty on metals
|
(74
|
)
|
—
|
|
—
|
|
|
|
|||||||||||
|
Net noncash and other costs
|
—
|
|
123
|
|
—
|
|
|
|
|||||||||||
|
Revenue adjustments, primarily for pricing on prior period open sales
|
—
|
|
—
|
|
—
|
|
|
|
|||||||||||
|
PT Smelting intercompany profit
|
—
|
|
(3
|
)
|
—
|
|
|||||||||||||
|
Indonesia mining
|
2,633
|
|
1,743
|
|
173
|
|
|
|
|||||||||||
|
Other mining & eliminations
b
|
10,888
|
|
6,774
|
|
865
|
|
|||||||||||||
|
Total mining
|
13,521
|
|
8,517
|
|
1,038
|
|
|||||||||||||
|
Oil & gas operations
|
1,512
|
|
377
|
|
732
|
|
|||||||||||||
|
Corporate, other & eliminations
|
3
|
|
10
|
|
8
|
|
|
|
|||||||||||
|
As reported in FCX’s consolidated financial statements
|
$
|
15,036
|
|
$
|
8,904
|
|
$
|
1,778
|
|
|
|
||||||||
|
a.
|
Includes silver sales of
1.8 million
ounces (
$22.55
per ounce average realized price).
|
|
b.
|
Represents the combined total for all other mining operations and the related eliminations, as presented in Note
13
.
|
81
Indonesia Mining Product Revenues and Production Costs (continued)
|
Nine Months Ended September 30, 2012
|
|
|
|||||||||||||||||
|
(In millions)
|
By-Product
|
Co-Product Method
|
|||||||||||||||||
|
Method
|
Copper
|
Gold
|
Silver
|
Total
|
|||||||||||||||
|
Revenues, excluding adjustments
|
$
|
1,863
|
|
$
|
1,863
|
|
$
|
1,150
|
|
$
|
43
|
|
a
|
$
|
3,056
|
|
|||
|
Site production and delivery, before net noncash and other costs shown below
|
1,637
|
|
998
|
|
616
|
|
23
|
|
1,637
|
|
|||||||||
|
Gold and silver credits
|
(1,196
|
)
|
—
|
|
—
|
|
—
|
|
—
|
|
|||||||||
|
Treatment charges
|
107
|
|
65
|
|
40
|
|
2
|
|
107
|
|
|||||||||
|
Royalty on metals
|
68
|
|
42
|
|
25
|
|
1
|
|
68
|
|
|||||||||
|
Net cash costs
|
616
|
|
1,105
|
|
681
|
|
26
|
|
1,812
|
|
|||||||||
|
Depreciation and amortization
|
153
|
|
93
|
|
58
|
|
2
|
|
153
|
|
|||||||||
|
Noncash and other costs, net
|
39
|
|
24
|
|
15
|
|
—
|
|
39
|
|
|||||||||
|
Total costs
|
808
|
|
1,222
|
|
754
|
|
28
|
|
2,004
|
|
|||||||||
|
Revenue adjustments, primarily for pricing on prior period open sales
|
13
|
|
13
|
|
3
|
|
—
|
|
16
|
|
|||||||||
|
PT Smelting intercompany loss
|
(28
|
)
|
(17
|
)
|
(11
|
)
|
—
|
|
(28
|
)
|
|||||||||
|
Gross profit
|
$
|
1,040
|
|
$
|
637
|
|
$
|
388
|
|
$
|
15
|
|
$
|
1,040
|
|
||||
|
Copper sales (millions of recoverable pounds)
|
512
|
|
512
|
|
|||||||||||||||
|
Gold sales (thousands of recoverable ounces)
|
691
|
|
|||||||||||||||||
|
Gross profit per pound of copper/per ounce of gold:
|
|||||||||||||||||||
|
Revenues, excluding adjustments
|
$
|
3.64
|
|
$
|
3.64
|
|
$
|
1,665
|
|
||||||||||
|
Site production and delivery, before net noncash
|
|||||||||||||||||||
|
and other costs shown below
|
3.20
|
|
1.95
|
|
892
|
|
|||||||||||||
|
Gold and silver credits
|
(2.34
|
)
|
—
|
|
—
|
|
|||||||||||||
|
Treatment charges
|
0.21
|
|
0.13
|
|
58
|
|
|||||||||||||
|
Royalty on metals
|
0.13
|
|
0.08
|
|
37
|
|
|||||||||||||
|
Unit net cash costs
|
1.20
|
|
2.16
|
|
987
|
|
|||||||||||||
|
Depreciation and amortization
|
0.30
|
|
0.18
|
|
83
|
|
|||||||||||||
|
Noncash and other costs, net
|
0.08
|
|
0.05
|
|
22
|
|
|||||||||||||
|
Total unit costs
|
1.58
|
|
2.39
|
|
1,092
|
|
|||||||||||||
|
Revenue adjustments, primarily for pricing on
|
|||||||||||||||||||
|
prior period open sales
|
0.03
|
|
0.03
|
|
4
|
|
|||||||||||||
|
PT Smelting intercompany loss
|
(0.06
|
)
|
(0.04
|
)
|
(15
|
)
|
|||||||||||||
|
Gross profit per pound/ounce
|
$
|
2.03
|
|
$
|
1.24
|
|
$
|
562
|
|
||||||||||
|
Reconciliation to Amounts Reported
|
|
|
|
|
|
||||||||||||||
|
(In millions)
|
Revenues
|
Production and Delivery
|
Depreciation, Depletion and Amortization
|
|
|
||||||||||||||
|
Totals presented above
|
$
|
3,056
|
|
$
|
1,637
|
|
$
|
153
|
|
|
|
||||||||
|
Treatment charges
|
(107
|
)
|
—
|
|
—
|
|
|
|
|||||||||||
|
Royalty on metals
|
(68
|
)
|
—
|
|
—
|
|
|
|
|||||||||||
|
Net noncash and other costs
|
—
|
|
39
|
|
—
|
|
|
|
|||||||||||
|
Revenue adjustments, primarily for pricing on prior period open sales
|
16
|
|
—
|
|
—
|
|
|
|
|||||||||||
|
PT Smelting intercompany loss
|
—
|
|
28
|
|
—
|
|
|||||||||||||
|
Indonesia mining
|
2,897
|
|
1,704
|
|
153
|
|
|
|
|||||||||||
|
Other mining & eliminations
b
|
10,595
|
|
5,936
|
|
697
|
|
|||||||||||||
|
Total mining
|
13,492
|
|
7,640
|
|
850
|
|
|||||||||||||
|
Oil & gas operations
|
—
|
|
—
|
|
—
|
|
|||||||||||||
|
Corporate, other & eliminations
|
5
|
|
2
|
|
6
|
|
|
|
|||||||||||
|
As reported in FCX’s consolidated financial statements
|
$
|
13,497
|
|
$
|
7,642
|
|
$
|
856
|
|
|
|
||||||||
|
a.
|
Includes silver sales of
1.4 million
ounces (
$31.04
per ounce average realized price).
|
|
b.
|
Represents the combined total for all other mining operations and the related eliminations, as presented in Note
13
.
|
82
Africa Mining Product Revenues and Production Costs
|
Three Months Ended September 30, 2013
|
|
|
|
|
|||||||||||
|
(In millions)
|
By-Product
|
Co-Product Method
|
|||||||||||||
|
Method
|
Copper
|
Cobalt
|
Total
|
||||||||||||
|
Revenues, excluding adjustments
a
|
$
|
374
|
|
$
|
374
|
|
$
|
53
|
|
$
|
427
|
|
|||
|
Site production and delivery, before net noncash and other costs shown below
|
168
|
|
162
|
|
25
|
|
187
|
|
|||||||
|
Cobalt credits
b
|
(32
|
)
|
—
|
|
—
|
|
—
|
|
|||||||
|
Royalty on metals
|
8
|
|
7
|
|
1
|
|
8
|
|
|||||||
|
Net cash costs
|
144
|
|
169
|
|
26
|
|
195
|
|
|||||||
|
Depreciation, depletion and amortization
|
64
|
|
56
|
|
8
|
|
64
|
|
|||||||
|
Noncash and other costs, net
|
3
|
|
2
|
|
1
|
|
3
|
|
|||||||
|
Total costs
|
211
|
|
227
|
|
35
|
|
262
|
|
|||||||
|
Revenue adjustments, primarily for pricing on prior period open sales
|
3
|
|
3
|
|
(2
|
)
|
1
|
|
|||||||
|
Gross profit
|
$
|
166
|
|
$
|
150
|
|
$
|
16
|
|
$
|
166
|
|
|||
|
Copper sales (millions of recoverable pounds)
|
118
|
|
118
|
|
|||||||||||
|
Cobalt sales (millions of contained pounds)
|
6
|
|
|||||||||||||
|
Gross profit per pound of copper/cobalt:
|
|||||||||||||||
|
Revenues, excluding adjustments
a
|
$
|
3.19
|
|
$
|
3.19
|
|
$
|
8.57
|
|
||||||
|
Site production and delivery, before net noncash
|
|||||||||||||||
|
and other costs shown below
|
1.43
|
|
1.38
|
|
4.14
|
|
|||||||||
|
Cobalt credits
b
|
(0.27
|
)
|
—
|
|
—
|
|
|||||||||
|
Royalty on metals
|
0.07
|
|
0.06
|
|
0.13
|
|
|||||||||
|
Unit net cash costs
|
1.23
|
|
1.44
|
|
4.27
|
|
|||||||||
|
Depreciation, depletion and amortization
|
0.55
|
|
0.48
|
|
1.37
|
|
|||||||||
|
Noncash and other costs, net
|
0.02
|
|
0.02
|
|
0.06
|
|
|||||||||
|
Total unit costs
|
1.80
|
|
1.94
|
|
5.70
|
|
|||||||||
|
Revenue adjustments, primarily for pricing
|
|||||||||||||||
|
on prior period open sales
|
0.03
|
|
0.03
|
|
(0.27
|
)
|
|||||||||
|
Gross profit per pound
|
$
|
1.42
|
|
$
|
1.28
|
|
$
|
2.60
|
|
||||||
|
Reconciliation to Amounts Reported
|
|
|
|
|
|||||||||||
|
(In millions)
|
Revenues
|
Production and Delivery
|
Depreciation, Depletion and Amortization
|
|
|||||||||||
|
Totals presented above
|
$
|
427
|
|
$
|
187
|
|
$
|
64
|
|
|
|||||
|
Royalty on metals
|
(8
|
)
|
—
|
|
—
|
|
|
||||||||
|
Net noncash and other costs
|
—
|
|
3
|
|
—
|
|
|
||||||||
|
Revenue adjustments, primarily for pricing on prior period open sales
|
1
|
|
—
|
|
—
|
|
|
||||||||
|
Africa mining
|
420
|
|
190
|
|
64
|
|
|
||||||||
|
Other mining & eliminations
c
|
4,569
|
|
2,852
|
|
289
|
|
|||||||||
|
Total mining
|
4,989
|
|
3,042
|
|
353
|
|
|||||||||
|
Oil & gas operations
|
1,176
|
|
288
|
|
563
|
|
|||||||||
|
Corporate, other & eliminations
|
—
|
|
2
|
|
3
|
|
|
||||||||
|
As reported in FCX’s consolidated financial statements
|
$
|
6,165
|
|
$
|
3,332
|
|
$
|
919
|
|
|
|||||
|
a.
|
Includes point-of-sale transportation costs as negotiated in customer contracts.
|
|
b.
|
Net of cobalt downstream processing and freight costs.
|
|
c.
|
Represents the combined total for all other mining operations and the related eliminations, as presented in Note
13
.
|
83
Africa Mining Product Revenues and Production Costs (continued)
|
Three Months Ended September 30, 2012
|
|
|
|
|
|||||||||||
|
(In millions)
|
By-Product
|
Co-Product Method
|
|||||||||||||
|
Method
|
Copper
|
Cobalt
|
Total
|
||||||||||||
|
Revenues, excluding adjustments
a
|
$
|
312
|
|
$
|
312
|
|
$
|
64
|
|
$
|
376
|
|
|||
|
Site production and delivery, before net noncash and other costs shown below
|
143
|
|
127
|
|
39
|
|
166
|
|
|||||||
|
Cobalt credits
b
|
(41
|
)
|
—
|
|
—
|
|
—
|
|
|||||||
|
Royalty on metals
|
7
|
|
6
|
|
1
|
|
7
|
|
|||||||
|
Net cash costs
|
109
|
|
133
|
|
40
|
|
173
|
|
|||||||
|
Depreciation, depletion and amortization
|
42
|
|
38
|
|
4
|
|
42
|
|
|||||||
|
Noncash and other costs, net
|
6
|
|
5
|
|
1
|
|
6
|
|
|||||||
|
Total costs
|
157
|
|
176
|
|
45
|
|
221
|
|
|||||||
|
Revenue adjustments, primarily for pricing on prior period open sales
|
(2
|
)
|
(2
|
)
|
—
|
|
(2
|
)
|
|||||||
|
Gross profit
|
$
|
153
|
|
$
|
134
|
|
$
|
19
|
|
$
|
153
|
|
|||
|
Copper sales (millions of recoverable pounds)
|
88
|
|
88
|
|
|||||||||||
|
Cobalt sales (millions of contained pounds)
|
8
|
|
|||||||||||||
|
Gross profit per pound of copper/cobalt:
|
|||||||||||||||
|
Revenues, excluding adjustments
a
|
$
|
3.55
|
|
$
|
3.55
|
|
$
|
8.24
|
|
||||||
|
Site production and delivery, before net noncash
|
|||||||||||||||
|
and other costs shown below
|
1.63
|
|
1.45
|
|
4.96
|
|
|||||||||
|
Cobalt credits
b
|
(0.48
|
)
|
—
|
|
—
|
|
|||||||||
|
Royalty on metals
|
0.08
|
|
0.07
|
|
0.14
|
|
|||||||||
|
Unit net cash costs
|
1.23
|
|
1.52
|
|
5.10
|
|
|||||||||
|
Depreciation, depletion and amortization
|
0.49
|
|
0.43
|
|
0.64
|
|
|||||||||
|
Noncash and other costs, net
|
0.07
|
|
0.06
|
|
0.08
|
|
|||||||||
|
Total unit costs
|
1.79
|
|
2.01
|
|
5.82
|
|
|||||||||
|
Revenue adjustments, primarily for pricing
|
|||||||||||||||
|
on prior period open sales
|
(0.02
|
)
|
(0.02
|
)
|
0.05
|
|
|||||||||
|
Gross profit per pound
|
$
|
1.74
|
|
$
|
1.52
|
|
$
|
2.47
|
|
||||||
|
Reconciliation to Amounts Reported
|
|
|
|
|
|||||||||||
|
(In millions)
|
Revenues
|
Production and Delivery
|
Depreciation, Depletion and Amortization
|
|
|||||||||||
|
Totals presented above
|
$
|
376
|
|
$
|
166
|
|
$
|
42
|
|
|
|||||
|
Royalty on metals
|
(7
|
)
|
—
|
|
—
|
|
|
||||||||
|
Net noncash and other costs
|
—
|
|
6
|
|
—
|
|
|
||||||||
|
Revenue adjustments, primarily for pricing on prior period open sales
|
(2
|
)
|
—
|
|
—
|
|
|
||||||||
|
Africa mining
|
367
|
|
172
|
|
42
|
|
|
||||||||
|
Other mining & eliminations
c
|
4,049
|
|
2,418
|
|
254
|
|
|||||||||
|
Total mining
|
4,416
|
|
2,590
|
|
296
|
|
|||||||||
|
Oil & gas operations
|
—
|
|
—
|
|
—
|
|
|||||||||
|
Corporate, other & eliminations
|
1
|
|
2
|
|
2
|
|
|
||||||||
|
As reported in FCX’s consolidated financial statements
|
$
|
4,417
|
|
$
|
2,592
|
|
$
|
298
|
|
|
|||||
|
a.
|
Includes point-of-sale transportation costs as negotiated in customer contracts.
|
|
b.
|
Net of cobalt downstream processing and freight costs.
|
|
c.
|
Represents the combined total for all other mining operations and the related eliminations, as presented in Note
13
.
|
84
Africa Mining Product Revenues and Production Costs (continued)
|
Nine Months Ended September 30, 2013
|
|
|
|
|
|||||||||||
|
(In millions)
|
By-Product
|
Co-Product Method
|
|||||||||||||
|
Method
|
Copper
|
Cobalt
|
Total
|
||||||||||||
|
Revenues, excluding adjustments
a
|
$
|
1,101
|
|
$
|
1,101
|
|
$
|
140
|
|
$
|
1,241
|
|
|||
|
Site production and delivery, before net noncash and other costs shown below
|
488
|
|
465
|
|
76
|
|
541
|
|
|||||||
|
Cobalt credits
b
|
(90
|
)
|
—
|
|
—
|
|
—
|
|
|||||||
|
Royalty on metals
|
23
|
|
20
|
|
3
|
|
23
|
|
|||||||
|
Net cash costs
|
421
|
|
485
|
|
79
|
|
564
|
|
|||||||
|
Depreciation, depletion and amortization
|
179
|
|
163
|
|
16
|
|
179
|
|
|||||||
|
Noncash and other costs, net
|
19
|
|
17
|
|
2
|
|
19
|
|
|||||||
|
Total costs
|
619
|
|
665
|
|
97
|
|
762
|
|
|||||||
|
Revenue adjustments, primarily for pricing on prior period open sales
|
2
|
|
2
|
|
3
|
|
5
|
|
|||||||
|
Gross profit
|
$
|
484
|
|
$
|
438
|
|
$
|
46
|
|
$
|
484
|
|
|||
|
Copper sales (millions of recoverable pounds)
|
342
|
|
342
|
|
|||||||||||
|
Cobalt sales (millions of contained pounds)
|
17
|
|
|||||||||||||
|
Gross profit per pound of copper/cobalt:
|
|||||||||||||||
|
Revenues, excluding adjustments
a
|
$
|
3.22
|
|
$
|
3.22
|
|
$
|
8.10
|
|
||||||
|
Site production and delivery, before net noncash
|
|||||||||||||||
|
and other costs shown below
|
1.43
|
|
1.36
|
|
4.40
|
|
|||||||||
|
Cobalt credits
b
|
(0.26
|
)
|
—
|
|
—
|
|
|||||||||
|
Royalty on metals
|
0.06
|
|
0.06
|
|
0.14
|
|
|||||||||
|
Unit net cash costs
|
1.23
|
|
1.42
|
|
4.54
|
|
|||||||||
|
Depreciation, depletion and amortization
|
0.52
|
|
0.48
|
|
0.97
|
|
|||||||||
|
Noncash and other costs, net
|
0.06
|
|
0.05
|
|
0.09
|
|
|||||||||
|
Total unit costs
|
1.81
|
|
1.95
|
|
5.60
|
|
|||||||||
|
Revenue adjustments, primarily for pricing
|
|||||||||||||||
|
on prior period open sales
|
0.01
|
|
0.01
|
|
0.14
|
|
|||||||||
|
Gross profit per pound
|
$
|
1.42
|
|
$
|
1.28
|
|
$
|
2.64
|
|
||||||
|
Reconciliation to Amounts Reported
|
|
|
|
|
|||||||||||
|
(In millions)
|
Revenues
|
Production and Delivery
|
Depreciation, Depletion and Amortization
|
|
|||||||||||
|
Totals presented above
|
$
|
1,241
|
|
$
|
541
|
|
$
|
179
|
|
|
|||||
|
Royalty on metals
|
(23
|
)
|
—
|
|
—
|
|
|
||||||||
|
Net noncash and other costs
|
—
|
|
19
|
|
—
|
|
|
||||||||
|
Revenue adjustments, primarily for pricing on prior period open sales
|
5
|
|
—
|
|
—
|
|
|
||||||||
|
Africa mining
|
1,223
|
|
560
|
|
179
|
|
|
||||||||
|
Other mining & eliminations
c
|
12,298
|
|
7,957
|
|
859
|
|
|||||||||
|
Total mining
|
13,521
|
|
8,517
|
|
1,038
|
|
|||||||||
|
Oil & gas operations
|
1,512
|
|
377
|
|
732
|
|
|||||||||
|
Corporate, other & eliminations
|
3
|
|
10
|
|
8
|
|
|
||||||||
|
As reported in FCX’s consolidated financial statements
|
$
|
15,036
|
|
$
|
8,904
|
|
$
|
1,778
|
|
|
|||||
|
a.
|
Includes point-of-sale transportation costs as negotiated in customer contracts.
|
|
b.
|
Net of cobalt downstream processing and freight costs.
|
|
c.
|
Represents the combined total for all other mining operations and the related eliminations, as presented in Note
13
.
|
85
Africa Mining Product Revenues and Production Costs (continued)
|
Nine Months Ended September 30, 2012
|
|
|
|
|
|||||||||||
|
(In millions)
|
By-Product
|
Co-Product Method
|
|||||||||||||
|
Method
|
Copper
|
Cobalt
|
Total
|
||||||||||||
|
Revenues, excluding adjustments
a
|
$
|
845
|
|
$
|
845
|
|
$
|
157
|
|
$
|
1,002
|
|
|||
|
Site production and delivery, before net noncash and other costs shown below
|
368
|
|
341
|
|
95
|
|
436
|
|
|||||||
|
Cobalt credits
b
|
(91
|
)
|
—
|
|
—
|
|
—
|
|
|||||||
|
Royalty on metals
|
18
|
|
16
|
|
2
|
|
18
|
|
|||||||
|
Net cash costs
|
295
|
|
357
|
|
97
|
|
454
|
|
|||||||
|
Depreciation, depletion and amortization
|
114
|
|
101
|
|
13
|
|
114
|
|
|||||||
|
Noncash and other costs, net
|
20
|
|
18
|
|
2
|
|
20
|
|
|||||||
|
Total costs
|
429
|
|
476
|
|
112
|
|
588
|
|
|||||||
|
Revenue adjustments, primarily for pricing on prior period open sales
|
8
|
|
8
|
|
2
|
|
10
|
|
|||||||
|
Gross profit
|
$
|
424
|
|
$
|
377
|
|
$
|
47
|
|
$
|
424
|
|
|||
|
Copper sales (millions of recoverable pounds)
|
239
|
|
239
|
|
|||||||||||
|
Cobalt sales (millions of contained pounds)
|
19
|
|
|||||||||||||
|
Gross profit per pound of copper/cobalt:
|
|||||||||||||||
|
Revenues, excluding adjustments
a
|
$
|
3.54
|
|
$
|
3.54
|
|
$
|
8.36
|
|
||||||
|
Site production and delivery, before net noncash
|
|||||||||||||||
|
and other costs shown below
|
1.54
|
|
1.43
|
|
5.05
|
|
|||||||||
|
Cobalt credits
b
|
(0.39
|
)
|
—
|
|
—
|
|
|||||||||
|
Royalty on metals
|
0.08
|
|
0.06
|
|
0.13
|
|
|||||||||
|
Unit net cash costs
|
1.23
|
|
1.49
|
|
5.18
|
|
|||||||||
|
Depreciation, depletion and amortization
|
0.48
|
|
0.42
|
|
0.68
|
|
|||||||||
|
Noncash and other costs, net
|
0.09
|
|
0.08
|
|
0.12
|
|
|||||||||
|
Total unit costs
|
1.80
|
|
1.99
|
|
5.98
|
|
|||||||||
|
Revenue adjustments, primarily for pricing
|
|||||||||||||||
|
on prior period open sales
|
0.03
|
|
0.03
|
|
0.12
|
|
|||||||||
|
Gross profit per pound
|
$
|
1.77
|
|
$
|
1.58
|
|
$
|
2.50
|
|
||||||
|
Reconciliation to Amounts Reported
|
|
|
|
|
|||||||||||
|
(In millions)
|
Revenues
|
Production and Delivery
|
Depreciation, Depletion and Amortization
|
|
|||||||||||
|
Totals presented above
|
$
|
1,002
|
|
$
|
436
|
|
$
|
114
|
|
|
|||||
|
Royalty on metals
|
(18
|
)
|
—
|
|
—
|
|
|
||||||||
|
Net noncash and other costs
|
—
|
|
20
|
|
—
|
|
|
||||||||
|
Revenue adjustments, primarily for pricing on prior period open sales
|
10
|
|
—
|
|
—
|
|
|
||||||||
|
Africa mining
|
994
|
|
456
|
|
114
|
|
|
||||||||
|
Other mining & eliminations
c
|
12,498
|
|
7,184
|
|
736
|
|
|||||||||
|
Total mining
|
13,492
|
|
7,640
|
|
850
|
|
|||||||||
|
Oil & gas operations
|
—
|
|
—
|
|
—
|
|
|||||||||
|
Corporate, other & eliminations
|
5
|
|
2
|
|
6
|
|
|
||||||||
|
As reported in FCX’s consolidated financial statements
|
$
|
13,497
|
|
$
|
7,642
|
|
$
|
856
|
|
|
|||||
|
a.
|
Includes point-of-sale transportation costs as negotiated in customer contracts.
|
|
b.
|
Net of cobalt downstream processing and freight costs.
|
|
c.
|
Represents the combined total for all other mining operations and the related eliminations, as presented in Note
13
.
|
86
Molybdenum Mines Product Revenues and Production Costs
|
|
Three Months Ended September 30,
|
|
|||||||||
|
(In millions)
|
2013
a
|
2012
a
|
|
||||||||
|
Revenues, excluding adjustments
b
|
$
|
132
|
|
$
|
119
|
|
|
||||
|
Site production and delivery, before net noncash and other costs shown below
|
75
|
|
54
|
|
|
||||||
|
Treatment charges and other
|
11
|
|
8
|
|
|
||||||
|
Net cash costs
|
86
|
|
62
|
|
|
||||||
|
Depreciation, depletion and amortization
|
21
|
|
9
|
|
|
||||||
|
Noncash and other costs, net
|
7
|
|
4
|
|
|
||||||
|
Total costs
|
114
|
|
75
|
|
|
||||||
|
Gross profit
|
$
|
18
|
|
$
|
44
|
|
|
||||
|
Molybdenum sales (millions of recoverable pounds)
b
|
12
|
|
9
|
|
|||||||
|
Gross profit per pound of molybdenum:
|
|||||||||||
|
Revenues, excluding adjustments
b
|
$
|
10.92
|
|
$
|
13.69
|
|
|||||
|
Site production and delivery, before net noncash and other costs shown below
|
6.27
|
|
6.23
|
|
|||||||
|
Treatment charges and other
|
0.88
|
|
0.88
|
|
|||||||
|
Unit net cash costs
|
7.15
|
|
7.11
|
|
|||||||
|
Depreciation, depletion and amortization
|
1.71
|
|
1.00
|
|
|||||||
|
Noncash and other costs, net
|
0.54
|
|
0.52
|
|
|||||||
|
Total unit costs
|
9.40
|
|
8.63
|
|
|||||||
|
Gross profit per pound
|
$
|
1.52
|
|
$
|
5.06
|
|
|||||
|
Reconciliation to Amounts Reported
(In millions)
|
Revenues
|
Production and Delivery
|
Depreciation, Depletion and Amortization
|
||||||||
|
Three Months Ended September 30, 2013
|
|
|
|
||||||||
|
Totals presented above
|
$
|
132
|
|
$
|
75
|
|
$
|
21
|
|
||
|
Treatment charges and other
|
(11
|
)
|
—
|
|
—
|
|
|||||
|
Net noncash and other costs
|
—
|
|
7
|
|
—
|
|
|||||
|
Molybdenum mines
|
121
|
|
82
|
|
21
|
|
|||||
|
Other mining & eliminations
c
|
4,868
|
|
2,960
|
|
332
|
|
|||||
|
Total mining
|
4,989
|
|
3,042
|
|
353
|
|
|||||
|
Oil & gas operations
|
1,176
|
|
288
|
|
563
|
|
|||||
|
Corporate, other & eliminations
|
—
|
|
2
|
|
3
|
|
|||||
|
As reported in FCX’s consolidated financial statements
|
$
|
6,165
|
|
$
|
3,332
|
|
$
|
919
|
|
||
|
Three Months Ended September 30, 2012
|
|
|
|
||||||||
|
Totals presented above
|
$
|
119
|
|
$
|
54
|
|
$
|
9
|
|
||
|
Treatment charges and other
|
(8
|
)
|
—
|
|
—
|
|
|||||
|
Net noncash and other costs
|
—
|
|
4
|
|
—
|
|
|||||
|
Henderson mine
|
111
|
|
58
|
|
9
|
|
|||||
|
Climax mine
|
18
|
|
30
|
|
6
|
|
|||||
|
Molybdenum mines
|
129
|
|
88
|
|
15
|
|
|||||
|
Other mining & eliminations
c
|
4,287
|
|
2,502
|
|
281
|
|
|||||
|
Total mining
|
4,416
|
|
2,590
|
|
296
|
|
|||||
|
Oil & gas operations
|
—
|
|
—
|
|
—
|
|
|||||
|
Corporate, other & eliminations
|
1
|
|
2
|
|
2
|
|
|||||
|
As reported in FCX’s consolidated financial statements
|
$
|
4,417
|
|
$
|
2,592
|
|
$
|
298
|
|
||
|
a.
|
The 2013 period includes the results of the Henderson and Climax mines; the
2012
period reflects the results of only the Henderson mine as start up activities were still underway for the Climax mine.
|
|
b.
|
Reflects sales of the molybdenum mines' production to our molybdenum sales company at market-based pricing. On a consolidated basis, realizations are based on the actual contract terms for sales to third-parties; as a result, our consolidated average realized price per pound of molybdenum will differ from the amounts reported in this table.
|
|
c.
|
Represents the combined total for all other mining operations and the related eliminations, as presented in Note
13
. Also includes amounts associated with our molybdenum sales company, which includes sales of molybdenum produced by the molybdenum mines and by certain of the North and South America copper mines.
|
87
Molybdenum Mines Product Revenues and Production Costs (continued)
|
|
Nine Months Ended September 30,
|
|
|||||||||
|
(In millions)
|
2013
a
|
2012
a
|
|
||||||||
|
Revenues, excluding adjustments
b
|
$
|
443
|
|
$
|
383
|
|
|
||||
|
Site production and delivery, before net noncash and other costs shown below
|
229
|
|
159
|
|
|
||||||
|
Treatment charges and other
|
35
|
|
23
|
|
|
||||||
|
Net cash costs
|
264
|
|
182
|
|
|
||||||
|
Depreciation, depletion and amortization
|
62
|
|
25
|
|
|
||||||
|
Noncash and other costs, net
|
11
|
|
5
|
|
|
||||||
|
Total costs
|
337
|
|
212
|
|
|
||||||
|
Gross profit
|
$
|
106
|
|
$
|
171
|
|
|
||||
|
Molybdenum sales (millions of recoverable pounds)
b
|
37
|
|
26
|
|
|||||||
|
Gross profit per pound of molybdenum:
|
|||||||||||
|
Revenues, excluding adjustments
b
|
$
|
11.87
|
|
$
|
14.61
|
|
|||||
|
Site production and delivery, before net noncash and other costs shown below
|
6.15
|
|
6.06
|
|
|||||||
|
Treatment charges and other
|
0.93
|
|
0.88
|
|
|||||||
|
Unit net cash costs
|
7.08
|
|
6.94
|
|
|||||||
|
Depreciation, depletion and amortization
|
1.66
|
|
0.95
|
|
|||||||
|
Noncash and other costs, net
|
0.29
|
|
0.21
|
|
|||||||
|
Total unit costs
|
9.03
|
|
8.10
|
|
|||||||
|
Gross profit per pound
|
$
|
2.84
|
|
$
|
6.51
|
|
|||||
|
Reconciliation to Amounts Reported
(In millions)
|
Revenues
|
Production and Delivery
|
Depreciation, Depletion and Amortization
|
||||||||
|
Nine Months Ended September 30, 2013
|
|
|
|
||||||||
|
Totals presented above
|
$
|
443
|
|
$
|
229
|
|
$
|
62
|
|
||
|
Treatment charges and other
|
(35
|
)
|
—
|
|
—
|
|
|||||
|
Net noncash and other costs
|
—
|
|
11
|
|
—
|
|
|||||
|
Molybdenum mines
|
408
|
|
240
|
|
62
|
|
|||||
|
Other mining & eliminations
c
|
13,113
|
|
8,277
|
|
976
|
|
|||||
|
Total mining
|
13,521
|
|
8,517
|
|
1,038
|
|
|||||
|
Oil & gas operations
|
1,512
|
|
377
|
|
732
|
|
|||||
|
Corporate, other & eliminations
|
3
|
|
10
|
|
8
|
|
|||||
|
As reported in FCX’s consolidated financial statements
|
$
|
15,036
|
|
$
|
8,904
|
|
$
|
1,778
|
|
||
|
Nine Months Ended September 30, 2012
|
|
|
|
||||||||
|
Totals presented above
|
$
|
383
|
|
$
|
159
|
|
$
|
25
|
|
||
|
Treatment charges and other
|
(23
|
)
|
—
|
|
—
|
|
|||||
|
Net noncash and other costs
|
—
|
|
5
|
|
—
|
|
|||||
|
Henderson mine
|
360
|
|
164
|
|
25
|
|
|||||
|
Climax mine
|
29
|
|
73
|
|
13
|
|
|||||
|
Molybdenum mines
|
389
|
|
237
|
|
38
|
|
|||||
|
Other mining & eliminations
c
|
13,103
|
|
7,403
|
|
812
|
|
|||||
|
Total mining
|
13,492
|
|
7,640
|
|
850
|
|
|||||
|
Oil & gas operations
|
—
|
|
—
|
|
—
|
|
|||||
|
Corporate, other & eliminations
|
5
|
|
2
|
|
6
|
|
|||||
|
As reported in FCX’s consolidated financial statements
|
$
|
13,497
|
|
$
|
7,642
|
|
$
|
856
|
|
||
|
a.
|
The 2013 period includes the results of the Henderson and Climax mines; the
2012
period reflects the results of only the Henderson mine as start up activities were still underway for the Climax mine.
|
|
b.
|
Reflects sales of the molybdenum mines' production to our molybdenum sales company at market-based pricing. On a consolidated basis, realizations are based on the actual contract terms for sales to third-parties; as a result, our consolidated average realized price per pound of molybdenum will differ from the amounts reported in this table.
|
|
c.
|
Represents the combined total for all other mining operations and the related eliminations, as presented in Note
13
. Also includes amounts associated with our molybdenum sales company, which includes sales of molybdenum produced by the molybdenum mines and by certain of the North and South America copper mines.
|
88
Oil & Gas Product Revenues and Cash Production Costs and Realizations
|
Three Months Ended September 30, 2013
|
||||||||||||||||
|
(In millions)
|
Oil
|
Natural Gas
|
NGLs
|
Total Oil & Gas
|
||||||||||||
|
Oil and gas revenues before derivatives
|
$
|
1,220
|
|
$
|
86
|
|
$
|
39
|
|
$
|
1,345
|
|
||||
|
Realized (losses) gains on derivative contracts
|
(19
|
)
|
7
|
|
—
|
|
(12
|
)
|
||||||||
|
Realized revenues
|
$
|
1,201
|
|
$
|
93
|
|
$
|
39
|
|
1,333
|
|
|||||
|
Less: cash production costs
|
277
|
|
||||||||||||||
|
Cash operating margin
|
1,056
|
|
||||||||||||||
|
Less: depreciation, depletion and amortization
|
563
|
|
||||||||||||||
|
Less: accretion and other costs
|
11
|
|
||||||||||||||
|
Unrealized losses on derivative contracts
|
(158
|
)
|
||||||||||||||
|
Other net adjustments
|
1
|
|
||||||||||||||
|
Gross profit
|
$
|
325
|
|
|||||||||||||
|
Oil (MMBbls)
|
11.5
|
|
||||||||||||||
|
Gas (Bcf)
|
23.6
|
|
||||||||||||||
|
NGLs (MMBbls)
|
1.0
|
|
||||||||||||||
|
Oil Equivalents (MMBOE)
|
16.5
|
|
||||||||||||||
|
Oil
(per barrel) |
Natural Gas
(per MMBtu) |
NGLs
(per barrel) |
Per BOE
|
|||||||||||||
|
Oil and gas revenues before derivatives
|
$
|
106.00
|
|
$
|
3.67
|
|
$
|
37.16
|
|
$
|
81.67
|
|
||||
|
Realized (losses) gains on derivative contracts
|
(1.67
|
)
|
0.30
|
|
—
|
|
(0.74
|
)
|
||||||||
|
Realized revenues
|
$
|
104.33
|
|
$
|
3.97
|
|
$
|
37.16
|
|
80.93
|
|
|||||
|
Less: cash production costs
|
16.80
|
|
||||||||||||||
|
Cash operating margin
|
64.13
|
|
||||||||||||||
|
Less: depreciation, depletion and amortization
|
34.15
|
|
||||||||||||||
|
Less: accretion and other costs
|
0.70
|
|
||||||||||||||
|
Unrealized losses on derivative contracts
|
(9.58
|
)
|
||||||||||||||
|
Other net adjustments
|
0.06
|
|
||||||||||||||
|
Gross profit
|
$
|
19.76
|
|
|||||||||||||
|
Reconciliation to Amounts Reported
|
||||||||||||||||
|
(In Millions)
|
Revenues
|
Production and Delivery
|
Depreciation, Depletion and Amortization
|
|||||||||||||
|
Revenues, before derivative contracts
|
$
|
1,345
|
|
$
|
—
|
|
$
|
—
|
|
|||||||
|
Realized losses on derivative contracts
|
(12
|
)
|
—
|
|
—
|
|
||||||||||
|
Unrealized losses on derivative contracts
|
(158
|
)
|
—
|
|
—
|
|
||||||||||
|
Cash production costs
|
—
|
|
277
|
|
—
|
|
||||||||||
|
Accretion and other costs
|
—
|
|
11
|
|
—
|
|
||||||||||
|
Depreciation, depletion and amortization
|
—
|
|
—
|
|
563
|
|
||||||||||
|
Other net adjustments
|
1
|
|
—
|
|
—
|
|
||||||||||
|
Oil & gas operations
|
1,176
|
|
288
|
|
563
|
|
||||||||||
|
Total mining
a
|
4,989
|
|
3,042
|
|
353
|
|
||||||||||
|
Corporate, other & eliminations
|
—
|
|
2
|
|
3
|
|
||||||||||
|
As reported in FCX's consolidated financial statements
|
$
|
6,165
|
|
$
|
3,332
|
|
$
|
919
|
|
|||||||
a. Represents the combined total for all other mining operations and the related eliminations, as presented in Note
13
.
89
Oil & Gas Product Revenues and Cash Production Costs and Realizations (continued)
|
Four months from June 1, 2013, to September 30, 2013
|
||||||||||||||||
|
(In millions)
|
Oil
|
Natural Gas
|
NGLs
|
Total Oil & Gas
|
||||||||||||
|
Oil and gas revenues before derivatives
|
$
|
1,550
|
|
$
|
116
|
|
$
|
50
|
|
$
|
1,716
|
|
||||
|
Realized (losses) gains on derivative contracts
|
(18
|
)
|
7
|
|
—
|
|
(11
|
)
|
||||||||
|
Realized revenues
|
$
|
1,532
|
|
$
|
123
|
|
$
|
50
|
|
1,705
|
|
|||||
|
Less: cash production costs
|
360
|
|
||||||||||||||
|
Cash operating margin
|
1,345
|
|
||||||||||||||
|
Less: depreciation, depletion and amortization
|
732
|
|
||||||||||||||
|
Less: accretion and other costs
|
17
|
|
||||||||||||||
|
Unrealized losses on derivative contracts
|
(194
|
)
|
||||||||||||||
|
Other net adjustments
|
1
|
|
||||||||||||||
|
Gross profit
|
$
|
403
|
|
|||||||||||||
|
Oil (MMBbls)
|
14.9
|
|
||||||||||||||
|
Gas (Bcf)
|
31.3
|
|
||||||||||||||
|
NGLs (MMBbls)
|
1.3
|
|
||||||||||||||
|
Oil Equivalents (MMBOE)
|
21.5
|
|
||||||||||||||
|
Oil
(per barrel) |
Natural Gas
(per MMBtu) |
NGLs
(per barrel) |
Per BOE
|
|||||||||||||
|
Oil and gas revenues before derivatives
|
$
|
103.96
|
|
$
|
3.70
|
|
$
|
36.70
|
|
$
|
79.89
|
|
||||
|
Realized (losses) gains on derivative contracts
|
(1.20
|
)
|
0.24
|
|
—
|
|
(0.49
|
)
|
||||||||
|
Realized revenues
|
$
|
102.76
|
|
$
|
3.94
|
|
$
|
36.70
|
|
79.40
|
|
|||||
|
Less: cash production costs
|
16.76
|
|
||||||||||||||
|
Cash operating margin
|
62.64
|
|
||||||||||||||
|
Less: depreciation, depletion and amortization
|
34.07
|
|
||||||||||||||
|
Less: accretion and other costs
|
0.80
|
|
||||||||||||||
|
Unrealized losses on derivative contracts
|
(9.04
|
)
|
||||||||||||||
|
Other net adjustments
|
0.04
|
|
||||||||||||||
|
Gross profit
|
$
|
18.77
|
|
|||||||||||||
|
Reconciliation to Amounts Reported
|
||||||||||||||||
|
(In Millions)
|
Revenues
|
Production and Delivery
|
Depreciation, Depletion and Amortization
|
|||||||||||||
|
Revenues, before derivative contracts
|
$
|
1,716
|
|
$
|
—
|
|
$
|
—
|
|
|||||||
|
Realized losses on derivative contracts
|
(11
|
)
|
—
|
|
—
|
|
||||||||||
|
Unrealized losses on derivative contracts
|
(194
|
)
|
—
|
|
—
|
|
||||||||||
|
Cash production costs
|
—
|
|
360
|
|
—
|
|
||||||||||
|
Accretion and other costs
|
—
|
|
17
|
|
—
|
|
||||||||||
|
Depreciation, depletion and amortization
|
—
|
|
—
|
|
732
|
|
||||||||||
|
Other net adjustments
|
1
|
|
—
|
|
—
|
|
||||||||||
|
Oil & gas operations
|
1,512
|
|
377
|
|
732
|
|
||||||||||
|
Total mining
a
|
13,521
|
|
8,517
|
|
1,038
|
|
||||||||||
|
Corporate, other & eliminations
|
3
|
|
10
|
|
8
|
|
||||||||||
|
As reported in FCX's consolidated financial statements
|
$
|
15,036
|
|
$
|
8,904
|
|
$
|
1,778
|
|
|||||||
a. Represents the combined total for all other mining operations and the related eliminations, as presented in Note
13
.
90
CAUTIONARY STATEMENT
Our discussion and analysis contains forward-looking statements in which we discuss factors we believe may affect our future performance. Forward-looking statements are all statements other than statements of historical facts, such as projections or expectations relating to ore grades and milling rates, production and sales volumes, unit net cash costs, operating cash flows, capital expenditures, exploration efforts and results, development and production activities and costs, liquidity, tax rates, the impact of copper, gold, molybdenum, cobalt, oil and gas price changes, the impact of derivative positions, the impact of deferred intercompany profits on earnings, reserve estimates, future dividend payments and potential share purchases. The words “anticipates,” “may,” “can,” “plans,” “believes,” “estimates,” “expects,” “projects,” “intends,” “likely,” “will,” “should,” “to be,” "potential," and any similar expressions are intended to identify those assertions as forward-looking statements. The declaration of dividends is at the discretion of the Board and will depend on our financial results, cash requirements, future prospects, and other factors deemed relevant by the Board.
We caution readers that forward-looking statements are not guarantees of future performance and our actual results may differ materially from those anticipated, projected or assumed in the forward-looking statements. Important factors that can cause our actual results to differ materially from those anticipated in the forward-looking statements include demand for, and prices of, copper, gold, molybdenum, cobalt, oil and gas, mine sequencing, production rates, drilling results, the outcome of ongoing discussions with the Indonesian government, the potential effects of violence in Indonesia, the resolution of administrative disputes in the Democratic Republic of Congo, labor relations, the ability to retain current or future lease acreage rights, unanticipated hazards for which we have limited or no insurance coverage, failure of third party partners to fulfill their capital and other commitments, adverse conditions that could lead to structural or mechanical failures or increased costs, changes in reserve estimates, currency translation risks, risks associated with the integration of recently acquired oil and gas operations, industry risks, regulatory changes, political risks, weather- and climate-related risks, environmental risks, litigation results, and other factors described in more detail under the heading “Risk Factors” in our annual report on Form 10-K for the year ended December 31, 2012, filed with the SEC as updated by our subsequent filings with the SEC.
Investors are cautioned that many of the assumptions on which our forward-looking statements are based are likely to change after our forward-looking statements are made, including for example commodity prices, which we cannot control, and production volumes and costs, some aspects of which we may or may not be able to control. Further, we may make changes to our business plans that could or will affect our results. We caution investors that we do not intend to update our forward-looking statements more frequently than quarterly notwithstanding any changes in our assumptions, changes in our business plans, our actual experience, or other changes, and we undertake no obligation to update any forward-looking statements.
91
|
Item 3.
|
Quantitative and Qualitative Disclosures About Market Risk.
|
There have been no material changes in our market risks during the three-month period ended
September 30, 2013
. For additional information on market risks, refer to “Disclosures About Market Risks” included in Part I, Item 2. of this quarterly report. For projected sensitivities of our operating cash flow to changes in commodity prices, refer to “Outlook” in Part I, Item 2. of this quarterly report; for projected sensitivities of our provisionally priced copper sales and derivative instruments to changes in commodity prices refer to “Consolidated Results – Revenues” in Part I, Item 2. of this quarterly report.
|
Item 4.
|
Controls and Procedures.
|
|
(a)
|
Evaluation of disclosure controls and procedures.
Our chief executive officer and chief financial officer, with the participation of management, have evaluated the effectiveness of our “disclosure controls and procedures” (as defined in Rules 13a-15(e) and 15(d)-15(e) under the Securities Exchange Act of 1934) as of the end of the period covered by this quarterly report on Form 10-Q. Based on their evaluation, they have concluded that our disclosure controls and procedures are effective as of
September 30, 2013
.
|
|
(b)
|
Changes in internal control over financial reporting.
During second-quarter 2011, we began a phased implementation of a new enterprise resource planning (ERP) information technology system to upgrade our information technology infrastructure and enhance operating efficiency and effectiveness. Implementation has been completed at our North America, South America, Africa and Indonesia mining operations and at our downstream operations in Europe. Excluding the recently acquired oil and gas operations, we expect the initial implementation of the ERP system to be completed at all of our operations in 2013. During each phase of the implementation, an appropriate level of training of employees, testing of the system and monitoring of the financial results recorded in the system is conducted. Management has updated our system of internal control over financial reporting for the impacted operating business units.
|
During second-quarter 2013, we completed our acquisitions of Plains Exploration & Production Company and McMoRan Exploration Co. (collectively known as Freeport-McMoRan Oil & Gas, or FM O&G). We consider these oil and gas acquisitions material to our results of operations, financial position and cash flows. As of September 30, 2013, the assets of FM O&G represented 42 percent of our total assets, and for the three and nine month periods ended September 30, 2013 revenues from the FM O&G operations represented 19 percent and 10 percent, respectively, of our total revenues. Refer to Note 2 for additional information regarding the oil and gas acquisitions.
We are currently in the process of integrating the FM O&G operations, including internal controls and procedures and extending our Sarbanes-Oxley Act Section 404 compliance program to include FM O&G. We anticipate a successful integration of FM O&G's operations and internal controls and procedures and will continue to evaluate our internal control over financial reporting as we execute integration activities. We expect that our assessment of the effectiveness of our controls and procedures for the year ended December 31, 2013, will include FM O&G.
With the exception of the ERP implementation and the ongoing integration activities described above,
there has been no change in our internal control over financial reporting that occurred during the three months ended
September 30, 2013
, that materially affected, or is reasonably likely to materially affect, our internal control over financial reporting.
|
|
OTHER INFORMATION
|
|
Item 1.
|
Legal Proceedings.
|
We are involved in numerous legal proceedings that arise in the ordinary course of our business or are associated with environmental issues arising from legacy operations conducted over the years by Freeport-McMoRan Corporation (FMC - formerly Phelps Dodge Corporation) and its affiliates. We are also involved from time to time in other reviews, investigations and proceedings by government agencies, some of which may result in adverse judgments, settlements, fines, penalties, injunctions or other relief.
Management does not believe, based on currently available information, that the outcome of any proceeding reported in Note 13 and incorporated by reference into Part I, Item 3. “Legal Proceedings” of our annual report on
92
Form 10-K for the year ended
December 31, 2012
, will have a material adverse effect on our financial condition; although individual outcomes could be material to our operating results for a particular period, depending on the nature and magnitude of the outcome and the operating results for the period. Refer to Notes
8
and 12 for discussion of updates to previously reported legal proceedings.
Item 1A.
Risk Factors.
During second-quarter 2013, we completed the acquisitions of Plains Exploration & Production Company (PXP) and McMoRan Exploration Co. (MMR). Accordingly, the following discussion updates the risk factors reported in Part I, Item 1A. “Risk Factors” of our annual report on Form 10-K for the year ended December 31, 2012, by addressing risk factors specific to the newly acquired oil and gas operations:
Financial risks
Extended declines in the market prices of copper, gold, molybdenum, and/or oil could adversely affect our earnings and cash flows and, if sustained, could adversely affect our ability to repay debt. Fluctuations in the market prices of copper, gold, molybdenum or oil can cause significant volatility in our financial performance and adversely affect the trading prices of our debt and common stock.
In addition to the financial risks related to market prices of copper, gold and molybdenum, as described in Part I, Item 1A. “Risk Factors” of our annual report on Form 10-K for the year ended December 31, 2012, our financial results may vary with fluctuations in oil prices. Historically, the market for oil has been volatile and is likely to continue to be volatile in the future. For the three-year period ending September 30, 2013, Brent crude oil prices ranged from a low of $81.10 per barrel to a high of $126.65 per barrel. Oil prices are affected by numerous factors beyond our control, including:
|
•
|
Worldwide and domestic supplies of and demand for oil;
|
|
•
|
The level of global oil inventories;
|
|
•
|
Weather conditions;
|
|
•
|
Actions by the Organization of the Petroleum Exporting Countries and other major oil producing nations;
|
|
•
|
Political conditions and events in oil producing regions, including the possibility of insurgency, terrorism or war in such areas;
|
|
•
|
The prices of foreign exports and the availability of alternate fuel sources;
|
|
•
|
Technological advances affecting energy exploration, production and consumption;
|
|
•
|
The overall economic conditions in the United States (U.S.) and worldwide, including the value of the U.S. dollar relative to other major currencies; and
|
|
•
|
Governmental regulations and taxes.
|
A significant decline in the prices of oil and gas could adversely affect our financial results and our reserve estimates. We may also have to revise operating plans for our oil and gas operations, including delaying or postponing capital projects. In addition, declines in the prices of oil and gas could result in a “ceiling” write-down of the carrying value of our oil and gas properties and/or of goodwill recorded in connection with the second-quarter 2013 oil and gas acquisitions. For further discussion of our accounting policies and estimates used in evaluating our oil and gas properties and goodwill for impairment, refer to Note 3 (contained in Part I, Item 1. of this quarterly report) and to Critical Accounting Policies and Estimates (contained in Part I, Item 2. of this quarterly report). Any impairment charge related to our oil and gas properties or goodwill would potentially have a material adverse impact on our results of operations and stockholders' equity, but would have no effect on cash flows.
93
A significant portion of our oil and gas production for 2013 through 2015, is hedged with derivative contracts, which may prevent us from benefitting fully from price increases and may expose us to other risks.
Our oil and gas operations use various derivative contracts to manage exposure to commodity price risk for a substantial portion of its oil and gas production. In connection with the acquisition of PXP, we assumed the derivative contracts for 2013, 2014 and 2015 that consist of crude oil options, and crude oil and natural gas swaps. As a result, we may not fully benefit from increases in oil and gas prices above the maximum fixed amount specified in the derivative contracts. These derivative contracts may also expose us to the risk of financial loss in certain circumstances, including when:
|
•
|
a counterparty to the derivative contract is unable to satisfy its obligations;
|
|
•
|
production is delayed or is less than expected; or
|
|
•
|
there is an adverse change in the expected differential between the underlying price in the derivative instrument and actual prices received for our production.
|
Refer to Note 9 for a summary of our oil and gas derivative positions at September 30, 2013. These oil and gas derivative contracts do not qualify or are not designated as hedging instruments; accordingly, they are recorded at fair value with the mark-to-market gains and losses recorded in revenues each period. We expect fluctuations in our consolidated statements of income as changes occur in the index prices.
Operational risks
Oil and gas reserves are estimates, and actual recoveries may vary significantly.
There are numerous uncertainties inherent in estimating quantities and values of reserves. Petroleum engineering is a subjective process of estimating underground accumulations of oil and gas that cannot be measured in an exact manner. Because of the high degree of judgment involved, the accuracy of any reserve estimate is inherently imprecise, and a function of the quality of available data and the engineering and geological interpretation. In accordance with U.S. Securities and Exchange Commission guidelines, our estimates of proved oil and gas reserves are based on the trailing twelve-month average of the first-day-of-the-month reference prices as adjusted for location and quality differentials. Therefore, these reserve quantities will change when actual oil or gas prices increase or decrease. Our estimates of economically recoverable oil and gas reserves and of the related future net cash flows depend upon a number of factors and assumptions that may vary from actual results, including:
|
•
|
Historical production from the area, compared with production from other comparable producing areas;
|
|
•
|
The effects of regulations by governmental agencies;
|
|
•
|
Future oil and gas prices; and
|
|
•
|
Amounts and timing of future operating costs, transportation costs, severance and excise taxes, development costs and workover and remedial costs.
|
Future decreases in estimated proved oil and gas reserves could result in prospective changes to our depletion rates, which could have a significant impact on our results of operations. Estimated proved oil and gas reserve decreases could also result in impairment of our oil and gas properties and/or to goodwill recorded in connection with the second-quarter 2013 oil and gas acquisitions. Any impairment charge related to our oil and gas properties or goodwill would potentially have a material adverse impact on our results of operations and stockholders' equity, but would have no effect on cash flows. For further discussion of our accounting policies and estimates used in evaluating our oil and gas properties and goodwill for impairment, refer to Note 3 (contained in Part I, Item 1. of this quarterly report) and to Critical Accounting Policies and Estimates (contained in Part I, Item 2. of this quarterly report).
94
We must continually replace oil and gas reserves depleted by production. We may not be successful in acquiring, developing or exploring oil and gas properties.
The future success of our oil and gas operations depends on our ability to find, develop and acquire additional oil and gas reserves that are economically recoverable. Without successful acquisition or exploration activities, our oil and gas reserves will decline as a result of our current reserves being depleted by production and we may not be able to find or acquire additional reserves that are economically recoverable.
Operations in the deepwaters of the Gulf of Mexico (GOM) present unique and more costly operating risks than operations in the shallower waters or onshore. In addition, our ultra-deep prospects, which target shallow water, ultra-deep formations on the Shelf of the GOM and onshore Gulf Coast, have greater risks and costs associated with their exploration and development than conventional GOM prospects.
The Deepwater GOM area has had relatively limited drilling activity due to risks associated with geological complexity, water depth and higher drilling and development costs, any of which can cause substantial cost overruns and uneconomic projects or wells. The Deepwater GOM also lacks the infrastructure present in shallower waters, which can result in significant delays in obtaining or maintaining production. As a result, deepwater operations may require significant time between a discovery and marketability, thereby increasing the financial risk of these operations.
Our objectives in our ultra-deep prospects target formations below the salt weld (i.e., ultra-deep targets) in the shallow water of the GOM Shelf and onshore in South Louisiana. These ultra-deep targets have not traditionally been the subject of exploratory activity in these regions, so that little direct comparative data is available. To date, there has been no production of hydrocarbons from ultra-deep reservoirs in these areas. As a result of the unavailability of direct comparative data and limitations of diagnostic tools that operate in the extreme temperatures and pressures encountered, it is very difficult to predict with accuracy the reservoir quality and performance of ultra-deep formations. Additionally, ultra-deep formations are significantly more expensive to drill and complete than wells drilled on the GOM Shelf at more conventional depths. Major contributors to such increased costs include far higher temperatures and pressures encountered down hole and longer drilling times.
Operating hazards, natural disasters or other interruptions of our oil and gas operations could result in potential liabilities, which may not be fully covered by our insurance.
In addition to the operational risks that could adversely affect our business, as described in Part I, Item 1A. “Risk Factors” of our annual report on Form 10-K for the year ended December 31, 2012, our oil and gas operations involves operating hazards such as well blowouts, cratering, explosions, fires, uncontrollable flows of oil, gas or well fluids, pipeline ruptures, pollution, and releases of toxic gas, as well as natural disasters such as earthquakes, mudslides, and hurricanes. Any of these operating hazards could cause personal injuries, fatalities, oil spills, discharge of hazardous materials, lost production, remediation and clean-up costs and other environmental damages, or property damage, all of which could adversely affect our business, operating results and cash flows.
Our oil and gas operations are subject to extensive regulations, some of which require permits and other approvals. These regulations increase our costs and in some circumstances may terminate, delay or suspend our operations.
Our oil and gas operations are subject to extensive federal, state and local laws and regulations that are interpreted by governmental agencies and other bodies vested with broad authority relating to the exploration for, and the development, production and transportation of, oil and gas, as well as environmental and safety matters. Certain of these regulations require permits for the drilling and operation of wells. Existing laws and regulations, or their interpretations, can be changed, and any changes can increase costs of compliance and operations, delay projects or significantly limit drilling activity which could adversely affect our business, operating results and cash flows.
Certain of our undeveloped leasehold acreage is subject to leases that will expire over the next several years unless production is established on units containing the acreage.
Unless production in paying quantities is established on units containing undeveloped leasehold acreage during their terms, the leases will expire. If leases expire and we are unable to renew them, we will lose our right to develop those properties. Our drilling plans are subject to change based upon various factors, including drilling
95
results, oil and gas prices, the availability and cost of capital, drilling and production costs, availability of drilling services and equipment, gathering system and pipeline transportation constraints, and regulatory approvals.
We have limited control over the development of properties in which we have an interest but do not operate.
Certain of our oil and gas properties, including Lucius, Ram Powell, Lineham Creek, Haynesville and portions of our Eagle Ford acreage, are operated by other companies and involve third-party working interest owners. As a result, we have limited ability to influence or control the operation or future development of such properties, including compliance with environmental, safety and other regulations, or the amount of capital expenditures that we will be required to fund with respect to such properties. Additionally, we are dependent on the other working interest owners of such projects to fund their contractual share of the operating costs and capital expenditures of such projects. These limitations and our dependence on the operator and other working interest owners for these projects could cause us to incur unexpected future costs, result in lower production and materially and adversely affect our financial condition and results of operations.
Environmental risks
Our oil and gas operations may incur significant costs related to environmental matters.
Oil and gas operations are subject to environmental hazards, such as oil spills, gas leaks, ruptures, discharges of petroleum products and hazardous substances, and historical disposal activities. These environmental hazards could expose us to material liabilities for property damages, personal injuries or other environmental harm, including costs of investigating and remediating contaminated properties. We may also be liable for environmental damages caused by the previous owners or operators of properties we are currently operating.
Our oil and gas operations are subject to federal, state and local laws and regulations relating to the discharge of materials into, and the protection of, the environment. These laws and regulations, among other things, impose liability on the lessee under an oil and gas lease for the cost of pollution clean-up resulting from operations, subject the lessee to liability for pollution damages and require suspension or cessation of operations in affected areas. Any noncompliance with these laws and regulations could result in material administrative, civil or criminal penalties or other liabilities. Additionally, our compliance with these laws may, from time to time, result in delays to project implementation, and increased costs to our operations or decreased production. Furthermore, changes to existing laws and regulations, or their interpretations, can result in increased costs of compliance and operations, delayed projects, or significantly limited drilling activity.
In addition, in response to the 2010 Deepwater Horizon incident, the Bureau of Ocean Energy Management and the Bureau of Safety and Environmental Enforcement issued new guidelines and regulations regarding safety, environmental matters, drilling equipment, and decommissioning applicable to drilling in the GOM. The enactment of new or stricter regulations in the U.S. and increased liability for companies operating in this area could adversely impact our oil and gas operations in the GOM.
Proposed federal, state or local regulations regarding hydraulic fracturing could increase our operating and capital costs.
Our oil and gas operations utilize hydraulic fracturing and other types of well stimulation. Hydraulic fracturing involves the injection of water, sand and chemicals under pressure into rock formations to stimulate the flow of oil and gas. Hydraulic fracturing is necessary to produce commercial quantities of oil and gas from many reservoirs, especially shale formations such as the Haynesville Shale and the Eagle Ford Shale.
The process is typically regulated by state oil and gas commissions and agencies, and continues to receive significant regulatory and legislative attention at the federal, state, and local levels. Several proposals are before the U.S. Congress that, if implemented, would either prohibit or restrict the practice of hydraulic fracturing or subject the process to more extensive regulations. Several states have adopted or are considering legislation to regulate hydraulic fracturing practices that could impose more stringent permitting, transparency, and well construction requirements on hydraulic-fracturing operations or otherwise seek to ban fracturing activities altogether. In addition, some municipalities have significantly limited or prohibited drilling activities and/or hydraulic fracturing, or are considering doing so.
96
Although it is not possible to predict the final outcome of any legislation regarding hydraulic fracturing, any new federal, state or local restrictions on hydraulic fracturing that are enacted in areas where we conduct our oil and gas operations could result in increased compliance costs or additional operating restrictions.
Other risks
We may experience difficulties in integrating the oil and gas businesses of PXP and MMR, which could cause us to fail to realize many of the anticipated potential synergies of our acquisitions of PXP and MMR.
We acquired PXP and MMR because we believe that the transactions will be beneficial to our company and our shareholders. Achieving the anticipated benefits of the transactions will depend in part upon whether we can integrate these businesses in an efficient and effective manner. We may not be able to accomplish this integration process smoothly or successfully. The difficulties of combining the oil and gas businesses of PXP and MMR potentially will include, among other things:
|
•
|
Coordinating geographically separated organizations and addressing possible differences with respect to incorporating corporate cultures and management philosophies;
|
|
•
|
Dedicating significant management resources to the integration, which may temporarily distract management's attention from the day-to-day business of the combined company;
|
|
•
|
Operating in states where we have not previously conducted business; and
|
|
•
|
Operating an oil and gas business, which is a line of business in which FCX has not historically engaged.
|
|
Item 2.
|
Unregistered Sales of Equity Securities and Use of Proceeds.
|
|
(c)
|
The following table sets forth information with respect to shares of Freeport-McMoRan Copper & Gold Inc. (FCX) common stock purchased by us during the three months ended
September 30, 2013
:
|
|
Period
|
(a) Total Number
of Shares Purchased
|
(b) Average
Price Paid Per Share
|
(c) Total Number of
Shares Purchased as Part
of Publicly Announced Plans or Programs
a
|
(d) Maximum Number
of Shares That May
Yet Be Purchased Under the Plans or Programs
a
|
||||||||||
|
July 1-31, 2013
|
—
|
|
$
|
—
|
|
—
|
|
23,685,500
|
|
|||||
|
August 1-31, 2013
|
—
|
|
$
|
—
|
|
—
|
|
23,685,500
|
|
|||||
|
September 1-30, 2013
|
—
|
|
$
|
—
|
|
—
|
|
23,685,500
|
|
|||||
|
Total
|
—
|
|
$
|
—
|
|
—
|
|
23,685,500
|
|
|||||
|
a.
|
On July 21, 2008, our Board of Directors approved an increase in our open-market share purchase program for up to 30 million shares. There have been no purchases under this program since 2008. This program does not have an expiration date.
|
|
Item 4.
|
Mine Safety Disclosure.
|
The safety and health of all employees is our highest priority. Management believes that safety and health considerations are integral to, and compatible with, all other functions in the organization and that proper safety and health management will enhance production and reduce costs. Our approach towards the safety and health of our workforce is to continuously improve performance through implementing robust management systems and providing adequate training, safety incentive and occupational health programs. The information concerning mine safety violations or other regulatory matters required by Section 1503(a) of the Dodd-Frank Wall Street Reform and Consumer Protection Act and Item 104 of Regulation S-K is included in Exhibit 95.1 to this quarterly report on Form 10-Q.
|
Item 6.
|
Exhibits.
|
The exhibits to this report are listed in the Exhibit Index beginning on Page E-1 hereof.
97
FREEPORT-McMoRan COPPER & GOLD INC.
SIGNATURE
Pursuant to the requirements of the Securities Exchange Act of 1934, the registrant has duly caused this report to be signed on its behalf by the undersigned hereunto duly authorized.
|
FREEPORT-McMoRan COPPER & GOLD INC.
|
||
|
By:
|
/s/ C. Donald Whitmire, Jr.
|
|
|
C. Donald Whitmire, Jr.
|
||
|
Vice President and
|
||
|
Controller - Financial Reporting
|
||
|
(authorized signatory
|
||
|
and Principal Accounting Officer)
|
||
Date:
November 6, 2013
98
|
FREEPORT-McMoRan COPPER & GOLD INC.
|
|||||
|
EXHIBIT INDEX
|
|||||
|
|
|
Filed
|
|
||
|
Exhibit
|
|
with this
|
Incorporated by Reference
|
||
|
Number
|
Exhibit Title
|
Form 10-Q
|
Form
|
File No.
|
Date Filed
|
|
3.1
|
Composite Certificate of Incorporation of Freeport-McMoRan Copper & Gold Inc.
|
10-Q
|
001-1307-01
|
8/6/2010
|
|
|
3.2
|
Composite By-Laws of Freeport-McMoRan Copper & Gold Inc. as of July 16, 2013
|
8-K
|
001-1307-01
|
7/18/2013
|
|
|
4.1
|
Indenture dated as of February 13, 2012, between Freeport-McMoRan Copper & Gold Inc. and U.S. Bank National Association, as Trustee (relating to the 1.4% Senior Notes due 2015, the 2.15% Senior Notes due 2017, and the 3.55% Senior Notes due 2022)
|
8-K
|
001-1307-01
|
2/13/2012
|
|
|
4.2
|
First Supplemental Indenture dated as of February 13, 2012, between Freeport-McMoRan Copper & Gold Inc. and U.S. Bank National Association, as Trustee (relating to the 1.4% Senior Notes due 2015)
|
8-K
|
001-1307-01
|
2/13/2012
|
|
|
4.3
|
Second Supplemental Indenture dated as of February 13, 2012, between Freeport-McMoRan Copper & Gold Inc. and U.S. Bank National Association, as Trustee (relating to the 2.15% Senior Notes due 2017)
|
8-K
|
001-1307-01
|
2/13/2012
|
|
|
4.4
|
Third Supplemental Indenture dated as of February 13, 2012, between Freeport-McMoRan Copper & Gold Inc. and U.S. Bank National Association, as Trustee (relating to the 3.55% Senior Notes due 2022)
|
8-K
|
001-1307-01
|
2/13/2012
|
|
|
4.5
|
Fourth Supplemental Indenture dated as of May 31, 2013, among Freeport-McMoRan Copper & Gold Inc., Freeport-McMoRan Oil & Gas LLC and U.S. Bank National Association, as Trustee (relating to the 1.4% Senior Notes due 2015, the 2.15% Senior Notes due 2017, and the 3.55% Senior Notes due 2022)
|
8-K
|
001-1307-01
|
6/3/2013
|
|
|
4.6
|
Indenture dated as of March 7, 2013, between Freeport-McMoRan Copper & Gold Inc. and U.S. Bank National Association, as Trustee (relating to the 2.375% Senior Notes due 2018, the 3.100% Senior Notes due 2020, the 3.875% Senior Notes due 2023, and the 5.450% Senior Notes due 2043)
|
8-K
|
001-1307-01
|
3/7/2013
|
|
|
4.7
|
Supplemental Indenture dated as of May 31, 2013, among Freeport-McMoRan Copper & Gold Inc., Freeport-McMoRan Oil & Gas LLC and U.S. Bank National Association, as Trustee (relating to the 2.375% Senior Notes due 2018, the 3.100% Senior Notes due 2020, the 3.875% Senior Notes due 2023, and the 5.450% Senior Notes due 2043)
|
8-K
|
001-1307-01
|
6/3/2013
|
|
|
4.8
|
Indenture dated as of March 13, 2007, among Plains Exploration & Production Company, the Subsidiary Guarantors parties thereto, and Wells Fargo Bank, N.A., as Trustee (relating to the 8.625% Senior Notes due 2019, the 7.625% Senior Notes due 2020, the 6.625% Senior Notes due 2021, the 6.75% Senior Notes due 2022, the 6.125% Senior Notes due 2019, the 6.5% Senior Notes due 2020, and the 6.875% Senior Notes due 2023)
|
8-K
|
001-31470
|
3/13/2007
|
|
E-1
|
FREEPORT-McMoRan COPPER & GOLD INC.
|
|||||
|
EXHIBIT INDEX
|
|||||
|
|
|
Filed
|
|
||
|
Exhibit
|
|
with this
|
Incorporated by Reference
|
||
|
Number
|
Exhibit Title
|
Form 10-Q
|
Form
|
File No.
|
Date Filed
|
|
4.09
|
Tenth Supplemental Indenture dated as of September 11, 2009 to the Indenture dated as of March 13, 2007, among Plains Exploration & Production Company, the Subsidiary Guarantors parties thereto and Wells Fargo Bank, N.A., as Trustee (relating to the 8.625% Senior Notes due 2019)
|
8-K
|
001-31470
|
9/11/2009
|
|
|
4.10
|
Eleventh Supplemental Indenture dated as of March 29, 2010 to the Indenture dated as of March 13, 2007, among Plains Exploration & Production Company, the Subsidiary Guarantors parties thereto and Wells Fargo Bank, N.A., as Trustee (relating to the 7.625% Senior Notes due 2020)
|
8-K
|
001-31470
|
3/29/2010
|
|
|
4.11
|
Twelfth Supplemental Indenture dated as of March 29, 2011 to the Indenture dated as of March 13, 2007, among Plains Exploration & Production Company, the Subsidiary Guarantors parties thereto and Wells Fargo Bank, N.A., as Trustee (relating to the 6.625% Senior Notes due 2021)
|
8-K
|
001-31470
|
3/29/2011
|
|
|
4.12
|
Thirteenth Supplemental Indenture dated as of November 21, 2011 to the Indenture dated as of March 13, 2007, among Plains Exploration & Production Company, the Subsidiary Guarantors parties thereto and Wells Fargo Bank, N.A., as Trustee (relating to the 6.75% Senior Notes due 2022)
|
8-K
|
001-31470
|
11/21/2011
|
|
|
4.13
|
Fourteenth Supplemental Indenture dated as of April 27, 2012 to the Indenture dated as of March 13, 2007, among Plains Exploration & Production Company, the Subsidiary Guarantors parties thereto and Wells Fargo Bank, N.A., as Trustee (relating to the 6.125% Senior Notes due 2019)
|
8-K
|
001-31470
|
7/27/2012
|
|
|
4.14
|
Sixteenth Supplemental Indenture dated as of October 26, 2012 to the Indenture dated as of March 13, 2007, among Plains Exploration & Production Company, the Subsidiary Guarantors parties thereto and Wells Fargo Bank, N.A., as Trustee (relating to the 6.5% Senior Notes due 2020)
|
8-K
|
001-31470
|
10/26/2012
|
|
|
4.15
|
Seventeenth Supplemental Indenture dated as of October 26, 2012 to the Indenture dated as of March 13, 2007, among Plains Exploration & Production Company, the Subsidiary Guarantors parties thereto and Wells Fargo Bank, N.A., as Trustee (relating to the 6.875% Senior Notes due 2023)
|
8-K
|
001-31470
|
10/26/2012
|
|
|
4.16
|
Eighteenth Supplemental Indenture dated as of May 31, 2013 to the Indenture dated as of March 13, 2007, among Freeport-McMoRan Oil & Gas LLC, as Successor Issuer, FCX Oil & Gas Inc., as Co-Issuer, Freeport-McMoRan Copper & Gold Inc., as Parent Guarantor, Plains Exploration & Production Company, as Original Issuer, and Wells Fargo Bank, N.A., as Trustee (relating to the 8.625% Senior Notes due 2019, the 7.625% Senior Notes due 2020, the 6.625% Senior Notes due 2021, the 6.75% Senior Notes due 2022, the 6.125% Senior Notes due 2019, the 6.5% Senior Notes due 2020, and the 6.875% Senior Notes due 2023)
|
8-K
|
001-1307-01
|
6/3/2013
|
|
|
4.17
|
Form of Indenture dated as of September 22, 1997, between Phelps Dodge Corporation and The Chase Manhattan Bank, as Trustee (relating to the 7.125% Senior Notes due 2027, the 9.50% Senior Notes due 2031, and the 6.125% Senior Notes due 2034)
|
S-3
|
333-36415
|
9/25/1997
|
|
E-2
|
FREEPORT-McMoRan COPPER & GOLD INC.
|
|||||
|
EXHIBIT INDEX
|
|||||
|
|
|
Filed
|
|
||
|
Exhibit
|
|
with this
|
Incorporated by Reference
|
||
|
Number
|
Exhibit Title
|
Form 10-Q
|
Form
|
File No.
|
Date Filed
|
|
4.18
|
Form of 7.125% Debenture due November 1, 2027 of Phelps Dodge Corporation issued on November 5, 1997, pursuant to the Indenture dated as of September 22, 1997, between Phelps Dodge Corporation and The Chase Manhattan Bank, as Trustee (relating to the 7.125% Senior Notes due 2027)
|
8-K
|
01-00082
|
11/3/1997
|
|
|
4.19
|
Form of 9.5% Note due June 1, 2031 of Phelps Dodge Corporation issued on May 30, 2001, pursuant to the Indenture dated as of September 22, 1997, between Phelps Dodge Corporation and First Union National Bank, as successor Trustee (relating to the 9.50% Senior Notes due 2031)
|
8-K
|
01-00082
|
5/30/2001
|
|
|
4.20
|
Form of 6.125% Note due March 15, 2034 of Phelps Dodge Corporation issued on March 4, 2004, pursuant to the Indenture dated as of September 22, 1997, between Phelps Dodge Corporation and First Union National Bank, as successor Trustee (relating to the 6.125% Senior Notes due 2034)
|
10-K
|
01-00082
|
3/7/2005
|
|
|
4.21
|
Indenture dated as of November 14, 2007, between McMoRan Exploration Co. and The Bank of New York, as Trustee (related to the 11.875% Senior Notes due 2014)
|
8-K
|
001-07791
|
11/15/2007
|
|
|
4.22
|
First Supplemental Indenture dated as of November 14, 2007, by and between McMoRan and the Bank of New York, as Trustee (related to the 11.875% Senior Notes due 2014)
|
8-K
|
001-07791
|
11/15/2007
|
|
|
4.23
|
Second Supplemental Indenture dated as of June 3, 2013, by and among McMoRan Exploration Co., Freeport-McMoRan Copper & Gold Inc., as Parent Guarantor, and The Bank of New York Mellon, as Trustee (relating to the 11.875% Senior Notes due 2014)
|
8-K
|
001-1307-01
|
6/3/2013
|
|
|
4.24
|
Indenture dated September 13, 2012, by and among McMoRan and The Bank of New York Mellon Trust Company, N.A., as Trustee (relating to the 5.25% Convertible Senior Notes due 2013)
|
8-K
|
001-07791
|
9/13/2012
|
|
|
4.25
|
First Supplemental Indenture dated as of June 3, 2013, between McMoRan Exploration Co. and The Bank of New York Mellon Trust Company, N.A., as Trustee (relating to the 5.25% Convertible Senior Notes due 2013)
|
8-K
|
001-1307-01
|
6/3/2013
|
|
|
4.26
|
Registration Rights Agreement dated as of March 7, 2013, among Freeport-McMoRan Copper & Gold Inc. and J.P. Morgan Securities LLC and Merrill Lynch, Pierce, Fenner & Smith Incorporated, as representatives of the Initial Purchasers (relating to the 2.375% Senior Notes due 2018)
|
8-K
|
001-1307-01
|
3/7/2013
|
|
|
4.27
|
Registration Rights Agreement dated as of March 7, 2013, among Freeport-McMoRan Copper & Gold Inc. and J.P. Morgan Securities LLC and Merrill Lynch, Pierce, Fenner & Smith Incorporated, as representatives of the Initial Purchasers (relating to the 3.100% Senior Notes due 2020)
|
8-K
|
001-1307-01
|
3/7/2013
|
|
|
4.28
|
Registration Rights Agreement dated as of March 7, 2013, among Freeport-McMoRan Copper & Gold Inc. and J.P. Morgan Securities LLC and Merrill Lynch, Pierce, Fenner & Smith Incorporated, as representatives of the Initial Purchasers (relating to the 3.875% Senior Notes due 2023)
|
8-K
|
001-1307-01
|
3/7/2013
|
|
E-3
|
FREEPORT-McMoRan COPPER & GOLD INC.
|
|||||
|
EXHIBIT INDEX
|
|||||
|
|
|
Filed
|
|
||
|
Exhibit
|
|
with this
|
Incorporated by Reference
|
||
|
Number
|
Exhibit Title
|
Form 10-Q
|
Form
|
File No.
|
Date Filed
|
|
4.29
|
Registration Rights Agreement dated as of March 7, 2013, among Freeport-McMoRan Copper & Gold Inc. and J.P. Morgan Securities LLC and Merrill Lynch, Pierce, Fenner & Smith Incorporated, as representatives of the Initial Purchasers (relating to the 5.450% Senior Notes due 2043)
|
8-K
|
001-1307-01
|
3/7/2013
|
|
|
10.1
|
Plains Exploration & Production Company 2004 Stock Incentive Plan, as amended and restated
|
10-Q
|
001-31470
|
11/1/2007
|
|
|
10.2
|
Plains Exploration & Production Company 2006 Incentive Plan
|
10-K
|
001-31470
|
2/23/2012
|
|
|
10.3
|
Form of Restricted Stock Unit Agreement under the Plains Exploration & Production Company 2004 Stock Incentive Plan
|
10-K
|
001-31470
|
2/23/2012
|
|
|
10.4
|
Form of Restricted Stock Unit Agreement under the Plains Exploration & Production Company 2006 Incentive Plan
|
10-K
|
001-31470
|
2/23/2012
|
|
|
10.5
|
McMoRan Exploration Co. Amended and Restated 2008 Stock Incentive Plan
|
8-K
|
001-07791
|
5/4/2010
|
|
|
10.6
|
McMoRan Exploration Co. 2005 Stock Incentive Plan, as amended and restated
|
10-Q
|
001-07791
|
5/10/2007
|
|
|
10.7
|
McMoRan Exploration Co. 2004 Director Compensation Plan, as amended and restated
|
10-Q
|
001-07791
|
8/9/2010
|
|
|
10.8
|
McMoRan Exploration Co. 2003 Stock Incentive Plan, as amended and restated
|
10-Q
|
001-07791
|
5/10/2007
|
|
|
10.9
|
McMoRan Exploration Co. 1998 Stock Option Plan for Non-Employee Directors, as amended and restated
|
10-Q
|
001-07791
|
5/10/2007
|
|
|
10.10
|
Form of Notice of Grant of Nonqualified Stock Options under the McMoRan Exploration Co. 2008, 2005 and 2003 Stock Incentive Plans
|
10-K
|
001-07791
|
2/2/2011
|
|
|
10.11
|
Form of Notice of Grant of Nonqualified Stock Options and Restricted Stock Units under the McMoRan Exploration Co. 2008 Stock Incentive Plan (for grants made to non-management directors and advisory directors)
|
8-K
|
001-07791
|
6/11/2008
|
|
|
10.12
|
Amended and Restated Employment Agreement between Plains Exploration & Production Company and James C. Flores, effective as of June 9, 2004
|
10-K
|
001-31470
|
2/27/2008
|
|
|
10.13
|
Amendment to Amended and Restated Employment Agreement between Plains Exploration & Production Company and James C. Flores, effective as of March 12, 2008
|
8-K
|
001-31470
|
3/12/2008
|
|
|
10.14
|
Letter Agreement dated as of December 5, 2012, by and among James C. Flores, Plains Exploration & Production Company and Freeport-McMoRan Copper & Gold Inc.
|
8-K
|
001-11307-01
|
12/6/2012
|
|
|
Letter from Ernst & Young LLP regarding unaudited interim financial statements.
|
X
|
|
|
|
|
|
Certification of Principal Executive Officer pursuant to Rule 13a-14(a)/15d – 14(a).
|
X
|
|
|
|
|
|
Certification of Principal Financial Officer pursuant to Rule 13a-14(a)/15d – 14(a).
|
X
|
|
|
|
|
|
Certification of Principal Executive Officer pursuant to 18 U.S.C. Section 1350.
|
X
|
|
|
|
|
|
Certification of Principal Financial Officer pursuant to 18 U.S.C Section 1350.
|
X
|
|
|
|
|
|
Mine Safety and Health Administration Safety Data.
|
X
|
|
|
|
|
E-4
|
FREEPORT-McMoRan COPPER & GOLD INC.
|
|||||
|
EXHIBIT INDEX
|
|||||
|
|
|
Filed
|
|
||
|
Exhibit
|
|
with this
|
Incorporated by Reference
|
||
|
Number
|
Exhibit Title
|
Form 10-Q
|
Form
|
File No.
|
Date Filed
|
|
101.INS
|
XBRL Instance Document.
|
X
|
|
|
|
|
101.SCH
|
XBRL Taxonomy Extension Schema.
|
X
|
|
|
|
|
101.CAL
|
XBRL Taxonomy Extension Calculation Linkbase.
|
X
|
|
|
|
|
101.DEF
|
XBRL Taxonomy Extension Definition Linkbase.
|
X
|
|
|
|
|
101.LAB
|
XBRL Taxonomy Extension Label Linkbase.
|
X
|
|
|
|
|
101.PRE
|
XBRL Taxonomy Extension Presentation Linkbase.
|
X
|
|
|
|
E-5
TABLE OF CONTENTS
Part IItem 1. Financial StatementsItem 2. Management's Discussion and Analysis Of Financial Condition and Results Of OperationsItem 3. Quantitative and Qualitative Disclosures About Market RiskItem 4. Controls and ProceduresPart II. Other InformationPart IIItem 1. Legal ProceedingsItem 1A. Risk FactorsItem 2. Unregistered Sales Of Equity Securities and Use Of ProceedsItem 4. Mine Safety DisclosureItem 6. Exhibits