FREEPORT-MCMORAN INC
10-Ks and 10-Qs
|
|
|
|
|
|
|
|
|
|
|
|
|
|
|
|
|
|
|
|
|
|
|
|
|
|
|
|
|
|
|
|
|
|
|
|
|
|
|
|
|
|
|
|
|
|
|
|
|
|
|
|
|
|
|
|
|
|
|
|
UNITED STATES
|
||
|
SECURITIES AND EXCHANGE COMMISSION
|
||
|
Washington, D.C. 20549
|
||
|
|
||
|
FORM 10-Q
|
||
|
|
||
|
(Mark One)
|
||
|
[X] QUARTERLY REPORT PURSUANT TO SECTION 13 OR 15(d) OF THE SECURITIES EXCHANGE ACT OF 1934
|
||
|
For the quarterly period ended September 30, 2014
|
||
|
OR
|
||
|
[ ] TRANSITION REPORT PURSUANT TO SECTION 13 OR 15(d) OF THE SECURITIES EXCHANGE ACT OF 1934
|
||
|
For the transition period from
|
|
to
|
|
Commission File Number: 001-11307-01
|
||

Freeport-McMoRan Inc.
(Exact name of registrant as specified in its charter)
|
Delaware
|
74-2480931
|
|
(State or other jurisdiction of
|
(I.R.S. Employer Identification No.)
|
|
incorporation or organization)
|
|
|
|
|
|
333 North Central Avenue
|
|
|
Phoenix, AZ
|
85004-2189
|
|
(Address of principal executive offices)
|
(Zip Code)
|
|
(602) 366-8100
|
|
|
(Registrant's telephone number, including area code)
|
|
Indicate by check mark whether the registrant (1) has filed all reports required to be filed by Section 13 or 15(d) of the Securities Exchange Act of 1934 during the preceding 12 months (or for such shorter period that the registrant was required to file such reports), and (2) has been subject to such filing requirements for the past 90 days.
þ
Yes
¨
No
Indicate by check mark whether the registrant has submitted electronically and posted on its corporate website, if any, every Interactive Data File required to be submitted and posted pursuant to Rule 405 of Regulation S-T (§ 232.405 of this chapter) during the preceding 12 months (or for such shorter period that the registrant was required to submit and post such files).
þ
Yes
¨
No
Indicate by check mark whether the registrant is a large accelerated filer, an accelerated filer, a non-accelerated filer, or a smaller reporting company. See the definitions of “large accelerated filer,” “accelerated filer” and “smaller reporting company” in Rule 12b-2 of the Exchange Act.
Large accelerated filer
þ
Accelerated filer
¨
Non-accelerated filer
¨
Smaller reporting company
¨
Indicate by check mark whether the registrant is a shell company (as defined in Rule 12b-2 of the Exchange Act).
¨
Yes
þ
No
On
October 31, 2014
, there were issued and outstanding
1,039,118,147
shares of the registrant’s common stock, par value
$0.10
per share.
FREEPORT-McMoRan INC.
TABLE OF CONTENTS
|
|
|
|
|
Page
|
|
|
|
|
|
|
|
|
|
|
|
|
|
|
|
|
|
|
|
|
|
|
|
|
|
|
|
|
|
|
|
|
|
|
|
|
|
|
|
|
|
|
|
|
|
|
|
|
|
|
|
|
|
|
|
|
|
2
|
|
FINANCIAL INFORMATION
|
|
Item 1.
|
Financial Statements
.
|
FREEPORT-McMoRan INC.
CONDENSED CONSOLIDATED BALANCE SHEETS (Unaudited)
|
September 30,
2014 |
December 31,
2013 |
||||||
|
|
(In millions)
|
||||||
|
ASSETS
|
|
|
|||||
|
Current assets:
|
|
|
|||||
|
Cash and cash equivalents
|
$
|
658
|
|
$
|
1,985
|
|
|
|
Trade accounts receivable
|
1,514
|
|
1,728
|
|
|||
|
Other accounts receivable
|
793
|
|
834
|
|
|||
|
Inventories:
|
|
||||||
|
Mill and leach stockpiles
|
1,967
|
|
1,705
|
|
|||
|
Materials and supplies, net
|
1,943
|
|
1,730
|
|
|||
|
Product
|
1,579
|
|
1,583
|
|
|||
|
Other current assets
|
577
|
|
407
|
|
|||
|
Total current assets
|
9,031
|
|
9,972
|
|
|||
|
Property, plant, equipment and mining development costs, net
|
26,304
|
|
24,042
|
|
|||
|
Oil and gas properties - full cost method
|
|||||||
|
Subject to amortization, less accumulated amortization
|
11,306
|
|
12,472
|
|
|||
|
Not subject to amortization
|
11,031
|
|
10,887
|
|
|||
|
Long-term mill and leach stockpiles
|
2,569
|
|
2,386
|
|
|||
|
Goodwill
|
1,717
|
|
1,916
|
|
|||
|
Other assets
|
2,018
|
|
1,798
|
|
|||
|
Total assets
|
$
|
63,976
|
|
$
|
63,473
|
|
|
|
LIABILITIES AND EQUITY
|
|
|
|||||
|
Current liabilities:
|
|
|
|||||
|
Accounts payable and accrued liabilities
|
$
|
3,784
|
|
$
|
3,708
|
|
|
|
Current portion of debt
|
1,762
|
|
312
|
|
|||
|
Dividends payable
|
334
|
|
333
|
|
|||
|
Current portion of environmental and asset retirement obligations
|
310
|
|
236
|
|
|||
|
Accrued income taxes
|
153
|
|
184
|
|
|||
|
Total current liabilities
|
6,343
|
|
4,773
|
|
|||
|
Long-term debt, less current portion
|
17,975
|
|
20,394
|
|
|||
|
Deferred income taxes
|
7,559
|
|
7,410
|
|
|||
|
Environmental and asset retirement obligations, less current portion
|
3,654
|
|
3,259
|
|
|||
|
Other liabilities
|
1,730
|
|
1,690
|
|
|||
|
Total liabilities
|
37,261
|
|
37,526
|
|
|||
|
Redeemable noncontrolling interest
|
749
|
|
716
|
|
|||
|
Equity:
|
|
|
|||||
|
FCX stockholders’ equity:
|
|
|
|||||
|
Common stock
|
117
|
|
117
|
|
|||
|
Capital in excess of par value
|
22,248
|
|
22,161
|
|
|||
|
Retained earnings
|
3,306
|
|
2,742
|
|
|||
|
Accumulated other comprehensive loss
|
(394
|
)
|
(405
|
)
|
|||
|
Common stock held in treasury
|
(3,686
|
)
|
(3,681
|
)
|
|||
|
Total FCX stockholders’ equity
|
21,591
|
|
20,934
|
|
|||
|
Noncontrolling interests
|
4,375
|
|
4,297
|
|
|||
|
Total equity
|
25,966
|
|
25,231
|
|
|||
|
Total liabilities and equity
|
$
|
63,976
|
|
$
|
63,473
|
|
|
The accompanying notes are an integral part of these consolidated financial statements.
3
FREEPORT-McMoRan INC.
CONSOLIDATED STATEMENTS OF INCOME (Unaudited)
|
Three Months Ended
|
Nine Months Ended
|
||||||||||||||
|
September 30,
|
September 30,
|
||||||||||||||
|
|
2014
|
2013
|
2014
|
2013
|
|||||||||||
|
(In millions, except per share amounts)
|
|||||||||||||||
|
Revenues
|
$
|
5,696
|
|
$
|
6,165
|
|
$
|
16,203
|
|
$
|
15,036
|
|
|||
|
Cost of sales:
|
|
|
|||||||||||||
|
Production and delivery
|
3,152
|
|
3,332
|
|
8,971
|
|
8,904
|
|
|||||||
|
Depreciation, depletion and amortization
|
945
|
|
919
|
|
2,924
|
|
1,778
|
|
|||||||
|
Impairment of oil and gas properties
|
308
|
|
—
|
|
308
|
|
—
|
|
|||||||
|
Total cost of sales
|
4,405
|
|
|
4,251
|
|
|
12,203
|
|
10,682
|
|
|||||
|
Selling, general and administrative expenses
|
158
|
|
158
|
|
457
|
|
457
|
|
|||||||
|
Mining exploration and research expenses
|
29
|
|
57
|
|
93
|
|
173
|
|
|||||||
|
Environmental obligations and shutdown costs
|
18
|
|
(8
|
)
|
100
|
|
23
|
|
|||||||
|
Net gain on sales of assets
|
(46
|
)
|
—
|
|
(46
|
)
|
—
|
|
|||||||
|
Total costs and expenses
|
4,564
|
|
4,458
|
|
12,807
|
|
11,335
|
|
|||||||
|
Operating income
|
1,132
|
|
1,707
|
|
3,396
|
|
3,701
|
|
|||||||
|
Interest expense, net
|
(158
|
)
|
(162
|
)
|
(483
|
)
|
(351
|
)
|
|||||||
|
Net gain (loss) on early extinguishment of debt
|
58
|
|
—
|
|
63
|
|
(45
|
)
|
|||||||
|
Gain on investment in McMoRan Exploration Co.
|
—
|
|
—
|
|
—
|
|
128
|
|
|||||||
|
Other income, net
|
23
|
|
3
|
|
48
|
|
13
|
|
|||||||
|
Income before income taxes and equity in affiliated companies' net (losses) earnings
|
1,055
|
|
1,548
|
|
3,024
|
|
3,446
|
|
|||||||
|
Provision for income taxes
|
(349
|
)
|
(499
|
)
|
(1,034
|
)
|
(967
|
)
|
|||||||
|
Equity in affiliated companies’ net (losses) earnings
|
(2
|
)
|
(1
|
)
|
—
|
|
3
|
|
|||||||
|
Net income
|
704
|
|
1,048
|
|
1,990
|
|
2,482
|
|
|||||||
|
Net income attributable to noncontrolling interests
|
(142
|
)
|
(218
|
)
|
(416
|
)
|
(519
|
)
|
|||||||
|
Preferred dividends attributable to redeemable noncontrolling interest
|
(10
|
)
|
(9
|
)
|
(30
|
)
|
(12
|
)
|
|||||||
|
Net income attributable to FCX common stockholders
|
$
|
552
|
|
$
|
821
|
|
$
|
1,544
|
|
$
|
1,951
|
|
|||
|
Net income per share attributable to FCX common stockholders:
|
|
||||||||||||||
|
Basic
|
$
|
0.53
|
|
$
|
0.79
|
|
$
|
1.48
|
|
$
|
1.97
|
|
|||
|
Diluted
|
$
|
0.53
|
|
$
|
0.79
|
|
$
|
1.47
|
|
$
|
1.96
|
|
|||
|
Weighted-average common shares outstanding:
|
|
|
|||||||||||||
|
Basic
|
1,039
|
|
1,038
|
|
1,039
|
|
989
|
|
|||||||
|
Diluted
|
1,046
|
|
1,043
|
|
1,045
|
|
993
|
|
|||||||
|
Dividends declared per share of common stock
|
$
|
0.3125
|
|
$
|
0.3125
|
|
$
|
0.9375
|
|
$
|
1.9375
|
|
|||
The accompanying notes are an integral part of these consolidated financial statements.
4
FREEPORT-McMoRan INC.
CONSOLIDATED STATEMENTS OF COMPREHENSIVE INCOME (Unaudited)
|
Three Months Ended
|
Nine Months Ended
|
|||||||||||||||
|
September 30,
|
September 30,
|
|||||||||||||||
|
2014
|
2013
|
2014
|
2013
|
|||||||||||||
|
(In millions)
|
||||||||||||||||
|
Net income
|
$
|
704
|
|
$
|
1,048
|
|
$
|
1,990
|
|
$
|
2,482
|
|
||||
|
Other comprehensive income, net of taxes:
|
||||||||||||||||
|
Defined benefit plans:
|
||||||||||||||||
|
Amortization of unrecognized amounts included in net periodic benefit costs
|
5
|
|
6
|
|
12
|
|
18
|
|
||||||||
|
Foreign exchange losses
|
2
|
|
—
|
|
(1
|
)
|
—
|
|
||||||||
|
Translation adjustments and unrealized gains (losses) on securities
|
—
|
|
4
|
|
—
|
|
3
|
|
||||||||
|
Other comprehensive income
|
7
|
|
10
|
|
11
|
|
21
|
|
||||||||
|
Total comprehensive income
|
711
|
|
1,058
|
|
2,001
|
|
2,503
|
|
||||||||
|
Total comprehensive income attributable to noncontrolling interests
|
(142
|
)
|
(217
|
)
|
(416
|
)
|
(518
|
)
|
||||||||
|
Preferred dividends attributable to redeemable noncontrolling interest
|
(10
|
)
|
(9
|
)
|
(30
|
)
|
(12
|
)
|
||||||||
|
Total comprehensive income attributable to FCX common stockholders
|
$
|
559
|
|
$
|
832
|
|
$
|
1,555
|
|
$
|
1,973
|
|
||||
The accompanying notes are an integral part of these consolidated financial statements.
5
FREEPORT-McMoRan INC.
CONSOLIDATED STATEMENTS OF CASH FLOWS (Unaudited)
|
Nine Months Ended
|
||||||||
|
September 30,
|
||||||||
|
|
2014
|
2013
|
||||||
|
|
(In millions)
|
|||||||
|
Cash flow from operating activities:
|
|
|
||||||
|
Net income
|
$
|
1,990
|
|
$
|
2,482
|
|
||
|
Adjustments to reconcile net income to net cash provided by operating activities:
|
|
|
||||||
|
Depreciation, depletion and amortization
|
2,924
|
|
1,778
|
|
||||
|
Impairment of oil and gas properties
|
308
|
|
—
|
|
||||
|
Net losses on crude oil and natural gas derivative contracts
|
56
|
|
205
|
|
||||
|
Gain on investment in McMoRan Exploration Co. (MMR)
|
—
|
|
(128
|
)
|
||||
|
Net charges for environmental and asset retirement obligations, including accretion
|
146
|
|
98
|
|
||||
|
Payments for environmental and asset retirement obligations
|
(134
|
)
|
(166
|
)
|
||||
|
Net (gain) loss on early extinguishment of debt
|
(63
|
)
|
45
|
|
||||
|
Net gain on sales of assets
|
(46
|
)
|
—
|
|
||||
|
Deferred income taxes
|
107
|
|
169
|
|
||||
|
Increase in long-term mill and leach stockpiles
|
(182
|
)
|
(348
|
)
|
||||
|
Other, net
|
106
|
|
97
|
|
||||
|
Decreases (increases) in working capital and changes in other tax payments, excluding amounts from acquisitions and dispositions:
|
|
|||||||
|
Accounts receivable
|
200
|
|
51
|
|
||||
|
Inventories
|
(267
|
)
|
(66
|
)
|
||||
|
Other current assets
|
(26
|
)
|
162
|
|
||||
|
Accounts payable and accrued liabilities
|
(379
|
)
|
(596
|
)
|
||||
|
Accrued income taxes and other tax payments
|
(227
|
)
|
(40
|
)
|
||||
|
Net cash provided by operating activities
|
4,513
|
|
3,743
|
|
||||
|
Cash flow from investing activities:
|
|
|
||||||
|
Capital expenditures:
|
|
|
||||||
|
North America copper mines
|
(815
|
)
|
(795
|
)
|
||||
|
South America
|
(1,278
|
)
|
(734
|
)
|
||||
|
Indonesia
|
(722
|
)
|
(720
|
)
|
||||
|
Africa
|
(100
|
)
|
(155
|
)
|
||||
|
Molybdenum mines
|
(45
|
)
|
(128
|
)
|
||||
|
U.S. oil and gas operations
|
(2,392
|
)
|
(928
|
)
|
||||
|
Other
|
(63
|
)
|
(163
|
)
|
||||
|
Acquisition of Deepwater Gulf of Mexico interests
|
(1,421
|
)
|
—
|
|
||||
|
Acquisition of Plains Exploration & Production Company, net of cash acquired
|
—
|
|
(3,465
|
)
|
||||
|
Acquisition of MMR, net of cash acquired
|
—
|
|
(1,628
|
)
|
||||
|
Acquisition of cobalt chemical business, net of cash acquired
|
—
|
|
(348
|
)
|
||||
|
Net proceeds from sale of Eagle Ford shale assets
|
2,971
|
|
—
|
|
||||
|
Other, net
|
221
|
|
(24
|
)
|
||||
|
Net cash used in investing activities
|
(3,644
|
)
|
(9,088
|
)
|
||||
|
Cash flow from financing activities:
|
|
|
||||||
|
Proceeds from debt
|
3,346
|
|
11,229
|
|
||||
|
Repayments of debt
|
(4,196
|
)
|
(4,816
|
)
|
||||
|
Redemption of MMR preferred stock
|
—
|
|
(227
|
)
|
||||
|
Cash dividends and distributions paid:
|
|
|||||||
|
Common stock
|
(979
|
)
|
(1,957
|
)
|
||||
|
Noncontrolling interests
|
(365
|
)
|
(157
|
)
|
||||
|
Contributions from noncontrolling interests
|
24
|
|
—
|
|
||||
|
Stock-based awards net proceeds (payments), including excess tax benefit
|
7
|
|
(100
|
)
|
||||
|
Debt financing costs and other, net
|
(33
|
)
|
(113
|
)
|
||||
|
Net cash (used in) provided by financing activities
|
(2,196
|
)
|
3,859
|
|
||||
|
Net decrease in cash and cash equivalents
|
(1,327
|
)
|
(1,486
|
)
|
||||
|
Cash and cash equivalents at beginning of year
|
1,985
|
|
3,705
|
|
||||
|
Cash and cash equivalents at end of period
|
$
|
658
|
|
$
|
2,219
|
|
||
The accompanying notes are an integral part of these consolidated financial statements.
6
FREEPORT-McMoRan INC.
CONSOLIDATED STATEMENT OF EQUITY (Unaudited)
|
|
FCX Stockholders’ Equity
|
|
|
||||||||||||||||||||||||||||||||||
|
Common Stock
|
Retained
Earnings |
Accumu-
lated Other Compre- hensive Loss |
Common Stock
Held in Treasury
|
Total FCX
Stock-holders' Equity |
|||||||||||||||||||||||||||||||||
|
Number
of
Shares
|
At Par
Value
|
Capital in
Excess of
Par Value
|
Number
of
Shares
|
At
Cost
|
Non-
controlling
Interests
|
Total
Equity
|
|||||||||||||||||||||||||||||||
|
|
(In millions)
|
||||||||||||||||||||||||||||||||||||
|
Balance at December 31, 2013
|
1,165
|
|
$
|
117
|
|
$
|
22,161
|
|
$
|
2,742
|
|
$
|
(405
|
)
|
127
|
|
$
|
(3,681
|
)
|
$
|
20,934
|
|
$
|
4,297
|
|
$
|
25,231
|
|
|||||||||
|
Exercised and issued stock-based awards
|
2
|
|
—
|
|
13
|
|
—
|
|
—
|
|
—
|
|
—
|
|
13
|
|
—
|
|
13
|
|
|||||||||||||||||
|
Stock-based compensation
|
—
|
|
—
|
|
75
|
|
—
|
|
—
|
|
—
|
|
—
|
|
75
|
|
—
|
|
75
|
|
|||||||||||||||||
|
Tender of shares for stock-based awards
|
—
|
|
—
|
|
—
|
|
—
|
|
—
|
|
—
|
|
(5
|
)
|
(5
|
)
|
—
|
|
(5
|
)
|
|||||||||||||||||
|
Dividends on common stock
|
—
|
|
—
|
|
—
|
|
(980
|
)
|
—
|
|
—
|
|
—
|
|
(980
|
)
|
—
|
|
(980
|
)
|
|||||||||||||||||
|
Dividends to noncontrolling interests
|
—
|
|
—
|
|
—
|
|
—
|
|
—
|
|
—
|
|
—
|
|
—
|
|
(344
|
)
|
(344
|
)
|
|||||||||||||||||
|
Noncontrolling interests' share of contributed capital in subsidiary
|
—
|
|
—
|
|
(1
|
)
|
—
|
|
—
|
|
—
|
|
—
|
|
(1
|
)
|
6
|
|
5
|
|
|||||||||||||||||
|
Net income attributable to FCX common stockholders
|
—
|
|
—
|
|
—
|
|
1,544
|
|
—
|
|
—
|
|
—
|
|
1,544
|
|
—
|
|
1,544
|
|
|||||||||||||||||
|
Net income attributable to noncontrolling interests
|
—
|
|
—
|
|
—
|
|
—
|
|
—
|
|
—
|
|
—
|
|
—
|
|
416
|
|
416
|
|
|||||||||||||||||
|
Other comprehensive income
|
—
|
|
—
|
|
—
|
|
—
|
|
11
|
|
—
|
|
—
|
|
11
|
|
—
|
|
11
|
|
|||||||||||||||||
|
Balance at September 30, 2014
|
1,167
|
|
$
|
117
|
|
$
|
22,248
|
|
$
|
3,306
|
|
$
|
(394
|
)
|
127
|
|
$
|
(3,686
|
)
|
$
|
21,591
|
|
$
|
4,375
|
|
$
|
25,966
|
|
|||||||||
The accompanying notes are an integral part of these consolidated financial statements.
7
FREEPORT-McMoRan INC.
NOTES TO CONSOLIDATED FINANCIAL STATEMENTS (Unaudited)
Effective
July 14, 2014
, Freeport-McMoRan Copper & Gold Inc. changed its name to Freeport-McMoRan Inc. (FCX) to simplify the corporate name and better reflect FCX's expanded portfolio of assets. The accompanying unaudited consolidated financial statements have been prepared in accordance with the instructions to Form 10-Q and do not include all information and disclosures required by generally accepted accounting principles (GAAP) in the United States (U.S.). Therefore, this information should be read in conjunction with FCX's consolidated financial statements and notes contained in its annual report on Form 10-K for the year ended December 31, 2013. The information furnished herein reflects all adjustments that are, in the opinion of management, necessary for a fair statement of the results for the interim periods reported. With the exception of the oil and gas properties impairment discussed below and certain adjustments associated with the acquisitions of Plains Exploration & Production Company (PXP) and McMoRan Exploration Co. (MMR), collectively known as FCX Oil & Gas Inc. (FM O&G), all such adjustments are, in the opinion of management, of a normal recurring nature. Operating results for the
three
-month and
nine
-month periods ended
September 30, 2014
, are not necessarily indicative of the results that may be expected for the year ending
December 31, 2014
.
As further discussed in Note 2, FCX completed its acquisitions of PXP on
May 31, 2013
, and MMR on
June 3, 2013
. The results included in these financial statements for the
nine
months ended
September 30, 2013
, include PXP
'
s results beginning
June 1, 2013
, and MMR's results beginning
June 4, 2013
.
Oil and Gas Properties.
Under the Securities and Exchange Commission's (SEC) full cost accounting rules, FCX reviews the carrying value of its oil and gas properties each quarter on a country-by-country basis. Under these rules, capitalized costs of oil and gas properties (net of accumulated depreciation, depletion and amortization, and related deferred income taxes) for each cost center may not exceed a “ceiling” equal to:
|
•
|
the present value, discounted at
10 percent
, of estimated future net cash flows from the related proved oil and natural gas reserves, net of estimated future income taxes; plus
|
|
•
|
the cost of the related unproved properties not being amortized; plus
|
|
•
|
the lower of cost or estimated fair value of the related unproved properties included in the costs being amortized (net of related tax effects).
|
These rules require that FCX price its future oil and gas production at the twelve-month average of the first-day-of-the-month historical reference prices as adjusted for location and quality differentials. FCX's reference prices are West Texas Intermediate for oil and the Henry Hub spot price for natural gas. Such prices are utilized except where different prices are fixed and determinable from applicable contracts for the remaining term of those contracts. The reserve estimates exclude the effect of any crude oil and natural gas derivatives FCX has in place. The estimated future net cash flows also exclude future cash outflows associated with settling asset retirement obligations included in the net book value of the oil and gas properties. The rules require an impairment if the capitalized costs exceed this “ceiling.”
At
September 30, 2014
, the net capitalized costs with respect to FCX's U.S. oil and gas properties exceeded the related ceiling; therefore, an impairment charge of
$308 million
was recorded in third-quarter 2014, primarily because of higher capitalized costs and the lower twelve-month average of the first-day-of-the-month historical reference oil price at
September 30, 2014
. During October 2014, oil prices declined from the third-quarter average. Continuation of recent oil price declines, increases in capitalized costs subject to amortization and other factors may result in future additional ceiling test impairments.
Eagle Ford Disposition.
On
June 20, 2014
, FCX completed the sale of its Eagle Ford shale assets to a subsidiary of Encana Corporation for cash consideration of
$3.1 billion
, before closing adjustments from the
April 1, 2014
, effective date. Under full cost accounting rules, the proceeds were recorded as a reduction of capitalized oil and gas properties, with no gain or loss recognition, except for
$62 million
of deferred tax expense recorded through
September 30, 2014
, in connection with the allocation of
$221 million
of goodwill (for which deferred taxes were not previously provided) to the Eagle Ford shale assets. Approximately
$1.3 billion
of proceeds from this transaction was placed in a like-kind exchange escrow and was used to reinvest in additional oil and gas interests, as discussed below. The remaining proceeds were used to repay debt.
8
Deepwater Gulf of Mexico (GOM) Acquisitions.
On
June 30, 2014
, FCX completed the acquisition of interests in the Deepwater GOM from a subsidiary of Apache Corporation, including interests in the Lucius and Heidelberg oil fields and
several
exploration leases, for
$919 million
. Based on preliminary valuations, and including transaction costs and estimated asset retirement costs, FCX recorded capitalized costs for oil and gas properties subject to amortization of
$460 million
and costs not subject to amortization of
$476 million
. The Deepwater GOM acquisition was funded by the like-kind exchange escrow.
Additionally, on
September 8, 2014
, FCX completed the acquisition of additional Deepwater GOM interests for
$496 million
, including an interest in the Vito oil discovery in the Mississippi Canyon area and a significant lease position in the Vito basin area. Based on preliminary valuations, and including purchase price adjustments and transaction costs, FCX recorded capitalized costs for oil and gas properties not subject to amortization of
$509 million
. This acquisition was funded in part with the remaining
$414 million
of funds from the like-kind exchange escrow.
PXP and MMR Acquisitions.
The second-quarter 2013 acquisitions of PXP and MMR added a portfolio of oil and gas assets to FCX
'
s global mining business, creating a U.S.-based natural resources company. The acquisitions have been accounted for under the acquisition method, with FCX as the acquirer.
During second-quarter 2014, FCX finalized the purchase price allocations, which resulted in a net increase of
$20 million
to oil and gas properties, an increase of
$22 million
to goodwill and a net decrease of
$42 million
to deferred income tax assets.
For further discussion of the PXP and MMR acquisitions and the related financing, refer to Notes 2 and 8 in FCX's annual report on Form 10-K for the year ended December 31, 2013.
Unaudited Pro Forma Consolidated Financial Information.
The following unaudited pro forma financial information has been prepared to reflect the acquisitions of PXP and MMR. The unaudited pro forma financial information combines the historical statements of income of FCX, PXP and MMR for the
nine
months ended
September 30, 2013
, giving effect to the mergers as if they had occurred on January 1, 2012. The historical consolidated financial information has been adjusted to reflect factually supportable items that are directly attributable to the acquisitions.
|
Nine Months
|
|||
|
Ended
|
|||
|
September 30, 2013
|
|||
|
(in millions, except per share amounts)
|
|||
|
Revenues
|
$
|
17,190
|
|
|
Operating income
|
4,617
|
|
|
|
Net income from continuing operations
|
2,683
|
|
|
|
Net income attributable to FCX common stockholders
|
2,134
|
|
|
|
Net income per share attributable to FCX common stockholders:
|
|||
|
Basic
|
$
|
2.05
|
|
|
Diluted
|
2.04
|
|
|
The unaudited pro forma consolidated information for the
nine
months ended
September 30, 2013
, has been prepared for illustrative purposes only and is not intended to be indicative of the results of operations that actually would have occurred, or the results of operations expected in future periods, had the events reflected herein occurred on the date indicated. The most significant pro forma adjustments to net income from continuing operations for the
nine
months ended
September 30, 2013
, were to exclude
$519 million
of acquisition-related costs, the net tax benefit of
$183 million
of acquisition-related adjustments and the
$128 million
gain on the investment in MMR. Additionally, for the
nine
months ended
September 30, 2013
, the pro forma consolidated information excluded a
$77 million
gain on the sale of MMR oil and gas properties because of the application of the full cost method of accounting.
9
FCX’s basic net income per share of common stock was computed by dividing net income attributable to FCX common stockholders by the weighted-average of common stock outstanding during the period. Diluted net income per share of common stock was computed using the most dilutive of (a) the two-class method or (b) the treasury stock method. Under the two-class method, net income is allocated to each class of common stock and participating securities as if all of the earnings for the period had been distributed. FCX’s participating securities consist of vested restricted stock units (RSUs) for which the underlying common shares are not yet issued and entitle holders to non-forfeitable dividends.
The following table sets forth the computation of basic and diluted net income per share (in millions, except per share amounts):
|
Three Months Ended
|
Nine Months Ended
|
|||||||||||||||
|
September 30,
|
September 30,
|
|||||||||||||||
|
|
2014
|
2013
|
2014
|
2013
|
||||||||||||
|
Net income
|
$
|
704
|
|
$
|
1,048
|
|
$
|
1,990
|
|
$
|
2,482
|
|
||||
|
Net income attributable to noncontrolling interests
|
(142
|
)
|
(218
|
)
|
(416
|
)
|
(519
|
)
|
||||||||
|
Preferred dividends on redeemable noncontrolling interest
|
(10
|
)
|
(9
|
)
|
(30
|
)
|
(12
|
)
|
||||||||
|
Undistributed earnings allocable to participating securities
|
(2
|
)
|
—
|
|
(4
|
)
|
—
|
|
||||||||
|
Net income allocable to FCX common stockholders
|
$
|
550
|
|
$
|
821
|
|
$
|
1,540
|
|
$
|
1,951
|
|
||||
|
Basic weighted-average shares of common stock outstanding
|
1,039
|
|
1,038
|
|
1,039
|
|
989
|
|
||||||||
|
Add shares issuable upon exercise or vesting of dilutive stock options and RSUs
|
7
|
|
a
|
5
|
|
6
|
|
a
|
4
|
|
||||||
|
Diluted weighted-average shares of common stock outstanding
|
1,046
|
|
1,043
|
|
1,045
|
|
993
|
|
||||||||
|
Basic net income per share attributable to FCX common stockholders
|
$
|
0.53
|
|
$
|
0.79
|
|
$
|
1.48
|
|
$
|
1.97
|
|
||||
|
Diluted net income per share attributable to FCX common stockholders
|
$
|
0.53
|
|
$
|
0.79
|
|
$
|
1.47
|
|
$
|
1.96
|
|
||||
|
a.
|
Excluded shares of common stock associated with outstanding stock options with exercise prices less than the average market price of FCX's common stock that were anti-dilutive totaled approximately
5 million
for
third-quarter
2014 and
3 million
for the
nine
months ended
September 30, 2014
.
|
Outstanding stock options with exercise prices greater than the average market price of FCX’s common stock during the period are excluded from the computation of diluted net income per share of common stock. Excluded stock options totaled
25 million
with a weighted-average exercise price of
$42.34
per option for
third-quarter
2014
,
28 million
with a weighted-average exercise price of
$41.42
per option for the
nine
months ended
September 30, 2014
,
34 million
with a weighted-average exercise price of
$40.11
per option for
third-quarter
2013
and
32 million
with a weighted-average exercise price of
$40.63
per option for the
nine
months ended
September 30, 2013
.
10
The components of inventories follow (in millions):
|
September 30,
2014 |
December 31, 2013
|
|||||||
|
Current inventories:
|
||||||||
|
Raw materials (primarily concentrates)
|
$
|
335
|
|
$
|
238
|
|
||
|
Work-in-process
a
|
129
|
|
199
|
|
||||
|
Finished goods
b
|
1,115
|
|
1,146
|
|
||||
|
Total product inventories
|
$
|
1,579
|
|
$
|
1,583
|
|
||
|
Mill stockpiles
|
$
|
126
|
|
$
|
91
|
|
||
|
Leach stockpiles
|
1,841
|
|
1,614
|
|
||||
|
Total current mill and leach stockpiles
|
$
|
1,967
|
|
$
|
1,705
|
|
||
|
Total materials and supplies, net
c
|
$
|
1,943
|
|
$
|
1,730
|
|
||
|
Long-term inventories:
|
||||||||
|
Mill stockpiles
|
$
|
787
|
|
$
|
698
|
|
||
|
Leach stockpiles
|
1,782
|
|
1,688
|
|
||||
|
Total long-term mill and leach stockpiles
d
|
$
|
2,569
|
|
$
|
2,386
|
|
||
|
a.
|
FCX's mining operations also have work-in-process inventories that are reflected as mill and leach stockpiles.
|
|
b.
|
Primarily included molybdenum concentrates; copper concentrates, anodes, cathodes and rod; and various cobalt products.
|
|
c.
|
Materials and supplies inventory was net of obsolescence reserves totaling
$22 million
at
September 30, 2014
, and
$24 million
at
December 31, 2013
.
|
|
d.
|
Estimated metals in stockpiles not expected to be recovered within the next 12 months.
|
Variations in the relative proportions of jurisdictional income result in fluctuations to FCX’s consolidated effective income tax rate. Geographic sources of FCX's provision for income taxes follow (in millions):
|
Three Months Ended
|
Nine Months Ended
|
|||||||||||||||
|
September 30,
|
September 30,
|
|||||||||||||||
|
|
2014
|
2013
|
2014
|
2013
|
||||||||||||
|
U.S. operations
|
$
|
38
|
|
$
|
104
|
|
a
|
$
|
323
|
|
b
|
$
|
85
|
|
a
|
|
|
International operations
|
311
|
|
c
|
395
|
|
711
|
|
c
|
882
|
|
||||||
|
Total
|
$
|
349
|
|
$
|
499
|
|
$
|
1,034
|
|
$
|
967
|
|
||||
|
a.
|
As a result of second-quarter 2013 oil and gas acquisitions, FCX recognized a net tax benefit of
$183 million
, consisting of income tax benefits of
$190 million
associated with net reductions in FCX's valuation allowances and
$69 million
related to the release of the deferred tax liability on PXP's investment in MMR common stock; partially offset by income tax expense of
$76 million
associated with the write off of deferred tax assets related to environmental liabilities.
|
|
b.
|
Included a
$62 million
charge for deferred taxes recorded in connection with the allocation of goodwill to the sale of the Eagle Ford shale assets.
|
|
c.
|
Included a
$54 million
charge related to changes in Chilean tax rules.
|
FCX’s consolidated effective income tax rate was
34 percent
for the
first nine months of
2014
and
33 percent
for the
first nine months of
2013
, excluding the net benefit of
$183 million
for acquisition-related adjustments.
In September 2014, FCX announced the planned redemption of the
$400 million
outstanding aggregate principal amount of its
8.625%
Senior Notes due 2019. On
October 15, 2014
, the redemption date, these senior notes had a book value of
$441 million
, which included purchase accounting fair value adjustments of
$41 million
. Holders of these senior notes received the principal amount together with the redemption premium and accrued and unpaid interest to the redemption date. As a result of this redemption, FCX will report a gain on early extinguishment of debt of
$24 million
in fourth-quarter 2014.
11
In July 2014, FCX redeemed
$1.7 billion
of the aggregate principal amount of outstanding senior notes, which included
$263 million
for the
6.125%
Senior Notes due 2019,
$525 million
for the 6½% Senior Notes due 2020,
$350 million
for the
6.75%
Senior Notes due 2022 and
$525 million
for the
6.875%
Senior Notes due 2023. At the redemption date, these senior notes had a book value of
$1.8 billion
, which included purchase accounting fair value adjustments of
$167 million
. In accordance with the terms of these senior notes, the redemptions were funded with cash contributions to FM O&G by FCX in exchange for additional equity, which is eliminated in the consolidated financial statements. Holders of these senior notes received the principal amount together with the redemption premium and accrued and unpaid interest to the redemption date. As a result of these redemptions, FCX recorded a gain on early extinguishment of debt of
$58 million
in third-quarter 2014.
In May 2014, FCX, PT Freeport Indonesia (PT-FI) and Freeport-McMoRan Oil & Gas LLC (FM O&G LLC, a wholly owned subsidiary of FM O&G and the successor entity of PXP) amended the senior unsecured
$3.0 billion
revolving credit facility to extend the maturity date one year to
May 31, 2019
, and increase the aggregate principal amount from
$3.0 billion
to
$4.0 billion
, with
$500 million
available to PT-FI. FCX, PT-FI and FM O&G LLC had entered into the
$3.0 billion
revolving credit facility on
May 31, 2013
(upon completion of the acquisition of PXP). At
September 30, 2014
, FCX had borrowings of
$1.1 billion
and
$45 million
of letters of credit issued under the revolving credit facility, resulting in availability of approximately
$2.9 billion
, of which
$1.5 billion
could be used for additional letters of credit.
In April 2014, FCX redeemed
$210 million
of the aggregate principal amount of the outstanding
6.625%
Senior Notes due 2021. In accordance with the terms of the senior notes, the redemption was funded with cash contributions to FM O&G by FCX in exchange for additional equity, which is eliminated in the consolidated financial statements. Holders of these senior notes received the principal amount together with the redemption premium and accrued and unpaid interest to the redemption date. As a result of the redemption, FCX recorded a gain on early extinguishment of debt of
$6 million
in second-quarter 2014.
In March 2014, Sociedad Minera Cerro Verde S.A.A. (Cerro Verde, FCX's mining subsidiary in Peru) entered into a
five
-year,
$1.8 billion
senior unsecured credit facility that is nonrecourse to FCX and the other shareholders of Cerro Verde. The credit facility allows for term loan borrowings up to the full amount of the facility, less any amounts issued and outstanding under a
$500 million
letter of credit sublimit. Interest on amounts drawn under the term loan is based on London Interbank Offered Rate (
LIBOR
) plus a spread (currently
1.90 percent
) based on Cerro Verde’s total net debt to earnings before interest, taxes, depreciation and amortization (EBITDA) ratio as defined in the agreement. Amounts may be drawn or letters of credit may be issued over a
two
-year period to fund a portion of Cerro Verde’s expansion project and for Cerro Verde's general corporate purposes. The credit facility amortizes in
three
installments in amounts necessary for the aggregate borrowings and outstanding letters of credit not to exceed
85 percent
of the
$1.8 billion
commitment on
September 30, 2017
,
70 percent
on
March 31, 2018
, and
35 percent
on
September 30, 2018
, with the remaining balance due on the maturity date of
March 10, 2019
. At
September 30, 2014
, there were
no
borrowings and
no
letters of credit issued under Cerro Verde’s credit facility.
FCX recorded a loss on early extinguishment of debt of
$45 million
in first-quarter 2013 for financing costs incurred for the terminated
$9.5 billion
acquisition bridge loan facility, which was entered into in December 2012 to provide interim financing for FCX's second-quarter 2013 acquisitions of PXP and MMR.
Consolidated interest expense (excluding capitalized interest) totaled
$212 million
in
third-quarter
2014
,
$223 million
in
third-quarter
2013
,
$661 million
for the first
nine
months of
2014
and
$465 million
for the first
nine
months of
2013
. Capitalized interest included in property, plant, equipment and mining development costs, net, totaled
$34 million
in
third-quarter
2014
,
$26 million
in
third-quarter
2013
,
$113 million
for the first
nine
months of
2014
and
$68 million
for the
nine
months of
2013
. Capitalized interest included in oil and gas properties not subject to amortization totaled
$20 million
in
third-quarter
2014
,
$35 million
in
third-quarter
2013
,
$65 million
for the first
nine
months of
2014
and
$46 million
for the four months from June 1, 2013, to September 30, 2013.
On
September 24, 2014
, FCX's Board of Directors declared a quarterly dividend of
$0.3125
per share, which was paid on
November 3, 2014
, to common shareholders of record at the close of business on
October 15, 2014
.
In connection with the second-quarter 2013 acquisition of PXP, FCX issued
91 million
shares of its common stock.
12
FCX does not purchase, hold or sell derivative financial instruments unless there is an existing asset or obligation, or it anticipates a future activity that is likely to occur and will result in exposure to market risks, which FCX intends to offset or mitigate. FCX does not enter into any derivative financial instruments for speculative purposes, but has entered into derivative financial instruments in limited instances to achieve specific objectives. These objectives principally relate to managing risks associated with commodity price changes, foreign currency exchange rates and interest rates.
Commodity Contracts.
From time to time, FCX has entered into derivative contracts to hedge the market risk associated with fluctuations in the prices of commodities it purchases and sells. As a result of the acquisition of PXP, FCX assumed a variety of crude oil and natural gas commodity derivatives to hedge the exposure to the volatility of crude oil and natural gas commodity prices. Derivative financial instruments used by FCX to manage its risks do not contain credit risk-related contingent provisions. As of
September 30, 2014
, and
December 31, 2013
, FCX had no price protection contracts relating to its mine production. A discussion of FCX’s derivative contracts and programs follows.
Derivatives Designated as Hedging Instruments – Fair Value Hedges
Copper Futures and Swap Contracts.
Some of FCX’s U.S. copper rod customers request a fixed market price instead of the Commodity Exchange Inc. (COMEX), a division of the New York Mercantile Exchange (NYMEX), average copper price in the month of shipment. FCX hedges this price exposure in a manner that allows it to receive the COMEX average price in the month of shipment while the customers pay the fixed price they requested. FCX accomplishes this by entering into copper futures or swap contracts. Hedging gains or losses from these copper futures and swap contracts are recorded in revenues. FCX did not have any significant gains or losses during the
three
-month or
nine
-month periods ended
September 30, 2014
and
2013
, resulting from hedge ineffectiveness. At
September 30, 2014
, FCX held copper futures and swap contracts that qualified for hedge accounting for
54 million
pounds at an average contract price of
$3.09
per pound, with maturities through
December 2015
.
A summary of gains (losses) recognized in revenues for derivative financial instruments related to commodity contracts that are designated and qualify as fair value hedge transactions, along with the unrealized gains (losses) on the related hedged item follows (in millions):
|
|
Three Months Ended
|
Nine Months Ended
|
|||||||||||||
|
September 30,
|
September 30,
|
||||||||||||||
|
|
2014
|
2013
|
2014
|
2013
|
|||||||||||
|
Copper futures and swap contracts:
|
|
|
|||||||||||||
|
Unrealized gains (losses):
|
|
|
|||||||||||||
|
Derivative financial instruments
|
$
|
(10
|
)
|
$
|
16
|
|
$
|
(10
|
)
|
$
|
(2
|
)
|
|||
|
Hedged item – firm sales commitments
|
10
|
|
(16
|
)
|
10
|
|
2
|
|
|||||||
|
Realized gains (losses):
|
|
|
|||||||||||||
|
Matured derivative financial instruments
|
1
|
|
(3
|
)
|
(3
|
)
|
(17
|
)
|
|||||||
Derivatives Not Designated as Hedging Instruments
Embedded Derivatives.
As described in Note 1 to FCX's annual report on Form 10-K for the year ended December 31, 2013, under “Revenue Recognition,” certain FCX copper concentrate, copper cathode and gold sales contracts provide for provisional pricing primarily based on the London Metal Exchange (LME) copper price or the COMEX copper price and the London Bullion Market Association (London) gold price at the time of shipment as specified in the contract. Similarly, FCX purchases copper under contracts that provide for provisional pricing. FCX applies the normal purchases and normal sales scope exception in accordance with derivatives and hedge accounting guidance to the host sales agreements since the contracts do not allow for net settlement and always result in physical delivery. Sales and purchases with a provisional sales price contain an embedded derivative (
i.e.
, the price settlement mechanism is settled after the time of delivery) that is required to be bifurcated from the host contract. The host contract is the sale or purchase of the metals contained in the concentrates or cathodes at the then-current LME or COMEX copper price or the London gold price as defined in the contract. Mark-to-market price fluctuations recorded through the settlement date are reflected in revenues for sales contracts and in cost of sales as production and delivery costs for purchase contracts.
13
A summary of FCX’s embedded commodity derivatives at
September 30, 2014
, follows:
|
Open Positions
|
Average Price
Per Unit
|
Maturities Through
|
||||||||||
|
|
Contract
|
Market
|
||||||||||
|
Embedded derivatives in provisional sales contracts:
|
|
|
|
|
||||||||
|
Copper (millions of pounds)
|
554
|
|
$
|
3.14
|
|
$
|
3.03
|
|
February 2015
|
|||
|
Gold (thousands of ounces)
|
301
|
|
1,259
|
|
1,214
|
|
January 2015
|
|||||
|
Embedded derivatives in provisional purchase contracts:
|
|
|
|
|||||||||
|
Copper (millions of pounds)
|
98
|
|
3.16
|
|
3.03
|
|
January 2015
|
|||||
Crude Oil and Natural Gas Contracts.
As a result of the acquisition of PXP, FCX has derivative contracts for 2014 and 2015 that consist of crude oil options and natural gas swaps. These crude oil and natural gas derivatives are not designated as hedging instruments and are recorded at fair value with the mark-to-market gains and losses recorded in revenues.
The crude oil options were entered into by PXP to protect the realized price of a portion of expected future sales in order to limit the effects of crude oil price decreases. At
September 30, 2014
, these contracts are composed of crude oil put spreads consisting of put options with a floor limit. The premiums associated with put options are deferred until the settlement period. At
September 30, 2014
, the deferred option premiums and accrued interest associated with the crude oil option contracts totaled
$269 million
, which was included as a reduction of the fair value of the crude oil options contracts. At
September 30, 2014
, the outstanding crude oil option contracts, which settle monthly and cover approximately
10 million
barrels in the fourth quarter of 2014 and approximately
31 million
barrels in 2015, follow:
|
Average Strike Price (per barrel)
a
|
|||||||||||||||||||
|
Period
|
Instrument Type
|
Daily Volumes (thousand barrels)
|
Floor
|
Floor Limit
|
Average Deferred Premium
(per barrel)
|
Index
|
|||||||||||||
|
2014
|
|||||||||||||||||||
|
Oct - Dec
|
Put options
b
|
75
|
|
$
|
90
|
|
$
|
70
|
|
$
|
5.74
|
|
Brent
|
||||||
|
Oct - Dec
|
Put options
b
|
30
|
|
95
|
|
75
|
|
6.09
|
|
Brent
|
|||||||||
|
Oct - Dec
|
Put options
b
|
5
|
|
100
|
|
80
|
|
7.11
|
|
Brent
|
|||||||||
|
2015
|
|||||||||||||||||||
|
Jan - Dec
|
Put options
b
|
84
|
|
90
|
|
70
|
|
6.89
|
|
Brent
|
|||||||||
|
a.
|
The average strike prices do not reflect any premiums to purchase the put options.
|
|
b.
|
If the index price is less than the per barrel floor, FCX receives the difference between the per barrel floor and the index price up to a maximum of
$20
per barrel less the option premium. If the index price is at or above the per barrel floor, FCX pays the option premium and no cash settlement is received.
|
In addition, at
September 30, 2014
, outstanding natural gas swaps with a weighted-average fixed swap price of
$4.09
per million British thermal units (MMBtu) cover approximately
9 million
MMBtu of natural gas, with maturities through
December 2014
(on daily volumes of
100,000
MMBtu). If the Henry Hub index price is less than the fixed price, FCX receives the difference between the fixed price and the Henry Hub index price. FCX pays the difference between the index price and the fixed price if the Henry Hub index price is greater than the fixed price.
Copper Forward Contracts.
Atlantic Copper, FCX's wholly owned smelting and refining unit in Spain, enters into forward copper contracts designed to hedge its copper price risk whenever its physical purchases and sales pricing periods do not match. These economic hedge transactions are intended to hedge against changes in copper prices, with the mark-to-market hedging gains or losses recorded in cost of sales. At
September 30, 2014
, Atlantic Copper held net forward copper purchase contracts for
46 million
pounds at an average contract price of
$3.12
per pound, with maturities through
November 2014
.
14
Summary of Gains (Losses).
A summary of the realized and unrealized gains (losses) recognized in income before income taxes and equity in affiliated companies’ net earnings for commodity contracts that do not qualify as hedge transactions, including embedded derivatives, follows (in millions):
|
|
Three Months Ended
|
Nine Months Ended
|
|||||||||||||
|
September 30,
|
September 30,
|
||||||||||||||
|
|
2014
|
2013
|
2014
|
2013
|
|||||||||||
|
Embedded derivatives in provisional copper and gold
|
|||||||||||||||
|
sales contracts
a
|
$
|
(99
|
)
|
$
|
141
|
|
$
|
(184
|
)
|
$
|
(147
|
)
|
|||
|
Crude oil options and swaps
a
|
57
|
|
(173
|
)
|
(47
|
)
|
(227
|
)
|
|||||||
|
Natural gas swaps
a
|
7
|
|
3
|
|
(9
|
)
|
22
|
|
|||||||
|
Copper forward contracts
b
|
(4
|
)
|
—
|
|
1
|
|
3
|
|
|||||||
|
a.
|
Amounts recorded in revenues.
|
|
b.
|
Amounts recorded in cost of sales as production and delivery costs.
|
Unsettled Derivative Financial Instruments
A summary of the fair values of unsettled commodity derivative financial instruments follows (in millions):
|
September 30,
2014 |
December 31, 2013
|
|||||||
|
Commodity Derivative Assets:
|
|
|
||||||
|
Derivatives designated as hedging instruments:
|
|
|
||||||
|
Copper futures and swap contracts
a
|
$
|
1
|
|
$
|
6
|
|
||
|
Derivatives not designated as hedging instruments:
|
|
|
||||||
|
Embedded derivatives in provisional copper and gold
|
||||||||
|
sales/purchase contracts
|
12
|
|
63
|
|
||||
|
Total derivative assets
|
$
|
13
|
|
$
|
69
|
|
||
|
Commodity Derivative Liabilities:
|
||||||||
|
Derivatives designated as hedging instruments:
|
||||||||
|
Copper futures and swap contracts
a
|
$
|
5
|
|
$
|
—
|
|
||
|
Derivatives not designated as hedging instruments:
|
||||||||
|
Embedded derivatives in provisional copper and gold
|
||||||||
|
sales/purchase contracts
|
75
|
|
16
|
|
||||
|
Crude oil options
b
|
182
|
|
309
|
|
||||
|
Natural gas swaps
|
—
|
|
4
|
|
||||
|
Copper forward contracts
|
4
|
|
1
|
|
||||
|
Total derivative liabilities
|
$
|
266
|
|
$
|
330
|
|
||
|
a.
|
FCX paid
$6 million
to brokers at
September 30, 2014
, and
$1 million
at
December 31, 2013
, for margin requirements (recorded in other current assets).
|
|
b.
|
Included
$269 million
at
September 30, 2014
, and
$444 million
at
December 31, 2013
, for deferred premiums and accrued interest.
|
15
FCX's commodity contracts have netting arrangements with counterparties with which the right of offset exists, and it is FCX's policy to offset balances by counterparty on the balance sheet. FCX's embedded derivatives on provisional sales/purchases are netted with the corresponding outstanding receivable/payable balances. A summary of these unsettled commodity contracts that are offset in the balance sheet follows (in millions):
|
Assets
|
Liabilities
|
|||||||||||||||
|
September 30, 2014
|
December 31, 2013
|
September 30, 2014
|
December 31, 2013
|
|||||||||||||
|
Gross amounts recognized:
|
||||||||||||||||
|
Commodity contracts:
|
||||||||||||||||
|
Embedded derivatives on provisional
|
||||||||||||||||
|
sales/purchase contracts
|
$
|
12
|
|
$
|
63
|
|
$
|
75
|
|
$
|
16
|
|
||||
|
Crude oil and natural gas derivatives
|
—
|
|
—
|
|
182
|
|
313
|
|
||||||||
|
Copper derivatives
|
1
|
|
6
|
|
9
|
|
1
|
|
||||||||
|
13
|
|
69
|
|
266
|
|
330
|
|
|||||||||
|
Less gross amounts of offset:
|
||||||||||||||||
|
Commodity contracts:
|
||||||||||||||||
|
Embedded derivatives on provisional
|
||||||||||||||||
|
sales/purchase contracts
|
—
|
|
10
|
|
—
|
|
10
|
|
||||||||
|
Crude oil and natural gas derivatives
|
—
|
|
—
|
|
—
|
|
—
|
|
||||||||
|
Copper derivatives
|
1
|
|
—
|
|
1
|
|
—
|
|
||||||||
|
1
|
|
10
|
|
1
|
|
10
|
|
|||||||||
|
Net amounts presented in balance sheet:
|
||||||||||||||||
|
Commodity contracts:
|
||||||||||||||||
|
Embedded derivatives on provisional
|
||||||||||||||||
|
sales/purchase contracts
|
12
|
|
53
|
|
75
|
|
6
|
|
||||||||
|
Crude oil and natural gas derivatives
|
—
|
|
—
|
|
182
|
|
313
|
|
||||||||
|
Copper derivatives
|
—
|
|
6
|
|
8
|
|
1
|
|
||||||||
|
$
|
12
|
|
$
|
59
|
|
$
|
265
|
|
$
|
320
|
|
|||||
|
Balance sheet classification:
|
||||||||||||||||
|
Trade accounts receivable
|
$
|
1
|
|
$
|
53
|
|
$
|
60
|
|
$
|
—
|
|
||||
|
Other current assets
|
—
|
|
6
|
|
—
|
|
—
|
|
||||||||
|
Accounts payable and accrued liabilities
|
11
|
|
—
|
|
169
|
|
205
|
|
||||||||
|
Other liabilities
|
—
|
|
—
|
|
36
|
|
115
|
|
||||||||
|
$
|
12
|
|
$
|
59
|
|
$
|
265
|
|
$
|
320
|
|
|||||
Credit Risk.
FCX is exposed to credit loss when financial institutions with which FCX has entered into derivative transactions (commodity, foreign exchange and interest rate swaps) are unable to pay. To minimize the risk of such losses, FCX uses counterparties that meet certain credit requirements and periodically reviews the creditworthiness of these counterparties. FCX does not anticipate that any of the counterparties it deals with will default on their obligations. As of
September 30, 2014
, the maximum amount of credit exposure associated with derivative transactions was
$12 million
.
Other Financial Instruments.
Other financial instruments include cash and cash equivalents, accounts receivable, investment securities, legally restricted funds, accounts payable and accrued liabilities, dividends payable and long-term debt. The carrying value for cash and cash equivalents (which included time deposits of
$72 million
at
September 30, 2014
, and
$211 million
at December 31, 2013), accounts receivable, accounts payable and accrued liabilities, and dividends payable approximates fair value because of their short-term nature and generally negligible credit losses (refer to Note
8
for the fair values of investment securities, legally restricted funds and long-term debt).
In addition,
FCX has non-detachable warrants, which are considered to be embedded derivative instruments, associated with FM O&G's Plains Offshore Operations Inc. (Plains Offshore)
8%
Convertible Preferred Stock (Preferred Stock) (refer to Note
8
for the fair value of these instruments).
16
Fair value accounting guidance includes a hierarchy that prioritizes the inputs to valuation techniques used to measure fair value. The hierarchy gives the highest priority to unadjusted quoted prices in active markets for identical assets or liabilities (Level 1 inputs) and the lowest priority to unobservable inputs (Level 3 inputs). FCX recognizes transfers between levels at the end of the reporting period. FCX did not have any significant transfers in or out of Level 1, 2 or 3 for
third
-quarter
2014
or for the first nine months of 2014.
A summary of the carrying amount and fair value of FCX’s financial instruments, other than cash and cash equivalents, accounts receivable, accounts payable and accrued liabilities, and dividends payable (refer to Note
7
), follows (in millions):
|
At September 30, 2014
|
|||||||||||||||||||
|
|
Carrying
|
Fair Value
|
|||||||||||||||||
|
|
Amount
|
Total
|
Level 1
|
Level 2
|
Level 3
|
||||||||||||||
|
Assets
|
|
|
|
|
|||||||||||||||
|
Investment securities:
a,b,c
|
|||||||||||||||||||
|
U.S. core fixed income fund
|
$
|
22
|
|
$
|
22
|
|
$
|
—
|
|
$
|
22
|
|
$
|
—
|
|
||||
|
Money market funds
|
20
|
|
20
|
|
20
|
|
—
|
|
—
|
|
|||||||||
|
Equity securities
|
4
|
|
4
|
|
4
|
|
—
|
|
—
|
|
|||||||||
|
Total
|
46
|
|
46
|
|
24
|
|
22
|
|
—
|
|
|||||||||
|
Legally restricted funds:
a,b,d
|
|
|
|
|
|||||||||||||||
|
U.S. core fixed income fund
|
50
|
|
50
|
|
—
|
|
50
|
|
—
|
|
|||||||||
|
Government bonds and notes
|
35
|
|
35
|
|
—
|
|
35
|
|
—
|
|
|||||||||
|
Government mortgage-backed securities
|
33
|
|
33
|
|
—
|
|
33
|
|
—
|
|
|||||||||
|
Corporate bonds
|
26
|
|
26
|
|
—
|
|
26
|
|
—
|
|
|||||||||
|
Asset-backed securities
|
16
|
|
16
|
|
—
|
|
16
|
|
—
|
|
|||||||||
|
Money market funds
|
8
|
|
8
|
|
8
|
|
—
|
|
—
|
|
|||||||||
|
Municipal bonds
|
1
|
|
1
|
|
—
|
|
1
|
|
—
|
|
|||||||||
|
Total
|
169
|
|
169
|
|
8
|
|
161
|
|
—
|
|
|||||||||
|
Derivatives:
a,e
|
|
|
|
|
|||||||||||||||
|
Embedded derivatives in provisional sales/purchase
|
|||||||||||||||||||
|
contracts in a gross asset position
|
12
|
|
12
|
|
—
|
|
12
|
|
—
|
|
|||||||||
|
Copper futures and swap contracts
|
1
|
|
1
|
|
1
|
|
—
|
|
—
|
|
|||||||||
|
Total
|
13
|
|
13
|
|
1
|
|
12
|
|
—
|
|
|||||||||
|
Total assets
|
$
|
228
|
|
$
|
33
|
|
$
|
195
|
|
$
|
—
|
|
|||||||
|
Liabilities
|
|
|
|
|
|||||||||||||||
|
Derivatives:
a,e
|
|
|
|
|
|||||||||||||||
|
Embedded derivatives in provisional sales/purchase
|
|||||||||||||||||||
|
contracts in a gross liability position
|
$
|
75
|
|
$
|
75
|
|
$
|
—
|
|
$
|
75
|
|
$
|
—
|
|
||||
|
Crude oil options
|
182
|
|
182
|
|
—
|
|
—
|
|
182
|
|
|||||||||
|
Copper futures and swap contracts
|
5
|
|
5
|
|
5
|
|
—
|
|
—
|
|
|||||||||
|
Copper forward contracts
|
4
|
|
4
|
|
2
|
|
2
|
|
—
|
|
|||||||||
|
Total
|
266
|
|
266
|
|
7
|
|
77
|
|
182
|
|
|||||||||
|
Long-term debt, including current portion
f
|
19,737
|
|
19,882
|
|
—
|
|
19,882
|
|
—
|
|
|||||||||
|
Total liabilities
|
$
|
20,148
|
|
$
|
7
|
|
$
|
19,959
|
|
$
|
182
|
|
|||||||
17
|
At December 31, 2013
|
|||||||||||||||||||
|
|
Carrying
|
Fair Value
|
|||||||||||||||||
|
|
Amount
|
Total
|
Level 1
|
Level 2
|
Level 3
|
||||||||||||||
|
Assets
|
|
|
|
|
|||||||||||||||
|
Investment securities:
a,b
|
|||||||||||||||||||
|
U.S. core fixed income fund
|
$
|
21
|
|
$
|
21
|
|
$
|
—
|
|
$
|
21
|
|
$
|
—
|
|
||||
|
Money market funds
|
18
|
|
18
|
|
18
|
|
—
|
|
—
|
|
|||||||||
|
Equity securities
|
5
|
|
5
|
|
5
|
|
—
|
|
—
|
|
|||||||||
|
Total
|
44
|
|
44
|
|
23
|
|
21
|
|
—
|
|
|||||||||
|
Legally restricted funds:
a,b,d
|
|
|
|
|
|||||||||||||||
|
U.S. core fixed income fund
|
48
|
|
48
|
|
—
|
|
48
|
|
—
|
|
|||||||||
|
Government mortgage-backed securities
|
34
|
|
34
|
|
—
|
|
34
|
|
—
|
|
|||||||||
|
Corporate bonds
|
28
|
|
28
|
|
—
|
|
28
|
|
—
|
|
|||||||||
|
Government bonds and notes
|
28
|
|
28
|
|
—
|
|
28
|
|
—
|
|
|||||||||
|
Money market funds
|
28
|
|
28
|
|
28
|
|
—
|
|
—
|
|
|||||||||
|
Asset-backed securities
|
15
|
|
15
|
|
—
|
|
15
|
|
—
|
|
|||||||||
|
Municipal bonds
|
1
|
|
1
|
|
—
|
|
1
|
|
—
|
|
|||||||||
|
Total
|
182
|
|
182
|
|
28
|
|
154
|
|
—
|
|
|||||||||
|
Derivatives:
a,e
|
|
|
|
|
|||||||||||||||
|
Embedded derivatives in provisional sales/purchase
|
|||||||||||||||||||
|
contracts in a gross asset position
|
63
|
|
63
|
|
—
|
|
63
|
|
—
|
|
|||||||||
|
Copper futures and swap contracts
|
6
|
|
6
|
|
5
|
|
1
|
|
—
|
|
|||||||||
|
Total
|
69
|
|
69
|
|
5
|
|
64
|
|
—
|
|
|||||||||
|
Total assets
|
$
|
295
|
|
$
|
56
|
|
$
|
239
|
|
$
|
—
|
|
|||||||
|
Liabilities
|
|
|
|
|
|||||||||||||||
|
Derivatives:
a
|
|||||||||||||||||||
|
Embedded derivatives in provisional sales/purchase
|
|||||||||||||||||||
|
contracts in a gross liability position
e
|
$
|
16
|
|
$
|
16
|
|
$
|
—
|
|
$
|
16
|
|
$
|
—
|
|
||||
|
Crude oil options
e
|
309
|
|
309
|
|
—
|
|
—
|
|
309
|
|
|||||||||
|
Natural gas swaps
e
|
4
|
|
4
|
|
—
|
|
4
|
|
—
|
|
|||||||||
|
Copper forward contracts
e
|
1
|
|
1
|
|
1
|
|
—
|
|
—
|
|
|||||||||
|
Plains Offshore warrants
g
|
2
|
|
2
|
|
—
|
|
—
|
|
2
|
|
|||||||||
|
Total
|
332
|
|
332
|
|
1
|
|
20
|
|
311
|
|
|||||||||
|
Long-term debt, including current portion
f
|
20,706
|
|
20,487
|
|
—
|
|
20,487
|
|
—
|
|
|||||||||
|
Total liabilities
|
$
|
20,819
|
|
$
|
1
|
|
$
|
20,507
|
|
$
|
311
|
|
|||||||
|
a.
|
Recorded at fair value.
|
|
b.
|
Current portion included in other current assets and long-term portion included in other assets.
|
|
c.
|
Excluded
$115 million
of time deposits (which approximated fair value) at
September 30, 2014
(included in other assets), associated with an assurance bond to support PTFI's commitment for smelter development in Indonesia (refer to Note 9 for further discussion).
|
|
d.
|
Excluded time deposits (which approximated fair value) of
$9 million
at
September 30, 2014
(included in other current assets), associated with a customs audit assessment at PT-FI, and
$15 million
included in other current assets and
$210 million
in other assets at
December 31, 2013
, associated with the Cerro Verde royalty dispute.
|
|
e.
|
Refer to Note
7
for further discussion and balance sheet classifications. Crude oil options are net of
$269 million
at
September 30, 2014
, and
$444 million
at
December 31, 2013
, for deferred premiums and accrued interest.
|
|
f.
|
Recorded at cost except for debt assumed in acquisitions, which were recorded at fair value at the respective acquisition dates.
|
|
g.
|
Included in other liabilities.
|
18
Valuation Techniques
Money market funds are classified within Level 1 of the fair value hierarchy because they are valued using quoted market prices in active markets.
Fixed income securities (U.S. core fixed income funds, government securities, corporate bonds, asset-backed securities and municipal bonds) are valued using a bid evaluation price or a mid-evaluation price. A bid evaluation price is an estimated price at which a dealer would pay for a security. A mid-evaluation price is the average of the estimated price at which a dealer would sell a security and the estimated price at which a dealer would pay for a security. These evaluations are based on quoted prices, if available, or models that use observable inputs and, as such, are classified within Level 2 of the fair value hierarchy.
Equity securities are valued at the closing price reported on the active market on which the individual securities are traded and, as such, are classified within Level 1 of the fair value hierarchy.
FCX’s embedded derivatives on provisional copper concentrate, copper cathode and gold purchases and sales have critical inputs of quoted monthly LME or COMEX copper forward prices and the London gold forward price at each reporting date based on the month of maturity; however, FCX's contracts themselves are not traded on an exchange. As a result, these derivatives are classified within Level 2 of the fair value hierarchy.
FCX
'
s derivative financial instruments for crude oil options are valued using an option pricing model, which uses various inputs including IntercontinentalExchange, Inc. crude oil prices, volatilities, interest rates and contract terms. FCX
'
s derivative financial instruments for natural gas swaps are valued using a pricing model that has various inputs including NYMEX price quotations, interest rates and contract terms. Valuations are adjusted for credit quality, using the counterparties
'
credit quality for asset balances and FCX
'
s credit quality for liability balances (which considers the impact of netting agreements on counterparty credit risk, including whether the position with the counterparty is a net asset or net liability). For asset balances, FCX uses the credit default swap value for counterparties when available or the spread between the risk-free interest rate and the yield rate on the counterparties
'
publicly traded debt for similar instruments
.
The 2014 natural gas swaps are classified within Level 2 of the fair value hierarchy because the inputs used in the valuation models are directly or indirectly observable for substantially the full term of the instruments. The 2014 and 2015 crude oil options are classified within Level 3 of the fair value hierarchy because the inputs used in the valuation models are not observable for substantially the full term of the instruments. The significant unobservable inputs used in the fair value measurement of the crude oil options are implied volatilities and deferred premiums. Significant increases (decreases) in implied volatilities in isolation would result in a significantly higher (lower) fair value measurement. The implied volatilities ranged from
17 percent
to
33 percent
, with a weighted average of
21 percent
. The deferred premiums ranged from
$5.15
per barrel to
$7.22
per barrel, with a weighted average of
$6.64
per barrel. Refer to Note
7
for further discussion of these derivative financial instruments
.
FCX’s derivative financial instruments for copper futures and swap contracts and copper forward contracts that are traded on the respective exchanges are classified within Level 1 of the fair value hierarchy because they are valued using quoted monthly COMEX or LME prices at each reporting date based on the month of maturity (refer to Note
7
for further discussion). Certain of these contracts are traded on the over-the-counter market and are classified within Level 2 of the fair value hierarchy based on COMEX and LME forward prices.
The fair value of warrants associated with the Plains Offshore Preferred Stock was determined with an option pricing model that used unobservable inputs. The inputs used in the valuation model are the estimated fair value of the underlying Plains Offshore common stock, expected exercise price, expected term, expected volatility and risk-free interest rate. The assumptions used in the valuation model are highly subjective because the common stock of Plains Offshore is not publicly traded. As a result, these warrants are classified within Level 3 of the fair value hierarchy.
Long-term debt, including the current portion, is not actively traded and is valued using prices obtained from a readily available pricing source and, as such, is classified within Level 2 of the fair value hierarchy.
19
The techniques described above may produce a fair value calculation that may not be indicative of net realizable value or reflective of future fair values. Furthermore, while FCX believes its valuation techniques are appropriate and consistent with other market participants, the use of different techniques or assumptions to determine fair value of certain financial instruments could result in a different fair value measurement at the reporting date. There have been no changes in the techniques used at
September 30, 2014
.
A summary of the changes in the fair value of FCX
'
s Level 3 instruments follows (in millions):
|
Crude Oil
|
Plains Offshore
|
|||||||
|
Options
|
Warrants
|
|||||||
|
Fair value at December 31, 2013
|
$
|
(309
|
)
|
$
|
(2
|
)
|
||
|
Net realized losses
|
(21
|
)
|
a
|
—
|
|
|||
|
Net unrealized (losses) gains included in earnings related to assets and liabilities still held at the end of the period
|
(29
|
)
|
b
|
2
|
|
c
|
||
|
Settlement payments
|
177
|
|
—
|
|
||||
|
Fair value at September 30, 2014
|
$
|
(182
|
)
|
$
|
—
|
|
||
|
a.
|
Included net realized losses of
$20 million
recorded in revenues and
$1 million
of interest expense associated with the deferred premiums.
|
|
b.
|
Included net unrealized losses of
$28 million
recorded in revenues and
$1 million
of interest expense associated with the deferred premiums.
|
|
c.
|
Recorded in other income, net.
|
Litigation.
During third-quarter 2014, there were no significant developments in previously reported legal proceedings included in Note 12 of FCX’s annual report on Form 10-K for the year ended
December 31, 2013
, as updated in Note 9 of FCX's quarterly report on Form 10-Q for the quarter ended March 31, 2014.
Tax and Other Matters.
Cerro Verde Royalty Dispute.
There were no significant changes to the Cerro Verde royalty dispute during the first nine months of 2014 (refer to Note 12 of FCX’s annual report on Form 10-K for the year ended
December 31, 2013
, for further discussion of this matter).
Indonesia Tax Matters.
As reported in Note 12 of FCX’s annual report on Form 10-K for the year ended December 31, 2013, PT-FI has received assessments from the Indonesian tax authorities for additional taxes and interest related to various audit exceptions for the years 2005, 2006, 2007, 2008 and 2011. PT-FI has filed objections to these assessments because it believes it has properly determined and paid its taxes.
Required estimated income tax payments for 2012 significantly exceeded PT-FI’s 2012 reported income tax liability, which resulted in a
$303 million
overpayment (included in other accounts receivable in the condensed consolidated balance sheets at December 31, 2013). During second-quarter 2014, the Indonesian tax authorities issued tax assessments for 2012 of
$137 million
and other offsets of
$15 million
, and refunded the balance of
$151 million
(before foreign exchange adjustments). PT-FI expects to file objections and use other means available under Indonesian tax laws and regulations to recover all overpayments that remain in dispute.
As of September 30, 2014, PT-FI had
$392 million
included in other assets for amounts paid on disputed tax assessments, which it believes are collectable.
Mining Contract - Indonesia.
On
July 25, 2014
, PT-FI entered into a Memorandum of Understanding (MOU) with the Indonesian government under which PT-FI and the government agreed to negotiate an amended Contract of Work (COW) to address provisions related to the size of PT-FI’s concession area, royalties and taxes, domestic processing and refining, divestment, local content, and continuation of operations post-
2021
.
Under the MOU, provisions to be addressed in the negotiation of an amended COW include provisions for the development of new copper smelting and refining capacity in Indonesia, which will take into consideration an equitable sharing of costs between PT-FI (and any partners in the project) and the Indonesian government through fiscal incentives, provisions for divestment to the Indonesian government and/or Indonesian nationals of up to a
30 percent
interest (an additional
20.64 percent
interest) in PT-FI at fair value, and continuation of operations from
2022
through
2041
. The MOU provides that negotiations for an amended COW will take into consideration PT-FI’s need for assurance of legal and fiscal terms post-
2021
for PT-FI to continue with its large-scale investment program
20
for the development of its underground reserves. PT-FI is engaged in discussions with the Indonesian government regarding an amended COW.
Effective with the signing of the MOU, PT-FI provided a
$115 million
assurance bond to support its commitment for smelter development, agreed to increase royalties to
4.0 percent
for copper and
3.75 percent
for gold from the previous rates of
3.5 percent
for copper and
1.0 percent
for gold, and to pay export duties set forth in a new regulation. The Indonesian government revised its January 2014 regulations (as discussed in Note 13 of FCX’s annual report on Form 10-K for the year ended December 31, 2013) regarding export duties to incorporate reduced rates for copper concentrate exports for companies engaged in smelter development. The revised regulations provide for duties on copper concentrate exports during smelter development initially at
7.5 percent
, declining to
5.0 percent
when development progress exceeds
7.5 percent
and is eliminated when development progress exceeds
30 percent
. In addition, PT-FI is required to apply for renewal of export permits at six-month intervals, with the next renewal date in January 2015.
Under the MOU, no terms of the COW other than those relating to the export duties, smelter bond and royalties described previously will be changed until the completion of an amended COW.
FCX has organized its operations into six primary divisions – North America copper mines, South America mining, Indonesia mining, Africa mining, Molybdenum mines and U.S. oil and gas operations. Notwithstanding this structure, FCX internally reports information on a mine-by-mine basis for its mining operations. Therefore, FCX concluded that its operating segments include individual mines or operations relative to its mining operations. For oil and gas operations, FCX determines its operating segments on a country-by-country basis. FCX's U.S. oil and gas operations reflect the results of FM O&G beginning
June 1, 2013
. Operating segments that meet certain thresholds are reportable segments, which are disclosed separately in the following tables.
On
November 3, 2014
, FCX completed the sale of its
80 percent
ownership interests in the Candelaria mine, a separately reported segment, and the Ojos del Salado mine, reported as a component of other South America mines. Refer to Note
13
for further discussion.
Intersegment Sales.
Intersegment sales between FCX’s mining operations are based on similar arms-length transactions with third parties at the time of the sale. Intersegment sales may not be reflective of the actual prices ultimately realized because of a variety of factors, including additional processing, timing of sales to unaffiliated customers and transportation premiums.
FCX defers recognizing profits on sales from its mining operations to other divisions, including Atlantic Copper and on
25 percent
of PT-FI's sales to PT Smelting until final sales to third parties occur. Quarterly variations in ore grades, the timing of intercompany shipments and changes in product prices result in variability in FCX's net deferred profits and quarterly earnings.
Allocations.
FCX allocates certain operating costs, expenses and capital expenditures to its operating divisions and individual segments. However, not all costs and expenses applicable to an operation are allocated. U.S. federal and state income taxes are recorded and managed at the corporate level, whereas foreign income taxes are recorded and managed at the applicable country level. In addition, most mining exploration and research activities are managed on a consolidated basis, and those costs along with some selling, general and administrative costs are not allocated to the operating divisions or individual segments. Accordingly, the following segment information reflects management determinations that may not be indicative of what the actual financial performance of each operating division or segment would be if it was an independent entity.
21
Business Segments
|
(In millions)
|
Mining Operations
|
||||||||||||||||||||||||||||||||||||||||||||||||||||||||||||||||||
|
North America Copper Mines
|
South America
|
Indonesia
|
Africa
|
|
|
|
|
|
|||||||||||||||||||||||||||||||||||||||||||||||||||||||||||
|
|
Atlantic
|
Other
|
Corporate,
|
||||||||||||||||||||||||||||||||||||||||||||||||||||||||||||||||
|
Molyb-
|
Copper
|
Mining
|
U.S.
|
Other
|
|||||||||||||||||||||||||||||||||||||||||||||||||||||||||||||||
|
Other
|
Cerro
|
Candel-
|
Other
|
denum
|
Rod &
|
Smelting
|
& Elimi-
|
Total
|
Oil & Gas
|
& Elimi-
|
FCX
|
||||||||||||||||||||||||||||||||||||||||||||||||||||||||
|
Morenci
|
Mines
|
Total
|
Verde
|
aria
|
Mines
|
Total
|
Grasberg
|
Tenke
|
Mines
|
Refining
|
& Refining
|
nations
|
Mining
|
Operations
|
nations
|
Total
|
|||||||||||||||||||||||||||||||||||||||||||||||||||
|
Three Months Ended September 30, 2014
|
|
|
|
|
|
|
|
|
|
|
|
|
|
||||||||||||||||||||||||||||||||||||||||||||||||||||||
|
Revenues:
|
|
|
|
|
|
|
|
|
|
|
|
|
|
||||||||||||||||||||||||||||||||||||||||||||||||||||||
|
Unaffiliated customers
|
$
|
140
|
|
$
|
79
|
|
$
|
219
|
|
$
|
295
|
|
$
|
141
|
|
$
|
300
|
|
$
|
736
|
|
$
|
1,086
|
|
a
|
$
|
379
|
|
$
|
—
|
|
$
|
1,219
|
|
$
|
597
|
|
$
|
470
|
|
b
|
$
|
4,706
|
|
$
|
990
|
|
c
|
$
|
—
|
|
$
|
5,696
|
|
|||||||||||||
|
Intersegment
|
428
|
|
843
|
|
1,271
|
|
63
|
|
48
|
|
—
|
|
111
|
|
167
|
|
49
|
|
173
|
|
8
|
|
4
|
|
(1,783
|
)
|
—
|
|
—
|
|
—
|
|
—
|
|
|||||||||||||||||||||||||||||||||
|
Production and delivery
|
341
|
|
561
|
|
902
|
|
178
|
|
142
|
|
151
|
|
471
|
|
700
|
|
206
|
|
86
|
|
1,220
|
|
578
|
|
(1,283
|
)
|
2,880
|
|
273
|
|
(1
|
)
|
3,152
|
|
|||||||||||||||||||||||||||||||||
|
Depreciation, depletion and amortization
|
51
|
|
82
|
|
133
|
|
41
|
|
14
|
|
47
|
|
102
|
|
92
|
|
58
|
|
25
|
|
2
|
|
11
|
|
15
|
|
438
|
|
504
|
|
3
|
|
945
|
|
|||||||||||||||||||||||||||||||||
|
Impairment of oil and gas properties
|
—
|
|
—
|
|
—
|
|
—
|
|
—
|
|
—
|
|
—
|
|
—
|
|
—
|
|
—
|
|
—
|
|
—
|
|
—
|
|
—
|
|
308
|
|
—
|
|
308
|
|
|||||||||||||||||||||||||||||||||
|
Selling, general and administrative expenses
|
—
|
|
1
|
|
1
|
|
—
|
|
—
|
|
1
|
|
1
|
|
27
|
|
3
|
|
—
|
|
—
|
|
4
|
|
7
|
|
43
|
|
55
|
|
60
|
|
158
|
|
|||||||||||||||||||||||||||||||||
|
Mining exploration and research expenses
|
—
|
|
2
|
|
2
|
|
—
|
|
—
|
|
—
|
|
—
|
|
—
|
|
—
|
|
—
|
|
—
|
|
—
|
|
27
|
|
29
|
|
—
|
|
—
|
|
29
|
|
|||||||||||||||||||||||||||||||||
|
Environmental obligations and shutdown costs
|
—
|
|
(5
|
)
|
(5
|
)
|
—
|
|
—
|
|
—
|
|
—
|
|
—
|
|
—
|
|
—
|
|
—
|
|
—
|
|
23
|
|
18
|
|
—
|
|
—
|
|
18
|
|
|||||||||||||||||||||||||||||||||
|
Net gain on sales of assets
|
—
|
|
(14
|
)
|
(14
|
)
|
—
|
|
—
|
|
—
|
|
—
|
|
—
|
|
—
|
|
—
|
|
—
|
|
—
|
|
(32
|
)
|
(46
|
)
|
—
|
|
—
|
|
(46
|
)
|
|||||||||||||||||||||||||||||||||
|
Operating income (loss)
|
176
|
|
295
|
|
471
|
|
139
|
|
33
|
|
101
|
|
273
|
|
434
|
|
161
|
|
62
|
|
5
|
|
8
|
|
(70
|
)
|
1,344
|
|
(150
|
)
|
(62
|
)
|
1,132
|
|
|||||||||||||||||||||||||||||||||
|
Interest expense, net
|
1
|
|
—
|
|
1
|
|
1
|
|
—
|
|
—
|
|
1
|
|
—
|
|
—
|
|
—
|
|
—
|
|
3
|
|
19
|
|
24
|
|
51
|
|
83
|
|
158
|
|
|||||||||||||||||||||||||||||||||
|
Provision for (benefit from) income taxes
|
—
|
|
—
|
|
—
|
|
47
|
|
4
|
|
91
|
|
142
|
|
181
|
|
36
|
|
—
|
|
—
|
|
—
|
|
—
|
|
359
|
|
—
|
|
(10
|
)
|
349
|
|
|||||||||||||||||||||||||||||||||
|
Total assets at September 30, 2014
|
3,689
|
|
5,742
|
|
9,431
|
|
7,030
|
|
1,511
|
|
2,210
|
|
10,751
|
|
8,537
|
|
5,010
|
|
2,089
|
|
282
|
|
948
|
|
1,025
|
|
38,073
|
|
25,328
|
|
575
|
|
63,976
|
|
|||||||||||||||||||||||||||||||||
|
Capital expenditures
|
158
|
|
30
|
|
188
|
|
416
|
|
7
|
|
16
|
|
439
|
|
243
|
|
40
|
|
12
|
|
1
|
|
3
|
|
11
|
|
937
|
|
908
|
|
8
|
|
1,853
|
|
|||||||||||||||||||||||||||||||||
|
Three Months Ended September 30, 2013
|
|
|
|
|
|
|
|
|
|
|
|
|
|
||||||||||||||||||||||||||||||||||||||||||||||||||||||
|
Revenues:
|
|
|
|
|
|
|
|
|
|
|
|
|
|
||||||||||||||||||||||||||||||||||||||||||||||||||||||
|
Unaffiliated customers
|
$
|
100
|
|
$
|
145
|
|
$
|
245
|
|
$
|
434
|
|
$
|
318
|
|
$
|
300
|
|
$
|
1,052
|
|
$
|
1,108
|
|
a
|
$
|
406
|
|
$
|
—
|
|
$
|
1,247
|
|
$
|
514
|
|
$
|
417
|
|
b
|
$
|
4,989
|
|
$
|
1,176
|
|
c
|
$
|
—
|
|
$
|
6,165
|
|
|||||||||||||
|
Intersegment
|
375
|
|
681
|
|
1,056
|
|
27
|
|
60
|
|
—
|
|
87
|
|
3
|
|
14
|
|
121
|
|
6
|
|
2
|
|
(1,289
|
)
|
—
|
|
—
|
|
—
|
|
—
|
|
|||||||||||||||||||||||||||||||||
|
Production and delivery
|
287
|
|
520
|
|
807
|
|
175
|
|
163
|
|
156
|
|
494
|
|
617
|
|
190
|
|
82
|
|
1,245
|
|
523
|
|
(916
|
)
|
3,042
|
|
288
|
|
2
|
|
3,332
|
|
|||||||||||||||||||||||||||||||||
|
Depreciation, depletion and amortization
|
35
|
|
67
|
|
102
|
|
35
|
|
19
|
|
31
|
|
85
|
|
60
|
|
64
|
|
21
|
|
2
|
|
10
|
|
9
|
|
353
|
|
563
|
|
3
|
|
919
|
|
|||||||||||||||||||||||||||||||||
|
Selling, general and administrative expenses
|
—
|
|
1
|
|
1
|
|
—
|
|
1
|
|
1
|
|
2
|
|
29
|
|
3
|
|
—
|
|
—
|
|
5
|
|
5
|
|
45
|
|
51
|
|
62
|
|
158
|
|
|||||||||||||||||||||||||||||||||
|
Mining exploration and research expenses
|
—
|
|
2
|
|
2
|
|
—
|
|
—
|
|
—
|
|
—
|
|
1
|
|
—
|
|
—
|
|
—
|
|
—
|
|
52
|
|
55
|
|
—
|
|
2
|
|
57
|
|
|||||||||||||||||||||||||||||||||
|
Environmental obligations and shutdown costs
|
—
|
|
5
|
|
5
|
|
—
|
|
—
|
|
—
|
|
—
|
|
—
|
|
—
|
|
—
|
|
—
|
|
—
|
|
(13
|
)
|
(8
|
)
|
—
|
|
—
|
|
(8
|
)
|
|||||||||||||||||||||||||||||||||
|
Operating income (loss)
|
153
|
|
231
|
|
384
|
|
251
|
|
195
|
|
112
|
|
558
|
|
404
|
|
163
|
|
18
|
|
6
|
|
(22
|
)
|
(9
|
)
|
1,502
|
|
274
|
|
(69
|
)
|
1,707
|
|
|||||||||||||||||||||||||||||||||
|
Interest expense, net
|
—
|
|
—
|
|
—
|
|
—
|
|
—
|
|
—
|
|
—
|
|
—
|
|
—
|
|
—
|
|
—
|
|
4
|
|
20
|
|
24
|
|
74
|
|
64
|
|
162
|
|
|||||||||||||||||||||||||||||||||
|
Provision for income taxes
|
—
|
|
—
|
|
—
|
|
92
|
|
67
|
|
35
|
|
194
|
|
173
|
|
33
|
|
—
|
|
—
|
|
—
|
|
—
|
|
400
|
|
—
|
|
99
|
|
499
|
|
|||||||||||||||||||||||||||||||||
|
Total assets at September 30, 2013
|
2,915
|
|
5,734
|
|
8,649
|
|
6,440
|
|
1,612
|
|
2,478
|
|
10,530
|
|
7,399
|
|
4,862
|
|
2,094
|
|
308
|
|
691
|
|
1,267
|
|
35,800
|
|
26,347
|
|
451
|
|
62,598
|
|
|||||||||||||||||||||||||||||||||
|
Capital expenditures
|
172
|
|
80
|
|
252
|
|
224
|
|
23
|
|
17
|
|
264
|
|
209
|
|
52
|
|
46
|
|
1
|
|
20
|
|
51
|
|
895
|
|
738
|
|
12
|
|
1,645
|
|
|||||||||||||||||||||||||||||||||
|
a.
|
Included PT-FI’s sales to PT Smelting totaling
$628 million
in
third-quarter
2014
and
$458 million
in
third-quarter
2013
.
|
|
b.
|
Included revenues from FCX's molybdenum sales company, which included sales of molybdenum produced by the Molybdenum mines and by certain of the North and South America copper mines.
|
|
c.
|
Included net mark-to-market gains (losses) associated with crude oil and natural gas derivative contracts totaling
$64 million
in third-quarter 2014 and
$(170) million
in third-quarter 2013.
|
22
|
(In millions)
|
Mining Operations
|
||||||||||||||||||||||||||||||||||||||||||||||||||||||||||||||||||
|
North America Copper Mines
|
South America
|
Indonesia
|
Africa
|
|
|
|
|
|
|||||||||||||||||||||||||||||||||||||||||||||||||||||||||||
|
Atlantic
|
Other
|
Corporate,
|
|||||||||||||||||||||||||||||||||||||||||||||||||||||||||||||||||
|
Molyb-
|
Copper
|
Mining
|
U.S.
|
Other
|
|||||||||||||||||||||||||||||||||||||||||||||||||||||||||||||||
|
Other
|
Cerro
|
Candel-
|
Other
|
denum
|
Rod &
|
Smelting
|
& Elimi-
|
Total
|
Oil & Gas
|
& Elimi-
|
FCX
|
||||||||||||||||||||||||||||||||||||||||||||||||||||||||
|
Morenci
|
Mines
|
Total
|
Verde
|
aria
|
Mines
|
Total
|
Grasberg
|
Tenke
|
Mines
|
Refining
|
& Refining
|
nations
|
Mining
|
Operations
|
nations
|
Total
|
|||||||||||||||||||||||||||||||||||||||||||||||||||
|
Nine Months Ended September 30, 2014
|
|
|
|
|
|
|
|
|
|
|
|
|
|
||||||||||||||||||||||||||||||||||||||||||||||||||||||
|
Revenues:
|
|
|
|
|
|
|
|
|
|
|
|
|
|
||||||||||||||||||||||||||||||||||||||||||||||||||||||
|
Unaffiliated customers
|
$
|
215
|
|
$
|
195
|
|
$
|
410
|
|
$
|
996
|
|
$
|
482
|
|
$
|
905
|
|
$
|
2,383
|
|
$
|
2,071
|
|
a
|
$
|
1,071
|
|
$
|
—
|
|
$
|
3,599
|
|
$
|
1,808
|
|
$
|
1,374
|
|
b
|
$
|
12,716
|
|
$
|
3,487
|
|
c
|
$
|
—
|
|
$
|
16,203
|
|
|||||||||||||
|
Intersegment
|
1,346
|
|
2,489
|
|
3,835
|
|
150
|
|
238
|
|
5
|
|
393
|
|
175
|
|
102
|
|
469
|
|
24
|
|
15
|
|
(5,013
|
)
|
—
|
|
—
|
|
—
|
|
—
|
|
|||||||||||||||||||||||||||||||||
|
Production and delivery
|
936
|
|
1,622
|
|
2,558
|
|
538
|
|
456
|
|
483
|
|
1,477
|
|
1,594
|
|
556
|
|
243
|
|
3,601
|
|
1,784
|
|
(3,753
|
)
|
8,060
|
|
913
|
|
(2
|
)
|
8,971
|
|
|||||||||||||||||||||||||||||||||
|
Depreciation, depletion and amortization
|
128
|
|
240
|
|
368
|
|
120
|
|
49
|
|
115
|
|
284
|
|
194
|
|
172
|
|
71
|
|
7
|
|
31
|
|
51
|
|
1,178
|
|
1,736
|
|
10
|
|
2,924
|
|
|||||||||||||||||||||||||||||||||
|
Impairment of oil and gas properties
|
—
|
|
—
|
|
—
|
|
—
|
|
—
|
|
—
|
|
—
|
|
—
|
|
—
|
|
—
|
|
—
|
|
—
|
|
—
|
|
—
|
|
308
|
|
—
|
|
308
|
|
|||||||||||||||||||||||||||||||||
|
Selling, general and administrative expenses
|
1
|
|
2
|
|
3
|
|
2
|
|
1
|
|
2
|
|
5
|
|
73
|
|
9
|
|
—
|
|
—
|
|
13
|
|
20
|
|
123
|
|
171
|
|
163
|
|
457
|
|
|||||||||||||||||||||||||||||||||
|
Mining exploration and research expenses
|
—
|
|
6
|
|
6
|
|
—
|
|
—
|
|
—
|
|
—
|
|
—
|
|
—
|
|
—
|
|
—
|
|
—
|
|
87
|
|
93
|
|
—
|
|
—
|
|
93
|
|
|||||||||||||||||||||||||||||||||
|
Environmental obligations and shutdown costs
|
—
|
|
(5
|
)
|
(5
|
)
|
—
|
|
—
|
|
—
|
|
—
|
|
—
|
|
—
|
|
—
|
|
—
|
|
—
|
|
105
|
|
100
|
|
—
|
|
—
|
|
100
|
|
|||||||||||||||||||||||||||||||||
|
Net gain on sales of assets
|
—
|
|
(14
|
)
|
(14
|
)
|
—
|
|
—
|
|
—
|
|
—
|
|
—
|
|
—
|
|
—
|
|
—
|
|
—
|
|
(32
|
)
|
(46
|
)
|
—
|
|
—
|
|
(46
|
)
|
|||||||||||||||||||||||||||||||||
|
Operating income (loss)
|
496
|
|
833
|
|
1,329
|
|
486
|
|
214
|
|
310
|
|
1,010
|
|
385
|
|
436
|
|
155
|
|
15
|
|
(5
|
)
|
(117
|
)
|
3,208
|
|
359
|
|
(171
|
)
|
3,396
|
|
|||||||||||||||||||||||||||||||||
|
Interest expense, net
|
2
|
|
1
|
|
3
|
|
1
|
|
—
|
|
—
|
|
1
|
|
—
|
|
—
|
|
—
|
|
—
|
|
10
|
|
55
|
|
69
|
|
201
|
|
213
|
|
483
|
|
|||||||||||||||||||||||||||||||||
|
Provision for income taxes
|
—
|
|
—
|
|
—
|
|
177
|
|
72
|
|
160
|
|
409
|
|
166
|
|
93
|
|
—
|
|
—
|
|
—
|
|
—
|
|
668
|
|
—
|
|
366
|
|
1,034
|
|
|||||||||||||||||||||||||||||||||
|
Capital expenditures
|
691
|
|
124
|
|
815
|
|
1,207
|
|
29
|
|
42
|
|
1,278
|
|
722
|
|
100
|
|
45
|
|
3
|
|
9
|
|
38
|
|
3,010
|
|
2,392
|
|
13
|
|
5,415
|
|
|||||||||||||||||||||||||||||||||
|
Nine Months Ended September 30, 2013
|
|
|
|
|
|
|
|
|
|
|
|
|
|
||||||||||||||||||||||||||||||||||||||||||||||||||||||
|
Revenues:
|
|
|
|
|
|
|
|
|
|
|
|
|
|
||||||||||||||||||||||||||||||||||||||||||||||||||||||
|
Unaffiliated customers
|
$
|
218
|
|
$
|
266
|
|
$
|
484
|
|
$
|
1,035
|
|
$
|
709
|
|
$
|
922
|
|
$
|
2,666
|
|
$
|
2,443
|
|
a
|
$
|
1,199
|
|
$
|
—
|
|
$
|
3,842
|
|
$
|
1,730
|
|
$
|
1,157
|
|
b
|
$
|
13,521
|
|
$
|
1,512
|
|
c
|
$
|
3
|
|
$
|
15,036
|
|
|||||||||||||
|
Intersegment
|
1,255
|
|
2,256
|
|
3,511
|
|
222
|
|
216
|
|
—
|
|
438
|
|
190
|
|
24
|
|
408
|
|
20
|
|
12
|
|
(4,603
|
)
|
—
|
|
—
|
|
—
|
|
—
|
|
|||||||||||||||||||||||||||||||||
|
Production and delivery
|
885
|
|
1,574
|
|
2,459
|
|
535
|
|
504
|
|
446
|
|
1,485
|
|
1,743
|
|
560
|
|
240
|
|
3,835
|
|
1,726
|
|
(3,531
|
)
|
8,517
|
|
377
|
|
10
|
|
8,904
|
|
|||||||||||||||||||||||||||||||||
|
Depreciation, depletion and amortization
|
105
|
|
207
|
|
312
|
|
105
|
|
44
|
|
93
|
|
242
|
|
173
|
|
179
|
|
62
|
|
7
|
|
32
|
|
31
|
|
1,038
|
|
732
|
|
8
|
|
1,778
|
|
|||||||||||||||||||||||||||||||||
|
Selling, general and administrative expenses
|
1
|
|
3
|
|
4
|
|
2
|
|
2
|
|
1
|
|
5
|
|
82
|
|
9
|
|
—
|
|
—
|
|
14
|
|
23
|
|
137
|
|
65
|
|
255
|
|
457
|
|
|||||||||||||||||||||||||||||||||
|
Mining exploration and research expenses
|
—
|
|
3
|
|
3
|
|
—
|
|
—
|
|
—
|
|
—
|
|
1
|
|
—
|
|
—
|
|
—
|
|
—
|
|
161
|
|
165
|
|
—
|
|
8
|
|
173
|
|
|||||||||||||||||||||||||||||||||
|
Environmental obligations and shutdown costs
|
—
|
|
(1
|
)
|
(1
|
)
|
—
|
|
—
|
|
—
|
|
—
|
|
—
|
|
—
|
|
—
|
|
—
|
|
—
|
|
24
|
|
23
|
|
—
|
|
—
|
|
23
|
|
|||||||||||||||||||||||||||||||||
|
Operating income (loss)
|
482
|
|
736
|
|
1,218
|
|
615
|
|
375
|
|
382
|
|
1,372
|
|
634
|
|
475
|
|
106
|
|
20
|
|
(30
|
)
|
(154
|
)
|
3,641
|
|
338
|
|
(278
|
)
|
3,701
|
|
|||||||||||||||||||||||||||||||||
|
Interest expense, net
|
3
|
|
1
|
|
4
|
|
2
|
|
—
|
|
—
|
|
2
|
|
12
|
|
2
|
|
—
|
|
—
|
|
12
|
|
60
|
|
92
|
|
100
|
|
159
|
|
351
|
|
|||||||||||||||||||||||||||||||||
|
Provision for income taxes
|
—
|
|
—
|
|
—
|
|
215
|
|
131
|
|
126
|
|
472
|
|
289
|
|
99
|
|
—
|
|
—
|
|
—
|
|
—
|
|
860
|
|
—
|
|
107
|
|
d
|
967
|
|
||||||||||||||||||||||||||||||||
|
Capital expenditures
|
529
|
|
266
|
|
795
|
|
596
|
|
91
|
|
47
|
|
734
|
|
720
|
|
155
|
|
128
|
|
3
|
|
39
|
|
91
|
|
2,665
|
|
928
|
|
30
|
|
3,623
|
|
|||||||||||||||||||||||||||||||||
|
a.
|
Included PT-FI’s sales to PT Smelting totaling
$1.5 billion
for the first nine months of
2014
and
$1.2 billion
for the first nine months of
2013
.
|
|
b.
|
Included revenues from FCX's molybdenum sales company, which included sales of molybdenum produced by the Molybdenum mines and by certain of the North and South America copper mines.
|
|
c.
|
Included net mark-to-market losses associated with crude oil and natural gas derivative contracts totaling
$56 million
for the first nine months of 2014 and
$205 million
for the period from June 1, 2013 to September 30, 2013.
|
|
d.
|
Included
$183 million
of net benefits resulting from second-quarter 2013 oil and gas acquisitions.
|
23
In March 2013, FCX completed the sale of
$6.5 billion
of senior notes. These notes, along with FCX's senior notes sold in February 2012, are fully and unconditionally guaranteed on a senior basis jointly and severally by FM O&G LLC, as guarantor, which is a
100 percent
owned subsidiary of FM O&G and FCX. The guarantee is an unsecured obligation of the guarantor and ranks equal in right of payment with all existing and future indebtedness of FM O&G LLC, including indebtedness under the revolving credit facility. The guarantee ranks senior in right of payment with all of FM O&G LLC's future subordinated obligations and is effectively subordinated in right of payment to any debt of FM O&G LLC's subsidiaries. In the future, FM O&G LLC's guarantee may be released or terminated for certain obligations under the following circumstances: (i) all or substantially all of the equity interests or assets of FM O&G LLC are sold to a third party; or (ii) FM O&G LLC no longer has any obligations under any FM O&G senior notes or any refinancing thereof and no longer guarantees any obligations of FCX under the revolver, the term loan or any other senior debt.
The following condensed consolidating financial information includes information regarding FCX, as issuer, FM O&G LLC, as guarantor, and all other non-guarantor subsidiaries of FCX. Included are the condensed consolidating balance sheets at
September 30, 2014
, and
December 31, 2013
, and the related condensed consolidating statements of comprehensive income for the
three
and
nine
months ended
September 30, 2014
and
2013
, and condensed consolidating statements of cash flows for the
nine
months ended
September 30, 2014
and
2013
(in millions), which should be read in conjunction with FCX's notes to the consolidated financial statements.
CONDENSED CONSOLIDATING BALANCE SHEET
September 30, 2014
|
FCX
|
FM O&G LLC
|
Non-guarantor
|
Consolidated
|
||||||||||||||||
|
Issuer
|
Guarantor
|
Subsidiaries
|
Eliminations
|
FCX
|
|||||||||||||||
|
ASSETS
|
|||||||||||||||||||
|
Current assets:
|
|||||||||||||||||||
|
Cash and cash equivalents
|
$
|
—
|
|
$
|
1
|
|
$
|
657
|
|
$
|
—
|
|
$
|
658
|
|
||||
|
Accounts receivable
|
348
|
|
1,814
|
|
2,187
|
|
(2,042
|
)
|
2,307
|
|
|||||||||
|
Other current assets
|
104
|
|
73
|
|
5,889
|
|
—
|
|
6,066
|
|
|||||||||
|
Total current assets
|
452
|
|
1,888
|
|
8,733
|
|
(2,042
|
)
|
9,031
|
|
|||||||||
|
Property, plant, equipment and mining development costs, net
|
23
|
|
45
|
|
26,236
|
|
—
|
|
26,304
|
|
|||||||||
|
Oil and gas properties, net - full cost method:
|
|||||||||||||||||||
|
Subject to amortization, less accumulated amortization
|
—
|
|
4,235
|
|
6,727
|
|
344
|
|
11,306
|
|
|||||||||
|
Not subject to amortization
|
—
|
|
2,346
|
|
8,685
|
|
—
|
|
11,031
|
|
|||||||||
|
Investments in consolidated subsidiaries
|
33,908
|
|
10,492
|
|
13,063
|
|
(57,463
|
)
|
—
|
|
|||||||||
|
Goodwill
|
—
|
|
217
|
|
1,500
|
|
—
|
|
1,717
|
|
|||||||||
|
Other assets
|
6,512
|
|
3,913
|
|
4,439
|
|
(10,277
|
)
|
4,587
|
|
|||||||||
|
Total assets
|
$
|
40,895
|
|
$
|
23,136
|
|
$
|
69,383
|
|
$
|
(69,438
|
)
|
$
|
63,976
|
|
||||
|
LIABILITIES AND EQUITY
|
|||||||||||||||||||
|
Current liabilities
|
$
|
1,664
|
|
$
|
985
|
|
$
|
5,294
|
|
$
|
(1,600
|
)
|
$
|
6,343
|
|
||||
|
Long-term debt, less current portion
|
13,355
|
|
5,301
|
|
6,562
|
|
(7,243
|
)
|
17,975
|
|
|||||||||
|
Deferred income taxes
|
4,233
|
|
a
|
—
|
|
3,326
|
|
—
|
|
7,559
|
|
||||||||
|
Environmental and asset retirement obligations, less current portion
|
—
|
|
302
|
|
3,352
|
|
—
|
|
3,654
|
|
|||||||||
|
Other liabilities
|
52
|
|
3,403
|
|
1,751
|
|
(3,476
|
)
|
1,730
|
|
|||||||||
|
Total liabilities
|
19,304
|
|
9,991
|
|
20,285
|
|
(12,319
|
)
|
37,261
|
|
|||||||||
|
Redeemable noncontrolling interest
|
—
|
|
—
|
|
749
|
|
—
|
|
749
|
|
|||||||||
|
Equity:
|
|||||||||||||||||||
|
Stockholders' equity
|
21,591
|
|
13,145
|
|
44,460
|
|
(57,605
|
)
|
21,591
|
|
|||||||||
|
Noncontrolling interests
|
—
|
|
—
|
|
3,889
|
|
486
|
|
4,375
|
|
|||||||||
|
Total equity
|
21,591
|
|
13,145
|
|
48,349
|
|
(57,119
|
)
|
25,966
|
|
|||||||||
|
Total liabilities and equity
|
$
|
40,895
|
|
$
|
23,136
|
|
$
|
69,383
|
|
$
|
(69,438
|
)
|
$
|
63,976
|
|
||||
|
a.
|
All U.S. related deferred income taxes are recorded at the parent company.
|
24
CONDENSED CONSOLIDATING BALANCE SHEET
December 31, 2013
|
FCX
|
FM O&G LLC
|
Non-guarantor
|
Consolidated
|
||||||||||||||||
|
Issuer
|
Guarantor
|
Subsidiaries
|
Eliminations
|
FCX
|
|||||||||||||||
|
ASSETS
|
|||||||||||||||||||
|
Current assets:
|
|||||||||||||||||||
|
Cash and cash equivalents
|
$
|
—
|
|
$
|
—
|
|
$
|
1,985
|
|
$
|
—
|
|
$
|
1,985
|
|
||||
|
Accounts receivable
|
855
|
|
659
|
|
2,258
|
|
(1,210
|
)
|
2,562
|
|
|||||||||
|
Other current assets
|
114
|
|
38
|
|
5,273
|
|
—
|
|
5,425
|
|
|||||||||
|
Total current assets
|
969
|
|
697
|
|
9,516
|
|
(1,210
|
)
|
9,972
|
|
|||||||||
|
Property, plant, equipment and mining development costs, net
|
27
|
|
43
|
|
23,972
|
|
—
|
|
24,042
|
|
|||||||||
|
Oil and gas properties, net - full cost method:
|
|||||||||||||||||||
|
Subject to amortization, less accumulated amortization
|
—
|
|
6,207
|
|
6,265
|
|
—
|
|
12,472
|
|
|||||||||
|
Not subject to amortization
|
—
|
|
2,649
|
|
8,238
|
|
—
|
|
10,887
|
|
|||||||||
|
Investments in consolidated subsidiaries
|
31,162
|
|
9,712
|
|
12,468
|
|
(53,342
|
)
|
—
|
|
|||||||||
|
Goodwill
|
—
|
|
437
|
|
1,479
|
|
—
|
|
1,916
|
|
|||||||||
|
Other assets
|
7,126
|
|
4,640
|
|
4,128
|
|
(11,710
|
)
|
4,184
|
|
|||||||||
|
Total assets
|
$
|
39,284
|
|
$
|
24,385
|
|
$
|
66,066
|
|
$
|
(66,262
|
)
|
$
|
63,473
|
|
||||
|
LIABILITIES AND EQUITY
|
|||||||||||||||||||
|
Current liabilities
|
$
|
1,003
|
|
$
|
758
|
|
$
|
4,222
|
|
$
|
(1,210
|
)
|
$
|
4,773
|
|
||||
|
Long-term debt, less current portion
|
13,184
|
|
7,199
|
|
8,056
|
|
(8,045
|
)
|
20,394
|
|
|||||||||
|
Deferred income taxes
|
4,137
|
|
a
|
—
|
|
3,273
|
|
—
|
|
7,410
|
|
||||||||
|
Environmental and asset retirement obligations, less current portion
|
—
|
|
301
|
|
2,958
|
|
—
|
|
3,259
|
|
|||||||||
|
Other liabilities
|
26
|
|
3,436
|
|
1,893
|
|
(3,665
|
)
|
1,690
|
|
|||||||||
|
Total liabilities
|
18,350
|
|
11,694
|
|
20,402
|
|
(12,920
|
)
|
37,526
|
|
|||||||||
|
Redeemable noncontrolling interest
|
—
|
|
—
|
|
716
|
|
—
|
|
716
|
|
|||||||||
|
Equity:
|
|||||||||||||||||||
|
Stockholders' equity
|
20,934
|
|
12,691
|
|
41,100
|
|
(53,791
|
)
|
20,934
|
|
|||||||||
|
Noncontrolling interests
|
—
|
|
—
|
|
3,848
|
|
449
|
|
4,297
|
|
|||||||||
|
Total equity
|
20,934
|
|
12,691
|
|
44,948
|
|
(53,342
|
)
|
25,231
|
|
|||||||||
|
Total liabilities and equity
|
$
|
39,284
|
|
$
|
24,385
|
|
$
|
66,066
|
|
$
|
(66,262
|
)
|
$
|
63,473
|
|
||||
|
a.
|
All U.S. related deferred income taxes are recorded at the parent company.
|
25
CONDENSED CONSOLIDATING STATEMENTS OF COMPREHENSIVE INCOME
Three and Nine Months Ended
September 30, 2014
|
Three Months Ended September 30, 2014
|
|||||||||||||||||||
|
FCX
|
FM O&G LLC
|
Non-guarantor
|
Consolidated
|
||||||||||||||||
|
Issuer
|
Guarantor
|
Subsidiaries
|
Eliminations
|
FCX
|
|||||||||||||||
|
Revenues
|
$
|
—
|
|
$
|
370
|
|
$
|
5,326
|
|
$
|
—
|
|
$
|
5,696
|
|
||||
|
Total costs and expenses
|
12
|
|
916
|
|
3,966
|
|
(330
|
)
|
4,564
|
|
|||||||||
|
Operating (loss) income
|
(12
|
)
|
(546
|
)
|
1,360
|
|
330
|
|
1,132
|
|
|||||||||
|
Interest expense, net
|
(99
|
)
|
(38
|
)
|
(37
|
)
|
16
|
|
(158
|
)
|
|||||||||
|
Net gain on early extinguishment of debt
|
—
|
|
58
|
|
—
|
|
—
|
|
58
|
|
|||||||||
|
Other income (expense), net
|
15
|
|
—
|
|
24
|
|
(16
|
)
|
23
|
|
|||||||||
|
Benefit from (provision for) income taxes
|
46
|
|
(104
|
)
|
(166
|
)
|
(125
|
)
|
(349
|
)
|
|||||||||
|
Equity in affiliated companies' net earnings (losses)
|
602
|
|
381
|
|
(111
|
)
|
(874
|
)
|
(2
|
)
|
|||||||||
|
Net income (loss)
|
552
|
|
(249
|
)
|
1,070
|
|
(669
|
)
|
704
|
|
|||||||||
|
Net income and preferred dividends attributable to noncontrolling interests
|
—
|
|
—
|
|
(130
|
)
|
(22
|
)
|
(152
|
)
|
|||||||||
|
Net income (loss) attributable to FCX common stockholders
|
$
|
552
|
|
$
|
(249
|
)
|
$
|
940
|
|
$
|
(691
|
)
|
$
|
552
|
|
||||
|
Other comprehensive income
|
—
|
|
—
|
|
7
|
|
—
|
|
7
|
|
|||||||||
|
Total comprehensive income (loss)
|
$
|
552
|
|
$
|
(249
|
)
|
$
|
947
|
|
$
|
(691
|
)
|
$
|
559
|
|
||||
|
Nine Months Ended September 30, 2014
|
|||||||||||||||||||
|
FCX
|
FM O&G LLC
|
Non-guarantor
|
Consolidated
|
||||||||||||||||
|
Issuer
|
Guarantor
|
Subsidiaries
|
Eliminations
|
FCX
|
|||||||||||||||
|
Revenues
|
$
|
—
|
|
$
|
1,584
|
|
$
|
14,619
|
|
$
|
—
|
|
$
|
16,203
|
|
||||
|
Total costs and expenses
|
44
|
|
1,931
|
|
11,170
|
|
(338
|
)
|
12,807
|
|
|||||||||
|
Operating (loss) income
|
(44
|
)
|
(347
|
)
|
3,449
|
|
338
|
|
3,396
|
|
|||||||||
|
Interest expense, net
|
(268
|
)
|
(123
|
)
|
(146
|
)
|
54
|
|
(483
|
)
|
|||||||||
|
Net (loss) gain on early extinguishment of debt
|
(1
|
)
|
64
|
|
—
|
|
—
|
|
63
|
|
|||||||||
|
Other income (expense), net
|
52
|
|
1
|
|
49
|
|
(54
|
)
|
48
|
|
|||||||||
|
Benefit from (provision for) income taxes
|
51
|
|
(121
|
)
|
(836
|
)
|
(128
|
)
|
(1,034
|
)
|
|||||||||
|
Equity in affiliated companies' net earnings (losses)
|
1,754
|
|
637
|
|
228
|
|
(2,619
|
)
|
—
|
|
|||||||||
|
Net income (loss)
|
1,544
|
|
111
|
|
2,744
|
|
(2,409
|
)
|
1,990
|
|
|||||||||
|
Net income and preferred dividends attributable to noncontrolling interests
|
—
|
|
—
|
|
(421
|
)
|
(25
|
)
|
(446
|
)
|
|||||||||
|
Net income (loss) attributable to FCX common stockholders
|
$
|
1,544
|
|
$
|
111
|
|
$
|
2,323
|
|
$
|
(2,434
|
)
|
$
|
1,544
|
|
||||
|
Other comprehensive income
|
—
|
|
—
|
|
11
|
|
—
|
|
11
|
|
|||||||||
|
Total comprehensive income (loss)
|
$
|
1,544
|
|
$
|
111
|
|
$
|
2,334
|
|
$
|
(2,434
|
)
|
$
|
1,555
|
|
||||
26
CONDENSED CONSOLIDATING STATEMENTS OF COMPREHENSIVE INCOME
Three and Nine Months Ended
September 30, 2013
|
Three Months Ended September 30, 2013
|
|||||||||||||||||||
|
FCX
|
FM O&G LLC
|
Non-guarantor
|
Consolidated
|
||||||||||||||||
|
Issuer
|
Guarantor
|
Subsidiaries
|
Eliminations
|
FCX
|
|||||||||||||||
|
Revenues
|
$
|
—
|
|
$
|
512
|
|
$
|
5,653
|
|
$
|
—
|
|
$
|
6,165
|
|
||||
|
Total costs and expenses
|
11
|
|
452
|
|
3,995
|
|
—
|
|
4,458
|
|
|||||||||
|
Operating (loss) income
|
(11
|
)
|
60
|
|
1,658
|
|
—
|
|
1,707
|
|
|||||||||
|
Interest expense, net
|
(94
|
)
|
(51
|
)
|
(40
|
)
|
23
|
|
(162
|
)
|
|||||||||
|
Other income (expense), net
|
24
|
|
—
|
|
2
|
|
(23
|
)
|
3
|
|
|||||||||
|
Benefit from (provision for) income taxes
|
35
|
|
(5
|
)
|
(529
|
)
|
—
|
|
(499
|
)
|
|||||||||
|
Equity in affiliated companies' net earnings (losses)
|
867
|
|
187
|
|
47
|
|
(1,102
|
)
|
(1
|
)
|
|||||||||
|
Net income (loss)
|
821
|
|
191
|
|
1,138
|
|
(1,102
|
)
|
1,048
|
|
|||||||||
|
Net income and preferred dividends attributable to noncontrolling interests
|
—
|
|
—
|
|
(202
|
)
|
(25
|
)
|
(227
|
)
|
|||||||||
|
Net income (loss) attributable to FCX common stockholders
|
$
|
821
|
|
$
|
191
|
|
$
|
936
|
|
$
|
(1,127
|
)
|
$
|
821
|
|
||||
|
Other comprehensive income
|
—
|
|
—
|
|
11
|
|
—
|
|
11
|
|
|||||||||
|
Total comprehensive income (loss)
|
$
|
821
|
|
$
|
191
|
|
$
|
947
|
|
$
|
(1,127
|
)
|
$
|
832
|
|
||||
|
Nine Months Ended September 30, 2013
|
|||||||||||||||||||
|
FCX
|
FM O&G LLC
|
Non-guarantor
|
Consolidated
|
||||||||||||||||
|
Issuer
|
Guarantor
|
Subsidiaries
|
Eliminations
|
FCX
|
|||||||||||||||
|
Revenues
|
$
|
—
|
|
$
|
674
|
|
$
|
14,362
|
|
$
|
—
|
|
$
|
15,036
|
|
||||
|
Total costs and expenses
|
106
|
|
587
|
|
10,642
|
|
—
|
|
11,335
|
|
|||||||||
|
Operating (loss) income
|
(106
|
)
|
87
|
|
3,720
|
|
—
|
|
3,701
|
|
|||||||||
|
Interest expense, net
|
(222
|
)
|
(63
|
)
|
(104
|
)
|
38
|
|
(351
|
)
|
|||||||||
|
Loss on early extinguishment of debt
|
(45
|
)
|
—
|
|
—
|
|
—
|
|
(45
|
)
|
|||||||||
|
Gain on investment in MMR
|
128
|
|
—
|
|
—
|
|
—
|
|
128
|
|
|||||||||
|
Other income (expense), net
|
39
|
|
—
|
|
12
|
|
(38
|
)
|
13
|
|
|||||||||
|
Benefit from (provision for) income taxes
|
61
|
|
(10
|
)
|
(1,018
|
)
|
—
|
|
(967
|
)
|
|||||||||
|
Equity in affiliated companies' net earnings (losses)
|
2,096
|
|
207
|
|
1
|
|
(2,301
|
)
|
3
|
|
|||||||||
|
Net income (loss)
|
1,951
|
|
221
|
|
2,611
|
|
(2,301
|
)
|
2,482
|
|
|||||||||
|
Net income and preferred dividends attributable to noncontrolling interests
|
—
|
|
—
|
|
(494
|
)
|
(37
|
)
|
(531
|
)
|
|||||||||
|
Net income (loss) attributable to FCX common stockholders
|
$
|
1,951
|
|
$
|
221
|
|
$
|
2,117
|
|
$
|
(2,338
|
)
|
$
|
1,951
|
|
||||
|
Other comprehensive income
|
—
|
|
—
|
|
22
|
|
—
|
|
22
|
|
|||||||||
|
Total comprehensive income (loss)
|
$
|
1,951
|
|
$
|
221
|
|
$
|
2,139
|
|
$
|
(2,338
|
)
|
$
|
1,973
|
|
||||
27
CONDENSED CONSOLIDATING STATEMENT OF CASH FLOWS
Nine Months Ended
September 30, 2014
|
FCX
|
FM O&G LLC
|
Non-guarantor
|
Consolidated
|
||||||||||||||||
|
Issuer
|
Guarantor
|
Subsidiaries
|
Eliminations
|
FCX
|
|||||||||||||||
|
Cash flow from operating activities:
|
|||||||||||||||||||
|
Net income (loss)
|
$
|
1,544
|
|
$
|
111
|
|
$
|
2,744
|
|
$
|
(2,409
|
)
|
$
|
1,990
|
|
||||
|
Adjustments to reconcile net income (loss) to net cash (used in) provided by operating activities:
|
|||||||||||||||||||
|
Depreciation, depletion and amortization
|
3
|
|
673
|
|
2,269
|
|
(21
|
)
|
2,924
|
|
|||||||||
|
Impairment of oil and gas properties
|
—
|
|
625
|
|
—
|
|
(317
|
)
|
308
|
|
|||||||||
|
Net losses on crude oil and natural gas derivative contracts
|
—
|
|
56
|
|
—
|
|
—
|
|
56
|
|
|||||||||
|
Net loss (gain) on early extinguishment of debt
|
1
|
|
(64
|
)
|
—
|
|
—
|
|
(63
|
)
|
|||||||||
|
Equity in (earnings) losses of consolidated subsidiaries
|
(1,754
|
)
|
(637
|
)
|
4
|
|
2,387
|
|
—
|
|
|||||||||
|
Other, net
|
87
|
|
(17
|
)
|
(73
|
)
|
—
|
|
(3
|
)
|
|||||||||
|
(Increases) decreases in working capital and changes in other tax payments, excluding amounts from dispositions
|
(217
|
)
|
(1,166
|
)
|
684
|
|
—
|
|
(699
|
)
|
|||||||||
|
Net cash (used in) provided by operating activities
|
(336
|
)
|
(419
|
)
|
5,628
|
|
(360
|
)
|
4,513
|
|
|||||||||
|
Cash flow from investing activities:
|
|||||||||||||||||||
|
Capital expenditures
|
—
|
|
(1,771
|
)
|
(3,644
|
)
|
—
|
|
(5,415
|
)
|
|||||||||
|
Acquisition of Deepwater GOM interests
|
—
|
|
—
|
|
(1,421
|
)
|
—
|
|
(1,421
|
)
|
|||||||||
|
Intercompany loans
|
1,151
|
|
734
|
|
—
|
|
(1,885
|
)
|
—
|
|
|||||||||
|
Investment in consolidated subsidiary
|
(959
|
)
|
(97
|
)
|
(696
|
)
|
1,752
|
|
—
|
|
|||||||||
|
Net proceeds from sale of Eagle Ford shale assets
|
—
|
|
2,971
|
|
—
|
|
—
|
|
2,971
|
|
|||||||||
|
Other, net
|
—
|
|
32
|
|
189
|
|
—
|
|
221
|
|
|||||||||
|
Net cash provided by (used in) investing activities
|
192
|
|
1,869
|
|
(5,572
|
)
|
(133
|
)
|
(3,644
|
)
|
|||||||||
|
Cash flow from financing activities:
|
|||||||||||||||||||
|
Proceeds from debt
|
2,806
|
|
—
|
|
540
|
|
—
|
|
3,346
|
|
|||||||||
|
Repayments of debt
|
(1,686
|
)
|
(1,996
|
)
|
(514
|
)
|
—
|
|
(4,196
|
)
|
|||||||||
|
Intercompany loans
|
—
|
|
213
|
|
(2,098
|
)
|
1,885
|
|
—
|
|
|||||||||
|
Cash dividends and distributions paid, and contributions received
|
(979
|
)
|
336
|
|
691
|
|
(1,392
|
)
|
(1,344
|
)
|
|||||||||
|
Other, net
|
3
|
|
(2
|
)
|
(3
|
)
|
—
|
|
(2
|
)
|
|||||||||
|
Net cash provided by (used in) financing activities
|
144
|
|
(1,449
|
)
|
(1,384
|
)
|
493
|
|
(2,196
|
)
|
|||||||||
|
Net increase (decrease) in cash and cash equivalents
|
—
|
|
1
|
|
(1,328
|
)
|
—
|
|
(1,327
|
)
|
|||||||||
|
Cash and cash equivalents at beginning of period
|
—
|
|
—
|
|
1,985
|
|
—
|
|
1,985
|
|
|||||||||
|
Cash and cash equivalents at end of period
|
$
|
—
|
|
$
|
1
|
|
$
|
657
|
|
$
|
—
|
|
$
|
658
|
|
||||
28
CONDENSED CONSOLIDATING STATEMENT OF CASH FLOWS
Nine Months Ended
September 30, 2013
|
FCX
|
FM O&G LLC
|
Non-guarantor
|
Consolidated
|
||||||||||||||||||
|
Issuer
|
Guarantor
|
Subsidiaries
|
Eliminations
|
FCX
|
|||||||||||||||||
|
Cash flow from operating activities:
|
|||||||||||||||||||||
|
Net income (loss)
|
$
|
1,951
|
|
$
|
221
|
|
$
|
2,611
|
|
$
|
(2,301
|
)
|
$
|
2,482
|
|
||||||
|
Adjustments to reconcile net income (loss) to net cash (used in) provided by operating activities:
|
|||||||||||||||||||||
|
Depreciation, depletion and amortization
|
3
|
|
341
|
|
1,434
|
|
—
|
|
1,778
|
|
|||||||||||
|
Net losses on crude oil and natural gas derivative contracts
|
—
|
|
205
|
|
—
|
|
—
|
|
205
|
|
|||||||||||
|
Net loss on early extinguishment of debt
|
45
|
|
—
|
|
—
|
|
—
|
|
45
|
|
|||||||||||
|
Gain on investment in MMR
|
(128
|
)
|
—
|
|
—
|
|
—
|
|
(128
|
)
|
|||||||||||
|
Equity in (earnings) losses of consolidated subsidiaries
|
(2,096
|
)
|
(207
|
)
|
2
|
|
2,301
|
|
—
|
|
|||||||||||
|
Other, net
|
8
|
|
(15
|
)
|
(143
|
)
|
—
|
|
(150
|
)
|
|||||||||||
|
Decreases (increases) in working capital and changes in other tax payments, excluding amounts from acquisitions
|
112
|
|
518
|
|
(1,119
|
)
|
—
|
|
(489
|
)
|
|||||||||||
|
Net cash (used in) provided by operating activities
|
(105
|
)
|
1,063
|
|
2,785
|
|
—
|
|
3,743
|
|
|||||||||||
|
Cash flow from investing activities:
|
|||||||||||||||||||||
|
Capital expenditures
|
—
|
|
(621
|
)
|
(3,002
|
)
|
—
|
|
(3,623
|
)
|
|||||||||||
|
Acquisitions, net of cash acquired
|
(5,437
|
)
|
—
|
|
(4
|
)
|
—
|
|
(5,441
|
)
|
|||||||||||
|
Intercompany loans
|
793
|
|
—
|
|
(1,095
|
)
|
—
|
|
302
|
|
—
|
|
|||||||||
|
Dividends from consolidated subsidiary
|
321
|
|
—
|
|
—
|
|
—
|
|
(321
|
)
|
—
|
|
|||||||||
|
Other, net
|
14
|
|
32
|
|
(70
|
)
|
—
|
|
(24
|
)
|
|||||||||||
|
Net cash (used in) provided by investing activities
|
(4,309
|
)
|
(589
|
)
|
(4,171
|
)
|
(19
|
)
|
(9,088
|
)
|
|||||||||||
|
Cash flow from financing activities:
|
|||||||||||||||||||||
|
Proceeds from debt
|
11,085
|
|
—
|
|
144
|
|
—
|
|
11,229
|
|
|||||||||||
|
Repayments of debt and redemption of MMR preferred stock
|
(4,501
|
)
|
(416
|
)
|
(126
|
)
|
—
|
|
(5,043
|
)
|
|||||||||||
|
Intercompany loans
|
—
|
|
(56
|
)
|
358
|
|
(302
|
)
|
—
|
|
|||||||||||
|
Cash dividends and distributions paid
|
(1,957
|
)
|
—
|
|
(478
|
)
|
321
|
|
(2,114
|
)
|
|||||||||||
|
Other, net
|
(213
|
)
|
—
|
|
—
|
|
—
|
|
(213
|
)
|
|||||||||||
|
Net cash provided by (used in) financing activities
|
4,414
|
|
(472
|
)
|
(102
|
)
|
19
|
|
3,859
|
|
|||||||||||
|
Net increase (decrease) in cash and cash equivalents
|
—
|
|
2
|
|
(1,488
|
)
|
—
|
|
(1,486
|
)
|
|||||||||||
|
Cash and cash equivalents at beginning of period
|
—
|
|
—
|
|
3,705
|
|
—
|
|
3,705
|
|
|||||||||||
|
Cash and cash equivalents at end of period
|
$
|
—
|
|
$
|
2
|
|
$
|
2,217
|
|
$
|
—
|
|
$
|
2,219
|
|
||||||
In May 2014, the Financial Accounting Standards Board (FASB) issued an Accounting Standards Update (ASU), which outlines a single comprehensive model and supersedes most of the current revenue recognition guidance. For public entities, this ASU is effective for annual reporting periods beginning after December 15, 2016, and interim periods within that reporting period. Early adoption is not permitted. FCX is evaluating this new guidance, but does not expect it to have a significant impact on its current revenue recognition policies.
In April 2014, FASB issued an ASU, which revises the guidance for reporting discontinued operations. This ASU amends the definition of a discontinued operation and requires additional disclosures about disposal transactions that do not meet the definition of a discontinued operation. For public entities, this ASU is effective for annual periods beginning on or after December 15, 2014, and interim periods within that year. Early adoption is permitted, but only for disposals (or classifications as held for sale) that have not been reported in financial statements previously issued or available for issuance. FCX adopted this ASU in the first quarter of 2014.
29
Candelaria and Ojos del Salado Disposition.
On
November 3, 2014
, FCX completed the sale of its
80 percent
ownership interests in the Candelaria and Ojos del Salado copper mining operations and supporting infrastructure (Candelaria/Ojos) located in Chile to Lundin Mining Corporation for
$1.8 billion
in cash, before closing adjustments, and contingent consideration of up to
$200 million
. Contingent consideration is calculated as
five percent of net copper revenues in any annual period over the next five years when the average realized copper price exceeds $4.00 per pound
. Excluding contingent consideration, after-tax net proceeds approximated
$1.5 billion
, and FCX expects to record a gain of approximately
$680 million
(approximately
$450 million
after tax) associated with this transaction. The transaction has an effective date of
June 30, 2014
. FCX expects to use the proceeds from this transaction to repay indebtedness.
The sale of Candelaria/Ojos does not meet the criteria for classification as a discontinued operation.
The following table provides the major classes of assets and liabilities associated with Candelaria/Ojos at September 30, 2014 (in millions):
|
Current assets
|
$
|
449
|
|
|
Long-term assets
|
1,160
|
|
|
|
Current liabilities
|
138
|
|
|
|
Long-term liabilities
|
92
|
|
|
The following table provides net income before income taxes and net income attributable to FCX associated with Candelaria/Ojos (in millions):
|
Nine Months Ended
|
||||||||
|
September 30,
|
||||||||
|
2014
|
2013
|
|||||||
|
Net income before income taxes
|
$
|
236
|
|
$
|
391
|
|
||
|
Net income attributable to FCX
|
132
|
|
199
|
|
||||
Other.
FCX evaluated events after
September 30, 2014
, and through the date the consolidated financial statements were issued, and determined any events or transactions occurring during this period that would require recognition or disclosure are appropriately addressed in these consolidated financial statements.
30
REVIEW REPORT OF INDEPENDENT REGISTERED PUBLIC ACCOUNTING FIRM
TO THE BOARD OF DIRECTORS AND STOCKHOLDERS OF
FREEPORT-McMoRan INC.
We have reviewed the condensed consolidated balance sheet of Freeport-McMoRan Inc. (formerly Freeport-McMoRan Copper & Gold Inc.) as of
September 30, 2014
, and the related consolidated statements of income and comprehensive income for the
three
- and
nine
-month periods ended
September 30, 2014
and
2013
, the consolidated statements of cash flows for the
nine
-month periods ended
September 30, 2014
and
2013
, and the consolidated statement of equity for the
nine
-month period ended
September 30, 2014
. These financial statements are the responsibility of the Company’s management.
We conducted our review in accordance with the standards of the Public Company Accounting Oversight Board (United States). A review of interim financial information consists principally of applying analytical procedures and making inquiries of persons responsible for financial and accounting matters. It is substantially less in scope than an audit conducted in accordance with the standards of the Public Company Accounting Oversight Board (United States), the objective of which is the expression of an opinion regarding the financial statements taken as a whole. Accordingly, we do not express such an opinion.
Based on our review, we are not aware of any material modifications that should be made to the condensed consolidated financial statements referred to above for them to be in conformity with U.S. generally accepted accounting principles.
We have previously audited, in accordance with the standards of the Public Company Accounting Oversight Board (United States), the consolidated balance sheet of Freeport-McMoRan Inc. as of
December 31, 2013
, and the related consolidated statements of income, comprehensive income, cash flows, and equity for the year then ended (not presented herein), and we expressed an unqualified audit opinion on those consolidated financial statements in our report dated February 27, 2014. In our opinion, the accompanying condensed consolidated balance sheet of Freeport-McMoRan Inc. as of
December 31, 2013
, is fairly stated, in all material respects, in relation to the consolidated balance sheet from which it has been derived.
/s/ ERNST & YOUNG LLP
Phoenix, Arizona
November 7, 2014
31
|
Item 2.
|
Management's Discussion and Analysis of Financial Condition and Results of Operations.
|
In Management’s Discussion and Analysis of Financial Condition and Results of Operations, "we," "us" and "our" refer to Freeport-McMoRan Inc. (FCX) and its consolidated subsidiaries. You should read this discussion in conjunction with our financial statements, the related Management’s Discussion and Analysis of Financial Condition and Results of Operations and the discussion of our Business and Properties in our annual report on Form 10-K for the year ended
December 31, 2013
, filed with the United States (U.S.) Securities and Exchange Commission (SEC). The results of operations reported and summarized below are not necessarily indicative of future operating results and future results could differ materially from those anticipated in forward-looking statements (refer to "Cautionary Statement" for further discussion). References to "Notes" are Notes included in our Notes to Consolidated Financial Statements. Throughout Management's Discussion and Analysis of Financial Condition and Results of Operations, all references to earnings or losses per share are on a diluted basis.
OVERVIEW
We are a premier U.S.-based natural resources company with an industry-leading global portfolio of mineral assets, significant oil and gas resources and a growing production profile. We are the world's largest publicly traded copper producer. Our portfolio of assets includes the Grasberg minerals district in Indonesia, one of the world's largest copper and gold deposits; significant mining operations in North and South America; the Tenke Fungurume (Tenke) minerals district in the Democratic Republic of Congo (DRC) in Africa; and significant oil and natural gas assets in the U.S., including reserves in the Deepwater Gulf of Mexico (GOM), onshore and offshore California, in the Haynesville shale play in Louisiana, in the Madden area in central Wyoming, and an industry-leading position in the emerging Inboard Lower Tertiary/Cretaceous natural gas trend in the shallow waters of the GOM and onshore in South Louisiana.
In November 2014, we completed the sale of our
80 percent
ownership interests in the Candelaria and Ojos del Salado copper mining operations and supporting infrastructure (Candelaria/Ojos) to Lundin Mining Corporation (Lundin) for
$1.8 billion
in cash and contingent consideration of up to
$0.2 billion
. Excluding contingent consideration, after-tax net proceeds from the transaction approximated $1.5 billion. Refer to Note
13
for further discussion.
As further discussed in Note 2, we completed the sale of our Eagle Ford shale assets for $3.1 billion (before closing adjustments) in June 2014, and acquired additional interests in the Deepwater GOM totaling $1.4 billion. Refer to "Operations - Oil and Gas" for further discussion.
Our results for third-quarter 2014, compared with third-quarter
2013
, reflect lower oil volumes and price realizations for copper, gold and oil, partly offset by higher copper and gold sales volumes. Our results for the first
nine
months of
2014
, compared with the first
nine
months of
2013
, reflect lower copper volumes and price realizations for copper and gold, partly offset by higher gold sales volumes and a full nine months of results from FCX Oil & Gas Inc. (FM O&G). The third quarter and first
nine
months of
2014
were also impacted by a ceiling-test impairment charge for our oil and gas properties pursuant to full cost accounting rules (refer to Note
1
), which was partly offset by net noncash mark-to-market gains on oil and gas derivative contracts. Refer to “Consolidated Results” for further discussion of our consolidated financial results for the
three
- and
nine
-month periods ended
September 30, 2014
and
2013
.
At
September 30, 2014
, we had
$0.7 billion
in consolidated cash and cash equivalents and
$19.7 billion
in total debt. During third-quarter 2014, we redeemed
$1.7 billion
aggregate principal amount of senior notes with an average interest rate of 6.6 percent. Additionally, on
October 15, 2014
, we redeemed the
$400 million
aggregate principal amount of our 8.625% Senior Notes. We continue to target significant reductions in debt by the end of 2016 using cash flows generated above capital expenditures and other cash requirements and potentially, net proceeds from asset sales. Refer to Note
6
and "Capital Resources and Liquidity" for further discussion.
32
OUTLOOK
We view the long-term outlook for our business positively, supported by limitations on supplies of copper and oil and by the requirements for copper and oil in the world’s economy. Our financial results vary as a result of fluctuations in market prices primarily for copper, gold, molybdenum and oil, as well as other factors. World market prices for these commodities have fluctuated historically and are affected by numerous factors beyond our control. Because we cannot control the price of our products, the key measures that management focuses on in operating our business are sales volumes, unit net cash costs for our mining operations, cash production costs per barrel of oil equivalent (BOE) for our oil and gas operations and operating cash flow. The outlook for each of these measures follows.
Sales Volumes.
Following are our projected consolidated sales volumes for the year
2014
:
|
Copper
(millions of recoverable pounds):
|
|
||
|
North America copper mines
|
1,670
|
|
|
|
South America mining
|
1,090
|
|
a
|
|
Indonesia mining
|
710
|
|
|
|
Africa mining
|
445
|
|
|
|
|
3,915
|
|
|
|
Gold
(thousands of recoverable ounces):
|
|
||
|
Indonesia mining
|
1,150
|
|
|
|
North and South America mining
|
70
|
|
a
|
|
|
1,220
|
|
|
|
Molybdenum
(millions of recoverable pounds)
|
95
|
|
b
|
|
Oil Equivalents
(million BOE, or MMBOE)
|
56.2
|
|
|
|
a.
|
Excludes estimated fourth-quarter 2014 production from the Candelaria and Ojos del Salado mines (totaling 80 million pounds of copper and 25 thousand ounces of gold).
|
|
b.
|
Projected molybdenum sales include
50 million
pounds produced by our Molybdenum mines and
45 million
pounds produced by our North and South America copper mines.
|
Consolidated sales for
fourth-quarter
2014
are expected to approximate
1.0 billion
pounds of copper,
350 thousand
ounces of gold,
21 million
pounds of molybdenum and
11.5
MMBOE. Projected sales volumes are dependent on a number of factors, including operational performance and other factors.
Mining Unit Net Cash Costs.
Assuming average prices of
$1,250
per ounce of gold and
$10
per pound of molybdenum for
fourth-quarter
2014
, and achievement of current sales volume and cost estimates, consolidated unit net cash costs (net of by-product credits) for our copper mines are expected to average
$1.52
per pound of copper for the year
2014
. Quarterly unit net cash costs vary with fluctuations in sales volumes and average realized prices (primarily gold and molybdenum prices). The impact of price changes for
fourth-quarter
2014
on consolidated unit net cash costs would approximate
$0.01
per pound for each
$50
per ounce change in the average price of gold and
$0.005
per pound for each
$2
per pound change in the average price of molybdenum. Refer to “Consolidated Results – Production and Delivery Costs” for further discussion of consolidated production and delivery costs for our mining operations.
Oil and Gas Cash Production Costs per BOE.
Based on current sales volume and cost estimates for
fourth-quarter
2014
, oil and gas cash production costs are expected to approximate
$21
per BOE for the year
2014
and
$24
per BOE for
fourth-quarter
2014
. Fourth-quarter 2014 unit cost estimates reflect downtime for maintenance affecting production rates at Marlin in the Deepwater GOM. Refer to “Operations – Oil and Gas” for further discussion of oil and gas production costs.
Consolidated Operating Cash Flow.
Our consolidated operating cash flows vary with prices realized from copper, gold, molybdenum and oil sales, our sales volumes, production costs, income taxes, other working capital changes and other factors. Based on current sales volume and cost estimates, and assuming average prices of
$3.00
per pound of copper,
$1,250
per ounce of gold,
$10
per pound of molybdenum and
$90
per barrel of Brent crude oil for
fourth-quarter
2014
, consolidated operating cash flows are estimated to approximate
$5.8 billion
for the year
2014
(net of
$0.4 billion
of working capital uses and changes in other tax payments). Projected consolidated operating cash flows for the year
2014
also reflect estimated taxes of
$1.6 billion
(refer to “Consolidated Results – Provision
33
for Income Taxes” for further discussion of our projected consolidated effective annual tax rate for
2014
). The impact of price changes during
fourth-quarter
2014
on operating cash flows would approximate
$90 million
for each
$0.10
per pound change in the average price of copper,
$15 million
for each
$50
per ounce change in the average price of gold and
$18 million
for each
$2
per pound change in the average price of molybdenum. For Brent crude oil, a $5 per barrel increase above $90 per barrel in fourth-quarter 2014 would improve 2014 operating cash flows by approximately $20 million. After giving effect to derivative contracts, which provide price protection between approximately $70 and $90 per barrel, a $5 per barrel decrease below $90 per barrel in fourth-quarter 2014 would not reduce 2014 operating cash flows.
MARKETS
Metals.
World prices for copper, gold and molybdenum can fluctuate significantly. During the period from January 2004 through
September 2014
, the London Metal Exchange (LME) spot copper price varied from a low of
$1.06
per pound in 2004 to a record high of
$4.60
per pound in 2011, the London Bullion Market Association (London) PM gold price fluctuated from a low of
$375
per ounce in 2004 to a record high of
$1,895
per ounce in 2011, and the
Metals Week
Molybdenum Dealer Oxide weekly average price ranged from a low of
$7.35
per pound in 2004 to a record high of
$39.25
per pound in 2005. Copper, gold and molybdenum prices are affected by numerous factors beyond our control as described further in our “Risk Factors” contained in Part I, Item 1A of our annual report on Form 10-K for the year ended
December 31, 2013
.
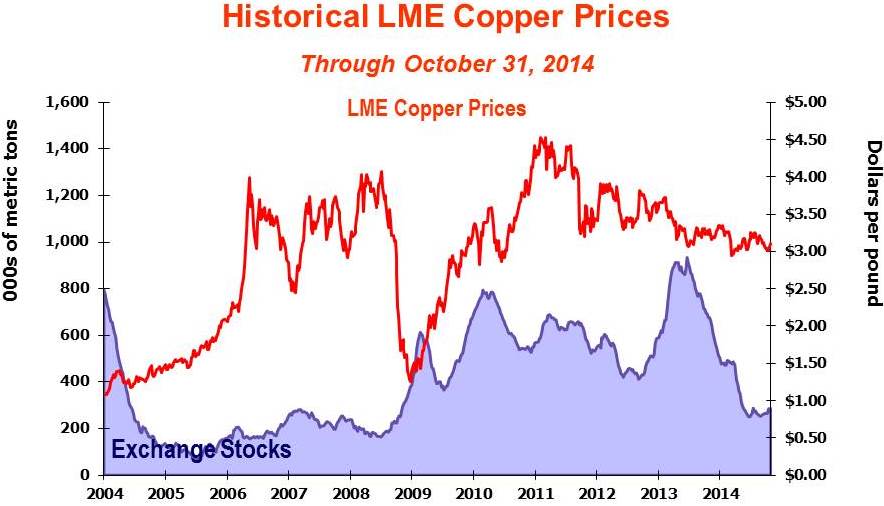
This graph presents LME spot copper prices and the combined reported stocks of copper at the LME, Commodity Exchange Inc., a division of the New York Mercantile Exchange (NYMEX), and the Shanghai Futures Exchange from January 2004 through
October 2014
. From 2006 through most of 2008, limited supplies, combined with growing demand from China and other emerging economies, resulted in high copper prices and low levels of inventories. We believe current copper prices are supported by a combination of demand from developing economies and pro-growth monetary and fiscal policy decisions in Europe, China and the U.S. During the first nine months of
2014
, copper prices declined because of concerns about slowing growth rates in China and an outlook for higher near-term supplies. During
third-quarter
2014
, LME spot copper prices ranged from a low of
$3.06
per pound to a high of
$3.26
per pound, averaged
$3.17
per pound, and closed at
$3.06
per pound on
September 30, 2014
.
We believe the underlying long-term fundamentals of the copper business remain positive, supported by the significant role of copper in the global economy and a challenging long-term supply environment. Future copper
34
prices are expected to be volatile and are likely to be influenced by demand from China and emerging markets, as well as economic activity in the U.S. and other industrialized countries, the timing of the development of new supplies of copper and production levels of mines and copper smelters. LME spot copper prices closed at
$3.10
per pound on
October 31, 2014
.
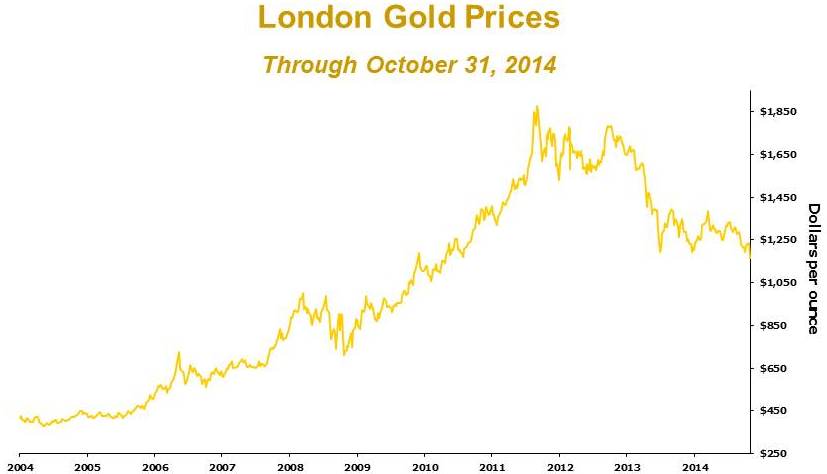
This graph presents London PM gold prices from January 2004 through
October 2014
. An improving economic outlook and positive equity performance contributed to lower demand for gold in 2013 and the first nine months of 2014, resulting in generally lower prices. During
third-quarter
2014
, London PM gold prices ranged from a low of
$1,214
per ounce to a high of
$1,340
per ounce, averaged
$1,282
per ounce and closed at
$1,217
per ounce on
September 30, 2014
. Gold prices closed at
$1,164
per ounce on
October 31, 2014
.
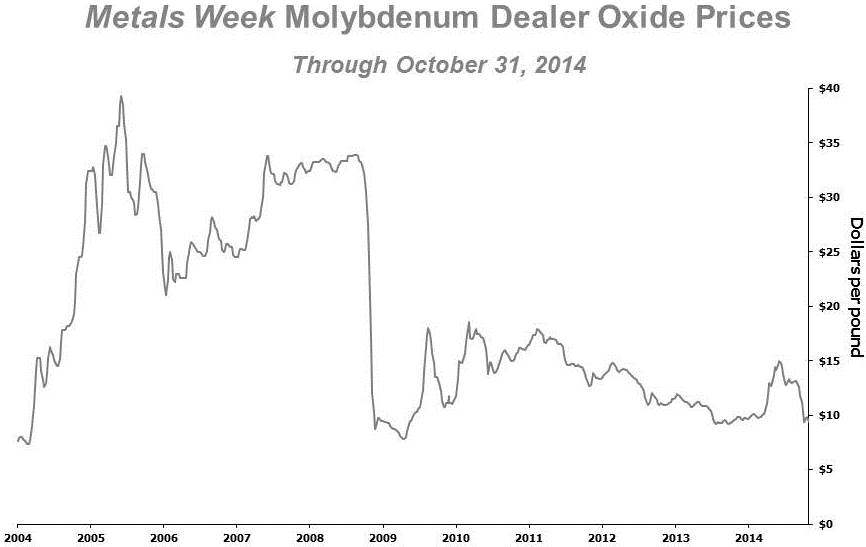
This graph presents the
Metals Week
Molybdenum Dealer Oxide weekly average prices from January 2004 through
October 2014
. Molybdenum prices improved during the first nine months of 2014, resulting from improved demand in the metallurgical sector. During
third-quarter
2014
, the weekly average price of molybdenum ranged from a low of
$11.21
per pound to a high of
$13.28
per pound, averaged
$12.77
per pound and was
$11.21
on
September 30,
35
2014
. The
Metals Week
Molybdenum Dealer Oxide weekly average price was
$9.38
per pound on
October 31, 2014
.
Oil and Gas.
Market prices for crude oil and natural gas can fluctuate significantly. During the period from January 2004 through
October 2014
, the Brent crude oil price ranged from a low of
$28.83
per barrel in 2004 to a high of
$146.08
per barrel in 2008 and the NYMEX natural gas price fluctuated from a low of
$2.04
per million British thermal units (MMBtu) in 2012 to a high of
$13.91
per MMBtu in 2005. Crude oil and natural gas prices are affected by numerous factors beyond our control as described further in our “Risk Factors” contained in Part I, Item 1A of our annual report on Form 10-K for the year ended
December 31, 2013
.
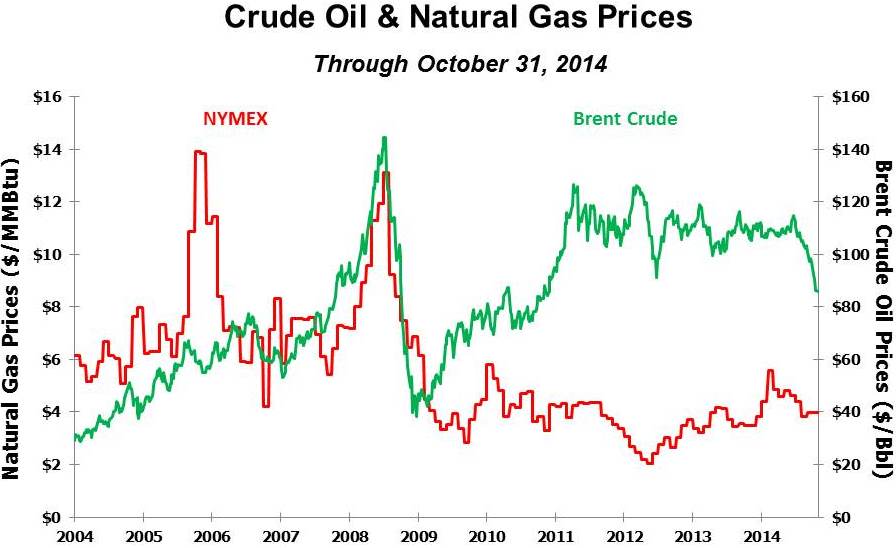
This graph presents Brent crude oil prices and NYMEX natural gas contract prices from January 2004 through
October 2014
. During third-quarter 2014 and through October 2014, oil prices have been under pressure from global oversupply primarily attributable to U.S. shale production and increased Libyan output, coupled with weak economic data in Europe and slowing Chinese demand. During
third-quarter
2014
, Brent crude oil prices ranged from a low of
$94.67
per barrel to a high of
$112.29
per barrel, averaged
$103.50
per barrel and were
$94.67
per barrel on
September 30, 2014
. Brent crude oil prices declined during October 2014 and were
$85.86
per barrel on
October 31, 2014
.
36
CONSOLIDATED RESULTS
|
Three Months Ended
|
Nine Months Ended
|
|||||||||||||||
|
|
September 30,
|
September 30,
|
||||||||||||||
|
|
2014
|
2013
|
2014
|
2013
a
|
||||||||||||
|
SUMMARY FINANCIAL DATA
|
(in millions, except per share amounts)
|
|||||||||||||||
|
Revenues
b
|
$
|
5,696
|
|
c,d
|
$
|
6,165
|
|
c,d
|
$
|
16,203
|
|
c,d
|
$
|
15,036
|
|
c,d
|
|
Operating income
b
|
$
|
1,132
|
|
c,d,e,f,g
|
$
|
1,707
|
|
c,d,g
|
$
|
3,396
|
|
c,d,e,f,g
|
$
|
3,701
|
|
c,d,g,h
|
|
Net income attributable to common stockholders
i
|
$
|
552
|
|
c,d,e,f,g,j,k
|
$
|
821
|
|
c,d,g
|
$
|
1,544
|
|
c,d,e,f,g,j,k
|
$
|
1,951
|
|
c,d,g,h,j,l
|
|
Diluted net income per share attributable to common stockholders
|
$
|
0.53
|
|
c,d,e,f,g,j,k
|
$
|
0.79
|
|
c,d,g
|
$
|
1.47
|
|
c,d,e,f,g,j,k
|
$
|
1.96
|
|
c,d,g,h,j,l
|
|
Diluted weighted-average common shares outstanding
|
1,046
|
|
1,043
|
|
1,045
|
|
993
|
|
||||||||
|
Operating cash flows
m
|
$
|
1,926
|
|
|
$
|
1,878
|
|
|
$
|
4,513
|
|
|
$
|
3,743
|
|
|
|
Capital expenditures
|
$
|
1,853
|
|
$
|
1,645
|
|
$
|
5,415
|
|
$
|
3,623
|
|
||||
|
At September 30:
|
||||||||||||||||
|
Cash and cash equivalents
|
$
|
658
|
|
$
|
2,219
|
|
$
|
658
|
|
$
|
2,219
|
|
||||
|
Total debt, including current portion
|
$
|
19,737
|
|
$
|
21,123
|
|
$
|
19,737
|
|
$
|
21,123
|
|
||||
|
a.
|
Includes the results of FM O&G beginning June 1, 2013.
|
b.
As further detailed in Note 10, following is a summary of revenues and operating income (loss) by operating division (in millions):
|
Three Months Ended
|
Nine Months Ended
|
|||||||||||||||
|
September 30,
|
September 30,
|
|||||||||||||||
|
Revenues
|
2014
|
2013
|
2014
|
2013
|
||||||||||||
|
North America copper mines
|
$
|
1,490
|
|
$
|
1,301
|
|
$
|
4,245
|
|
$
|
3,995
|
|
||||
|
South America mining
|
847
|
|
1,139
|
|
2,776
|
|
3,104
|
|
||||||||
|
Indonesia mining
|
1,253
|
|
1,111
|
|
2,246
|
|
2,633
|
|
||||||||
|
Africa mining
|
428
|
|
420
|
|
1,173
|
|
1,223
|
|
||||||||
|
Molybdenum mines
|
173
|
|
121
|
|
469
|
|
408
|
|
||||||||
|
Rod & Refining
|
1,227
|
|
1,253
|
|
3,623
|
|
3,862
|
|
||||||||
|
Atlantic Copper Smelting & Refining
|
601
|
|
516
|
|
1,823
|
|
1,742
|
|
||||||||
|
U.S. oil & gas operations
|
990
|
|
1,176
|
|
3,487
|
|
1,512
|
|
||||||||
|
Other mining, corporate, other & eliminations
|
(1,313
|
)
|
(872
|
)
|
(3,639
|
)
|
(3,443
|
)
|
||||||||
|
Total FCX revenues
|
$
|
5,696
|
|
$
|
6,165
|
|
$
|
16,203
|
|
$
|
15,036
|
|
||||
|
Operating income (loss)
|
||||||||||||||||
|
North America copper mines
|
$
|
471
|
|
$
|
384
|
|
$
|
1,329
|
|
$
|
1,218
|
|
||||
|
South America mining
|
273
|
|
558
|
|
1,010
|
|
1,372
|
|
||||||||
|
Indonesia mining
|
434
|
|
404
|
|
385
|
|
634
|
|
||||||||
|
Africa mining
|
161
|
|
163
|
|
436
|
|
475
|
|
||||||||
|
Molybdenum mines
|
62
|
|
18
|
|
155
|
|
106
|
|
||||||||
|
Rod & Refining
|
5
|
|
6
|
|
15
|
|
20
|
|
||||||||
|
Atlantic Copper Smelting & Refining
|
8
|
|
(22
|
)
|
(5
|
)
|
(30
|
)
|
||||||||
|
U.S. oil & gas operations
|
(150
|
)
|
274
|
|
359
|
|
338
|
|
||||||||
|
Other mining, corporate, other & eliminations
|
(132
|
)
|
(78
|
)
|
(288
|
)
|
(432
|
)
|
||||||||
|
Total FCX operating income
|
$
|
1,132
|
|
$
|
1,707
|
|
$
|
3,396
|
|
$
|
3,701
|
|
||||
|
c.
|
Includes (unfavorable) favorable adjustments to provisionally priced concentrate and cathode sales recognized in prior periods totaling
$(22) million
(
$(10) million
to net income attributable to common stockholders or
$(0.01)
per share) for
third-quarter
2014
,
$73 million
(
$35 million
to net income attributable to common stockholders or
$0.03
per share) for
third-quarter
2013
,
$(118) million
(
$(65) million
to net income attributable to common stockholders or
$(0.06)
per share) for the
first nine months of
2014
and
$(26) million
(
$(12) million
to net income attributable to common stockholders or
$(0.01)
per share) for the
first nine months of
2013
. Refer to “Revenues” for further discussion.
|
|
d.
|
Includes net noncash mark-to-market gains (losses) associated with crude oil and natural gas derivative contracts totaling
$122 million
(
$76 million
to net income attributable to common stockholders or
$0.07
per share) for
third-quarter
2014
,
$(158) million
(
$(98) million
to net income attributable to common stock or
$(0.09)
per share) for
third-quarter
2013
,
$130 million
(
$80 million
to net income attributable to common stockholders or
$0.08
per share) for the
first nine months of
2014
, and
$(194) million
(
$(120) million
to net income attributable to common stock or
$(0.12)
per share) for the four-month period from June 1, 2013, to September 30, 2013. Refer to "Revenues" for further discussion.
|
37
|
e.
|
Includes a charge of
$308 million
(
$192 million
to net income attributable to common stockholders or
$0.18
per share) to reduce the carrying value of oil and gas properties pursuant to full cost accounting rules.
|
|
f.
|
Includes a gain of
$46 million
(
$31 million
to net income attributable to common stockholders or
$0.03
per share) primarily from the sale of a metals injection molding plant.
|
|
g.
|
Includes net credits (charges) for adjustments to environmental obligations and related litigation reserves of
$1 million
(
$1 million
to net income attributable to common stockholders or less than
$0.01
per share) for
third-quarter
2014
,
$22 million
(
$14 million
to net income attributable to common stockholders or
$0.01
per share) for
third-quarter
2013
,
$(68) million
(
$(67) million
to net income attributable to common stockholders or
$(0.06)
per share) for the
first nine months of
2014
and
$14 million
(
$7 million
to net income attributable to common stockholders or
$0.01
per share) for the
first nine months of
2013
.
|
|
h.
|
Includes transaction and related costs totaling
$76 million
(
$47 million
to net income attributable to common stock or
$0.05
per share) principally associated with oil and gas acquisitions.
|
|
i.
|
We defer recognizing profits on intercompany sales until final sales to third parties occur. Refer to "Operations - Smelting & Refining" for a summary of net impacts from changes in these deferrals.
|
|
j.
|
Includes net gains (losses) on early extinguishment of debt totaling
$58 million
(
$17 million
to net income attributable to common stockholders or
$0.02
per share) in
third-quarter
2014
and
$63 million
(
$21 million
to net income attributable to common stockholders or
$0.02
per share) for the
first nine months of
2014
related to the redemption of senior notes and
$(45) million
(
$(36) million
to net income attributable to common stockholders or
$(0.04)
per share) for the
first nine months of
2013
related to the termination of the acquisition bridge loan facilities.
|
|
k.
|
Includes a tax charge of $54 million ($47 million net of noncontrolling interests or $0.04 per share) related to changes in Chilean tax rules. Additionally, the
first nine months of
2014
include a tax charge of
$62 million
(
$0.06
per share) associated with deferred taxes recorded in connection with the allocation of goodwill to the sale of Eagle Ford properties.
|
|
l.
|
Includes gains associated with the oil and gas acquisitions, including $128 million to net income attributable to common stockholders or $0.13 per share, related to our preferred stock investment in and the subsequent acquisition of McMoRan Exploration Co., and
$183 million
to net income attributable to common stockholders or
$0.18
per share, associated with net reductions in our deferred tax liabilities and deferred tax asset valuation allowances.
|
|
m.
|
Includes net working capital sources (uses) and changes in other tax payments of
$78 million
for
third-quarter
2014
,
$(294) million
for
third-quarter
2013
,
$(699) million
for the
first nine months of
2014
and
$(489) million
for the
first nine months of
2013
.
|
|
Three Months Ended
|
Nine Months Ended
|
|||||||||||||||
|
September 30,
|
September 30,
|
|||||||||||||||
|
2014
|
2013
|
2014
|
2013
a
|
|||||||||||||
|
SUMMARY OPERATING DATA
|
||||||||||||||||
|
Copper
(recoverable)
|
|
|
||||||||||||||
|
Production (millions of pounds)
|
1,027
|
|
1,063
|
|
2,906
|
|
2,952
|
|
||||||||
|
Sales, excluding purchases (millions of pounds)
|
1,077
|
|
1,041
|
|
2,916
|
|
2,946
|
|
||||||||
|
Average realized price per pound
|
$
|
3.12
|
|
$
|
3.28
|
|
$
|
3.14
|
|
$
|
3.31
|
|
||||
|
Site production and delivery costs per pound
b
|
$
|
1.91
|
|
$
|
1.85
|
|
$
|
1.92
|
|
c
|
$
|
1.96
|
|
|||
|
Unit net cash costs per pound
b
|
$
|
1.34
|
|
d
|
$
|
1.46
|
|
$
|
1.52
|
|
c,d
|
$
|
1.62
|
|
||
|
Gold
(recoverable)
|
|
|
||||||||||||||
|
Production (thousands of ounces)
|
449
|
|
327
|
|
846
|
|
713
|
|
||||||||
|
Sales, excluding purchases (thousands of ounces)
|
525
|
|
305
|
|
871
|
|
692
|
|
||||||||
|
Average realized price per ounce
|
$
|
1,220
|
|
$
|
1,329
|
|
$
|
1,251
|
|
$
|
1,395
|
|
||||
|
Molybdenum
(recoverable)
|
|
|
||||||||||||||
|
Production (millions of pounds)
|
24
|
|
25
|
|
73
|
|
71
|
|
||||||||
|
Sales, excluding purchases (millions of pounds)
|
22
|
|
23
|
|
74
|
|
71
|
|
||||||||
|
Average realized price per pound
|
$
|
14.71
|
|
$
|
11.21
|
|
$
|
13.01
|
|
$
|
12.12
|
|
||||
|
Oil Equivalents
|
||||||||||||||||
|
Sales volumes:
|
||||||||||||||||
|
MMBOE
|
12.5
|
|
16.5
|
|
44.7
|
|
21.5
|
|
||||||||
|
Thousand BOE (MBOE) per day
|
136
|
|
179
|
|
164
|
|
176
|
|
||||||||
|
Cash operating margin per BOE:
e
|
||||||||||||||||
|
Realized revenues
|
$
|
69.08
|
|
$
|
80.93
|
|
$
|
75.04
|
|
$
|
79.40
|
|
||||
|
Cash production costs
|
20.93
|
|
16.80
|
|
19.57
|
|
16.76
|
|
||||||||
|
Cash operating margin
|
$
|
48.15
|
|
$
|
64.13
|
|
$
|
55.47
|
|
$
|
62.64
|
|
||||
|
a.
|
Includes the results of FM O&G beginning June 1, 2013.
|
38
|
b.
|
Reflects per pound weighted-average production and delivery costs and unit net cash costs (net of by-product credits) for all copper mines, excluding net noncash and other costs. For reconciliations of the per pound unit costs by operating division to production and delivery costs applicable to sales reported in our consolidated financial statements, refer to "Product Revenues and Production Costs."
|
|
c.
|
Excludes
$0.05
per pound of copper for fixed costs charged directly to cost of sales as a result of the impact of export restrictions on PT Freeport Indonesia's (PT-FI) operating rates.
|
|
d.
|
Includes $0.06 per pound of copper in third-quarter 2014 and $0.02 per pound of copper for the first nine months of 2014 for export duties and increased royalty rates at PT-FI.
|
|
e.
|
Cash operating margin for oil and gas operations reflects realized revenues less cash production costs. Realized revenues exclude noncash mark-to-market adjustments on derivative contracts, and cash production costs exclude accretion and other costs. For reconciliations of realized revenues and cash production costs per BOE to revenues and production and delivery costs reported in our consolidated financial statements, refer to "Product Revenues and Production Costs."
|
Revenues
Consolidated revenues totaled
$5.7 billion
in
third-quarter
2014
and
$16.2 billion
for the
first nine months of
2014
, compared with
$6.2 billion
in
third-quarter
2013
and
$15.0 billion
for the
first nine months of
2013
. Revenues included the sale of copper concentrates, copper cathodes, copper rod, gold, molybdenum, silver, cobalt hydroxide and beginning June 1, 2013, the sale of oil, natural gas and natural gas liquids (NGLs) by our oil and gas operations. Following is a summary of changes in our consolidated revenues between periods (in millions):
|
Three Months Ended September 30,
|
Nine Months Ended September 30,
|
|||||||
|
Consolidated revenues - 2013 periods
|
$
|
6,165
|
|
$
|
15,036
|
|
||
|
Mining operations:
|
||||||||
|
Higher (lower) sales volumes:
|
||||||||
|
Copper
|
119
|
|
(100
|
)
|
||||
|
Gold
|
293
|
|
250
|
|
||||
|
Molybdenum
|
(9
|
)
|
35
|
|
||||
|
(Lower) higher price realizations:
|
|
|||||||
|
Copper
|
(172
|
)
|
(496
|
)
|
||||
|
Gold
|
(57
|
)
|
(126
|
)
|
||||
|
Molybdenum
|
78
|
|
66
|
|
||||
|
Unfavorable impact of net adjustments for prior period provisionally priced copper sales
|
(95
|
)
|
(92
|
)
|
||||
|
Lower revenues from purchased copper
|
(189
|
)
|
(324
|
)
|
||||
|
Oil and gas operations:
|
||||||||
|
Lower oil sales volumes
|
(302
|
)
|
—
|
|
||||
|
Lower oil price realizations, including realized cash losses on derivative contacts
|
(136
|
)
|
—
|
|
||||
|
Higher oil and gas revenues, including realized cash losses on derivative contracts
|
—
|
|
1,651
|
|
a
|
|||
|
Favorable impact of net noncash mark-to-market adjustments on derivative contracts
|
280
|
|
324
|
|
||||
|
Other, including intercompany eliminations
|
(279
|
)
|
(21
|
)
|
||||
|
Consolidated revenues - 2014 periods
|
$
|
5,696
|
|
$
|
16,203
|
|
||
|
a. Represents the change in oil and gas revenues, excluding impacts from net noncash mark-to-market adjustments on derivative contracts, for the first nine months of 2014 compared to the four-month period from June 1, 2013, to September 30, 2013.
|
||||||||
Mining Sales Volumes
Consolidated copper sales volumes were
1.08 billion
pounds in
third-quarter
2014
and
2.9 billion
pounds for the
first nine months of
2014
, compared with
1.04 billion
pounds in
third-quarter
2013
and
2.9 billion
pounds for the
first nine months of
2013
. Consolidated gold sales volumes increased to
525 thousand
ounces in
third-quarter
2014
and
871 thousand
ounces for the
first nine months of
2014
, compared with
305 thousand
ounces in
third-quarter
2013
and
692 thousand
ounces for the
first nine months of
2013
, primarily reflecting higher ore grades at PT-FI. Consolidated molybdenum sales volumes were
22 million
pounds in
third-quarter
2014
and
74 million
pounds for the
first nine months of
2014
, compared with
23 million
pounds in
third-quarter
2013
and
71 million
pounds for the
first nine months of
2013
. Refer to “Operations” for further discussion of sales volumes at our mining operations.
39
Metal Price Realizations
Our consolidated revenues can vary significantly as a result of fluctuations in the market prices of copper, gold and molybdenum. Following is a summary of our average price realizations from mining operations for the
third quarters
and
first nine months of
2014
and
2013
:
|
Three Months Ended
|
Nine Months Ended
|
||||||||||||||
|
September 30,
|
September 30,
|
||||||||||||||
|
|
2014
|
|
2013
|
2014
|
|
2013
|
|||||||||
|
Copper (per pound)
|
$
|
3.12
|
|
$
|
3.28
|
|
$
|
3.14
|
|
$
|
3.31
|
|
|||
|
Gold (per ounce)
|
$
|
1,220
|
|
$
|
1,329
|
|
$
|
1,251
|
|
$
|
1,395
|
|
|||
|
Molybdenum (per pound)
|
$
|
14.71
|
|
$
|
11.21
|
|
$
|
13.01
|
|
$
|
12.12
|
|
|||
Copper and gold realizations were lower in
third-quarter
2014
and for the
first nine months of
2014
, compared with
third-quarter
2013
and the
first nine months of
2013
. Realized molybdenum prices improved in
third-quarter
2014
and the
first nine months of
2014
, compared with
third-quarter
2013
and the
first nine months of
2013
. Refer to "Markets."
Provisionally Priced Copper Sales
During the
first nine months of
2014
,
43 percent
of our mined copper was sold in concentrate,
31 percent
as cathode and
26 percent
as rod from our North America operations. Impacts of net adjustments for prior period provisionally priced sales primarily relate to copper sales. Substantially all of our copper concentrate and cathode sales contracts provide final copper pricing in a specified future month (generally one to four months from the shipment date) based primarily on quoted LME monthly average spot copper prices. We receive market prices based on prices in the specified future period, which results in price fluctuations recorded through revenues until the date of settlement. We record revenues and invoice customers at the time of shipment based on then-current LME prices, which results in an embedded derivative on our provisionally priced concentrate and cathode sales that is adjusted to fair value through earnings each period, using the period-end forward prices, until final pricing on the date of settlement. To the extent final prices are higher or lower than what was recorded on a provisional basis, an increase or decrease to revenues is recorded each reporting period until the date of final pricing. Accordingly, in times of rising copper prices, our revenues benefit from adjustments to the final pricing of provisionally priced sales pursuant to contracts entered into in prior periods; in times of falling copper prices, the opposite occurs.
Following is a summary of the (unfavorable) favorable impacts of net adjustments to the prior periods' provisionally priced copper sales for the
third quarters
and
first nine months of
2014
and
2013
(in millions, except per share amounts):
|
Three Months Ended
|
Nine Months Ended
|
||||||||||||||
|
September 30,
|
September 30,
|
||||||||||||||
|
|
2014
|
|
2013
|
2014
|
|
2013
|
|||||||||
|
Revenues
|
$
|
(22
|
)
|
$
|
73
|
|
$
|
(118
|
)
|
$
|
(26
|
)
|
|||
|
Net income attributable to common stockholders
|
$
|
(10
|
)
|
$
|
35
|
|
$
|
(65
|
)
|
$
|
(12
|
)
|
|||
|
Net income per share attributable to common stockholders
|
$
|
(0.01
|
)
|
$
|
0.03
|
|
$
|
(0.06
|
)
|
$
|
(0.01
|
)
|
|||
At
September 30, 2014
, we had provisionally priced copper sales at our copper mining operations, primarily South America and Indonesia, totaling
394 million
pounds of copper (net of intercompany sales and noncontrolling interests) recorded at an average of
$3.03
per pound, subject to final pricing over the next several months. We estimate that each $0.05 change in the price realized from the
September 30, 2014
, provisional price recorded would have an approximate
$13 million
impact on
2014
net income attributable to common stockholders. The LME spot copper price closed at
$3.10
per pound on
October 31, 2014
.
Purchased Copper
From time to time, we purchase copper cathode for processing by our Rod & Refining segment when production from our North America copper mines does not meet customer demand.
Oil and Gas Revenues
Oil realizations of
$88.58
per barrel in
third-quarter
2014
and
$93.00
per barrel for the
first nine months of
2014
, were lower compared with
$104.33
per barrel for
third-quarter
2013
and
$102.76
per barrel for the four-month period from June 1, 2013, to September 30, 2013, primarily reflecting lower oil prices and higher realized cash losses on derivative contracts.
40
Oil sales volumes were
8.6 million
barrels (MMBbls) in
third-quarter
2014
,
11.5
MMBbls in
third-quarter
2013
,
32.1
MMBbls for the
first nine months of
2014
and
14.9
MMBbls for the four-month period from June 1, 2013, to September 30, 2013. Lower oil sales volumes in
third-quarter
2014
, compared with
third-quarter
2013
, primarily reflected the sale of the Eagle Ford properties in June 2014.
Refer to “Operations” for further discussion of average realizations and sales volumes at our oil and gas operations.
In connection with the acquisition of Plains Exploration & Production Company (PXP), we have derivative contracts for 2014 and 2015 that consist of crude oil options and natural gas swaps. These crude oil and natural gas derivative contracts are not designated as hedging instruments; accordingly, they are recorded at fair value with the mark-to-market gains and losses recorded in revenues each period. Following is a summary of the net noncash mark-to-market gains (losses) on crude oil and natural gas derivative contracts for the
third quarter
s and
first nine months of
2014
and
2013
(in millions, except per share amounts):
|
Three Months Ended
|
Nine Months Ended
|
||||||||||||||
|
September 30,
|
September 30,
|
||||||||||||||
|
|
2014
|
|
2013
|
2014
|
|
2013
a
|
|||||||||
|
Revenues
|
$
|
122
|
|
$
|
(158
|
)
|
$
|
130
|
|
$
|
(194
|
)
|
|||
|
Net income attributable to common stockholders
|
$
|
76
|
|
$
|
(98
|
)
|
$
|
80
|
|
$
|
(120
|
)
|
|||
|
Net income per share attributable to common stockholders
|
$
|
0.07
|
|
$
|
(0.09
|
)
|
$
|
0.08
|
|
$
|
(0.12
|
)
|
|||
|
a.
|
Reflects the four month period from June 1, 2013, to September 30, 2013.
|
Refer to Note
7
for further discussion of oil and gas derivative contracts.
Production and Delivery Costs
Consolidated production and delivery costs totaled
$3.2 billion
in
third-quarter
2014
and
$9.0 billion
for the
first nine months of
2014
, compared with
$3.3 billion
in
third-quarter
2013
and
$8.9 billion
for the
first nine months of
2013
. Higher production and delivery costs for
first nine months of
2014
were primarily associated with our oil and gas operations, which included a full nine months of results for
2014
, partly offset by lower costs of cathode purchases in North America and lower costs in Indonesia associated with lower volumes.
Mining Unit Site Production and Delivery Costs
Consolidated unit site production and delivery costs (before net noncash and other costs) for our copper mines of
$1.91
per pound of copper in
third-quarter
2014
were higher than consolidated unit site production and delivery costs of
$1.85
per pound in
third-quarter
2013
, primarily reflecting the impact of lower production rates at PT-FI and lower copper sales volumes in South America, partly offset by higher copper sales volumes in North America.
Consolidated unit site production and delivery costs (before net noncash and other costs) for our copper mines of
$1.92
per pound for the
first nine months of
2014
were lower than
$1.96
per pound for the
first nine months of
2013
, primarily reflecting higher copper sales volumes in North America, partly offset by the impact of lower production rates at PT-FI. Additionally, consolidated unit site production and delivery costs for the
first nine months of
2014
exclude fixed costs charged directly to cost of sales as a result of the impact of export restrictions on PT-FI's operating rates totaling
$0.05
per pound of copper.
Assuming achievement of current volume and cost estimates, consolidated unit site production and delivery costs are expected to average
$1.91
per pound of copper for the year
2014
. Refer to “Operations – Unit Net Cash Costs” for further discussion of unit net cash costs associated with our operating divisions and to “Product Revenues and Production Costs” for reconciliations of per pound costs by operating division to production and delivery costs applicable to sales reported in our consolidated financial statements.
Our mining operations require significant energy, principally diesel, electricity, coal and natural gas, most of which is obtained from third parties under long-term contracts. Energy costs are expected to approximate 20 percent of our consolidated copper production costs for the year
2014
, including purchases of approximately 260 million gallons of diesel fuel; 8,000 gigawatt hours of electricity at our North America, South America and Africa copper mining operations (we generate all of our power at our Indonesia mining operation); 650 thousand metric tons of coal for our coal power plant in Indonesia; and 1 MMBtu of natural gas at certain of our North America mines.
41
Oil and Gas Cash Production Costs per BOE
Cash production costs for our oil and gas operations of
$20.93
per BOE in
third-quarter
2014
and
$19.57
for the
first nine months of
2014
, were higher than the
$16.80
per BOE in
third-quarter
2013
and
$16.76
for the four months from June 1, 2013, to September 30, 2013, primarily reflecting the sale of lower cost Eagle Ford properties in June 2014 and higher operating costs in California.
Assuming achievement of current volume and cost estimates for
fourth-quarter
2014
, cash production costs are expected to approximate
$21
per BOE for the year
2014
and
$24
per BOE for
fourth-quarter
2014
. Fourth-quarter 2014 unit cost estimates reflect downtime for maintenance affecting production rates at Marlin in the Deepwater GOM.
Refer to “Operations” for further discussion of cash production costs at our oil and gas operations.
Depreciation, Depletion and Amortization
Depreciation will vary under the unit-of-production (UOP) method as a result of changes in sales volumes and the related UOP rates at our mining and oil and gas operations. Consolidated depreciation, depletion and amortization totaled
$0.9 billion
in both the third quarters of 2014 and 2013,
$2.9 billion
for
the
first nine months of
2014
and
$1.8 billion
for the
first nine months of
2013
. Higher depreciation, depletion and amortization in the
first nine months of
2014
was primarily associated with a full nine months of expense for our acquired oil and gas operations in 2014, compared with the four months in 2013.
Impairment of Oil and Gas Properties
Under the full cost accounting rules, a "ceiling test" is conducted each quarter to review the carrying value of the oil and gas properties for impairment. At September 30, 2014, the net capitalized costs with respect to FM O&G's U.S. oil and gas properties exceeded the related ceiling, which resulted in the recognition of an impairment charge of
$308 million
(
$192 million
to net income attributable to common stockholders), reflecting higher capitalized costs and the lower twelve-month average of the first-day-of-the-month historical reference oil price at September 30, 2014. Refer to Note 1 for further discussion.
Selling, General and Administrative Expenses
Consolidated selling, general and administrative expenses totaled
$158 million
in both the third quarters of
2014
and
2013
, and
$457 million
for both the
first nine months of
2014
and
2013
. Excluding amounts for our oil and gas operations, which totaled
$171 million
for the
first nine months of
2014
and
$65 million
for the four months from June 1, 2013, to September 30, 2013, selling, general and administrative expenses were lower in the
first nine months of
2014
, primarily because of transaction costs incurred during 2013 associated with the oil and gas acquisitions. Consolidated selling, general and administrative expenses were net of capitalized general and administrative expense at our oil and gas operations totaling $37 million in
third-quarter
2014
, $27 million in
third-quarter
2013
, $111 million for the
first nine months of
2014
and $35 million for the four months from June 1, 2013, to September 30, 2013.
Mining Exploration and Research Expenses
Consolidated exploration and research expenses for our mining operations decreased to
$29 million
in
third-quarter
2014
and
$93 million
for the
first nine months of
2014
, compared with
$57 million
in
third-quarter
2013
and
$173 million
for the
first nine months of
2013
. We are actively conducting exploration activities near our existing mines with a focus on opportunities to expand reserves and resources to support development of additional future production capacity in the large mineral districts where we currently operate. Exploration results continue to indicate opportunities for what we believe could be significant future potential reserve additions in North and South America, and in the Tenke minerals district. The drilling data in North America also continue to indicate the potential for significantly expanded sulfide production. Drilling results and exploration modeling in North America have identified large scale potential sulfide resources in the Morenci and Safford/Lone Star districts, providing a long-term pipeline for future growth in reserves and production capacity in an established minerals district.
For the year
2014
, mining exploration and research expenditures are expected to approximate
$130 million
, including
$100 million
for mining exploration.
Under the full cost method of accounting, exploration costs for our oil and gas operations are capitalized to oil and gas properties.
42
Environmental Obligations and Shutdown Costs
Environmental obligation costs reflect net revisions to our long-term environmental obligations, which will vary from period to period because of changes to environmental laws and regulations, the settlement of environmental matters and/or circumstances affecting our operations that could result in significant changes in our estimates. Shutdown costs include care and maintenance costs and any litigation, remediation or related expenditures associated with closed facilities or operations. Net charges (credits) for environmental obligations and shutdown costs totaled
$18 million
in
third-quarter
2014
and
$100 million
for the
first nine months of
2014
, compared with
$(8) million
in
third-quarter
2013
and
$23 million
for the
first nine months of
2013
. Refer to "Contingencies" for further discussion of environmental obligations and litigation matters associated with closed facilities or operations.
Net Gain on Sales of Assets
Net gain on sales of assets totaled
$46 million
(
$31 million
to net income attributable to common stockholders) for the third quarter and first nine months of 2014, primarily related to the sale of a metals injection molding plant.
Interest Expense, Net
Consolidated interest expense (excluding capitalized interest) totaled
$212 million
in
third-quarter
2014
,
$661 million
for the
first nine months of
2014
,
$223 million
in
third-quarter
2013
and
$465 million
for the
first nine months of
2013
. Increased interest expense for the first nine months of 2014 was primarily associated with acquisition-related debt and assumed debt of PXP.
Capitalized interest is related to the level of expenditures for our development projects and average interest rates on our borrowings, and totaled
$54 million
in
third-quarter
2014
and
$178 million
for the
first nine months of
2014
, compared with
$61 million
in
third-quarter
2013
and
$114 million
for the
first nine months of
2013
. Refer to "Operations" and “Capital Resources and Liquidity - Investing Activities” for further discussion of current development projects.
Net Gain (Loss) on Early Extinguishment of Debt
Net gain (loss) on early extinguishment of debt totaled
$58 million
in the third quarter and
$63 million
for the
first nine months of
2014
, primarily related to the redemption of senior notes and
$(45) million
for the
first nine months of
2013
related to the termination of the bridge loan facilities for the oil and gas acquisitions.
Gain on Investment in McMoRan Exploration Co. (MMR)
During the
first nine months of
2013
, we recorded a gain totaling $128 million related to the carrying value of our preferred stock investment in and the subsequent acquisition of MMR. Refer to Note 2 in our annual report on Form 10-K for the year ended December 31, 2013.
Provision for Income Taxes
Following is a summary of the approximate amounts used in the calculation of our consolidated provision for income taxes for the
first nine months of
2014
and
2013
(in millions, except percentages):
|
Nine Months Ended
|
Nine Months Ended
|
|||||||||||||||||||
|
September 30, 2014
|
September 30, 2013
|
|||||||||||||||||||
|
Income
a
|
Effective
Tax Rate
|
Income Tax Provision
|
Income
a
|
Effective
Tax Rate
|
Income Tax
(Provision) Benefit |
|||||||||||||||
|
U.S.
|
$
|
1,165
|
|
28%
|
$
|
(321
|
)
|
b
|
$
|
1,007
|
|
26%
|
$
|
(259
|
)
|
|||||
|
South America
|
1,014
|
|
40%
|
(409
|
)
|
c
|
1,325
|
|
36%
|
(472
|
)
|
|||||||||
|
Indonesia
|
397
|
|
42%
|
(166
|
)
|
622
|
|
46%
|
(289
|
)
|
||||||||||
|
Africa
|
305
|
|
30%
|
(93
|
)
|
320
|
|
31%
|
(99
|
)
|
||||||||||
|
Eliminations and other
|
143
|
|
N/A
|
(14
|
)
|
172
|
|
N/A
|
(31
|
)
|
||||||||||
|
Annualized rate adjustment
d
|
—
|
|
N/A
|
(31
|
)
|
—
|
|
N/A
|
—
|
|
||||||||||
|
3,024
|
|
34%
|
(1,034
|
)
|
3,446
|
|
33%
|
(1,150
|
)
|
|||||||||||
|
Adjustments
|
—
|
|
N/A
|
—
|
|
—
|
|
N/A
|
183
|
|
e
|
|||||||||
|
Consolidated FCX
|
$
|
3,024
|
|
34%
|
f
|
$
|
(1,034
|
)
|
$
|
3,446
|
|
28%
|
$
|
(967
|
)
|
|||||
|
a.
|
Represents income by geographic location before income taxes and equity in affiliated companies’ net earnings.
|
|
b.
|
Includes a
$62 million
charge for deferred taxes recorded in connection with the allocation of goodwill to the sale of Eagle Ford properties.
|
43
|
c.
|
Includes a $54 million charge related to changes in Chilean tax rules.
|
|
d.
|
In accordance with applicable accounting rules, we adjust our interim provision for income taxes equal to our estimated annualized tax rate.
|
|
e.
|
Reflects net reductions in our deferred tax liabilities and deferred tax asset valuation allowances resulting from the oil and gas acquisitions.
|
|
f.
|
Our consolidated effective income tax rate is a function of the combined effective tax rates for the jurisdictions in which we conduct operations. Accordingly, variations in the relative proportions of jurisdictional income result in fluctuations to our consolidated effective income tax rate. Assuming average prices of
$3.00
per pound for copper,
$1,250
per ounce for gold,
$10
per pound for molybdenum and Brent crude oil of
$90
per barrel for
fourth-quarter
2014
and achievement of current sales volume and cost estimates, we estimate that our consolidated effective tax rate will approximate
34 percent
for the year
2014
.
|
OPERATIONS
North America Copper Mines
We operate seven open-pit copper mines in North America – Morenci, Bagdad, Safford, Sierrita and Miami in Arizona, and Chino and Tyrone in New Mexico. All of the North America mining operations are wholly owned, except for Morenci. We record our 85 percent joint venture interest in Morenci using the proportionate consolidation method.
The North America copper mines include open-pit mining, sulfide ore concentrating, leaching and solution extraction/electrowinning (SX/EW) operations. A majority of the copper produced at our North America copper mines is cast into copper rod by our Rod & Refining segment. The remainder of our North America copper sales is in the form of copper cathode or copper concentrate, a portion of which is shipped to Atlantic Copper (our wholly owned copper smelter). Molybdenum concentrate is also produced by certain of our North America copper mines.
Operating and Development Activities.
We have increased production from our North America copper mines by approximately 25 percent over the past five years and continue to evaluate a number of opportunities to invest in additional production capacity following positive exploration results. Future investments will be undertaken based on the results of economic and technical feasibility studies and market conditions.
Morenci Mill Expansion.
The mill expansion project commenced operations in May 2014 and is expected to reach full rates by year-end 2014. The project targets average incremental annual production of approximately 225 million pounds of copper (an approximate 40 percent increase from 2013) through an increase in milling rates from 50,000 metric tons of ore per day to approximately 115,000 metric tons of ore per day. During third-quarter 2014, Morenci's mill rates averaged 77,900 metric tons per day. At full rates, Morenci's copper production is expected to average over 900 million pounds per year over the next five years.
Construction of the expanded Morenci milling facility is substantially complete. Remaining items include completion of the molybdenum circuit, which would add capacity of approximately 9 million pounds of molybdenum per year, and the construction of an expanded tailings storage facility, which is expected to be completed in 2015. As of
September 30, 2014
,
$1.5 billion
had been incurred for this project (
$0.5 billion
during the first nine months of 2014), with approximately
$0.1 billion
remaining to be incurred.
44
Operating Data.
Following is summary operating data for the North America copper mines for the
third quarters
and
first nine months of
2014
and
2013
:
|
Three Months Ended
|
Nine Months Ended
|
||||||||||||||
|
September 30,
|
September 30,
|
||||||||||||||
|
|
2014
|
2013
|
2014
|
2013
|
|||||||||||
|
Operating Data, Net of Joint Venture Interest
|
|
|
|||||||||||||
|
Copper
(recoverable)
|
|
|
|||||||||||||
|
Production (millions of pounds)
|
423
|
|
354
|
|
1,203
|
|
1,046
|
|
|||||||
|
Sales, excluding purchases (millions of pounds)
|
436
|
|
363
|
|
1,230
|
|
1,088
|
|
|||||||
|
Average realized price per pound
|
$
|
3.17
|
|
$
|
3.27
|
|
$
|
3.19
|
|
$
|
3.37
|
|
|||
|
Molybdenum
(millions of recoverable pounds)
|
|
|
|||||||||||||
|
Production
a
|
8
|
|
9
|
|
25
|
|
26
|
|
|||||||
|
100% Operating Data
|
|
|
|||||||||||||
|
SX/EW operations
|
|
|
|||||||||||||
|
Leach ore placed in stockpiles (metric tons per day)
|
1,003,900
|
|
993,100
|
|
1,010,600
|
|
1,015,400
|
|
|||||||
|
Average copper ore grade (percent)
|
0.25
|
|
0.22
|
|
0.25
|
|
0.22
|
|
|||||||
|
Copper production (millions of recoverable pounds)
|
244
|
|
216
|
|
707
|
|
651
|
|
|||||||
|
Mill operations
|
|
|
|||||||||||||
|
Ore milled (metric tons per day)
|
278,000
|
|
247,400
|
|
264,500
|
|
246,300
|
|
|||||||
|
Average ore grade (percent):
|
|
||||||||||||||
|
Copper
|
0.44
|
|
0.38
|
|
0.43
|
|
0.39
|
|
|||||||
|
Molybdenum
|
0.03
|
|
0.03
|
|
0.03
|
|
0.03
|
|
|||||||
|
Copper recovery rate (percent)
|
87.5
|
|
86.3
|
|
85.5
|
|
84.6
|
|
|||||||
|
Copper production (millions of recoverable pounds)
|
211
|
|
163
|
|
581
|
|
469
|
|
|||||||
|
a.
|
Refer to "Consolidated Results" for our consolidated molybdenum sales volumes, which include sales of molybdenum produced at the North America copper mines.
|
Copper sales volumes from our North America copper mines increased to
436 million
pounds in
third-quarter
2014
and
1.2 billion
pounds for the
first nine months of
2014
, compared with
363 million
pounds in
third-quarter
2013
and
1.1 billion
pounds for the
first nine months of
2013
, reflecting higher mining and milling rates at Morenci and higher ore grades at Chino.
Copper sales from North America are expected to approximate
1.7 billion
pounds for the year
2014
, compared with
1.4 billion
pounds in
2013
. North America copper production is expected to continue to increase for the year 2015 as a result of higher mill rates from the Morenci expansion. Refer to "Outlook" for projected molybdenum sales volumes.
Unit Net Cash Costs.
Unit net cash costs per pound of copper is a measure intended to provide investors with information about the cash-generating capacity of our mining operations expressed on a basis relating to the primary metal product for our respective operations. We use this measure for the same purpose and for monitoring operating performance by our mining operations. This information differs from measures of performance determined in accordance with U.S. GAAP and should not be considered in isolation or as a substitute for measures of performance determined in accordance with U.S. GAAP. This measure is presented by other metals mining companies, although our measure may not be comparable to similarly titled measures reported by other companies.
45
Gross Profit per Pound of Copper and Molybdenum
The following tables summarize unit net cash costs and gross profit per pound at our North America copper mines for the
third quarters
and
first nine months of
2014
and
2013
. Refer to “Product Revenues and Production Costs” for an explanation of the “by-product” and “co-product” methods and a reconciliation of unit net cash costs per pound to production and delivery costs applicable to sales reported in our consolidated financial statements.
|
Three Months Ended
|
Three Months Ended
|
|||||||||||||||||||||||
|
|
September 30, 2014
|
September 30, 2013
|
||||||||||||||||||||||
|
|
By- Product Method
|
Co-Product Method
|
By- Product Method
|
Co-Product Method
|
||||||||||||||||||||
|
Copper
|
Molyb-
denum
a
|
Copper
|
Molyb-
denum a |
|||||||||||||||||||||
|
Revenues, excluding adjustments
|
$
|
3.17
|
|
$
|
3.17
|
|
$
|
13.55
|
|
$
|
3.27
|
|
$
|
3.27
|
|
$
|
10.24
|
|
||||||
|
Site production and delivery, before net noncash and other costs shown below
|
1.83
|
|
1.79
|
|
3.17
|
|
2.00
|
|
1.94
|
|
4.01
|
|
||||||||||||
|
By-product credits
|
(0.26
|
)
|
—
|
|
—
|
|
(0.24
|
)
|
—
|
|
—
|
|
||||||||||||
|
Treatment charges
|
0.11
|
|
0.11
|
|
—
|
|
0.10
|
|
0.09
|
|
—
|
|
||||||||||||
|
Unit net cash costs
|
1.68
|
|
1.90
|
|
3.17
|
|
1.86
|
|
2.03
|
|
4.01
|
|
||||||||||||
|
Depreciation, depletion and amortization
|
0.30
|
|
0.30
|
|
0.17
|
|
0.27
|
|
0.27
|
|
0.24
|
|
||||||||||||
|
Noncash and other costs, net
|
0.11
|
|
0.10
|
|
0.03
|
|
0.08
|
|
0.07
|
|
0.03
|
|
||||||||||||
|
Total unit costs
|
2.09
|
|
2.30
|
|
3.37
|
|
2.21
|
|
2.37
|
|
4.28
|
|
||||||||||||
|
Revenue adjustments, primarily for pricing on prior period open sales
|
(0.02
|
)
|
(0.02
|
)
|
—
|
|
0.02
|
|
0.02
|
|
—
|
|
||||||||||||
|
Gross profit per pound
|
$
|
1.06
|
|
$
|
0.85
|
|
$
|
10.18
|
|
$
|
1.08
|
|
$
|
0.92
|
|
$
|
5.96
|
|
||||||
|
Copper sales (millions of recoverable pounds)
|
434
|
|
434
|
|
362
|
|
362
|
|
|
|||||||||||||||
|
Molybdenum sales (millions of recoverable pounds)
a
|
8
|
|
|
|
9
|
|
||||||||||||||||||
|
Nine Months Ended
|
Nine Months Ended
|
|||||||||||||||||||||||
|
|
September 30, 2014
|
September 30, 2013
|
||||||||||||||||||||||
|
|
By- Product Method
|
Co-Product Method
|
By- Product Method
|
Co-Product Method
|
||||||||||||||||||||
|
Copper
|
Molyb-
denum
a
|
Copper
|
Molyb-
denum
a
|
|||||||||||||||||||||
|
Revenues, excluding adjustments
|
$
|
3.19
|
|
$
|
3.19
|
|
$
|
11.93
|
|
$
|
3.37
|
|
$
|
3.37
|
|
$
|
11.03
|
|
||||||
|
Site production and delivery, before net noncash and other costs shown below
|
1.86
|
|
1.83
|
|
2.75
|
|
2.03
|
|
1.97
|
|
3.99
|
|
||||||||||||
|
By-product credits
|
(0.25
|
)
|
—
|
|
—
|
|
(0.25
|
)
|
—
|
|
—
|
|
||||||||||||
|
Treatment charges
|
0.11
|
|
0.11
|
|
—
|
|
0.10
|
|
0.10
|
|
—
|
|
||||||||||||
|
Unit net cash costs
|
1.72
|
|
1.94
|
|
2.75
|
|
1.88
|
|
2.07
|
|
3.99
|
|
||||||||||||
|
Depreciation, depletion and amortization
|
0.29
|
|
0.29
|
|
0.15
|
|
0.28
|
|
0.27
|
|
0.25
|
|
||||||||||||
|
Noncash and other costs, net
|
0.09
|
|
0.08
|
|
0.03
|
|
0.08
|
|
0.08
|
|
0.03
|
|
||||||||||||
|
Total unit costs
|
2.10
|
|
2.31
|
|
2.93
|
|
2.24
|
|
2.42
|
|
4.27
|
|
||||||||||||
|
Revenue adjustments, primarily for pricing on prior period open sales
|
(0.01
|
)
|
(0.01
|
)
|
—
|
|
—
|
|
—
|
|
—
|
|
||||||||||||
|
Gross profit per pound
|
$
|
1.08
|
|
$
|
0.87
|
|
$
|
9.00
|
|
$
|
1.13
|
|
$
|
0.95
|
|
$
|
6.76
|
|
||||||
|
Copper sales (millions of recoverable pounds)
|
1,224
|
|
1,224
|
|
1,084
|
|
1,084
|
|
|
|||||||||||||||
|
Molybdenum sales (millions of recoverable pounds)
a
|
25
|
|
|
26
|
|
|||||||||||||||||||
|
a.
|
Reflects sales of molybdenum produced by certain of the North America copper mines to our molybdenum sales company at market-based pricing.
|
46
Our North America copper mines have varying cost structures because of differences in ore grades and characteristics, processing costs, by-product credits and other factors. Average unit net cash costs (net of by-product credits) of
$1.68
per pound of copper in
third-quarter
2014
and
$1.72
per pound for the
first nine months of
2014
were lower than unit net cash costs of
$1.86
per pound in
third-quarter
2013
and
$1.88
per pound for the
first nine months of
2013
, primarily reflecting higher copper sales volumes.
Because certain assets are depreciated on a straight-line basis, North America's average unit depreciation rate may vary with asset additions and the level of copper production and sales.
Assuming achievement of current sales volume and cost estimates, and an average price of
$10
per pound of molybdenum for fourth-quarter
2014
, average unit net cash costs (net of by-product credits) for our North America copper mines are expected to approximate
$1.73
per pound of copper for the year
2014
, compared with
$1.87
per pound in
2013
. North America's unit net cash costs for fourth-quarter 2014 would change by approximately
$0.007
per pound for each
$2
per pound change in the average price of molybdenum.
South America Mining
We operate four copper mines in South America – Cerro Verde in Peru and El Abra, Candelaria and Ojos del Salado in Chile. We own a 53.56 percent interest in Cerro Verde, a 51 percent interest in El Abra, and an 80 percent interest in the Candelaria and Ojos del Salado mining complex. All operations in South America are consolidated in our financial statements.
South America mining includes open-pit and underground mining, sulfide ore concentrating, leaching and SX/EW operations. Production from our South America mines is sold as copper concentrate or copper cathode under long-term contracts. Our South America mines ship a portion of their copper concentrate inventories to Atlantic Copper. In addition to copper, the Candelaria and Ojos del Salado mines produce gold and silver, and the Cerro Verde mine produces molybdenum concentrates.
Sale Transaction.
In November 2014, we completed the sale of our 80 percent ownership interests in Candelaria/Ojos to Lundin for $1.8 billion in cash and contingent consideration of up to $0.2 billion. Contingent consideration is calculated as five percent of net copper revenues in any annual period over the next five years when the average copper price exceeds $4.00 per pound. Excluding contingent consideration, we estimate after-tax net proceeds from the transaction of approximately $1.5 billion.
As of December 31, 2013, we estimated that Candelaria and Ojos del Salado had consolidated recoverable proven and probable reserves totaling 4.0 billion pounds of copper and 1.1 million ounces of gold, determined using a long-term average price of $2.00 per pound for copper and $1,000 per ounce for gold. Consolidated production for the first nine months of 2014 totaled 246 million pounds of copper and 62 thousand ounces of gold.
The transaction has an effective date of June 30, 2014. We expect to record an after-tax net gain of approximately $450 million related to the transaction. Refer to Note 13 for further discussion.
Development Activities.
Cerro Verde Expansion.
Construction activities associated with a large-scale expansion at Cerro Verde are in progress. Detailed engineering and major procurement activities are complete and construction progress is approaching 40 percent completion. The project will expand the concentrator facilities from 120,000 metric tons of ore per day to 360,000 metric tons of ore per day and provide incremental annual production of approximately 600 million pounds of copper and 15 million pounds of molybdenum beginning in 2016. As of
September 30, 2014
,
$2.7 billion
had been incurred for this project (
$1.2 billion
during the first nine months of 2014), with approximately
$1.9 billion
remaining to be incurred.
El Abra Sulfide.
We continue to evaluate a potential large-scale milling operation at El Abra to process additional sulfide material and to achieve higher recoveries. Exploration results in recent years at El Abra indicate a significant sulfide resource, which could potentially support a major mill project. Future investments will be dependent on technical studies, economic factors and global copper market conditions.
47
Operating Data.
Following is summary operating data for our South America mining operations for the
third quarters
and
first nine months of
2014
and
2013
:
|
Three Months Ended
|
Nine Months Ended
|
||||||||||||||
|
September 30,
|
September 30,
|
||||||||||||||
|
|
2014
|
2013
|
2014
|
2013
|
|||||||||||
|
Copper
(recoverable)
|
|
|
|||||||||||||
|
Production (millions of pounds)
|
284
|
|
347
|
|
898
|
|
944
|
|
|||||||
|
Sales (millions of pounds)
|
271
|
|
323
|
|
888
|
|
923
|
|
|||||||
|
Average realized price per pound
|
$
|
3.10
|
|
$
|
3.30
|
|
$
|
3.12
|
|
$
|
3.30
|
|
|||
|
Gold
(recoverable)
|
|
|
|||||||||||||
|
Production (thousands of ounces)
|
20
|
|
30
|
|
62
|
|
70
|
|
|||||||
|
Sales (thousands of ounces)
|
16
|
|
26
|
|
59
|
|
68
|
|
|||||||
|
Average realized price per ounce
|
$
|
1,234
|
|
$
|
1,335
|
|
$
|
1,280
|
|
$
|
1,415
|
|
|||
|
Molybdenum
(millions of recoverable pounds)
|
|
|
|||||||||||||
|
Production
a
|
3
|
|
4
|
|
8
|
|
8
|
|
|||||||
|
SX/EW operations
|
|
|
|||||||||||||
|
Leach ore placed in stockpiles (metric tons per day)
|
269,600
|
|
287,500
|
|
279,300
|
|
276,600
|
|
|||||||
|
Average copper ore grade (percent)
|
0.50
|
|
0.48
|
|
0.50
|
|
0.49
|
|
|||||||
|
Copper production (millions of recoverable pounds)
|
122
|
|
110
|
|
370
|
|
329
|
|
|||||||
|
Mill operations
|
|
||||||||||||||
|
Ore milled (metric tons per day)
|
192,100
|
|
189,900
|
|
187,700
|
|
191,000
|
|
|||||||
|
Average ore grade:
|
|
||||||||||||||
|
Copper (percent)
|
0.50
|
|
0.71
|
|
0.55
|
|
0.62
|
|
|||||||
|
Gold (grams per metric ton)
|
0.09
|
|
0.14
|
|
0.10
|
|
0.11
|
|
|||||||
|
Molybdenum (percent)
|
0.02
|
|
0.03
|
|
0.02
|
|
0.02
|
|
|||||||
|
Copper recovery rate (percent)
|
86.9
|
|
90.5
|
|
88.6
|
|
90.4
|
|
|||||||
|
Copper production (millions of recoverable pounds)
|
162
|
|
237
|
|
528
|
|
615
|
|
|||||||
|
a.
|
Refer to "Consolidated Results" for our consolidated molybdenum sales volumes, which include sales of molybdenum produced at Cerro Verde.
|
Consolidated copper sales volumes from South America of
271 million
pounds in
third-quarter
2014
and
888 million
pounds for the
first nine months of
2014
were lower than third-quarter 2013 sales of
323 million
pounds and
923 million
pounds for the
first nine months of
2013
, primarily reflecting anticipated lower ore grades at Candelaria and Cerro Verde.
Sales from South America mining are expected to approximate
1.1 billion
pounds of copper for the year
2014
and exclude estimated fourth-quarter 2014 production from the Candelaria and Ojos del Salado mines (totaling approximately 80 million pounds of copper) because of the pending sale transaction. Refer to "Outlook" for projected gold and molybdenum sales volumes.
Unit Net Cash Costs.
Unit net cash costs per pound of copper is a measure intended to provide investors with information about the cash-generating capacity of our mining operations expressed on a basis relating to the primary metal product for our respective operations. We use this measure for the same purpose and for monitoring operating performance by our mining operations. This information differs from measures of performance determined in accordance with U.S. GAAP and should not be considered in isolation or as a substitute for measures of performance determined in accordance with U.S. GAAP. This measure is presented by other metals mining companies, although our measure may not be comparable to similarly titled measures reported by other companies.
48
Gross Profit per Pound of Copper
The following tables summarize unit net cash costs and gross profit per pound of copper at the South America mining operations for the
third quarters
and
first nine months of
2014
and
2013
. Unit net cash costs per pound of copper are reflected under the by-product and co-product methods as the South America mining operations also had small amounts of molybdenum, gold and silver sales. Refer to “Product Revenues and Production Costs” for an explanation of the “by-product” and “co-product” methods and a reconciliation of unit net cash costs per pound to production and delivery costs applicable to sales reported in our consolidated financial statements.
|
Three Months Ended
|
Three Months Ended
|
||||||||||||||
|
|
September 30, 2014
|
September 30, 2013
|
|||||||||||||
|
By-Product
Method
|
Co-Product
Method
|
By-Product
Method
|
Co-Product
Method
|
||||||||||||
|
Revenues, excluding adjustments
|
$
|
3.10
|
|
$
|
3.10
|
|
$
|
3.30
|
|
$
|
3.30
|
|
|||
|
Site production and delivery, before net noncash and other costs shown below
|
1.67
|
|
1.53
|
|
1.49
|
|
1.40
|
|
|||||||
|
By-product credits
|
(0.23
|
)
|
—
|
|
(0.22
|
)
|
—
|
|
|||||||
|
Treatment charges
|
0.16
|
|
0.16
|
|
0.16
|
|
0.16
|
|
|||||||
|
Unit net cash costs
|
1.60
|
|
1.69
|
|
1.43
|
|
1.56
|
|
|||||||
|
Depreciation, depletion and amortization
|
0.37
|
|
0.35
|
|
0.26
|
|
0.25
|
|
|||||||
|
Noncash and other costs, net
|
0.07
|
|
0.07
|
|
0.05
|
|
0.02
|
|
|||||||
|
Total unit costs
|
2.04
|
|
2.11
|
|
1.74
|
|
1.83
|
|
|||||||
|
Revenue adjustments, primarily for pricing on prior period open sales
|
(0.06
|
)
|
(0.06
|
)
|
0.15
|
|
0.15
|
|
|||||||
|
Gross profit per pound
|
$
|
1.00
|
|
$
|
0.93
|
|
$
|
1.71
|
|
$
|
1.62
|
|
|||
|
Copper sales (millions of recoverable pounds)
|
271
|
|
271
|
|
323
|
|
323
|
|
|||||||
|
Nine Months Ended
|
Nine Months Ended
|
||||||||||||||
|
|
September 30, 2014
|
September 30, 2013
|
|||||||||||||
|
By-Product
Method
|
Co-Product
Method
|
By-Product
Method
|
Co-Product
Method
|
||||||||||||
|
Revenues, excluding adjustments
|
$
|
3.12
|
|
$
|
3.12
|
|
$
|
3.30
|
|
$
|
3.30
|
|
|||
|
Site production and delivery, before net noncash and other costs shown below
|
1.61
|
|
1.48
|
|
1.57
|
|
1.46
|
|
|||||||
|
By-product credits
|
(0.24
|
)
|
—
|
|
(0.25
|
)
|
—
|
|
|||||||
|
Treatment charges
|
0.17
|
|
0.17
|
|
0.17
|
|
0.17
|
|
|||||||
|
Unit net cash costs
|
1.54
|
|
1.65
|
|
1.49
|
|
1.63
|
|
|||||||
|
Depreciation, depletion and amortization
|
0.32
|
|
0.30
|
|
0.26
|
|
0.24
|
|
|||||||
|
Noncash and other costs, net
|
0.06
|
|
0.08
|
|
0.04
|
|
0.01
|
|
|||||||
|
Total unit costs
|
1.92
|
|
2.03
|
|
1.79
|
|
1.88
|
|
|||||||
|
Revenue adjustments, primarily for pricing on prior period open sales
|
(0.07
|
)
|
(0.07
|
)
|
(0.04
|
)
|
(0.04
|
)
|
|||||||
|
Gross profit per pound
|
$
|
1.13
|
|
$
|
1.02
|
|
$
|
1.47
|
|
$
|
1.38
|
|
|||
|
Copper sales (millions of recoverable pounds)
|
888
|
|
888
|
|
923
|
|
923
|
|
|||||||
Our South America mines have varying cost structures because of differences in ore grades and characteristics, processing costs, by-product credits and other factors. Average unit net cash costs (net of by-product credits) of
$1.60
per pound of copper in
third-quarter
2014
and
$1.54
per pound for the
first nine months of
2014
, were higher than unit net cash costs of
$1.43
per pound in
third-quarter
2013
and
$1.49
per pound for the
first nine months of
2013
, primarily reflecting lower sales volumes.
Because certain assets are depreciated on a straight-line basis, South America's unit depreciation rate may vary with asset additions and the level of copper production and sales.
Revenue adjustments primarily result from changes in prices on provisionally priced copper sales recognized in prior periods. Refer to “Consolidated Results - Revenues” for further discussion of adjustments to prior period provisionally priced copper sales.
49
Assuming achievement of current sales volume and cost estimates, and average prices of
$1,250
per ounce of gold and
$10
per pound of molybdenum for fourth-quarter
2014
, we estimate that average unit net cash costs (net of by-product credits) for our South America mining operations would approximate
$1.56
per pound of copper for the year
2014
, compared with
$1.43
per pound in
2013
.
Indonesia Mining
Indonesia mining includes PT-FI’s Grasberg minerals district. We own 90.64 percent of PT-FI, including 9.36 percent owned through our wholly owned subsidiary, PT Indocopper Investama.
PT-FI operates a proportionately consolidated joint venture, which produces copper concentrates that contain significant quantities of gold and silver. Substantially all of PT-FI’s copper concentrates are sold under long-term contracts, of which approximately one-half is sold to Atlantic Copper and PT Smelting and the remainder to third-party customers.
We have established certain unincorporated joint ventures with Rio Tinto plc (Rio Tinto), under which Rio Tinto has a 40 percent interest in certain assets and future production exceeding specified annual amounts of copper, gold and silver. Refer to Note 3 in our annual report on Form 10-K for the year ended
December 31, 2013
, for discussion of our joint ventures with Rio Tinto.
Refer to "Risk Factors" contained in Part II, Item 1A of this quarterly report and in Part I, Item 1A of our annual report on Form 10-K for the year ended
December 31, 2013
, for discussions of risks associated with operations in Indonesia.
Regulatory Matters.
On July 25, 2014, PT-FI entered into a Memorandum of Understanding (MOU) with the Indonesian government under which PT-FI and the government agreed to negotiate an amended Contract of Work (COW) to address provisions related to the size of PT-FI’s concession area, royalties and taxes, domestic processing and refining, divestment, local content, and continuation of operations post-2021. Execution of the MOU enabled the resumption of concentrate exports in August 2014, which had been suspended since January 2014. In addition, PT-FI is required to apply for renewal of export permits at six-month intervals, with the next renewal date in January 2015.
Under the MOU, provisions to be addressed in the negotiation of an amended COW include provisions for the development of new copper smelting and refining capacity in Indonesia, provisions for divestment to the Indonesian government and/or Indonesian nationals of up to a 30 percent interest (an additional 20.64 percent interest) in PT-FI at fair value, and continuation of operations from 2022 through 2041. The MOU provides that negotiations for an amended COW will take into consideration PT-FI’s need for assurance of legal and fiscal terms post-2021 for PT-FI to continue with its large-scale investment program for the development of its underground reserves. The revisions to the COW are expected to result in additional costs for our Indonesian operations. PT-FI is engaged in discussions with the Indonesian government regarding an amended COW.
Effective with the signing of the MOU, PT-FI provided a $115 million assurance bond to support its commitment for smelter development, agreed to increase royalties to 4.0 percent for copper and 3.75 percent for gold from the previous rates of 3.5 percent for copper and 1.0 percent for gold, and to pay export duties set forth in a new regulation. The Indonesian government revised its January 2014 regulations regarding export duties to incorporate reduced rates for copper concentrate exports for companies engaged in smelter development. The revised regulations provide for duties on copper concentrate exports during smelter development initially at 7.5 percent, declining to 5.0 percent when development progress exceeds 7.5 percent and is eliminated when development progress exceeds 30 percent. During third-quarter 2014, PT-FI paid export duties of $42 million and increased royalties of $20 million.
Under the MOU, no terms of the COW other than those relating to the export duties, the smelter bond and royalties described above will be changed until the completion of an amended COW.
Operating and Development Activities.
We have several projects in progress in the Grasberg minerals district related to the development of the large-scale, long-lived, high-grade underground ore bodies. In aggregate, these underground ore bodies are expected to ramp up over several years to process approximately 240,000 metric tons of ore per day following the transition from the Grasberg open pit, currently anticipated to occur in 2017. Development of the Grasberg Block Cave and Deep Mill Level Zone (DMLZ) underground mines is advancing to enable DMLZ to commence production in 2015 and the Grasberg Block Cave mine to commence production in
50
2017. Over the next five years, estimated aggregate capital spending on these projects is currently expected to average $0.9 billion per year ($0.7 billion per year net to PT-FI). Considering the long-term nature and large size of these projects, actual costs could vary from these estimates. Additionally, PT-FI may reduce or defer these activities pending resolution of negotiations for an amended COW.
The following provides additional information on the continued development of the Common Infrastructure project, the Grasberg Block Cave underground mine and development of the DMLZ ore body that lies below the Deep Ore Zone (DOZ) underground mine.
Common Infrastructure and Grasberg Block Cave Mine.
In 2004, PT-FI commenced its Common Infrastructure project to provide access to its large undeveloped underground ore bodies located in the Grasberg minerals district through a tunnel system located approximately 400 meters deeper than its existing underground tunnel system. In addition to providing access to our underground ore bodies, the tunnel system will enable PT-FI to conduct future exploration in prospective areas associated with currently identified ore bodies. The tunnel system was completed to the Big Gossan terminal, and the Big Gossan mine was brought into production in 2010. Development of the DMLZ and Grasberg Block Cave underground mines is advancing using the Common Infrastructure project tunnels as access.
The Grasberg Block Cave underground mine accounts for more than 40 percent of our recoverable proven and probable reserves in Indonesia. Production at the Grasberg Block Cave mine is expected to commence in 2017, at the end of mining the Grasberg open pit. Targeted production rates once the Grasberg Block Cave mining operation reaches full capacity are expected to approximate 160,000 metric tons of ore per day.
Aggregate mine development capital for the Grasberg Block Cave mine and associated Common Infrastructure is expected to approximate
$5.2 billion
(incurred between 2008 and 2021), with PT-FI’s share totaling approximately
$4.6 billion
. Aggregate project costs totaling
$1.7 billion
have been incurred through
September 30, 2014
(
$0.3 billion
during the
first nine months of
2014
).
DMLZ.
The DMLZ ore body lies below the DOZ mine at the 2,590-meter elevation and represents the downward continuation of mineralization in the Ertsberg East Skarn system and neighboring Ertsberg porphyry. We plan to mine the ore body using a block-cave method with production beginning in 2015. Targeted production rates once the DMLZ mining operation reaches full capacity are expected to approximate 80,000 metric tons of ore per day. Drilling efforts continue to determine the extent of this ore body. Aggregate mine development capital costs for the DMLZ mine are expected to approximate
$2.6 billion
(incurred between 2009 and 2020), with PT-FI’s share totaling approximately
$1.5 billion
. Aggregate project costs totaling
$1.1 billion
have been incurred through
September 30, 2014
(
$0.2 billion
during the
first nine months of
2014
).
51
Operating Data.
Following is summary operating data for our Indonesia mining operations for the
third quarters
and
first nine months of
2014
and
2013
:
|
Three Months Ended
|
Nine Months Ended
|
||||||||||||||
|
September 30,
|
September 30,
|
||||||||||||||
|
|
2014
|
2013
|
2014
|
2013
|
|||||||||||
|
Operating Data, Net of Joint Venture Interest
|
|
|
|||||||||||||
|
Copper
(recoverable)
|
|
|
|||||||||||||
|
Production (millions of pounds)
|
203
|
|
253
|
|
465
|
|
611
|
|
|||||||
|
Sales (millions of pounds)
|
258
|
|
237
|
|
484
|
|
593
|
|
|||||||
|
Average realized price per pound
|
$
|
3.05
|
|
$
|
3.30
|
|
$
|
3.09
|
|
$
|
3.27
|
|
|||
|
Gold
(recoverable)
|
|
|
|||||||||||||
|
Production (thousands of ounces)
|
426
|
|
297
|
|
776
|
|
640
|
|
|||||||
|
Sales (thousands of ounces)
|
505
|
|
278
|
|
802
|
|
620
|
|
|||||||
|
Average realized price per ounce
|
$
|
1,219
|
|
$
|
1,330
|
|
$
|
1,248
|
|
$
|
1,393
|
|
|||
|
100% Operating Data
|
|
|
|||||||||||||
|
Ore milled (metric tons per day):
a
|
|
|
|||||||||||||
|
Grasberg open pit
|
78,100
|
|
149,000
|
|
64,900
|
|
122,700
|
|
|||||||
|
DOZ underground mine
b
|
57,600
|
|
47,600
|
|
52,800
|
|
45,900
|
|
|||||||
|
Big Gossan underground mine
c
|
—
|
|
1,600
|
|
1,200
|
|
2,000
|
|
|||||||
|
Total
|
135,700
|
|
198,200
|
|
118,900
|
|
170,600
|
|
|||||||
|
Average ore grades:
|
|
|
|||||||||||||
|
Copper (percent)
|
0.88
|
|
0.74
|
|
0.78
|
|
0.71
|
|
|||||||
|
Gold (grams per metric ton)
|
1.28
|
|
0.65
|
|
0.94
|
|
0.57
|
|
|||||||
|
Recovery rates (percent):
|
|
||||||||||||||
|
Copper
|
91.4
|
|
89.7
|
|
89.9
|
|
89.1
|
|
|||||||
|
Gold
|
84.6
|
|
80.3
|
|
81.5
|
|
76.3
|
|
|||||||
|
Production (recoverable):
|
|
||||||||||||||
|
Copper (millions of pounds)
|
207
|
|
253
|
|
476
|
|
611
|
|
|||||||
|
Gold (thousands of ounces)
|
426
|
|
297
|
|
777
|
|
640
|
|
|||||||
|
a.
|
Amounts represent the approximate average daily throughput processed at PT-FI’s mill facilities from each producing mine.
|
|
b.
|
Production from the DOZ underground mine is expected to ramp up to the design rate of 80,000 metric tons of ore per day in third-quarter 2015.
|
|
c.
|
Production from the Big Gossan underground mine is expected to ramp up to 7,000 metric tons of ore per day in 2017.
|
Indonesia's sales volumes increased to
258 million
pounds of copper and
505 thousand
ounces of gold for
third-quarter
2014
, compared with
237 million
pounds of copper and
278 thousand
ounces of gold for
third-quarter
2013
, primarily reflecting higher ore grades. Indonesia's sales volumes totaled
484 million
pounds of copper and
802 thousand
ounces of gold for the
first nine months of
2014
, compared with
593 million
pounds of copper and
620 thousand
ounces of gold for the
first nine months of
2013
, reflecting lower mill throughput resulting from the export ban, offset by higher gold ore grades.
At the Grasberg mine, the sequencing of mining areas with varying ore grades causes fluctuations in quarterly and annual production of copper and gold. Consolidated sales volumes from our Indonesia mining operations are expected to approximate
0.7 billion
pounds of copper and
1.15 million
ounces of gold for
2014
, compared with
0.9 billion
pounds of copper and
1.1 million
ounces of gold in
2013
. Sales from Indonesia mining are expected to increase through 2016 as PT-FI gains access to higher grade ore.
On September 27, 2014, four Grasberg workers were fatally injured when a haul truck collided with a light
vehicle near the Grasberg open-pit operations. Operations in the Grasberg open pit were temporarily suspended in
order to complete internal and government investigations regarding the accident. On October 13, 2014, Indonesian
authorities approved the resumption of operations after issuing recommendations on traffic control procedures
that have been implemented by PT-FI. Workforce attendance in several operating areas reflect normal levels.
However, a large percentage of Grasberg open-pit operators have not reported to their scheduled shifts resulting in
reduced production from the open pit during October. These actions conflict with agreed policies and processes in
the Collective Labor Agreement (CLA), and PT-FI is working with union leadership regarding this work stoppage to
52
resume normal operations as soon as possible.
On October 27, 2014, PT-FI received notice from union leadership indicating its intention to conduct a 30-day strike beginning on November 6, 2014. Following constructive dialogue between PT-FI and union leadership, union leadership advised PT-FI on October 31, 2014, that all strike actions had been canceled.
Unit Net Cash Costs.
Unit net cash costs per pound of copper is a measure intended to provide investors with information about the cash-generating capacity of our mining operations expressed on a basis relating to the primary metal product for our respective operations. We use this measure for the same purpose and for monitoring operating performance by our mining operations. This information differs from measures of performance determined in accordance with U.S. GAAP and should not be considered in isolation or as a substitute for measures of performance determined in accordance with U.S. GAAP. This measure is presented by other metals mining companies, although our measure may not be comparable to similarly titled measures reported by other companies.
Gross Profit per Pound of Copper and per Ounce of Gold
The following tables summarize the unit net cash costs and gross profit per pound of copper and per ounce of gold at our Indonesia mining operations for the
third quarters
and
first nine months of
2014
and
2013
. Refer to “Production Revenues and Production Costs” for an explanation of “by-product” and “co-product” methods and a reconciliation of unit net cash costs per pound to production and delivery costs applicable to sales reported in our consolidated financial statements.
|
Three Months Ended
|
Three Months Ended
|
||||||||||||||||||||||
|
|
September 30, 2014
|
September 30, 2013
|
|||||||||||||||||||||
|
|
By-Product Method
|
Co-Product Method
|
By-Product Method
|
Co-Product Method
|
|||||||||||||||||||
|
|
Copper
|
Gold
|
Copper
|
Gold
|
|||||||||||||||||||
|
Revenues, excluding adjustments
|
$
|
3.05
|
|
$
|
3.05
|
|
$
|
1,219
|
|
$
|
3.30
|
|
$
|
3.30
|
|
$
|
1,330
|
|
|||||
|
Site production and delivery, before net noncash and other costs shown below
|
2.42
|
|
1.34
|
|
537
|
|
2.30
|
|
1.54
|
|
621
|
|
|||||||||||
|
Gold and silver credits
|
(2.44
|
)
|
—
|
|
—
|
|
(1.65
|
)
|
—
|
|
—
|
|
|||||||||||
|
Treatment charges
|
0.25
|
|
0.14
|
|
56
|
|
0.23
|
|
0.15
|
|
62
|
|
|||||||||||
|
Export duties
|
0.16
|
|
0.09
|
|
36
|
|
—
|
|
—
|
|
—
|
|
|||||||||||
|
Royalty on metals
|
0.21
|
|
a
|
0.12
|
|
45
|
|
0.11
|
|
0.08
|
|
31
|
|
||||||||||
|
Unit net cash costs
|
0.60
|
|
1.69
|
|
674
|
|
0.99
|
|
1.77
|
|
714
|
|
|||||||||||
|
Depreciation and amortization
|
0.35
|
|
0.20
|
|
79
|
|
0.25
|
|
0.17
|
|
68
|
|
|||||||||||
|
Noncash and other costs, net
|
0.11
|
|
0.06
|
|
24
|
|
0.15
|
|
0.10
|
|
40
|
|
|||||||||||
|
Total unit costs
|
1.06
|
|
1.95
|
|
777
|
|
1.39
|
|
2.04
|
|
822
|
|
|||||||||||
|
Revenue adjustments, primarily for pricing on prior period open sales
|
(0.01
|
)
|
(0.01
|
)
|
(1
|
)
|
0.08
|
|
0.08
|
|
17
|
|
|||||||||||
|
PT Smelting intercompany loss
|
(0.19
|
)
|
(0.10
|
)
|
(42
|
)
|
(0.15
|
)
|
(0.10
|
)
|
(41
|
)
|
|||||||||||
|
Gross profit per pound/ounce
|
$
|
1.79
|
|
$
|
0.99
|
|
$
|
399
|
|
$
|
1.84
|
|
$
|
1.24
|
|
$
|
484
|
|
|||||
|
Copper sales (millions of recoverable pounds)
|
258
|
|
258
|
|
|
237
|
|
237
|
|
|
|||||||||||||
|
Gold sales (thousands of recoverable ounces)
|
|
|
505
|
|
|
|
278
|
|
|||||||||||||||
|
a.
|
Includes $0.08 per pound of copper associated with increased royalty rates.
|
53
|
Nine Months Ended
|
Nine Months Ended
|
||||||||||||||||||||||
|
|
September 30, 2014
|
September 30, 2013
|
|||||||||||||||||||||
|
|
By-Product Method
|
Co-Product Method
|
By-Product Method
|
Co-Product Method
|
|||||||||||||||||||
|
|
Copper
|
Gold
|
Copper
|
Gold
|
|||||||||||||||||||
|
Revenues, excluding adjustments
|
$
|
3.09
|
|
$
|
3.09
|
|
$
|
1,248
|
|
$
|
3.27
|
|
$
|
3.27
|
|
$
|
1,393
|
|
|||||
|
Site production and delivery, before net noncash and other costs shown below
|
2.90
|
|
1.72
|
|
694
|
|
2.74
|
|
1.87
|
|
795
|
|
|||||||||||
|
Gold and silver credits
|
(2.16
|
)
|
—
|
|
—
|
|
(1.52
|
)
|
—
|
|
—
|
|
|||||||||||
|
Treatment charges
|
0.25
|
|
0.15
|
|
60
|
|
0.23
|
|
0.16
|
|
67
|
|
|||||||||||
|
Export duties
|
0.09
|
|
0.05
|
|
21
|
|
—
|
|
—
|
|
—
|
|
|||||||||||
|
Royalty on metals
|
0.16
|
|
a
|
0.09
|
|
39
|
|
0.12
|
|
0.08
|
|
36
|
|
||||||||||
|
Unit net cash costs
|
1.24
|
|
2.01
|
|
814
|
|
1.57
|
|
2.11
|
|
898
|
|
|||||||||||
|
Depreciation and amortization
|
0.40
|
|
0.24
|
|
96
|
|
0.29
|
|
0.20
|
|
85
|
|
|||||||||||
|
Noncash and other costs, net
|
0.41
|
|
b
|
0.25
|
|
98
|
|
0.21
|
|
0.14
|
|
60
|
|
||||||||||
|
Total unit costs
|
2.05
|
|
2.50
|
|
1,008
|
|
2.07
|
|
2.45
|
|
1,043
|
|
|||||||||||
|
Revenue adjustments, primarily for pricing on prior period open sales
|
(0.11
|
)
|
(0.11
|
)
|
22
|
|
—
|
|
—
|
|
(2
|
)
|
|||||||||||
|
PT Smelting intercompany profit
|
0.02
|
|
0.01
|
|
5
|
|
0.01
|
|
0.01
|
|
1
|
|
|||||||||||
|
Gross profit per pound/ounce
|
$
|
0.95
|
|
$
|
0.49
|
|
$
|
267
|
|
$
|
1.21
|
|
$
|
0.83
|
|
$
|
349
|
|
|||||
|
Copper sales (millions of recoverable pounds)
|
484
|
|
484
|
|
|
593
|
|
593
|
|
|
|||||||||||||
|
Gold sales (thousands of recoverable ounces)
|
|
|
802
|
|
|
|
620
|
|
|||||||||||||||
|
a.
|
Includes $0.04 per pound of copper for the first nine months of 2014 associated with increased royalty rates.
|
|
b.
|
Includes
$0.30
per pound of fixed costs charged directly to cost of sales as a result of the impact of export restrictions on PT-FI's operating rates.
|
A significant portion of PT-FI's costs are fixed and unit costs vary depending on production volumes. Indonesia's unit net cash costs (net of gold and silver credits) totaled
$0.60
per pound of copper in
third-quarter
2014
and
$1.24
per pound for the
first nine months of
2014
, compared with
$0.99
per pound in
third-quarter
2013
and
$1.57
per pound for the
first nine months of
2013
, primarily reflecting higher gold and silver credits, partly offset by export duties, increased royalty rates and the impact of lower production rates.
Treatment charges vary with the volume of metals sold and the price of copper, and royalties vary with the volume of metals sold and the prices of copper and gold.
Because certain assets are depreciated on a straight-line basis, PT-FI’s unit depreciation rate varies with the level of copper production and sales.
Revenue adjustments primarily result from changes in prices on provisionally priced copper sales recognized in prior periods. Refer to “Consolidated Results - Revenues” for further discussion of adjustments to prior period provisionally priced copper sales.
PT Smelting intercompany profit (loss) represents the change in the elimination of 25 percent of PT-FI's profit on sales to PT Smelting. Refer to "Operations - Smelting & Refining" for further discussion.
Based on current sales volume and cost estimates, and assuming an average gold price of
$1,250
per ounce for fourth-quarter
2014
, Indonesia's unit net cash costs (net of gold and silver credits) are expected to approximate
$1.19
per pound of copper for the year
2014
, compared with $1.12 for the year 2013. Indonesia's projected unit net cash costs would change by approximately
$0.05
per pound for each
$50
per ounce change in the average price of gold for fourth-quarter
2014
. Because of the fixed nature of a large portion of Indonesia's costs, unit costs vary from quarter to quarter depending on copper and gold volumes.
54
Africa Mining
Africa mining includes Tenke Fungurume Mining S.A.R.L's (TFM) Tenke minerals district. We hold an effective 56 percent interest in the Tenke copper and cobalt mining concessions in the Katanga province of the DRC through our consolidated subsidiary TFM, and we are the operator of Tenke.
The Tenke operation includes surface mining, leaching and SX/EW operations. Copper production from the Tenke minerals district is sold as copper cathode. In addition to copper, the Tenke minerals district produces cobalt hydroxide.
Operating and Development Activities.
TFM completed its second phase expansion project in early 2013, which included increasing mine, mill and processing capacity. We continue to engage in exploration activities and metallurgical testing to evaluate the potential of the highly prospective minerals district at Tenke. These analyses are being incorporated in future plans for potential expansions of production capacity. Future expansions are subject to a number of factors, including economic and market conditions, and the business and investment climate in the DRC.
Operating Data.
Following is summary operating data for our Africa mining operations for the
third quarters
and
first nine months of
2014
and
2013
:
|
Three Months Ended
|
Nine Months Ended
|
||||||||||||||
|
September 30,
|
September 30,
|
||||||||||||||
|
|
2014
|
2013
|
2014
|
2013
|
|||||||||||
|
Copper
(recoverable)
|
|
|
|||||||||||||
|
Production (millions of pounds)
|
117
|
|
109
|
|
340
|
|
351
|
|
|||||||
|
Sales (millions of pounds)
|
112
|
|
118
|
|
314
|
|
342
|
|
|||||||
|
Average realized price per pound
a
|
$
|
3.11
|
|
$
|
3.19
|
|
$
|
3.09
|
|
$
|
3.22
|
|
|||
|
Cobalt
(contained)
|
|
|
|||||||||||||
|
Production (millions of pounds)
|
8
|
|
8
|
|
22
|
|
19
|
|
|||||||
|
Sales (millions of pounds)
|
8
|
|
6
|
|
23
|
|
17
|
|
|||||||
|
Average realized price per pound
|
$
|
9.99
|
|
$
|
8.57
|
|
$
|
9.68
|
|
$
|
8.10
|
|
|||
|
Ore milled (metric tons per day)
|
15,500
|
|
14,500
|
|
15,100
|
|
14,700
|
|
|||||||
|
Average ore grades (percent):
|
|
||||||||||||||
|
Copper
|
4.13
|
|
3.94
|
|
4.09
|
|
4.32
|
|
|||||||
|
Cobalt
|
0.33
|
|
0.43
|
|
0.33
|
|
0.36
|
|
|||||||
|
Copper recovery rate (percent)
|
91.3
|
|
91.6
|
|
92.8
|
|
91.7
|
|
|||||||
|
a.
|
Includes point-of-sale transportation costs as negotiated in customer contracts.
|
TFM's copper sales of
112 million
pounds in
third-quarter
2014
and
314 million
pounds for the
first nine months of
2014
were lower than copper sales of
118 million
pounds in third-quarter
2013
and
342 million
pounds for the
first nine months of
2013
, primarily because of timing of shipments.
For the year
2014
, we expect sales volumes from TFM to approximate
445 million
pounds of copper and
30 million
pounds of cobalt, compared with
454 million
pounds of copper and
25 million
pounds of cobalt for the year
2013
.
Unit Net Cash Costs.
Unit net cash costs per pound of copper is a measure intended to provide investors with information about the cash-generating capacity of our mining operations expressed on a basis relating to the primary metal product for our respective operations. We use this measure for the same purpose and for monitoring operating performance by our mining operations. This information differs from measures of performance determined in accordance with U.S. GAAP and should not be considered in isolation or as a substitute for measures of performance determined in accordance with U.S. GAAP. This measure is presented by other metals mining companies, although our measure may not be comparable to similarly titled measures reported by other companies.
55
Gross Profit per Pound of Copper and Cobalt
The following tables summarize the unit net cash costs and gross profit per pound of copper and cobalt at our Africa mining operations for the
third quarters
and
first nine months of
2014
and
2013
. Refer to “Production Revenues and Production Costs” for an explanation of “by-product” and “co-product” methods and a reconciliation of unit net cash costs per pound to production and delivery costs applicable to sales reported in our consolidated financial statements.
|
Three Months Ended
|
Three Months Ended
|
||||||||||||||||||||||
|
|
September 30, 2014
|
September 30, 2013
|
|||||||||||||||||||||
|
|
By-Product Method
|
Co-Product Method
|
By-Product Method
|
Co-Product Method
|
|||||||||||||||||||
|
|
Copper
|
Cobalt
|
Copper
|
Cobalt
|
|||||||||||||||||||
|
Revenues, excluding adjustments
a
|
$
|
3.11
|
|
$
|
3.11
|
|
$
|
9.99
|
|
$
|
3.19
|
|
$
|
3.19
|
|
$
|
8.57
|
|
|||||
|
Site production and delivery, before net noncash and other costs shown below
|
1.61
|
|
1.40
|
|
5.32
|
|
1.43
|
|
1.38
|
|
4.14
|
|
|||||||||||
|
Cobalt credits
b
|
(0.58
|
)
|
—
|
|
—
|
|
(0.27
|
)
|
—
|
|
—
|
|
|||||||||||
|
Royalty on metals
|
0.07
|
|
0.06
|
|
0.18
|
|
0.07
|
|
0.06
|
|
0.13
|
|
|||||||||||
|
Unit net cash costs
|
1.10
|
|
1.46
|
|
5.50
|
|
1.23
|
|
1.44
|
|
4.27
|
|
|||||||||||
|
Depreciation, depletion and amortization
|
0.51
|
|
0.43
|
|
1.06
|
|
0.55
|
|
0.48
|
|
1.37
|
|
|||||||||||
|
Noncash and other costs, net
|
0.05
|
|
0.04
|
|
0.10
|
|
0.02
|
|
0.02
|
|
0.06
|
|
|||||||||||
|
Total unit costs
|
1.66
|
|
1.93
|
|
6.66
|
|
1.80
|
|
1.94
|
|
5.70
|
|
|||||||||||
|
Revenue adjustments, primarily for pricing on prior period open sales
|
0.01
|
|
0.01
|
|
0.39
|
|
0.03
|
|
0.03
|
|
(0.27
|
)
|
|||||||||||
|
Gross profit per pound
|
$
|
1.46
|
|
$
|
1.19
|
|
$
|
3.72
|
|
$
|
1.42
|
|
$
|
1.28
|
|
$
|
2.60
|
|
|||||
|
Copper sales (millions of recoverable pounds)
|
112
|
|
112
|
|
|
118
|
|
118
|
|
|
|||||||||||||
|
Cobalt sales (millions of contained pounds)
|
|
|
8
|
|
|
|
6
|
|
|||||||||||||||
|
Nine Months Ended
|
Nine Months Ended
|
||||||||||||||||||||||
|
|
September 30, 2014
|
September 30, 2013
|
|||||||||||||||||||||
|
|
By-Product Method
|
Co-Product Method
|
By-Product Method
|
Co-Product Method
|
|||||||||||||||||||
|
|
Copper
|
Cobalt
|
Copper
|
Cobalt
|
|||||||||||||||||||
|
Revenues, excluding adjustments
a
|
$
|
3.09
|
|
$
|
3.09
|
|
$
|
9.68
|
|
$
|
3.22
|
|
$
|
3.22
|
|
$
|
8.10
|
|
|||||
|
Site production and delivery, before net noncash and other costs shown below
|
1.51
|
|
1.33
|
|
5.24
|
|
1.43
|
|
1.36
|
|
4.40
|
|
|||||||||||
|
Cobalt credits
b
|
(0.51
|
)
|
—
|
|
—
|
|
(0.26
|
)
|
—
|
|
—
|
|
|||||||||||
|
Royalty on metals
|
0.07
|
|
0.06
|
|
0.16
|
|
0.06
|
|
0.06
|
|
0.14
|
|
|||||||||||
|
Unit net cash costs
|
1.07
|
|
1.39
|
|
5.40
|
|
1.23
|
|
1.42
|
|
4.54
|
|
|||||||||||
|
Depreciation, depletion and amortization
|
0.55
|
|
0.47
|
|
1.04
|
|
0.52
|
|
0.48
|
|
0.97
|
|
|||||||||||
|
Noncash and other costs, net
|
0.05
|
|
0.05
|
|
0.10
|
|
0.06
|
|
0.05
|
|
0.09
|
|
|||||||||||
|
Total unit costs
|
1.67
|
|
1.91
|
|
6.54
|
|
1.81
|
|
1.95
|
|
5.60
|
|
|||||||||||
|
Revenue adjustments, primarily for pricing on prior period open sales
|
—
|
|
—
|
|
0.09
|
|
0.01
|
|
0.01
|
|
0.14
|
|
|||||||||||
|
Gross profit per pound
|
$
|
1.42
|
|
$
|
1.18
|
|
$
|
3.23
|
|
$
|
1.42
|
|
$
|
1.28
|
|
$
|
2.64
|
|
|||||
|
Copper sales (millions of recoverable pounds)
|
314
|
|
314
|
|
|
342
|
|
342
|
|
|
|||||||||||||
|
Cobalt sales (millions of contained pounds)
|
|
|
23
|
|
|
|
17
|
|
|||||||||||||||
|
a.
|
Includes point-of-sale transportation costs as negotiated in customer contracts.
|
|
b.
|
Net of cobalt downstream processing and freight costs.
|
Unit net cash costs (net of cobalt credits) for our Africa operations of
$1.10
per pound of copper in
third-quarter
2014
and
$1.07
per pound for the
first nine months of
2014
were lower than unit net cash costs of
$1.23
per pound in both the third quarter and
first nine months of
2013
, primarily reflecting higher cobalt credits, partly offset by higher site production and delivery costs.
Because certain assets are depreciated on a straight-line basis, Africa's unit depreciation rate may vary with the level of copper production and sales.
56
Assuming achievement of current sales volume and cost estimates, and an average cobalt market price of
$13
per pound for fourth-quarter
2014
, average unit net cash costs (net of cobalt credits) are expected to approximate
$1.16
per pound of copper for the year
2014
, compared with
$1.21
per pound in
2013
. Africa's projected unit net cash costs would change by
$0.02
per pound for each
$2
per pound change in the average price of cobalt during fourth-quarter
2014
.
Molybdenum Mines
We have two wholly owned molybdenum mines in North America – the Henderson underground mine and the Climax open-pit mine, both in Colorado. The Henderson and Climax mines produce high-purity, chemical-grade molybdenum concentrates, which are typically further processed into value-added molybdenum chemical products. The majority of the molybdenum concentrates produced at the Henderson and Climax mines, as well as from certain of our North and South America copper mines, are processed at our own conversion facilities.
Production from the Molybdenum mines totaled
13 million
pounds of molybdenum in
third-quarter
2014
,
12 million
pounds in
third-quarter
2013
,
40 million
pounds for the
first nine months of
2014
and
37 million
pounds for the
first nine months of
2013
. Refer to "Consolidated Results" for our consolidated molybdenum operating data, which includes sales of molybdenum produced at our molybdenum mines and at our North and South America copper mines, and refer to "Outlook" for projected consolidated molybdenum sales volumes.
Unit Net Cash Costs Per Pound of Molybdenum.
Unit net cash costs per pound of molybdenum is a measure intended to provide investors with information about the cash-generating capacity of our mining operations expressed on a basis relating to the primary metal product for our respective operations. We use this measure for the same purpose and for monitoring operating performance by our mining operations. This information differs from measures of performance determined in accordance with U.S. GAAP and should not be considered in isolation or as a substitute for measures of performance determined in accordance with U.S. GAAP. This measure is presented by other metals mining companies, although our measure may not be comparable to similarly titled measures reported by other companies.
Average unit net cash costs for our Molybdenum mines decreased to
$7.12
per pound of molybdenum in
third-quarter
2014
and
$6.76
per pound for the
first nine months of
2014
, compared with
$7.15
per pound in
third-quarter
2013
and
$7.08
per pound for the
first nine months of
2013
, primarily reflecting higher production volumes. Assuming achievement of current sales volume and cost estimates, unit net cash costs for our Molybdenum mines are expected to average approximately
$7.00
per pound of molybdenum for the year
2014
. Refer to “Product Revenues and Production Costs” for a reconciliation of unit net cash costs per pound to production and delivery costs applicable to sales reported in our consolidated financial statements.
Smelting & Refining
Treatment charges for smelting and refining copper concentrates consist of a base rate and, in certain contracts, price participation based on copper prices. Treatment charges represent a cost to our mining operations and income to Atlantic Copper and PT Smelting. Thus, higher treatment charges benefit our smelter operations and adversely affect our mining operations. Our North America copper mines are less significantly affected by changes in treatment charges because these operations are largely integrated with our wholly owned smelter located in Miami, Arizona.
Atlantic Copper, our wholly owned subsidiary located in Spain, smelts and refines copper concentrates and markets refined copper and precious metals in slimes. During the
first nine months of
2014
, Atlantic Copper purchased 25 percent of its concentrate requirements from our North America mining operations, 20 percent from our South America copper mines and 9 percent from our Indonesia mining operations, with the remainder purchased from third parties. Through this form of downstream integration, we are assured placement of a significant portion of our concentrate production.
We defer recognizing profits on sales from our mining operations to Atlantic Copper and on 25 percent of Indonesia mining's sales to PT Smelting until final sales to third parties occur. Changes in these deferrals attributable to variability in intercompany volumes resulted in net (reductions) additions to net income attributable to common stockholders totaling
$(20) million
in
third-quarter
2014
and
$36 million
for the
first nine months of
2014
, compared with
$2 million
in
third-quarter
2013
and
$28 million
for the
first nine months of
2013
. Our net deferred profits on inventories at Atlantic Copper and PT Smelting to be recognized in future periods’ net income attributable to common stockholders totaled
$87 million
at
September 30, 2014
. Quarterly variations in ore grades, the timing of
57
intercompany shipments and changes in product prices will result in variability in our net deferred profits and quarterly earnings.
Oil and Gas
Our oil and gas operations provide exposure to energy markets with favorable long-term fundamentals, strong margins and cash flows, and a large resource base with financially attractive exploration and development investment opportunities. The portfolio of assets includes significant oil production facilities and growth potential in the Deepwater GOM, established oil production onshore and offshore California, large onshore natural gas resources in the Haynesville shale play in Louisiana, natural gas production from the Madden area in central Wyoming, and an industry-leading position in the emerging Inboard Lower Tertiary/Cretaceous natural gas trend located in the shallow waters of the GOM and onshore in South Louisiana. More than 90 percent of our oil and gas revenues are from oil and NGLs.
Our oil and gas operations follow the full cost method of accounting whereby all costs associated with oil and gas property acquisition, exploration and development activities are capitalized into cost centers on a country-by-country basis. Capitalized costs, along with estimated future costs to develop proved reserves and asset retirement costs that are not already included in oil and gas properties, net of related salvage value, are amortized to expense under the unit-of-production method using estimates of proved oil and natural gas reserves. The costs of unproved oil and gas properties are excluded from amortization until the properties are evaluated, at which time the related costs are subject to amortization. Our depletion, depreciation and amortization rate is affected by changes to estimates of proved reserves and costs subject to amortization, as further discussed in "Critical Accounting Estimates" in Part II, Item 7 and 7a of our annual report on Form 10-K for the year ended December 31, 2013.
Under full cost accounting rules, a "ceiling test" is conducted each quarter to review the carrying value of our oil and gas properties for impairment. As of September 30, 2014, the net capitalized costs with respect to FM O&G's U.S. oil and gas properties exceeded the related ceiling, which resulted in the recognition of an impairment charge of
$308 million
($
192 million
to net income attributable to common stock), reflecting higher capitalized costs and the lower twelve-month average of the first-day-of-the-month historical reference oil price at September 30, 2014. We evaluated our goodwill, which totaled
$1.7 billion
at September 30, 2014, and is assigned to our U.S. oil and gas reporting unit, and concluded no impairment charge was required at September 30, 2014. As further discussed in "Critical Accounting Estimates" in Part II, Item 7 and 7a of our annual report on Form 10-K for the year ended December 31, 2013, events that could result in impairment of our oil and gas properties in future periods include, but are not limited to, a decline in trailing average oil and gas prices, transfers of costs into the full cost pool without equivalent increased reserve values, increased costs or negative reserve revisions. In the near term, FM O&G expects to conduct significant completion activities to assess certain of its unevaluated properties. As these assessments are completed, related costs currently recorded as unevaluated properties not subject to amortization will be transferred into the full cost pool. If these activities do not result in additions to discounted future net cash flows from proved oil and natural gas reserves at least equal to the related costs transferred (net of related tax effects), additional ceiling test impairments may occur.
During October 2014, oil prices declined significantly from the third-quarter 2014 average. Continuation of recent oil price declines, increases in capitalized costs subject to amortization and other factors discussed above, may result in future additional ceiling test impairments. A ceiling test impairment may also trigger an impairment assessment of our goodwill balance.
Exploration and Development Activities.
Our oil and gas business has significant proved, probable and possible reserves, a broad range of development opportunities and high-potential exploration prospects. The business is being managed to reinvest its cash flows in projects with attractive rates of return and risk profiles.
FM O&G has a large, strategic position in the Deepwater GOM with significant current oil production, strong cash margins and existing infrastructure and facilities with excess capacity. These assets, combined with FM O&G’s large leasehold interests in an established geologic basin, provide financially attractive investment opportunities for high-impact growth in oil production and cash margins. FM O&G’s capital allocation strategy is principally focused on exploitation drilling and development opportunities that can be tied back to existing facilities. Additional oil and gas asset sales and other transactions may be considered to provide incremental funding to accelerate FM O&G’s growth plans in the Deepwater GOM.
Capital expenditures for our oil and gas operations approximated
$0.9 billion
for
third-quarter
2014
, including $0.5 billion incurred for the Deepwater GOM and $0.2 billion for the Inboard Lower Tertiary/Cretaceous natural gas trend,
58
and $2.4 billion for the first nine months of 2014, including $1.3 billion incurred for the Deepwater GOM and $0.5 billion for the Inboard Lower Tertiary/Cretaceous natural gas trend. Capital expenditures for our oil and gas operations, which are expected to be funded by its operating cash flows and oil and gas asset sales, are projected to approximate
$3.4 billion
for the year
2014
, including
$2.0 billion
for the Deepwater GOM and
$0.7 billion
for the Inboard Lower Tertiary/Cretaceous natural gas trend. Our future capital spending estimates may be adjusted to incorporate results from our ongoing drilling activities and follow-on development activities, and changes in market conditions.
See "Financial and Operating Data" below for further discussion of our current oil and gas operations.
Sale and Purchase Transactions.
In June 2014, FM O&G completed the sale of the Eagle Ford shale assets for cash consideration of $3.1 billion ($2.6 billion net of taxes and closing adjustments). Approximately $1.3 billion of the proceeds was placed in a like-kind exchange escrow to reinvest in additional oil and gas interests and the remaining net proceeds were used to repay debt. In June 2014, FM O&G completed the acquisition of Deepwater GOM interests for $0.9 billion, including interests in the Lucius and Heidelberg oil fields and several exploration leases, and in September 2014, FM O&G acquired additional Deepwater GOM interests for $0.5 billion, including an 18.67 percent interest in the Vito oil discovery in the Mississippi Canyon area (Blocks 940, 941, 984 and 985) and a significant lease position in the Vito area.
Financial and Operating Data.
Following is summary operating results for the U.S. oil and gas operations for the
third quarters
and
first nine months of
2014
and
2013
:
|
Three Months Ended
|
Nine Months Ended
|
||||||||||||||||
|
September 30,
|
September 30,
|
||||||||||||||||
|
2014
|
2013
|
2014
a
|
2013
b
|
||||||||||||||
|
Sales Volumes
|
|||||||||||||||||
|
Oil (MMBbls)
|
8.6
|
|
11.5
|
|
32.1
|
|
14.9
|
|
|||||||||
|
Natural gas (Bcf)
|
20.2
|
|
23.5
|
|
59.9
|
|
31.3
|
|
|||||||||
|
NGLs (MMBbls)
|
0.6
|
|
1.0
|
|
2.7
|
|
1.3
|
|
|||||||||
|
MMBOE
|
12.5
|
|
16.5
|
|
44.7
|
|
21.5
|
|
|||||||||
|
Average Realizations
c
|
|||||||||||||||||
|
Oil (per barrel)
|
$
|
88.58
|
|
$
|
104.33
|
|
$
|
93.00
|
|
$
|
102.76
|
|
|||||
|
Natural gas
(per MMBtu)
|
$
|
4.02
|
|
$
|
3.97
|
|
$
|
4.37
|
|
$
|
3.94
|
|
|||||
|
NGLs (per barrel)
|
$
|
39.69
|
|
$
|
37.16
|
|
$
|
41.77
|
|
$
|
36.70
|
|
|||||
|
Gross (Loss) Profit per BOE
|
|||||||||||||||||
|
Realized revenues
c
|
$
|
69.08
|
|
$
|
80.93
|
|
$
|
75.04
|
|
$
|
79.40
|
|
|||||
|
Less: cash production costs
c
|
20.93
|
|
16.80
|
|
19.57
|
|
16.76
|
|
|||||||||
|
Cash operating margin
c
|
48.15
|
|
64.13
|
|
55.47
|
|
62.64
|
|
|||||||||
|
Less: depreciation, depletion and amortization
|
40.12
|
|
34.15
|
|
38.81
|
|
34.07
|
|
|||||||||
|
Less: impairment of oil and gas properties
|
24.59
|
|
—
|
|
6.90
|
|
—
|
|
|||||||||
|
Less: accretion and other costs
|
0.85
|
|
0.70
|
|
0.86
|
|
0.80
|
|
|||||||||
|
Plus: net noncash mark-to-market gains (losses) on derivative contracts
|
9.73
|
|
(9.58
|
)
|
2.90
|
|
(9.04
|
)
|
|||||||||
|
Plus: other net adjustments
|
0.09
|
|
0.06
|
|
0.05
|
|
0.04
|
|
|||||||||
|
Gross (loss) profit
|
$
|
(7.59
|
)
|
$
|
19.76
|
|
$
|
11.85
|
|
$
|
18.77
|
|
|||||
|
a.
|
Includes results from Eagle Ford through June 19, 2014.
|
|
b.
|
Include the results of FM O&G beginning June 1, 2013.
|
|
c.
|
Cash operating margin for our oil and gas operations reflects realized revenues less cash production costs. Realized revenues exclude noncash mark-to-market adjustments on derivative contracts, and cash production costs exclude accretion and other costs. For reconciliations of realized revenues (including average realizations for oil, natural gas and NGLs) and cash production costs per BOE to revenues and production and delivery costs reported in our consolidated financial statements, refer to "Product Revenues and Production Costs."
|
FM O&G's average realized price for crude oil was
$88.58
per barrel, net of
$6.77
per barrel associated with payments on derivative contracts in
third-quarter
2014
, and
$93.00
per barrel, net of
$5.41
per barrel associated with payments on derivative contracts for the
first nine months of
2014
. Excluding the impact of derivative contracts,
59
the
third-quarter
2014
average realized price for crude oil was
$95.35
per barrel (
92 percent
of the average Brent crude oil price of
$103.50
per barrel) and
$98.41
per barrel (
92 percent
of the average Brent crude oil price of
$106.98
per barrel) for the
first nine months of
2014
.
FM O&G has derivative contracts that provide price protection averaging between approximately $70 and $90 per barrel of Brent crude oil for all of its estimated fourth-quarter 2014 oil production and approximately 80 percent of estimated 2015 oil production. See Note 7 for further discussion.
FM O&G's average realized price for natural gas was
$4.02
per MMBtu in
third-quarter
2014
and
$4.37
per MMBtu for the
first nine months of
2014
. Excluding the impact of derivative contracts, the
third-quarter
2014
average realized price for natural gas was
$4.00
per MMBtu, compared to the NYMEX natural gas price average of
$4.06
per MMBtu for the July through
September 2014
contracts, and
$4.58
per MMBtu for the
first nine months of
2014
, compared to the NYMEX natural gas price average of
$4.54
per MMBtu for the January through
September 2014
contracts.
Realized revenues for oil and gas operations of
$69.08
per BOE in
third-quarter
2014
were lower than realized revenues of
$80.93
per BOE in
third-quarter
2013, primarily reflecting lower oil prices (the Brent crude oil average price was $6.09 per barrel lower) and higher realized cash losses on derivative contracts (
$58 million
or
$4.62
per BOE in third-quarter 2014, compared with
$12 million
or
$0.74
per BOE in third-quarter 2013). Realized revenues of
$75.04
per BOE for the
first nine months of
2014
were lower than realized revenues of
$79.40
per BOE for the four month period from June 1, 2013, to September 30, 2013 primarily reflecting higher realized cash losses on derivative contracts (
$186 million
or
$4.16
per BOE for the
first nine months of
2014
, compared with
$11 million
or
$0.49
per BOE for the four month period from June 1, 2013, to September 30, 2013).
Cash production costs of
$20.93
per BOE in
third-quarter
2014
and
$19.57
per BOE for the
first nine months of
2014
were higher than cash production costs of
$16.80
per BOE in
third-quarter
2013 and
$16.76
per BOE for the four month period from June 1, 2013, to September 30, 2013, primarily reflecting the sale of lower cost Eagle Ford properties in June 2014 and the higher operating costs in California.
Based on current sales volume and cost estimates for fourth-quarter 2014, cash production costs are expected to approximate
$21
per BOE for the year
2014
and
$24
per BOE for fourth-quarter
2014
. Fourth-quarter 2014 sales volumes and unit cost estimates reflect downtime for maintenance affecting production rates at Marlin in the Deepwater GOM.
The following table presents average sales volumes per day by region for our oil and gas operations for the
third quarters
and first nine months of
2014
and
2013
:
|
Three Months Ended
|
Nine Months Ended
|
||||||||||
|
September 30,
|
September 30,
|
||||||||||
|
2014
|
2013
|
2014
|
2013
a
|
||||||||
|
Sales Volumes (MBOE per day):
|
|||||||||||
|
GOM
b
|
75
|
|
73
|
|
74
|
|
71
|
|
|||
|
California
|
39
|
|
39
|
|
39
|
|
38
|
|
|||
|
Haynesville/Madden/Other
|
22
|
|
c
|
21
|
|
19
|
|
c
|
22
|
|
|
|
Eagle Ford
|
—
|
|
46
|
|
32
|
|
d
|
45
|
|
||
|
Total oil and gas operations
|
136
|
|
179
|
|
164
|
|
176
|
|
|||
|
a.
|
Includes the results of FM O&G beginning June 1, 2013.
|
|
b.
|
Includes sales from properties on the GOM Shelf and in the Deepwater GOM. Production from the GOM Shelf totaled 14 MBOE per day in third-quarter 2014 (18 percent of the GOM total), 12 MBOE per day for the first nine months of 2014 (17 percent of the GOM total) and 13 MBOE per day (18 percent of the GOM total) for both third-quarter 2013 and the four-month period from June 1, 2013, to September 30, 2013.
|
|
c.
|
Results include volume adjustments related to Eagle Ford's pre-close sales.
|
|
d.
|
FM O&G completed the sale of Eagle Ford on June 20, 2014.
|
Daily sales volumes averaged
136
MBOE in
third-quarter
2014
, including
93
MBbls of crude oil,
219
million cubic feet (MMcf) of natural gas and
6
MBbls of NGLs, and
164
MBOE for the
first nine months of
2014
, including
117
MBbls of crude oil,
220
MMcf of natural gas and
10
MBbls of NGLs. The decrease in daily average sales volumes
60
for the 2014 periods primarily reflects the sale of Eagle Ford properties in June 2014. Oil and gas sales volumes are expected to average 125 MBOE per day for fourth-quarter
2014
, comprised of 67 percent oil, 29 percent natural gas and 4 percent NGLs.
Deepwater Gulf of Mexico.
Multiple development and exploration opportunities have been identified in the Deepwater GOM that are expected to benefit from tie-back opportunities to available production capacity at the FM O&G operated large-scale Holstein, Marlin and Horn Mountain deepwater production platforms. Operations to pursue these opportunities have commenced and activities are expected to accelerate following the delivery of additional contracted drillships in late 2014 and mid-year 2015. Production is also expected to benefit from the commencement of production from the Lucius oil field in late 2014, the Heidelberg oil field in 2016 and longer range development in the Vito basin area.
All major construction and installation projects for the development of the Lucius oil field in
Keathley Canyon are finished, and the initial six development wells are being completed. Commissioning work is in progress with first oil production from the 80 MBbls of oil per day spar expected to be achieved in fourth-quarter 2014. The geologic results from the six wells drilled since 2009 confirm a significant oil resource. Lucius is a subsea development consisting of a truss spar hull located in 7,200 feet of water. FM O&G has a 25.1 percent working interest in Lucius.
During third-quarter 2014, fabrication work on the Heidelberg spar hull and load-out was completed in Finland. The hull for this 80 MBbls of oil per day Lucius-look-alike facility arrived in Texas in October 2014, and fabrication of the main topsides module is approximately 60 percent complete. Development drilling is underway and the project remains on track for first production in 2016. Heidelberg is a large, high-quality oil development project located in 5,300 feet of water in the Green Canyon area. FM O&G has a 12.5 percent working interest in Heidelberg.
Holstein, in which FM O&G has a 100 percent working interest, is located in Green Canyon and has production facilities capable of producing in excess of 100 MBOE per day. Drilling from the Holstein platform rig commenced in first-quarter 2014. The first sidetrack well commenced production in June 2014 and a second sidetrack well was completed in third-quarter 2014, commencing initial production in October 2014. Combined production from the first two sidetrack wells is over 4 MBOE per day. Operations to commence the third sidetrack well are under way. FM O&G expects to drill four additional sidetrack wells from the Holstein platform. FM O&G also plans to drill several subsea tie-back wells from contracted drillships to enhance production volumes from the spar.
Delineation drilling for subsalt Miocene objectives on the western flank of the Holstein Deep prospect commenced in third-quarter 2014. In October 2014, interim logging and core results above 28,500 feet from the delineation well indicated 110 net feet of pay with positive reservoir characteristics and good correlation with the discovery well. The delineation well, which is approximately one mile south of the discovery well, is currently drilling below 28,900 feet towards a proposed total depth of 32,000 feet to evaluate the primary objectives. The Holstein Deep development, in which FM O&G has a 100 percent working interest, is located west of the Holstein platform in 3,890 feet of water and is a subsea tie-back opportunity to the Holstein facility. FM O&G acquired the acreage associated with this development in a 2013 lease sale held by the BOEM. Two successful wells with approximately 500 net feet of oil pay had previously been drilled in recent years.
FM O&G drilled two exploration wells at the Copper prospect during third-quarter 2014. The first well encountered multiple hydrocarbon bearing sands in the Pliocene and Miocene totaling approximately 100 feet of net pay. Follow-on drilling at the second location was unsuccessful. FM O&G is currently evaluating future plans for this prospect, which is located southeast of the Holstein field in 4,400 feet of water and is a subsea tie-back opportunity to the Holstein facility. FM O&G has a 100 percent working interest in Copper.
Marlin, in which FM O&G has a 100 percent working interest, is located in Mississippi Canyon and has production facilities capable of producing in excess of 60 MBOE per day. Several tie-back opportunities in the area have been identified. Development drilling at Dorado commenced in October 2014. This multi-well, infill development program will target undrained fault blocks and updip resource potential south of the Marlin facility. FM O&G also plans to commence exploitation drilling at the King M63 prospect in late 2014. King is located south of the Marlin facility in 5,200 feet of water.
FM O&G has an 18.67 percent interest in the Vito oil discovery in the Mississippi Canyon area and a significant lease position in the Vito basin in the Mississippi Canyon and Atwater Valley areas. Vito, a large, deep subsalt Miocene oil discovery made in 2009, is located in approximately 4,000 feet of water and is operated by Shell Offshore Inc. Exploration and appraisal drilling in recent years confirmed a resource in high-quality, subsalt Miocene
61
sands. Development options are under evaluation. The acquired exploration leases in the Vito basin area (with working interests ranging from 50 percent to 100 percent) provide high potential tie-back opportunities and are complementary to FM O&G’s existing lease position in the Mississippi Canyon and Atwater Valley areas.
The Power Nap exploration prospect, in which FM O&G has a 50 percent working interest, commenced drilling in September 2014 towards a proposed total depth of 31,100 feet. The prospect is a Vito analog play. Power Nap is located in the Vito basin in 4,200 feet of water and is operated by Shell Offshore Inc.
Inboard Lower Tertiary/Cretaceous.
FM O&G has an industry-leading position in the emerging Inboard Lower Tertiary/Cretaceous natural gas trend, located on the Shelf of the GOM and onshore in South Louisiana. FM O&G has a large onshore and offshore lease acreage position with high-quality prospects and the potential to develop a significant long-term, low-cost source of natural gas. Data from eight wells drilled to date indicate the presence of geologic formations that are analogous to productive formations in the Deepwater GOM and onshore in the Gulf Coast region. The near-term focus is on defining the trend onshore.
The Highlander discovery well is currently being completed to test Cretaceous/Tuscaloosa objectives found below the salt weld and flow testing is anticipated in fourth-quarter 2014. The Highlander onshore exploratory well, in which FM O&G is the operator and has a 72 percent working interest, located in St. Martin Parish, Louisiana, encountered gas pay in several Wilcox and Cretaceous/Tuscaloosa sands between 24,000 feet and 29,000 feet in January 2014. As previously reported, the wireline log and core data obtained from the Wilcox and Cretaceous sand packages indicated favorable reservoir characteristics with approximately 150 feet of net pay. FM O&G has identified multiple exploratory prospects in the Highlander area where it controls rights to more than 60,000 gross acres.
In September and October 2014, flow testing was performed on middle Miocene sand sections in the Blackbeard West No. 2 well on Ship Shoal Block 188, in which FM O&G has a 69.4 percent working interest. During the testing period, the well flowed at a rate of approximately 2,000 barrels of water per day with flowing tubing pressure of approximately 9,000 pounds per square inch. While the well did not result in hydrocarbon production in commercial quantities, this water rate indicates that subsalt sands on the Shelf below 20,000 feet are capable of substantial production rates. The well will be temporarily abandoned while FM O&G evaluates plans to complete and test shallower upper Miocene sands in the well. A rig will be moved to Blackbeard East in fourth-quarter 2014 to complete and test the middle Miocene sands in this well. FM O&G holds a 90 percent working interest in Blackbeard East. FM O&G plans to temporarily abandon the Davy Jones No. 2 well in order to use certain equipment from the well to advance the completion and testing of the Highlander well. Future plans for Davy Jones will be determined following the Highlander flow test.
The Farthest Gate West onshore exploration prospect, commenced drilling in October 2014 and is currently drilling below 9,100 feet towards a proposed total depth of 29,000 feet. Farthest Gate West is located onshore in Cameron Parish, Louisiana, and is a Lineham Creek analog prospect with Paleogene objectives. FM O&G is currently reviewing completion options for the Lineham Creek discovery, in which FM O&G has a 36 percent working interest.
California.
FM O&G's California assets benefit from an established oil production base with a stable production profile and access to favorably priced crude markets. Development plans are principally focused on maintaining stable production levels through continued drilling in the long-established producing fields onshore in California. FM O&G's position in California is located onshore in the San Joaquin Valley and Los Angeles Basin and offshore in the Point Arguello and Point Pedernales fields.
Haynesville.
FM O&G has rights to a substantial natural gas resource, located in the Haynesville shale play in North Louisiana. Drilling activities in recent years have been reduced to maximize cash flows in a low natural gas price environment and to benefit from potentially higher future natural gas prices.
International Exploration (Morocco).
FM O&G has a farm-in arrangement to earn interests in exploration blocks located in the Mazagan permit area offshore Morocco. The exploration area covers 2.2 million gross acres in water depths of 4,500 to 9,900 feet. The prospects include Miocene, Cretaceous and Jurassic targets. FM O&G expects to commence drilling the first well in early 2015.
62
CAPITAL RESOURCES AND LIQUIDITY
Our operating cash flows vary with prices realized from copper, gold, molybdenum and oil sales, our sales volumes, production costs, income taxes, other working capital changes and other factors. We continue to target significant reductions in debt by the end of 2016 using cash flows generated above capital expenditures and other cash requirements. We have taken steps to accelerate our deleveraging plans through asset sales and will continue to evaluate our portfolio for potential future monetizations. We may also take additional steps to reduce or defer capital spending and other costs in response to market conditions.
Cash
Following is a summary of the U.S. and international components of consolidated cash and cash equivalents, including cash available to the parent company, net of noncontrolling interests' share, taxes and other costs at
September 30, 2014
(in millions):
|
Cash at domestic companies
|
$
|
61
|
|
|
|
Cash at international operations
|
597
|
|
a
|
|
|
Total consolidated cash and cash equivalents
|
658
|
|
||
|
Less: noncontrolling interests’ share
|
(161
|
)
|
||
|
Cash, net of noncontrolling interests’ share
|
497
|
|
||
|
Less: withholding taxes and other
|
(41
|
)
|
||
|
Net cash available
|
$
|
456
|
|
a
|
a. Includes $121 million of consolidated cash and cash equivalents at Candelaria and Ojos del Salado ($80 million available to the parent company).
Cash held at our international operations is generally used to support our foreign operations' capital expenditures, operating expenses, working capital and other tax payments, or other cash needs. Management believes that sufficient liquidity is available in the U.S. from cash balances and availability from our revolving credit facility and uncommitted lines of credit (see discussion below). With the exception of TFM, we have not elected to permanently reinvest earnings from our foreign subsidiaries, and we have recorded deferred tax liabilities for foreign earnings that are available to be repatriated to the U.S. From time to time, our foreign subsidiaries distribute earnings to the U.S. through dividends that are subject to applicable withholding taxes and noncontrolling interests' share.
Debt
Following is a summary of our total debt and the related weighted-average interest rates at
September 30, 2014
(in billions, except percentages):
|
Weighted-
|
||||||
|
Average
|
||||||
|
Interest Rate
|
||||||
|
FCX Senior Notes
|
$
|
9.5
|
|
3.6%
|
||
|
FM O&G Senior Notes
|
4.6
|
|
a
|
6.9%
|
||
|
FCX Term Loan
|
3.8
|
|
1.7%
|
|||
|
Other FCX debt
|
1.8
|
|
2.8%
|
|||
|
Total debt
|
$
|
19.7
|
|
3.9%
|
||
a. On October 15, 2014, we redeemed the $400 million principal amount of our 8.625% Senior Notes. Holders received the principal amount together with the redemption premium and accrued and unpaid interest to the redemption date. We expect to report a pre-tax gain of $24 million in fourth-quarter 2014 associated with this redemption.
On May 30, 2014, we amended our revolving credit facility, extending the maturity date by one year, to
May 31, 2019
, and increased the aggregate principal amount available from $3.0 billion to
$4.0 billion
. At
September 30, 2014
, we had
$1.1 billion
of borrowings outstanding and
$45 million
of letters of credit issued under our revolving credit facility.
We have uncommitted unsecured short-term lines of credit with certain financial institutions, which have terms and pricing that are more favorable than our revolving credit facility. As of
September 30, 2014
, there were
$250 million
of borrowings drawn on these lines of credit.
63
In March 2014, Cerro Verde entered into a five-year,
$1.8 billion
senior unsecured credit facility. Amounts may be drawn or letters of credit issued over a two-year period to fund a portion of the expansion project (see "Operations - South America Mining") and for Cerro Verde's general corporate purposes. At
September 30, 2014
, there were
no
borrowings and
no
letters of credit issued under Cerro Verde’s credit facility.
Refer to Note
6
for further discussion of our debt.
Operating Activities
During the
first nine months of
2014
, we generated consolidated operating cash flows totaling
$4.5 billion
(net of
$699 million
for working capital uses and changes in other tax payments), compared with consolidated operating cash flows for the
first nine months of
2013
of
$3.7 billion
(net of
$489 million
for working capital uses and changes in other tax payments). Consolidated operating cash flows for the first nine months of 2014 benefited from a full nine months of our oil and gas operations, partly offset by the impact of lower copper and gold price realizations and lower copper sales volumes.
Based on current operating plans and subject to future copper, gold, molybdenum and crude oil prices, we expect estimated consolidated operating cash flows for the year
2014
, plus available cash, asset sales proceeds and availability under our revolving credit facility, to be sufficient to fund our budgeted capital expenditures, dividends, noncontrolling interest distributions and other cash requirements for the year. Refer to “Outlook” for further discussion of projected operating cash flows for the year
2014
.
Investing Activities
Capital Expenditures.
Capital expenditures, including capitalized interest, totaled
$5.4 billion
for the
first nine months of
2014
, including
$2.0 billion
for major projects at mining operations and
$2.4 billion
for oil and gas operations, compared with
$3.6 billion
for the
first nine months of
2013
, including $1.4 billion for major projects and
$0.9 billion
for oil and gas operations for the four month period from June 1, 2013, to September 30, 2013. Increased capital expenditures at our mining operations for the first
nine
months of
2014
is primarily associated with the expansion project at Cerro Verde. Refer to “Operations” for further discussion.
Capital expenditures are currently expected to approximate
$7.5 billion
for the year
2014
, including
$3.0 billion
for major projects at mining operations (primarily the expansion projects at Cerro Verde and Morenci, and underground development activities at Grasberg) and
$3.4 billion
for oil and gas operations (primarily in the Deepwater GOM). Capital spending plans remain under review and will be revised as market conditions warrant. Refer to "Operations" for further discussion.
Acquisitions and Dispositions.
In June 2014, we completed the sale of the Eagle Ford shale assets for cash consideration of $3.1 billion. Approximately $1.3 billion of the proceeds was placed in a like-kind exchange escrow to reinvest in additional oil and gas interests and the remaining net proceeds were used to repay debt. In June 2014 and September 2014, we completed acquisitions of Deepwater GOM interests totaling $1.4 billion. Refer to Note
2
for further discussion of our oil and gas acquisition and disposal transactions.
In second-quarter 2013, we paid $3.5 billion in cash (net of cash acquired) for the acquisition of PXP and $1.6 billion in cash (net of cash acquired) for the acquisition of MMR.
In March 2013, we paid
$348 million
(net of cash acquired) to fund the acquisition of a cobalt chemical refinery in Kokkola, Finland, and the related sales and marketing business. The acquisition was funded 70 percent by us and 30 percent by Lundin, our joint venture partner.
Financing Activities
Debt Transactions.
In third-quarter 2014, we redeemed $1.7 billion of the aggregate principal amount of outstanding senior notes with an average interest rate of 6.6 percent under the equity clawback provisions of the instruments. Holders received the principal amount together with the redemption premium and accrued and unpaid interest to the redemption date.
In second-quarter 2014, we redeemed $210 million of the aggregate principal amount of the outstanding 6.625% Senior Notes. Holders received the principal amount together with the redemption premium and accrued and unpaid interest to the redemption date.
64
We used available cash and borrowings under the revolving credit facility and uncommitted lines of credit to fund the redemptions. Refer to Note
6
for further discussion of debt transactions for the
first nine months of
2014
.
Proceeds from debt for the
first nine months of
2013
primarily included amounts from the sale of
$6.5 billion
of unsecured senior notes in four tranches with a weighted-average interest rate of
3.9 percent
and borrowings of $4.0 billion under an unsecured term loan with an interest rate of LIBOR plus 1.5 percent. Net proceeds from these borrowings were used to fund the second-quarter 2013 oil and gas acquisitions, repay certain debt of PXP and for general corporate purposes. Repayments of debt for the
first nine months of
2013
primarily reflected the repayment of the
$3.9 billion
outstanding under PXP's amended credit facility and
$0.4 billion
of PXP senior notes that were assumed in the oil and gas acquisitions.
Dividends.
We paid dividends on our common stock totaling
$1.0 billion
for the first
nine
months of
2014
and
$2.0 billion
for the first
nine
months of
2013
(which included $1.0 billion for a supplemental dividend of $1.00 per share paid on July 1, 2013). The current annual dividend rate for our common stock is $1.25 per share (
$0.3125
per share quarterly). The declaration of dividends is at the discretion of our Board of Directors (Board) and will depend upon our financial results, cash requirements, future prospects and other factors deemed relevant by the Board. The Board will continue to review our financial policy on an ongoing basis.
Cash dividends and other distributions paid to noncontrolling interests totaled
$365 million
for the first
nine
months of
2014
and
$157 million
for the first
nine
months of
2013
. These payments will vary based on the cash requirements of our consolidated subsidiaries.
CONTRACTUAL OBLIGATIONS
Except as discussed in Note 13, there have been no material changes in our contractual obligations since
December 31, 2013
. Refer to Item 7 in our annual report on Form 10-K for the year ended
December 31, 2013
, for further information regarding our contractual obligations.
CONTINGENCIES
Environmental and Asset Retirement Obligations
Our current and historical operating activities are subject to stringent laws and regulations governing the protection of the environment. We perform a comprehensive annual review of our environmental and asset retirement obligations and also review changes in facts and circumstances associated with these obligations at least quarterly. During third-quarter 2014, we recorded additional asset retirement obligations totaling $403 million ($413 million on an undiscounted and unescalated basis) related to increased estimated costs to reclaim a waste stockpile at Grasberg. Additionally, in accordance with the 2011 Chilean legislation regulating mine closure, we will submit revised closure plans for our Chilean mine sites in November 2014. We expect to record additional asset retirement obligations in fourth-quarter 2014 associated with these revised closure plans. Updated cost assumptions, including increases and decreases to cost estimates, changes in the anticipated scope and timing of remediation activities, and settlement of environmental matters may result in additional revisions to certain of our environmental obligations.
Refer to Note 12 in our annual report on Form 10-K for the year ended
December 31, 2013
, for further information regarding our environmental and asset retirement obligations.
Litigation and Other Contingencies
There have been no material changes to our contingencies associated with legal proceedings and other matters since
December 31, 2013
. Refer to Note 12 and "Legal Proceedings" contained in Part I, Item 3 of our annual report on Form 10-K for the year ended
December 31, 2013
, as updated in Note 9 to the financial statements included in our quarterly report on Form 10-Q for the quarter ended March 31, 2014, for further information regarding legal proceedings and other matters.
65
NEW ACCOUNTING STANDARDS
We do not expect the impact of recently issued accounting standards to have a significant impact on our future financial statements and disclosures.
PRODUCT REVENUES AND PRODUCTION COSTS
Mining Product Revenues and Unit Net Cash Cost
Unit net cash costs per pound of copper and molybdenum are measures intended to provide investors with information about the cash-generating capacity of our mining operations expressed on a basis relating to the primary metal product for the respective operations. We use this measure for the same purpose and for monitoring operating performance by our mining operations. This information differs from measures of performance determined in accordance with U.S. GAAP and should not be considered in isolation or as a substitute for measures of performance determined in accordance with U.S. GAAP. This measure is presented by other metals mining companies, although our measures may not be comparable to similarly titled measures reported by other companies.
We present gross profit per pound of copper in the following tables using both a “by-product” method and a “co-product” method. We use the by-product method in our presentation of gross profit per pound of copper because (i) the majority of our revenues are copper revenues, (ii) we mine ore, which contains copper, gold, molybdenum and other metals, (iii) it is not possible to specifically assign all of our costs to revenues from the copper, gold, molybdenum and other metals we produce, (iv) it is the method used to compare mining operations in certain industry publications and (v) it is the method used by our management and the Board to monitor operations. In the co-product method presentation below, shared costs are allocated to the different products based on their relative revenue values, which will vary to the extent our metals sales volumes and realized prices change.
We show revenue adjustments for prior period open sales as a separate line item. Because these adjustments do not result from current period sales, we have reflected these separately from revenues on current period sales. Noncash and other costs consist of items such as stock-based compensation costs, start-up costs, write-offs of equipment and/or unusual charges. They are removed from site production and delivery costs in the calculation of unit net cash costs. As discussed above, gold, molybdenum and other metal revenues at copper mines are reflected as credits against site production and delivery costs in the by-product method. The following schedules for our mining operations are presentations under both the by-product and co-product methods together with reconciliations to amounts reported in our consolidated financial statements.
U.S. Oil & Gas Product Revenues and Cash Production Costs per Unit
Realized revenues and cash production costs per unit are measures intended to provide investors with information about the cash operating margin of our oil and gas operations. We use this measure for the same purpose and for monitoring operating performance by our oil and gas operations. This information differs from measures of performance determined in accordance with U.S. GAAP and should not be considered in isolation or as a substitute for measures of performance determined in accordance with U.S. GAAP. Our measures may not be comparable to similarly titled measures reported by other companies.
We show revenue adjustments from derivative contracts as separate line items. Because these adjustments do not result from oil and gas sales, these gains and losses have been reflected separately from revenues on current period sales. Additionally, accretion and other costs are removed from production and delivery costs in the calculation of cash production costs per BOE. The following schedules include calculations of oil and gas product revenues and cash production costs together with a reconciliation to amounts reported in our consolidated financial statements.
66
North America Copper Mines Product Revenues, Production Costs and Unit Net Cash Costs
|
Three Months Ended September 30, 2014
|
|
|
|||||||||||||||||
|
(In millions)
|
By-Product
|
Co-Product Method
|
|||||||||||||||||
|
Method
|
Copper
|
Molybdenum
a
|
Other
b
|
Total
|
|||||||||||||||
|
Revenues, excluding adjustments
|
$
|
1,374
|
|
$
|
1,374
|
|
$
|
106
|
|
$
|
34
|
|
$
|
1,514
|
|
||||
|
Site production and delivery, before net noncash and other costs shown below
|
791
|
|
776
|
|
25
|
|
19
|
|
820
|
|
|||||||||
|
By-product credits
|
(111
|
)
|
—
|
|
—
|
|
—
|
|
—
|
|
|||||||||
|
Treatment charges
|
50
|
|
49
|
|
—
|
|
1
|
|
50
|
|
|||||||||
|
Net cash costs
|
730
|
|
825
|
|
25
|
|
20
|
|
870
|
|
|||||||||
|
Depreciation, depletion and amortization
|
131
|
|
128
|
|
1
|
|
2
|
|
131
|
|
|||||||||
|
Noncash and other costs, net
|
46
|
|
45
|
|
—
|
|
1
|
|
46
|
|
|||||||||
|
Total costs
|
907
|
|
998
|
|
26
|
|
23
|
|
1,047
|
|
|||||||||
|
Revenue adjustments, primarily for pricing on prior period open sales
|
(8
|
)
|
(8
|
)
|
—
|
|
—
|
|
(8
|
)
|
|||||||||
|
Gross profit
|
$
|
459
|
|
$
|
368
|
|
$
|
80
|
|
$
|
11
|
|
$
|
459
|
|
||||
|
Copper sales (millions of recoverable pounds)
|
434
|
|
434
|
|
|||||||||||||||
|
Molybdenum sales (millions of recoverable pounds)
a
|
8
|
|
|||||||||||||||||
|
Gross profit per pound of copper/molybdenum:
|
|||||||||||||||||||
|
Revenues, excluding adjustments
|
$
|
3.17
|
|
$
|
3.17
|
|
$
|
13.55
|
|
||||||||||
|
Site production and delivery, before net noncash
and other costs shown below
|
1.83
|
|
1.79
|
|
3.17
|
|
|||||||||||||
|
By-product credits
|
(0.26
|
)
|
—
|
|
—
|
|
|||||||||||||
|
Treatment charges
|
0.11
|
|
0.11
|
|
—
|
|
|||||||||||||
|
Unit net cash costs
|
1.68
|
|
1.90
|
|
3.17
|
|
|||||||||||||
|
Depreciation, depletion and amortization
|
0.30
|
|
0.30
|
|
0.17
|
|
|||||||||||||
|
Noncash and other costs, net
|
0.11
|
|
0.10
|
|
0.03
|
|
|||||||||||||
|
Total unit costs
|
2.09
|
|
2.30
|
|
3.37
|
|
|||||||||||||
|
Revenue adjustments, primarily for pricing
|
|||||||||||||||||||
|
on prior period open sales
|
(0.02
|
)
|
(0.02
|
)
|
—
|
|
|||||||||||||
|
Gross profit per pound
|
$
|
1.06
|
|
$
|
0.85
|
|
$
|
10.18
|
|
||||||||||
|
Reconciliation to Amounts Reported
|
|
|
|
|
|
||||||||||||||
|
(In millions)
|
Revenues
|
Production and Delivery
|
Depreciation, Depletion and Amortization
|
|
|
||||||||||||||
|
Totals presented above
|
$
|
1,514
|
|
$
|
820
|
|
$
|
131
|
|
|
|
||||||||
|
Treatment charges
|
—
|
|
50
|
|
—
|
|
|
|
|||||||||||
|
Noncash and other costs, net
|
—
|
|
46
|
|
—
|
|
|
|
|||||||||||
|
Revenue adjustments, primarily for pricing on prior period open sales
|
(8
|
)
|
—
|
|
—
|
|
|
|
|||||||||||
|
Eliminations and other
|
(16
|
)
|
(14
|
)
|
2
|
|
|
|
|||||||||||
|
North America copper mines
|
1,490
|
|
902
|
|
133
|
|
|
|
|||||||||||
|
Other mining & eliminations
c
|
3,216
|
|
1,978
|
|
305
|
|
|||||||||||||
|
Total mining
|
4,706
|
|
2,880
|
|
438
|
|
|||||||||||||
|
U.S. oil & gas operations
|
990
|
|
273
|
|
812
|
|
d
|
||||||||||||
|
Corporate, other & eliminations
|
—
|
|
(1
|
)
|
3
|
|
|
|
|||||||||||
|
As reported in FCX’s consolidated financial statements
|
$
|
5,696
|
|
$
|
3,152
|
|
$
|
1,253
|
|
d
|
|
|
|||||||
|
a.
|
Reflects sales of molybdenum produced by certain of the North America copper mines to our molybdenum sales company at market-based pricing.
|
|
b.
|
Includes gold and silver product revenues and production costs.
|
|
c.
|
Represents the combined total for all other mining operations and the related eliminations, as presented in Note
10
.
|
|
d.
|
Includes impairment of oil and gas properties of
$308 million
.
|
67
North America Copper Mines Product Revenues, Production Costs and Unit Net Cash Costs (continued)
|
Three Months Ended September 30, 2013
|
|
|
|||||||||||||||||
|
(In millions)
|
By-Product
|
Co-Product Method
|
|||||||||||||||||
|
Method
|
Copper
|
Molybdenum
a
|
Other
b
|
Total
|
|||||||||||||||
|
Revenues, excluding adjustments
|
$
|
1,183
|
|
$
|
1,183
|
|
$
|
89
|
|
$
|
27
|
|
$
|
1,299
|
|
||||
|
Site production and delivery, before net noncash and other costs shown below
|
725
|
|
701
|
|
35
|
|
18
|
|
754
|
|
|||||||||
|
By-product credits
|
(87
|
)
|
—
|
|
—
|
|
—
|
|
—
|
|
|||||||||
|
Treatment charges
|
35
|
|
34
|
|
—
|
|
1
|
|
35
|
|
|||||||||
|
Net cash costs
|
673
|
|
735
|
|
35
|
|
19
|
|
789
|
|
|||||||||
|
Depreciation, depletion and amortization
|
100
|
|
97
|
|
2
|
|
1
|
|
100
|
|
|||||||||
|
Noncash and other costs, net
|
27
|
|
27
|
|
—
|
|
—
|
|
27
|
|
|||||||||
|
Total costs
|
800
|
|
859
|
|
37
|
|
20
|
|
916
|
|
|||||||||
|
Revenue adjustments, primarily for pricing on prior period open sales
|
9
|
|
9
|
|
—
|
|
—
|
|
9
|
|
|||||||||
|
Gross profit
|
$
|
392
|
|
$
|
333
|
|
$
|
52
|
|
$
|
7
|
|
$
|
392
|
|
||||
|
Copper sales (millions of recoverable pounds)
|
362
|
|
362
|
|
|||||||||||||||
|
Molybdenum sales (millions of recoverable pounds)
a
|
9
|
|
|||||||||||||||||
|
Gross profit per pound of copper/molybdenum:
|
|||||||||||||||||||
|
Revenues, excluding adjustments
|
$
|
3.27
|
|
$
|
3.27
|
|
$
|
10.24
|
|
||||||||||
|
Site production and delivery, before net noncash
and other costs shown below
|
2.00
|
|
1.94
|
|
4.01
|
|
|||||||||||||
|
By-product credits
|
(0.24
|
)
|
—
|
|
—
|
|
|||||||||||||
|
Treatment charges
|
0.10
|
|
0.09
|
|
—
|
|
|||||||||||||
|
Unit net cash costs
|
1.86
|
|
2.03
|
|
4.01
|
|
|||||||||||||
|
Depreciation, depletion and amortization
|
0.27
|
|
0.27
|
|
0.24
|
|
|||||||||||||
|
Noncash and other costs, net
|
0.08
|
|
0.07
|
|
0.03
|
|
|||||||||||||
|
Total unit costs
|
2.21
|
|
2.37
|
|
4.28
|
|
|||||||||||||
|
Revenue adjustments, primarily for pricing
|
|||||||||||||||||||
|
on prior period open sales
|
0.02
|
|
0.02
|
|
—
|
|
|||||||||||||
|
Gross profit per pound
|
$
|
1.08
|
|
$
|
0.92
|
|
$
|
5.96
|
|
||||||||||
|
Reconciliation to Amounts Reported
|
|
|
|
|
|
||||||||||||||
|
(In millions)
|
Revenues
|
Production and Delivery
|
Depreciation, Depletion and Amortization
|
|
|
||||||||||||||
|
Totals presented above
|
$
|
1,299
|
|
$
|
754
|
|
$
|
100
|
|
|
|
||||||||
|
Treatment charges
|
—
|
|
35
|
|
—
|
|
|
|
|||||||||||
|
Noncash and other costs, net
|
—
|
|
27
|
|
—
|
|
|
|
|||||||||||
|
Revenue adjustments, primarily for pricing on prior period open sales
|
9
|
|
—
|
|
—
|
|
|
|
|||||||||||
|
Eliminations and other
|
(7
|
)
|
(9
|
)
|
2
|
|
|
|
|||||||||||
|
North America copper mines
|
1,301
|
|
807
|
|
102
|
|
|
|
|||||||||||
|
Other mining & eliminations
c
|
3,688
|
|
2,235
|
|
251
|
|
|||||||||||||
|
Total mining
|
4,989
|
|
3,042
|
|
353
|
|
|||||||||||||
|
U.S. oil & gas operations
|
1,176
|
|
288
|
|
563
|
|
|||||||||||||
|
Corporate, other & eliminations
|
—
|
|
2
|
|
3
|
|
|
|
|||||||||||
|
As reported in FCX’s consolidated financial statements
|
$
|
6,165
|
|
$
|
3,332
|
|
$
|
919
|
|
|
|
||||||||
|
a.
|
Reflects sales of molybdenum produced by certain of the North America copper mines to our molybdenum sales company at market-based pricing.
|
|
b.
|
Includes gold and silver product revenues and production costs.
|
|
c.
|
Represents the combined total for all other mining operations and the related eliminations, as presented in Note
10
.
|
68
North America Copper Mines Product Revenues, Production Costs and Unit Net Cash Costs (continued)
|
Nine Months Ended September 30, 2014
|
|
|
|||||||||||||||||
|
(In millions)
|
By-Product
|
Co-Product Method
|
|||||||||||||||||
|
Method
|
Copper
|
Molybdenum
a
|
Other
b
|
Total
|
|||||||||||||||
|
Revenues, excluding adjustments
|
$
|
3,901
|
|
$
|
3,901
|
|
$
|
297
|
|
$
|
96
|
|
$
|
4,294
|
|
||||
|
Site production and delivery, before net noncash and other costs shown below
|
2,272
|
|
2,232
|
|
69
|
|
54
|
|
2,355
|
|
|||||||||
|
By-product credits
|
(310
|
)
|
—
|
|
—
|
|
—
|
|
—
|
|
|||||||||
|
Treatment charges
|
144
|
|
140
|
|
—
|
|
4
|
|
144
|
|
|||||||||
|
Net cash costs
|
2,106
|
|
2,372
|
|
69
|
|
58
|
|
2,499
|
|
|||||||||
|
Depreciation, depletion and amortization
|
360
|
|
352
|
|
4
|
|
4
|
|
360
|
|
|||||||||
|
Noncash and other costs, net
|
105
|
|
104
|
|
—
|
|
1
|
|
105
|
|
|||||||||
|
Total costs
|
2,571
|
|
2,828
|
|
73
|
|
63
|
|
2,964
|
|
|||||||||
|
Revenue adjustments, primarily for pricing on prior period open sales
|
(7
|
)
|
(7
|
)
|
—
|
|
—
|
|
(7
|
)
|
|||||||||
|
Gross profit
|
$
|
1,323
|
|
$
|
1,066
|
|
$
|
224
|
|
$
|
33
|
|
$
|
1,323
|
|
||||
|
Copper sales (millions of recoverable pounds)
|
1,224
|
|
1,224
|
|
|||||||||||||||
|
Molybdenum sales (millions of recoverable pounds)
a
|
25
|
|
|||||||||||||||||
|
Gross profit per pound of copper/molybdenum:
|
|||||||||||||||||||
|
Revenues, excluding adjustments
|
$
|
3.19
|
|
$
|
3.19
|
|
$
|
11.93
|
|
||||||||||
|
Site production and delivery, before net noncash
|
|||||||||||||||||||
|
and other costs shown below
|
1.86
|
|
1.83
|
|
2.75
|
|
|||||||||||||
|
By-product credits
|
(0.25
|
)
|
—
|
|
—
|
|
|||||||||||||
|
Treatment charges
|
0.11
|
|
0.11
|
|
—
|
|
|||||||||||||
|
Unit net cash costs
|
1.72
|
|
1.94
|
|
2.75
|
|
|||||||||||||
|
Depreciation, depletion and amortization
|
0.29
|
|
0.29
|
|
0.15
|
|
|||||||||||||
|
Noncash and other costs, net
|
0.09
|
|
0.08
|
|
0.03
|
|
|||||||||||||
|
Total unit costs
|
2.10
|
|
2.31
|
|
2.93
|
|
|||||||||||||
|
Revenue adjustments, primarily for pricing
|
|||||||||||||||||||
|
on prior period open sales
|
(0.01
|
)
|
(0.01
|
)
|
—
|
|
|||||||||||||
|
Gross profit per pound
|
$
|
1.08
|
|
$
|
0.87
|
|
$
|
9.00
|
|
||||||||||
|
Reconciliation to Amounts Reported
|
|
|
|
|
|
||||||||||||||
|
(In millions)
|
Revenues
|
Production and Delivery
|
Depreciation, Depletion and Amortization
|
|
|
||||||||||||||
|
Totals presented above
|
$
|
4,294
|
|
$
|
2,355
|
|
$
|
360
|
|
|
|
||||||||
|
Treatment charges
|
—
|
|
144
|
|
—
|
|
|
|
|||||||||||
|
Noncash and other costs, net
|
—
|
|
105
|
|
—
|
|
|
|
|||||||||||
|
Revenue adjustments, primarily for pricing on prior period open sales
|
(7
|
)
|
—
|
|
—
|
|
|
|
|||||||||||
|
Eliminations and other
|
(42
|
)
|
(46
|
)
|
8
|
|
|
|
|||||||||||
|
North America copper mines
|
4,245
|
|
2,558
|
|
368
|
|
|
|
|||||||||||
|
Other mining & eliminations
c
|
8,471
|
|
5,502
|
|
810
|
|
|||||||||||||
|
Total mining
|
12,716
|
|
8,060
|
|
1,178
|
|
|||||||||||||
|
U.S. oil & gas operations
|
3,487
|
|
913
|
|
2,044
|
|
d
|
||||||||||||
|
Corporate, other & eliminations
|
—
|
|
(2
|
)
|
10
|
|
|
|
|||||||||||
|
As reported in FCX’s consolidated financial statements
|
$
|
16,203
|
|
$
|
8,971
|
|
$
|
3,232
|
|
d
|
|
|
|||||||
|
a.
|
Reflects sales of molybdenum produced by certain of the North America copper mines to our molybdenum sales company at market-based pricing.
|
|
b.
|
Includes gold and silver product revenues and production costs.
|
|
c.
|
Represents the combined total for all other mining operations and the related eliminations, as presented in Note
10
.
|
|
d.
|
Includes impairment of oil and gas properties of
$308 million
.
|
69
North America Copper Mines Product Revenues, Production Costs and Unit Net Cash Costs (continued)
|
Nine Months Ended September 30, 2013
|
|
|
|||||||||||||||||
|
(In millions)
|
By-Product
|
Co-Product Method
|
|||||||||||||||||
|
Method
|
Copper
|
Molybdenum
a
|
Other
b
|
Total
|
|||||||||||||||
|
Revenues, excluding adjustments
|
$
|
3,655
|
|
$
|
3,655
|
|
$
|
280
|
|
$
|
80
|
|
$
|
4,015
|
|
||||
|
Site production and delivery, before net noncash and other costs shown below
|
2,201
|
|
2,130
|
|
101
|
|
56
|
|
2,287
|
|
|||||||||
|
By-product credits
|
(274
|
)
|
—
|
|
—
|
|
—
|
|
—
|
|
|||||||||
|
Treatment charges
|
112
|
|
109
|
|
—
|
|
3
|
|
112
|
|
|||||||||
|
Net cash costs
|
2,039
|
|
2,239
|
|
101
|
|
59
|
|
2,399
|
|
|||||||||
|
Depreciation, depletion and amortization
|
303
|
|
293
|
|
6
|
|
4
|
|
303
|
|
|||||||||
|
Noncash and other costs, net
|
88
|
|
87
|
|
1
|
|
—
|
|
88
|
|
|||||||||
|
Total costs
|
2,430
|
|
2,619
|
|
108
|
|
63
|
|
2,790
|
|
|||||||||
|
Revenue adjustments, primarily for pricing on prior period open sales
|
(4
|
)
|
(4
|
)
|
—
|
|
—
|
|
(4
|
)
|
|||||||||
|
Gross profit
|
$
|
1,221
|
|
$
|
1,032
|
|
$
|
172
|
|
$
|
17
|
|
$
|
1,221
|
|
||||
|
Copper sales (millions of recoverable pounds)
|
1,084
|
|
1,084
|
|
|||||||||||||||
|
Molybdenum sales (millions of recoverable pounds)
a
|
26
|
|
|||||||||||||||||
|
Gross profit per pound of copper/molybdenum:
|
|||||||||||||||||||
|
Revenues, excluding adjustments
|
$
|
3.37
|
|
$
|
3.37
|
|
$
|
11.03
|
|
||||||||||
|
Site production and delivery, before net noncash
|
|||||||||||||||||||
|
and other costs shown below
|
2.03
|
|
1.97
|
|
3.99
|
|
|||||||||||||
|
By-product credits
|
(0.25
|
)
|
—
|
|
—
|
|
|||||||||||||
|
Treatment charges
|
0.10
|
|
0.10
|
|
—
|
|
|||||||||||||
|
Unit net cash costs
|
1.88
|
|
2.07
|
|
3.99
|
|
|||||||||||||
|
Depreciation, depletion and amortization
|
0.28
|
|
0.27
|
|
0.25
|
|
|||||||||||||
|
Noncash and other costs, net
|
0.08
|
|
0.08
|
|
0.03
|
|
|||||||||||||
|
Total unit costs
|
2.24
|
|
2.42
|
|
4.27
|
|
|||||||||||||
|
Revenue adjustments, primarily for pricing
|
|||||||||||||||||||
|
on prior period open sales
|
—
|
|
—
|
|
—
|
|
|||||||||||||
|
Gross profit per pound
|
$
|
1.13
|
|
$
|
0.95
|
|
$
|
6.76
|
|
||||||||||
|
Reconciliation to Amounts Reported
|
|
|
|
|
|
||||||||||||||
|
(In millions)
|
Revenues
|
Production and Delivery
|
Depreciation, Depletion and Amortization
|
|
|
||||||||||||||
|
Totals presented above
|
$
|
4,015
|
|
$
|
2,287
|
|
$
|
303
|
|
|
|
||||||||
|
Treatment charges
|
—
|
|
112
|
|
—
|
|
|
|
|||||||||||
|
Noncash and other costs, net
|
—
|
|
88
|
|
—
|
|
|
|
|||||||||||
|
Revenue adjustments, primarily for pricing on prior period open sales
|
(4
|
)
|
—
|
|
—
|
|
|
|
|||||||||||
|
Eliminations and other
|
(16
|
)
|
(28
|
)
|
9
|
|
|
|
|||||||||||
|
North America copper mines
|
3,995
|
|
2,459
|
|
312
|
|
|
|
|||||||||||
|
Other mining & eliminations
c
|
9,526
|
|
6,058
|
|
726
|
|
|||||||||||||
|
Total mining
|
13,521
|
|
8,517
|
|
1,038
|
|
|||||||||||||
|
U.S. oil & gas operations
|
1,512
|
|
377
|
|
732
|
|
|||||||||||||
|
Corporate, other & eliminations
|
3
|
|
10
|
|
8
|
|
|
|
|||||||||||
|
As reported in FCX’s consolidated financial statements
|
$
|
15,036
|
|
$
|
8,904
|
|
$
|
1,778
|
|
|
|
||||||||
|
a.
|
Reflects sales of molybdenum produced by certain of the North America copper mines to our molybdenum sales company at market-based pricing.
|
|
b.
|
Includes gold and silver product revenues and production costs.
|
|
c.
|
Represents the combined total for all other mining operations and the related eliminations, as presented in Note
10
.
|
70
South America Mining Product Revenues, Production Costs and Unit Net Cash Costs
|
Three Months Ended September 30, 2014
|
|
|
|
|
|||||||||||
|
(In millions)
|
By-Product
|
Co-Product Method
|
|||||||||||||
|
Method
|
Copper
|
Other
|
Total
|
||||||||||||
|
Revenues, excluding adjustments
|
$
|
840
|
|
$
|
840
|
|
$
|
69
|
|
a
|
$
|
909
|
|
||
|
Site production and delivery, before net noncash and other costs shown below
|
451
|
|
415
|
|
43
|
|
458
|
|
|||||||
|
By-product credits
|
(62
|
)
|
—
|
|
—
|
|
—
|
|
|||||||
|
Treatment charges
|
43
|
|
43
|
|
—
|
|
43
|
|
|||||||
|
Royalty on metals
|
1
|
|
1
|
|
—
|
|
1
|
|
|||||||
|
Net cash costs
|
433
|
|
459
|
|
43
|
|
502
|
|
|||||||
|
Depreciation, depletion and amortization
|
102
|
|
96
|
|
6
|
|
102
|
|
|||||||
|
Noncash and other costs, net
|
18
|
|
19
|
|
(1
|
)
|
18
|
|
|||||||
|
Total costs
|
553
|
|
574
|
|
48
|
|
622
|
|
|||||||
|
Revenue adjustments, primarily for pricing on prior period open sales
|
(15
|
)
|
(15
|
)
|
—
|
|
(15
|
)
|
|||||||
|
Gross profit
|
$
|
272
|
|
$
|
251
|
|
$
|
21
|
|
$
|
272
|
|
|||
|
Copper sales (millions of recoverable pounds)
|
271
|
|
271
|
|
|||||||||||
|
Gross profit per pound of copper:
|
|||||||||||||||
|
Revenues, excluding adjustments
|
$
|
3.10
|
|
$
|
3.10
|
|
|||||||||
|
Site production and delivery, before net noncash
and other costs shown below
|
1.67
|
|
1.53
|
|
|||||||||||
|
By-product credits
|
(0.23
|
)
|
—
|
|
|||||||||||
|
Treatment charges
|
0.16
|
|
0.16
|
|
|||||||||||
|
Royalty on metals
|
—
|
|
—
|
|
|||||||||||
|
Unit net cash costs
|
1.60
|
|
1.69
|
|
|||||||||||
|
Depreciation, depletion and amortization
|
0.37
|
|
0.35
|
|
|||||||||||
|
Noncash and other costs, net
|
0.07
|
|
0.07
|
|
|||||||||||
|
Total unit costs
|
2.04
|
|
2.11
|
|
|||||||||||
|
Revenue adjustments, primarily for pricing
|
|||||||||||||||
|
on prior period open sales
|
(0.06
|
)
|
(0.06
|
)
|
|||||||||||
|
Gross profit per pound
|
$
|
1.00
|
|
$
|
0.93
|
|
|||||||||
|
Reconciliation to Amounts Reported
|
|
|
|
|
|||||||||||
|
(In millions)
|
Revenues
|
Production and Delivery
|
Depreciation, Depletion and Amortization
|
|
|||||||||||
|
Totals presented above
|
$
|
909
|
|
$
|
458
|
|
$
|
102
|
|
|
|||||
|
Treatment charges
|
(43
|
)
|
—
|
|
—
|
|
|
||||||||
|
Royalty on metals
|
(1
|
)
|
—
|
|
—
|
|
|||||||||
|
Noncash and other costs, net
|
—
|
|
18
|
|
—
|
|
|
||||||||
|
Revenue adjustments, primarily for pricing on prior period open sales
|
(15
|
)
|
—
|
|
—
|
|
|
||||||||
|
Eliminations and other
|
(3
|
)
|
(5
|
)
|
—
|
|
|
||||||||
|
South America mining
|
847
|
|
471
|
|
102
|
|
|
||||||||
|
Other mining & eliminations
b
|
3,859
|
|
2,409
|
|
336
|
|
|||||||||
|
Total mining
|
4,706
|
|
2,880
|
|
438
|
|
|||||||||
|
U.S. oil & gas operations
|
990
|
|
273
|
|
812
|
|
c
|
||||||||
|
Corporate, other & eliminations
|
—
|
|
(1
|
)
|
3
|
|
|
||||||||
|
As reported in FCX’s consolidated financial statements
|
$
|
5,696
|
|
$
|
3,152
|
|
$
|
1,253
|
|
c
|
|
||||
|
a.
|
Includes gold sales of
16 thousand
ounces (
$1,234
per ounce average realized price) and silver sales of
684 thousand
ounces (
$18.57
per ounce average realized price). Also reflects sales of molybdenum produced by Cerro Verde to our molybdenum sales company at market-based pricing.
|
|
b.
|
Represents the combined total for all other mining operations and the related eliminations, as presented in Note
10
.
|
|
c.
|
Includes impairment of oil and gas properties of
$308 million
.
|
71
South America Mining Product Revenues, Production Costs and Unit Net Cash Costs (continued)
|
Three Months Ended September 30, 2013
|
|
|
|
|
|||||||||||
|
(In millions)
|
By-Product
|
Co-Product Method
|
|||||||||||||
|
Method
|
Copper
|
Other
|
Total
|
||||||||||||
|
Revenues, excluding adjustments
|
$
|
1,065
|
|
$
|
1,065
|
|
$
|
79
|
|
a
|
$
|
1,144
|
|
||
|
Site production and delivery, before net noncash and other costs shown below
|
483
|
|
453
|
|
35
|
|
488
|
|
|||||||
|
By-product credits
|
(74
|
)
|
—
|
|
—
|
|
—
|
|
|||||||
|
Treatment charges
|
52
|
|
52
|
|
—
|
|
52
|
|
|||||||
|
Net cash costs
|
461
|
|
505
|
|
35
|
|
540
|
|
|||||||
|
Depreciation, depletion and amortization
|
85
|
|
80
|
|
5
|
|
85
|
|
|||||||
|
Noncash and other costs, net
|
14
|
|
5
|
|
9
|
|
14
|
|
|||||||
|
Total costs
|
560
|
|
590
|
|
49
|
|
639
|
|
|||||||
|
Revenue adjustments, primarily for pricing on prior period open sales
|
49
|
|
49
|
|
—
|
|
49
|
|
|||||||
|
Gross profit
|
$
|
554
|
|
$
|
524
|
|
$
|
30
|
|
$
|
554
|
|
|||
|
Copper sales (millions of recoverable pounds)
|
323
|
|
323
|
|
|||||||||||
|
Gross profit per pound of copper:
|
|||||||||||||||
|
Revenues, excluding adjustments
|
$
|
3.30
|
|
$
|
3.30
|
|
|||||||||
|
Site production and delivery, before net noncash
and other costs shown below
|
1.49
|
|
1.40
|
|
|||||||||||
|
By-product credits
|
(0.22
|
)
|
—
|
|
|||||||||||
|
Treatment charges
|
0.16
|
|
0.16
|
|
|||||||||||
|
Unit net cash costs
|
1.43
|
|
1.56
|
|
|||||||||||
|
Depreciation, depletion and amortization
|
0.26
|
|
0.25
|
|
|||||||||||
|
Noncash and other costs, net
|
0.05
|
|
0.02
|
|
|||||||||||
|
Total unit costs
|
1.74
|
|
1.83
|
|
|||||||||||
|
Revenue adjustments, primarily for pricing
|
|||||||||||||||
|
on prior period open sales
|
0.15
|
|
0.15
|
|
|||||||||||
|
Gross profit per pound
|
$
|
1.71
|
|
$
|
1.62
|
|
|||||||||
|
Reconciliation to Amounts Reported
|
|
|
|
|
|||||||||||
|
(In millions)
|
Revenues
|
Production and Delivery
|
Depreciation, Depletion and Amortization
|
|
|||||||||||
|
Totals presented above
|
$
|
1,144
|
|
$
|
488
|
|
$
|
85
|
|
|
|||||
|
Treatment charges
|
(52
|
)
|
—
|
|
—
|
|
|
||||||||
|
Noncash and other costs, net
|
—
|
|
14
|
|
—
|
|
|
||||||||
|
Revenue adjustments, primarily for pricing on prior period open sales
|
49
|
|
—
|
|
—
|
|
|
||||||||
|
Eliminations and other
|
(2
|
)
|
(8
|
)
|
—
|
|
|
||||||||
|
South America mining
|
1,139
|
|
494
|
|
85
|
|
|
||||||||
|
Other mining & eliminations
b
|
3,850
|
|
2,548
|
|
268
|
|
|||||||||
|
Total mining
|
4,989
|
|
3,042
|
|
353
|
|
|||||||||
|
U.S. oil & gas operations
|
1,176
|
|
288
|
|
563
|
|
|||||||||
|
Corporate, other & eliminations
|
—
|
|
2
|
|
3
|
|
|
||||||||
|
As reported in FCX’s consolidated financial statements
|
$
|
6,165
|
|
$
|
3,332
|
|
$
|
919
|
|
|
|||||
|
a.
|
Includes gold sales of
26 thousand
ounces (
$1,335
per ounce average realized price) and silver sales of
841 thousand
ounces (
$15.20
per ounce average realized price). Also reflects sales of molybdenum produced by Cerro Verde to our molybdenum sales company at market-based pricing.
|
|
b.
|
Represents the combined total for all other mining operations and the related eliminations, as presented in Note
10
.
|
72
South America Mining Product Revenues, Production Costs and Unit Net Cash Costs (continued)
|
Nine Months Ended September 30, 2014
|
|
|
|
|
|||||||||||
|
(In millions)
|
By-Product
|
Co-Product Method
|
|||||||||||||
|
Method
|
Copper
|
Other
|
Total
|
||||||||||||
|
Revenues, excluding adjustments
|
$
|
2,775
|
|
$
|
2,775
|
|
$
|
227
|
|
a
|
$
|
3,002
|
|
||
|
Site production and delivery, before net noncash and other costs shown below
|
1,424
|
|
1,315
|
|
124
|
|
1,439
|
|
|||||||
|
By-product credits
|
(212
|
)
|
—
|
|
—
|
|
—
|
|
|||||||
|
Treatment charges
|
151
|
|
151
|
|
—
|
|
151
|
|
|||||||
|
Royalty on metals
|
4
|
|
4
|
|
—
|
|
4
|
|
|||||||
|
Net cash costs
|
1,367
|
|
1,470
|
|
124
|
|
1,594
|
|
|||||||
|
Depreciation, depletion and amortization
|
284
|
|
266
|
|
18
|
|
284
|
|
|||||||
|
Noncash and other costs, net
|
57
|
|
64
|
|
(7
|
)
|
57
|
|
|||||||
|
Total costs
|
1,708
|
|
1,800
|
|
135
|
|
1,935
|
|
|||||||
|
Revenue adjustments, primarily for pricing on prior period open sales
|
(66
|
)
|
(66
|
)
|
—
|
|
(66
|
)
|
|||||||
|
Gross profit
|
$
|
1,001
|
|
$
|
909
|
|
$
|
92
|
|
$
|
1,001
|
|
|||
|
Copper sales (millions of recoverable pounds)
|
888
|
|
888
|
|
|||||||||||
|
Gross profit per pound of copper:
|
|||||||||||||||
|
Revenues, excluding adjustments
|
$
|
3.12
|
|
$
|
3.12
|
|
|||||||||
|
Site production and delivery, before net noncash
|
|||||||||||||||
|
and other costs shown below
|
1.61
|
|
1.48
|
|
|||||||||||
|
By-product credits
|
(0.24
|
)
|
—
|
|
|||||||||||
|
Treatment charges
|
0.17
|
|
0.17
|
|
|||||||||||
|
Royalty on metals
|
—
|
|
—
|
|
|||||||||||
|
Unit net cash costs
|
1.54
|
|
1.65
|
|
|||||||||||
|
Depreciation, depletion and amortization
|
0.32
|
|
0.30
|
|
|||||||||||
|
Noncash and other costs, net
|
0.06
|
|
0.08
|
|
|||||||||||
|
Total unit costs
|
1.92
|
|
2.03
|
|
|||||||||||
|
Revenue adjustments, primarily for pricing
|
|||||||||||||||
|
on prior period open sales
|
(0.07
|
)
|
(0.07
|
)
|
|||||||||||
|
Gross profit per pound
|
$
|
1.13
|
|
$
|
1.02
|
|
|||||||||
|
Reconciliation to Amounts Reported
|
|
|
|
|
|||||||||||
|
(In millions)
|
Revenues
|
Production and Delivery
|
Depreciation, Depletion and Amortization
|
|
|||||||||||
|
Totals presented above
|
$
|
3,002
|
|
$
|
1,439
|
|
$
|
284
|
|
|
|||||
|
Treatment charges
|
(151
|
)
|
—
|
|
—
|
|
|
||||||||
|
Royalty on metals
|
(4
|
)
|
—
|
|
—
|
|
|||||||||
|
Noncash and other costs, net
|
—
|
|
57
|
|
—
|
|
|
||||||||
|
Revenue adjustments, primarily for pricing on prior period open sales
|
(66
|
)
|
—
|
|
—
|
|
|
||||||||
|
Eliminations and other
|
(5
|
)
|
(19
|
)
|
—
|
|
|
||||||||
|
South America mining
|
2,776
|
|
1,477
|
|
284
|
|
|
||||||||
|
Other mining & eliminations
b
|
9,940
|
|
6,583
|
|
894
|
|
|||||||||
|
Total mining
|
12,716
|
|
8,060
|
|
1,178
|
|
|||||||||
|
U.S. oil & gas operations
|
3,487
|
|
913
|
|
2,044
|
|
c
|
||||||||
|
Corporate, other & eliminations
|
—
|
|
(2
|
)
|
10
|
|
|
||||||||
|
As reported in FCX’s consolidated financial statements
|
$
|
16,203
|
|
$
|
8,971
|
|
$
|
3,232
|
|
c
|
|
||||
|
a.
|
Includes gold sales of
59 thousand
ounces (
$1,280
per ounce average realized price) and silver sales of
2.2 million
ounces (
$19.10
per ounce average realized price). Also reflects sales of molybdenum produced by Cerro Verde to our molybdenum sales company at market-based pricing.
|
|
b.
|
Represents the combined total for all other mining operations and the related eliminations, as presented in Note
10
.
|
|
c.
|
Includes impairment of oil and gas properties of
$308 million
.
|
73
South America Mining Product Revenues, Production Costs and Unit Net Cash Costs (continued)
|
Nine Months Ended September 30, 2013
|
|
|
|
|
|||||||||||
|
(In millions)
|
By-Product
|
Co-Product Method
|
|||||||||||||
|
Method
|
Copper
|
Other
|
Total
|
||||||||||||
|
Revenues, excluding adjustments
|
$
|
3,042
|
|
$
|
3,042
|
|
$
|
245
|
|
a
|
$
|
3,287
|
|
||
|
Site production and delivery, before net noncash and other costs shown below
|
1,453
|
|
1,349
|
|
119
|
|
1,468
|
|
|||||||
|
By-product credits
|
(230
|
)
|
—
|
|
—
|
|
—
|
|
|||||||
|
Treatment charges
|
151
|
|
151
|
|
—
|
|
151
|
|
|||||||
|
Net cash costs
|
1,374
|
|
1,500
|
|
119
|
|
1,619
|
|
|||||||
|
Depreciation, depletion and amortization
|
242
|
|
228
|
|
14
|
|
242
|
|
|||||||
|
Noncash and other costs, net
|
38
|
|
11
|
|
27
|
|
38
|
|
|||||||
|
Total costs
|
1,654
|
|
1,739
|
|
160
|
|
1,899
|
|
|||||||
|
Revenue adjustments, primarily for pricing on prior period open sales
|
(29
|
)
|
(29
|
)
|
—
|
|
(29
|
)
|
|||||||
|
Gross profit
|
$
|
1,359
|
|
$
|
1,274
|
|
$
|
85
|
|
$
|
1,359
|
|
|||
|
Copper sales (millions of recoverable pounds)
|
923
|
|
923
|
|
|||||||||||
|
Gross profit per pound of copper:
|
|||||||||||||||
|
Revenues, excluding adjustments
|
$
|
3.30
|
|
$
|
3.30
|
|
|||||||||
|
Site production and delivery, before net noncash
|
|||||||||||||||
|
and other costs shown below
|
1.57
|
|
1.46
|
|
|||||||||||
|
By-product credits
|
(0.25
|
)
|
—
|
|
|||||||||||
|
Treatment charges
|
0.17
|
|
0.17
|
|
|||||||||||
|
Unit net cash costs
|
1.49
|
|
1.63
|
|
|||||||||||
|
Depreciation, depletion and amortization
|
0.26
|
|
0.24
|
|
|||||||||||
|
Noncash and other costs, net
|
0.04
|
|
0.01
|
|
|||||||||||
|
Total unit costs
|
1.79
|
|
1.88
|
|
|||||||||||
|
Revenue adjustments, primarily for pricing
|
|||||||||||||||
|
on prior period open sales
|
(0.04
|
)
|
(0.04
|
)
|
|||||||||||
|
Gross profit per pound
|
$
|
1.47
|
|
$
|
1.38
|
|
|||||||||
|
Reconciliation to Amounts Reported
|
|
|
|
|
|||||||||||
|
(In millions)
|
Revenues
|
Production and Delivery
|
Depreciation, Depletion and Amortization
|
|
|||||||||||
|
Totals presented above
|
$
|
3,287
|
|
$
|
1,468
|
|
$
|
242
|
|
|
|||||
|
Treatment charges
|
(151
|
)
|
—
|
|
—
|
|
|
||||||||
|
Noncash and other costs, net
|
—
|
|
38
|
|
—
|
|
|
||||||||
|
Revenue adjustments, primarily for pricing on prior period open sales
|
(29
|
)
|
—
|
|
—
|
|
|
||||||||
|
Eliminations and other
|
(3
|
)
|
(21
|
)
|
—
|
|
|
||||||||
|
South America mining
|
3,104
|
|
1,485
|
|
242
|
|
|
||||||||
|
Other mining & eliminations
b
|
10,417
|
|
7,032
|
|
796
|
|
|||||||||
|
Total mining
|
13,521
|
|
8,517
|
|
1,038
|
|
|||||||||
|
U.S. oil & gas operations
|
1,512
|
|
377
|
|
732
|
|
|||||||||
|
Corporate, other & eliminations
|
3
|
|
10
|
|
8
|
|
|
||||||||
|
As reported in FCX’s consolidated financial statements
|
$
|
15,036
|
|
$
|
8,904
|
|
$
|
1,778
|
|
|
|||||
|
a.
|
Includes gold sales of
68 thousand
ounces (
$1,415
per ounce average realized price) and silver sales of
2.6 million
ounces (
$22.51
per ounce average realized price). Also reflects sales of molybdenum produced by Cerro Verde to our molybdenum sales company at market-based pricing.
|
|
b.
|
Represents the combined total for all other mining operations and the related eliminations, as presented in Note
10
.
|
74
Indonesia Mining Product Revenues, Production Costs and Unit Net Cash Costs
|
Three Months Ended September 30, 2014
|
|
|
|||||||||||||||||
|
(In millions)
|
By-Product
|
Co-Product Method
|
|||||||||||||||||
|
Method
|
Copper
|
Gold
|
Silver
|
Total
|
|||||||||||||||
|
Revenues, excluding adjustments
|
$
|
786
|
|
$
|
786
|
|
$
|
615
|
|
$
|
15
|
|
a
|
$
|
1,416
|
|
|||
|
Site production and delivery, before net noncash and other costs shown below
|
624
|
|
346
|
|
271
|
|
7
|
|
624
|
|
|||||||||
|
Gold and silver credits
|
(629
|
)
|
—
|
|
—
|
|
—
|
|
—
|
|
|||||||||
|
Treatment charges
|
65
|
|
36
|
|
28
|
|
1
|
|
65
|
|
|||||||||
|
Export duties
|
42
|
|
23
|
|
18
|
|
1
|
|
42
|
|
|||||||||
|
Royalty on metals
|
52
|
|
29
|
|
23
|
|
—
|
|
52
|
|
|||||||||
|
Net cash costs
|
154
|
|
434
|
|
340
|
|
9
|
|
783
|
|
|||||||||
|
Depreciation and amortization
|
92
|
|
51
|
|
40
|
|
1
|
|
92
|
|
|||||||||
|
Noncash and other costs, net
|
28
|
|
16
|
|
12
|
|
—
|
|
28
|
|
|||||||||
|
Total costs
|
274
|
|
501
|
|
392
|
|
10
|
|
903
|
|
|||||||||
|
Revenue adjustments, primarily for pricing on prior period open sales
|
(3
|
)
|
(3
|
)
|
(1
|
)
|
—
|
|
(4
|
)
|
|||||||||
|
PT Smelting intercompany loss
|
(48
|
)
|
(27
|
)
|
(21
|
)
|
—
|
|
(48
|
)
|
|||||||||
|
Gross profit
|
$
|
461
|
|
$
|
255
|
|
$
|
201
|
|
$
|
5
|
|
$
|
461
|
|
||||
|
Copper sales (millions of recoverable pounds)
|
258
|
|
258
|
|
|
||||||||||||||
|
Gold sales (thousands of recoverable ounces)
|
|
|
505
|
|
|||||||||||||||
|
Gross profit per pound of copper/per ounce of gold:
|
|||||||||||||||||||
|
Revenues, excluding adjustments
|
$
|
3.05
|
|
$
|
3.05
|
|
$
|
1,219
|
|
||||||||||
|
Site production and delivery, before net noncash
and other costs shown below
|
2.42
|
|
1.34
|
|
537
|
|
|||||||||||||
|
Gold and silver credits
|
(2.44
|
)
|
—
|
|
—
|
|
|||||||||||||
|
Treatment charges
|
0.25
|
|
0.14
|
|
56
|
|
|||||||||||||
|
Export duties
|
0.16
|
|
0.09
|
|
36
|
|
|||||||||||||
|
Royalty on metals
|
0.21
|
|
0.12
|
|
45
|
|
|||||||||||||
|
Unit net cash costs
|
0.60
|
|
1.69
|
|
674
|
|
|||||||||||||
|
Depreciation and amortization
|
0.35
|
|
0.20
|
|
79
|
|
|||||||||||||
|
Noncash and other costs, net
|
0.11
|
|
0.06
|
|
24
|
|
|||||||||||||
|
Total unit costs
|
1.06
|
|
1.95
|
|
777
|
|
|||||||||||||
|
Revenue adjustments, primarily for pricing on
|
|||||||||||||||||||
|
prior period open sales
|
(0.01
|
)
|
(0.01
|
)
|
(1
|
)
|
|||||||||||||
|
PT Smelting intercompany loss
|
(0.19
|
)
|
(0.10
|
)
|
(42
|
)
|
|||||||||||||
|
Gross profit per pound/ounce
|
$
|
1.79
|
|
$
|
0.99
|
|
$
|
399
|
|
||||||||||
|
Reconciliation to Amounts Reported
|
|
|
|
|
|
||||||||||||||
|
(In millions)
|
Revenues
|
Production and Delivery
|
Depreciation, Depletion and Amortization
|
|
|
||||||||||||||
|
Totals presented above
|
$
|
1,416
|
|
$
|
624
|
|
$
|
92
|
|
|
|
||||||||
|
Treatment charges
|
(65
|
)
|
—
|
|
—
|
|
|
|
|||||||||||
|
Export duties
|
(42
|
)
|
—
|
|
—
|
|
|||||||||||||
|
Royalty on metals
|
(52
|
)
|
—
|
|
—
|
|
|
|
|||||||||||
|
Noncash and other costs, net
|
—
|
|
28
|
|
—
|
|
|
|
|||||||||||
|
Revenue adjustments, primarily for pricing on prior period open sales
|
(4
|
)
|
—
|
|
—
|
|
|
|
|||||||||||
|
PT Smelting intercompany loss
|
—
|
|
48
|
|
—
|
|
|||||||||||||
|
Indonesia mining
|
1,253
|
|
700
|
|
92
|
|
|
|
|||||||||||
|
Other mining & eliminations
b
|
3,453
|
|
2,180
|
|
346
|
|
|||||||||||||
|
Total mining
|
4,706
|
|
2,880
|
|
438
|
|
|||||||||||||
|
U.S. oil & gas operations
|
990
|
|
273
|
|
812
|
|
c
|
||||||||||||
|
Corporate, other & eliminations
|
—
|
|
(1
|
)
|
3
|
|
|
|
|||||||||||
|
As reported in FCX’s consolidated financial statements
|
$
|
5,696
|
|
$
|
3,152
|
|
$
|
1,253
|
|
c
|
|
|
|||||||
|
a.
|
Includes silver sales of
889 thousand
ounces (
$17.11
per ounce average realized price).
|
|
b.
|
Represents the combined total for all other mining operations and the related eliminations, as presented in Note
10
.
|
|
c.
|
Includes impairment of oil and gas properties of
$308 million
.
|
75
Indonesia Mining Product Revenues, Production Costs and Unit Net Cash Costs (continued)
|
Three Months Ended September 30, 2013
|
|
|
|||||||||||||||||
|
(In millions)
|
By-Product
|
Co-Product Method
|
|||||||||||||||||
|
Method
|
Copper
|
Gold
|
Silver
|
Total
|
|||||||||||||||
|
Revenues, excluding adjustments
|
$
|
782
|
|
$
|
782
|
|
$
|
370
|
|
$
|
16
|
|
a
|
$
|
1,168
|
|
|||
|
Site production and delivery, before net noncash and other costs shown below
|
545
|
|
365
|
|
173
|
|
7
|
|
545
|
|
|||||||||
|
Gold and silver credits
|
(391
|
)
|
—
|
|
—
|
|
—
|
|
—
|
|
|||||||||
|
Treatment charges
|
54
|
|
36
|
|
18
|
|
—
|
|
54
|
|
|||||||||
|
Royalty on metals
|
27
|
|
18
|
|
8
|
|
1
|
|
27
|
|
|||||||||
|
Net cash costs
|
235
|
|
419
|
|
199
|
|
8
|
|
626
|
|
|||||||||
|
Depreciation and amortization
|
60
|
|
40
|
|
19
|
|
1
|
|
60
|
|
|||||||||
|
Noncash and other costs, net
|
36
|
|
24
|
|
11
|
|
1
|
|
36
|
|
|||||||||
|
Total costs
|
331
|
|
483
|
|
229
|
|
10
|
|
722
|
|
|||||||||
|
Revenue adjustments, primarily for pricing on prior period open sales
|
19
|
|
19
|
|
4
|
|
1
|
|
24
|
|
|||||||||
|
PT Smelting intercompany loss
|
(36
|
)
|
(24
|
)
|
(11
|
)
|
(1
|
)
|
(36
|
)
|
|||||||||
|
Gross profit
|
$
|
434
|
|
$
|
294
|
|
$
|
134
|
|
$
|
6
|
|
$
|
434
|
|
||||
|
Copper sales (millions of recoverable pounds)
|
237
|
|
237
|
|
|||||||||||||||
|
Gold sales (thousands of recoverable ounces)
|
278
|
|
|||||||||||||||||
|
Gross profit per pound of copper/per ounce of gold:
|
|||||||||||||||||||
|
Revenues, excluding adjustments
|
$
|
3.30
|
|
$
|
3.30
|
|
$
|
1,330
|
|
||||||||||
|
Site production and delivery, before net noncash
and other costs shown below
|
2.30
|
|
1.54
|
|
621
|
|
|||||||||||||
|
Gold and silver credits
|
(1.65
|
)
|
—
|
|
—
|
|
|||||||||||||
|
Treatment charges
|
0.23
|
|
0.15
|
|
62
|
|
|||||||||||||
|
Royalty on metals
|
0.11
|
|
0.08
|
|
31
|
|
|||||||||||||
|
Unit net cash costs
|
0.99
|
|
1.77
|
|
714
|
|
|||||||||||||
|
Depreciation and amortization
|
0.25
|
|
0.17
|
|
68
|
|
|||||||||||||
|
Noncash and other costs, net
|
0.15
|
|
0.10
|
|
40
|
|
|||||||||||||
|
Total unit costs
|
1.39
|
|
2.04
|
|
822
|
|
|||||||||||||
|
Revenue adjustments, primarily for pricing on
|
|||||||||||||||||||
|
prior period open sales
|
0.08
|
|
0.08
|
|
17
|
|
|||||||||||||
|
PT Smelting intercompany loss
|
(0.15
|
)
|
(0.10
|
)
|
(41
|
)
|
|||||||||||||
|
Gross profit per pound/ounce
|
$
|
1.84
|
|
$
|
1.24
|
|
$
|
484
|
|
||||||||||
|
Reconciliation to Amounts Reported
|
|
|
|
|
|
||||||||||||||
|
(In millions)
|
Revenues
|
Production and Delivery
|
Depreciation, Depletion and Amortization
|
|
|
||||||||||||||
|
Totals presented above
|
$
|
1,168
|
|
$
|
545
|
|
$
|
60
|
|
|
|
||||||||
|
Treatment charges
|
(54
|
)
|
—
|
|
—
|
|
|
|
|||||||||||
|
Royalty on metals
|
(27
|
)
|
—
|
|
—
|
|
|
|
|||||||||||
|
Noncash and other costs, net
|
—
|
|
36
|
|
—
|
|
|
|
|||||||||||
|
Revenue adjustments, primarily for pricing on prior period open sales
|
24
|
|
—
|
|
—
|
|
|
|
|||||||||||
|
PT Smelting intercompany loss
|
—
|
|
36
|
|
—
|
|
|||||||||||||
|
Indonesia mining
|
1,111
|
|
617
|
|
60
|
|
|
|
|||||||||||
|
Other mining & eliminations
b
|
3,878
|
|
2,425
|
|
293
|
|
|||||||||||||
|
Total mining
|
4,989
|
|
3,042
|
|
353
|
|
|||||||||||||
|
U.S. oil & gas operations
|
1,176
|
|
288
|
|
563
|
|
|||||||||||||
|
Corporate, other & eliminations
|
—
|
|
2
|
|
3
|
|
|
|
|||||||||||
|
As reported in FCX’s consolidated financial statements
|
$
|
6,165
|
|
$
|
3,332
|
|
$
|
919
|
|
|
|
||||||||
|
a.
|
Includes silver sales of
761 thousand
ounces (
$21.46
per ounce average realized price).
|
|
b.
|
Represents the combined total for all other mining operations and the related eliminations, as presented in Note
10
.
|
76
Indonesia Mining Product Revenues, Production Costs and Unit Net Cash Costs (continued)
|
Nine Months Ended September 30, 2014
|
|
|
|||||||||||||||||
|
(In millions)
|
By-Product
|
Co-Product Method
|
|||||||||||||||||
|
Method
|
Copper
|
Gold
|
Silver
|
Total
|
|||||||||||||||
|
Revenues, excluding adjustments
|
$
|
1,495
|
|
$
|
1,495
|
|
$
|
1,001
|
|
$
|
29
|
|
a
|
$
|
2,525
|
|
|||
|
Site production and delivery, before net noncash and other costs shown below
|
1,404
|
|
831
|
|
557
|
|
16
|
|
1,404
|
|
|||||||||
|
Gold and silver credits
|
(1,048
|
)
|
—
|
|
—
|
|
—
|
|
—
|
|
|||||||||
|
Treatment charges
|
121
|
|
72
|
|
48
|
|
1
|
|
121
|
|
|||||||||
|
Export duties
|
42
|
|
25
|
|
16
|
|
1
|
|
42
|
|
|||||||||
|
Royalty on metals
|
79
|
|
47
|
|
31
|
|
1
|
|
79
|
|
|||||||||
|
Net cash costs
|
598
|
|
975
|
|
652
|
|
19
|
|
1,646
|
|
|||||||||
|
Depreciation and amortization
|
194
|
|
115
|
|
77
|
|
2
|
|
194
|
|
|||||||||
|
Noncash and other costs, net
|
200
|
|
b
|
118
|
|
80
|
|
2
|
|
200
|
|
||||||||
|
Total costs
|
992
|
|
1,208
|
|
809
|
|
23
|
|
2,040
|
|
|||||||||
|
Revenue adjustments, primarily for pricing on prior period open sales
|
(55
|
)
|
(55
|
)
|
18
|
|
—
|
|
(37
|
)
|
|||||||||
|
PT Smelting intercompany profit
|
10
|
|
6
|
|
4
|
|
—
|
|
10
|
|
|||||||||
|
Gross profit
|
$
|
458
|
|
$
|
238
|
|
$
|
214
|
|
$
|
6
|
|
$
|
458
|
|
||||
|
Copper sales (millions of recoverable pounds)
|
484
|
|
484
|
|
|||||||||||||||
|
Gold sales (thousands of recoverable ounces)
|
802
|
|
|||||||||||||||||
|
Gross profit per pound of copper/per ounce of gold:
|
|||||||||||||||||||
|
Revenues, excluding adjustments
|
$
|
3.09
|
|
$
|
3.09
|
|
$
|
1,248
|
|
||||||||||
|
Site production and delivery, before net noncash
|
|||||||||||||||||||
|
and other costs shown below
|
2.90
|
|
1.72
|
|
694
|
|
|||||||||||||
|
Gold and silver credits
|
(2.16
|
)
|
—
|
|
—
|
|
|||||||||||||
|
Treatment charges
|
0.25
|
|
0.15
|
|
60
|
|
|||||||||||||
|
Export duties
|
0.09
|
|
0.05
|
|
21
|
|
|||||||||||||
|
Royalty on metals
|
0.16
|
|
0.09
|
|
39
|
|
|||||||||||||
|
Unit net cash costs
|
1.24
|
|
2.01
|
|
814
|
|
|||||||||||||
|
Depreciation and amortization
|
0.40
|
|
0.24
|
|
96
|
|
|||||||||||||
|
Noncash and other costs, net
|
0.41
|
|
b
|
0.25
|
|
98
|
|
||||||||||||
|
Total unit costs
|
2.05
|
|
2.50
|
|
1,008
|
|
|||||||||||||
|
Revenue adjustments, primarily for pricing on
|
|||||||||||||||||||
|
prior period open sales
|
(0.11
|
)
|
(0.11
|
)
|
22
|
|
|||||||||||||
|
PT Smelting intercompany profit
|
0.02
|
|
0.01
|
|
5
|
|
|||||||||||||
|
Gross profit per pound/ounce
|
$
|
0.95
|
|
$
|
0.49
|
|
$
|
267
|
|
||||||||||
|
Reconciliation to Amounts Reported
|
|
|
|
|
|
||||||||||||||
|
(In millions)
|
Revenues
|
Production and Delivery
|
Depreciation, Depletion and Amortization
|
|
|
||||||||||||||
|
Totals presented above
|
$
|
2,525
|
|
$
|
1,404
|
|
$
|
194
|
|
|
|
||||||||
|
Treatment charges
|
(121
|
)
|
—
|
|
—
|
|
|
|
|||||||||||
|
Export duties
|
(42
|
)
|
—
|
|
—
|
|
|||||||||||||
|
Royalty on metals
|
(79
|
)
|
—
|
|
—
|
|
|
|
|||||||||||
|
Noncash and other costs, net
|
—
|
|
200
|
|
—
|
|
|
|
|||||||||||
|
Revenue adjustments, primarily for pricing on prior period open sales
|
(37
|
)
|
—
|
|
—
|
|
|
|
|||||||||||
|
PT Smelting intercompany profit
|
—
|
|
(10
|
)
|
—
|
|
|||||||||||||
|
Indonesia mining
|
2,246
|
|
1,594
|
|
194
|
|
|
|
|||||||||||
|
Other mining & eliminations
c
|
10,470
|
|
6,466
|
|
984
|
|
|||||||||||||
|
Total mining
|
12,716
|
|
8,060
|
|
1,178
|
|
|||||||||||||
|
U.S. oil & gas operations
|
3,487
|
|
913
|
|
2,044
|
|
d
|
||||||||||||
|
Corporate, other & eliminations
|
—
|
|
(2
|
)
|
10
|
|
|
|
|||||||||||
|
As reported in FCX’s consolidated financial statements
|
$
|
16,203
|
|
$
|
8,971
|
|
$
|
3,232
|
|
d
|
|
|
|||||||
|
a.
|
Includes silver sales of
1.6 million
ounces (
$18.21
per ounce average realized price).
|
|
b.
|
Includes
$143 million
(
$0.30
per pound) of fixed costs charged directly to cost of sales as a result of the impact of export restrictions on PT-FI's operating rates.
|
|
c.
|
Represents the combined total for all other mining operations and the related eliminations, as presented in Note
10
.
|
|
d.
|
Includes impairment of oil and gas properties of
$308 million
.
|
77
Indonesia Mining Product Revenues, Production Costs and Unit Net Cash Costs (continued)
|
Nine Months Ended September 30, 2013
|
|
|
|||||||||||||||||
|
(In millions)
|
By-Product
|
Co-Product Method
|
|||||||||||||||||
|
Method
|
Copper
|
Gold
|
Silver
|
Total
|
|||||||||||||||
|
Revenues, excluding adjustments
|
$
|
1,938
|
|
$
|
1,938
|
|
$
|
864
|
|
$
|
40
|
|
a
|
$
|
2,842
|
|
|||
|
Site production and delivery, before net noncash and other costs shown below
|
1,623
|
|
1,107
|
|
493
|
|
23
|
|
1,623
|
|
|||||||||
|
Gold and silver credits
|
(903
|
)
|
—
|
|
—
|
|
—
|
|
—
|
|
|||||||||
|
Treatment charges
|
135
|
|
92
|
|
41
|
|
2
|
|
135
|
|
|||||||||
|
Royalty on metals
|
74
|
|
50
|
|
23
|
|
1
|
|
74
|
|
|||||||||
|
Net cash costs
|
929
|
|
1,249
|
|
557
|
|
26
|
|
1,832
|
|
|||||||||
|
Depreciation and amortization
|
173
|
|
118
|
|
53
|
|
2
|
|
173
|
|
|||||||||
|
Noncash and other costs, net
|
123
|
|
84
|
|
37
|
|
2
|
|
123
|
|
|||||||||
|
Total costs
|
1,225
|
|
1,451
|
|
647
|
|
30
|
|
2,128
|
|
|||||||||
|
Revenue adjustments, primarily for pricing on prior period open sales
|
1
|
|
1
|
|
(1
|
)
|
—
|
|
—
|
|
|||||||||
|
PT Smelting intercompany profit
|
3
|
|
2
|
|
1
|
|
—
|
|
3
|
|
|||||||||
|
Gross profit
|
$
|
717
|
|
$
|
490
|
|
$
|
217
|
|
$
|
10
|
|
$
|
717
|
|
||||
|
Copper sales (millions of recoverable pounds)
|
593
|
|
593
|
|
|||||||||||||||
|
Gold sales (thousands of recoverable ounces)
|
620
|
|
|||||||||||||||||
|
Gross profit per pound of copper/per ounce of gold:
|
|||||||||||||||||||
|
Revenues, excluding adjustments
|
$
|
3.27
|
|
$
|
3.27
|
|
$
|
1,393
|
|
||||||||||
|
Site production and delivery, before net noncash
|
|||||||||||||||||||
|
and other costs shown below
|
2.74
|
|
1.87
|
|
795
|
|
|||||||||||||
|
Gold and silver credits
|
(1.52
|
)
|
—
|
|
—
|
|
|||||||||||||
|
Treatment charges
|
0.23
|
|
0.16
|
|
67
|
|
|||||||||||||
|
Royalty on metals
|
0.12
|
|
0.08
|
|
36
|
|
|||||||||||||
|
Unit net cash costs
|
1.57
|
|
2.11
|
|
898
|
|
|||||||||||||
|
Depreciation and amortization
|
0.29
|
|
0.20
|
|
85
|
|
|||||||||||||
|
Noncash and other costs, net
|
0.21
|
|
0.14
|
|
60
|
|
|||||||||||||
|
Total unit costs
|
2.07
|
|
2.45
|
|
1,043
|
|
|||||||||||||
|
Revenue adjustments, primarily for pricing on
|
|||||||||||||||||||
|
prior period open sales
|
—
|
|
—
|
|
(2
|
)
|
|||||||||||||
|
PT Smelting intercompany profit
|
0.01
|
|
0.01
|
|
1
|
|
|||||||||||||
|
Gross profit per pound/ounce
|
$
|
1.21
|
|
$
|
0.83
|
|
$
|
349
|
|
||||||||||
|
Reconciliation to Amounts Reported
|
|
|
|
|
|
||||||||||||||
|
(In millions)
|
Revenues
|
Production and Delivery
|
Depreciation, Depletion and Amortization
|
|
|
||||||||||||||
|
Totals presented above
|
$
|
2,842
|
|
$
|
1,623
|
|
$
|
173
|
|
|
|
||||||||
|
Treatment charges
|
(135
|
)
|
—
|
|
—
|
|
|
|
|||||||||||
|
Royalty on metals
|
(74
|
)
|
—
|
|
—
|
|
|
|
|||||||||||
|
Noncash and other costs, net
|
—
|
|
123
|
|
—
|
|
|
|
|||||||||||
|
Revenue adjustments, primarily for pricing on prior period open sales
|
—
|
|
—
|
|
—
|
|
|
|
|||||||||||
|
PT Smelting intercompany profit
|
—
|
|
(3
|
)
|
—
|
|
|||||||||||||
|
Indonesia mining
|
2,633
|
|
1,743
|
|
173
|
|
|
|
|||||||||||
|
Other mining & eliminations
b
|
10,888
|
|
6,774
|
|
865
|
|
|||||||||||||
|
Total mining
|
13,521
|
|
8,517
|
|
1,038
|
|
|||||||||||||
|
U.S. oil & gas operations
|
1,512
|
|
377
|
|
732
|
|
|||||||||||||
|
Corporate, other & eliminations
|
3
|
|
10
|
|
8
|
|
|
|
|||||||||||
|
As reported in FCX’s consolidated financial statements
|
$
|
15,036
|
|
$
|
8,904
|
|
$
|
1,778
|
|
|
|
||||||||
|
a.
|
Includes silver sales of
1.8 million
ounces (
$22.55
per ounce average realized price).
|
|
b.
|
Represents the combined total for all other mining operations and the related eliminations, as presented in Note
10
.
|
78
Africa Mining Product Revenues, Production Costs and Unit Net Cash Costs
|
Three Months Ended September 30, 2014
|
|
|
|
|
|||||||||||
|
(In millions)
|
By-Product
|
Co-Product Method
|
|||||||||||||
|
Method
|
Copper
|
Cobalt
|
Total
|
||||||||||||
|
Revenues, excluding adjustments
a
|
$
|
350
|
|
$
|
350
|
|
$
|
82
|
|
$
|
432
|
|
|||
|
Site production and delivery, before net noncash and other costs shown below
|
181
|
|
158
|
|
44
|
|
202
|
|
|||||||
|
Cobalt credits
b
|
(64
|
)
|
—
|
|
—
|
|
—
|
|
|||||||
|
Royalty on metals
|
8
|
|
6
|
|
2
|
|
8
|
|
|||||||
|
Net cash costs
|
125
|
|
164
|
|
46
|
|
210
|
|
|||||||
|
Depreciation, depletion and amortization
|
58
|
|
49
|
|
9
|
|
58
|
|
|||||||
|
Noncash and other costs, net
|
4
|
|
4
|
|
—
|
|
4
|
|
|||||||
|
Total costs
|
187
|
|
217
|
|
55
|
|
272
|
|
|||||||
|
Revenue adjustments, primarily for pricing on prior period open sales
|
1
|
|
1
|
|
3
|
|
4
|
|
|||||||
|
Gross profit
|
$
|
164
|
|
$
|
134
|
|
$
|
30
|
|
$
|
164
|
|
|||
|
Copper sales (millions of recoverable pounds)
|
112
|
|
112
|
|
|||||||||||
|
Cobalt sales (millions of contained pounds)
|
8
|
|
|||||||||||||
|
Gross profit per pound of copper/cobalt:
|
|||||||||||||||
|
Revenues, excluding adjustments
a
|
$
|
3.11
|
|
$
|
3.11
|
|
$
|
9.99
|
|
||||||
|
Site production and delivery, before net noncash
and other costs shown below
|
1.61
|
|
1.40
|
|
5.32
|
|
|||||||||
|
Cobalt credits
b
|
(0.58
|
)
|
—
|
|
—
|
|
|||||||||
|
Royalty on metals
|
0.07
|
|
0.06
|
|
0.18
|
|
|||||||||
|
Unit net cash costs
|
1.10
|
|
1.46
|
|
5.50
|
|
|||||||||
|
Depreciation, depletion and amortization
|
0.51
|
|
0.43
|
|
1.06
|
|
|||||||||
|
Noncash and other costs, net
|
0.05
|
|
0.04
|
|
0.10
|
|
|||||||||
|
Total unit costs
|
1.66
|
|
1.93
|
|
6.66
|
|
|||||||||
|
Revenue adjustments, primarily for pricing
|
|||||||||||||||
|
on prior period open sales
|
0.01
|
|
0.01
|
|
0.39
|
|
|||||||||
|
Gross profit per pound
|
$
|
1.46
|
|
$
|
1.19
|
|
$
|
3.72
|
|
||||||
|
Reconciliation to Amounts Reported
|
|
|
|
|
|||||||||||
|
(In millions)
|
Revenues
|
Production and Delivery
|
Depreciation, Depletion and Amortization
|
|
|||||||||||
|
Totals presented above
|
$
|
432
|
|
$
|
202
|
|
$
|
58
|
|
|
|||||
|
Royalty on metals
|
(8
|
)
|
—
|
|
—
|
|
|
||||||||
|
Noncash and other costs, net
|
—
|
|
4
|
|
—
|
|
|
||||||||
|
Revenue adjustments, primarily for pricing on prior period open sales
|
4
|
|
—
|
|
—
|
|
|
||||||||
|
Africa mining
|
428
|
|
206
|
|
58
|
|
|
||||||||
|
Other mining & eliminations
c
|
4,278
|
|
2,674
|
|
380
|
|
|||||||||
|
Total mining
|
4,706
|
|
2,880
|
|
438
|
|
|||||||||
|
U.S. oil & gas operations
|
990
|
|
273
|
|
812
|
|
d
|
||||||||
|
Corporate, other & eliminations
|
—
|
|
(1
|
)
|
3
|
|
|
||||||||
|
As reported in FCX’s consolidated financial statements
|
$
|
5,696
|
|
$
|
3,152
|
|
$
|
1,253
|
|
d
|
|
||||
|
a.
|
Includes point-of-sale transportation costs as negotiated in customer contracts.
|
|
b.
|
Net of cobalt downstream processing and freight costs.
|
|
c.
|
Represents the combined total for all other mining operations and the related eliminations, as presented in Note
10
.
|
|
d.
|
Includes impairment of oil and gas properties of
$308 million
.
|
79
Africa Mining Product Revenues, Production Costs and Unit Net Cash Costs (continued)
|
Three Months Ended September 30, 2013
|
|
|
|
|
|||||||||||
|
(In millions)
|
By-Product
|
Co-Product Method
|
|||||||||||||
|
Method
|
Copper
|
Cobalt
|
Total
|
||||||||||||
|
Revenues, excluding adjustments
a
|
$
|
374
|
|
$
|
374
|
|
$
|
53
|
|
$
|
427
|
|
|||
|
Site production and delivery, before net noncash and other costs shown below
|
168
|
|
162
|
|
25
|
|
187
|
|
|||||||
|
Cobalt credits
b
|
(32
|
)
|
—
|
|
—
|
|
—
|
|
|||||||
|
Royalty on metals
|
8
|
|
7
|
|
1
|
|
8
|
|
|||||||
|
Net cash costs
|
144
|
|
169
|
|
26
|
|
195
|
|
|||||||
|
Depreciation, depletion and amortization
|
64
|
|
56
|
|
8
|
|
64
|
|
|||||||
|
Noncash and other costs, net
|
3
|
|
2
|
|
1
|
|
3
|
|
|||||||
|
Total costs
|
211
|
|
227
|
|
35
|
|
262
|
|
|||||||
|
Revenue adjustments, primarily for pricing on prior period open sales
|
3
|
|
3
|
|
(2
|
)
|
1
|
|
|||||||
|
Gross profit
|
$
|
166
|
|
$
|
150
|
|
$
|
16
|
|
$
|
166
|
|
|||
|
Copper sales (millions of recoverable pounds)
|
118
|
|
118
|
|
|||||||||||
|
Cobalt sales (millions of contained pounds)
|
6
|
|
|||||||||||||
|
Gross profit per pound of copper/cobalt:
|
|||||||||||||||
|
Revenues, excluding adjustments
a
|
$
|
3.19
|
|
$
|
3.19
|
|
$
|
8.57
|
|
||||||
|
Site production and delivery, before net noncash
and other costs shown below
|
1.43
|
|
1.38
|
|
4.14
|
|
|||||||||
|
Cobalt credits
b
|
(0.27
|
)
|
—
|
|
—
|
|
|||||||||
|
Royalty on metals
|
0.07
|
|
0.06
|
|
0.13
|
|
|||||||||
|
Unit net cash costs
|
1.23
|
|
1.44
|
|
4.27
|
|
|||||||||
|
Depreciation, depletion and amortization
|
0.55
|
|
0.48
|
|
1.37
|
|
|||||||||
|
Noncash and other costs, net
|
0.02
|
|
0.02
|
|
0.06
|
|
|||||||||
|
Total unit costs
|
1.80
|
|
1.94
|
|
5.70
|
|
|||||||||
|
Revenue adjustments, primarily for pricing
|
|||||||||||||||
|
on prior period open sales
|
0.03
|
|
0.03
|
|
(0.27
|
)
|
|||||||||
|
Gross profit per pound
|
$
|
1.42
|
|
$
|
1.28
|
|
$
|
2.60
|
|
||||||
|
Reconciliation to Amounts Reported
|
|
|
|
|
|||||||||||
|
(In millions)
|
Revenues
|
Production and Delivery
|
Depreciation, Depletion and Amortization
|
|
|||||||||||
|
Totals presented above
|
$
|
427
|
|
$
|
187
|
|
$
|
64
|
|
|
|||||
|
Royalty on metals
|
(8
|
)
|
—
|
|
—
|
|
|
||||||||
|
Noncash and other costs, net
|
—
|
|
3
|
|
—
|
|
|
||||||||
|
Revenue adjustments, primarily for pricing on prior period open sales
|
1
|
|
—
|
|
—
|
|
|
||||||||
|
Africa mining
|
420
|
|
190
|
|
64
|
|
|
||||||||
|
Other mining & eliminations
c
|
4,569
|
|
2,852
|
|
289
|
|
|||||||||
|
Total mining
|
4,989
|
|
3,042
|
|
353
|
|
|||||||||
|
U.S. oil & gas operations
|
1,176
|
|
288
|
|
563
|
|
|||||||||
|
Corporate, other & eliminations
|
—
|
|
2
|
|
3
|
|
|
||||||||
|
As reported in FCX’s consolidated financial statements
|
$
|
6,165
|
|
$
|
3,332
|
|
$
|
919
|
|
|
|||||
|
a.
|
Includes point-of-sale transportation costs as negotiated in customer contracts.
|
|
b.
|
Net of cobalt downstream processing and freight costs.
|
|
c.
|
Represents the combined total for all other mining operations and the related eliminations, as presented in Note
10
.
|
80
Africa Mining Product Revenues, Production Costs and Unit Net Cash Costs (continued)
|
Nine Months Ended September 30, 2014
|
|
|
|
|
|||||||||||
|
(In millions)
|
By-Product
|
Co-Product Method
|
|||||||||||||
|
Method
|
Copper
|
Cobalt
|
Total
|
||||||||||||
|
Revenues, excluding adjustments
a
|
$
|
972
|
|
$
|
972
|
|
$
|
222
|
|
$
|
1,194
|
|
|||
|
Site production and delivery, before net noncash and other costs shown below
|
477
|
|
420
|
|
120
|
|
540
|
|
|||||||
|
Cobalt credits
b
|
(161
|
)
|
—
|
|
—
|
|
—
|
|
|||||||
|
Royalty on metals
|
22
|
|
18
|
|
4
|
|
22
|
|
|||||||
|
Net cash costs
|
338
|
|
438
|
|
124
|
|
562
|
|
|||||||
|
Depreciation, depletion and amortization
|
172
|
|
148
|
|
24
|
|
172
|
|
|||||||
|
Noncash and other costs, net
|
16
|
|
14
|
|
2
|
|
16
|
|
|||||||
|
Total costs
|
526
|
|
600
|
|
150
|
|
750
|
|
|||||||
|
Revenue adjustments, primarily for pricing on prior period open sales
|
(1
|
)
|
(1
|
)
|
2
|
|
1
|
|
|||||||
|
Gross profit
|
$
|
445
|
|
$
|
371
|
|
$
|
74
|
|
$
|
445
|
|
|||
|
Copper sales (millions of recoverable pounds)
|
314
|
|
314
|
|
|||||||||||
|
Cobalt sales (millions of contained pounds)
|
23
|
|
|||||||||||||
|
Gross profit per pound of copper/cobalt:
|
|||||||||||||||
|
Revenues, excluding adjustments
a
|
$
|
3.09
|
|
$
|
3.09
|
|
$
|
9.68
|
|
||||||
|
Site production and delivery, before net noncash
|
|||||||||||||||
|
and other costs shown below
|
1.51
|
|
1.33
|
|
5.24
|
|
|||||||||
|
Cobalt credits
b
|
(0.51
|
)
|
—
|
|
—
|
|
|||||||||
|
Royalty on metals
|
0.07
|
|
0.06
|
|
0.16
|
|
|||||||||
|
Unit net cash costs
|
1.07
|
|
1.39
|
|
5.40
|
|
|||||||||
|
Depreciation, depletion and amortization
|
0.55
|
|
0.47
|
|
1.04
|
|
|||||||||
|
Noncash and other costs, net
|
0.05
|
|
0.05
|
|
0.10
|
|
|||||||||
|
Total unit costs
|
1.67
|
|
1.91
|
|
6.54
|
|
|||||||||
|
Revenue adjustments, primarily for pricing
|
|||||||||||||||
|
on prior period open sales
|
—
|
|
—
|
|
0.09
|
|
|||||||||
|
Gross profit per pound
|
$
|
1.42
|
|
$
|
1.18
|
|
$
|
3.23
|
|
||||||
|
Reconciliation to Amounts Reported
|
|
|
|
|
|||||||||||
|
(In millions)
|
Revenues
|
Production and Delivery
|
Depreciation, Depletion and Amortization
|
|
|||||||||||
|
Totals presented above
|
$
|
1,194
|
|
$
|
540
|
|
$
|
172
|
|
|
|||||
|
Royalty on metals
|
(22
|
)
|
—
|
|
—
|
|
|
||||||||
|
Noncash and other costs, net
|
—
|
|
16
|
|
—
|
|
|
||||||||
|
Revenue adjustments, primarily for pricing on prior period open sales
|
1
|
|
—
|
|
—
|
|
|
||||||||
|
Africa mining
|
1,173
|
|
556
|
|
172
|
|
|
||||||||
|
Other mining & eliminations
c
|
11,543
|
|
7,504
|
|
1,006
|
|
|||||||||
|
Total mining
|
12,716
|
|
8,060
|
|
1,178
|
|
|||||||||
|
U.S. oil & gas operations
|
3,487
|
|
913
|
|
2,044
|
|
d
|
||||||||
|
Corporate, other & eliminations
|
—
|
|
(2
|
)
|
10
|
|
|
||||||||
|
As reported in FCX’s consolidated financial statements
|
$
|
16,203
|
|
$
|
8,971
|
|
$
|
3,232
|
|
d
|
|
||||
|
a.
|
Includes point-of-sale transportation costs as negotiated in customer contracts.
|
|
b.
|
Net of cobalt downstream processing and freight costs.
|
|
c.
|
Represents the combined total for all other mining operations and the related eliminations, as presented in Note
10
.
|
|
d.
|
Includes impairment of oil and gas properties of
$308 million
.
|
81
Africa Mining Product Revenues, Production Costs and Unit Net Cash Costs (continued)
|
Nine Months Ended September 30, 2013
|
|
|
|
|
|||||||||||
|
(In millions)
|
By-Product
|
Co-Product Method
|
|||||||||||||
|
Method
|
Copper
|
Cobalt
|
Total
|
||||||||||||
|
Revenues, excluding adjustments
a
|
$
|
1,101
|
|
$
|
1,101
|
|
$
|
140
|
|
$
|
1,241
|
|
|||
|
Site production and delivery, before net noncash and other costs shown below
|
488
|
|
465
|
|
76
|
|
541
|
|
|||||||
|
Cobalt credits
b
|
(90
|
)
|
—
|
|
—
|
|
—
|
|
|||||||
|
Royalty on metals
|
23
|
|
20
|
|
3
|
|
23
|
|
|||||||
|
Net cash costs
|
421
|
|
485
|
|
79
|
|
564
|
|
|||||||
|
Depreciation, depletion and amortization
|
179
|
|
163
|
|
16
|
|
179
|
|
|||||||
|
Noncash and other costs, net
|
19
|
|
17
|
|
2
|
|
19
|
|
|||||||
|
Total costs
|
619
|
|
665
|
|
97
|
|
762
|
|
|||||||
|
Revenue adjustments, primarily for pricing on prior period open sales
|
2
|
|
2
|
|
3
|
|
5
|
|
|||||||
|
Gross profit
|
$
|
484
|
|
$
|
438
|
|
$
|
46
|
|
$
|
484
|
|
|||
|
Copper sales (millions of recoverable pounds)
|
342
|
|
342
|
|
|||||||||||
|
Cobalt sales (millions of contained pounds)
|
17
|
|
|||||||||||||
|
Gross profit per pound of copper/cobalt:
|
|||||||||||||||
|
Revenues, excluding adjustments
a
|
$
|
3.22
|
|
$
|
3.22
|
|
$
|
8.10
|
|
||||||
|
Site production and delivery, before net noncash
|
|||||||||||||||
|
and other costs shown below
|
1.43
|
|
1.36
|
|
4.40
|
|
|||||||||
|
Cobalt credits
b
|
(0.26
|
)
|
—
|
|
—
|
|
|||||||||
|
Royalty on metals
|
0.06
|
|
0.06
|
|
0.14
|
|
|||||||||
|
Unit net cash costs
|
1.23
|
|
1.42
|
|
4.54
|
|
|||||||||
|
Depreciation, depletion and amortization
|
0.52
|
|
0.48
|
|
0.97
|
|
|||||||||
|
Noncash and other costs, net
|
0.06
|
|
0.05
|
|
0.09
|
|
|||||||||
|
Total unit costs
|
1.81
|
|
1.95
|
|
5.60
|
|
|||||||||
|
Revenue adjustments, primarily for pricing
|
|||||||||||||||
|
on prior period open sales
|
0.01
|
|
0.01
|
|
0.14
|
|
|||||||||
|
Gross profit per pound
|
$
|
1.42
|
|
$
|
1.28
|
|
$
|
2.64
|
|
||||||
|
Reconciliation to Amounts Reported
|
|
|
|
|
|||||||||||
|
(In millions)
|
Revenues
|
Production and Delivery
|
Depreciation, Depletion and Amortization
|
|
|||||||||||
|
Totals presented above
|
$
|
1,241
|
|
$
|
541
|
|
$
|
179
|
|
|
|||||
|
Royalty on metals
|
(23
|
)
|
—
|
|
—
|
|
|
||||||||
|
Noncash and other costs, net
|
—
|
|
19
|
|
—
|
|
|
||||||||
|
Revenue adjustments, primarily for pricing on prior period open sales
|
5
|
|
—
|
|
—
|
|
|
||||||||
|
Africa mining
|
1,223
|
|
560
|
|
179
|
|
|
||||||||
|
Other mining & eliminations
c
|
12,298
|
|
7,957
|
|
859
|
|
|||||||||
|
Total mining
|
13,521
|
|
8,517
|
|
1,038
|
|
|||||||||
|
U.S. oil & gas operations
|
1,512
|
|
377
|
|
732
|
|
|||||||||
|
Corporate, other & eliminations
|
3
|
|
10
|
|
8
|
|
|
||||||||
|
As reported in FCX’s consolidated financial statements
|
$
|
15,036
|
|
$
|
8,904
|
|
$
|
1,778
|
|
|
|||||
|
a.
|
Includes point-of-sale transportation costs as negotiated in customer contracts.
|
|
b.
|
Net of cobalt downstream processing and freight costs.
|
|
c.
|
Represents the combined total for all other mining operations and the related eliminations, as presented in Note
10
.
|
82
Molybdenum Mines Product Revenues, Production Costs and Unit Net Cash Costs
|
|
Three Months Ended September 30,
|
|
||||||||||
|
(In millions)
|
2014
|
2013
|
|
|||||||||
|
Revenues, excluding adjustments
a
|
$
|
184
|
|
$
|
132
|
|
|
|||||
|
Site production and delivery, before net noncash and other costs shown below
|
83
|
|
75
|
|
|
|||||||
|
Treatment charges and other
|
11
|
|
11
|
|
|
|||||||
|
Net cash costs
|
94
|
|
86
|
|
|
|||||||
|
Depreciation, depletion and amortization
|
25
|
|
21
|
|
|
|||||||
|
Noncash and other costs, net
|
3
|
|
7
|
|
|
|||||||
|
Total costs
|
122
|
|
114
|
|
|
|||||||
|
Gross profit
|
$
|
62
|
|
$
|
18
|
|
|
|||||
|
Molybdenum sales (millions of recoverable pounds)
a
|
13
|
|
12
|
|
||||||||
|
Gross profit per pound of molybdenum:
|
||||||||||||
|
Revenues, excluding adjustments
a
|
$
|
13.93
|
|
$
|
10.92
|
|
||||||
|
Site production and delivery, before net noncash and other costs shown below
|
6.29
|
|
6.27
|
|
||||||||
|
Treatment charges and other
|
0.83
|
|
0.88
|
|
||||||||
|
Unit net cash costs
|
7.12
|
|
7.15
|
|
||||||||
|
Depreciation, depletion and amortization
|
1.89
|
|
1.71
|
|
||||||||
|
Noncash and other costs, net
|
0.21
|
|
0.54
|
|
||||||||
|
Total unit costs
|
9.22
|
|
9.40
|
|
||||||||
|
Gross profit per pound
|
$
|
4.71
|
|
$
|
1.52
|
|
||||||
|
Reconciliation to Amounts Reported
|
||||||||||||
|
(In millions)
|
||||||||||||
|
Three Months Ended September 30, 2014
|
Revenues
|
Production and Delivery
|
Depreciation, Depletion and Amortization
|
|||||||||
|
Totals presented above
|
$
|
184
|
|
$
|
83
|
|
$
|
25
|
|
|||
|
Treatment charges and other
|
(11
|
)
|
—
|
|
—
|
|
||||||
|
Noncash and other costs, net
|
—
|
|
3
|
|
—
|
|
||||||
|
Molybdenum mines
|
173
|
|
86
|
|
25
|
|
||||||
|
Other mining & eliminations
b
|
4,533
|
|
2,794
|
|
413
|
|
||||||
|
Total mining
|
4,706
|
|
2,880
|
|
438
|
|
||||||
|
U.S. oil & gas operations
|
990
|
|
273
|
|
812
|
|
c
|
|||||
|
Corporate, other & eliminations
|
—
|
|
(1
|
)
|
3
|
|
||||||
|
As reported in FCX’s consolidated financial statements
|
$
|
5,696
|
|
$
|
3,152
|
|
$
|
1,253
|
|
c
|
||
|
Three Months Ended September 30, 2013
|
|
|
|
|||||||||
|
Totals presented above
|
$
|
132
|
|
$
|
75
|
|
$
|
21
|
|
|||
|
Treatment charges and other
|
(11
|
)
|
—
|
|
—
|
|
||||||
|
Noncash and other costs, net
|
—
|
|
7
|
|
—
|
|
||||||
|
Molybdenum mines
|
121
|
|
82
|
|
21
|
|
||||||
|
Other mining & eliminations
b
|
4,868
|
|
2,960
|
|
332
|
|
||||||
|
Total mining
|
4,989
|
|
3,042
|
|
353
|
|
||||||
|
U.S. oil & gas operations
|
1,176
|
|
288
|
|
563
|
|
||||||
|
Corporate, other & eliminations
|
—
|
|
2
|
|
3
|
|
||||||
|
As reported in FCX’s consolidated financial statements
|
$
|
6,165
|
|
$
|
3,332
|
|
$
|
919
|
|
|||
|
a.
|
Reflects sales of the Molybdenum mines' production to our molybdenum sales company at market-based pricing. On a consolidated basis, realizations are based on the actual contract terms for sales to third-parties; as a result, our consolidated average realized price per pound of molybdenum will differ from the amounts reported in this table.
|
|
b.
|
Represents the combined total for all other mining operations and the related eliminations, as presented in Note
10
. Also includes amounts associated with our molybdenum sales company, which includes sales of molybdenum produced by the molybdenum mines and by certain of the North and South America copper mines.
|
|
c.
|
Includes impairment of oil and gas properties of
$308 million
.
|
83
Molybdenum Mines Product Revenues, Production Costs and Unit Net Cash Costs (continued)
|
|
Nine Months Ended September 30,
|
|
||||||||||
|
(In millions)
|
2014
|
2013
|
|
|||||||||
|
Revenues, excluding adjustments
a
|
$
|
502
|
|
$
|
443
|
|
|
|||||
|
Site production and delivery, before net noncash
and other costs shown below
|
237
|
|
229
|
|
|
|||||||
|
Treatment charges and other
|
33
|
|
35
|
|
|
|||||||
|
Net cash costs
|
270
|
|
264
|
|
|
|||||||
|
Depreciation, depletion and amortization
|
71
|
|
62
|
|
|
|||||||
|
Noncash and other costs, net
|
6
|
|
11
|
|
|
|||||||
|
Total costs
|
347
|
|
337
|
|
|
|||||||
|
Gross profit
|
$
|
155
|
|
$
|
106
|
|
|
|||||
|
Molybdenum sales (millions of recoverable pounds)
a
|
40
|
|
37
|
|
||||||||
|
Gross profit per pound of molybdenum:
|
||||||||||||
|
Revenues, excluding adjustments
a
|
$
|
12.56
|
|
$
|
11.87
|
|
||||||
|
Site production and delivery, before net noncash
and other costs shown below
|
5.92
|
|
6.15
|
|
||||||||
|
Treatment charges and other
|
0.84
|
|
0.93
|
|
||||||||
|
Unit net cash costs
|
6.76
|
|
7.08
|
|
||||||||
|
Depreciation, depletion and amortization
|
1.77
|
|
1.66
|
|
||||||||
|
Noncash and other costs, net
|
0.14
|
|
0.29
|
|
||||||||
|
Total unit costs
|
8.67
|
|
9.03
|
|
||||||||
|
Gross profit per pound
|
$
|
3.89
|
|
$
|
2.84
|
|
||||||
|
Reconciliation to Amounts Reported
|
||||||||||||
|
(In millions)
|
||||||||||||
|
Nine Months Ended September 30, 2014
|
Revenues
|
Production and Delivery
|
Depreciation, Depletion and Amortization
|
|||||||||
|
Totals presented above
|
$
|
502
|
|
$
|
237
|
|
$
|
71
|
|
|||
|
Treatment charges and other
|
(33
|
)
|
—
|
|
—
|
|
||||||
|
Noncash and other costs, net
|
—
|
|
6
|
|
—
|
|
||||||
|
Molybdenum mines
|
469
|
|
243
|
|
71
|
|
||||||
|
Other mining & eliminations
b
|
12,247
|
|
7,817
|
|
1,107
|
|
||||||
|
Total mining
|
12,716
|
|
8,060
|
|
1,178
|
|
||||||
|
U.S. oil & gas operations
|
3,487
|
|
913
|
|
2,044
|
|
c
|
|||||
|
Corporate, other & eliminations
|
—
|
|
(2
|
)
|
10
|
|
||||||
|
As reported in FCX’s consolidated financial statements
|
$
|
16,203
|
|
$
|
8,971
|
|
$
|
3,232
|
|
c
|
||
|
Nine Months Ended September 30, 2013
|
|
|
|
|||||||||
|
Totals presented above
|
$
|
443
|
|
$
|
229
|
|
$
|
62
|
|
|||
|
Treatment charges and other
|
(35
|
)
|
—
|
|
—
|
|
||||||
|
Noncash and other costs,net
|
—
|
|
11
|
|
—
|
|
||||||
|
Molybdenum mines
|
408
|
|
240
|
|
62
|
|
||||||
|
Other mining & eliminations
b
|
13,113
|
|
8,277
|
|
976
|
|
||||||
|
Total mining
|
13,521
|
|
8,517
|
|
1,038
|
|
||||||
|
U.S. oil & gas operations
|
1,512
|
|
377
|
|
732
|
|
||||||
|
Corporate, other & eliminations
|
3
|
|
10
|
|
8
|
|
||||||
|
As reported in FCX’s consolidated financial statements
|
$
|
15,036
|
|
$
|
8,904
|
|
$
|
1,778
|
|
|||
|
a.
|
Reflects sales of the Molybdenum mines' production to our molybdenum sales company at market-based pricing. On a consolidated basis, realizations are based on the actual contract terms for sales to third-parties; as a result, our consolidated average realized price per pound of molybdenum will differ from the amounts reported in this table.
|
|
b.
|
Represents the combined total for all other mining operations and the related eliminations, as presented in Note
10
. Also includes amounts associated with our molybdenum sales company, which includes sales of molybdenum produced by the molybdenum mines and by certain of the North and South America copper mines.
|
|
c.
|
Includes impairment of oil and gas properties of
$308 million
.
|
84
U.S. Oil & Gas Product Revenues, Cash Production Costs and Realizations
|
Three Months Ended September 30, 2014
|
||||||||||||||||
|
(In millions)
|
Oil
|
Natural Gas
|
NGLs
|
Total
U.S. Oil & Gas
|
||||||||||||
|
Oil and gas revenues before derivatives
|
$
|
821
|
|
$
|
81
|
|
$
|
23
|
|
$
|
925
|
|
||||
|
Realized cash losses on derivative contracts
|
(58
|
)
|
—
|
|
—
|
|
(58
|
)
|
||||||||
|
Realized revenues
|
$
|
763
|
|
$
|
81
|
|
$
|
23
|
|
867
|
|
|||||
|
Less: cash production costs
|
263
|
|
||||||||||||||
|
Cash operating margin
|
604
|
|
||||||||||||||
|
Less: depreciation, depletion and amortization
|
504
|
|
||||||||||||||
|
Less: impairment of oil and gas properties
|
308
|
|
||||||||||||||
|
Less: accretion and other costs
|
10
|
|
||||||||||||||
|
Plus: net noncash mark-to-market gains on derivative contracts
|
122
|
|
||||||||||||||
|
Plus: other net adjustments
|
1
|
|
||||||||||||||
|
Gross loss
|
$
|
(95
|
)
|
|||||||||||||
|
Oil (MMBbls)
|
8.6
|
|
||||||||||||||
|
Gas (Bcf)
|
20.2
|
|
||||||||||||||
|
NGLs (MMBbls)
|
0.6
|
|
||||||||||||||
|
Oil Equivalents (MMBOE)
|
12.5
|
|
||||||||||||||
|
Oil
(per barrel) |
Natural Gas
(per MMBtu) |
NGLs
(per barrel) |
Per BOE
|
|||||||||||||
|
Oil and gas revenues before derivatives
|
$
|
95.35
|
|
$
|
4.00
|
|
$
|
39.69
|
|
$
|
73.70
|
|
||||
|
Realized cash (losses) gains on derivative contracts
|
(6.77
|
)
|
0.02
|
|
—
|
|
(4.62
|
)
|
||||||||
|
Realized revenues
|
$
|
88.58
|
|
$
|
4.02
|
|
$
|
39.69
|
|
69.08
|
|
|||||
|
Less: cash production costs
|
20.93
|
|
||||||||||||||
|
Cash operating margin
|
48.15
|
|
||||||||||||||
|
Less: depreciation, depletion and amortization
|
40.12
|
|
||||||||||||||
|
Less: impairment of oil and gas properties
|
24.59
|
|
||||||||||||||
|
Less: accretion and other costs
|
0.85
|
|
||||||||||||||
|
Plus: net noncash mark-to-market gains on derivative contracts
|
9.73
|
|
||||||||||||||
|
Plus: other net adjustments
|
0.09
|
|
||||||||||||||
|
Gross loss
|
$
|
(7.59
|
)
|
|||||||||||||
|
Reconciliation to Amounts Reported
|
||||||||||||||||
|
(In Millions)
|
Revenues
|
Production and Delivery
|
Depreciation, Depletion and Amortization
|
|||||||||||||
|
Totals presented above
|
$
|
925
|
|
$
|
263
|
|
$
|
504
|
|
|||||||
|
Realized cash losses on derivative contracts
|
(58
|
)
|
—
|
|
—
|
|
||||||||||
|
Net noncash mark-to-market gains on derivative contracts
|
122
|
|
—
|
|
—
|
|
||||||||||
|
Accretion and other costs
|
—
|
|
10
|
|
—
|
|
||||||||||
|
Impairment of oil and gas properties
|
—
|
|
—
|
|
308
|
|
||||||||||
|
Other net adjustments
|
1
|
|
—
|
|
—
|
|
||||||||||
|
U.S. oil & gas operations
|
990
|
|
273
|
|
812
|
|
||||||||||
|
Total mining
a
|
4,706
|
|
2,880
|
|
438
|
|
||||||||||
|
Corporate, other & eliminations
|
—
|
|
(1
|
)
|
3
|
|
||||||||||
|
As reported in FCX's consolidated financial statements
|
$
|
5,696
|
|
$
|
3,152
|
|
$
|
1,253
|
|
|||||||
|
a.
|
Represents the combined total for mining operations and the related eliminations, as presented in Note
10
.
|
85
|
U.S. Oil & Gas Product Revenues, Cash Production Costs and Realizations (continued)
|
|||||||||||||||||
|
Three Months Ended September 30, 2013
|
|||||||||||||||||
|
Total
|
|||||||||||||||||
|
Natural
|
U.S. Oil
|
||||||||||||||||
|
(In Millions)
|
Oil
|
Gas
|
NGLs
|
& Gas
|
|||||||||||||
|
Oil and gas revenues before derivatives
|
$
|
1,220
|
|
$
|
86
|
|
$
|
39
|
|
$
|
1,345
|
|
|||||
|
Realized cash (losses) gains on derivative contracts
|
(19
|
)
|
7
|
|
—
|
|
(12
|
)
|
|||||||||
|
Realized revenues
|
$
|
1,201
|
|
$
|
93
|
|
$
|
39
|
|
1,333
|
|
||||||
|
Less: cash production costs
|
277
|
|
|||||||||||||||
|
Cash operating margin
|
1,056
|
|
|||||||||||||||
|
Less: depreciation, depletion and amortization
|
563
|
|
|||||||||||||||
|
Less: accretion and other costs
|
11
|
|
|||||||||||||||
|
Plus: net noncash mark-to-market losses on derivative contracts
|
(158
|
)
|
|||||||||||||||
|
Plus: other net adjustments
|
1
|
|
|||||||||||||||
|
Gross profit
|
$
|
325
|
|
||||||||||||||
|
Oil (MMBbls)
|
11.5
|
|
|||||||||||||||
|
Gas (Bcf)
|
23.5
|
|
|||||||||||||||
|
NGLs (MMBbls)
|
1.0
|
|
|||||||||||||||
|
Oil Equivalents (MMBOE)
|
16.5
|
|
|||||||||||||||
|
Oil
|
Natural Gas
|
NGLs
|
|||||||||||||||
|
(per barrel)
|
(per MMBtu)
|
(per barrel)
|
Per BOE
|
||||||||||||||
|
Oil and gas revenues before derivatives
|
$
|
106.00
|
|
$
|
3.67
|
|
$
|
37.16
|
|
$
|
81.67
|
|
|||||
|
Realized cash (losses) gains on derivative contracts
|
(1.67
|
)
|
0.30
|
|
—
|
|
(0.74
|
)
|
|||||||||
|
Realized revenues
|
$
|
104.33
|
|
$
|
3.97
|
|
$
|
37.16
|
|
80.93
|
|
||||||
|
Less: cash production costs
|
16.80
|
|
|||||||||||||||
|
Cash operating margin
|
64.13
|
|
|||||||||||||||
|
Less: depreciation, depletion and amortization
|
34.15
|
|
|||||||||||||||
|
Less: accretion and other costs
|
0.70
|
|
|||||||||||||||
|
Plus: net noncash mark-to-market losses on derivative contracts
|
(9.58
|
)
|
|||||||||||||||
|
Plus: other net adjustments
|
0.06
|
|
|||||||||||||||
|
Gross profit
|
$
|
19.76
|
|
||||||||||||||
|
Reconciliation to Amounts Reported
|
|||||||||||||||||
|
(In Millions)
|
Revenues
|
Production and Delivery
|
Depreciation, Depletion and Amortization
|
||||||||||||||
|
Totals presented above
|
$
|
1,345
|
|
$
|
277
|
|
$
|
563
|
|
||||||||
|
Realized cash losses on derivative contracts
|
(12
|
)
|
—
|
|
—
|
|
|||||||||||
|
Net noncash mark-to-market losses on derivative contracts
|
(158
|
)
|
—
|
|
—
|
|
|||||||||||
|
Accretion and other costs
|
—
|
|
11
|
|
—
|
|
|||||||||||
|
Other net adjustments
|
1
|
|
—
|
|
—
|
|
|||||||||||
|
U.S. oil & gas operations
|
1,176
|
|
288
|
|
563
|
|
|||||||||||
|
Total mining
a
|
4,989
|
|
3,042
|
|
353
|
|
|||||||||||
|
Corporate, other & eliminations
|
—
|
|
2
|
|
3
|
|
|||||||||||
|
As reported in FCX's consolidated financial statements
|
$
|
6,165
|
|
$
|
3,332
|
|
$
|
919
|
|
||||||||
|
a.
|
Represents the combined total for mining operations and the related eliminations, as presented in Note
10
.
|
86
U.S. Oil & Gas Product Revenues, Cash Production Costs and Realizations (continued)
|
Nine Months Ended September 30, 2014
|
||||||||||||||||
|
(In millions)
|
Oil
|
Natural Gas
|
NGLs
|
Total
U.S. Oil & Gas
|
||||||||||||
|
Oil and gas revenues before derivatives
|
$
|
3,155
|
|
$
|
275
|
|
$
|
111
|
|
$
|
3,541
|
|
||||
|
Realized cash losses on derivative contracts
|
(173
|
)
|
(13
|
)
|
—
|
|
(186
|
)
|
||||||||
|
Realized revenues
|
$
|
2,982
|
|
$
|
262
|
|
$
|
111
|
|
3,355
|
|
|||||
|
Less: cash production costs
|
875
|
|
||||||||||||||
|
Cash operating margin
|
2,480
|
|
||||||||||||||
|
Less: depreciation, depletion and amortization
|
1,736
|
|
||||||||||||||
|
Less: impairment of oil and gas properties
|
308
|
|
||||||||||||||
|
Less: accretion and other costs
|
38
|
|
||||||||||||||
|
Plus: net noncash mark-to-market gains on derivative
contracts
|
130
|
|
||||||||||||||
|
Plus: other net adjustments
|
2
|
|
||||||||||||||
|
Gross profit
|
$
|
530
|
|
|||||||||||||
|
Oil (MMBbls)
|
32.1
|
|
||||||||||||||
|
Gas (Bcf)
|
59.9
|
|
||||||||||||||
|
NGLs (MMBbls)
|
2.7
|
|
||||||||||||||
|
Oil Equivalents (MMBOE)
|
44.7
|
|
||||||||||||||
|
Oil
(per barrel) |
Natural Gas
(per MMBtu) |
NGLs
(per barrel) |
Per BOE
|
|||||||||||||
|
Oil and gas revenues before derivatives
|
$
|
98.41
|
|
$
|
4.58
|
|
$
|
41.77
|
|
$
|
79.20
|
|
||||
|
Realized cash losses on derivative contracts
|
(5.41
|
)
|
(0.21
|
)
|
—
|
|
(4.16
|
)
|
||||||||
|
Realized revenues
|
$
|
93.00
|
|
$
|
4.37
|
|
$
|
41.77
|
|
75.04
|
|
|||||
|
Less: cash production costs
|
19.57
|
|
||||||||||||||
|
Cash operating margin
|
55.47
|
|
||||||||||||||
|
Less: depreciation, depletion and amortization
|
38.81
|
|
||||||||||||||
|
Less: impairment of oil and gas properties
|
6.90
|
|
||||||||||||||
|
Less: accretion and other costs
|
0.86
|
|
||||||||||||||
|
Plus: net noncash mark-to-market gains on derivative
contracts
|
2.90
|
|
||||||||||||||
|
Plus: other net adjustments
|
0.05
|
|
||||||||||||||
|
Gross profit
|
$
|
11.85
|
|
|||||||||||||
|
Reconciliation to Amounts Reported
|
||||||||||||||||
|
(In Millions)
|
Revenues
|
Production and Delivery
|
Depreciation, Depletion and Amortization
|
|||||||||||||
|
Totals presented above
|
$
|
3,541
|
|
$
|
875
|
|
$
|
1,736
|
|
|||||||
|
Realized cash losses on derivative contracts
|
(186
|
)
|
—
|
|
—
|
|
||||||||||
|
Net noncash mark-to-market gains on derivative contracts
|
130
|
|
—
|
|
—
|
|
||||||||||
|
Accretion and other costs
|
—
|
|
38
|
|
—
|
|
||||||||||
|
Impairment of oil and gas properties
|
—
|
|
—
|
|
308
|
|
||||||||||
|
Other net adjustments
|
2
|
|
—
|
|
—
|
|
||||||||||
|
U.S. oil & gas operations
|
3,487
|
|
913
|
|
2,044
|
|
||||||||||
|
Total mining
a
|
12,716
|
|
8,060
|
|
1,178
|
|
||||||||||
|
Corporate, other & eliminations
|
—
|
|
(2
|
)
|
10
|
|
||||||||||
|
As reported in FCX's consolidated financial statements
|
$
|
16,203
|
|
$
|
8,971
|
|
$
|
3,232
|
|
|||||||
|
a.
|
Represents the combined total for mining operations and the related eliminations, as presented in Note
10
.
|
87
U.S. Oil & Gas Product Revenues, Cash Production Costs and Realizations (continued)
|
Four months from June 1, 2013 to September 30, 2013
|
||||||||||||||||
|
(In millions)
|
Oil
|
Natural Gas
|
NGLs
|
Total
U.S. Oil & Gas
|
||||||||||||
|
Oil and gas revenues before derivatives
|
$
|
1,550
|
|
$
|
116
|
|
$
|
50
|
|
$
|
1,716
|
|
||||
|
Realized cash (losses) gains on derivative contracts
|
(18
|
)
|
7
|
|
—
|
|
(11
|
)
|
||||||||
|
Realized revenues
|
$
|
1,532
|
|
$
|
123
|
|
$
|
50
|
|
1,705
|
|
|||||
|
Less: cash production costs
|
360
|
|
||||||||||||||
|
Cash operating margin
|
1,345
|
|
||||||||||||||
|
Less: depreciation, depletion and amortization
|
732
|
|
||||||||||||||
|
Less: accretion and other costs
|
17
|
|
||||||||||||||
|
Plus: net noncash mark-to-market losses on derivative contracts
|
(194
|
)
|
||||||||||||||
|
Plus: other net adjustments
|
1
|
|
||||||||||||||
|
Gross profit
|
$
|
403
|
|
|||||||||||||
|
Oil (MMBbls)
|
14.9
|
|
||||||||||||||
|
Gas (Bcf)
|
31.3
|
|
||||||||||||||
|
NGLs (MMBbls)
|
1.3
|
|
||||||||||||||
|
Oil Equivalents (MMBOE)
|
21.5
|
|
||||||||||||||
|
Oil
(per barrel) |
Natural Gas
(per MMBtu) |
NGLs
(per barrel) |
Per BOE
|
|||||||||||||
|
Oil and gas revenues before derivatives
|
$
|
103.96
|
|
$
|
3.70
|
|
$
|
36.70
|
|
$
|
79.89
|
|
||||
|
Realized cash (losses) gains on derivative contracts
|
(1.20
|
)
|
0.24
|
|
—
|
|
(0.49
|
)
|
||||||||
|
Realized revenues
|
$
|
102.76
|
|
$
|
3.94
|
|
$
|
36.70
|
|
79.40
|
|
|||||
|
Less: cash production costs
|
16.76
|
|
||||||||||||||
|
Cash operating margin
|
62.64
|
|
||||||||||||||
|
Less: depreciation, depletion and amortization
|
34.07
|
|
||||||||||||||
|
Less: accretion and other costs
|
0.80
|
|
||||||||||||||
|
Plus: net noncash mark-to-market losses on derivative contracts
|
(9.04
|
)
|
||||||||||||||
|
Plus: other net adjustments
|
0.04
|
|
||||||||||||||
|
Gross profit
|
$
|
18.77
|
|
|||||||||||||
|
Reconciliation to Amounts Reported for the Nine Months Ended September 30, 2013
|
||||||||||||||||
|
(In Millions)
|
Revenues
|
Production and Delivery
|
Depreciation, Depletion and Amortization
|
|||||||||||||
|
Totals presented above
|
$
|
1,716
|
|
$
|
360
|
|
$
|
732
|
|
|||||||
|
Realized cash losses on derivative contracts
|
(11
|
)
|
—
|
|
—
|
|
||||||||||
|
Net noncash mark-to-market losses on derivative contracts
|
(194
|
)
|
—
|
|
—
|
|
||||||||||
|
Accretion and other costs
|
—
|
|
17
|
|
—
|
|
||||||||||
|
Other net adjustments
|
1
|
|
—
|
|
—
|
|
||||||||||
|
U.S. oil & gas operations
|
1,512
|
|
377
|
|
732
|
|
||||||||||
|
Total mining
a
|
13,521
|
|
8,517
|
|
1,038
|
|
||||||||||
|
Corporate, other & eliminations
|
3
|
|
10
|
|
8
|
|
||||||||||
|
As reported in FCX's consolidated financial statements
|
$
|
15,036
|
|
$
|
8,904
|
|
$
|
1,778
|
|
|||||||
|
a.
|
Represents the combined total for mining operations and the related eliminations, as presented in Note
10
.
|
88
CAUTIONARY STATEMENT
Our discussion and analysis contains forward-looking statements in which we discuss factors we believe may affect our future performance. Forward-looking statements are all statements other than statements of historical facts, such as projections or expectations relating to ore grades and milling rates, production and sales volumes, unit net cash costs, cash production costs per BOE, operating cash flows, capital expenditures, exploration efforts and results, development and production activities and costs, liquidity, tax rates, the impact of copper, gold, molybdenum, cobalt, crude oil and natural gas price changes, the impact of derivative positions, the impact of deferred intercompany profits on earnings, reserve estimates, and future dividend payments, debt reduction and share purchases. The words “anticipates,” “may,” “can,” “plans,” “believes,” “potential,” “estimates,” “expects,” “projects,” “targets,” “intends,” “likely,” “will,” “should,” “to be” and any similar expressions are intended to identify those assertions as forward-looking statements. The declaration of dividends is at the discretion of the Board and will depend on our financial results, cash requirements, future prospects, and other factors deemed relevant by the Board.
We caution readers that forward-looking statements are not guarantees of future performance and that our actual results may differ materially from those anticipated, projected or assumed in the forward-looking statements. Important factors that can cause our actual results to differ materially from those anticipated in the forward-looking statements include supply of and demand for, and prices of copper, gold, molybdenum, cobalt, oil and gas, mine sequencing, production rates, industry risks, regulatory changes, political risks, drilling results, the outcome of negotiations with the Indonesian government regarding an amendment to PT-FI's COW, the potential effects of violence in Indonesia, the ability of the parties to satisfy customary closing conditions and consummate the pending sale of our ownership interest in the Candelaria/Ojos del Salado copper mining operations and supporting infrastructure, the resolution of administrative disputes in the Democratic Republic of Congo, weather- and climate-related risks, labor relations, environmental risks, litigation results, currency translation risks and other factors described in more detail under the heading “Risk Factors” in our annual report on Form 10-K for the year ended
December 31, 2013
, and in Part II Item 1A of this report filed with the SEC as updated by our subsequent filings with the SEC.
Investors are cautioned that many of the assumptions on which our forward-looking statements are based are likely to change after our forward-looking statements are made, including for example commodity prices, which we cannot control, and production volumes and costs, some aspects of which we may or may not be able to control. Further, we may make changes to our business plans that could or will affect our results. We caution investors that we do not intend to update forward-looking statements more frequently than quarterly notwithstanding any changes in our assumptions, changes in business plans, actual experience or other changes, and we undertake no obligation to update any forward-looking statements.
89
|
Item 3.
|
Quantitative and Qualitative Disclosures About Market Risk.
|
There have been no material changes in our market risks during the three-month period ended
September 30, 2014
. For additional information on market risks, refer to “Disclosures About Market Risks” included in Part I, Item 2. of our annual report on Form 10-K for the year ended
December 31, 2013
. For projected sensitivities of our operating cash flow to changes in commodity prices, refer to “Outlook” in Part I, Item 2. of this quarterly report on Form 10-Q for the period ended
September 30, 2014
; for projected sensitivities of our provisionally priced copper sales and derivative instruments to changes in commodity prices refer to “Consolidated Results – Revenues” in Part I, Item 2. of this quarterly report on Form 10-Q for the period ended
September 30, 2014
.
|
Item 4.
|
Controls and Procedures.
|
|
(a)
|
Evaluation of disclosure controls and procedures.
Our chief executive officer and chief financial officer, with the participation of management, have evaluated the effectiveness of our “disclosure controls and procedures” (as defined in Rules 13a-15(e) and 15d-15(e) under the Securities Exchange Act of 1934) as of the end of the period covered by this quarterly report on Form 10-Q. Based on their evaluation, they have concluded that our disclosure controls and procedures are effective as of
September 30, 2014
.
|
|
(b)
|
Changes in internal control over financial reporting.
There has been no change in our internal control over financial reporting that occurred during the quarter ended
September 30, 2014
, that has materially affected, or is reasonably likely to materially affect, our internal control over financial reporting.
|
|
|
OTHER INFORMATION
|
|
Item 1.
|
Legal Proceedings.
|
We are involved in numerous legal proceedings that arise in the ordinary course of our business or that are associated with environmental issues arising from legacy operations conducted over the years by Freeport Minerals Corporation (FMC - formerly Freeport-McMoRan Corporation) and its affiliates. We are also involved from time to time in other reviews, investigations and proceedings by government agencies, some of which may result in adverse judgments, settlements, fines, penalties, injunctions or other relief.
Management does not believe, based on currently available information, that the outcome of any proceeding reported in Note 12 and incorporated by reference into Part I, Item 3. “Legal Proceedings” of our annual report on Form 10-K for the year ended
December 31, 2013
, as updated in Note 9 to the financial statements included in our quarterly report on Form 10-Q for the quarter ended March 31, 2014, will have a material adverse effect on our financial condition; although individual outcomes could be material to our operating results for a particular period, depending on the nature and magnitude of the outcome and the operating results for the period.
Item 1A.
Risk Factors.
The risk factor
“Because our Grasberg minerals district is our most significant operating asset, our business may continue to be adversely affected by political, economic and social uncertainties and security risks in Indonesia”,
which was included in FCX’s annual report on Form 10-K for the year ended December 31, 2013, is amended to add the following:
PT Freeport Indonesia (PT-FI) has been engaged in discussions with officials of the Indonesian government since 2012 regarding various provisions of its Contract of Work (COW). The government has sought to modify existing mining contracts, including PT-FI’s COW, to address provisions of Indonesia’s 2009 mining law and subsequent regulations, including with respect to the size of contract concessions, government revenues, domestic processing of minerals, divestment, provision of local services, conversion from a COW to a licensing framework for extension periods, and a requirement that extensions may be applied for only within two years prior to a COW’s expiration.
In January 2014, the Indonesian government published regulations providing that holders of contracts of work with existing processing facilities in Indonesia may continue to export product through January 12, 2017, but established new requirements for the continued export of copper concentrates, including the imposition of a progressive export duty on copper concentrates in the amount of 25 percent in 2014, rising to 60 percent by mid-2016. Regulations published in 2014 require companies to obtain permits issued at six-month intervals to allow exports of products, including copper concentrates.
90
Despite PT-FI’s rights under its COW to export concentrates without the payment of duties, PT-FI was unable to obtain administrative approval for exports and operated at approximately half of its capacity from mid-January 2014 until late-July 2014.
On July 25, 2014, PT-FI and the Indonesian government entered into a Memorandum of Understanding (MOU) under which PT-FI and the government agreed to negotiate an amended COW to address provisions related to the size of PT-FI’s concession area, royalties and taxes, domestic processing and refining, divestment, local content, and continuation of operations post-2021. Execution of the MOU enabled the resumption of concentrate exports, which began in August 2014.
Effective with the signing of the MOU, PT-FI agreed to provide a $115 million assurance bond to support its commitment for smelter development, pay higher royalties on copper, gold and silver and pay export duties set forth in a new regulation issued by the Indonesian government on July 25, 2014.
Among other items, MOU provisions to be addressed in the negotiation of an amended COW include provisions for the development of new copper smelting and refining capacity in Indonesia, which will take into consideration an equitable sharing of costs between PT-FI (and any partners in the project) and the Indonesian government through fiscal incentives and PT-FI’s requirement for assurance of fiscal and legal certainty of its operational rights, provisions for divestment to the Indonesian government and/or Indonesian nationals of up to a 30 percent interest (an additional 20.64 percent interest) in PT-FI at fair value, and continuation of operations from 2022 through 2041. The parties agreed to complete negotiations within a six month period. Under the MOU, no terms of the COW other than those relating to the export duties, smelter bond and royalties described above will be changed until the completion of an amended COW.
The MOU also provides that negotiations for an amended COW will take into consideration PT-FI’s need for assurance of legal and fiscal terms post-2021 for PT-FI to continue with its large-scale investment program for the development of its underground reserves.
The revisions to the COW are expected to result in additional costs for our Indonesian operations. We cannot predict whether we will be successful in reaching a satisfactory agreement on the terms of our long-term mining rights. If we are unable to reach agreement with the government on our long-term rights, we may be required to reduce or defer investments in our underground development projects, which would negatively impact future production and reserves. In addition, we are required to apply for renewal of export permits at six-month intervals and cannot predict if such permits will be granted on a timely basis or whether we will be permitted to export concentrates after January 12, 2017.
In October 2014, Joko “Jokowi” Widodo took office as the president of Indonesia, elected in July 2014, to serve for a five-year term. PT-FI’s COW negotiations are taking place during a period of transition for the Indonesian national government, and we cannot predict what impact the transition will have on the progress or outcome of the negotiations.
On September 27, 2014, four Grasberg workers were fatally injured when a haul truck collided with a light vehicle near the Grasberg open-pit operations. Operations in the Grasberg open pit were temporarily suspended in order to complete internal and government investigations regarding the accident. On October 13, 2014, Indonesian authorities approved the resumption of operations after issuing recommendations on traffic control procedures that have been implemented by PT-FI. Workforce attendance in several operating areas reflect normal levels. However, a large percentage of Grasberg open-pit operators have not reported to their scheduled shifts resulting in reduced production from the open pit during October. These actions conflict with agreed policies and processes in the Collective Labor Agreement (CLA) and PT-FI is working with union leadership regarding this work stoppage to resume normal operations as soon as possible.
On October 27, 2014, PT-FI received notice from union leadership indicating its intention to conduct a 30-day strike beginning on November 6. Following constructive dialogue between PT-FI and union leadership, union leadership advised PT-FI on October 31, 2014, that all strike actions had been canceled.
Except as described above, there have been no material changes to our risk factors as discussed in Part I Item 1A. "Risk Factors" of our annual report on Form 10-K for the year ended
December 31, 2013
.
91
|
Item 2.
|
Unregistered Sales of Equity Securities and Use of Proceeds.
|
|
(c)
|
The following table sets forth information with respect to shares of our common stock purchased by us during the three months ended
September 30, 2014
:
|
|
Period
|
(a) Total Number
of Shares Purchased
|
(b) Average
Price Paid Per Share
|
(c) Total Number of
Shares Purchased as Part
of Publicly Announced Plans or Programs
a
|
(d) Maximum Number
of Shares That May
Yet Be Purchased Under the Plans or Programs
a
|
||||||||||
|
July 1-31, 2014
|
—
|
|
$
|
—
|
|
—
|
|
23,685,500
|
|
|||||
|
August 1-31, 2014
|
—
|
|
$
|
—
|
|
—
|
|
23,685,500
|
|
|||||
|
September 1-30, 2014
|
—
|
|
$
|
—
|
|
—
|
|
23,685,500
|
|
|||||
|
Total
|
—
|
|
$
|
—
|
|
—
|
|
23,685,500
|
|
|||||
|
a.
|
On July 21, 2008, our Board of Directors approved an increase in our open-market share purchase program for up to 30 million shares. There have been no purchases under this program since 2008. This program does not have an expiration date.
|
|
Item 4.
|
Mine Safety Disclosure.
|
The safety and health of all employees is our highest priority. Management believes that safety and health considerations are integral to, and compatible with, all other functions in the organization and that proper safety and health management will enhance production and reduce costs. Our approach towards the safety and health of our workforce is to continuously improve performance through implementing robust management systems and providing adequate training, safety incentive and occupational health programs. The information concerning mine safety violations or other regulatory matters required by Section 1503(a) of the Dodd-Frank Wall Street Reform and Consumer Protection Act and Item 104 of Regulation S-K is included in Exhibit 95.1 to this quarterly report on Form 10-Q.
92
|
Item 5.
|
Other Information.
|
(a) Completion of Disposition of Assets; Pro Forma Financial Information.
The following unaudited pro forma condensed financial statements (the Pro Forma Financial Statements) have been prepared to reflect the sale of FCX's 80 percent ownership interests in the Candelaria and Ojos del Salado mining operations to Lundin Mining Corporation (Lundin), which was completed on November 3, 2014 (the sale transaction). For additional information, see Part I, Item II "Operations - South America Mining" in this report on Form 10-Q.
The unaudited pro forma condensed balance sheet is presented as if the sale transaction had occurred on September 30, 2014. The unaudited pro forma condensed statements of income for the year ended December 31, 2013, and the nine months ended September 30, 2014, are presented as if the sale transaction had occurred on January 1, 2013. The historical consolidated financial information has been adjusted to reflect factually supportable items that are directly attributable to the sale transaction and, with respect to the statements of income only, expected to have a continuing impact on the combined results.
The Pro Forma Financial Statements have been prepared using the sale of assets method of accounting under accounting principles generally accepted in the United States (U.S.). The sale transaction is subject to closing adjustments that have not yet been finalized. Accordingly, the pro forma adjustments are preliminary, and have been made solely for the purpose of providing Pro Forma Financial Statements as required by the U.S. Securities and Exchange Commission (SEC) rules. Differences between these preliminary estimates and the final sale accounting may be material.
The Pro Forma Financial Statements are provided for informational purposes only and do not purport to represent what the actual consolidated results of operations or the consolidated financial position of FCX would have been had the sale transaction occurred on the dates assumed, nor are they necessarily indicative of future consolidated results of operations or consolidated financial position. The Pro Forma Financial Statements should be read in conjunction with (i) the accompanying notes to the Pro Forma Financial Statements; (ii) the audited consolidated financial statements and accompanying notes of FCX contained in its annual report on Form 10-K for the year ended December 31, 2013; and (iii) the unaudited condensed consolidated financial statements and accompanying notes of FCX contained in this quarterly report on Form 10-Q for the quarterly period ended September 30, 2014.
Affiliates of FCX own an effective 56 percent interest in Tenke Fungurume Mining S.A.R.L. (TFM), with the remaining ownership interests held by affiliates of Lundin (an effective 24 percent interest) and La Generale des Carrieres et des Mines (Gecamines), which is wholly owned by the government of the Democratic Republic of Congo (DRC) (a 20 percent non-dilutable interest). TFM holds copper and cobalt mining concessions in the Katanga province of the DRC, and affiliates of FCX operate the mine. Affiliates of FCX also own and operate a cobalt chemical refinery in Kokkola, Finland, and related sales and marketing business, through a joint venture with affiliates of Lundin and Gecamines, with ownership interests similar to the interests in TFM. The consideration in the sale transaction was determined through arms-length bargaining.
93
FREEPORT-McMoRan INC.
AT SEPTEMBER 30, 2014
(in millions)
|
Historical
|
Adjustments
|
||||||||||||||||||
|
FCX
|
Candelaria/Ojos del Salado
|
Pro Forma
(1)
|
Sale
(2)
|
Pro Forma
|
|||||||||||||||
|
ASSETS
|
|||||||||||||||||||
|
Current assets:
|
|||||||||||||||||||
|
Cash and cash equivalents
|
$
|
658
|
|
$
|
121
|
|
$
|
—
|
|
$
|
1,852
|
|
A
|
$
|
2,389
|
|
|||
|
Trade and other accounts receivable
|
2,307
|
|
197
|
|
94
|
|
—
|
|
2,204
|
|
|||||||||
|
Inventories
|
5,489
|
|
124
|
|
—
|
|
—
|
|
5,365
|
|
|||||||||
|
Other current assets
|
577
|
|
7
|
|
(1
|
)
|
—
|
|
569
|
|
|||||||||
|
Total current assets
|
9,031
|
|
449
|
|
93
|
|
1,852
|
|
10,527
|
|
|||||||||
|
Property, plant, equipment and development costs, net
|
26,304
|
|
663
|
|
—
|
|
—
|
|
25,641
|
|
|||||||||
|
Oil and natural gas properties, net - full cost method
|
22,337
|
|
—
|
|
—
|
|
—
|
|
22,337
|
|
|||||||||
|
Long-term mill and leach stockpiles
|
2,569
|
|
438
|
|
—
|
|
—
|
|
2,131
|
|
|||||||||
|
Goodwill and other assets
|
3,735
|
|
59
|
|
(19
|
)
|
1
|
|
3,658
|
|
|||||||||
|
Total assets
|
$
|
63,976
|
|
$
|
1,609
|
|
$
|
74
|
|
$
|
1,853
|
|
$
|
64,294
|
|
||||
|
LIABILITIES AND EQUITY
|
|||||||||||||||||||
|
Current liabilities
|
$
|
6,343
|
|
$
|
138
|
|
$
|
94
|
|
$
|
405
|
|
A
|
$
|
6,704
|
|
|||
|
Long-term debt, less current portion
|
17,975
|
|
—
|
|
—
|
|
—
|
|
17,975
|
|
|||||||||
|
Deferred income taxes
|
7,559
|
|
—
|
|
—
|
|
(179
|
)
|
B
|
7,380
|
|
||||||||
|
Reclamation and environmental obligations, less current portion
|
3,654
|
|
36
|
|
—
|
|
—
|
|
3,618
|
|
|||||||||
|
Other liabilities
|
1,730
|
|
56
|
|
3
|
|
—
|
|
1,677
|
|
|||||||||
|
Total liabilities
|
37,261
|
|
230
|
|
97
|
|
226
|
|
37,354
|
|
|||||||||
|
Redeemable noncontrolling interest
|
749
|
|
—
|
|
—
|
|
—
|
|
749
|
|
|||||||||
|
Total stockholders' equity
|
21,591
|
|
1,140
|
|
(23
|
)
|
1,627
|
|
22,055
|
|
|||||||||
|
Noncontrolling interests
|
4,375
|
|
239
|
|
—
|
|
—
|
|
4,136
|
|
|||||||||
|
Total equity
|
25,966
|
|
1,379
|
|
(23
|
)
|
1,627
|
|
26,191
|
|
|||||||||
|
Total liabilities and equity
|
$
|
63,976
|
|
$
|
1,609
|
|
$
|
74
|
|
$
|
1,853
|
|
$
|
64,294
|
|
||||
NOTES TO THE UNAUDITED PRO FORMA CONDENSED BALANCE SHEET
|
(1)
|
Pro Forma Adjustments
|
Pro forma adjustments reflect reversal of the elimination of intercompany balances (such as intercompany receivables/payables) primarily between the Candelaria and Ojos del Salado mining complex (Candelaria/Ojos) and Atlantic Copper, FCX's wholly owned copper smelter.
|
(2)
|
Sale Adjustments
|
|
A.
|
Represents adjusted gross cash proceeds of $1.85 billion from the sale of Candelaria/Ojos and $405 million for income taxes related to the sale of Candelaria/Ojos.
|
|
B.
|
Adjustment reflects the reversal of $179 million of deferred withholding taxes associated with FCX's tax liability for its share of undistributed earnings from Candelaria/Ojos.
|
94
FREEPORT-McMoRan INC.
(in millions, except per share amounts)
|
Year Ended December 31, 2013
|
|||||||||||||||
|
Historical
|
|||||||||||||||
|
FCX
|
Candelaria/Ojos del Salado
|
Pro Forma Adjustments
(1)
|
Pro Forma
|
||||||||||||
|
Revenues
|
$
|
20,921
|
|
$
|
1,518
|
|
$
|
274
|
|
$
|
19,677
|
|
|||
|
Total operating costs and expenses
|
15,570
|
|
834
|
|
222
|
|
14,958
|
|
|||||||
|
Operating income
|
5,351
|
|
684
|
|
52
|
|
4,719
|
|
|||||||
|
Interest expense and other, net
|
(438
|
)
|
5
|
|
—
|
|
(443
|
)
|
|||||||
|
Income before taxes and equity in affiliated companies' net earnings
|
4,913
|
|
689
|
|
52
|
|
4,276
|
|
|||||||
|
Provision for income taxes
|
(1,475
|
)
|
(252
|
)
|
(18
|
)
|
(1,241
|
)
|
|||||||
|
Equity in affiliated companies' net earnings
|
3
|
|
—
|
|
—
|
|
3
|
|
|||||||
|
Net income
|
3,441
|
|
437
|
|
34
|
|
3,038
|
|
|||||||
|
Net income and preferred dividends attributable to noncontrolling interests
|
(783
|
)
|
(96
|
)
|
(8
|
)
|
(695
|
)
|
|||||||
|
Net income attributable to FCX common stockholders
|
$
|
2,658
|
|
$
|
341
|
|
$
|
26
|
|
$
|
2,343
|
|
|||
|
Net income per share attributable to FCX common stockholders:
|
|||||||||||||||
|
Basic
|
$
|
2.65
|
|
$
|
2.34
|
|
|||||||||
|
Diluted
|
$
|
2.64
|
|
$
|
2.33
|
|
|||||||||
|
Weighted-average common shares outstanding:
|
|||||||||||||||
|
Basic
|
1,002
|
|
1,002
|
|
|||||||||||
|
Diluted
|
1,006
|
|
1,006
|
|
|||||||||||
|
Nine Months Ended September 30, 2014
|
|||||||||||||||
|
Historical
|
|||||||||||||||
|
FCX
|
Candelaria/Ojos del Salado
|
Pro Forma Adjustments
(1)
|
Pro Forma
|
||||||||||||
|
Revenues
|
$
|
16,203
|
|
$
|
769
|
|
$
|
238
|
|
$
|
15,672
|
|
|||
|
Total operating costs and expenses
|
12,807
|
|
541
|
|
214
|
|
12,480
|
|
|||||||
|
Operating income
|
3,396
|
|
228
|
|
24
|
|
3,192
|
|
|||||||
|
Interest expense and other, net
|
(372
|
)
|
8
|
|
—
|
|
(380
|
)
|
|||||||
|
Income before taxes and equity in affiliated companies' net earnings
|
3,024
|
|
236
|
|
24
|
|
2,812
|
|
|||||||
|
Provision for income taxes
|
(1,034
|
)
|
(80
|
)
|
(8
|
)
|
(962
|
)
|
|||||||
|
Equity in affiliated companies' net earnings
|
—
|
|
—
|
|
—
|
|
—
|
|
|||||||
|
Net income
|
1,990
|
|
156
|
|
16
|
|
1,850
|
|
|||||||
|
Net income and preferred dividends attributable to noncontrolling interests
|
(446
|
)
|
(24
|
)
|
(3
|
)
|
(425
|
)
|
|||||||
|
Net income attributable to FCX common stockholders
|
$
|
1,544
|
|
$
|
132
|
|
$
|
13
|
|
$
|
1,425
|
|
|||
|
Net income per share attributable to FCX common stockholders:
|
|||||||||||||||
|
Basic
|
$
|
1.48
|
|
$
|
1.37
|
|
|||||||||
|
Diluted
|
$
|
1.47
|
|
$
|
1.36
|
|
|||||||||
|
Weighted-average common shares outstanding:
|
|||||||||||||||
|
Basic
|
1,039
|
|
1,039
|
|
|||||||||||
|
Diluted
|
1,045
|
|
1,045
|
|
|||||||||||
95
NOTE TO THE UNAUDITED PRO FORMA CONDENSED STATEMENTS OF INCOME
|
(1)
|
Pro Forma Adjustments
|
Candelaria/Ojos revenues include sales to Atlantic Copper that are eliminated in FCX's consolidated results. The pro forma adjustments primarily reflect recognition of these previously eliminated intercompany sales and purchases.
|
Item 6.
|
Exhibits.
|
The exhibits to this report are listed in the Exhibit Index beginning on Page E-1 hereof.
FREEPORT-McMoRan INC.
SIGNATURE
Pursuant to the requirements of the Securities Exchange Act of 1934, the registrant has duly caused this report to be signed on its behalf by the undersigned hereunto duly authorized.
|
FREEPORT-McMoRan INC.
|
||
|
By:
|
/s/ C. Donald Whitmire, Jr.
|
|
|
C. Donald Whitmire, Jr.
|
||
|
Vice President and
|
||
|
Controller - Financial Reporting
|
||
|
(authorized signatory
|
||
|
and Principal Accounting Officer)
|
||
Date:
November 7, 2014
96
|
FREEPORT-McMoRan INC.
|
|||||
|
EXHIBIT INDEX
|
|||||
|
|
|
Filed
|
|
||
|
Exhibit
|
|
with this
|
Incorporated by Reference
|
||
|
Number
|
Exhibit Title
|
Form 10-Q
|
Form
|
File No.
|
Date Filed
|
|
Stock Purchase Agreement, dated as of October 6, 2014, among LMC Candelaria SpA, LMC Ojos del Salado SpA and Freeport Minerals Corporation
|
X
|
||||
|
3.1
|
Composite Certificate of Incorporation of FCX
|
10-Q
|
001-11307-01
|
8/8/2014
|
|
|
3.2
|
Composite By-Laws of FCX as of July 14, 2014
|
8-K
|
001-11307-01
|
7/2/2014
|
|
|
4.1
|
Indenture dated as of February 13, 2012, between FCX and U.S. Bank National Association, as Trustee (relating to the 1.4% Senior Notes due 2015, the 2.15% Senior Notes due 2017, and the 3.55% Senior Notes due 2022)
|
8-K
|
001-11307-01
|
2/13/2012
|
|
|
4.2
|
First Supplemental Indenture dated as of February 13, 2012, between FCX and U.S. Bank National Association, as Trustee (relating to the 1.4% Senior Notes due 2015)
|
8-K
|
001-11307-01
|
2/13/2012
|
|
|
4.3
|
Second Supplemental Indenture dated as of February 13, 2012, between FCX and U.S. Bank National Association, as Trustee (relating to the 2.15% Senior Notes due 2017)
|
8-K
|
001-11307-01
|
2/13/2012
|
|
|
4.4
|
Third Supplemental Indenture dated as of February 13, 2012, between FCX and U.S. Bank National Association, as Trustee (relating to the 3.55% Senior Notes due 2022)
|
8-K
|
001-11307-01
|
2/13/2012
|
|
|
4.5
|
Fourth Supplemental Indenture dated as of May 31, 2013, among FCX, Freeport-McMoRan Oil & Gas LLC and U.S. Bank National Association, as Trustee (relating to the 1.4% Senior Notes due 2015, the 2.15% Senior Notes due 2017, and the 3.55% Senior Notes due 2022)
|
8-K
|
001-11307-01
|
6/3/2013
|
|
|
4.6
|
Indenture dated as of March 7, 2013, between FCX and U.S. Bank National Association, as Trustee (relating to the 2.375% Senior Notes due 2018, the 3.100% Senior Notes due 2020, the 3.875% Senior Notes due 2023, and the 5.450% Senior Notes due 2043)
|
8-K
|
001-11307-01
|
3/7/2013
|
|
|
4.7
|
Supplemental Indenture dated as of May 31, 2013, among FCX, Freeport-McMoRan Oil & Gas LLC and U.S. Bank National Association, as Trustee (relating to the 2.375% Senior Notes due 2018, the 3.100% Senior Notes due 2020, the 3.875% Senior Notes due 2023, and the 5.450% Senior Notes due 2043)
|
8-K
|
001-11307-01
|
6/3/2013
|
|
|
4.8
|
Indenture dated as of March 13, 2007, among Plains Exploration & Production Company, the Subsidiary Guarantors parties thereto, and Wells Fargo Bank, N.A., as Trustee (relating to the 8.625% Senior Notes due 2019, the 7.625% Senior Notes due 2020, the 6.625% Senior Notes due 2021, the 6.75% Senior Notes due 2022, the 6.125% Senior Notes due 2019, the 6.5% Senior Notes due 2020, and the 6.875% Senior Notes due 2023)
|
8-K
|
001-31470
|
3/13/2007
|
|
E-1
|
FREEPORT-McMoRan INC.
|
|||||
|
EXHIBIT INDEX
|
|||||
|
|
|
Filed
|
|
||
|
Exhibit
|
|
with this
|
Incorporated by Reference
|
||
|
Number
|
Exhibit Title
|
Form 10-Q
|
Form
|
File No.
|
Date Filed
|
|
4.09
|
Tenth Supplemental Indenture dated as of September 11, 2009 to the Indenture dated as of March 13, 2007, among Plains Exploration & Production Company, the Subsidiary Guarantors parties thereto and Wells Fargo Bank, N.A., as Trustee (relating to the 8.625% Senior Notes due 2019)
|
8-K
|
001-31470
|
9/11/2009
|
|
|
4.10
|
Eleventh Supplemental Indenture dated as of March 29, 2010 to the Indenture dated as of March 13, 2007, among Plains Exploration & Production Company, the Subsidiary Guarantors parties thereto and Wells Fargo Bank, N.A., as Trustee (relating to the 7.625% Senior Notes due 2020)
|
8-K
|
001-31470
|
3/29/2010
|
|
|
4.11
|
Twelfth Supplemental Indenture dated as of March 29, 2011 to the Indenture dated as of March 13, 2007, among Plains Exploration & Production Company, the Subsidiary Guarantors parties thereto and Wells Fargo Bank, N.A., as Trustee (relating to the 6.625% Senior Notes due 2021)
|
8-K
|
001-31470
|
3/29/2011
|
|
|
4.12
|
Thirteenth Supplemental Indenture dated as of November 21, 2011 to the Indenture dated as of March 13, 2007, among Plains Exploration & Production Company, the Subsidiary Guarantors parties thereto and Wells Fargo Bank, N.A., as Trustee (relating to the 6.75% Senior Notes due 2022)
|
8-K
|
001-31470
|
11/22/2011
|
|
|
4.13
|
Fourteenth Supplemental Indenture dated as of April 27, 2012 to the Indenture dated as of March 13, 2007, among Plains Exploration & Production Company, the Subsidiary Guarantors parties thereto and Wells Fargo Bank, N.A., as Trustee (relating to the 6.125% Senior Notes due 2019)
|
8-K
|
001-31470
|
4/27/2012
|
|
|
4.14
|
Sixteenth Supplemental Indenture dated as of October 26, 2012 to the Indenture dated as of March 13, 2007, among Plains Exploration & Production Company, the Subsidiary Guarantors parties thereto and Wells Fargo Bank, N.A., as Trustee (relating to the 6.5% Senior Notes due 2020)
|
8-K
|
001-31470
|
10/26/2012
|
|
|
4.15
|
Seventeenth Supplemental Indenture dated as of October 26, 2012 to the Indenture dated as of March 13, 2007, among Plains Exploration & Production Company, the Subsidiary Guarantors parties thereto and Wells Fargo Bank, N.A., as Trustee (relating to the 6.875% Senior Notes due 2023)
|
8-K
|
001-31470
|
10/26/2012
|
|
|
4.16
|
Eighteenth Supplemental Indenture dated as of May 31, 2013 to the Indenture dated as of March 13, 2007, among Freeport-McMoRan Oil & Gas LLC, as Successor Issuer, FCX Oil & Gas Inc., as Co-Issuer, FCX, as Parent Guarantor, Plains Exploration & Production Company, as Original Issuer, and Wells Fargo Bank, N.A., as Trustee (relating to the 8.625% Senior Notes due 2019, the 7.625% Senior Notes due 2020, the 6.625% Senior Notes due 2021, the 6.75% Senior Notes due 2022, the 6.125% Senior Notes due 2019, the 6.5% Senior Notes due 2020, and the 6.875% Senior Notes due 2023)
|
8-K
|
001-11307-01
|
6/3/2013
|
|
|
4.17
|
Form of Indenture dated as of September 22, 1997, between Phelps Dodge Corporation and The Chase Manhattan Bank, as Trustee (relating to the 7.125% Senior Notes due 2027, the 9.50% Senior Notes due 2031, and the 6.125% Senior Notes due 2034)
|
S-3
|
333-36415
|
9/25/1997
|
|
E-2
|
FREEPORT-McMoRan INC.
|
|||||
|
EXHIBIT INDEX
|
|||||
|
|
|
Filed
|
|
||
|
Exhibit
|
|
with this
|
Incorporated by Reference
|
||
|
Number
|
Exhibit Title
|
Form 10-Q
|
Form
|
File No.
|
Date Filed
|
|
4.18
|
Form of 7.125% Debenture due November 1, 2027 of Phelps Dodge Corporation issued on November 5, 1997, pursuant to the Indenture dated as of September 22, 1997, between Phelps Dodge Corporation and The Chase Manhattan Bank, as Trustee (relating to the 7.125% Senior Notes due 2027)
|
8-K
|
01-00082
|
11/3/1997
|
|
|
4.19
|
Form of 9.5% Note due June 1, 2031 of Phelps Dodge Corporation issued on May 30, 2001, pursuant to the Indenture dated as of September 22, 1997, between Phelps Dodge Corporation and First Union National Bank, as successor Trustee (relating to the 9.50% Senior Notes due 2031)
|
8-K
|
01-00082
|
5/30/2001
|
|
|
4.20
|
Form of 6.125% Note due March 15, 2034 of Phelps Dodge Corporation issued on March 4, 2004, pursuant to the Indenture dated as of September 22, 1997, between Phelps Dodge Corporation and First Union National Bank, as successor Trustee (relating to the 6.125% Senior Notes due 2034)
|
10-K
|
01-00082
|
3/7/2005
|
|
|
10.1
|
Memorandum of Understanding dated as of July 25, 2014, between the Directorate General of Mineral and Coal, the Ministry of Energy and Mineral Resources and PT Freeport Indonesia on Adjustment of the Contract of Work.
|
8-K
|
001-11307-01
|
7/28/2014
|
|
|
Letter from Ernst & Young LLP regarding unaudited interim financial statements.
|
X
|
|
|
|
|
|
Certification of Principal Executive Officer pursuant to Rule 13a-14(a)/15d – 14(a).
|
X
|
|
|
|
|
|
Certification of Principal Financial Officer pursuant to Rule 13a-14(a)/15d – 14(a).
|
X
|
|
|
|
|
|
Certification of Principal Executive Officer pursuant to 18 U.S.C. Section 1350.
|
X
|
|
|
|
|
|
Certification of Principal Financial Officer pursuant to 18 U.S.C Section 1350.
|
X
|
|
|
|
|
|
Mine Safety and Health Administration Safety Data.
|
X
|
|
|
|
|
|
101.INS
|
XBRL Instance Document.
|
X
|
|
|
|
|
101.SCH
|
XBRL Taxonomy Extension Schema.
|
X
|
|
|
|
|
101.CAL
|
XBRL Taxonomy Extension Calculation Linkbase.
|
X
|
|
|
|
|
101.DEF
|
XBRL Taxonomy Extension Definition Linkbase.
|
X
|
|
|
|
|
101.LAB
|
XBRL Taxonomy Extension Label Linkbase.
|
X
|
|
|
|
|
101.PRE
|
XBRL Taxonomy Extension Presentation Linkbase.
|
X
|
|
|
|
E-3
TABLE OF CONTENTS
Part IItem 1. Financial StatementsNote 1. General InformationNote 2. Acquisitions and DispositionsNote 3. Earnings Per ShareNote 4. Inventories, Including Long-term Mill and Leach StockpilesNote 5. Income TaxesNote 6. Debt and Equity TransactionsNote 7. Financial InstrumentsNote 8. Fair Value MeasurementNote 9. Contingencies and CommitmentsNote 10. Business SegmentsNote 11. Guarantor Financial StatementsNote 12. New Accounting StandardsNote 13. Subsequent EventsItem 2. Management's Discussion and Analysis Of Financial Condition and Results Of OperationsItem 3. Quantitative and Qualitative Disclosures About Market RiskItem 4. Controls and ProceduresPart Ii.other InformationPart IIItem 1. Legal ProceedingsItem 1A. Risk FactorsItem 2. Unregistered Sales Of Equity Securities and Use Of ProceedsItem 4. Mine Safety DisclosureItem 5. Other InformationItem 6. Exhibits