F5 NETWORKS, INC.
10-Ks and 10-Qs
|
|
|
|
|
|
|
|
|
|
|
|
|
|
|
|
|
|
|
|
|
|
|
|
|
|
|
|
|
|
|
|
|
|
|
|
|
|
|
|
|
|
|
|
|
|
|
|
|
|
|
|
|
|
|
|
|
|
|
UNITED STATES
SECURITIES AND EXCHANGE COMMISSION
Washington, D.C. 20549
Form 10-K
ANNUAL REPORT PURSUANT TO SECTIONS 13 OR 15(d)
OF THE SECURITIES EXCHANGE ACT OF 1934
(Mark One)
|
x
|
ANNUAL REPORT PURSUANT TO SECTION 13 OR 15(d) OF THE SECURITIES EXCHANGE ACT OF 1934
|
|
For the fiscal year ended September 30, 2016
|
|
or
|
¨
|
TRANSITION REPORT PURSUANT TO SECTION 13 OR 15(d) OF THE SECURITIES EXCHANGE ACT OF 1934
|
|
For the transition period from to .
|
|
Commission File Number 000-26041
F5 Networks, Inc.
(Exact name of Registrant as specified in its charter)
|
WASHINGTON
|
91-1714307
|
|
|
(State or other jurisdiction of
incorporation or organization)
|
(I.R.S. Employer
Identification No.)
|
|
401 Elliott Ave West
Seattle, Washington 98119
(Address of principal executive offices)
(206) 272-5555
(Registrant’s telephone number, including area code)
Securities registered pursuant to Section 12(b) of the Act:
|
Title of Each Class
|
Name of Each Exchange on Which Registered
|
|
|
Common stock, no par value
|
NASDAQ Global Select Market
|
|
Securities registered pursuant to Section 12(g) of the Act:
None
Indicate by check mark if the registrant is a well-known seasoned issuer, as defined in Rule 405 of the Securities Act. Yes
x
No
¨
Indicate by check mark if the registrant is not required to file reports pursuant to Section 13 or Section 15(d) of the Act. Yes
¨
No
x
Indicate by check mark whether the registrant (1) has filed all reports required to be filed by Section 13 or 15(d) of the Securities Exchange Act of 1934 during the preceding 12 months (or for such shorter period that the Registrant was required to file such reports), and (2) has been subject to such filing requirements for the past 90 days. Yes
x
No
¨
Indicate by check mark whether the registrant has submitted electronically and posted on its corporate Web site, if any, every Interactive Data File required to be submitted and posted pursuant to Rule 405 of Regulation S-T (§ 232.405 of this chapter) during the preceding 12 months (or for such shorter period that the registrant was required to submit and post such files). Yes
x
No
¨
Indicate by check mark if disclosure of delinquent filers pursuant to Item 405 of Regulation S-K is not contained herein, and will not be contained, to the best of the Registrant’s knowledge, in definitive proxy or information statements incorporated by reference in Part III of this Form 10-K or any amendment to this Form 10-K.
¨
Indicate by check mark whether the registrant is a large accelerated filer, an accelerated filer, a non-accelerated filer, or a smaller reporting company. See the definitions of “large accelerated filer,” “accelerated filer” and “smaller reporting company” in Rule 12b-2 of the Exchange Act. (Check one):
|
Large accelerated filer
x
|
|
|
Accelerated filer
¨
|
|
|
Non-accelerated filer
¨
|
|
(Do not check if a smaller reporting company)
|
|
Smaller reporting company
¨
|
Indicate by check mark whether the registrant is a shell company (as defined in Rule 12b-2 of the Exchange Act). Yes
¨
No
x
As of
March 31, 2016
, the aggregate market value of the Registrant’s Common Stock held by non-affiliates of the Registrant was
$7,074,870,573
based on the closing sales price of the Registrant’s Common Stock on the NASDAQ Global Select Market on that date.
As of
October 28, 2016
, the number of shares of the Registrant’s common stock outstanding was
65,316,007
.
DOCUMENTS INCORPORATED BY REFERENCE
Information required in response to Part III of this Form 10-K (Items 10, 11, 12, 13 and 14) is hereby incorporated by reference to the specified portions of the Registrant’s Definitive Proxy Statement for the Annual Shareholders Meeting for fiscal year
2016
, which Definitive Proxy Statement shall be filed with the Securities and Exchange Commission pursuant to Regulation 14A within 120 days of the end of the fiscal year to which this Report relates.
F5 NETWORKS, INC.
ANNUAL REPORT ON FORM 10-K
For the Fiscal Year Ended
September 30, 2016
Table of Contents
|
|
|
Page
|
|
PART I
|
||
|
Item 1.
|
||
|
Item 1A.
|
||
|
Item 1B.
|
||
|
Item 2.
|
||
|
Item 3.
|
||
|
Item 4.
|
||
|
Item 5.
|
||
|
Item 6.
|
||
|
Item 7.
|
||
|
Item 7A.
|
||
|
Item 8.
|
||
|
Item 9.
|
||
|
Item 9A.
|
||
|
Item 9B.
|
||
|
Item 10.
|
||
|
Item 11.
|
||
|
Item 12.
|
||
|
Item 13.
|
||
|
Item 14.
|
||
|
Item 15.
|
||
2
Trademarks and Tradenames
3DNS, Access Policy Manager, Acopia, Acopia Networks, Advanced Client Authentication, Advanced Routing, AAM, Application Acceleration Manager, AFM, Advanced Firewall Manager, APM, Application Security Manager, Applications without Constraints, ARX, AskF5, ASM, BIG-IP, BIG-IP EDGE GATEWAY, BIG-IQ, Cloud Extender, CloudFucious, Clustered Multiprocessing, CMP, COHESION, Data Manager, Defense.Net, defense.net [DESIGN], DevCentral, DevCentral [DESIGN], DSI, DNS Express, DSC, Edge Client, Edge Gateway, Edge Portal, ELEVATE, EM, Enterprise Manager, ENGAGE, F5, F5 [DESIGN], F5 Agility, F5 Certified [DESIGN], F5 Labs, F5 Labs [DESIGN], F5 Management Pack, F5 Networks, F5 Synthesis, f5 Synthesis, F5 TMOS, F5 World, Fast Application Proxy, Fast Cache, FirePass, Global Traffic Manager, GTM, GUARDIAN, IBR, Intelligent Browser Referencing, iCall, Intelligent Compression, IPv6 Gateway, iApps, iControl, iHealth, iQuery, iRules, iRules OnDemand, iSession, iWorkflow, L7 Rate Shaping, LC, LineRate, LineRate [DESIGN], LROS, LineRate Operating System, LineRate Point, LineRate Precision, Link Controller, Local Traffic Manager, LTM, Message Security Manager, MobileSafe, MSM, Netcelera, OneConnect, Packet Velocity, Protocol Security Manager, PSM, Policy Enforcement Manager, PEM, Point Load Balancer, Ready Defense, Real Traffic Policy Builder, SAM, ScaleN, Secure Access Manager, Signaling Delivery Controller, SDC, Solutions for an application world, Software Defined Application Services, SDAS, SalesXchange, SalesXchange [DESIGN], Silverline, SSL Acceleration, SSL Everywhere, SSL Orchestrator, StrongBox, SuperVIP, SYN Check, Synthesis, Synthesis [DESIGN], TCP Express, TechXchange, TechXchange [DESIGN], TotALL, TDR, TMOS, Traffic Management Operating System, TrafficShield, Traffix, Traffix [DESIGN], Transparent Data Reduction, UNITY, VAULT, VE F5 [DESIGN], Versafe, Versafe [DESIGN], VIPRION, vCMP, Virtual Clustered Multiprocessing, WA, WAN Optimization Manager, WAN Optimization Module, WANJet, WebAccelerator, WebSafe, WOM, and ZoneRunner are trademarks or service marks of F5 Networks, Inc., or its subsidiaries in the U.S. and other countries. Any other trademarks, service marks and/or trade names appearing in this document are the property of their respective owners.
Unless the context otherwise requires, in this Annual Report on Form 10-K, the terms “F5 Networks,” “the Company,” “we,” “us,” and “our” refer to F5 Networks, Inc. and its subsidiaries. Our fiscal year ends on September 30, and fiscal years are referred to by the calendar year in which they end. For example, “fiscal year
2016
” and “fiscal
2016
” refer to the fiscal year ended
September 30, 2016
.
Forward-Looking Statements
This Annual Report on Form 10-K contains forward-looking statements within the meaning of Section 21E of the Securities Exchange Act of 1934 and Section 27A of the Securities Act of 1933. These statements include, but are not limited to, statements about our plans, objectives, expectations, strategies, intentions or other characterizations of future events or circumstances and are generally identified by the words “expects,” “anticipates,” “intends,” “plans,” “believes,” “seeks,” “estimates,” and similar expressions. These forward-looking statements are based on current information and expectations and are subject to a number of risks and uncertainties. Our actual results could differ materially and adversely from those expressed or implied by these forward-looking statements. Factors that could cause or contribute to such differences include, but are not limited to, those discussed under “Item 1A. Risk Factors” below and in other documents we file from time to time with the Securities and Exchange Commission. We assume no obligation to revise or update any such forward-looking statements.
|
Item 1.
|
Business
|
General
F5 Networks is the leading developer and provider of software defined application services designed to ensure that applications delivered over Internet Protocol (IP) networks are secure, fast and available to any user, anywhere, anytime, on any device. Our core technology is a full-proxy, programmable, massively-scalable software platform called TMOS (Traffic Management Operating System).
Introduced in 2004, the TMOS platform supports the industry’s broadest array of application services, including local and global traffic management, network and application security, access management, web acceleration and a number of other network and application services. These services are available as software modules that can run individually or as part of an integrated solution on our high-performance, scalable, purpose-built BIG-IP appliances and chassis-based VIPRION systems; or as software-only Virtual Editions that run on major hypervisors in public and private clouds. Our cloud-based Silverline software-as-a-service (SaaS) offerings allow customers to subscribe to online denial-of-service protection and application security services. In conjunction with our BIG-IQ management software, the availability of our application services as software on our purpose-built hardware, software-only and Silverline subscription services gives customers the flexibility to create a dynamic hybrid infrastructure with consistent policies and centralized management across public and private clouds as well as traditional data centers.
3
The core features and functions of TMOS enable our products to inspect and modify the content of IP traffic flows at network speeds and sessions between users and applications and support a broad and growing array of services. iRules, a built-in scripting language, enables customers and third parties to write customized rules to inspect and modify traffic. TMOS also has an open software interface called iControl, which allows our products to communicate with one another and with third-party products; a set of powerful features called iApps that speed deployment of our services and give users an application-centric view of how applications are managed and delivered; and a scripting framework called iCall that lets users configure their F5 devices inline.
The majority of our revenue today is derived from sales of BIG-IP and VIPRION products. Our hardware products include our BIG-IP family of appliances and our scalable VIPRION systems, and a new line of security appliances. These purpose-built devices integrate industry-standard components, such as Intel based general-purpose processors, high performance cryptographic offload components, and FPGAs (Field-Programmable Gate Arrays). The architecture of these systems is designed to accelerate and optimize the performance of our software by offloading repetitive, compute-intensive functions such as encryption and compression to specific components, and enabling complex application-layer processing at network speed. Typically deployed in front of web and application servers, our hardware products deliver massive performance and scalability that enable customers to consolidate multiple application services on a single device. This consolidation reduces their total cost of ownership and helps drive down operating costs by simplifying the management of servers and applications.
As information technology architecture continues to evolve, there is growing demand for software-only application services that can be deployed in virtual environments next to each instance of an application. Our Virtual Edition (VE) products are software-only versions of the same application delivery services we sell as modules on our purpose-built hardware. Designed to run on all standard hypervisors, they are portable across major cloud environments, deliver faster throughput than competing products, and offer the broadest array of integrated application services available. While VEs have lower performance than our hardware-based solutions, they give customers the flexibility to deploy a mix of integrated application services as needed, spin them up and down with each instance of an application, and move them easily between traditional data centers and private or public clouds.
Whether they are deployed as VEs or as modules on our purpose-built hardware, all of our application delivery services can be centrally managed from our BIG-IQ management platform.
In addition to our VEs and hardware-based solutions, our cloud-based Silverline SaaS platform gives customers the option to subscribe to enterprise-grade application delivery services available online. Current Silverline services include DDoS protection and application security. Subscriptions include 24/7 access to our Security Operations Center (SOC) support teams.
Our products also include our Traffix solutions for Diameter signaling and routing, load balancing and gateway connectivity, designed to enable service providers to meet the multiple challenges associated with the growth of mobile data.
In connection with our products, we offer a broad range of services including consulting, training, installation, maintenance and other technical support services.
F5 Networks was incorporated on February 26, 1996 in the State of Washington. Our headquarters is in Seattle, Washington, and our mailing address is 401 Elliott Avenue West, Seattle, Washington 98119. The telephone number at our executive offices is (206) 272-5555. We have subsidiaries or branch offices in Argentina, Australia, Belgium, Brazil, the British Virgin Islands, Canada, Chile, China, Colombia, Croatia, Finland, France, Germany, Hong Kong, India, Israel, Italy, Japan, Kingdom of Saudi Arabia, Malaysia, Mexico, Netherlands, New Zealand, Norway, Poland, Russia, Singapore, South Africa, South Korea, Spain, Sweden, Taiwan, Turkey, the United Arab Emirates and the United Kingdom. Our annual reports on Form 10-K, quarterly reports on Form 10-Q, current reports on Form 8-K and all amendments to those reports are available free of charge on our website, www.f5.com, as soon as reasonably practicable after they are electronically filed with the Securities and Exchange Commission. Copies of these filings may also be obtained by visiting the Public Reference Room of the SEC at 100 F Street, NE, Washington, D.C. 20549, or by calling the SEC at 1-800-SEC-0330. In addition, the SEC maintains a website (www.sec.gov) that contains current, quarterly and annual reports, proxy and information statements and other information regarding issuers that file electronically.
4
Industry Background
Growth and Evolution of IP-Based Infrastructures
Internet Protocol (IP) is a communications language used to deliver applications and data over the Internet. For more than two decades, large business and government organizations have been gradually replacing older data center architectures with IP-based infrastructures, deploying new IP-based applications and replacing or upgrading legacy applications with new IP-enabled versions. This trend has been accompanied by the proliferation of mobile devices such as smartphones, tablets and laptops that allow users to access data and applications from almost anywhere. At the same time, virtualization of data centers and networks and the emergence of public clouds have given rise to dynamic hybrid infrastructures where applications are increasingly hosted off-premise as well as in traditional data centers and can move freely between locations as demand or other circumstances require.
Emergence of the Dynamic Data Center and Hybrid IT Infrastructures
From a broad perspective, the goal of IT organizations is to optimize the secure delivery of applications to users wherever they are and whenever they need them, regardless of where those applications exist. Server virtualization has enabled organizations to group or partition data center resources to meet user demand and reconfigure these virtual resources easily and quickly as demand changes. More recently, Software Defined Networks (SDN) offer organizations ways to reduce costs, increase the flexibility, and simplify the deployment and management of IT infrastructure through network virtualization. Many organizations are also taking advantage of the growing availability of external private and public cloud resources as a flexible, secure and reliable alternative to owning and managing everything themselves. As a result, IT infrastructure has become increasingly dynamic, complex and reliant on IP-based networks for the delivery of applications and data.
At the same time, these changes have created new challenges to the security of IP networks and the applications and data accessible over the Internet. With increasing frequency, sophisticated denial-of-service attacks have exposed a major vulnerability in the security perimeter of corporate networks by overwhelming firewalls and effectively shutting down the networks. In addition, many network-level security threats are directly related to the improper use of the same protocols applications depend on to transmit data. Intrusion detection and prevention devices, which rely on signature databases of known threats, afford some protection against these types of attack. However, they offer no protection against many of the most common threats, including information leakage, content spoofing, cross-site request forgery or “day zero” attacks designed to exploit a variety of application vulnerabilities.
In addition to preventing the threat of attacks designed to disrupt, destroy or block access to network applications, organizations are faced with the equally daunting challenge of controlling access to applications and data. The proliferation of mobile devices has given users with smart phones, tablets, and laptops the ability to access corporate private and public data centers from virtually anywhere. This, in turn, has increased the difficulty of ensuring that mobile users are able to access applications and data for which they are authorized, and that applications and data are protected from access by unauthorized users.
Need to Optimize the Secure Delivery of Applications and Data
With the ongoing evolution and increasing complexity of IT infrastructures, there is a growing need to optimize the secure delivery of applications and data over IP networks. IP-based traffic passing between end-user devices and servers is divided into discrete packets that travel by multiple routes to their destination where they are reassembled. The disassembly, routing, and reassembly of transmissions are relatively straightforward and require little intelligence. By contrast, managing, inspecting, modifying, redirecting and securing application traffic going to and from servers requires intelligent systems capable of performing an expanding array of functions. Broadly speaking, all of those functions are aspects of application delivery.
Application Delivery Services dynamically manage, secure and optimize the flow of traffic between users and servers (physical or virtual), freeing up other resources by offloading common network functions, such as encryption, IPv4/IPv6 translation, compression, authentication, rate-shaping, and a variety of specialized functions, including network and application security services, policy management, and WAN optimization, that would otherwise have to be coded into applications. Since most large enterprises have hundreds — if not thousands — of applications, it isn't practical to replicate these functions within each instance of an application and maintain consistent policies across a broad spectrum of different applications. In traditional data centers, it has been common practice to deploy an array of point products in front of server farms to provide various services, but that typically requires integrating, maintaining and upgrading disparate technologies from different vendors, a process that is time-consuming and expensive in terms of both capital and operating costs. From a security standpoint, it is also much more difficult to audit traffic passing through multiple devices. In such environments, a more practical and efficient solution is a comprehensive set of integrated application delivery services on a single, high-performance device. In virtual and
5
cloud environments where flexibility is a priority, software designed to run on standard hypervisors provides the same services and many of the benefits associated with hardware-based solutions.
Although application delivery services are broadly applicable within enterprise and service provider IT infrastructures, service providers face unique challenges as they attempt to modernize and scale their networks to deal with the flood of data generated by smart phones, tablets, wearables and other mobile devices. To cope with these challenges, service providers are migrating legacy 2G/3G infrastructures to 4G/LTE networks and Evolved Packet Core (EPC) data centers that require an array of network and application services. Today, most of those services are deployed on separate appliances from different vendors, and service providers are actively seeking solutions that will enable them to lower costs and improve reliability and performance by consolidating services and reducing the number of devices. Increasingly, they are also demanding software solutions designed to run on commodity hardware that can be repurposed as needed. To cope with the dramatic increase in signaling traffic associated with 4G/LTE networks, the challenges of migrating legacy infrastructure, and the need to integrate charging and enforcement functions with subscriber data, service providers have also adopted the Diameter signaling protocol as the de facto standard for communication within their evolving data centers.
F5’s Strategy
Our goal is to lead the industry in providing IP network services that ensure the safe, fast and reliable delivery of applications to any user, anywhere, anytime regardless of a user's location or where the application resides. These services include availability, security, performance, mobility, and identity. They also include managing and orchestrating resources, as well as coordinating services across multiple data centers, networks and cloud-based resources. Our products are designed to be strategic points of control in the IT infrastructure that allow business policies to be implemented where information is exchanged. Key components of our strategy include:
Offering a complete, integrated suite of application services.
Since the introduction of TMOS, we have developed TMOS-based versions of our own legacy products, such as Local Traffic Manager (LTM), BIG-IP DNS and Link Controller; new products, such as Advanced Firewall Manager (AFM), Carrier Grade Network Address Translation (CGNAT) and Policy Enforcement Manager (PEM); and products that incorporate acquired technology, including Application Security Manager (ASM), Application Acceleration Manager (AAM), Access Policy Manager (APM) and our end-user protection services, WebSafe and MobileSafe. All of these products are currently available as integrated software modules on our BIG-IP and VIPRION hardware and as Virtual Editions that run on any standard hypervisor. Recently, we introduced our first stand-alone security appliances, DDoS Hybrid Defender and SSL Orchestrator. In addition, we offer online DDoS protection and application security as subscription services on our cloud-based Silverline SaaS platform. Regardless whether these services are deployed as software-only solutions or as modules running on our purpose-built hardware, our BIG-IQ management platform allows customers to apply and update consistent policies across all of their F5 services from a centralized resource. We believe this approach addresses the needs of today's evolving hybrid infrastructures and sharply differentiates our products from our competitors’ offerings.
Investing in technology to meet evolving customer needs.
We meet with our customers often, and we host an annual invitational customer advisory board to ensure that our development efforts are aligned with their needs. We continue to invest in research and development efforts that leverage the unique attributes of our TMOS platform to deliver new features and functions that address the complex, changing needs of our customers. Although the bulk of our investment is software development, concurrent development of tightly integrated hardware that delivers consistent, guaranteed high-performance is a key part of our investment strategy. We also look for opportunities to acquire technologies that will enable us to broaden the scope of our offerings and expand into adjacent markets.
6
Expanding our addressable market.
Since the introduction of TMOS, we have continually expanded our addressable market and the definition of application delivery through the acquisition and development of new technology. In 2003, for example, we entered the market for secure remote access through the acquisition of uRoam, Inc. and its FirePass SSL VPN technology that has become the core of our current Access Policy Manager (APM) offering. The following year we entered the web application firewall market with the acquisition of Magnifire Websystems, Inc. and its TrafficShield security appliance, which became the foundation of our Application Security Manager (ASM). In 2013, we introduced Advanced Firewall Manager (AFM), our network firewall. In 2013, we also continued to expand our security offerings with the acquisition of Versafe, a provider of web anti-fraud, anti-phishing, and anti-malware solutions, and in 2014 we acquired Defense.Net, a cloud-based DDoS protection service that complements our on-premise DDoS solution and is currently available on our Silverline SaaS platform. During fiscal year 2016, we added new standalone security appliances, DDoS Defender and SSL Orchestrator, to our family of security products. These products are all integral components of our comprehensive Security offering and tightly integrated with LTM and the other features and functions available on our products. As a result of this strategy and our development and acquisition of technology in other related markets such as WAN optimization, Java Script programming, and Diameter signaling and routing, we believe our current addressable market is significantly broader and more diverse than the ADC market as industry analysts have traditionally defined it.
Continuing to build and expand relationships with strategic technology partners.
Early on, we developed strategic technology partnerships with enterprise software vendors, such as Microsoft, Oracle, VMware and others, who had an established presence in large enterprises. By taking advantage of iControl, our open application programming interface, and iCall, a scripting framework that provides the ability to define data plane events such as threshold breaches and adjust the behavior of our products accordingly, these vendors were able to equip their applications to control our products in the network, enhancing overall application performance. In return, they provided us significant leverage in the selling process by recommending our products to their customers. More recently, we have worked closely with several of these vendors to develop configurations of our products, called iApps, that are specifically designed to simplify deployment and optimize the performance of their applications. These solutions are available as templates which allow quick and easy configuration of our products for specific applications.
Within the past two years, we have developed partnerships with Cisco, HP, Microsoft and VMware to provide integrated application services for their Software Defined Networking (SDN) offerings. In addition, we have established partnerships with Amazon AWS, Microsoft Azure, VMware vCloud Air, Cisco ACI and many others to provide cloud-based application services and solutions. We plan to continue building on our existing relationships and to extend our competitive edge by developing new strategic partnerships with other technology leaders.
Leveraging DevCentral, our online community of network architects and developers.
Customization of our TMOS-based products using iRules enhances their “stickiness” by allowing customers to solve problems in both their applications and their networks that would be difficult if not impossible to solve by other means. To promote the use of iRules, we host an online community, DevCentral, where customers and partners discuss and share the ways in which they use iRules to solve problems and enhance the security, performance and availability of applications. A corollary benefit is that many of the iRules solutions posted by DevCentral participants have become standard features in new releases of TMOS. DevCentral also provides a valuable window into our customers’ constantly evolving needs that guide our product development.
F5 Solutions
Our integrated family of TMOS-based application services are available as software modules on our purpose-built hardware, as software-only Virtual Editions, or VEs, that run on standard hypervisors, and as online services on our Silverline SaaS platform. These products function as strategic points of control in IP networks, inspecting, modifying and directing traffic to optimize the security, availability and delivery of applications and data to any user, anywhere, anytime and on any device. Our Traffix Diameter signaling and routing solutions address the complex needs of service providers and complement our TMOS-based products by enabling fast, reliable communications among the elements of their legacy infrastructures and their evolving packet-based 4G/LTE networks and data centers. We believe our products offer the most intelligent services and advanced functionality in the marketplace along with performance and flexibility that enable organizations to simplify management of their IP networks and data center operations by integrating disparate resources to reduce operating costs, enhance productivity and improve service to employees, customers and partners.
Since 2004 we have expanded the breadth of features and functionality we offer well beyond the scope of application delivery networking as it has been traditionally defined. Today, we also offer solutions that include application security, secure
7
remote access, firewall protection, WAN optimization, access policy management, carrier grade network address translation, Diameter signaling policy enforcement, and fraud detection, opening up large opportunities in several adjacent markets.
Software
The core of our application delivery technology is TMOS, our Traffic Management Operating System, introduced in September 2004. The full-proxy characteristics of the TMOS architecture enable our products to intercept, inspect and act on the contents of traffic from virtually every type of IP-enabled application. In addition, the modularity of the TMOS architecture allows us to deliver tightly integrated solutions that secure, optimize and ensure the availability of applications and the networks they run on.
Traffic Management Operating System (TMOS)
Since TMOS was launched, we have added thousands of new features designed to interpret and act on specific content in the traffic passing between users and applications. TMOS includes several features and functions that are unique to our products:
|
•
|
iApps is a set of portable, customizable, reusable templates that enable the rapid and predictable deployment of our products in front of dozens of applications from vendors including Cisco, Citrix, Microsoft, Oracle and VMware. iApps also allows customers and partners to create templates that simplify the deployment and provisioning of their own applications.
|
|
•
|
iCall is a control plane scripting framework that provides the ability to define data plane events such as threshold breaches and adjust the behavior of our products accordingly. iCall enables administrators to react to specified data plane events by executing services on the management plane. It can also be used periodically to manage backups or repopulate DNS, or to provide regularly scheduled services such as configuration audits.
|
|
•
|
iRules is a powerful, built-in scripting language that enables users to customize how our products intercept, inspect, transform, and direct inbound or outbound application traffic.
|
|
•
|
Scale
N
is a set of three unique capabilities that enhance the flexibility of our products:
|
|
◦
|
Clustered Multiprocessing (CMP) allows customers to cluster and aggregate processors (cores) within BIG-IP appliances or VIPRION chassis products.
|
|
◦
|
Virtual Clustered Multiprocessing (vCMP) enables the creation of separate virtual instances of TMOS within an appliance or chassis, each with a different configuration and assigned to a different application.
|
|
◦
|
Device Service Clustering (DSC) gives customers the ability to group devices and services across an array of physical and virtual devices (BIG-IP appliances, VIPRION chassis, or Virtual Editions). Devices can be added to or removed from a DSC without disrupting application services, and application services can be independently managed within the cluster.
|
TMOS includes features that enhance the ability of our products to protect and hide networks and applications from denial-of-service attacks and other types of security threats. Other enhancements include gateway support for software defined networks (SDN), symmetrical and asymmetrical application acceleration, subscriber and application aware enforcement for service providers, management and orchestration of multiple devices, and improved visibility that allows customers to monitor and record the performance of applications and users. The latest release of TMOS (BIG-IP 12.1) delivers leading application services with enhanced public cloud integration and more sophisticated security policies for on-premises and hybrid cloud environments. Enhancements in iRules LX enable programmability across traditional, cloud, and hybrid architectures and leverage an extensive Node.js library that allows DevOps teams to create customized services quickly and easily.
Software Modules and Virtual Editions
The features and functions embedded in TMOS support a family of integrated software services that cover a broad range of application-aware network functions from load-balancing to security. These services are available as software modules designed to run on our purpose-built hardware and as software only Virtual Editions designed to run on any standard hypervisor.
|
•
|
Local Traffic Manager (LTM) provides intelligent load-balancing, traffic management and application health checking.
|
|
•
|
BIG-IP DNS (DNS) improves the performance and availability of global applications by intelligently directing users to the closest or best-performing physical, virtual, or cloud environment. In addition, it enhances DNS security by automatically scaling to absorb a rapid increase in queries resulting from a denial-of-service attack and mitigates complex threats from malware and viruses by blocking access to malicious IP domains.
|
8
|
•
|
Link Controller: For organizations with more than one Internet Service Provider (ISP), Link Controller monitors the health and availability of each connection. In the event of a failure, traffic is dynamically directed across other available links so users and external customers stay connected. Link Controller includes an optional compression feature that reduces WAN link bandwidth for lower ISP costs and cuts down on bandwidth bottlenecks for faster application delivery.
|
|
•
|
Advanced Firewall Manager (AFM) is a high-performance network firewall designed to ensure that traffic isn’t interrupted even under the most intense attacks. AFM scales to support millions of concurrent connections per second and uses the flexibility of iRules, sophisticated filtering, immediate blacklisting, and over a hundred built-in threat vectors to identify and mitigate DDoS attacks. We also offer a carrier-class version of AFM designed to meet the rigorous requirements of an S/Gi firewall in service provider networks.
|
|
•
|
Application Security Manager (ASM) is a web application firewall that provides comprehensive, proactive, application-layer protection against both generalized and targeted attacks. Combining a positive security model (“deny all unless allowed”) with signature-based detection, ASM can prevent “day-zero” attacks in addition to known security threats.
|
|
•
|
Access Policy Manager (APM) provides secure, granular, context-aware access to networks and applications while simplifying authentication, authorization, and accounting (AAA) management. Our endpoint security service validates client devices, including personal devices used by employees to access corporate applications and data, to protect organizations from viruses or malware infections, accidental data loss, and rogue device access. This allows users to apply repeatable access policies across many devices, networks, applications and servers with centralized visibility of their authorization infrastructure.
|
|
•
|
Carrier-Grade Network Address Translation (CGNAT) offers a broad set of tools that enables service providers to successfully migrate to IPv6 while continuing to support and interoperate with existing IPv4 devices and content. BIG-IP CGNAT offers service providers tunneling solutions with Dual-Stack Lite capabilities as well as native network address translation solutions such as NAT44 and NAT64. It provides carrier-grade scalability by offering a very high number of IP address translations, very fast NAT translation setup rates, high throughput, and high-speed logging.
|
|
•
|
Policy Enforcement Manager (PEM) offers service providers a comprehensive set of traffic classification capabilities to accurately identify the specific applications and services subscribers are using and how they’re using them. This information allows them to steer application and subscriber traffic to the most appropriate value-added services (such as web caching, video optimization, or parental control) and reduce the burden on other services. PEM also provides deep reporting, enabling service providers to build tailored services and packages based on subscribers’ application usage and traffic classification.
|
All software modules and Virtual Editions can be licensed individually. In addition, our “Better” and “Best” offerings bundle certain modules or VEs and are sold at a discount to the price customers would pay if each of the included items were purchased separately. We also offer a variety of licensing options for VEs, including subscriptions, utility pricing, and volume licensing.
Cloud-Based Subscription Services
|
•
|
Silverline is a SaaS platform that allows customers to subscribe to application services running on our own high-performance, massively-scalable hardware in cloud-based points of presence around the globe. Two services are currently available on Silverline: DDoS protection and Web Application Firewall (WAF). Depending on the level of protection they require, customers can route traffic through Silverline 24/7 or only when an attack is detected. For customers who want to minimize the upfront costs and expense of maintaining on-premise solutions, these services are an easy and affordable alternative. For large enterprises, subscribing to these services in conjunction with our on-premise DDoS solution (AFM) and application firewall (ASM) can provide a first line of defense against attacks before they reach the data center.
|
Other Subscription Services
|
•
|
WebSafe and MobileSafe are software modules that inject code into traffic between a large enterprise, such as a major financial institution, and its online customers or clients. The code is then downloaded transparently onto the client device and provides real-time protection against malware, phishing, and other cyberthreats, including fraud, without any impact to the user experience. WebSafe protects against all web-based threat types, and MobileSafe protects against advanced threats targeting the mobile user.
|
|
•
|
Secure Web Gateway Services is a function of APM that protects enterprises against both inbound and outbound malware. Integrated with cloud-based threat intelligence provided by Websense, Secure Web Gateway enables enterprises to manage user access to websites, as well as to hundreds of web-based applications, protocols, and videos, ensuring adherence to corporate acceptable use policies, and compliance regulations.
|
9
|
•
|
IP Intelligence uses contextual awareness and analysis of traffic and constantly refreshed data from a global threat-sensor network to block threats from a dynamic set of high-risk IP addresses.
|
Diameter Signaling and Routing
|
•
|
Traffix Signaling Delivery Controller: The Diameter signaling protocol is a de facto standard adopted by service providers to deal with the massive increase in signaling traffic that has accompanied the mobile industry’s transition to 4G/LTE networks. The Traffix Signaling Delivery Controller (SDC) is a software platform consolidating Traffix’s widely deployed Diameter Gateway, Diameter Load Balancer and Diameter Router solutions to deliver cost-effective connectivity, scalability and control to service providers migrating from legacy infrastructures to LTE and IMS networks. Traffix SDC solutions include interoperability of legacy and next-generation networks, mobile and fixed elements, and all third-party vendors.
|
Hardware
All of our purpose-built hardware products are designed to enhance the performance of our software. Currently we offer two types of hardware configurations: BIG-IP appliances; and our chassis-based VIPRION products. Both BIG-IP and VIPRION run TMOS and support all of our product software modules. We also sell specialty appliances that integrate specific software services and are only available as standalone products.
Data sheets for all of our hardware platforms are available in the products section of our website.
BIG-IP Appliances
Products in our family of BIG-IP appliances differ primarily in their performance characteristics resulting from the hardware components and configurations that make up each system. Our current line of BIG-IP appliances includes BIG-IP 2000 series, BIG-IP 4000 series, BIG-IP 5000 series, BIG-IP 7000 series, BIG-IP 10000 series and BIG-IP 12000 series. During the fourth quarter of fiscal year 2016, we began the rollout of a complete refresh of the BIG-IP appliance family that will replace all current products and is scheduled for completion during the first quarter of fiscal year 2017. Enhancements in performance, scalability and hardware programmability will enable all the new products to run all of our software services, including virtual clustered multiprocessing (vCMP), which allows complete segmentation of BIG-IP systems into independent virtual BIG-IPs.
VIPRION Chassis-Based Systems
Currently we offer four chassis-based systems: VIPRION 4800, VIPRION 4480, VIPRION 2400 and VIPRION 2200. VIPRION’s unique architecture distributes traffic across all available processors and allows customers to add or remove blades without disrupting traffic. It also helps customers simplify their networks by consolidating application delivery services, saving management costs as well as power, space, and cooling in the datacenter. During the third quarter of fiscal year 2016, we introduced the VIPRION 4450 blade for VIPRION 4800 (our 8-blade chassis) and VIPRION 4480 (our 4-blade chassis). Each blade delivers 100Gb of throughput, and a fully loaded VIPRION 4800 can support more than 1 billion concurrent connections.
Management and Orchestration
BIG-IQ Centralized Management
BIG-IQ Centralized Management is an intelligent management framework that enables customers to manage their F5 devices across on-premise data centers and public and private clouds. From a single console, customers can:
|
•
|
Manage up to 200 physical and/or virtual BIG-IP devices, including inventory, status, backups, updates and upgrades, and handle licensing for up to 5,000 virtual devices, spinning them up or down as needed.
|
|
•
|
Manage configurations and policies for F5 security products and view reports and alerts for recognized security events.
|
BIG-IQ Centralized Management is available as a Virtual Edition or as an enterprise-grade appliance.
iWorkflow
iWorkflow is a software platform designed to accelerate the deployment of applications and services, while reducing exposure to the operational risk that comes with manual processes. Available as a virtual appliance, iWorkflow lets customers deploy configurable, administrator-defined application policies, in the form of iApp templates, in minutes rather than days. Compatible with a range of technologies and platforms, including Cisco APIC and VMware NSX, as well as BIG-IP, iWorkflow’s REST API enables easy integration with third-party management and orchestration systems.
10
Product Development
We believe our future success depends on our ability to maintain technology leadership by continuing to improve our products and by developing new products to meet the changing needs of our customers and partners. Our product development organization, which includes product management and marketing, employs standard processes for the development, documentation and quality control of software and systems that are designed to meet these goals. These processes include working with our business development and marketing teams, customers and partners to identify new or improved solutions that meet the evolving needs of our addressable markets.
More than 90 percent of our product development organization is engaged in software development. Our principal software engineering team is located at our headquarters in Seattle, Washington. Product development for APM and PEM is located in San Jose, California. ASM, Traffix SDC and Versafe product development is located in Tel Aviv, Israel. Our hardware engineering team is located in Spokane, Washington, San Jose and Tel Aviv. In addition, we recently opened a dedicated facility for product testing and quality control in Warsaw, Poland.
Members of all our product development teams collaborate closely with one another to ensure the interoperability and performance of our hardware and software systems.
During the fiscal years ended
September 30, 2016
,
2015
and
2014
, we had research and product development expenses of
$334.2 million
,
$296.6 million
, and
$263.8 million
, respectively.
Customers
Our customers include a wide variety of enterprises and service providers among Fortune 1000 and Business Week Global 1000 companies, including those in technology, telecommunications, financial services, transportation, education, manufacturing and healthcare, along with government customers. In fiscal year
2016
, sales outside of the Americas represented
43.6%
of our net revenues. Refer to Note 9 of our consolidated financial statements included in this Annual Report on Form 10-K for additional information regarding our revenues by geographic area.
Sales and Marketing
Sales
We sell our products and services to large enterprise customers and service providers through a variety of channels, including distributors, value-added resellers (VARs) and systems integrators. A substantial amount of our revenue for fiscal year
2016
was derived from these channel sales. Our sales teams work closely with our channel partners and also sell our products and services directly to major accounts.
F5 sales teams.
Our inside sales team generates and qualifies leads for regional sales managers and helps manage accounts by serving as a liaison between the field and internal corporate resources. Our field sales personnel are located in major cities in four sales regions: the Americas (primarily the United States); Europe, the Middle East, and Africa (EMEA); Japan; and the Asia Pacific region (APAC). Field sales personnel work closely with our channel partners to assist them, as necessary, in the sale of our products and services to their customers. We also sell our products and services directly to customers, primarily large enterprises, whose accounts are managed by our major account team. Field systems engineers support our regional sales managers and channel partners by participating in joint sales calls and providing pre-sale technical resources as needed.
Distributors and VARs.
As a key component of our sales strategy, we have established relationships with a number of large national and international distributors, local and specialized distributors and VARs. We derive a majority of our product sales from VARs and rely on our large distributors primarily for fulfillment.
Our agreements with these channel partners are not exclusive and do not prevent them from selling competitive products. These agreements typically have terms of one year with no obligation to renew, and typically do not provide for exclusive sales territories or minimum purchase requirements.
For fiscal year
2016
, sales to four of our worldwide distributors, Westcon Group, Inc., Ingram Micro, Inc., Avnet Technology Solutions and Arrow ECS represented
18.7%
,
14.9%
,
13.3%
and
10.1%
of our total revenues, respectively. Our agreements with these distributors are standard, non-exclusive distribution agreements that renew automatically on an annual basis and generally can be terminated by either party with 30 days written notice prior to the start of any renewal term. The agreements grant Westcon Group, Inc., Ingram Micro, Inc., Avnet Technology Solutions, and Arrow ECS the right to distribute our products to resellers, with no minimum purchase requirements.
11
Systems integrators.
We also market our products through strategic relationships with systems integrators, including Dell Services, HP Enterprise Services and IBM Global Services, who include our products as core components of application deployments or network-based solutions they deploy for their customers. In most cases, systems integrators do not directly purchase our products for resale to their customers. Instead they typically recommend our products as part of broader solutions, such as enterprise resource planning (ERP) or customer relationship management (CRM) solutions that incorporate our products for high availability and enhanced performance.
Resellers and Technology Partners
. Historically, our ability to compete with much larger companies has been strengthened through partnerships with large systems and software vendors. Currently we partner with Dell and Hewlett-Packard, who resell our products, and with other large technology companies, including Microsoft, Oracle, VMware and Cisco, who recommend our products to their customers. Management of these relationships is the responsibility of our business development team, which closely monitors technology companies in adjacent and complementary markets for opportunities to partner with those whose solutions are complementary to ours and could enable us to expand our addressable market.
Marketing
Our marketing strategy is driven by the belief that our continued success depends on our ability to understand and anticipate the dynamic needs of our addressable markets and to develop valuable solutions that meet those needs. In line with this belief, our marketing organization works directly with customers, partners and our product development teams to identify and create innovative solutions to further enhance our leadership position.
To support the growing number of developers using our products, including network and application architects, we continue to promote and expand DevCentral, our on-line community website that provides technical resources to customers, prospects and partners wanting to extend and optimize F5 solutions using iRules and iCall. A key aspect of DevCentral is an on-line forum where developers as well as application and network architects discuss and share solutions they have written with iRules and iCall. At the end of fiscal year
2016
, DevCentral had more than
278,000
registered members.
We also engage in a number of marketing programs and initiatives aimed at promoting our brand and creating market awareness of our technology and products. These include actively participating in industry trade shows and joint marketing events with channel and technology partners, and briefing industry analysts and members of the trade press on our latest products, business relationships and technology partnerships. In addition, we market our products to chief information officers and other information technology professionals through targeted advertising, direct mail and high-profile Web events.
Backlog
At the end of fiscal years
2016
and
2015
, we had product backlog of approximately
$33.4 million
and
$38.1 million
, respectively. Backlog represents orders confirmed with a purchase order for products to be shipped generally within 90 days to customers with approved credit status. Orders are subject to cancellation, rescheduling by customers or product specification changes by customers. Although we believe that the backlog orders are firm, purchase orders may be cancelled by the customer prior to shipment without significant penalty. For this reason, we believe that our product backlog at any given date is not a reliable indicator of future revenues.
Customer Service and Technical Support
We believe that our ability to provide consistent, high-quality customer service and technical support is a key factor in attracting and retaining large enterprise customers. Accordingly, we offer a broad range of support services that include installation, phone support, hardware repair and replacement, software updates, online tools, consulting and training services.
We provide these services directly to end users and also utilize a multi-tiered support model, leveraging the capabilities of our channel partners when applicable. Our technical support staff is strategically located in regional service centers to support our global customer base.
Prior to the installation of our products, our services personnel work with customers to analyze their network needs and determine the best way to deploy our products and configure product features and functions to meet those needs. Our services personnel also provide on-site installation and training services to help customers make optimal use of product features and functions.
Our customers typically purchase a one-year maintenance contract which entitles them to an array of services provided by our technical support team. Maintenance services provided under the contract include online updates, software error correction releases, hardware repair and replacement, and, in the majority of cases, round-the-clock call center support. Free updates of our software are available to customers with a current maintenance contract. We also offer an online, automated,
12
self-help customer support function called “Ask F5” that provides answers to many commonly asked questions, allowing customers to get information and solve problems quickly while significantly reducing the number of calls to our support desk. This enables us to provide comprehensive customer support while keeping our support-related expenses at a manageable, consistent level. We also offer an online service called iHealth, which allows customers to diagnose up-to-the-minute snapshots of their BIG-IP systems. Diagnoses include tailored feedback about configuration issues or code defects, a description of the issue, recommendations for resolution, and a link to further information in the AskF5™ Knowledge Base.
F5 offers training classes for customers on the configuration and use of products, including local and wide area network system administration and management. We have a complete certification program that qualifies our partners and customers for having the appropriate skills to implement and use the functionality of our products. To provide our customers with onsite and remote help, we have a professional services team able to provide a full range of fee-based consulting services, including comprehensive network management, documentation and performance analysis, and capacity planning to assist in predicting future network requirements.
Manufacturing
We outsource the manufacturing of our pre-configured hardware platforms to third party contract manufacturers for assembly according to our specifications.
Our purpose-built systems are manufactured by Flextronics International LTD. Subcontracting activity at Flextronics encompasses prototype builds, full production and direct fulfillment. Flextronics also performs the following activities on our behalf; material procurement, PCB assembly and test, final assembly, system test, quality control, direct shipment and warranty repairs. We provide a rolling forecast that allows our contract manufacturers to stock component parts and other materials, plan capacity and build finished goods inventory in anticipation of end user demand. Flextronics procures components in volumes consistent with our forecast, assembles the products and tests them according to our specifications. Products are then shipped to our distributors, value-added resellers, or end users. Generally, we do not own the components. Title to the products transfers from the contract manufacturers to us and then to our customers upon shipment from a designated fulfillment location. If the components are unused or the products are not sold within specified periods of time, we may incur carrying charges or obsolete material charges for components that our contract manufacturers purchased to build products to meet our forecast or customer orders.
Hardware components for our products consist primarily of commodity parts and certain custom components designed and approved by our hardware engineering group. Most of our components are purchased from sources which we believe are readily available from other suppliers. However, some components used in the assembly of our products are purchased from a single or limited source.
Certain sub-assembly and testing processes of our products are performed at Flextronics' facility in Zhuhai, China. The majority of our sub-assemblies are shipped to Flextronics' Milpitas, California plant for configuration and final testing and eventual distribution to our end users. We also have capabilities to complete this process for some of our products in Flextronics' Zhuhai, China plant for distribution to APAC and Japan end users.
Competition
The expanding capabilities of our product offerings have enabled us to address a growing array of market opportunities, many of which are outside the bounds of the application delivery networking market as defined and measured by industry analysts such as Gartner Group, Dell’Oro and others. In addition to server load-balancing, traffic management and other functions normally associated with application delivery, our suite of integrated product modules has expanded our addressable market into security, WAN optimization, application acceleration, policy management, and Diameter signaling and routing, where we compete with a growing number of companies not included among traditional ADC vendors. The ability to create custom network services using iRules, iControl and iCall has also enabled us, our customers, and our partners to design solutions to problems for which there is no off-the-shelf solution. As a result, we believe the traditional definitions of our market do not encompass all of the features, functions and capabilities of our products or accurately represent the addressable market for those products.
Within the more narrowly defined traditional ADC market, several companies sell server load-balancing products. These include Brocade Communications Systems, Inc., Citrix Systems, Inc. and a number of smaller competitors: A10 Networks, Array Networks, Inc., Barracuda Networks, Inc., Kemp Technologies, and Radware Ltd.
In related markets we compete with the following:
|
•
|
Cisco, Juniper Networks and Checkpoint Systems in the network firewall market;
|
13
|
•
|
Cisco, Imperva, Citrix and Barracuda Networks in the web application firewall market;
|
|
•
|
Cisco, Juniper and A10 in Carrier Grade NAT;
|
|
•
|
Procera, Allot, Sandvine and other DPI vendors with our PEM offerings;
|
|
•
|
Oracle via the acquisition of Tekelec and Acme Packet in the Diameter signaling market;
|
|
•
|
IBM in end-user protection against malware, phishing and other cyberthreats;
|
|
•
|
Akamai Networks in cloud-based DDoS protection; and
|
|
•
|
Blue Coat Systems in protecting enterprises from inbound and outbound malware.
|
The principal competitive factors in the markets in which we compete include product features and performance, customer support, brand recognition, the scope of distribution and sales channels and pricing. Certain of our competitors have employed and may in the future adopt aggressive pricing policies to gain market share. However, because of the superior performance, broad functionality and unique capabilities of our products, which have resulted in high levels of customer satisfaction and growing brand awareness, we believe that we can and will compete effectively against such pricing policies.
Intellectual Property
We rely on a combination of patent, copyright, trademark and trade secret laws and restrictions on disclosure to protect our intellectual property rights. F5 holds
283
patents in the United States and has
46
international patents (with applications pending for various aspects of our technology). Our future success depends in part on our ability to protect our proprietary rights to the technologies used in our principal products. Despite our efforts to protect our proprietary rights, unauthorized parties may attempt to copy aspects of our products or to obtain and use trade secrets or other information that we regard as proprietary. In addition, the laws of some foreign countries do not protect our proprietary rights as fully as do the laws of the United States. Any issued patent may not preserve our proprietary position, and competitors or others may develop technologies similar to or superior to our technology. Our failure to enforce and protect our intellectual property rights could harm our business, operating results and financial condition.
In addition to our own proprietary software, we incorporate software licensed from several third-party sources into our products. These are generally term licenses which may renew annually and that generally provide for certain rights and licenses to support our customers post termination. While we may not be able to renew certain of these licenses in the future, we believe that alternative technologies for these licenses are available both domestically and internationally.
Employees
As of
September 30, 2016
, we had
4,395
full-time employees, including
1,202
in product development,
1,617
in sales and marketing,
1,120
in professional services and technical support and
456
in accounting and finance, administration and operations. None of our employees is represented by a labor union. We have experienced no work stoppages and believe that our employee relations are good.
Executive Officers of the Registrant
The following table sets forth certain information with respect to our executive officers as of
November 4, 2016
:
|
Name
|
Age
|
Position
|
|||
|
John McAdam
|
65
|
|
President, Chief Executive Officer, and Director
|
||
|
John DiLullo
|
50
|
|
Executive Vice President of Worldwide Sales
|
||
|
Edward J. Eames
|
58
|
|
Executive Vice President and Chief Operations Officer
|
||
|
Benjamin Gibson
|
48
|
|
Executive Vice President and Chief Marketing Officer
|
||
|
Ryan Kearny
|
47
|
|
Executive Vice President of Product Development and Chief Technology Officer
|
||
|
Andy Reinland
|
52
|
|
Executive Vice President and Chief Financial Officer
|
||
|
Scot Rogers
|
49
|
|
Executive Vice President and General Counsel
|
||
John McAdam
served as our President, Chief Executive Officer and member of our Board of Directors from July 2000 until his retirement in July 2015. He subsequently served as Non-Executive Chairman of the Board until December 2015, when
14
he stepped down as Chairman and resumed the role of President and Chief Executive Officer in December 2015, following the resignation of Manuel Rivelo. Mr. McAdam has announced his intention to remain in his current position until the Board hires a replacement. A search for his replacement is currently underway. Prior to joining F5 in 2000, Mr. McAdam served as General Manager of the Web server sales business at International Business Machines Corporation from September 1999 to July 2000. From January 1995 until August 1999, Mr. McAdam served as the President and Chief Operating Officer of Sequent Computer Systems, Inc., a manufacturer of high-end open systems, which was sold to International Business Machines Corporation in September 1999. Mr. McAdam holds a B.S. in Computer Science from the University of Glasgow, Scotland.
John DiLullo
has served as our Executive Vice President of Worldwide Sales since October 2015. Responsible for F5’s global sales strategy, Mr. DiLullo brings over 25 years of experience in global business, sales, market and channel development, operations, and team management. Prior to joining F5, Mr. DiLullo ran the Worldwide Sales and Services team at Aruba Networks, through their acquisition by Hewlett-Packard. Before this role, he served Avaya Communications in three progressive General Manager roles-first as President of Asia-Pacific, then Latin America and Canada, and ultimately the entire Americas Theater. Before joining Avaya, Mr. DiLullo spent seven years at Cisco Systems, most recently as Vice President of Channels, and three years at SonicWALL as Vice President of Sales, Channels, and Field Operations. He holds a B.S. from Villanova University and was a Fellow and Ph.D. candidate at Stanford University.
Edward J. Eames
has served as our Executive Vice President and Chief Operations Officer since October 2015. Mr. Eames joined F5 in October 2000 as our Vice President of Professional Services and was promoted to Executive Vice President of Business Operations in January 2001. Prior to joining F5, Mr. Eames served as Vice President of e-Business Services for International Business Machines Corporation from September 1999 to October 2000. From June 1992 to September 1999, Mr. Eames served as the European Services Director and the Worldwide Vice President of Customer Service for Sequent Computer Systems, Inc., a manufacturer of high-end open systems. Mr. Eames holds a Higher National Diploma in Business Studies from Bristol Polytechnic and in 1994 completed the Senior Executive Program at the London Business School.
Benjamin Gibson
has served as our Executive Vice President and Chief Marketing Officer since August 2016. Prior to joining F5, Mr. Gibson was Chief Marketing Officer at Veritas, where he led the company’s rebranding efforts, following a spin-off from Symantec. Prior to Veritas, Mr. Gibson served as Chief Marketing Officer at Aruba Networks. During his five-year tenure, Aruba doubled in annual revenue as it expanded into new markets. Before joining Aruba, Mr. Gibson spent five years at Cisco Systems, most recently as Vice President of Data Center/Virtualization Marketing, where he ran the outbound marketing strategy and execution for a number of Cisco’s application networking products. Mr. Gibson has a B.A. in Journalism from California State University, Long Beach.
Ryan Kearny
has served as our Executive Vice President of Product Development and Chief Technology Officer since October 2016. Mr. Kearny is responsible for overseeing F5's products and technology roadmap and leading our engineering team. Mr. Kearny joined F5 in 1998 and was named Vice President of Product Development in May 2004 and Senior Vice President of Product Development in January 2012. Prior to joining F5, Mr. Kearny held a variety of software application architect positions with various Northwest companies. Mr. Kearny holds a B.S. in Electrical Engineering from the University of Washington.
Andy Reinland
has served as Executive Vice President since October 2005 and Chief Financial Officer since October 2012. From October 2005 to October 2012, he served as our Chief Finance Officer. Mr. Reinland joined F5 in 1998 as a senior financial analyst and served as our Vice President of Finance from January 2004 to October 2005. Prior to joining F5, Mr. Reinland was Chief Financial Officer for RTIME, Inc., a developer of real-time 3D software for Internet applications, which was acquired by Sony. Mr. Reinland started his career in public accounting. Mr. Reinland holds a B.A. in Business from Washington State University.
Scot Rogers
has served as our Executive Vice President and General Counsel since January 2014. Mr. Rogers has held a variety of positions in F5's legal department since 2005, including most recently as Senior Vice President and Associate General Counsel immediately prior to his promotion to Executive Vice President. From 2002 through 2005, Mr. Rogers was the General Counsel for Xpediate Consulting, a healthcare technology and consulting company located in the San Francisco Bay Area. Prior to becoming a corporate counsel, he spent eight years in private practice as a commercial litigator. Mr. Rogers is a graduate of the University of Texas and holds a J.D. from the Dedman School of Law of Southern Methodist University.
|
Item 1A.
|
Risk Factors
|
In addition to the other information in this report, the following risk factors should be carefully considered in evaluating our company and its business.
15
Our business could be adversely impacted by conditions affecting the information technology market
A substantial portion of our business depends on the demand for information technology by large enterprise customers and service providers. In addition to the challenges presented by new cloud computing models, we are dependent upon the overall economic health of our current and prospective customers and the continued growth and evolution of the Internet. International, national, regional and local economic conditions, such as recessionary economic cycles, protracted economic slowdown or further deterioration of the economy could adversely impact demand for our products. Demand for our products and services depends substantially upon the general demand for application delivery products and associated services, which fluctuates based on numerous factors, including capital spending levels and growth of our current and prospective customers, as well as general economic conditions. Moreover, the purchase of our products is often discretionary and may involve a significant commitment of capital and other resources. Future economic projections for the information technology sector are uncertain as companies continue to reassess their spending for technology projects and embrace new models for delivery of IT services, such as cloud computing and highly orchestrated software defined networking environments. As a result, spending priorities for our current and future customers may vary and demand for our products and services may be impacted. In addition, customer buying patterns are changing over time and more customers seek to rent software on a subscription basis and to reduce their total cost of ownership. These evolving business models could lead to changes in demand and licensing strategies, which could have a material adverse effect on our business, results of operations and financial condition.
Cloud-based computing trends present competitive and execution risks
Customers are transitioning to a hybrid computing environment utilizing various cloud-based software and services accessed via various smart client devices. Pricing and delivery models are evolving and our competitors are developing and deploying cloud-based services for customers. In addition, new cloud infrastructures are enabling the emergence of new competitors including large cloud providers who offer their own ADC functionality as well as smaller companies targeting the growing numbers of "born in the cloud" applications. We are devoting significant resources to develop and deploy our own competing cloud-based software and services strategies. While we believe our expertise and investments in software and infrastructure for cloud-based services provides us with a strong foundation to compete, it is uncertain whether our strategies will attract the customers or generate the revenue required to be successful. In addition to software development costs, we are incurring costs to build and maintain infrastructure to support cloud-computing services. These costs may reduce the operating margins we have previously achieved. Whether we are successful in this new business model depends on our execution in a number of areas, including:
|
•
|
continuing to innovate and bring to market compelling cloud-based services that generate increasing traffic and market share;
|
|
•
|
maintaining the utility, compatibility and performance of our software on the growing array of cloud computing platforms and the enhanced interoperability requirements associated with orchestration of cloud computing environments; and
|
|
•
|
implementing the infrastructure to deliver our own cloud based services.
|
These new business models may reduce our revenues or operating margins and could have a material adverse effect on our business, results of operations and financial condition.
Industry consolidation may result in increased competition
Some of our competitors have made acquisitions or entered into partnerships or other strategic relationships to offer a more comprehensive solution than they had previously offered. We have also entered into large, strategic partnerships to enhance our competitive position in the marketplace. As IT companies attempt to strengthen or maintain their market positions in the evolving application delivery, mobility, cloud networking and cloud platform markets, these companies continue to seek to deliver comprehensive IT solutions to end users and combine enterprise-level hardware and software solutions that may compete with our solutions and which could negatively impact our partnerships. These consolidators or potential consolidators may have significantly greater financial, technical and other resources than we do and may be better positioned to acquire and offer complementary products and services. The companies resulting from these possible combinations may create more compelling product and service offerings and be able to offer greater pricing flexibility or sales and marketing support for such offerings than we can. These heightened competitive pressures could result in a loss of customers or a reduction in our revenues or revenue growth rates, all of which could adversely affect our business, results of operations and financial condition.
We may not be able to compete effectively in the emerging application delivery networking market
The markets we serve are new, rapidly evolving and highly competitive, and we expect competition to persist and intensify in the future. Our principal competitors in the application delivery networking market include Brocade
16
Communications Systems, Inc., Citrix Systems, Inc., Radware Ltd. and A10 Networks. In related ADC markets, we compete with the following:
|
•
|
Cisco, Juniper Networks and Checkpoint Systems in the network firewall market;
|
|
•
|
Cisco, Imperva, Citrix and Barracuda Networks in the web application firewall market;
|
|
•
|
Cisco, Juniper and A10 in Carrier Grade NAT;
|
|
•
|
Procera, Allot, Sandvine and other DPI vendors with our PEM offerings;
|
|
•
|
Oracle via the acquisition of Tekelec and Acme Packet in the Diameter signaling market;
|
|
•
|
IBM in end-user protection against malware, phishing and other cyberthreats;
|
|
•
|
Akamai Networks in cloud-based DDoS protection; and
|
|
•
|
Blue Coat Systems in protecting enterprises from inbound and outbound malware.
|
We expect to continue to face additional competition as new participants enter our markets. As we continue to expand globally, we may see new competitors in different geographic regions. In addition, larger companies with significant resources, brand recognition, and sales channels may form alliances with or acquire competing application delivery networking solutions from other companies and emerge as significant competitors. Potential competitors may bundle their products or incorporate an Internet traffic management or security component into existing products in a manner that discourages users from purchasing our products. Any of these circumstances may limit our opportunities for growth and negatively impact our financial performance.
Our success depends on our timely development of new products and features, market acceptance of new product offerings and proper management of the timing of the life cycle of our products
The markets for our products and services are characterized by:
|
•
|
rapid technological change;
|
|
•
|
evolving industry standards;
|
|
•
|
consolidation of network and application functions into existing network infrastructure products;
|
|
•
|
requirements that our products interoperate with those of other IT vendors to enable ease of management;
|
|
•
|
fluctuations in customer demand;
|
|
•
|
changes in customer requirements; and
|
|
•
|
frequent new product and service introductions and enhancements.
|
Our continued success depends on our ability to identify and develop new products and new features for our existing products to meet the demands of these changes, and the acceptance of those products and features by our existing and target customers. In addition, our products must interoperate with our end customers’ IT infrastructure, which often have different specifications, deploy products from multiple vendors, and utilize multiple protocol standards. Our customers’ IT infrastructure is becoming more complex and we may be reliant on orchestration and interoperability with third party vendors on whom we are reliant for testing and support of new product versions and configurations. If we are unable to identify, develop and deploy new products and new product features on a timely basis, our business and results of operations may be harmed.
The current development cycle for our products is on average 12-24 months. The introduction of new products or product enhancements may shorten the life cycle of our existing products, or replace sales of some of our current products, thereby offsetting the benefit of even a successful product introduction, and may cause customers to defer purchasing our existing products in anticipation of the new products. This could harm our operating results by decreasing sales, increasing our inventory levels of older products and exposing us to greater risk of product obsolescence. We have also experienced, and may in the future experience, delays in developing and releasing new products and product enhancements. This has led to, and may in the future lead to, delayed sales, increased expenses and lower quarterly revenue than anticipated. Also, in the development of our products, we have experienced delays in the prototyping of our products, which in turn has led to delays in product introductions. In addition, complexity and difficulties in managing product transitions at the end-of-life stage of a product can create excess inventory of components associated with the outgoing product that can lead to increased expenses. Any or all of the above problems could materially harm our business and results of operations.
17
Our success depends on sales and continued innovation of our application delivery networking product lines
For the fiscal year ended
September 30, 2016
, we derived approximately
98.8%
of our net product revenues, or approximately
46.8%
of our total net revenues, from sales of our application delivery networking (ADN) product lines. We expect to continue to derive a significant portion of our net revenues from sales of our ADN products in the future. Implementation of our strategy depends upon these products being able to solve critical network availability, performance and security problems for our customers. If our ADN products are unable to solve these problems for our customers or if we are unable to sustain the high levels of innovation in our ADN product feature set needed to maintain leadership in what will continue to be a competitive market environment, our business and results of operations will be harmed.
Undetected software or hardware errors or security vulnerabilities may harm our business and results of operations
Our products may contain undetected errors or defects when first introduced or as new versions are released. We have experienced these errors or defects in the past in connection with new products and product upgrades. As our products and customer IT infrastructures become increasingly complex, customers may experience unforeseen errors in implementing our products into their IT environments. We expect that these errors or defects will be found from time to time in new or enhanced products after commencement of commercial shipments. These problems may cause us to incur significant warranty and repair costs, divert the attention of our engineering personnel from our product development efforts and cause significant customer relations problems. We may also be subject to liability claims for damages related to product errors or defects. While we carry insurance policies covering this type of liability, these policies may not provide sufficient protection should a claim be asserted. A material product liability claim may harm our business and results of operations.
Our products must successfully operate with products from other vendors. As a result, when problems occur in a network, it may be difficult to identify the source of the problem. The occurrence of software or hardware problems, whether caused by our products or another vendor’s products, may result in the delay or loss of market acceptance of our products. The occurrence of any of these problems may harm our business and results of operations.
Our products are used to manage critical applications and data for customers and third parties may attempt to exploit security vulnerabilities in our products as well as our internal IT systems. As we continue to focus on the development and marketing of security solutions, we become a bigger target for malicious computer hackers who wish to exploit security vulnerabilities in our products or IT systems. These problems may cause us to incur significant remediation costs, divert the attention of our engineering personnel from our product development efforts and cause significant customer relations problems. Adverse publicity related to security vulnerabilities or damage to a customer’s operations due to exploitation of security vulnerability in our products or IT systems may harm our business and results of operations.
Any errors, defects or vulnerabilities in our products or IT systems could result in:
|
•
|
expenditures of significant financial and product development resources in efforts to analyze, correct, eliminate, or work-around errors and defects or to address and eliminate vulnerabilities;
|
|
•
|
loss of existing or potential customers or channel partners;
|
|
•
|
negative publicity and damage to our reputation;
|
|
•
|
delayed or lost revenue;
|
|
•
|
delay or failure to attain market acceptance;
|
|
•
|
an increase in warranty claims compared with our historical experience, or an increased cost of servicing warranty claims, either of which would adversely affect our gross margins; and
|
|
•
|
litigation, regulatory inquiries, or investigations that may be costly and harm our reputation.
|
We are dependent on various information technology systems, and failures of or interruptions to those systems could harm our business
Many of our business processes depend upon our IT systems, the systems and processes of third parties, and on interfaces with the systems of third parties. For example, our order entry system provides information to the systems of our contract manufacturers, which enables them to build and ship our products. If those systems fail or are interrupted, or if our ability to connect to or interact with one or more networks is interrupted, our processes may function at a diminished level or not at all. This would harm our ability to ship products, and our financial results may be harmed.
In addition, reconfiguring our IT systems or other business processes in response to changing business needs may be time-consuming and costly. To the extent this impacted our ability to react timely to specific market or business opportunities, our financial results may be harmed.
18
Our failure to adequately protect personal information could have a material adverse effect on our business
A wide variety of local, state, national, and international laws, directives and regulations apply to the collection, use, retention, protection, disclosure, transfer, and other processing of personal data. These data protection and privacy-related laws and regulations continue to evolve and may result in ever-increasing regulatory and public scrutiny and escalating levels of enforcement and sanctions and increased costs of compliance. Certain safe-harbor exemptions upon which the Company relies for data transfers have been challenged and may no longer be available to us in the future. Our failure to comply with applicable laws and regulations, or to protect such data, could result in enforcement action against us, including fines, imprisonment of company officials and public censure, claims for damages by end-customers and other affected individuals, damage to our reputation and loss of goodwill (both in relation to existing end-customers and prospective end-customers), any of which could have a material adverse effect on our operations, financial performance, and business. Changing definitions of personal data and personal information, within the European Union, the United States, and elsewhere, especially relating to classification of IP addresses, machine identification, location data, and other information, may limit or inhibit our ability to operate or expand our business, including limiting strategic partnerships that may involve the sharing of data. The evolving data protection regulatory environment may require significant management attention and financial resources to analyze and modify our IT infrastructure to meet these changing requirements all of which could reduce our operating margins and impact our operating results and financial condition.
Our success depends on our key personnel and our ability to hire, retain and motivate qualified executives, sales and marketing, operations, product development and professional services personnel
Our success depends, in large part, on our ability to attract, engage, retain, and integrate qualified executives and other key employees throughout all areas of our business. In order to attract and retain executives and other key employees in a competitive marketplace, we must provide a competitive compensation package, including cash- and equity-based compensation. If we do not obtain the stockholder approval needed to continue granting equity compensation in a competitive manner, our ability to attract, retain, and motivate executives and key employees could be weakened. Failure to successfully hire executives and key employees or the loss of any executives and key employees could have a significant impact on our operations. Further, changes in our management team may be disruptive to our business, and any failure to successfully integrate key new hires or promoted employees could adversely affect our business and results of operations. In addition, we recently announced the Board of Directors has formed a committee to initiate a search for a replacement for John McAdam as the Company’s CEO upon his retirement. The process of searching for and transitioning to a new chief executive could be disruptive to our business and could adversely affect our business and results of operations. The complexity of our application delivery networking products and their integration into existing networks and ongoing support, as well as the sophistication of our sales and marketing effort, requires us to retain highly trained developers, professional services, customer support and sales personnel. Competition for qualified developers, professional services, customer support and sales personnel in our industry is intense, especially in Silicon Valley and Seattle where we have substantial operations and a need for highly skilled personnel, because of the limited number of people available with the necessary technical skills and understanding of our products. Also, to the extent we hire personnel from competitors, we may be subject to allegations that they have been improperly solicited, that they have divulged proprietary or other confidential information, that they have violated non-compete obligations to their prior employers, or that their former employers own their inventions or other work product. Our ability to hire and retain these personnel may be adversely affected by volatility or reductions in the price of our common stock or our ability to get approval from shareholders to offer additional common stock to our employees, since these employees are generally granted restricted stock units. The loss of services of any of our key personnel, the inability to retain and attract qualified personnel in the future or delays in hiring qualified personnel may harm our business and results of operations.
The average selling price of our products may decrease and our costs may increase, which may negatively impact revenues and profits
It is possible that the average selling prices of our products will decrease in the future in response to competitive pricing pressures, increased sales discounts, new product introductions by us or our competitors, as well as the shift to more software consumption based and “as a service based” models, or other factors. Therefore, in order to maintain our profits, we must develop and introduce new products and product enhancements on a timely basis and continually reduce our product costs. Our failure to do so could cause our revenue and profits to decline, which would harm our business and results of operations. In addition, we may experience substantial period-to-period fluctuations in future operating results due to the erosion of our average selling prices.
19
Our business may be harmed if our contract manufacturers are not able to provide us with adequate supplies of our products or if a single source of hardware assembly is lost or impaired
We outsource the manufacturing of our hardware platforms to third party contract manufacturers who assemble these hardware platforms to our specifications. We have experienced minor delays in shipments from contract manufacturers in the past. However, if we experience major delays in the future or other problems, such as inferior quality and insufficient quantity of product, any one or a combination of these factors may harm our business and results of operations. The inability of our contract manufacturers to provide us with adequate supplies of our products or the loss of one or more of our contract manufacturers may cause a delay in our ability to fulfill orders while we obtain a replacement manufacturer and may harm our business and results of operations. In particular, we currently subcontract manufacturing of our application delivery networking products to a single contract manufacturer with whom we do not have a long-term contract. If our arrangement with this single source of hardware assembly was terminated or otherwise impaired, and we were not able to engage another contract manufacturer in a timely manner, our business, financial condition and results of operation could be adversely affected.
If the demand for our products grows, we will need to increase our raw material and component purchases, contract manufacturing capacity and internal test and quality control functions. Any disruptions in product flow may limit our revenue, may harm our competitive position and may result in additional costs or cancellation of orders by our customers.
Our business could suffer if there are any interruptions or delays in the supply of hardware components from our third-party sources
We currently purchase several hardware components used in the assembly of our products from a number of single or limited sources. Lead times for these components vary significantly. The unavailability of suitable components, any interruption or delay in the supply of any of these hardware components or the inability to procure a similar component from alternate sources at acceptable prices within a reasonable time, may delay assembly and sales of our products and, hence, our revenues, and may harm our business and results of operations.
It is difficult to predict our future operating results because we have an unpredictable sales cycle
Our products have a lengthy sales cycle and the timing of our revenue is difficult to predict. Historically, our sales cycle has ranged from approximately two to three months and has tended to lengthen as our products become increasingly complex. Also, as our distribution strategy is focused on a channel model, utilizing value-added resellers, distributors and systems integrators, the level of variability in the length of sales cycle across transactions has increased and made it more difficult to predict the timing of many of our sales transactions. Sales of our products require us to educate potential customers in their use and benefits. Sales of our products are subject to delays from the lengthy internal budgeting, approval and competitive evaluation processes that large enterprises and governmental entities may require. For example, customers frequently begin by evaluating our products on a limited basis and devote time and resources to testing our products before they decide whether or not to purchase. Customers may also defer orders as a result of anticipated releases of new products or enhancements by our competitors or us. As a result, our products have an unpredictable sales cycle that contributes to the uncertainty of our future operating results.
We may not be able to sustain or develop new distribution relationships, and a reduction or delay in sales to significant distribution partners could hurt our business
We sell our products and services through multiple distribution channels in the United States and internationally, including leading industry distributors, value-added resellers, systems integrators, service providers and other indirect channel partners. We have a limited number of agreements with companies in these channels, and we may not be able to increase our number of distribution relationships or maintain our existing relationships. Recruiting and retaining qualified channel partners and training them in our technologies requires significant time and resources. These channel partners may also market, sell and support products and services that are competitive with ours and may devote more resources to the marketing, sales and support of such competitive products. Our indirect sales channel structure could subject us to lawsuits, potential liability, and reputational harm if, for example, any of our channel partners misrepresent the functionality of our products or services to customers or violate laws or our corporate policies. If we are unable to establish or maintain our indirect sales channels, our business and results of operations will be harmed. In addition, four worldwide distributors of our products accounted for
57.0%
of our total net revenue for fiscal year
2016
. Four worldwide distributors of our products accounted for
57.9%
of our total net revenue for fiscal year
2015
. A substantial reduction or delay in sales of our products to these distribution partners, if not replaced by sales to other indirect channel partners and distributors, could harm our business, operating results and financial condition.
20
A portion of our revenue is generated by sales to government entities, which are subject to a number of challenges and risks
Sales to U.S. and foreign, federal, state, and local governmental agency end-customers account for a significant portion of our revenues and we may in the future increase sales to government entities. Sales to government entities are subject to a number of risks. Selling to government entities can be highly competitive, expensive, and time consuming, often requiring significant upfront time and expense without any assurance that these efforts will generate a sale. The substantial majority of our sales to date to government entities have been made indirectly through our channel partners. Government certification requirements for products like ours may change, thereby restricting our ability to sell into the federal government sector until we have attained the revised certification. Government demand and payment for our products and services may be impacted by public sector budgetary cycles and funding authorizations, with funding reductions or delays adversely affecting public sector demand for our products and services. Government entities may have statutory, contractual or other legal rights to terminate contracts with our distributors and resellers for convenience or due to a default, and any such termination may adversely impact our future operating results. Governments routinely investigate and audit government contractors’ administrative processes, and any unfavorable audit could result in the government refusing to continue buying our products and services, a reduction of revenue or fines or civil or criminal liability if the audit uncovers improper or illegal activities, which could adversely impact our operating results in a material way. Finally, for purchases by the U.S. government, the government may require certain products to be manufactured in the United States and other relatively high cost manufacturing locations, and we may not manufacture all products in locations that meet the requirements of the U.S. government, affecting our ability to sell these products to the U.S. government.
Misuse of our products could harm our reputation
Our products may be misused by end-customers or third parties that obtain access to our products. For example, our products could be used to censor private access to certain information on the Internet. Such use of our products for censorship could result in negative publicity and damage to our reputation. In addition, as many of our products are subject to export control regulations, diversion of our products to restricted third parties by others could result in investigations, penalties, fines, trade restrictions and negative publicity that could damage our reputation and materially impact our business, operating results, and financial condition.
Our quarterly and annual operating results may fluctuate in future periods, which may cause our stock price to fluctuate
Our quarterly and annual operating results have varied significantly in the past and could vary significantly in the future, which makes it difficult for us to predict our future operating results. Our operating results may fluctuate due to a variety of factors, many of which are outside of our control, including the changing and recently volatile U.S. and global economic environment, which may cause our stock price to fluctuate. In particular, we anticipate that the size of customer orders may increase as we continue to focus on larger business accounts. A delay in the recognition of revenue, even from just one account, may have a significant negative impact on our results of operations for a given period. In the past, a majority of our sales have been realized near the end of a quarter. Accordingly, a delay in an anticipated sale past the end of a particular quarter may negatively impact our results of operations for that quarter, or in some cases, that fiscal year. Additionally, we have exposure to the credit risks of some of our customers and sub-tenants. Although we have programs in place that are designed to monitor and mitigate the associated risk, there can be no assurance that such programs will be effective in reducing our credit risks adequately. We monitor individual payment capability in granting credit arrangements, seek to limit the total credit to amounts we believe our customers can pay and maintain reserves we believe are adequate to cover exposure for potential losses. If there is a deterioration of a sub-tenant’s or a major customer’s creditworthiness or actual defaults are higher than expected, future losses, if incurred, could harm our business and have a material adverse effect on our operating results. Further, our operating results may be below the expectations of securities analysts and investors in future quarters or years. Our failure to meet these expectations will likely harm the market price of our common stock. Such a decline could occur, and has occurred in the past, even when we have met our publicly stated revenue and/or earnings guidance.
21
Reliance on shipments at the end of the quarter could cause our revenue for the applicable period to fall below expected levels
As a result of customer buying patterns and the efforts of our sales force and channel partners to meet or exceed their sales objectives, we have historically received a substantial portion of sales orders and generated a substantial portion of revenue during the last few weeks of each fiscal quarter. In addition, any significant interruption in our information technology systems, which manage critical functions such as order processing, revenue recognition, financial forecasts, inventory and supply chain management, and trade compliance reviews, could result in delayed order fulfillment and decreased revenue for that fiscal quarter. If expected revenue at the end of any fiscal quarter is delayed for any reason, including the failure of anticipated purchase orders to materialize, our third party contract manufacturers’ inability to manufacture and ship products prior to fiscal quarter-end to fulfill purchase orders received near the end of the fiscal quarter, our failure to manage inventory to meet demand, our inability to release new products on schedule, any failure of our systems related to order review and processing, or any delays in shipments based on trade compliance requirements, our revenue for that quarter could fall below our expectations, resulting in a decline in the trading price of our common stock.
Changes in financial accounting standards may cause adverse unexpected revenue fluctuations and affect our reported results of operations
A change in accounting policies can have a significant effect on our reported results and may even affect our reporting of transactions completed before the change is effective. New pronouncements and varying interpretations of existing pronouncements have occurred with frequency and may occur in the future. Changes to existing rules, or changes to the interpretations of existing rules, could lead to changes in our accounting practices, and such changes could adversely affect our reported financial results or the way we conduct our business.
We may have exposure to greater than anticipated tax liabilities
Our provision for income taxes is subject to volatility and could be adversely affected by nondeductible stock-based compensation, changes in the research and development tax credit laws, earnings being lower than anticipated in jurisdictions where we have lower statutory rates and being higher than anticipated in jurisdictions where we have higher statutory rates, transfer pricing adjustments, not meeting the terms and conditions of tax holidays or incentives, changes in the valuation of our deferred tax assets and liabilities, changes in actual results versus our estimates, or changes in tax laws, regulations, accounting principles or interpretations thereof, including changes to the tax laws applicable to corporate multinationals. The U.S., the European Union and its member states, and a number of other countries are actively pursuing changes in this regard. In addition, like other companies, we may be subject to examination of our income tax returns by the U.S. Internal Revenue Service and other tax authorities. While we regularly assess the likelihood of adverse outcomes from such examinations and the adequacy of our provision for income taxes, there can be no assurance that such provision is sufficient and that a determination by a tax authority will not have an adverse effect on our results of operations.
We are subject to governmental export and import controls that could subject us to liability or impair our ability to compete in international markets
Our products are subject to U.S. export controls and may be exported outside the U.S. only with the required level of export license or through an export license exception because we incorporate encryption technology into our products. In addition, various countries regulate the import of certain encryption technology and have enacted laws that could limit our ability to distribute our products or our customers’ ability to implement our products in those countries. Changes in our products or changes in export and import regulations may create delays in the introduction of our products in international markets, prevent our customers with international operations from deploying our products throughout their global systems or, in some cases, prevent the export or import of our products to certain countries altogether. Any change in export or import regulations or related legislation, shift in approach to the enforcement or scope of existing regulations or change in the countries, persons or technologies targeted by such regulations, could result in decreased use of our products by, or in our decreased ability to export or sell our products to, existing or potential customers with international operations. Any decreased use of our products or limitation on our ability to export or sell our products would likely adversely affect our business, operating results and financial condition.
We may not be able to adequately protect our intellectual property, and our products may infringe on the intellectual property rights of third parties
We rely on a combination of patent, copyright, trademark and trade secret laws, and restrictions on disclosure of confidential and proprietary information to protect our intellectual property rights. Despite our efforts to protect our proprietary rights, unauthorized parties may attempt to copy or otherwise obtain and use our products or technology. Monitoring unauthorized use of our products is difficult, and we cannot be certain that the steps we have taken will prevent
22
misappropriation of our technology, particularly in foreign countries where the laws may not protect our proprietary rights as fully as in the United States.
Our industry is characterized by the existence of a large number of patents and frequent claims and related litigation regarding patent and other intellectual property rights. In the ordinary course of our business, we are involved in disputes and licensing discussions with others regarding their claimed proprietary rights and cannot provide assurance that we will always successfully defend ourselves against such claims and such matters are subject to many uncertainties and outcomes are not predictable with assurance. We expect that infringement claims may increase as the number of products and competitors in our market increases and overlaps occur. Also, as we have gained greater visibility, market exposure and competitive success, we face a higher risk of being the subject of intellectual property infringement claims. If we are found to infringe the proprietary rights of others, or if we otherwise settle such claims, we could be compelled to pay damages or royalties and either obtain a license to those intellectual property rights or alter our products so that they no longer infringe upon such proprietary rights. Any license could be very expensive to obtain or may not be available at all or may require us to make royalty payments which could adversely affect gross margins in future periods. The actual liability in any such matters may be materially different from our estimate, if any, which could result in the need to adjust the liability and record additional expenses. Similarly, changing our products or processes to avoid infringing upon the rights of others may be costly or impractical. In addition, we have initiated, and may in the future initiate, claims or litigation against third parties for infringement of our proprietary rights, or to determine the scope and validity of our proprietary rights or those of our competitors. Any of these claims, whether claims that we are infringing the proprietary rights of others, or vice versa, with or without merit, may be time-consuming, result in costly litigation and diversion of technical and management personnel or require us to cease using infringing technology, develop non-infringing technology or enter into royalty or licensing agreements. Further, our license agreements typically require us to indemnify our customers, distributors and resellers for infringement actions related to our technology, which could cause us to become involved in infringement claims made against our customers, distributors or resellers. Any of the above-described circumstances relating to intellectual property rights disputes could result in our business and results of operations being harmed.
We incorporate open source software into our products. Although we monitor our use of open source closely, the terms of many open source licenses have not been interpreted by U.S. courts, and there is a risk that such licenses could be construed in a manner that could impose unanticipated conditions or restrictions on our ability to commercialize our products. We could also be subject to similar conditions or restrictions should there be any changes in the licensing terms of the open source software incorporated into our products. In either event, we could be required to seek licenses from third parties in order to continue offering our products, to re-engineer our products or to discontinue the sale of our products in the event re-engineering cannot be accomplished on a timely or successful basis, any of which could adversely affect our business, operating results and financial condition.
Many of our products include intellectual property licensed from third parties. In the future, it may be necessary to renew licenses for third party intellectual property or obtain new licenses for other technology. These third party licenses may not be available to us on acceptable terms, if at all. The inability to obtain certain licenses, or litigation regarding the interpretation or enforcement of license rights and related intellectual property issues, could have a material adverse effect on our business, operating results and financial condition. Furthermore, we license some third party intellectual property on a non-exclusive basis and this may limit our ability to protect our intellectual property rights in our products.
Our operating results are exposed to risks associated with international commerce
As our international sales increase, our operating results become more exposed to international operating risks. Additionally, our international sales and operations are subject to a number of risks, including the following:
|
•
|
greater difficulty in enforcing contracts and accounts receivable collection and longer collection periods;
|
|
•
|
the uncertainty of protection for intellectual property rights in some countries;
|
|
•
|
greater risk of unexpected changes in regulatory practices, tariffs, and tax laws and treaties;
|
|
•
|
risks associated with trade restrictions and foreign legal requirements, including the importation, certification, and localization of our products required in foreign countries;
|
|
•
|
greater risk of a failure of foreign employees, partners, distributors, and resellers to comply with both U.S. and foreign laws, including antitrust regulations, the U.S. Foreign Corrupt Practices Act, and any trade regulations ensuring fair trade practices;
|
|
•
|
heightened risk of unfair or corrupt business practices in certain geographies and of improper or fraudulent sales arrangements that may impact financial results and result in restatements of, or irregularities in, financial statements;
|
23
|
•
|
increased expenses incurred in establishing and maintaining office space and equipment for our international operations;
|
|
•
|
greater difficulty in recruiting local experienced personnel, and the costs and expenses associated with such activities;
|
|
•
|
management communication and integration problems resulting from cultural and geographic dispersion;
|
|
•
|
fluctuations in exchange rates between the U.S. dollar and foreign currencies in markets where we do business;
|
|
•
|
economic uncertainty around the world, including continued economic uncertainty as a result of sovereign debt issues in Europe; and
|
|
•
|
general economic and political conditions in these foreign markets.
|
In addition, the June 2016 announcement of the results of the United Kingdom European Union membership referendum (commonly referred to as Brexit) advising for the exit of the United Kingdom from the European Union has created economic, financial, and regulatory uncertainty, which may cause our customers to closely monitor their costs and reduce their spending on our products and services.
We must hire and train experienced personnel to staff and manage our foreign operations. To the extent that we experience difficulties in recruiting, training, managing, and retaining an international staff, and specifically staff related to sales management and sales personnel, we may experience difficulties in sales productivity in foreign markets. We also enter into strategic distributor and reseller relationships with companies in certain international markets where we do not have a local presence. If we are not able to maintain successful strategic distributor relationships internationally or recruit additional companies to enter into strategic distributor relationships, our future success in these international markets could be limited. Business practices in the international markets that we serve may differ from those in the United States and may require us in the future to include terms other than our standard terms in customer contracts. We intend to continue expanding into international markets. Sales outside of the Americas represented
43.6%
and
42.7%
of our net revenues for the fiscal years ended
September 30, 2016
and
2015
, respectively.
These factors and other factors could harm our ability to gain future international revenues and, consequently, materially impact our business, operating results, and financial condition. The expansion of our existing international operations and entry into additional international markets will require significant management attention and financial resources. Our failure to successfully manage our international operations and the associated risks effectively could limit the future growth of our business.
Changes in governmental regulations could negatively affect our revenues
Many of our products are subject to various regulations promulgated by the United States and various foreign governments including, but not limited to, environmental regulations and regulations implementing export license requirements and restrictions on the import or export of some technologies, especially encryption technology. Changes in governmental regulation and our inability or failure to obtain required approvals, permits or registrations could harm our international and domestic sales and adversely affect our revenues, business and operations.
New regulations related to conflict minerals may force us to incur additional expenses and could limit the supply and increase the costs of certain metals and minerals used in the manufacturing of our products
In August 2012, the SEC adopted new requirements under the Dodd-Frank Wall Street Reform and Consumer Protection Act of 2010 (or the Dodd-Frank Act) for companies that use certain minerals and derivative metals (referred to as conflict minerals, regardless of their country of origin) in their products, whether or not these products are manufactured by third parties. The Dodd-Frank Act requires companies to perform due diligence and disclose whether or not such minerals originate from the Democratic Republic of Congo or adjoining countries. We filed a report on Form SD with the SEC regarding such matters on May 31, 2016. These new requirements could adversely affect the sourcing, availability and pricing of minerals or metals used in the manufacture of our products and the numerous components that go into our products all of which could adversely affect our business, financial condition, and operating results. In addition, we will incur additional costs to comply with the disclosure requirements, including costs related to determining the source of any relevant minerals and metals used in our products. We have a complex supply chain and many components are sourced through our contract manufacturer and we may not be able to sufficiently verify the origins for these minerals and metals used in our products through the due diligence procedures that we implement. As a result, we may face reputational challenges with our customers and other stakeholders and possible regulatory risk.
24
We face litigation risks
We are a party to lawsuits in the normal course of our business. Litigation in general, and intellectual property and securities litigation in particular, can be expensive, lengthy and disruptive to normal business operations. Moreover, the results of complex legal proceedings are difficult to predict. Responding to lawsuits has been, and will likely continue to be, expensive and time-consuming for us. An unfavorable resolution of these lawsuits could adversely affect our business, results of operations or financial condition.
Acquisitions present many risks and we may not realize the financial and strategic goals that are contemplated at the time of the transaction
With respect to our past acquisitions, as well as any other future acquisitions we may undertake, we may find that the acquired businesses, products or technologies do not further our business strategy as expected, that we paid more than what the assets are later worth or that economic conditions change, all of which may generate future impairment charges. Our acquisitions may be viewed negatively by customers, financial markets or investors. There may be difficulty integrating the operations and personnel of the acquired business, and we may have difficulty retaining the key personnel of the acquired business. We may have difficulty in integrating the acquired technologies or products with our existing product lines. Our ongoing business and management’s attention may be disrupted or diverted by transition or integration issues and the complexity of managing geographically and culturally diverse locations. We may have difficulty maintaining uniform standards, controls, procedures and policies across locations. We may experience significant problems or liabilities associated with product quality, technology and other matters.
Our inability to successfully operate and integrate newly-acquired businesses appropriately, effectively and in a timely manner, or to retain key personnel of any acquired business, could have a material adverse effect on our ability to take advantage of further growth in demand for integrated traffic management and security solutions and other advances in technology, as well as on our revenues, gross margins and expenses.
Anti-takeover provisions could make it more difficult for a third party to acquire us
Our Board of Directors has the authority to issue up to 10,000,000 shares of preferred stock and to determine the price, rights, preferences, privileges and restrictions, including voting rights, of those shares without any further vote or action by the shareholders. The rights of the holders of common stock may be subject to, and may be adversely affected by, the rights of the holders of any preferred stock that may be issued in the future. The issuance of preferred stock may have the effect of delaying, deferring or preventing a change of control of our company without further action by our shareholders and may adversely affect the voting and other rights of the holders of common stock. Further, certain provisions of our bylaws, including a provision limiting the ability of shareholders to raise matters at a meeting of shareholders without giving advance notice, may have the effect of delaying or preventing changes in control or management of our company, which could have an adverse effect on the market price of our common stock. Similarly, state anti-takeover laws in the State of Washington related to corporate takeovers may prevent or delay a change of control of our company.
Our stock price could be volatile, particularly during times of economic uncertainty and volatility in domestic and international stock markets
Our stock price has been volatile and has fluctuated significantly in the past. The trading price of our stock is likely to continue to be volatile and subject to fluctuations in the future. Some of the factors that could significantly affect the market price of our stock include:
|
•
|
Actual or anticipated variations in operating and financial results;
|
|
•
|
Analyst reports or recommendations;
|
|
•
|
Rumors, announcements or press articles regarding our competitors’ operations, management, organization, financial condition or financial statements; and
|
|
•
|
Other events or factors, many of which are beyond our control.
|
The stock market in general and the market for technology companies in particular, have experienced extreme price and volume fluctuations. These fluctuations have often been unrelated or disproportionate to operating performance. The fluctuations may continue in the future and this could significantly impact the value of our stock and your investment.
25
We face risks associated with having operations and employees located in Israel
We have offices and employees located in Israel. As a result, political, economic, and military conditions in Israel directly affect our operations. The future of peace efforts between Israel and its Arab neighbors remains uncertain. There has been a significant increase in hostilities and political unrest in Israel in the past year. The effects of these hostilities and violence on the Israeli economy and our operations in Israel are unclear, and we cannot predict the effect on us of further increases in these hostilities or future armed conflict, political instability or violence in the region. In addition, many of our employees in Israel are obligated to perform annual reserve duty in the Israeli military and are subject to being called for active duty under emergency circumstances. We cannot predict the full impact of these conditions on us in the future, particularly if emergency circumstances or an escalation in the political situation occurs. If many of our employees in Israel are called for active duty for a significant period of time, our operations and our business could be disrupted and may not be able to function at full capacity. Current or future tensions and conflicts in the Middle East could adversely affect our business, operating results, financial condition and cash flows.
Our business is subject to the risks of earthquakes, fire, power outages, floods, and other catastrophic events, and to interruption by man-made problems such as terrorism
A significant natural disaster, such as an earthquake, a fire, a flood, or a significant power outage could have a material adverse impact on our business, operating results, and financial condition. We have an administrative and product development office and a third party contract manufacturer located in the San Francisco Bay Area, a region known for seismic activity. In addition, natural disasters could affect our supply chain, manufacturing vendors, or logistics providers’ ability to provide materials and perform services such as manufacturing products or assisting with shipments on a timely basis. In the event our or our service providers’ information technology systems or manufacturing or logistics abilities are hindered by any of the events discussed above, shipments could be delayed, resulting in missed financial targets, such as revenue and shipment targets, for a particular quarter. In addition, cyber-attacks, acts of terrorism, or other geo-political unrest could cause disruptions in our business or the business of our supply chain, manufacturers, logistics providers, partners, or end-customers or the economy as a whole. Any disruption in the business of our supply chain, manufacturers, logistics providers, partners or end-customers that impacts sales at the end of a fiscal quarter could have a significant adverse impact on our quarterly results. All of the aforementioned risks may be further increased if the disaster recovery plans for us and our suppliers prove to be inadequate. To the extent that any of the above should result in delays or cancellations of customer orders, or the delay in the manufacture, deployment or shipment of our products, our business, financial condition and operating results would be adversely affected.
In addition to other risks listed in this “Risk Factors” section, factors that may affect our operating results include, but are not limited to:
|
•
|
fluctuations in demand for our products and services due to changing market conditions, pricing conditions, technology evolution, seasonality, or other changes in the global economic environment;
|
|
•
|
changes or fluctuations in sales and implementation cycles for our products and services;
|
|
•
|
changes in the mix of our products and services, including increases in subscription based offerings;
|
|
•
|
changes in the growth rate of the application delivery market;
|
|
•
|
reduced visibility into our customers’ spending and implementation plans;
|
|
•
|
reductions in customers’ budgets for data center and other IT purchases or delays in these purchases;
|
|
•
|
changes in end-user customer attach rates and renewal rates for our services;
|
|
•
|
fluctuations in our gross margins, including the factors described herein, which may contribute to such fluctuations;
|
|
•
|
our ability to control costs, including operating expenses, the costs of hardware and software components, and other manufacturing costs;
|
|
•
|
our ability to develop, introduce and gain market acceptance of new products, technologies and services, and our success in new and evolving markets;
|
|
•
|
any significant changes in the competitive environment, including the entry of new competitors or the substantial discounting of products or services;
|
|
•
|
the timing and execution of product transitions or new product introductions, and related inventory costs;
|
|
•
|
variations in sales channels, product costs, or mix of products sold;
|
26
|
•
|
our ability to establish and manage our distribution channels, and the effectiveness of any changes we make to our distribution model;
|
|
•
|
the ability of our contract manufacturers and suppliers to provide component parts, hardware platforms and other products in a timely manner;
|
|
•
|
benefits anticipated from our investments in sales, marketing, product development, manufacturing or other activities;
|
|
•
|
impacts on our overall tax rate caused by any reorganization in our corporate structure;
|
|
•
|
changes in tax laws or regulations, or other accounting rules; and
|
|
•
|
general economic conditions, both domestically and in our foreign markets.
|
|
Item 1B.
|
Unresolved Staff Comments
|
Not applicable.
|
Item 2.
|
Properties
|
We lease our principal administrative, sales, marketing, research and development facilities, which are located in Seattle, Washington and consist of approximately 320,000 square feet. In April 2010, we amended and restated the lease agreement for three of the buildings that serve as our corporate headquarters. The lease commenced in April, July and August of 2010 for various sections of the first building; and August 2010 for the second and third buildings. The lease for these three buildings will expire in 2022 with an option for renewal. In January 2016, we entered into an agreement to lease approximately 20,000 square feet of additional space in a building near our corporate headquarters. This lease commenced in July of 2016 and will expire in 2022 with an option for renewal. In October 2006, we entered into an agreement to lease a building adjacent to the buildings that serve as our corporate headquarters. This lease will expire in 2018. We are currently subleasing all floors of this building to two subtenants.
We believe that our existing properties are in good condition and suitable for the conduct of our business. We also lease office space for our product development personnel in Spokane, Washington and Bellevue, Washington, San Jose, California,
Louisville, Colorado, Lowell, Massachusetts, Israel, and Poland and for our sales and support personnel in California, Florida, Georgia, Illinois, Kansas, Missouri, New York, Tennessee, Washington D.C., Argentina, Australia, Belgium, Brazil, Canada, China, Denmark, Finland, France, Germany, Hong Kong, India, Indonesia, Italy, Japan, Malaysia, Mexico, Netherlands, New Zealand, the Philippines, Poland, Saudi Arabia, Singapore, South Africa, South Korea, Spain, Sweden, Taiwan, Thailand, Turkey, the United Arab Emirates, the United Kingdom and Vietnam. We believe that our future growth can be accommodated by our current facilities or by leasing additional space if necessary.
|
Item 3.
|
Legal Proceedings
|
See Note 7 - Commitments and Contingencies of the Notes to Financial Statements (Part II, Item 8 of this Form 10-K) for information regarding legal proceedings in which we are involved.
|
Item 4.
|
Mine Safety Disclosures
|
Not applicable.
27
|
Item 5.
|
Market for Registrant’s Common Equity, Related Stockholder Matters and Issuer Purchases of Equity Securities
|
Market Prices of Common Stock
Our common stock is traded on the Nasdaq Global Select Market under the symbol “FFIV.” The following table sets forth the high and low sales prices of our common stock as reported on the Nasdaq Global Select Market.
|
|
Fiscal Year 2016
|
Fiscal Year 2015
|
||||||||||||||
|
|
High
|
Low
|
High
|
Low
|
||||||||||||
|
First Quarter
|
$
|
123.25
|
|
$
|
94.51
|
|
$
|
136.11
|
|
$
|
106.82
|
|
||||
|
Second Quarter
|
$
|
106.86
|
|
$
|
86.03
|
|
$
|
132.99
|
|
$
|
108.60
|
|
||||
|
Third Quarter
|
$
|
124.91
|
|
$
|
93.64
|
|
$
|
128.08
|
|
$
|
111.33
|
|
||||
|
Fourth Quarter
|
$
|
127.13
|
|
$
|
110.86
|
|
$
|
135.20
|
|
$
|
111.43
|
|
||||
The last reported sales price of our common stock on the Nasdaq Global Select Market on
October 28, 2016
was
$134.66
.
As of
October 28, 2016
, there were
55
holders of record of our common stock. As many of our shares of common stock are held by brokers and other institutions on behalf of shareholders, we are unable to estimate the total number of beneficial holders of our common stock represented by these record holders.
Dividend Policy
Our policy has been to retain cash to fund future growth. Accordingly, we have not paid dividends and do not anticipate declaring dividends on our common stock in the foreseeable future.
Unregistered Securities Sold in
2016
We did not sell any unregistered shares of our common stock during the fiscal year
2016
.
Issuer Purchases of Equity Securities
On
April 20, 2016
, we announced that our Board of Directors authorized an additional
$1.0 billion
for our common stock share repurchase program. This new authorization is incremental to the existing
$2.4 billion
program, initially approved in October 2010 and expanded in each fiscal year. Acquisitions for the share repurchase programs will be made from time to time in private transactions or open market purchases as permitted by securities laws and other legal requirements. The programs can be terminated at any time. During fiscal year 2016, we had repurchased and retired
6,608,980
shares at an average price of
$105.94
per share and as of September 30, 2016, we had
$773.7 million
remaining authorized to purchase shares.
28
Shares repurchased and retired as of
September 30, 2016
are as follows (in thousands, except shares and per share data):
|
Total Number
of Shares
Purchased
|
Average Price
Paid per Share
|
Total Number of
Shares Purchased
per the Publicly
Announced Plan
|
Approximate Dollar
Value of Shares
that May Yet be
Purchased
Under the Plan
|
|||||||||||
|
October 1, 2015 — October 31, 2015
|
—
|
|
$
|
—
|
|
—
|
|
$
|
473,867
|
|
||||
|
November 1, 2015 — November 30, 2015
|
1,888,266
|
|
$
|
105.94
|
|
1,888,266
|
|
$
|
273,832
|
|
||||
|
December 1, 2015 — December 31, 2015
|
—
|
|
$
|
—
|
|
—
|
|
$
|
273,832
|
|
||||
|
January 1, 2016 — January 31, 2016
|
1,194,000
|
|
$
|
94.57
|
|
1,194,000
|
|
$
|
160,916
|
|
||||
|
February 1, 2016 — February 29, 2016
|
920,165
|
|
$
|
94.68
|
|
920,165
|
|
$
|
73,790
|
|
||||
|
March 1, 2016 — March 31, 2016
|
—
|
|
$
|
—
|
|
—
|
|
$
|
73,790
|
|
||||
|
April 1, 2016 — April 30, 2016
|
—
|
|
$
|
—
|
|
—
|
|
$
|
1,073,790
|
|
||||
|
May 1, 2016 — May 31, 2016
|
1,000,000
|
|
$
|
106.30
|
|
1,000,000
|
|
$
|
967,490
|
|
||||
|
June 1, 2016 — June 30, 2016
|
399,700
|
|
$
|
109.39
|
|
399,700
|
|
$
|
923,766
|
|
||||
|
July 1, 2016 — July 31, 2016
|
150,000
|
|
$
|
123.78
|
|
150,000
|
|
$
|
905,199
|
|
||||
|
August 1, 2016 — August 31, 2016
|
1,056,849
|
|
$
|
124.39
|
|
1,056,849
|
|
$
|
773,743
|
|
||||
|
September 1, 2016 — September 30, 2016
|
—
|
|
$
|
—
|
|
—
|
|
$
|
773,743
|
|
||||
29
Performance Measurement Comparison of Shareholder Return
The following graph compares the annual percentage change in the cumulative total return on shares of our common stock, the Nasdaq Composite Index and the Nasdaq Computer Index for the period commencing
September 30, 2011
, and ending
September 30, 2016
.
Comparison of Cumulative Total Return
On Investment Since September 30, 2011*
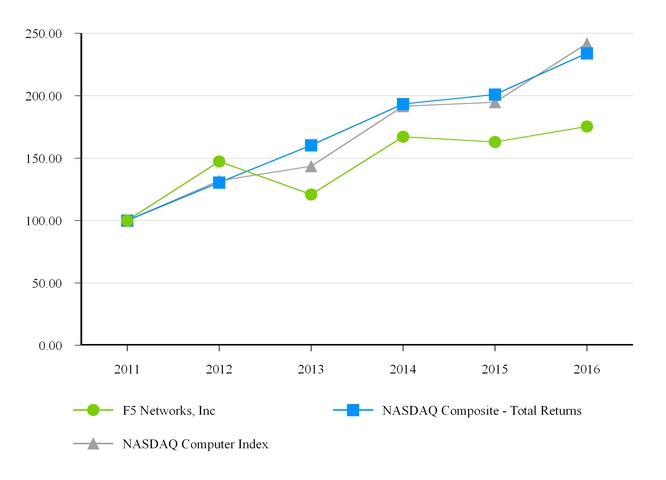
The Company’s closing stock price on
September 30, 2016
, the last trading day of the Company’s
2016
fiscal year, was
$124.64
per share.
|
*
|
Assumes that $100 was invested
September 30, 2011
in shares of Common Stock and in each index, and that all dividends were reinvested. Shareholder returns over the indicated period should not be considered indicative of future shareholder returns.
|
30
|
Item 6.
|
Selected Financial Data
|
The following selected consolidated historical financial data are derived from our audited financial statements. The consolidated balance sheet data as of
September 30, 2016
and
2015
and the consolidated income statement data for the years ended
September 30, 2016
,
2015
and
2014
are derived from our audited consolidated financial statements and related notes that are included elsewhere in this report. The consolidated balance sheet data as of
September 30, 2014
,
2013
and
2012
and the consolidated income statement data for the years ended
September 30, 2013
and
2012
are derived from our audited consolidated financial statements and related notes which are not included in this report. The information set forth below should be read in conjunction with our historical financial statements, including the notes thereto, and “Management’s Discussion and Analysis of Financial Condition and Results of Operations,” included elsewhere in this report.
|
|
Years Ended September 30,
|
|||||||||||||||||||
|
|
2016
|
2015
|
2014
|
2013
|
2012
|
|||||||||||||||
|
|
(In thousands, except per share data)
|
|||||||||||||||||||
|
Consolidated Income Statement Data
|
||||||||||||||||||||
|
Net revenues
|
||||||||||||||||||||
|
Products
|
$
|
944,469
|
|
$
|
991,539
|
|
$
|
936,130
|
|
$
|
798,856
|
|
$
|
818,555
|
|
|||||
|
Services
|
1,050,565
|
|
928,284
|
|
795,916
|
|
682,458
|
|
558,692
|
|
||||||||||
|
Total
|
1,995,034
|
|
1,919,823
|
|
1,732,046
|
|
1,481,314
|
|
1,377,247
|
|
||||||||||
|
Cost of net revenues
|
||||||||||||||||||||
|
Products
|
166,624
|
|
174,225
|
|
158,788
|
|
129,066
|
|
137,102
|
|
||||||||||
|
Services
|
170,581
|
|
158,036
|
|
151,171
|
|
123,981
|
|
99,066
|
|
||||||||||
|
Total
|
337,205
|
|
332,261
|
|
309,959
|
|
253,047
|
|
236,168
|
|
||||||||||
|
Gross profit
|
1,657,829
|
|
1,587,562
|
|
1,422,087
|
|
1,228,267
|
|
1,141,079
|
|
||||||||||
|
Operating expenses
|
||||||||||||||||||||
|
Sales and marketing
|
628,743
|
|
602,540
|
|
558,284
|
|
483,041
|
|
445,595
|
|
||||||||||
|
Research and development
|
334,227
|
|
296,583
|
|
263,792
|
|
209,614
|
|
177,406
|
|
||||||||||
|
General and administrative
|
138,431
|
|
135,540
|
|
106,454
|
|
102,401
|
|
91,775
|
|
||||||||||
|
Loss on facility sublease (1)
|
—
|
|
—
|
|
—
|
|
2,393
|
|
—
|
|
||||||||||
|
Litigation expense (2)
|
9,051
|
|
—
|
|
—
|
|
—
|
|
—
|
|
||||||||||
|
Total
|
1,110,452
|
|
1,034,663
|
|
928,530
|
|
797,449
|
|
714,776
|
|
||||||||||
|
Income from operations
|
547,377
|
|
552,899
|
|
493,557
|
|
430,818
|
|
426,303
|
|
||||||||||
|
Other income, net
|
2,514
|
|
8,445
|
|
3,785
|
|
7,274
|
|
5,911
|
|
||||||||||
|
Income before income taxes
|
549,891
|
|
561,344
|
|
497,342
|
|
438,092
|
|
432,214
|
|
||||||||||
|
Provision for income taxes
|
184,036
|
|
196,330
|
|
186,159
|
|
160,778
|
|
157,028
|
|
||||||||||
|
Net income
|
$
|
365,855
|
|
$
|
365,014
|
|
$
|
311,183
|
|
$
|
277,314
|
|
$
|
275,186
|
|
|||||
|
Net income per share — basic
|
$
|
5.43
|
|
$
|
5.07
|
|
$
|
4.13
|
|
$
|
3.53
|
|
$
|
3.48
|
|
|||||
|
Weighted average shares — basic
|
67,433
|
|
71,944
|
|
75,395
|
|
78,565
|
|
79,135
|
|
||||||||||
|
Net income per share — diluted
|
$
|
5.38
|
|
$
|
5.03
|
|
$
|
4.09
|
|
$
|
3.50
|
|
$
|
3.45
|
|
|||||
|
Weighted average shares — diluted
|
67,984
|
|
72,547
|
|
76,092
|
|
79,136
|
|
79,780
|
|
||||||||||
|
Consolidated Balance Sheet Data
|
||||||||||||||||||||
|
Cash, cash equivalents, and short-term investments
|
$
|
882,395
|
|
$
|
774,342
|
|
$
|
645,379
|
|
$
|
542,143
|
|
$
|
532,151
|
|
|||||
|
Restricted cash (3)
|
1,151
|
|
1,149
|
|
798
|
|
860
|
|
179
|
|
||||||||||
|
Long-term investments
|
276,375
|
|
397,656
|
|
482,917
|
|
728,981
|
|
662,803
|
|
||||||||||
|
Total assets
|
2,306,323
|
|
2,312,290
|
|
2,184,950
|
|
2,230,554
|
|
1,911,201
|
|
||||||||||
|
Long-term liabilities
|
276,823
|
|
240,439
|
|
178,659
|
|
140,492
|
|
115,772
|
|
||||||||||
|
Total shareholders’ equity
|
1,185,262
|
|
1,316,728
|
|
1,369,310
|
|
1,538,712
|
|
1,329,400
|
|
||||||||||
|
(1)
|
Loss on facility sublease expense represents a charge related to the consolidation of certain subleases at our corporate headquarters in Seattle, Washington.
|
|
(2)
|
Litigation expense represents a patent-related jury verdict and legal fees associated with the litigation.
|
|
(3)
|
Restricted cash represents escrow accounts established in connection with lease agreements for our facilities.
|
31
|
Item 7.
|
Management’s Discussion and Analysis of Financial Condition and Results of Operations
|
The following discussion of our financial condition and results of operations contains forward-looking statements within the meaning of Section 21E of the Securities Exchange Act of 1934 and Section 27A of the Securities Act of 1933. These statements include, but are not limited to, statements about our plans, objectives, expectations, strategies, intentions or other characterizations of future events or circumstances and are generally identified by the words “expects,” “anticipates,” “intends,” “plans,” “believes,” “seeks,” “estimates,” and similar expressions. These forward-looking statements are based on current information and expectations and are subject to a number of risks and uncertainties. Our actual results could differ materially from those expressed or implied by these forward-looking statements. Factors that could cause or contribute to such differences include, but are not limited to, those discussed under “Item 1A. Risk Factors” herein and in other documents we file from time to time with the Securities and Exchange Commission. We assume no obligation to revise or update any such forward-looking statements.
Overview
We are a global provider of software-defined application delivery services designed to ensure the fast, secure and reliable delivery of applications and data. Our products include hardware-based software, software-only solutions, cloud-based subscription services and a common management framework that enable customers to accelerate, optimize, secure and manage applications across hybrid computing infrastructures that combine traditional networks and data centers with software-defined networks, virtualized data centers and cloud-based resources. We market and sell our products primarily through multiple indirect sales channels in the Americas (primarily the United States); Europe, the Middle East, and Africa (EMEA); Japan; and the Asia Pacific region (APAC). Enterprise customers (Fortune 1000 or Business Week Global 1000 companies) in the technology, telecommunications, financial services, transportation, education, manufacturing and health care industries, along with government customers, continue to make up the largest percentage of our customer base.
Our management team monitors and analyzes a number of key performance indicators in order to manage our business and evaluate our financial and operating performance on a consolidated basis. Those indicators include:
|
•
|
Revenues.
The majority of our revenues are derived from sales of our application delivery networking (ADN) products including our BIG-IP appliances and high end VIPRION chassis and related software modules; Local Traffic Manager (LTM), DNS Services (formerly Global Traffic Manager); Advanced Firewall Manager (AFM) and Policy Enforcement Manager (PEM), that leverage the unique performance characteristics of our hardware and software architecture; and products that incorporate acquired technology, including Application Security Manager (ASM) and Access Policy Manager (APM); signaling delivery controller products (SDC); and the WebSafe, MobileSafe, Secure Web Gateway and Silverline DDoS and Application security offerings which are sold to customers on a subscription basis. We also derive revenues from the sales of services including annual maintenance contracts, training and consulting services. We carefully monitor the sales mix of our revenues within each reporting period. We believe customer acceptance rates of our new products and feature enhancements are indicators of future trends. We also consider overall revenue concentration by customer and by geographic region as additional indicators of current and future trends.
|
|
•
|
Cost of revenues and gross margins.
We strive to control our cost of revenues and thereby maintain our gross margins. Significant items impacting cost of revenues are hardware costs paid to our contract manufacturers, third-party software license fees, amortization of developed technology and personnel and overhead expenses. Our margins have remained relatively stable; however, factors such as sales price, product and services mix, inventory obsolescence, returns, component price increases and warranty costs could significantly impact our gross margins from quarter to quarter and represent significant indicators we monitor on a regular basis.
|
|
•
|
Operating expenses.
Operating expenses are substantially driven by personnel and related overhead expenses. Existing headcount and future hiring plans are the predominant factors in analyzing and forecasting future operating expense trends. Other significant operating expenses that we monitor include marketing and promotions, travel, professional fees, computer costs related to the development of new products and provision of services, facilities and depreciation expenses.
|
|
•
|
Liquidity and cash flows.
Our financial condition remains strong with significant cash and investments and no long term debt. The decrease in cash and investments for fiscal year
2016
was primarily due to
$700.1 million
of cash used to repurchase outstanding common stock under our share repurchase program, and capital expenditures of
$63.5 million
, partially offset by cash provided by operating activities of
$711.5 million
. Going forward, we believe the primary driver of cash flows will be net income from operations. Capital expenditures for fiscal year
2016
were comprised primarily of information technology infrastructure and equipment to support the growth of our core business activities. We will continue to evaluate possible acquisitions of, or investments in businesses, products, or technologies that we believe are strategic, which may require the use of cash.
|
32
|
•
|
Balance sheet.
We view cash, short-term and long-term investments, deferred revenue, accounts receivable balances and days sales outstanding as important indicators of our financial health. Deferred revenues continued to increase in fiscal
2016
due to growth in the amount of annual maintenance contracts purchased on new products and maintenance renewal contracts related to our existing product installation base. Our days sales outstanding for the fourth quarter of fiscal year
2016
was
46
.
|
Critical Accounting Policies
Our consolidated financial statements have been prepared in accordance with accounting principles generally accepted in the United States of America. The preparation of these financial statements requires us to make estimates and judgments that affect the reported amounts of assets, liabilities, revenues and expenses, and related disclosure of contingent assets and liabilities. We base our estimates on historical experience and on various other assumptions that are believed to be reasonable under the circumstances. Actual results may differ from these estimates under different assumptions or conditions.
We believe the following critical accounting policies affect the more significant estimates and judgments used in the preparation of our financial statements.
Revenue Recognition.
We sell products through distributors, resellers, and directly to end users. Revenue is recognized provided that all of the following criteria have been met:
|
•
|
Persuasive evidence of an arrangement exists. Evidence of an arrangement generally consists of a purchase order issued pursuant to the terms and conditions of a distributor, reseller or end user agreement.
|
|
•
|
Delivery has occurred. We use shipping or related documents, or written evidence of customer acceptance, when applicable, to verify delivery or completion of any performance terms.
|
|
•
|
The sales price is fixed or determinable. We assess whether the sales price is fixed or determinable based on payment terms associated with the transaction and whether the sales price is subject to refund or adjustment.
|
|
•
|
Collectability is reasonably assured. We assess collectability primarily based on the creditworthiness of the customer as determined by credit checks and related analysis, as well as the customer’s payment history.
|
Revenue from the sale of products is generally recognized when the product has been shipped and the customer is obligated to pay for the product. When rights of return are present and we cannot estimate returns, revenue is recognized when such rights of return lapse. Payment terms to domestic customers are generally net 30 days to net 45 days. Payment terms to international customers range from net 30 days to net 120 days based on normal and customary trade practices in the individual markets. We offer extended payment terms to certain customers, in which case, revenue is recognized when payments are due.
Revenues for post-contract customer support (PCS) are recognized on a straight-line basis over the service contract term. PCS includes a limited period of telephone support, updates, repair or replacement of any failed product or component that fails during the term of the agreement, bug fixes and rights to upgrades, when and if available. Consulting services are customarily billed at fixed hourly rates, plus out-of-pocket expenses, and revenues are recognized when the consulting has been completed. Training revenue is recognized when the training has been completed.
Arrangement consideration is first allocated between software (consisting of nonessential and stand-alone software) and non-software deliverables. The majority of our products are hardware appliances which contain software essential to the overall functionality of the products. Hardware appliances are generally sold with PCS and on occasion, with consulting and/or training services. Arrangement consideration in such multiple element transactions is allocated to each element based on a fair value hierarchy, where the selling price for an element is based on vendor specific objective evidence (VSOE), if available, third-party evidence (TPE), if available and VSOE is not available; or the best estimate of selling price (BESP), if neither VSOE or TPE is available.
For software deliverables, we allocate revenue between multiple elements based on software revenue recognition guidance. Software revenue recognition guidance requires revenue earned on software arrangements involving multiple elements to be allocated to each element based on the relative fair values of those elements. The fair value of an element must be based on VSOE. Where fair value of delivered elements is not available, revenue is recognized on the “residual method” based on the fair value of undelivered elements. If evidence of fair value of one or more undelivered elements does not exist, all revenue is deferred and recognized at the earlier of the delivery of those elements or the establishment of fair value of the remaining undelivered elements.
We establish VSOE for our products, PCS, consulting and training services based on the sales price charged for each element when sold separately. The sales price is discounted from the applicable list price based on various factors including the type of customer, volume of sales, geographic region and program level. Our list prices are generally not fair value as discounts
33
may be given based on the factors enumerated above. We use historical sales transactions to determine whether VSOE can be established for each of the elements. In most instances, VSOE of fair value is the sales price of actual standalone (unbundled) transactions within the past 12 month period, when a substantial majority of transactions (more than 80%) are priced within a narrow range, which we have determined to be plus or minus 15% of the median sales price.
We believe that the VSOE of fair value of training and consulting services is represented by the billable rate per hour, based on the rates charged to customers when they purchase standalone training or consulting services. The price of consulting services is not based on the type of customer, volume of sales, geographic region or program level.
We are typically not able to determine VSOE or TPE for non-software products. TPE is determined based on competitor prices for similar elements when sold separately. Generally, our go-to-market strategy differs from that of other competitive products or services in its markets and our offerings contain a significant level of differentiation such that the comparable pricing of products with similar functionality cannot be obtained. Furthermore, we are unable to reliably determine the selling prices on a stand-alone basis of similar products offered by our competitors.
When we are unable to establish selling price using VSOE or TPE, we use BESP in our allocation of arrangement consideration. The objective of BESP is to determine the price at which we would transact a sale if the product or service were sold on a stand-alone basis. We have been able to establish BESP through the list price, less a discount deemed appropriate to maintain a reasonable gross margin. Management regularly reviews gross margin information at the consolidated level. Non-software product BESP is determined through our review of historical sales transactions within the past 12 month period. Additional factors considered in determining an appropriate BESP include, but are not limited to, cost of products, pricing practices, geographies, customer classes, and distribution channels.
We regularly validate the VSOE of fair value and BESP for elements in its multiple element arrangements. We account for taxes collected from customers and remitted to governmental authorities on a net basis and excluded these amounts from revenues.
Reserve for Doubtful Accounts.
Estimates are used in determining our allowance for doubtful accounts and are based upon an assessment of selected accounts and as a percentage of our remaining accounts receivable by aging category. In determining these percentages, we evaluate historical write-offs, current trends in the credit quality of our customer base, as well as changes in the credit policies. We perform ongoing credit evaluations of our customers’ financial condition and do not require any collateral. If there is deterioration of a major customer’s credit worthiness or actual defaults are higher than our historical experience, our allowance for doubtful accounts may not be sufficient.
Reserve for Product Returns.
In some instances, product revenue from distributors is subject to agreements allowing rights of return. Product returns are estimated based on historical experience and are recorded at the time revenues are recognized. Accordingly, we reduce recognized revenue for estimated future returns at the time revenue is recorded. When rights of return are present and we cannot estimate returns, revenue is recognized when such rights lapse. The estimates for returns are adjusted periodically based upon changes in historical rates of returns and other related factors. It is possible that these estimates will change in the future or that the actual amounts could vary from our estimates.
Accounting for Income Taxes.
We are required to estimate our income taxes in each of the jurisdictions in which we operate as part of the process of preparing our consolidated financial statements. This process involves estimating our actual current tax exposure, including assessing the risks associated with tax audits, together with assessing temporary differences resulting from the different treatment of items for tax and accounting purposes. These differences result in deferred tax assets and liabilities. Due to the evolving nature and complexity of tax rules combined with the large number of jurisdictions in which we operate, it is possible that our estimates of our tax liability could change in the future, which may result in additional tax liabilities and adversely affect our results of operations, financial condition and cash flows.
Stock-based Compensation.
We account for stock-based compensation using the straight-line attribution method for recognizing compensation expense over the requisite service period of the related award. We recognized
$156.8 million
and
$145.6 million
of stock-based compensation expense for the years ended
September 30, 2016
and
2015
, respectively. As of
September 30, 2016
, there was
$119.1 million
of total unrecognized stock-based compensation cost, the majority of which will be recognized over the next
two
years. Going forward, stock-based compensation expenses may increase as we issue additional equity-based awards to continue to attract and retain key employees.
We issue incentive awards to our employees through stock-based compensation consisting of restricted stock units (RSUs). The value of RSUs is determined using the fair value method, which in this case, is based on the number of shares granted and the quoted price of our common stock on the date of grant.
34
We recognize compensation expense for only the portion of RSUs that are expected to vest. Therefore, we apply estimated forfeiture rates that are derived from historical employee termination behavior. Based on historical differences with forfeitures of stock-based awards granted to our executive officers and Board of Directors versus grants awarded to all other employees, we developed separate forfeiture expectations for these two groups.
We recognize compensation costs for awards with performance conditions when we conclude it is probable that the performance condition will be achieved. We reassess the probability of vesting at each balance sheet date and adjust compensation costs based on our probability assessment.
Common stock repurchase.
On
April 20, 2016
, we announced that our Board of Directors authorized an additional
$1.0 billion
for our common stock share repurchase program. This new authorization is incremental to the existing
$2.4 billion
program, initially approved in October 2010 and expanded in each fiscal year. Acquisitions for the share repurchase programs will be made from time to time in private transactions or open market purchases as permitted by securities laws and other legal requirements. The programs can be terminated at any time. During fiscal year 2016, we repurchased and retired
6,608,980
shares at an average price of
$105.94
per share and as of September 30, 2016, we had
$773.7 million
remaining authorized to purchase shares.
Goodwill and acquired intangible assets.
Goodwill represents the excess purchase price over the estimated fair value of net assets acquired as of the acquisition date. We test goodwill for impairment on an annual basis and between annual tests when impairment indicators are identified. Goodwill is written down when impaired. Goodwill was recorded in connection with the acquisition of Defense.Net, Inc. in fiscal year 2014, Versafe Ltd. and LineRate Systems, Inc. in fiscal year 2013, Traffix Systems in fiscal year 2012, Acopia Networks, Inc. in fiscal year 2007, Swan Labs, Inc. in fiscal year 2006, MagniFire Websystems, Inc. in fiscal year 2004 and uRoam, Inc. in fiscal year 2003. For our annual goodwill impairment test in all periods to date, we have operated under one reporting unit and the fair value of the reporting unit has been determined by the Company’s enterprise value. We perform our annual goodwill impairment test during the second fiscal quarter.
As part of the annual goodwill impairment test, we first perform a qualitative assessment to determine whether further impairment testing is necessary. If, as a result of its qualitative assessment, it is more-likely-than-not (i.e. greater than 50% chance) that the fair value of our reporting unit is less than its carrying amount, the quantitative impairment test will be required. Otherwise, no further testing will be required.
Examples of events and circumstances that might indicate that a reporting unit’s fair value is less than its carrying amount include macro-economic conditions such as deterioration in the entity’s operating environment or industry or market considerations; entity-specific events such as increasing costs, declining financial performance, or loss of key personnel; or other events such as an expectation that a reporting unit will be sold or a sustained decrease in the stock price on either an absolute basis or relative to peers.
If it is determined, as a result of the qualitative assessment, that it is more-likely-than-not that the fair value of our reporting unit is less than its carrying amount, the provisions of authoritative guidance require that we perform a two-step impairment test on goodwill. The first step of the test identifies whether potential impairment may have occurred, while the second step of the test measures the amount of the impairment, if any. Impairment is recognized when the carrying amount of goodwill exceeds its fair value. In March 2016, we completed a qualitative assessment of potential impairment indicators and concluded that it was more-likely-than-not that the fair value of our reporting unit exceeded its carrying amount. The Company considered potential impairment indicators of goodwill and acquired intangible assets at
September 30, 2016
and noted no indicators of impairment.
Software development costs.
The authoritative guidance requires certain internal software development costs related to software to be sold to be capitalized upon the establishment of technological feasibility. Our software development costs incurred subsequent to achieving technological feasibility have not been significant, and all software development costs have been expensed as research and development activities as incurred.
Internal use software.
In accordance with the authoritative guidance, we capitalize application development stage costs associated with the development of new functionality for internal-use software and software developed related to our SaaS-based product offerings. The capitalized costs are then amortized over the estimated useful life of the software, which is generally three to five years, and are included in property and equipment in the accompanying consolidated balance sheets.
Investments.
Our investments are diversified among high-credit quality debt securities in accordance with our investment policy. We classify our investments as available-for-sale, which are reported at fair market value with the related unrealized gains and losses included in accumulated other comprehensive income or loss in stockholders’ equity. Realized gains and losses and declines in value of these investments judged to be other than temporary are included in other income (expense). To date, we have not deemed it necessary to record any charges related to other-than-temporary declines in the estimated fair values of
35
our marketable debt securities. However, the fair value of our investments is subject to volatility. Declines in the fair value of our investments judged to be other than temporary could adversely affect our future operating results.
Results of Operations
The following discussion and analysis should be read in conjunction with our consolidated financial statements and related notes included elsewhere in this Annual Report on Form 10-K.
|
|
Years Ended September 30,
|
|||||||||||
|
|
2016
|
2015
|
2014
|
|||||||||
|
|
(in thousands, except percentages)
|
|||||||||||
|
Net Revenues
|
||||||||||||
|
Products
|
$
|
944,469
|
|
$
|
991,539
|
|
$
|
936,130
|
|
|||
|
Services
|
1,050,565
|
|
928,284
|
|
795,916
|
|
||||||
|
Total
|
$
|
1,995,034
|
|
$
|
1,919,823
|
|
$
|
1,732,046
|
|
|||
|
Percentage of net revenues
|
||||||||||||
|
Products
|
47.3
|
%
|
51.6
|
%
|
54.0
|
%
|
||||||
|
Services
|
52.7
|
|
48.4
|
|
46.0
|
|
||||||
|
Total
|
100.0
|
%
|
100.0
|
%
|
100.0
|
%
|
||||||
Net Revenues.
Total net revenues increased
3.9%
in fiscal year
2016
from fiscal year
2015
, compared to an increase of
10.8%
in fiscal year
2015
from the prior year. Overall revenue growth for the year ended
September 30, 2016
was primarily due to increased service revenues as a result of our increased installed base of products. International revenues represented
48.9%
,
47.7%
and
48.3%
of net revenues in fiscal years
2016
,
2015
and
2014
, respectively. We expect international sales will continue to represent a significant portion of net revenues, although we cannot provide assurance that international revenues as a percentage of net revenues will remain at current levels.
Net product revenues decreased
4.7%
in fiscal year
2016
from fiscal year
2015
, compared to an increase of
5.9%
in fiscal year
2015
from the prior year. The decrease of
$47.1 million
in net product sales for fiscal year
2016
was primarily due to a
$47.5 million
decrease in the volume of sales of our ADN products. The increase of
$55.4 million
in net product sales for fiscal year
2015
was primarily due to a
$62.4 million
increase in the volume of sales of our ADN products. Sales of our ADN products represented
98.8%
,
98.9%
and
98.1%
of total product revenues in fiscal years
2016
,
2015
and
2014
, respectively.
Net service revenues increased
13.2%
in fiscal year
2016
from fiscal year
2015
, compared to an increase of
16.6%
in fiscal year
2015
from the prior year. The increases in service revenue were the result of increased purchases or renewals of maintenance contracts driven by additions to our installed base of products, as well as growth in sales of consulting services.
Avnet Technology Solutions, one of our worldwide distributors, accounted for
13.3%
,
13.8%
and
14.0%
of our total net revenues in fiscal years
2016
,
2015
and
2014
, respectively. Ingram Micro, Inc., another worldwide distributor, accounted for
14.9%
,
16.1%
and
17.4%
of our total net revenues in fiscal years
2016
,
2015
and
2014
, respectively. Westcon Group, Inc., another worldwide distributor, accounted for
18.7%
,
17.6%
and
14.5%
of our total net revenues in fiscal years
2016
,
2015
and
2014
, respectively. Arrow ECS, another worldwide distributor, accounted for
10.1%
and
10.4%
of our total net revenues in fiscal years
2016
and
2015
, respectively. Westcon and Ingram Micro accounted for
18.0%
and
15.5%
of our accounts receivable as of
September 30, 2016
, respectively. Westcon and Ingram Micro accounted for
17.2%
and
15.8%
of our accounts receivable as of
September 30, 2015
, respectively. No other distributors accounted for more than
10%
of total net revenue or receivables.
36
|
|
Years Ended September 30,
|
|||||||||||
|
|
2016
|
2015
|
2014
|
|||||||||
|
|
(in thousands, except percentages)
|
|||||||||||
|
Cost of net revenues and Gross Margin
|
||||||||||||
|
Products
|
$
|
166,624
|
|
$
|
174,225
|
|
$
|
158,788
|
|
|||
|
Services
|
170,581
|
|
158,036
|
|
151,171
|
|
||||||
|
Total
|
337,205
|
|
332,261
|
|
309,959
|
|
||||||
|
Gross profit
|
$
|
1,657,829
|
|
$
|
1,587,562
|
|
$
|
1,422,087
|
|
|||
|
Percentage of net revenues and Gross Margin (as a percentage of related net revenue)
|
||||||||||||
|
Products
|
17.6
|
%
|
17.6
|
%
|
17.0
|
%
|
||||||
|
Services
|
16.2
|
|
17.0
|
|
19.0
|
|
||||||
|
Total
|
16.9
|
|
17.3
|
|
17.9
|
|
||||||
|
Gross profit
|
83.1
|
%
|
82.7
|
%
|
82.1
|
%
|
||||||
Cost of Net Product Revenues.
Cost of net product revenues consist of finished products purchased from our contract manufacturers, manufacturing overhead, freight, warranty, provisions for excess and obsolete inventory and amortization expenses in connection with developed technology from acquisitions. Cost of net product revenues decreased to
$166.6 million
in fiscal year
2016
, down
4.4%
from the prior year, primarily due to a reduction in the volume of product sales. Cost of net product revenues increased to
$174.2 million
in fiscal year
2015
from
$158.8 million
in fiscal year
2014
, primarily due to a higher volume of hardware and software sales and increased amortization expense related to acquired technology. Cost of net product revenues also included expenses related to the launch of our subscription-based Silverline service in the first quarter of fiscal year 2015.
Cost of Net Service Revenues.
Cost of net service revenues consist of the salaries and related benefits of our professional services staff, travel, facilities and depreciation expenses. Cost of net service revenues as a percentage of net service revenues decreased to
16.2%
in fiscal year
2016
compared to
17.0%
in fiscal year
2015
, primarily due to increased efficiencies within our customer support organization and increased revenue from maintenance contracts and professional services. Cost of net service revenues as a percentage of net service revenues in fiscal year
2015
decreased from
19.0%
in fiscal year
2014
, primarily due to increased efficiencies within our customer support organization and increased revenue from maintenance contracts and professional services. Professional services headcount at the end of fiscal year
2016
increased to
1,120
from
1,078
at the end of fiscal year
2015
and
945
at the end of fiscal year
2014
. In addition, cost of net service revenues included stock-based compensation expense of
$16.6 million
,
$12.7 million
and
$12.4 million
for fiscal years
2016
,
2015
and
2014
, respectively.
|
|
Years Ended September 30,
|
|||||||||||
|
|
2016
|
2015
|
2014
|
|||||||||
|
|
(in thousands, except percentages)
|
|||||||||||
|
Operating expenses
|
||||||||||||
|
Sales and marketing
|
$
|
628,743
|
|
$
|
602,540
|
|
$
|
558,284
|
|
|||
|
Research and development
|
334,227
|
|
296,583
|
|
263,792
|
|
||||||
|
General and administrative
|
138,431
|
|
135,540
|
|
106,454
|
|
||||||
|
Litigation expense
|
9,051
|
|
—
|
|
—
|
|
||||||
|
Total
|
$
|
1,110,452
|
|
$
|
1,034,663
|
|
$
|
928,530
|
|
|||
|
Operating expenses (as a percentage of net revenue)
|
||||||||||||
|
Sales and marketing
|
31.5
|
%
|
31.4
|
%
|
32.3
|
%
|
||||||
|
Research and development
|
16.8
|
|
15.4
|
|
15.2
|
|
||||||
|
General and administrative
|
6.9
|
|
7.1
|
|
6.1
|
|
||||||
|
Litigation expense
|
0.5
|
|
—
|
|
—
|
|
||||||
|
Total
|
55.7
|
%
|
53.9
|
%
|
53.6
|
%
|
||||||
Sales and Marketing.
Sales and marketing expenses consist of the salaries, commissions and related benefits of our sales and marketing staff, the costs of our marketing programs, including public relations, advertising and trade shows, travel, facilities, and depreciation expenses. Sales and marketing expense increased
4.3%
in fiscal year
2016
from the prior year, as compared to a year over year increase of
7.9%
in fiscal year
2015
. The increase in sales and marketing expense for fiscal year
2016
was primarily due to increases in commissions and personnel costs of
$22.6 million
, compared to the prior year. The
37
increases in commissions and personnel costs were driven by growth in sales and marketing employee headcount in fiscal year
2016
. In fiscal year
2015
, the increase in sales and marketing expense was primarily due to increases in commissions and personnel costs of
$23.7 million
, compared to the prior year. The increases in commissions and personnel costs were driven by growth in sales and marketing employee headcount and increased sales volume for fiscal year
2015
over the prior year. The increase in sales and marketing expense for fiscal year
2015
was also due to an increase of
$7.7 million
in marketing promotions and initiatives aimed at promoting our brand and creating market awareness of our technology and our offerings. Sales and marketing headcount at the end of fiscal
2016
increased to
1,617
from
1,582
at the end of fiscal
2015
and
1,448
at the end of fiscal
2014
. Sales and marketing expense included stock-based compensation expense of
$61.2 million
,
$56.8 million
and
$50.1 million
for fiscal years
2016
,
2015
and
2014
, respectively.
Research and Development.
Research and development expenses consist of the salaries and related benefits of our product development personnel, prototype materials and other expenses related to the development of new and improved products, facilities and depreciation expenses. Research and development expense increased
12.7%
in fiscal year
2016
, compared to the prior year. The increase in research and development expense for fiscal year
2016
was primarily due to increased personnel costs of
$28.2 million
, compared to the prior year. In fiscal year
2015
, research and development expense increased
12.4%
, compared to the prior year. The increase in research and development expense for fiscal year
2015
was primarily due to increased personnel costs of
$20.7 million
, compared to the prior year. In addition, research and development expense included a year over year increase in computer equipment and software costs of
$5.3 million
primarily related to prototyping and planning for future product releases. Research and development headcount at the end of fiscal
2016
increased to
1,202
from
1,087
at the end of fiscal
2015
and
1,054
at the end of fiscal
2014
. Research and development expense included stock-based compensation expense of
$52.6 million
,
$46.1 million
and
$43.6 million
for fiscal years
2016
,
2015
and
2014
, respectively. We expect research and development expenses to be consistent as a percentage of net revenue in the foreseeable future.
General and Administrative.
General and administrative expenses consist of the salaries, benefits and related costs of our executive, finance, information technology, human resource and legal personnel, third-party professional service fees, bad debt charges, facilities and depreciation expenses. General and administrative expense increased
2.1%
in fiscal year
2016
, compared to the prior year. The increase in general and administrative expense for fiscal year
2016
was primarily due to an increase in personnel costs of
$8.1 million
, compared to the prior year. In fiscal year
2015
, general and administrative expense increased
27.3%
compared to the prior year. The increase in general and administrative expense for fiscal year
2015
was primarily due to an increase in personnel costs of
$7.4 million
, compared to the prior year, and a
$3.0 million
tax expense in the first quarter of fiscal 2015. In addition, fees paid to outside consultants for legal, audit and tax services increased
$3.2 million
for fiscal year 2015, compared to the prior year. General and administrative headcount at the end of fiscal
2016
increased to
456
from
431
at the end of fiscal
2015
and
387
at the end of fiscal
2014
. General and administrative expense included stock-based compensation expense of
$24.5 million
,
$28.5 million
and
$19.4 million
for fiscal years
2016
,
2015
and
2014
, respectively.
Litigation expense.
In the second quarter of fiscal 2016, we accrued a litigation expense of
$8.9 million
, which included a patent-related jury verdict for
$6.4 million
and
$2.5 million
in legal fees and other costs associated with the litigation. The accrual was adjusted in the third and fourth quarters of fiscal 2016 to better reflect our total expected litigation expense. See Note 7 - Commitments and Contingencies of the Notes to Financial Statements (Part II, Item 8 of this Form 10-K) for additional information regarding this litigation.
|
|
Years Ended September 30,
|
|||||||||||
|
|
2016
|
2015
|
2014
|
|||||||||
|
|
(in thousands, except percentages)
|
|||||||||||
|
Other income and income taxes
|
||||||||||||
|
Income from operations
|
$
|
547,377
|
|
$
|
552,899
|
|
$
|
493,557
|
|
|||
|
Other income, net
|
2,514
|
|
8,445
|
|
3,785
|
|
||||||
|
Income before income taxes
|
549,891
|
|
561,344
|
|
497,342
|
|
||||||
|
Provision for income taxes
|
184,036
|
|
196,330
|
|
186,159
|
|
||||||
|
Net income
|
$
|
365,855
|
|
$
|
365,014
|
|
$
|
311,183
|
|
|||
|
Other income and income taxes (as percentage of net revenue)
|
||||||||||||
|
Income from operations
|
27.4
|
%
|
28.8
|
%
|
28.5
|
%
|
||||||
|
Other income, net
|
0.1
|
|
0.4
|
|
0.2
|
|
||||||
|
Income before income taxes
|
27.5
|
|
29.2
|
|
28.7
|
|
||||||
|
Provision for income taxes
|
9.2
|
|
10.2
|
|
10.7
|
|
||||||
|
Net income
|
18.3
|
%
|
19.0
|
%
|
18.0
|
%
|
||||||
38
Other Income, Net.
Other income, net, consists primarily of interest income and foreign currency transaction gains and losses. Other income, net decreased
70.2%
in fiscal year
2016
, as compared to fiscal year
2015
and increased
123.1%
in fiscal year
2015
, as compared to fiscal year
2014
. Interest income was
$6.6 million
,
$5.4 million
and
$5.7 million
for fiscal years
2016
,
2015
and
2014
, respectively. The decrease in other income, net for fiscal year
2016
was primarily due to
$7.2 million
in foreign currency losses, compared to the prior year. The increase in other income, net for fiscal year
2015
as compared to fiscal year
2014
was primarily due to
$4.0 million
in foreign currency gains, compared to the prior year, and a non-recurring charge of
$1.0 million
related to a legal settlement that occurred in the first quarter of fiscal year 2014.
Provision for Income Taxes.
We recorded a
33.5%
provision for income taxes for fiscal year
2016
, compared to
35.0%
for fiscal year
2015
and
37.4%
for fiscal year
2014
. The decrease in the effective tax rate from fiscal year 2015 to 2016 was primarily due to the impact of foreign income, and the permanent extension of the United States Federal Credit for Increasing Research Activities. The decrease in the effective tax rate from fiscal year 2014 to 2015 was primarily due to additional tax benefit recognized during fiscal year 2015 as a result of the reinstatement of the United States Federal Credit for Increasing Research Activities retroactive to January 1, 2014, increase in profitability of certain foreign entities, and a reduction in non-deductible compensation expense.
We record a valuation allowance to reduce our deferred tax assets to the amount we believe is more-likely-than-not to be realized. In making these determinations we consider historical and projected taxable income, and ongoing prudent and feasible tax planning strategies in assessing the appropriateness of a valuation allowance. The net increase in the valuation allowance of
$4.2 million
for fiscal year 2016 and
$2.9 million
for fiscal year 2015 was primarily related to tax net operating losses incurred in certain foreign jurisdictions, and state tax credit carryforwards. Our net deferred tax assets as of
September 30, 2016
,
2015
and
2014
were
$49.4 million
,
$55.7 million
and
$43.1 million
respectively.
Our worldwide effective tax rate may fluctuate based on a number of factors, including variations in projected taxable income in the various geographic locations in which we operate, changes in the valuation of our net deferred tax assets, resolution of potential exposures, tax positions taken on tax returns filed in the various geographic locations in which we operate, and the introduction of new accounting standards or changes in tax laws or interpretations thereof in the various geographic locations in which we operate. We have recorded liabilities to address potential tax exposures related to business and income tax positions we have taken that could be challenged by taxing authorities. The ultimate resolution of these potential exposures may be greater or less than the liabilities recorded which could result in an adjustment to our future tax expense.
Liquidity and Capital Resources
We have funded our operations with our cash balances, cash generated from operations and proceeds from public offerings of our securities.
|
|
Years Ended September 30,
|
|||||||||||
|
|
2016
|
2015
|
2014
|
|||||||||
|
|
(in thousands)
|
|||||||||||
|
Liquidity and Capital Resources
|
||||||||||||
|
Cash and cash equivalents and investments
|
$
|
1,158,770
|
|
$
|
1,171,998
|
|
$
|
1,128,296
|
|
|||
|
Cash provided by operating activities
|
711,535
|
|
684,541
|
|
548,992
|
|
||||||
|
Cash provided by (used in) investing activities
|
62,720
|
|
(10,699
|
)
|
150,641
|
|
||||||
|
Cash used in financing activities
|
(652,647
|
)
|
(556,902
|
)
|
(604,960
|
)
|
||||||
Cash and cash equivalents, short-term investments and long-term investments totaled
$1,158.8 million
as of
September 30, 2016
, compared to
$1,172.0 million
as of
September 30, 2015
, representing a decrease of
$13.2 million
. The decrease was primarily due to
$700.1 million
of cash required for the repurchase of outstanding common stock under our share repurchase program in fiscal
2016
, and
$63.5 million
of capital expenditures related to the expansion of our facilities to support our operations worldwide, partially offset by cash provided by operating activities of
$711.5 million
. As of
September 30, 2016
,
30.7%
of our cash and cash equivalents and investment balances were outside of the U.S., which may be subject to U.S. taxes if repatriated. The cash and cash equivalents and investment balances outside of the U.S. are subject to fluctuation based on the settlement of intercompany balances. In fiscal year
2015
, the increase to cash and cash equivalents, short-term investments and long-term investments from the prior year was primarily due to cash provided by operating activities of
$684.5 million
, partially offset by
$606.9 million
of cash required for the repurchase of outstanding common stock under our share repurchase program. As of
September 30, 2015
,
17.0%
of our cash and cash equivalents and investment balances were outside of the U.S., which may be subject to U.S. taxes if repatriated.
39
Cash provided by operating activities during fiscal year
2016
was
$711.5 million
compared to
$684.5 million
in fiscal year
2015
and
$549.0 million
in fiscal year
2014
. Cash provided by operating activities resulted primarily from cash generated from net income, after adjusting for non-cash charges such as stock-based compensation, depreciation and amortization charges and changes in operating assets and liabilities.
Cash provided by investing activities during fiscal year
2016
was
$62.7 million
compared to cash used in investing activities of
$10.7 million
in fiscal year
2015
and cash provided by investing activities of
$150.6 million
in fiscal year
2014
. Cash provided by investing activities for fiscal year
2016
was primarily the result of the sale and maturity of investments partially offset by the purchase of investments and capital expenditures related to maintaining our operations worldwide. Cash used in investing activities for fiscal year
2015
was primarily the result of the purchase of investments and capital expenditures related to the expansion of our facilities to support our operations worldwide, partially offset by the sale and maturity of investments. Cash provided by investing activities for fiscal year
2014
was primarily the result of the sale and maturity of investments partially offset by the purchase of investments and capital expenditures related to maintaining our operations worldwide, and
$49.4 million
for the Defense.Net acquisition.
Cash used in financing activities was
$652.6 million
for fiscal year
2016
, compared to
$556.9 million
for fiscal year
2015
and
$605.0 million
for fiscal year
2014
. Cash used in financing activities for fiscal year
2016
included
$700.1 million
to repurchase common stock under our share repurchase program, which was partially offset by cash received from the exercise of employee stock options and stock purchases under our employee stock purchase plan of
$44.9 million
and excess tax benefits related to share-based compensation of
$2.6 million
. Cash used in financing activities for fiscal year
2015
included
$606.9 million
to repurchase common stock under our share repurchase program, which was partially offset by cash received from the exercise of employee stock options and stock purchases under our employee stock purchase plan of
$40.4 million
and excess tax benefits related to share-based compensation of
$9.5 million
. Cash used in financing activities for fiscal
2014
included
$650.5 million
to repurchase common stock under our share repurchase program, which was partially offset by cash received from the exercise of employee stock options and stock purchases under our employee stock purchase plan of
$35.3 million
and excess tax benefits related to share-based compensation of
$10.3 million
.
Based on our current operating and capital expenditure forecasts, we believe that our existing cash and investment balances, together with cash generated from operations should be sufficient to meet our operating requirements for the next twelve months. Our future capital requirements will depend on many factors, including our rate of revenue growth, the expansion of our sales and marketing activities, the timing and extent of expansion into new territories, the timing of introductions of new products and enhancements of existing products, and the continuing market acceptance of our products.
Obligations and Commitments
The following table summarizes our contractual payment obligations and commitments as of
September 30, 2016
:
|
|
Payment Obligations by Year
|
|||||||||||||||||||||||||||
|
|
2017
|
2018
|
2019
|
2020
|
2021
|
Thereafter
|
Total
|
|||||||||||||||||||||
|
|
(in thousands)
|
|||||||||||||||||||||||||||
|
Operating leases
|
$
|
27,289
|
|
$
|
23,623
|
|
$
|
18,675
|
|
$
|
18,116
|
|
$
|
16,975
|
|
$
|
30,314
|
|
$
|
134,992
|
|
|||||||
|
Purchase obligations
|
20,693
|
|
—
|
|
—
|
|
—
|
|
—
|
|
—
|
|
20,693
|
|
||||||||||||||
|
Total
|
$
|
47,982
|
|
$
|
23,623
|
|
$
|
18,675
|
|
$
|
18,116
|
|
$
|
16,975
|
|
$
|
30,314
|
|
$
|
155,685
|
|
|||||||
We lease our facilities under operating leases that expire at various dates through
2025
.
As of
September 30, 2016
, we had approximately
$14.6 million
of tax liabilities, including interest and penalties, related to uncertain tax positions (See Note 5 to our Consolidated Financial Statements). Because of the high degree of uncertainty regarding the settlement of these liabilities, we are unable to estimate the years in which future cash outflows may occur.
Purchase obligations are comprised of purchase commitments with our contract manufacturers. The agreement with our primary contract manufacturer allows it to procure component inventory on our behalf based on our production forecast. We are obligated to purchase component inventory that the contract manufacturer procures in accordance with the forecast, unless cancellation is given within applicable lead times.
Recent Accounting Pronouncements
In May 2014, the FASB issued ASU 2014-09,
Revenue from Contracts with Customers (Topic 606)
(ASU 2014-09). ASU 2014-09 and the related amendments outline a new, single comprehensive model for entities to use in accounting for revenue
40
arising from contracts with customers and supersedes most current revenue recognition guidance, including industry-specific guidance. The new model will require revenue recognition to depict the transfer of promised goods or services to customers in an amount that reflects the consideration a company expects to receive in exchange for those goods or services. The standard can be applied either retrospectively to each period presented or as a cumulative-effect adjustment as of the date of adoption. In July 2015, the FASB issued ASU 2015-14,
Revenue from Contracts with Customers (Topic 606): Deferral of the Effective Date
, which delays the effective date of ASU 2014-09 by one year. In accordance with the agreed upon delay, ASU 2014-09 and all related amendments are effective for fiscal years, and interim periods within those fiscal years, beginning after December 15, 2017. Early adoption is permitted but not before annual periods beginning after December 15, 2016. We are currently assessing the impact that this updated standard will have on our consolidated financial statements and footnote disclosures.
In June 2014, the FASB issued ASU 2014-12,
Compensation - Stock Compensation (Topic 718): Accounting for Share-Based Payments When the Terms of an Award Provide that a Performance Target Could be Achieved after the Requisite Service Period
(ASU 2014-12), which requires that a performance target that affects vesting, and that could be achieved after the requisite service period, be treated as a performance condition. As such, the performance target should not be reflected in estimating the grant date fair value of the award. This update further clarifies that compensation cost should be recognized in the period in which it becomes probable that the performance target will be achieved and should represent the compensation cost attributable to the period(s) for which the requisite service has already been rendered. The new standard is effective for fiscal years, and interim periods within those fiscal years, beginning after December 15, 2015. Early adoption is permitted. We will adopt ASU 2014-12 in the first quarter of fiscal 2017 and do not expect the adoption of this standard to have a material impact on our consolidated financial statements.
In April 2015, the FASB issued ASU 2015-05,
Intangibles-Goodwill and Other-Internal-Use Software: Customer’s Accounting for Fees Paid in a Cloud Computing Arrangement
(ASU 2015-05), which provides guidance on determining whether a cloud computing arrangement contains a software license. If a cloud computing arrangement includes a software license, then the customer should account for the software license element of the arrangement consistent with the acquisition of other software licenses. If a cloud computing arrangement does not include a software license, the customer should account for the arrangement as a service contract. The new standard is effective for fiscal years, and interim periods within those fiscal years, beginning after December 15, 2015. Early adoption is permitted. We will adopt ASU 2015-05 in the first quarter of fiscal 2017 and do not expect the adoption of this standard to have a material impact on our consolidated financial statements.
In July 2015, the FASB issued ASU 2015-11,
Simplifying the Measurement of Inventory
(ASU 2015-11), which changes the subsequent measurement of inventory from lower of cost or market to lower of cost and net realizable value. The new standard is effective for fiscal years, and interim periods within those fiscal years, beginning after December 15, 2016. Early adoption is permitted. We are currently assessing the impact that this updated standard will have on our consolidated financial statements and footnote disclosures.
In November 2015, the FASB issued ASU 2015-17,
Balance Sheet Classification of Deferred Taxes
(ASU 2015-17), which requires that all deferred tax assets and liabilities be classified as noncurrent in a classified balance sheet. The new standard is effective for fiscal years, and interim periods within those fiscal years, beginning after December 15, 2016. Early adoption is permitted as of the beginning of an interim or annual reporting period. We do not anticipate that the adoption of this standard will have a material impact on our consolidated financial statements.
In February 2016, the FASB issued ASU 2016-02,
Leases (Topic 842)
(ASU 2016-02), which requires lessees to recognize on the balance sheet a right-of-use asset, representing its right to use the underlying asset for the lease term, and a corresponding lease liability for all leases with terms greater than twelve months. The guidance also requires qualitative and quantitative disclosures designed to assess the amount, timing and uncertainty of cash flows arising from leases. The new standard is effective for fiscal years, and interim periods within those fiscal years, beginning after December 15, 2018, and is required to be applied with a modified retrospective approach. Early adoption is permitted. We are currently assessing the impact that this updated standard will have on our consolidated financial statements and footnote disclosures.
In March 2016, the FASB issued ASU 2016-09,
Compensation-Stock Compensation (Topic 718): Improvements to Employee Share-Based Payment Accounting
(ASU 2016-09), which is intended to simplify several aspects of the accounting for share-based payment transactions, including the accounting for income taxes, forfeitures, and statutory tax withholding requirements, as well as classification in the statement of cash flows. The new standard is effective for fiscal years, and interim periods within those fiscal years, beginning after December 15, 2016. Early adoption is permitted. We are currently assessing the impact that this updated standard will have on our consolidated financial statements and footnote disclosures.
In June 2016, the FASB issued ASU 2016-13,
Financial Instruments - Credit Losses (Topic 326): Measurement of Credit Losses on Financial Instruments
, which replaces the incurred loss impairment methodology in current GAAP with a
41
methodology that reflects expected credit losses. The new standard is effective for fiscal years, and interim periods within those fiscal years, beginning after December 15, 2019. Early adoption is permitted. We are currently assessing the impact that this updated standard will have on our consolidated financial statements and footnote disclosures.
In August 2016, the FASB issued ASU 2016-15,
Statement of Cash Flows (Topic 230): Classification of Certain Cash Receipts and Cash Payments
(ASU 2016-15), which clarifies how companies present and classify certain cash receipts and cash payments in the statement of cash flows. The new standard is effective for fiscal years, and interim periods within those fiscal years, beginning after December 15, 2017. Early adoption is permitted, including adoption in an interim period. We are currently assessing the impact that this updated standard will have on our consolidated financial statements and footnote disclosures.
42
|
Item 7A.
|
Quantitative and Qualitative Disclosure About Market Risk
|
Interest Rate Risk.
Our cash equivalents consist of high-quality securities, as specified in our investment policy guidelines. The policy limits the amount of credit exposure to any one issue or issuer to a maximum of
5%
of the total portfolio with the exception of U.S. treasury and agency securities, commercial paper and money market funds, which are exempt from size limitation. The policy requires investments in securities that mature in three years or less, with the average maturity being no greater than one and a half years. These securities are subject to interest rate risk and will decrease in value if interest rates increase. A decrease of one percent in the average interest rate would have resulted in a decrease of approximately
$6.6 million
in our interest income for the fiscal year
2016
.
|
|
Maturing in
|
|||||||||||||||||||
|
|
Three Months
or Less
|
Three Months
to One Year
|
Greater Than
One Year
|
Total
|
Fair Value
|
|||||||||||||||
|
|
(in thousands, except for percentages)
|
|||||||||||||||||||
|
September 30, 2016
|
||||||||||||||||||||
|
Included in cash and cash equivalents
|
$
|
56,525
|
|
$
|
—
|
|
$
|
—
|
|
$
|
56,525
|
|
$
|
56,525
|
|
|||||
|
Weighted average interest rate
|
0.3
|
%
|
—
|
|
—
|
|
—
|
|
—
|
|
||||||||||
|
Included in short-term investments
|
$
|
78,969
|
|
$
|
288,855
|
|
$
|
—
|
|
$
|
367,824
|
|
$
|
367,824
|
|
|||||
|
Weighted average interest rates
|
0.4
|
%
|
0.6
|
%
|
—
|
|
—
|
|
—
|
|
||||||||||
|
Included in long-term investments
|
$
|
—
|
|
$
|
—
|
|
$
|
276,375
|
|
$
|
276,375
|
|
$
|
276,375
|
|
|||||
|
Weighted average interest rate
|
—
|
|
—
|
|
1.0
|
%
|
—
|
|
—
|
|
||||||||||
|
September 30, 2015
|
||||||||||||||||||||
|
Included in cash and cash equivalents
|
$
|
60,144
|
|
$
|
—
|
|
$
|
—
|
|
$
|
60,144
|
|
$
|
60,144
|
|
|||||
|
Weighted average interest rate
|
0.1
|
%
|
—
|
|
—
|
|
—
|
|
—
|
|
||||||||||
|
Included in short-term investments
|
$
|
74,744
|
|
$
|
309,138
|
|
$
|
—
|
|
$
|
383,882
|
|
$
|
383,882
|
|
|||||
|
Weighted average interest rates
|
0.5
|
%
|
0.5
|
%
|
—
|
|
—
|
|
—
|
|
||||||||||
|
Included in long-term investments
|
$
|
—
|
|
$
|
—
|
|
$
|
397,656
|
|
$
|
397,656
|
|
$
|
397,656
|
|
|||||
|
Weighted average interest rate
|
—
|
|
—
|
|
0.9
|
%
|
—
|
|
—
|
|
||||||||||
|
September 30, 2014
|
||||||||||||||||||||
|
Included in cash and cash equivalents
|
$
|
43,618
|
|
$
|
—
|
|
$
|
—
|
|
$
|
43,618
|
|
$
|
43,618
|
|
|||||
|
Weighted average interest rate
|
0.1
|
%
|
—
|
|
—
|
|
—
|
|
—
|
|
||||||||||
|
Included in short-term investments
|
$
|
70,405
|
|
$
|
293,472
|
|
$
|
—
|
|
$
|
363,877
|
|
$
|
363,877
|
|
|||||
|
Weighted average interest rates
|
0.4
|
%
|
0.5
|
%
|
—
|
|
—
|
|
—
|
|
||||||||||
|
Included in long-term investments
|
$
|
—
|
|
$
|
—
|
|
$
|
482,917
|
|
$
|
482,917
|
|
$
|
482,917
|
|
|||||
|
Weighted average interest rate
|
—
|
|
—
|
|
0.7
|
%
|
—
|
|
—
|
|
||||||||||
Foreign Currency Risk.
The majority of our sales and expenses are denominated in U.S. dollars and as a result, we have not experienced significant foreign currency transaction gains and losses to date. While we have conducted some transactions in foreign currencies during the fiscal year ended
September 30, 2016
and expect to continue to do so, we do not anticipate that foreign currency transaction gains or losses will be significant at our current level of operations. However, as we continue to expand our operations internationally, transaction gains or losses may become significant in the future. We have not engaged in foreign currency hedging to date. However, we may do so in the future.
43
|
Item 8.
|
Financial Statements and Supplementary Data
|
F5 NETWORKS, INC.
INDEX TO CONSOLIDATED FINANCIAL STATEMENTS
|
|
Page
|
|
Consolidated Financial Statements
|
|
44
Report of Independent Registered Public Accounting Firm
To the Board of Directors and Shareholders
of F5 Networks, Inc.:
In our opinion, the accompanying consolidated balance sheets and the related consolidated statements of income, comprehensive income, shareholders’ equity and cash flows present fairly, in all material respects, the financial position of F5 Networks, Inc. and its subsidiaries at September 30, 2016 and 2015, and the results of their operations and their cash flows for each of the three years in the period ended
September 30, 2016
in conformity with accounting principles generally accepted in the United States of America. Also in our opinion, the Company maintained, in all material respects, effective internal control over financial reporting as of September 30, 2016, based on criteria established in
Internal Control - Integrated Framework (2013)
issued by the Committee of Sponsoring Organizations of the Treadway Commission (COSO). The Company's management is responsible for these financial statements, for maintaining effective internal control over financial reporting and for its assessment of the effectiveness of internal control over financial reporting, included in Management's Report on Internal Control over Financial Reporting appearing under Item 9A. Our responsibility is to express opinions on these financial statements and on the Company's internal control over financial reporting based on our integrated audits. We conducted our audits in accordance with the standards of the Public Company Accounting Oversight Board (United States). Those standards require that we plan and perform the audits to obtain reasonable assurance about whether the financial statements are free of material misstatement and whether effective internal control over financial reporting was maintained in all material respects. Our audits of the financial statements included examining, on a test basis, evidence supporting the amounts and disclosures in the financial statements, assessing the accounting principles used and significant estimates made by management, and evaluating the overall financial statement presentation. Our audit of internal control over financial reporting included obtaining an understanding of internal control over financial reporting, assessing the risk that a material weakness exists, and testing and evaluating the design and operating effectiveness of internal control based on the assessed risk. Our audits also included performing such other procedures as we considered necessary in the circumstances. We believe that our audits provide a reasonable basis for our opinions.
A company’s internal control over financial reporting is a process designed to provide reasonable assurance regarding the reliability of financial reporting and the preparation of financial statements for external purposes in accordance with generally accepted accounting principles. A company’s internal control over financial reporting includes those policies and procedures that (i) pertain to the maintenance of records that, in reasonable detail, accurately and fairly reflect the transactions and dispositions of the assets of the company; (ii) provide reasonable assurance that transactions are recorded as necessary to permit preparation of financial statements in accordance with generally accepted accounting principles, and that receipts and expenditures of the company are being made only in accordance with authorizations of management and directors of the company; and (iii) provide reasonable assurance regarding prevention or timely detection of unauthorized acquisition, use, or disposition of the company’s assets that could have a material effect on the financial statements.
Because of its inherent limitations, internal control over financial reporting may not prevent or detect misstatements. Also, projections of any evaluation of effectiveness to future periods are subject to the risk that controls may become inadequate because of changes in conditions, or that the degree of compliance with the policies or procedures may deteriorate.
/s/ PricewaterhouseCoopers LLP
Seattle, Washington
November 4, 2016
45
F5 NETWORKS, INC.
(in thousands)
|
|
September 30,
|
|||||||
|
|
2016
|
2015
|
||||||
|
ASSETS
|
||||||||
|
Current assets
|
||||||||
|
Cash and cash equivalents
|
$
|
514,571
|
|
$
|
390,460
|
|
||
|
Short-term investments
|
367,824
|
|
383,882
|
|
||||
|
Accounts receivable, net of allowances of $2,062 and $1,979
|
268,175
|
|
279,434
|
|
||||
|
Inventories
|
34,051
|
|
33,717
|
|
||||
|
Deferred tax assets
|
51,601
|
|
50,128
|
|
||||
|
Other current assets
|
52,579
|
|
50,519
|
|
||||
|
Total current assets
|
1,288,801
|
|
1,188,140
|
|
||||
|
Property and equipment, net
|
123,248
|
|
95,909
|
|
||||
|
Long-term investments
|
276,375
|
|
397,656
|
|
||||
|
Deferred tax assets
|
2,044
|
|
6,492
|
|
||||
|
Goodwill
|
555,965
|
|
555,965
|
|
||||
|
Other assets, net
|
59,890
|
|
68,128
|
|
||||
|
Total assets
|
$
|
2,306,323
|
|
$
|
2,312,290
|
|
||
|
LIABILITIES AND SHAREHOLDERS’ EQUITY
|
||||||||
|
Current liabilities
|
||||||||
|
Accounts payable
|
$
|
34,117
|
|
$
|
50,814
|
|
||
|
Accrued liabilities
|
178,353
|
|
130,401
|
|
||||
|
Deferred revenue
|
631,768
|
|
573,908
|
|
||||
|
Total current liabilities
|
844,238
|
|
755,123
|
|
||||
|
Other long-term liabilities
|
34,138
|
|
30,136
|
|
||||
|
Deferred revenue, long-term
|
238,473
|
|
209,402
|
|
||||
|
Deferred tax liabilities
|
4,212
|
|
901
|
|
||||
|
Total long-term liabilities
|
276,823
|
|
240,439
|
|
||||
|
Commitments and contingencies (Note 7)
|
|
|
||||||
|
Shareholders’ equity
|
||||||||
|
Preferred stock, no par value; 10,000 shares authorized, no shares outstanding
|
—
|
|
—
|
|
||||
|
Common stock, no par value; 200,000 shares authorized, 65,315 and 70,138 shares issued and outstanding
|
13,191
|
|
10,159
|
|
||||
|
Accumulated other comprehensive loss
|
(13,194
|
)
|
(15,288
|
)
|
||||
|
Retained earnings
|
1,185,265
|
|
1,321,857
|
|
||||
|
Total shareholders’ equity
|
1,185,262
|
|
1,316,728
|
|
||||
|
Total liabilities and shareholders’ equity
|
$
|
2,306,323
|
|
$
|
2,312,290
|
|
||
The accompanying notes are an integral part of these consolidated financial statements.
46
F5 NETWORKS, INC.
(in thousands, except per share amounts)
|
|
Years Ended September 30,
|
|||||||||||
|
|
2016
|
2015
|
2014
|
|||||||||
|
Net revenues
|
||||||||||||
|
Products
|
$
|
944,469
|
|
$
|
991,539
|
|
$
|
936,130
|
|
|||
|
Services
|
1,050,565
|
|
928,284
|
|
795,916
|
|
||||||
|
Total
|
1,995,034
|
|
1,919,823
|
|
1,732,046
|
|
||||||
|
Cost of net revenues
|
||||||||||||
|
Products
|
166,624
|
|
174,225
|
|
158,788
|
|
||||||
|
Services
|
170,581
|
|
158,036
|
|
151,171
|
|
||||||
|
Total
|
337,205
|
|
332,261
|
|
309,959
|
|
||||||
|
Gross profit
|
1,657,829
|
|
1,587,562
|
|
1,422,087
|
|
||||||
|
Operating expenses
|
||||||||||||
|
Sales and marketing
|
628,743
|
|
602,540
|
|
558,284
|
|
||||||
|
Research and development
|
334,227
|
|
296,583
|
|
263,792
|
|
||||||
|
General and administrative
|
138,431
|
|
135,540
|
|
106,454
|
|
||||||
|
Litigation expense
|
9,051
|
|
—
|
|
—
|
|
||||||
|
Total
|
1,110,452
|
|
1,034,663
|
|
928,530
|
|
||||||
|
Income from operations
|
547,377
|
|
552,899
|
|
493,557
|
|
||||||
|
Other income, net
|
2,514
|
|
8,445
|
|
3,785
|
|
||||||
|
Income before income taxes
|
549,891
|
|
561,344
|
|
497,342
|
|
||||||
|
Provision for income taxes
|
184,036
|
|
196,330
|
|
186,159
|
|
||||||
|
Net income
|
$
|
365,855
|
|
$
|
365,014
|
|
$
|
311,183
|
|
|||
|
Net income per share — basic
|
$
|
5.43
|
|
$
|
5.07
|
|
$
|
4.13
|
|
|||
|
Weighted average shares — basic
|
67,433
|
|
71,944
|
|
75,395
|
|
||||||
|
Net income per share — diluted
|
$
|
5.38
|
|
$
|
5.03
|
|
$
|
4.09
|
|
|||
|
Weighted average shares — diluted
|
67,984
|
|
72,547
|
|
76,092
|
|
||||||
The accompanying notes are an integral part of these consolidated financial statements.
47
F5 NETWORKS, INC.
CONSOLIDATED STATEMENTS OF COMPREHENSIVE INCOME
(in thousands)
|
|
Years Ended September 30,
|
|||||||||||
|
|
2016
|
2015
|
2014
|
|||||||||
|
|
||||||||||||
|
Net income
|
$
|
365,855
|
|
$
|
365,014
|
|
$
|
311,183
|
|
|||
|
Other comprehensive income (loss):
|
||||||||||||
|
Foreign currency translation adjustment
|
2,067
|
|
(5,997
|
)
|
(1,997
|
)
|
||||||
|
Available-for-sale securities:
|
||||||||||||
|
Unrealized gains (losses) on securities, net of taxes of $14, $222, and $(15) for the years ended September 30, 2016, 2015, and 2014, respectively
|
23
|
|
379
|
|
(26
|
)
|
||||||
|
Reclassification adjustment for realized losses (gains) included in net income, net of taxes of $(2), $50, and $86 for the years ended September 30, 2016, 2015, and 2014, respectively
|
4
|
|
(86
|
)
|
(147
|
)
|
||||||
|
Net change in unrealized gains (losses) on available-for-sale securities, net of tax
|
27
|
|
293
|
|
(173
|
)
|
||||||
|
Total other comprehensive income (loss)
|
2,094
|
|
(5,704
|
)
|
(2,170
|
)
|
||||||
|
Comprehensive income
|
$
|
367,949
|
|
$
|
359,310
|
|
$
|
309,013
|
|
|||
The accompanying notes are an integral part of these consolidated financial statements.
48
F5 NETWORKS, INC.
CONSOLIDATED STATEMENTS OF SHAREHOLDERS’ EQUITY
(in thousands)
|
|
Common Stock
|
Accumulated
Other
Comprehensive
Income/(Loss)
|
Retained
Earnings
|
Total
Shareholders’
Equity
|
|||||||||||||||
|
|
Shares
|
Amount
|
|||||||||||||||||
|
|
|||||||||||||||||||
|
Balance, September 30, 2013
|
78,090
|
|
$
|
262,505
|
|
$
|
(7,414
|
)
|
$
|
1,283,621
|
|
$
|
1,538,712
|
|
|||||
|
Exercise of employee stock options
|
149
|
|
1,422
|
|
—
|
|
—
|
|
1,422
|
|
|||||||||
|
Issuance of stock under employee stock purchase plan
|
516
|
|
33,878
|
|
—
|
|
—
|
|
33,878
|
|
|||||||||
|
Issuance of restricted stock
|
1,228
|
|
—
|
|
—
|
|
—
|
|
—
|
|
|||||||||
|
Repurchase of common stock
|
(6,593
|
)
|
(418,879
|
)
|
—
|
|
(231,663
|
)
|
(650,542
|
)
|
|||||||||
|
Tax benefit from employee stock transactions
|
—
|
|
9,671
|
|
—
|
|
—
|
|
9,671
|
|
|||||||||
|
Stock-based compensation
|
—
|
|
127,156
|
|
—
|
|
—
|
|
127,156
|
|
|||||||||
|
Net income
|
—
|
|
—
|
|
—
|
|
311,183
|
|
311,183
|
|
|||||||||
|
Other comprehensive loss
|
—
|
|
—
|
|
(2,170
|
)
|
—
|
|
(2,170
|
)
|
|||||||||
|
Balance, September 30, 2014
|
73,390
|
|
$
|
15,753
|
|
$
|
(9,584
|
)
|
$
|
1,363,141
|
|
$
|
1,369,310
|
|
|||||
|
Exercise of employee stock options
|
37
|
|
215
|
|
—
|
|
—
|
|
215
|
|
|||||||||
|
Issuance of stock under employee stock purchase plan
|
411
|
|
40,224
|
|
—
|
|
—
|
|
40,224
|
|
|||||||||
|
Issuance of restricted stock
|
1,232
|
|
—
|
|
—
|
|
—
|
|
—
|
|
|||||||||
|
Repurchase of common stock
|
(4,932
|
)
|
(200,560
|
)
|
—
|
|
(406,298
|
)
|
(606,858
|
)
|
|||||||||
|
Tax benefit from employee stock transactions
|
—
|
|
8,974
|
|
—
|
|
—
|
|
8,974
|
|
|||||||||
|
Stock-based compensation
|
—
|
|
145,553
|
|
—
|
|
—
|
|
145,553
|
|
|||||||||
|
Net income
|
—
|
|
—
|
|
—
|
|
365,014
|
|
365,014
|
|
|||||||||
|
Other comprehensive loss
|
—
|
|
—
|
|
(5,704
|
)
|
—
|
|
(5,704
|
)
|
|||||||||
|
Balance, September 30, 2015
|
70,138
|
|
$
|
10,159
|
|
$
|
(15,288
|
)
|
$
|
1,321,857
|
|
$
|
1,316,728
|
|
|||||
|
Exercise of employee stock options
|
19
|
|
179
|
|
—
|
|
—
|
|
179
|
|
|||||||||
|
Issuance of stock under employee stock purchase plan
|
492
|
|
44,690
|
|
—
|
|
—
|
|
44,690
|
|
|||||||||
|
Issuance of restricted stock
|
1,275
|
|
—
|
|
—
|
|
—
|
|
—
|
|
|||||||||
|
Repurchase of common stock
|
(6,609
|
)
|
(197,677
|
)
|
—
|
|
(502,447
|
)
|
(700,124
|
)
|
|||||||||
|
Tax loss from employee stock transactions
|
—
|
|
(920
|
)
|
—
|
|
—
|
|
(920
|
)
|
|||||||||
|
Stock-based compensation
|
—
|
|
156,760
|
|
—
|
|
—
|
|
156,760
|
|
|||||||||
|
Net income
|
—
|
|
—
|
|
—
|
|
365,855
|
|
365,855
|
|
|||||||||
|
Other comprehensive income
|
—
|
|
—
|
|
2,094
|
|
—
|
|
2,094
|
|
|||||||||
|
Balance, September 30, 2016
|
65,315
|
|
$
|
13,191
|
|
$
|
(13,194
|
)
|
$
|
1,185,265
|
|
$
|
1,185,262
|
|
|||||
The accompanying notes are an integral part of these consolidated financial statements.
49
F5 NETWORKS, INC.
(in thousands)
|
|
Years Ended September 30,
|
|||||||||||
|
|
2016
|
2015
|
2014
|
|||||||||
|
|
||||||||||||
|
Operating activities
|
||||||||||||
|
Net income
|
$
|
365,855
|
|
$
|
365,014
|
|
$
|
311,183
|
|
|||
|
Adjustments to reconcile net income to net cash provided by operating activities:
|
||||||||||||
|
Realized loss (gain) on disposition of assets and investments
|
693
|
|
282
|
|
(195
|
)
|
||||||
|
Stock-based compensation
|
156,760
|
|
145,553
|
|
127,156
|
|
||||||
|
Provisions for doubtful accounts and sales returns
|
1,526
|
|
1,488
|
|
2,870
|
|
||||||
|
Depreciation and amortization
|
56,776
|
|
52,583
|
|
46,121
|
|
||||||
|
Deferred income taxes
|
2,967
|
|
(12,571
|
)
|
(3,090
|
)
|
||||||
|
Changes in operating assets and liabilities, net of amounts acquired:
|
||||||||||||
|
Accounts receivable
|
9,732
|
|
(38,680
|
)
|
(40,895
|
)
|
||||||
|
Inventories
|
(334
|
)
|
(9,246
|
)
|
(5,445
|
)
|
||||||
|
Other current assets
|
(1,876
|
)
|
(6,533
|
)
|
(9,828
|
)
|
||||||
|
Other assets
|
(712
|
)
|
569
|
|
(2,502
|
)
|
||||||
|
Accounts payable and accrued liabilities
|
33,217
|
|
39,521
|
|
18,339
|
|
||||||
|
Deferred revenue
|
86,931
|
|
146,561
|
|
105,278
|
|
||||||
|
Net cash provided by operating activities
|
711,535
|
|
684,541
|
|
548,992
|
|
||||||
|
Investing activities
|
||||||||||||
|
Purchases of investments
|
(354,708
|
)
|
(609,875
|
)
|
(515,737
|
)
|
||||||
|
Maturities of investments
|
418,821
|
|
461,327
|
|
523,983
|
|
||||||
|
Sales of investments
|
66,848
|
|
205,292
|
|
214,493
|
|
||||||
|
(Increase) decrease in restricted cash
|
(3
|
)
|
(357
|
)
|
59
|
|
||||||
|
Acquisition of intangible assets
|
(4,750
|
)
|
(6,779
|
)
|
—
|
|
||||||
|
Acquisition of businesses, net of cash acquired
|
—
|
|
—
|
|
(49,439
|
)
|
||||||
|
Purchases of property and equipment
|
(63,488
|
)
|
(60,307
|
)
|
(22,718
|
)
|
||||||
|
Net cash provided by (used in) investing activities
|
62,720
|
|
(10,699
|
)
|
150,641
|
|
||||||
|
Financing activities
|
||||||||||||
|
Excess tax benefit from stock-based compensation
|
2,608
|
|
9,517
|
|
10,283
|
|
||||||
|
Proceeds from the exercise of stock options and purchases of stock under employee stock purchase plan
|
44,869
|
|
40,439
|
|
35,299
|
|
||||||
|
Repurchase of common stock
|
(700,124
|
)
|
(606,858
|
)
|
(650,542
|
)
|
||||||
|
Net cash used in financing activities
|
(652,647
|
)
|
(556,902
|
)
|
(604,960
|
)
|
||||||
|
Net increase in cash and cash equivalents
|
121,608
|
|
116,940
|
|
94,673
|
|
||||||
|
Effect of exchange rate changes on cash and cash equivalents
|
2,503
|
|
(7,982
|
)
|
(2,864
|
)
|
||||||
|
Cash and cash equivalents, beginning of year
|
390,460
|
|
281,502
|
|
189,693
|
|
||||||
|
Cash and cash equivalents, end of year
|
$
|
514,571
|
|
$
|
390,460
|
|
$
|
281,502
|
|
|||
|
Supplemental information
|
||||||||||||
|
Cash paid for taxes
|
$
|
164,362
|
|
$
|
189,235
|
|
$
|
169,424
|
|
|||
The accompanying notes are an integral part of these consolidated financial statements.
50
F5 NETWORKS, INC.
NOTES TO CONSOLIDATED FINANCIAL STATEMENTS
1. Summary of Significant Accounting Policies
The Company
F5 Networks, Inc. (the “Company”) is the leading developer and provider of software-defined application services. The Company’s core technology is a full-proxy, programmable, highly-scalable software platform called TMOS, which supports a broad array of features and functions designed to ensure that applications delivered over Internet Protocol (IP) networks are secure, fast and available. The Company’s TMOS-based offerings include software products for local and global traffic management, network and application security, access management, web acceleration and a number of other network and application services. These products are available as modules that can run individually or as part of an integrated solution on the Company’s high-performance, scalable, purpose-built BIG-IP appliances and VIPRION chassis-based hardware, or as software-only Virtual Editions. The Company also offers distributed denial-of-service (DDoS) protection, application security and other application services by subscription on its cloud-based Silverline platform. In connection with its products, the Company offers a broad range of support services including consulting, training, installation and maintenance.
Accounting Principles
The Company’s consolidated financial statements and accompanying notes are prepared on the accrual basis of accounting in accordance with generally accepted accounting principles in the United States of America (GAAP).
Principles of Consolidation
The consolidated financial statements include the accounts of the Company and its wholly owned subsidiaries. All intercompany accounts and transactions have been eliminated in consolidation.
Reclassifications
Certain prior year amounts, specifically relating to the tax effects of unrealized gains and losses on securities, have been corrected and reclassified as tax expenses and benefits, respectively, to conform to the current year presentation in the Consolidated Statements of Comprehensive Income. The corrected and reclassified amounts are considered immaterial and there was no change to comprehensive income as a result.
Use of Estimates
The preparation of financial statements in conformity with GAAP requires management to make estimates and assumptions that affect the reported amounts of assets and liabilities, disclosures of contingent assets and liabilities as of the date of the financial statements, and the reported amounts of revenues and expenses during the reporting period. Estimates are used in accounting for revenue recognition, reserves for doubtful accounts, product returns, obsolete and excess inventory and valuation allowances on deferred tax assets. Actual results could differ from those estimates.
Cash and Cash Equivalents
The Company considers all highly liquid investments with original maturities of three months or less to be cash equivalents. The Company invests its cash and cash equivalents in deposits with five major financial institutions, which, at times, exceed federally insured limits. The Company has not experienced any losses on its cash and cash equivalents.
Investments
The Company classifies its investment securities as available-for-sale. Investment securities, consisting of certificates of deposit, corporate and municipal bonds and notes, United States government and agency securities and international government securities are reported at fair value with the related unrealized gains and losses included as a component of accumulated other comprehensive income (loss) in shareholders’ equity. Realized gains and losses and declines in value of securities judged to be other than temporary are included in other income (expense). The cost of investments for purposes of computing realized and unrealized gains and losses is based on the specific identification method. Investments in securities with maturities of less than one year or where management’s intent is to use the investments to fund current operations are classified as short-term investments. Investments with maturities of greater than one year are classified as long-term investments.
51
Concentration of Credit Risk
The Company extends credit to customers and is therefore subject to credit risk. The Company performs initial and ongoing credit evaluations of its customers’ financial condition and does not require collateral. An allowance for doubtful accounts is recorded to account for potential bad debts. Estimates are used in determining the allowance for doubtful accounts and are based upon an assessment of selected accounts and as a percentage of remaining accounts receivable by aging category. In determining these percentages, the Company evaluates historical write-offs, and current trends in customer credit quality, as well as changes in credit policies. At
September 30, 2016
, Westcon Group, Inc. and Ingram Micro, Inc. accounted for
18.0%
and
15.5%
of the Company’s accounts receivable, respectively. At
September 30, 2015
, Westcon Group, Inc. and Ingram Micro, Inc. accounted for
17.2%
and
15.8%
of the Company’s accounts receivable, respectively.
The Company maintains its cash and investment balances with high credit quality financial institutions.
Fair Value of Financial Instruments
Short-term and long-term investments are recorded at fair value as the underlying securities are classified as available-for-sale with any unrealized gain or loss being recorded to other comprehensive income. The fair value for securities held is determined using quoted market prices, broker or dealer quotations, or alternative pricing sources with reasonable levels of price transparency.
Inventories
The Company outsources the manufacturing of its pre-configured hardware platforms to contract manufacturers++, who assemble each product to the Company’s specifications. As protection against component shortages and to provide replacement parts for its service teams, the Company also stocks limited supplies of certain key product components. The Company reduces inventory to net realizable value based on excess and obsolete inventories determined primarily by historical usage and forecasted demand. Inventories consist of hardware and related component parts and are recorded at the lower of cost or market (as determined by the first-in, first-out method).
Inventories consist of the following (in thousands):
|
|
September 30,
|
|||||||
|
|
2016
|
2015
|
||||||
|
Finished goods
|
$
|
23,642
|
|
$
|
24,346
|
|
||
|
Raw materials
|
10,409
|
|
9,371
|
|
||||
|
$
|
34,051
|
|
$
|
33,717
|
|
|||
Property and Equipment
Property and equipment is stated at cost. Depreciation of property and equipment are provided using the straight-line method over the estimated useful lives of the assets, ranging from
two
to
five
years. Leasehold improvements are amortized over the lesser of the remaining lease term or the estimated useful life of the improvements. The cost of normal maintenance and repairs is charged to expense as incurred and expenditures for major improvements are capitalized at cost. Gains or losses on the disposition of assets are reflected in the income statements at the time of disposal.
Property and equipment consist of the following (in thousands):
|
|
September 30,
|
|||||||
|
|
2016
|
2015
|
||||||
|
Computer equipment
|
$
|
158,127
|
|
$
|
137,243
|
|
||
|
Office furniture and equipment
|
28,557
|
|
17,505
|
|
||||
|
Leasehold improvements
|
83,712
|
|
70,953
|
|
||||
|
270,396
|
|
225,701
|
|
|||||
|
Accumulated depreciation and amortization
|
(147,148
|
)
|
(129,792
|
)
|
||||
|
$
|
123,248
|
|
$
|
95,909
|
|
|||
Depreciation and amortization expense totaled approximately
$36.4 million
,
$30.1 million
, and
$24.7 million
for the fiscal years ended
September 30, 2016
,
2015
and
2014
, respectively.
52
Goodwill
Goodwill represents the excess purchase price over the estimated fair value of net assets acquired as of the acquisition date. The Company tests goodwill for impairment on an annual basis and between annual tests when impairment indicators are identified, and goodwill is written down when impaired. Goodwill was recorded in connection with the acquisition of Defense.Net, Inc. in fiscal year 2014, Versafe Ltd. and LineRate Systems, Inc. in fiscal year 2013, Traffix Systems in fiscal year 2012, Acopia Networks, Inc. in fiscal year 2007, Swan Labs, Inc. in fiscal year 2006, MagniFire Websystems, Inc. in fiscal year 2004 and uRoam, Inc. in fiscal year 2003. For its annual goodwill impairment test in all periods to date, the Company has operated under one reporting unit and the fair value of its reporting unit has been determined by the Company’s enterprise value. The Company performs its annual goodwill impairment test during the second fiscal quarter.
As part of the annual goodwill impairment test, the Company first performs a qualitative assessment to determine whether further impairment testing is necessary. If, as a result of its qualitative assessment, it is more-likely-than-not (i.e. greater than 50% chance) that the fair value of the Company’s reporting unit is less than its carrying amount, the quantitative impairment test will be required. Otherwise, no further testing will be required.
Examples of events and circumstances that might indicate that a reporting unit’s fair value is less than its carrying amount include macro-economic conditions such as deterioration in the entity’s operating environment or industry or market considerations; entity-specific events such as increasing costs, declining financial performance, or loss of key personnel; or other events such as an expectation that a reporting unit will be sold or a sustained decrease in the stock price on either an absolute basis or relative to peers.
If it is determined, as a result of the qualitative assessment, that it is more-likely-than-not that the fair value of the Company’s reporting unit is less than its carrying amount, the provisions of authoritative guidance require that the Company perform a two-step impairment test on goodwill. The first step of the test identifies whether potential impairment may have occurred, while the second step of the test measures the amount of the impairment, if any. Impairment is recognized when the carrying amount of goodwill exceeds its fair value. In March 2016, the Company completed a qualitative assessment of potential impairment indicators and concluded that it was more-likely-than-not that the fair value of its reporting unit exceeded its carrying amount. The Company considered potential impairment indicators of goodwill at
September 30, 2016
and noted no indicators of impairment.
Acquired Technology and Intangible Assets
Acquired technology is recorded at cost and amortized over its estimated useful life of
five
years. The estimated useful life of these assets is assessed and evaluated for reasonableness periodically. Acquired technology of
$3.6 million
in fiscal year
2014
,
$15.4 million
in fiscal year
2013
and
$14.9 million
in fiscal year
2012
was recorded in connection with the acquisitions of Defense.Net, Versafe and Traffix Systems, respectively.
Acquired in-process research and development (IPR&D) are intangible assets initially recognized at fair value and classified as indefinite-lived assets until the successful completion or abandonment of the associated research and development efforts. During the development period, these assets will not be amortized as charges to earnings; instead these assets will be tested for impairment on an annual basis or more frequently if impairment indicators are identified.
Amortization expense related to acquired technology totaled
$10.6 million
,
$10.6 million
and
$7.9 million
during the fiscal years
2016
,
2015
and
2014
, respectively, and is charged to cost of product revenues.
The Company's intangible assets subject to amortization are amortized using the straight-line method over their estimated useful lives, ranging from
three
to
ten
years. The Company evaluates the recoverability of intangible assets periodically by taking into account events or circumstances that may warrant revised estimates of useful lives or that indicate the asset may be impaired. Amortization expense of all other intangible assets, including customer relationships, patents and trademarks was not material during the fiscal years
2016
,
2015
and
2014
.
Software Development Costs
The authoritative guidance requires certain internal software development costs related to software to be sold to be capitalized upon the establishment of technological feasibility. Thereafter, software development costs incurred after the establishment of technological feasibility and prior to a product being released for sale are capitalized and reported at the lower of unamortized cost or net realizable value. Capitalized software development costs are amortized over the remaining estimated economic life of the product. The establishment of technological feasibility and the ongoing assessment of recoverability of costs require considerable judgment by the Company with respect to certain internal and external factors, including, but not
53
limited to, anticipated future gross product revenues, estimated economic life and changes in hardware and software technology.
The Company’s software development costs incurred subsequent to achieving technological feasibility have not been significant, and all software development costs have been expensed as research and development activities as incurred.
Internal Use Software
In accordance with the authoritative guidance, the Company capitalizes costs incurred during the application development stage associated with the development of new functionality for internal-use software and developed software related to the infrastructure of its SaaS-based product offerings. The capitalized costs are then amortized over the estimated useful life of the software, which is generally
three
to
five
years, and are included in property and equipment in the accompanying consolidated balance sheets.
Impairment of Long-Lived Assets
The Company assesses the impairment of long-lived assets whenever events or changes in business circumstances indicate that the carrying amount of an asset may not be recoverable. When such events occur, management determines whether there has been impairment by comparing the anticipated undiscounted net future cash flows to the related asset’s carrying value. If impairment exists, the asset is written down to its estimated fair value. No impairment of long-lived assets was noted as of and for the years ended
September 30, 2016
,
2015
and
2014
.
Revenue Recognition
The Company sells products through distributors, resellers, and directly to end users. Revenue is recognized provided that all of the following criteria have been met:
|
•
|
Persuasive evidence of an arrangement exists. Evidence of an arrangement generally consists of a purchase order issued pursuant to the terms and conditions of a distributor, reseller or end user agreement.
|
|
•
|
Delivery has occurred. The Company uses shipping or related documents, or written evidence of customer acceptance, when applicable, to verify delivery or completion of any performance terms.
|
|
•
|
The sales price is fixed or determinable. The Company assesses whether the sales price is fixed or determinable based on payment terms associated with the transaction and whether the sales price is subject to refund or adjustment.
|
|
•
|
Collectability is reasonably assured. The Company assesses collectability primarily based on the creditworthiness of the customer as determined by credit checks and related analysis, as well as the Customer’s payment history.
|
Revenue from the sale of products is generally recognized when the product has been shipped and the customer is obligated to pay for the product. When rights of return are present and the Company cannot estimate returns, revenue is recognized when such rights of return lapse. Payment terms to domestic customers are generally net
30
days to net
45
days. Payment terms to international customers range from net
30
days to net
120
days based on normal and customary trade practices in the individual markets. The Company offers extended payment terms to certain customers, in which case, revenue is recognized when payments are due.
Revenues for post-contract customer support (PCS) are recognized on a straight-line basis over the service contract term. PCS includes a limited period of telephone support, updates, repair or replacement of any failed product or component that fails during the term of the agreement, bug fixes and rights to upgrades, when and if available. Consulting services are customarily billed at fixed hourly rates, plus out-of-pocket expenses, and revenues are recognized when the consulting has been completed. Training revenue is recognized when the training has been completed.
Arrangement consideration is first allocated between software (consisting of nonessential and stand-alone software) and non-software deliverables. The majority of the Company’s products are hardware appliances which contain software essential to the overall functionality of the products. Hardware appliances are generally sold with PCS and on occasion, with consulting and/or training services. Arrangement consideration in such multiple element transactions is allocated to each element based on a fair value hierarchy, where the selling price for an element is based on vendor specific objective evidence (VSOE), if available, third-party evidence (TPE), if available and VSOE is not available; or the best estimate of selling price (BESP), if neither VSOE or TPE is available.
For software deliverables, the Company allocates revenue between multiple elements based on software revenue recognition guidance. Software revenue recognition guidance requires revenue earned on software arrangements involving multiple elements to be allocated to each element based on the relative fair values of those elements. The fair value of an
54
element must be based on VSOE. Where VSOE of the fair value of delivered elements is not available, revenue is recognized on the “residual method” based on the fair value of undelivered elements. If evidence of fair value of one or more undelivered elements does not exist, all revenue is deferred and recognized at the earlier of the delivery of those elements or the establishment of fair value of the remaining undelivered elements.
The Company establishes VSOE for its products, PCS, consulting and training services based on the sales price charged for each element when sold separately. The sales price is discounted from the applicable list price based on various factors including the type of customer, volume of sales, geographic region and program level. The Company’s list prices are generally not fair value as discounts may be given based on the factors enumerated above. The Company uses historical sales transactions to determine whether VSOE can be established for each of the elements. In most instances, VSOE of fair value is the sales price of actual standalone (unbundled) transactions within the past 12 month period, when a substantial majority of transactions (more than
80%
) are priced within a narrow range, which the Company has determined to be plus or minus
15%
of the median sales price.
The Company believes that the VSOE of fair value of training and consulting services is represented by the billable rate per hour, based on the rates charged to customers when they purchase standalone training or consulting services. The price of consulting services is not based on the type of customer, volume of sales, geographic region or program level.
The Company is typically not able to determine VSOE or TPE for non-software products. TPE is determined based on competitor prices for similar elements when sold separately. Generally, the Company’s go-to-market strategy differs from that of other competitive products or services in its markets and the Company’s offerings contain a significant level of differentiation such that the comparable pricing of products with similar functionality cannot be obtained. Furthermore, the Company is unable to reliably determine the selling prices on a stand-alone basis of similar products offered by its competitors.
When the Company is unable to establish selling price using VSOE or TPE, the Company uses BESP in its allocation of arrangement consideration. The objective of BESP is to determine the price at which the Company would transact a sale if the product or service were sold on a stand-alone basis. The Company has been able to establish BESP through the list price, less a discount deemed appropriate to maintain a reasonable gross margin. Management regularly reviews the gross margin information. Non-software product BESP is determined through the Company’s review of historical sales transactions within the past 12 month period. Additional factors considered in determining an appropriate BESP include, but are not limited to, cost of products, pricing practices, geographies, customer classes, and distribution channels.
The Company regularly validates the VSOE of fair value and BESP for elements in its multiple element arrangements. The Company accounts for taxes collected from customers and remitted to governmental authorities on a net basis and excluded these amounts from revenues.
Shipping and Handling
Shipping and handling fees charged to the Company’s customers are recognized as product revenue in the period shipped and the related costs for providing these services are recorded as a cost of sale.
Guarantees and Product Warranties
In the normal course of business to facilitate sales of its products, the Company indemnifies other parties, including customers, resellers, lessors, and parties to other transactions with the Company, with respect to certain matters. The Company has agreed to hold the other party harmless against losses arising from a breach of representations or covenants, or out of intellectual property infringement or other claims made against certain parties. These agreements may limit the time within which an indemnification claim can be made and the amount of the claim. The Company has entered into indemnification agreements with its officers and directors, and the Company’s bylaws contain similar indemnification obligations to the Company’s agents. It is not possible to determine the maximum potential amount under these indemnification agreements due to the limited history of prior indemnification claims and the unique facts and circumstances involved in each particular agreement.
The Company offers warranties of
one
year for hardware for those customers without service contracts, with the option of purchasing additional warranty coverage in yearly increments. The Company accrues for warranty costs as part of its cost of sales based on associated material product costs and technical support labor costs. Accrued warranty costs as of
September 30, 2016
,
2015
and
2014
were not considered material.
55
Research and Development
Research and development expenses consist of salaries and related benefits of product development personnel, prototype materials and expenses related to the development of new and improved products, and an allocation of facilities and depreciation expense. Research and development expenses are reflected in the income statements as incurred.
Advertising
Advertising costs are expensed as incurred. The Company incurred
$4.0 million
,
$4.6 million
and
$3.6 million
in advertising costs during the fiscal years
2016
,
2015
and
2014
, respectively.
Income Taxes
Deferred income tax assets and liabilities are determined based upon differences between the financial statement and income tax bases of assets and liabilities using enacted tax rates in effect for the year in which the differences are expected to reverse. The realization of deferred tax assets is based on historical tax positions and estimates of future taxable income. A valuation allowance is recorded when it is more-likely-than-not that some of the deferred tax assets will not be realized.
The Company assesses whether tax benefits claimed or expected to be claimed on a tax return should be recorded in the financial statements. The Company may recognize the tax benefit from an uncertain tax position only if it is more-likely-than-not that the tax position will be sustained on examination by the taxing authorities, including resolution of any related appeals or litigation processes, based on the technical merits of the position. The tax benefits to be recognized in the financial statements from such a position is measured as the largest amount of benefit that has a greater than fifty percent likelihood of being realized upon ultimate settlement. The Company adjusts these liabilities based on a variety of factors, including the evaluation of information not previously available. These adjustments are reflected as increases or decreases to income tax expense in the period in which new information is available.
Foreign Currency
The functional currency for the Company’s foreign subsidiaries is the local currency in which the respective entity is located, with the exception of F5 Networks Singapore Pte Ltd. in Singapore, F5 Networks Ltd. in the United Kingdom and F5 Networks (Israel) Ltd., Traffix Communication Systems Ltd. and Versafe Ltd. in Israel, that use the U.S. dollar as their functional currency. An entity’s functional currency is determined by the currency of the economic environment in which the majority of cash is generated and expended by the entity. The financial statements of all majority-owned subsidiaries and related entities, with a functional currency other than the U.S. dollar, have been translated into U.S. dollars. All assets and liabilities of the respective entities are translated at year-end exchange rates and all revenues and expenses are translated at average rates during the respective period. Translation adjustments are reported as other comprehensive income (loss) in the consolidated statements of comprehensive income.
Foreign currency transaction gains and losses are a result of the effect of exchange rate changes on transactions denominated in currencies other than the functional currency, including U.S. dollars. Gains and losses on those foreign currency transactions are included in determining net income or loss for the period of exchange. The net effect of foreign currency gains and losses was not significant during the fiscal years ended
September 30, 2016
,
2015
and
2014
.
Segments
Management has determined that the Company was organized as, and operated in, one reportable operating segment for fiscal year
2016
and prior years: the development, marketing and sale of application delivery networking products that optimize the security, performance and availability of network applications, servers and storage systems.
Stock-based Compensation
The Company accounts for stock-based compensation using the straight-line attribution method for recognizing compensation expense. The Company recognized
$156.8 million
,
$145.6 million
and
$127.2 million
of stock-based compensation expense for the fiscal years ended
September 30, 2016
,
2015
and
2014
, respectively. As of
September 30, 2016
, there was
$119.1 million
of total unrecognized stock-based compensation cost, the majority of which will be recognized over the next
two
years. Going forward, stock-based compensation expenses may increase as the Company issues additional equity-based awards to continue to attract and retain key employees.
The Company issues incentive awards to its employees through stock-based compensation consisting of restricted stock units (RSUs). On
October 28, 2016
, the Company’s Board of Directors and Compensation Committee approved
1,242,170
RSUs to employees and executive officers pursuant to the Company’s annual equity awards program. The value of RSUs is
56
determined using the fair value method, which in this case, is based on the number of shares granted and the quoted price of the Company’s common stock on the date of grant. No stock options were granted in fiscal years
2016
and
2015
. All stock options granted in fiscal year
2014
were assumed as part of the acquisition of Defense.Net. In determining the fair value of shares issued under the Employee Stock Purchase Plan (ESPP), the Company uses the Black-Scholes option pricing model that employs the following key assumptions.
|
|
Employee Stock Purchase Plan
Years Ended September 30, |
||||||||
|
|
2016
|
2015
|
2014
|
||||||
|
Risk-free interest rate
|
0.44
|
%
|
0.17
|
%
|
0.05
|
%
|
|||
|
Expected dividend
|
—
|
|
—
|
|
—
|
|
|||
|
Expected term
|
0.5 years
|
|
0.5 years
|
|
0.5 years
|
|
|||
|
Expected volatility
|
29.97
|
%
|
24.44
|
%
|
24.44
|
%
|
|||
The risk-free rate is based on the U.S. Treasury yield curve in effect at the time of grant. The Company does not anticipate declaring dividends in the foreseeable future. Expected volatility is based on the annualized daily historical volatility of the Company’s stock price commensurate with the expected life of the ESPP option. Expected term of the ESPP option is based on an offering period of
six
months. The assumptions above are based on management’s best estimates at that time, which impact the fair value of the ESPP option calculated under the Black-Scholes methodology and, ultimately, the expense that will be recognized over the life of the ESPP option.
The Company recognizes compensation expense for only the portion of restricted stock units that are expected to vest. Therefore, the Company applies estimated forfeiture rates that are derived from historical employee termination behavior. Based on historical differences with forfeitures of stock-based awards granted to the Company’s executive officers and Board of Directors versus grants awarded to all other employees, the Company has developed separate forfeiture expectations for these two groups.
The Company issues incentive awards to certain current executive officers as part of its annual equity awards program.
Fifty percent
of the aggregate number of RSUs issued to executive officers vest in equal quarterly increments, and
50%
are subject to the Company achieving specified quarterly revenue and EBITDA goals. In each case,
70%
of the quarterly performance stock grant is based on achieving at least
80%
of the quarterly revenue goal set by the Company's Board of Directors, and the other
30%
is based on achieving at least
80%
of the quarterly EBITDA goal set by the Company's Board of Directors. The quarterly performance stock grant is paid linearly over
80%
of the targeted goals. At least
100%
of both goals must be attained in order for the quarterly performance stock grant to be awarded over
100%
. Each goal is evaluated individually and subject to the
80%
achievement threshold and the
100%
over-achievement threshold. Each goal is also capped at achievement of
200%
above target.
As of
September 30, 2016
, the following annual equity grants for executive officers or a portion thereof are outstanding:
|
Grant Date
|
RSUs Granted
|
Vesting Schedule
|
Vesting Period
|
Date Fully Vested
|
|
November 2, 2015
|
145,508
|
Quarterly
|
4 years
|
November 1, 2019
|
|
November 1, 2014
|
171,575
|
Quarterly
|
4 years
|
November 1, 2018
|
|
November 1, 2013
|
231,320
|
Quarterly
|
4 years
|
November 1, 2017
|
|
November 1, 2012
|
290,415
|
Quarterly
|
4 years
|
November 1, 2016
|
The Company recognizes compensation costs for awards with performance conditions when it concludes it is probable that the performance condition will be achieved. The Company reassesses the probability of vesting at each balance sheet date and adjusts compensation costs based on the probability assessment.
Common Stock Repurchase
On
April 20, 2016
, the Company announced that its Board of Directors authorized an additional
$1.0 billion
for its common stock share repurchase program. This new authorization is incremental to the existing
$2.4 billion
program, initially approved in October 2010 and expanded in each fiscal year. Acquisitions for the share repurchase programs will be made from time to time in private transactions or open market purchases as permitted by securities laws and other legal requirements. The programs can be terminated at any time. During fiscal year 2016, the Company repurchased and retired
6,608,980
shares at an
57
average price of
$105.94
per share and as of September 30, 2016, the Company had
$773.7 million
remaining authorized to purchase shares.
Earnings Per Share
Basic net income per share is computed by dividing net income by the weighted average number of common shares outstanding during the period. Diluted net income per share is computed by dividing net income by the weighted average number of common and dilutive common stock equivalent shares outstanding during the period. The Company’s nonvested restricted stock units do not have nonforfeitable rights to dividends or dividend equivalents and are not considered participating securities that should be included in the computation of earnings per share under the two-class method.
The following table sets forth the computation of basic and diluted net income per share (in thousands, except per share data):
|
|
Years Ended September 30,
|
|||||||||||
|
|
2016
|
2015
|
2014
|
|||||||||
|
Numerator
|
||||||||||||
|
Net income
|
$
|
365,855
|
|
$
|
365,014
|
|
$
|
311,183
|
|
|||
|
Denominator
|
||||||||||||
|
Weighted average shares outstanding — basic
|
67,433
|
|
71,944
|
|
75,395
|
|
||||||
|
Dilutive effect of common shares from stock options and restricted stock units
|
551
|
|
603
|
|
697
|
|
||||||
|
Weighted average shares outstanding — diluted
|
67,984
|
|
72,547
|
|
76,092
|
|
||||||
|
Basic net income per share
|
$
|
5.43
|
|
$
|
5.07
|
|
$
|
4.13
|
|
|||
|
Diluted net income per share
|
$
|
5.38
|
|
$
|
5.03
|
|
$
|
4.09
|
|
|||
An immaterial amount of common shares potentially issuable from stock options for the years ended September 30,
2016
,
2015
and
2014
are excluded from the calculation of diluted earnings per share because the exercise price was greater than the average market price of common stock for the respective period.
Comprehensive Income
Comprehensive income includes certain changes in equity that are excluded from net income. Specifically, unrealized gains or losses on securities and foreign currency translation adjustments. These changes are included in accumulated other comprehensive income or loss.
Recent Accounting Pronouncements
In May 2014, the FASB issued ASU 2014-09,
Revenue from Contracts with Customers (Topic 606)
(ASU 2014-09). ASU 2014-09 and the related amendments outline a new, single comprehensive model for entities to use in accounting for revenue arising from contracts with customers and supersedes most current revenue recognition guidance, including industry-specific guidance. The new model will require revenue recognition to depict the transfer of promised goods or services to customers in an amount that reflects the consideration a company expects to receive in exchange for those goods or services. The standard can be applied either retrospectively to each period presented or as a cumulative-effect adjustment as of the date of adoption. In July 2015, the FASB issued ASU 2015-14,
Revenue from Contracts with Customers (Topic 606): Deferral of the Effective Date
, which delays the effective date of ASU 2014-09 by one year. In accordance with the agreed upon delay, ASU 2014-09 and all related amendments are effective for fiscal years, and interim periods within those fiscal years, beginning after December 15, 2017. Early adoption is permitted but not before annual periods beginning after December 15, 2016. The Company is currently assessing the impact that this updated standard will have on its consolidated financial statements and footnote disclosures.
In June 2014, the FASB issued ASU 2014-12,
Compensation - Stock Compensation (Topic 718): Accounting for Share-Based Payments When the Terms of an Award Provide that a Performance Target Could be Achieved after the Requisite Service Period
(ASU 2014-12), which requires that a performance target that affects vesting, and that could be achieved after the requisite service period, be treated as a performance condition. As such, the performance target should not be reflected in estimating the grant date fair value of the award. This update further clarifies that compensation cost should be recognized in the period in which it becomes probable that the performance target will be achieved and should represent the compensation cost attributable to the period(s) for which the requisite service has already been rendered. The new standard is effective for fiscal years, and interim periods within those fiscal years, beginning after December 15, 2015. Early adoption is permitted. The
58
Company will adopt ASU 2014-12 in the first quarter of fiscal 2017 and does not expect the adoption of this standard to have a material impact on its consolidated financial statements.
In April 2015, the FASB issued ASU 2015-05,
Intangibles-Goodwill and Other-Internal-Use Software: Customer’s Accounting for Fees Paid in a Cloud Computing Arrangement
(ASU 2015-05), which provides guidance on determining whether a cloud computing arrangement contains a software license. If a cloud computing arrangement includes a software license, then the customer should account for the software license element of the arrangement consistent with the acquisition of other software licenses. If a cloud computing arrangement does not include a software license, the customer should account for the arrangement as a service contract. The new standard is effective for fiscal years, and interim periods within those fiscal years, beginning after December 15, 2015. Early adoption is permitted. The Company will adopt ASU 2015-05 in the first quarter of fiscal 2017 and does not expect the adoption of this standard to have a material impact on its consolidated financial statements.
In July 2015, the FASB issued ASU 2015-11,
Simplifying the Measurement of Inventory
(ASU 2015-11), which changes the subsequent measurement of inventory from lower of cost or market to lower of cost and net realizable value. The new standard is effective for fiscal years, and interim periods within those fiscal years, beginning after December 15, 2016. Early adoption is permitted. The Company is currently assessing the impact that this updated standard will have on its consolidated financial statements and footnote disclosures.
In November 2015, the FASB issued ASU 2015-17,
Balance Sheet Classification of Deferred Taxes
(ASU 2015-17), which requires that all deferred tax assets and liabilities be classified as noncurrent in a classified balance sheet. The new standard is effective for fiscal years, and interim periods within those fiscal years, beginning after December 15, 2016. Early adoption is permitted as of the beginning of an interim or annual reporting period. The Company does not anticipate that the adoption of this standard will have a material impact on its consolidated financial statements.
In February 2016, the FASB issued ASU 2016-02,
Leases (Topic 842)
(ASU 2016-02), which requires lessees to recognize on the balance sheet a right-of-use asset, representing its right to use the underlying asset for the lease term, and a corresponding lease liability for all leases with terms greater than twelve months. The guidance also requires qualitative and quantitative disclosures designed to assess the amount, timing and uncertainty of cash flows arising from leases. The new standard is effective for fiscal years, and interim periods within those fiscal years, beginning after December 15, 2018, and is required to be applied with a modified retrospective approach. Early adoption is permitted. The Company is currently assessing the impact that this updated standard will have on its consolidated financial statements and footnote disclosures.
In March 2016, the FASB issued ASU 2016-09,
Compensation-Stock Compensation (Topic 718): Improvements to Employee Share-Based Payment Accounting
(ASU 2016-09), which is intended to simplify several aspects of the accounting for share-based payment transactions, including the accounting for income taxes, forfeitures, and statutory tax withholding requirements, as well as classification in the statement of cash flows. The new standard is effective for fiscal years, and interim periods within those fiscal years, beginning after December 15, 2016. Early adoption is permitted. The Company is currently assessing the impact that this updated standard will have on its consolidated financial statements and footnote disclosures.
In June 2016, the FASB issued ASU 2016-13,
Financial Instruments - Credit Losses (Topic 326): Measurement of Credit Losses on Financial Instruments
, which replaces the incurred loss impairment methodology in current GAAP with a methodology that reflects expected credit losses. The new standard is effective for fiscal years, and interim periods within those fiscal years, beginning after December 15, 2019. Early adoption is permitted. The Company is currently assessing the impact that this updated standard will have on its consolidated financial statements and footnote disclosures.
In August 2016, the FASB issued ASU 2016-15,
Statement of Cash Flows (Topic 230): Classification of Certain Cash Receipts and Cash Payments
(ASU 2016-15), which clarifies how companies present and classify certain cash receipts and cash payments in the statement of cash flows. The new standard is effective for fiscal years, and interim periods within those fiscal years, beginning after December 15, 2017. Early adoption is permitted, including adoption in an interim period. The Company is currently assessing the impact that this updated standard will have on its consolidated financial statements and footnote disclosures.
2. Fair Value Measurements
In accordance with the authoritative guidance on fair value measurements and disclosure under GAAP, the Company determines fair value using a fair value hierarchy that distinguishes between market participant assumptions developed based on market data obtained from sources independent of the reporting entity, and the reporting entity’s own assumptions about market participant assumptions developed based on the best information available in the circumstances and expands disclosure about fair value measurements.
59
Fair value is the price that would be received to sell an asset or paid to transfer a liability in the principal or most advantageous market for the asset or liability in an orderly transaction between market participants at the measurement date, essentially the exit price.
The levels of fair value hierarchy are:
Level 1:
Quoted prices in active markets for identical assets and liabilities at the measurement date that the Company has the ability to access.
Level 2:
Observable inputs other than quoted prices included in Level 1, such as quoted prices for similar assets and liabilities in active markets; quoted prices for identical or similar assets and liabilities in markets that are not active; or other inputs that are observable or can be corroborated by observable market data.
Level 3:
Unobservable inputs for which there is little or no market data available. These inputs reflect management’s assumptions of what market participants would use in pricing the asset or liability.
Level 1 investments are valued based on quoted market prices in active markets and include the Company’s cash equivalent investments. Level 2 investments, which include investments that are valued based on quoted prices in markets that are not active, broker or dealer quotations, actual trade data, benchmark yields or alternative pricing sources with reasonable levels of price transparency, include the Company’s certificates of deposit, corporate bonds and notes, municipal bonds and notes, U.S. government securities, U.S. government agency securities and international government securities. Fair values for the Company’s level 2 investments are based on similar assets without applying significant judgments. In addition, all of the Company’s level 2 investments have a sufficient level of trading volume to demonstrate that the fair values used are appropriate for these investments.
A financial instrument’s level within the fair value hierarchy is based upon the lowest level of any input that is significant to the fair value measurement. However, the determination of what constitutes “observable” requires significant judgment by the Company. The Company considers observable data to be market data which is readily available, regularly distributed or updated, reliable and verifiable, not proprietary, and provided by independent sources that are actively involved in the relevant market.
The Company’s financial assets measured at fair value on a recurring basis subject to the disclosure requirements at
September 30, 2016
, were as follows (in thousands):
|
|
Fair Value Measurements at Reporting Date Using
|
Fair Value at
September 30,
2016
|
||||||||||||||
|
|
Quoted Prices in
Active Markets for
Identical Securities
(Level 1)
|
Significant
Other Observable
Inputs
(Level 2)
|
Significant
Unobservable
Inputs
(Level 3)
|
|||||||||||||
|
Cash equivalents
|
$
|
56,525
|
|
$
|
—
|
|
$
|
—
|
|
$
|
56,525
|
|
||||
|
Short-term investments
|
||||||||||||||||
|
Available-for-sale securities — corporate bonds and notes
|
—
|
|
223,358
|
|
—
|
|
223,358
|
|
||||||||
|
Available-for-sale securities — municipal bonds and notes
|
—
|
|
53,621
|
|
—
|
|
53,621
|
|
||||||||
|
Available-for-sale securities — U.S. government securities
|
—
|
|
72,521
|
|
—
|
|
72,521
|
|
||||||||
|
Available-for-sale securities — U.S. government agency securities
|
—
|
|
18,324
|
|
—
|
|
18,324
|
|
||||||||
|
Long-term investments
|
|
|||||||||||||||
|
Available-for-sale securities — corporate bonds and notes
|
—
|
|
131,427
|
|
—
|
|
131,427
|
|
||||||||
|
Available-for-sale securities — municipal bonds and notes
|
—
|
|
27,050
|
|
—
|
|
27,050
|
|
||||||||
|
Available-for-sale securities — U.S. government securities
|
—
|
|
27,023
|
|
—
|
|
27,023
|
|
||||||||
|
Available-for-sale securities — U.S. government agency securities
|
—
|
|
90,875
|
|
—
|
|
90,875
|
|
||||||||
|
Total
|
$
|
56,525
|
|
$
|
644,199
|
|
$
|
—
|
|
$
|
700,724
|
|
||||
60
The Company’s financial assets measured at fair value on a recurring basis subject to the disclosure requirements at
September 30, 2015
, were as follows (in thousands):
|
|
Fair Value Measurements at Reporting Date Using
|
Fair Value at
September 30,
2015
|
||||||||||||||
|
Quoted Prices in
Active Markets for
Identical Securities
(Level 1)
|
Significant
Other Observable
Inputs
(Level 2)
|
Significant
Unobservable
Inputs
(Level 3)
|
||||||||||||||
|
Cash equivalents
|
$
|
60,142
|
|
$
|
—
|
|
$
|
—
|
|
$
|
60,142
|
|
||||
|
Short-term investments
|
||||||||||||||||
|
Available-for-sale securities — corporate bonds and notes
|
—
|
|
224,693
|
|
—
|
|
224,693
|
|
||||||||
|
Available-for-sale securities — municipal bonds and notes
|
—
|
|
39,518
|
|
—
|
|
39,518
|
|
||||||||
|
Available-for-sale securities — U.S. government securities
|
—
|
|
58,530
|
|
—
|
|
58,530
|
|
||||||||
|
Available-for-sale securities — U.S. government agency securities
|
—
|
|
58,323
|
|
—
|
|
58,323
|
|
||||||||
|
Available-for-sale securities — international government securities
|
—
|
|
2,818
|
|
—
|
|
2,818
|
|
||||||||
|
Long-term investments
|
|
|||||||||||||||
|
Available-for-sale securities — corporate bonds and notes
|
—
|
|
244,973
|
|
—
|
|
244,973
|
|
||||||||
|
Available-for-sale securities — municipal bonds and notes
|
—
|
|
74,505
|
|
—
|
|
74,505
|
|
||||||||
|
Available-for-sale securities — U.S. government securities
|
—
|
|
26,089
|
|
—
|
|
26,089
|
|
||||||||
|
Available-for-sale securities — U.S. government agency securities
|
—
|
|
52,089
|
|
—
|
|
52,089
|
|
||||||||
|
Total
|
$
|
60,142
|
|
$
|
781,538
|
|
$
|
—
|
|
$
|
841,680
|
|
||||
The Company uses the fair value hierarchy for financial assets and liabilities. The Company’s non-financial assets and liabilities, which include goodwill, intangible assets, and long-lived assets, are not required to be carried at fair value on a recurring basis. These non-financial assets and liabilities are measured at fair value on a non-recurring basis when there is an indicator of impairment, and they are recorded at fair value only when impairment is recognized. The Company reviews goodwill and intangible assets for impairment annually, during the second quarter of each fiscal year, or as circumstances indicate the possibility of impairment. The Company monitors the carrying value of long-lived assets for impairment whenever events or changes in circumstances indicate its carrying amount may not be recoverable. During the year ended
September 30, 2016
, the Company did not recognize any impairment charges related to goodwill, intangible assets, or long-lived assets.
3. Short-Term and Long-Term Investments
Short-term investments consist of the following (in thousands):
|
September 30, 2016
|
Cost or
Amortized
Cost
|
Gross
Unrealized
Gains
|
Gross
Unrealized
Losses
|
Fair Value
|
||||||||||||
|
Corporate bonds and notes
|
$
|
223,448
|
|
$
|
38
|
|
$
|
(128
|
)
|
$
|
223,358
|
|
||||
|
Municipal bonds and notes
|
53,657
|
|
1
|
|
(37
|
)
|
53,621
|
|
||||||||
|
U.S. government securities
|
72,497
|
|
31
|
|
(7
|
)
|
72,521
|
|
||||||||
|
U.S. government agency securities
|
18,318
|
|
6
|
|
—
|
|
18,324
|
|
||||||||
|
$
|
367,920
|
|
$
|
76
|
|
$
|
(172
|
)
|
$
|
367,824
|
|
|||||
|
September 30, 2015
|
Cost or
Amortized
Cost
|
Gross
Unrealized
Gains
|
Gross
Unrealized
Losses
|
Fair Value
|
||||||||||||
|
Corporate bonds and notes
|
$
|
224,635
|
|
$
|
100
|
|
$
|
(42
|
)
|
$
|
224,693
|
|
||||
|
Municipal bonds and notes
|
39,497
|
|
24
|
|
(3
|
)
|
39,518
|
|
||||||||
|
U.S. government securities
|
58,499
|
|
31
|
|
—
|
|
58,530
|
|
||||||||
|
U.S. government agency securities
|
58,318
|
|
10
|
|
(5
|
)
|
58,323
|
|
||||||||
|
International government securities
|
2,819
|
|
—
|
|
(1
|
)
|
2,818
|
|
||||||||
|
$
|
383,768
|
|
$
|
165
|
|
$
|
(51
|
)
|
$
|
383,882
|
|
|||||
61
Long-term investments consist of the following (in thousands):
|
September 30, 2016
|
Cost or
Amortized
Cost
|
Gross
Unrealized
Gains
|
Gross
Unrealized
Losses
|
Fair Value
|
||||||||||||
|
Corporate bonds and notes
|
$
|
131,273
|
|
$
|
249
|
|
$
|
(95
|
)
|
$
|
131,427
|
|
||||
|
Municipal bonds and notes
|
27,017
|
|
46
|
|
(13
|
)
|
27,050
|
|
||||||||
|
U.S. government securities
|
26,989
|
|
36
|
|
(2
|
)
|
27,023
|
|
||||||||
|
U.S. government agency securities
|
90,877
|
|
52
|
|
(54
|
)
|
90,875
|
|
||||||||
|
$
|
276,156
|
|
$
|
383
|
|
$
|
(164
|
)
|
$
|
276,375
|
|
|||||
|
September 30, 2015
|
Cost or
Amortized
Cost
|
Gross
Unrealized
Gains
|
Gross
Unrealized
Losses
|
Fair Value
|
||||||||||||
|
Corporate bonds and notes
|
$
|
245,224
|
|
$
|
152
|
|
$
|
(403
|
)
|
$
|
244,973
|
|
||||
|
Municipal bonds and notes
|
74,349
|
|
169
|
|
(13
|
)
|
74,505
|
|
||||||||
|
U.S. government securities
|
26,075
|
|
15
|
|
(1
|
)
|
26,089
|
|
||||||||
|
U.S. government agency securities
|
52,042
|
|
47
|
|
—
|
|
52,089
|
|
||||||||
|
$
|
397,690
|
|
$
|
383
|
|
$
|
(417
|
)
|
$
|
397,656
|
|
|||||
The amortized cost and fair value of fixed maturities at
September 30, 2016
, by contractual years-to-maturity, are presented below (in thousands):
|
September 30, 2016
|
Cost or
Amortized
Cost
|
Fair Value
|
||||||
|
One year or less
|
$
|
367,920
|
|
$
|
367,824
|
|
||
|
Over one year
|
276,156
|
|
276,375
|
|
||||
|
$
|
644,076
|
|
$
|
644,199
|
|
|||
The following table summarizes investments that have been in a continuous unrealized loss position for less than 12 months and those that have been in a continuous unrealized loss position for more than 12 months as of
September 30, 2016
(in thousands):
|
|
Less Than 12 Months
|
12 Months or Greater
|
Total
|
|||||||||||||||||||||
|
September 30, 2016
|
Fair Value
|
Gross
Unrealized
Losses
|
Fair
Value
|
Gross
Unrealized
Losses
|
Fair Value
|
Gross
Unrealized
Losses
|
||||||||||||||||||
|
Corporate bonds and notes
|
$
|
90,886
|
|
$
|
(124
|
)
|
$
|
103,043
|
|
$
|
(99
|
)
|
$
|
193,929
|
|
$
|
(223
|
)
|
||||||
|
Municipal bonds and notes
|
50,240
|
|
(37
|
)
|
11,075
|
|
(13
|
)
|
61,315
|
|
(50
|
)
|
||||||||||||
|
U.S. government securities
|
34,006
|
|
(9
|
)
|
—
|
|
—
|
|
34,006
|
|
(9
|
)
|
||||||||||||
|
U.S. government agency securities
|
51,947
|
|
(54
|
)
|
—
|
|
—
|
|
51,947
|
|
(54
|
)
|
||||||||||||
|
Total
|
$
|
227,079
|
|
$
|
(224
|
)
|
$
|
114,118
|
|
$
|
(112
|
)
|
$
|
341,197
|
|
$
|
(336
|
)
|
||||||
The Company invests in securities that are rated investment grade or better. The unrealized losses on investments for fiscal year
2016
were primarily caused by interest rate increases.
The Company reviews the individual securities in its portfolio to determine whether a decline in a security's fair value below the amortized cost basis is other-than-temporary. The Company determined that as of
September 30, 2016
, there were no investments in its portfolio that were other-than-temporarily impaired.
62
4. Balance Sheet Details
Goodwill
There was no change in the carrying amount of goodwill during fiscal year
2016
and changes during fiscal year
2015
were not considered material.
Other Assets
Other assets consist of the following (in thousands):
|
|
September 30,
|
|||||||
|
|
2016
|
2015
|
||||||
|
Acquired and developed technology and software development costs
|
$
|
33,924
|
|
$
|
44,528
|
|
||
|
Intangible assets
|
16,577
|
|
14,268
|
|
||||
|
Restricted cash and deposits
|
9,389
|
|
9,332
|
|
||||
|
$
|
59,890
|
|
$
|
68,128
|
|
|||
Amortization expense related to other assets was approximately
$13.9 million
,
$13.2 million
, and
$9.5 million
for the fiscal years ended
September 30, 2016
,
2015
and
2014
, respectively.
Intangible assets are included in other assets on the balance sheet and consist of the following (in thousands):
|
|
2016
|
2015
|
||||||||||||||||||||||
|
|
Gross
Carrying
Amount
|
Accumulated
Amortization
|
Net Carrying
Amount
|
Gross
Carrying
Amount
|
Accumulated
Amortization
|
Net Carrying
Amount
|
||||||||||||||||||
|
Acquired and developed technology and software development costs
|
$
|
103,031
|
|
$
|
(69,107
|
)
|
$
|
33,924
|
|
$
|
103,031
|
|
$
|
(58,503
|
)
|
$
|
44,528
|
|
||||||
|
Customer relationships
|
10,941
|
|
(5,427
|
)
|
5,514
|
|
10,941
|
|
(4,602
|
)
|
6,339
|
|
||||||||||||
|
Patents and trademarks
|
15,433
|
|
(4,734
|
)
|
10,699
|
|
9,822
|
|
(3,283
|
)
|
6,539
|
|
||||||||||||
|
Trade names
|
1,173
|
|
(809
|
)
|
364
|
|
1,173
|
|
(627
|
)
|
546
|
|
||||||||||||
|
Non-compete covenants
|
2,732
|
|
(2,732
|
)
|
—
|
|
2,732
|
|
(1,888
|
)
|
844
|
|
||||||||||||
|
$
|
133,310
|
|
$
|
(82,809
|
)
|
$
|
50,501
|
|
$
|
127,699
|
|
$
|
(68,903
|
)
|
$
|
58,796
|
|
|||||||
Estimated amortization expense for intangible assets for the five succeeding fiscal years is as follows (in thousands):
|
2017
|
$
|
11,843
|
|
|
|
2018
|
10,444
|
|
||
|
2019
|
6,273
|
|
||
|
2020
|
5,778
|
|
||
|
2021
|
5,646
|
|
||
|
$
|
39,984
|
|
||
Accrued Liabilities
Accrued liabilities consist of the following (in thousands):
|
|
September 30,
|
|||||||
|
|
2016
|
2015
|
||||||
|
Payroll and benefits
|
$
|
105,716
|
|
$
|
90,802
|
|
||
|
Sales and marketing
|
7,228
|
|
2,938
|
|
||||
|
Income tax accruals
|
21,894
|
|
12,913
|
|
||||
|
Other tax accruals
|
10,095
|
|
10,378
|
|
||||
|
Other
|
33,420
|
|
13,370
|
|
||||
|
$
|
178,353
|
|
$
|
130,401
|
|
|||
63
5. Income Taxes
The United States and international components of income before income taxes are as follows (in thousands):
|
|
Years Ended September 30,
|
|||||||||||
|
|
2016
|
2015
|
2014
|
|||||||||
|
United States
|
$
|
465,738
|
|
$
|
530,684
|
|
$
|
492,577
|
|
|||
|
International
|
84,153
|
|
30,660
|
|
4,765
|
|
||||||
|
$
|
549,891
|
|
$
|
561,344
|
|
$
|
497,342
|
|
||||
The provision for income taxes (benefit) consists of the following (in thousands):
|
|
Years Ended September 30,
|
|||||||||||
|
|
2016
|
2015
|
2014
|
|||||||||
|
Current
|
||||||||||||
|
U.S. federal
|
$
|
129,728
|
|
$
|
176,074
|
|
$
|
164,994
|
|
|||
|
State
|
16,821
|
|
16,817
|
|
15,462
|
|
||||||
|
Foreign
|
31,015
|
|
15,446
|
|
13,287
|
|
||||||
|
Total
|
177,564
|
|
208,337
|
|
193,743
|
|
||||||
|
Deferred
|
||||||||||||
|
U.S. federal
|
9,770
|
|
(9,778
|
)
|
(5,778
|
)
|
||||||
|
State
|
(1,029
|
)
|
(326
|
)
|
(83
|
)
|
||||||
|
Foreign
|
(2,269
|
)
|
(1,903
|
)
|
(1,723
|
)
|
||||||
|
Total
|
6,472
|
|
(12,007
|
)
|
(7,584
|
)
|
||||||
|
$
|
184,036
|
|
$
|
196,330
|
|
$
|
186,159
|
|
||||
The effective tax rate differs from the U.S. federal statutory rate as follows (in thousands):
|
|
Years Ended September 30,
|
|||||||||||
|
|
2016
|
2015
|
2014
|
|||||||||
|
Income tax provision at statutory rate
|
$
|
192,462
|
|
$
|
196,470
|
|
$
|
174,070
|
|
|||
|
State taxes, net of federal benefit
|
13,434
|
|
13,030
|
|
12,901
|
|
||||||
|
Foreign operations
|
(9,199
|
)
|
(1,386
|
)
|
5,050
|
|
||||||
|
Research and development and other credits
|
(18,368
|
)
|
(10,286
|
)
|
(6,397
|
)
|
||||||
|
Domestic manufacturing deduction
|
(14,624
|
)
|
(18,236
|
)
|
(15,514
|
)
|
||||||
|
Stock-based and other compensation
|
17,137
|
|
15,462
|
|
14,583
|
|
||||||
|
Other
|
3,194
|
|
1,276
|
|
1,466
|
|
||||||
|
$
|
184,036
|
|
$
|
196,330
|
|
$
|
186,159
|
|
||||
64
The tax effects of the temporary differences that give rise to the deferred tax assets and liabilities are as follows (in thousands):
|
|
Years Ended September 30,
|
|||||||
|
|
2016
|
2015
|
||||||
|
Deferred tax assets
|
||||||||
|
Net operating loss carry-forwards
|
$
|
9,162
|
|
$
|
8,656
|
|
||
|
Allowance for doubtful accounts
|
624
|
|
980
|
|
||||
|
Accrued compensation and benefits
|
10,385
|
|
9,403
|
|
||||
|
Inventories and related reserves
|
1,062
|
|
952
|
|
||||
|
Stock-based compensation
|
11,387
|
|
10,572
|
|
||||
|
Deferred revenue
|
40,763
|
|
39,195
|
|
||||
|
Other accruals and reserves
|
18,492
|
|
15,292
|
|
||||
|
Tax credit carryforwards
|
5,829
|
|
3,743
|
|
||||
|
Depreciation
|
376
|
|
—
|
|
||||
|
98,080
|
|
88,793
|
|
|||||
|
Valuation allowance
|
(14,249
|
)
|
(10,057
|
)
|
||||
|
83,831
|
|
78,736
|
|
|||||
|
Deferred tax liabilities
|
||||||||
|
Purchased intangibles and other
|
(19,308
|
)
|
(21,659
|
)
|
||||
|
Depreciation
|
(14,440
|
)
|
(1,358
|
)
|
||||
|
Other accruals and reserves
|
(652
|
)
|
—
|
|
||||
|
(34,400
|
)
|
(23,017
|
)
|
|||||
|
Net deferred tax assets
|
$
|
49,431
|
|
$
|
55,719
|
|
||
At
September 30, 2016
, the Company had foreign net operating loss carry-forwards of approximately
$49.4 million
that can be carried forward indefinitely. Management believes that it is more-likely-than-not that the benefit from certain foreign net operating loss carryforwards and state tax carryforwards will not be realized. In recognition of this risk, the Company has provided a valuation allowance on the deferred tax assets relating to these carryforwards. The net change in the total valuation allowance was an increase of
$4.2 million
and
$2.9 million
for the years ended
September 30, 2016
and
2015
, respectively.
As of September 30, 2016, the undistributed earnings of our foreign subsidiaries totaled
$110.3 million
. We have not provided U.S. income and foreign withholding taxes on certain foreign subsidiaries in which we intend to permanently reinvest such earnings outside the U.S., or where there would be no U.S. tax liability due to the availability of foreign tax credits. Determination of the unrecognized deferred tax liability that would be incurred if such amounts were repatriated is not practicable.
The Company recognizes the financial statement impact of a tax position only after determining that the relevant tax authority would more-likely-than-not sustain the position following an audit. For tax positions meeting the more-likely-than-not threshold, the amount recognized in the financial statements is the largest impact that has a greater than fifty percent likelihood of being realized upon ultimate settlement with the relevant tax authority.
The following table provides a reconciliation of the beginning and ending amount of unrecognized tax benefits in fiscal years
2016
,
2015
and
2014
(in thousands):
|
2016
|
2015
|
2014
|
||||||||||
|
Balance, beginning of period
|
$
|
9,562
|
|
$
|
6,394
|
|
$
|
7,302
|
|
|||
|
Gross increases related to prior period tax positions
|
1,622
|
|
2,704
|
|
901
|
|
||||||
|
Gross decreases related to prior period tax positions
|
(7
|
)
|
(642
|
)
|
(224
|
)
|
||||||
|
Gross increases related to current period tax positions
|
4,441
|
|
1,290
|
|
1,081
|
|
||||||
|
Decreases relating to settlements with tax authorities
|
(521
|
)
|
(116
|
)
|
(2,589
|
)
|
||||||
|
Reductions due to lapses of statute of limitations
|
(1,410
|
)
|
(68
|
)
|
(77
|
)
|
||||||
|
Balance, end of period
|
$
|
13,687
|
|
$
|
9,562
|
|
$
|
6,394
|
|
|||
65
The total amount of gross unrecognized tax benefits was
$13.7 million
,
$9.6 million
, and
$6.4 million
as of September 30, 2016, 2015, and 2014, respectively, of which,
$11.1 million
,
$8.0 million
, and
$5.5 million
, if recognized, would affect the effective tax rate. There is a reasonable possibility that the Company’s unrecognized tax benefits will change within twelve months due to audit settlements or the expiration of statute of limitations, but the Company does not expect the change to be material to the consolidated financial statements.
The Company recognizes interest and, if applicable, penalties (not included in the “unrecognized tax benefits” table above) for any uncertain tax positions. Interest and penalties are recorded as a component of income tax expense. In the years ended
September 30, 2016
,
2015
and
2014
, the Company recorded approximately
$18,000
,
$466,000
and
$5,000
, respectively, of interest and penalty expense related to uncertain tax positions. As of
September 30, 2016
and
2015
, the Company had a cumulative balance of accrued interest and penalties on unrecognized tax positions of
$920,000
and
$902,000
, respectively.
The Company and its subsidiaries are subject to U.S. federal income tax as well as the income tax of multiple state and foreign jurisdictions. The Company has concluded all U.S. federal income tax matters for fiscal years through
September 30, 2012
. The Company is currently under audit by the IRS for fiscal year
2014
and various states for fiscal years
2011
through
2014
. Major jurisdictions where there are wholly owned subsidiaries of F5 Networks, Inc. which require income tax filings include the United Kingdom, Japan, Singapore, and Australia. The earliest periods open for review by local taxing authorities are fiscal years
2015
for the United Kingdom,
2010
for Japan,
2011
for Singapore, and
2012
for Australia. Within the next four fiscal quarters, the statute of limitations will begin to close on the fiscal years
2012
and
2013
state income tax returns.
6. Stock-based Compensation
The majority of awards consist of restricted stock units and to a lesser degree, stock options. Employees vest in restricted stock units and stock options ratably over the corresponding service term, generally
one
to
four
years. The Company’s stock options expire
ten
years from the date of grant. Restricted stock units are payable in shares of the Company’s common stock as the periodic vesting requirements are satisfied. The value of a restricted stock unit is based upon the fair market value of the Company’s common stock on the date of grant. The value of restricted stock units is determined using the intrinsic value method and is based on the number of shares granted and the quoted price of the Company’s common stock on the date of grant. Alternatively, the Company used the Black-Scholes option pricing model to determine the fair value of its stock options. Compensation expense related to restricted stock units and stock options is recognized over the vesting period. The Company has adopted a number of stock-based compensation plans as discussed below.
1998 Equity Incentive Plan.
In November 1998, the Company adopted the 1998 Equity Incentive Plan, or the 1998 Plan, which provided for discretionary grants of non-qualified and incentive stock options, stock purchase awards and stock bonuses for employees and other service providers. The 1998 Plan expired on November 11, 2008 and no shares remain available for awards under the 1998 Plan. Upon certain changes in control of the Company, all outstanding and unvested options or stock awards under the 1998 Plan will vest at the rate of
50%
, unless assumed or substituted by the acquiring entity. During the fiscal years
2016
and
2015
, the Company issued no stock options, stock purchase awards or stock bonuses under this plan. As of
September 30, 2016
, there were no options outstanding under the 1998 Plan.
2011 Employee Stock Purchase Plan.
In April 2012, the Board of Directors amended and restated the Company’s 1999 Employee Stock Purchase Plan, or the Employee Stock Purchase Plan. A total of
8,000,000
shares of common stock have been reserved for issuance under the Employee Stock Purchase Plan. The Employee Stock Purchase Plan permits eligible employees to acquire shares of the Company’s common stock through periodic payroll deductions of up to
15%
of base compensation. No employee may purchase more than
10,000
shares during an offering period. In addition, no employee may purchase more than
$25,000
worth of stock, determined by the fair market value of the shares at the time such option is granted, in one calendar year. The Employee Stock Purchase Plan has been implemented in a series of offering periods, each
6 months
in duration. The price at which the common stock may be purchased is
85%
of the lesser of the fair market value of the Company’s common stock on the first day of the applicable offering period or on the last day of the respective purchase period. As of
September 30, 2016
there were
1,596,248
shares available for awards under the Employee Stock Purchase Plan.
Acquisition Related Incentive Plans.
In connection with the Company’s acquisition of Acopia in the fourth quarter of fiscal year 2007, the Company assumed the Acopia 2001 Stock Incentive Plan, or the Acopia Plan. Unvested options to acquire Acopia’s common stock were converted into options to acquire the Company’s common stock in connection with the acquisition. A total of
2,230,703
shares of common stock were reserved for issuance under the Acopia Plan. The plan provided for discretionary grants of non-qualified and incentive stock options, restricted stock awards and other stock-based awards to persons who were employees, officers, directors, consultants or advisors to Acopia on or prior to September 12, 2007. During the fiscal year
2016
, the Company issued no stock options or restricted stock units under the Acopia Plan. As of
September 30, 2016
, there were options to purchase
7,619
shares outstanding and no shares available for awards under the Acopia Plan. The
66
Company terminated the Acopia Plan effective November 1, 2008 and no additional shares may be issued from the Acopia Plan.
In connection with the Company’s acquisition of Traffix Systems in the second quarter of fiscal year 2012, the Company assumed the Traffix 2007 Israeli Employee Share Option Plan, or the Traffix Plan. Unvested options to acquire Traffix’s common stock were converted into options to acquire the Company’s common stock in connection with the acquisition. A total of
106,829
shares of common stock were reserved for issuance under the Traffix Plan. The plan provided for grants of stock options to persons who were employees, officers, directors, consultants or advisors to Traffix on or prior to February 21, 2012. During the fiscal year
2016
, the Company issued no stock options or restricted stock units under the Traffix Plan. As of
September 30, 2016
, there were options to purchase
774
shares outstanding and no shares available for additional awards under the Traffix Plan. The Company terminated the Traffix Plan effective January 3, 2014 and no additional shares may be issued from the Traffix Plan.
In February 2013, the Company adopted the LineRate Acquisition Equity Incentive Plan, or the LineRate Acquisition Plan. The LineRate Acquisition Plan provided for discretionary grants of non-statutory stock options and stock units for employees, directors and consultants of LineRate Systems to whom the Company offered employment in connection with the Company’s acquisition of LineRate Systems. A total of
100,000
shares of common stock were reserved for issuance under the LineRate Acquisition Plan. Upon certain changes in control of the Company, the surviving entity will either assume or substitute all outstanding stock awards under the LineRate Acquisition Plan or the vesting of
50%
of the stock awards shall be accelerated. During the fiscal year
2016
, the Company issued no stock options or restricted stock units under the LineRate Acquisition Plan. As of
September 30, 2016
, there were no options outstanding,
10,041
restricted stock units outstanding and no shares available for awards under the LineRate Acquisition Plan. The Company terminated the LineRate Acquisition Plan effective January 3, 2014 and no additional shares may be issued from the LineRate Acquisition Plan.
In connection with the Company’s acquisition of LineRate Systems in the second quarter of fiscal year 2013, the Company assumed the LineRate Systems, Inc. Third Amended and Restated 2009 Equity Incentive Plan, or the LineRate Plan. Unvested options to acquire LineRate Systems' common stock were converted into options to acquire the Company’s common stock in connection with the acquisition. A total of
201,478
shares of common stock were reserved for issuance under the LineRate Plan. The plan provided for grants of stock options to persons who were employees, officers, directors, consultants or advisors to LineRate Systems on or prior to February 11, 2013. During the fiscal year
2016
, the Company issued no stock options or restricted stock units under the LineRate Plan. As of
September 30, 2016
, there were options to purchase
1,000
shares outstanding and no shares available for additional awards under the LineRate Plan. The Company terminated the LineRate Plan effective January 3, 2014 and no additional shares may be issued from the LineRate Plan.
In September 2013, the Company adopted the Versafe Acquisition Equity Incentive Plan, or the Versafe Acquisition Plan. The Versafe Acquisition Plan provided for discretionary grants of non-statutory stock options and stock units for employees, directors and consultants of Versafe Ltd. to whom the Company offered employment in connection with the Company’s acquisition of Versafe. A total of
60,000
shares of common stock were reserved for issuance under the Versafe Acquisition Plan. Upon certain changes in control of the Company, the surviving entity will either assume or substitute all outstanding stock awards under the Versafe Acquisition Plan or the vesting of
50%
of the stock awards shall be accelerated. During the fiscal year
2016
, the Company issued no stock options or restricted stock units under the Versafe Acquisition Plan. As of
September 30, 2016
, there were no options outstanding,
2,120
restricted stock units outstanding and no shares available for awards under the Versafe Acquisition Plan. The Company terminated the Versafe Acquisition Plan effective January 3, 2014 and no additional shares may be issued from the Versafe Acquisition Plan.
In May 2014, the Company adopted the Defense.Net Acquisition Equity Incentive Plan, or the Defense.Net Acquisition Plan. The Defense.Net Acquisition Plan provided for discretionary grants of non-statutory stock options and stock units for employees, directors and consultants of Defense.Net, Inc. to whom the Company offered employment in connection with the Company’s acquisition of Defense.Net. A total of
30,000
shares of common stock were reserved for issuance under the Defense.Net Acquisition Plan. Upon certain changes in control of the Company, the surviving entity will either assume or substitute all outstanding stock awards under the Defense.Net Acquisition Plan or the vesting of
50%
of the stock awards shall be accelerated. During the fiscal year
2016
, the Company issued no stock options or restricted stock units under the Defense.Net Acquisition Plan. As of
September 30, 2016
, there were no options outstanding,
11,500
restricted stock units outstanding and no shares available for awards under the Defense.Net Acquisition Plan. The Company terminated the Defense.Net Acquisition Plan effective January 5, 2015 and no additional shares may be issued from the Defense.Net Acquisition Plan.
In connection with the Company’s acquisition of Defense.Net, Inc. in the third quarter of fiscal year 2014, the Company assumed the Defense.Net, Inc. 2012 Stock Option and Grant Plan, or the Defense.Net Plan. Unvested options to acquire Defense.Net's common stock were converted into options to acquire the Company’s common stock in connection with the
67
acquisition. A total of
84,375
shares of common stock were reserved for issuance under the Defense.Net Plan. The plan provided for grants of stock options to persons who were employees, officers, directors, consultants or advisors to Defense.Net, Inc. on or prior to May 22, 2014. During the fiscal year
2016
, the Company issued no stock options or restricted stock units under the Defense.Net Plan. As of
September 30, 2016
, there were options to purchase
3,181
shares outstanding and no shares available for additional awards under the Defense.Net Plan. The Company terminated the Defense.Net Plan effective January 5, 2015 and no additional shares may be issued from the Defense.Net Plan.
2014 Incentive Plan.
In March 2014, the Company adopted the 2014 Incentive Plan, or the 2014 Plan, which amended and restated the 2005 Equity Incentive Plan. The 2014 Plan provides for discretionary grants of non-statutory stock options and stock units for employees, including officers, and other service providers. A total of
17,630,000
shares of common stock have been reserved for issuance under the 2014 Plan. Upon certain changes in control of the Company, all outstanding and unvested options or stock awards under the 2014 Plan will vest at the rate of
50%
, unless assumed or substituted by the acquiring entity. During the fiscal year
2016
, the Company issued no stock options,
101,073
performance stock units and
1,557,145
restricted stock units under the 2014 Plan. As of
September 30, 2016
, there were no options outstanding,
49,528
performance stock units outstanding,
1,442,170
restricted stock units outstanding and
3,195,747
shares available for new awards under the 2014 Plan.
A majority of the restricted stock units the Company grants to its employees vest quarterly over a
two
-year period. The restricted stock units under all plans were granted during fiscal years
2016
,
2015
and
2014
with a per-share weighted average fair value of
$109.65
,
$124.16
and
$83.81
, respectively. The fair value of restricted stock units vested during fiscal years
2016
,
2015
and
2014
was
$137.7 million
,
$151.4 million
and
$128.9 million
, respectively.
A summary of restricted stock unit activity under the 2014 Plan is as follows:
|
Performance Stock Units
|
Restricted Stock Units
|
|||||||||||||
|
Outstanding
Performance
Stock Units
|
Weighted
Average
Grant Date
Fair Value
|
Outstanding
Restricted
Stock Units
|
Weighted
Average
Grant Date
Fair Value
|
|||||||||||
|
Balance, September 30, 2015
|
20,905
|
|
$
|
123.36
|
|
1,352,752
|
|
$
|
113.14
|
|
||||
|
Units granted
|
101,073
|
|
111.12
|
|
1,557,145
|
|
109.55
|
|
||||||
|
Units vested
|
(64,542
|
)
|
108.55
|
|
(1,175,398
|
)
|
107.99
|
|
||||||
|
Units cancelled
|
(7,908
|
)
|
114.12
|
|
(292,329
|
)
|
111.34
|
|
||||||
|
Balance, September 30, 2016
|
49,528
|
|
$
|
110.50
|
|
1,442,170
|
|
$
|
111.45
|
|
||||
A summary of stock option activity under all of the Company’s plans is as follows:
|
|
Options Outstanding
|
||||||
|
|
Number of
Shares
|
Weighted
Average
Exercise Price
per Share
|
|||||
|
Balance, September 30, 2015
|
32,079
|
|
$
|
14.18
|
|
||
|
Options granted
|
—
|
|
—
|
|
|||
|
Options exercised
|
(19,073
|
)
|
9.42
|
|
|||
|
Options cancelled
|
(432
|
)
|
1.36
|
|
|||
|
Balance, September 30, 2016
|
12,574
|
|
$
|
21.84
|
|
||
No stock options were granted in fiscal years
2016
and
2015
. All stock options granted in fiscal year
2014
were assumed as part of the acquisition of Defense.Net in the third fiscal quarter.
The total intrinsic value of options exercised during fiscal
2016
,
2015
and
2014
was
$1.9 million
,
$4.4 million
and
$14.1 million
, respectively.
68
|
Number of
Shares
|
Weighted
Average
Remaining
Contractual
Life (in Years)
|
Weighted
Average
Exercise
Price
per Share
|
Aggregate
Intrinsic
Value(1)
|
||||||||||
|
|
(In thousands)
|
||||||||||||
|
Stock options outstanding
|
12,574
|
|
3.03
|
$
|
21.84
|
|
$
|
1,293
|
|
||||
|
Exercisable
|
10,176
|
|
2.13
|
$
|
26.22
|
|
$
|
1,002
|
|
||||
|
Vested and expected to vest
|
12,496
|
|
3.01
|
$
|
21.96
|
|
$
|
1,283
|
|
||||
|
(1)
|
Aggregate intrinsic value represents the difference between the fair value of the Company’s common stock underlying these options at
September 30, 2016
and the related exercise prices.
|
As of
September 30, 2016
, equity based awards (including stock options and restricted stock units) are available for future issuance as follows:
|
|
Awards
Available for
Grant
|
||
|
Balance, September 30, 2015
|
4,553,728
|
|
|
|
Granted
|
(1,658,218
|
)
|
|
|
Cancelled
|
313,522
|
|
|
|
Additional shares reserved (terminated), net
|
(13,285
|
)
|
|
|
Balance, September 30, 2016
|
3,195,747
|
|
|
7. Commitments and Contingencies
Operating Leases
The majority of the Company’s operating lease payments relate to the Company’s
four
building corporate headquarters in Seattle, Washington. The leases for all
four
buildings will expire in
2022
with options for renewal. The Company also leases additional office space for product development and sales and support personnel in the United States and internationally.
In October 2006, the Company entered into an agreement to lease a total of approximately
137,000
square feet of office space in a building known as 333 Elliott West, which is adjacent to the
four
buildings that serve as the Company’s corporate headquarters. The lease expires in
2018
. The Company is currently subleasing all floors of this building.
Future minimum operating lease payments, net of sublease income, are as follows (in thousands):
|
Gross Lease
Payments
|
Sublease
Income
|
Net Lease
Payments
|
||||||||||
|
2017
|
27,289
|
|
4,197
|
|
23,092
|
|
||||||
|
2018
|
23,623
|
|
2,828
|
|
20,795
|
|
||||||
|
2019
|
18,675
|
|
—
|
|
18,675
|
|
||||||
|
2020
|
18,116
|
|
—
|
|
18,116
|
|
||||||
|
2021
|
16,975
|
|
—
|
|
16,975
|
|
||||||
|
Thereafter
|
30,314
|
|
—
|
|
30,314
|
|
||||||
|
$
|
134,992
|
|
$
|
7,025
|
|
$
|
127,967
|
|
||||
Rent expense under non-cancelable operating leases amounted to approximately
$30.1 million
,
$28.3 million
, and
$28.6 million
for the fiscal years ended
September 30, 2016
,
2015
, and
2014
, respectively.
Purchase Obligations
Purchase obligations are comprised of purchase commitments with the Company’s contract manufacturers. The agreement with the Company’s primary contract manufacturer allows them to procure component inventory on the Company’s behalf based on the Company’s production forecast. The Company is obligated to purchase component inventory that the contract manufacturer procures in accordance with the forecast, unless cancellation is given within applicable lead times. As of
September 30, 2016
, the Company’s purchase obligations were
$20.7 million
.
69
Litigation
On May 1, 2013, Radware, Ltd. and Radware, Inc. (Radware), filed a complaint for patent infringement against the Company in the United States District Court for the Northern District of California seeking an unspecified amount of monetary damages, as well as interest, costs, and injunctive relief, based upon allegations that the Company infringed three Radware patents related to devices for ISP link load balancing. The Company answered the Complaint, denied the substantive allegations, and sought a declaratory judgment that the asserted claims were invalid. The Company also counter-claimed alleging that Radware had infringed certain Company patents. F5 was granted summary judgment of non-infringement of one of Radware’s three patents before trial. Radware’s remaining infringement claims proceeded to trial and on March 15, 2016, the jury returned a verdict finding that F5 had not proven that the asserted patents were invalid, that the Company willfully infringed one of the two patents and that Radware was due
$6.4 million
in damages. On August 22, 2016, the Court, in response to various post-trial motions, granted F5 judgment as a matter of law on Radware’s claim of willful infringement (and thus denied Radware’s motion for treble damages and attorneys’ fees), awarded prejudgment interest, and issued an injunction. On September 7, 2016, the Court entered judgment in the amount of
$6,870,978.95
in favor of Radware on its claims, and
$40,000
in favor of F5 on its counterclaim (pursuant to an offer and acceptance of judgment). On October 5, 2016, F5 moved for a new trial on invalidity. That motion is still pending and has suspended the time for appeal. Separately, Radware has requested an award of
$192,000
in costs. F5 has objected to the request and it remains pending.
In addition, on April 4, 2016, the Company sued Radware, Inc. in the United States District Court for the Western District of Washington accusing Radware products of infringing three additional Company patents. The Company’s complaint seeks a jury trial and an unspecified amount of monetary damages, as well as interest, costs, and injunctive relief. There is no schedule set in the case at this time.
In addition to the above referenced matters, the Company is subject to legal proceedings, claims, and litigation arising in the ordinary course of business, including intellectual property litigation. Management believes that the Company has meritorious defenses to the allegations made in its pending cases and intends to vigorously defend these lawsuits; however, the Company is unable currently to determine the ultimate outcome of these or similar matters or the potential exposure to loss, if any. There are many uncertainties associated with any litigation and these actions or other third-party claims against the Company may cause it to incur costly litigation and/or substantial settlement charges that could have a material adverse effect on the Company's business, financial condition, results of operations, and cash flows.
The Company records an accrual for loss contingencies for legal proceedings when it believes that an unfavorable outcome is both (a) probable and (b) the amount or range of any possible loss is reasonably estimable. In the second quarter of fiscal 2016, the Company recorded an accrual related to the Radware litigation mentioned above of
$6.4 million
for the verdict and
$2.5 million
for legal fees and other costs associated with the litigation. In the third and fourth quarters of fiscal 2016, the Company recorded a credit of
$0.5 million
and an additional accrual of
$0.6 million
, respectively, related to other costs associated with the litigation. The Company has not recorded any other accruals for loss contingencies associated with other legal proceedings.
8. Employee Benefit Plans
The Company has a 401(k) savings plan whereby eligible employees may voluntarily contribute a percentage of their compensation. The Company may, at its discretion, match a portion of the employees’ eligible contributions. Contributions by the Company to the plan during the years ended
September 30, 2016
,
2015
, and
2014
were approximately
$9.5 million
,
$8.9 million
and
$7.2 million
, respectively. Contributions made by the Company vest over
four
years.
9. Geographic Sales and Significant Customers
Operating segments are defined as components of an enterprise for which separate financial information is available and evaluated regularly by the chief operating decision-maker, or decision-making group, in deciding how to allocate resources and in assessing performance. Management has determined that the Company is organized as, and operates in, one reportable operating segment: the development, marketing and sale of application delivery networking products that optimize the security, performance and availability of network applications, servers and storage systems.
The Company does business in four main geographic regions: the Americas (primarily the United States); Europe, the Middle East, and Africa (EMEA); Japan; and the Asia Pacific region (APAC). The Company’s chief operating decision-making group reviews financial information presented on a consolidated basis accompanied by information about revenues by geographic region. The Company’s foreign offices conduct sales, marketing and support activities. Revenues are attributed by geographic location based on the location of the customer.
70
The following presents revenues by geographic region (in thousands):
|
|
Years Ended September 30,
|
|||||||||||
|
|
2016
|
2015
|
2014
|
|||||||||
|
Americas:
|
||||||||||||
|
United States
|
$
|
1,019,054
|
|
$
|
1,004,601
|
|
$
|
896,010
|
|
|||
|
Other
|
106,228
|
|
94,906
|
|
89,786
|
|
||||||
|
Total Americas
|
1,125,282
|
|
1,099,507
|
|
985,796
|
|
||||||
|
EMEA
|
487,966
|
|
464,078
|
|
404,300
|
|
||||||
|
Japan
|
94,767
|
|
88,297
|
|
90,131
|
|
||||||
|
Asia Pacific
|
287,019
|
|
267,941
|
|
251,819
|
|
||||||
|
$
|
1,995,034
|
|
$
|
1,919,823
|
|
$
|
1,732,046
|
|
||||
The following distributors of the Company's products accounted for more than 10% of total net revenue:
|
|
Years Ended September 30,
|
||||||||
|
|
2016
|
2015
|
2014
|
||||||
|
Westcon Group, Inc.
|
18.7
|
%
|
17.6
|
%
|
14.5
|
%
|
|||
|
Ingram Micro, Inc.
|
14.9
|
%
|
16.1
|
%
|
17.4
|
%
|
|||
|
Avnet Technology Solutions
|
13.3
|
%
|
13.8
|
%
|
14.0
|
%
|
|||
|
Arrow ECS
|
10.1
|
%
|
10.4
|
%
|
—
|
|
|||
The Company tracks assets by physical location. Long-lived assets consist of property and equipment, net, and are shown below (in thousands):
|
|
September 30,
|
|||||||
|
|
2016
|
2015
|
||||||
|
United States
|
$
|
105,480
|
|
$
|
77,223
|
|
||
|
EMEA
|
13,789
|
|
14,574
|
|
||||
|
Other countries
|
3,979
|
|
4,112
|
|
||||
|
$
|
123,248
|
|
$
|
95,909
|
|
|||
71
10. Quarterly Results of Operations (Unaudited)
The following presents the Company’s unaudited quarterly results of operations for the eight quarters ended
September 30, 2016
. The information should be read in conjunction with the Company’s financial statements and related notes included elsewhere in this report. This unaudited information has been prepared on the same basis as the audited financial statements and includes all adjustments, consisting only of normal recurring adjustments that were considered necessary for a fair statement of the Company’s operating results for the quarters presented.
|
|
Three Months Ended
|
|||||||||||||||||||||||||||||||
|
|
Sept. 30, 2016
|
June 30, 2016
|
March 31, 2016
|
Dec. 31, 2015
|
Sept. 30, 2015
|
June 30, 2015
|
March 31, 2015
|
Dec. 31, 2014
|
||||||||||||||||||||||||
|
|
(Unaudited and in thousands, except per share data)
|
|||||||||||||||||||||||||||||||
|
Net revenues
|
||||||||||||||||||||||||||||||||
|
Products
|
$
|
252,984
|
|
$
|
231,366
|
|
$
|
225,441
|
|
$
|
234,678
|
|
$
|
257,719
|
|
$
|
248,767
|
|
$
|
244,116
|
|
$
|
240,937
|
|
||||||||
|
Services
|
272,365
|
|
265,156
|
|
258,236
|
|
254,808
|
|
243,582
|
|
234,819
|
|
228,027
|
|
221,856
|
|
||||||||||||||||
|
Total
|
525,349
|
|
496,522
|
|
483,677
|
|
489,486
|
|
501,301
|
|
483,586
|
|
472,143
|
|
462,793
|
|
||||||||||||||||
|
Cost of net revenues
|
||||||||||||||||||||||||||||||||
|
Products
|
43,591
|
|
40,474
|
|
39,908
|
|
42,651
|
|
44,505
|
|
44,050
|
|
43,600
|
|
42,070
|
|
||||||||||||||||
|
Services
|
41,358
|
|
43,869
|
|
42,322
|
|
43,032
|
|
40,153
|
|
41,609
|
|
38,996
|
|
37,278
|
|
||||||||||||||||
|
Total
|
84,949
|
|
84,343
|
|
82,230
|
|
85,683
|
|
84,658
|
|
85,659
|
|
82,596
|
|
79,348
|
|
||||||||||||||||
|
Gross profit
|
440,400
|
|
412,179
|
|
401,447
|
|
403,803
|
|
416,643
|
|
397,927
|
|
389,547
|
|
383,445
|
|
||||||||||||||||
|
Operating expenses
|
||||||||||||||||||||||||||||||||
|
Sales and marketing
|
158,198
|
|
156,620
|
|
156,469
|
|
157,456
|
|
151,653
|
|
150,833
|
|
151,238
|
|
148,816
|
|
||||||||||||||||
|
Research and development
|
83,746
|
|
83,042
|
|
86,294
|
|
81,145
|
|
77,665
|
|
74,337
|
|
74,521
|
|
70,060
|
|
||||||||||||||||
|
General and administrative
|
35,193
|
|
34,182
|
|
34,803
|
|
34,253
|
|
39,726
|
|
32,627
|
|
30,933
|
|
32,254
|
|
||||||||||||||||
|
Litigation expense
|
630
|
|
(527
|
)
|
8,948
|
|
—
|
|
—
|
|
—
|
|
—
|
|
—
|
|
||||||||||||||||
|
Total operating expenses
|
277,767
|
|
273,317
|
|
286,514
|
|
272,854
|
|
269,044
|
|
257,797
|
|
256,692
|
|
251,130
|
|
||||||||||||||||
|
Income from operations
|
162,633
|
|
138,862
|
|
114,933
|
|
130,949
|
|
147,599
|
|
140,130
|
|
132,855
|
|
132,315
|
|
||||||||||||||||
|
Other income, net
|
268
|
|
978
|
|
133
|
|
1,135
|
|
1,865
|
|
720
|
|
3,266
|
|
2,594
|
|
||||||||||||||||
|
Income before income taxes
|
162,901
|
|
139,840
|
|
115,066
|
|
132,084
|
|
149,464
|
|
140,850
|
|
136,121
|
|
134,909
|
|
||||||||||||||||
|
Provision for income taxes
|
53,966
|
|
48,051
|
|
39,651
|
|
42,368
|
|
52,427
|
|
47,678
|
|
50,392
|
|
45,833
|
|
||||||||||||||||
|
Net income
|
$
|
108,935
|
|
$
|
91,789
|
|
$
|
75,415
|
|
$
|
89,716
|
|
$
|
97,037
|
|
$
|
93,172
|
|
$
|
85,729
|
|
$
|
89,076
|
|
||||||||
|
Net income per share — basic
|
$
|
1.66
|
|
$
|
1.37
|
|
$
|
1.12
|
|
$
|
1.29
|
|
$
|
1.37
|
|
$
|
1.30
|
|
$
|
1.19
|
|
$
|
1.21
|
|
||||||||
|
Weighted average shares — basic
|
65,772
|
|
66,851
|
|
67,549
|
|
69,554
|
|
70,679
|
|
71,509
|
|
72,240
|
|
73,350
|
|
||||||||||||||||
|
Net income per share — diluted
|
$
|
1.64
|
|
$
|
1.37
|
|
$
|
1.11
|
|
$
|
1.28
|
|
$
|
1.36
|
|
$
|
1.29
|
|
$
|
1.18
|
|
$
|
1.21
|
|
||||||||
|
Weighted average shares — diluted
|
66,262
|
|
67,235
|
|
67,804
|
|
69,878
|
|
71,098
|
|
71,957
|
|
72,711
|
|
73,857
|
|
||||||||||||||||
|
Item 9.
|
Changes in and Disagreements with Accountants on Accounting and Financial Disclosure
|
None.
|
Item 9A.
|
Controls and Procedures
|
Evaluation of Disclosure Controls and Procedures
The Company maintains disclosure controls and procedures (as defined in Rules 13a-15(e) and 15d-15(e) under the Securities Exchange Act of 1934, as amended (the “Exchange Act”)) that are designed to ensure that required information is recorded, processed, summarized and reported within the required timeframe, as specified in the rules set forth by the Securities Exchange Commission. Our disclosure controls and procedures are also designed to ensure that information required to be
72
disclosed is accumulated and communicated to management, including the Chief Executive Officer and Chief Financial Officer, to allow timely decisions regarding required disclosures.
Our management, with the participation of our Chief Executive Officer and Chief Financial Officer, evaluated the effectiveness of our disclosure controls and procedures as of
September 30, 2016
and, based on this evaluation, our Chief Executive Officer and Chief Financial Officer have concluded that our disclosure controls and procedures were effective as of
September 30, 2016
.
Management’s Report on Internal Control over Financial Reporting
Management is responsible for establishing and maintaining adequate internal control over financial reporting, as such term is defined in Exchange Act Rules 13a-15(f) and 15d-15(f). Internal control over financial reporting is a process designed to provide reasonable assurance regarding the reliability of financial reporting and the preparation of financial statements for external purposes in accordance with generally accepted accounting principles.
Because of its inherent limitations, internal control over financial reporting may not prevent or detect misstatements. Also, projections of any evaluation of effectiveness to future periods are subject to the risk that controls may become inadequate because of changes in conditions, or that the degree of compliance with the policies or procedures may deteriorate. Management conducted an assessment of the effectiveness of our internal control over financial reporting as of
September 30, 2016
. In making this assessment, management used the criteria set forth by the Committee of Sponsoring Organizations of the Treadway Commission in
Internal Control — Integrated Framework (2013)
. Based on the results of this assessment and on those criteria, management concluded that our internal control over financial reporting was effective as of
September 30, 2016
.
The effectiveness of the Company’s internal control over financial reporting as of
September 30, 2016
, has been audited by PricewaterhouseCoopers LLP, an independent registered public accounting firm, as stated in their report which appears herein.
Changes in Internal Control over Financial Reporting
During the fourth fiscal quarter, there were no changes to our internal control over financial reporting that materially affected, or are reasonably likely to materially affect, our internal controls over financial reporting.
|
Item 9B.
|
Other Information
|
None.
73
|
Item 10.
|
Directors, Executive Officers and Corporate Governance
|
Certain information required by this item regarding the Company’s directors and executive officers is incorporated herein by reference to the sections entitled “Board of Directors — Nominees and Continuing Directors,” “Corporate Governance — Committees of the Board — Audit Committee” and “— Code of Ethics for Senior Financial Officers” and “— Director Nomination,” and “Security Ownership of Certain Beneficial Owners and Management — Section 16(a) Beneficial Ownership Reporting Compliance” in the Company’s definitive Proxy Statement that will be furnished to the SEC no later than
January 28, 2017
(the “Proxy Statement”). Additional information regarding the Company’s directors and executive officers is set forth in Item 1 of Part I of this Annual Report on Form 10-K under the caption “Directors and Executive Officers of the Registrant.”
|
Item 11.
|
Executive Compensation
|
The information required by this item is incorporated by reference to the sections entitled “Executive Compensation” and “Corporate Governance — Committees of the Board — Compensation Committee” and “— Compensation Committee Interlocks and Insider Participation” and “— Compensation Committee Report” in the Proxy Statement.
|
Item 12.
|
Security Ownership of Certain Beneficial Owners and Management and Related Shareholder Matters
|
The information required by this item is incorporated by reference to the section entitled “Security Ownership of Certain Beneficial Owners and Management” in the Proxy Statement.
|
Item 13.
|
Certain Relationships and Related Transactions, and Director Independence
|
The information required by this item is incorporated by reference to the sections entitled “Board of Directors — Director Independence” and “Corporate Governance — Related Person Transactions Policy and Procedures” and “— Certain Relationships and Related Person Transactions” in the Proxy Statement.
|
Item 14.
|
Principal Accountant Fees and Services
|
The information required by this item is incorporated by reference to the section entitled “Executive Compensation — Fees Paid to PricewaterhouseCoopers LLP” and “— Audit Committee Pre-Approval Procedures” and “— Annual Independence Determination” in the Proxy Statement.
74
|
Item 15.
|
Exhibits and Financial Statement Schedules
|
|
(a)
|
Documents filed as part of this report are as follows:
|
|
1.
|
Consolidated Financial Statements:
|
Our Consolidated Financial Statements are listed in the Index to Consolidated Financial Statements.
|
2.
|
Financial Statement Schedule:
|
Financial statement schedules have been omitted because the information required to be set forth therein is not applicable, material, or is shown in the Consolidated Financial Statements or the notes hereto.
|
3.
|
Exhibits:
|
The required exhibits are included at the end of this Annual Report on Form 10-K and are described in the Exhibit Index immediately preceding the first exhibit.
75
SIGNATURES
Pursuant to the requirements of Section 13 or 15(d) of the Securities Exchange Act of 1934, the Registrant has duly caused this report to be signed on its behalf by the undersigned, thereunto duly authorized.
|
F5 N
ETWORKS
, I
NC
.
|
|||
|
By:
|
|
/
S
/ JOHN MCADAM
|
|
|
|
John McAdam
|
||
|
|
Chief Executive Officer and President
|
||
Dated:
November 4, 2016
Pursuant to the requirements of the Securities Exchange Act of 1934, this report has been signed below by the following persons on behalf of the Registrant and in the capacities and on the dates indicated.
|
Signature
|
|
Title
|
|
Date
|
||
|
By:
|
|
/
S
/ JOHN MCADAM
|
|
Chief Executive Officer, President, and
Director (principal executive officer)
|
|
November 4, 2016
|
|
|
John McAdam
|
|
|
|||
|
By:
|
|
/
S
/ ANDY REINLAND
|
|
Executive Vice President, Chief Financial
Officer (principal financial officer and principal accounting officer)
|
|
November 4, 2016
|
|
|
Andy Reinland
|
|
|
|||
|
By:
|
|
/
S
/ ALAN J. HIGGINSON
|
|
Director
|
November 4, 2016
|
|
|
Alan J. Higginson
|
||||||
|
By:
|
|
/
S
/ A. GARY AMES
|
|
Director
|
|
November 4, 2016
|
|
|
A. Gary Ames
|
|
|
|||
|
By:
|
|
/
S
/ SANDRA BERGERON
|
|
Director
|
|
November 4, 2016
|
|
Sandra Bergeron
|
||||||
|
By:
|
|
/
S
/ DEBORAH L. BEVIER
|
|
Director
|
|
November 4, 2016
|
|
|
Deborah L. Bevier
|
|
|
|||
|
By:
|
|
/
S
/ JONATHAN CHADWICK
|
|
Director
|
|
November 4, 2016
|
|
|
Jonathan Chadwick
|
|
|
|||
|
By:
|
|
/
S
/ MICHAEL L. DREYER
|
|
Director
|
|
November 4, 2016
|
|
Michael L. Dreyer
|
||||||
|
By:
|
|
/
S
/ PETER KLEIN
|
|
Director
|
|
November 4, 2016
|
|
|
Peter Klein
|
|
|
|||
|
By:
|
|
/
S
/ STEPHEN SMITH
|
|
Director
|
|
November 4, 2016
|
|
Stephen Smith
|
||||||
76
EXHIBIT INDEX
|
Exhibit
Number
|
|
Exhibit Description
|
||
|
2.1
|
|
—
|
Agreement and Plan of Merger dated as of May 31, 2004, by and among the Registrant, Fire5, Inc., a wholly owned subsidiary of the Registrant, MagniFire Websystems, Inc., and Lucent Venture Partners III LLC(1)
|
|
|
3.1
|
|
—
|
Third Amended and Restated Articles of Incorporation of the Registrant(6)
|
|
|
3.2
|
|
—
|
Fifth Amended and Restated Bylaws of F5 Networks, Inc.(19)
|
|
|
4.1
|
|
—
|
Specimen Common Stock Certificate(3)
|
|
|
10.1
|
|
—
|
Second Amended and Restated Office Lease Agreement dated April 5, 2010, between the Registrant and CLP--Elliott West, L.P.(7)
|
|
|
10.2
|
|
—
|
Sublease Agreement dated March 30, 2001 between the Registrant and Cell Therapeutics, Inc.(5)
|
|
|
10.3
|
|
—
|
Form of Indemnification Agreement between the Registrant and each of its directors and certain of its officers(3) §
|
|
|
10.4
|
|
—
|
2011 Employee Stock Purchase Plan(15) §
|
|
|
10.5
|
|
|
—
|
Incentive Compensation Plan for Executive Officers(8) §
|
|
10.6
|
|
|
—
|
Office Lease Agreement with Selig Real Estate Holdings IIX, L.L.C. dated October 31, 2006(9)
|
|
10.7
|
|
|
—
|
First Amendment to Sublease Agreement dated April 13, 2001 between the Registrant and Cell Therapeutics, Inc.(11)
|
|
10.8
|
|
|
—
|
Second Amendment to Sublease Agreement dated March 6, 2002 between the Registrant and Cell Therapeutics, Inc.(11)
|
|
10.9
|
|
|
—
|
Third Amendment to Sublease Agreement dated as of December 22, 2005 between the Registrant and Cell Therapeutics, Inc.(11)
|
|
10.10
|
|
|
—
|
Assumed Acopia Networks, Inc. 2001 Stock Incentive Plan(12) §
|
|
10.11
|
|
|
—
|
Acopia Acquisition Equity Incentive Plan(12) §
|
|
10.12
|
|
|
—
|
Form of Restricted Stock Unit Agreement under the Acopia Acquisition Equity Incentive Plan (with acceleration upon change of control)(13) §
|
|
10.13
|
|
|
—
|
Form of Restricted Stock Unit Agreement under the Acopia Acquisition Equity Incentive Plan (no acceleration upon change of control)(13) §
|
|
10.14
|
|
|
—
|
Form of Change of Control Agreement between F5 Networks, Inc. and the executive officers(14) §
|
|
10.15
|
|
|
—
|
Traffix Communication Systems Ltd. 2007 Israeli Employee Share Option Plan(16) §
|
|
10.16
|
|
|
—
|
Traffix Communication Systems Ltd. Acquisition Equity Incentive Plan(16) §
|
|
10.17
|
|
—
|
LineRate Systems, Inc. Third Amended and Restated 2009 Equity Incentive Plan(17) §
|
|
|
10.18
|
|
—
|
LineRate Systems, Inc. Acquisition Equity Incentive Plan(17) §
|
|
|
10.19
|
|
—
|
Versafe Ltd. Acquisition Equity Incentive Plan(18) §
|
|
|
10.20
|
|
—
|
2014 Incentive Plan(20) §
|
|
|
10.21
|
|
—
|
Defense.Net, Inc. 2012 Stock Option and Grant Plan(21) §
|
|
|
10.22
|
|
—
|
Defense.Net Acquisition Equity Incentive Plan(21) §
|
|
|
10.23
|
|
—
|
Form of 2014 Incentive Plan Award Agreement (Accelerated Vesting) as revised November 2014 §
|
|
|
10.24
|
|
—
|
Retirement Agreement between John McAdam and F5 Networks, Inc.(22)
|
|
|
10.25
|
|
—
|
Waiver and Non-Competition Agreement and General Release of all Claims(23)
|
|
|
10.26
|
|
—
|
Separation and Consulting Agreement and General Release of all Claims(24)
|
|
|
21.1
|
|
*
|
—
|
Subsidiaries of the Registrant
|
|
23.1
|
|
*
|
—
|
Consent of PricewaterhouseCoopers LLP, Independent Registered Public Accounting Firm
|
|
31.1
|
|
*
|
—
|
Certification Pursuant to Section 302 of the Sarbanes-Oxley Act of 2002
|
|
31.2
|
|
*
|
—
|
Certification Pursuant to Section 302 of the Sarbanes-Oxley Act of 2002
|
|
32.1
|
|
*
|
—
|
Certification Pursuant to Section 906 of the Sarbanes-Oxley Act of 2002
|
|
101.INS
|
|
*
|
—
|
XBRL Instance Document
|
|
101.SCH
|
|
*
|
—
|
XBRL Taxonomy Extension Schema Document
|
77
|
Exhibit
Number
|
|
Exhibit Description
|
||
|
101.CAL
|
|
*
|
—
|
XBRL Taxonomy Extension Calculation Linkbase Document
|
|
101.DEF
|
|
*
|
—
|
XBRL Taxonomy Extension Definition Linkbase Document
|
|
101.LAB
|
|
*
|
—
|
XBRL Taxonomy Extension Label Linkbase Document
|
|
101.PRE
|
|
*
|
—
|
XBRL Taxonomy Extension Presentation Linkbase Document
|
|
*
|
Filed herewith.
|
|
§
|
Indicates a management contract or compensatory plan or arrangement.
|
|
(1)
|
Incorporated by reference from Current Report on Form 8-K dated May 31, 2004 and filed with the SEC on June 2, 2004.
|
|
(2)
|
Incorporated by reference from Current Report on Form 8-K dated October 4, 2005 and filed with the SEC on October 5, 2005.
|
|
(3)
|
Incorporated by reference from Registration Statement on Form S-1, File No. 333-75817.
|
|
(4)
|
Incorporated by reference from Quarterly Report on Form 10-Q for the quarter ended June 30, 2000.
|
|
(5)
|
Incorporated by reference from Quarterly Report on Form 10-Q for the quarter ended June 30, 2001.
|
|
(6)
|
Incorporated by reference from Current Report on Form 8-K dated March 19, 2013 and filed with the SEC on March 19, 2013.
|
|
(7)
|
Incorporated by reference from Current Report on Form 8-K dated April 5, 2010 and filed with the SEC on April 8, 2010.
|
|
(8)
|
Incorporated by reference from Annual Report on Form 10-K for the year ended September 30, 2004.
|
|
(9)
|
Incorporated by reference from Current Report on Form 8-K dated October 31, 2006 and filed with the SEC on November 3, 2006.
|
|
(10)
|
Incorporated by reference from Current Report on Form 8-K dated August 6, 2007 and filed with the SEC on August 8, 2007.
|
|
(11)
|
Incorporated by reference from Annual Report on Form 10-K for the year ended September 30, 2006.
|
|
(12)
|
Incorporated by reference from Registration Statement on Form S-8, File No. 333-146195.
|
|
(13)
|
Incorporated by reference from Annual Report on Form 10-K for the year ended September 30, 2007.
|
|
(14)
|
Incorporated by reference from Current Report on Form 8-K dated April 29, 2009 and filed with the SEC on May 4, 2009.
|
|
(15)
|
Incorporated by reference from Quarterly Report on Form 10-Q for the quarter ended June 30, 2012.
|
|
(16)
|
Incorporated by reference from Registration Statement on Form S-8 File No. 333-179794.
|
|
(17)
|
Incorporated by reference from Registration Statement on Form S-8 File No. 333-186765.
|
|
(18)
|
Incorporated by reference from Registration Statement on Form S-8 File No. 333-191773.
|
|
(19)
|
Incorporated by reference from Current Report on Form 8-K dated April 22, 2015 and filed with the SEC on April 22, 2015.
|
|
(20)
|
Incorporated by reference from Registration Statement on Form S-8 File No. 333-194620.
|
|
(21)
|
Incorporated by reference from Registration Statement on Form S-8 File No. 333-196405.
|
|
(22)
|
Incorporated by reference from Quarterly Report on Form 10-Q for the quarter ended March 31, 2015.
|
|
(23)
|
Incorporated by reference from Current Report on Form 8-K dated December 13, 2015 and filed with the SEC on January 6, 2016.
|
|
(24)
|
Incorporated by reference from Current Report on Form 8-K dated September 26, 2016 and filed with the SEC on September 30, 2016.
|
78
TABLE OF CONTENTS
Item 1. BusinessItem 1A. Risk FactorsItem 1B. Unresolved Staff CommentsItem 2. PropertiesItem 3. Legal ProceedingsItem 4. Mine Safety DisclosuresPart IIItem 5. Market For Registrant S Common Equity, Related Stockholder Matters and Issuer Purchases Of Equity SecuritiesItem 6. Selected Financial DataItem 7. Management S Discussion and Analysis Of Financial Condition and Results Of OperationsItem 7A. Quantitative and Qualitative Disclosure About Market RiskItem 8. Financial Statements and Supplementary DataItem 9. Changes in and Disagreements with Accountants on Accounting and Financial DisclosureItem 9A. Controls and ProceduresItem 9B. Other InformationPart IIIItem 10. Directors, Executive Officers and Corporate GovernanceItem 11. Executive CompensationItem 12. Security Ownership Of Certain Beneficial Owners and Management and Related Shareholder MattersItem 13. Certain Relationships and Related Transactions, and Director IndependenceItem 14. Principal Accountant Fees and ServicesPart IVItem 15. Exhibits and Financial Statement Schedules