UNITED STATES
SECURITIES AND EXCHANGE COMMISSION
Washington, D.C. 20549
Form
10-K
(Mark One)
|
|
ANNUAL REPORT PURSUANT TO SECTION 13 OR 15(d) OF THE SECURITIES EXCHANGE ACT OF 1934
|
For the fiscal year ended
December 31, 2019
OR
|
|
TRANSITION REPORT PURSUANT TO SECTION 13 OR 15(d) OF THE SECURITIES EXCHANGE ACT OF 1934
|
For the transition period from to
Commission file number:
001-37779
(Exact name of registrant as specified in its charter)
|
|
|
|
|
(State or other jurisdiction of
incorporation or organization)
|
|
(I.R.S. Employer
Identification No.)
|
(Address of principal executive offices, including zip code)
(
800
)
445-6758
(Registrant’s telephone number, including area code)
Not Applicable
(Former name, former address and former fiscal year, if changed since last report)
Securities registered pursuant to Section 12(b) of the Act:
|
Title of each class:
|
Trading Symbol:
|
Name of each exchange on which registered:
|
|
|
|
|
|
|
|
|
Securities registered pursuant to Section 12(g) of the Act: None
Indicate by check mark if the registrant is a well-known seasoned issuer, as defined in Rule 405 of the Securities Act. Yes
☐
No
☒
Indicate by check mark if the registrant is not required to file reports pursuant to Section 13 or Section 15(d) of the Act. Yes
☐
No
☒
Indicate by check mark whether the registrant (1) has filed all reports required to be filed by Section 13 or 15(d) of the Securities Exchange Act of 1934 during the preceding 12 months (or for such shorter period that the registrant was required to file such reports), and (2) has been subject to such filing requirements for the past 90 days.
Yes
☒
No
☐
Indicate by check mark whether the registrant has submitted electronically every Interactive Data File required to be submitted pursuant to Rule 405 of Regulation S-T (
§
232.405 of this chapter) during the preceding 12 months (or for such shorter period that the registrant was required to submit such files).
Yes
☒
No
☐
Indicate by check mark whether the registrant is a large accelerated filer, an accelerated filer, a non-accelerated filer, a smaller reporting company, or an emerging growth company. See the definitions of "large accelerated filer," "accelerated filer," "smaller reporting company," and “emerging growth company” in Rule 12b-2 of the Exchange Act.
|
|
☒
|
Accelerated Filer
|
☐
|
|
Non-accelerated Filer
|
☐
|
Smaller reporting company
|
|
|
Emerging growth company
|
|
||
If an emerging growth company, indicate by check mark if the registrant has elected not to use the extended transition period for complying with any new or revised financial accounting standards provided pursuant to Section 13(a) of the Exchange Act.
☐
Indicate by check mark whether the registrant is a shell company (as defined in Rule 12b-2 of the Act). Yes
☐
No
☒
The aggregate market value of the ordinary shares held by non-affiliates of the registrant as of the last business day of the registrant's most recently completed second quarter, computed by reference to the closing price reported on the New York Stock Exchange as of June 30, 2019 was approximately
$
1,214
million.
As of
February 24, 2020
, there were
221,807,598
ordinary shares, $.0001 par value, issued and outstanding.
FGL HOLDINGS
ANNUAL REPORT ON FORM 10-K
TABLE OF CONTENTS
|
Page
|
||
|
PART I
|
||
|
PART II
|
||
|
PART III
|
||
|
PART IV
|
||
3
Unless the context otherwise indicates or requires, the terms “we”, “our”, “us”, and the “Company”, as used in this Form 10-K filing, refer for periods prior to the completion of the Business Combination to Fidelity & Guaranty Life ("FGL") and its subsidiaries and, for periods upon or after completion of the Business Combination, to FGL Holdings and its subsidiaries, including FGL and its subsidiaries. The term “FGLH” refers to FGL’s direct subsidiary Fidelity & Guaranty Life Holdings, Inc. FGL Holdings primarily operates through FGL and FGLH’s subsidiary, Fidelity & Guaranty Life Insurance Company (“FGL Insurance”), which is domiciled in Iowa.
Dollar amounts in the accompanying sections are presented in millions, unless otherwise noted.
Special Note Regarding Forward-Looking Statements
This annual report includes forward-looking statements. Some of the forward-looking statements can be identified by the use of terms such as “believes”, “expects”, “may”, “will”, “should”, “could”, “seeks”, “intends”, “plans”, “estimates”, “anticipates” or other comparable terms. However, not all forward-looking statements contain these identifying words. These forward-looking statements include all matters that are not related to present facts or current conditions or that are not historical facts. They appear in a number of places throughout this report and include statements regarding our intentions, beliefs or current expectations concerning, among other things, our consolidated results of operations, financial condition, liquidity, prospects and growth strategies and the industries in which we operate and including, without limitation, statements relating to our future performance.
Forward-looking statements are subject to known and unknown risks and uncertainties, many of which are beyond our control. We caution you that forward-looking statements are not guarantees of future performance and that our actual consolidated results of operations, financial condition and liquidity, and industry development may differ materially from those made in or suggested by the forward-looking statements contained in this report. In addition, even if our consolidated results of operations, financial condition and liquidity, and industry development are consistent with the forward-looking statements contained in this report, those results or developments may not be indicative of results or developments in subsequent periods. A number of important factors could cause actual results to differ materially from those contained in or implied by the forward-looking statements, including the risks and uncertainties discussed in “Risk Factors” (Part I, Item 1A of this Form 10-K). Factors that could cause actual results to differ from those reflected in forward-looking statements relating to our operations and business include:
|
•
|
general economic conditions and other factors, including prevailing interest and unemployment rate levels and stock and credit market performance;
|
|
•
|
concentration in certain states for distribution of our products;
|
|
•
|
the impact of interest rate fluctuations;
|
|
•
|
equity market volatility;
|
|
•
|
credit market volatility or disruption;
|
|
•
|
the impact of credit risk of our counterparties;
|
|
•
|
volatility or decline in the market price of our ordinary shares could impair our ability to raise necessary capital;
|
|
•
|
changes in our assumptions and estimates regarding the amortization of our deferred acquisition costs, deferred sales inducements and value of business acquired balances;
|
|
•
|
changes in our methodologies, estimates and assumptions regarding our valuation of investments and the determinations of the amounts of allowances and impairments;
|
|
•
|
changes in our valuation allowance against our deferred tax assets, and restrictions on our ability to fully utilize such assets;
|
|
•
|
the accuracy of management’s reserving assumptions;
|
|
•
|
regulatory changes or actions, including those relating to regulation of financial services affecting (among other things) underwriting of insurance products and regulation of the sale, underwriting and pricing of products, and minimum capitalization and statutory reserve requirements for insurance companies, or the
|
4
ability of our insurance subsidiaries to make cash distributions to us (including dividends or payments on surplus notes those subsidiaries issue to us);
|
•
|
the ability to maintain or obtain approval of Iowa Insurance Division ("IID") and other regulatory authorities as required for our operations and those of our insurance subsidiaries
|
|
•
|
the impact of the "fiduciary" rule proposals on the Company, its products, distribution and business model;
|
|
•
|
changes in the federal income tax laws and regulations which may affect the relative income tax advantages of our products;
|
|
•
|
changes in tax laws which affect us and/or our shareholders;
|
|
•
|
potential adverse tax consequences if we are treated as a passive foreign investment company;
|
|
•
|
the impact on our business of new accounting rules or changes to existing accounting rules;
|
|
•
|
our potential need and our insurance subsidiaries’ potential need for additional capital to maintain our and their financial strength and credit ratings and meet other requirements and obligations;
|
|
•
|
our ability to successfully acquire new companies or businesses and integrate such acquisitions into our existing framework;
|
|
•
|
the impact of potential litigation, including class action litigation;
|
|
•
|
our ability to protect our intellectual property;
|
|
•
|
our ability to maintain effective internal controls over financial reporting;
|
|
•
|
the impact of restrictions in the Company's debt instruments on its ability to operate its business, finance its capital needs or pursue or expand its business strategies;
|
|
•
|
our ability and our insurance subsidiaries’ ability to maintain or improve financial strength ratings;
|
|
•
|
the performance of third parties including third party administrators, independent distributors, underwriters, actuarial consultants and other outsourcing relationships;
|
|
•
|
the loss of key personnel;
|
|
•
|
interruption or other operational failures in telecommunication, information technology and other operational systems, or a failure to maintain the security, integrity, confidentiality or privacy of sensitive data residing on such systems;
|
|
•
|
our exposure to unidentified or unanticipated risk not adequately addressed by our risk management policies and procedures;
|
|
•
|
the impact on our business of natural and man-made catastrophes, pandemics, and malicious and terrorist acts;
|
|
•
|
our ability to compete in a highly competitive industry;
|
|
•
|
our ability to attract and retain national marketing organizations and independent agents;
|
|
•
|
our subsidiaries’ ability to pay dividends to us; and
|
|
•
|
the other factors discussed in “Risk Factors”, of (Part I, Item 1A of this Form 10-K).
|
You should read this report completely and with the understanding that actual future results may be materially different from expectations. All forward-looking statements made in this report are qualified by these cautionary statements. These forward-looking statements are made only as of the date of this report and we do not undertake any obligation, other than as may be required by law, to update or revise any forward-looking statements to reflect future events or developments. Comparisons of results for current and any prior periods are not intended to express any future trends, or indications of future performance, unless expressed as such, and should only be viewed as historical data.
5
Overview
FGL Holdings
FGL Holdings (the “Company” or “F&G”), formerly known as CF Corporation (“CF Corp”), a Cayman Islands exempted company, was originally incorporated in the Cayman Islands on February 26, 2016 as a Special Purpose Acquisition Company (“SPAC”). CF Corp formed for the purpose of effecting a merger, capital stock exchange, asset acquisition, stock purchase, reorganization, or other similar business combination with one or more target businesses. Prior to November 30, 2017, CF Corp. was a shell company with no operations. On November 30, 2017, CF Corp consummated the acquisition of Fidelity & Guaranty Life ("FGL"), a Delaware corporation, and its subsidiaries, pursuant to the Agreement and Plan of Merger, dated as of May 24, 2017 (the “FGL Merger Agreement”). The transactions contemplated by the FGL Merger Agreement are referred to herein as the “Business Combination.” In connection with the closing of the Business Combination, CF Corp. changed its name to “FGL Holdings” and the Company’s ordinary shares and warrants began trading on the NYSE under the symbols “FG” and “FG WS,” respectively.
F&G Reinsurance Ltd (“F&G Re”), an exempted company incorporated in Bermuda with limited liability has a license to carry on business as an Unrestricted Class "C" reinsurer to provide a platform for non-affiliated offshore reinsurance business. Front Street Re Cayman Ltd, an exempted company incorporated in the Cayman Islands with limited liability (“FSRC”) has a license to carry on business as an Unrestricted Class “B” Insurer that permits FSRC to conduct offshore direct and reinsurance business. F&G Re and FSRC (together herein referred to as the “F&G Reinsurance Companies”), are indirect wholly owned subsidiaries of FGL Holdings and parties to reinsurance transactions.
Our Company
For more than 60 years, our Company has helped middle-income Americans prepare for retirement and for their loved ones' financial security. We partner with leading independent marketing organizations ("IMO") and their agents to serve the needs of the middle-income market and develop competitive products to align with their evolving needs. As of
December 31, 2019
, we have approximately
650,000
policyholders who count on the safety and protection features our fixed annuity and life insurance products provide.
Through the efforts of our
352
employees, most of whom are located in Des Moines, IA and Baltimore, MD, and through a network of approximately
200
IMOs that represent approximately
37,000
independent agents, we offer various types of fixed annuities and life insurance products. Our fixed annuities serve as a retirement and savings tool for which our customers rely on principal protection and predictable income streams. In addition, our indexed universal life ("IUL") insurance products provide our customers with a complementary product that allows them to build on their savings and provide a payment to their designated beneficiaries upon the policyholder’s death. Our most popular products are fixed indexed annuities (“FIAs”) that tie contractual returns to specific market indices, such as the Standard & Poor's Ratings Services ("S&P") 500 Index. Our customers value our FIAs, which provide a portion of the gains of an underlying market index, while also providing principal protection. We believe this mix of “some upside but limited downside” fills the need for middle-income Americans who must save for retirement but who want to limit the risk of decline in their savings.
For the year ended
December 31, 2019
, FIAs generated approximately
65%
of our total sales. The remaining
35%
of sales were primarily generated from fixed rate annuity sales and flow reinsurance during the year. We invest the annuity premiums primarily in fixed income securities, options and futures that hedge our risk and replicate the market index returns to our policyholders. We invest predominantly in call options on the S&P 500 Index. The majority of our products contain provisions that permit us to adjust annually the formula by which we provide index credits in response to changing market conditions. In addition, our annuity contracts generally either cannot be surrendered or include surrender charges that discourage early redemptions.
Pending Transaction with Fidelity National Financial
On February 7, 2020, we announced that we had entered into an Agreement and Plan of Merger (the “FNF Merger Agreement”), by and among the Company, Fidelity National Financial, Inc., a Delaware corporation (“FNF”), F I Corp., a Cayman Islands exempted company and wholly owned subsidiary of FNF (“Merger Sub I”), and F II Corp., a Cayman Islands exempted company and wholly owned subsidiary of FNF (“Merger Sub II” and, together with Merger Sub I, “Merger Subs”). Upon the terms and subject to the conditions set forth in the FNF Merger Agreement, at the time of the closing of the transactions contemplated by the FNF Merger Agreement: (i) Merger Sub I will be merged with and into the Company (the “First Merger”) with the Company surviving the First Merger (the “Surviving Company”) and becoming a wholly owned subsidiary of FNF as a result of the First Merger in accordance with the Companies Law (2018 Revision) of the Cayman Islands (the “CICL”); and (ii) immediately following the First Merger, the Surviving Company will be
6
merged with and into Merger Sub II (the “Second Merger” and, together with the First Merger, the “Mergers”) with Merger Sub II surviving the Second Merger and remaining a wholly owned subsidiary of FNF as a result of the Second Merger in accordance with the CICL. Following the close of the Mergers, the Company will operate as a subsidiary of FNF.
A special committee of our board of directors, comprised solely of independent directors not affiliated with FNF, unanimously determined that it is fair and in the best interests of the Company, and declared it advisable, to enter into the FNF Merger Agreement. Subject to the terms and conditions of the FNF Merger Agreement, each of our ordinary shares issued and outstanding immediately prior to the effective time of the First Merger (other than those owned by FNF, the merger subsidiaries or any other subsidiary of FNF) will be canceled and converted automatically into the right to receive (i) $12.50 in cash or (ii) 0.2558 shares of FNF common stock, at the election of the holder of such ordinary share, subject to the allocation and proration provisions of the FNF Merger Agreement. In addition, subject to the terms and conditions of the Series A Preferred Share Purchase Agreement, FNF will purchase our outstanding Series A Preferred Shares.
The Mergers are expected to occur in the second or third quarter of 2020, subject to shareholder and regulatory approvals and the satisfaction of customary closing conditions. Certain conditions include, among other things, (i) the adoption of the FNF Merger Agreement, the Mergers and the other transactions contemplated thereby by the affirmative vote of the holders of ordinary shares of the Company representing at least two-thirds of the ordinary shares of the Company present and voting in person or by proxy as a single class at the shareholders’ meeting in accordance with the CICL and the Amended and Restated Memorandum and Articles of Association of the Company (as amended and restated), (ii) the expiration or termination of the waiting period under the Hart-Scott-Rodino Antitrust Improvements Act of 1976, as amended, and obtaining any requisite approvals, consents or authorizations from governmental authorities, including insurance regulators in the jurisdictions of domicile of our and FNF’s insurance subsidiaries, (iii) the absence of any injunction or applicable law or order preventing or prohibiting consummation of the Mergers, (iv) a declaration by the Securities and Exchange Commission of the effectiveness of the Form S-4 to be filed with the SEC by FNF relating to the registration under the Securities Act of the shares of FNF’s common stock to be issued in the Mergers, (v) approval for listing by the New York Stock Exchange of the shares of FNF common stock to be issued in the Mergers and (vi) the receipt of an opinion of counsel or an accounting firm to the effect that, for U.S. federal income tax purposes, the Mergers, together with the purchase of the Series A Preferred Shares pursuant to the Series A Preferred Share Purchase Agreement, will constitute a reorganization within the meaning of Section 368(a) of the Code. The FNF Merger Agreement does not contain any financing condition or contingency.
Upon termination of the FNF Merger Agreement, under specified circumstances, we may be required to pay a termination fee to FNF in an aggregate amount of either
$40
or
$67
. The termination fee shall be an amount equal to
$40
if such termination fee becomes payable in the event that (i) the Company terminates the FNF Merger Agreement to enter into any Takeover Proposal Documentation regarding a Superior Proposal with an Excluded Party (as such terms are defined in the FNF Merger Agreement) or (ii) FNF terminates the FNF Merger Agreement where the event giving rise to the right of termination is based on the submission of a Takeover Proposal by an Excluded Party (as such terms are defined in the FNF Merger Agreement). The termination fee shall be an amount equal to
$67
in all other circumstances that require us to pay a termination fee.
We have filed a Current Report on Form 8-K with the SEC on February 7, 2020 with respect to the proposed Mergers. In addition, please see “Risks relating to the Pending Transaction with Fidelity National Financial, Inc. (FNF)” under “Item 1A. Risk Factors” below for further discussion of the Mergers and risks and uncertainties related thereto.
Our Strategy
At F&G we seek to deliver profitable growth for our shareholders through a number of strategic pillars.
|
•
|
Serve the growing retirement market needs by collaborating with our existing and new distribution partners to deliver peace of mind solutions.
We believe the demand for retirement and principal protection products will continue to grow. As both a direct writer and a reinsurer, we offer valuable products and capabilities tailored to serve this growing demographic need.
|
|
•
|
Strengthen our foundation.
With our process rigor, we pay close attention to market and profitability trends and fine-tune our actions throughout the year. By partnering with Blackstone Insurance Solutions, we are able to source the breadth and volume of assets that enable us to offer competitive products while we optimize our risk-adjusted returns.
|
|
•
|
Enhance the F&G experience.
With products that provide downside protection coupled with opportunity for market upside, we are focused on giving our policyholders peace of mind. We partner with agents who help their clients select the best products for their individual needs. Our customer care professionals provide personalized support, and we offer self-serve options through our digital platforms.
|
|
•
|
Focus on bottom-line, profit-oriented objectives.
In both our organic and inorganic growth plans as a writer and as a reinsurer, we focus on markets and products where we can achieve targeted profit margins.
|
7
The F&G Reinsurance Companies were formed with the intention of building a flexible and diversified portfolio of life and annuity reinsurance treaties. F&G Re has entered into three reinsurance agreements as of
December 31, 2019
and is actively evaluating additional opportunities.
Competition
Our ability to compete is dependent upon many factors which include, among other things, our ability to develop competitive and profitable products, our ability to maintain stable relationships with our contracted IMOs, our ability to maintain low unit costs, our ability to source and secure investments with attractive returns and risk profiles and our ability to maintain adequate financial strength ratings from rating agencies. Principal competitive factors for FIAs are initial crediting rates, reputation for renewal crediting action, product features, brand recognition, customer service, cost, distribution capabilities and financial strength ratings of the provider. Competition may affect, among other matters, both business growth and the pricing of our products and services. Principal competitive factors for IULs are based on service and distribution channel relationships, price, brand recognition, financial strength ratings of our insurance subsidiaries and financial stability.
The reinsurance industry is highly competitive. The F&G Reinsurance Companies compete with major reinsurers, most of which are well established and have significant operating histories, strong financial strength ratings and long-standing client relationships.
For detailed information about revenues, operating income and total assets of our Company, see Part II, Item 7. “Management’s Discussion and Analysis of Financial Condition and Results of Operations” and the consolidated financial statements beginning on page F-1 in this report.
Products
Our experience designing and developing annuities and life insurance products will allow us to continue to introduce innovative products and solutions designed to meet customers’ changing needs. We work hand-in-hand with our distributors to devise the most suitable product solutions for the ever-changing market. We believe that, on a practical basis, we have a unique understanding of the safety, accumulation, protection, and income needs of middle-income Americans.
Annuity Products
Through our insurance subsidiaries, we issue a broad portfolio of deferred annuities (fixed indexed and fixed rate annuities) and immediate annuities. A deferred annuity is a type of contract that accumulates value on a tax deferred basis and typically begins making specified periodic or lump sum payments a certain number of years after the contract has been issued. An immediate annuity is a type of contract that begins making specified payments within one annuity period (e.g., one month or one year) and typically pays principal and earnings in equal payments over some period of time.
Deferred Annuities
FIAs
.
Our FIAs allow contract owners the possibility of earning returns linked to the performance of a specified market index, predominantly the S&P 500 Index, while providing principal protection. The contracts include a provision for a minimum guaranteed surrender value calculated in accordance with applicable law. A market index tracks the performance of a specific group of stocks representing a particular segment of the market, or in some cases an entire market. For example, the S&P 500 Composite Stock Price Index is an index of 500 stocks intended to be representative of a broad segment of the market. All FIA products allow policyholders to allocate funds once a year among several different crediting strategies, including one or more index-based strategies and a traditional fixed rate strategy. High surrender charges apply for early withdrawal, typically for seven to fourteen years after purchase. For the year ended
December 31, 2019
, we sold
$2,820
of FIAs.
The contractholder account value of a FIA contract is equal to the sum of deposits paid, premium bonuses, if any, (described below), and index credits based on the change in the relevant market index (subject to a cap, spread and/or a participation rate) less any fees for riders and any withdrawals taken to-date. Caps (a maximum rate that may be credited) generally range from
2%
to
5%
when measured annually and
1%
to
3%
when measured monthly, spreads (a credited rate determined by deducting a specific rate from the index return) generally range from
1%
to
6%
when measured annually, and participation rates (a credited rate equal to a percentage of index return) generally range from
100%
to
140%
of the performance of the applicable market index. The cap, spread and participation rate can typically be reset annually and in some instances every two to five years. Certain riders provide a variety of benefits, such as the ability to increase their cap, lifetime income or additional liquidity for a set fee. As this fee is fixed, the contractholder may lose principal if the index credits received do not exceed the amount of such fee.
8
Approximately
72%
of the FIA sales for the year ended
December 31, 2019
involved “premium bonuses” or vesting bonuses. Premium bonuses increase the initial annuity deposit by a specified rate of
2%
to
5%
. The vesting bonuses, which range from
1%
to
10%
, increase the initial annuity deposit liability but are subject to adjustment for unvested amounts in the event of surrender by the policyholder prior to the end of the vesting period. We made compensating adjustments in the commission paid to the agent or the surrender charges on the policy to offset the premium bonus.
Approximately
66%
of our FIA contracts were issued with a guaranteed minimum withdrawal benefit (“GMWB”) rider for the year ended
December 31, 2019
. With this rider, a contract owner can elect to receive guaranteed payments for life from the FIA contract without requiring the owner to annuitize the FIA contract value. The amount of the income benefit available is determined by the growth in the policy's benefit base value as defined in the FIA contract rider. Typically this accumulates for 10 years based on a guaranteed rate of
3%
to
8%
. Guaranteed withdrawal payments may be stopped and restarted at the election of the contract owner. Some of the FIA contract riders that we offer include an additional death benefit or an increase in benefit amounts under chronic health conditions. Rider fees range from
0%
to
1%
.
As of
December 31, 2019
, the distribution of the FIA account values by cap rate and by strategy was as follows:
|
Cap rate
|
||||||||||||||||
|
Strategy
|
0% to 3%
|
3% to 5%
|
> 5%
|
Total
|
||||||||||||
|
1 year gain trigger
|
$
|
612
|
|
$
|
170
|
|
$
|
35
|
|
$
|
817
|
|
||||
|
1-2 year monthly average
|
890
|
|
532
|
|
168
|
|
1,590
|
|
||||||||
|
1-3 year monthly point-to-point
|
5,316
|
|
24
|
|
—
|
|
5,340
|
|
||||||||
|
1-3 year annual point-to-point
|
2,174
|
|
1,475
|
|
704
|
|
4,353
|
|
||||||||
|
3 year step forward
|
—
|
|
23
|
|
110
|
|
133
|
|
||||||||
|
Total
|
$
|
8,992
|
|
|
$
|
2,224
|
|
|
$
|
1,017
|
|
|
$
|
12,233
|
|
|
As of
December 31, 2019
, the distribution of the FIA account values by cap rate and by index was as follows:
|
Cap rate
|
||||||||||||||||
|
Index
|
0% to 3%
|
3% to 5%
|
> 5%
|
Total
|
||||||||||||
|
S&P 500
|
$
|
8,964
|
|
$
|
2,007
|
|
$
|
987
|
|
$
|
11,958
|
|
||||
|
Dow Jones
|
—
|
|
117
|
|
—
|
|
117
|
|
||||||||
|
Nasdaq
|
28
|
|
100
|
|
30
|
|
158
|
|
||||||||
|
Total
|
$
|
8,992
|
|
$
|
2,224
|
|
$
|
1,017
|
|
$
|
12,233
|
|
||||
Fixed Rate Annuities
.
Fixed rate annuities include annual reset and multi-year rate guaranteed policies. Fixed rate annual reset annuities issued by us have an annual interest rate (the “crediting rate”) that is guaranteed for the first policy year. After the first policy year, we have the discretionary ability to change the crediting rate once annually to any rate at or above a guaranteed minimum rate. Multi-year guaranteed annuities ("MYGA") are similar to fixed rate annual reset annuities except that the initial crediting rate is guaranteed for a specified number of years before it may be changed at our discretion. For the year ended
December 31, 2019
we sold
$776
of fixed rate MYGA. As of
December 31, 2019
, crediting rates on outstanding (i) single-year guaranteed annuities generally ranged from
2%
to
6%
and (ii) MYGA ranged from
1%
to
6%
. The average crediting rate on all outstanding fixed rate annuities at
December 31, 2019
was
3%
.
As of
December 31, 2019
, the distribution of the fixed rate annuity account values by crediting rate was as follows:
|
Crediting rate
|
1% to 2%
|
2% to 3%
|
3% to 4%
|
4% to 5%
|
5% to 6%
|
Total
|
||||||||||||||||||
|
Account value (gross)
|
$
|
31
|
|
$
|
260
|
|
$
|
2,866
|
|
$
|
423
|
|
$
|
4
|
|
$
|
3,584
|
|
||||||
9
As of
December 31, 2019
, the MYGA expiring guaranty account values, net of reinsurance, by year were as follows:
|
Year of expiry:
|
Account Value
|
|||
|
2020
|
131
|
|
||
|
2021
|
646
|
|
||
|
2022
|
764
|
|
||
|
2023
|
719
|
|
||
|
2024
|
566
|
|
||
|
Thereafter
|
467
|
|
||
|
Total
|
$
|
3,293
|
|
|
Withdrawal Options for Deferred Annuities
.
After the first year following the issuance of a deferred annuity policy, holders of deferred annuities are typically permitted penalty-free withdrawals up to
10%
of the prior year’s value, subject to certain limitations. Withdrawals in excess of allowable penalty-free amounts are assessed a surrender charge if such withdrawals are made during the penalty period of the deferred annuity policy. The penalty period typically ranges from seven to fourteen years for FIAs and three to ten years for fixed rate annuities. This surrender charge initially ranges from
0%
to
15%
of the contract value for FIAs and
0%
to
10%
of the contract value for fixed rate annuities and generally decreases by approximately one to two percentage points per year during the penalty period. The average surrender charge is
8%
for our FIAs and
7%
for our fixed rate annuities as of
December 31, 2019
.
The following table summarizes our deferred annuity account values and surrender charge protection as of
December 31, 2019
:
|
Fixed Rate and Fixed Index Annuities Account Value
|
Percent of Total
|
Weighted Average Surrender Charge
|
||||||||
|
SURRENDER CHARGE EXPIRATION BY YEAR
|
||||||||||
|
Out of surrender charge
|
$
|
2,564
|
|
13
|
%
|
—
|
%
|
|||
|
2020
|
588
|
|
3
|
%
|
3
|
%
|
||||
|
2021 - 2023
|
3,771
|
|
18
|
%
|
6
|
%
|
||||
|
2024 - 2025
|
3,214
|
|
16
|
%
|
8
|
%
|
||||
|
2026 - 2027
|
3,608
|
|
18
|
%
|
9
|
%
|
||||
|
Therafter
|
6,657
|
|
32
|
%
|
11
|
%
|
||||
|
Total
|
$
|
20,402
|
|
100
|
%
|
8
|
%
|
|||
Subsequent to the penalty period, the policyholder may elect to take the proceeds of the surrender either in a single payment or in a series of payments over the life of the policyholder or for a fixed number of years (or a combination of these payment options). In addition to the foregoing withdrawal rights, policyholders may also elect to have additional withdrawal benefits by purchasing a GMWB.
Immediate Annuities
We also sell single premium immediate annuities (or “SPIAs”), which provide a series of periodic payments for a fixed period of time or for the life of the policyholder, according to the policyholder’s choice at the time of issue. The amounts, frequency and length of time of the payments are fixed at the outset of the annuity contract. SPIAs are often purchased by persons at or near retirement age who desire a steady stream of payments over a future period of years.
10
The following table presents the deposits (also known as “sales”) on annuity policies issued for the period presented as well as reserves required by U.S. generally accepted accounting principles (“U.S. GAAP”) as of the periods presented:
|
Year ended
December 31, 2019
|
Year ended
December 31, 2018
|
Period from December 1 to December 31, 2017
|
|||||||||||||||||||||
|
Deposits on
Annuity Policies |
U.S.
GAAP Reserves |
Deposits on
Annuity Policies |
U.S.
GAAP Reserves |
Deposits on
Annuity Policies |
U.S.
GAAP Reserves |
||||||||||||||||||
|
Products (net of reinsurance)
|
|||||||||||||||||||||||
|
Fixed indexed annuities
|
$
|
2,800
|
|
$
|
18,058
|
|
$
|
2,253
|
|
$
|
16,076
|
|
$
|
178
|
|
$
|
15,178
|
|
|||||
|
Fixed rate annuities
|
539
|
|
4,477
|
|
61
|
|
4,462
|
|
45
|
|
4,022
|
|
|||||||||||
|
Single premium immediate annuities
|
14
|
|
3,291
|
|
24
|
|
3,217
|
|
—
|
|
3,144
|
|
|||||||||||
|
Total
|
$
|
3,353
|
|
$
|
25,826
|
|
$
|
2,338
|
|
$
|
23,755
|
|
$
|
223
|
|
$
|
22,344
|
|
|||||
|
Period from October 1 to November 30, 2017
|
Period from October 1 to December 31, 2016 (Unaudited)
|
Year ended
September 30, 2017
|
|||||||||||||||||||||
|
|
|||||||||||||||||||||||
|
|
Predecessor
|
Predecessor
|
Predecessor
|
||||||||||||||||||||
|
Deposits on
Annuity Policies |
U.S.
GAAP Reserves |
Deposits on
Annuity Policies |
U.S.
GAAP Reserves |
Deposits on
Annuity Policies |
U.S.
GAAP Reserves |
||||||||||||||||||
|
Products (net of reinsurance)
|
|
|
|||||||||||||||||||||
|
Fixed indexed annuities
|
$
|
288
|
|
$
|
14,464
|
|
$
|
556
|
|
$
|
13,317
|
|
$
|
1,892
|
|
$
|
14,237
|
|
|||||
|
Fixed rate annuities
|
116
|
|
3,993
|
|
99
|
|
3,627
|
|
556
|
|
3,910
|
|
|||||||||||
|
Single premium immediate annuities
|
1
|
|
2,809
|
|
2
|
|
2,866
|
|
15
|
|
2,845
|
|
|||||||||||
|
Total
|
$
|
405
|
|
$
|
21,266
|
|
$
|
657
|
|
$
|
19,810
|
|
$
|
2,463
|
|
$
|
20,992
|
|
|||||
Life Insurance
We currently offer IUL insurance policies and have previously sold universal life, term and whole life insurance products. Holders of universal life insurance policies earn returns on their policies which are credited to the policyholder’s cash value account. The insurer periodically deducts its expenses and the cost of life insurance protection from the cash value account. The balance of the cash value account is credited interest at a fixed rate or returns based on the performance of a market index, or both, at the option of the policyholder, using a method similar to that described above for FIAs.
Almost all of the life insurance policies in force, except for the return of premium benefits on term life insurance products and universal life contracts issued after March 1, 2010, are subject to an arrangement with Wilton Reassurance Company (“Wilton Re”). See section titled “Reinsurance-Wilton Re Transaction” in Item 1. Business.
As of
December 31, 2019
, the distribution of the retained IUL account values by cap rate and by strategy was as follows:
|
Cap rate
|
||||||||||||||||||||||||
|
Strategy
|
2.5%-5.0%
|
5.0-7.5%
|
7.5%-10.0%
|
10.0-12.5%
|
12.5+
|
Total
|
||||||||||||||||||
|
1 year annual point-to-point, Gold Index
|
$
|
—
|
|
$
|
—
|
|
$
|
—
|
|
$
|
—
|
|
$
|
44
|
|
$
|
44
|
|
||||||
|
1 year monthly point-to-point, S&P Index
|
33
|
|
—
|
|
—
|
|
—
|
|
—
|
|
33
|
|
||||||||||||
|
1 year annual point-to-point with 100% par rate, S&P Index
|
14
|
|
2
|
|
57
|
|
135
|
|
168
|
|
376
|
|
||||||||||||
|
1 year annual point-to-point with 140% par rate, S&P Index
|
3
|
|
4
|
|
23
|
|
—
|
|
—
|
|
30
|
|
||||||||||||
|
Total
|
$
|
50
|
|
|
$
|
6
|
|
|
$
|
80
|
|
|
$
|
135
|
|
|
$
|
212
|
|
|
$
|
483
|
|
|
11
Distribution
The sale of our products typically occurs as part of a four-party, three stage sales process between Fidelity & Guaranty Life Insurance Company (“FGL Insurance”), an IMO, the agent and the customer. FGL Insurance designs, manufactures, issues, and services the product. The IMOs will typically sign contracts with multiple insurance carriers to provide their agents with a broad and competitive product portfolio. The IMO provides training and discusses product options with agents in preparation for meetings with clients. The IMO staff also provide assistance to the agent during the selling and application process. The agent may get customer leads from the IMOs. The agent conducts a fact find and presents suitable product choices to the customers. We monitor the business issued by each distribution partner for pricing metrics, mortality, persistency, as well as market conduct and suitability.
We offer our products through a network of approximately
200
IMOs, representing approximately
37,000
agents. We identify "Power Partners" as those we believe have the ability to generate significant production for the Company. We currently have
32
Power Partners, comprised of
21
annuity IMOs and
11
life insurance IMOs. During the year ended
December 31, 2019
these Power Partners accounted for approximately
97%
of our annual sales volume. We believe that our relationships with these IMOs are strong. The average tenure of the top ten Power Partners is approximately
16
years.
Our Power Partners play an important role in the development of our products by providing feedback integral to the development process and by securing “shelf space” for new products. Over the last ten years, the majority of our best-selling products have been developed with our Power Partners. We intend to continue to involve Power Partners in the development of our products in the future.
The top five states for the distribution of FGL Insurance’s products in the year ended
December 31, 2019
were
California
,
Texas
,
Florida
,
New Jersey
and
Arizona
, which together accounted for
41%
of FGL Insurance’s premiums.
F&G Re provides a platform for non-affiliated offshore reinsurance business. The company’s main product is reinsuring annuity blocks of business. As of
December 31, 2019
it had entered into three reinsurance treaties and is actively evaluating additional opportunities.
Investments
We embrace a long-term conservative investment philosophy, investing nearly all the insurance premiums we receive in a wide range of fixed income interest-bearing securities.
FGL Insurance, and certain subsidiaries of the Company, entered into investment management agreements (“IMAs”) with Blackstone ISG-I Advisors LLC (“BISGA”), a wholly-owned subsidiary of Blackstone on December 1, 2017. On December 31, 2019, to be effective as of October 31, 2019, FGL Insurance and certain subsidiaries of the Company entered into amended and restated IMAs (the “Restated IMAs”) with BISGA, pursuant to which BISGA was appointed as investment manager of the company’s general accounts (the “F&G Accounts”). Pursuant to the terms of the IMAs, BISGA may delegate any or all of its discretionary investment, advisory and other rights, powers, functions and obligations under the IMAs to one or more sub-managers, including its affiliates. Pursuant to the Restated IMAs, BISGA delegated certain investment services to its affiliates, Blackstone Real Estate Special Situations Advisors L.L.C. (“BRESSA”) and GSO Capital Advisors II LLC (“GSO Capital Advisors”), pursuant to sub-management agreements executed between BISGA and each of BRESSA and GSO Capital Advisors. See "Note 14. Related Party Transactions" to our audited
consolidated financial statements
for further details. Additionally, three other subsidiaries of the Company entered into Investment Management Agreements with BISGA on substantially the same terms as the FGL Insurance IMA (the “Additional Investment Management Agreements” and collectively with the FGL Insurance IMA, the “Investment Management Agreements”).
BISGA manages the bulk of the investment portfolio. For certain asset classes, we utilize experienced third party companies. As of
December 31, 2019
,
88%
of our
$28
billion investment portfolio was managed by Blackstone, with the remaining
12%
balance managed by other third parties. BISGA appointed MVB Management, an entity owned by affiliates of the Company’s Co-Executive Chairmen, as Sub-Adviser of the FGL Account pursuant to a sub-advisory agreement (the “Sub-Advisory Agreement”). Under the Sub-Advisory Agreement, MVB Management will provide investment advisory services, portfolio review, and consultation with regard to the FGL Account (and the accounts of the other Company subsidiaries party to Investment Management Agreements) and the asset classes and markets contemplated by the investment guidelines specified in the agreement, including such recommendations as the Investment Manager shall reasonably request. Payment or reimbursement of the subadvisory fee to MVB Management is solely the obligation of BISGA and is not an obligation of FGL Insurance or the Company. Subject to certain conditions, the Sub-Advisory Agreement cannot be terminated by BISGA unless FGL Insurance terminates the FGL Insurance IMA.
The Company and certain subsidiaries entered into amended and restated Investment Management Agreements with BISGA on December 31, 2019, to be effective as of October 1, 2019, pursuant to which BISGA was appointed as investment manager of the company’s general accounts (the “F&G Accounts”). The IMAs amend and restate investment management agreements entered into between November 2017 and March 2018 (the “Restated IMAs”). Pursuant to the terms of the
12
IMAs, BISGA may delegate any or all of its discretionary investment, advisory and other rights, powers, functions and obligations under the IMAs to one or more sub-managers, including its affiliates. BISGA delegated certain investment services to its affiliates, Blackstone Real Estate Special Situations Advisors L.L.C. (“BRESSA”) and GSO Capital Advisors II LLC (“GSO Capital Advisors”), pursuant to sub-management agreements executed between BISGA and each of BRESSA and GSO Capital Advisors.
Our investment strategy is designed to (i) achieve strong absolute returns, (ii) provide consistent yield and investment income, and (iii) preserve capital. We base all of our decisions on fundamental, bottom-up research, coupled with a top-down view that respects the cyclicality of certain asset classes. The types of assets in which we may invest are influenced by various state laws, which prescribe qualified investment assets applicable to insurance companies. Additionally, we define risk tolerance across a wide range of factors, including credit risk, liquidity risk, concentration (issuer and sector) risk, and caps on specific asset classes, which in turn establish conservative risk thresholds.
Our investment portfolio consists of high quality fixed maturities, including publicly issued and privately issued corporate bonds, municipal and other government bonds, asset-backed securities ("ABS"), residential mortgage-backed securities ("RMBS"), commercial mortgage-backed securities ("CMBS"), commercial mortgage loans ("CMLs"), residential mortgage loans, limited partnership investments, and fund investments. We also maintain holdings in floating rate, and less rate-sensitive investments, including senior tranches of collateralized loan obligations (“CLOs”), non-agency RMBS, and various types of ABS. It is our expectation that our investment portfolio will broaden in scope and diversity to include other asset classes held by life and annuity insurance writers. We also have a small amount of equity holdings through our funding arrangement with the Federal Home Loan Bank of Atlanta.
Over the last year, we continued to work with BISGA and the other third party asset managers to broaden the portfolio’s exposure to include United States dollar ("USD") denominated emerging market bonds, highly rated preferred stocks and hybrids, and structured securities including ABS. As a result of these portfolio repositionings, we currently maintain:
|
•
|
a well matched asset/liability profile (asset duration, including cash and cash equivalents, of
6.7
years vs. liability duration of
6.8
years); and
|
|
•
|
a large exposure to less rate-sensitive assets (
22%
of invested assets).
|
For further discussion of portfolio activity, see “Item 7. Management’s Discussion and Analysis of Financial Condition and Results of Operations-Investment Portfolio”.
Derivatives
Our FIA contracts permit the holder to elect to receive a return based on an interest rate or the performance of a market index, most typically the S&P 500 Index. We purchase derivatives consisting predominantly of call options and, to a lesser degree, futures contracts on the equity indices underlying the applicable policy. These derivatives are used to fund the index credits due to policyholders under the FIA contracts based upon policyholders' contract elections. The majority of all such call options are one-year options purchased to match the funding requirements underlying the FIA contracts. On the anniversary dates of the FIA contracts, the market index used to compute the annual index credit under the FIA contract is reset. At such time, we purchase new one-, two-, three-, or five-year call options to fund the next index credit. We manage the cost of these purchases through the terms of our FIA contracts, which permit us to change caps or participation rates, subject to certain guaranteed minimums on each contracts anniversary date. The change in the fair value of the call options and futures contracts is generally designed to offset the equity market related change in the fair value of the FIA contract’s related reserve liability. The call options and futures contracts are marked to fair value with the change in fair value included as a component of "Net investment gains (losses)". The change in fair value of the call options and futures contracts includes the gains and losses recognized at the expiration of the instruments term or upon early termination and the changes in fair value of open positions.
Outsourcing
We outsource the following functions to third-party service providers:
|
•
|
new business administration (date entry and policy issue only);
|
|
•
|
service of existing policies;
|
|
•
|
underwriting administration of life insurance applications;
|
|
•
|
life reinsurance administration;
|
|
•
|
call centers;
|
|
•
|
information technology development and maintenance;
|
13
|
•
|
valuation of reinsurance liabilities held at fair value;
|
|
•
|
investment accounting and custody; and
|
|
•
|
co-located data centers and hosting of financial systems.
|
We closely manage our outsourcing partners and integrate their services into our operations. We believe that outsourcing such functions allows us to focus capital and our employees on our core business operations and perform differentiating functions, such as investment, actuarial, product development and risk management functions. In addition, we believe an outsourcing model provides predictable pricing, service levels and volume capabilities and allows us to benefit from technological developments that enhance our customer self-service and sales processes. We believe that we have a good relationship with our principal outsource service providers.
We outsource our existing policy administration for annuity and life products to Transaction Applications Group, Inc and Concentrix Insurance Services. Under this arrangement, Transaction Applications Group, Inc. administers most of our new business processing and manages most of our call center and processing requirements. Our current agreement expires on December 31, 2021. Additionally, in August 2017, we partnered with Concentrix Insurance Services to administer a portion of our annuity new business processing and the servicing (administration and call center activities) of these issued annuity contracts.
We have partnered with CRL-Plus (“CRL-Plus”) to implement our life insurance underwriting policies. Under the terms of the arrangement, CRL-Plus has assigned the Company a dedicated team of underwriters with appropriate professional designations and experience. Underwriting guidelines for each product are established by our Chief Underwriter in collaboration with our actuarial department. Our Chief Underwriter and actuarial department work closely with our reinsurance counterparties to establish or change guidelines. Adherence to underwriting guidelines is managed at a case level through monthly underwriting audits conducted by our Chief Underwriter as well as the CRL-Plus lead underwriter. Periodically, underwriting audits are conducted by our reinsurers and an independent third party underwriting firm. Our current agreement with CRL-Plus is reviewed annually.
Ratings
Our access to funding and our related cost of borrowing, the attractiveness of certain of our products to customers and requirements for derivatives collateral posting are affected by our credit ratings and insurance financial strength ratings, which are periodically reviewed by the rating agencies. Financial strength ratings and credit ratings are important factors affecting public confidence in an insurer and its competitive position in marketing products.
As of the date of this filing, A.M. Best Company ("A.M. Best"), Fitch Ratings ("Fitch"), Moody’s Investors Service ("Moody's") and S&P Global Ratings ("S&P") had issued credit ratings, financial strength ratings and/or outlook statements regarding us, as listed below. Credit ratings represent the opinions of rating agencies regarding an entity’s ability to repay its indebtedness. Financial strength ratings represent the opinions of rating agencies regarding the ability of an insurance company to meet its financial obligations under an insurance policy and generally involve quantitative and qualitative evaluations by rating agencies of a company’s financial condition and operating performance. Generally, rating agencies base their financial strength ratings upon information furnished to them by the insurer and upon their own investigations, studies and assumptions. Financial strength ratings are based upon factors of concern to policyholders, agents and intermediaries and are not directed toward the protection of investors. Credit and financial strength ratings are not recommendations to buy, sell or hold securities and they may be revised or revoked at any time at the sole discretion of the rating organization.
In addition to the financial strength ratings, rating agencies use an “outlook statement” to indicate a medium or long term trend which, if continued, may lead to a rating change. A positive outlook indicates a rating may be raised and a negative outlook indicates a rating may be lowered. A stable outlook is assigned when ratings are not likely to be changed. A developing outlook is assigned when a rating may be raised, lowered, or affirmed. Outlooks should not be confused with expected stability of the issuer’s financial or economic performance. A rating may have a "stable" outlook to indicate that the rating is not expected to change, but a "stable" outlook does not preclude a rating agency from changing a rating at any time without notice.
14
The rating organizations may take various actions, positive or negative. Such actions are beyond the Company's control and the Company cannot predict what these actions may be and the timing thereof.
|
A.M. Best
|
Fitch (a)
|
Moody's (b)
|
S&P (c)
|
|||||
|
Holding Company Ratings
|
||||||||
|
FGL Holdings
|
||||||||
|
Issuer Credit / Default Rating
|
Not Rated
|
BBB-
|
Ba3
|
BB+
|
||||
|
Outlook
|
Positive
|
Positive
|
Positive
|
|||||
|
CF Bermuda Holdings Limited
|
||||||||
|
Issuer Credit / Default Rating
|
Not Rated
|
BBB-
|
Ba2
|
BB+
|
||||
|
Outlook
|
Positive
|
Positive
|
Positive
|
|||||
|
Fidelity & Guaranty Life Holdings, Inc.
|
||||||||
|
Issuer Credit / Default Rating
|
bbb-
|
BBB-
|
Not Rated
|
BB+
|
||||
|
Outlook
|
Stable
|
Positive
|
|
Positive
|
||||
|
Senior Unsecured Notes
|
bbb-
|
BB+
|
Ba2
|
BB+
|
||||
|
Outlook
|
Stable
|
|
Positive
|
|||||
|
Operating Subsidiary Ratings
|
||||||||
|
Fidelity & Guaranty Life Insurance Company
|
||||||||
|
Financial Strength Rating
|
A-
|
BBB+
|
Baa2
|
BBB+
|
||||
|
Outlook
|
Stable
|
Positive
|
Positive
|
Positive
|
||||
|
Fidelity & Guaranty Life Insurance Company of New York
|
||||||||
|
Financial Strength Rating
|
A-
|
BBB+
|
Not Rated
|
BBB+
|
||||
|
Outlook
|
Stable
|
Positive
|
|
Positive
|
||||
|
F&G Reinsurance Ltd
|
||||||||
|
Financial Strength Rating
|
A-
|
BBB-
|
Not Rated
|
Not Rated
|
||||
|
Outlook
|
Stable
|
Positive
|
|
|
||||
|
F&G Life Re Ltd
|
||||||||
|
Financial Strength Rating
|
Not Rated
|
BBB-
|
Baa2
|
BBB+
|
||||
|
Outlook
|
Positive
|
Positive
|
Positive
|
|||||
|
*Reflects current ratings and outlooks as of date of filing
|
||||||||
(a) Outlook reflects Rating Watch Positive
(b) Outlook reflects Review for Upgrade
(c) Outlook reflects CreditWatch Positive
A.M. Best, Fitch, Moody’s and S&P review their ratings of insurance companies from time to time. There can be no assurance that any particular rating will continue for any given period of time or that it will not be changed or withdrawn entirely if, in their judgment, circumstances so warrant. While the degree to which ratings adjustments will affect sales and persistency is unknown, we believe if our ratings were to be negatively adjusted for any reason, we could experience a material decline in the sales of our products and the persistency of our existing business. See “Item 1A. Risk Factors”.
Potential Impact of a Ratings Downgrade
The Company is required to maintain minimum ratings as a matter of routine practice as part of its over-the-counter derivatives agreements on ISDA forms. Under some ISDA agreements, the Company has agreed to maintain certain financial strength ratings. Please refer to "Note 5. Derivative Financial Instruments" to our audited
consolidated financial statements
for disclosure around the Company's requirement to maintain minimum ratings.
If the insurance subsidiaries held net short positions against a counterparty, and the subsidiaries’ financial strength ratings were below the levels required in the ISDA agreement with the counterparty, the counterparty would demand immediate further collateralization which could negatively impact overall liquidity. Based on the fair value of our derivatives as of
December 31, 2019
and
December 31, 2018
, we hold
no
net short positions against a counterparty; therefore, there is currently
no
potential exposure for us to post collateral.
A downgrade of the financial strength rating of one of our principal insurance subsidiaries could affect our competitive position in the insurance industry and make it more difficult for us to market our products, as potential customers may select companies with higher financial strength ratings. A downgrade of the financial strength rating could also impact the Company's borrowing costs.
15
Risk Management
Risk management is a critical part of our business. We seek to assess risk to our business through a formalized process involving (i) identifying short-term and long-term strategic and operational objectives, (ii) development of risk appetite statements that establish what the company is willing to accept in terms of risks to achieving its goals and objectives, (iii) identifying the levers that control the risk appetite of the company, (iv) establishing the overall limits of risk acceptable for a given risk driver, (v) establishing operational risk limits that are aligned with the tolerances, (vi) assigning risk limit quantification and mitigation responsibilities to individual team members within functional groups, (vii) analyzing the potential qualitative and quantitative impact of individual risks, including but not limited to stress and scenario testing covering over 8 economic and insurance related risks, (viii) mitigating risks by appropriate actions and (ix) identifying, documenting and communicating key business risks in a timely fashion.
The responsibility for monitoring, evaluating and responding to risk is assigned first to our management and employees, second to those occupying specialist functions, such as legal compliance and risk teams, and third to those occupying supervisory functions, such as internal audit and the board of directors.
In compliance with the Risk Management and Own Risk and Solvency Assessment Model Act (ORSA), FGL Insurance submitted an ORSA report to the state regulators in November 2019 to provide risk management transparency and insight in the financial strength and long-term sustainability of the Companies.
Reinsurance
We both cede reinsurance and assume reinsurance from other insurance companies. We use reinsurance to diversify risks and earnings, to manage loss exposures, to enhance our capital position, and to manage new business volume. The effects of certain reinsurance agreements are not accounted for as reinsurance as they do not transfer the risks of the reinsured policies.
In instances where we are the ceding company, we pay a premium to a reinsurer in exchange for the reinsurer assuming a portion of our liabilities under the policies we issued and collect expense allowances in return for our administration of the ceded policies. Use of reinsurance does not discharge our liability as the ceding company because we remain directly liable to our policyholders and are required to pay the full amount of our policy obligations in the event that our reinsurers fail to satisfy their obligations. We collect reimbursement from our reinsurers when we pay claims on policies that are reinsured. In instances where we assume reinsurance from another insurance company, we accept, in exchange for a reinsurance premium, a portion of the liabilities of the other insurance company under the policies that the ceding company has issued to its policyholders.
We monitor the credit risk related to the ability of our reinsurers to honor their obligations under various agreements. To minimize the risk of credit loss on such contracts, we generally diversify our exposures among many reinsurers and limit the amount of exposure to each based on financial strength ratings, which are reviewed annually. We are able to further manage risk via funds withheld arrangements.
See “Item 7A. Quantitative and Qualitative Disclosures About Market Risk” for further discussion on credit risk and counterparty risk.
See “Item 1A. Risk Factors” for further discussion of credit risk related to reinsurance agreements. A description of significant ceded reinsurance transactions appears below.
Wilton Re Transaction
Pursuant to the agreed upon terms, Wilton Re has reinsured a 100% quota share of certain FGL Insurance policies that are subject to redundant reserves under Regulation XXX and Guideline AXXX, as well as another block of FGL Insurance’s in-force traditional, universal life and IUL insurance policies. The effects of this agreement are accounted for as reinsurance as it satisfies the risk transfer requirements for GAAP.
Hannover Reinsurance Transaction
Effective January 1, 2017, FGL Insurance entered into a reinsurance agreement with Hannover Life Reassurance Company of America (Bermuda) Ltd. ("Hannover Re"), an unaffiliated reinsurer, to reinsure an inforce block of its FIA and fixed deferred annuity contracts with Guaranteed Minimum Withdraw Benefit (“GMWB”) and Guaranteed Minimum Death Benefit (“GMDB”) guarantees. In accordance with the terms of this agreement, the Company cedes 70% net retention of secondary guarantee payments in excess of account value for GMWB and GMDB guarantees. FGL Insurance and Hannover Re extended this agreement in subsequent years to include new business issued during 2017, 2018, and 2019. The effects of this agreement are not accounted for as reinsurance as it does not satisfy the risk transfer requirements for GAAP.
16
Kubera Reinsurance Transaction
Effective December 31, 2018, FGL Insurance entered into a reinsurance agreement with Kubera Insurance (SAC) Ltd. ("Kubera"), an unaffiliated reinsurer, to cede certain MYGA and deferred annuity statutory reserve on a coinsurance funds withheld basis, net of applicable existing reinsurance. The effects of this agreement are accounted for as reinsurance as it satisfies the risk transfer requirements for GAAP. Effective June 30, 2019, FGL Insurance and Kubera executed a letter of intent to amend this agreement and cede an additional
$185
of MYGA GAAP reserves on a coinsurance funds withheld basis via a quota share percentage of certain issue years. The amended reinsurance agreement was executed on July 31, 2019.
Effective December 31, 2018, FGL Insurance entered into a reinsurance agreement with Kubera to cede approximately
$4 billion
of certain FIA statutory reserve on a coinsurance funds withheld basis, net of applicable existing reinsurance. In accordance with the terms of this agreement, FGL Insurance cedes an 80% and 90% quota share percentage of these annuity plans for issue years 2013 through 2014 and 2007 and prior, respectively. The effects of this agreement are not accounted for as reinsurance as it does not satisfy the risk transfer requirements for GAAP. Effective June 30, 2019, FGL Insurance and Kubera executed a letter of intent to amend this agreement and cede an additional $1 billion of FIA statutory reserves on a coinsurance funds withheld basis via a quota share percentage of certain issue years. The amended reinsurance agreement was executed on July 31, 2019. The effects of the amendment are also not accounted for as reinsurance as it does not satisfy the risk transfer requirements for GAAP.
The CARVM Facility
Life insurance companies operating in the United States must calculate required reserves for life and annuity policies based on statutory principles. These methodologies are governed by “Regulation XXX” (applicable to term life insurance policies), “Guideline AXXX” (applicable to universal life insurance policies with secondary guarantees) and the Commissioners Annuity Reserve Valuation Method, known as “CARVM” (applicable to annuities). Under Regulation XXX, Guideline AXXX and CARVM, insurers are required to establish statutory reserves for such policies that exceed economic reserves. The industry has reduced or eliminated redundancies thereby increasing capital using a variety of techniques including reserve facilities.
Effective October 1, 2012, FGL Insurance entered into a yearly renewable term indemnity reinsurance agreement with Raven Reinsurance Company ("Raven Re"), a wholly-owned subsidiary of FGL Insurance (the “Raven Reinsurance Agreement”), pursuant to which FGL Insurance ceded a
100%
quota share of its CARVM liability for annuity benefits where surrender charges are waived. To collateralize its obligations under the Raven Reinsurance Agreement, Raven Re entered into a reimbursement agreement with Nomura Bank International plc (“NBI”), an affiliate of Nomura Securities International, Inc., and FGL (the “Reimbursement Agreement”) whereby a subsidiary of NBI issued trust notes and NBI issued a
$295
letter of credit that, in each case, were deposited into a reinsurance trust as collateral for Raven Re’s obligations under the Raven Reinsurance Agreement (the “NBI Facility”). Pursuant to the NBI Facility, FGL Insurance takes full credit on its statutory financial statements for the CARVM reserve ceded to Raven Re.
Effective January 1, 2019, the letter of credit facility was amended to reduce the available amount to
$100
and extend the termination date to October 1, 2022, although the facility may terminate earlier, in accordance with the terms of the Reimbursement Agreement. Under the terms of the reimbursement agreement, in the event the letter of credit is drawn upon, Raven Re is required to repay the amounts utilized, and FGLH is obligated to repay the amounts utilized if Raven Re fails to make the required reimbursement. FGLH also is required to make capital contributions to Raven Re in the event that Raven Re’s statutory capital and surplus falls below certain defined levels. As of December 31, 2019 and 2018, Raven Re’s statutory capital and surplus was
$33
and
$20
, respectively, in excess of the minimum level required under the Reimbursement Agreement.
The Front Street Reinsurance Transactions
Effective December 31, 2012, following regulatory approval, FGL Insurance entered into a coinsurance agreement (the “Cayman Reinsurance Agreement”) with FSRC, an indirect wholly-owned subsidiary of the Company. Pursuant to the Cayman Reinsurance Agreement, FSRC reinsured a 10% quota share percentage of certain FGL Insurance annuity liabilities of approximately
$1 billion
and the funds withheld assets are
$1 billion
. As of
December 31, 2019
, ceded reserves are
$756
.
Effective September 17, 2014, FGL Insurance entered into a second reinsurance treaty with FSRC whereby FGL Insurance ceded
30%
of any new business of its MYGA block of business on a funds withheld basis. This treaty was subsequently terminated as to new business effective April 30, 2015, but will remain in effect for policies ceded to FSRC with an effective date between September 17, 2014 and April 30, 2015.
17
F&G Life Re Transaction
F&G Life Re Ltd (“F&G Life Re”) is our licensed reinsurer registered in Bermuda and subject to the Bermuda Insurance Act and the rules and regulations promulgated thereunder. Effective December 1, 2017, F&G Life Re and FGL Insurance entered into a modified coinsurance treaty that effectively ceded
60%
of FGL Insurance's inforce to F&G Life Re and provides the ability to cede new business to F&G Life Re. Effective October 1, 2018, FGL Insurance and F&G Life Re mutually agreed to terminate this reinsurance agreement. Upon termination of the reinsurance agreement, F&G Life Re made a
$1,094
extraordinary dividend to its sole shareholder, CF Bermuda Holdings Limited (“CF Bermuda”) of which
$830
was contributed to FGL Insurance to support the recapture of the insurance liabilities and to allow FGL Insurance to maintain appropriate solvency ratios. The
$1,094
extraordinary dividend included
$750
return of capital which was approved by the Bermuda Monetary Authority (“BMA”).
All intercompany balances have been eliminated in the preparation of the Company’s consolidated financial statements. However, these agreements have a material impact on the regulatory capital position of FGL Insurance and the effective tax rate of the Company. See “Note 13. Reinsurance” to our audited consolidated financial statements.
18
Regulation
Overview
FGL Insurance, Fidelity & Guaranty Life Insurance Company of New York (“FGL NY Insurance”) and Raven Re are subject to comprehensive regulation and supervision in their domiciles, Iowa, New York and Vermont, respectively, and in each state in which they do business. FGL Insurance does business throughout the United States, except for New York. FGL NY Insurance only does business in New York. Raven Re is a special purpose captive reinsurance company that only provides reinsurance to FGL Insurance under the CARVM Treaty. FGL Insurance’s principal insurance regulatory authority is the IID; however, state insurance departments throughout the United States also monitor FGL Insurance’s insurance operations as a licensed insurer. The New York State Department of Financial Services (“NYDFS”) regulates the operations of FGL NY Insurance,. The purpose of these regulations is primarily to protect policyholders and beneficiaries and not general creditors and shareholders of those insurers. Many of the laws and regulations to which FGL Insurance and FGL NY Insurance are subject are regularly re-examined and existing or future laws and regulations may become more restrictive or otherwise adversely affect their operations.
Generally, insurance products underwritten by and rates used by FGL Insurance and FGL NY Insurance must be approved by the insurance regulators in each state in which they are sold. Those products are also substantially affected by federal and state tax laws. For example, changes in tax law could reduce or eliminate the tax-deferred accumulation of earnings on the deposits paid by the holders of annuities and life insurance products, which could make such products less attractive to potential purchasers. A shift away from life insurance and annuity products could reduce FGL Insurance’s and FGL NY Insurance’s income from the sale of such products, as well as the assets upon which FGL Insurance and FGL NY Insurance earn investment income. In addition, insurance products may also be subject to the Employee Retirement Income Security Act of 1974 ("ERISA").
State insurance authorities have broad administrative powers over FGL Insurance and FGL NY Insurance with respect to all aspects of the insurance business including:
|
•
|
licensing to transact business;
|
|
•
|
licensing agents;
|
|
•
|
prescribing which assets and liabilities are to be considered in determining statutory surplus;
|
|
•
|
regulating premium rates for certain insurance products;
|
|
•
|
approving policy forms and certain related materials;
|
|
•
|
determining whether a reasonable basis exists as to the suitability of the annuity purchase recommendations producers make;
|
|
•
|
regulating unfair trade and claims practices;
|
|
•
|
establishing reserve requirements and solvency standards;
|
|
•
|
regulating the amount of dividends that may be paid in any year;
|
|
•
|
regulating the availability of reinsurance or other substitute financing solutions, the terms thereof and the ability of an insurer to take credit on its financial statements for insurance ceded to reinsurers or other substitute financing solutions;
|
|
•
|
|
|
•
|
fixing maximum interest rates on life insurance policy loans and minimum accumulation or surrender values; and
|
|
•
|
regulating the type, amounts, and valuations of investments permitted, transactions with affiliates, and other matters.
|
Financial Regulation
State insurance laws and regulations require FGL Insurance, FGL NY Insurance and Raven Re to file reports, including financial statements, with state insurance departments in each state in which they do business, and their operations and accounts are subject to examination by those departments at any time. FGL Insurance, FGL NY Insurance and Raven Re prepare statutory financial statements in accordance with accounting practices and procedures prescribed or permitted by these departments.
The National Association of Insurance Commissioners ("NAIC") has approved a series of statutory accounting principles and various model regulations that have been adopted, in some cases with certain modifications, by all state insurance departments. These statutory principles are subject to ongoing change and modification. Moreover, compliance with any particular regulator’s interpretation of a legal or accounting issue may not result in compliance with another regulator’s interpretation of the same issue, particularly when compliance is judged in hindsight. Any particular regulator’s
19
interpretation of a legal or accounting issue may change over time to FGL Insurance’s or FGL NY Insurance’s detriment, or changes to the overall legal or market environment, even absent any change of interpretation by a particular regulator, may cause FGL Insurance and FGL NY Insurance to change their views regarding the actions they need to take from a legal risk management perspective, which could necessitate changes to FGL Insurance’s or FGL NY Insurance’s practices that may, in some cases, limit their ability to grow and improve profitability.
State insurance departments conduct periodic examinations of the books and records, financial reporting, policy and rate filings, market conduct and business practices of insurance companies domiciled in their states, generally once every three to five years. Examinations are generally carried out in cooperation with the insurance departments of other states under guidelines promulgated by the NAIC. State insurance departments also have the authority to conduct examinations of non-domiciliary insurers that are licensed in their states.
The IID completed a routine examination of FGL Insurance for the five year period ending 2017, and found no material deficiencies and proposed no adjustments to the financial statements as filed. The NYDFS completed a routine financial examination of FGL NY Insurance for the three year period ended December 31, 2012, and found no material deficiencies and proposed no adjustments to the financial statements as filed. The Vermont Department of Financial Regulation has completed a routine financial examination of Raven Re for the five year period ending December 31, 2017, and found no material deficiencies and proposed no adjustments to the financial statements as filed.
Dividend and Other Distribution Payment Limitations
The Iowa insurance law and the New York insurance law regulate the amount of dividends that may be paid in any year by FGL Insurance and FGL NY Insurance, respectively. Pursuant to an order issued by the Iowa Commissioner on November 28, 2017 in connection with the approval of the Merger Agreement, FGL Insurance shall not pay any dividend or other distribution to shareholders prior to November 28, 2021 without the prior approval of the Iowa Commissioner. Additionally, F&G Life Re will not, for a period of three (3) years from November 28, 2017, declare, set aside or distribute any dividends or distributions other than solely (a) dividends or distributions that would be permitted in accordance with Section 521A.5(3) of the Iowa Code if F&G Life Re were a life insurance company domesticated in Iowa, upon prior written notice to the Iowa Commissioner, but limited only to the amount necessary to service interest payments on outstanding indebtedness and other obligations of CF Bermuda and FGLH, and (b) dividends or distributions upon written notice to, and with the prior written approval of, the Iowa Commissioner.
Each year, FGL NY Insurance may pay a certain limited amount of ordinary dividends or other distributions without being required to obtain the prior consent of or the NYDFS, respectively. However, to pay any dividends or distributions (including the payment of any dividends or distributions for which prior consent is not required), FGL NY Insurance must provide advance written notice to the NYDFS, respectively.
Pursuant to Iowa insurance law, ordinary dividends are payments, together with all other such payments within the preceding twelve months, that do not exceed the greater of (i)
10%
of FGL Insurance’s statutory surplus as regards policyholders as of December 31 of the preceding year; or (ii) the net gain from operations of FGL Insurance (excluding realized capital gains) for the 12-month period ending December 31 of the preceding year.
Dividends in excess of FGL Insurance’s ordinary dividend capacity are referred to as extraordinary and require prior approval of the Iowa Commissioner. In deciding whether to approve a request to pay an extraordinary dividend, Iowa insurance law requires the Iowa Commissioner to consider the effect of the dividend payment on FGL Insurance’s surplus and financial condition generally and whether the payment of the dividend will cause FGL Insurance to fail to meet its required RBC ratio. Dividends may only be paid out of statutory earned surplus.
In 2019, upon approval by the Iowa Commissioner, FGL Insurance declared and paid extraordinary dividends of
$100
to its Parent, FGLH.
In recent calendar years, the Company's insurance subsidiaries have had the dividend capacity and paid ordinary dividends to us as set forth in this table:
|
|
2019
|
2018
|
2017
|
2016
|
2015
|
|||||||||||||||
|
FGL Insurance ordinary dividend capacity
|
$
|
—
|
|
$
|
—
|
|
$
|
132
|
|
$
|
124
|
|
$
|
121
|
|
|||||
|
FGL Insurance ordinary dividends paid
|
—
|
|
—
|
|
25
|
|
—
|
|
—
|
|
||||||||||
|
F&G Life Re dividend capacity
|
1
|
|
1
|
|
201
|
|
—
|
|
—
|
|
||||||||||
|
F&G Re dividend capacity
|
74
|
|
10
|
|
—
|
|
—
|
|
—
|
|
||||||||||
|
FSRC dividend capacity
|
—
|
|
—
|
|
—
|
|
—
|
|
—
|
|
||||||||||
Any payment of dividends by FGL Insurance is subject to the regulatory restrictions described above and the approval of such payment by the board of directors of FGL Insurance, which must consider various factors, including general
20
economic and business conditions, tax considerations, FGL Insurance’s strategic plans, financial results and condition, FGL Insurance’s expansion plans, any contractual, legal or regulatory restrictions on the payment of dividends and its effect on RBC and such other factors the board of directors of FGL Insurance considers relevant. For example, payments of dividends could reduce FGL Insurance’s RBC and financial condition and lead to a reduction in FGL Insurance’s financial strength rating. See section titled "Risks Relating to Our Business-A financial strength ratings downgrade, potential downgrade, or any other negative action by a rating agency could make our products less attractive and increase our cost of capital, and thereby adversely affect our financial condition and results of operations” in Item 1A. Risk Factors.
FGL NY Insurance has historically not paid dividends.
See sections titled "Bermuda Regulatory Framework-Restrictions on Dividends and Distributions" and "Cayman Islands Regulation"
in Item 1. Business for further discussion on Bermuda and Cayman Island, respectively, dividend limitations that impact F&G Re, F&G Life Re and FSRC.
Surplus and Capital
FGL Insurance and FGL NY Insurance are subject to the supervision of the regulators in states where they are licensed to transact business. Regulators have discretionary authority in connection with the continuing licensing of these entities to limit or prohibit sales to policyholders if, in their judgment, the regulators determine that such entities have not maintained the minimum surplus or capital or that the further transaction of business will be hazardous to policyholders.
Risk-Based Capital
In order to enhance the regulation of insurers’ solvency, the NAIC adopted a model law to implement RBC requirements for life, health and property and casualty insurance companies. All states have adopted the NAIC’s model law or a substantially similar law. RBC is used to evaluate the adequacy of capital and surplus maintained by an insurance company in relation to risks associated with: (i) asset risk, (ii) insurance risk, (iii) interest rate risk, and (iv) business risk. In general, RBC is calculated by applying factors to various asset, premium and reserve items, taking into account the risk characteristics of the insurer. Within a given risk category, these factors are higher for those items with greater underlying risk and lower for items with lower underlying risk. The RBC formula is used as an early warning regulatory tool to identify possible inadequately capitalized insurers for purposes of initiating regulatory action, and not as a means to rank insurers generally. Insurers that have less statutory capital than the RBC calculation requires are considered to have inadequate capital and are subject to varying degrees of regulatory action depending upon the level of capital inadequacy. As of the most recent annual statutory financial statements filed with insurance regulators, the RBC ratios for FGL Insurance and FGL NY Insurance each exceeded the minimum RBC requirements.
It is desirable to maintain an RBC ratio in excess of the minimum requirements in order to maintain or improve our financial strength ratings. Our historical RBC ratios for FGL Insurance are presented in the table below. See section titled “Risks Relating to Our Business-A financial strength ratings downgrade, potential downgrade, or any other negative action by a rating agency, could make our product offerings less attractive and increase our cost of capital, and thereby adversely affect our financial condition and results of operations” in Item 1A. Risk Factors.
|
|
RBC Ratio
|
||
|
As of:
|
|||
|
December 31, 2019
|
452
|
%
|
|
|
December 31, 2018
|
447
|
%
|
|
|
December 31, 2017
|
499
|
%
|
|
|
December 31, 2016
|
412
|
%
|
|
|
December 31, 2015
|
401
|
%
|
|
See section titled "Bermuda Regulatory Framework-ECR and Bermuda Solvency Capital Requirements" in Item 1. Business for a discussion on Bermuda regulatory requirements that impact F&G Life Re.
Insurance Regulatory Information System Tests
The NAIC has developed a set of financial relationships or tests known as the Insurance Regulatory Information System ("IRIS") to assist state regulators in monitoring the financial condition of U.S. insurance companies and identifying companies that require special attention or action by insurance regulatory authorities. A ratio falling outside the prescribed “usual range” is not considered a failing result. Rather, unusual values are viewed as part of the regulatory early monitoring system. In many cases, it is not unusual for financially sound companies to have one or more ratios that fall outside the usual range. Insurance companies generally submit data annually to the NAIC, which in turn analyzes the data using
21
prescribed financial data ratios, each with defined “usual ranges”. Generally, regulators will begin to investigate or monitor an insurance company if its ratios fall outside the usual ranges for four or more of the ratios. IRIS consists of a statistical phase and an analytical phase whereby financial examiners review insurers’ annual statements and financial ratios. The statistical phase consists of
12
key financial ratios based on year-end data that are generated from the NAIC database annually; each ratio has a “usual range” of results. As of
December 31, 2019
, FGL Insurance, FGL NY Insurance and Raven Re had two, zero and two ratios outside the usual range, respectively. The IRIS ratios for total affiliated investments to capital and surplus and change in premium for FGL Insurance were outside the usual range. The IRIS ratio for change in premium and adequacy of investment income for Raven Re were outside the usual range.
In all instances in prior years, regulators have been satisfied upon follow-up that no regulatory action was required. FGL Insurance, FGL NY Insurance and Raven Re are not currently subject to regulatory restrictions based on these ratios.
Insurance Reserves
State insurance laws require insurers to analyze the adequacy of reserves. The respective appointed actuaries for FGL Insurance, FGL NY Insurance and Raven Re must each submit an opinion on an annual basis that their respective reserves, when considered in light of the respective assets FGL Insurance, FGL NY Insurance and Raven Re hold with respect to those reserves, make adequate provision for the contractual obligations and related expenses of FGL Insurance, FGL NY Insurance and Raven Re. FGL Insurance, FGL NY Insurance and Raven Re have filed all of the required opinions with the insurance departments in the states in which they do business.
Credit for Reinsurance Regulation
States regulate the extent to which insurers are permitted to take credit on their financial statements for the financial obligations that the insurers cede to reinsurers. Where an insurer cedes obligations to a reinsurer which is neither licensed nor accredited by the state insurance department, the ceding insurer is not permitted to take such financial statement credit unless the unlicensed or unaccredited reinsurer secures the liabilities it will owe under the reinsurance contract. Under the laws regulating credit for reinsurance issued by such unlicensed or unaccredited reinsurers, the permissible means of securing such liabilities are (i) the establishment of a trust account by the reinsurer to hold certain qualifying assets in a qualified U.S. financial institution, such as a member of the Federal Reserve, with the ceding insurer as the exclusive beneficiary of such trust account with the unconditional right to demand, without notice to the reinsurer, that the trustee pay over to it the assets in the trust account equal to the liabilities owed by the reinsurer; (ii) the posting of an unconditional and irrevocable letter of credit by a qualified U.S. financial institution in favor of the ceding company allowing the ceding company to draw upon the letter of credit up to the amount of the unpaid liabilities of the reinsurer and (iii) a “funds withheld” arrangement by which the ceding company withholds transfer to the reinsurer of the assets which support the liabilities to be owed by the reinsurer, with the ceding insurer retaining title to and exclusive control over such assets. In addition, on January 1, 2014, the NAIC Model Credit for Reinsurance Act became effective in Iowa, which adds the concept of “certified reinsurer”, whereby a ceding insurer may take financial statement credit for reinsurance provided by an unaccredited and unlicensed reinsurer which has been certified by the Iowa Commissioner. The Iowa Commissioner certifies reinsurers based on several factors, including their financial strength ratings, and imposes collateral requirements based on such factors. FGL Insurance and FGL NY Insurance are subject to such credit for reinsurance rules in Iowa and New York, respectively, insofar as they enter into any reinsurance contracts with reinsurers which are neither licensed nor accredited in Iowa and New York, respectively.
Insurance Holding Company Regulation
As the parent company of FGL Insurance and the indirect parent company of FGL NY Insurance, we and entities affiliated for purposes of insurance regulation are subject to the insurance holding company laws in Iowa and New York. These laws generally require each insurance company directly or indirectly owned by the holding company to register with the insurance department in the insurance company’s state of domicile and to furnish annually financial and other information about the operations of companies within the holding company system. Generally, all transactions between insurers and affiliates within the holding company system are subject to regulation and must be fair and reasonable, and may require prior notice and approval or non-disapproval by its domiciliary insurance regulator.
Most states, including Iowa and New York, have insurance laws that require regulatory approval of a direct or indirect change of control of an insurer or an insurer’s holding company. Such laws prevent any person from acquiring control, directly or indirectly, of FGL Holdings, CF Bermuda, F&G Re, F&G Life Re, FGLH, FGL Insurance or FGL NY Insurance unless that person has filed a statement with specified information with the insurance regulators and has obtained their prior approval. In addition, investors deemed to have a direct or indirect controlling interest are required to make regulatory filings and respond to regulatory inquiries. Under most states’ statutes, including those of Iowa and New York, acquiring
10%
or more of the voting stock of an insurance company or its parent company is presumptively considered a change of
22
control, although such presumption may be rebutted. Accordingly, any person who acquires 10% or more of our voting securities or that of FGL Holdings, CF Bermuda, F&G Re, F&G Life Re, FGLH, FGL Insurance or FGL NY Insurance without the prior approval of the insurance regulators of Iowa and New York will be in violation of those states’ laws and may be subject to injunctive action requiring the disposition or seizure of those securities by the relevant insurance regulator or prohibiting the voting of those securities and to other actions determined by the relevant insurance regulator.
Insurance Guaranty Association Assessments
Each state has insurance guaranty association laws under which insurers doing business in the state may be assessed by state insurance guaranty associations for certain obligations of insolvent insurance companies to policyholders and claimants. Typically, states assess each member insurer in an amount related to the member insurer’s proportionate share of the business written by all member insurers in the state. Although no prediction can be made as to the amount and timing of any future assessments under these laws, FGL Insurance and FGL NY Insurance have established reserves that they believe are adequate for assessments relating to insurance companies that are currently subject to insolvency proceedings.
Market Conduct Regulation
State insurance laws and regulations include numerous provisions governing the marketplace activities of insurers, including provisions governing the form and content of disclosure to consumers, illustrations, advertising, sales and complaint process practices. State regulatory authorities generally enforce these provisions through periodic market conduct examinations. In addition, FGL Insurance and FGL NY Insurance must file, and in many jurisdictions and for some lines of business obtain regulatory approval for, rates and forms relating to the insurance written in the jurisdictions in which they operate. FGL Insurance is currently the subject of
four
ongoing market conduct examinations in various states. Market conduct examinations can result in monetary fines or remediation and generally require FGL Insurance to devote significant resources to the management of such examinations. FGL Insurance does not believe that any of the current market conduct examinations it is subject to will result in any fines or remediation orders that will be material to its business.
Regulation of Investments
FGL Insurance, FGL NY Insurance, and Raven Re are subject to state laws and regulations that require diversification of their investment portfolios and limit the amount of investments in certain asset categories, such as below investment grade fixed income securities, equity, real estate, other equity investments and derivatives. Failure to comply with these laws and regulations would cause investments exceeding regulatory limitations to be treated as either non-admitted assets for purposes of measuring surplus or as not qualified as an asset held for reserve purposes and, in some instances, would require divestiture or replacement of such non-qualifying investments. We believe that the investment portfolios of FGL Insurance, FGL NY Insurance, and Raven Re as of
December 31, 2019
complied in all material respects with such regulations.
Bermuda Regulation
F&G Life Re and F&G Re are Bermuda exempted companies incorporated under the Companies Act 1981, as amended (the “Companies Act”) and registered as Class C insurers under the Insurance Act 1978, as amended, and its related regulations (the “Insurance Act”). Each of F&G Life Re and F&G Re are regulated by the BMA.
The Insurance Act provides that no person may carry on an insurance business in or from within Bermuda unless registered as an insurer under the Insurance Act by the BMA. In deciding whether to grant registration, the BMA has broad discretion to act as it thinks fit in the public interest. The BMA is required by the Insurance Act to determine whether the applicant is a fit and proper body to be engaged in the insurance business and, in particular, whether it has, or has available to it, adequate knowledge and expertise. The registration of an applicant as an insurer is subject to the insurer complying with the terms of its registration and such other conditions as the BMA may impose at any time. The Insurance Act also grants to the BMA powers to supervise, investigate and intervene in the affairs of insurance companies. Bermuda has been awarded full equivalence for commercial insurers under Europe’s Solvency II regime applicable to insurance companies, which regime came into effect on January 1, 2016.
All insurers are required to implement corporate governance policies and processes as the BMA considers appropriate given the nature, size, complexity and risk profile of the insurer and all insurers, on an annual basis, are required to deliver a declaration to the BMA confirming whether or not they meet the minimum criteria for registration under the Insurance Act.
All insurers are required to comply with the Bermuda Insurance Code of Conduct (the “Bermuda Insurance Code”), which is a codification of best practices for insurers provided by the BMA, and to submit annually to the BMA with its statutory financial return a declaration of compliance confirming it complies with the Bermuda Insurance Code of Conduct.
23
The BMA utilizes a risk-based approach when it comes to licensing and supervising insurance and reinsurance companies. As part of the BMA’s risk-based system, an assessment of the inherent risks within each particular class of insurer or reinsurer is used to determine the limitations and specific requirements that may be imposed. Thereafter the BMA keeps its analysis of relative risk within individual institutions under review on an ongoing basis, including through the scrutiny of audited financial statements, and, as appropriate, meeting with senior management during onsite visits.
Bermuda Regulatory Framework
The Insurance Act imposes on Bermuda insurance companies solvency and liquidity standards, as well as auditing and reporting requirements. Certain significant aspects of the Bermuda insurance regulatory framework are set forth below.
Minimum Solvency Margin
. The Insurance Act provides that the value of the assets of an insurer must exceed the value of its liabilities by an amount greater than its prescribed minimum solvency margin.
The minimum solvency margin that must be maintained by a Class C insurer is the greater of: (i) $500,000; (ii) 1.5% of assets; and (iii) 25% of that insurer’s enhanced capital requirement (“ECR”). An insurer may file an application under the Insurance Act to waive the aforementioned requirements.
ECR and Bermuda Solvency Capital Requirements (“BSCR”)
. Class C insurers are required to maintain available capital and surplus at a level equal to or in excess of the applicable ECR, which is established by reference to either the applicable BSCR model or an approved internal capital model. Furthermore, to enable the BMA to better assess the quality of the insurer’s capital resources, a Class C insurer is required to disclose the makeup of its capital in accordance with its 3-tiered capital system. An insurer may file an application under the Insurance Act to have the aforementioned ECR requirements waived.
Restrictions on Dividends and Distributions
. In addition to the requirements under the Companies Act (as discussed below), the Insurance Act limits the maximum amount of annual dividends and distributions that may be paid or distributed by F&G Life Re and F&G Re without prior regulatory approval.
Each of F&G Life Re and F&G Re is prohibited from declaring or paying a dividend if it fails to meet its minimum solvency margin, or ECR, or if the declaration or payment of such dividend would cause such breach. If F&G Life Re or F&G Re were to fail to meet its minimum solvency margin on the last day of any financial year, it would be prohibited from declaring or paying any dividends during the next financial year without the approval of the BMA.
In addition, as Class C insurers, each of F&G Life Re and F&G Re must: (i) not make any payment from its long-term business fund for any purpose other than a purpose of the insurer’s long-term business, except in so far as such payment can be made out of any surplus certified by the insurer’s approved actuary to be available for distribution otherwise than to policyholders; and (ii) not declare or pay a dividend to any person other than a policyholder unless the value of the assets of its long-term business fund, as certified by the insurer’s approved actuary, exceeds the extent (as to certified) of the liabilities of the insurer’s long-term business. In the event a dividend complies with the above, each of F&G Life Re and F&G Re must ensure the amount of any such dividend does not exceed the aggregate of (i) that excess and (ii) any other funds properly available for the payment of dividend, being funds arising out of business of the insurer other than long-term business.
Furthermore, as Class C insurers, each of F&G Life Re and F&G Re must not declare or pay a dividend to any person other than a policyholder unless the value of the assets of the insurer, as certified by its approved actuary, exceeds its liabilities (as so certified) by the greater of its margin of solvency or its ECR and the amount of any such dividend shall not exceed that excess.
The Companies Act also limits F&G Life Re’s and F&G Re’s ability to pay dividends and make distributions to its shareholders. Each of F&G Life Re and F&G Re is not permitted to declare or pay a dividend, or make a distribution out of its contributed surplus, if it is, or would after the payment be, unable to pay its liabilities as they become due or if the realizable value of its assets would be less than its liabilities.
Reduction of Capital
. Each of F&G Life Re and F&G Re may not reduce its total statutory capital by
15%
or more, as set out in its previous year’s financial statements, unless it has received the prior approval of the BMA. Total statutory capital consists of the insurer’s paid in share capital, its contributed surplus (sometimes called additional paid in capital) and any other fixed capital designated by the BMA as statutory capital.
Cayman Islands Regulation
FSRC is licensed as a class B insurer in the Cayman Islands by the Cayman Islands Monetary Authority (“CIMA”). As a regulated insurance company, FSRC is subject to the supervision of CIMA and CIMA may at any time direct FSRC, in relation to a policy, a line of business or the entire business, to cease or refrain from committing an act or pursing a course of conduct and to perform such acts as in the opinion of CIMA are necessary to remedy or ameliorate the situation.
24
The laws and regulations of the Cayman Islands require that, among other things, FSRC maintain minimum levels of statutory capital, surplus and liquidity, meet solvency standards, submit to periodic examinations of its financial condition and restrict payments of dividends and reductions of capital. Statutes, regulations and policies that FSRC is subject to may also restrict the ability of FSRC to write insurance and reinsurance policies, make certain investments and distribute funds. Any failure to meet the applicable requirements or minimum statutory capital requirements could subject it to further examination or corrective action by CIMA, including restrictions on dividend payments, limitations on our writing of additional business or engaging in finance activities, supervision or liquidation.
Privacy Regulation
Our operations are subject to certain federal and state laws and regulations that require financial institutions and other businesses to protect the security and confidentiality of personal information, including health-related and customer information, and to notify customers and other individuals about their policies and practices relating to their collection and disclosure of health-related and customer information and their practices relating to protecting the security and confidentiality of such information. These laws and regulations require notice to affected individuals, law enforcement agencies, regulators and others if there is a breach of the security of certain personal information, including social security numbers, and require holders of certain personal information to protect the security of the data. Our operations are also subject to certain federal regulations that require financial institutions and creditors to implement effective programs to detect, prevent, and mitigate identity theft. In addition, our ability to make telemarketing calls and to send unsolicited e-mail or fax messages to consumers and customers and our uses of certain personal information, including consumer report information, are regulated. Federal and state governments and regulatory bodies may be expected to consider additional or more detailed regulation regarding these subjects and the privacy and security of personal information.
FIAs
In recent years, the U.S. Securities and Exchange Commission (“SEC”) and state securities regulators have questioned whether FIAs, such as those sold by us, should be treated as securities under the federal and state securities laws rather than as insurance products exempted from such laws. Treatment of these products as securities would require additional registration and licensing of these products and the agents selling them, as well as cause us to seek additional marketing relationships for these products, any of which may impose significant restrictions on our ability to conduct operations as currently operated. Under the Dodd-Frank Act, annuities that meet specific requirements, including requirements relating to certain state suitability rules, are specifically exempted from being treated as securities by the SEC. We expect the types of FIAs that FGL Insurance and FGL NY Insurance sell will meet these requirements and therefore are exempt from being treated as securities by the SEC and state securities regulators. However, there can be no assurance that federal or state securities laws or state insurance laws and regulations will not be amended or interpreted to impose further requirements on FIAs.
The Dodd-Frank Act
The Dodd-Frank Act makes sweeping changes to the regulation of financial services entities, products and markets. Certain provisions of the Dodd-Frank Act are or may become applicable to us, our competitors or those entities with which we do business, including, but not limited to:
|
•
|
the establishment of federal regulatory authority over derivatives;
|
|
•
|
the establishment of consolidated federal regulation and resolution authority over systemically important financial services firms;
|
|
•
|
the establishment of the Federal Insurance Office;
|
|
•
|
changes to the regulation of broker dealers and investment advisors;
|
|
•
|
changes to the regulation of reinsurance;
|
|
•
|
changes to regulations affecting the rights of shareholders;
|
|
•
|
the imposition of additional regulation over credit rating agencies;
|
|
•
|
|
|
•
|
the imposition of concentration limits on financial institutions that restrict the amount of credit that may be extended to a single person or entity; and
|
|
•
|
the clearing of derivative contracts.
|
Numerous provisions of the Dodd-Frank Act require the adoption of implementing rules or regulations, some of which have been implemented. In addition, the Dodd-Frank Act mandates multiple studies, which could result in additional legislation or regulation applicable to the insurance industry, us, our competitors or those entities with which we do business.
25
Legislative or regulatory requirements imposed by or promulgated in connection with the Dodd-Frank Act may impact us in many ways, including, but not limited to:
|
•
|
placing us at a competitive disadvantage relative to our competition or other financial services entities;
|
|
•
|
changing the competitive landscape of the financial services sector or the insurance industry;
|
|
•
|
making it more expensive for us to conduct our business;
|
|
•
|
requiring the reallocation of significant company resources to government affairs;
|
|
•
|
increasing our legal and compliance related activities and the costs associated therewith; or
|
|
•
|
otherwise having a material adverse effect on the overall business climate as well as our financial condition and results of operations.
|
Until various studies are completed and final regulations are promulgated pursuant to the Dodd-Frank Act, the full impact of the Dodd-Frank Act on investments, investment activities and insurance and annuity products of FGL Insurance and FGL NY Insurance remains unclear.
ERISA
We may offer certain insurance and annuity products to employee benefit plans governed by ERISA and/or the Code, including group annuity contracts designated to fund tax-qualified retirement plans. ERISA and the Code provide (among other requirements) standards of conduct for employee benefit plan fiduciaries, including investment managers and investment advisers with respect to the assets of such plans, and holds fiduciaries liable if they fail to satisfy fiduciary standards of conduct.
In March 2018, the United States Fifth Circuit Court of Appeals formally vacated the U. S. Department Labor “Fiduciary Rule” which would have imposed fiduciary duties upon insurance agents selling Individual Retirement Account (IRA) annuities and would have potentially had a material impact on the Company, its products, distribution, and business model. Since then, in June 2019, the U.S. Securities and Exchange Commission (SEC) adopted Regulation Best Interest imposing new sales practice standards on securities brokers, which does not directly impact the Company or its distributors, but gives impetus for the National Association of Insurance Commissioners (NAIC) and individual states to consider best interest proposals for insurance sales. The NAIC adopted an amended Suitability in Annuity Transactions Model Regulation in February 2020 incorporating a requirement that agents act in the best interest of consumers without putting their own financial interests or insurer’s interests ahead of consumer interests. It is expected individual states may soon begin to consider and adopt the NAIC model regulation. FGL NY Insurance already modified certain new business processes in response to the New York Department of Financial Services (NYDFS) best interest rule despite relatively low sales in New York. Management is following a legal challenge to nullify the NYDFS rule and will continue to monitor action by other state or federal agencies to implement sales practice rules affecting insurance agents selling fixed insurance or annuity products.
The SECURE Act
New and recently passed legislation may also impact the industry in which we compete. For example, the Setting Every Community Up for Retirement Enhancement Act of 2019, Pub.L. 116-94 (the “SECURE Act”), which took effect January 1, 2020, creates an opportunity for us and our competitors to pursue sales to employer retirement plan sponsors as well as our traditional customers. In addition, we and our competitors may implement operational changes to adapt to the effect of the new legislation. See section titled “The Setting Every Community Up for Retirement Enhancement Act of 2019, may impact our business and the markets in which we compete” in Item 1A. Risk Factors.
26
Employees
As of
December 31, 2019
, the Company had
352
employees. We believe that we have a good relationship with our employees.
FGL Holdings Available Information
The Company maintains an Internet website at
http://www.fglife.bm
. The Company’s Annual Reports on Form 10-K, Quarterly Reports on Form 10-Q, Current Reports on Form 8-K and amendments to those reports filed or furnished pursuant to Sections 13(a) or 15(d) of the Securities Exchange Act of 1934, as amended (the “Exchange Act”) are made available, free of charge, on or through the “Investor Relations” portion of our Internet website as soon as reasonably practicable after we file them with, or furnish them to, the SEC. The information contained on or connected to our website is not incorporated by reference into this Annual Report on Form 10-K and should not be considered part of this or any other report filed with the SEC. The SEC maintains a website at
http:
//
www.sec.go
v that contains reports, proxy statements, information statements and other information regarding SEC registrants, including the Company.
27
In addition to the other information set forth in this Annual Report on Form 10-K, you should carefully consider the following factors which could have a material adverse effect on our business, financial condition, results of operations or stock price. The risks below are not the only risks we face. Additional risks and uncertainties not currently known to us or that we currently deem to be immaterial may also adversely affect our business, financial condition.
Risks relating to economic conditions, market conditions and investments
Conditions in the economy generally could adversely affect our business, results of operations and financial condition.
Our results of operations are materially affected by conditions in the U.S. economy. Adverse economic conditions may result in a decline in revenues and/or erosion of our profit margins. In addition, in the event of extreme prolonged market events and economic downturns we could incur significant losses. Even in the absence of a market downturn we are exposed to substantial risk of loss due to market volatility.
Factors such as consumer spending, business investment, government spending, the volatility and strength of the capital markets, investor and consumer confidence, foreign currency exchange rates and inflation levels all affect the business and economic environment and, ultimately, the amount and profitability of our business. In an economic downturn characterized by higher unemployment, lower family income, negative investor sentiment and lower consumer spending, the demand for our insurance products could be adversely affected. Under such conditions, we may also experience an elevated incidence of policy lapses, policy loans, withdrawals and surrenders. In addition, our investments could be adversely affected as a result of deteriorating financial and business conditions affecting the issuers of the securities in our investment portfolio.
Concentration in certain states for the distribution of our products may subject us to losses attributable to economic downturns or catastrophes in those states.
Our top five states for the distribution of our products are
California
,
Texas
,
Florida
,
New Jersey
and
Arizona
. Any adverse economic developments or catastrophes in these states could have an adverse impact on our business.
Interest rate fluctuations could adversely affect our business, financial condition, liquidity, results of operations and cash flows.
Interest rate risk is a significant market risk as our business involves issuing interest rate sensitive obligations backed primarily by investments in fixed income assets. For the past several years interest rates have remained at or near historically low levels. The prolonged period of low rates exposes us to the risk of not achieving returns sufficient to meet our earnings targets and/or our contractual obligations. Furthermore, low or declining interest rates may reduce the rate of policyholder surrenders and withdrawals on our life insurance and annuity products, thus increasing the duration of the liabilities, creating asset and liability duration mismatches and increasing the risk of having to reinvest assets at yields below the amounts required to support our obligations. Lower interest rates may also result in decreased sales of certain insurance products, negatively impacting our profitability from new business.
During periods of increasing interest rates we may offer higher crediting rates on interest-sensitive products, such as universal life insurance and fixed annuities, and we may increase crediting rates on in-force products to keep these products competitive. We may be required to accept lower spread income (the difference between the returns we earn on our investments and the amounts we credit to contractholders) thus reducing our profitability, as returns on our portfolio of invested assets may not increase as quickly as current interest rates. Rapidly rising interest rates may also expose us to the risk of financial disintermediation which is an increase in policy surrenders, withdrawals and requests for policy loans as customers seek to achieve higher returns elsewhere requiring us to liquidate assets in an unrealized loss position. If we experience unexpected withdrawal activity, we could exhaust our liquid assets and be forced to liquidate other less liquid assets such as limited partnership investments. We may have difficulty selling these investments in a timely manner and/or be forced to sell them for less than we otherwise would have been able to realize, which could have a material adverse effect on our business, financial condition and results of operations. We have developed and maintain asset liability management (“ALM”) programs and procedures designed to mitigate interest rate risk by matching asset cash flows to expected liability cash flows. In addition, we assess surrender charges on withdrawals in excess of allowable penalty-free amounts that occur during the surrender charge period. There can be no assurance actual withdrawals, contract benefits, and maturities will
28
match our estimates. Despite our efforts to reduce the impact of rising interest rates, we may be required to sell assets to raise the cash necessary to respond to an increase in surrenders, withdrawals and loans, thereby realizing capital losses on the assets sold.
Fixed maturities that are classified as available-for-sale (‘‘AFS’’) are reported within the audited
consolidated financial statements
at fair value. Rising interest rates would cause a decrease in the value of financial assets held at fair value on our consolidated balance sheets. Unrealized gains or losses on AFS securities are recognized as a component of accumulated other comprehensive income (‘‘AOCI’’) and are, therefore, excluded from net income. The accumulated change in fair value of the AFS securities is recognized in net income when the gain or loss is realized upon the sale of the asset or in the event that the decline in fair value is determined to be other than temporary (referred to as an other-than-temporary impairment).
We may experience spread income compression, and a loss of anticipated earnings, if credited interest rates are increased on renewing contracts in an effort to decrease or manage withdrawal activity. Our expectation for future spread income is an important component in amortization of deferred acquisition costs (“DAC”), deferred sales inducements ("DSI"), and value of business acquired (“VOBA”) under U.S. GAAP. Significant reductions in spread income may cause us to accelerate DAC, DSI, and VOBA amortization. In addition, certain statutory capital and reserve requirements are based on formulas or models that consider interest rates and a prolonged period of low interest rates may increase the statutory capital we are required to hold as well as the amount of assets we must maintain to support statutory reserves.
Equity market volatility could negatively impact our business.
The estimated cost of providing GMWB associated with our annuity products incorporates various assumptions about the overall performance of equity markets over certain time periods. Periods of significant and sustained downturns in equity markets or increased equity volatility could result in an increase in the valuation of the future policy benefit or policyholder account balance liabilities associated with such products, resulting in a reduction in our revenues and net income. The rate of amortization of DAC and VOBA relating to FIA products could also increase if equity market performance is worse than assumed and have a materially adverse impact on our results of operations and financial condition.
Our investments are subject to market and credit risks. These risks could be heightened during periods of extreme volatility or disruption in financial and credit markets.
Our invested assets and derivative financial instruments are subject to risks of credit defaults and changes in market values. Periods of extreme volatility or disruption in the financial and credit markets could increase these risks. Changes in interest rates and credit spreads could cause market price and cash flow variability in the fixed income instruments in our investment portfolio. Significant volatility and lack of liquidity in the credit markets could cause issuers of the fixed-income securities we own to default on either principal or interest payments. Additionally, market price valuations may not accurately reflect the underlying expected cash flows of securities within our investment portfolio.
The value of our mortgage-backed securities and our commercial and residential mortgage loan investments depends in part on the financial condition of the borrowers and tenants for the properties underlying those investments, as well as general and specific economic trends affecting the overall default rate. We are also subject to the risk that cash flows resulting from the payments on pools of mortgages that serve as collateral underlying the mortgage-backed securities we own may differ from our expectations in timing or size. Any event reducing the estimated fair value of these securities, other than on a temporary basis, could have an adverse effect on our business, results of operations and financial condition.
We are subject to the credit risk of our counterparties, including companies with whom we have reinsurance agreements or we have purchased call options.
Our insurance subsidiaries cede material amounts of insurance and transfer related assets and certain liabilities to other insurance companies through reinsurance. Accordingly, we bear credit risk with respect to our reinsurers. The failure, insolvency, inability or unwillingness of any reinsurer to pay under the terms of reinsurance agreements with us could materially adversely affect our business, financial condition and results of operations. We regularly monitor the credit rating and performance of our reinsurance parties. Wilton Re represents our largest reinsurance counterparty exposure. See section titled “Reinsurance-Wilton Re Transaction” in Item 1. Business.
We are also exposed to credit loss in the event of non-performance by our counterparties on call options. We seek to reduce the risk associated with such agreements by purchasing such options from large, well-established
29
financial institutions. There can be no assurance we will not suffer losses in the event of counterparty non-performance. See "Note 5. Derivative Financial Instruments" to our audited
consolidated financial statements
for the balances of collateral posted by our counterparties and further discussion of credit risk.
The market price of our ordinary shares may be volatile and could decline impairing our ability to raise capital.
The market price of our ordinary shares may fluctuate significantly in response to various factors, some of which are beyond our control. In addition to the factors discussed in this “Risk Factors” section and elsewhere in this Form 10-K, various factors that could affect our stock price are:
|
•
|
domestic and international political and economic factors unrelated to our performance;
|
|
•
|
actual or anticipated fluctuations in our quarterly operating results;
|
|
•
|
changes in or failure to meet publicly disclosed expectations as to our future financial performance;
|
|
•
|
changes in securities analysts’ estimates of our financial performance, incomplete research and reports by industry analysts, or misleading or unfavorable research about our business;
|
|
•
|
action by institutional shareholders or other large shareholders, including sales of large blocks of ordinary shares;
|
|
•
|
speculation in the press or investment community;
|
|
•
|
changes in investor perception of us and our industry;
|
|
•
|
changes in market valuations or earnings of similar companies;
|
|
•
|
announcements by us or our competitors of significant products, contracts, acquisitions or strategic partnerships;
|
|
•
|
changes in our capital structure, such as future sales of our ordinary shares or other securities;
|
|
•
|
future offerings of debt or equity securities that rank senior to our ordinary shares;
|
|
•
|
changes in applicable laws, rules or regulations, regulatory actions affecting us and other dynamics; and
|
|
•
|
additions or departures of key personnel.
|
Risks relating to the Pending Transaction with Fidelity National Financial, Inc. (FNF)
Completion of the Mergers is subject to the satisfaction of certain conditions, including regulatory and shareholder approvals, and there can be no assurances as to whether and when it may be completed.
On February 7, 2020, we announced that we had entered into the FNF Merger Agreement, by and among the Company, FNF, Merger Sub I and Merger Sub II. Upon the terms and subject to the conditions set forth in the FNF Merger Agreement, at the time of the closing of the transactions contemplated by the FNF Merger Agreement: (i) Merger Sub I will be merged with and into the Company with the Company surviving the First Merger and becoming a wholly owned subsidiary of FNF as a result of the First Merger in accordance with the CICL; and (ii) immediately following the First Merger, the Surviving Company will be merged with and into Merger Sub II with Merger Sub II surviving the Second Merger and remaining a wholly owned subsidiary of FNF as a result of the Second Merger in accordance with the CICL. Please see “Pending Transaction with Fidelity National Financial, Inc.” under “Item 1 Business” above for further discussion of the Mergers.
There can be no assurance that the proposed Mergers will be consummated. Consummation of the Mergers is subject to the satisfaction or waiver of customary conditions on or prior to the Closing Date, including, among other things, (i) the adoption of the FNF Merger Agreement, the Mergers and the other transactions contemplated thereby by the affirmative vote of the holders of ordinary shares of the Company representing at least two-thirds of the ordinary shares of the Company present and voting in person or by proxy as a single class at the shareholders’ meeting in accordance with the CICL and the Amended and Restated Memorandum and Articles of Association of the Company (as amended and restated), (ii) the expiration or termination of the waiting period under the Hart-Scott-Rodino Antitrust Improvements Act of 1976, as amended, and obtaining any requisite approvals, consents or authorizations from governmental authorities, including insurance regulators in the jurisdictions of domicile of our and FNF’s insurance subsidiaries, (iii) the absence of any injunction or applicable law or order preventing or prohibiting consummation of the Mergers, (iv) a declaration by the Securities and Exchange Commission (“SEC”) of the effectiveness of the Form S-4 to be filed with the SEC by FNF relating to the registration under the Securities Act of the shares of FNF’s common stock to be issued in the Mergers, (v) approval for listing by the New York Stock Exchange of the shares of FNF common stock to be issued in the Mergers and (vi) the receipt of an opinion of counsel or an accounting firm to the effect that, for U.S. federal income tax purposes, the Mergers, together with the purchase of the Series A Preferred Shares pursuant to the Series A Preferred Share Purchase Agreement, will constitute a reorganization within the meaning of Section 368(a) of the Code.
30
The FNF Merger Agreement contains certain provisions giving each of FNF and us the right to terminate the FNF Merger Agreement under certain circumstances. Capitalized terms used but not otherwise defined in this paragraph have the meanings set forth in the FNF Merger Agreement, which is included as an exhibit to our Current Report on Form 8-K, filed with the SEC on February 7, 2020. We and FNF may terminate the FNF Merger Agreement by mutual written consent with the approval of the Company Special Committee and the board of directors or special committee of the board of directors of FNF. Subject to certain limitations, we or FNF may terminate the FNF Merger Agreement if (a) any Governmental Authority issues a final and nonappealable Order or a Law is in effect permanently preventing or prohibiting the Mergers, (b) the Company Required Vote has not been obtained at the Company Shareholder Meeting or (c) the Closing does not occur prior to November 7, 2020 (as such date may be extended to February 7, 2021, by FNF or us under certain circumstances in which the requisite regulatory approvals have not been obtained but all of the other closing conditions set forth in the FNF Merger Agreement have been satisfied or waived (other than those conditions that by their nature can only be satisfied at the closing)). Subject to certain limitations, we may terminate the FNF Merger Agreement (i) to enter into any Takeover Proposal Documentation regarding a Superior Proposal if the Company Special Committee determines that failure to take such actions would be inconsistent with the fiduciary duties of the directors under the Laws of the Cayman Islands or (ii) if there has been a breach by FNF, Merger Sub I or Merger Sub II of any representation, warranty, covenant or agreement contained in the FNF Merger Agreement to the extent such breach would result in the failure of a closing condition (subject to a 30-day cure period). Subject to certain limitations, FNF may terminate the FNF Merger Agreement if (A) the Company Special Committee makes an Adverse Recommendation Change, (B) our board of directors recommends to Company Shareholders that they approve or accept a Superior Proposal, (C) the Company enters into or publicly announces its intention to enter into any Takeover Proposal Documentation with respect to a Superior Proposal, (D) we fail to hold the Company Shareholders’ Meeting, (E) we willfully and materially breach any of our obligations concerning the go-shop process or non-solicitation of alternative transactions or (F) we breach any representation, warranty, covenant or agreement in the FNF Merger Agreement (other than if there is a Company Material Adverse Effect) to the extent such breach would result in the failure of a closing condition (subject to a 30-day cure period).
We may experience: the occurrence of an event, change or other circumstance that could give rise to the termination of the FNF Merger Agreement or could otherwise cause the transactions contemplated by the FNF Merger Agreement to fail to close; disruptions to the current plans and operations of the Company and FNF as a result of the announcement of the FNF Merger Agreement; an inability to complete the transactions contemplated by the FNF Merger Agreement, including due to failure to obtain approval of the shareholders of the Company or other conditions to closing in the Merger Agreement; delays in obtaining or the inability to obtain necessary regulatory approvals (including approval from insurance regulators) required to complete the Mergers; the imposition on us by regulators of terms, conditions, requirements, limitations, costs or restrictions that would delay the completion of the Mergers, the imposition of additional material costs on or limitations on the revenues after the Mergers, or limitations on some of the cost savings and other benefits that we expect following completion of the Mergers; changes in applicable laws or regulations; the risk that the transactions contemplated by the FNF Merger Agreement will not qualify for their intended tax treatment; adverse legal and regulatory developments or determinations or adverse changes in, or interpretations of, U.S. or other foreign laws, rules or regulations, including tax laws, rules and regulations, that could delay or prevent completion of the transactions contemplated by the FNF Merger Agreement, cause the terms of such transactions to be modified or change the anticipated tax consequences of such transactions; the possibility that we or FNF may be adversely affected by other economic, business, and/or competitive factors. As a result, we cannot provide any assurance that any such terms, conditions, requirements, limitations, costs, or restrictions will not result in the abandonment of the Mergers.
In addition, we cannot be certain that the other conditions to closing the Mergers will be satisfied (or waived, if applicable) in a timely manner or at all. Failure to, or any delay in, completing the Mergers could cause us to not realize some or all of the benefits that we expect to achieve if the Mergers are successfully completed within the expected timeframe.
Termination of the FNF Merger Agreement could negatively impact our financial condition and the share price of our common stock.
The FNF Merger Agreement provides that in certain specified circumstances, upon termination of the FNF Merger Agreement, we will be required to pay FNF a termination fee of either $40 or $67. Please see “Pending Transaction with Fidelity National Financial, Inc.” under “Item 1 Business” for further discussion of the termination fee. Depending on the circumstances requiring us to make this payment, doing so could materially adversely affect our business, financial condition and results of operations.
31
There can be no assurance that an adequate remedy will be available to us in the event of a breach of the FNF Merger Agreement by FNF or its affiliates, or that we will wholly or partially recover any damages incurred in connection with the proposed Mergers. In particular, a failed transaction may result in negative publicity and a negative impression of our business among our customers or in the investment community or business community generally, all of which could negatively impact our business. Any disruptions to our business resulting from the announcement and pendency of the proposed Mergers, including any adverse changes in our relationships with our customers, IMOs, business partners, and employees, may continue or accelerate in the event of a failed transaction. In addition, if the proposed Mergers are not completed, the share price of our ordinary shares could decline to the extent that the current market price of the our ordinary shares reflects an assumption that the proposed Mergers will be completed. Furthermore, we have incurred, and will continue to incur, significant costs, expenses, and fees for professional services, including legal, accounting, investment banking and advisory fees, and other transaction costs in connection with the proposed Mergers, for which it will have received little or no benefit if the proposed Mergers are not completed. Many of these fees and costs will be payable by us if the proposed Mergers are not completed and may relate to activities that we would not have undertaken other than to complete the proposed Mergers.
The announcement and pendency of the proposed Mergers may adversely affect our business and results of operations.
Uncertainty about the effect of the proposed Mergers on our employees, customers, and other parties with whom we have business relationships may have an adverse effect on our business and results of operations regardless of whether the proposed Mergers are completed. Particularly, these risks to our business include the following: (i) the impairment of our ability to attract, retain, or motivate our employees, or the loss of employees due to office closures; (ii) the diversion of significant management time and attention from ongoing business operations towards the completion of the proposed Mergers and management’s ability to grow and manage growth of our business profitably; (iii) difficulties maintaining relationships with customers, IMOs, and other business partners; (iv) competition; (v) delays or deferments of certain business decisions by our customers, IMOs, and other business partners; (vi) the inability to pursue alternative business opportunities or make appropriate changes to our business because the FNF Merger Agreement requires us to conduct our business in the ordinary course of business and not engage in certain kinds of transactions prior to the completion of the proposed Mergers without the prior written consent of FNF, even if such actions could prove beneficial; (vii) litigation relating to the proposed Mergers and the costs related thereto; and (viii) the incurrence of significant costs, expenses, and fees for professional services and other transaction costs in connection with the proposed Mergers.
Each of the foregoing may be exacerbated by a delay in the completion of the proposed Mergers. Particularly, our management team will have devoted substantial time and resources to matters relating to the Mergers (including integration planning), and would otherwise have devoted their time and resources to other opportunities that may have been beneficial to us as an independent company.
Lawsuits relating to the Mergers could be filed against us and adversely impact our business, financial condition and operating results.
Litigation is common in connection with acquisitions of public companies, regardless of any merits related to the claims. In the event lawsuits are filed against us, the outcome of the lawsuits would be uncertain, and we may not be successful in defending against any such claims. While we will defend against any lawsuits filed against us in connection with the Mergers, the costs of the defense of such actions and other effects of such litigation could have an adverse effect on our business, financial condition and operating results.
Certain of our shareholders have agreed to vote in favor of the Mergers, regardless of how our other shareholders vote.
Concurrently with the execution and delivery of the FNF Merger Agreement, we and FNF entered into Voting Agreements with certain of our shareholders representing, as of February 5, 2020, in the aggregate approximately 32.7% of the issued and outstanding our ordinary shares and all the issued and outstanding Series A Preferred Shares and Series B Preferred Shares. Pursuant to their respective Voting Agreements, these shareholders have agreed (capitalized terms used in the paragraph below but not otherwise defined have the meanings set forth in the applicable Voting Agreement, which are included as exhibits to our Current Report on Form 8-K, filed with the SEC on February 7, 2020):
32
|
•
|
unless the Company Special Committee has made an Adverse Recommendation Change that has not been rescinded or withdrawn, to vote all Subject Shares owned by them in favor of the approval of the FNF Merger Agreement, the Mergers and the other transactions contemplated thereby;
|
|
•
|
against any action or agreement that is recommended against by the Company Special Committee and that would reasonably be expected to impede, frustrate, interfere with, delay, postpone or adversely affect the consummation of the Mergers and the other transactions contemplated by the FNF Merger Agreement; and
|
|
•
|
in the event that the Company Special Committee has made an Adverse Recommendation Change that has not been rescinded or otherwise withdrawn, to vote all Subject Shares owned by them in favor of the approval of the FNF Merger Agreement, the Mergers and the other transactions contemplated thereby in the same proportion as the number of Company Ordinary Shares owned by Unaffiliated Shareholders that are voted in favor of the approval of the FNF Merger Agreement, the Mergers and the other transactions contemplated thereby bears to the total number of Shares owned by Unaffiliated Shareholders present (in person or by proxy) and voting at a meeting of the Company’s shareholders.
|
Accordingly, the Voting Agreements make it more likely that the necessary shareholder approval will be received for the Mergers than would be the case in the absence of the Voting Agreements.
Risks relating to estimates, assumptions and valuations
The pattern of amortizing our DAC, DSI, and VOBA balances relies on assumptions and estimates made by management. Changes in these assumptions and estimates could impact our results of operations and financial condition.
Amortization of our DAC, DSI and VOBA balances depends on the actual and expected profits generated by the respective lines of business that incurred the expenses. Expected profits are dependent on assumptions regarding a number of factors including investment returns, benefit payments, expenses, mortality, and policy lapse. Due to the uncertainty associated with establishing these assumptions, we cannot, with precision, determine the exact pattern of profit emergence. As a result, amortization of these balances will vary from period to period. Any difference in actual experience versus expected results could require us to, among other things, accelerate the amortization of DAC, DSI and VOBA which would reduce profitability for such lines of business in the current period.
For additional information, see “Item 7. Management’s Discussion and Analysis of Financial Condition and Results of Operations-Critical Accounting Policies and Estimates”.
Our valuation of investments and the determinations of the amounts of allowances and impairments taken on our investments may include methodologies, estimates and assumptions which are subject to differing interpretations and, if changed, could materially adversely affect our results of operations or financial condition.
Fixed maturities, equity securities and derivatives represent the majority of total cash and invested assets reported at fair value on our consolidated balance sheets. Fair value is defined as the price that would be received to sell an asset or paid to transfer a liability in an orderly transaction between market participants at the measurement date (an exit price). Fair value estimates are made based on available market information and judgments about the financial instrument at a specific point in time. Expectations that our investments will continue to perform in accordance with their contractual terms are based on evidence gathered through our normal credit surveillance process and on assumptions a market participant would use in determining the current fair value.
The determination of other than temporary impairment ("OTTI") varies by investment type and is based upon our periodic evaluation and assessment of known and inherent risks associated with the respective asset class. Our management considers a wide range of factors about the instrument issuer (e.g., operations of the issuer, future earnings potential) and uses their best judgment in evaluating the cause of the decline in the estimated fair value of the instrument and in assessing the prospects for recovery. Such evaluations and assessments require significant judgment and are revised as conditions change and new information becomes available. Additional impairments may need to be taken in the future, and the ultimate loss may exceed management’s current estimate of impairment amounts.
The value and performance of certain of our assets are dependent upon the performance of collateral underlying these investments. It is possible the collateral will not meet performance expectations leading to adverse changes in the cash flows on our holdings of these types of securities.
33
See "Note 4. Investments" to our audited
consolidated financial statements
for additional information about our investment portfolio.
Change in our evaluation of the recoverability of our deferred tax assets could adversely affect our results of operations and financial condition.
Deferred tax assets and liabilities are attributable to differences between the financial statement carrying amounts of existing assets and liabilities and their respective tax bases using enacted tax rates expected to be in effect during the years in which the basis differences reverse. Deferred tax assets in essence represent future savings of taxes that would otherwise be paid in cash. We are required to evaluate the recoverability of our deferred tax assets each quarter and establish a valuation allowance, if necessary, to reduce our deferred tax assets to an amount that is more-likely-than-not to be realizable. In determining the need for a valuation allowance, we consider many factors, including future reversals of existing taxable temporary differences, future taxable income exclusive of reversing temporary differences and carryforwards, taxable income in prior carryback years and implementation of any feasible and prudent tax planning strategies management would employ to realize the tax benefit. See the “Federal Regulation” section of the risk factor “
Our business is highly regulated and subject to numerous legal restrictions and regulations
” for further discussion on tax impact.
Based on our current assessment of future taxable income, including available tax planning opportunities, we anticipate it is more-likely-than-not that we will generate sufficient taxable income to realize all of our deferred tax assets as to which we do not have a valuation allowance. If future events differ from our current assumptions, the valuation allowance may need to be increased, which could have a material adverse effect on our results of operation and financial condition.
We may face losses if our actual experience differs significantly from our reserving assumptions.
Our profitability depends significantly upon the extent to which our actual experience is consistent with the assumptions used in setting rates for our products and establishing liabilities for future life insurance and annuity policy benefits and claims. However, due to the nature of the underlying risks and the high degree of uncertainty associated with the determination of the liabilities for unpaid policy benefits and claims, we cannot determine precisely the amounts we will ultimately pay to settle these liabilities. As a result, we may experience volatility in our profitability and our reserves from period to period. To the extent that actual experience is less favorable than our underlying assumptions, we could be required to increase our liabilities, which may reduce our profitability and impact our financial strength.
We have minimal experience to date on policyholder behavior for our GMWB products which we began issuing in 2008. If emerging experience deviates from our assumptions on GMWB utilization, it could have a significant effect on our reserve levels and related results of operations. Based on experience on GMWB utilization, which continues to emerge, we updated our GMWB utilization assumption during 2019, with a favorable impact on reserves. We will continue to monitor the GMWB utilization assumption and update our best estimate as applicable.
See “Item 7. Management’s Discussion and Analysis of Financial Condition and Results of Operations-Critical Accounting Policies and Estimates”.
Legal, regulatory and tax risks
Our business is highly regulated and subject to numerous legal restrictions and regulations.
State insurance regulators, the NAIC and federal regulators continually reexamine existing laws and regulations and may impose changes in the future. New interpretations of existing laws and the passage of new legislation may harm our ability to sell new policies, increase our claims exposure on policies we issued previously and adversely affect our profitability and financial strength. We are also subject to the risk that compliance with any particular regulator’s interpretation of a legal or accounting issue may not result in compliance with another regulator’s interpretation of the same issue, particularly when compliance is judged in hindsight. Regulators and other authorities have the power to bring administrative or judicial proceedings against us, which could result in, among other things, suspension or revocation of our licenses, cease and desist orders, fines, civil penalties, criminal penalties or other disciplinary action, which could materially harm our results of operations and financial condition.
We cannot predict what form any future changes in these or other areas of regulation affecting the insurance industry might take or what effect, if any, such proposals might have on us if enacted into law. In addition, because
34
our activities are relatively concentrated in a small number of lines of business, any change in law or regulation affecting one of those lines of business could have a disproportionate impact on us as compared to other more diversified insurance companies. See section titled “Regulation” in Item 1. Business for further discussion of the impact of regulations on our business.
State Regulation
Our business is subject to government regulation in each of the states in which we conduct business and is concerned primarily with the protection of policyholders and other customers rather than shareholders. Such regulation is vested in state agencies having broad administrative and discretionary authority, which may include, among other things, premium rates and increases thereto, underwriting practices, reserve requirements, marketing practices, advertising, privacy, policy forms, reinsurance reserve requirements, acquisitions, mergers and capital adequacy. At any given time, we and our insurance subsidiaries may be the subject of a number of ongoing financial or market conduct, audits or inquiries. From time to time, regulators raise issues during such examinations or audits that could have a material impact on our business.
We have received inquiries from a number of state regulatory authorities regarding our use of the U.S. Social Security Administration’s Death Master File (“Death Master File”) and compliance with state claims practices regulations and unclaimed property or escheatment laws. We have established procedures to periodically compare our in-force life insurance and annuity policies against the Death Master File or similar databases; investigate any identified potential matches to confirm the death of the insured; determine whether benefits are due; and attempt to locate the beneficiaries of any benefits due or, if no beneficiary can be located, escheat the benefit to the state as unclaimed property. We believe we have established sufficient reserves with respect to these matters; however, it is possible that third parties could dispute these amounts and additional payments or additional unreported claims or liabilities could be identified which could be significant and could have a material adverse effect on our results of operations.
Under insurance guaranty fund laws in most states, insurance companies doing business therein can be assessed up to prescribed limits for policyholder losses incurred by insolvent companies. We cannot predict the amount or timing of any such future assessments and therefore the liability we have established for these potential assessments may not be adequate. In addition, regulators may change their interpretation or application of existing laws and regulations such as the case with broadening the scope of carriers that must contribute towards Long Term Care insolvencies.
NAIC
Although our business is subject to regulation in each state in which we conduct business, in many instances the state regulatory models emanate from the NAIC. Some of the NAIC pronouncements, particularly as they affect accounting issues, take effect automatically in the various states without affirmative action by the states. Statutes, regulations and interpretations may be applied with retroactive impact, particularly in areas such as accounting and reserve requirements. The NAIC continues to work to reform state regulation in various areas, including comprehensive reforms relating to cyber security regulations, best interest standards, RBC and life insurance reserves.
On June 10, 2016, the NAIC formally approved principle-based reserving for life insurance products with secondary guarantees, with an effective date of January 1, 2017. Effective October 2019, we began replacing our life insurance product portfolio to comply with the new 2017 CSO mortality requirement as well as the principle-based reserve (PBR) requirement. As of January 1, 2020 all life insurance policies sold by F&G are PBR compliant.
Our insurance subsidiaries are subject to minimum capitalization requirements based on RBC formulas for life insurance companies that establish capital requirements relating to insurance, business, asset, interest rate and certain other risks. Changes to statutory reserve or risk-based capital requirements may increase the amount of reserves or capital our insurance companies are required to hold and may impact our ability to pay dividends. In addition, changes in statutory reserve or risk-based capital requirements may adversely impact our financial strength ratings. Changes currently under consideration include adding an operational risk component, factors for asset credit risk, and group wide capital calculations. See the risk factor entitled “A financial strength ratings downgrade, potential downgrade, or any other negative action by a rating agency, could make our product offerings less attractive and increase our cost of capital, and thereby adversely affect our financial condition and results of operations” for a discussion of risks relating to our financial strength ratings.
35
“Fiduciary” Rule Proposals
Although the DOL fiduciary rule has been vacated in total, similar rules proposed by state officials or the SEC may have an adverse effect on sales of annuity products to IRA owners particularly in the independent agent distribution channel. Compliance with such rules may require additional supervision of agents, cause changes to compensation practices and product offerings, and increase litigation risk, all of which could have adverse impact our business, results of operations and/or financial condition. Management will continue to monitor for potential action by state officials or the SEC to implement rules similar to the vacated DOL rule.
See section titled “Regulation” in Item 1. Business for further discussion on “fiduciary” rule proposals.
Bermuda and Cayman Islands Regulation
Our business is subject to regulation in Bermuda and the Cayman Islands, including the BMA and the CIMA. These regulations may limit or curtail our activities, including activities that might be profitable, and changes to existing regulations may affect our ability to continue to offer our existing products and services, or new products and services we may wish to offer in the future.
In particular, our reinsurance subsidiaries, F&G Life Re and F&G Re, are registered in Bermuda under the Bermuda Insurance Act and subject to the rules and regulations promulgated thereunder. The BMA has sought regulatory equivalency, which enables Bermuda’s commercial insurers to transact business with the EU on a “level playing field.” In connection with its initial efforts to achieve equivalency under the European Union’s Directive (2009/138/EC) (“Solvency II”), the BMA implemented and imposed additional requirements on the companies it regulates. The European Commission (the “EC”) granted Bermuda’s commercial insurers full equivalence in all areas of Solvency II for an indefinite period of time effective March 24, 2016, and applies from January 1, 2016.
See section titled "Regulation" in Item 1. Business for further discussion of regulations in the Bermuda and Cayman Islands.
Changes in federal or state tax laws may affect sales of our products and profitability.
The annuity and life insurance products that we market generally provide the policyholder with certain federal income or state tax advantages. For example, federal income taxation on any increases in non-qualified annuity contract values (i.e., the “inside build-up”) is deferred until it is received by the policyholder. Non-qualified annuities are annuities that are not sold to a qualified retirement plan or in the form of a qualified contract such as an IRA. With other savings investments, such as certificates of deposit and taxable bonds, the increase in value is generally taxed each year as it is realized. Additionally, life insurance death benefits and the inside build-up under life insurance contracts are generally exempt from income tax or tax deferred.
From time to time, various tax law changes have been proposed that could have an adverse effect on our business, including the elimination of all or a portion of the income tax advantages described above for annuities and life insurance policies. Additionally, insurance products, including the tax favorable features of these products, generally must be approved by the insurance regulators in each state in which they are sold. This review could delay the introduction of new products or impact the features that provide for tax advantages and make such products less attractive to potential purchasers. If legislation were enacted to eliminate the tax deferral for annuities or life insurance policies, such a change would have a material adverse effect on our ability to sell non-qualified annuities or life insurance policies.
36
Changes in tax law may adversely affect us and/or our shareholders.
From time to time, the United States, as well as foreign, state and local governments, consider changes to their tax laws that may affect our future results of operations and financial condition. Also, the Organization for Economic Co-operation and Development has published reports and launched a global dialogue among member and non-member countries on measures to limit harmful tax competition. These measures are largely directed at counteracting the effects of tax havens and preferential tax regimes in countries around the world. Changes to tax laws could increase their complexity and the burden and costs of compliance. Additionally, such changes could also result in significant modifications to the existing transfer pricing rules and could potentially have an impact on our taxable profits as such legislation is adopted by participating countries.
We are incorporated in the Cayman Islands and maintain subsidiaries or offices in the United States, Bermuda and the Cayman Islands. Taxing authorities, such as the IRS, actively audit and otherwise challenge these types of arrangements. We are subject to reviews and audits by the IRS and other taxing authorities from time to time, and the IRS or other taxing authority may challenge our structure. Responding to or defending against challenges from taxing authorities could be expensive and time consuming, and could divert management’s time and focus away from operating our business. We cannot predict whether and when taxing authorities will conduct an audit, challenge our tax structure or the cost involved in responding to any such audit or challenge. If we are unsuccessful, we may be required to pay taxes for prior periods, interest, fines or penalties, and may be obligated to pay increased taxes in the future, all of which could have an adverse effect on our business, financial condition, results of operations or growth prospects.
U.S. Tax Cuts and Jobs Act (“TCJA”)
In 2017, the United States enacted the Tax Cut and Jobs Act (“TCJA”), which amended many provisions of the Internal Revenue Code of 1986 (the “Code”). The TCJA contains provisions affecting the tax treatment of non-U.S. companies that can materially affect us. The TCJA includes provisions that reduce the U.S. corporate tax rate, impose a base erosion minimum tax on income of a U.S. corporation determined without regard to certain otherwise deductible payments made to certain foreign affiliates, and significantly accelerate taxable income and therefore cash tax expense by the imposition of other changes affecting life insurance companies, among others.
The TCJA also includes provisions that could materially affect our shareholders as a result of provisions that broaden the definition of United States shareholder for purposes of the controlled foreign corporation (“CFC”) rules and make it more difficult for a foreign insurance company to not be treated as a passive foreign investment company (“PFIC”). Independent of the TJCA, interpretations of U.S. federal income tax law, including those regarding whether a company is engaged in a trade or business (or has a permanent establishment) within the United States or is a PFIC, or whether U.S. persons are required to include in their gross income “subpart F income” or related person insurance income (“RPII”) of a CFC, are subject to change, possibly on a retroactive basis. Regulations regarding the application of the PFIC rules to insurance companies and regarding RPII are only in proposed form. New regulations or pronouncements interpreting or clarifying the existing proposed Treasury regulations could be forthcoming. In addition to the TCJA, other legislative proposals or administrative or judicial developments could also result in an increase in the amount of U.S. tax payable by us or by an investor in our securities or reduce the attractiveness of our products. If any such developments occur, our business, financial condition and results of operation could be materially and adversely affected and could have a material and adverse effect on your investment in our securities.
The Base Erosion and Anti-Abuse Tax
The TCJA introduced a new tax called the Base Erosion and Anti-Abuse Tax (BEAT). The BEAT is a minimum tax and is calculated as a percentage (
10%
in 2019-2025, and
12.5%
in 2026 and thereafter) of the “modified taxable income” of an “applicable taxpayer.” Modified taxable income is calculated by adding back to a taxpayer’s regular taxable income the amount of certain “base erosion tax benefits” with respect to certain payments made to foreign affiliates (including premium or other consideration paid or accrued to a related foreign reinsurance company for reinsurance) of the taxpayer, as well as the “base erosion percentage” of any net operating loss deductions. The BEAT applies for a taxable year only to the extent it exceeds a taxpayer’s regular corporate income tax liability for such year (determined without regard to certain tax credits).
For the year ended December 31, 2019, we believe that FGL Insurance did not incur tax liability under the BEAT. However, FGL Insurance has incurred BEAT in prior years, and it is possible that tax authorities may disagree with our BEAT calculations, or the interpretations on which those calculations were based, and assess additional taxes, interest and penalties, and the uncertainty regarding the correct interpretation of the BEAT may make such disagreements more likely.
37
Bermuda Tax Exemption
We are subject to the risk that Bermuda tax laws may change and that we may become subject to new Bermuda taxes following the expiration of a current exemption after 2035. The Bermuda Minister of Finance (the “Minister”), under the Exempted Undertakings Tax Protection Act 1966 of Bermuda, as amended, has given our Bermuda subsidiaries an assurance that if any legislation is enacted in Bermuda that would impose tax computed on profits or income, or computed on any capital asset, gain or appreciation, or any tax in the nature of estate duty or inheritance tax, then the imposition of any such tax will not be applicable to our Bermuda subsidiaries or any of our Bermuda subsidiaries’ operations, shares, debentures or other obligations until March 31, 2035, except insofar as such tax applies to persons ordinarily resident in Bermuda or to any taxes payable by our Bermuda subsidiaries in respect of real property owned or leased by our Bermuda subsidiaries in Bermuda. Given the limited duration of the Minister’s assurance, we cannot assure you that our Bermuda subsidiaries will not be subject to any Bermuda tax after March 31, 2035.
We may be subject to U.S. federal income taxation.
The Company is incorporated under the laws of the Cayman Islands and CF Bermuda Holdings Limited (“CF Bermuda”), F&G Re Ltd and F&G Life Re are incorporated under the laws of Bermuda. These companies currently intend to operate so that they will not be treated as being engaged in a trade or business within the U.S. or subject to current U.S. federal income taxation on their net income. However, the determination of whether a foreign corporation is engaged in a trade or business within the United States is highly factual, subject to uncertainty, and must be made annually. There can be no assurance that the IRS will not successfully contend that these companies are engaged in a trade or business in the U.S. If they were considered to be engaged in a U.S. trade or business, they could be subject to U.S. federal income taxation on a net basis on their income that is effectively connected with such U.S. trade or business (including a branch profits tax on the portion of its earnings and profits that is attributable to such income). Any such U.S. federal income taxation could result in substantial tax liabilities and consequently could have a material adverse effect on our financial condition and results of future operations.
U.S. persons who own our shares may be subject to U.S. federal income taxation at ordinary income rates on our undistributed earnings and profits.
Controlled foreign corporations in general
. If the Company or any of its non-U.S. subsidiaries is a “controlled foreign corporation” (“CFC”) for the taxable year, each U.S. person treated as a “U.S. Shareholder” with respect to the Company or its non-U.S. subsidiaries that held our shares directly (or indirectly through non-U.S. entities) as of the last day in such taxable year generally is required to include in gross income as ordinary income its pro rata share of such company’s insurance and reinsurance income and certain other investment income, regardless of whether that income was actually distributed to such U.S. person (with certain adjustments).
In general, a non-U.S. corporation is a CFC if its “U.S. Shareholders,” in the aggregate, own (or are treated as owning) stock of the non-U.S. corporation possessing more than 50% of the voting power or value of such corporation’s stock. However, this threshold is lowered to more than 25% for purposes of taking into account the insurance income of a non-U.S. corporation. Special rules apply for purposes of taking into account any related person insurance income (“RPII”) of a non-U.S. corporation, as described below.
U.S. Shareholder status
. Prior to the enactment of the TCJA, a “U.S. Shareholder” was defined as any U.S. person that owned, directly or indirectly (or was treated as owning), stock of the non-U.S. corporation possessing 10% or more of the total voting power of such non-U.S. corporation’s stock. However, for taxable years of non-U.S. corporations beginning after December 31, 2017, the TCJA provides that a “U.S. Shareholder” of a non-U.S. corporation generally is any U.S. person that owns (or is treated as owning) stock of the non-U.S. corporation possessing 10% or more of the total voting power or 10% or more of the total value of such non-U.S. corporation’s stock.
In addition, the TCJA expanded the situations in which a U.S. person that does not directly own stock in a non-U.S. corporation will be treated as owning such stock via the application of attribution rules. Specifically, the TCJA eliminated the prohibition on “downward attribution,” one effect of which is that stock of a non-U.S. subsidiary of a foreign parent may be attributed down to a U.S. subsidiary of such parent. Such attribution thus could cause the U.S. subsidiary to become a “U.S. Shareholder” of the non-U.S. subsidiary and thereby cause the latter to become a CFC.
38
CFC status
. Our Charter generally limits the voting power attributable to our shares so that no “United States person” (as defined in Section 957 of the Code) holds, directly, indirectly or constructively (within the meaning of Section 958 of the Code), more than 9.5% of the total voting power of our shares. This limitation would not apply to reduce the voting power of shares held by members of (a) the Blackstone Group (as defined in our Charter) without the consent of a majority of the Blackstone Group shareholders (as determined based on their ownership of the common shares) or (b) the FNF Group (as defined in our Charter) without the consent of the applicable member of the FNF Group. This voting power limitation was intended to reduce the likelihood that the Company’s shareholders would be treated as U.S. Shareholders.
By expanding the definition of a U.S. Shareholder, the TCJA reduces the effectiveness of our voting power limitation, because a U.S. person that owns 10% or more by value of our shares will be treated as a U.S. Shareholder, and increases the likelihood that the Company will be treated as a CFC. Thus, there can be no assurance that the Company will not become a CFC. In addition, as a result of the allowance of “downward attribution,” the non-U.S. subsidiaries of CF Bermuda currently are CFCs. U.S. persons should consult with their tax advisors regarding the possible application of the CFC rules to their investment in the Company.
Effect of CFC status on our shareholders
. Since CF Bermuda’s non-U.S. subsidiaries are CFCs, a U.S. person that is a U.S. Shareholder with respect to them as of the last day in such taxable year generally is required to include in gross income as ordinary income its pro rata share of such non-U.S. subsidiaries’ insurance and reinsurance income and certain other investment income, regardless of whether that income was actually distributed to such U.S. person (with certain adjustments). This same treatment would apply with respect to the Company or CF Bermuda, if it also becomes a CFC and a U.S. person is similarly treated as a U.S. Shareholder with respect to it.
In addition, if a U.S. Shareholder disposes of shares in a non-U.S. company that was a CFC during the five-year period ending on the date of disposition, any gain from the disposition will generally be treated as a dividend to the extent of the U.S. person’s share of the corporation’s undistributed earnings and profits that were accumulated during the period or periods that the U.S. person owned the shares while the corporation was a CFC (with certain adjustments). Also, a U.S. person may be required to comply with specified reporting requirements, regardless of the number of shares owned.
U.S. persons who own our shares may be subject to U.S. federal income taxation at ordinary income rates on a disproportionate share of our undistributed earnings and profits attributable to RPII.
In general.
If either of our non-U.S. insurance subsidiaries is treated as recognizing RPII in a taxable year and is treated as a CFC for purposes of the RPII rules for such taxable year (a “RPII CFC”), each U.S. person that owns, directly or indirectly through non-U.S. entities, any of such non-U.S. insurance subsidiary’s stock as of the last day in such taxable year must generally include in gross income its pro rata share of the RPII of such non-U.S. insurance subsidiary, determined as if the RPII were distributed proportionately only to all such U.S. persons, regardless of whether that income is distributed (with certain adjustments). Each of our non-U.S. insurance subsidiaries generally will be treated as a CFC for purposes of the RPII rules if U.S. persons in the aggregate own (or are treated as owning) 25% or more of the total voting power or value of the Company’s stock on any day of the taxable year. Each of our non-U.S. insurance subsidiaries expects to be treated as a CFC for this purpose based on the ownership of its shares.
RPII of a RPII CFC generally is certain insurance and reinsurance income (including underwriting and investment income) attributable to a policy of insurance or reinsurance with respect to which the person (directly or indirectly) insured is a U.S. person that owns (or is treated as owning) stock of such RPII CFC, or risks of a person that is “related” to such a U.S. person. For this purpose, (1) a person is “related” to another person if such person “controls,” or is “controlled” by, such other person, or if both are “controlled” by the same persons and (2) “control” of a corporation means ownership (or deemed ownership) of stock possessing more than 50% of the total voting power or value of such corporation’s stock and “control” of a partnership, trust or estate for U.S. federal income tax purposes means ownership (or deemed ownership) of more than 50% by value of the beneficial interests in such partnership, trust or estate. Certain attribution rules apply for purposes of determining control.
We do not believe that any of our non-U.S. insurance subsidiaries will earn more than a
de minimis
amount of RPII from insuring risks of such U.S. shareholders. Our Charter provides that no shareholder or holder (or, to its actual knowledge, any direct or indirect beneficial owner thereof) of our issued and outstanding shares, including any securities exchangeable for our share capital and all options, warrants, and contractual and other rights to purchase our share capital (“Derivative Securities”), that is a “United States person” (as defined in Section 957 of the Code) shall knowingly permit itself to hold (directly, indirectly or constructively within the meaning of Section
39
958 of the Code) 50% or more of the total voting power or of the total value of our issued and outstanding shares, including our Derivative Securities, in order to reduce the likelihood of us recognizing RPII. This limitation would not apply to a shareholder or holder of Derivative Securities that is a member of the Blackstone Group or FNF Group. In the event that any holder of our shares or Derivative Securities to whom this limitation applies contravenes such limitation, our board of directors may require such holder to sell or allow us to repurchase some or all of such holder’s shares or Derivative Securities at fair market value, as the board of directors and such holder agree in good faith, or to take any reasonable action that the board of directors deems appropriate. If a member of the Blackstone Group or FNF Group were to own (directly, indirectly or constructively) more than 50% of the total voting power or total value of our issued and outstanding shares, our subsidiaries may be treated as “related” to a member of the Blackstone Group or FNF Group, as applicable (or one of their affiliates) for these purposes. In such case, income of our non-U.S. insurance subsidiaries allocable to reinsuring risks of our U.S. subsidiaries (if any) would constitute RPII, and might trigger adverse RPII consequences to all U.S. persons that hold our ordinary shares directly or indirectly through non-U.S. entities, as described below.
RPII Exceptions - The RPII rules will not apply with respect to a non-U.S. insurance subsidiary for a taxable year if (1) at all times during its taxable year less than 20% of the total combined voting power of all classes of such non-U.S. insurance subsidiary’s voting stock and less than 20% of the total value of all of its stock is owned (directly or indirectly) by persons who are (directly or indirectly) insured under any policy of insurance or reinsurance issued by such insurance subsidiary, respectively, or who are related persons to any such person or (2) its RPII (determined on a gross basis) is less than 20% of its insurance income (as so determined) for the taxable year, determined with certain adjustments. It is expected that one or both of these exceptions will apply to our non-U.S. insurance subsidiaries but because we cannot be certain of our future ownership or our ability to obtain information about our shareholders to manage such ownership to ensure that our subsidiaries qualify for one or both of these exceptions, there can be no assurance in this regard.
U.S. persons who dispose of our shares may be required to treat any gain as ordinary income for U.S. federal income tax purposes and comply with other specified reporting requirements.
If a U.S. person disposes of shares in a non-U.S. corporation that is an insurance company that had RPII and the 25% threshold described above is met at any time when the U.S. person owned any shares in the corporation during the five-year period ending on the date of disposition, any gain from the disposition will generally be treated as a dividend to the extent of the U.S. person’s share of the corporation’s undistributed earnings and profits that were accumulated during the period that the U.S. person owned the shares (possibly whether or not those earnings and profits are attributable to RPII). In addition, the shareholder will be required to comply with specified reporting requirements, regardless of the amount of shares owned. We believe that these rules should not apply to a disposition of our shares because FGL Holdings is not itself directly engaged in the insurance business. We cannot assure you, however, that the IRS will not successfully assert that these rules apply to a disposition of our ordinary shares.
We may be a PFIC, which could result in adverse United States federal income tax consequences for our shareholders.
If we are a “passive foreign investment company” (“PFIC”) for any taxable year (or portion thereof) that is included in the holding period of U.S. person treated as a “U.S. Shareholder” of our shares or warrants, such U.S. person may be subject to adverse U.S. federal income tax consequences and may be subject to additional reporting requirements.
A foreign corporation will be classified as a PFIC for United States federal income tax purposes if either (i) at least 75% of its gross income in a taxable year, including its pro rata share of the gross income of any corporation in which it is considered to own at least 25% of the shares by value, is passive income or (ii) at least 50% of its assets in a taxable year (ordinarily determined based on fair market value and averaged quarterly over the year), including its pro rata share of the assets of any corporation in which it is considered to own at least 25% of the shares by value, are held for the production of, or produce, passive income (the “look-through rule”). Passive income generally includes dividends, interest, rents and royalties (other than rents or royalties derived from the active conduct of a trade or business) and gains from the disposition of passive assets. Income derived in the active conduct of an insurance business by a qualifying insurance company, however, is not treated as passive income.
Under the look-through rule described above, we are deemed to own all of the assets and to have received all of the income of our wholly-owned subsidiaries, including our Iowa based insurance subsidiary, FGL Insurance, and our non-U.S. insurance subsidiaries. Taking into account the anticipated ratio of passive and non-passive income and assets of our subsidiaries, while not free from doubt, we do not believe that we were a PFIC for the
40
taxable year ending December 31, 2019, and do not currently believe that we will be classified as a PFIC for the 2020 taxable year. Our actual PFIC status for our current taxable year or any subsequent taxable year, however, will not be determinable until after the end of such taxable year.
The determination as to whether we are a PFIC for any taxable year is based on the application of complex U.S. federal income tax rules, which are subject to differing interpretations. The PFIC rules as they relate to insurance companies were amended by the TCJA and there is considerable uncertainty regarding how certain aspects of the new rules will be interpreted. As a result of these uncertainties in the application of the PFIC rules to us and our subsidiaries, there can be no assurance that the IRS will not assert that we are PFIC for any taxable year or that a court will not sustain such assertion.
No final or temporary Treasury regulations currently exist regarding the application of the PFIC rules to an insurance company. However, proposed Treasury regulations were released in July 2019. The proposed Treasury regulations say that whether a company is engaged in the active conduct of an insurance business is a facts and circumstances test, but also introduce a “bright line” test providing that the active conduct requirement is met only if the insurance company’s “active conduct percentage” is at least 50%. In general, a company’s active conduct percentage is determined by dividing the company’s aggregate expenses for certain insurance-related services of its officers and employees (and the officers and employees of certain affiliates) by the company’s aggregate expenses for such insurance-related services (including those paid to unaffiliated persons). In addition, the proposed Treasury regulations modify and limit the application of the look-through rule described above in a manner that may make it more likely for FGL Holdings to be treated as a PFIC. The proposed Treasury regulations would also expand the circumstances in which a shareholder of a foreign corporation is treated as owning shares of a subsidiary that is treated as a PFIC, even if the foreign corporation is not treated as a PFIC. If these rules are finalized in their currently proposed form, there is a risk that we and/or foreign insurance company subsidiaries will be treated as PFICs, and that shareholders will be treated as owning indirectly interests in one or more PFICs.
If we determine we are a PFIC for any taxable year, we will endeavor to provide to a U.S. Holder such information as the Internal Revenue Service (“IRS”) may require, including a PFIC annual information statement, in order to enable the U.S. Holder to make and maintain a qualified electing fund election, but there is no assurance that we will timely provide such required information. There is also no assurance that we will have timely knowledge of our status as a PFIC in the future or of the required information to be provided. We urge U.S. investors to consult their own tax advisors regarding the possible application of the PFIC rules, including the impact of the changes to the PFIC rules contained in the TCJA.
Accounting rules, changes to accounting rules, or the grant of permitted accounting practices to competitors could negatively impact us.
We are required to comply with U.S. GAAP. A number of organizations are instrumental in the development and interpretation of U.S. GAAP, such as the SEC, the Financial Accounting Standards Board (“FASB”) and the American Institute of Certified Public Accountants. U.S. GAAP is subject to constant review by these organizations and others in an effort to address emerging accounting issues and to interpret existing accounting guidance. See "Note 2. Significant Accounting Policies and Practices" to our audited
consolidated financial statements
for further discussion on the FASB’s key projects and their impact to our financial condition and profitability.
The amount of statutory capital that our insurance subsidiaries have and the amount of statutory capital that they must hold to maintain their financial strength ratings and meet other requirements can vary significantly from time to time due to a number of factors outside of our control.
The financial strength ratings of our insurance subsidiaries are significantly influenced by their statutory surplus amounts and capital adequacy ratios. In any particular year, statutory surplus amounts and RBC ratios may increase or decrease depending on a variety of factors, most of which are outside of our control, including, but not limited to, the following:
|
•
|
the amount of statutory income or losses generated by our insurance subsidiaries (which itself is sensitive to equity market and credit market conditions);
|
|
•
|
the amount of additional capital our insurance subsidiaries must hold to support business growth and changes to the RBC calculation methodologies;
|
|
•
|
changes in statutory accounting or reserve requirements applicable to our insurance subsidiaries;
|
|
•
|
our ability to access capital markets to provide reserve relief;
|
|
•
|
changes in equity market levels, interest rates, and market volatility;
|
|
•
|
the value of certain fixed-income and equity securities in our investment portfolio;
|
|
•
|
changes in the credit ratings of investments held in our portfolio; and
|
41
|
•
|
the value of certain derivative instruments.
|
Rating agencies may also implement changes to their internal models, which differ from the RBC capital model and could result in our insurance subsidiaries increasing or decreasing the amount of statutory capital they must hold in order to maintain their current ratings. In addition, rating agencies may downgrade the investments held in our portfolio, which could result in a reduction of our capital and surplus and our RBC ratio. To the extent that an insurance subsidiary’s RBC ratios are deemed to be insufficient, we may take actions either to increase the capitalization of the insurer or to reduce the capitalization requirements. If we are unable to take such actions, the rating agencies may view this as a reason for a ratings downgrade.
The failure of any of our insurance subsidiaries to meet its applicable RBC requirements or minimum capital and surplus requirements could subject it to further examination or corrective action imposed by insurance regulators, including limitations on its ability to write additional business, supervision by regulators or seizure or liquidation. Any corrective action imposed could have a material adverse effect on our business, results of operations and financial condition. A decline in RBC ratios also limits the ability of an insurance subsidiary to make dividends or distributions to us and could be a factor in causing rating agencies to downgrade the insurer’s financial strength ratings, which could have a material adverse effect on our business, results of operations and financial condition.
We may be the target of future litigation, law enforcement investigations or increased scrutiny which may affect our financial strength or reduce profitability.
We, like other financial services companies, are involved in litigation and arbitration in the ordinary course of business. For further discussion on litigation and regulatory investigation risk, see “Note 12. Commitments and Contingencies” to our audited
consolidated financial statements
.
More generally, we operate in an industry in which various practices are subject to scrutiny and potential litigation, including class actions. In addition, we sell our products through IMOs, whose activities may be difficult to monitor. Civil jury verdicts have been returned against insurers and other financial services companies involving sales, underwriting practices, product design, product disclosure, administration, denial or delay of benefits, charging excessive or impermissible fees, recommending unsuitable products to customers, breaching fiduciary or other duties to customers, refund or claims practices, alleged agent misconduct, failure to properly supervise representatives, relationships with agents or other persons with whom the insurer does business, payment of sales or other contingent commissions and other matters. Such lawsuits can result in substantial judgments and damage to our reputation that is disproportionate to the actual damages, including material amounts of punitive non-economic compensatory damages. In some states, juries, judges and arbitrators have substantial discretion in awarding punitive and non-economic compensatory damages, which creates the potential for unpredictable material adverse judgments or awards in any given lawsuit or arbitration. Arbitration awards are subject to very limited appellate review. In addition, in some class action and other lawsuits, financial services companies have made material settlement payments.
We may not be able to protect our intellectual property and may be subject to infringement claims.
We rely on a combination of contractual rights and copyright, trademark and trade secret laws to establish and protect our intellectual property. Although we use a broad range of measures to protect our intellectual property rights, third parties may infringe or misappropriate our intellectual property. We may have to litigate to enforce and protect our copyrights, trademarks, trade secrets and know-how or to determine their scope, validity or enforceability, which represents a diversion of resources that may be significant in amount and may not prove successful. The loss of intellectual property protection or the inability to secure or enforce the protection of our intellectual property assets could adversely impact our business and its ability to compete effectively.
We may be subject to costly litigation in the event that another party alleges our operations or activities infringe upon that party’s intellectual property rights. Third parties may have, or may eventually be issued, patents or other protections that could be infringed by our products, methods, processes or services or could otherwise limit our ability to offer certain product features. We may also be subject to claims by third parties for breach of copyright, trademark, trade secret or license usage rights. Any such claims and any resulting litigation could result in significant expense and liability for damages or we could be enjoined from providing certain products or services to our customers or utilizing and benefiting from certain methods, processes, copyrights, trademarks, trade secrets or licenses, or alternatively, we could be required to enter into costly licensing arrangements with third parties, all of which could have a material adverse effect on our business, results of operations and financial condition.
42
Because we are incorporated under the laws of the Cayman Islands, shareholders may face difficulties in protecting their interests, and their ability to protect their rights through the U.S. Federal courts may be limited.
We are an exempted company incorporated under the laws of the Cayman Islands. As a result, it may be difficult for investors to effect service of process within the United States upon our directors or executive officers, or enforce judgments obtained in the United States courts against our directors or officers.
Our corporate affairs are governed by our Charter, the Companies Law (2020 Revision) of the Cayman Islands, as amended (the “Companies Law”) (as the same may be supplemented or amended from time to time) and the common law of the Cayman Islands. We are also subject to the federal securities laws of the United States. The rights of shareholders to take action against the directors, actions by minority shareholders and the fiduciary responsibilities of our directors to us under Cayman Islands law are to a large extent governed by the common law of the Cayman Islands. The common law of the Cayman Islands is derived in part from comparatively limited judicial precedent in the Cayman Islands as well as from English common law, the decisions of whose courts are of persuasive authority, but are not binding on a court in the Cayman Islands. The rights of our shareholders and the fiduciary responsibilities of our directors under Cayman Islands law are different from what they would be under statutes or judicial precedent in some jurisdictions in the United States. In particular, the Cayman Islands has a different body of securities laws as compared to the United States, and certain states may have more fully developed and judicially interpreted bodies of corporate law. In addition, Cayman Islands companies may not have standing to initiate a shareholders derivative action in a Federal court of the United States.
We have been advised by our Cayman Islands legal counsel that the courts of the Cayman Islands are unlikely (i) to recognize or enforce against us judgments of courts of the United States predicated upon the civil liability provisions of the federal securities laws of the United States or any state; and (ii) in original actions brought in the Cayman Islands, to impose liabilities against us predicated upon the civil liability provisions of the federal securities laws of the United States or any state, so far as the liabilities imposed by those provisions are penal in nature. In those circumstances, although there is no statutory enforcement in the Cayman Islands of judgments obtained in the United States, the courts of the Cayman Islands will recognize and enforce a foreign money judgment of a foreign court of competent jurisdiction without retrial on the merits based on the principle that a judgment of a competent foreign court imposes upon the judgment debtor an obligation to pay the sum for which judgment has been given provided certain conditions are met. For a foreign judgment to be enforced in the Cayman Islands, such judgment must be final and conclusive and for a liquidated sum, and must not be in respect of taxes or a fine or penalty, inconsistent with a Cayman Islands judgment in respect of the same matter, impeachable on the grounds of fraud or obtained in a manner, or be of a kind the enforcement of which is, contrary to natural justice or the public policy of the Cayman Islands (awards of punitive or multiple damages may well be held to be contrary to public policy). A Cayman Islands Court may stay enforcement proceedings if concurrent proceedings are being brought elsewhere.
As a result of all of the above, public shareholders may have more difficulty in protecting their interests in the face of actions taken by management, members of the board of directors or controlling shareholders than they would as public shareholders of a United States company.
Anti-takeover provisions in our Charter discourage, delay or prevent a change in control of the Company and may affect the trading price of our ordinary shares.
Our Charter includes a number of provisions that may discourage, delay or prevent a change in our management or control over us. For example, our Charter includes provisions (i) classifying the Company’s board of directors into three classes with each class to serve for three years with one class being elected annually, (ii) providing that directors may only be removed for cause, (iii) requiring shareholders to comply with advance notice procedures in order to bring business before an annual general meeting or to nominate candidates for election as directors, (iv) providing that only directors may call general meetings, (v) providing that resolutions may only be passed at a duly convened general meeting.
These provisions may prevent our shareholders from receiving the benefit from any premium to the market price of our ordinary shares offered by a bidder in a takeover context. Even in the absence of a takeover attempt, the existence of these provisions may adversely affect the prevailing market price of our ordinary shares if the provisions are viewed as discouraging takeover attempts in the future.
Our Charter may also make it difficult for shareholders to replace or remove our management. These provisions may facilitate management entrenchment that may delay, deter, render more difficult or prevent a change in our control, which may not be in the best interests of our shareholders.
43
Many states, including the jurisdictions where our principal insurance subsidiaries FGL Insurance and FGL NY Insurance are domiciled, have insurance laws and regulations that require advance approval by state agencies of any direct or indirect change in control of an insurance company that is domiciled in or, in some cases, has such substantial business that it is deemed to be commercially domiciled in that state. Therefore, any person seeking to acquire a controlling interest in us would face regulatory obstacles which may delay, deter or prevent an acquisition that shareholders might consider in their best interests.
The consent right of the original holders of our preferred shares over a change of control transaction may discourage, delay or prevent a change in control of our Company and may affect the trading price of our ordinary shares and the preferred shares.
The original holders of the preferred shares each have a consent right over any change of control transaction so long as they hold any preferred shares at the time of such change of control, unless prior to any such change of control transaction, such original holders have received a bona fide, binding offer to purchase all of such original holders’ preferred shares at a price equal to or greater than the then-current liquidation preference, plus any accumulated and unpaid dividends (whether or not declared), from a person not affiliated with any person or group participating in such change of control transaction.
This provision may prevent our shareholders from receiving the benefit from any premium to the market price of our ordinary shares offered by a bidder in a takeover context. Even in the absence of a takeover attempt, the existence of these provisions may adversely affect the prevailing market price of our ordinary shares and our preferred shares if this provision is viewed as discouraging takeover attempts in the future.
If we fail to maintain an effective system of internal controls, we may not be able to accurately report our financial results.
We are required to comply with Section 404 of the Sarbanes-Oxley Act, which requires, among other things, that companies maintain disclosure controls and procedures to ensure timely disclosure of material information, and that management review the effectiveness of those controls on a quarterly basis. Effective internal controls are necessary for us to provide reliable financial reports and to help prevent fraud, and our management and other personnel devote a substantial amount of time to these compliance requirements. Moreover, these rules and regulations increase our legal and financial compliance costs and make some activities more time-consuming and costly. Section 404 of the Sarbanes-Oxley Act also requires us to evaluate annually the effectiveness of our internal controls over financial reporting as of the end of each fiscal year and to include a management report assessing the effectiveness of our internal control over financial reporting in our Annual Report on Form 10-K. If we fail to maintain effective internal controls, we might be subject to sanctions or investigation by regulatory authorities, such as the SEC. Any such action could adversely affect our financial results and may also result in delayed filings with the SEC.
Risks relating to our business
The agreements and instruments governing our debt contain significant operating and financial restrictions, which may prevent us from capitalizing on business opportunities.
The indenture (“the indenture”) governing the
5.50%
senior notes due 2025 (the “Senior Notes”) issued by FGLH and the three-year $250 unsecured revolving credit facility (the “Credit Agreement”); each contains various restrictive covenants which limit, among other things, the Company’s ability to:
|
•
|
incur additional indebtedness;
|
|
•
|
pay dividends or certain other distributions on its capital stock other than as allowed under the indenture and the Credit Agreement;
|
|
•
|
make certain investments, prepayment of junior indebtedness or other restricted payments;
|
|
•
|
engage in transactions with stockholders or affiliates;
|
|
•
|
sell certain assets or merge with or into other companies;
|
|
•
|
change our accounting policies;
|
|
•
|
guarantee indebtedness; and
|
|
•
|
create liens or incur liens on the assets of FGLH and its subsidiaries.
|
In addition, if FGL or FGLH undergoes a “change of control” as defined in the indenture, each holder of Senior Notes will have the right to require us to repurchase their Senior Notes at a price equal to 101% of the principal amount and any accrued but unpaid interest.
44
As a result of these restrictions and their effect on us, we may be limited in how we conduct our business and we may be unable to raise additional debt financing to compete effectively or to take advantage of new business opportunities. The terms of any future indebtedness we or our subsidiaries may incur could include more restrictive covenants. For detailed information about restrictions governing our debt, see the section titled "Debt" in "Item 7. Management’s Discussion and Analysis of Financial Condition and Results of Operations-Liquidity and Capital Resources" in this report.
A financial strength ratings downgrade, potential downgrade, or any other negative action by a rating agency, could make our product offerings less attractive and increase our cost of capital, and thereby adversely affect our financial condition and results of operations.
Various nationally recognized rating agencies review the financial performance and condition of insurers, including our insurance subsidiaries, and publish their financial strength ratings as indicators of an insurer’s ability to meet policyholder and contractholder obligations. These ratings are important to maintaining public confidence in our products, our ability to market our products and our competitive position. Any downgrade or other negative action by a rating agency could have a materially adverse effect on us in many ways, including the following:
|
•
|
adversely affecting relationships with distributors, IMOs and sales agents, which could result in reduction of sales;
|
|
•
|
increasing the number or amount of policy lapses or surrenders and withdrawals of funds;
|
|
•
|
requiring a reduction in prices for our insurance products and services in order to remain competitive;
|
|
•
|
adversely affecting our ability to obtain reinsurance at a reasonable price, on reasonable terms or at all;
|
|
•
|
adversely affecting our ability to grow offshore reinsurance business; and
|
|
•
|
requiring us to collateralize reserves, balances or obligations under reinsurance and derivatives agreements.
|
See “Item 7A. Quantitative and Qualitative Disclosures About Market Risk” for further discussion on credit risk and counterparty risk.
Our insurance subsidiaries’ ability to grow depends in large part upon the continued availability of capital.
Our insurance subsidiaries’ long-term strategic capital requirements will depend on many factors, including their accumulated statutory earnings and the relationship between their statutory capital and surplus and various elements of required capital. To support long-term capital requirements, we and our insurance subsidiaries may need to increase or maintain statutory capital and surplus through financings, which could include debt, equity, financing arrangements or other surplus relief transactions. Adverse market conditions have affected and continue to affect the availability and cost of capital from external sources. We are not obligated, may choose not, or may not be able to provide financing or make capital contributions to our insurance subsidiaries. Consequently, financings, if available at all, may be available only on terms that are not favorable to us or our insurance subsidiaries. If our insurance subsidiaries cannot maintain adequate capital, they may be required to limit growth in sales of new policies, and such action could materially adversely affect our business, operations and financial condition.
Our business could be interrupted or compromised if we experience difficulties arising from outsourcing relationships.
If we do not maintain an effective outsourcing strategy or third-party providers do not perform as contracted, we may experience operational difficulties, increased costs and a loss of business that could have a material adverse effect on our results of operations. If there is a delay in our third-party providers’ introduction of our new products or if our third-party providers are unable to service our customers appropriately, we may experience a loss of business that could have a material adverse effect on our results of operations. In addition, our reliance on third-party service providers that we do not control does not relieve us of our responsibilities and requirements. Any failure or negligence by such third-party service providers in carrying out their contractual duties may result in us becoming subjected to liability to parties who are harmed and ensuing litigation. Any litigation relating to such matters could be costly, expensive and time-consuming, and the outcome of any such litigation may be uncertain. Moreover, any adverse publicity arising from such litigation, even if the litigation is not successful, could adversely affect our reputation and sales of our products.
See section titled "Outsourcing” in Item 1. Business for functions we outsource to third-party service providers.
45
The loss of key personnel could negatively affect our financial results and impair our ability to implement our business strategy.
Our success depends in large part on our ability to attract and retain qualified employees. Intense competition exists for key employees with demonstrated ability, and we may be unable to hire or retain such employees. Our key employees include senior management, sales and distribution professionals, actuarial and finance professionals and information technology professionals. We do not believe the departure of any particular individual would cause a material adverse effect on our operations; however, the unexpected loss of several of key employees could have a material adverse effect on our operations due to the loss of their skills, knowledge of our business, and their years of industry experience as well as the potential difficulty of promptly finding qualified replacement employees.
Interruption or other operational failures in telecommunication, information technology and other operational systems, or a failure to maintain the security, integrity, confidentiality or privacy of sensitive data residing on such systems, including as a result of human error, could harm our business.
We are highly dependent on automated and information technology systems to record and process our internal transactions and transactions involving our customers, as well as to calculate reserves, value invested assets and complete certain other components of our U.S. GAAP and statutory financial statements. We have policies, procedures, automation, and back-up plans designed to prevent or limit the effect of failure. All of these risks are also applicable where we rely on outside vendors, to provide services to us and our customers. The failure of any one of these systems for any reason could disrupt our operations, result in loss of customer business and adversely impact our business.
We retain confidential information in our information technology systems and those of our business partners, and we rely on industry standard commercial technologies and network security measures to maintain the security of those systems and prevent disruptions from unauthorized tampering with our computer systems. Any compromise of the security of our information technology systems that results in inappropriate access, use or disclosure of personally identifiable customer information could damage our reputation in the marketplace, deter purchases of our products, subject us to heightened regulatory scrutiny or significant civil and criminal liability and require us to incur significant technical, legal and other expenses.
Our risk management policies and procedures could leave us exposed to unidentified or unanticipated risk, which could negatively affect our business or result in losses.
We have developed risk management policies and procedures designed to manage material risks within established risk appetites and risk tolerances. Nonetheless, our policies and procedures may not effectively mitigate the internal and external risks identified or predict future exposures, which could be different or significantly greater than expected. Many of our methods of managing risk and exposures are based upon observed historical data, current market behavior, and certain assumptions made by management. The information may not always be accurate, complete, up-to-date, or properly evaluated. As a result, additional risks and uncertainties not currently known to us, or that we currently deem to be immaterial, may adversely affect our business, financial condition or operating results. See section titled “Risk Management” in Item 1. Business for further discussion of the Company’s risk assessment.
We are exposed to the risks of natural and man-made catastrophes, pandemics and malicious and terrorist acts that could materially adversely affect our business, financial condition and results of operations.
Natural and man-made catastrophes, pandemics and malicious and terrorist acts present risks that could materially adversely affect our results of operations or the mortality or morbidity experience of our business. Claims arising from such events could have a material adverse effect on our business, operations and financial condition, either directly or as a result of their effect on our reinsurers or other counterparties. Such events could also have an adverse effect on lapses and surrenders of existing policies, as well as sales of new policies. While we have taken steps to identify and mitigate these risks, such risks cannot be predicted, nor fully protected against even if anticipated. In addition, such events could result in overall macroeconomic volatility or specifically a decrease or halt in economic activity in large geographic areas, adversely affecting the marketing or administration of our business within such geographic areas or the general economic climate, which in turn could have an adverse effect on our business, operations and financial condition. The possible macroeconomic effects of such events could also adversely affect our asset portfolio.
46
We operate in a highly competitive industry, which could limit our ability to gain or maintain our position in the industry and could materially adversely affect our business, financial condition and results of operations.
We operate in a highly competitive industry. We encounter significant competition in all of our product lines from other insurance companies, many of which have greater financial resources and higher financial strength ratings than us and which may have a greater market share, offer a broader range of products, services or features, assume a greater level of risk, have lower operating or financing costs, or have different profitability expectations than us. Competition could result in, among other things, lower sales or higher lapses of existing products.
Our annuity products compete with fixed indexed, fixed rate and variable annuities sold by other insurance companies and also with mutual fund products, traditional bank investments and other retirement funding alternatives offered by asset managers, banks and broker-dealers. The ability of banks and broker dealers to increase their securities-related business or to affiliate with insurance companies may materially and adversely affect sales of all of our products by substantially increasing the number and financial strength of potential competitors. Our insurance products compete with those of other insurance companies, financial intermediaries and other institutions based on a number of factors, including premium rates, policy terms and conditions, service provided to distribution channels and policyholders, ratings by rating agencies, reputation and commission structures.
Our ability to compete is dependent upon, among other things, our ability to develop competitive and profitable products, our ability to maintain low unit costs, and our maintenance of adequate financial strength ratings from rating agencies. Our ability to compete is also dependent upon, among other things, our ability to attract and retain distribution channels to market our products, the competition for which is vigorous.
The Setting Every Community Up for Retirement Enhancement Act of 2019, may impact our business and the markets in which we compete
The Setting Every Community Up for Retirement Enhancement Act of 2019, Pub.L. 116-94 (the “SECURE Act”), was signed into law on December 20, 2019 as part of the Further Consolidated Appropriations Act, 2020 and takes effect in certain respects as early as January 1, 2020. The SECURE Act contains provisions that may impact our business, including: elimination of the “stretch IRA” (funds from inherited IRAs must now be fully withdrawn by beneficiaries within 10 years of the account owner’s death and, as a result, IRAs may be less desirable to our customers, and our administrative system for handling distributions from IRAs invested in our annuity products may need to be updated to reflect the shortened distribution period for IRA beneficiaries); elimination of age limit for making traditional IRA contributions; raising of the age for required minimum distributions from IRAs from 70½ to 72 (particularly impacting our administrative system for handling distributions from IRAs invested in our annuity products); expansion of 401K plan eligibility for part-time workers; creation of new employer protections for offering annuities, including a fiduciary safe harbor for employer retirement plan sponsors that wish to add in-plan annuity products (particularly impacting how we and our competitors may now sell annuity products to employers or provide certifications necessary to meet the SECURE Act fiduciary safe harbor requirements); and lowering of barriers for offering multiple employer plans. The SECURE Act changes may also affect, to some extent, the length of time that IRA assets remain in our annuity products. While we cannot predict whether, or to what extent, the SECURE Act will ultimately impact us, the SECURE Act may have implications for our business operations and the markets in which we compete. See section titled “The SECURE Act” in Item 1. Business.
If we are unable to attract and retain national marketing organizations and independent agents, sales of our products may be reduced.
We must attract and retain our network of IMOs and independent agents to sell our products. Insurance companies compete vigorously for productive agents. We compete with other life insurance companies for marketers and agents primarily on the basis of our financial position, support services, compensation and product features. Such marketers and agents may promote products offered by other life insurance companies that offer a larger variety of products than we do. If we are unable to attract and retain a sufficient number of marketers and agents to sell our products, our ability to compete and our revenues would suffer.
47
We are a holding company with limited operations of our own. As a consequence, our ability to pay dividends on our stock will depend on the ability of our subsidiaries to pay dividends to us, which may be restricted by law.
We are a holding company with limited business operations of our own. Our primary subsidiaries are insurance subsidiaries that own substantially all of our assets and conduct substantially all of our operations. The Iowa insurance law and the New York insurance law regulate the amount of dividends that may be paid in any year by FGL Insurance and FGL NY Insurance, respectively. Accordingly, our payment of dividends is dependent, to a significant extent, on the generation of cash flow by our subsidiaries and their ability to make such cash available to us, by dividend or otherwise. Our subsidiaries may not be able to, or may not be permitted to, make distributions to enable us to meet our obligations and pay dividends. Each subsidiary is a distinct legal entity and legal and contractual restrictions may also limit our ability to obtain cash from our subsidiaries.
It is possible that in the future our insurance subsidiaries may be unable to pay dividends or distributions to us in an amount sufficient to meet our obligations or to pay dividends due to a lack of sufficient statutory net gain from operations, a diminishing statutory policyholders surplus, changes to the Iowa or New York insurance laws or regulations or for some other reason. In addition, Cayman Islands law may impose requirements that may restrict our ability to pay dividends to holders of our ordinary shares. Further, the covenants in the agreement governing the existing indebtedness of FGLH significantly restrict its ability to pay dividends, which further limits our ability to obtain cash or other assets from our subsidiaries. If our subsidiaries cannot pay sufficient dividends or distributions to us in the future, we would be unable to meet our obligations or to pay dividends. This would negatively affect our business and financial condition as well as the trading price of our ordinary shares. See section titled “Regulation-Dividend and Other Distribution Payment Limitations” in Item 1. Business for further discussion.
Our growth strategy includes selectively acquiring business through acquisitions of other insurance companies and reinsurance of insurance obligations written by unaffiliated insurance companies, and our ability to consummate these acquisitions on economically advantageous terms acceptable to us in the future is unknown.
We intend to grow our business in the future in part by acquisitions of other insurance companies and businesses, and through block reinsurance, which could materially increase the size of our business and could require additional capital, systems development and skilled personnel. Any such acquisitions could be funded through cash from operations, the issuance of equity and/or the incurrence of additional indebtedness, which amount may be material, or a combination thereof. We actively monitor the market for merger and acquisition opportunities; however the timing, structure and size of any such acquisitions are uncertain and any such acquisitions could be material.
Moreover, we may experience challenges identifying, financing, consummating and integrating such acquisitions and block reinsurance transactions. Competition exists in the market for profitable blocks of business and such competition is likely to intensify as insurance businesses become more attractive targets.
It is also possible that merger and acquisition transactions will become less frequent, or be difficult to consummate due to financing or other factors, which could also make it more difficult for us to implement this aspect of our growth strategy. Our acquisition and block reinsurance transaction activities may also divert the attention of our management from our business, which may have an adverse effect on our business and results of operations.
Occasionally we may acquire or seek to acquire an insurance company or business that writes businesses that are not core to our business. The ability of our management to transfer or source sufficient reasonably priced reinsurance for non-core businesses that we may acquire and want to dispose of may be limited. In the event that we were unable to find buyers or purchase adequate reinsurance, we would have to accept an increase in our net risk exposures, revise our pricing to reflect higher reinsurance premiums, or otherwise modify our acquisitions and product offerings, each of which could have a material adverse effect on our business, financial condition, results of operations and cash flows.
In furtherance of our strategy of growth through acquisitions, we may review and conduct investigations of potential acquisitions or block reinsurance transactions, some of which may be material. When we believe a favorable opportunity exists, we may seek to enter into discussions with target companies or sellers regarding the possibility of such transactions. At any given time, we may be in discussions with one or more counterparties. There can be no assurance that any such negotiations will lead to definitive agreements, or if such agreements are reached, that any transactions would be consummated.
48
The founders and Blackstone affiliates own a significant portion of our issued and outstanding voting shares and have nomination rights with respect to our board of directors and have agreed to vote together for nominees selected pursuant to the Nominating and Voting Agreement.
The founders beneficially own approximately
13%
of our ordinary shares, and Blackstone affiliates (including GSO) beneficially own approximately
20%
of our ordinary shares, in each case excluding warrants held by such parties that are currently exercisable. As long as the founders and Blackstone affiliates own or control a significant percentage of our outstanding voting power, they will have the ability to strongly influence all corporate actions requiring shareholder approval, including the election and removal of directors and the size of our board of directors, any amendment of our Charter, or the approval of any merger or other significant corporate transaction, including a sale of substantially all of our assets.
In addition, we have entered into a nominating and voting agreement (the “Nominating and Voting Agreement”) with Mr. Foley, Mr. Chu and Blackstone Tactical Opportunities Fund II L.P. (“BTO”) (collectively, the “Nominating Parties”), pursuant to which, if the Nominating Parties and their respective affiliates own, in the aggregate, directly or indirectly, at least 20% of our issued and outstanding ordinary shares, the Nominating Parties will have the right to designate one director nominee for election at each general meeting of the Company. If the Nominating Parties and their respective affiliates own, in the aggregate, directly or indirectly, at least 12% but less than 20% of the issued and outstanding ordinary shares (the “Two Director Range”), the Nominating Parties will have the right to designate one director nominee for each of the two director classes (the “Two Director Classes”) to be voted on at the two general meetings of the Company immediately after the aggregate ownership of ordinary shares comes within the Two Director Range and for each subsequent meeting at which one of the Two Director Classes is to be voted on by the shareholders, provided that such aggregate ownership remains within the Two Director Range at the time of each such nomination.
If the Nominating Parties and their respective affiliates own, in the aggregate, directly or indirectly, at least 5% but less than 12% of the issued and outstanding ordinary shares (the “One Director Range”), the Nominating Parties will have the right to designate one director nominee for the class of directors (the “One Director Class”) to be voted on at the general meeting of the Company immediately after the aggregate ownership of ordinary shares comes within the One Director Range and for each subsequent meeting at which the One Director Class is to be voted on by the shareholders, provided that such aggregate ownership remains within the One Director Range at the time of each such nomination.
Director nominees selected under the Nominating and Voting Agreement will be selected by the vote of any two of Mr. Foley, Mr. Chu and BTO. In addition, pursuant to the Nominating and Voting Agreement, each of Mr. Foley, Mr. Chu and BTO agreed to vote their respective ordinary shares for each director so nominated.
The interests of the founders and Blackstone affiliates may not align with the interests of our other shareholders. The founders and Blackstone are in the business of making investments in companies and may acquire and hold interests in businesses that compete directly or indirectly with us. The founders and Blackstone may also pursue acquisition opportunities that may be complementary to our business, and, as a result, those acquisition opportunities may not be available to us.
Warrants, including those issued in connection with the business combination, exercised for our ordinary share would increase the number of shares eligible for future resale in the public market and result in dilution to our shareholders.
We issued warrants to purchase 34,500 ordinary shares as part of our IPO, and we issued an aggregate of 17,300 private placement warrants to CF Capital Growth, LLC ("Sponsor"), each exercisable to purchase one whole ordinary share at $11.50 per whole share. In connection with the business combination, we also issued an aggregate of 19,083 forward purchase warrants to the anchor investors. A total of
65,374
warrants were tendered prior to October 4, 2018, the date of expiration of the Company's offer to exchange. On October 9, 2018, the Company issued
7,191
shares and paid
$64
in cash in exchange for the warrants tendered. After completion of the offer to exchange,
5,510
warrants still remain outstanding, which will expire on November 30, 2022, or upon earlier redemption or liquidation.
To the extent the warrants that remain outstanding are exercised, additional ordinary shares will be issued, which will result in dilution to the then existing holders of our ordinary shares and increase the number of shares eligible for resale in the public market. Sales of substantial numbers of such shares in the public market could adversely affect the market price of our ordinary shares. In addition, such dilution could, among other things, limit the ability of our current shareholders to influence management through the election of directors.
49
We may amend the terms of the warrants in a manner that may be adverse to holders with the approval by the holders of at least 65% of the then outstanding public warrants. As a result, the exercise price of the warrants could be increased, the exercise period could be shortened and the number of ordinary shares purchasable upon exercise of a warrant could be decreased, all without the approval of the holders of the warrants.
Our warrants were issued in registered form under a warrant agreement between Continental Stock Transfer & Trust Company, as warrant agent, and us. The warrant agreement provides that the terms of the warrants may be amended without the consent of any holder to cure any ambiguity or correct any defective provision, but requires the approval by the holders of at least 65% of the then outstanding public warrants to make any change that adversely affects the interests of the registered holders. Accordingly, we may amend the terms of the public warrants in a manner adverse to a holder if holders of at least 65% of the then outstanding public warrants approve of such amendment. Although our ability to amend the terms of the public warrants with the consent of at least 65% of the then outstanding public warrants is unlimited, examples of such amendments could be amendments to, among other things, increase the exercise price of the warrants, shorten the exercise period or decrease the number of ordinary shares purchasable upon exercise of a warrant.
We may redeem unexpired warrants prior to their exercise at a time that is disadvantageous to warrant holders, thereby making their warrants worthless.
We have the ability to redeem outstanding warrants at any time after they become exercisable and prior to their expiration, at a price of $0.01 per warrant, provided that the last reported sales price of our ordinary shares equals or exceeds $18.00 per share for any 20 trading days within a 30 trading-day period ending on the third trading day prior to the date we send the notice of redemption to the warrant holders. If and when the warrants become redeemable by us, we may exercise our redemption right even if we are unable to register or qualify the underlying securities for sale under all applicable state securities laws. Redemption of the outstanding warrants could force the warrant holders (i) to exercise their warrants and pay the exercise price therefor at a time when it may be disadvantageous for them to do so, (ii) to sell their warrants at the then-current market price when they might otherwise wish to hold their warrants or (iii) to accept the nominal redemption price which, at the time the outstanding warrants are called for redemption, is likely to be substantially less than the market value of their warrants. None of the warrants will be redeemable by us so long as they are held by our Sponsor or its permitted transferees.
Holders of our Series A Preferred Shares and Series B Preferred Shares will have no voting rights except under limited circumstances.
Except with respect to certain material and adverse changes to the Series A Preferred Shares or Series B Preferred Shares and the right to appoint a director upon certain nonpayment events, holders of the preferred shares do not have voting rights and will not have the right to vote for any members of the board of directors, except as may be required by law.
Upon a successful remarketing of the Series A Preferred Shares or Series B Preferred Shares, the terms of the preferred shares may be modified even if holders are unable to participate in the remarketing.
When we attempt to remarket the Series A Preferred Shares or Series B Preferred Shares, the remarketing agent will agree to use its reasonable best efforts to sell such preferred shares included in the remarketing. In connection with the remarketing, we and the remarketing agent may remarket such preferred shares with different terms prior to the remarketing, including a later earliest redemption date and a different dividend rate. Only the original holders may request or elect to participate in a remarketing. However, if the remarketing is successful, the modified terms will apply to all of the Series A Preferred Shares and Series B Preferred Shares, including those shares that were not included in the remarketing.
The Series A Preferred Shares and Series B Preferred Shares have no maturity or mandatory redemption date.
Each of the Series A Preferred Shares and Series B Preferred Shares is a perpetual equity security. The Series A Preferred Shares and Series B Preferred Shares have no maturity or mandatory redemption date and are not redeemable at the option of the holders. Accordingly, the Series A Preferred Shares and Series B Preferred Shares will remain outstanding indefinitely unless we elect to redeem the Series A Preferred Shares or Series B Preferred Shares or, in the case of an original holder, such original holder decides to convert its preferred shares, subject to the conditions described herein.
50
On or after November 30, 2022, we may redeem any or all of the Series A Preferred Shares or Series B Preferred Shares, and upon any redemption of the Series A Preferred Shares or Series B Preferred Shares, holders will not receive any “make whole” cash or shares or other compensation for future dividends or lost time value of the Series A Preferred Shares or Series B Preferred Shares.
On or after November 30, 2022 (or such later date as is determined in connection with a successful remarketing), we may redeem any or all of the Series A Preferred Shares or Series B Preferred Shares. The redemption price will equal 100% of the liquidation preference of the Series A Preferred Shares and Series B Preferred Shares to be redeemed, plus any accumulated and unpaid dividends (whether or not declared) to, but excluding, the redemption date. Upon any such redemption, we will not be required to pay any “make whole” cash or shares or otherwise compensate holders in any way for any future dividend payments, if any, that holders would have otherwise received or any other lost time value of the Series A Preferred Shares or Series B Preferred Shares.
Holders of the Series A Preferred Shares and Series B Preferred Shares have no right to vote for directors until and unless dividends on of the Series A Preferred Shares or Series B Preferred Shares are in arrears and unpaid for the equivalent of six or more dividend periods.
Until and unless dividends on any of the Series A Preferred Shares or Series B Preferred Shares are in arrears and unpaid for the equivalent of six or more dividend periods, purchasers of the Series A Preferred Shares and Series B Preferred Shares have no voting rights with respect to the election of directors. If dividends on any shares of the Series A Preferred Shares or Series B Preferred Shares are in arrears and unpaid for the equivalent of six or more dividend periods, whether or not consecutive, the holders of our Series A Preferred Shares and Series B Preferred Shares, voting as a single class with all of our other classes or series of preferred shares upon which equivalent voting rights have been conferred and are exercisable, will have the right to elect two additional directors to our board of directors. These voting rights and the terms of the directors so elected will continue until all dividends on the Series A Preferred Shares and Series B Preferred Shares have been paid in full, or declared and a sum or number of preferred shares sufficient for such payment is set aside for payment.
None.
We lease our headquarters at 601 Locust Street, Des Moines, Iowa, and sublease property in Baltimore, Maryland. Such leases expire December 2020 and May 2021, respectively. In December 2019, we entered into a lease for a new headquarters located at 801 Grand Avenue, Des Moines, Iowa. We anticipate occupation of the premises by late 2020. We believe our existing facilities are suitable and adequate for our present purposes. As of January 2020, we believe that our Des Moines, Iowa, and Baltimore, Maryland, properties will be sufficient for us to conduct our operations.
See "Note 12. Commitments and Contingencies" to our audited
consolidated financial statements
.
Not applicable.
51
Market Information
Our ordinary shares and warrants are listed on the NYSE under the symbols “FG” and “FG WS,” respectively. The Company’s ordinary shares and warrants began trading on the NYSE on December 1, 2017.
As of
February 24, 2020
, there were approximately
51
holders of record of our ordinary shares. This number does not include the stockholders for whom shares are held in a “nominee” or “street” name.
Dividends on Ordinary Shares
As previously disclosed, in December 2018, the Company's board of directors approved the implementation of a quarterly cash dividend of $0.01 per ordinary share, beginning in the first quarter of fiscal year 2019. The dividend equates to $0.04 per share on a full-year basis. The payment of cash dividends on ordinary shares in the future will be dependent upon the Company’s revenues and earnings, if any, capital requirements and general financial condition. The payment of any dividends on ordinary shares will be within the discretion of the Company’s board of directors at such time. In addition, the terms of the preferred shares and agreements governing the indebtedness of the Company and its subsidiaries contain restrictions on the Company’s ability to declare and pay dividends. For further discussion on dividends and other distribution payment limitations, see “Note 9. Equity” to our audited
consolidated financial statements
.
52
Performance Graph
The information contained in this Performance Graph section shall not be deemed to be “soliciting material” or “filed” or incorporated by reference in future filings with the SEC, or subject to the liabilities of Section 18 of the Securities Exchange Act of 1934, except to the extent that we specifically incorporate it by reference into a document filed under the Securities Act of 1933 or the Securities Exchange Act of 1934.
The following graph shows a comparison from July 8, 2016 (the date our ordinary shares commenced trading on the Nasdaq) through
December 31, 2019
of the cumulative total return for our ordinary shares with the comparable cumulative return of two indices: the Standard & Poor's 500 Stock Index (S&P 500 Index) and the S&P 500 Life & Health Insurance Index. The graph assumes that $100 was invested at the market close on July 8, 2016 in ordinary shares of FGL Holdings and the two indices and assumes reinvestments of dividends. The stock price performance of the following graph is not necessarily indicative of future stock price performance.
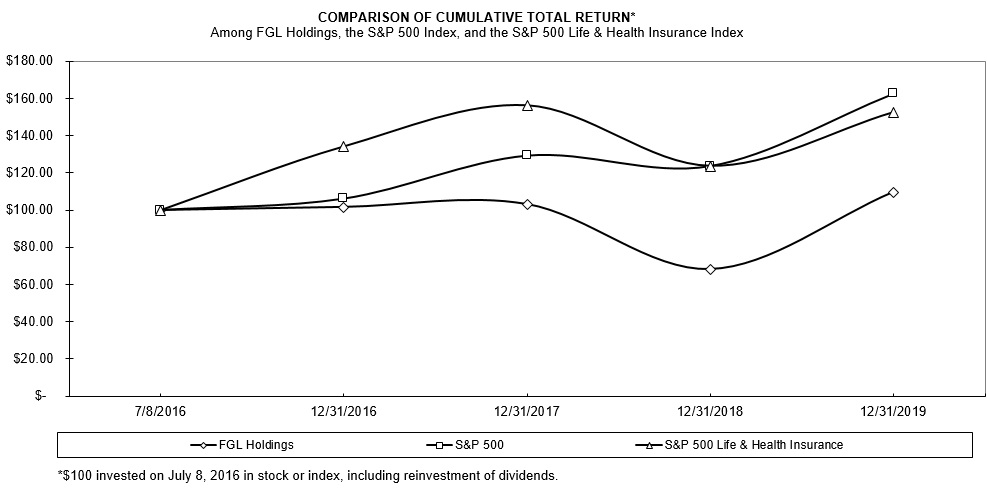
Recent Sales of Unregistered Sales of Equity Securities
There were no sales of unregistered securities other than as previously reported by the Company in either its quarterly reports on Form 10-Q or current reports on Form 8-K.
As previously disclosed, on December 21, 2018, we issued a total of 3,813,476 stock options outside our 2017 Omnibus Incentive Plan to Christopher Blunt, our Chief Executive Officer, as an inducement material to Mr. Blunt’s entry into employment with FGL Holdings. For 3,200,000 of such stock options, fifty percent vest in five equal annual installments beginning on December 21, 2019, subject to continued employment, with the remaining fifty percent vesting in five equal installments beginning on December 21, 2019 based on attainment of performance objectives to be established by the board of directors on an annual basis, subject to continued employment. For 613,476 of such stock options, fifty percent vest in three equal annual installments beginning on March 15, 2021 based on attainment of specified return on equity performance metrics, subject to continued employment, with the remaining fifty percent vesting in five equal installments beginning on March 15, 2020 based on attainment of specified minimum stock prices, subject to continued employment.
Also on December 21, 2018, we issued a total of 2,106,738 stock options outside our 2017 Omnibus Incentive Plan to Jonathan Bayer, our Head of Corporate Development & Strategy, as an inducement material to Mr. Bayer’s entry into employment with FGL Holdings. For 1,800,000 of such stock options, fifty percent vest in five equal annual installments beginning on December 21, 2019, subject to continued employment, with the remaining fifty percent vesting in five equal installments beginning on December 21, 2019 based on attainment of performance objectives to be established by the board of directors on an annual basis, subject to continued employment. For 306,738 of such stock options, fifty percent vest in three equal annual installments beginning on March 15, 2021 based on attainment of specified return on equity performance metrics, subject to continued employment, with the remaining fifty percent vesting in five equal installments beginning on March 15, 2020 based on attainment of specified minimum stock prices, subject to continued employment.
53
These awards were granted as an inducement awards pursuant to NYSE Rule 303A.08 and in reliance on Section 4(a)(2) of the Securities Act of 1933, as amended.
Purchases of Equity Securities by the Issuer
On December 19, 2018, the Company's board of directors authorized a share repurchase program of up to $150 of the Company's outstanding common stock. This program will expire on December 15, 2020, and may be modified at any time. Under the share repurchase program, the Company may repurchase shares from time to time in open market transactions or through privately negotiated transactions in accordance with applicable federal securities laws. Repurchases may also be made pursuant to a trading plan under Rule 10b5-1 of the Securities Exchange Act of 1934. The extent to which the Company repurchases its shares, and the timing of such purchases, will depend upon a variety of factors, including market conditions, regulatory requirements and other considerations, as determined by the Company.
The following table provides information about our repurchases of our ordinary shares during the quarter ended December 31, 2019:
|
Total number of shares purchased
|
Average price paid per share
|
Total number of shares purchased as part of publicly announced plans or programs
|
Approximate dollar value of shares that may yet be purchased under the plans or programs (1)
|
||||||||||
|
Period
|
|||||||||||||
|
October 1 to October 31, 2019
|
2,030
|
|
$
|
8.34
|
|
2,030
|
|
$
|
81
|
|
|||
|
November 1 to November 30, 2019
|
—
|
|
—
|
|
—
|
|
81
|
|
|||||
|
December 1 to December 31, 2019
|
—
|
|
—
|
|
—
|
|
81
|
|
|||||
(1) On December 19, 2018, the Company’s board of directors authorized and the Company announced a share repurchase program of up to $150 million of the Company’s outstanding ordinary shares. This repurchase program will expire on December 15, 2020, and may be modified at any time.
The company's offer to exchange any and all of its outstanding warrants for 0.11 ordinary shares of the Company, par value $0.0001, and $0.98, in cash, without interest, per warrant expired on October 4, 2018. A total of 65,374 warrants were properly tendered prior to the expiration of the offer to exchange. On October 9, 2018, the Company issued an aggregate of 7,191 ordinary shares and paid $64 million in cash in exchange for the warrants tendered. After completion of the offer to exchange, 5,510 warrants remain outstanding, which will expire on November 30, 2022, or upon earlier redemption or liquidation.
54
We have prepared the following selected financial data as of and for the years ended
December 31, 2019
and
December 31, 2018
, the period from December 1, 2017 to December 31, 2017, the Predecessor period from October 1, 2017 to November 31, 2017, the Predecessor period from October 1, 2016 to December 31, 2016 (unaudited), and the Predecessor years ended September 30,
2017
, and
2016
.
As a result of the business combination ("Business Combination"), for accounting purposes, FGL Holdings is the acquirer and FGL is the acquired party and accounting predecessor. Our financial statement presentation includes the financial statements of FGL and its subsidiaries as “Predecessor” for the periods prior to the completion of the Business Combination, and FGL Holdings, including the consolidation of FGL and its subsidiaries and F&G Reinsurance Companies, for periods from and after the Closing Date. FGL Holdings is the surviving company organized and existing under the laws of the United States of America, any State of the United States, the District of Columbia or any territory thereof (and in the case of the Company, Bermuda or the Cayman Islands). Prior to the Business Combination, FGL Holdings reported under a fiscal year end of December 31 and the Predecessor companies reported under a fiscal year end of September 30. Subsequent to the Business Combination, FGL Holdings reports under a fiscal year end of December 31.
|
FGL Holdings
|
Fidelity & Guaranty Life
|
|||||||||||||||
|
Year ended
|
Period from December 1 to December 31, 2017
|
Period from October 1 to November 30, 2017
|
||||||||||||||
|
(In millions, except share data)
|
December 31, 2019
|
December 31, 2018
|
||||||||||||||
|
Predecessor
|
||||||||||||||||
|
SUMMARY OF OPERATIONS
|
||||||||||||||||
|
Total operating revenues
|
$
|
2,113
|
|
$
|
711
|
|
$
|
165
|
|
$
|
362
|
|
||||
|
Total benefits and expenses
|
1,513
|
|
653
|
|
144
|
|
314
|
|
||||||||
|
Net income (loss)
|
$
|
507
|
|
$
|
13
|
|
$
|
(91
|
)
|
$
|
28
|
|
||||
|
PER SHARE DATA
|
||||||||||||||||
|
Net income per common share - basic
|
$
|
2.19
|
|
$
|
(0.07
|
)
|
$
|
(0.44
|
)
|
$
|
0.48
|
|
||||
|
Net income per common share - diluted
|
$
|
2.19
|
|
$
|
(0.07
|
)
|
$
|
(0.44
|
)
|
$
|
0.47
|
|
||||
|
Cash dividends declared per common share
|
$
|
0.04
|
|
$
|
—
|
|
$
|
—
|
|
$
|
0.065
|
|
||||
|
Common shares outstanding (includes treasury shares of 8.7
and 0.6 for the years ended December 31, 2019 and December 31, 2018 respectively)
|
221.8
|
|
221.1
|
|
214.4
|
|
59.0
|
|
||||||||
|
BALANCE SHEET DATA
|
||||||||||||||||
|
Total investments
|
$
|
27,954
|
|
$
|
23,917
|
|
$
|
23,604
|
|
$
|
23,326
|
|
||||
|
Total assets
|
36,714
|
|
30,945
|
|
29,923
|
|
29,227
|
|
||||||||
|
Total debt
|
542
|
|
541
|
|
412
|
|
405
|
|
||||||||
|
Total liabilities
|
33,971
|
|
30,055
|
|
27,960
|
|
26,943
|
|
||||||||
|
Total equity
|
2,743
|
|
890
|
|
1,963
|
|
2,284
|
|
||||||||
|
Total equity excluding AOCI
|
2,262
|
|
1,827
|
|
1,888
|
|
1,729
|
|
||||||||
55
|
Fidelity & Guaranty Life
|
|||||||||||||
|
Period from October 1 to December 31, 2016 (Unaudited)
|
Year ended
|
||||||||||||
|
(In millions, except share data)
|
September 30, 2017
|
September 30, 2016
|
|||||||||||
|
Predecessor
|
Predecessor
|
Predecessor
|
|||||||||||
|
SUMMARY OF OPERATIONS
|
|||||||||||||
|
Total operating revenues
|
$
|
340
|
|
$
|
1,530
|
|
$
|
1,139
|
|
||||
|
Total benefits and expenses
|
171
|
|
1,173
|
|
964
|
|
|||||||
|
Net income
|
$
|
108
|
|
$
|
223
|
|
$
|
97
|
|
||||
|
PER SHARE DATA
|
|||||||||||||
|
Net income per common share - basic
|
$
|
1.85
|
|
$
|
3.83
|
|
$
|
1.67
|
|
||||
|
Net income per common share - diluted
|
$
|
1.85
|
|
$
|
3.83
|
|
$
|
1.66
|
|
||||
|
Cash dividends declared per common share
|
$
|
0.065
|
|
$
|
0.26
|
|
$
|
0.26
|
|
||||
|
Common shares outstanding
|
59.0
|
|
58.9
|
|
59.0
|
|
|||||||
|
BALANCE SHEET DATA
|
|||||||||||||
|
Total investments
|
$
|
21,076
|
|
$
|
23,072
|
|
$
|
21,025
|
|
||||
|
Total assets
|
26,952
|
|
28,965
|
|
27,035
|
|
|||||||
|
Total debt
|
400
|
|
405
|
|
400
|
|
|||||||
|
Total liabilities
|
25,200
|
|
26,718
|
|
25,101
|
|
|||||||
|
Total equity
|
1,752
|
|
2,247
|
|
1,934
|
|
|||||||
|
Total equity excluding AOCI
|
1,599
|
|
1,704
|
|
1,495
|
|
|||||||
56
Item 7.
Management’s Discussion and Analysis of Financial Condition and Results of Operations
Introduction
This “Management’s Discussion and Analysis of Financial Condition and Results of Operations” of FGL Holdings (“FGL Holdings,” “we,” “us,” “our” and, collectively with its subsidiaries, the “Company”) should be read in conjunction with “Item 6. Selected Financial Data,” and our accompanying consolidated financial statements and related notes (the “Consolidated Financial Statements”) referred to in “Item 8. Financial Statements and Supplementary Data” of this Annual Report on Form 10-K (the “Form 10-K”). Certain statements we make under this Item 7 constitute “forward-looking statements” under the Private Securities Litigation Reform Act of 1995. See “Forward-Looking Statements” at the beginning of Part I of this Form 10-K. You should consider our forward-looking statements in light of our Consolidated Financial Statements, related notes, and other financial information appearing elsewhere in this Form 10-K and our other filings with the SEC.
Basis of Presentation
As a result of the completion of the Business Combination on November 30, 2017, our Consolidated Financial Statements included elsewhere in the Annual Report are presented: (i) as of December 31, 2019 and for the year ended December 31, 2019; (ii) as of December 31, 2018 and the year ended December 31, 2018; (iii) for the period December 1, 2017 to December 31, 2017; (iv) for the period October 1, 2017 to November 30, 2017 (Predecessor); (v) for the unaudited period October 1, 2016 to December 31, 2016 (Predecessor); and (vi) for the year ended September 30, 2017 (Predecessor). In this Management’s Discussion and Analysis of Financial Condition and Results of Operations, we present the Predecessor’s year ended September 30, 2017 results. We believe this discussion provides helpful information with respect to performance of our business during those respective periods. In Management’s Discussion and Analysis of Financial Condition and Results of Operations included within this Form 10-K, we discuss consolidated financial results for the year ended December 31, 2019 compared to the year ended December 31, 2018. Discussion for the period December 1, 2017 to December 31, 2017, the period October 1, 2017 to November 30, 2017 (Predecessor), the unaudited period October 1, 2016 to December 31, 2016 (Predecessor), and the year ended September 30, 2017 (Predecessor) is included within our Annual Report on Form 10-K for the year ended December 31, 2018.
Overview
See “Item 1. Business” for a detailed discussion of FGL Holdings company overview, strategy and products, as well as the February 7, 2020 announcement of an agreement to be acquired by Fidelity National Financial, Inc.
Trends and Uncertainties
The following factors represent some of the key trends and uncertainties that have influenced the development of our business and our historical financial performance and that we believe will continue to influence our business and financial performance in the future.
Market Conditions
Market volatility has affected and may continue to affect our business and financial performance in varying ways. Volatility can pressure sales and reduce demand as consumers hesitate to make financial decisions. To enhance the attractiveness and profitability of our products and services, we continually monitor the behavior of our customers, as evidenced by annuitization rates and lapse rates, which vary in response to changes in market conditions.
Interest Rate Environment
Some of our products include guaranteed minimum crediting rates, most notably our fixed rate annuities. As of
December 31, 2019
, the Company's reserves, net of reinsurance, and average crediting rate on our fixed rate annuities were
$4
billion and
3%
, respectively. We are required to pay the guaranteed minimum crediting rates even if earnings on our investment portfolio decline, which would negatively impact earnings. In addition, we expect more policyholders to hold policies with comparatively high guaranteed rates for a longer period in a low interest rate environment. Conversely, a rise in average yield on our investment portfolio would increase earnings if the average interest rate we pay on our products does not rise correspondingly. Similarly, we expect that policyholders would be less likely to hold policies with existing guarantees as interest rates rise and the relative value of other new business offerings are increased, which would negatively impact our earnings and cash flows.
57
See “Item 7A. Quantitative and Qualitative Disclosures about Market Risk” for a more detailed discussion of interest rate risk.
Aging of the U.S. Population
We believe that the aging of the U.S. population will increase the demand for our products. As the “baby boomer” generation prepares for retirement, we believe that demand for retirement savings, growth, and income products will grow. The impact of this growth may be offset to some extent by asset outflows as an increasing percentage of the population begins withdrawing assets to convert their savings into income.
Industry Factors and Trends Affecting Our Results of Operations
Demographics and macroeconomic factors are increasing the demand for our FIA and IUL products. Over 10,000 people will turn 65 each day in the United States over the next 15 years, and according to the U.S. Census Bureau, the proportion of the U.S. population over the age of 65 is expected to grow from
15%
in 2015 to
20%
in 2030.
We operate in the sector of the insurance industry that focuses on the needs of middle-income Americans. The underserved middle-income market represents a major growth opportunity for the Company. As a tool for addressing the unmet need for retirement planning, we believe that many middle-income Americans have grown to appreciate the “sleep at night protection” that annuities such as our FIA products afford. Accordingly, the FIA market grew from nearly
$12 billion
of sales in 2002 to
$68 billion
of sales in 2018. Additionally, this market demand has positively impacted the IUL market as it has expanded from
$100 million
of annual premiums in 2002 to
$2 billion
of annual premiums in 2018.
Competition
Please refer to the section titled "Competition" in Item 1. Business for discussion on our competition.
Annuity and Life Sales
We regularly monitor and report the production volume metric titled “Sales”.
Sales are not derived from any specific GAAP income statement accounts or line items and should not be viewed as a substitute for any financial measure determined in accordance with GAAP. Annuity and IUL sales are recorded as deposit liabilities (i.e. contractholder funds) within the Company's consolidated financial statements in accordance with GAAP. Management believes that presentation of sales, as measured for management purposes, enhances the understanding of our business and helps depict longer term trends that may not be apparent in the results of operations due to the timing of sales and revenue recognition.
Sales of annuities and IULs were as follows:
|
|
Annuity Sales
|
IUL Sales
|
|||||||||||||||||||||
|
(Dollars in millions)
|
2019
|
2018
|
2017
|
2019
|
2018
|
2017
|
|||||||||||||||||
|
First Quarter
|
$
|
1,053
|
|
$
|
778
|
|
$
|
732
|
|
$
|
8
|
|
$
|
6
|
|
$
|
14
|
|
|||||
|
Second Quarter
|
1,122
|
|
769
|
|
582
|
|
10
|
|
7
|
|
9
|
|
|||||||||||
|
Third Quarter
|
797
|
|
842
|
|
588
|
|
9
|
|
7
|
|
6
|
|
|||||||||||
|
Fourth Quarter
|
921
|
|
957
|
|
623
|
|
11
|
|
8
|
|
7
|
|
|||||||||||
|
Total
|
$
|
3,893
|
|
$
|
3,346
|
|
$
|
2,525
|
|
$
|
38
|
|
$
|
28
|
|
$
|
36
|
|
|||||
58
Key Components of Our Historical Results of Operations
Under U.S. GAAP, premium collections for fixed indexed annuities, fixed rate annuities, and immediate annuities without life contingency are reported in the financial statements as deposit liabilities (i.e., contractholder funds) instead of as sales or revenues. Similarly, cash payments to customers are reported as decreases in the liability for contractholder funds and not as expenses. Sources of revenues for products accounted for as deposit liabilities are net investment income; surrender, cost of insurance, and other charges deducted from contractholder funds; and net realized gains (losses) on investments. Components of expenses for products accounted for as deposit liabilities are interest-sensitive and index product benefits (primarily interest credited to account balances or the cost of providing index credits to the policyholder), amortization of deferred acquisition cost (“DAC”), deferred sales inducements ("DSI"), and value of business acquired (“VOBA”), other operating costs and expenses, and income taxes.
Through our insurance subsidiaries, we issue a broad portfolio of deferred annuities (fixed indexed and fixed rate annuities) and immediate annuities. A deferred annuity is a type of contract that accumulates value on a tax deferred basis and typically begins making specified periodic or lump sum payments a certain number of years after the contract has been issued. An immediate annuity is a type of contract that begins making specified payments within one annuity period (e.g., one month or one year) and typically makes payments of principal and interest earnings over a period of time.
The Company hedges certain portions of its exposure to product related equity market risk by entering into derivative transactions. We purchase derivatives consisting predominantly of call options and, to a lesser degree, futures contracts on the equity indices underlying the applicable policy. These derivatives are used to offset the statutory reserve impact of the index credits due to policyholders under the FIA contracts. The majority of all such call options are one-year options purchased to match the funding requirements underlying the FIA contracts. We attempt to manage the cost of these purchases through the terms of our FIA contracts, which permit us to change caps, spread, or participation rates, subject to certain guaranteed minimums, on each contracts anniversary date. The call options and futures contracts are marked to fair value with the change in fair value included as a component of net investment gains (losses). The change in fair value of the call options and futures contracts includes the gains and losses recognized at the expiration of the instruments’ terms or upon early termination and the changes in fair value of open positions.
Earnings from products accounted for as deposit liabilities are primarily generated from
the excess of net investment income earned over the sum of interest credited to policyholders and the cost of hedging our risk on FIA policies
, known as the net investment spread. With respect to FIAs, the cost of hedging our risk includes the expenses incurred to fund the index credits. Proceeds received upon expiration or early termination of call options purchased to fund annual index credits are recorded as part of the change in fair value of derivatives, and are largely offset by an expense for index credits earned on annuity contractholder fund balances.
Our profitability depends in large part upon the amount of assets under management (“AUM”), the net investment spreads earned on our AUM, our ability to manage our operating expenses and the costs of acquiring new business (principally commissions to agents and bonuses credited to policyholders). As we grow AUM, earnings generally increase. AUM increases when cash inflows, which include sales, exceed cash outflows. Managing net investment spreads involves the ability to maximize returns on our AUM and minimize risks such as interest rate changes and defaults or impairment of investments. It also includes our ability to manage interest rates credited to policyholders and costs of the options and futures purchased to fund the annual index credits on the FIAs or IULs. We analyze returns on average assets under management ("AAUM") pre- and post-DAC, DSI, and VOBA as well as pre- and post-tax to measure our profitability in terms of growth and improved earnings.
Non-GAAP Financial Measures
Management believes that certain non-GAAP financial measures may be useful in certain instances to provide additional meaningful comparisons between current results and results in prior operating periods. Our non-GAAP measures may not be comparable to similarly titled measures of other organizations because other organizations may not calculate such non-GAAP measures in the same manner as we do. Reconciliations of such measures to the most comparable GAAP measures are included herein.
Adjusted Operating Income ("AOI")
is a non-GAAP economic measure we use to evaluate financial performance each period. AOI is calculated by adjusting net income (loss) to eliminate:
59
(i) the impact of net investment gains/losses, including other than temporary impairment ("OTTI") losses recognized in operations, but excluding realized gains and losses on derivatives hedging our indexed annuity policies,
(ii) the impacts related to changes in the fair values of FIA related derivatives and embedded derivatives, net of hedging cost, and the fair value accounting impacts of assumed reinsurance by our international subsidiaries,
(iii) the tax effect of affiliated reinsurance embedded derivative,
(iv) the effect of change in fair value of the reinsurance related embedded derivative,
(v) the effect of integration, merger related & other non-operating items,
(vi) impact of extinguishment of debt, and
(vii) net impact from Tax Cuts and Jobs Act.
Adjustments to AOI are net of the corresponding impact on amortization of intangibles, as appropriate. The income tax impact related to these adjustments is measured using an effective tax rate, as appropriate by tax jurisdiction. While these adjustments are an integral part of the overall performance of the Company, market conditions and/or the non-operating nature of these items can overshadow the underlying performance of the core business. Accordingly, management considers this to be a useful measure internally and to investors and analysts in analyzing the trends of our operations.
Beginning with the quarter ended March 31, 2018, the Company updated its AOI definition to remove the residual impacts of fair value accounting on its FIA products, including gains and losses on derivatives hedging those policies. Management believes the revised measure enhances the understanding of the business post-merger and is more useful and relevant to investors as compared to the previous definition which eliminated only the effects of changes in the interest rates used to discount the FIA embedded derivative. Periods shown prior to March 31, 2018 have not been adjusted to reflect the new definition.
Beginning with the quarter ended December 31, 2018, the Company updated its AOI definition to remove the incremental change due to the impact of the fair value accounting election for international subsidiaries. Management believes this revision will enhance the understanding of our business as the Company executes its growth strategy through international third party assumed business and is more relevant to investors as the impact of fair value accounting election can create an increase/decrease in the assumed liabilities that does not match the increase/decrease of the corresponding assets. This change will be applied on a prospective basis as the Company executes its growth strategy through international third party assumed reinsurance.
AOI should not be used as a substitute for net income. However, we believe the adjustments made to net income in order to derive AOI provide an understanding of our overall results of operations. For example, we could have strong operating results in a given period, yet report net income that is materially less, if during such period the fair value of our derivative assets hedging the FIA index credit obligations decreased due to general equity market conditions but the embedded derivative liability related to the index credit obligation did not decrease in the same proportion as the derivative assets because of non-equity market factors such as interest rate movements. Similarly, we could also have poor operating results in a given period yet show net income that is materially greater, if during such period the fair value of the derivative assets increases but the embedded derivative liability did not increase in the same proportion as the derivative assets. We hedge our FIA index credits with a combination of static and dynamic strategies, which can result in earnings volatility, the effects of which are generally likely to reverse over time. Our management and board of directors review AOI and net income as part of their examination of our overall financial results. However, these examples illustrate the significant impact derivative and embedded derivative movements can have on our net income. Accordingly, our management and board of directors perform a review and analysis of these items, as part of their review of our hedging results each period.
The adjustments to net income are net of intangibles amortization, as appropriate. Amounts attributable to the fair value accounting for derivatives hedging the FIA index credits and the related embedded derivative liability fluctuate from period to period based upon changes in the fair values of call options purchased to fund the annual index credits for FIAs, changes in the interest rates used to discount the embedded derivative liability, and the fair value assumptions reflected in the embedded derivative liability. The accounting standards for fair value measurement require the discount rates used in the calculation of the embedded derivative liability to be based on risk-free interest rates as of the reporting date. The impact of the change in fair values of FIA related derivatives, embedded derivatives and hedging costs has been removed from net income in calculating AOI.
60
AAUM is a non-GAAP measure we use to assess the rate of return on assets available for reinvestment.
AAUM is calculated as the sum of:
(i) total invested assets at amortized cost, excluding derivatives;
(ii) related party loans and investments;
(iii) accrued investment income;
(iv) funds withheld at fair value;
(v) the net payable/receivable for the purchase/sale of investments, and
(iv) cash and cash equivalents, excluding derivative collateral, at the beginning of the period and the end of each month in the period, divided by the total number of months in the period plus one.
Management considers this non-GAAP financial measure to be useful internally and to investors and analysts when assessing the rate of return on assets available for reinvestment.
Critical Accounting Policies and Estimates
General
The preparation of financial statements in conformity with GAAP requires management to make estimates and judgments that affect the reported amounts of certain assets and liabilities and disclosure of contingent assets and liabilities at the date of the financial statements and the reported amounts of revenues and expenses during the reporting period. Critical estimates and assumptions are evaluated on an ongoing basis based on historical developments, market conditions, industry trends and other information that is reasonable under the circumstances. There can be no assurance that actual results will conform to estimates and assumptions and that reported results of operations will not be materially affected by the need to make future accounting adjustments to reflect changes in these estimates and assumptions from time to time.
We have identified the following accounting policies and estimates as critical as they involve a higher degree of judgment and are subject to a significant degree of variability: valuation of available-for sale ("AFS") securities and derivatives, evaluation of OTTI, amortization of DAC, DSI and VOBA, reserves for future policy benefits and product guarantees and recognition of deferred income tax valuation allowances.
In developing these accounting estimates and policies, we make subjective and complex judgments that are inherently uncertain and subject to material changes as facts and circumstances develop. Although variability is inherent in these estimates, we believe the amounts provided are appropriate based upon the facts available upon preparation of our audited consolidated financial statements. We continually update and assess the facts and circumstances regarding all of these critical accounting matters and other significant accounting matters affecting estimates in our financial statements.
The above critical accounting estimates are also described in "Note 2. Significant Accounting Policies and Practices" to our audited
consolidated financial statements
.
Valuation of AFS Securities, Derivatives and Fund withheld for reinsurance receivables
Our fixed maturity securities classified as AFS are reported at fair value, with unrealized gains and losses included within accumulated other comprehensive income (loss) ("AOCI"), net of associated impact on intangibles adjustments and deferred income taxes. Our equity securities are reported at fair value, with unrealized gains and losses included within net income (loss). Unrealized gains and losses represent the difference between the cost or amortized cost basis and the fair value of these investments. We measure the fair value of our AFS securities based on assumptions used by market participants, which may include inherent risk and restrictions on the sale or use of an asset. The estimate of fair value is the price that would be received to sell an asset in an orderly transaction between market participants (“exit price”) in the principal market, or the most advantageous market in the absence of a principal market, for that asset or liability. We utilize independent pricing services in estimating the fair values of AFS securities. The independent pricing services incorporate a variety of observable market data in their valuation techniques, including: reported trading prices, benchmark yields, broker-dealer quotes, benchmark securities, bids and offers, credit ratings, relative credit information and other reference data.
F&G Re and FSRC have elected to apply the fair value option to account for its funds withheld receivables. F&G Re and FSRC measure fair value of the funds withheld receivables based on the fair values of the securities in the underlying funds withheld portfolio held by the cedant. The valuation of AFS securities by F&G Re and FSRC follows the same process as the Company, as outlined above.
61
We categorize our AFS securities into a three-level hierarchy based on the priority of the inputs to the valuation technique. The fair value hierarchy gives the highest priority to quoted prices in active markets for identical assets (Level 1) and the lowest priority to unobservable inputs (Level 3). If the inputs used to measure fair value fall within different levels of the hierarchy, the category level is based on the lowest priority level input that is significant to the fair value measurement of the instrument. The following table presents the fair value of fixed maturity securities and equity securities by pricing source and hierarchy level as of
December 31, 2019
and
December 31, 2018
.
|
As of December 31, 2019
|
||||||||||||||||
|
(Dollars in millions)
|
Quoted Prices in
Active Markets for Identical Assets (Level 1) |
Significant
Observable Inputs (Level 2) |
Significant
Unobservable Inputs (Level 3) |
Total
|
||||||||||||
|
Fixed maturity securities available-for-sale and equity securities:
|
||||||||||||||||
|
Prices via third party pricing services
|
$
|
714
|
|
$
|
21,250
|
|
$
|
1,043
|
|
$
|
23,007
|
|
||||
|
Priced via independent broker quotations
|
—
|
|
—
|
|
1,720
|
|
1,720
|
|
||||||||
|
Priced via other methods
|
—
|
|
—
|
|
1
|
|
1
|
|
||||||||
|
Total
|
$
|
714
|
|
$
|
21,250
|
|
$
|
2,764
|
|
$
|
24,728
|
|
||||
|
Available-for-sale embedded derivative:
|
||||||||||||||||
|
Priced via other methods
|
—
|
|
—
|
|
21
|
|
21
|
|
||||||||
|
Total
|
$
|
714
|
|
$
|
21,250
|
|
$
|
2,785
|
|
$
|
24,749
|
|
||||
|
% of Total
|
3
|
%
|
86
|
%
|
11
|
%
|
100
|
%
|
||||||||
|
As of December 31, 2018
|
||||||||||||||||
|
(Dollars in millions)
|
Quoted Prices in
Active Markets for Identical Assets (Level 1) |
Significant
Observable Inputs (Level 2) |
Significant
Unobservable Inputs (Level 3) |
Total
|
||||||||||||
|
Fixed maturity securities available-for-sale and equity securities:
|
||||||||||||||||
|
Prices via third party pricing services
|
$
|
833
|
|
$
|
19,185
|
|
$
|
15
|
|
$
|
20,033
|
|
||||
|
Priced via independent broker quotations
|
—
|
|
—
|
|
1,692
|
|
1,692
|
|
||||||||
|
Priced via other methods
|
—
|
|
—
|
|
716
|
|
716
|
|
||||||||
|
Total
|
$
|
833
|
|
$
|
19,185
|
|
$
|
2,423
|
|
$
|
22,441
|
|
||||
|
Available-for-sale embedded derivative:
|
||||||||||||||||
|
Priced via other methods
|
—
|
|
—
|
|
14
|
|
14
|
|
||||||||
|
Total
|
$
|
833
|
|
$
|
19,185
|
|
$
|
2,437
|
|
$
|
22,455
|
|
||||
|
% of Total
|
4
|
%
|
85
|
%
|
10
|
%
|
99
|
%
|
||||||||
Management’s assessment of all available data when determining fair value of the AFS securities is necessary to appropriately apply fair value accounting. The independent pricing services also take into account perceived market movements and sector news, as well as a security’s terms and conditions, including any features specific to that issue that may influence risk and marketability. Depending on the security, the priority of the use of observable market inputs may change as some observable market inputs may not be relevant or additional inputs may be necessary. We generally obtain one value from our primary external pricing service. In situations where a price is not available from the independent pricing service, we may obtain broker quotes or prices from additional parties recognized to be market participants. We believe the broker quotes are prices at which trades could be executed based on historical trades executed at broker-quoted or slightly higher prices. When quoted prices in active markets are not available, the determination of estimated fair value is based on market standard valuation methodologies, including discounted cash flows, matrix pricing, or other similar techniques.
62
We validate external valuations at least quarterly through a combination of procedures that include the evaluation of methodologies used by the pricing services, comparisons to valuations from other independent pricing services, analytical reviews and performance analysis of the prices against trends, and maintenance of a securities watch list. See “Note 4. Investments” and “Note 6. Fair Value of Financial Instruments” to our audited
consolidated financial statements
for a more complete discussion.
The fair value of derivative assets and liabilities is based upon valuation pricing models and represents what we would expect to receive or pay at the balance sheet date if we canceled the options, entered into offsetting positions, or exercised the options. Fair values for these instruments are determined internally using a conventional model and market observable inputs, including interest rates, yield curve volatilities and other factors. Credit risk related to the counterparty is considered when estimating the fair values of these derivatives. However, we are largely protected by collateral arrangements with counterparties when individual counterparty exposures exceed certain thresholds. The fair value of futures contracts at the balance sheet date represents the cumulative unsettled variation margin (open trade equity net of cash settlements). The fair values of the embedded derivatives in our FIA contracts are derived using market value of options, use of current and budgeted option cost, swap rates, mortality rates, surrender rates and non-performance spread and are classified as Level 3. The discount rate used to determine the fair value of our FIA embedded derivative liabilities includes an adjustment to reflect the risk that these obligations will not be fulfilled (“non-performance risk”). For the years ended
December 31, 2019
and December 31, 2018, our non-performance risk adjustment was based on the expected loss due to default in debt obligations for similarly rated financial companies. See "Note 5. Derivative Financial Instruments” and "Note 6. Fair Value of Financial Instruments” to our audited
consolidated financial statements
for a more complete discussion.
As discussed in “Item 1. Business”, FGL Insurance entered into a reinsurance agreement with Kubera effective December 31, 2018, to cede certain MYGA and deferred annuity statutory reserve on a coinsurance funds withheld basis, net of applicable existing reinsurance. This arrangement creates an obligation for FGL Insurance to pay Kubera at a later date, which results in an embedded derivative. This embedded derivative is considered a total return swap with contractual returns that are attributable to the assets and liabilities associated with this reinsurance arrangement. The fair value of the total return swap is based on the change in fair value of the underlying assets held in the funds withheld portfolio. Investment results for the assets that support the coinsurance with funds withheld reinsurance arrangement, including gains and losses from sales, were passed directly to the reinsurer pursuant to contractual terms of the reinsurance arrangement. The reinsurance related embedded derivative is reported in “Other assets” if in a net gain position, or “Other liabilities”, if in a net loss position, on the
Consolidated Balance Sheets
and the related gains or losses are reported in “Net investment gains (losses)” on the
Consolidated Statements of Operations
.
Evaluation of OTTI
We have a policy and process in place to evaluate securities and mortgage loans in our investment portfolio quarterly to assess whether there has been an OTTI. This evaluation process entails considerable judgment and estimation and involves monitoring market events and other items that could impact issuers. See "Note 2. Significant Accounting Policies and Practices" and "Note 4. Investments" to our audited
consolidated financial statements
for a more complete discussion over the Company's OTTI policy.
Intangibles
Acquisition costs that are incremental, direct costs of successful contract acquisition are capitalized as DAC. DAC consists principally of commissions. Indirect or unsuccessful acquisition costs, maintenance, product development and overhead expenses are charged to expense as incurred. DSI consists of contract enhancements such as premium and interest bonuses credited to policyholder account balances.
VOBA is an intangible asset that reflects the amount recorded as insurance contract liabilities less the estimated fair value of in-force contracts in a life insurance company acquisition. It represents the portion of the purchase price that is allocated to the value of the rights to receive future cash flows from the business in force at the acquisition date.
DAC, DSI, and VOBA are subject to loss recognition testing on a quarterly basis or when an event occurs that may warrant loss recognition.
For annuity products and IUL, DAC, DSI and VOBA are being amortized in proportion to estimated gross profits from net investment spread margins, surrender charges and other product fees, policy benefits, maintenance expenses, mortality net of reinsurance ceded and expense margins, and recognized gains and losses on investments. Current and future period gross profits for FIA contracts also include the impact of amounts recorded for the change in fair value of derivatives and the change in fair value of embedded derivatives. At each valuation date, the most
63
recent quarter’s estimated gross profits are updated with actual gross profits and the assumptions underlying future estimated gross profits are evaluated for continued reasonableness. If the update of assumptions causes estimated gross profits to increase, DAC, DSI and VOBA amortization will decrease, resulting in lower amortization expense in the period. The opposite result occurs when the assumption update causes estimated gross profits to decrease. Current period amortization is adjusted retrospectively through an unlocking process when estimates of current or future gross profits (including the impact of recognized investment gains and losses) to be realized from a group of products are revised. Our estimates of future gross profits are based on actuarial assumptions related to the underlying policies’ terms, lives of the policies, duration of contract, yield on investments supporting the liabilities, cost to find policy obligations, and level of expenses necessary to maintain the polices over their entire lives.
Changes in assumptions can have a significant impact on DAC, DSI and VOBA, amortization rates and results of operations. Assumptions are management’s best estimate of future outcomes, and require considerable judgment. We periodically review assumptions against actual experience, and update our assumptions based on historical results and our best estimates of future experience when additional information becomes available.
Estimated future gross profits are sensitive to changes in interest rates, which are the most significant component of gross profits. Assumptions related to interest rate spreads and credit losses also impact estimated gross profits for products with credited rates. These assumptions are based on the current investment portfolio yields and credit quality, estimated future crediting rates, capital markets, and estimates of future interest rates and defaults. Significant assumptions also include policyholder behavior assumptions, such as surrender, lapse, and annuitization rates. We use a combination of actual and industry experience when setting and updating our policyholder behavior assumptions.
We perform sensitivity analyses to assess the impact that certain assumptions have on DAC, DSI and VOBA. The following table presents the estimated instantaneous net impact to income before income taxes of various assumption changes on our DAC, DSI and VOBA. The effects, increase or (decrease), presented are not representative of the aggregate impacts that could result if a combination of such changes to interest rates and other assumptions occurred.
|
(Dollars in millions)
|
As of December 31, 2019
|
|||
|
A change to the long-term interest rate assumption of -50 basis points
|
$
|
(26
|
)
|
|
|
A change to the long-term interest rate assumption of +50 basis points
|
21
|
|
||
|
An assumed 10% increase in surrender rate
|
(1
|
)
|
||
Assumptions regarding shifts in market factors may be overly simplistic and not indicative of actual market behavior in stress scenarios.
Lower assumed interest rates or higher assumed annuity surrender rates tend to decrease the balances of DAC, DSI and VOBA, thus decreasing income before income taxes. Higher assumed interest rates or lower assumed annuity surrender rates tend to increase the balances of DAC, DSI and VOBA, thus increasing income before income taxes.
See “Note 2. Significant Accounting Policies and Practices”, “Note 3. Significant Risks and Uncertainties” and “Note 7. Intangibles” to our audited
consolidated financial statements
for a more complete discussion.
Reserves for Future Policy Benefits and Product Guarantees
The determination of future policy benefit reserves is dependent on actuarial assumptions. The principal assumptions used to establish liabilities for future policy benefits are based on our experience. These assumptions are established at issue of the contract and include mortality, morbidity, contract full and partial surrenders, investment returns, annuitization rates and expenses. The assumptions used require considerable judgment. We review overall policyholder experience at least annually and update these assumptions when deemed necessary based on additional information that becomes available. For traditional life and immediate annuity products, assumptions used in the reserve calculation can only be changed if the reserve is deemed to be insufficient. For all other insurance products, changes in assumptions will be used to calculate reserves. These changes in assumptions will also incorporate changes in risk free rates and option market values. Changes in, or deviations from, the assumptions previously used can significantly affect our reserve levels and related results of operations.
Mortality is the incidence of death amongst policyholders triggering the payment of underlying insurance coverage by the insurer. In addition, mortality also refers to the ceasing of payments on life-contingent annuities due to the death of the annuitant. We utilize a combination of actual and industry experience when setting our mortality assumptions.
64
A surrender rate is the percentage of account value surrendered by the policyholder. A lapse rate is the percentage of account value canceled by us due to nonpayment of premiums. We make estimates of expected full and partial surrenders of our fixed annuity products. Our surrender rate experience in the years ended
December 31, 2019
and
December 31, 2018
on the fixed annuity products averaged
4%
, which is within our assumed ranges. Management’s best estimate of surrender behavior incorporates actual experience over the entire period, as we believe that, over the duration of the policies, we will experience the full range of policyholder behavior and market conditions. If actual surrender rates are significantly different from those assumed, such differences could have a significant effect on our reserve levels and related results of operations.
The assumptions used to establish the liabilities for our product guarantees require considerable judgment and are established as management’s best estimate of future outcomes. We periodically review these assumptions and, if necessary, update them based on additional information that becomes available. Changes in or deviations from the assumptions used can significantly affect our reserve levels and related results of operations.
At issue, and at each subsequent valuation, we determine the present value of the cost of the GMWB rider benefits in excess of benefits that are funded by the account value. We also calculate the expected value of the future rider charges providing for these benefits. We accumulate a reserve equal to the portion of these fees that would be required to fund the future benefits less benefits paid to date. In making these projections, a number of assumptions are made and we update these assumptions as experience emerges, and determined necessary. We have minimal experience to date on policyholder behavior for our GMWB products which we began issuing in 2008. As a result, future experience could lead to significant changes in our assumptions. If emerging experience deviates from our assumptions on GMWB utilizations, such deviations could have a significant effect on our reserve levels and related results of operations.
Our aggregate reserves for contractholder funds, future policy benefits and product guarantees on a direct and net basis as of
December 31, 2019
are summarized as follows:
|
(Dollars in millions)
|
Direct
|
Reinsurance Recoverable
|
Net
|
|||||||||
|
Fixed indexed annuities
|
$
|
18,058
|
|
$
|
—
|
|
$
|
18,058
|
|
|||
|
Fixed rate annuities
|
4,477
|
|
(892
|
)
|
3,585
|
|
||||||
|
Immediate annuities
|
3,291
|
|
(133
|
)
|
3,158
|
|
||||||
|
Universal life
|
1,633
|
|
(1,017
|
)
|
616
|
|
||||||
|
Traditional life
|
2,007
|
|
(1,171
|
)
|
836
|
|
||||||
|
Offshore reinsurance
|
1,953
|
|
—
|
|
1,953
|
|
||||||
|
Total
|
$
|
31,419
|
|
$
|
(3,213
|
)
|
$
|
28,206
|
|
|||
Certain FIA products contain an embedded derivative; a feature that permits the holder to elect an interest rate return or an equity-index linked component, where interest credited to the contract is linked to the performance of various equity indices. The FIA embedded derivative is valued at fair value and included in the liability for contractholder funds in our Consolidated Balance Sheets with changes in fair value included as a component of “Benefits and other changes in policy reserves” in our Consolidated Statements of Operations.
See “Note 2. Significant Account Policies and Practices” to our audited
consolidated financial statements
for a more complete discussion.
Deferred Income Tax Valuation Allowance
Accounting Standards Codification section 740, Income Taxes (ASC 740), provides that deferred income tax assets are recognized for deductible temporary differences and operating loss and tax credit carry-forwards. A valuation allowance is recorded if, based on available information, it is more likely than not that deferred income tax assets will not be realized. Assessing the need for, and the amount of, a valuation allowance for deferred income tax assets requires significant judgment.
Future realization of deferred tax assets ultimately depends on the existence of sufficient taxable income of the appropriate character (i.e., ordinary income or capital gain) in either the carryback or carry-forward period under tax law. The four sources of taxable income that may be considered in determining whether a valuation allowance is required are:
|
•
|
Future reversals of existing taxable temporary differences (i.e., offset of gross deferred tax assets against gross deferred tax liabilities);
|
|
•
|
Taxable income in prior carryback years, if carryback is permitted under tax law;
|
65
|
•
|
Tax planning strategies; and
|
|
•
|
Future taxable income exclusive of reversing temporary differences and carry-forwards.
|
At each reporting date, management considers evidence that could impact the future realization of deferred tax assets. As of
December 31, 2019
, management gathered the following evidence concerning the future realization of deferred tax assets:
Positive Evidence:
|
•
|
As of
December 31, 2019
, we were in a cumulative income position based on pre-tax income over the prior 12 quarters;
|
|
•
|
We are projecting pre-tax GAAP income from continuing operations or we have tax planning opportunities in which to affect realization;
|
|
•
|
We have a history of utilizing all significant tax attributes before they expire;
|
|
•
|
For U.S. Life Companies, under new tax laws, net operating losses generated after December 31, 2017 can be carried forward indefinitely; and
|
|
•
|
We have net unrealized capital gains as of December 31, 2019.
|
Negative Evidence:
|
•
|
§382 limited carry-forwards reduce our ability to utilize tax attributes in future years; and
|
|
•
|
Brief carryback/carry-forward period for capital losses.
|
Based on management’s evaluation of the above positive and negative evidence, management concluded that a valuation allowance continues to be necessary for the deferred tax assets of the non-life insurance companies and FSRC capital deferred tax assets at
December 31, 2019
. Management also concluded that a valuation allowance is no longer needed for US life insurance companies, as they do not have unrealized deferred tax assets, and for FSRC ordinary deferred tax assets. For the year ended
December 31, 2019
, the valuation allowance release recorded to the income statement related to the items above was
$39
.
Recent Accounting Pronouncements
Please refer to "Note 2. Significant Accounting Policies and Practices" to our audited
consolidated financial statements
for disclosure of recent accounting pronouncements.
66
Results of Operations
(
All amounts presented in millions unless otherwise noted
)
The following table sets forth the consolidated results of operations for the periods presented:
|
Year ended
|
Year ended
|
|||||||||||||||||||||||
|
December 31, 2019
|
December 31,
2018 |
Period from December 1 to December 31, 2017
|
Period from October 1 to November 30, 2017
|
Period from October 1 to December 31, 2016 (Unaudited)
|
September 30, 2017
|
|||||||||||||||||||
|
Predecessor
|
Predecessor
|
Predecessor
|
||||||||||||||||||||||
|
Revenues:
|
||||||||||||||||||||||||
|
Premiums
|
$
|
40
|
|
$
|
54
|
|
$
|
3
|
|
$
|
7
|
|
$
|
11
|
|
$
|
42
|
|
||||||
|
Net investment income
|
1,229
|
|
1,107
|
|
92
|
|
174
|
|
240
|
|
1,005
|
|
||||||||||||
|
Net investment gains (losses)
|
674
|
|
(629
|
)
|
42
|
|
146
|
|
51
|
|
316
|
|
||||||||||||
|
Insurance and investment product fees and other
|
170
|
|
179
|
|
28
|
|
35
|
|
38
|
|
167
|
|
||||||||||||
|
Total revenues
|
2,113
|
|
711
|
|
165
|
|
362
|
|
340
|
|
1,530
|
|
||||||||||||
|
Benefits and expenses:
|
||||||||||||||||||||||||
|
Benefits and other changes in policy reserves
|
1,057
|
|
423
|
|
124
|
|
227
|
|
20
|
|
843
|
|
||||||||||||
|
Acquisition and operating expenses, net of deferrals
|
330
|
|
181
|
|
16
|
|
51
|
|
28
|
|
137
|
|
||||||||||||
|
Amortization of intangibles
|
126
|
|
49
|
|
4
|
|
36
|
|
123
|
|
193
|
|
||||||||||||
|
Total benefits and expenses
|
1,513
|
|
653
|
|
144
|
|
314
|
|
171
|
|
1,173
|
|
||||||||||||
|
Operating income
|
600
|
|
58
|
|
21
|
|
48
|
|
169
|
|
357
|
|
||||||||||||
|
Interest expense
|
(32
|
)
|
(29
|
)
|
(2
|
)
|
(4
|
)
|
(6
|
)
|
(24
|
)
|
||||||||||||
|
Income (loss) before income taxes
|
568
|
|
29
|
|
19
|
|
44
|
|
163
|
|
333
|
|
||||||||||||
|
Income tax (expense) benefit
|
(61
|
)
|
(16
|
)
|
(110
|
)
|
(16
|
)
|
(55
|
)
|
(110
|
)
|
||||||||||||
|
Net income (loss)
|
$
|
507
|
|
$
|
13
|
|
$
|
(91
|
)
|
$
|
28
|
|
$
|
108
|
|
$
|
223
|
|
||||||
|
Less Preferred stock dividend
|
31
|
|
29
|
|
2
|
|
—
|
|
—
|
|
—
|
|
||||||||||||
|
Net income (loss) available to common shareholders
|
$
|
476
|
|
$
|
(16
|
)
|
$
|
(93
|
)
|
$
|
28
|
|
$
|
108
|
|
$
|
223
|
|
||||||
The following table summarizes sales by product type for the periods presented:
|
Year ended
|
Year ended
|
|||||||||||||||||||||||
|
December 31,
2019 |
December 31,
2018 |
Period from December 1 to December 31, 2017
|
Period from October 1 to November 30, 2017
|
Period from October 1 to December 31, 2016 (Unaudited)
|
September 30, 2017
|
|||||||||||||||||||
|
Predecessor
|
Predecessor
|
Predecessor
|
||||||||||||||||||||||
|
Fixed index annuities ("FIA")
|
$
|
2,820
|
|
$
|
2,283
|
|
$
|
175
|
|
$
|
287
|
|
$
|
551
|
|
$
|
1,868
|
|
||||||
|
Fixed rate annuities ("MYGA")
|
776
|
|
758
|
|
47
|
|
114
|
|
97
|
|
546
|
|
||||||||||||
|
Institutional spread based
|
297
|
|
305
|
|
—
|
|
—
|
|
—
|
|
136
|
|
||||||||||||
|
Total annuity
|
$
|
3,893
|
|
$
|
3,346
|
|
$
|
222
|
|
$
|
401
|
|
$
|
648
|
|
$
|
2,550
|
|
||||||
|
Index universal life ("IUL")
|
$
|
38
|
|
$
|
28
|
|
$
|
3
|
|
$
|
4
|
|
$
|
17
|
|
$
|
46
|
|
||||||
|
Flow reinsurance
|
$
|
394
|
|
$
|
185
|
|
$
|
8
|
|
$
|
—
|
|
$
|
—
|
|
$
|
—
|
|
||||||
|
•
|
FIA and MYGA sales during the years ended
December 31, 2019
and
December 31, 2018
are the result of disciplined pricing to achieve profit and capital targets. Increased FIA sales during the year ended
December 31, 2019
compared to
December 31, 2018
reflect the Company’s growth strategy.
|
|
•
|
Institutional spread based products reflect funding agreements with Federal Home Loan Bank, under an investment strategy that is as subject to fluctuation period to period.
|
67
|
•
|
The increase in flow reinsurance during the year ended
December 31, 2019
compared to
December 31, 2018
reflect F&G Re's assumed third party flow reinsurance which includes the on-boarding of F&G Re's new flow reinsurance partner effective January 1, 2019.
|
Revenues
Premiums
Premiums primarily reflect insurance premiums for traditional life insurance products which are recognized as revenue when due from the policyholder. FGL Insurance has ceded the majority of its traditional life business to unaffiliated third party reinsurers. While the base contract has been reinsured, we continue to retain the return of premium rider. The traditional life insurance premiums are primarily related to the return of premium riders on traditional life contracts. The following table summarizes premium revenue for the periods presented:
|
Year ended
|
Year ended
|
|||||||||||||||||||||||
|
December 31,
2019 |
December 31,
2018 |
Period from December 1 to December 31, 2017
|
Period from October 1 to November 30, 2017
|
Period from October 1 to December 31, 2016 (Unaudited)
|
September 30, 2017
|
|||||||||||||||||||
|
Predecessor
|
Predecessor
|
Predecessor
|
||||||||||||||||||||||
|
Traditional life insurance
|
$
|
26
|
|
$
|
30
|
|
$
|
3
|
|
$
|
6
|
|
$
|
10
|
|
$
|
27
|
|
||||||
|
Life-contingent immediate annuity
|
14
|
|
24
|
|
—
|
|
1
|
|
1
|
|
15
|
|
||||||||||||
|
Premiums
|
$
|
40
|
|
$
|
54
|
|
$
|
3
|
|
$
|
7
|
|
$
|
11
|
|
$
|
42
|
|
||||||
|
•
|
Traditional life insurance premiums for the
year ended
December 31, 2019
reflect a decrease compared to
December 31, 2018
due to the continuing maturing of the return of premium block of business.
|
|
•
|
Immediate annuity premiums for the
year ended
December 31, 2019
reflect a decrease compared to
December 31, 2018
as a result of policyholder behavior for annuitizations as well as FGL Insurance's reinsurance agreements with Kubera Insurance (SAC) Ltd. ("Kubera"), effective December 31, 2018 and June 30, 2019.
|
68
Net investment income
Below is a summary of net investment income ("NII") for the periods presented:
|
Year ended
|
Year ended
|
||||||||||||||||||||||||
|
December 31, 2019
|
December 31, 2018
|
Period from December 1 to December 31, 2017
|
Period from October 1 to November 30, 2017
|
Period from October 1 to December 31, 2016 (Unaudited)
|
September 30, 2017
|
||||||||||||||||||||
|
Predecessor
|
Predecessor
|
Predecessor
|
|||||||||||||||||||||||
|
Fixed maturity securities, available-for-sale
|
$
|
1,054
|
|
$
|
1,009
|
|
$
|
80
|
|
$
|
164
|
|
$
|
228
|
|
$
|
953
|
|
|||||||
|
Equity securities
|
73
|
|
73
|
|
6
|
|
5
|
|
10
|
|
41
|
|
|||||||||||||
|
Funds withheld
|
65
|
|
28
|
|
2
|
|
—
|
|
—
|
|
—
|
|
|||||||||||||
|
Limited partnerships
|
81
|
|
17
|
|
1
|
|
3
|
|
1
|
|
5
|
|
|||||||||||||
|
Mortgage loans, invested cash, and other investments
|
72
|
|
50
|
|
4
|
|
6
|
|
6
|
|
28
|
|
|||||||||||||
|
Gross investment income
|
1,345
|
|
1,177
|
|
93
|
|
178
|
|
245
|
|
1,027
|
|
|||||||||||||
|
Investment expense
|
(116
|
)
|
(70
|
)
|
(1
|
)
|
(4
|
)
|
(5
|
)
|
(22
|
)
|
|||||||||||||
|
Net investment income
|
$
|
1,229
|
|
$
|
1,107
|
|
$
|
92
|
|
$
|
174
|
|
$
|
240
|
|
$
|
1,005
|
|
|||||||
Our net investment spread and AAUM for the period is summarized as follows (annualized):
|
Year ended
|
Year ended
|
||||||||||||||||||||||||
|
December 31, 2019
|
December 31, 2018
|
Period from December 1 to December 31, 2017
|
Period from October 1 to November 30, 2017
|
Period from October 1 to December 31, 2016 (Unaudited)
|
September 30, 2017
|
||||||||||||||||||||
|
Predecessor
|
Predecessor
|
Predecessor
|
|||||||||||||||||||||||
|
Yield on AAUM (at amortized cost)
|
4.49
|
%
|
4.32
|
%
|
4.48
|
%
|
4.93
|
%
|
4.85
|
%
|
4.95
|
%
|
|||||||||||||
|
Less: Fixed interest credited and option cost
|
(2.26
|
)%
|
(2.37
|
)%
|
(2.47
|
)%
|
(2.49
|
)%
|
(2.56
|
)%
|
(2.53
|
)%
|
|||||||||||||
|
Net investment spread
|
2.23
|
%
|
1.95
|
%
|
2.01
|
%
|
2.44
|
%
|
2.29
|
%
|
2.42
|
%
|
|||||||||||||
|
AAUM
|
$
|
27,358
|
|
$
|
25,619
|
|
$
|
24,722
|
|
$
|
21,167
|
|
$
|
19,768
|
|
$
|
20,324
|
|
|||||||
|
•
|
The increase in AAUM from
December 31, 2018
to
December 31, 2019
is primarily the result of $2.1 billion net new business asset flows and an offshore $0.9 billion assumed third-party block reinsurance transaction, partially offset by $0.9 billion reinsurance cession to Kubera.
|
|
•
|
NII for the year ended
December 31, 2019
compared to
December 31, 2018
increased primarily as a result of portfolio reposition uplift and invested asset growth, as described above, partially offset by higher planned for asset management fees
. The volume increase period over period resulted in net investment income growth of $75, with the remaining $47 driven by an increase in rate.
|
69
Net investment gains (losses)
Below is a summary of the major components included in net investment gains (losses) for the periods presented:
|
Year ended
|
Year ended
|
||||||||||||||||||||||||
|
December 31, 2019
|
December 31, 2018
|
Period from December 1 to December 31, 2017
|
Period from October 1 to November 30, 2017
|
Period from October 1 to December 31, 2016 (Unaudited)
|
September 30, 2017
|
||||||||||||||||||||
|
Predecessor
|
|
Predecessor
|
|
Predecessor
|
|
||||||||||||||||||||
|
Net realized and unrealized gains (losses) on fixed maturity available-for-sale securities, equity securities and other invested assets
|
$
|
176
|
|
$
|
(334
|
)
|
$
|
5
|
|
$
|
6
|
|
$
|
—
|
|
$
|
(19
|
)
|
|||||||
|
Net realized and unrealized gains (losses) on certain derivatives instruments
|
434
|
|
(250
|
)
|
37
|
|
138
|
|
39
|
|
348
|
|
|||||||||||||
|
Change in fair value of funds withheld for reinsurance receivables and reinsurance related embedded derivatives (a)
|
57
|
|
(42
|
)
|
—
|
|
1
|
|
12
|
|
(16
|
)
|
|||||||||||||
|
Change in fair value of other derivatives and embedded derivatives
|
7
|
|
(3
|
)
|
—
|
|
1
|
|
—
|
|
3
|
|
|||||||||||||
|
Net investment gains (losses)
|
$
|
674
|
|
$
|
(629
|
)
|
$
|
42
|
|
$
|
146
|
|
$
|
51
|
|
$
|
316
|
|
|||||||
(a) Change in fair value of reinsurance related embedded derivatives starting December 1, 2017 and after is due to F&G Re and FSRC unaffiliated third party business under the fair value option election. Starting January 1, 2019, the balance also includes activity related to the FGL Insurance and Kubera reinsurance treaty. The predecessor periods activity is due to the FGL Insurance and FSRC reinsurance treaty.
|
•
|
Net investment gains for the
year ended
December 31, 2019
include realized gains on available-for-sale securities of
$69
primarily resulting from the execution of planned portfolio re-positioning strategies,
$127
of realized and unrealized gains on equity securities, and
$23
of impairment losses.
|
|
•
|
Net investment losses for the year ended
December 31, 2018
include realized losses on available-for-sale securities of $
160
primarily resulting from the execution of planned portfolio re-positioning strategy following the completion of the merger,
$142
of realized and unrealized losses on equity securities, and
$24
of impairment losses.
|
|
•
|
We utilize a combination of static (call options) and dynamic (long futures contracts) instruments in our hedging strategy. A substantial portion of the call options and futures contracts are based upon the S&P 500 Index with the remainder based upon other equity, bond and gold market indices. See the table below for primary drivers of gains (losses) on certain derivatives.
|
70
The components of the realized and unrealized gains (losses) on certain derivative instruments hedging our indexed annuity and universal life products are as follows for the periods presented:
|
Year ended
|
Year ended
|
||||||||||||||||||||||||
|
December 31, 2019
|
December 31, 2018
|
Period from December 1 to December 31, 2017
|
Period from October 1 to November 30, 2017
|
Period from October 1 to December 31, 2016 (Unaudited)
|
September 30, 2017
|
||||||||||||||||||||
|
Predecessor
|
|
Predecessor
|
|
Predecessor
|
|
||||||||||||||||||||
|
Call Options:
|
|||||||||||||||||||||||||
|
Gains (losses) on option expiration
|
$
|
(41
|
)
|
$
|
3
|
|
$
|
1
|
|
$
|
73
|
|
$
|
—
|
|
$
|
212
|
|
|||||||
|
Change in unrealized gains (losses)
|
445
|
|
(247
|
)
|
33
|
|
56
|
|
39
|
|
126
|
|
|||||||||||||
|
Futures contracts:
|
|||||||||||||||||||||||||
|
Gains (losses) on futures contracts expiration
|
23
|
|
(7
|
)
|
2
|
|
7
|
|
1
|
|
7
|
|
|||||||||||||
|
Change in unrealized gains (losses)
|
4
|
|
(1
|
)
|
1
|
|
2
|
|
(1
|
)
|
3
|
|
|||||||||||||
|
Foreign currency forward:
|
|||||||||||||||||||||||||
|
Gains (losses) on foreign currency forward
|
3
|
|
2
|
|
—
|
|
—
|
|
—
|
|
—
|
|
|||||||||||||
|
Total net change in fair value
|
$
|
434
|
|
$
|
(250
|
)
|
$
|
37
|
|
$
|
138
|
|
$
|
39
|
|
$
|
348
|
|
|||||||
|
Annual Point-to-Point Change in S&P 500 Index during the period
|
28
|
%
|
(6
|
)%
|
1
|
%
|
5
|
%
|
3
|
%
|
16
|
%
|
|||||||||||||
|
•
|
Realized gains and losses on certain derivative instruments are directly correlated to the performance of the indices upon which the call options and futures contracts are based and the value of the derivatives at the time of expiration compared to the value at the time of purchase. Gains (losses) on option expiration reflect the movement during the years ended
December 31, 2019
and
2018
on options settled during the respective period.
|
|
•
|
Additionally, the change in unrealized gains and losses due to fair value of call options are primarily driven by the underlying performance of the S&P 500 Index during each respective year relative to the S&P 500 Index on the policyholder buy dates.
|
The average index credits to policyholders are as follows for the periods presented:
|
Year ended
|
Year ended
|
||||||||||||||||||
|
December 31, 2019
|
December 31, 2018
|
Period from December 1 to December 31, 2017
|
Period from October 1 to November 30, 2017
|
Period from October 1 to December 31, 2016 (Unaudited)
|
September 30, 2017
|
||||||||||||||
|
Predecessor
|
Predecessor
|
Predecessor
|
|||||||||||||||||
|
Average Crediting Rate
|
2
|
%
|
4
|
%
|
6
|
%
|
6
|
%
|
2
|
%
|
4
|
%
|
|||||||
|
S&P 500 Index:
|
|||||||||||||||||||
|
Point-to-point strategy
|
3
|
%
|
4
|
%
|
4
|
%
|
4
|
%
|
4
|
%
|
4
|
%
|
|||||||
|
Monthly average strategy
|
2
|
%
|
4
|
%
|
4
|
%
|
4
|
%
|
2
|
%
|
3
|
%
|
|||||||
|
Monthly point-to-point strategy
|
—
|
%
|
4
|
%
|
10
|
%
|
10
|
%
|
1
|
%
|
4
|
%
|
|||||||
|
3 year high water mark
|
18
|
%
|
15
|
%
|
13
|
%
|
16
|
%
|
15
|
%
|
13
|
%
|
|||||||
|
•
|
Actual amounts credited to contractholder fund balances may differ from the index appreciation due to contractual features in the FIA contracts (caps, spreads and participation rates) which allow the Company to manage the cost of the options purchased to fund the annual index credits. Market volatility compared to previous years can impact index credits differently than overall S&P 500 Index appreciation.
|
|
•
|
The credits for the periods presented above were based on comparing the S&P 500 Index on each issue date in these respective periods to the same issue date in the respective prior year periods. Favorable S&P 500 Index performance at different points in these periods caused favorable changes in crediting rates for the 3 year high water mark strategy in the year ended
December 31, 2019
compared to the year ended
December 31, 2018
. Unfavorable S&P 500 Index performance at different points in the periods presented caused a decline in crediting rates in the point-to-point, monthly average, and monthly point-to-point
|
71
strategies due to lower equity returns in the year ended
December 31, 2019
compared to
December 31, 2018
.
Insurance and investment product fees and other
Insurance and investment product fees and other consists primarily of the cost of insurance on IUL policies, policy rider fees primarily on FIA policies and surrender charges assessed against policy withdrawals in excess of the policyholder's allowable penalty-free amounts (up to 10% of the prior year's value, subject to certain limitations). Below is a summary of the major components included in Insurance and investment product fees and other for the periods presented:
|
Year ended
|
Year ended
|
||||||||||||||||||||||||
|
December 31, 2019
|
December 31, 2018
|
Period from December 1 to December 31, 2017
|
Period from October 1 to November 30, 2017
|
Period from October 1 to December 31, 2016 (Unaudited)
|
September 30, 2017
|
||||||||||||||||||||
|
Predecessor
|
Predecessor
|
Predecessor
|
|||||||||||||||||||||||
|
Surrender charges
|
$
|
30
|
|
$
|
44
|
|
$
|
3
|
|
$
|
10
|
|
$
|
7
|
|
$
|
34
|
|
|||||||
|
Cost of insurance fees and other income
|
140
|
|
135
|
|
25
|
|
25
|
|
31
|
|
133
|
|
|||||||||||||
|
Total insurance and investment product fees and other
|
$
|
170
|
|
$
|
179
|
|
$
|
28
|
|
$
|
35
|
|
$
|
38
|
|
$
|
167
|
|
|||||||
|
•
|
Surrender charges were higher in the prior year, primarily due to a higher number of universal life policy surrenders.
|
|
•
|
Cost of insurance fees and other income changed year over year primarily due to the amortization of the deferred reinsurance gain established at the inception of FGL Insurance's reinsurance agreement with Kubera, effective December 31, 2018 and amended June 30, 2019, and the amortization of unearned revenue liability.
|
Benefits and expenses
Benefits and other changes in policy reserves
Below is a summary of the major components included in Benefits and other changes in policy reserves for the periods presented:
|
Year ended
|
Year ended
|
||||||||||||||||||||||||
|
December 31, 2019
|
December 31, 2018
|
Period from December 1 to December 31, 2017
|
Period from October 1 to November 30, 2017
|
Period from October 1 to December 31, 2016 (Unaudited)
|
September 30, 2017
|
||||||||||||||||||||
|
Predecessor
|
Predecessor
|
Predecessor
|
|||||||||||||||||||||||
|
FIA embedded derivative impact
|
$
|
391
|
|
$
|
(404
|
)
|
$
|
7
|
|
$
|
39
|
|
$
|
(136
|
)
|
$
|
6
|
|
|||||||
|
Index credits, interest credited & bonuses
|
477
|
|
688
|
|
28
|
|
151
|
|
112
|
|
649
|
|
|||||||||||||
|
Annuity payments
|
138
|
|
150
|
|
13
|
|
25
|
|
40
|
|
152
|
|
|||||||||||||
|
Other policy benefits and reserve movements
|
73
|
|
(12
|
)
|
71
|
|
12
|
|
4
|
|
36
|
|
|||||||||||||
|
Change in fair value of reserve liabilities held at fair value
|
(22
|
)
|
1
|
|
5
|
|
—
|
|
—
|
|
—
|
|
|||||||||||||
|
Total benefits and other changes in policy reserves
|
$
|
1,057
|
|
$
|
423
|
|
$
|
124
|
|
$
|
227
|
|
$
|
20
|
|
$
|
843
|
|
|||||||
|
•
|
The FIA embedded derivative impact on reserve changes for the periods presented above are driven by changes in the equity markets and risk free rates during the respective periods. The change in risk free rates increased the FIA embedded derivative reserves by approximately
$164
and reduced the FIA embedded derivative reserves by approximately
$36
for the years ended
December 31, 2019
and
December 31, 2018
,
respectively. Equity market movements increased reserves by
$266
and decreased reserves by
$269
for the years ended
December 31, 2019
and
December 31, 2018
,
respectively. The change in equity market also impacts the market value of the derivative assets hedging our FIA policies. See table in the net investment gains/losses discussion above for summary and discussion of net unrealized gains (losses) on certain derivative instruments.
|
72
|
•
|
Annually, the Company reviews assumptions associated with reserves for policy benefits and product guarantees. The years ended
December 31, 2019
and
December 31, 2018
included a decrease of
$13
and
$5
related to the annual surrender assumption update.
|
|
•
|
Index credits, interest credited & bonuses changed during the periods presented primarily due to changes in the amount of index credits on FIA policies reflecting the fluctuation in performance of the S&P 500 Index relative to the S&P 500 Index level on the policyholder buy dates and related changes in the options and futures which fund FIA index credits. Increased index credits, interest credited & bonuses for the years ended
December 31, 2019
and
December 31, 2018
also reflect increased sales volume for FIA products.
|
|
•
|
The change in the fair value of reserve liabilities held at fair value for the year ended
December 31, 2019
was primarily due to assumption updates on F&G Re and FSRC's assumed business.
|
Acquisition and operating expenses, net of deferrals
Below is a summary of acquisition and operating expenses, net of deferrals for the periods presented:
|
Year ended
|
Year ended
|
||||||||||||||||||||||||
|
December 31, 2019
|
December 31, 2018
|
Period from December 1 to December 31, 2017
|
Period from October 1 to November 30, 2017
|
Period from October 1 to December 31, 2016 (Unaudited)
|
September 30, 2017
|
||||||||||||||||||||
|
Predecessor
|
Predecessor
|
Predecessor
|
|||||||||||||||||||||||
|
General expenses
|
$
|
160
|
|
$
|
150
|
|
$
|
11
|
|
$
|
47
|
|
$
|
25
|
|
$
|
120
|
|
|||||||
|
Acquisition expenses
|
541
|
|
348
|
|
27
|
|
44
|
|
92
|
|
310
|
|
|||||||||||||
|
Deferred acquisition costs
|
(371
|
)
|
(317
|
)
|
(22
|
)
|
(40
|
)
|
(89
|
)
|
(293
|
)
|
|||||||||||||
|
Total acquisition and operating expenses, net of deferrals
|
$
|
330
|
|
$
|
181
|
|
$
|
16
|
|
$
|
51
|
|
$
|
28
|
|
$
|
137
|
|
|||||||
|
•
|
The increase in acquisition and operating expenses, net of deferrals, during the year ended
December 31, 2019
compared to the year ended
December 31, 2018
was primarily related to F&G Re closed block reinsurance transaction initial ceding commission (a corresponding offset is recognized in reserves under the fair value option election), ceding commissions on flow reinsurance, and project related costs, partially offset by a decrease in the preferred equity remarketing reimbursement embedded derivative liability.
|
Amortization of intangibles
Below is a summary of the major components included in amortization of intangibles for the periods presented:
|
Year ended
|
Year ended
|
||||||||||||||||||||||||
|
December 31, 2019
|
December 31, 2018
|
Period from December 1 to December 31, 2017
|
Period from October 1 to November 30, 2017
|
Period from October 1 to December 31, 2016 (Unaudited)
|
September 30, 2017
|
||||||||||||||||||||
|
Predecessor
|
Predecessor
|
Predecessor
|
|||||||||||||||||||||||
|
Amortization
|
$
|
156
|
|
$
|
64
|
|
$
|
8
|
|
$
|
56
|
|
$
|
136
|
|
$
|
280
|
|
|||||||
|
Interest
|
(35
|
)
|
(24
|
)
|
(2
|
)
|
(10
|
)
|
(13
|
)
|
(57
|
)
|
|||||||||||||
|
Unlocking
|
5
|
|
9
|
|
—
|
|
(10
|
)
|
—
|
|
(30
|
)
|
|||||||||||||
|
Total amortization of intangibles
|
$
|
126
|
|
$
|
49
|
|
$
|
6
|
|
$
|
36
|
|
$
|
123
|
|
$
|
193
|
|
|||||||
|
•
|
Amortization of intangibles is based on historical, current and future expected gross margins (pre-tax operating income before amortization). The change in amortization year over year is the result of actual gross profits ("AGPs") in each period on the DAC and VOBA lines of business ("LOBs"). The increase in amortization year over year was driven primarily by an increase in net investment gains.
|
|
•
|
Annually, the Company reviews assumptions associated with the amortization of intangibles. For the year ended December 31, 2019, this resulted in a decrease in future expected margins and an increase of $3 amortization expense reported as a component of “unlocking”. In 2018, this assumption review process resulted in an increase in future expected margins and a corresponding decrease of $2 amortization expense.
|
73
Other items affecting net income
Interest expense
The interest expense and amortization of debt issuance costs of the Company's debt for the periods presented:
|
Year ended
|
Year ended
|
||||||||||||||||||||||||
|
December 31, 2019
|
December 31, 2018
|
Period from December 1 to December 31, 2017
|
Period from October 1 to November 30, 2017
|
Period from October 1 to December 31, 2016 (Unaudited)
|
September 30, 2017
|
||||||||||||||||||||
|
Predecessor
|
Predecessor
|
Predecessor
|
|||||||||||||||||||||||
|
Debt
|
$
|
32
|
|
$
|
29
|
|
$
|
2
|
|
$
|
3
|
|
$
|
5
|
|
$
|
19
|
|
|||||||
|
Revolving credit facility
|
—
|
|
2
|
|
—
|
|
1
|
|
1
|
|
5
|
|
|||||||||||||
|
Gain on extinguishment of debt
|
—
|
|
(2
|
)
|
—
|
|
—
|
|
—
|
|
—
|
|
|||||||||||||
|
Total interest expense
|
$
|
32
|
|
$
|
29
|
|
$
|
2
|
|
$
|
4
|
|
$
|
6
|
|
$
|
24
|
|
|||||||
|
•
|
On April 20, 2018, the Company completed a debt offering of $550 aggregate principal amount of 5.50% senior notes due 2025. The Company used the net proceeds of the offering (i) to repay $135 of borrowings under its revolving credit facility and related expenses and (ii) to redeem in full and satisfy and discharge all of the outstanding $300 aggregate principal amount of FGLH's outstanding 6.375% Senior Notes due 2021.
|
|
•
|
The year ended December 31, 2018 reflects a $2 gain on extinguishment of the $300 debt, and interest on the 5.50% senior notes beginning April 20, 2018. The year ended December 31, 2019 reflects a full year of interest on the 5.50% senior notes.
|
Income tax (expense) benefit
Below is a summary of the major components included in Income tax expense for the periods presented:
|
Year ended
|
Year ended
|
||||||||||||||||||||||||
|
December 31, 2019
|
December 31, 2018
|
Period from December 1 to December 31, 2017
|
Period from October 1 to November 30, 2017
|
Period from October 1 to December 31, 2016 (Unaudited)
|
September 30, 2017
|
||||||||||||||||||||
|
Predecessor
|
Predecessor
|
Predecessor
|
|||||||||||||||||||||||
|
Income before taxes
|
$
|
568
|
|
$
|
29
|
|
$
|
19
|
|
$
|
44
|
|
$
|
163
|
|
$
|
333
|
|
|||||||
|
Income tax before valuation allowance and tax law impact
|
100
|
|
(22
|
)
|
(8
|
)
|
14
|
|
55
|
|
111
|
|
|||||||||||||
|
Change in tax law impact
|
—
|
|
—
|
|
131
|
|
—
|
|
—
|
|
—
|
|
|||||||||||||
|
Change in valuation allowance
|
(39
|
)
|
38
|
|
(13
|
)
|
2
|
|
—
|
|
(1
|
)
|
|||||||||||||
|
Income tax expense
|
$
|
61
|
|
$
|
16
|
|
$
|
110
|
|
$
|
16
|
|
$
|
55
|
|
$
|
110
|
|
|||||||
|
Effective rate
|
11
|
%
|
55
|
%
|
579
|
%
|
37
|
%
|
34
|
%
|
33
|
%
|
|||||||||||||
|
•
|
Income tax expense for the year ended
December 31, 2019
was affected by the impact of the valuation allowance release, the benefit of low taxed international income in excess of the withholdings taxes, and favorable permanent adjustments, including low income housing credits and the dividends received deduction.
|
|
•
|
Income tax expense for the year ended December 31, 2018 was affected by the impact of the valuation allowance expense, partially offset by the benefit of low taxed international income in excess of the BEAT, and favorable permanent adjustments, including low income housing credits and the dividends received deduction.
|
In assessing the recoverability of our deferred tax assets, we regularly consider the guidance outlined within Accounting Standards Codification (“ASC”) Topic 740, “Income Taxes”. The guidance requires an assessment of both positive and negative evidence in determining the realizability of deferred tax assets. See "Note 11. Income Taxes" to our audited consolidated financial statements for additional information regarding deferred tax assets and our analysis for recoverability.
74
AOI
The table below shows the adjustments made to reconcile net income to AOI and AOI available to common shareholders for the periods presented:
|
Year ended
|
Year ended
|
||||||||||||||||||||||||
|
December 31, 2019
|
December 31, 2018
|
Period from December 1 to December 31, 2017
|
Period from October 1 to November 30, 2017
|
Period from October 1 to December 31, 2016 (Unaudited)
|
September 30, 2017
|
||||||||||||||||||||
|
Predecessor
|
Predecessor
|
Predecessor
|
|||||||||||||||||||||||
|
Net income (loss)
|
$
|
507
|
|
$
|
13
|
|
$
|
(91
|
)
|
$
|
28
|
|
$
|
108
|
|
$
|
223
|
|
|||||||
|
Adjustments to arrive at AOI:
|
|||||||||||||||||||||||||
|
Effect of investment losses (gains), net of offsets (a)
|
(170
|
)
|
288
|
|
—
|
|
(6
|
)
|
(1
|
)
|
13
|
|
|||||||||||||
|
Impacts related to changes in the fair values of FIA related derivatives and embedded derivatives, net of hedging cost, and the fair value accounting impacts of assumed reinsurance by our international subsidiaries (a) (b)
|
(19
|
)
|
(25
|
)
|
(8
|
)
|
(10
|
)
|
(92
|
)
|
(95
|
)
|
|||||||||||||
|
Effect of change in fair value of reinsurance related embedded derivative, net of offsets (a)
|
27
|
|
—
|
|
—
|
|
(1
|
)
|
(10
|
)
|
11
|
|
|||||||||||||
|
Effects of integration, merger related & other non-operating items
|
(1
|
)
|
40
|
|
(8
|
)
|
29
|
|
—
|
|
—
|
|
|||||||||||||
|
Effects of extinguishment of debt
|
—
|
|
(2
|
)
|
—
|
|
—
|
|
—
|
|
—
|
|
|||||||||||||
|
Tax effect of affiliated reinsurance embedded derivative
|
—
|
|
—
|
|
(20
|
)
|
—
|
|
—
|
|
—
|
|
|||||||||||||
|
Net impact of Tax Cuts and Jobs Act (c)
|
—
|
|
3
|
|
131
|
|
—
|
|
—
|
|
—
|
|
|||||||||||||
|
Tax impact of adjusting items
|
7
|
|
(31
|
)
|
(1
|
)
|
(4
|
)
|
36
|
|
25
|
|
|||||||||||||
|
AOI
|
$
|
351
|
|
$
|
286
|
|
$
|
3
|
|
$
|
36
|
|
$
|
41
|
|
$
|
177
|
|
|||||||
|
Less Preferred stock dividend
|
$
|
31
|
|
$
|
29
|
|
$
|
2
|
|
$
|
—
|
|
$
|
—
|
|
$
|
—
|
|
|||||||
|
AOI available to common shareholders
|
$
|
320
|
|
$
|
257
|
|
|
$
|
1
|
|
$
|
36
|
|
$
|
41
|
|
$
|
177
|
|
||||||
(b) The updated definition of AOI removes the impact of fair value accounting of FIA products for periods after December 31, 2017 and the fair value accounting impacts of assumed reinsurance by our international subsidiaries for periods after September 30, 2018. Included in the one-month period ended December 31, 2017 is the impact of the immaterial error resulting from the model code error, net of VOBA amortization.
(c) For the year ended December 31, 2018, the Company recorded an immaterial out of period adjustment related to the December 1, 2017 fair value of the deferred income tax valuation allowance acquired from the Business Combination. See "Note 2. Significant Accounting Policies and Practices" for additional information.
|
•
|
AOI increased for the year ended
December 31, 2019
primarily due to increased investment spread as a result of portfolio repositioning activity, disciplined crediting rate strategy, and invested asset growth. Included in these results were
$30
net favorable actual to expected mortality within the single premium immediate annuity (“SPIA”) product line, $21 favorable market movement on the futures and options contracts held to economically hedge our indexed products, $18 tax benefit due to the release of the FSRC valuation allowance, and
$11
net favorable adjustments resulting from the annual review of DAC, VOBA, and our international subsidiaries assumptions, partially offset by
$23
project expenses.
|
|
•
|
AOI increased for the year ended
December 31, 2018
, primary as a result of an increase in net investment income. Included in these results were favorable items related to $24 net tax benefit realized upon recapture of affiliated reinsurance (pursuant to a tax reform strategy), $22 net favorable actual to expected mortality within the SPIA product line and other reserve adjustments, $5 bond prepay income and other; partially offset by $9 unfavorable market movement on futures and options contracts held to economically hedge our indexed products and $5 project expenses.
|
75
Investment Portfolio
(
All dollar amounts presented in millions unless otherwise noted
)
The types of assets in which we may invest are influenced by various state laws, which prescribe qualified investment assets applicable to insurance companies. Within the parameters of these laws, we invest in assets giving consideration to four primary investment objectives: (i) maintain robust absolute returns; (ii) provide reliable yield and investment income; (iii) preserve capital and (iv) provide liquidity to meet policyholder and other corporate obligations.
Our investment portfolio is designed to contribute stable earnings and balance risk across diverse asset classes and is primarily invested in high quality fixed income securities.
As of
December 31, 2019
and
December 31, 2018
, the fair value of our investment portfolio was approximately
$28 billion
and
$24 billion
, respectively, and was divided among the following asset class and sectors:
|
|
December 31, 2019
|
December 31, 2018
|
|||||||||||
|
Fair Value
|
Percent
|
Fair Value
|
Percent
|
||||||||||
|
Fixed maturity securities, available for sale:
|
|||||||||||||
|
United States Government full faith and credit
|
$
|
34
|
|
—
|
%
|
$
|
119
|
|
—
|
%
|
|||
|
United States Government sponsored entities
|
134
|
|
—
|
%
|
106
|
|
—
|
%
|
|||||
|
United States municipalities, states and territories
|
1,343
|
|
5
|
%
|
1,187
|
|
5
|
%
|
|||||
|
Foreign Governments
|
155
|
|
1
|
%
|
121
|
|
1
|
%
|
|||||
|
Corporate securities:
|
|||||||||||||
|
Finance, insurance and real estate
|
4,234
|
|
15
|
%
|
4,113
|
|
17
|
%
|
|||||
|
Manufacturing, construction and mining
|
771
|
|
3
|
%
|
574
|
|
2
|
%
|
|||||
|
Utilities, energy and related sectors
|
2,452
|
|
9
|
%
|
2,281
|
|
10
|
%
|
|||||
|
Wholesale/retail trade
|
1,617
|
|
6
|
%
|
1,376
|
|
6
|
%
|
|||||
|
Services, media and other
|
2,523
|
|
9
|
%
|
2,037
|
|
9
|
%
|
|||||
|
Hybrid securities
|
1,027
|
|
4
|
%
|
901
|
|
4
|
%
|
|||||
|
Non-agency residential mortgage-backed securities
|
820
|
|
3
|
%
|
925
|
|
4
|
%
|
|||||
|
Commercial mortgage-backed securities
|
2,922
|
|
10
|
%
|
2,537
|
|
10
|
%
|
|||||
|
Asset-backed securities
|
5,694
|
|
20
|
%
|
4,832
|
|
20
|
%
|
|||||
|
Total fixed maturity available for sale securities
|
23,726
|
|
85
|
%
|
21,109
|
|
88
|
%
|
|||||
|
Equity securities (a)
|
1,071
|
|
4
|
%
|
1,382
|
|
6
|
%
|
|||||
|
Commercial mortgage loans
|
435
|
|
1
|
%
|
483
|
|
2
|
%
|
|||||
|
Residential mortgage loans
|
848
|
|
3
|
%
|
187
|
|
1
|
%
|
|||||
|
Other (primarily derivatives and limited partnerships)
|
1,875
|
|
7
|
%
|
748
|
|
3
|
%
|
|||||
|
Total Investments
|
$
|
27,955
|
|
100
|
%
|
$
|
23,909
|
|
100
|
%
|
|||
(a) Includes investment grade non-redeemable preferred stocks (
$887
and
$1,208
, respectively).
Insurance statutes regulate the type of investments that our life insurance subsidiaries are permitted to make and limit the amount of funds that may be used for any one type of investment. In light of these statutes and regulations, and our business and investment strategy, we generally seek to invest in (i) corporate securities rated investment grade by established nationally recognized statistical rating organizations (each, an “NRSRO”), (ii) U.S. Government and government-sponsored agency securities, or (iii) securities of comparable investment quality, if not rated.
76
The following table summarizes the credit quality, by Nationally Recognized Statistical Ratings Organization ("NRSRO") rating, of our fixed income portfolio:
|
|
December 31, 2019
|
December 31, 2018
|
||||||||||||
|
Rating
|
Fair Value
|
Percent
|
Fair Value
|
Percent
|
||||||||||
|
AAA
|
$
|
496
|
|
2
|
%
|
$
|
627
|
|
3
|
%
|
||||
|
AA
|
1,520
|
|
6
|
%
|
1,415
|
|
7
|
%
|
||||||
|
A
|
6,601
|
|
28
|
%
|
5,354
|
|
25
|
%
|
||||||
|
BBB
|
8,800
|
|
37
|
%
|
8,328
|
|
39
|
%
|
||||||
|
Not rated (c)
|
4,304
|
|
18
|
%
|
3,612
|
|
17
|
%
|
||||||
|
Total investment grade
|
21,721
|
|
91
|
%
|
19,336
|
|
91
|
%
|
||||||
|
BB (a)
|
1,353
|
|
6
|
%
|
1,307
|
|
6
|
%
|
||||||
|
B and below (b)
|
519
|
|
2
|
%
|
351
|
|
2
|
%
|
||||||
|
Not rated (c)
|
133
|
|
1
|
%
|
115
|
|
1
|
%
|
||||||
|
Total below investment grade
|
2,005
|
|
9
|
%
|
1,773
|
|
9
|
%
|
||||||
|
Total
|
$
|
23,726
|
|
100
|
%
|
$
|
21,109
|
|
100
|
%
|
||||
(a) Includes
$13
and
$17
at
December 31, 2019
and
December 31, 2018
, respectively, of non-agency residential mortgage-backed securities ("RMBS") that carry a National Association of Insurance Commissioners ("NAIC") 1 designation.
(b) Includes
$138
and
$175
at
December 31, 2019
and
December 31, 2018
, respectively, of non-agency RMBS that carry a NAIC 1 designation.
(c) Securities denoted as not-rated by an NRSRO were classified as investment or non-investment grade according to the securities' respective NAIC designation.
The NAIC’s Securities Valuation Office ("SVO") is responsible for the day-to-day credit quality assessment and valuation of securities owned by state regulated insurance companies. Insurance companies report ownership of securities to the SVO when such securities are eligible for regulatory filings. The SVO conducts credit analysis on these securities for the purpose of assigning an NAIC designation or unit price. Typically, if a security has been rated by an NRSRO, the SVO utilizes that rating and assigns an NAIC designation based upon the following system:
|
NAIC Designation
|
NRSRO Equivalent Rating
|
|
|
1
|
AAA/AA/A
|
|
|
2
|
BBB
|
|
|
3
|
BB
|
|
|
4
|
B
|
|
|
5
|
CCC and lower
|
|
|
6
|
In or near default
|
|
The NAIC has adopted revised designation methodologies for non-agency RMBS, including RMBS backed by subprime mortgage loans and for commercial mortgage-backed securities ("CMBS"). The NAIC’s objective with the revised designation methodologies for these structured securities was to increase accuracy in assessing expected losses and to use the improved assessment to determine a more appropriate capital requirement for such structured securities. The NAIC designations for structured securities, including subprime and Alternative A-paper ("Alt-A") RMBS, are based upon a comparison of the bond’s amortized cost to the NAIC’s loss expectation for each security. Securities where modeling does not generate an expected loss in all scenarios are given the highest designation of NAIC 1. A number of our RMBS securities carry a NAIC 1 designation while the NRSRO rating indicates below investment grade. The revised methodologies reduce regulatory reliance on rating agencies and allow for greater regulatory input into the assumptions used to estimate expected losses from such structured securities. In the tables below, we present the rating of structured securities based on ratings from the revised NAIC rating methodologies described above (which in some cases do not correspond to rating agency designations). All NAIC designations (e.g., NAIC 1-6) are based on the revised NAIC methodologies.
77
The tables below present our fixed maturity securities by NAIC designation as of
December 31, 2019
and
December 31, 2018
:
|
December 31, 2019
|
|||||||||||
|
NAIC Designation
|
Amortized Cost
|
Fair Value
|
Percent of Total Fair Value
|
||||||||
|
1
|
$
|
12,326
|
|
$
|
12,829
|
|
54
|
%
|
|||
|
2
|
9,046
|
|
9,350
|
|
39
|
%
|
|||||
|
3
|
1,112
|
|
1,108
|
|
5
|
%
|
|||||
|
4
|
273
|
|
280
|
|
1
|
%
|
|||||
|
5
|
157
|
|
159
|
|
1
|
%
|
|||||
|
6
|
—
|
|
—
|
|
—
|
%
|
|||||
|
Total
|
$
|
22,914
|
|
$
|
23,726
|
|
100
|
%
|
|||
|
December 31, 2018
|
|||||||||||
|
NAIC Designation
|
Amortized Cost
|
Fair Value
|
Percent of Total Fair Value
|
||||||||
|
1
|
$
|
11,245
|
|
$
|
10,928
|
|
52
|
%
|
|||
|
2
|
9,677
|
|
9,003
|
|
43
|
%
|
|||||
|
3
|
1,064
|
|
967
|
|
4
|
%
|
|||||
|
4
|
155
|
|
139
|
|
1
|
%
|
|||||
|
5
|
71
|
|
65
|
|
—
|
%
|
|||||
|
6
|
7
|
|
7
|
|
—
|
%
|
|||||
|
Total
|
$
|
22,219
|
|
$
|
21,109
|
|
100
|
%
|
|||
78
Investment Industry Concentration
The tables below presents the fair value of the top ten industry categories of our fixed maturity, equity securities, and FHLB common stock, and percent of total fixed maturity, equity securities, and FHLB common stock fair value as of
December 31, 2019
and
December 31, 2018
:
|
December 31, 2019
|
|||||||
|
Top 10 Industry Concentration
|
Fair Value
|
Percent of Total Fair Value
|
|||||
|
ABS collateralized loan obligation ("CLO")
|
$
|
3,881
|
|
10
|
%
|
||
|
Whole loan collateralized mortgage obligation ("CMO")
|
2,479
|
|
16
|
%
|
|||
|
Banking
|
2,414
|
|
6
|
%
|
|||
|
ABS Other
|
1,779
|
|
5
|
%
|
|||
|
Life insurance
|
1,610
|
|
7
|
%
|
|||
|
Municipal
|
1,343
|
|
10
|
%
|
|||
|
Electric
|
1,261
|
|
5
|
%
|
|||
|
CMBS
|
887
|
|
3
|
%
|
|||
|
Technology
|
694
|
|
3
|
%
|
|||
|
Pipelines
|
648
|
|
4
|
%
|
|||
|
Total
|
$
|
16,996
|
|
68
|
%
|
||
|
December 31, 2018
|
|||||||
|
Top 10 Industry Concentration
|
Fair Value
|
Percent of Total Fair Value
|
|||||
|
ABS collateralized loan obligation ("CLO")
|
$
|
3,283
|
|
15
|
%
|
||
|
Banking
|
2,491
|
|
11
|
%
|
|||
|
Whole loan collateralized mortgage obligation ("CMO")
|
2,234
|
|
10
|
%
|
|||
|
ABS Other
|
1,545
|
|
7
|
%
|
|||
|
Life insurance
|
1,376
|
|
6
|
%
|
|||
|
Municipal
|
1,187
|
|
5
|
%
|
|||
|
Electric
|
939
|
|
4
|
%
|
|||
|
CMBS
|
874
|
|
4
|
%
|
|||
|
Pipelines
|
812
|
|
4
|
%
|
|||
|
Property and casualty insurance
|
542
|
|
2
|
%
|
|||
|
Total
|
$
|
15,283
|
|
68
|
%
|
||
79
The amortized cost and fair value of fixed maturity AFS securities by contractual maturities as of
December 31, 2019
and
December 31, 2018
, as applicable, are shown below. Actual maturities may differ from contractual maturities because issuers may have the right to call or prepay obligations.
|
December 31, 2019
|
December 31, 2018
|
||||||||||||||
|
Amortized Cost
|
Fair Value
|
Amortized Cost
|
Fair Value
|
||||||||||||
|
Corporate, Non-structured Hybrids, Municipal and U.S. Government securities:
|
|||||||||||||||
|
Due in one year or less
|
$
|
85
|
|
$
|
85
|
|
$
|
191
|
|
$
|
191
|
|
|||
|
Due after one year through five years
|
888
|
|
914
|
|
817
|
|
794
|
|
|||||||
|
Due after five years through ten years
|
2,020
|
|
2,082
|
|
2,219
|
|
2,137
|
|
|||||||
|
Due after ten years
|
10,496
|
|
11,075
|
|
10,443
|
|
9,587
|
|
|||||||
|
Subtotal
|
$
|
13,489
|
|
$
|
14,156
|
|
$
|
13,670
|
|
$
|
12,709
|
|
|||
|
Other securities which provide for periodic payments:
|
|||||||||||||||
|
Asset-backed securities
|
$
|
5,720
|
|
$
|
5,694
|
|
$
|
4,954
|
|
$
|
4,832
|
|
|||
|
Commercial mortgage-backed securities
|
2,788
|
|
2,922
|
|
2,568
|
|
2,537
|
|
|||||||
|
Residential mortgage-backed securities
|
917
|
|
954
|
|
1,027
|
|
1,031
|
|
|||||||
|
Subtotal
|
$
|
9,425
|
|
$
|
9,570
|
|
$
|
8,549
|
|
$
|
8,400
|
|
|||
|
Total fixed maturity available-for-sale securities
|
$
|
22,914
|
|
$
|
23,726
|
|
$
|
22,219
|
|
$
|
21,109
|
|
|||
80
Non-Agency RMBS Exposure
Our investment in non-agency RMBS securities is predicated on the conservative and adequate cushion between purchase price and NAIC 1 rating, general lack of sensitivity to interest rates, positive convexity to prepayment rates and correlation between the price of the securities and the unfolding recovery of the housing market.
The fair value of our investments in subprime and Alt-A RMBS securities was
$81
and
$130
as of
December 31, 2019
, respectively, and
$104
and
$163
as of
December 31, 2018
, respectively.
The following tables summarize our exposure to subprime and Alt-A RMBS by credit quality using NAIC designations, NRSRO ratings and vintage year as of
December 31, 2019
and
December 31, 2018
:
|
December 31, 2019
|
December 31, 2018
|
||||||||||||
|
NAIC Designation:
|
Fair Value
|
Percent of Total
|
Fair Value
|
Percent of Total
|
|||||||||
|
1
|
$
|
193
|
|
92
|
%
|
$
|
245
|
|
92
|
%
|
|||
|
2
|
6
|
|
3
|
%
|
18
|
|
7
|
%
|
|||||
|
3
|
1
|
|
—
|
%
|
—
|
|
—
|
%
|
|||||
|
4
|
11
|
|
5
|
%
|
4
|
|
1
|
%
|
|||||
|
5
|
—
|
|
—
|
%
|
—
|
|
—
|
%
|
|||||
|
6
|
—
|
|
—
|
%
|
—
|
|
—
|
%
|
|||||
|
Total
|
$
|
211
|
|
100
|
%
|
$
|
267
|
|
100
|
%
|
|||
|
NRSRO:
|
|||||||||||||
|
AAA
|
$
|
1
|
|
—
|
%
|
$
|
1
|
|
—
|
%
|
|||
|
AA
|
7
|
|
3
|
%
|
11
|
|
4
|
%
|
|||||
|
A
|
21
|
|
10
|
%
|
25
|
|
9
|
%
|
|||||
|
BBB
|
5
|
|
2
|
%
|
8
|
|
3
|
%
|
|||||
|
Not rated - Above investment grade (a)
|
34
|
|
16
|
%
|
46
|
|
17
|
%
|
|||||
|
BB and below
|
143
|
|
69
|
%
|
176
|
|
66
|
%
|
|||||
|
Total
|
$
|
211
|
|
100
|
%
|
$
|
267
|
|
100
|
%
|
|||
|
Vintage:
|
|||||||||||||
|
2017
|
$
|
13
|
|
6
|
%
|
$
|
12
|
|
4
|
%
|
|||
|
2016
|
—
|
|
—
|
%
|
15
|
|
6
|
%
|
|||||
|
2007
|
44
|
|
21
|
%
|
51
|
|
19
|
%
|
|||||
|
2006
|
55
|
|
26
|
%
|
63
|
|
24
|
%
|
|||||
|
2005 and prior
|
99
|
|
47
|
%
|
126
|
|
47
|
%
|
|||||
|
Total
|
$
|
211
|
|
100
|
%
|
$
|
267
|
|
100
|
%
|
|||
(a) Securities denoted as not-rated by an NRSRO were classified as investment or non-investment grade according to the securities' respective NAIC designation.
81
ABS Exposure
As of
December 31, 2019
and
December 31, 2018
, our ABS exposure was largely composed of CLOs, which comprised
68%
and
68%
, respectively, of all ABS holdings. These exposures are generally senior tranches of CLOs which have leveraged loans as their underlying collateral. The remainder of our ABS exposure was largely diversified by underlying collateral and issuer type, including automobile and home equity receivables.
As of
December 31, 2019
, the non-CLO exposure represents
32%
of total ABS assets, or
6%
of total invested assets, and the CLO and non-CLO positions were trading at a net unrealized gain (loss) position of
$(65)
and
$38
, respectively. As of
December 31, 2018
, the non-CLO exposure represented
32%
of total ABS assets, or
6%
of total invested assets, and the CLO and non-CLO positions were trading at a net unrealized gain (loss) position of
$(128)
and
$6
, respectively. The following tables summarize our ABS exposure.
|
December 31, 2019
|
December 31, 2018
|
||||||||||||
|
Asset Class
|
Fair Value
|
Percent
|
Fair Value
|
Percent
|
|||||||||
|
ABS CLO
|
$
|
3,881
|
|
68
|
%
|
$
|
3,283
|
|
68
|
%
|
|||
|
ABS auto
|
34
|
|
1
|
%
|
1
|
|
—
|
%
|
|||||
|
ABS credit card
|
—
|
|
—
|
%
|
3
|
|
—
|
%
|
|||||
|
ABS other
|
1,779
|
|
31
|
%
|
1,545
|
|
32
|
%
|
|||||
|
Total ABS
|
$
|
5,694
|
|
100
|
%
|
$
|
4,832
|
|
100
|
%
|
|||
Mortgage Loans
We rate all CMLs to quantify the level of risk. We place those loans with higher risk on a watch list and closely monitor them for collateral deficiency or other credit events that may lead to a potential loss of principal and/or interest. If we determine the value of any CML to be impaired (i.e., when it is probable that we will be unable to collect on amounts due according to the contractual terms of the loan agreement), the carrying value of the CML is reduced to either the present value of expected cash flows from the loan, discounted at the loan’s effective interest rate, or fair value of the collateral. For those mortgage loans that are determined to require foreclosure, the carrying value is reduced to the fair value of the underlying collateral, net of estimated costs to obtain and sell at the point of foreclosure. The carrying value of the impaired loans is reduced by establishing a specific write-down recorded in "Net realized capital gains (losses)" in the Consolidated Statements of Operations.
Loan-to-value (“LTV”) and debt service coverage (“DSC”) ratios are utilized as part of the review process described above. As of
December 31, 2019
, our mortgage loans on real estate portfolio had a weighted average DSC ratio of
2.21
, and a weighted average LTV ratio of
44%
. See "Note 4. Investments" to our audited consolidated financial statements for additional information regarding our LTV and DSC ratios.
The Company's residential mortgage loans (“RML”) are closed end, amortizing loans and 100% of the properties are located in the United States. The Company diversifies its RML portfolio by state to reduce concentration risk. Residential mortgage loans have a primary credit quality indicator of either a performing or nonperforming loan. The Company defines non-performing residential mortgage loans as those that are 90 or more days past due and/or in nonaccrual status which is assessed monthly.
82
Unrealized Losses
The amortized cost and fair value of the fixed maturity securities and the equity securities that were in an unrealized loss position as of
December 31, 2019
and
December 31, 2018
, were as follows:
|
December 31, 2019
|
||||||||||||||
|
Number of securities
|
Amortized Cost
|
Unrealized Losses
|
Fair Value
|
|||||||||||
|
Fixed maturity securities, available for sale:
|
||||||||||||||
|
United States Government full faith and credit
|
2
|
|
$
|
6
|
|
$
|
—
|
|
$
|
6
|
|
|||
|
United States Government sponsored agencies
|
33
|
|
36
|
|
—
|
|
36
|
|
||||||
|
United States municipalities, states and territories
|
23
|
|
188
|
|
(5
|
)
|
183
|
|
||||||
|
Corporate securities:
|
||||||||||||||
|
Finance, insurance and real estate
|
41
|
|
413
|
|
(14
|
)
|
399
|
|
||||||
|
Manufacturing, construction and mining
|
20
|
|
132
|
|
(2
|
)
|
130
|
|
||||||
|
Utilities, energy and related sectors
|
54
|
|
502
|
|
(30
|
)
|
472
|
|
||||||
|
Wholesale/retail trade
|
45
|
|
508
|
|
(19
|
)
|
489
|
|
||||||
|
Services, media and other
|
39
|
|
351
|
|
(7
|
)
|
344
|
|
||||||
|
Hybrid securities
|
10
|
|
87
|
|
(4
|
)
|
83
|
|
||||||
|
Non-agency residential mortgage backed securities
|
62
|
|
115
|
|
(3
|
)
|
112
|
|
||||||
|
Commercial mortgage backed securities
|
43
|
|
254
|
|
(6
|
)
|
248
|
|
||||||
|
Asset backed securities
|
364
|
|
3,249
|
|
(77
|
)
|
3,172
|
|
||||||
|
Total fixed maturity available for sale securities
|
736
|
|
5,841
|
|
(167
|
)
|
5,674
|
|
||||||
|
Equity securities
|
33
|
|
505
|
|
(17
|
)
|
488
|
|
||||||
|
Total investments
|
769
|
|
$
|
6,346
|
|
$
|
(184
|
)
|
$
|
6,162
|
|
|||
|
December 31, 2018
|
||||||||||||||
|
Number of securities
|
Amortized Cost
|
Unrealized Losses
|
Fair Value
|
|||||||||||
|
Fixed maturity securities, available for sale:
|
||||||||||||||
|
United States Government full faith and credit
|
15
|
|
$
|
120
|
|
$
|
(1
|
)
|
$
|
119
|
|
|||
|
United States Government sponsored agencies
|
72
|
|
88
|
|
(2
|
)
|
86
|
|
||||||
|
United States municipalities, states and territories
|
103
|
|
1,054
|
|
(32
|
)
|
1,022
|
|
||||||
|
Foreign Governments
|
16
|
|
123
|
|
(8
|
)
|
115
|
|
||||||
|
Corporate securities:
|
||||||||||||||
|
Finance, insurance and real estate
|
300
|
|
3,721
|
|
(230
|
)
|
3,491
|
|
||||||
|
Manufacturing, construction and mining
|
86
|
|
613
|
|
(57
|
)
|
556
|
|
||||||
|
Utilities, energy and related sectors
|
237
|
|
2,347
|
|
(222
|
)
|
2,125
|
|
||||||
|
Wholesale/retail trade
|
211
|
|
1,469
|
|
(144
|
)
|
1,325
|
|
||||||
|
Services, media and other
|
266
|
|
2,179
|
|
(195
|
)
|
1,984
|
|
||||||
|
Hybrid securities
|
67
|
|
956
|
|
(91
|
)
|
865
|
|
||||||
|
Non-agency residential mortgage backed securities
|
110
|
|
249
|
|
(6
|
)
|
243
|
|
||||||
|
Commercial mortgage backed securities
|
205
|
|
1,768
|
|
(40
|
)
|
1,728
|
|
||||||
|
Asset backed securities
|
419
|
|
3,704
|
|
(137
|
)
|
3,567
|
|
||||||
|
Total fixed maturity available for sale securities
|
2,107
|
|
18,391
|
|
(1,165
|
)
|
17,226
|
|
||||||
|
Equity securities
|
95
|
|
1,523
|
|
(145
|
)
|
1,378
|
|
||||||
|
Total investments
|
2,202
|
|
$
|
19,914
|
|
$
|
(1,310
|
)
|
$
|
18,604
|
|
|||
The gross unrealized loss position on the available-for-sale fixed maturity security and equity portfolio as of
December 31, 2019
and
December 31, 2018
was
$184
and
$1,310
, respectively. The gross unrealized loss position decreased
$1,126
from
December 31, 2018
to
December 31, 2019
as most components of the portfolio exhibited price appreciation due to interest rates and credit spreads narrowing during the year. Floating rate notes experienced some stress as LIBOR declined through the year in response to interest rate cuts from the US Federal Reserve Bank, however, some of this was mitigated by tightening spreads. The total book value of all securities in an unrealized loss position was
$6,346
and
$19,914
as of
December 31, 2019
and
December 31, 2018
, respectively.
83
The total book value of all securities in an unrealized loss position decreased
68%
from
December 31, 2018
to
December 31, 2019
. The average market value/book value of the investment category with the largest unrealized loss position was
98%
for
asset backed
securities and
92%
for
corporate bonds
as of
December 31, 2019
and
December 31, 2018
, respectively. In aggregate,
asset backed
securities represented
42%
and
corporate bonds
represented
65%
of the total unrealized loss position as of
December 31, 2019
and
December 31, 2018
, respectively.
Our municipal bond exposure is a combination of general obligation bonds (fair value of
$228
and an amortized cost of
$215
as of
December 31, 2019
) and special revenue bonds (fair value of
$1,115
and amortized cost of
$1,069
as of
December 31, 2019
).
Across all municipal bonds, the largest issuer represented
9%
of the category, less than
1%
of the entire portfolio, and is rated NAIC
1
. Our focus within municipal bonds is on NAIC
1
rated instruments, and
90%
of our municipal bond exposure is rated NAIC
1
.
The amortized cost and fair value of fixed maturity securities and equity securities (excluding U.S. Government and U.S. Government-sponsored agency securities) in an unrealized loss position greater than
20%
and the number of months in an unrealized loss position with fixed maturity investment grade securities (NRSRO rating of BBB/Baa or higher) as of
December 31, 2019
and
December 31, 2018
, were as follows:
|
December 31, 2019
|
||||||||||||||
|
Number of securities
|
Amortized Cost
|
Fair Value
|
Gross Unrealized Losses
|
|||||||||||
|
Investment grade:
|
||||||||||||||
|
Less than six months
|
—
|
|
$
|
—
|
|
$
|
—
|
|
$
|
—
|
|
|||
|
Six months or more and less than twelve months
|
—
|
|
—
|
|
—
|
|
—
|
|
||||||
|
Twelve months or greater
|
1
|
|
—
|
|
—
|
|
—
|
|
||||||
|
Total investment grade
|
1
|
|
—
|
|
—
|
|
—
|
|
||||||
|
Below investment grade:
|
||||||||||||||
|
Less than six months
|
1
|
|
3
|
|
2
|
|
(1
|
)
|
||||||
|
Six months or more and less than twelve months
|
—
|
|
—
|
|
—
|
|
—
|
|
||||||
|
Twelve months or greater
|
3
|
|
42
|
|
33
|
|
(9
|
)
|
||||||
|
Total below investment grade
|
4
|
|
45
|
|
35
|
|
(10
|
)
|
||||||
|
Total
|
5
|
|
$
|
45
|
|
$
|
35
|
|
$
|
(10
|
)
|
|||
|
December 31, 2018
|
||||||||||||||
|
Number of securities
|
Amortized Cost
|
Fair Value
|
Gross Unrealized Losses
|
|||||||||||
|
Investment grade:
|
||||||||||||||
|
Less than six months
|
3
|
|
$
|
23
|
|
$
|
18
|
|
$
|
(5
|
)
|
|||
|
Six months or more and less than twelve months
|
10
|
|
72
|
|
55
|
|
(17
|
)
|
||||||
|
Twelve months or greater
|
4
|
|
25
|
|
19
|
|
(6
|
)
|
||||||
|
Total investment grade
|
17
|
|
120
|
|
92
|
|
(28
|
)
|
||||||
|
Below investment grade:
|
||||||||||||||
|
Less than six months
|
3
|
|
11
|
|
9
|
|
(2
|
)
|
||||||
|
Six months or more and less than twelve months
|
9
|
|
31
|
|
22
|
|
(9
|
)
|
||||||
|
Twelve months or greater
|
5
|
|
12
|
|
9
|
|
(3
|
)
|
||||||
|
Total below investment grade
|
17
|
|
54
|
|
40
|
|
(14
|
)
|
||||||
|
Total
|
34
|
|
$
|
174
|
|
$
|
132
|
|
$
|
(42
|
)
|
|||
84
OTTI and Watch List
At
December 31, 2019
and
December 31, 2018
, our watch list included
8
and
34
securities, respectively, in an unrealized loss position with an amortized cost of
$45
and
$174
, unrealized losses of
$10
and
$42
, and a fair value of $
35
and $
132
, respectively. As part of the OTTI analysis, we evaluated each of these securities to assess the following:
•
whether the issuer is currently meeting its financial obligations;
•
its ability to continue to meet these obligations;
•
its existing cash available;
•
its access to additional available capital;
•
any expense management actions the issuer has taken; and
•
whether the issuer has the ability and willingness to sell non-core assets to generate liquidity.
Based on our analysis, these securities demonstrated that the
December 31, 2019
and
December 31, 2018
carrying values were fully recoverable.
There were
4
and
4
structured securities with a fair value of
$0
and
$6
on the watch list to which we had potential credit exposure as of
December 31, 2019
and
December 31, 2018
, respectively. Our analysis of these structured securities, which included cash flow testing results, demonstrated the
December 31, 2019
and
December 31, 2018
values were fully recoverable.
Exposure to Sovereign Debt
Our investment portfolio had
no
direct exposure to European sovereign debt as of
December 31, 2019
and
December 31, 2018
.
As of
December 31, 2019
and
December 31, 2018
, the Company also had
no
material exposure risk related to financial investments in Puerto Rico.
Net Investment Income and Net Investment Gains (Losses)
For discussion regarding our net investment income and net investment gains (losses) refer to "Note 4. Investments" to our audited consolidated financial statements.
Available-For-Sale Securities
For additional information regarding our AFS securities, including the amortized cost, gross unrealized gains (losses), and fair value as well as the amortized cost and fair value of fixed maturity AFS securities by contractual maturities as of
December 31, 2019
, refer to "Note 4. Investments" to our audited
consolidated financial statements
.
Concentrations of Financial Instruments
For detail regarding our concentration of financial instruments refer to "Note 3. Significant Risks and Uncertainties" to our audited
consolidated financial statements
.
Derivatives
We are exposed to credit loss in the event of nonperformance by our counterparties on call options. We attempt to reduce this credit risk by purchasing such options from large, well-established financial institutions.
We also hold cash and cash equivalents received from counterparties for call option collateral, as well as U.S. Government securities pledged as call option collateral, if our counterparty’s net exposures exceed pre-determined thresholds.
The Company is required to pay counterparties the effective federal funds rate each day for cash collateral posted to FGL for daily mark to market margin changes. The Company reduces the negative interest cost associated with cash collateral posted from counterparties under various ISDA agreements by reinvesting derivative cash collateral. This program permits collateral cash received to be invested in short term Treasury securities, bank deposits and commercial paper rated A1/P1 which are included in "Cash and cash equivalents" in the accompanying Consolidated Balance Sheets.
See "Note 5. Derivative Financial Instruments" to our audited
consolidated financial statements
for additional information regarding our derivatives and our exposure to credit loss on call options.
85
Liquidity and Capital Resources
Liquidity and Cash Flow
Liquidity refers to the ability of an enterprise to generate adequate amounts of cash from its normal operations to meet cash requirements with a prudent margin of safety. Our principal sources of cash flow from operating activities are insurance premiums, and fees and investment income, however, sources of cash flows from investing activities also result from maturities and sales of invested assets. Our operating activities provided cash of
$675
in the year ended
December 31, 2019
. When considering our liquidity and cash flow, it is important to distinguish between the needs of our insurance subsidiaries and the needs of the holding company, FGL Holdings. As a holding company with no operations of its own, FGL Holdings derives its cash primarily from its insurance subsidiaries and CF Bermuda Holdings Limited ("CF Bermuda"), a Bermuda exempted limited liability company and a wholly owned direct subsidiary of the Company, a downstream holding company that provides additional sources of liquidity. Dividends from our insurance subsidiaries flow through CF Bermuda to FGL Holdings.
The sources of liquidity of the holding company are principally comprised of dividends from subsidiaries, bank lines of credit (at FGLH level) and the ability to raise long-term public financing under an SEC-filed registration statement or private placement offering. These sources of liquidity and cash flow support the general corporate needs of the holding company, including common stock dividends, interest and debt service, funding acquisitions, and investment in core businesses.
Our cash flows associated with collateral received from and posted with counterparties change as the market value of the underlying derivative contract changes. As the value of a derivative asset declines (or increases), the collateral required to be posted by our counterparties would also decline (or increase). Likewise, when the value of a derivative liability declines (or increases), the collateral we are required to post to our counterparties would also decline (or increase).
Discussion of Consolidated Cash Flows
Presented below is a table that summarizes the cash provided or used in our activities and the amount of the respective increases or decreases in cash provided or used from those activities for the periods presented:
|
(Dollars in millions)
|
Year ended
|
Year ended
|
||||||||||||||||||||||
|
December 31, 2019
|
December 31, 2018
|
Period from December 1 to December 31, 2017
|
Period from October 1 to November 30, 2017
|
Period from October 1 to December 31, 2016 (Unaudited)
|
September 30, 2017
|
|||||||||||||||||||
|
Cash provided by (used in):
|
Predecessor
|
Predecessor
|
Predecessor
|
|||||||||||||||||||||
|
Operating activities
|
$
|
675
|
|
$
|
897
|
|
$
|
85
|
|
$
|
79
|
|
$
|
72
|
|
$
|
237
|
|
||||||
|
Investing activities
|
(1,568
|
)
|
(2,280
|
)
|
(22
|
)
|
(175
|
)
|
(594
|
)
|
(1,217
|
)
|
||||||||||||
|
Financing activities
|
1,291
|
|
739
|
|
45
|
|
135
|
|
290
|
|
1,001
|
|
||||||||||||
|
Net increase (decrease) in cash and cash equivalents
|
$
|
398
|
|
$
|
(644
|
)
|
$
|
108
|
|
$
|
39
|
|
$
|
(232
|
)
|
$
|
21
|
|
||||||
Operating Activities
Cash provided by operating activities for the years ended
December 31, 2019
and
December 31, 2018
were principally due to investment income and deferred acquisition costs. For the year ended
December 31, 2019
, net investment income receipts of
$1,280
were partially offset by deferred acquisition costs of
$468
.
Investing Activities
Cash used in investing activities for the years ended
December 31, 2019
and
December 31, 2018
was principally due to the purchases of fixed maturity securities and other investments, net of cash proceeds from sales, maturities and repayments, as a result of the Company's portfolio repositioning.
86
Financing Activities
Cash provided by financing activities for the years ended
December 31, 2019
and
December 31, 2018
was related to the issuance of investment contracts and pending new production, including annuity and universal life insurance contracts, net of redemptions and benefit payments.
Sources of Cash Flow
Dividends from Insurance Subsidiaries, Statutory Capital and Risk-Based Capital
The Company’s insurance subsidiaries domiciled in the U.S. are restricted by state laws and regulations as to the amount of dividends they may pay to their parent without regulatory approval in any year, the purpose of which is to protect affected insurance policyholders, depositors or investors. Any dividends in excess of limits are deemed “extraordinary” and require regulatory approval. Based on statutory results as of December 31, 2019, in accordance with applicable dividend restrictions, the Company’s subsidiaries may pay “ordinary” dividends to FGLH in 2020 of
$175
. However, pursuant to an order issued in connection with the approval of the Merger Agreement by the Iowa Commissioner on November 28, 2017, FGL Insurance shall not pay any dividend or other distribution to shareholders prior to November 28, 2021 without the prior approval of the Iowa Commissioner. In 2019, upon approval by the Iowa Commissioner, FGL Insurance declared and paid extraordinary dividends of
$100
to its Parent, FGLH.
FGL Insurance and FGL NY Insurance are subject to minimum RBC requirements established by the insurance departments of their applicable state of domicile. The formulas for determining the amount of RBC specify various weighting factors that are applied to financial balances and levels of premium activity based on the perceived degree of risk. Regulatory compliance is determined by a ratio of TAC, as defined by the NAIC, to RBC requirements, as defined by the NAIC. FGL Insurance and FGL NY Insurance exceeded the minimum RBC requirements that would require regulatory or corrective action for all periods presented herein. RBC is an important factor in the determination of the financial strength ratings of FGL Insurance.
FGL Insurance and FGL NY Insurance are required to prepare statutory financial statements in accordance with statutory accounting practices prescribed or permitted by the insurance department of the state of domicile of the respective insurance subsidiary. Statutory accounting practices primarily differ from GAAP by charging policy acquisition costs to expense as incurred, establishing future policy benefit liabilities using different actuarial assumptions as well as valuing investments and certain assets and accounting for deferred taxes on a different basis. Certain assets that are not admitted under statutory accounting principles are charged directly to surplus.
For non-U.S. companies, Class C insurers are required to maintain available capital and surplus at a level equal to or in excess of the applicable ECR, which is established by reference to either the applicable BSCR model or an approved internal capital model. Furthermore, to enable the BMA to better assess the quality of the insurer’s capital resources, a Class C insurer is required to disclose the makeup of its capital in accordance with its 3-tiered capital system. An insurer may file an application under the Insurance Act to have the aforementioned ECR requirements waived.
Statutory capital and surplus of FGL Insurance and our other insurance subsidiaries is as follows for the periods presented:
|
(Dollars in millions)
|
As of December 31, 2019
|
As of December 31, 2018
|
||||||
|
Subsidiary Name:
|
|
|
|
|
||||
|
F&G Life Re Ltd
|
$
|
2
|
|
$
|
2
|
|
||
|
FSRC
|
73
|
|
73
|
|
||||
|
F&G Reinsurance Ltd
|
295
|
|
38
|
|
||||
|
Fidelity & Guaranty Life Insurance Company
|
1,513
|
|
1,545
|
|
||||
|
Fidelity & Guaranty Life Insurance Company of New York
|
95
|
|
85
|
|
||||
|
Raven Reinsurance Company
|
87
|
|
94
|
|
||||
87
We monitor the ratio of our insurance subsidiaries’ TAC to company action level risk-based capital (“CAL”). A ratio in excess of either (i) 100% or (ii) 150% if there is a negative trend, indicates that the insurance subsidiary is not required to take any corrective actions to increase capital levels at the direction of the applicable state of domicile.
The ratio of TAC to CAL for FGL Insurance and FGL NY Insurance is set out below for the periods presented:
|
|
As of December 31, 2019
|
As of December 31, 2018
|
||||||||||||||||||||
|
(Dollars in millions)
|
CAL
|
TAC
|
Ratio
|
CAL
|
TAC
|
Ratio
|
||||||||||||||||
|
Fidelity & Guaranty Life Insurance Company
|
$
|
393
|
|
$
|
1,776
|
|
452
|
%
|
$
|
380
|
|
$
|
1,699
|
|
447
|
%
|
||||||
|
Fidelity & Guaranty Life Insurance Company of New York
|
14
|
|
99
|
|
709
|
%
|
10
|
|
88
|
|
903
|
%
|
||||||||||
Debt
During the year ended December 31, 2018, FGLH completed a debt offering of
$550
aggregate principal amount of
5.50%
senior notes due 2025, issued at
99.5%
for proceeds of
$547
. The Company also has a credit agreement with certain financial institutions party thereto, as lenders, and Royal Bank of Canada, as administrative agent and letter of credit issuer, which provides for a
$250
senior unsecured revolving credit facility with a maturity of
three
years. Refer to "Note 8. Debt" to our audited consolidated financial statements for further details regarding the Company's Senior Notes and revolving credit agreement.
The 5.50% Senior Notes were issued pursuant to an indenture, dated as of April 20, 2018 (the “Base Indenture”), among FGLH, the guarantors from time to time party thereto and Wells Fargo Bank, National Association, as trustee (the “Trustee”), and a supplemental indenture thereto (the “Supplemental Indenture” and, together with the Base Indenture, the “Indenture”). FGLH pays interest on the 5.50% Senior Notes in cash on May 1 and November 1 of each year at a rate of 5.50% per annum. The 5.50% Senior Notes will mature on May 1, 2025. The 5.50% Senior Notes are fully and unconditionally guaranteed by FGLH’s direct parent, FGL US Holdings Inc., a Delaware corporation, FGL’s indirect parent, CF Bermuda, and certain existing and future wholly-owned domestic restricted subsidiaries of the CF Bermuda, other than its insurance subsidiaries.
The Indenture contains covenants that restrict the CF Bermuda’s and its restricted subsidiaries’ ability to, among other things, pay dividends on or make other distributions in respect of equity interests or make other restricted payments, make certain investments, incur or guarantee additional indebtedness, create liens on certain assets to secure debt, sell certain assets, consummate certain mergers or consolidations or sell all or substantially all assets, or enter into transactions with affiliates.
Debt Covenants
The Credit Agreement contains a number of covenants that, among other things, limit or restrict the ability of FGLH, CF Bermuda and their subsidiaries to incur additional indebtedness, incur or become subject to liens, dispose of assets, make investments, dividends or distributions or repurchases of certain equity interests or prepayments of certain indebtedness, enter into certain transactions with affiliates, undergo fundamental changes, enter into certain restrictive agreements, and change certain accounting policies or reporting practices. The Credit Agreement also contains certain affirmative covenants, including financial and other reporting requirements. In addition, the Credit Agreement includes the following financial maintenance covenants: (a) minimum total shareholders’ equity of CF Bermuda and its consolidated subsidiaries at the end of each fiscal quarter of the sum of (i) the greater of (x) 70% of the total shareholders’ equity of CF Bermuda as of the Closing Date and (y)
$1.19
billion plus (ii) 50% of the consolidated net income (loss) of CF Bermuda and its consolidated subsidiaries since the first day of the first fiscal quarter after November 30, 2017 plus (iii) 50% of all equity issuances of CF Bermuda after November 30, 2017; (b) maximum debt to total capitalization ratio of CF Bermuda at the end of each fiscal quarter of 0.35 to 1.00 for CF Bermuda and its consolidated subsidiaries; and (c) a minimum aggregate risk-based capital ratio of FGL Insurance, at the end of each fiscal quarter, of 300%. As of the date of this filing, FGLH and CF Bermuda are in compliance with all such covenants.
The Indenture contains a number of covenants that, among other things, limit or restrict FGLH’s ability and the ability of FGLH’s restricted subsidiaries to incur debt, incur liens, make certain asset dispositions or dispositions of subsidiary stock, enter into transactions with affiliates, enter into mergers, consolidations or transfers of all or substantially all assets, declare or pay dividends, redeem stock or prepay certain indebtedness, make investments
88
or enter into restrictive agreements. The Indenture also contains certain affirmative covenants, including financial and other reporting requirements. Most of these covenants will cease to apply for so long as the Senior Notes have investment grade ratings from both Moody’s and S&P. As of the date of this filing, FGLH is in compliance with all such covenants.
Credit Ratings
The indicative credit ratings published by the primary rating agencies are set forth below. Securities are rated at the time of issuance so actual ratings may differ from the indicative ratings. There may be other rating agencies that also provide credit ratings, which we do not disclose in our reports. Our current financial strength ratings of our principal insurance subsidiaries are described in section titled “Ratings
” in
Item 1. Business.
The long-term credit rating scales of A.M. Best, Fitch, Moody’s and S&P are as follows:
|
Financial Strength Rating Scale
|
Senior Unsecured Notes
Credit Rating Scale
|
|||
|
Rating Agency
|
||||
|
A.M. Best(1)
|
“A++” to “S”
|
“aaa to rs”
|
||
|
S&P(2)
|
“AAA” to “R”
|
“AAA to D”
|
||
|
Moody's(3)
|
“Aaa” to “C”
|
“Aaa to C”
|
||
|
Fitch(4)
|
“AAA” to “C”
|
“AAA to D”
|
||
|
(1)
|
A.M. Best’s financial strength rating is an independent opinion of an insurer’s financial strength and ability to meet its ongoing insurance policy and contract obligations. It is based on a comprehensive quantitative and qualitative evaluation of a company’s balance sheet strength, operating performance and business profile. A.M. Best’s long-term credit ratings reflect its assessment of the ability of an obligor to pay interest and principal in accordance with the terms of the obligation. Ratings from “aa” to “ccc” may be enhanced with a “+” (plus) or “-” (minus) to indicate whether credit quality is near the top or bottom of a category. A.M. Best’s short-term credit rating is an opinion to the ability of the rated entity to meet its senior financial commitments on obligations maturing in generally less than one year.
|
|
(2)
|
S&P’s insurer financial strength rating is a forward-looking opinion about the financial security characteristics of an insurance organization with respect to its ability to pay under its insurance policies and contracts in accordance with their terms. A “+” or “-” indicates relative standing within a category. An S&P credit rating is an assessment of default risk, but may incorporate an assessment of relative seniority or ultimate recovery in the event of default. Short-term issuer credit ratings reflect the obligor’s creditworthiness over a short-term time horizon.
|
|
(3)
|
Moody’s financial strength ratings are opinions of the ability of insurance companies to repay punctually senior policyholder claims and obligations. Moody’s appends numerical modifiers 1, 2, and 3 to each generic rating classification from Aa through Caa. The modifier 1 indicates that the obligation ranks in the higher end of its generic rating category; the modifier 2 indicates a mid-range ranking; and the modifier 3 indicates a ranking in the lower end of that generic rating category. Moody’s long-term credit ratings are opinions of the relative credit risk of fixed-income obligations with an original maturity of one year or more. They address the possibility that a financial obligation will not be honored as promised. Moody’s short-term ratings are opinions of the ability of issuers to honor short-term financial obligations.
|
|
(4)
|
Fitch’s financial strength ratings provide an assessment of the financial strength of an insurance organization. The IFS Rating is assigned to the insurance company’s policyholder obligations, including assumed reinsurance obligations and contract holder obligations, such as guaranteed investment contracts. Within long-term and short-term ratings, a “+” or a “-” may be appended to a rating to denote relative position within major rating categories.
|
A downgrade of our debt ratings could affect our ability to raise additional debt with terms and conditions similar to our current debt, and accordingly, likely increase our cost of capital. In addition, a downgrade of these ratings could make it more difficult to raise capital to refinance any maturing debt obligations, to support business growth at our insurance subsidiaries and to maintain or improve the current financial strength ratings of our principal insurance subsidiaries described in section titled “Ratings” in Item 1. Business. All of our ratings are subject to
89
revision or withdrawal at any time by the rating agencies, and therefore, no assurance can be given that we can maintain these ratings. Each rating should be evaluated independently of any other rating.
Preferred Stock
Our amended and restated memorandum of association and articles of association provide that we have the authority to issue
100,000,000
preferred shares, including the
275,000
shares of Series A Preferred Shares and the
100,000
Series B Preferred Shares issued on November 30, 2017. Subject to certain consent rights of the holders of the Series A Preferred Shares and the Series B Preferred Shares, we may issue additional series of preferred shares that would rank on parity with the Series A Preferred Shares and the Series B Preferred Shares as to liquidation preference. Under our amended and restated articles of association, our board of directors has the authority, subject to the provisions, if any, in our amended and restated memorandum of association and any rights attached to any existing shares, to issue preferred shares and to fix the preferred, deferred or other rights or restrictions, whether in regard to dividends or other distributions, voting, return of capital or otherwise, including varying such rights at such times and on such other terms as the board of directors thinks proper.
The Series A Preferred Shares and the Series B Preferred Shares (together, the “preferred shares”) do not have a maturity date and are non-callable for the first five years. The dividend rate of the preferred shares is 7.5% per annum, payable quarterly in cash or additional preferred shares, at the Company’s option, subject to increase beginning 10 years after issuance based on the then-current three-month LIBOR rate plus 5.5%. In addition, commencing 10 years after issuance of the preferred shares, and following a failed remarketing event, GSO and FNF will have the right to convert their preferred shares into a number of ordinary shares of the Company as determined by dividing (i) the aggregate par value (including dividends paid in kind and unpaid accrued dividends) of the preferred shares that GSO or FNF, as applicable, wishes to convert by (ii) the higher of (a) a 5% discount to the 30-day volume weighted average of the ordinary shares following the conversion notice, and (b) the then-current Floor Price. The “Floor Price” will be
$8.00
per share during the 11th year post-funding,
$7.00
per share during the 12th year post-funding, and
$6.00
during the 13th year post-funding and thereafter.
Because the board of directors has the power to establish the preferences and rights of the shares of preferred shares, it may afford holders of any preferred shares preferences, powers and rights, including voting and dividend rights, senior to the rights of holders of our ordinary stock, which could adversely affect the holders of the ordinary shares and could delay, discourage or prevent a takeover of us even if a change of control of our company would be beneficial to the interests of our shareholders.
FHLB
We are currently a member of the Federal Home Loan Bank of Atlanta (“FHLB”) and are required to maintain a collateral deposit that backs any funding agreements issued. We use these funding agreements as part of a spread enhancement strategy. We have the ability to obtain funding from the FHLB based on a percentage of the value of our assets, subject to the availability of eligible collateral. Collateral is pledged based on the outstanding balances of FHLB funding agreements. The amount of funding varies based on the type, rating and maturity of the collateral posted to the FHLB. Generally, U.S. government agency notes and mortgage-backed securities are pledged to the FHLB as collateral. Market value fluctuations resulting from changes in interest rates, spreads and other risk factors for each type of asset are monitored and additional collateral is either pledged or released as needed.
Our borrowing capacity under these credit facilities does not have an expiration date as long as we maintain a satisfactory level of creditworthiness based on the FHLB’s credit assessment. As of
December 31, 2019
and
December 31, 2018
, we had
$1,096
and
$878
in non-putable funding agreements, respectively, included under contract owner account balances on our consolidated balance sheet. As of
December 31, 2019
and
December 31, 2018
, we had assets with a fair value of approximately
$1,521
and
$1,414
, respectively, which collateralized the FHLB funding agreements. Assets pledged to the FHLB are included in fixed maturities, AFS, on our consolidated balance sheets.
Collateral-Derivative Contracts
Under the terms of our ISDA agreements, we may receive from, or deliver to, counterparties collateral to assure that all terms of the ISDA agreements will be met with regard to the Credit Support Annex (“CSA”). The terms of the CSA call for us to pay interest on any cash received equal to the federal funds rate. As of
December 31, 2019
and
December 31, 2018
,
$489
and
$59
collateral was posted by our counterparties as they did not meet the net exposure thresholds. Collateral requirements are monitored on a daily basis and incorporate changes in market
90
values of both the derivatives contract as well as the collateral pledged. Market value fluctuations are due to changes in interest rates, spreads and other risk factors.
Uses of Cash Flow
Contractual Obligations
The following table summarizes, as of
December 31, 2019
, our contractual obligations that were fixed and determinable and the payments due under those obligations in the following periods.
|
|
Payment Due by Period
|
|||||||||||||||||||
|
(Dollars in millions)
|
Total
|
Less than 1 year
|
1-3 years
|
3-5 years
|
More than 5 years
|
|||||||||||||||
|
Annuity and universal life products (a)
|
$
|
36,628
|
|
$
|
2,125
|
|
$
|
5,540
|
|
$
|
4,948
|
|
$
|
24,015
|
|
|||||
|
Operating leases
|
16
|
|
2
|
|
3
|
|
3
|
|
8
|
|
||||||||||
|
Debt
|
550
|
|
—
|
|
—
|
|
—
|
|
550
|
|
||||||||||
|
Interest expense
|
166
|
|
30
|
|
60
|
|
61
|
|
15
|
|
||||||||||
|
Total
|
$
|
37,360
|
|
$
|
2,157
|
|
$
|
5,603
|
|
$
|
5,012
|
|
$
|
24,588
|
|
|||||
|
(a)
|
Amounts shown in this table are projected payments through the year 2030 which we are contractually obligated to pay our annuity and IUL policyholders. The payments are derived from actuarial models which assume a level interest rate scenario and incorporate assumptions regarding mortality and persistency, when applicable. These assumptions are based on our historical experience, but actual amounts will differ.
|
Return of Capital to Common Stockholders
One of the Company’s primary goals is to provide a return to our common stockholders through share price accretion, dividends and stock repurchases. In determining dividends, the board of directors takes into consideration items such as current and expected earnings, capital needs, rating agency considerations and requirements for financial flexibility. The amount and timing of share repurchase depends on key capital ratios, rating agency expectations, the generation of free cash flow and an evaluation of the costs and benefits associated with alternative uses of capital.
In December 2018, the Company's board of directors authorized a share repurchase program of up to $150 of the Company's outstanding ordinary shares. This program will expire on December 15, 2020, and may be modified at any time. Under the share repurchase program, the Company may repurchase shares from time to time in open market transactions or through privately negotiated transactions in accordance with applicable federal securities laws. Repurchases may also be made pursuant to a trading plan under Rule 10b5-1 of the Exchange Act. The extent to which the Company repurchases its shares, and the timing of such purchases, will depend upon a variety of factors, including market conditions, regulatory requirements and other considerations, as determined by the Company. As of December 31, 2019, the Company has repurchased
8,652
thousand shares for a total cost of
$69
.
In December 2018, the Company’s board of directors approved the implementation of a quarterly cash dividend of $0.01 per ordinary share, beginning in the first quarter of fiscal year 2019. The dividend equates to $0.04 per share on a full-year basis.
Off-Balance Sheet Arrangements
Throughout our history, we have entered into indemnifications in the ordinary course of business with our customers, suppliers, service providers, business partners and in certain instances, when we sold businesses. Additionally, we have indemnified our directors and officers who are, or were, serving at our request in such capacities. Although the specific terms or number of such arrangements is not precisely known due to the extensive history of our past operations, costs incurred to settle claims related to these indemnifications have not been material to our financial statements. We have no reason to believe that future costs to settle claims related to our former operations will have a material impact on our financial position, results of operations or cash flows.
On November 30, 2017, FGLH and CF Bermuda, together as borrowers and each as a borrower, entered into the Credit Agreement with certain financial institutions party thereto, as lenders, and Royal Bank of Canada, as administrative agent and letter of credit issuer, which provides for a
$250
senior unsecured revolving credit facility with a maturity of three years. The Credit Agreement provides a letter of credit sub-facility in a maximum amount
91
of $
20
. The borrowers are permitted to use the proceeds of the loans under the Credit Agreement for working capital, growth initiatives and general corporate purposes, as well as to pay fees, commissions and expenses incurred in connection with the Credit Agreement and the transactions contemplated thereby. Amounts borrowed under the Credit Agreement may be reborrowed until the maturity date or termination of commitments under the Credit Agreement. The borrowers may increase the maximum amount of availability under the Credit Agreement from time to time by up to an aggregate amount not to exceed
$50
, subject to certain conditions, including the consent of the lenders participating in each such increase. As of
December 31, 2019
, the Company had not drawn on the revolver.
The Company has unfunded investment commitments as of
December 31, 2019
based upon the timing of when investments are executed compared to when the actual investments are funded, as some investments require that funding occur over a period of months or years. Please refer to "Note 4. Investments" and "Note 12. Commitments and Contingencies" to our audited
consolidated financial statements
for additional details on unfunded investment commitments.
|
Item 7A.
|
Quantitative and Qualitative Disclosures about Market Risk
|
Market Risk Factors
Market risk is the risk of the loss of fair value resulting from adverse changes in market rates and prices, such as interest rates, foreign currency exchange rates, commodity prices and equity prices. Market risk is directly influenced by the volatility and liquidity in the markets in which the related underlying financial instruments are traded. We have significant holdings in financial instruments and are naturally exposed to a variety of market risks. We are primarily exposed to interest rate risk, credit risk and equity price risk and have some exposure to counterparty risk, which affect the fair value of financial instruments subject to market risk.
Enterprise Risk Management
We place a high priority to risk management and risk control. As part of our effort to ensure measured risk taking, management has integrated risk management in our daily business activities and strategic planning. We have comprehensive risk management, governance and control procedures in place and have established a dedicated risk management function with responsibility for the formulation of our risk appetite, strategies, policies and limits. The risk management function is also responsible for monitoring our overall market risk exposures and provides review, oversight and support functions on risk-related issues. Our risk appetite is aligned with how our businesses are managed and how we anticipate future regulatory developments.
Our risk governance and control systems enable us to identify, control, monitor and aggregate risks and provide assurance that risks are being measured, monitored and reported adequately and effectively in accordance with the following three principles:
|
•
|
Management of the business has primary responsibility for the day-to-day management of risk.
|
|
•
|
The risk management function has the primary responsibility to align risk taking with strategic planning through risk tolerance and limit setting.
|
|
•
|
The internal audit function provides an ongoing independent and objective assessment of the effectiveness of internal controls, including financial and operational risk management.
|
The Chief Risk Officer (“CRO”) heads our risk management process and reports directly to our Chief Executive Officer (“CEO”). Our Enterprise Risk Committee discusses and approves all risk policies and reviews and approves risks associated with our activities. This includes volatility (affecting earnings and value), exposure (required capital and market risk) and insurance risks.
We have implemented several limit structures to manage risk. Examples include, but are not limited to, the following:
|
•
|
At-risk limits on sensitivities of regulatory capital to the capital markets provide the fundamental framework to manage capital markets risks including the risk of asset / liability mismatch;
|
|
•
|
Duration and convexity mismatch limits;
|
|
•
|
Credit risk concentration limits; and
|
|
•
|
Investment and derivative guidelines.
|
92
We manage our risk appetite based on two key risk metrics:
|
•
|
Regulatory Capital Sensitivities: the potential reduction, under a range of moderate to extreme capital markets stress scenarios, of the excess of available statutory capital above the minimum required under the NAIC regulatory RBC methodology; and
|
|
•
|
Earnings Sensitivities: the potential reduction in results of operations over a 30 year time horizon under the same moderate to extreme capital markets stress scenario. Maintaining a consistent level of earnings helps us to finance our operations, support our capital requirements and provide funds to pay dividends to stockholders.
|
Our risk metrics cover the most important aspects in terms of performance measures where risk can materialize and are representative of the regulatory constraints to which our business is subject. The sensitivities for earnings and statutory capital are important metrics since they provide insight into the level of risk we take under stress scenarios. They also are the basis for internal risk management.
We are also subject to cash flow stress testing pursuant to regulatory requirements. This analysis measures the effect of changes in interest rate assumptions on asset and liability cash flows. The analysis includes the effects of:
|
•
|
The timing and amount of redemptions and prepayments in our asset portfolio;
|
|
•
|
Our derivative portfolio;
|
|
•
|
Death benefits and other claims payable under the terms of our insurance products;
|
|
•
|
Lapses and surrenders in our insurance products;
|
|
•
|
Minimum interest guarantees in our insurance products; and
|
|
•
|
Book value guarantees in our insurance products.
|
Interest Rate Risk
Interest rate risk is our primary market risk exposure. We define interest rate risk as the risk of an economic loss due to adverse changes in interest rates. This risk arises from our holdings in interest sensitive assets and liabilities, primarily as a result of investing life insurance premiums and fixed annuity deposits received in interest-sensitive assets and carrying these funds as interest-sensitive liabilities. Substantial and sustained increases or decreases in market interest rates can affect the profitability of the insurance products and the fair value of our investments, as the majority of our insurance liabilities are backed by fixed maturity securities.
The profitability of most of our products depends on the spreads between interest yield on investments and rates credited on insurance liabilities. We have the ability to adjust the rates credited, primarily caps and credit rates, on the majority of the annuity liabilities at least annually, subject to minimum guaranteed values. In addition, the majority of the annuity products have surrender and withdrawal penalty provisions designed to encourage persistency and to help ensure targeted spreads are earned. However, competitive factors, including the impact of the level of surrenders and withdrawals, may limit our ability to adjust or maintain crediting rates at the levels necessary to avoid a narrowing of spreads under certain market conditions.
In order to meet our policy and contractual obligations, we must earn a sufficient return on our invested assets. Significant changes in interest rates exposes us to the risk of not earning the anticipated spreads between the interest rate earned on our investments and the credited interest rates paid on outstanding policies and contracts. Both rising and declining interest rates can negatively affect interest earnings, spread income and the attractiveness of certain of our products.
During periods of increasing interest rates, we may offer higher crediting rates on interest-sensitive products, such as IUL insurance and fixed annuities, and we may increase crediting rates on in-force products to keep these products competitive. A rise in interest rates, in the absence of other countervailing changes, will result in a decline in the market value of our investment portfolio.
As part of our asset liability management (“ALM”) program, we have made a significant effort to identify the assets appropriate to different product lines and ensure investing strategies match the profile of these liabilities. Our ALM strategy is designed to align the expected cash flows from the investment portfolio with the expected liability cash flows. As such, a major component of our effort to manage interest rate risk has been to structure the investment portfolio with cash flow characteristics that are consistent with the cash flow characteristics of the insurance liabilities. We use actuarial models to simulate the cash flows expected from the existing business under various interest rate scenarios. These simulations enable us to measure the potential gain or loss in the fair value
93
of interest rate-sensitive financial instruments, to evaluate the adequacy of expected cash flows from assets to meet the expected cash requirements of the liabilities and to determine if it is necessary to lengthen or shorten the average life and duration of our investment portfolio. Duration measures the price sensitivity of a security to a small change in interest rates. When the durations of assets and liabilities are similar, exposure to interest rate risk is minimized because a change in the value of assets could be expected to be largely offset by a change in the value of liabilities.
The duration of the investment portfolio, excluding cash and cash equivalents, derivatives, policy loans, and common stocks as of
December 31, 2019
, is summarized as follows:
|
(Dollars in millions)
|
|||||||
|
Duration
|
Amortized Cost
|
|
% of Total
|
|
|||
|
0-4
|
$
|
11,195
|
|
43
|
%
|
||
|
5-9
|
6,406
|
|
24
|
%
|
|||
|
10-14
|
5,854
|
|
22
|
%
|
|||
|
15-19
|
2,959
|
|
11
|
%
|
|||
|
20-25
|
36
|
|
—
|
%
|
|||
|
Total
|
$
|
26,450
|
|
100
|
%
|
||
Credit Risk and Counterparty Risk
We are exposed to the risk that a counterparty will default on its contractual obligation resulting in financial loss. The major source of credit risk arises predominantly in our insurance operations’ portfolios of debt and similar securities. The fair value of our fixed maturity portfolio totaled
$24 billion
and
$21 billion
at
December 31, 2019
and
December 31, 2018
, respectively. Our credit risk materializes primarily as impairment losses. We are exposed to occasional cyclical economic downturns, during which impairment losses may be significantly higher than the long-term historical average. This is offset by years where we expect the actual impairment losses to be substantially lower than the long-term average. Credit risk in the portfolio can also materialize as increased capital requirements as assets migrate into lower credit qualities over time. The effect of rating migration on our capital requirements is also dependent on the economic cycle and increased asset impairment levels may go hand in hand with increased asset related capital requirements.
We attempt to manage the risk of default and rating migration by applying disciplined credit evaluation and underwriting standards and limiting allocations to lower quality, higher risk investments. In addition, we diversify our exposure by issuer and country, using rating based issuer and country limits. We also set investment constraints that limit our exposure by industry segment. To limit the impact that credit risk can have on earnings and capital adequacy levels, we have portfolio-level credit risk constraints in place. Limit compliance is monitored on a monthly or, in some cases, daily basis.
In connection with the use of call options, we are exposed to counterparty credit risk-the risk that a counterparty fails to perform under the terms of the derivative contract. We have adopted a policy of only dealing with credit worthy counterparties and obtaining sufficient collateral where appropriate, as a means of attempting to mitigate the financial loss from defaults. The exposure and credit rating of the counterparties are continuously monitored and the aggregate value of transactions concluded is spread amongst different approved counterparties to limit the concentration in one counterparty. Our policy allows for the purchase of derivative instruments from counterparties and/or clearinghouses that meet the required qualifications under the Iowa Code. The Company reviews the ratings of all the counterparties periodically. Collateral support documents are negotiated to further reduce the exposure when deemed necessary. See "Note 5. Derivative Financial Instruments" to our audited
consolidated financial statements
for additional information regarding our exposure to credit loss.
94
We also have credit risk related to the ability of reinsurance counterparties to honor their obligations to pay the contract amounts under various agreements. To minimize the risk of credit loss on such contracts, we diversify our exposures among many reinsurers and limit the amount of exposure to each based on credit rating. We also generally limit our selection of counterparties with which we do new transactions to those with an “A-” credit rating or above and/or that are appropriately collateralized and provide credit for reinsurance. When exceptions are made to that principle, we ensure that we obtain collateral to mitigate our risk of loss. The following table presents our reinsurance recoverable balances and financial strength ratings for our five largest reinsurance recoverable balances as of
December 31, 2019
:
|
(Dollars in millions)
|
Financial Strength Rating
|
|||||||||
|
Parent Company/Principal Reinsurers
|
Reinsurance Recoverable
|
AM Best
|
S&P
|
Fitch
|
Moody's
|
|||||
|
Wilton Re
|
1,496
|
A+
|
Not Rated
|
A+
|
Not Rated
|
|||||
|
Kubera Insurance (SAC) Ltd
|
842
|
Not Rated
|
Not Rated
|
Not Rated
|
Not Rated
|
|||||
|
Security Life of Denver
|
156
|
Not Rated
|
A+
|
A
|
A3
|
|||||
|
Hannover Re
|
131
|
A+
|
AA-
|
Not Rated
|
Not Rated
|
|||||
|
London Life
|
107
|
A+
|
Not Rated
|
Not Rated
|
Not Rated
|
|||||
In the normal course of business, certain reinsurance recoverables are subject to reviews by the reinsurers. We are not aware of any material disputes arising from these reviews or other communications with the counterparties as of
December 31, 2019
that would require an allowance for uncollectible amounts.
Through FSRC and F&G Re, the Company is exposed to insurance counterparty risk, which is the potential for FSRC and F&G Re to incur losses due to a client or partner becoming distressed or insolvent. This includes run-on-the-bank risk and collection risk. The run-on-the-bank risk is that a client’s in force block incurs substantial surrenders and/or lapses due to credit impairment, reputation damage or other market changes affecting the counterparty. Substantially higher than expected surrenders and/or lapses could result in inadequate in force business to recover cash paid out for acquisition costs. The collection risk for clients includes their inability to satisfy a reinsurance agreement because the right of offset is disallowed by the receivership court; the reinsurance contract is rejected by the receiver, resulting in a premature termination of the contract; and/or the security supporting the transaction becomes unavailable to FSRC and F&G Re.
FSRC and F&G Re are exposed to the risk that a counterparty will default on its contractual obligation resulting in financial loss. The major source of credit risk arises predominantly in FSRC and F&G Re’s funds withheld receivables portfolio that consists primarily of debt and equity securities. FSRC and F&G Re’s credit risk materializes primarily as impairment losses. FSRC and F&G Re are exposed to occasional cyclical economic downturns, during which impairment losses may be significantly higher than the long-term historical average. This is offset by years where FSRC and F&G Re expect the actual impairment losses to be substantially lower than the long-term average. Credit risk in the portfolio can also materialize as increased capital requirements as assets migrate into lower credit qualities over time. The effect of rating migration on FSRC and F&G Re’s capital requirements is also dependent on the economic cycle and increased asset impairment levels may go hand in hand with increased asset related capital requirements.
FSRC and F&G Re assume reinsurance business from counterparties that seek to manage the risk of default and rating migration by applying credit evaluation and underwriting standards and limiting allocations to lower quality, higher risk investments. In addition, FSRC and F&G Re’s reinsurance counterparties diversify their exposure by issuer and country, using rating based issuer and country limits and set investment constraints that limit its exposure by industry segment. To limit the impact that credit risk can have on earnings and capital adequacy levels, FSRC and F&G Re have portfolio-level credit risk constraints in place. Limit compliance is monitored on a daily or, in some cases, monthly basis.
95
Equity Price Risk
We are primarily exposed to equity price risk through certain insurance products, specifically those products with GMWB. We offer a variety of FIA contracts with crediting strategies linked to the performance of indices such as the S&P 500 Index, Dow Jones Industrials or the NASDAQ 100 Index. The estimated cost of providing GMWB incorporates various assumptions about the overall performance of equity markets over certain time periods. Periods of significant and sustained downturns in equity markets, increased equity volatility or reduced interest rates could result in an increase in the valuation of the future policy benefit or policyholder account balance liabilities associated with such products, resulting in a reduction in our net income (loss). The rate of amortization of intangibles related to FIA products and the cost of providing GMWB could also increase if equity market performance is worse than assumed.
To economically hedge the equity returns on these products, we purchase derivatives to hedge the FIA equity exposure. The primary way we hedge FIA equity exposure is to purchase over the counter equity index call options from broker-dealer derivative counterparties approved by the Company. The second way to hedge FIA equity exposure is by purchasing exchange traded equity index futures contracts. Our hedging strategy enables us to reduce our overall hedging costs and achieve a high correlation of returns on the call options purchased relative to the index credits earned by the FIA contractholders. The majority of the call options are one-year options purchased to match the funding requirements underlying the FIA contracts. These hedge programs are limited to the current policy term of the FIA contracts, based on current participation rates. Future returns, which may be reflected in FIA contracts’ credited rates beyond the current policy term, are not hedged. We attempt to manage the costs of these purchases through the terms of our FIA contracts, which permit us to change caps or participation rates, subject to certain guaranteed minimums that must be maintained.
The derivatives are used to fund the FIA contract index credits and the cost of the call options purchased is treated as a component of spread earnings. While the FIA hedging program does not explicitly hedge GAAP income volatility, the FIA hedging program tends to mitigate a significant portion of the GAAP reserve changes associated with movements in the equity market and risk-free rates. This is due to the fact that a key component in the calculation of GAAP reserves is the market valuation of the current term embedded derivative. Due to the alignment of the embedded derivative reserve component with hedging of this same embedded derivative, there should be a reasonable match between changes in this component of the reserve and changes in the assets backing this component of the reserve. However, there may be an interim mismatch due to the fact that the hedges which are put in place are only intended to cover exposures expected to remain until the end of an indexing term. To the extent index credits earned by the contractholder exceed the proceeds from option expirations and futures income, we incur a raw hedging loss.
See "Note 5. Derivative Financial Instruments" to our audited
consolidated financial statements
for additional details on the derivatives portfolio.
Fair value changes associated with these investments are intended to, but do not always, substantially offset the increase or decrease in the amounts added to policyholder account balances for index products. When index credits to policyholders exceed option proceeds received at expiration related to such credits, any shortfall is funded by our net investment spread earnings and futures income. For the years ended
December 31, 2019
and
December 31, 2018
, the annual index credits to policyholders on their anniversaries were $
196
and
$379
, respectively. Proceeds received at expiration on options related to such credits were $
214
and
$384
, respectively.
Other market exposures are hedged periodically depending on market conditions and our risk tolerance. The FIA hedging strategy economically hedges the equity returns and exposes us to the risk that unhedged market exposures result in divergence between changes in the fair value of the liabilities and the hedging assets. We use a variety of techniques including direct estimation of market sensitivities and value-at-risk to monitor this risk daily. We intend to continue to adjust the hedging strategy as market conditions and risk tolerance change.
Sensitivity Analysis
The analysis below is hypothetical and should not be considered a projection of future risks. Earnings projections are before tax and non-controlling interest.
Interest Rate Risk
We assess interest rate exposures for financial assets, liabilities and derivatives using hypothetical test scenarios that assume either increasing or decreasing
100
basis point parallel shifts in the yield curve, reflecting changes in either credit spreads or risk-free rates.
96
If interest rates were to increase
100
basis points from levels at
December 31, 2019
, the estimated fair value of our fixed maturity securities would decrease by approximately
$1,697
. The impact on shareholders’ equity of such decrease, net of income taxes (assumes a 21% tax rate) and intangibles adjustments, and the change in reinsurance related derivative would be a decrease of
$1,093
in AOCI and in total shareholders’ equity. If interest rates were to decrease by
100
basis points from levels at
December 31, 2019
, the estimated impact on the FIA embedded derivative liability of such a decrease would be an increase of
$284
.
The actuarial models used to estimate the impact of a
one
percentage point change in market interest rates incorporate numerous assumptions, require significant estimates and assume an immediate and parallel change in interest rates without any management of the investment portfolio in reaction to such change. Consequently, potential changes in value of financial instruments indicated by these simulations will likely be different from the actual changes experienced under given interest rate scenarios, and the differences may be material. Because we actively manage our investments and liabilities, the net exposure to interest rates can vary over time. However, any such decreases in the fair value of fixed maturity securities, unless related to credit concerns of the issuer requiring recognition of an OTTI, would generally be realized only if we were required to sell such securities at losses prior to their maturity to meet liquidity needs. Our liquidity needs are managed using the surrender and withdrawal provisions of the annuity contracts and through other means.
Equity Price Risk
Assuming all other factors are constant, we estimate that a decline in equity market prices of
10%
would cause the market value of our equity investments to decrease by approximately
$107
, our call option investments to decrease by approximately
$20
based on equity positions and our FIA embedded derivative liability to decrease by approximately
$49
as of
December 31, 2019
. Due to the adoption of ASU 2016-01, the
10%
decline in market value of our equity securities would affect current earnings. These scenarios consider only the direct effect on fair value of declines in equity market levels and not changes in asset-based fees recognized as revenue, or changes in our estimates of total gross profits used as a basis for amortizing intangibles.
Item 8.
Financial Statements and Supplementary Data
The Reports of the Independent Registered Public Accounting Firm, the Company’s consolidated financial statements and notes to the Company’s consolidated financial statements appear in a separate section of this Form 10-K (beginning on Page F-2 following Part IV). The index to the Company’s consolidated financial statements appears on Page F-1.
Item 9.
Changes in and Disagreements with Accountants on Accounting and Financial Disclosure
None.
|
Item 9A.
|
Controls and Procedures
|
Evaluation of Disclosure Controls and Procedures
An evaluation was performed under the supervision and participation of the Company’s management, including the Chief Executive Officer ("CEO") and Chief Financial Officer ("CFO"), of the effectiveness of the design and operation of the Company’s disclosure controls and procedures (as defined in Rules 13a-15(e) and 15d-15(e) of the Securities Exchange Act of 1934, as amended (the "Exchange Act")), as of the end of the period covered by this report. Based on that evaluation, the Company’s management, including the CEO and CFO, concluded that, as of
December 31, 2019
, the Company’s disclosure controls and procedures were effective to ensure that information we are required to disclose in reports that we file or submit under the Exchange Act is recorded, processed, summarized and reported within the time periods specified in the SEC’s rules and forms, and is accumulated and communicated to the Company’s management, including the Company’s CEO and CFO, as appropriate to allow timely decisions regarding required disclosure.
Notwithstanding the foregoing, there can be no assurance that the Company’s disclosure controls and procedures will detect or uncover all failures of persons within the Company to disclose material information otherwise required to be set forth in the Company’s periodic reports. There are inherent limitations to the effectiveness of any system of disclosure controls and procedures, including the possibility of human error and the circumvention or overriding of the controls and procedures. Accordingly, even effective disclosure controls and procedures can only provide reasonable, not absolute, assurance of achieving their control objectives.
97
Management’s Report on Internal Control Over Financial Reporting
The Company’s management is responsible for establishing and maintaining adequate internal control over financial reporting for the Company, as such term is defined in Exchange Act Rules 13a-15(f) and 15d-15(f). Internal control over financial reporting is a process designed to provide reasonable assurance regarding the reliability of financial reporting and the preparation of financial statements for external purposes in accordance with generally accepted accounting principles. Internal control over financial reporting includes those policies and procedures that: (i) pertain to the maintenance of records that, in reasonable detail, accurately and fairly reflect the transactions and dispositions of the Company’s assets; (ii) provide reasonable assurance that transactions are recorded as necessary to permit preparation of the financial statements in accordance with generally accepted accounting principles, and that receipts and expenditures are being made only with proper authorizations; and (iii) provide reasonable assurance regarding prevention or timely detection of unauthorized acquisition, use or disposition of the Company’s assets that could have a material effect on the financial statements.
Because of its inherent limitations, internal control over financial reporting may not prevent or detect misstatements. These inherent limitations are an intrinsic part of the financial reporting process. Therefore, although the Company’s management is unable to eliminate this risk, it is possible to develop safeguards to reduce it. Also, projections of any evaluation of effectiveness to future periods are subject to the risk that controls may become inadequate because of changes in conditions, or that the degree of compliance with the policies or procedures may deteriorate.
The Company's management, under the supervision of and with the participation of the CEO and CFO, assessed the effectiveness of the Company's internal control over financial reporting as of December 31, 2019 based on criteria for effective control over financial reporting described in Internal Control - Integrated Framework issued by the Committee of Sponsoring Organizations of the Treadway Commission ("COSO") in 2013. Based on this assessment the Company's management concluded that its internal control over financial reporting was effective as of December 31, 2019 in accordance with the COSO criteria. The Company's independent registered public accounting firm, KPMG LLP, has issued an attestation report on the effectiveness of the Company's internal control over financial reporting, which is included herein.
Changes in Internal Control Over Financial Reporting
An evaluation was performed under the supervision of the Company's management, including the CEO and CFO, of whether any change in the Company's internal control over financial reporting (as defined in the Exchange Act Rules 13a-15(f) and 15d-15(f)) occurred during the quarter ended December 31, 2019.
Based on that evaluation, the Company’s management, including the CEO and CFO, concluded that no change in the Company’s internal control over financial reporting occurred during the quarter ended December 31, 2019 that has materially affected, or is reasonably likely to materially affect, the Company’s internal control over financial reporting.
Limitations on the Effectiveness of Controls
A control system, no matter how well conceived and operated, can provide only reasonable, not absolute, assurance that the objectives of the control system are met. Because of the inherent limitations in all control systems, no evaluation of controls can provide absolute assurance that all control issues and instances of fraud, if any, within the Company have been detected.
Disclosure pursuant to Item 5.02(e) of Form 8-K
On February 25, 2020, the Compensation Committee approved Transaction Bonus Letter Agreements with each of our named executive officers to reward them for the critical role they are performing in working towards the closing of the FNF Merger.
Under the Transaction Bonus Letter Agreements, each executive is eligible to receive a specified cash transaction bonus, as set forth below, subject to the occurrence of the closing of the FNF Merger and the executive’s continued employment through the date of the closing. Such bonuses would be paid out within 30 days following the date of closing. Executives will no longer be eligible to receive a Transaction Bonus if their employment is
98
terminated for any reason prior to the closing date, or if the Merger Agreement with FNF is terminated prior to closing.
|
Potential Transaction Bonus
|
|||
|
Christopher Blunt
|
$
|
400,000
|
|
|
John Fleurant
|
$
|
250,000
|
|
|
Raj Krishnan
|
$
|
200,000
|
|
|
Bonnie Wasgatt
|
$
|
200,000
|
|
|
Alex Castillo
|
$
|
200,000
|
|
The foregoing description is qualified in its entirety by the form of Transaction Bonus Letter Agreement, which is filed as an exhibit to this Form 10-K.
99
Our Directors
|
Name
|
Age (a)
|
Director Since
|
Class (b)
|
Position
|
Pursuant to Nominating Agreement (c)
|
|
William P. Foley, II
|
75
|
2016
|
A
|
Co-Chairman and Director
|
*
|
|
Keith W. Abell
|
62
|
2017
|
A
|
Director
|
|
|
Richard M. Massey
|
64
|
2016
|
A
|
Director
|
|
|
Chinh E. Chu
|
53
|
2016
|
B
|
Co-Chairman and Director
|
*
|
|
Patrick S. Baird
|
66
|
2017
|
B
|
Director
|
|
|
James A. Quella
|
70
|
2016
|
B
|
Director
|
|
|
Christopher O. Blunt
|
57
|
2019
|
C
|
Chief Executive Officer, President and Director
|
|
|
Menes O. Chee
|
42
|
2017
|
C
|
Director
|
*
|
|
Timothy M. Walsh
|
57
|
2017
|
C
|
Director
|
|
|
a.
|
The respective age of each individual is as of February 15, 2020.
|
|
b.
|
Our Board is divided into three classes of as nearly equal number of directors as possible. Any additional directorships resulting from an increase in the number of directors will be distributed among the three classes so that, as nearly as possible, each class will consist of one-third of the directors. The term of each class of directors is three years, with the term for one class expiring each year in rotation. As a result, one class of directors is elected at each annual shareholders meeting for a term of three years, to hold office until their successors are elected and qualified or until their earlier death, removal or resignation. The term of the current Class A directors will expires at our 2020 annual meeting.
|
|
c.
|
The company is a party to a nominating and voting agreement (the “Nominating and Voting Agreement”) with Messrs. Foley and Chu, and BTO (the “Nominating Parties”). The Nominating and Voting Agreement is intended to preserve continuity of leadership of the founding sponsors and lead investor to preserve the F&G investment thesis and long-term perspective upon which the company was founded. Pursuant to the Nominating and Voting Agreement, if the Nominating Parties and their respective affiliates own, in the aggregate, directly or indirectly, at least 20% of the issued and outstanding ordinary shares, the Nominating Parties will have the right to designate one director nominee for election at each general meeting of the company. If the Nominating Parties and their respective affiliates own, in the aggregate, directly or indirectly, at least 12% but less than 20% of the issued and outstanding ordinary shares (the “Two Director Range”), the Nominating Parties will have the right to designate one director nominee for each of the two director classes (the “Two Director Classes”) to be voted on at the two general meetings of the company immediately after the aggregate ownership of ordinary shares comes within the Two Director Range and for each subsequent meeting at which one of the Two Director Classes is to be voted on by the shareholders, provided that such aggregate ownership remains within the Two Director Range at the time of each such nomination. If the Nominating Parties and their respective affiliates own, in the aggregate, directly or indirectly, at least 5% but less than 12% of the issued and outstanding ordinary shares (the “One Director Range”), the Nominating Parties will have the right to designate one director nominee for the class of directors (the “One Director Class”) to be voted on at the general meeting of the company immediately after the aggregate ownership of ordinary shares comes within the One Director Range and for each subsequent meeting at which the One Director Class is to be voted on by the shareholders, provided that such aggregate ownership remains within the One Director Range at the time of each such nomination. Director nominees selected under the Nominating and Voting Agreement will be selected by the vote of any two of Mr. Chu, Mr. Foley and BTO. In addition, pursuant to the Nominating and Voting Agreement, each of Mr. Foley, Mr. Chu and BTO agreed to vote for each director so nominated. Our Nominating and Corporate Governance Committee and our Board recommend each nominee for director to our shareholders to be elected at our annual meetings.
|
Class A Directors - Terms Expiring in 2020
Keith W. Abell
joined our Board in May 2017. Mr. Abell is the co-founder of Sungate Properties, LLC, a real estate investment company, which he co-founded in 2010, and is the founder of Snowridge Investments, which establishes strategic partnerships between U.S. fund managers and Chinese financial institutions, which he founded in 2015. From 1994 to 2007, Mr. Abell was a co-founder of, and served in a variety of senior management roles at, GSC Group (and its predecessor, Greenwich Street Capital Partners, L.P.), an alternative asset manager. From 1990 to 1994, Mr. Abell was a managing director at Blackstone where he, among other things, founded the firm’s first Hong Kong office. From 1986 to 1990, Mr. Abell was a vice president at Goldman, Sachs & Co. where he worked in the global finance, corporate finance and mergers and acquisitions departments. Mr. Abell serves as the treasurer and as a director of the National Committee on United States-China Relations. Mr. Abell serves as a director of Graf Industrial Corp. Throughout his career, Mr. Abell has served as a director of a number of public, private and not-for-profit entities.
100
Mr. Abell’s qualifications to serve on our Board include: his extensive experience in corporate finance, private equity and mergers and acquisitions.
William P. Foley, II
has served as Co-Executive Chairman of FGL Holdings since 2016. Mr. Foley is a founder of FNF and has served as Chairman of FNF’s board of directors since 1984. He served as Chief Executive Officer of FNF until May 2007 and as President of FNF until December 1994. Mr. Foley also serves as Chairman of the board of directors of Black Knight, Inc. since December 2014, and as Chairman of Cannae Holdings, Inc. since July 2017. Mr. Foley also serves as Chairman of The Dun & Bradstreet Corporation, which is privately held. Mr. Foley serves on the boards of directors of The Foley Family Charitable Foundation and the Cummer Museum of Arts and Gardens. He is a founder, trustee and director of The Folded Flag Foundation. Mr. Foley is also Executive Chairman and Chief Executive Officer of Black Knight Sports and Entertainment LLC, which is the private company that owns the Vegas Golden Knights, a National Hockey League team. Within the past five years, Mr. Foley served as Vice Chairman of Fidelity National Information Services, Inc. (FIS), and as a director of Ceridian HCM Holding Inc. After receiving his B.S. degree in engineering from the United States Military Academy at West Point, Mr. Foley served in the U.S. Air Force, where he attained the rank of captain.
Mr. Foley’s qualifications to serve on our Board include more than 30 years as a director and executive officer of FNF, his long and deep knowledge of our business and industry, his strategic vision, his experience as a board member and executive officer of public and private companies in a wide variety of industries, and his strong track record of building and maintaining shareholder value and successfully negotiating and implementing mergers and acquisitions. Mr. Foley provides high value-added services ot the Company and has sufficient time to focus on FGL Holdings.
Richard N. Massey
joined our Board in May 2016. Since 2009, Mr. Massey has been a partner of Westrock Capital, LLC, a private investment partnership. Mr. Massey was Chief Strategy Officer and General Counsel of Alltel Corporation, or Alltel, from 2006 to 2009. Alltel, the fifth-largest wireless carrier in the United States as of 2009, was acquired by its management and a consortium of private equity investors in 2007 and sold to Verizon Communications, Inc. in 2009 for approximately $29 billion. Since 2006, Mr. Massey has served as a director of FNF. Mr. Massey also serves as a director of Black Knight and ServiceLink Holdings, LLC, as Chairman of the board of directors of Bear State Financial, Inc., as a director of Oxford American Literary Project, a non-profit literary publication, and as Chairman of the board of directors of the Arkansas Razorback Foundation. Mr. Massey served as a director of Fidelity National Information Services, Inc. (“FIS”) until May 2017 and has also served as a director of various other private companies. Mr. Massey received a B.A. and a J.D., with high honors, from the University of Arkansas.
Mr. Massey’s qualifications to serve on the board of directors include his experience in corporate finance and investment banking and as a financial and legal advisor to public and private businesses, as well as his expertise in identifying, negotiating and consummating mergers and acquisitions.
Class B Directors - Terms Expiring in 2021
Chinh E. Chu
joined our Board as Co-Chairman in April 2016. Mr. Chu is the Founder and Managing Partner at CC Capital, a private investment firm which he founded in 2015. Before founding CC Capital, Mr. Chu worked at Blackstone from 1990 to 2015. Blackstone is a leading global alternative asset manager, with total assets under management of $366.6 billion as of December 31, 2016. Mr. Chu was a Senior Managing Director at Blackstone since 2000, and previously served as Co-Chair of Blackstone’s Private Equity Executive Committee and was a member of Blackstone’s Executive Committee. Mr. Chu currently serves as a Director of Catalent, Inc., Stearns Mortgage, and NCR Corporation. Mr. Chu previously served as a Director of Kronos Incorporated, SunGard Data Systems, Inc., Stiefel Laboratories, Freescale Semiconductor, Ltd. Biomet, Inc., Alliant, Celanese Corporation, Nalco Company, DJO Global, Inc., HealthMarkets, Inc., Nycomed, Alliant Insurance Services, Inc., the London International Financial Futures and Options Exchange, or LIFFE, Graham Packaging, and AlliedBarton Security Services. Before joining Blackstone in 1990, Mr. Chu worked at Salomon Brothers in the Mergers & Acquisitions Department. Mr. Chu received a B.S. in Finance from the University of Buffalo.
Mr. Chu’s qualifications to serve on our Board include: his substantial experience in mergers and acquisitions, corporate finance and strategic business planning; his track record at Blackstone and in advising and managing multi-national companies; and his experience serving as a director for various public and private companies.
Patrick S. Baird
joined our Board in November 2017. From March 2002 until his retirement in January 2010, Mr. Baird served as the President and Chief Executive Officer of AEGON USA, LLC, the U.S. subsidiary of AEGON
101
N.V., a leading multinational insurance organization (“AEGON”). He continues to serve AEGON with certain projects and is currently assisting AEGON with its expansion activities in Latin America. Mr. Baird joined the AEGON USA companies in 1976, and during his career also served as Executive Vice President and Chief Operating Officer, Chief Financial Officer and Chief Tax Officer. Mr. Baird currently serves as Chairman of QCR Holdings, Inc., a publicly traded community bank holding company in Moline, Illinois, and two of its subsidiaries, Cedar Rapids Bank and Trust Company and m2 Lease Funds. He is also a director of Lombard International, a specialty life insurance company based in Luxembourg and Philadelphia, Pennsylvania. Mr. Baird is a Commissioner for the Eastern Iowa Airport, a founding board member and Treasurer of the Zach Johnson Foundation and a member of the board of directors of the Creative Corridor Economic Development Partnership. He also served as a director of National Financial Partners Corp. until its sale in 2013. Mr. Baird holds a Bachelor of Business Administration from the University of Iowa and is a Certified Public Accountant (inactive).
Mr. Baird’s qualifications to serve on our Board include: his wide-ranging experience in the insurance industry; his extensive financial and accounting knowledge; his strong track record as an executive officer of AEGON; and his experience as a board member of various companies.
James A. Quella
joined our Board in May 2016. Since 2013, Mr. Quella has served as a Senior Advisor at Blackstone. On June 30, 2013, Mr. Quella retired as a Senior Managing Director and Senior Operating Partner at Blackstone, where he worked since 2004. Mr. Quella was responsible for monitoring the strategy and operational performance of Blackstone’s portfolio companies and providing direct assistance in the oversight of large investments. Mr. Quella has been a Director of Michaels Stores, Inc. since 2006 and has been an Independent Director of The Michaels Companies, Inc. since 2013. Mr. Quella has been a Director of Catalent, Inc. since 2009 and a Director of DJO Finance LLC and DJO Global Inc. since 2012. While at Blackstone, Mr. Quella also served as a Director at The Columbia House Company from 2004 to 2005. Mr. Quella served as a Director of Celanese Emulsions GmbH and Celanese Corporation from 2004 to 2007. He served as a Director of Houghton Mifflin Harcourt Publishing Company from 2005 to 2006. Mr. Quella served as a Director of Allied Waste Industries, Inc. from 2005 to 2008. He served as a Director and Vice President, Assistant Secretary and Assistant Treasurer Graham Packaging Holdings Company from 2005 to 2010. Mr. Quella served as Member of Supervisory Board at Nielsen Holdings plc (also known as Nielsen Holdings N.V.) from 2006 to 2009. He served as a Director of Intelenet Global Services from 2007 to 2011, a Director of Vanguard Health Systems Inc. from 2007 to 2011, a Director of Freescale Semiconductor, Ltd. from 2008 to February 2011 and from August, 2011 to 2015. Independently, Mr. Quella was a Director of Lionbridge Technologies Inc. from 2015-2017.
Previous to his experience at Blackstone, Mr. Quella held various positions at Donaldson, Lufkin & Jenrette Merchant Banking Partners-CSFB Private Equity. Mr. Quella served as Managing Director and Senior Operating Partner at Credit Suisse Private Equity, LLC (formerly, CSFB Private Equity) from 2000 to 2004. While at DLJ Merchant Banking Partners-CSFB Private Equity, Mr. Quella served as a member of various private equity company Boards including as a Director of Merrill Corporation from 2000 to 2004. He served as a Director of Von Hoffmann Holdings Inc. and Von Hoffmann Corporation from 2000 to 2004. Mr. Quella served as a Director of Advanstar Holdings Inc., from 2000 to 2004, a Director of DeCrane Aerospace, Inc. (formerly Decrane Aircraft Holdings Inc.) and DeCrane Holdings Co. from 2003 to 2004, and a Director of Jostens, Inc. from 2003 to 2004.
From 1981 to 2000, Mr. Quella worked at Oliver Wyman, Inc., (Mercer Management Consulting and Strategic Planning Associates) where he served as a Senior Consultant to Chief Executive Officers and senior management teams and served as a Co-Vice Chairman from 1997 to 2000 with shared responsibility for overall management of the global firm. In 1992, he founded the Financial Services Practice Group and also managed it until 1995.
Mr. Quella is a co-author of Profit Patterns: 30 Ways to Anticipate and Profit from the Strategic Forces Reshaping Your Business. Mr. Quella received his Masters of Business Administration, with Dean’s honors, from the University of Chicago Graduate School of Business, and a B.A. in International Studies from the University of Chicago and University of Wisconsin-Madison.
Mr. Quella’s qualifications to serve on our Board include: his substantial experience in managing businesses; his experience in mergers and acquisitions; his familiarity with corporate finance and strategic business planning activities; and his extensive experience serving as a director for various public and private companies.
102
Class C Directors - Terms Expiring in 2022
Christopher O. Blunt
joined our company as President and Chief Executive Officer and joined our Board in January 2019. Mr. Blunt previously served as a Senior Managing Director and Chief Executive Officer of Blackstone Insurance Solutions, beginning in January 2018. Before joining Blackstone Insurance Solutions, Mr. Blunt served in a variety of senior leadership positions with New York Life from 2004 to 2017. During his tenure at New York Life, Mr. Blunt served as the President of New York Life’s Investment Group and prior to that, as Co-President of the Insurance and Agency Group, which included the company’s U.S. Life Operations, Seguros Monterrey New York Life Mexico and AARP Operations. Prior to joining New York Life, Mr. Blunt was Chairman and Chief Executive Officer of Giving Capital, Inc., a wealth management solutions provider serving the financial institutions marketplace, from 2001 to 2004. Mr. Blunt served in a variety of senior marketing and distribution roles in the investment management industry. Mr. Blunt was the Chief Marketing Officer - Americas for Merrill Lynch Investment Managers and President of Mercury Funds Distributors from 1999 to 2001. Before working with Merrill Lynch, Mr. Blunt was a Managing Director with Goldman Sachs & Co., as well as the National Sales Manager for Goldman Sachs Funds, from 1996 to 1999. He currently serves as Chair of the Board of Directors of the YMCA of Greater New York. Mr. Blunt received a B.A. in History from the University of Michigan and an MBA in Finance from The Wharton School at the University of Pennsylvania.
Menes O. Chee
joined our Board in November 2017. Mr. Chee is a Senior Managing Director and founding member of Blackstone’s Tactical Opportunities Group. He is responsible for sourcing, evaluating and executing investments in private opportunities and capital markets. Mr. Chee is a member of the investment committees of Tactical Opportunities. Mr. Chee joined Blackstone in 2009 as a Managing Director of GSO and transferred to Tactical Opportunities in 2012. Before joining Blackstone, Mr. Chee was a Principal in TPG-Axon Capital, where he invested globally in equity and credit public markets and private transactions. Prior to that, he was a private equity investment professional with Texas Pacific Group. Before TPG, Mr. Chee worked at Credit Suisse First Boston in the Merchant Banking Group and at Donald Lufkin & Jenrette in the Leveraged Finance Group.
Mr. Chee currently serves on the boards of Lombard International, Philadelphia Financial Group, Finance of America, DRB Capital, Viva Capital, and Ellington Residential Mortgage REIT. He graduated magna cum laude from the University of Pennsylvania with a B.S. in Economics from the Wharton School and a B.A. from the College of Arts and Sciences, where he was elected Phi Beta Kappa.
Mr. Chee’s qualifications to serve on our Board include: his strong track record as Senior Managing Director of Blackstone’s Tactical Opportunities Group and his extensive experience in corporate finance and private equity.
Timothy M. Walsh
joined our Board in November 2017. He is currently a Director of Strategic Relationships for Owl Rock Capital Partners, a direct lending business development corporation. In addition, he is an investment advisor to the $55 billion Alaska Permanent Fund Corporation and an independent trustee to Blackstone Mortgage Trust, Inc. From 2013 to 2015, he served as President of Gaw Capital USA, a California-based private equity real estate firm. He served as Chief Investment Officer for the State of New Jersey’s Division of Investment from 2010 to 2013, where he served as the chief fiduciary for the approximately $70 billion New Jersey pension fund as well as approximately $15 billion in money market funds, deferred compensation plans and college savings plans. Prior to joining the State of New Jersey, he was the Chief Investment Officer managing the $8 billion Indiana State Teachers’ Retirement Fund. Before joining the Indiana State Teachers’ Retirement Fund, he was head of investor relations for a global macro hedge fund, VARA Capital Management, and a vice president and senior trader in fixed income securities and foreign currencies for several large money center banks in Chicago, Illinois. Mr. Walsh founded an investment advisory firm, Walsh Financial Services that provided wealth management services for individuals, private trusts and corporate clients. He served on the board of directors of Ambassadors Corp. from 2012 to 2014 and has also been a board member of various privately held companies, a trustee of the Indiana State Teachers’ Retirement Fund and a Commissioner of the Indiana Gaming Commission. Mr. Walsh holds a B.S. from Merrimack College and an MBA from the Kellogg School of Management at Northwestern University.
Mr. Walsh’s qualifications to serve on our Board include: his over 30 years in the investment business, with extensive experience in fixed income, equities, private equity and real estate, and his substantial experience on the boards of directors of various companies.
103
Information About Our Executive Officers
The following sets forth certain information with respect to our executive officers. We deem certain employees of our subsidiaries Fidelity & Guaranty Life Holdings, Inc. (“FGLH”) and F&G Life Re Ltd. (“F&G Life Re”) to be our executive officers. All officers of our company serve at the discretion of our Board.
|
Name
|
Age
|
Position
|
|
Christopher O. Blunt
|
57
|
President, Chief Executive Officer and Director
|
|
John T. Fleurant
|
57
|
Executive Vice President, Chief Financial Officer
|
|
Eric L. Marhoun
|
57
|
Executive Vice President, General Counsel and Secretary
|
|
Rajesh Krishnan
|
48
|
Executive Vice President, Chief Investment Officer
|
|
John D. Currier
|
49
|
Executive Vice President, Chief Actuary & Chief Product Officer
|
|
Wendy J.B. Young
|
56
|
Executive Vice President, Chief Risk Officer
|
|
Jonathan Bayer
|
43
|
Head of Corporate Development & Strategy
|
|
John A. Phelps, II
|
60
|
Executive Vice President, Chief Distribution Officer
|
|
Bonnie Wasgatt
|
62
|
Executive Vice President, Chief Operations Officer
|
|
Alex Castillo
|
41
|
Senior Vice President, Chief Human Resources Officer
|
Christopher O. Blunt
joined our company as President and Chief Executive Officer and joined our Board in January 2019. Mr. Blunt previously served as a Senior Managing Director and Chief Executive Officer of Blackstone Insurance Solutions, beginning in January 2018. Before joining Blackstone Insurance Solutions, Mr. Blunt served in a variety of senior leadership positions with New York Life from 2004 to 2017. During his tenure at New York Life, Mr. Blunt served as the President of New York Life’s Investment Group and prior to that, as Co-President of the Insurance and Agency Group, which included the company’s U.S. Life Operations, Seguros Monterrey New York Life Mexico and AARP Operations. Prior to joining New York Life, Mr. Blunt was Chairman and Chief Executive Officer of Giving Capital, Inc., a wealth management solutions provider serving the financial institutions marketplace, from 2001 to 2004. Mr. Blunt served in a variety of senior marketing and distribution roles in the investment management industry. Mr. Blunt was the Chief Marketing Officer - Americas for Merrill Lynch Investment Managers and President of Mercury Funds Distributors from 1999 to 2001. Before working with Merrill Lynch, Mr. Blunt was a Managing Director with Goldman Sachs & Co., as well as the National Sales Manager for Goldman Sachs Funds, from 1996 to 1999. He currently serves as Chair of the Board of Directors of the YMCA of Greater New York. Mr. Blunt received a B.A. in History from the University of Michigan and an MBA in Finance from The Wharton School at the University of Pennsylvania.
John T. Fleurant
joined our company as Chief Financial Officer in November 2019. Mr. Fleurant served in a number of senior leadership positions with New York Life Insurance Co. from November 2010 to April 2019, including Senior Vice President of Finance and Controller from 2010 to 2013, and Executive Vice President and Chief Financial Officer from 2013 to 2019. Prior to joining New York Life Insurance Co., Mr. Fleurant was the Financial Controller and Chief Financial Officer, U.S. Businesses of Prudential Financial. Mr. Fleurant received a B.A. in accounting from Widener University.
Rajesh Krishnan
joined our company as Chief Investment Officer in January 2019. He is responsible for all aspects of the company’s investment portfolio. Before to joining F&G, Mr. Krishnan was Executive Vice President at Blackstone ISG-I Advisors L.L.C. from November 2017 to December 2018. Prior to his position there, Mr. Krishnan worked as Executive Vice President and Chief Investment Officer of Fidelity & Guaranty Life starting in 2009. During his tenure at Fidelity & Guaranty Life, Mr. Krishnan led the restructuring of the company’s fixed income portfolio and the development of in-house asset management capabilities, including the establishment of the company’s Baltimore-based trading desk, and was promoted from Senior to Executive Vice President in August 2012. Prior to joining Fidelity & Guaranty Life, Mr. Krishnan was with Wellington Management Company, an investment management company, in Boston, Massachusetts, from 1994 to 2008. While employed there, he was a Fixed Income Portfolio Manager and Associate Partner focusing on managing bond portfolios for a wide range of insurance clients. Mr. Krishnan is a Chartered Financial Analyst and a member of the Boston Security Analysts Society. He holds a Bachelor of Arts degree from Harvard College.
104
Eric L. Marhoun
joined our company as General Counsel and Secretary in November 2017. Mr. Marhoun previously served as Executive Vice President, General Counsel and Secretary of FGL until its acquisition by CF Corp in November 2017. Mr. Marhoun joined FGL in 2007 as Senior Vice President and General Counsel. Mr. Marhoun was promoted to Executive Vice President of FGL in November 2013. In his current position, Mr. Marhoun oversees Legal and Compliance matters for the U.S. life and annuity businesses of our company. Mr. Marhoun has over 35 years of legal experience in U.S. and non-U.S. insurance markets. Mr. Marhoun was previously Senior Vice President and General Counsel to Old Mutual US Life and managed the Legal and Compliance departments for the U.S. and Bermuda life and annuity businesses of Old Mutual plc of the United Kingdom from 2007 to 2011. Prior to joining Old Mutual US Life, Mr. Marhoun was Vice President, Lead Group Counsel and Secretary of American Express Financial Advisors, Inc., a financial services company, from 1995 to 2006 where he oversaw the legal operations of the insurance division of American Express. He was also Of Counsel with Lord, Bissell & Brook in 2006 and an Associate with the firm at the beginning of his career. Mr. Marhoun received his J.D., cum laude, from DePaul University College of Law and is admitted to practice law in the states of Illinois, Minnesota, Wisconsin and Georgia as well as various federal courts.
Wendy J.B. Young
joined our company as Chief Risk Officer in November 2017. Ms. Young previously served as Senior Vice President, Chief Risk Officer of FGL until CF Corp’s acquisition of FGL in November 2017. Ms. Young joined FGL in 2000 as Actuary. During her tenure with FGL, she was promoted to Senior Vice President and assumed increasing responsibilities, including leading the Financial Planning & Analysis area. In February 2014, Ms. Young was appointed Senior Vice President, Chief Risk Officer of FGL where she was responsible for risk management across the organization, which included ERM, internal controls, and internal audit. Ms. Young has over 28 years of experience as an actuary in the insurance industry. Prior to joining FGL, Ms. Young served for 10 years at the Acacia Group, a life and annuity company holding various actuarial roles, ending as 2nd Vice President and Associate Actuary responsible for statutory reporting and projections for regulatory filings. Ms. Young began her career in Ernst & Young’s insurance practice performing auditing and consulting functions. She holds a Bachelor of Science in Insurance with a concentration in Actuarial Science from The Pennsylvania State University. Ms. Young is a Member of the American Academy of Actuaries as well as a Fellow in the Society of Actuaries.
Bonnie Wasgatt
joined our company as Chief Operating Officer in May 2019. Ms. Wasgatt most recently served as a Senior Advisor at The Blackstone Group L.P. since January 2019, where she worked in insurance vertical growth opportunities. Prior to joining Blackstone, Ms. Wasgatt served as the Chief Information Officer at Jackson National Life Insurance Company from 2013 to 2018, where she was responsible for all aspects of systems development, production support, vendor management, project management and execution as well as firmwide organizational and transformational change, and also served as Executive IT Strategist from 2012 to 2013. Before joining Jackson National Life Insurance Company, she worked in a variety of roles for both insurance carriers and software firms, including as President of Insurance Solutions at DST Corporation from 2010 to 2012, as a Senior Vice President of Swiss Re - Global Admin Re from 2002 to 2010, as an Executive Vice President at Computer Sciences Corporation (now DXC Technology Company) and as a Project Director at Vantage Computer Systems. Ms. Wasgatt brings over 35 years of experience in the life insurance and annuity product manufacturing and software development arenas.
John D. Currier Jr.
joined FGLH as Deputy Chief Actuary in May 2015 and was named Chief Actuary in October 2016. Mr. Currier has more than 25 years of experience in the insurance industry. Prior to joining FGLH, he served briefly as Chief Operating Officer and Chief Actuary of the Life Companies of Farm Bureau Financial Services. He served with Aviva USA, a provider of indexed universal life and indexed annuity products, as Executive Vice President and Chief Actuary of Aviva USA (formerly AmerUs Group) from March 2010 to June 2013, Chief Product Officer from February 2008 to February 2010, and Senior Vice President of Annuity Product Development from August 2005 to February 2010. Prior to Aviva USA, he served in a variety of product development and management positions with INF US Financial Services and Conseco, Inc. Mr. Currier began his insurance career as a consulting actuary with Beckley & Associates on a wide range of actuarial projects. Mr. Currier holds a bachelor’s degree Cum Laude from Butler University, is a Fellow of the Society of Actuaries and a Member of the American Academy of Actuaries.
John A. Phelps, II
is FGLH’s Senior Vice President and Chief Distribution Officer. In 2000, Mr. Phelps joined FGLH as National Life Sales Director and in 2002 was promoted to Vice President, Brokerage Life Sales. In 2003, Mr. Phelps was promoted to Vice President, Life Distribution. In 2006, Mr. Phelps was promoted to the position of Senior Vice President, Sales & Marketing, overseeing all life & annuity product development and distribution
105
channels. In 2009, Mr. Phelps was named Chief Distribution Officer and continues to function in this role today. During his 32-year career in the industry, Mr. Phelps has served as a personal producer and general agent and has held executive sales and marketing positions with home office insurance companies as well as having served on the ACLI Life Insurance Committee, the LIMRA Distribution Leaders Round Table Committee and LIMRA Brokerage Committee. Mr. Phelps obtained his Masters of Science Management degree from The American College and holds a Bachelor of Science degree in Economics from Manchester College.
Jonathan Bayer
joined our company as Head of Corporate Development and Strategy in December 2018. Mr. Bayer is responsible for directing the company's M&A, corporate strategy, and overseeing the execution of acquisitions. He has more than 20 years of experience in insurance investment banking, where he has focused on M&A advisory and capital raising transactions. Over his career, Mr. Bayer has advised a number of leading Annuity and Life insurers, including F&G. Mr. Bayer joins F&G from RBC Capital Markets, where he was Managing Director and Head of U.S. Insurance Investment Banking since September 2011. Prior to his tenure there, Mr. Bayer worked on the FIG team at UBS AG and focused on the life and property and casualty insurance industries. Before UBS, he covered insurance while working at Deutsche Bank AG. Mr. Bayer holds a Bachelor of Arts degree in Economics from Washington and Lee University.
Rubén Alejandro (“Alex”) Castillo
joined FGLH as Senior Vice President, Chief Human Resources Officer in May 2019. Mr. Castillo previously served as Vice President of Global Human Resources at Kemin Industries from September 2016 to May 2019. Prior to Kemin, Mr. Castillo was Vice President of Human Resources at ATI Physical Therapy from March 2014 to September 2016. He also served in a number of Human Resources leadership roles at Collins Aerospace from July 2005 to February 2014. Mr. Castillo earned his B.S. in International Business and Economics from St. Ambrose University and his MBA from the Kellogg School of Management at Northwestern University.
106
CORPORATE GOVERNANCE
Audit Committee of the Board
Our Board maintains an Audit Committee, which is currently composed of Messrs. Abell, Baird and Walsh. Each member of the Audit Committee has been determined by the Board to be independent within the meaning of the federal securities laws and NYSE Corporate Governance Standards and meets the financial literacy requirements under NYSE Corporate Governance Standards, and our Board has determined that Messrs. Abell, Baird and Walsh are each an “audit committee financial expert,” as that term is defined by the applicable rules of the SEC.
Code of Ethics and Business Conduct
Our Board has adopted a Code of Business Conduct and Ethics that applies to directors and all of our employees, including our senior executive and financial officers, which include our principal executive officer, principal financial officer, principal accounting officer, and persons performing similar functions. A copy of the Code of Business Conduct and Ethics is available on our website. We will promptly disclose any future amendments to this code on our website as well as any waivers from this code for executive officers and directors. Copies of this code also are available in print from our corporate secretary upon request.
Governance Documents Availability
We have posted our Corporate Governance Guidelines, Code of Business Conduct and Ethics, Audit Committee charter, Compensation Committee charter, Nominating and Corporate Governance Committee charter and Transactions Committee charter on our website under the heading “Corporate Governance” at investors.fglife.bm. We intend to disclose any amendments to, and, if applicable, any waivers of, these governance documents on that section of our website. These governance documents are also available in print without charge to any shareholder of record that makes a written request to our company. Inquiries should be directed to the Investor Relations Department at FGL Holdings, 4th Floor, Boundary Hall, Cricket Square, Grand Cayman, Cayman Islands KY1-1102.
Communications with Board Members
We believe that communications between our Board, our shareholders and other interested parties are an important part of our corporate governance. Shareholders and other interested parties may communicate with the Board as a whole, the independent directors, or any individual member of the Board or any committee of the Board. All such communications should be submitted:
By email at: By mail at the following address:
Legalgovernance@fglife.com
FGL Holdings
c/o General Counsel and Secretary
4th Floor, Boundary Hall, Cricket Square
Grand Cayman, Cayman Islands KY1-1102
The Board has designated our General Counsel as its agent to receive and review written communications addressed to the Board, any of its committees, or any board member or group of members. As an initial matter, the General Counsel will determine whether the communication is a proper communication for the Board. The General Counsel will promptly forward to the chairman of the Audit Committee any communication alleging legal, ethical or compliance issues by management or any other matter deemed by the General Counsel to be potentially material to our company. The General Counsel will not forward communications of a personal nature or not related to the duties and responsibilities of the Board, including junk mail and mass mailings, business solicitations, routine customer service complaints, new product or service suggestions, opinion survey polls or any other communications deemed by the General Counsel to be immaterial to the company.
107
Delinquent Section 16(a) Reports
Section 16(a) of the Exchange Act requires our directors, executive officers, and any persons who beneficially own more than 10% of our ordinary shares to file with the SEC initial reports of ownership and reports of changes in ownership of our ordinary shares. Such reporting persons are also required by the SEC’s regulations to furnish us with copies of all forms they file with the SEC pursuant to Section 16(a) of the Exchange Act. Based solely on the reports received by us and on the representations of the reporting persons, we believe that the reporting persons have complied with all applicable filing requirements during the fiscal 2019, except for a Form 4 for Patrick S. Baird which was triggered on August 14, 2019, and filed on August 22, 2019.
COMPENSATION DISCUSSION AND ANALYSIS
In this compensation discussion and analysis section, we provide an overview and analysis of our executive compensation program, including a discussion of our compensation philosophy. The discussion below is intended to help provide an understanding of the detailed information in the compensation tables and related narrative disclosure below. We discuss the material elements of our compensation program and the material factors considered by the Compensation Committee in making compensation decisions. The following table identifies our named executive officers (“NEOs”) as of December 31, 2019, as defined by SEC regulations:
|
Named Executive Officers (NEO's)
|
Position
|
|
Christopher O. Blunt
|
President, Chief Executive Officer and Director
|
|
John T. Fleurant
|
Chief Financial Officer
|
|
Rajesh Krishnan
|
Chief Investment Officer
|
|
Bonnie Wasgatt
|
Executive Vice President, Chief Operations Officer
|
|
R. Alex Castillo
|
Senior Vice President, Chief Human Resources Officer
|
|
Dennis R. Vigneau (a)
|
Former Chief Financial Officer
|
|
a.
|
Mr. Vigneau transitioned to a non-executive advisor role in November 2019 in connection with the appointment of Mr. Fleurant as our CFO, and retired December 31, 2019.
|
Executive Summary
Our Business
We are an insurance holding company that helps middle-income Americans prepare for retirement and for their loved ones' financial security. Through our subsidiaries, we are a leading provider of annuity and life insurance products. We acquired Fidelity & Guaranty Life, a Delaware corporation (“FGL”), on November 30, 2017 (the “Business Combination”). For more information about our business, please see the “Business” and “Management’s Discussion and Analysis of Financial Condition and Results of Operations” included within this report.
Executive Compensation Highlights
The Compensation Committee has designed our executive compensation programs to align with evolving competitive and governance practices and respond to feedback from our shareholders. We tie executive compensation closely to financial performance through the use of performance metrics in our short-term incentives as well as the use of options and stock-price incentives to directly align executive incentives with long-term shareholder interests.
108
In 2018, we made substantial grants of equity to our then-NEOs intended to provide equity compensation for a five-year period, leveraging a mix of time-based and performance-based stock options to ensure alignment with shareholder interests. During 2019, we granted equity with a similar five-year design to our new NEOs upon joining our Company.
2019 Appointment of CEO
Christopher O. Blunt joined our company as President and Chief Executive Officer effective January 2, 2019. In, developing our compensatory arrangement with Mr. Blunt, the Board considered Mr. Blunt’s then current compensation, including his current equity, the compensation of our former President and Chief Executive Officer, and the compensation of chief executive officers of other similarly sized insurance companies. In designing a compensation package for Mr. Blunt, the Board determined to provide him the following:
|
•
|
annual base salary of $800,000,
|
|
•
|
target bonus opportunity equal to 200% of his base salary, and
|
|
•
|
sign-on bonus in the amount of $2,250,000.
|
Upon a termination without “cause” or by Mr. Blunt for “good reason,” he will be entitled to receive severance benefits equal to three times his base salary, acceleration of certain unvested options and 18 months of benefit continuation. In addition, Mr. Blunt will be subject to certain restrictive covenants that apply both during his employment with the company and for certain durations afterwards.
The Board also determined to grant a one-time award of stock options covering a five-year period to Mr. Blunt for 3.2 million shares, subject to a combination of time and performance-based vesting, as well as a stretch award of stock options for 613,476 shares, subject to performance-based vesting, as inducements to his employment by us. The stock options were issued outside of our 2017 Omnibus Incentive Plan as employment inducement awards pursuant to NYSE rules. The Board determined that the overall compensation package would be sufficient to encourage Mr. Blunt to join our company, yet would help support the creation of shareholder value and be in the best interests of our shareholders.
Compensation Philosophy and Practices
Compensation Philosophy and Objectives
Our compensation programs are based on the following objectives:
|
•
|
Attract and retain highly qualified executives and employees;
|
|
•
|
Align our incentives with shareholder interests;
|
|
•
|
Drive performance and results; and
|
|
•
|
Support our culture.
|
Compensation Practices
Market and industry practices are taken into account when developing compensation programs. Third-party market industry surveys and compensation data from other public companies are utilized when reviewing compensation. We consider our peer group to be companies in our industry that are similar in size to us, that have business models similar to ours and that compete with us for customers, labor and capital.
Our goal is to align total compensation to the competitive market within our peer group while being mindful of internal equity. Salaries are reviewed annually in a process correlated to our performance management program and a competitive base salary market review. Incentives are the primary motivators to achieve business goals and strong business or individual performance can result in above-market incentives.
The Committee leverages the following best practices in designing, administering and governing our executive compensation programs:
109
|
What We Do
|
What We Do Not Do
|
|
Target executive compensation to be competitive at the median
|
"Single trigger" change-in-control cash severance payments, or change-in-control cash severance payments exceeding three times base salary and annual incentives
|
|
Tie the majority of compensation to stock price targets and performance based incentives
|
Stock option discounts or repricings
|
|
Use equity to create long-term incentives aligned with shareholders' interests
|
Change-in-control tax gross-ups to our named executive officers
|
|
Promote stock ownership with equity-based compensation
|
Executives or director hedging or pledging company stock unless approved in advance
|
|
Reflect shareholder preferences in our compensation program and policies, including double trigger protections
|
|
|
Periodically review our compensation program to ensure it does not encourage excessive risk taking
|
|
|
Consider market and industry practices when developing compensation programs
|
|
Our Process for Making Compensation Decisions
Our Compensation Committee
Our Compensation Committee is responsible for reviewing and approving the compensation and benefits strategy for our employees, including our NEOs, authorizing and ratifying equity grants and other incentive arrangements, and authorizing employment and related agreements. The Compensation Committee has the full authority of the Board to make compensation decisions relating to our NEOs.
The Compensation Committee has the authority to delegate any of its responsibilities to sub-committees as the Compensation Committee may deem appropriate, provided that the sub-committees are composed entirely of directors satisfying the independence standards then applicable to the Compensation Committee generally. The Compensation Committee has the authority to delegate responsibilities regarding some activities that are below certain thresholds to management, provided that no member of management is delegated authority of his or her own compensation.
Role of our Executive Officers
Although our Compensation Committee has the authority to make final decisions with respect to executive compensation, our Senior Vice President, Human Resources in partnership with our Chief Executive Officer, drive the design and implementation of all executive compensation programs. The goal is to ensure that the design of our compensation programs supports our overall strategy. Except for his own compensation, the Chief Executive Officer has final management-level review of any compensation program or individual element of compensation for our NEOs before they are reviewed by the Compensation Committee. The Chief Executive Officer and our other NEOs do not participate in discussions regarding their own compensation.
Role of the Compensation Consultant
Prior to establishing our executive compensation program for fiscal 2019, our Compensation Committee and management reviewed our executive compensation policies and practices. The Compensation Committee also conducted on-going assessments of our compensation structure. The committee has retained FW Cook to serve as our compensation consultant and to assist and advise the Compensation Committee in connection with compensation policies and practices, including the design and setup of our long-term incentive program.
FW Cook reviewed the structure and mechanics of the various components of our compensation programs and practices in preparation for fiscal 2019. In order to obtain a complete view of the competitive market for talent, FW Cook considered data from publicly available peer company proxy statements, and, as a secondary view of the market, considered data from published survey sources, which includes industry peers from privately held and publicly traded organizations. In particular, FW Cook analyzed two key elements: pay magnitude and pay practices. Pay magnitude relates to overall base pay delivery, base salaries, annual and long-term incentive targets and payouts. Pay practices is the assessment of the design attributes of other organizations’ incentive plans that provide
110
perspectives on performance measurement, the mix of long-term incentive vehicles, vesting and shareholding requirements.
FW Cook completed an assessment in 2019 indicating that the current compensation structure is sound and well-balanced, and demonstrates alignment between company performance and executive compensation.
Compensation Peer Group
The Compensation Committee reviewed recommendations from FW Cook based on a peer group of insurance companies. FW Cook conducted a market analysis that included several data points using peer group comparators and relevant survey data to develop a clear assessment of current compensation practices in our industry. In order to provide peer comparison data, FW Cook utilized data from multiple sources. The primary survey source is the LOMA insurance and financial services industry survey. FW Cook utilizes a comparison of survey participants with total assets in the category of $10 billion to $40 billion.
Competitive pay data from a selected peer group’s proxy data is also used as a data source. The selected peer group consisted of companies with total assets from $10.1 billion to $144.2 billion, revenue ranging from $625 million to $11.8 billion and market capitalization ranging from $1.1 billion to $11.4 billion at the time of the analysis. There were 14 companies included in the peer group, and the list was the same as our 2018 peer group except that Globe Life Inc. changed its name in the interim, becoming Torchmark Corp.
|
American Equity Investment Life Holding Company
|
Horace Mann Educators Corporation
|
|
American Financial Group, Inc.
|
Kemper Corporation
|
|
American National Insurance Company
|
National General Holdings Corp.
|
|
Assurant, Inc.
|
National Western Life Group, Inc.
|
|
Athene Holding Ltd.
|
Primerica, Inc.
|
|
CNO Financial Group, Inc.
|
Globe Life Inc.
|
|
FBL Financial Group, Inc.
|
Unum Group
|
Shareholder Approval of our Executive Compensation Program
In deciding on the structure of the executive compensation program for fiscal 2019, the Compensation Committee took into account the perspectives of our shareholders, in particular the results of the shareholder advisory vote on executive compensation (the “say on pay” vote). At our 2018 Annual General Meeting, our proposal regarding the “say on pay” vote was approved by approximately 99.90% of the votes cast on the proposal in support of the compensation of our NEOs. We continue to consider the perspectives of our shareholders in the design and administration of our executive compensation programs.
In addition, at our 2018 Annual General Meeting, our shareholders also voted on the frequency of future “say on pay” votes, with approximately 64.97% of the votes cast supporting a frequency of every three years. Our Board also reviewed these results and determined that, consistent with the preference of our shareholders as reflected in the shareholder advisory vote, we will hold a “say on pay” vote every three years. Accordingly, the next scheduled “say on pay” advisory vote would take place at the 2021 Annual General Meeting.
Other Related Considerations
Relationship of Compensation Policies and Practices to Risk Management
We believe that our compensation policies and practices are designed to promote a strong risk management culture. We have reviewed our compensation programs and employee policies and practices and have determined that they do not encourage excessive risk taking and are not reasonably likely to have a material adverse effect on the company.
111
Components of Our Executive Compensation Program
For fiscal 2019, our compensation program consisted of the following key components:
|
Component
|
Purpose
|
Key Features
|
|
Base Salary
|
Provide a fixed level of compensation
Compensate executive officers fairly for the responsibility of the position held and reflect competitive practices
|
Salary levels set based on an assessment of:
Level of responsibility
Experience and time in position
Individual performance
Future potential
Competitiveness
Internal pay equity considerations
Salary levels are reviewed annually
by the committee and adjusted as appropriate
|
|
Short-Term Incentives
|
Provide executive officers with incentives to achieve objectives to drive short- and long-term business performance
Support attracting and retaining the best available talent
|
Awards based on achievement of financial and corporate objectives
Awards determined on annual basis
|
|
Long-Term Incentives
|
||
|
Time Based Options
|
Provide opportunities for equity ownership
Support leadership retention objectives
|
5-year ratable vesting
7-year expiration
|
|
Stock Price Options
|
Encourage sustained shareholder value creation via stock price increases
Align executive officers’ interests with the interests of our shareholders
|
Vesting subject to stock performance objectives
Target awards subject to multi-year ratable vesting
Stretch awards subject to 1-year performance periods
|
|
Performance Options
|
Provide executive officers with incentives to achieve long-term success
Align executive officers’ interests with the interests of our shareholders
|
Vesting subject to performance objectives
3-, 4- and 5-year performance periods
|
Set forth below is a discussion of each component of compensation, the rationale for each component, and how each component fits into our overall compensation philosophy.
Base Salary
We provide a base salary to compensate our executives for their services rendered on a day-to-day basis during the year. Base salaries are set to attract and retain executives with qualities necessary to ensure our short-term and long-term financial success. Base salary levels are set to be competitive with the salaries of executives in similar positions with similar responsibilities at comparable companies. The determination of an executive’s base salary is based on market compensation rates and individual factors, including personal performance and contribution, experience in the role, scope of responsibility and overall impact on the business. Base salaries are reviewed annually and adjusted when necessary to reflect market conditions as well as individual roles and performance.
The table below shows base salaries for fiscal 2019, on an annualized basis:
|
Name
|
Fiscal 2019 Base Salary
|
|
Christopher O. Blunt
|
$800,000
|
|
John T. Fleurant
|
$500,000
|
|
Rajesh Krishnan
|
$350,000
|
|
Bonnie Wasgatt
|
$335,000
|
|
R. Alex Castillo
|
$275,000
|
|
Dennis R. Vigneau
|
$440,000
|
112
Short-Term Incentives
In order to promote our “pay for performance” culture, we pay annual cash incentives to our executives for achieving performance targets that support financial and corporate goals. The short-term incentives made pursuant to our Employee Incentive Plan (the “EIP”), which allows for annual cash-based bonus awards intended to attract and retain the best available executive officers to be responsible for the management, growth, and success of our business and to provide an incentive for such individuals to exert their best efforts on behalf of our company and shareholders. Our Chief Executive Officer and executive team develop an annual business plan that includes objectives to drive short- and long-term business performance. The Compensation Committee reviews these objectives and establishes performance targets. Performance against plan objectives are reviewed and approved by the Compensation Committee to establish the bonus pool for each performance period. Short-term incentive payouts require that minimum targets be satisfied and allow for recognition of individual performance and contribution toward those goals.
The EIP includes a financial performance component based on the annual business plan weighted at 85% and a corporate initiatives component weighted at 15%. For fiscal 2019, the performance metrics for the EIP were:
|
Metrics
|
Weighting
|
|
Achieve the Financial Plan
|
85%
|
|
Sales
|
|
|
Adjusted Operating Income
|
|
|
Risk-based Capital
|
|
|
New Business Internal Rate of Return
|
|
|
Corporate Initiatives
|
15%
|
|
Enhance our control environment and strengthen our risk management process
|
|
|
Diversify the business through new products, distribution operating plans and channel growth
|
|
|
Further optimize capital usage
|
|
|
Simplify our Investor Relations story
|
|
|
Win the war for talent
|
|
The Compensation Committee approved the percentage of base salary paid for performance at the target levels depicted below. If a minimum performance measure is satisfied, depending on actual performance, bonus payments under the EIP could range from 50% to 150% of target. As a result of the corporate performance against our goals for fiscal 2019, the bonus pool for determining individual executive incentive awards was 137% of target.
|
Name
|
2019 Target Bonus
|
Actual Bonus Earned
|
||
|
(% of base salary earnings)
|
($)
|
(% of base salary earnings)
|
($)
|
|
|
Christopher O. Blunt
|
200%
|
1,587,693
|
271%
|
2,150,000
|
|
John T. Fleurant (a)
|
100%
|
N/A
|
N/A
|
N/A
|
|
Rajesh Krishnan
|
100%
|
348,654
|
143%
|
500,000
|
|
Bonnie Wasgatt
|
50%
|
103,077
|
82%
|
170,000
|
|
R. Alex Castillo
|
40%
|
67,692
|
59%
|
100,000
|
|
Dennis R. Vigneau
|
60%
|
264,000
|
114%
|
500,000 (b)
|
|
a.
|
Mr. Fleurant was not eligible for a 2019 bonus due to his hire date.
|
|
b.
|
Pursuant to his transition agreement, Mr. Vigneau received $500,000 with respect to payments under the EIP, irrespective of company performance. Therefore this amount is classified as a bonus and reported in the Summary Compensation Table as a bonus.
|
Long-Term Incentives
We provide long-term incentive opportunities to motivate and reward our executive officers for their contributions toward achieving our business objectives and the interests of our shareholders. We believe that equity-based awards link compensation levels with performance results and ensure sustained alignment with shareholder interests. Additionally, we believe equity awards provide an important retention tool, because the awards are subject
113
to multi-year vesting. In furtherance of these objectives, we adopted the FGL Holdings 2017 Omnibus Incentive Plan, under which we grant such equity awards.
In 2018, the Compensation Committee established a new program for long-term award opportunities for our executives. We made substantial equity grants to each of the then-NEOs through a five-year incentive program that provides for a one-time award of stock options. The Compensation Committee approved these one-time grants covering long-term award targets for the five-year period in lieu of annual awards. In establishing these awards, the Compensation Committee considered its desire to strategically align the long term incentives to the long-term success of our business. In addition, a stretch award was granted to drive extraordinary performance of the stock price over the five-year period of the grant. These grants were made in March 2018.
Our long-term incentives for NEOs consist of three forms of stock option awards that incentivize long-term value creation: time-vesting options that reward increases in the market value of our shares and continued service with our company; stock price options that reward the achievement of our long-term goals for increasing the market price of our shares; and performance options that reward the achievement of our long-term performance goals as determined by Adjusted Operating ROE. The mix of long-term incentives granted to our NEOs is as follows:
|
Time-Vesting Options
|
1/3
|
|
Stock Price Options
|
1/3
|
|
Performance Options
|
1/3
|
Time-Vesting Options
Time-vesting options provide value based solely on stock price appreciation. The time-vesting options vest in four or five equal annual installments beginning on the anniversary of the date grant, based on continued service.
Stock Price Options
Stock price options align our long-term incentives to the appreciation of our share price. Stock price options vest based on achievement of both stock price goals and continued service requirements.
We awarded our NEOs two one-time grants of stock price options: target stock price options that vest in four or five equal installments upon the later of the achievement of annual stock price goals or the applicable continued service requirement; and stretch stock price options that vest in four or five equal installments based on both continued service during the performance period and achievement of the stock price goal for the applicable one-year performance period.
Performance Options
Performance options align our long-term incentives to the achievement of our Adjusted Operating ROE objectives. Performance options vest in equal installments based on continued service and achievement of separate three-year, four-year and five-year Adjusted Operating ROE goals established at the start of the five-year period.
Of our 2019 NEOs, only Mr. Vigneau was employed by the Company in March 2018 when the original five-year grants were made. He received the following grants in 2018, and no additional grants in 2019.
|
Stock Price Options (c)
|
Performance Options (d)
|
||||||
|
Time-Vesting Options
|
Target
|
Stretch
|
Target
|
Stretch
|
Total Value at Grant (a)
|
||
|
Name
|
Date of Grant
|
(#)
|
(#)
|
(#)
|
(#)
|
(#)
|
($)
|
|
Dennis R. Vigneau (b)
|
May 15, 2018
|
605,693
|
605,693
|
153,369
|
605,693
|
153,369 (d)
|
4,462,790
|
|
a.
|
Represents the grant date fair value computed in accordance with Financial Accounting Standards Board Accounting Standards Clarification (“FASB ASC”) Topic 718.
|
|
b.
|
Mr. Vigneau’s options were subsequently accelerated in part, and cancelled in part, on December 31, 2019, in connection with his transition agreement from the company. See “Potential Payments Upon Termination or Change in Control” for more detail.
|
114
|
c.
|
The stock price objectives for our ordinary shares for the applicable installment period and performance period for the target stock price options and stretch period stock price options granted to our NEOs in fiscal 2018 were:
|
|
2019
|
2020
|
2021
|
2022
|
2023
|
|
|
Target
|
$11.00
|
$12.75
|
$14.75
|
$17.00
|
$20.00
|
|
Stretch
|
$12.00
|
$14.50
|
$17.00
|
$21.00
|
$25.00
|
d. Included the following terms:
|
Performance Option Award
|
Performance Periods
|
Adjusted Operating ROE
Performance Targets (a)
|
|
Stretch Performance Options
|
March 15, 2021
March 15, 2022
March 15, 2023
|
16.50%
17.50%
18.50%
|
|
a.
|
“Adjusted Operating ROE” is a non-GAAP measure and is calculated by dividing adjusted operating income (“AOI”) available to common shareholders by total average common shareholders’ equity excluding accumulated other comprehensive income. AOI available to common shareholders is a non-GAAP measure and is calculated by adjusting net income (loss) available to common shareholders to eliminate certain items including the impact of net investment gains/losses, the effect of changes in fair values of FIA derivatives and embedded derivatives, the tax effect of change in fair value of affiliated reinsurance embedded derivatives, the effect of integration, merger related and other non-operating items and the impact of extinguishment of debt. Management considers this non-GAAP financial measure to provide useful supplemental information internally and to investors and analysts assessing the level of adjusted earned return on common equity.
|
Mr. Blunt’s appointment as President and CEO was announced on December 21, 2018, and he joined our Company on January 2, 2019. He received similar but not identical equity awards that were designed to mirror the awards received by the then-NEOs in March 2018 but to also reflect the passage of time, including Company’s stock price at the date of grant, and his key role as our Chief Executive Officer:
|
Performance Options (d)
|
||||||
|
Time-Vesting Options (b)
|
Stock Price Options (c)
|
Target (d)
|
Stretch (e)
|
Total Value at Grant (a)
|
||
|
Name
|
Date of Grant
|
(#)
|
(#)
|
(#)
|
(#)
|
($)
|
|
Christopher O. Blunt
|
December 21, 2018
|
1,600,000
|
306,738
|
1,600,000
|
306,738
|
4,075,971
|
|
a.
|
Represents the grant date fair value computed in accordance with Financial Accounting Standards Board Accounting Standards Clarification (“FASB ASC”) Topic 718.
|
|
b.
|
These options vest equally across five years on the anniversaries of the date of grant; One-half of the target options have an exercise price of $7.04, and one-half $10.00.
|
|
c.
|
The stock price options vest in five annual installments beginning on March 15, 2020 based upon continued service and the achievement of stock price objectives:
|
|
2019
|
2020
|
2021
|
2022
|
2023
|
|
|
Target
|
$11.00
|
$12.75
|
$14.75
|
$17.00
|
$20.00
|
|
Stretch
|
$12.00
|
$14.50
|
$17.00
|
$21.00
|
$25.00
|
|
d.
|
These options vest in five annual installments, beginning on December 21, 2019, based upon continued service and the achievement of performance objectives to be established by the Board on an annual basis.
|
|
e.
|
These options vest in five annual installments, beginning on December 21, 2019, based upon continued service and the achievement of the following objectives, were:
|
|
Performance Option Award
|
Vesting Date
|
Adjusted Operating ROE
Performance Targets (a)
|
|
Stretch Performance Options
|
March 15, 2021
March 15, 2022
March 15, 2023
|
16.50%
17.50%
18.50%
|
|
a.
|
ROE measured as of December 31 of each year. “Adjusted Operating ROE” is a non-GAAP measure and is calculated by dividing adjusted operating income (“AOI”) available to common shareholders by total average common shareholders’ equity excluding accumulated other comprehensive income. AOI available to common shareholders is a non-GAAP measure and is calculated by adjusting net income (loss) available to common shareholders to eliminate certain items including the impact of net investment gains/losses, the effect of changes in fair values of FIA derivatives and embedded derivatives, the tax effect of change in fair value
|
115
of affiliated reinsurance embedded derivatives, the effect of integration, merger related and other non-operating items and the impact of extinguishment of debt. Management considers this non-GAAP financial measure to provide useful supplemental information internally and to investors and analysts assessing the level of adjusted earned return on common equity.
Our other NEOs received substantially similar grants as sign-on awards as they joined our Company, with stock price objectives and performance targets that generally mirror the older awards except for adjustments based on the passage of time, including shortening time horizons to four rather than five years. Specific information about these grants is provided in the “Grants of Plan-Based Awards” table below.
Stock Option Awards
In August 2019, upon Mr. Blunt’s recommendation, our Compensation Committee determined to make additional stock option awards to our executive team other than Mr. Blunt and Mr. Fleurant. They did so in order to align goals and incentives across the team and retain executive talent.
Like our sign-on awards, these awards were split evenly between time-based vesting, stock price vesting, and vesting based on performance goals.
|
Time-Vesting Options
|
1/3
|
|
Stock Price Options
|
1/3
|
|
Performance Options
|
1/3
|
Transaction Bonus Letter Agreements
As discussed in Item 1 of this Annual Report on Form 10-K, we announced on February 7, 2020 that we had entered into the FNF Merger Agreement, upon closing of which our company would become a fully-owned subsidiary of Fidelity National Financial, Inc. (FNF).
In order to reward our NEOs for the critical role they are performing in working towards the closing of the FNF Merger, the Compensation Committee approved Transaction Bonus Letter Agreements with each of our NEOs on February 25, 2020.
Under the Transaction Bonus Letter Agreements, each executive is eligible to receive a specified cash transaction bonus, as set forth below, subject to the occurrence of the closing of the FNF Merger and the executive’s continued employment through the date of the closing. Such bonuses would be paid out within 30 days following the date of closing. Executives will no longer be eligible to receive a Transaction Bonus if their employment is terminated for any reason prior to the closing date, or if the Merger Agreement with FNF is terminated prior to closing.
|
Potential Transaction Bonus
|
|||
|
Christopher Blunt
|
$
|
400,000
|
|
|
John Fleurant
|
$
|
250,000
|
|
|
Raj Krishnan
|
$
|
200,000
|
|
|
Bonnie Wasgatt
|
$
|
200,000
|
|
|
Alex Castillo
|
$
|
200,000
|
|
116
Employment and Other Severance, Change-in-Control and Related Agreements
Employment Agreements
We believe that having employment agreements with our NEOs is beneficial to us because they provide retentive value, subject the executives to key restrictive covenants, and generally provide us with a competitive advantage in the recruiting process over companies that do not offer employment agreements. We have entered into employment agreements with our NEOs as follows:
|
NEOs
|
Date of Agreement
|
|
Christopher O. Blunt
|
December 2018
|
|
John T. Fleurant
|
November 2019
|
|
Rajesh Krishnan
|
January 2019
|
|
Bonnie Wasgatt
|
N/A
|
|
R. Alex Castillo
|
N/A
|
|
Dennis R. Vigneau
|
January 2014, amended and restated March 2019
|
These employment agreements include the specific terms set forth in greater detail below in “Summary Compensation Table-Narrative to Summary Compensation Table and Grants of Plan-Based Awards Table ‒ Employment Agreements and Leadership Transition Agreement.”
Other Agreements with Mr. Vigneau
Leadership Transition Agreement
On March 29, 2019, we entered into a prospective leadership transition agreement with then-Chief Financial Officer Dennis Vigneau, in connection with his planned retirement on December 31, 2019, which technically amended and restated the existing employment agreement between Mr. Vigneau and the Company, dated January 27, 2014. This agreement is detailed below under “Summary Compensation Table-Narrative to Summary Compensation Table and Grants of Plan-Based Awards Table ‒ Employment Agreements and Leadership Transition Agreement.”
2017 Incentive Awards
FGL entered into an incentive award letters with Mr. Vigneau and certain other executives dated February 1, 2017. The incentive award letters provided for the grant of a cash award in lieu of the December 2015 and December 2016 ordinary course discretionary long-term equity incentive awards that FGL was not permitted to make to its executive officers under the terms of its merger agreement with Anbang Insurance Group Co., Ltd. and its affiliates, which was terminated on April 17, 2017. The 2017 incentive awards were granted in recognition of the continued commitment and contributions of FGL’s executives during this period. These incentive awards vested in installments on December 1, 2017, December 3, 2018 and December 2, 2019, subject to the executive’s continued employment through the applicable vesting date. They would have also vested in full if the executive’s employment had been terminated by without “cause” prior to December 2, 2019 or if the executive’s position had been eliminated and the executive was not offered “comparable employment” before November 30, 2018, the first anniversary of the completion of the 2017 Business Combination. The amount of each incentive award installment to the NEOs is set forth in the following table:
|
Name
|
December 2017
|
December 2018
|
December 2019
|
Total
|
|
Dennis R. Vigneau
|
$146,667
|
$146,667
|
$ 73,333
|
$366,667
|
Other Executive Compensation Arrangements, Policies and Practices
Our executives are eligible to participate in our tax-qualified 401(k) defined contribution plan and our health and welfare plans on the same basis as our other salaried employees. Our executives also participate in a limited number of perquisite programs.
117
401(k) Plan
Under the 401(k) Plan, our company will match 100% of a participant’s contributions up to five percent of compensation, subject to the limits specified in the Internal Revenue Code (the “Code”). The employer match vests immediately. The 401(k) plan also allows for annual discretionary profit sharing contributions, which historically have been two percent of earnings, subject to limits under the Code. Any profit sharing contributions are immediately vested.
Nonqualified Deferred Compensation Arrangements
We permit our executives to defer on an elective basis a specified portion of their base salaries and performance-based bonus compensation, if any. See the narrative description following the table entitled “Nonqualified Deferred Compensation” below for more information surrounding the terms of the nonqualified deferred compensation plan.
Health and Welfare Benefits
We also offer a package of insurance benefits to all salaried employees, including our executives, including health, vision and dental insurance, basic life insurance, accidental death and dismemberment insurance and short- and long-term disability insurance.
Limited Executive Perquisites
All of our executives are eligible to participate in the Executive Life Insurance Plan. Under this plan, the beneficiary of a participant who dies while employed by us is entitled to a lump sum payment equal to three times his or her annual base salary at the time of hire. Our executives are also offered physical examinations at our cost once biannually. The value of these executive perquisites is reflected in the “All Other Compensation” column of the Summary Compensation Table below. We maintain no defined benefit pension plans or retiree medical plans.
Prohibition of Short Sales, Derivatives Trading, Hedging and Pledging of Our Securities
Our Board has adopted a policy prohibiting designated employees, including the NEOs, and directors from engaging in any short sales of our securities, or transactions in puts, calls or other derivative securities with respect to any of our equity securities. Unless first pre-cleared by our General Counsel, the policy also prohibits all employees, including the NEOs, and directors from entering into hedging transactions with respect to our securities or pledging our securities as collateral for any loan, including margin accounts.
Policy on Rule 10b5-1 Trading Plans
We have adopted a policy for Rule 10b5-1 trading plans for designated employees, including the NEOs, and directors, which allow for transactions in our securities pursuant to a pre-established written plan meeting certain requirements. Any Rule 10b5-1 plan must (a) be in writing and in a form acceptable to the company; (b) be acknowledged in writing by the General Counsel of the company prior to the plan becoming effective; (c) contain such terms and conditions as may be required by Rule 10b5-1; and (d) not be entered into, amended or terminated during a blackout period or when the person is in possession of material nonpublic information.
Compensation Committee Report
Our Compensation Committee has reviewed and discussed the “Compensation Discussion and Analysis” contained in this report with our management. Based on such review and discussions, the committee recommended to our Board that the “Compensation Discussion and Analysis” be included in Annual Report on Form 10-K filed with the SEC for fiscal 2019.
COMPENSATION COMMITTEE
/s/ Keith W. Abell
/s/ Richard M. Massey
118
/s/ James A. Quella
Compensation Committee Interlocks and Insider Participation
No member of the Compensation Committee has served as an officer or employee of the company or any of its subsidiaries during fiscal 2019 or any prior year. In addition, during fiscal 2019, no executive officer of our company served as a director or as a member of the compensation committee of a company (i) one of whose executive officers served as a director or as a member of the Compensation Committee of our company or (ii) which employed a director of our company.
CEO Pay Ratio
As required by the “pay ratio” rules under the Dodd-Frank Wall Street Reform and Consumer Protection Act of 2010 and Item 402(u) of Regulation S-K, we determined the annual total compensation of the estimated median of the annual total compensation of all employees, except our current President and Chief Executive Officer (our “non-CEO median employee”) and present a comparison of that annual total compensation to the annual total compensation of our President and Chief Executive Officer (our “CEO”). In accordance with SEC rules, for 2019, we have calculated:
|
•
|
The annual total compensation of our non-CEO median employee was $103,823
|
|
•
|
The annual total compensation of our CEO was $9,344,988
|
|
•
|
The estimated pay ratio of the annual total compensation of our CEO to the annual total compensation of our non-CEO median employee was 90:1
|
As permitted by Securities and Exchange Commission rules, to identify our non-CEO median employee we used a commonly accepted compensation measure, “total cash compensation,” which includes annual base pay plus all commissions and bonuses paid during the fiscal year. We used October 1, 2019, as our determination day, and included all 344 full-time, part-time, seasonal, and temporary employees of F&G and its subsidiaries globally, other than our CEO. We annualized pay for those who commenced work during the fiscal year. After we identified our non-CEO median employee based on total cash compensation, we calculated annual total compensation for both our CEO and our non-CEO median employee, using the same definition for total compensation set forth in this proxy statement’s Summary Compensation Table plus the value of benefits and employer retirement contributions not reported therein. These benefits include company contributions to the medical, dental and basic life insurance plans.
Mr. Blunt served as our CEO beginning Jan. 2, 2019. As allowed when a CEO does not serve for the entire fiscal year, we annualized his compensation for purposes of the pay ratio estimation. Mr. Blunt’s annualized total compensation for our fiscal year was $9,344,988.
This pay ratio is a reasonable estimate calculated in a manner consistent with Item 402(u) of Regulation S-K. Given the different methodologies that various public companies use to determine an estimate of their pay ratios and our unique situation in including the inducement equity grants made to our CEO, the estimated pay ratio reported above should not be used as a basis for comparison between companies.
119
SUMMARY COMPENSATION TABLE
The following table summarizes the total compensation paid to our NEOs for the fiscal year ended December 31, 2019, the fiscal year ended December 31, 2018, the three month transition period ended December 31, 2017 (“TP 2017”), and the fiscal year ended September 30, 2017.
|
Name
|
Year
|
Salary ($)
|
Bonus ($)(a)
|
Stock Awards ($)(b)(c)
|
Option Awards ($)(b)
|
Non-Equity Incentive Plan Compensation ($)(d)
|
Change in Pension Value and Nonqualified Deferred Compensation Earnings ($)
|
All Other Compensation ($)(e)
|
Total ($)
|
|||||||
|
Christopher O. Blunt, President and Chief Executive Officer (f)
|
FY 2019
|
793,846
|
|
2,250,000
|
|
-
|
|
4,075,971
|
|
2,150,000
|
|
-
|
75,170
|
|
9,344,988
|
|
|
John T. Fleurant, Chief Financial Officer (g)
|
FY 2019
|
67,308
|
|
-
|
|
-
|
|
3,727,065
|
|
-
|
|
-
|
6,050
|
|
3,800,424
|
|
|
Rajesh Krishnan, Chief Investment Officer (h)
|
FY 2019
|
348,654
|
|
-
|
|
-
|
|
2,882,609
|
|
500,000
|
|
-
|
15,759
|
|
3,747,022
|
|
|
Bonnie Wasgatt, EVP and Chief Operations Officer (i)
|
FY 2019
|
206,154
|
|
-
|
|
-
|
|
875,546
|
|
170,000
|
|
-
|
10,799
|
|
1,262,498
|
|
|
R. Alex Castillo, SVP and Chief Human Resources Officer (j)
|
FY 2019
|
169,231
|
|
60,000
|
|
-
|
|
614,808
|
|
100,000
|
|
-
|
8,466
|
|
952,505
|
|
|
Dennis R. Vigneau, Former Chief Financial Officer (k)
|
FY 2019
|
440,000
|
|
573,340
|
|
-
|
|
-
|
|
-
|
|
-
|
1,171,258
|
|
2,184,598
|
|
|
FY 2018
|
440,000
|
|
586,667
|
|
-
|
|
4,462,790
|
|
500,000
|
|
-
|
22,292
|
|
6,011,749
|
|
|
|
TP 2017
|
118,462
|
|
446,667
|
|
-
|
|
-
|
|
120,000
|
|
-
|
10,337
|
|
695,465
|
|
|
|
FY 2017
|
440,000
|
|
73,333
|
|
1,626,484
|
|
-
|
|
500,000
|
|
-
|
24,508
|
|
2,664,325
|
|
|
|
a.
|
For fiscal 2019, represents sign-on bonus paid to Mr. Blunt and bonuses paid to Mr. Vigneau pursuant to his transition agreement, including related to his EIP award. For fiscal 2018, represents cash payments under the 2017 Incentive Awards and the Retention Awards paid in December 2018 to Mr. Vigneau.
|
|
b.
|
Represents the grant date fair value computed in accordance with Financial Accounting Standards Board Accounting Standards Clarification (“FASB ASC”) Topic 718.
|
|
c.
|
Represents cash amounts paid by FGL to settle Performance RSUs granted to Mr. Vigneau in fiscal 2017 in connection with the Business Combination.
|
|
d.
|
For fiscal 2019 and 2018, the amounts reported in this column reflect amounts earned under the EIP for all NEOs in such fiscal year. The amounts reported for periods prior to fiscal 2018 reflect the amounts paid out to Mr. Vigneau under FGL’s Employee Incentive Compensation Plan.
|
|
e.
|
All other compensation for fiscal year 2019 was as follows:
|
|
Name
|
401(k) Match
|
Profit Sharing
|
Life Insurance Premiums
|
Long-Term Disability Insurance Premium
|
Relocation Subsidy
|
Paid-Time Off
|
Separation Payments (k)
|
Other
|
Total
|
||||||||||||||
|
Blunt
|
$
|
14,000
|
|
-
|
|
-
|
|
$
|
945
|
|
$
|
58,761
|
|
-
|
|
-
|
|
$
|
1,464
|
|
$
|
75,170
|
|
|
Fleurant
|
-
|
|
-
|
|
-
|
|
145
|
|
5,905
|
|
-
|
|
-
|
|
-
|
|
6,050
|
|
|||||
|
Krishnan
|
14,000
|
|
-
|
|
814
|
|
945
|
|
-
|
|
-
|
|
-
|
|
-
|
|
15,759
|
|
|||||
|
Wasgatt
|
7,087
|
|
-
|
|
3,130
|
|
582
|
|
-
|
|
-
|
|
-
|
|
-
|
|
10,799
|
|
|||||
|
Castillo
|
7,933
|
|
-
|
|
-
|
|
533
|
|
-
|
|
-
|
|
-
|
|
-
|
|
8,466
|
|
|||||
|
Vigneau
|
14,000
|
|
5,500
|
|
2,197
|
|
945
|
|
-
|
|
18,615
|
|
1,130,000
|
|
-
|
|
1,171,258
|
|
|||||
|
f.
|
Mr. Blunt was appointed as President, Chief Executive Officer and Director effective as of January 2, 2019.
|
|
g.
|
Mr. Fleurant joined our company effective November 11, 2019.
|
|
h.
|
Mr. Krishnan joined our company effective January 1, 2019.
|
|
i.
|
Ms. Wasgatt joined our company effective May 20, 2019.
|
|
j.
|
Mr. Castillo joined our company effective May 20, 2019.
|
|
k.
|
Mr. Vigneau transitioned to a non-executive role upon the appointment of Mr. Fleurant pursuant to a transition agreement, which is described in more detail below under “Leadership Transition Agreement”.
|
120
Grants of Plan-Based Awards
The following table sets forth information concerning estimated possible payouts under non-equity incentive plan awards for fiscal 2019 performance and equity incentive plan awards granted in fiscal 2019 to our named executive officers. The terms and conditions applicable to these awards are described in “Compensation Discussion and Analysis” and “Outstanding Equity Awards at Fiscal Year-End.”
|
Grant Date
|
Estimated future payouts under non-equity incentive plan awards ($)(a)
|
Estimated future payouts under equity incentive plan awards ($)
|
All other stock awards: Number of shares of stock or units (#)
|
All other option awards: Number of securities underlying options
(#)(b)
|
Exercise or base price of option awards
($/Sh)
|
Grant date fair value of stock and option awards ($)
|
|||||
|
Threshold
|
Target
|
Maximum
|
Threshold
|
Target
|
Maximum
|
||||||
|
Christopher O. Blunt
|
2/26/2019
|
800,000
|
1,600,000
|
2,400,000
|
-
|
-
|
-
|
-
|
-
|
-
|
-
|
|
12/21/2018
|
-
|
-
|
-
|
-
|
-
|
-
|
-
|
878,400
|
1.42
|
1,247,328
|
|
|
12/21/2018
|
-
|
-
|
-
|
-
|
-
|
-
|
-
|
721,600
|
0.89
|
642,224
|
|
|
12/21/2018
|
-
|
-
|
-
|
-
|
-
|
-
|
-
|
87,840
|
1.56
|
137,030
|
|
|
12/21/2018
|
-
|
-
|
-
|
-
|
-
|
-
|
-
|
87,840
|
1.28
|
112,435
|
|
|
12/21/2018
|
-
|
-
|
-
|
-
|
-
|
-
|
-
|
87,840
|
0.98
|
86,083
|
|
|
12/21/2018
|
-
|
-
|
-
|
-
|
-
|
-
|
-
|
87,840
|
0.7
|
61,488
|
|
|
12/21/2018
|
-
|
-
|
-
|
-
|
-
|
-
|
-
|
87,840
|
0.44
|
38,650
|
|
|
12/21/2018
|
-
|
-
|
-
|
-
|
-
|
-
|
-
|
72,160
|
1.01
|
72,882
|
|
|
12/21/2018
|
-
|
-
|
-
|
-
|
-
|
-
|
-
|
72,160
|
0.88
|
63,501
|
|
|
12/21/2018
|
-
|
-
|
-
|
-
|
-
|
-
|
-
|
72,160
|
0.71
|
51,234
|
|
|
12/21/2018
|
-
|
-
|
-
|
-
|
-
|
-
|
-
|
72,160
|
0.54
|
38,966
|
|
|
12/21/2018
|
-
|
-
|
-
|
-
|
-
|
-
|
-
|
72,160
|
0.35
|
25,256
|
|
|
12/21/2018
|
-
|
-
|
-
|
-
|
-
|
-
|
-
|
439,200
|
1.74
|
764,208
|
|
|
12/21/2018
|
-
|
-
|
-
|
-
|
-
|
-
|
-
|
360,800
|
1.13
|
407,704
|
|
|
12/21/2018
|
-
|
-
|
-
|
-
|
-
|
-
|
-
|
306,738
|
0.89
|
272,997
|
|
|
12/21/2018
|
-
|
-
|
-
|
-
|
-
|
-
|
-
|
61,348
|
0.12
|
7,362
|
|
|
12/21/2018
|
-
|
-
|
-
|
-
|
-
|
-
|
-
|
61,348
|
0.18
|
11,043
|
|
|
12/21/2018
|
-
|
-
|
-
|
-
|
-
|
-
|
-
|
61,348
|
0.21
|
12,883
|
|
|
12/21/2018
|
-
|
-
|
-
|
-
|
-
|
-
|
-
|
61,347
|
0.18
|
11,042
|
|
|
12/21/2018
|
-
|
-
|
-
|
-
|
-
|
-
|
-
|
61,347
|
0.19
|
11,656
|
|
|
12/21/2018
|
-
|
-
|
-
|
-
|
-
|
-
|
-
|
306,738
|
0.89
|
272,997
|
|
|
12/21/2018
|
-
|
-
|
-
|
-
|
-
|
-
|
-
|
61,348
|
0.12
|
7,362
|
|
|
12/21/2018
|
-
|
-
|
-
|
-
|
-
|
-
|
-
|
61,348
|
0.18
|
11,043
|
|
|
12/21/2018
|
-
|
-
|
-
|
-
|
-
|
-
|
-
|
61,348
|
0.21
|
12,883
|
|
|
12/21/2018
|
-
|
-
|
-
|
-
|
-
|
-
|
-
|
61,347
|
0.18
|
11,042
|
|
|
12/21/2018
|
-
|
-
|
-
|
-
|
-
|
-
|
-
|
61,347
|
0.19
|
11,656
|
|
|
John Fleurant (c)
|
11/11/2019
|
250,000
|
500,000
|
750,000
|
-
|
-
|
-
|
-
|
-
|
-
|
-
|
|
11/11/2019
|
-
|
-
|
-
|
-
|
-
|
-
|
-
|
30,000
|
0.61
|
18,300
|
|
|
11/11/2019
|
-
|
-
|
-
|
-
|
-
|
-
|
-
|
500,000
|
2.22
|
1,110,000
|
|
|
11/11/2019
|
-
|
-
|
-
|
-
|
-
|
-
|
-
|
30,000
|
0.32
|
9,600
|
|
|
11/11/2019
|
-
|
-
|
-
|
-
|
-
|
-
|
-
|
30,000
|
0.27
|
8,100
|
|
|
11/11/2019
|
-
|
-
|
-
|
-
|
-
|
-
|
-
|
30,000
|
0.19
|
5,700
|
|
|
11/11/2019
|
-
|
-
|
-
|
-
|
-
|
-
|
-
|
13,334
|
1.05
|
14,001
|
|
|
11/11/2019
|
-
|
-
|
-
|
-
|
-
|
-
|
-
|
13,334
|
1.26
|
16,801
|
|
|
11/11/2019
|
-
|
-
|
-
|
-
|
-
|
-
|
-
|
13,333
|
1.51
|
20,133
|
|
|
11/11/2019
|
-
|
-
|
-
|
-
|
-
|
-
|
-
|
13,333
|
1.92
|
25,599
|
|
|
11/11/2019
|
-
|
-
|
-
|
-
|
-
|
-
|
-
|
13,333
|
2.23
|
29,733
|
|
|
11/11/2019
|
-
|
-
|
-
|
-
|
-
|
-
|
-
|
100,000
|
1
|
100,000
|
|
|
11/11/2019
|
-
|
-
|
-
|
-
|
-
|
-
|
-
|
100,000
|
1.2
|
120,000
|
|
|
11/11/2019
|
-
|
-
|
-
|
-
|
-
|
-
|
-
|
100,000
|
1.43
|
143,000
|
|
|
11/11/2019
|
-
|
-
|
-
|
-
|
-
|
-
|
-
|
100,000
|
1.81
|
181,000
|
|
|
11/11/2019
|
-
|
-
|
-
|
-
|
-
|
-
|
-
|
100,000
|
2.08
|
208,000
|
|
|
11/11/2019
|
-
|
-
|
-
|
-
|
-
|
-
|
-
|
150,000
|
2.22
|
333,000
|
|
|
11/11/2019
|
-
|
-
|
-
|
-
|
-
|
-
|
-
|
66,666
|
2.34
|
155,998
|
|
|
11/11/2019
|
-
|
-
|
-
|
-
|
-
|
-
|
-
|
500,000
|
2.1
|
1,050,000
|
|
|
11/11/2019
|
-
|
-
|
-
|
-
|
-
|
-
|
-
|
66,667
|
2.46
|
164,001
|
|
|
11/11/2019
|
-
|
-
|
-
|
-
|
-
|
-
|
-
|
30,000
|
0.47
|
14,100
|
|
|
Raj Krishnan
|
2/26/2019
|
175,000
|
350,000
|
525,000
|
-
|
-
|
-
|
-
|
-
|
-
|
-
|
|
3/15/2019
|
-
|
-
|
-
|
-
|
-
|
-
|
-
|
24,539
|
1.74
|
42,698
|
|
121
|
3/15/2019
|
-
|
-
|
-
|
-
|
-
|
-
|
-
|
96,910
|
1.79
|
173,469
|
|
|
3/15/2019
|
-
|
-
|
-
|
-
|
-
|
-
|
-
|
24,539
|
0.64
|
15,705
|
|
|
3/15/2019
|
-
|
-
|
-
|
-
|
-
|
-
|
-
|
96,911
|
0.68
|
65,899
|
|
|
3/15/2019
|
-
|
-
|
-
|
-
|
-
|
-
|
-
|
24,539
|
0.98
|
24,048
|
|
|
3/15/2019
|
-
|
-
|
-
|
-
|
-
|
-
|
-
|
96,911
|
0.99
|
95,942
|
|
|
3/15/2019
|
-
|
-
|
-
|
-
|
-
|
-
|
-
|
24,539
|
1.27
|
31,165
|
|
|
3/15/2019
|
-
|
-
|
-
|
-
|
-
|
-
|
-
|
96,911
|
1.28
|
124,046
|
|
|
3/15/2019
|
-
|
-
|
-
|
-
|
-
|
-
|
-
|
24,539
|
1.52
|
37,299
|
|
|
3/15/2019
|
-
|
-
|
-
|
-
|
-
|
-
|
-
|
96,911
|
1.57
|
152,150
|
|
|
3/15/2019
|
-
|
-
|
-
|
-
|
-
|
-
|
-
|
122,695
|
1.74
|
213,489
|
|
|
3/15/2019
|
-
|
-
|
-
|
-
|
-
|
-
|
-
|
484,554
|
1.74
|
843,124
|
|
|
3/15/2019
|
-
|
-
|
-
|
-
|
-
|
-
|
-
|
484,555
|
1.68
|
814,052
|
|
|
8/6/2019
|
-
|
-
|
-
|
-
|
-
|
-
|
-
|
62,225
|
1.73
|
107,649
|
|
|
8/6/2019
|
-
|
-
|
-
|
-
|
-
|
-
|
-
|
62,225
|
1.64
|
102,049
|
|
|
8/6/2019
|
-
|
-
|
-
|
-
|
-
|
-
|
-
|
15,557
|
0.26
|
4,045
|
|
|
8/6/2019
|
-
|
-
|
-
|
-
|
-
|
-
|
-
|
15,556
|
0.48
|
7,467
|
|
|
8/6/2019
|
-
|
-
|
-
|
-
|
-
|
-
|
-
|
15,556
|
0.75
|
11,667
|
|
|
8/6/2019
|
-
|
-
|
-
|
-
|
-
|
-
|
-
|
15,556
|
1.07
|
16,645
|
|
|
Bonnie Wasgatt
|
5/20/2019
|
83,750
|
167,500
|
251,250
|
-
|
-
|
-
|
-
|
-
|
-
|
-
|
|
8/6/2019
|
-
|
-
|
-
|
-
|
-
|
-
|
-
|
18,192
|
1.73
|
31,472
|
|
|
8/6/2019
|
-
|
-
|
-
|
-
|
-
|
-
|
-
|
18,193
|
1.64
|
29,837
|
|
|
8/6/2019
|
-
|
-
|
-
|
-
|
-
|
-
|
-
|
4,548
|
0.26
|
1,182
|
|
|
8/6/2019
|
-
|
-
|
-
|
-
|
-
|
-
|
-
|
4,548
|
0.48
|
2,183
|
|
|
8/6/2019
|
-
|
-
|
-
|
-
|
-
|
-
|
-
|
4,548
|
0.75
|
3,411
|
|
|
8/6/2019
|
-
|
-
|
-
|
-
|
-
|
-
|
-
|
4,548
|
1.07
|
4,866
|
|
|
5/20/2019
|
-
|
-
|
-
|
-
|
-
|
-
|
-
|
9,375
|
0.36
|
3,375
|
|
|
5/20/2019
|
-
|
-
|
-
|
-
|
-
|
-
|
-
|
35,416
|
0.78
|
27,624
|
|
|
5/20/2019
|
-
|
-
|
-
|
-
|
-
|
-
|
-
|
9,375
|
0.33
|
3,094
|
|
|
5/20/2019
|
-
|
-
|
-
|
-
|
-
|
-
|
-
|
35,417
|
1.15
|
40,730
|
|
|
5/20/2019
|
-
|
-
|
-
|
-
|
-
|
-
|
-
|
9,375
|
0.3
|
2,813
|
|
|
5/20/2019
|
-
|
-
|
-
|
-
|
-
|
-
|
-
|
35,417
|
1.49
|
52,771
|
|
|
5/20/2019
|
-
|
-
|
-
|
-
|
-
|
-
|
-
|
9,375
|
0.1
|
938
|
|
|
5/20/2019
|
-
|
-
|
-
|
-
|
-
|
-
|
-
|
35,417
|
1.8
|
63,751
|
|
|
5/20/2019
|
-
|
-
|
-
|
-
|
-
|
-
|
-
|
141,667
|
1.86
|
263,501
|
|
|
5/20/2019
|
-
|
-
|
-
|
-
|
-
|
-
|
-
|
37,500
|
1.92
|
72,000
|
|
|
5/20/2019
|
-
|
-
|
-
|
-
|
-
|
-
|
-
|
141,666
|
1.92
|
271,999
|
|
|
Alex Castillo
|
5/20/2019
|
55,000
|
110,000
|
165,000
|
-
|
-
|
-
|
-
|
-
|
-
|
-
|
|
8/6/2019
|
-
|
-
|
-
|
-
|
-
|
-
|
-
|
12,842
|
1.73
|
22,217
|
|
|
8/6/2019
|
-
|
-
|
-
|
-
|
-
|
-
|
-
|
12,842
|
1.64
|
21,061
|
|
|
8/6/2019
|
-
|
-
|
-
|
-
|
-
|
-
|
-
|
3,211
|
0.26
|
835
|
|
|
8/6/2019
|
-
|
-
|
-
|
-
|
-
|
-
|
-
|
3,210
|
0.48
|
1,541
|
|
|
8/6/2019
|
-
|
-
|
-
|
-
|
-
|
-
|
-
|
3,210
|
0.75
|
2,408
|
|
|
8/6/2019
|
-
|
-
|
-
|
-
|
-
|
-
|
-
|
3,210
|
1.07
|
3,435
|
|
|
5/20/2019
|
-
|
-
|
-
|
-
|
-
|
-
|
-
|
6,250
|
0.36
|
2,250
|
|
|
5/20/2019
|
-
|
-
|
-
|
-
|
-
|
-
|
-
|
25,000
|
0.78
|
19,500
|
|
|
5/20/2019
|
-
|
-
|
-
|
-
|
-
|
-
|
-
|
6,250
|
0.33
|
2,063
|
|
|
5/20/2019
|
-
|
-
|
-
|
-
|
-
|
-
|
-
|
25,000
|
1.15
|
28,750
|
|
|
5/20/2019
|
-
|
-
|
-
|
-
|
-
|
-
|
-
|
6,250
|
0.3
|
1,875
|
|
|
5/20/2019
|
-
|
-
|
-
|
-
|
-
|
-
|
-
|
25,000
|
1.49
|
37,250
|
|
|
5/20/2019
|
-
|
-
|
-
|
-
|
-
|
-
|
-
|
6,250
|
0.1
|
625
|
|
|
5/20/2019
|
-
|
-
|
-
|
-
|
-
|
-
|
-
|
25,000
|
1.8
|
45,000
|
|
|
5/20/2019
|
-
|
-
|
-
|
-
|
-
|
-
|
-
|
100,000
|
1.86
|
186,000
|
|
|
5/20/2019
|
-
|
-
|
-
|
-
|
-
|
-
|
-
|
25,000
|
1.92
|
48,000
|
|
|
5/20/2019
|
-
|
-
|
-
|
-
|
-
|
-
|
-
|
100,000
|
1.92
|
192,000
|
|
|
Dennis R. Vigneau (d)
|
2/26/2019
|
132,000
|
264,000
|
396,000
|
-
|
-
|
-
|
-
|
-
|
-
|
-
|
|
5/15/2018
|
-
|
-
|
-
|
-
|
-
|
-
|
-
|
30,673
|
0.69
|
21,164
|
|
|
5/15/2018
|
-
|
-
|
-
|
-
|
-
|
-
|
-
|
30,674
|
0.83
|
25,459
|
|
|
5/15/2018
|
-
|
-
|
-
|
-
|
-
|
-
|
-
|
30,674
|
0.87
|
26,686
|
|
|
5/15/2018
|
-
|
-
|
-
|
-
|
-
|
-
|
-
|
30,674
|
0.77
|
23,619
|
|
|
5/15/2018
|
-
|
-
|
-
|
-
|
-
|
-
|
-
|
30,674
|
0.77
|
23,619
|
|
|
5/15/2018
|
-
|
-
|
-
|
-
|
-
|
-
|
-
|
121,138
|
2.53
|
306,479
|
|
|
5/15/2018
|
-
|
-
|
-
|
-
|
-
|
-
|
-
|
121,138
|
2.36
|
285,886
|
|
|
5/15/2018
|
-
|
-
|
-
|
-
|
-
|
-
|
-
|
121,139
|
2.10
|
254,392
|
|
|
5/15/2018
|
-
|
-
|
-
|
-
|
-
|
-
|
-
|
121,139
|
1.77
|
214,416
|
|
|
5/15/2018
|
-
|
-
|
-
|
-
|
-
|
-
|
-
|
121,139
|
1.36
|
164,749
|
|
|
5/15/2018
|
-
|
-
|
-
|
-
|
-
|
-
|
-
|
153,369
|
2.35
|
360,417
|
|
|
5/15/2018
|
-
|
-
|
-
|
-
|
-
|
-
|
-
|
605,693
|
2.35
|
1,423,379
|
|
|
5/15/2018
|
-
|
-
|
-
|
-
|
-
|
-
|
-
|
605,693
|
2.20
|
1,332,525
|
|
122
|
a.
|
Represents the potential amounts for annual EIP incentives for fiscal 2019. Actual amounts earned by the NEOs are reflected in the Summary Compensation Table.
|
|
b.
|
Represents stock option awards granted under our 2017 Omnibus Incentive Plan which vest, if at all, subject to a combination of time and/or performance based vesting over a four or five year period from the date of grant. Time-based stock options vest one-fifth or one-fourth each year on the anniversary of the grant date. Stock price options vest based on the achievement of stock price goals, ranging from $10 to $25, applicable to each period. Performance based options vest based on three-year, four-year and five-year Adjusted Operating ROE goals, ranging from 15.50% to 18.50%, applicable to each period. These stock options expire seven years from their respective grant date.
|
|
c.
|
Mr. Fleurant was not eligible for the 2019 EIP grant, as he joined our company in November 2019.
|
|
d.
|
Pursuant to his transition agreement, we agreed to amend the vesting of certain options held by Mr.Vigneau.
|
Narrative Disclosure to Summary Compensation Table and Grants of Plan-Based Awards Table
Employment Agreements and Related Agreements with Named Executive Officers
Employment Agreement with Christopher O. Blunt
On December 19, 2018, we announced that Christopher O. Blunt had been appointed as President, Chief Executive Officer, and member of the Board of Directors, effective January 2, 2019. In connection with this appointment we entered into an employment agreement with Mr. Blunt, pursuant to which Mr. Blunt is entitled to receive a base salary of $800,000 and a target bonus opportunity equal to 200% of his base salary, subject to the achievement of criteria to be established by the Board of Directors. The agreement also provided for a signing bonus of $2,250,000 upon Mr. Blunt’s continued employment through March 15, 2019.
Upon a termination without “cause” or by Mr. Blunt for “good reason,” each as defined in the agreement, he will be entitled to receive severance benefits equal to three times his base salary, acceleration of the stock options awarded December 21, 2018, and eighteen months of benefit continuation. He is also entitled to acceleration of certain options upon termination without cause or for good reason within 12 months following a change in control of the Company. In addition, Mr. Blunt will be subject to certain restrictive covenants that apply both during his employment with the Company and for certain durations afterwards.
Other Employment Agreements
On November 6, 2019, we announced that John T. Fleurant would join the Company as its Chief Financial Officer, effective November 11, 2019. In connection with this appointment we entered into an employment agreement with Mr. Fleurant, pursuant to which Mr. Fleurant is entitled to receive an annual base salary of $500,000 and a target bonus opportunity equal to 100% of his base salary, subject to the achievement of criteria to be established by the Company. Upon a termination without “cause”, Mr. Fleurant will be entitled to receive severance benefits equal to six months of his base salary and six months of Company-paid COBRA. Mr. Fleurant will be subject to certain restrictive covenants that apply both during his employment with the Company and for certain durations afterwards.
We have also entered into an employment agreement with Mr. Krishnan dated January 1, 2019. Pursuant to this agreement, Mr. Krishnan’s compensation is determined by the Company and he is entitled to certain severance amounts if terminated without cause, the amount of which is based on his tenure with the Company but range from 26 to 52 weeks of base salary, subject to execution of a release. Mr. Krishnan will be subject to certain restrictive covenants that apply both during his employment with the Company and for certain durations afterwards.
Leadership Transition Agreement with Dennis Vigneau
On March 29, 2019, we entered into a prospective leadership transition agreement with Chief Financial Officer Dennis Vigneau, in connection with his planned retirement on December 31, 2019, which technically amended and restated the existing employment agreement between Mr. Vigneau and the Company, dated January 27, 2014.
Under this agreement, Mr. Vigneau agreed to continue as the Company’s CFO until a new CFO was identified by the Company, at which time, Mr. Vigneau would assume a non-executive advisor role until his retirement. In return, Mr. Vigneau was entitled to the following payments pursuant to the terms of this agreement: (i) continued base salary through 2019; (ii) a 2019 fixed performance bonus of $500,000; (iii) a $500,000 bonus
123
upon the Company’s hiring of a permanent CFO; (iv) two bonuses equal to $200,000 each contingent upon the completion of certain strategic initiatives; (v) full severance benefits under Mr. Vigneau’s employment agreement equal to $330,000; (vi) an amount no greater than $40,000 for reasonable attorneys’ fees for the negotiation of the transition agreement; and (vii) accelerated vesting of certain options held by Mr. Vigneau.
2017 Business Combination
At the effective time of the Business Combination on November 30, 2017, each (i) option to purchase shares of FGL’s common stock (“FGL Stock Option”), (ii) restricted share of FGL’s common stock and (iii) Performance RSU, in each case whether vested or unvested, became fully vested and automatically converted into the right to receive a cash payment equal to the product of (1) the number of shares subject to the award (for Performance RSUs, determined at the target performance level) multiplied by (2) the merger consideration of $31.10 (less the exercise price per share in the case of FGL Stock Options). In addition, at the effective time of the Merger, each stock option (“FGLH Stock Option”) and restricted stock unit relating to shares of Fidelity & Guaranty Life Holdings, Inc., a Delaware corporation and wholly owned subsidiary of the company (“FGLH”), whether vested or unvested, became fully vested and automatically converted into the right to receive a cash payment equal to the product of (A) the number of shares of FGLH stock subject to the award multiplied by (B) $176.32 (less the exercise price in the case of such FGLH Stock Options).
Outstanding Equity Awards at Fiscal Year-End
The following table sets forth information concerning outstanding equity awards held by our named executive officers at the end of fiscal 2019.
|
Option Awards
|
Stock Awards
|
|||||||
|
Name
|
Number of securities underlying unexercised options (#) exercisable
|
Number of securities underlying unexercised options (#) unexercisable
|
Option exercise price ($)
|
Option Expiration Date
|
Number of shares or units of stock that have not vested (#)
|
Market value of shares or units of stock that have not vested (#)
|
Equity incentive plan awards: number of unearned shares, units or other rights that have not vested (#)
|
Equity incentive plan awards: market or payout value of unearned shares, units or other rights that have not vested ($)
|
|
Christopher O. Blunt
|
144,320
|
1,912,356
|
10.00
|
12/21/2025
|
-
|
-
|
-
|
-
|
|
175,680
|
1,581,120
|
7.04
|
12/21/2025
|
-
|
-
|
-
|
-
|
|
|
John Fleurant
|
-
|
1,800,000
|
10.00
|
11/11/2026
|
-
|
-
|
-
|
-
|
|
-
|
200,000
|
9.18
|
11/11/2026
|
-
|
-
|
-
|
-
|
|
|
Raj Krishnan
|
-
|
1,674,514
|
10.00
|
3/15/2026
|
-
|
-
|
-
|
-
|
|
-
|
186,675
|
7.16
|
8/6/2026
|
-
|
-
|
-
|
-
|
|
|
Bonnie Wasgatt
|
-
|
500,000
|
10.00
|
5/20/2026
|
-
|
-
|
-
|
-
|
|
-
|
54,577
|
7.16
|
8/6/2026
|
-
|
-
|
-
|
-
|
|
|
Alex Castillo
|
-
|
350,000
|
10.00
|
5/20/2026
|
-
|
-
|
-
|
-
|
|
-
|
38,525
|
7.16
|
8/6/2026
|
-
|
-
|
-
|
-
|
|
|
Dennis R. Vigneau (a)
|
242,277
|
-
|
10.00
|
5/15/2025
|
-
|
-
|
-
|
-
|
|
a.
|
Reflects the amendment of a portion of Mr. Vigneau’s options effective December 31, 2019, pursuant to his transition agreement with the company.
|
124
Option Exercises and Stock Vested
|
Option Awards
|
Stock Awards
|
|||
|
Name
|
Number of shares acquired on exercise (#)
|
Option exercise price
|
Number of shares acquired on vesting (#)
|
Value realized on vesting
|
|
Christopher O. Blunt
|
-
|
-
|
-
|
-
|
|
John T. Fleurant
|
-
|
-
|
-
|
-
|
|
Rajesh Krishnan
|
-
|
-
|
-
|
-
|
|
Bonnie Wasgatt
|
-
|
-
|
-
|
-
|
|
R. Alex Castillo
|
-
|
-
|
-
|
-
|
|
Dennis R. Vigneau
|
-
|
-
|
-
|
-
|
Pension Benefits
We do not provide any defined benefit plans to our NEOs.
125
Nonqualified Deferred Compensation
The following table provides information concerning the nonqualified deferred compensation of each of the participating NEOs in the Executive Nonqualified Deferred Compensation Plan of FGLH (the “Deferred Compensation Plan”) as of December 31, 2019.
|
Name
|
Aggregate Balance at Beginning of Last Fiscal Year
|
Executive Contributions in Last Fiscal Year (a)
|
Registrant Contributions in Last Fiscal Year (b)
|
Aggregate Earnings in Last Fiscal Year (c)
|
Aggregate Withdrawals/Distributions
|
Aggregate Balance at Last Fiscal Year End (d)
|
||||||||||||
|
Christopher O. Blunt
|
$
|
—
|
|
$
|
—
|
|
$
|
—
|
|
$
|
—
|
|
$
|
—
|
|
$
|
—
|
|
|
John T. Fleurant
|
—
|
|
—
|
|
—
|
|
—
|
|
—
|
|
—
|
|
||||||
|
Rajesh Krishnan
|
1,247,008
|
|
—
|
|
—
|
|
170,411
|
|
—
|
|
1,417,419
|
|
||||||
|
Bonnie Wasgatt
|
—
|
|
30,923
|
|
—
|
|
1,412
|
|
—
|
|
32,335
|
|
||||||
|
R. Alex Castillo
|
—
|
|
—
|
|
—
|
|
—
|
|
—
|
|
—
|
|
||||||
|
Dennis R. Vigneau
|
1,028,079
|
|
686,364
|
|
—
|
|
238,463
|
|
—
|
|
1,952,906
|
|
||||||
|
a.
|
Amounts reported in this column are included in the Summary Compensation Table in the “Salary” and “Non-Equity Incentive Plan Compensation” columns for fiscal 2019.
|
|
b.
|
Contributions were not made by FGL after fiscal 2013.
|
|
c.
|
Amounts reported in this column are not reported as compensation in the Summary Compensation Table.
|
|
d.
|
Amounts reported in this column were not reported as compensation in the Summary Compensation tables for previous years.
|
The Deferred Compensation Plan permits our participating NEOs and certain other employees to elect to defer up to 50% of their base salary and up to 100% of any performance-based non-equity incentive plan compensation. Any deferral elections are made under the Deferred Compensation Plan pursuant to a participation agreement with the NEO. We have eliminated the annual discretionary grant to each active participating NEO effective January 2013. Past employer contributions vest 20% for each year of service and are fully vested after five years of service. Deferred amounts and employer contributions are contributed to individual accounts in the FGLH Executive Deferred Compensation Plan Trust. The participants self-direct the notional investment of deferred contribution accounts in investment funds from a selection made available by our retirement committee.
The vested balance of the deferred compensation accounts will be distributed to each participating NEO upon his or her death, disability or separation from service (including retirement). Participants may elect upon initial enrollment to have accounts distributed upon a change in control event, although none of our NEOs have so elected. In-service hardship and education account withdrawals are permitted under the plan with respect to participant deferrals and employer credits.
Potential Payments upon Termination or Change in Control
The following table sets forth the estimated amount of compensation each of our NEOs would receive under the termination or change in control provisions contained in the agreements and plans discussed above, assuming that such termination or change in control event occurred on December 31, 2019. However, for Mr. Vigneau, the table includes only the actual amounts paid in connection with the transition agreement related to his retirement from the company on December 31, 2019.
The table excludes (i) amounts accrued through the termination date that would be paid in the normal course of continued employment, such as accrued but unpaid salary, (ii) vested account balances under our 401(k) plan that are generally available to all of our employees and (iii) except as indicated in the footnotes below, any post-employment benefit that is available to all of our employees and does not discriminate in favor of our NEOs. In the case of a change in control situation, we assume that the vesting of all options and restricted stock will be accelerated, even though our Compensation Committee has the discretion to provide for alternative treatment of the awards upon a change in control.
126
|
Name
|
Termination Trigger
|
Severance (Salary)(a)
|
Severance (Bonus)(b)
|
Equity Vesting (c)
|
Nonqualified Deferred Compensation (d)
|
Other Benefits (e)
|
Total
|
||||||||||||
|
Christopher O. Blunt
|
Involuntary termination w/o cause
|
$
|
2,400,000
|
|
$
|
—
|
|
$
|
1,116,019
|
|
$
|
—
|
|
$
|
16,950
|
|
$
|
3,532,969
|
|
|
Voluntary termination
|
—
|
|
—
|
|
1,116,019
|
|
—
|
|
15,385
|
|
1,131,404
|
|
|||||||
|
Retirement (f)
|
—
|
|
—
|
|
—
|
|
—
|
|
—
|
|
—
|
|
|||||||
|
Death
|
—
|
|
1,600,000
|
|
1,116,019
|
|
—
|
|
15,385
|
|
2,731,404
|
|
|||||||
|
Disability
|
—
|
|
1,600,000
|
|
1,116,019
|
|
—
|
|
15,385
|
|
2,731,404
|
|
|||||||
|
Change in control
|
2,400,000
|
|
—
|
|
1,116,019
|
|
—
|
|
16,950
|
|
3,532,969
|
|
|||||||
|
John T. Fleurant
|
Involuntary termination w/o cause
|
250,000
|
|
500,000
|
|
—
|
|
—
|
|
13,969
|
|
763,969
|
|
||||||
|
Voluntary termination
|
—
|
|
—
|
|
—
|
|
—
|
|
5,923
|
|
5,923
|
|
|||||||
|
Retirement (f)
|
—
|
|
—
|
|
—
|
|
—
|
|
—
|
|
—
|
|
|||||||
|
Death
|
—
|
|
500,000
|
|
—
|
|
—
|
|
—
|
|
500,000
|
|
|||||||
|
Disability
|
—
|
|
500,000
|
|
—
|
|
—
|
|
5,923
|
|
505,923
|
|
|||||||
|
Change in control
|
500,000
|
|
1,000,000
|
|
—
|
|
—
|
|
22,014
|
|
1,522,014
|
|
|||||||
|
Rajesh Krishnan
|
Involuntary termination w/o cause
|
175,000
|
|
350,000
|
|
—
|
|
1,417,419
|
|
16,413
|
|
1,958,832
|
|
||||||
|
Voluntary termination
|
—
|
|
—
|
|
—
|
|
1,417,419
|
|
6,731
|
|
1,424,150
|
|
|||||||
|
Retirement (f)
|
—
|
|
—
|
|
—
|
|
—
|
|
—
|
|
—
|
|
|||||||
|
Death
|
—
|
|
350,000
|
|
—
|
|
1,417,419
|
|
—
|
|
1,767,419
|
|
|||||||
|
Disability
|
—
|
|
350,000
|
|
—
|
|
1,417,419
|
|
6,731
|
|
1,774,150
|
|
|||||||
|
Change in control
|
350,000
|
|
700,000
|
|
—
|
|
-
|
|
26,095
|
|
1,076,095
|
|
|||||||
|
Bonnie Wasgatt
|
Involuntary termination w/o cause
|
167,500
|
|
—
|
|
—
|
|
32,335
|
|
16,156
|
|
215,991
|
|
||||||
|
Voluntary termination
|
—
|
|
—
|
|
—
|
|
32,335
|
|
6,442
|
|
38,777
|
|
|||||||
|
Retirement (f)
|
—
|
|
—
|
|
—
|
|
—
|
|
—
|
|
—
|
|
|||||||
|
Death
|
—
|
|
—
|
|
—
|
|
32,335
|
|
—
|
|
32,335
|
|
|||||||
|
Disability
|
—
|
|
—
|
|
—
|
|
32,335
|
|
6,442
|
|
38,777
|
|
|||||||
|
Change in control
|
335,000
|
|
335,000
|
|
—
|
|
—
|
|
25,869
|
|
695,869
|
|
|||||||
|
R. Alex Castillo
|
Involuntary termination w/o cause
|
137,500
|
|
—
|
|
—
|
|
—
|
|
14,970
|
|
152,470
|
|
||||||
|
Voluntary termination
|
—
|
|
—
|
|
—
|
|
—
|
|
5,288
|
|
5,288
|
|
|||||||
|
Retirement (f)
|
—
|
|
—
|
|
—
|
|
—
|
|
—
|
|
—
|
|
|||||||
|
Death
|
—
|
|
—
|
|
—
|
|
—
|
|
—
|
|
—
|
|
|||||||
|
Disability
|
—
|
|
—
|
|
—
|
|
—
|
|
5,288
|
|
5,288
|
|
|||||||
|
Change in control
|
275,000
|
|
220,000
|
|
—
|
|
—
|
|
24,652
|
|
519,652
|
|
|||||||
|
Dennis R. Vigneau (g)
|
Transition and Retirement
|
330,000
|
|
500,000
|
|
169,594
|
|
1,952,906
|
|
—
|
|
2,952,500
|
|
||||||
|
a.
|
Under the terms of the employment agreements and severance plan, severance pays out in a lump sum. Amounts payable in this column may be subject to the NEO executing and not revoking a release of claims against the company. See “Narrative to Summary Compensation Table and Grants of Plan-Based Awards Table-Employment Agreements with Named Executive Officers.”
|
|
b.
|
Amounts in this column include, if provided in an employment agreement with the NEO, a pro rata bonus for the year of termination upon certain types of terminations
|
|
c.
|
As of December 31, 2019, the exercise price of the stock options held by the NEOs subject to potential vesting exceeded the market price of the underlying ordinary shares.
|
|
d.
|
For any participating NEO, the vested balance of the deferred compensation accounts will be distributed upon death, disability or separation from service.
|
|
e.
|
Amounts include any accrued vacation as of December 31, 2019, which would be paid out upon a termination.
|
|
f.
|
As of December 31, 2019, none of our continuing NEOs were retirement eligible.
|
|
g.
|
Represents the amounts paid pursuant to Mr. Vigneau’s transition agreement from the company, which include amounts payable under his employment agreement as if he were terminated without cause. For a description of Mr. Vigneau’s transition agreement, see “Summary Compensation Table-Narrative to Summary Compensation Table and Grants of Plan-Based Awards Table ‒ Leadership Transition Agreement.”
|
127
NON-EMPLOYEE DIRECTOR COMPENSATION
Our Nominating and Corporate Governance Committee is responsible for reviewing the compensation of our non-employee directors and making recommendations to the Board. In recommending compensation, the committee takes into consideration the following: (i) compensation should be competitive and fairly compensate directors for the time and effort required of Board and committee members, taking into consideration compensation paid to directors of comparable companies; (ii) compensation should align directors' interests with the long-term interests of shareholders; and (iii) the structure of the compensation should be simple, transparent and easy for shareholders to understand.
In 2018, Frederic W. Cook & Co., Inc. (“FW Cook”) conducted a competitive analysis of our company’s compensation peer group with respect to board compensation. Based on the recommendations of FW Cook, the Nominating and Corporate Governance Committee recommended, and the Board approved, adjusting non-employee director compensation, including adding an equity component, which placed the compensation levels between the median and 75th percentile of the peer group.
The following are the components of our non-employee directors’ compensation:
|
Compensation Component
|
Description
|
|
Annual Cash Retainer
|
$100,000
|
|
Annual Equity Retainer
|
$125,000 in restricted stock shares that vest after one year
|
|
Board and Committee Fees
|
None
|
|
Chair Fees
|
$20,000 for Audit Committee
$10,000 for Compensation and Nominating and Corporate Governance Committees
|
|
Other
|
Directors are reimbursed for out-of-pocket expenses in connection with their service on the Board, including meetings and other Board duties
|
Director Compensation Table
The following table provides summary information concerning compensation paid or accrued by us to our non-employee directors for services rendered to us during fiscal 2019.
|
Name
|
Fees Earned or Paid in Cash
|
Stock Awards (a)
|
Option Awards
|
Non-Equity Incentive Plan Compensation
|
Change in Pension Value and Non-qualified Deferred Compensation Earnings
|
All Other Compensation
|
Total
|
|||||
|
Chinh E. Chu
|
$
|
100,000
|
|
124,997
|
|
-
|
-
|
-
|
-
|
$
|
224,997
|
|
|
William P. Foley, II
|
100,000
|
|
124,997
|
|
-
|
-
|
-
|
-
|
224,997
|
|
||
|
Keith W. Abell
|
110,000
|
|
124,997
|
|
-
|
-
|
-
|
-
|
234,997
|
|
||
|
Patrick S. Baird
|
100,000
|
|
124,997
|
|
-
|
-
|
-
|
-
|
224,997
|
|
||
|
Menes O. Chee
|
100,000
|
|
124,997
|
|
-
|
-
|
-
|
-
|
224,997
|
|
||
|
Richard M. Massey
|
100,000
|
|
124,997
|
|
-
|
-
|
-
|
-
|
224,997
|
|
||
|
James A. Quella
|
110,000
|
|
124,997
|
|
-
|
-
|
-
|
-
|
234,997
|
|
||
|
Timothy M. Walsh
|
120,000
|
|
124,997
|
|
-
|
-
|
-
|
-
|
244,997
|
|
||
|
a.
|
Represents the grant date fair value of restricted stock, computed in accordance with Financial Accounting Standards Board Accounting Standards Clarification (“FASB ASC”) Topic 718.
|
128
SECURITIES AUTHORIZED FOR ISSUANCE UNDER EQUITY COMPENSATION PLANS
The following table presents information as of December 31, 2019, regarding our securities authorized for issuance under equity compensation plans:
|
Plan category
|
Number of securities to be issued upon exercise of outstanding options, warrants and rights (1)
|
Weighted-average exercise price of outstanding options, warrants and rights (2)
|
Number of securities remaining available for future issuance under equity compensation plans (excluding securities reflected in column (1)) (3)
|
|
|
Equity compensation plans approved by security holders (a)
|
9,293,745
|
$
|
9.77
|
5,712,155
|
|
Equity compensation plans not approved by security holders (b)
|
5,920,214
|
$
|
8.57
|
—
|
|
Total
|
15,213,959
|
$
|
9.30
|
5,712,155
|
|
a.
|
Represents securities issued or issuable under our 2017 Omnibus Incentive Plan.
|
|
b.
|
Represents shares reserved for issuance in connection with stock options granted outside of the 2017 Omnibus Incentive Plan as an “employment inducement award” under NYSE Listing Rule 303A.08. The inducement awards are subject to the terms and conditions of the 2017 Omnibus Incentive Plan. Includes:
|
For Mr. Blunt, stock options for a total of 3,813,476 shares were issued as inducement awards and vest as follows:
|
•
|
Stock options for 3,200,000 shares vest as follows: fifty percent in five equal annual installments beginning on December 21, 2019, subject to continued employment, and fifty percent in five equal installments beginning on December 21, 2019, based on attainment of performance objectives to be established by the board of directors on an annual basis, subject to continued employment.
|
|
•
|
Stock options for 613,476 shares vest as follows: fifty percent in three equal annual installments beginning on March 15, 2021, based on attainment of specified return on equity performance metrics, subject to continued employment, and fifty percent vesting in five equal installments beginning on March 15, 2020, based on attainment of specified minimum stock prices, subject to continued employment.
|
For Mr. Bayer, stock options for a total of 2,106,738 shares were issued as inducement awards and vest as follows:
|
•
|
Stock options for 1,800,000 shares vest as follows: fifty percent in five equal annual installments beginning on December 21, 2019, subject to continued employment, and fifty percent in five equal installments beginning on December 21, 2019, based on attainment of performance objectives to be established by the board of directors on an annual basis, subject to continued employment.
|
|
•
|
Stock options for 306,738 shares vest as follows: fifty percent in three equal annual installments beginning on March 15, 2021, based on attainment of specified return on equity performance metrics, subject to continued employment, and fifty percent in five equal installments beginning on March 15, 2020, based on attainment of specified minimum stock prices, subject to continued employment.
|
SECURITY OWNERSHIP OF CERTAIN BENEFICIAL OWNERS AND MANAGEMENT
The following table sets forth certain information regarding beneficial ownership of our ordinary shares as of February 24, 2020, unless otherwise noted, by (a) each person who is known to us to own beneficially more than 5% of our common stock, (b) each director and nominee for director, (c) each named executive officer and (d) the directors and executive officers as a group. The table lists voting securities, including restricted stock held
129
by our directors and executive officers over which they have sole voting power but no investment power. Otherwise, except to the extent noted below, each person identified below has sole voting and investment power over the shares reported. Except as otherwise noted below, we know of no agreements among our shareholders which related to voting or investment power with respect to our common stock and none of the stated shares have been pledged as a security.
|
Name and Address of Beneficial Owner (a)
|
Number of Shares Beneficially Owned (a)
|
Percent of Outstanding Ordinary Shares (b)
|
|
|
Greater than 5% Shareholders:
|
|||
|
Blackstone
|
45,301,593
|
(c)(d)
|
20.4%
|
|
Fidelity National Financial, Inc.
|
16,897,000
|
(e)
|
7.6%
|
|
The Vanguard Group
|
15,289,000
|
(f)
|
6.9%
|
|
Coral Blue Investment Pte. Ltd.
|
12,691,278
|
(g)
|
5.7%
|
|
BlackRock, Inc.
|
21,669,453
|
(h)
|
9.7%
|
|
Directors and Officers:
|
|||
|
Chinh E. Chu
|
14,935,466
|
(i)(d)
|
6.7%
|
|
William P. Foley, II
|
14,935,466
|
(j)(d)
|
6.7%
|
|
Keith W. Abell
|
234,046
|
*
|
|
|
Patrick S. Baird
|
49,743
|
*
|
|
|
Menes O. Chee
|
42,743
|
(k)
|
*
|
|
Richard N. Massey
|
1,985,782
|
(l)
|
*
|
|
James A. Quella
|
979,262
|
*
|
|
|
Timothy M. Walsh
|
52,743
|
*
|
|
|
Christopher O. Blunt
|
821,348
|
(m)
|
*
|
|
John T. Fleurant
|
-
|
*
|
|
|
Rajesh Krishnan
|
273,700
|
(n)
|
*
|
|
Bonnie Wasgatt
|
89,304
|
(n)
|
*
|
|
R. Alex Castillo
|
62,670
|
(n)
|
*
|
|
Dennis Vigneau
|
242,277
|
(n)
|
*
|
|
All directors and executive officers as a group (19 persons)
|
36,150,298
|
(o)
|
16.3%
|
* Indicates less than 1% of our outstanding ordinary shares.
|
a.
|
Except as described in the footnotes below and subject to applicable community property laws and similar laws, the company believes that each person listed above has sole voting and investment power with respect to all ordinary shares beneficially owned by them. Unless otherwise indicated, the business address of each of the entities, directors and executives in this table is 4th Floor, Boundary Hall, Cricket Square, Grand Cayman, Cayman Islands KY1-1102.
|
|
b.
|
Percentage of beneficial ownership is based on 221,807,598 shares outstanding as of February 24, 2020. Shares issuable pursuant to options and warrants that are currently exercisable or exercisable within 60 days are deemed outstanding for computing the percentage of the person holding such options or warrants but are not deemed outstanding for computing the percentage of any other person.
|
|
c.
|
Based solely on a Schedule 13D/A filed with the SEC on February 10, 2020 by CFS Holdings (Cayman), L.P. (“CFS 1”), CFS Holdings II (Cayman), L.P. (“CFS 2” and together with CFS 2, the “Blackstone Funds”), CFS Holdings (Cayman) Manager L.L.C. (“CFS Cayman Manager”), Blackstone Tactical Opportunities LR Associates-B (Cayman) Ltd. (“BTO Cayman”), Blackstone Holdings III L.P. (“Blackstone Holdings III”), Blackstone Holding III GP L.P. (“Blackstone Holdings III GP”), Blackstone Holdings III GP Management L.L.C.(“(“Blackstone Holdings III LLC”), GSO Aiguille des Grands Montets Fund II LP (“Aiguille Fund”), GSO COF III AIV-5 LP (“GSO AIV-5”), GSO COF III Co-Investment AIV-5 LP (“GSO COF AIV-5”), GSO Co-Investment Fund-D LP (“GSO D”), GSO Credit Alpha Fund LP (“GSO Alpha”), GSO Churchill Partners LP (“GSO Churchill”), GSO Credit-A Partners LP (“GSO Credit-A”), GSO Harrington Credit Alpha Fund (Cayman) L.P. (“GSO Harrington” and collectively with Aiguille Fund, GSO AIV-5, GSO COF AIV-5, GSO D, GSO Alpha, GSO Churchill and GSO Credit-A, the “GSO Funds”). GSO Capital Partners LP (“GSO Partners”), GSO Advisor Holdings L.L.C. (“GSO Holdings”), GSO Capital Opportunities Associates III LLC (“GSO III LLC”), GSO COF III Co-Investment Associates LLC (“GSO COF AIV-5 LLC”), GSO Co-Investment Fund-D Associates LLC (“GSO D LLC”), GSO Credit Alpha Associates LLC (“GSO Alpha LLC”), GSO Churchill Associates LLC (“GSO Churchill LLC”), GSO Credit-A Associates LLC (“GSO Credit-A LLC”), GSO Harrington Credit Alpha Associates L.L.C. (“GSO Harrington LLC”), GSO Holdings I L.L.C. (“GSO Holdings I”), Blackstone Holdings I L.P. (“Blackstone Holdings I”), Blackstone Holdings II L.P. (“Blackstone Holdings II”), Blackstone Holdings I/II GP Inc. (“Blackstone Holdings I/II GP”), The Blackstone Group L.P., Blackstone Group Management L.L.C. (“Blackstone Management”), Stephen A. Schwarzman, Bennett J. Goodman, and J. Albert Smith III.
|
130
Includes 16,620,850 held by CFS 1, and 22,500,000 ordinary shares held by CFS 2, 142,111 ordinary shares held by Aiguille Fund; 4,147,302 ordinary shares held by GSO AIV-5; 1,442,118 ordinary shares held by GSO COF AIV-5; 50,912 ordinary shares held by GSO D; 165,079 ordinary shares held by GSO Alpha; 52,541 ordinary shares held by GSO Churchill; 113,921 ordinary shares held by GSO Credit-A; and 24,016 ordinary shares held by GSO Harrington. Additionally, includes 42,743 shares held by Mr. Chee, one of our directors and an employee of Blackstone and/or one of its affiliates. Pursuant to arrangements between Mr. Chee and Blackstone, Mr. Chee is required to transfer to Blackstone any and all compensation received in connection with his directorship for any company Blackstone invests in or advises. Blackstone has designated Blackstone Tactical Opportunities Advisors L.L.C. (“
BTOA
”) as the entity to receive the securities described herein. BTOA is an indirect subsidiary of Blackstone. As such, each of Blackstone, Blackstone Group Management L.L.C. and Stephen A. Schwarzman may be deemed to beneficially own the shares beneficially owned by BTOA.
CFS Cayman Manager is the general partner of CFS 1 and CFS 2. The Managing Member of CFS Cayman Manager is BTO Cayman. The controlling shareholder of BTO Cayman is Blackstone Holdings III. The general partner of Blackstone Holdings III is Blackstone Holding III GP. The general partner of Blackstone Holdings III GP is Blackstone Holdings III LLC The sole member of Blackstone Holdings III LLC is Blackstone.
GSO Partners is the investment manager of Aiguille Fund. GSO Holdings is the special limited partner of GSO Partners with the investment and voting power over the securities beneficially owned by GSO Partners. Blackstone Holdings I is the sole member of GSO Holdings.
GSO III LLC is the general partner of GSO AIV-5. GSO COF AIV-5 LLC is the general partner of GSO COF AIV-5. GSO D LLC is the general partner of GSO D. GSO Alpha LLC is the general partner of GSO Alpha. GSO Churchill LLC is the general partner of GSO Churchill. GSO Credit-A LLC is the general partner of GSO Credit-A. GSO Harrington LLC is the general partner of GSO Harrington. GSO Holdings I is the managing member of each of GSO III LLC, GSO COF AIV-5 LLC, GSO D LLC, GSO Alpha LLC, GSO Churchill LLC, GSO Credit-A LLC and GSO Harrington LLC. Blackstone Holdings II is the managing member of GSO Holdings I with respect to securities beneficially owned by the GSO Funds. Blackstone Holdings I/II GP is the general partner of each of Blackstone Holdings I and Blackstone Holdings II. Blackstone is the controlling shareholder of Blackstone Holdings I/II GP.
The general partner of Blackstone is Blackstone Management. Blackstone Management is wholly owned by Blackstone’s senior managing directors and controlled by its founder, Stephen A. Schwarzman. In addition, each of Bennett J. Goodman may be deemed to have shared voting power and/or investment power with respect to the securities held by the GSO Funds. Each of the foregoing entities and individuals disclaims beneficial ownership of the securities held directly by the GSO Funds (other than the GSO Funds to the extent of their direct holdings).
Each of such Blackstone entities, Mr. Schwarzman and Mr. Goodman may be deemed to beneficially own the shares beneficially owned by the Blackstone Funds and/or the GSO Funds directly or indirectly controlled by it or him, but each (other than the Blackstone Funds and GSO Funds to the extent they directly hold such securities) disclaims beneficial ownership of such shares.
The address for the GSO Funds, each entity listed in the third through fifth paragraphs of this footnote (other than Blackstone, Blackstone Holdings I, Blackstone Holdings II and Blackstone Holdings I/II GP), and Mr. Goodman is c/o GSO Capital Partners LP, 345 Park Avenue. The address for each other entity and person listed in this footnote is c/o The Blackstone Group L.P., 345 Park Avenue, New York, NY 10154.
|
d.
|
Pursuant to the Nominating and Voting Agreement, Mr. Chu, Mr. Foley and BTO have the right to designate one director nominee for election at each general meeting of the company, which nominee will be selected by a vote of any two of Mr. Chu, Mr. Foley and BTO. Mr. Chu, Mr. Foley and BTO have agreed to vote all of their shares in favor of such nominee. As such, each of Mr. Chu, Mr. Foley and BTO may be deemed to be members of a “group” within the meaning of Section 13(d)(3) of the Exchange Act, and each of the members may be deemed to beneficially own the shares of the other members. Each of Mr. Chu, Mr. Foley and BTO expressly disclaims any beneficial ownership of any securities owned by each of the other parties and their affiliates.
|
|
e.
|
Includes (i) 125,000 ordinary shares held by Fidelity National Financial, Inc. and (ii) 4,335,680 ordinary shares held by Fidelity National Title Insurance Company, 9,163,920 ordinary shares held by Chicago Title Insurance Company and 3,272,400 ordinary shares held by Commonwealth Land Title Insurance Company, each a wholly owned subsidiary of FNF (collectively, the “FNF Investors”). Each of the FNF Investors shares the power to vote and the power to dispose of the securities of the company held by it with FNF, and as such, FNF may be deemed to beneficially own the securities held by each of the FNF Investors. William P. Foley, II, our Co-Executive Chairman, is the non-executive Chairman of the Board of FNF. The address for FNF and the FNF Investors is 601 Riverside Ave., Jacksonville, FL 32204.
|
|
f.
|
Based solely on a Schedule 13G filed with the SEC on February 12, 2020 by The Vanguard Group. The Schedule 13G indicates that The Vanguard Group has sole voting power with respect to 144,811 of the shares, shared voting power with respect to 13,774 of the shares, sole dispositive power with respect to 15,157,775 of the shares, and shared dispositive power with respect to 131,725 of the shares. The business address of The Vanguard Group is 100 Vanguard Blvd., Malvern, PA 19355.
|
|
g.
|
Based solely on a Schedule 13G/A filed with the SEC on February 14, 2019 by GIC Private Limited (“GIC”) and Coral Blue Investment Pte. Ltd.. Coral Blue Investment Pte. Ltd. shares the power to vote and the power to dispose of these securities with GIC Private Limited (“GIC”), a private limited company incorporated in Singapore. GIC is wholly owned by the Government of Singapore and was set up with the sole purpose of managing Singapore’s foreign reserves. The Government of Singapore disclaims beneficial ownership of these securities. GIC and Coral Blue Investment Pte. Ltd. disclaim membership in a group. The business address of GIC and Coral Blue Investment Ltd. is 168 Robinson Road, #37-101, Capital Tower, Singapore, 068913.
|
|
h.
|
Based solely on a Schedule 13G filed with the SEC on February 5, 2020 by BlackRock, Inc. The Schedule 13G indicates that BlackRock, Inc. has sole dispositive power with respect to 21,669,453 of the ordinary shares and sole voting power with respect to 21,198,761 of the ordinary shares. The business address of BlackRock, Inc. is 55 East 52nd Street, New York, NY 10055.
|
131
|
i.
|
Includes 14,892,723 ordinary shares held by CC Capital Management LLC (“CCCM”). Mr. Chu is the managing member of CCCM and as such may be deemed to beneficially own all of the securities held directly by CCCM. Mr. Chu disclaims beneficial ownership of the reported securities except to the extent of his pecuniary interest therein.
|
|
j.
|
Includes 14,892,723 ordinary shares held by BilCar, LLC (“BilCar”). Mr. Foley is a manager of BilCar and as such may be deemed to beneficially own all of the securities held directly by BilCar. Mr. Foley disclaims beneficial ownership of the reported securities except to the extent of his pecuniary interest therein.
|
|
k.
|
Mr. Chee holds these shares for the benefit of Blackstone Tactical Opportunities Advisors L.L.C. Mr. Chee disclaims beneficial ownership of the reported securities except to the extent of his pecuniary interest therein.
|
|
l.
|
Includes 1,843,039 ordinary shares held by CFC 2016-A, LLC (“CFC”). Mr. Massey is the managing member of CFC and as such may be deemed to beneficially own all of the securities held by CFC. Mr. Massey disclaims beneficial ownership of the reported securities except to the extent of his pecuniary interest therein.
|
|
m.
|
Includes 701,348 ordinary shares subject to stock options, which are currently exercisable or are exercisable within 60 days.
|
|
n.
|
Comprised entirely of ordinary shares subject to stock options, which are currently exercisable or are exercisable within 60 days.
|
|
o.
|
Includes 1,445,748 ordinary shares subject to stock options, which are currently exercisable or are exercisable within 60 days.
|
132
CERTAIN RELATIONSHIPS AND RELATED PARTY TRANSACTIONS
Policies and Procedures for Related Person Transactions
Our Transactions Committee is responsible for reviewing any transaction with a related party pursuant to the policy and procedures in the committee’s charter. The Transactions Committee charter provides procedures for the approval of transactions with related persons as set forth in the rules and regulations of the SEC as well as “affiliate transactions” that require approval pursuant to the covenants set forth in any indenture, credit agreement or similar agreement of the company. These procedures provide that the Transactions Committee is responsible for reviewing and approving or disapproving all affiliate transactions, which include: any transaction between our company or its subsidiaries and our affiliates; any transaction, arrangement or relationship in which the amount involved may be expected to exceed $120,000 in any fiscal year, our company or its subsidiaries will be a participant, and a related person has a direct or indirect material interest; and any transaction described as an affiliate transaction in any indenture, credit agreement or similar agreement of our company. The Transactions Committee considers relevant facts and circumstances in determining whether or not to approve or ratify an affiliate transaction, and will approve or ratify only those transactions that are, in the committee’s judgment, fair to the company under the circumstances. In addition, Board approval is required for affiliate transactions required to comply with covenants set forth in any indenture, credit agreement or similar agreement of the company.
Related Person Transactions
In addition to the compensation arrangements with directors and executive officers described above in the section entitled “Executive Compensation,” the following is a description of each transaction since January 1, 2019 and each currently proposed transaction in which (i) we have been or are to be a participant, (ii) the amount involved exceeded or will exceed $120,000 and (iii) any of our directors, nominees for director, executive officers, holders of more than 5% of our ordinary shares, or any member of their immediate families or person sharing their household had or will have a direct or indirect material interest.
Investment Management Agreements
We, and certain subsidiaries of ours, entered into amended and restated investment management agreements (the “IMAs”) with Blackstone ISG-I Advisors LLC (“BISGA”), a wholly owned subsidiary of The Blackstone Group LP (“Blackstone”) on December 31, 2019, to be effective as of October 1, 2019, pursuant to which BISGA was appointed as investment manager of the Company’s general accounts (the “F&G Accounts”). The IMAs amend and restate investment management agreements entered into between November 2017 and March 2018 (the “Restated IMAs”). Pursuant to the terms of the IMAs, BISGA may delegate any or all of its discretionary investment, advisory and other rights, powers, functions and obligations under the IMAs to one or more sub-managers, including its affiliates. Pursuant to the Restated IMAs, BISGA delegated certain investment services to its affiliates, Blackstone Real Estate Special Situations Advisors L.L.C. (“BRESSA”) and GSO Capital Advisors II LLC (“GSO Capital Advisors”), pursuant to sub-management agreements executed between BISGA and each of BRESSA and GSO Capital Advisors. For the year ended December 31, 2019, the fees paid to BISGA under the Restated IMAs and the IMAs were approximately $95 million. As of December 31, 2019, the Company had a net liability of $47 million for the services provided under the Restated IMAs, the IMAs and related sub-management agreements, partially offset by fees received and expense reimbursements from BISGA. During fiscal 2019, we received expense reimbursements from BISGA for the services consumed under the agreements. The fees received for these services were $10 million for fiscal 2019.
Director Independence
Our Board has affirmatively determined that Messrs. Abell, Baird, Massey, Quella and Walsh are independent directors under NYSE Corporate Governance Standards. Under NYSE Corporate Governance Standards, no director qualifies as independent unless our Board affirmatively determines that the director has no material relationship with our company. Based upon information requested from and provided by each director concerning their background, employment and affiliations, including commercial, industrial, banking, consulting,
133
legal, accounting, charitable and familial relationships, our Board has determined that each of the independent directors named above has no material relationship with our company and is independent within the meaning of NYSE Corporate Governance Standards.
Our Audit, Compensation, Nominating and Corporate Governance Committee are entirely composed of such independent directors In addition, the Board has determined that members of the Audit Committee and Compensation Committee meet the additional independence requirements applicable to those committees under the NYSE Corporate Governance Standards and Rule 10A-3 under the Exchange Act, as applicable.
134
Principal Accountant Fees and Services
In accordance with Sarbanes-Oxley, our Audit Committee charter provides that our Audit Committee has the sole authority and responsibility to pre-approve all audit services, audit-related tax services and other permitted services to be performed for our company by our independent registered public accounting firm and the related fees. Pursuant to its charter and in compliance with rules of the SEC and the PCAOB, our Audit Committee has established a pre-approval policy and procedures that require the pre-approval of all services to be performed by our independent registered public accounting firm. The independent registered public accounting firm may be considered for other services not specifically approved as audit services or audit-related services and tax services so long as the services are not prohibited by SEC or PCAOB rules and would not otherwise impair the independence of our independent registered public accounting firm.
The table below sets forth the professional fees billed or expected to be billed to our company by KPMG for professional services rendered during fiscal 2019 and fiscal 2018.
|
Fiscal 2019
|
Fiscal 2018
|
|||||
|
Audit fees
|
$
|
4,701,000
|
|
$
|
3,696,000
|
|
|
Audit-related fees
|
220,070
|
|
187,855
|
|
||
|
Tax fees
|
786,724
|
|
679,175
|
|
||
|
All other fees
|
48,000
|
|
—
|
|
||
|
Total fees
|
$
|
5,755,794
|
|
$
|
4,563,030
|
|
|
•
|
Audit Fees are fees for professional services for the audit of the consolidated financial statements included in Form 10-K and the review of the consolidated financial statements included in Form 10-Qs or services that are provided in connection with statutory and regulatory filings or engagements, such as statutory audits required for certain U.S. and foreign subsidiaries. These fees also include services provided in connection with review of registration statements, comfort letters and consents.
|
|
•
|
Audit-Related Fees are fees for assurance and related services that are reasonably related to the performance of the audit or review of the consolidated financial statements.
|
|
•
|
Tax Fees are fees for tax compliance, tax advice and tax planning.
|
|
•
|
All Other Fees are fees, if any, for any services not included in the first three categories.
|
135
Item 15.
Exhibits, Financial Statements and Schedules
List of Documents Filed
1) Financial Statements
See Index to Consolidated Financial Statements on Page F-1 following this Part IV.
2) Financial Statement Schedules
Schedule I - Summary of Investments - Other than Investments in Related Parties
Schedule II - Condensed Financial Information of Parent Only
Schedule III - Supplementary Insurance Information
Schedule IV - Reinsurance
All other schedules have been omitted since they are either not applicable or the information is contained within the accompanying consolidated financial statements.
136
List of Exhibits
The following is a list of exhibits filed or incorporated by reference as a part of this Annual Report on Form 10-K.
|
Exhibit
No.
|
Description of Exhibits
|
|
|
2.1
|
||
|
2.2
|
||
|
2.3
|
||
|
2.4
|
||
|
2.5
|
||
|
2.6
|
||
|
2.7
|
||
|
2.8
|
||
|
2.9
|
||
|
3.1
|
||
|
3.2
|
||
|
3.3
|
||
|
4.1
|
||
|
4.2
|
||
|
4.3
|
||
|
4.4
|
||
137
|
4.5
|
||
|
4.6
|
||
|
4.7
|
||
|
4.8
|
||
|
10.1
|
||
|
10.2
|
||
|
10.3
|
||
|
10.4
|
||
|
10.5
|
||
|
10.6
|
||
|
10.7
|
||
|
10.8
|
||
|
10.9
|
||
|
10.10
|
||
|
10.11
|
||
|
10.12
|
||
|
10.13
|
||
138
|
10.14
|
||
|
10.15
|
||
|
10.16
|
||
|
10.17
|
||
|
10.18
|
||
|
10.19
|
||
|
10.20
|
||
|
10.21
|
||
|
10.22
|
||
|
10.23
|
||
|
10.24
|
||
|
10.25
|
||
|
10.26
|
||
|
10.27
|
||
|
10.28
|
||
|
10.29
|
||
139
|
10.30
|
||
|
10.31
|
||
|
10.32
|
||
|
10.33
|
||
|
10.36*
|
||
|
10.37*
|
||
|
10.38*
|
||
|
10.50*
|
||
|
21*
|
||
|
23*
|
||
|
24*
|
||
|
31.1 *
|
||
|
31.2 *
|
||
|
32.1 *
|
||
|
32.2 *
|
||
|
101 *
|
The following financial information from FGL Holdings' Quarterly Report on Form 10-Q for the period ended December 31, 2019 is formatted in Inline XBRL (Extensible Business Reporting Language): (i) the Condensed Consolidated Balance Sheets as of December 31, 2019 (unaudited) and December 31, 2018, (ii) the Condensed Consolidated Statements of Operations (unaudited), (iii) the Condensed Consolidated Statements of Comprehensive Income (Loss) (unaudited), (iv) the Condensed Consolidated Statements of Changes in Stockholders Equity (unaudited), (v) the Condensed Consolidated Statements of Cash Flows (unaudited), and (vi) Notes to the Condensed Consolidated Financial Statements.
|
|
|
104 *
|
The cover page from FGL Holdings' Quarterly Report on Form 10-Q for the period ended December 31, 2019 is formatted in Inline XBRL (Extensible Business Reporting Language).
|
|
|
*
|
Filed herewith
|
|
+
|
Indicates management contract or compensatory plan or agreement.
|
None.
140
SIGNATURES
Pursuant to the requirements of section 13 or 15(d) of the Securities Exchange Act of 1934, the Registrant has duly caused this report to be signed on its behalf by the undersigned, thereunto duly authorized.
|
FGL HOLDINGS (Registrant)
|
|||
|
Date:
|
March 2, 2020
|
By:
|
/s/ John Fleurant
|
|
Chief Financial Officer
|
|||
|
(on behalf of the Registrant and as Principal Financial Officer)
|
|||
POWERS OF ATTORNEY
KNOW ALL BY THESE PRESENT, that each person whose signature appears below constitutes and appoints Christopher O. Blunt and John Fleurant, and each of them, acting individually, as his true and lawful attorney-in-fact and agent, each with full power of substitution and resubstitution, for him and in his name, place and stead, in any and all capacities, to sign any and all amendments to this report, and to file the same, with all exhibits thereto, and other documents in connection therewith, with the Securities and Exchange Commission, granting unto said attorneys-in-fact and agents, full power and authority to do and perform each and every act and thing requisite or necessary to be done in and about the premises, as fully to all intents and purposes as he might or could do in person, hereby ratifying and confirming all that said attorneys-in-fact and agents, or any of them, or their substitute or substitutes, may lawfully do or cause to be done by virtue hereof.
141
Pursuant to the requirements of the Securities Exchange Act of 1934, this report has been signed below by the following persons on behalf of the registrant and in the capacities and on the dates indicated.
|
Signature
|
Title
|
Date
|
|
/s/ Christopher O. Blunt
|
||
|
Christopher O. Blunt
|
President, Chief Executive Officer and Director (Principal Executive Officer)
|
March 2, 2020
|
|
/s/ John Fleurant
|
||
|
John Fleurant
|
Chief Financial Officer
(Principal Financial Officer and Principal Accounting Officer)
|
March 2, 2020
|
|
/s/ Chinh E. Chu
|
||
|
Chinh E. Chu
|
Co-Chairman
|
March 2, 2020
|
|
/s/ William P. Foley, II
|
||
|
William P. Foley, II
|
Co-Chairman
|
March 2, 2020
|
|
/s/ Keith W. Abell
|
||
|
Keith W. Abell
|
Director
|
March 2, 2020
|
|
/s/ Patrick S. Baird
|
||
|
Patrick S. Baird
|
Director
|
March 2, 2020
|
|
/s/ Menes O. Chee
|
||
|
Menes O. Chee
|
Director
|
March 2, 2020
|
|
/s/ Richard N. Massey
|
||
|
Richard N. Massey
|
Director
|
March 2, 2020
|
|
/s/ James A. Ouella
|
||
|
James A. Ouella
|
Director
|
March 2, 2020
|
|
/s/ Timothy M. Walsh
|
||
|
Timothy M. Walsh
|
Director
|
March 2, 2020
|
142
FGL HOLDINGS
INDEX OF CONSOLIDATED FINANCIAL STATEMENTS
|
Page
|
|
F-1
Report of Independent Registered Public Accounting Firm
To the Shareholders and Board of Directors
FGL Holdings and subsidiaries:
Opinion on the Consolidated Financial Statements
We have audited the accompanying consolidated balance sheets of FGL Holdings and subsidiaries (the Company) as of December 31, 2019 and 2018, the related consolidated statements of operations, comprehensive income (loss), changes in shareholders’ equity, and cash flows for each of the years in the two year period ended December 31, 2019 and the period from December 1, 2017 to December 31, 2017 (Successor Company operations), the consolidated statements of operations, comprehensive income (loss), changes in shareholders’ equity, and cash flows of Fidelity & Guaranty Life and subsidiaries for the period from October 1, 2017 to November 30, 2017, and for the year ended September 30, 2017 (Predecessor Company operations) and the related notes and financial statement schedules I to IV (collectively, the consolidated financial statements). In our opinion, the consolidated financial statements present fairly, in all material respects, the financial position of the Company as of December 31, 2019 and 2018, and the results of its operations and its cash flows for each of the years in the two year period ended December 31, 2019 and the period from December 1, 2017 to December 31, 2017, in conformity with U.S. generally accepted accounting principles. Further, in our opinion, the consolidated financial statements present fairly, in all material respects, the results of the Predecessor Company operations and its cash flows for the period from October 1, 2017 to November 30, 2017, and for the year ended September 30, 2017, in conformity with U.S. generally accepted accounting principles.
We also have audited, in accordance with the standards of the Public Company Accounting Oversight Board (United States) (PCAOB), the Company’s internal control over financial reporting as of December 31, 2019, based on criteria established in
Internal Control - Integrated Framework
(2013) issued by the Committee of Sponsoring Organizations of the Treadway Commission, and our report dated March 2, 2020 expressed an unqualified opinion on the effectiveness of the Company’s internal control over financial reporting.
Basis for Opinion
These consolidated financial statements are the responsibility of the Company’s management. Our responsibility is to express an opinion on these consolidated financial statements based on our audits. We are a public accounting firm registered with the PCAOB and are required to be independent with respect to the Company in accordance with the U.S. federal securities laws and the applicable rules and regulations of the Securities and Exchange Commission and the PCAOB.
We conducted our audits in accordance with the standards of the PCAOB. Those standards require that we plan and perform the audit to obtain reasonable assurance about whether the consolidated financial statements are free of material misstatement, whether due to error or fraud. Our audits included performing procedures to assess the risks of material misstatement of the consolidated financial statements, whether due to error or fraud, and performing procedures that respond to those risks. Such procedures included examining, on a test basis, evidence regarding the amounts and disclosures in the consolidated financial statements. Our audits also included evaluating the accounting principles used and significant estimates made by management, as well as evaluating the overall presentation of the consolidated financial statements. We believe that our audits provide a reasonable basis for our opinion.
Critical Audit Matters
The critical audit matters communicated below are matters arising from the current period audit of the consolidated financial statements that were communicated or required to be communicated to the audit committee and that: (1) relate to accounts or disclosures that are material to the consolidated financial statements and (2) involved our especially challenging, subjective, or complex judgments. The communication of critical audit matters does not alter in any way our opinion on the consolidated financial statements, taken as a whole, and we are not, by communicating the critical audit matters below, providing separate opinions on the critical audit matters or on the accounts or disclosures to which they relate.
F-2
Assessment of the fair value measurement of fixed maturity securities, available for sale, classified as level 3 in the fair value hierarchy
As discussed in Note 2, 4 and 6 to the consolidated financial statements, the Company’s investments in fixed maturity securities classified as level 3 within the fair value hierarchy have been designated as available for sale and are reported at fair value which was $2.8 billion as of December 31, 2019. To estimate the fair value of fixed maturity securities classified as level 3 in the fair value hierarchy the Company employs a market approach which utilizes prices and other relevant information generated by market transactions involving identical or comparable securities. Sources of inputs to the market approach include third-party pricing services and independent broker quotations.
We identified the assessment of the fair value measurement of fixed maturity securities, available for sale, classified as level 3 in the fair value hierarchy as a critical audit matter. Due to the significant measurement uncertainty, this assessment involved subjective auditor judgment and required specialized skills and knowledge in identifying and applying comparable market information that is relevant and reliable.
The primary procedures we performed to address this critical audit matter included the following. We tested certain internal controls over the Company’s evaluation of quotations obtained from third-party pricing services and independent brokers, including the assessment of the valuation methodologies, and a comparison to portfolio and market trends.
We involved financial instrument valuation professionals with specialized skills and knowledge, who assisted in:
|
•
|
testing the Company’s methodology to produce fair value estimates compliant with U.S. generally accepted accounting principles, and
|
|
•
|
developing an independent estimate of fair value for securities selected for testing using key assumptions and market data sources, and comparing those fair value estimates to the Company’s value.
|
Assessment of certain assumptions used in the valuation of insurance intangible assets
As discussed in Notes 2 and 7 to the consolidated financial statements, the Company amortizes insurance intangible assets reflecting the value of insurance and reinsurance contracts acquired, deferred acquisition costs, and deferred sales inducements over the lives of the respective policies in relation to the expected emergence of estimated gross profits (EGP’s). EGP’s are derived from the estimates of future investment income, surrender charges and other product fees, less the cost of amounts credited to policyholders, maintenance expenses, mortality, net of reinsurance ceded, and expense margins. The determination of EGP’s requires the Company to use certain assumptions, including (1) surrender rates, (2) the earned rate, which represents the long term assumptions of the Company’s expected earnings on investments, and
(3) budgeted option costs, which represents the expected cost to purchase call options in future periods to fund the equity indexed linked feature related to the Company’s fixed indexed annuity contracts. The value of insurance and reinsurance contracts acquired, deferred acquisition costs, and deferred sales inducements were $0.6 billion, $0.6 billion and $0.2 billion, respectively as of December 31, 2019.
We identified the assessment of certain assumptions used in the valuation of insurance intangible assets as a critical audit matter. Due to the significant measurement uncertainty, this assessment involved subjective auditor judgment and required specialized skills and knowledge to evaluate the assumptions listed above used to determine the EGP estimates.
The primary procedures we performed to address this critical audit matter included the following. We tested certain internal controls over the Company’s development, review, and approval of the EGP assumptions listed above. We involved actuarial professionals with specialized skills and industry knowledge, who assisted in:
|
•
|
evaluating the Company’s methodology used to produce EGP estimates compliant with U.S. generally accepted accounting principles,
|
|
•
|
comparing estimated gross profits for the current year to actual gross profits for the current year,
|
F-3
|
•
|
comparing the Company’s actual historical experience to expected experience for surrender rates,
|
|
•
|
comparing the earned rates and budgeted option costs to historic and current experience, and
|
|
•
|
performing an analysis to evaluate the application of the earned rate and budgeted option cost assumptions used in the projection of EGP’s.
|
We also involved financial instrument valuation professionals with specialized skills and knowledge, who assisted in:
|
•
|
comparing the earned rate assumptions to actual Company projections and observable market information, and
|
|
•
|
re-performing calculations of projected cash flows for a selection of securities used in determining the earned rate assumptions.
|
Assessment of certain assumptions used in the fair value measurement of the fixed indexed annuity embedded derivative liability
As discussed in Notes 2, 5, and 6 to the consolidated financial statements, the Company permits the holder of a fixed indexed annuity contract to elect an equity index linked feature, where amounts credited to the contract are linked to the performance of the equity indices selected by the contract holder. This feature is accounted for as an embedded derivative liability and reported at fair value which was $3.2 billion as of December 31, 2019. The embedded derivative liability was classified as level 3 in the fair value hierarchy, and the fair value measurement uses inputs deemed unobservable, including the mortality multiplier, surrender rates, non-performance spread and budgeted option cost.
We identified the assessment of certain assumptions used in the fair value measurement of the fixed index annuity embedded derivative liability as a critical audit matter. Due to the significant measurement uncertainty, this assessment involved subjective auditor judgment and required specialized skills and knowledge to evaluate the assumptions related to the (1) surrender rates, and (2) budgeted option costs, which represent the expected cost to purchase call options in future periods to fund the equity indexed linked feature.
The primary procedures we performed to address the critical audit matter included the following. We tested certain internal controls over the Company’s development, review, and approval of the assumptions. We involved actuarial professionals with specialized skills and industry knowledge, who assisted in:
|
•
|
evaluating the Company’s methodology to produce a fair value estimate compliant with U.S. generally accepted accounting principles,
|
|
•
|
comparing the Company’s actual historical experience to expected experience for surrender rates,
|
|
•
|
comparing the budgeted option cost to the historic and current experience, and
|
|
•
|
testing the application of the Company’s methodology and assumptions by developing independent estimates for a selection of policies and comparing the results to the Company’s estimates.
|
/s/ KPMG LLP
We have served as the Company’s auditor since 1998.
Des Moines, Iowa
March 2, 2020
F-4
Report of Independent Registered Public Accounting Firm
To the Shareholders and Board of Directors
FGL Holdings and subsidiaries:
Opinion on Internal Control Over Financial Reporting
We have audited FGL Holdings and subsidiaries (the Company) internal control over financial reporting as of December 31, 2019, based on criteria established in
Internal Control - Integrated Framework
(2013) issued by the Committee of Sponsoring Organizations of the Treadway Commission. In our opinion, the Company maintained, in all material respects, effective internal control over financial reporting as of December 31, 2019, based on criteria established in
Internal Control - Integrated Framework
(2013) issued by the Committee of Sponsoring Organizations of the Treadway Commission.
We also have audited, in accordance with the standards of the Public Company Accounting Oversight Board (United States) (PCAOB), the consolidated balance sheets of the Company as of December 31, 2019 and 2018, the related consolidated statements of operations, comprehensive income (loss), changes in shareholders’ equity, and cash flows for each of the years in the two-year period ended December 31, 2019 and the period from December 1, 2017 to December 31, 2017 (Successor Company operations), the consolidated statements of operations, comprehensive income (loss), changes in shareholders’ equity, and cash flows of Fidelity & Guaranty Life and subsidiaries for the period from October 1, 2017 to November 30, 2017, and for the year ended September 30, 2017 (Predecessor Company operations) and the related notes and financial statement schedules I to IV (collectively, the consolidated financial statements), and our report dated March 2, 2020 expressed an unqualified opinion on those consolidated financial statements.
Basis for Opinion
The Company’s management is responsible for maintaining effective internal control over financial reporting and for its assessment of the effectiveness of internal control over financial reporting, included in the accompanying Management’s Report on Internal Control Over Financial Reporting. Our responsibility is to express an opinion on the Company’s internal control over financial reporting based on our audit. We are a public accounting firm registered with the PCAOB and are required to be independent with respect to the Company in accordance with the U.S. federal securities laws and the applicable rules and regulations of the Securities and Exchange Commission and the PCAOB.
We conducted our audit in accordance with the standards of the PCAOB. Those standards require that we plan and perform the audit to obtain reasonable assurance about whether effective internal control over financial reporting was maintained in all material respects. Our audit of internal control over financial reporting included obtaining an understanding of internal control over financial reporting, assessing the risk that a material weakness exists, and testing and evaluating the design and operating effectiveness of internal control based on the assessed risk. Our audit also included performing such other procedures as we considered necessary in the circumstances. We believe that our audit provides a reasonable basis for our opinion.
Definition and Limitations of Internal Control Over Financial Reporting
A company’s internal control over financial reporting is a process designed to provide reasonable assurance regarding the reliability of financial reporting and the preparation of financial statements for external purposes in accordance with generally accepted accounting principles. A company’s internal control over financial reporting includes those policies and procedures that (1) pertain to the maintenance of records that, in reasonable detail, accurately and fairly reflect the transactions and dispositions of the assets of the company; (2) provide reasonable assurance that transactions are recorded as necessary to permit preparation of financial statements in accordance with generally accepted accounting principles, and that receipts and expenditures of the company are being made
F-5
only in accordance with authorizations of management and directors of the company; and (3) provide reasonable assurance regarding prevention or timely detection of unauthorized acquisition, use, or disposition of the company’s assets that could have a material effect on the financial statements.
Because of its inherent limitations, internal control over financial reporting may not prevent or detect misstatements. Also, projections of any evaluation of effectiveness to future periods are subject to the risk that controls may become inadequate because of changes in conditions, or that the degree of compliance with the policies or procedures may deteriorate.
/s/ KPMG LLP
Des Moines, Iowa
March 2, 2020
F-6
FGL HOLDINGS
(In millions, except share data)
|
December 31,
2019 |
December 31,
2018 |
||||||
|
ASSETS
|
|
||||||
|
Investments:
|
|
||||||
|
Fixed maturity securities, available-for-sale, at fair value (amortized cost: December 31, 2019 - $22,914; December 31, 2018 - $22,219)
|
$
|
|
|
$
|
|
|
|
|
Equity securities, at fair value (cost: December 31, 2019 - $1,069; December 31, 2018 - $1,526)
|
|
|
|
|
|||
|
Derivative investments
|
|
|
|
|
|||
|
Mortgage loans
|
|
|
|
|
|||
|
Other invested assets
|
|
|
|
|
|||
|
Total investments
|
|
|
|
|
|||
|
Cash and cash equivalents
|
|
|
|
|
|||
|
Accrued investment income
|
|
|
|
|
|||
|
Funds withheld for reinsurance receivables, at fair value
|
|
|
|
|
|||
|
Reinsurance recoverable
|
|
|
|
|
|||
|
Intangibles, net
|
|
|
|
|
|||
|
Deferred tax assets, net
|
|
|
|
|
|||
|
Goodwill
|
|
|
|
|
|||
|
Other assets
|
|
|
|
|
|||
|
Total assets
|
$
|
|
|
$
|
|
|
|
|
|
|||||||
|
LIABILITIES AND SHAREHOLDERS' EQUITY
|
|
||||||
|
|
|||||||
|
Contractholder funds
|
$
|
|
|
$
|
|
|
|
|
Future policy benefits, including $1,953 and $725 at fair value at December 31, 2019 and December 31, 2018, respectively
|
|
|
|
|
|||
|
Funds withheld for reinsurance liabilities
|
|
|
|
|
|||
|
Liability for policy and contract claims
|
|
|
|
|
|||
|
Debt
|
|
|
|
|
|||
|
Other liabilities
|
|
|
|
|
|||
|
Total liabilities
|
|
|
|
|
|||
|
|
|||||||
|
Commitments and contingencies ("Note 12")
|
|||||||
|
|
|||||||
|
Shareholders' equity:
|
|
||||||
|
Preferred stock ($.0001 par value, 100,000,000 shares authorized, 429,789 and 399,033 shares issued and outstanding at December 31, 2019 and December 31, 2018, respectively)
|
|
|
|
|
|||
|
Common stock ($.0001 par value, 800,000,000 shares authorized, 221,807,598 and 221,660,974 issued and outstanding at December 31, 2019 and December 31, 2018, respectively
|
|
|
|
|
|||
|
Additional paid-in capital
|
|
|
|
|
|||
|
Retained earnings (Accumulated deficit)
|
|
|
(
|
)
|
|||
|
Accumulated other comprehensive income (loss)
|
|
|
(
|
)
|
|||
|
Treasury stock, at cost (8,652,400 shares at December 31, 2019; 600,000 shares at December 31, 2018)
|
(
|
)
|
(
|
)
|
|||
|
Total shareholders' equity
|
|
|
|
|
|||
|
Total liabilities and shareholders' equity
|
$
|
|
|
$
|
|
|
|
See accompanying notes to consolidated financial statements.
F-7
FGL HOLDINGS
(In millions, except share data)
|
|
||||||||||||||||||||||||
|
Year ended
|
Year ended
|
|||||||||||||||||||||||
|
December 31,
2019 |
December 31,
2018 |
Period from December 1 to December 31, 2017
|
Period from October 1 to November 30, 2017
|
Period from October 1 to December 31, 2016 (Unaudited)
|
September 30,
2017 |
|||||||||||||||||||
|
Predecessor
|
Predecessor
|
Predecessor
|
||||||||||||||||||||||
|
Revenues:
|
||||||||||||||||||||||||
|
Premiums
|
$
|
|
|
$
|
|
|
$
|
|
|
$
|
|
|
$
|
|
|
$
|
|
|
||||||
|
Net investment income
|
|
|
|
|
|
|
|
|
|
|
|
|
||||||||||||
|
Net investment gains (losses)
|
|
|
(
|
)
|
|
|
|
|
|
|
|
|
||||||||||||
|
Insurance and investment product fees and other
|
|
|
|
|
|
|
|
|
|
|
|
|
||||||||||||
|
Total revenues
|
|
|
|
|
|
|
|
|
|
|
|
|
||||||||||||
|
Benefits and expenses:
|
||||||||||||||||||||||||
|
Benefits and other changes in policy reserves
|
|
|
|
|
|
|
|
|
|
|
|
|
||||||||||||
|
Acquisition and operating expenses, net of deferrals
|
|
|
|
|
|
|
|
|
|
|
|
|
||||||||||||
|
Amortization of intangibles
|
|
|
|
|
|
|
|
|
|
|
|
|
||||||||||||
|
Total benefits and expenses
|
|
|
|
|
|
|
|
|
|
|
|
|
||||||||||||
|
Operating income
|
|
|
|
|
|
|
|
|
|
|
|
|
||||||||||||
|
Interest expense
|
(
|
)
|
(
|
)
|
(
|
)
|
(
|
)
|
(
|
)
|
(
|
)
|
||||||||||||
|
Income (loss) before income taxes
|
|
|
|
|
|
|
|
|
|
|
|
|
||||||||||||
|
Income tax (expense) benefit
|
(
|
)
|
(
|
)
|
(
|
)
|
(
|
)
|
(
|
)
|
(
|
)
|
||||||||||||
|
Net income (loss)
|
$
|
|
|
$
|
|
|
$
|
(
|
)
|
$
|
|
|
$
|
|
|
$
|
|
|
||||||
|
Less Preferred stock dividend
|
|
|
|
|
|
|
|
|
|
|
|
|
||||||||||||
|
Net income (loss) available to common shareholders
|
$
|
|
|
$
|
(
|
)
|
$
|
(
|
)
|
$
|
|
|
$
|
|
|
$
|
|
|
||||||
|
Net income (loss) per common share
|
||||||||||||||||||||||||
|
Basic
|
$
|
|
|
$
|
(
|
)
|
$
|
(
|
)
|
$
|
|
|
$
|
|
|
$
|
|
|
||||||
|
Diluted
|
$
|
|
|
$
|
(
|
)
|
$
|
(
|
)
|
$
|
|
|
$
|
|
|
$
|
|
|
||||||
|
Weighted average common shares used in computing net income (loss) per common share:
|
||||||||||||||||||||||||
|
Basic
|
|
|
|
|
|
|
|
|
|
|
|
|
||||||||||||
|
Diluted
|
|
|
|
|
|
|
|
|
|
|
|
|
||||||||||||
|
Cash dividend per common share
|
$
|
|
|
$
|
|
|
$
|
|
|
$
|
|
|
$
|
|
|
$
|
|
|
||||||
|
Supplemental disclosures
|
||||||||||||||||||||||||
|
Other-than-temporary impairments
|
$
|
(
|
)
|
$
|
(
|
)
|
$
|
|
|
$
|
|
|
$
|
(
|
)
|
$
|
(
|
)
|
||||||
|
Gains (losses) on derivatives and embedded derivatives
|
|
|
(
|
)
|
|
|
|
|
|
|
|
|
||||||||||||
|
Other investment gains (losses)
|
|
|
(
|
)
|
|
|
|
|
|
|
|
|
||||||||||||
|
Total net investment gains (losses)
|
$
|
|
|
$
|
(
|
)
|
$
|
|
|
$
|
|
|
$
|
|
|
$
|
|
|
||||||
See accompanying notes to consolidated financial statements.
F-8
FGL HOLDINGS
CONSOLIDATED STATEMENTS OF COMPREHENSIVE INCOME (LOSS)
(In millions)
|
Year ended
|
Year ended
|
|||||||||||||||||||||||
|
December 31,
2019 |
December 31,
2018 |
Period from December 1 to December 31, 2017
|
Period from October 1 to November 30, 2017
|
Period from October 1 to December 31, 2016 (unaudited)
|
September 30,
2017 |
|||||||||||||||||||
|
Predecessor
|
Predecessor
|
Predecessor
|
||||||||||||||||||||||
|
Net income (loss)
|
$
|
|
|
$
|
|
|
$
|
(
|
)
|
$
|
|
|
$
|
|
|
$
|
|
|
||||||
|
Other comprehensive income (loss):
|
||||||||||||||||||||||||
|
Net change in unrealized gains/losses on investments (net of intangibles and deferred tax asset)
|
|
|
(
|
)
|
|
|
|
|
(
|
)
|
|
|
||||||||||||
|
Change in reinsurance liabilities held at fair value resulting from a change in the instrument-specific credit risk
|
(
|
)
|
|
|
|
|
—
|
|
—
|
|
—
|
|
||||||||||||
|
Net changes to derive comprehensive income (loss) for the period
|
|
|
(
|
)
|
|
|
|
|
(
|
)
|
|
|
||||||||||||
|
Comprehensive income (loss), net of tax
|
$
|
|
|
$
|
(
|
)
|
$
|
(
|
)
|
$
|
|
|
$
|
(
|
)
|
$
|
|
|
||||||
See accompanying notes to consolidated financial statements.
F-9
FGL HOLDINGS
CONSOLIDATED STATEMENTS OF CHANGES IN SHAREHOLDERS' EQUITY
(In millions)
|
Preferred Stock
|
Common Stock
|
Additional Paid-in Capital
|
Retained Earnings (Accumulated Deficit)
|
Accumulated Other Comprehensive Income (Loss)
|
Treasury Stock
|
Total Shareholders' Equity
|
|||||||||||||||||||||
|
Balance, September 30, 2016
|
$
|
|
|
$
|
|
|
$
|
|
|
$
|
|
|
$
|
|
|
$
|
(
|
)
|
$
|
|
|
||||||
|
Treasury shares purchased
|
—
|
|
—
|
|
—
|
|
—
|
|
—
|
|
(
|
)
|
(
|
)
|
|||||||||||||
|
Common stock dividends
|
—
|
|
—
|
|
—
|
|
(
|
)
|
—
|
|
—
|
|
(
|
)
|
|||||||||||||
|
Net income
|
—
|
|
—
|
|
—
|
|
|
|
—
|
|
—
|
|
|
|
|||||||||||||
|
Unrealized investment gains, net
|
—
|
|
—
|
|
—
|
|
—
|
|
|
|
—
|
|
|
|
|||||||||||||
|
Stock-based compensation
|
—
|
|
—
|
|
|
|
—
|
|
—
|
|
—
|
|
|
|
|||||||||||||
|
Balance, September 30, 2017
|
$
|
|
|
$
|
|
|
$
|
|
|
$
|
|
|
$
|
|
|
$
|
(
|
)
|
$
|
|
|
||||||
|
Balance, October 1, 2016 (unaudited)
|
$
|
|
|
$
|
|
|
$
|
|
|
$
|
|
|
$
|
|
|
$
|
(
|
)
|
$
|
|
|
||||||
|
Treasury shares purchased
|
—
|
|
—
|
|
—
|
|
—
|
|
—
|
|
(
|
)
|
(
|
)
|
|||||||||||||
|
Common stock dividends
|
—
|
|
—
|
|
—
|
|
(
|
)
|
—
|
|
—
|
|
(
|
)
|
|||||||||||||
|
Net income
|
—
|
|
—
|
|
—
|
|
|
|
—
|
|
—
|
|
|
|
|||||||||||||
|
Unrealized investment (losses), net
|
—
|
|
—
|
|
—
|
|
—
|
|
(
|
)
|
—
|
|
(
|
)
|
|||||||||||||
|
Stock-based compensation
|
—
|
|
—
|
|
|
|
—
|
|
—
|
|
—
|
|
|
|
|||||||||||||
|
Balance, December 31, 2016 (unaudited)
|
$
|
|
|
$
|
|
|
$
|
|
|
$
|
|
|
$
|
|
|
$
|
(
|
)
|
$
|
|
|
||||||
|
Balance, October 1, 2017
|
$
|
|
|
$
|
|
|
$
|
|
|
$
|
|
|
$
|
|
|
$
|
(
|
)
|
$
|
|
|
||||||
|
Common stock dividends
|
—
|
|
—
|
|
—
|
|
(
|
)
|
—
|
|
—
|
|
(
|
)
|
|||||||||||||
|
Net income
|
—
|
|
—
|
|
—
|
|
|
|
—
|
|
—
|
|
|
|
|||||||||||||
|
Unrealized investment gains, net
|
—
|
|
—
|
|
—
|
|
—
|
|
|
|
—
|
|
|
|
|||||||||||||
|
Stock-based compensation
|
—
|
|
—
|
|
|
|
—
|
|
—
|
|
—
|
|
|
|
|||||||||||||
|
Balance, November 30, 2017
|
$
|
|
|
$
|
|
|
$
|
|
|
$
|
|
|
$
|
|
|
$
|
(
|
)
|
$
|
|
|
||||||
|
Balance, December 1, 2017
|
$
|
|
|
$
|
|
|
$
|
|
|
$
|
(
|
)
|
$
|
|
|
$
|
|
|
$
|
|
|
||||||
|
Preferred stock dividends (paid in-kind)
|
—
|
|
—
|
|
—
|
|
(
|
)
|
—
|
|
—
|
|
(
|
)
|
|||||||||||||
|
Net income
|
—
|
|
—
|
|
—
|
|
(
|
)
|
—
|
|
—
|
|
(
|
)
|
|||||||||||||
|
Unrealized investment gains, net
|
—
|
|
—
|
|
—
|
|
—
|
|
|
|
—
|
|
|
|
|||||||||||||
|
Balance, December 31, 2017
|
$
|
|
|
$
|
|
|
$
|
|
|
$
|
(
|
)
|
$
|
|
|
$
|
|
|
$
|
|
|
||||||
|
Treasury shares purchased
|
—
|
|
—
|
|
—
|
|
—
|
|
—
|
|
(
|
)
|
(
|
)
|
|||||||||||||
|
Preferred stock dividends (paid in kind)
|
—
|
|
—
|
|
|
|
(
|
)
|
—
|
|
—
|
|
(
|
)
|
|||||||||||||
|
Net income
|
—
|
|
—
|
|
—
|
|
|
|
—
|
|
—
|
|
|
|
|||||||||||||
|
Unrealized investment gains (losses), net
|
—
|
|
—
|
|
—
|
|
—
|
|
(
|
)
|
—
|
|
(
|
)
|
|||||||||||||
|
Change in reinsurance liabilities held at fair value resulting from a change in the instrument-specific credit risk
|
—
|
|
—
|
|
—
|
|
—
|
|
|
|
—
|
|
|
|
|||||||||||||
|
Stock-based compensation
|
—
|
|
—
|
|
|
|
—
|
|
—
|
|
—
|
|
|
|
|||||||||||||
|
Cash paid upon warrant tender and capitalized warrant tender costs
|
—
|
|
—
|
|
(
|
)
|
—
|
|
—
|
|
—
|
|
(
|
)
|
|||||||||||||
|
Cumulative effect of changes in accounting principles and other
|
—
|
|
—
|
|
—
|
|
(
|
)
|
|
|
—
|
|
|
|
|||||||||||||
|
Balance, December 31, 2018
|
$
|
|
|
$
|
|
|
$
|
|
|
$
|
(
|
)
|
$
|
(
|
)
|
$
|
(
|
)
|
$
|
|
|
||||||
|
Treasury shares purchased
|
—
|
|
—
|
|
—
|
|
—
|
|
—
|
|
(
|
)
|
(
|
)
|
|||||||||||||
|
Dividends
|
|||||||||||||||||||||||||||
|
Preferred stock (paid in kind)
|
—
|
|
—
|
|
|
|
(
|
)
|
—
|
|
—
|
|
(
|
)
|
|||||||||||||
|
Common stock ($0.04/share)
|
—
|
|
—
|
|
—
|
|
(
|
)
|
—
|
|
—
|
|
(
|
)
|
|||||||||||||
|
Net income
|
—
|
|
—
|
|
—
|
|
|
|
—
|
|
—
|
|
|
|
|||||||||||||
|
Unrealized investment gains (losses), net
|
—
|
|
—
|
|
—
|
|
—
|
|
|
|
—
|
|
|
|
|||||||||||||
|
Change in reinsurance liabilities held at fair value resulting from a change in the instrument-specific credit risk
|
—
|
|
—
|
|
—
|
|
—
|
|
(
|
)
|
—
|
|
(
|
)
|
|||||||||||||
|
Stock-based compensation
|
—
|
|
—
|
|
|
|
—
|
|
—
|
|
—
|
|
|
|
|||||||||||||
|
Balance, December 31, 2019
|
$
|
|
|
$
|
|
|
$
|
|
|
$
|
|
|
$
|
|
|
$
|
(
|
)
|
$
|
|
|
||||||
See accompanying notes to consolidated financial statements.
F-10
FGL HOLDINGS
(In millions)
|
Year ended
|
Year ended
|
|||||||||||||||||||||||
|
December 31, 2019
|
December 31, 2018
|
Period from December 1 to December 31, 2017
|
Period from October 1 to November 30, 2017
|
Period from October 1 to December 31, 2016 (Unaudited)
|
September 30,
2017 |
|||||||||||||||||||
|
Predecessor
|
Predecessor
|
Predecessor
|
||||||||||||||||||||||
|
Cash flows from operating activities:
|
||||||||||||||||||||||||
|
Net income (loss)
|
$
|
|
|
$
|
|
|
$
|
(
|
)
|
$
|
|
|
$
|
|
|
$
|
|
|
||||||
|
Adjustments to reconcile net income (loss) to net cash provided by operating activities:
|
||||||||||||||||||||||||
|
Stock based compensation
|
|
|
|
|
(
|
)
|
|
|
|
|
|
|
||||||||||||
|
Amortization
|
|
|
|
|
|
|
(
|
)
|
(
|
)
|
(
|
)
|
||||||||||||
|
Deferred income taxes
|
|
|
(
|
)
|
|
|
(
|
)
|
|
|
(
|
)
|
||||||||||||
|
Interest credited/index credits to contractholder account balances
|
|
|
|
|
|
|
|
|
(
|
)
|
|
|
||||||||||||
|
Net recognized losses (gains) on investments and derivatives
|
(
|
)
|
|
|
(
|
)
|
(
|
)
|
(
|
)
|
(
|
)
|
||||||||||||
|
Charges assessed to contractholders for mortality and administration
|
(
|
)
|
(
|
)
|
(
|
)
|
(
|
)
|
(
|
)
|
(
|
)
|
||||||||||||
|
Intangibles, net
|
(
|
)
|
(
|
)
|
(
|
)
|
(
|
)
|
|
|
(
|
)
|
||||||||||||
|
Changes in operating assets and liabilities:
|
||||||||||||||||||||||||
|
Reinsurance recoverable
|
|
|
|
|
|
|
|
|
(
|
)
|
(
|
)
|
||||||||||||
|
Future policy benefits reflected in net income (loss)
|
|
|
(
|
)
|
|
|
(
|
)
|
(
|
)
|
(
|
)
|
||||||||||||
|
Funds withheld for reinsurers
|
(
|
)
|
|
|
(
|
)
|
(
|
)
|
(
|
)
|
(
|
)
|
||||||||||||
|
Collateral (returned) posted
|
|
|
(
|
)
|
|
|
|
|
|
|
|
|
||||||||||||
|
Other assets and other liabilities
|
(
|
)
|
|
|
(
|
)
|
(
|
)
|
(
|
)
|
(
|
)
|
||||||||||||
|
Net cash provided by (used in) operating activities
|
|
|
|
|
|
|
|
|
|
|
|
|
||||||||||||
|
Cash flows from investing activities:
|
||||||||||||||||||||||||
|
Proceeds from available-for-sale investments sold, matured or repaid
|
|
|
|
|
|
|
|
|
|
|
|
|
||||||||||||
|
Proceeds from derivatives instruments and other invested assets
|
|
|
|
|
|
|
|
|
|
|
|
|
||||||||||||
|
Proceeds from mortgage loans
|
|
|
|
|
|
|
|
|
|
|
|
|
||||||||||||
|
Costs of available-for-sale investments
|
(
|
)
|
(
|
)
|
(
|
)
|
(
|
)
|
(
|
)
|
(
|
)
|
||||||||||||
|
Costs of derivatives instruments and other invested assets
|
(
|
)
|
(
|
)
|
(
|
)
|
(
|
)
|
(
|
)
|
(
|
)
|
||||||||||||
|
Costs of mortgage loans
|
(
|
)
|
(
|
)
|
|
|
|
|
|
|
|
|
||||||||||||
|
Capital expenditures
|
(
|
)
|
(
|
)
|
(
|
)
|
(
|
)
|
(
|
)
|
(
|
)
|
||||||||||||
|
Contingent purchase price payment
|
|
|
(
|
)
|
|
|
|
|
|
|
|
|
||||||||||||
|
Net cash provided by (used in) investing activities
|
(
|
)
|
(
|
)
|
(
|
)
|
(
|
)
|
(
|
)
|
(
|
)
|
||||||||||||
|
Cash flows from financing activities:
|
||||||||||||||||||||||||
|
Treasury stock
|
(
|
)
|
(
|
)
|
|
|
|
|
(
|
)
|
(
|
)
|
||||||||||||
|
Debt issuance costs
|
|
|
(
|
)
|
|
|
|
|
|
|
|
|
||||||||||||
|
Proceeds from issuance of new debt
|
|
|
|
|
|
|
|
|
|
|
|
|
||||||||||||
|
Retirement and paydown on debt and revolving credit facility
|
(
|
)
|
(
|
)
|
(
|
)
|
|
|
|
|
|
|
||||||||||||
|
Draw on revolving credit facility
|
|
|
|
|
|
|
|
|
|
|
|
|
||||||||||||
|
Common stock dividends paid
|
(
|
)
|
|
|
|
|
(
|
)
|
(
|
)
|
(
|
)
|
||||||||||||
|
Cash paid upon warrant tender and capitalized warrant tender costs
|
|
|
(
|
)
|
|
|
|
|
|
|
|
|
||||||||||||
|
Contractholder account deposits
|
|
|
|
|
|
|
|
|
|
|
|
|
||||||||||||
|
Contractholder account withdrawals
|
(
|
)
|
(
|
)
|
(
|
)
|
(
|
)
|
(
|
)
|
(
|
)
|
||||||||||||
|
Net cash provided by (used in) financing activities
|
|
|
|
|
|
|
|
|
|
|
|
|
||||||||||||
|
Change in cash & cash equivalents
|
|
|
(
|
)
|
|
|
|
|
(
|
)
|
|
|
||||||||||||
|
Cash & cash equivalents, beginning of period
|
|
|
|
|
|
|
|
|
|
|
|
|
||||||||||||
|
Cash & cash equivalents, end of period
|
$
|
|
|
$
|
|
|
$
|
|
|
$
|
|
|
$
|
|
|
$
|
|
|
||||||
|
Supplemental disclosures:
|
||||||||||||||||||||||||
|
Interest paid
|
$
|
|
|
$
|
|
|
$
|
|
|
$
|
|
|
$
|
|
|
$
|
|
|
||||||
|
Income taxes (refunded) paid
|
$
|
(
|
)
|
$
|
|
|
$
|
(
|
)
|
$
|
|
|
$
|
|
|
$
|
|
|
||||||
|
Deferred sales inducements
|
$
|
|
|
$
|
|
|
$
|
|
|
$
|
|
|
$
|
|
|
$
|
|
|
||||||
See accompanying notes to consolidated financial statements.
F-11
FGL HOLDINGS
NOTES TO CONSOLIDATED FINANCIAL STATEMENTS
(1)
Basis of Presentation and Nature of Business
FGL Holdings (the "Company"), formerly known as CF Corporation ("CF Corp"), a Cayman Islands exempted company, was originally incorporated in the Cayman Islands on February 26, 2016 as a Special Purpose Acquisition Company ("SPAC"). The Company’s primary business is the sale of individual life insurance products and annuities through independent agents, managing general agents, and specialty brokerage firms and in selected institutional markets. The Company’s principal products are deferred annuities (including fixed indexed annuity (“FIA”) contracts and fixed rate annuity contracts), immediate annuities and life insurance products. The Company markets products through its wholly-owned insurance subsidiaries, Fidelity & Guaranty Life Insurance Company (“FGL Insurance”) and Fidelity & Guaranty Life Insurance Company of New York (“FGL NY Insurance”), which together are licensed in all fifty states and the District of Columbia.
F&G Reinsurance Ltd (“F&G Re”), an exempted company incorporated in Bermuda with limited liability, provides a platform for non-affiliated reinsurance business. Front Street Re Cayman Ltd (“FSRC”), an exempted company incorporated in the Cayman Islands with limited liability, has a license to carry on business as an Unrestricted Class “B” Insurer that permits FSRC to conduct offshore direct and reinsurance business. F&G Re and FSRC (together herein referred to as the “F&G Reinsurance Companies”), are indirect wholly owned subsidiaries of the Company and parties to reinsurance transactions.
Prior to November 30, 2017, CF Corp. was a shell company with
no
operations. On November 30, 2017, CF Corp. consummated the acquisition of Fidelity & Guaranty Life ("FGL"), a Delaware corporation, and its subsidiaries, pursuant to the Agreement and Plan of Merger, dated as of May 24, 2017 (the “FGL Merger Agreement”). The transactions contemplated by the FGL Merger Agreement are referred to herein as the “Business Combination.” In addition to the Business Combination, on November 30, 2017, CF Corp bought all of the issued and outstanding shares of FSRC and F&G Re (formerly known as Front Street Re Ltd).
As a result of the Business Combination, for accounting purposes, FGL Holdings is the acquirer and FGL is the acquired party and accounting predecessor. Our financial statement presentation includes the financial statements of FGL and its subsidiaries as “Predecessor” for the periods prior to the completion of the Business Combination, and FGL Holdings, including the consolidation of FGL and its subsidiaries and the F&G Reinsurance Companies, for periods from and after the Closing Date. FGL Holdings is the surviving company organized and existing under the laws of the United States of America, any State of the United States, the District of Columbia or any territory thereof (and in the case of the Company, Bermuda or the Cayman Islands). Prior to the acquisition, FGL Holdings reported under a fiscal year end of December 31, and the Predecessor companies reported under a fiscal year end of September 30. Subsequent to the acquisition, FGL Holdings reports under a fiscal year end of December 31.
On February 7, 2020, FGL Holdings and Fidelity National Financial, Inc. (NYSE: FNF) (“FNF”) entered into a merger agreement pursuant to which FNF will acquire FGL Holdings for
$
12.50
per share, representing an equity value of approximately
$
2.7
billion
. The transaction was approved by a Special Committee of FGL Holdings Directors, a Special Committee of FNF Directors and the FNF Board of Directors. FNF currently owns
7.9
%
of FGL Holdings outstanding ordinary shares and all of FGL Holdings Series B Preferred shares. In connection with and immediately prior to the closing of the proposed acquisition, FNF will acquire all outstanding FGL Holdings Series A preferred shares, with a face value of approximately
$
321
million
as of December 31, 2019, and assume the
$
550
million
of senior notes due 2025.
Under the terms of the merger agreement, holders of FGL Holdings' ordinary shares (other than FNF and its subsidiaries) may elect to receive either (i)
$
12.50
per share in cash or (ii)
0.2558
of a share of FNF common stock for each ordinary share of F&G they own. This is subject to an election and proration mechanism such that the aggregate consideration paid to such holders of FGL Holdings' ordinary shares will consist of approximately
60
%
cash and
40
%
FNF common stock.
The transaction is expected to close in the second or third quarter of 2020, subject to the satisfaction of customary closing conditions, including the receipt of regulatory clearances and approval by FGL Holdings shareholders.
F-12
The accompanying financial statements have been prepared in accordance with U.S. generally accepted accounting principles (“GAAP”). Dollar amounts in the accompanying sections are presented in millions, unless otherwise noted.
We have
one
reporting segment, which is consistent with and reflects the manner by which our chief operating decision maker views and manages the business. We currently distribute and service primarily fixed rate annuities, including FIAs.
Premiums and annuity deposits (net of reinsurance), which are not included as revenues (except for traditional premiums) in the accompanying Consolidated Statements of Operations, collected by product type were as follows:
|
|
Year ended
|
Year ended
|
||||||||||||||||||||||
|
December 31, 2019
|
December 31, 2018
|
Period from December 1 to December 31, 2017
|
Period from October 1 to November 30, 2017
|
Period from October 1 to December 31, 2016 (Unaudited)
|
September 30, 2017
|
|||||||||||||||||||
|
Product Type
|
Predecessor
|
Predecessor
|
Predecessor
|
|||||||||||||||||||||
|
Fixed indexed annuities
|
$
|
|
|
$
|
|
|
$
|
|
|
$
|
|
|
$
|
|
|
$
|
|
|
||||||
|
Fixed rate annuities
|
|
|
|
|
|
|
|
|
|
|
|
|
||||||||||||
|
Single premium immediate annuities
|
|
|
|
|
|
|
|
|
|
|
|
|
||||||||||||
|
Life insurance (a)
|
|
|
|
|
|
|
|
|
|
|
|
|
||||||||||||
|
Total
|
$
|
|
|
$
|
|
|
$
|
|
|
$
|
|
|
$
|
|
|
$
|
|
|
||||||
|
(a)
|
Life insurance includes Universal Life (“UL”) and traditional life insurance products for FGL Insurance and FGL NY Insurance.
|
F-13
(2)
Significant Accounting Policies and Practices
Principles of Consolidation
The accompanying audited consolidated financial statements include the accounts of the Company and all other entities in which the Company has a controlling financial interest. All intercompany accounts and transactions have been eliminated in consolidation.
We are involved in certain entities that are considered variable interest entities ("VIEs") as defined under U.S. GAAP. Our involvement with VIEs is primarily to invest in assets that allow us to gain exposure to a broadly diversified portfolio of asset classes. A VIE is an entity that does not have sufficient equity to finance its own activities without additional financial support or where investors lack certain characteristics of a controlling financial interest. We assess our relationships to determine if we have the ability to direct the activities, or otherwise exert control, to evaluate if we are the primary beneficiary of the VIE. If we determine we are the primary beneficiary of a VIE, we consolidate the assets and liabilities of the VIE in our audited
consolidated financial statements
. See "Note 4. Investments" for additional information on the Company’s investments in VIEs.
Revenue Recognition
Insurance Premiums
The Company’s insurance premiums for traditional life insurance products are recognized as revenue when due from the contractholder. The Company’s traditional life insurance products include those products with fixed and guaranteed premiums and benefits and consist primarily of term life insurance and certain annuities with life contingencies, net of premiums ceded under reinsurance.
Premium collections for fixed indexed and fixed rate annuities, indexed universal life (“IUL”) policies and immediate annuities without life contingency are reported as an increase to deposit liabilities (i.e., contractholder funds) instead of as revenues. Similarly, cash payments to policyholders are reported as decreases in the liability for contractholder funds and not as expenses. Sources of revenues for products accounted for as deposit liabilities are net investment income, surrender and other charges deducted from contractholder funds, and net realized gains (losses) on investments. Surrender charges are earned when a policyholder withdraws funds from the contract early or cancels the contract. Other income related to riders is earned when elected by the policyholder.
See a description of FSRC’s and F&G Re's accounting policy for its assumed reinsurance contracts as described under "Reinsurance".
Net Investment Income
Dividends and interest income are recorded in “Net investment income” and recognized when earned. Income or losses upon call or prepayment of available-for-sale fixed maturity securities are recognized in "Net investment income". Amortization of premiums and accretion of discounts on investments in fixed maturity securities are reflected in “Net investment income” based on the earliest call date of the investments in a manner that produces a constant effective yield.
FSRC and F&G Re's dividends and interest income are recorded in "Net investment income" in the consolidated financial statements and are recognized on an accrual basis. Amortization of premiums and accretion of discounts on investment in debt securities are reflected in "Net investment income" over the contractual terms of the investments in a manner that produces a constant effective yield.
For mortgage-backed and asset-backed securities, included in the fixed maturity available-for-sale (“AFS”) securities portfolios, the Company recognizes income using a constant effective yield based on anticipated cash flows and the estimated economic life of the securities. When actual prepayments differ significantly from originally anticipated prepayments, the effective yield is generally recalculated prospectively to reflect actual payments to date plus anticipated future payments. Any adjustments resulting from changes in effective yield are reflected in “Net investment income’’.
"Net investment income" is presented net of earned investment management fees.
Net Investment Gains (Losses)
Net investment gains (losses) include realized gains and losses from the sale of investments, unrealized gains and losses on equity securities at fair value, write-downs for other-than-temporary impairments (“OTTI”) of AFS investments, and realized and unrealized gains and losses on derivatives and embedded derivatives. FSRC and F&G Re's net investment gains (losses) include realized losses and gains from the sale of investments, changes in
F-14
the fair value of funds withheld receivables and realized and unrealized gains and losses on derivative investments.
Realized gains and losses on the sale of investments are determined using the specific identification method on the trade date.
Insurance and Investment Product Fees and Other
Benefits and Other Changes in Policy Reserves
Benefit expenses for deferred annuity, FIA and IUL policies include index credits and interest credited to contractholder account balances and benefit claims in excess of contract account balances, net of reinsurance recoveries, are charged to expense in the period that they are earned by the policyholder based on their selected strategy. Interest crediting rates associated with funds invested in the general account of our insurance subsidiaries during
2017
through
2019
ranged from
0.5
%
to
6.0
%
for deferred annuities and FIA's, combined, and
3.0
%
to
4.8
%
for IUL's. Other changes in policy reserves include the change in the fair value of the FIA embedded derivative and the change in the reserve for secondary guarantee benefit payments.
Other changes in policy reserves also include the change in reserves for life insurance products. For traditional life and immediate annuities, policy benefit claims are charged to expense in the period that the claims are incurred, net of reinsurance recoveries.
See a description of FSRC’s and F&G Re's accounting policy for its assumed reinsurance contracts as described under "Future Policy Benefits" in Note 2.
Stock-Based Compensation
We expense the fair value of stock awards included in our incentive compensation plans. The Company issues stock options with three different types of vesting conditions. As of the date that there is a mutual understanding between the Company and the grantee of key terms of the awards, the fair value of stock options that vest based on service or non-market based performance conditions are determined using a Black-Scholes options valuation methodology. The Company uses a Monte Carlo simulation to determine the fair value of stock awards that vest based upon market conditions. The fair value of the awards is expensed over the performance or service period, which generally corresponds to the vesting period, and is recognized as an increase to “Additional paid-in capital” in “Shareholders’ equity”. We classify certain stock awards settled in cash as liabilities. For these awards, the fair value is classified as a liability on our Consolidated Balance Sheets, and the liability is marked-to-market through net income (loss) at the end of each reporting period. Stock-based compensation expense is reflected in “Acquisition and operating expenses, net of deferrals” on our Consolidated Statements of Operations.
Interest Expense
Earnings Per Share
Basic earnings per share (“EPS”) is computed by dividing earnings available to common shareholders by the average common shares outstanding. Diluted EPS is computed assuming the conversion or exercise of nonvested stock, stock options, warrants and performance share units outstanding during the year. The effect of a potential conversion of outstanding preferred shares to common shares is not considered in the diluted EPS calculation as the preferred shareholders do not yet have the right to convert. Stock options and warrants are excluded from the computation of diluted EPS, based on the application of the treasury stock method, if they are anti-dilutive.
Cash Equivalents
The Company considers money market funds and highly liquid debt instruments purchased with original maturities of three months or less to be cash equivalents. As of
December 31, 2019
and
December 31, 2018
, the Company held cash equivalents of
$
38
and
$
84
respectively.
F-15
Investments
Investment Securities
The Company’s investments in fixed maturity securities have been designated as AFS and are carried at fair value with unrealized gains and losses included in “Accumulated other comprehensive income” (“AOCI”), net of associated intangible asset and unearned revenue ("UREV") “shadow adjustments” (discussed in "Note 7. Intangibles") and deferred income taxes. The Company's investments in equity securities are carried at fair value with unrealized gains and losses included in “Realized gains (losses)”. Prior to the adoption of ASU 2016-01, effective January 1, 2018, unrealized gains and losses on equity securities were included in AOCI.
Available-for-Sale Securities' Other-Than-Temporary Impairments
The Company regularly reviews AFS securities for declines in fair value that it determines to be other-than-temporary. Prior to the adoption of ASU 2016-01, for an equity security, if the Company did not have the ability and intent to hold the security for a sufficient and reasonable period of time to allow for a recovery in value, it concluded that an OTTI had occurred and the amortized cost of the security was written down to the current fair value, with a corresponding charge to “Net investment gains (losses)” in the accompanying Consolidated Statements of Operations. Following the adoption of ASU 2016-01, equity securities are no longer reviewed for OTTI. When assessing its ability and intent to hold a security to recovery, the Company considers, among other things, the severity and duration of the decline in fair value of the security as well as the cause of the decline, business prospects and the overall financial condition of the issuer. When evaluating redeemable preferred stocks for OTTI the Company applies the accounting policy described above for fixed maturity securities (including an anticipated recovery period), provided there has been no evidence of a deterioration in credit of the issuer.
For its fixed maturity AFS securities, the Company generally considers the following in determining whether its unrealized losses are other-than-temporary:
|
•
|
The estimated period until recovery;
|
|
•
|
The extent and the duration of the decline;
|
|
•
|
The reasons for the decline in value (credit event, currency or interest-rate related, including general credit spread widening);
|
|
•
|
The financial condition of and near-term prospects of the issuer (including issuer’s current credit rating and the probability of full recovery of principal based upon the issuer’s financial strength);
|
|
•
|
Current delinquencies and nonperforming assets of underlying collateral;
|
|
•
|
Expected future default rates;
|
|
•
|
Collateral value by vintage, geographic region, industry concentration or property type;
|
|
•
|
Subordination levels or other credit enhancements as of the balance sheet date as compared to origination; and
|
|
•
|
Contractual and regulatory cash obligations and the issuer's plans to meet such obligations.
|
The Company recognizes OTTI on fixed maturity securities in an unrealized loss position when one of the following circumstances exists:
|
•
|
The Company does not expect full recovery of its amortized cost based on the present value of cash flows expected to be collected;
|
|
•
|
The Company intends to sell a security; or
|
|
•
|
It is more likely than not that the Company will be required to sell a security prior to recovery.
|
If the Company intends to sell a fixed maturity AFS security or it is more likely than not the Company will be required to sell the security before recovery of its amortized cost basis and the fair value of the security is below amortized cost, the Company will conclude that an OTTI has occurred and the amortized cost is written down to current fair value, with a corresponding charge to “Net investment gains (losses)” in the accompanying Consolidated Statements of Operations. If the Company does not intend to sell a fixed maturity security or it is more likely than not the Company will not be required to sell a fixed maturity security before recovery of its amortized cost basis and the present value of the cash flows expected to be collected is less than the amortized cost of the security (referred to as the credit loss), an OTTI has occurred and the amortized cost is written down to the estimated recovery value with a corresponding charge to “Net investment gains (losses)” in the accompanying Consolidated Statements of Operations, as this amount is deemed the credit loss portion of the OTTI. The remainder of the
F-16
decline to fair value is recorded in AOCI as an unrealized loss on AFS securities, as this amount is considered a non-credit impairment.
When assessing the Company’s intent to sell a fixed maturity security or if it is more likely than not the Company will be required to sell a fixed maturity security before recovery of its cost basis, the Company evaluates facts and circumstances at the individual security level based on facts and circumstances relevant to that security. Management also consider decisions to reposition the Company’s security portfolio, sale of securities to meet cash flow needs and sales of securities to capitalize on favorable pricing and tax planning strategies.
When evaluating mortgage-backed securities and asset-backed securities, the Company considers a number of pool-specific factors as well as market level factors when determining whether or not the impairment on the security is temporary or other-than-temporary. The most important factor is the performance of the underlying collateral in the security and the trends of that performance. The Company uses this information about the collateral to forecast the timing and rate of mortgage loan defaults, including making projections for loans that are already delinquent and for those loans that are currently performing but may become delinquent in the future. Other factors used in this analysis include type of underlying collateral (e.g., prime, Alternative A-paper (“Alt-A”), or subprime), geographic distribution of underlying loans and timing of liquidations by state. Once default rates and timing assumptions are determined, the Company then makes assumptions regarding the severity of a default if it were to occur. Factors that impact the severity assumption include expectations for future home price appreciation or depreciation, loan size, first lien versus second lien, existence of loan level private mortgage insurance, type of occupancy and geographic distribution of loans. Once default and severity assumptions are determined for the security in question, cash flows for the underlying collateral are projected, including expected defaults and prepayments. These cash flows on the collateral are then translated to cash flows on the Company’s tranche based on the cash flow waterfall of the entire capital security structure. If this analysis indicates the entire principal on a particular security will not be returned, the security is reviewed for OTTI by comparing the present value of expected future cash flows to amortized cost. To the extent that the security has already been impaired or was purchased at a discount, such that the amortized cost of the security is less than or equal to the present value of cash flows expected to be collected, no impairment is required. The Company also considers the ability of monoline insurers to meet their contractual guarantees on wrapped mortgage-backed securities. Otherwise, if the amortized cost of the security is greater than the present value of the cash flows expected to be collected, then an OTTI is recognized.
Mortgage Loans on Real Estate
The Company’s investment in mortgage loans consists of commercial and residential mortgage loans on real estate, which are reported at amortized cost, less impairment write-downs and allowance for losses. If a mortgage loan is determined to be impaired (i.e., when it is probable that the Company will be unable to collect all amounts due according to the contractual terms of the loan agreement or the loan is modified in a troubled debt restructuring), the carrying value of the mortgage loan is reduced to the lower of either the present value of expected cash flows from the loan, discounted at the loan’s original purchase yield, or fair value of the collateral. For those mortgages that are determined to require foreclosure, the carrying value is reduced to the fair value of the underlying collateral, net of estimated costs to obtain and sell at the point of foreclosure. The carrying value of the impaired loans is reduced by establishing an allowance with the offset recorded in "Net investment gains (losses)" in the Consolidated Statements of Operations.
Commercial mortgage loans are continuously monitored by reviewing appraisals, operating statements, rent revenues, annual inspection reports, loan specific credit quality, property characteristics, market trends and other factors.
Commercial mortgage loans are rated for the purpose of quantifying the level of risk. Loans are placed on a watch list when the debt service coverage ("DSC") ratio falls below and the loan-to-value ("LTV") ratios exceeds certain thresholds. Loans on the watchlist are closely monitored for collateral deficiency or other credit events that may lead to a potential loss of principal or interest. The Company defines delinquent mortgage loans as 30 days past due, consistent with industry practice.
Residential mortgage loans have a primary credit quality indicator of either a performing or nonperforming loan. The Company defines nonperforming residential mortgage loans as those that are 90 or more days past due
F-17
and/or in nonaccrual status which is assessed monthly. Generally, nonperforming residential mortgage loans have a higher risk of experiencing a credit loss.
Interest on loans is recognized on an accrual basis at the applicable interest rate on the principal amount outstanding. Loan origination fees and direct costs, as well as premiums and discounts, are amortized as level yield adjustments over the respective loan terms. Unamortized net fees or costs are recognized upon early repayment of the loans. Loan commitment fees are deferred and amortized on an effective yield basis over the term of the loan.
We establish mortgage loan valuation allowances both on a loan specific basis for those loans considered impaired where a property specific or market specific risk has been identified that could likely result in a future loss, as well as for pools of loans with similar risk characteristics where a property specific or market specific risk has not been identified, but for which we expect to incur a loss. Accordingly, a valuation allowance is provided to absorb these estimated probable credit losses. As of
December 31, 2019
and
2018
, the Company did not identify any specific loans that were impaired.
The determination of the amount of valuation allowances is based upon our periodic evaluation and assessment of inherent risks associated with our loan portfolios. Such evaluations and assessments are based upon several factors, including our experience for loan losses, defaults and loss severity, and loss expectations for loans with similar risk characteristics. We evaluate and monitor LTV ratios and DSC ratios of our loans as indicators of potential risk of default in establishing our valuation allowance.
Derivative Financial Instruments
The Company hedges certain portions of its exposure to product related equity market risk by entering into derivative transactions (primarily call options). All such derivative instruments are recognized as either assets or liabilities in the accompanying
Consolidated Balance Sheets
at fair value. The changes in fair value are reported within “Net investment gains (losses)” in the accompanying
Consolidated Statements of Operations
.
The Company purchases financial instruments and issues products that may contain embedded derivative instruments. If it is determined that the embedded derivative possesses economic characteristics that are not clearly and closely related to the economic characteristics of the host contract, and a separate instrument with the same terms would qualify as a derivative instrument, the embedded derivative is bifurcated from the host contract for measurement purposes. The embedded derivative is carried at fair value, which is determined through a combination of market observable inputs such as market value of option and interest swap rates and unobservable inputs such as the mortality multiplier, surrender and withdrawal rates and non-performance spread. The changes in fair value are reported within “Benefits and other changes in policy reserves” in the accompanying
Consolidated Statements of Operations
. See a description of the fair value methodology used in "Note 6. Fair Value of Financial Instruments".
Reinsurance Related Embedded Derivatives
As discussed in “Note 13. Reinsurance”, FGL Insurance entered into a reinsurance agreement with Kubera effective December 31, 2018, to cede certain MYGA and deferred annuity statutory reserve on a coinsurance funds withheld basis, net of applicable existing reinsurance. Funds withheld arrangements allow the Company to retain legal ownership of assets backing reinsurance arrangements until they are earned by the reinsurer while passing credit risk associated with the assets in the funds withheld account to the reinsurer. These arrangements create embedded derivatives considered total return swaps with contractual returns that are attributable to the assets and liabilities associated with the reinsurance arrangement. The fair value of the total return swap is based on the change in fair value of the underlying assets held in the funds withheld portfolio. Investment results for the assets that support the coinsurance with funds withheld reinsurance arrangement, including gains and losses from sales, are passed directly to the reinsurer pursuant to contractual terms of the reinsurance arrangement. These total return swaps are not clearly and closely related to the underlying reinsurance contract and thus require bifurcation. The reinsurance related embedded derivative is reported in “Other assets” if in a net gain position, or “Other liabilities”, if in a net loss position on the
Consolidated Balance Sheets
and the related gains or losses are reported in “Net investment gains (losses)” on the
Consolidated Statements of Operations
.
FGL Insurance has a funds withheld coinsurance arrangement with FSRC, which creates an embedded derivative similar to the embedded derivative described above related to the Kubera reinsurance agreement. Due to the acquisition of FSRC, the reinsurance related embedded derivative is eliminated in consolidation in the periods after December 1, 2017.
F-18
Preferred Equity Remarketing Reimbursement Embedded Derivative Liability
On November 30, 2017 the Company issued
275,000
Series A cumulative preferred shares and
100,000
Series B cumulative preferred shares (together the “Preferred Shares”). The Preferred Shares do not have a maturity date and are non-callable for the first
five years
.
From and after November 30, 2022, the original holders of the Preferred Shares may request and thus require, the Company (subject to customary blackout provisions) to remarket the Preferred Shares on their existing terms. If the remarketing is successful and the original holders elect to sell their preferred shares at the remarketed price and proceeds from such sale are less than the outstanding balance of the applicable shares (including dividends paid in kind and accumulated but unpaid dividends), the Company will be required to reimburse the sellers, up to a maximum of
10
%
of the par value of the originally issued preferred shares (including dividends paid in kind and accumulated but unpaid dividends) with such amount payable either in cash, ordinary shares, or any combination thereof, at the Company's option (the “Reimbursement Feature”). The Reimbursement Feature represents an embedded derivative that is not clearly and closely related to the preferred stock host and must be bifurcated. The Reimbursement Feature liability is reported at fair value within “Other liabilities” in the accompanying Consolidated Balance Sheets using a Black Derman Toy model incorporating among other things the paid in kind dividend coupon rate and the Company’s call option.
Funds withheld Receivable
FSRC and F&G Re have entered into various reinsurance agreements on a funds withheld basis, meaning that the funds are withheld by the ceding company from the coinsurance premium owed to FSRC and F&G Re as collateral for FSRC's and F&G Re's payment obligations. Accordingly, the collateral assets remain under the ultimate ownership of the ceding company. FSRC and F&G Re manage the assets supporting the reserves in accordance with the internal investments policies of the ceding companies and applicable law.
Limited Partnership Investments
Our investments in limited partnerships are included in other invested assets on our Consolidated Balance Sheets. We account for our investments in limited partnerships using the equity method and use net asset value ("NAV") as a practical expedient to determine the carrying value. Income from the limited partnership is included within "Net investment income" in the accompanying Consolidated Statements of Operations. Recognition of income is delayed due to the availability of the related financial statements, which are obtained from the partnership’s general partner generally on a one to three-month delay. Management meets quarterly with the general partner to determine whether any credit or other market events have occurred since prior quarter financial statements to ensure any material events are properly included in current quarter valuation and investment income. In addition, the impact of audit adjustments related to completion of calendar-year financial statement audits of the limited partnership are typically received during the second quarter of each calendar year. Accordingly, our investment income from the limited partnership investment for any calendar-year period may not include the complete impact of the change in the underlying net assets for the partnership for that calendar-year period.
Intangible Assets
The Company’s intangible assets include an intangible asset reflecting the value of insurance and reinsurance contracts acquired (hereafter referred to as “the value of business acquired” or (“VOBA”), deferred acquisition costs (“DAC”), deferred sales inducements (“DSI”), and trademarks and state licenses.
VOBA is an intangible asset that reflects the amount recorded as insurance contract liabilities less the estimated fair value of in-force contracts in a life insurance company acquisition. It represents the portion of the purchase price allocated to the value of the rights to receive future cash flows from the business in force at the acquisition date. DAC consists principally of commissions that are related directly to the successful sale of new or recoverable insurance contracts, which may be deferred to the extent recoverable. Indirect or unsuccessful acquisition costs, maintenance, product development and overhead expenses are charged to expense as incurred. DSI represents up front bonus credits and vesting bonuses to policyholder account values which may be deferred to the extent recoverable.
The methodology for determining the amortization of DAC, DSI and VOBA varies by product type. For all insurance contracts accounted for under long-duration contract deposit accounting, amortization is based on assumptions consistent with those used in the development of the underlying contract liabilities adjusted for emerging experience and expected trends. Amortization is reported within “Amortization of intangibles” in the accompanying Consolidated Statements of Operations.
For all of the insurance intangibles (DAC, DSI and VOBA), the balances are generally amortized over the lives of the policies in relation to the expected emergence of estimated gross profits (“EGPs”) from investment
F-19
income, surrender charges and other product fees, less policy benefits, maintenance expenses, mortality net of reinsurance ceded, and expense margins. Recognized gains (losses) on investments and changes in fair value of the funds withheld coinsurance embedded derivative are included in actual gross profits in the period realized as described further below.
Changes in assumptions, including
th
e Company’s earned rate, (i.e., long term assumptions of the Company’s expected earnings on related investments), budgeted option costs (i.e., the expected cost to purchase call options in future periods to fund the equity indexed linked feature) and surrender rates can have a significant impact on VOBA, DAC and DSI balances and amortization rates. Due to the relative size and sensitivity to minor changes in underlying assumptions of those intangible balances, the Company performs quarterly and annual analysis of the VOBA, DAC and DSI balances for recoverability to ensure that the unamortized portion does not exceed the expected recoverable amounts. At each evaluation date, actual historical gross profits are reflected with the impact on the intangibles reported as “unlocking” as a component of amortization expense, and estimated future gross profits and related assumptions are evaluated for continued reasonableness. Any adjustment in estimated future gross profits requires that the amortization rate be revised (“unlocking”) retroactively to the date of the policy or contract issuance. The cumulative unlocking adjustment is recognized as a component of current period amortization.
The carrying amounts of VOBA, DAC and DSI are adjusted for the effects of unrealized gains and losses on fixed maturity securities classified as AFS. For investment-type products, the VOBA, DAC and DSI assets are adjusted for the impact of unrealized gains (losses) on investments as if these gains (losses) had been realized, with corresponding credits or charges included in AOCI.
Amortization expense of VOBA, DAC and DSI reflects an assumption for an expected level of credit-related investment losses. When actual credit-related investment losses are realized, the Company performs a retrospective unlocking of amortization for those intangibles as actual margins vary from expected margins. This unlocking is reflected in the accompanying Consolidated Statements of Operations.
Reinsurance
Income Taxes
The Company’s life insurance subsidiaries file a consolidated life insurance income tax return. Income taxes are accounted for under the asset and liability method. Deferred tax assets and liabilities are recognized for the future tax consequences attributable to differences between the financial statement carrying amounts of existing assets and liabilities and their respective tax basis and operating loss and tax credit carryforwards. Deferred tax assets and liabilities are measured using enacted tax rates expected to apply to taxable income in the years in which those temporary differences are expected to be recovered or settled. The Company assesses the recoverability of its deferred tax assets in each reporting period under the guidance outlined within Accounting Standards Codification (“ASC”) Topic 740, “Income Taxes”. The guidance requires an assessment of both positive and negative evidence in determining the realizability of deferred tax assets. A valuation allowance is required to reduce the Company’s deferred tax asset to an amount that is more likely than not to be realized. In determining the net deferred tax asset and valuation allowance, management is required to make judgments and estimates related to projections of future profitability. These judgments include the following: the timing and extent of the utilization of net operating loss carry-forwards, the reversals of temporary differences, and tax planning strategies. The effect on deferred tax assets and liabilities of a change in tax rates is recognized in income in the period that includes the enactment date. The Company has the ability and intent to recover in a tax-free manner assets (or liabilities) with book/tax basis differences for which no deferred taxes have been provided, in accordance with ASC 740.
The Company applies the accounting guidance for uncertain tax positions which prescribes a minimum recognition threshold a tax position is required to meet before being recognized in the financial statements. The
F-20
guidance also provides information on de-recognition, measurement, classification, interest and penalties, accounting in interim periods, disclosure and transition. The Company recognizes the effect of income tax positions only if those positions are more likely than not of being sustained. Recognized income tax positions are measured at the largest amount that is greater than 50% likely of being realized. Changes in recognition or measurement are reflected in the period in which the change in judgment occurs. Accrued interest expense and penalties related to uncertain tax positions are recorded in “Income tax (expense) benefit” in the Company’s
Consolidated Statements of Operations
. The Company had
no
unrecognized tax benefits related to uncertain tax positions as of
December 31, 2019
.
For discussion on the impact of tax reform and the 338(h)(10) election, see “Note 11. Income Taxes”.
Contractholder Funds
The liabilities for contractholder funds for deferred annuities, IUL and UL policies consist of contract account balances that accrue to the benefit of the contractholders. The liabilities for FIA policies consist of the value of the host contract plus the fair value of the embedded derivative. The embedded derivative is carried at fair value in “Contractholder funds” in the accompanying Consolidated Balance Sheets with changes in fair value reported in "Benefits and other changes in policy reserves" in the accompanying
Consolidated Statements of Operations
. See a description of the fair value methodology used in "Note 6. Fair Value of Financial Instruments". Liabilities for immediate annuities with life contingencies are recorded at the present value of future benefits.
Liabilities for the secondary guarantees on UL-type products or Investment-type contracts are calculated by multiplying the benefit ratio by the cumulative assessments recorded from contract inception through the balance sheet date less the cumulative secondary guarantee benefit payments plus interest. The benefit ratio is the ratio of the present value of future secondary guarantees to the present value of the assessments used to provide the secondary guarantees using the same assumptions as the Company uses for its intangible assets. If experience or assumption changes result in a new benefit ratio, the reserves are adjusted to reflect the changes in a manner similar to the unlocking of DAC, DSI and VOBA. The accounting for secondary guarantee benefits impact EGPs used to calculate amortization of DAC, DSI and VOBA.
Future Policy Benefits
The liabilities for future policy benefits and claim reserves for traditional life policies and life contingent pay-out annuity policies are computed using assumptions for investment yields, mortality and withdrawals based on generally accepted actuarial methods and assumptions at the time of contract issue. Investment yield assumption for traditional direct life reserves for all contracts is
5.7
%
. The investment yield assumptions for life contingent pay-out annuities range from
0.1
%
to
5.5
%
.
FSRC and F&G Re elected to apply the fair value option to account for its funds withheld receivables, non-funds withheld assets and insurance reserves related to its assumed third party reinsurance at the inception date of the reinsurance transactions. FSRC and F&G Re measure fair value of the funds withheld receivables based on the fair values of the securities in the underlying funds withheld portfolio held by the cedant. The non-funds withheld assets held by FSRC, backing the insurance reserves, are measured at fair value.
FSRC and F&G Re use a discounted cash flows approach to measure the fair value of the insurance reserves. The cash flows associated with future policy premiums and benefits are generated using best estimate assumptions (plus a risk margin, where applicable). Risk margins are typically applied to non-observable, non-hedgeable market inputs such as mortality, morbidity, lapse, discount rate for non-performance risk, discount rate for risk margin, surrenders, etc. Mortality relates to the occurrence of death and morbidity relates to health risks. Mortality and morbidity assumptions are based upon the experience of the cedant as well as past and emerging industry experience, when available. Mortality and morbidity assumptions may be different by sex, underwriting class and policy type. Assumptions are also made for future mortality and morbidity improvements.
Policies are terminated through surrenders and maturities, where surrenders represent the voluntary terminations of policies by policyholders and maturities are determined by policy contract terms. Surrender assumptions are based upon cedant experience adjusted for expected future conditions. FSRC and F&G Re use market value weighting in the development of the discount rate. FSRC and F&G Re discount the liability cash flows using the market yields on the underlying assets backing the liabilities less a risk margin to reflect uncertainty and an adjustment to reflect the credit risk of FSRC and F&G Re, respectively. The Company adopted ASU 2016-01 effective January 1, 2018, which requires FSRC and F&G Re to present separately in other comprehensive income the portion of the total change in the fair value of a liability resulting from a change in the instrument-specific
F-21
credit risk when the entity has elected to measure the liability at fair value in accordance with the fair value option for financial instruments. See "Note 13. Reinsurance" for further information.
Federal Home Loan Bank of Atlanta Agreements
In accordance with the agreements, the investments supporting the funding agreement liabilities are pledged as collateral to secure the FHLB funding agreement liabilities and are not available to settle the general obligations of the Company. The collateral investments had a fair value of
$
1,521
and
$
1,414
at
December 31, 2019
and
December 31, 2018
, respectively.
Commitments and Contingencies
Business Combinations
In accordance with ASC Topic 805, Business Combinations (“ASC 805”), the Company accounts for acquisitions by applying the acquisition method of accounting. The acquisition method of accounting requires, among other things, that the assets acquired and liabilities assumed in a business combination be measured at their fair values as of the closing date of the acquisition. The fair values assigned to the assets acquired and liabilities assumed are based on valuations using market participant assumptions and are preliminary pending the completion of the valuation analysis of selected assets and liabilities. During the measurement period (which is not to exceed one year from the acquisition date), the Company is required to retrospectively adjust the provisional assets or liabilities if new information is obtained about facts and circumstances that existed as of the acquisition date that, if known, would have resulted in the recognition of those assets or liabilities as of that date. As of December 31, 2018, the measurement period is closed with respect to the Business Combination.
Reclassifications and Retrospective Adjustments
The Company identified an immaterial error, as described below, during the period ended September 30, 2018. Management has reviewed the impact of this error on prior periods in accordance with SEC Staff Accounting Bulletin No. 99, “Materiality,” (SAB 99) and determined this was not material to the prior periods impacted.
Effective December 1, 2017, the Company measured the identifiable assets acquired and liabilities assumed from the Business Combination at acquisition-date fair value in accordance with ASC 805. This required significant model changes for the re-bifurcation of the host contract and embedded derivative components of the fixed income annuity ("FIA") liability. During the quarter ended September 30, 2018, the Company identified an immaterial error resulting from the model code used in the calculation of the FIA embedded derivative liability. In issuing the September 30, 2018 Form 10-Q, the Company recorded an immaterial correction to the Consolidated Balance Sheet as of December 31, 2017 by decreasing the contractholder funds liability by
$
17
as well as a resulting decrease to the intangibles and deferred tax assets of
$
3
and
$
3
, respectively. In addition, the Company recorded immaterial corrections to the Consolidated Statement of Operations for the one month ended December 31, 2017 by decreasing the benefits and other changes in policy reserves by
$
17
, as well as increasing the amortization of intangibles by
$
3
, and income tax expense by
$
3
.
F-22
Certain prior year amounts have been reclassified or combined to conform to the current year presentation. These reclassifications and combinations had no effect on previously reported results of operations.
Adoption of New Accounting Pronouncements
Revenue from Contracts with Customers
In May 2014, the Financial Accounting Standards Board (FASB) issued new guidance on revenue recognition (ASU 2014-09,
Revenue from Contracts with Customers (Topic 606)
), effective for fiscal years beginning after December 15, 2016 and interim periods within those years. In August 2015, the FASB issued ASU 2015-14,
Revenue from Contracts with Customers (Topic 606) - Deferral of the Effective Date
, which deferred the effective date of ASU 2014-09 by one year. The FASB also issued the following ASUs which clarify the guidance in ASU 2014-09:
•
ASU 2016-08 - Revenue from Contracts with Customers (Topic 606) - Principal versus Agent Considerations (Reporting Revenue Gross versus Net) issued in March 2016
•
ASU 2016-10 - Revenue from Contracts with Customers (Topic 606) - Identifying Performance Obligations and Licensing issued in April 2016
•
ASU 2016-11 - Revenue Recognition (Topic 605) and Derivatives and Hedging (Topic 815) - Rescission of SEC Guidance Because of Accounting Standards Updates 2014-09 and 2014-16 Pursuant to Staff Announcements at the March 3, 2016 EITF Meeting issued in May 2016
•
ASU 2016-12 - Revenue from Contracts with Customers (Topic 606) - Narrow-Scope Improvements and Practical Expedients issued in May 2016
The guidance in ASU 2014-09 and the related ASUs supersedes the revenue recognition requirements in Topic 605,
Revenue Recognition
, and most industry-specific guidance unless the contracts are within the scope of other standards (for example, financial instruments, insurance contracts or lease contracts). The core principle of the guidance is that an entity should recognize revenue to depict the transfer of promised goods or services to customers in an amount that reflects the consideration to which the entity expects to be entitled in exchange for those goods or services. The guidance establishes a five-step process to achieve this core principle.
The Company adopted these standards effective January 1, 2018. The adoption of these standards has had no impact on the Company's consolidated financial statements as the Company’s primary sources of revenue, insurance contracts and financial instruments, are excluded from the scope of these standards.
Statement of Cash Flows Classification of Certain Cash Receipts and Cash Payments
In August 2016, the FASB issued new guidance (ASU 2016-15,
Statement of Cash Flows (Topic 230), Classification of Certain Cash Receipts and Cash Payments)
, effective for fiscal years beginning after December 15, 2017 and interim periods within those fiscal years. Notable amendments in this update change the classification of certain cash receipts and cash payments in the Statement of Cash Flows in the following ways:
|
•
|
cash payments for debt prepayment or debt extinguishment costs should be classified as cash outflows for financing activities
|
|
•
|
the settlement of zero-coupon debt instruments or other debt instruments with coupon interest rates that are insignificant in relation to the effective interest rate of the borrowing should be classified as follows: the portion of the cash payment attributable to the accreted interest related to the debt discount as cash outflows for operating activities, and the portion of the cash payment attributable to the principal as cash outflows for financing activities
|
|
•
|
a reporting entity must make an accounting policy election to classify distributions received from equity method investees using either:
|
|
◦
|
the cumulative earnings approach, which considers distributions received as returns on the investment and are classified as cash inflows from operating activities (with an exception when cumulative distributions received less distributions received in prior periods that were classified as returns of investment exceeds cumulative equity in earnings, in which case the current period distribution up to this excess amount will be considered a return of investment and classified as cash inflows from investing activities); or
|
|
◦
|
the nature of the distribution approach, which classifies distributions received based on the nature of the activity or activities of the investee that generated the distribution (would be considered
|
F-23
either a return on investment and classified as cash inflows from operating activities or a return of investment and classified as cash inflows from investing activities)
|
•
|
in the absence of specific GAAP guidance, an entity should classify cash receipts and payments that have aspects of more than one class of cash flows by determining and appropriately classifying each separately identifiable source or use within the cash receipts and cash payments on the basis of the underlying cash flows. If cash receipts and payments have aspects of more than one class of cash flows and cannot be separated by source or use, the activity that is likely to be the predominant source or use of cash flows for the item will determine the classification.
|
The amendments in this ASU were adopted by the Company effective January 1, 2018 as required, using a retrospective transition method to each period presented (except where impracticable to apply retrospectively; those specific amendments will be applied prospectively as of the earliest date practicable). The Company has elected to use the nature of distribution approach to classify distributions received from equity method investees. The adoption of this standard had an immaterial impact on the Company's Consolidated Statements of Cash Flows.
Amendments to Recognition and Measurement of Financial Assets and Financial Liabilities
In March 2018, February 2018 and January 2016, the FASB issued amended guidance on the measurement of financial assets and financial liabilities (ASU 2018-04
, Investments-Debt Securities (Topic 320) and Regulated Operations (Topic 980) - Amendments to SEC Paragraphs Pursuant to SEC Staff Accounting Bulletin No. 117 and SEC Release No. 33-9273;
ASU 2018-03,
Technical Corrections and Improvements to Financial Instruments-Overall (Subtopic 825-10), Recognition and Measurement of Financial Assets and Financial Liabilities;
and ASU 2016-01,
Financial Instruments- Overall (Subtopic 825-10), Recognition and Measurement of Financial Assets and Financial Liabilities,
respectively), effective for fiscal years beginning after December 15, 2017, including interim periods within those fiscal years. Notable amendments in these updates:
|
•
|
require all equity securities (other than equity investments accounted for under the equity method of accounting or requiring the consolidation of the investee) to be measured at fair value with changes in fair value recognized through net income. Equity securities that do not have readily determinable fair values may be measured at cost minus impairment
|
|
•
|
require qualitative assessment for impairment of equity investments without readily determinable fair values at each reporting period and, if the qualitative assessment indicates that impairment exists, to measure the investment at fair value
|
|
•
|
eliminate the requirement to disclose the methods and significant assumptions used to estimate fair value (which is currently required to be disclosed, for financial instruments measured at amortized cost on the balance sheet)
|
|
•
|
require an entity to present separately in other comprehensive income the portion of the total change in the fair value of a liability resulting from a change in the instrument-specific credit risk when the entity has elected to measure the liability at fair value in accordance with the fair value option for financial instruments
|
The amendments in these ASUs were applied via a cumulative-effect adjustment to the balance sheet as of the beginning of the fiscal year of adoption, and the amendments related to equity securities without readily determinable fair values were applied prospectively to equity investments that exist as of the date of adoption. The Company adopted ASUs 2016-01, 2018-03, and 2018-04 effective January 1, 2018, with a cumulative-effect adjustment to decrease retained earnings and increase AOCI by
$
4
.
Premium Amortization on Purchased Callable Debt Securities
In March 2017, the FASB issued new guidance on the amortization of callable securities (ASU 2017-08,
Receivables-Nonrefundable Fees and Other Costs (Subtopic 310-20), Premium Amortization on Purchased Callable Debt Securities)
, effective for fiscal years beginning after December 15, 2018, including interim periods within those fiscal years. The ASU requires premiums paid on purchased debt securities with an explicit call option to be amortized to the earliest call date, as opposed to the maturity date. The updated guidance is applicable to instruments that are callable based on explicit, non-contingent call features that are callable at fixed prices on preset dates. The amendments in this update were to be applied using the modified retrospective method through a cumulative effect adjustment directly to retained earnings as of the beginning of the period of adoption. The Company adopted this new accounting guidance effective January 1, 2019, as required, and it had an immaterial impact on its consolidated financial statements.
F-24
Amendments to Lease Accounting
In February 2016, the FASB issued amended guidance (ASU 2016-02,
Leases (Topic 842)
), effective for fiscal years beginning after December 15, 2018, including interim periods within those fiscal years. Notable amendments in this update:
|
•
|
require entities to recognize the rights and obligations resulting from all leases or lease components of contracts, including operating leases, as lease assets and lease liabilities, with an exception allowed for leases with a term of 12 months or less
|
|
•
|
create a distinction between finance leases and operating leases, with classification criteria substantially similar to that for distinguishing between capital leases and operating leases under previous guidance
|
|
•
|
not retain the accounting model for leveraged leases under previous guidance for leases that commence after the effective date of ASU 2016-02
|
|
•
|
provide additional guidance on separating the lease components from the nonlease components of a contract
|
|
•
|
require qualitative disclosures along with specific quantitative disclosures to provide information regarding the amount, timing, and uncertainty of cash flows arising from leases
|
|
•
|
include modifications to align lessor accounting with the changes to lessee accounting, as well as changes to the requirements of recognizing a transaction as a sale and leaseback transaction, however, these changes will have no impact on the Company's current lease arrangements
|
The amendments were required to be applied at the beginning of the earliest period presented using a modified retrospective approach (including several optional practical expedients related to leases commenced before the effective date). The Company adopted this standard effective January 1, 2019, as required, and it had an immaterial impact on its consolidated financial statements.
Derivatives and Hedging
In August 2017, the FASB issued ASU 2017-12,
Derivatives and Hedging (Topic 815), Targeted Improvements to the Accounting for Hedging Activities,
effective for fiscal years beginning after December 15, 2018 including interim periods within those fiscal years. Under this update:
|
•
|
removes previous limitations on designation of hedged risk in certain cash flow and fair value hedging relationships
|
|
•
|
permits different measurements when accounting for hedged items in fair value hedges of interest rate risk
|
|
•
|
the entity must present the hedging instrument earnings and hedged item earnings in the same income statement line
|
|
•
|
in addition to exclusion of option premiums and forward points, also permits exclusion of the cross-currency basis spread portion of the change in fair value of a currency swap in assessment of hedge effectiveness
|
The Company adopted this standard effective January 1, 2019, as required, and it did not impact its consolidated financial statements.
Future Adoption of Accounting Pronouncements
New Credit Loss Standard
In June 2016, the FASB issued ASU 2016-13,
Financial Instruments - Credit Losses (Topic 326), Measurement of Credit Losses on Financial Instruments
, effective for fiscal years beginning after December 15, 2019 and interim periods within those fiscal years. Since its release, certain targeted improvements and transition relief amendments have been made to ASU 2016-13 and have been published in ASU 2018-19, ASU 2019-04, ASU 2019-05 and ASU 2019-11. Collectively, these ASUs will change the accounting for impairment of most financial assets and certain other instruments in the following ways:
|
•
|
financial assets (or a group of financial assets) measured at amortized cost will be required to be presented at the net amount expected to be collected, with an allowance for credit losses deducted from the amortized cost basis, resulting in a net carrying value that reflects the amount the entity expects to collect on the financial asset. The measurement of expected credit losses is based on relevant information about past
|
F-25
events, including historical experience, current conditions, and reasonable and supportable forecasts that affect the collectability of the reported amount.
|
•
|
credit losses relating to AFS fixed maturity securities generally will be recorded through an allowance for credit losses, rather than reductions in the amortized cost of the securities. The allowance methodology recognizes that value may be realized either through collection of contractual cash flows or through the sale of the security. Therefore, the amount of the allowance for credit losses for AFS fixed maturity securities will be limited to the amount by which fair value is below amortized cost because the classification as available for sale is premised on an investment strategy that recognizes that the investment could be sold at fair value, if cash collection would result in the realization of an amount less than fair value
|
|
•
|
the income statement will reflect the measurement of expected credit losses for newly recognized financial assets as well as the expected increases or decreases (including the reversal of previously recognized losses) of expected credit losses that have taken place during the period. The measurement of expected credit losses is based on relevant information about past events, including historical experience, current conditions, and reasonable and supportable forecasts that affect the collectability of the reported amount
|
|
•
|
disclosures will be required to include information around how the credit loss allowance was developed, further details on information currently disclosed about credit quality of financing receivables and net investments in leases, and a rollforward of the allowance for credit losses for AFS fixed maturity securities as well as an aging analysis for securities that are past due
|
Test for Goodwill Impairment
In January 2017, the FASB issued ASU 2017-04,
Intangibles-Goodwill and Other (Topic 350), Simplifying the Test for Goodwill Impairment
, effective for fiscal years beginning after December 15, 2019 including interim periods within those fiscal years. Under this update:
|
•
|
the subsequent measurement of goodwill is simplified by the elimination of step 2 from the goodwill impairment test, which required an entity to determine the implied fair value at the impairment testing date of its assets and liabilities (including unrecognized assets and liabilities) following the procedure that would be required in determining the fair value of assets acquired and liabilities assumed in a business combination
|
|
•
|
the entity should perform its goodwill impairment test by comparing the fair value of a reporting unit with its carrying amount, recognizing an impairment charge for the amount by which the carrying amount exceeds the reporting unit's fair value, not to exceed the total amount of goodwill allocated to that reporting unit
|
|
•
|
the entity is no longer required to perform a qualitative assessment for any reporting unit with a zero or negative carrying amount
|
The Company will adopt this standard on January 1, 2020, and does not expect this new accounting standard to have a significant impact on its consolidated financial statements.
Long-Duration Contracts
In August 2018, the FASB issued ASU 2018-12,
Financial Services-Insurance (Topic 944), Targeted Improvements to the Accounting for Long-Duration Contracts
, effective for fiscal years beginning after December 15, 2021 including interim periods within those fiscal years. Under this update:
|
•
|
assumptions used to measure cash flows for traditional and limited-payment contracts must be reviewed at least annually with the effect of changes in those assumptions being recognized in the statement of operations
|
|
•
|
the discount rate applied to measure the liability for future policy benefits and limited-payment contracts must be updated at each reporting date with the effect of changes in the rate being recognized in other comprehensive income
|
F-26
|
•
|
market risk benefits associated with deposit contracts must be measured at fair value, with the effect of the change in the fair value attributable to a change in the instrument-specific credit risk being recognized in other comprehensive income
|
|
•
|
deferred acquisition costs are required to be amortized in proportion to premiums, gross profits, or gross margins and those balances must be amortized on a constant level basis over the expected term of the related contracts
|
|
•
|
deferred acquisition costs must be written off for unexpected contract terminations
|
|
•
|
disaggregated rollforwards of beginning to ending balances of the liability for future policy benefits, policyholder account balances, market risk benefits, separate account liabilities and deferred acquisition costs, as well as information about significant inputs, judgments, assumptions, and methods used in measurement are required to be disclosed
|
The amendments in this ASU may be early adopted as of the beginning of an annual reporting period for which financial statements have not yet been issued, including interim financial statements. The Company does not currently expect to early adopt this standard. The Company has identified specific areas that will be impacted by the new guidance and is in the process of assessing the accounting, reporting and/or process changes that will be required to comply as well as the impact of the new guidance on its consolidated financial statements.
Fair Value Measurement
In August 2018, the FASB issued ASU 2018-13,
Fair Value Measurement (Topic 820), Disclosure Framework-Changes to the Disclosure Requirements for Fair Value Measurement,
effective for fiscal years beginning after December 15, 2019 including interim periods within those fiscal years. Under this update:
|
•
|
for investments in certain entities that calculate net asset value, investors are required to disclose the timing of liquidation of an investee's assets and the date when restrictions from redemption might lapse if the investee has communicated timing to the entity or announced timing publicly
|
|
•
|
entities should use the measurement uncertainty disclosure to communicate information about the uncertainty in measurement as of the reporting date
|
|
•
|
entities must disclose changes in unrealized gains and losses included in other comprehensive income for recurring Level 3 fair value measurements, as well as the range and weighted average of significant unobservable inputs used to develop Level 3 fair value measurements, or other quantitative information in lieu of weighted average if the entity determines such information would be more reasonable and rational
|
|
•
|
entities are no longer required to disclose the amounts and reasons for transfers between Level 1 and Level 2 of the fair value hierarchy, the policy for timing of transfers between levels, and the valuation processes for Level 3 fair value measurements
|
The Company will adopt this standard on January 1, 2020, and does not expect this new accounting standard to have a significant impact on its consolidated financial statements.
Consolidation
In October 2018, the FASB issued ASU 2018-17,
Consolidation (Topic 810), Targeted Improvements to Related Party Guidance for Variable Interest Entities,
effective for fiscal years beginning after December 15, 2019 including interim periods within those fiscal years. Under this update, entities must consider indirect interests held through related parties under common control on a proportional basis to determine whether a decision-making fee is a variable interest.
The Company will adopt this standard on January 1, 2020, and does not expect this new accounting standard to have a significant impact on its consolidated financial statements.
(3)
Significant Risks and Uncertainties
Best Interest Regulation
In March 2018, the United States Fifth Circuit Court of Appeals formally vacated the U. S. Department Labor “Fiduciary Rule” which would have imposed fiduciary duties upon insurance agents selling Individual Retirement Account (IRA) annuities and would have potentially had a material impact on the Company, its products,
F-27
distribution, and business model. Since then, in June 2019, the U.S. Securities and Exchange Commission (SEC) adopted Regulation Best Interest imposing new sales practice standards on securities brokers, which does not directly impact the Company or its distributors, but gives impetus for the National Association of Insurance Commissioners (NAIC) and individual states to consider best interest proposals for insurance sales. The NAIC adopted an amended Suitability in Annuity Transactions Model Regulation in February 2020 incorporating a requirement that agents act in the best interest of consumers without putting their own financial interests or insurer’s interests ahead of consumer interests. It is expected individual states may soon begin to consider and adopt the NAIC model regulation. FGL NY Insurance already modified certain new business processes in response to the New York Department of Financial Services (NYDFS) best interest rule despite relatively low sales in New York. Management is following a legal challenge to nullify the NYDFS rule and will continue to monitor action by other state or federal agencies to implement sales practice rules affecting insurance agents selling fixed insurance or annuity products.
Use of Estimates and Assumptions
The preparation of the Company's
consolidated financial statements
in conformity with GAAP requires management to make estimates and assumptions that affect the reported amounts of assets and liabilities and disclosures of contingent assets and liabilities at the date of the financial statements and the reported amounts of revenues and expenses during the reporting period. Actual results could differ from those estimates and assumptions used.
The Company periodically, and at least annually, reviews the assumptions associated with reserves for policy benefits, product guarantees, and amortization of intangibles. As a result of the assumption review process that occurred in the year ended
December 31, 2019
, the surrender rates, guaranteed minimum withdrawal benefit (“GMWB”) utilization, IUL premium persistency, maintenance expenses, and earned rate assumptions were updated to reflect the Company's current and expected future experience. These changes in assumptions resulted in a net decrease in future expected margins and a corresponding increase in amortization expense reported as a component of “unlocking” for the period ended December 31, 2019. This resulted in a decrease to intangible assets of
$
3
. These assumptions are used in the SOP 03-1 liability for GMWB benefits and resulted in a decrease in liability of
$
13
for the period ended December 31, 2019. The surrender rate assumptions are also used in the reserve calculation and resulted in an increase in embedded derivative liability of
$
1
for the period ended December 31, 2019. The change in assumptions as of December 31, 2018 resulted in a net increase in future expected margins and a corresponding decrease in amortization expense reported as a component of “unlocking”. This resulted in a decrease to intangible assets of
$
2
. These assumptions are also used in the reserve calculation and resulted in a decrease of
$
5
in the year ended December 31, 2018.
As a result of the assumption review process at FSRC that occurred in the year ended
December 31, 2019
, the premium rate, claim factor and IBNR assumptions were updated. This resulted in an increase to the future policy benefits of
$
10
. F&G Re periodically, and at least annually, reviews the assumptions associated with reserves for future policy benefits. As a result of the assumption review process that occurred in the year ended
December 31, 2019
, the duration discount weighting and model demographics assumptions were updated to reflect the Company's current and expected future experience. This resulted in a decrease to future policy benefits of
$
14
.
Concentrations of Financial Instruments
As of
December 31, 2019
and
December 31, 2018
, the Company’s most significant investment in one industry, excluding United States ("U.S.") Government securities, was its investment securities in the
Banking
industry with a fair value of
$
2,414
or
9
%
and
$
2,491
or
10
%
, respectively, of the invested assets portfolio and an amortized cost of
$
2,325
and
$
2,691
, respectively. As of
December 31, 2019
, the Company’s holdings in this industry include investments in
98
different issuers with the top ten investments accounting for
39
%
of the total holdings in this industry. As of
December 31, 2019
, the Company had no investments in issuers that exceeded
10
%
of shareholders' equity. As of
December 31, 2018
, the Company had
sixteen
investments in issuers that exceeded
10
%
of shareholders' equity, with a total fair value of
$
1,634
or
7
%
of the invested assets portfolio: JP Morgan Chase & Co, Metropolitan Transportation Authority (NY), AT&T Inc, HSBC Holdings, Wells Fargo & Company, General Motors Co, Nationwide Mutual Insurance Company, Goldman Sachs Group Inc, United Mexican States, Energy Transfer Partners, Prudential Financial Inc, Citigroup Inc, HP Enterprise Co, Viacom Inc, Kinder Morgan Energy Partners, and Fuel Trust. The Company's largest concentration in any single issuer as of
December 31, 2019
and
December 31, 2018
was
HSBC Holdings
with a total fair value of
$
132
or
1
%
, and
JP Morgan Chase & Co
, with a total fair value of
$
115
or
1
%
of the invested assets portfolio, respectively.
F-28
Concentrations of Financial and Capital Markets Risk
The Company is exposed to financial and capital markets risk, including changes in interest rates and credit spreads which can have an adverse effect on the Company’s results of operations, financial condition and liquidity. The Company’s exposure to such financial and capital markets risk relates primarily to the market price and cash flow variability associated with changes in interest rates. A rise in interest rates, in the absence of other countervailing changes, will increase the net unrealized loss position of the Company’s investment portfolio and, if long-term interest rates rise dramatically within a six to twelve month time period, certain of the Company’s products may be exposed to disintermediation risk. Disintermediation risk refers to the risk that policyholders surrender their contracts in a rising interest rate environment, requiring the Company to liquidate assets in an unrealized loss position. The Company attempts to mitigate the risk, including changes in interest rates by investing in less rate-sensitive investments, including senior tranches of collateralized loan obligations, non-agency residential mortgage-backed securities, and various types of asset backed securities. Management believes this risk is also mitigated to some extent by surrender charge protection provided by the Company’s products. The Company expects to continue to face these challenges and uncertainties that could adversely affect its results of operations and financial condition.
Concentration of Reinsurance Risk
The Company has a significant concentration of reinsurance risk with third party reinsurers, Wilton Reassurance Company (“Wilton Re”) and Kubera Insurance (SAC) Ltd. ("Kubera") that could have a material impact on the Company’s financial position in the event that either Wilton Re or Kubera fail to perform their obligations under the various reinsurance treaties. Wilton Re is a wholly-owned subsidiary of Canada Pension Plan Investment Board ("CPPIB"). CPPIB has an
AAA
issuer credit rating from Standard & Poor's Ratings Services ("S&P") as of
December 31, 2019
. Kubera is not rated, however, management has attempted to mitigate the risk of non-performance through the funds withheld arrangement. As of
December 31, 2019
, the net amount recoverable from Wilton Re was
$
1,496
and the net amount recoverable from Kubera was
$
842
. The Company monitors both the financial condition of individual reinsurers and risk concentration arising from similar activities and economic characteristics of reinsurers to attempt to reduce the risk of default by such reinsurers. The Company believes that all amounts due from Wilton Re and Kubera for periodic treaty settlements are collectible as of
December 31, 2019
.
On March 6, 2019, Scottish Re (U.S.), Inc. (“SRUS”), a Delaware domestic life and health reinsurer of FGL Insurance, was ordered into receivership for purposes of rehabilitation. As of December 31, 2019, the net amount recoverable from SRUS was
$
47
. The financial exposure related to these ceded reserves are substantially mitigated via a reinsurance agreement whereby Wilton Re assumes treaty non-performance including credit risk for this business.
On July 9, 2019, Pavonia Life Insurance Company of Michigan ("Pavonia"), a Michigan domiciled life, accident, and health insurance company, was placed into rehabilitation. While the court order indicated that Pavonia had a stable financial condition and lack of non-insurance affiliated investments, the Director of the Michigan Department of Insurance and Financial Services ("MDIFS") has concerns relating to Pavonia's parent company. To insulate Pavonia from its parent until a pending acquisition transaction could be consummated, MDIFS placed Pavonia under supervision and rehabilitation. As of December 31, 2019, the net amount recoverable from Pavonia was
$
85
. The financial exposure related to these ceded reserves are substantially mitigated via a reinsurance agreement whereby Wilton Re assumes treaty non-performance including credit risk for this business.
F-29
(4)
Investments
The Company’s fixed maturity securities investments have been designated as available-for-sale and are carried at fair value with unrealized gains and losses included in AOCI, net of associated adjustments for DAC, VOBA, DSI, UREV, and deferred income taxes. The Company's equity securities investments are carried at fair value with unrealized gains and losses included in net income.
The Company’s consolidated investments at
December 31, 2019
and
December 31, 2018
are summarized as follows:
|
December 31, 2019
|
|||||||||||||||||||
|
Amortized Cost
|
Gross Unrealized Gains
|
Gross Unrealized Losses
|
Fair Value
|
Carrying Value
|
|||||||||||||||
|
Available-for sale securities
|
|||||||||||||||||||
|
Asset-backed securities
|
$
|
|
|
$
|
|
|
$
|
(
|
)
|
$
|
|
|
$
|
|
|
||||
|
Commercial mortgage-backed securities
|
|
|
|
|
(
|
)
|
|
|
|
|
|||||||||
|
Corporates
|
|
|
|
|
(
|
)
|
|
|
|
|
|||||||||
|
Hybrids
|
|
|
|
|
(
|
)
|
|
|
|
|
|||||||||
|
Municipals
|
|
|
|
|
(
|
)
|
|
|
|
|
|||||||||
|
Residential mortgage-backed securities
|
|
|
|
|
(
|
)
|
|
|
|
|
|||||||||
|
U.S. Government
|
|
|
|
|
|
|
|
|
|
|
|||||||||
|
Foreign Governments
|
|
|
|
|
|
|
|
|
|
|
|||||||||
|
Total available-for-sale securities
|
|
|
|
|
(
|
)
|
|
|
|
|
|||||||||
|
Equity securities
|
|
|
|
|
(
|
)
|
|
|
|
|
|||||||||
|
Derivative investments
|
|
|
|
|
(
|
)
|
|
|
|
|
|||||||||
|
Commercial mortgage loans
|
|
|
|
|
|
|
|
|
|
|
|||||||||
|
Residential mortgage loans
|
|
|
|
|
|
|
|
|
|
|
|||||||||
|
Other invested assets
|
|
|
|
|
(
|
)
|
|
|
|
|
|||||||||
|
Total investments
|
$
|
|
|
$
|
|
|
$
|
(
|
)
|
$
|
|
|
$
|
|
|
||||
|
December 31, 2018
|
|||||||||||||||||||
|
Amortized Cost
|
Gross Unrealized Gains
|
Gross Unrealized Losses
|
Fair Value
|
Carrying Value
|
|||||||||||||||
|
Available-for sale securities
|
|||||||||||||||||||
|
Asset-backed securities
|
$
|
|
|
$
|
|
|
$
|
(
|
)
|
$
|
|
|
$
|
|
|
||||
|
Commercial mortgage-backed securities
|
|
|
|
|
(
|
)
|
|
|
|
|
|||||||||
|
Corporates
|
|
|
|
|
(
|
)
|
|
|
|
|
|||||||||
|
Hybrids
|
|
|
|
|
(
|
)
|
|
|
|
|
|||||||||
|
Municipals
|
|
|
|
|
(
|
)
|
|
|
|
|
|||||||||
|
Residential mortgage-backed securities
|
|
|
|
|
(
|
)
|
|
|
|
|
|||||||||
|
U.S. Government
|
|
|
|
|
(
|
)
|
|
|
|
|
|||||||||
|
Foreign Governments
|
|
|
|
|
(
|
)
|
|
|
|
|
|||||||||
|
Total available-for-sale securities
|
|
|
|
|
(
|
)
|
|
|
|
|
|||||||||
|
Equity securities
|
|
|
|
|
(
|
)
|
|
|
|
|
|||||||||
|
Derivative investments
|
|
|
|
|
(
|
)
|
|
|
|
|
|||||||||
|
Commercial mortgage loans
|
|
|
|
|
|
|
|
|
|
|
|||||||||
|
Residential mortgage loans
|
|
|
|
|
|
|
|
|
|
|
|||||||||
|
Other invested assets
|
|
|
|
|
|
|
|
|
|
|
|||||||||
|
Total investments
|
$
|
|
|
$
|
|
|
$
|
(
|
)
|
$
|
|
|
$
|
|
|
||||
F-30
Included in AOCI were cumulative gross unrealized gains of
$
0
and gross unrealized losses of
$
0
related to the non-credit portion of other-than-temporary-impairments ("OTTI") on non-agency residential mortgage backed securities ("RMBS") for both
December 31, 2019
and
December 31, 2018
.
Securities held on deposit with various state regulatory authorities had a fair value of
$
17,591
and
$
19,930
at
December 31, 2019
and
December 31, 2018
, respectively. Under Iowa regulations, insurance companies are required to hold securities on deposit in an amount no less than the legal reserve.
At
December 31, 2019
and
December 31, 2018
, the Company held
no
material investments that were non-income producing for a period greater than twelve months.
In accordance with the Company's FHLB agreements, the investments supporting the funding agreement liabilities are pledged as collateral to secure the FHLB funding agreement liabilities and are not available to the Company for general purposes. The collateral investments had a fair value of
$
1,472
and
$
1,401
at
December 31, 2019
and
December 31, 2018
, respectively.
The amortized cost and fair value of fixed maturity available-for-sale securities by contractual maturities, as applicable, are shown below. Actual maturities may differ from contractual maturities because issuers may have the right to call or pre-pay obligations.
|
December 31, 2019
|
|||||||
|
Amortized Cost
|
Fair Value
|
||||||
|
Corporates, Non-structured Hybrids, Municipal and Government securities:
|
|||||||
|
Due in one year or less
|
$
|
|
|
$
|
|
|
|
|
Due after one year through five years
|
|
|
|
|
|||
|
Due after five years through ten years
|
|
|
|
|
|||
|
Due after ten years
|
|
|
|
|
|||
|
Subtotal
|
|
|
|
|
|||
|
Other securities which provide for periodic payments:
|
|||||||
|
Asset-backed securities
|
|
|
|
|
|||
|
Commercial mortgage-backed securities
|
|
|
|
|
|||
|
Residential mortgage-backed securities
|
|
|
|
|
|||
|
Subtotal
|
|
|
|
|
|||
|
Total fixed maturity available-for-sale securities
|
$
|
|
|
$
|
|
|
|
The Company's available-for-sale securities with unrealized losses are reviewed for potential OTTI. For factors considered in evaluating whether a decline in value is other-than-temporary, please refer to “Note 2. Significant Accounting Policies and Practices". Based on the results of our process for evaluating available-for-sale securities in unrealized loss positions for OTTI as discussed above, the Company determined the unrealized losses as of
December 31, 2019
decreased due to lower interest rates during the year in conjunction with tighter credit spreads over Treasuries.
F-31
The fair value and gross unrealized losses of available-for-sale securities, aggregated by investment category and duration of fair value below amortized cost, were as follows:
|
December 31, 2019
|
|||||||||||||||||||||||
|
Less than 12 months
|
12 months or longer
|
Total
|
|||||||||||||||||||||
|
Fair Value
|
Gross Unrealized
Losses
|
Fair Value
|
Gross Unrealized
Losses
|
Fair Value
|
Gross Unrealized
Losses
|
||||||||||||||||||
|
Available-for-sale securities
|
|||||||||||||||||||||||
|
Asset-backed securities
|
$
|
|
|
$
|
(
|
)
|
$
|
|
|
$
|
(
|
)
|
$
|
|
|
$
|
(
|
)
|
|||||
|
Commercial mortgage-backed securities
|
|
|
(
|
)
|
|
|
(
|
)
|
|
|
(
|
)
|
|||||||||||
|
Corporates
|
|
|
(
|
)
|
|
|
(
|
)
|
|
|
(
|
)
|
|||||||||||
|
Hybrids
|
|
|
(
|
)
|
|
|
(
|
)
|
|
|
(
|
)
|
|||||||||||
|
Municipals
|
|
|
(
|
)
|
|
|
(
|
)
|
|
|
(
|
)
|
|||||||||||
|
Residential mortgage-backed securities
|
|
|
—
|
|
|
|
(
|
)
|
|
|
(
|
)
|
|||||||||||
|
U.S. Government
|
|
|
—
|
|
|
|
|
|
|
|
|
|
|||||||||||
|
Total available-for-sale securities
|
$
|
|
|
$
|
(
|
)
|
$
|
|
|
$
|
(
|
)
|
$
|
|
|
$
|
(
|
)
|
|||||
|
Total number of available-for-sale securities in an unrealized loss position less than twelve months
|
|
|
|||||||||||||||||||||
|
Total number of available-for-sale securities in an unrealized loss position twelve months or longer
|
|
|
|||||||||||||||||||||
|
Total number of available-for-sale securities in an unrealized loss position
|
|
|
|||||||||||||||||||||
|
December 31, 2018
|
|||||||||||||||||||||||
|
Less than 12 months
|
12 months or longer
|
Total
|
|||||||||||||||||||||
|
Fair Value
|
Gross Unrealized
Losses |
Fair Value
|
Gross Unrealized
Losses |
Fair Value
|
Gross Unrealized
Losses |
||||||||||||||||||
|
Available-for-sale securities
|
|||||||||||||||||||||||
|
Asset-backed securities
|
$
|
|
|
$
|
(
|
)
|
$
|
|
|
$
|
(
|
)
|
$
|
|
|
$
|
(
|
)
|
|||||
|
Commercial mortgage-backed securities
|
|
|
(
|
)
|
|
|
(
|
)
|
|
|
(
|
)
|
|||||||||||
|
Corporates
|
|
|
(
|
)
|
|
|
(
|
)
|
|
|
(
|
)
|
|||||||||||
|
Hybrids
|
|
|
(
|
)
|
|
|
(
|
)
|
|
|
(
|
)
|
|||||||||||
|
Municipals
|
|
|
(
|
)
|
|
|
(
|
)
|
|
|
(
|
)
|
|||||||||||
|
Residential mortgage-backed securities
|
|
|
(
|
)
|
|
|
(
|
)
|
|
|
(
|
)
|
|||||||||||
|
U.S. Government
|
|
|
|
|
|
|
(
|
)
|
|
|
(
|
)
|
|||||||||||
|
Foreign Government
|
|
|
(
|
)
|
|
|
(
|
)
|
|
|
(
|
)
|
|||||||||||
|
Total available-for-sale securities
|
$
|
|
|
$
|
(
|
)
|
$
|
|
|
$
|
(
|
)
|
$
|
|
|
$
|
(
|
)
|
|||||
|
Total number of available-for-sale securities in an unrealized loss position less than twelve months
|
|
|
|||||||||||||||||||||
|
Total number of available-for-sale securities in an unrealized loss position twelve months or longer
|
|
|
|||||||||||||||||||||
|
Total number of available-for-sale securities in an unrealized loss position
|
|
|
|||||||||||||||||||||
At
December 31, 2019
and
December 31, 2018
, securities with a fair value of
$
35
and
$
132
, respectively, had an unrealized loss greater than
20
%
of amortized cost (excluding U.S. Government and U.S. Government sponsored agency securities), which were insignificant to the carrying value of all investments, respectively.
F-32
The following table provides a reconciliation of the beginning and ending balances of the credit loss portion of OTTI on fixed maturity available-for-sale securities held by the Company for the periods presented, for which a portion of the OTTI was recognized in AOCI:
|
Year ended
|
Year ended
|
|||||||||||||||||||||||
|
December 31, 2019
|
December 31, 2018
|
Period from December 1 to December 31, 2017
|
Period from October 1 to November 30, 2017
|
Period from October 1 to December 31, 2016 (Unaudited)
|
September 30, 2017
|
|||||||||||||||||||
|
Predecessor
|
Predecessor
|
Predecessor
|
||||||||||||||||||||||
|
Beginning balance
|
$
|
|
|
$
|
|
|
$
|
|
|
$
|
|
|
$
|
|
|
$
|
|
|
||||||
|
Increases attributable to credit losses on securities:
|
||||||||||||||||||||||||
|
OTTI was previously recognized
|
|
|
|
|
|
|
|
|
|
|
|
|
||||||||||||
|
OTTI was not previously recognized
|
|
|
|
|
|
|
|
|
|
|
|
|
||||||||||||
|
Ending balance
|
$
|
|
|
$
|
|
|
$
|
|
|
$
|
|
|
$
|
|
|
$
|
|
|
||||||
The following table breaks out the credit impairment loss type, the associated amortized cost and fair value of the investments at the balance sheet date and non-credit losses in relation to fixed maturity securities and other invested assets held by the Company for the periods presented:
|
Year ended
|
Year ended
|
|||||||||||||||||||||||
|
December 31, 2019
|
December 31, 2018
|
Period from December 1 to December 31, 2017
|
Period from October 1 to November 30, 2017
|
Period from October 1 to December 31, 2016 (Unaudited)
|
September 30, 2017
|
|||||||||||||||||||
|
Predecessor
|
Predecessor
|
Predecessor
|
||||||||||||||||||||||
|
Credit impairment losses in operations
|
$
|
(
|
)
|
$
|
(
|
)
|
$
|
|
|
$
|
|
|
$
|
(
|
)
|
$
|
(
|
)
|
||||||
|
Change-of-intent losses in operations
|
(
|
)
|
|
|
|
|
|
|
|
|
|
|
||||||||||||
|
Amortized cost
|
|
|
|
|
|
|
|
|
|
|
|
|
||||||||||||
|
Fair value
|
|
|
|
|
|
|
|
|
|
|
|
|
||||||||||||
|
Non-credit losses in other comprehensive income for investments which experienced OTTI
|
|
|
|
|
|
|
|
|
(
|
)
|
|
|
||||||||||||
Details of OTTI that were recognized in "Net income (loss)" and included in net realized gains on securities were as follows:
|
Year ended
|
Year ended
|
|||||||||||||||||||||||
|
December 31, 2019
|
December 31, 2018
|
Period from December 1 to December 31, 2017
|
Period from October 1 to November 30, 2017
|
Period from October 1 to December 31, 2016 (Unaudited)
|
September 30, 2017
|
|||||||||||||||||||
|
Predecessor
|
Predecessor
|
Predecessor
|
||||||||||||||||||||||
|
Asset-backed securities
|
$
|
|
|
$
|
|
|
$
|
|
|
$
|
|
|
$
|
(
|
)
|
$
|
(
|
)
|
||||||
|
Corporates
|
(
|
)
|
(
|
)
|
|
|
|
|
|
|
(
|
)
|
||||||||||||
|
Equity security
|
(
|
)
|
|
|
|
|
|
|
|
|
|
|
||||||||||||
|
Total
|
$
|
(
|
)
|
$
|
(
|
)
|
$
|
|
|
$
|
|
|
$
|
(
|
)
|
$
|
(
|
)
|
||||||
F-33
Mortgage Loans
The Company's mortgage loans are collateralized by commercial and residential properties.
Commercial Mortgage Loans
Commercial mortgage loans ("CMLs") represented approximately
2
%
of the Company’s total investments as of
December 31, 2019
and
December 31, 2018
, respectively. The Company primarily invests in mortgage loans on income producing properties including hotels, industrial properties, retail buildings, multifamily properties and office buildings. The Company diversifies its CML portfolio by geographic region and property type to reduce concentration risk. The Company continuously evaluates CMLs based on relevant current information to ensure properties are performing at a consistent and acceptable level to secure the related debt.
The distribution of CMLs, gross of valuation allowances, by property type and geographic region is reflected in the following tables:
|
December 31, 2019
|
December 31, 2018
|
||||||||||||
|
Gross Carrying Value
|
% of Total
|
Gross Carrying Value
|
% of Total
|
||||||||||
|
Property Type:
|
|||||||||||||
|
Hotel
|
|
|
|
%
|
|
|
|
%
|
|||||
|
Industrial - General
|
|
|
|
%
|
|
|
|
%
|
|||||
|
Industrial - Warehouse
|
|
|
|
%
|
|
|
|
%
|
|||||
|
Multifamily
|
|
|
|
%
|
|
|
|
%
|
|||||
|
Office
|
|
|
|
%
|
|
|
|
%
|
|||||
|
Retail
|
|
|
|
%
|
|
|
|
%
|
|||||
|
Total commercial mortgage loans, gross of valuation allowance
|
$
|
|
|
|
%
|
$
|
|
|
|
%
|
|||
|
Allowance for loan loss
|
|
|
|
|
|||||||||
|
Total commercial mortgage loans
|
$
|
|
|
$
|
|
|
|||||||
|
U.S. Region:
|
|||||||||||||
|
East North Central
|
$
|
|
|
|
%
|
$
|
|
|
|
%
|
|||
|
East South Central
|
|
|
|
%
|
|
|
|
%
|
|||||
|
Middle Atlantic
|
|
|
|
%
|
|
|
|
%
|
|||||
|
Mountain
|
|
|
|
%
|
|
|
|
%
|
|||||
|
New England
|
|
|
|
%
|
|
|
|
%
|
|||||
|
Pacific
|
|
|
|
%
|
|
|
|
%
|
|||||
|
South Atlantic
|
|
|
|
%
|
|
|
|
%
|
|||||
|
West North Central
|
|
|
|
%
|
|
|
|
%
|
|||||
|
West South Central
|
|
|
|
%
|
|
|
|
%
|
|||||
|
Total commercial mortgage loans, gross of valuation allowance
|
$
|
|
|
|
%
|
$
|
|
|
|
%
|
|||
|
Allowance for loan loss
|
|
|
|
|
|||||||||
|
Total commercial mortgage loans
|
$
|
|
|
$
|
|
|
|||||||
All of the Company's investments in CMLs had a loan-to-value ("LTV") ratio of less than
75
%
at
December 31, 2019
and
December 31, 2018
, as measured at inception of the loans unless otherwise updated. As of
December 31, 2019
, all CMLs are current and have not experienced credit or other events which would require the recording of an impairment loss.
LTV and DSC ratios are measures commonly used to assess the risk and quality of mortgage loans. The LTV ratio is expressed as a percentage of the amount of the loan relative to the value of the underlying property. A LTV ratio in excess of
100%
indicates the unpaid loan amount exceeds the underlying collateral. The DSC ratio, based upon the most recently received financial statements, is expressed as a percentage of the amount of a property’s net income to its debt service payments. A DSC ratio of less than
1.00
indicates that a property’s operations do not generate sufficient income to cover debt payments. We normalize our DSC ratios to a 25-year amortization period for purposes of our general loan allowance evaluation.
F-34
The following table presents the recorded investment in CMLs by LTV and DSC ratio categories and estimated fair value by the indicated loan-to-value ratios at
December 31, 2019
and
December 31, 2018
:
|
Debt-Service Coverage Ratios
|
Total Amount
|
% of Total
|
Estimated Fair Value
|
% of Total
|
|||||||||||||||||
|
>1.25
|
1.00 - 1.25
|
||||||||||||||||||||
|
December 31, 2019
|
|||||||||||||||||||||
|
LTV Ratios:
|
|||||||||||||||||||||
|
Less than 50%
|
$
|
|
|
$
|
|
|
$
|
|
|
|
%
|
$
|
|
|
|
%
|
|||||
|
50% to 60%
|
|
|
|
|
|
|
|
%
|
|
|
|
%
|
|||||||||
|
Commercial mortgage loans
|
$
|
|
|
$
|
|
|
$
|
|
|
|
%
|
$
|
|
|
|
%
|
|||||
|
December 31, 2018
|
|||||||||||||||||||||
|
LTV Ratios:
|
|||||||||||||||||||||
|
Less than 50%
|
$
|
|
|
$
|
|
|
$
|
|
|
|
%
|
$
|
|
|
|
%
|
|||||
|
50% to 60%
|
|
|
|
|
|
|
|
%
|
|
|
|
%
|
|||||||||
|
60% to 75%
|
|
|
|
|
|
|
|
%
|
|
|
|
%
|
|||||||||
|
Commercial mortgage loans
|
$
|
|
|
$
|
|
|
$
|
|
|
|
%
|
$
|
|
|
|
%
|
|||||
The Company recognizes a mortgage loan as delinquent when payments on the loan are greater than 30 days past due. At
December 31, 2019
and
December 31, 2018
, the Company had
no
CMLs that were delinquent in principal or interest payments.
Residential Mortgage Loans
Residential mortgage loans ("RMLs") represented approximately
3
%
and
1
%
of the Company’s total investments as of
December 31, 2019
and
December 31, 2018
, respectively. The Company's residential mortgage loans are closed end, amortizing loans and 100% of the properties are located in the United States. The Company diversifies its RML portfolio by state to reduce concentration risk. The distribution of RMLs by state with highest-to-lowest concentration is reflected in the following tables at
December 31, 2019
and
December 31, 2018
:
|
December 31, 2019
|
||||||
|
US State:
|
Unpaid Principal Balance
|
% of Total
|
||||
|
California
|
$
|
|
|
|
%
|
|
|
Florida
|
|
|
|
%
|
||
|
New Jersey
|
|
|
|
%
|
||
|
All Other States (a)
|
|
|
|
%
|
||
|
Total mortgage loans
|
$
|
|
|
|
%
|
|
(a) The individual concentration of each state is less than
9
%
.
F-35
|
December 31, 2018
|
|||||||
|
US State:
|
Unpaid Principal Balance
|
% of Total
|
|||||
|
Florida
|
$
|
|
|
|
%
|
||
|
Illinois
|
|
|
|
%
|
|||
|
New Jersey
|
|
|
|
%
|
|||
|
All Other States (a)
|
|
|
|
%
|
|||
|
Total mortgage loans
|
$
|
|
|
|
%
|
||
(a) The individual concentration of each state is less than
9
%
.
Residential mortgage loans have a primary credit quality indicator of either a performing or nonperforming loan. The Company defines non-performing residential mortgage loans as those that are 90 or more days past due or in nonaccrual status which is assessed monthly. The credit quality of RMLs as at
December 31, 2019
and
December 31, 2018
were as follows:
|
December 31, 2019
|
December 31, 2018
|
||||||||||||
|
Performance indicator:
|
Carrying Value
|
% of Total
|
Carrying Value
|
% of Total
|
|||||||||
|
Performing
|
$
|
|
|
|
%
|
$
|
|
|
|
%
|
|||
|
Non-performing
|
|
|
|
%
|
|
|
|
%
|
|||||
|
Total residential mortgage loans, gross of valuation allowance
|
$
|
|
|
|
%
|
$
|
|
|
|
%
|
|||
|
Allowance for loan loss
|
|
|
|
%
|
|
|
|
%
|
|||||
|
Total residential mortgage loans
|
$
|
|
|
|
%
|
$
|
|
|
|
%
|
|||
Net Investment Income
The major sources of “Net investment income” on the accompanying Consolidated Statements of Operations were as follows:
|
Year ended
|
Year ended
|
|||||||||||||||||||||||
|
December 31, 2019
|
December 31, 2018
|
Period from December 1 to December 31, 2017
|
Period from October 1 to November 30, 2017
|
Period from October 1 to December 31, 2016 (Unaudited)
|
September 30, 2017
|
|||||||||||||||||||
|
Predecessor
|
Predecessor
|
Predecessor
|
||||||||||||||||||||||
|
Fixed maturity securities, available-for-sale
|
$
|
|
|
$
|
|
|
$
|
|
|
$
|
|
|
$
|
|
|
$
|
|
|
||||||
|
Equity securities
|
|
|
|
|
|
|
|
|
|
|
|
|
||||||||||||
|
Mortgage loans
|
|
|
|
|
|
|
|
|
|
|
|
|
||||||||||||
|
Invested cash and short-term investments
|
|
|
|
|
|
|
|
|
|
|
|
|
||||||||||||
|
Funds withheld
|
|
|
|
|
|
|
|
|
|
|
|
|
||||||||||||
|
Limited partnerships
|
|
|
|
|
|
|
|
|
|
|
|
|
||||||||||||
|
Other investments
|
|
|
|
|
|
|
|
|
|
|
|
|
||||||||||||
|
Gross investment income
|
|
|
|
|
|
|
|
|
|
|
|
|
||||||||||||
|
Investment expense
|
(
|
)
|
(
|
)
|
(
|
)
|
(
|
)
|
(
|
)
|
(
|
)
|
||||||||||||
|
Net investment income
|
$
|
|
|
$
|
|
|
$
|
|
|
$
|
|
|
$
|
|
|
$
|
|
|
||||||
F-36
Net Investment Gains (Losses)
Details underlying “Net investment gains (losses)” reported on the accompanying Consolidated Statements of Operations were as follows:
|
Year ended
|
Year ended
|
|||||||||||||||||||||||
|
December 31, 2019
|
December 31, 2018
|
Period from December 1 to December 31, 2017
|
Period from October 1 to November 30, 2017
|
Period from October 1 to December 31, 2016 (Unaudited)
|
September 30, 2017
|
|||||||||||||||||||
|
Predecessor
|
Predecessor
|
Predecessor
|
||||||||||||||||||||||
|
Net realized gains (losses) on fixed maturity available-for-sale securities
|
$
|
|
|
$
|
(
|
)
|
$
|
|
|
$
|
|
|
$
|
|
|
$
|
(
|
)
|
||||||
|
Net realized/unrealized gains (losses) on equity securities
|
|
|
(
|
)
|
|
|
|
|
|
|
|
|
||||||||||||
|
Realized gains (losses) on other invested assets
|
|
|
(
|
)
|
|
|
|
|
(
|
)
|
(
|
)
|
||||||||||||
|
Derivatives and embedded derivatives:
|
||||||||||||||||||||||||
|
Realized gains (losses) on certain derivative instruments
|
(
|
)
|
(
|
)
|
|
|
|
|
|
|
|
|
||||||||||||
|
Unrealized gains (losses) on certain derivative instruments
|
|
|
(
|
)
|
|
|
|
|
|
|
|
|
||||||||||||
|
Change in fair value of funds withheld for reinsurance receivables and reinsurance related embedded derivatives (a)
|
|
|
(
|
)
|
|
|
|
|
|
|
(
|
)
|
||||||||||||
|
Change in fair value of other derivatives and embedded derivatives
|
|
|
(
|
)
|
|
|
|
|
|
|
|
|
||||||||||||
|
Realized gains (losses) on derivatives and embedded derivatives
|
|
|
(
|
)
|
|
|
|
|
|
|
|
|
||||||||||||
|
Net investment gains (losses)
|
$
|
|
|
$
|
(
|
)
|
$
|
|
|
$
|
|
|
$
|
|
|
$
|
|
|
||||||
(a) Change in fair value of reinsurance related embedded derivatives starting December 1, 2017 and after is due to F&G Re and FSRC unaffiliated third party business under the fair value option election. Starting January 1, 2019, the balance also includes activity related to the FGL Insurance and Kubera reinsurance treaty. The predecessor periods activity is due to the FGL Insurance and FSRC reinsurance treaty. See "Note 13. Reinsurance".
The proceeds from the sale of fixed-maturity available for-sale-securities and the gross gains and losses associated with those transactions were as follows:
|
Year ended
|
Year ended
|
|||||||||||||||||||||||
|
December 31, 2019
|
December 31, 2018
|
Period from December 1 to December 31, 2017
|
Period from October 1 to November 30, 2017
|
Period from October 1 to December 31, 2016 (Unaudited)
|
September 30, 2017
|
|||||||||||||||||||
|
Predecessor
|
Predecessor
|
Predecessor
|
||||||||||||||||||||||
|
Proceeds
|
$
|
|
|
$
|
|
|
$
|
|
|
$
|
|
|
$
|
|
|
$
|
|
|
||||||
|
Gross gains
|
|
|
|
|
|
|
|
|
|
|
|
|
||||||||||||
|
Gross losses
|
(
|
)
|
(
|
)
|
|
|
|
|
(
|
)
|
(
|
)
|
||||||||||||
Variable Interest Entities
FGL Insurance owns investments in VIEs that are not consolidated within the Company’s financial statements, and one investment in a VIE that is consolidated within the Company’s financial statements. VIEs do not have sufficient equity to finance their own activities without additional financial support and certain of its investors lack certain characteristics of a controlling financial interest. VIE’s are consolidated by their ‘primary beneficiary’, a designation given to an entity that receives both the benefits from the VIE as well as the substantive power to make its key economic decisions. While FGL Insurance participates in the benefits from VIEs in which it invests, but does not consolidate, the substantive power to make the key economic decisions for each respective VIE resides with entities not under common control with FGL Insurance. It is for this reason that FGL Insurance is not considered the primary beneficiary for the VIE investments that are not consolidated.
The Company has concluded it is the primary beneficiary of BISA Co-Invest Fund II L.P (“Co-Invest II”). The primary beneficiary conclusion was drawn given the fact that substantially all of Co-Invest II’s activities are
F-37
conducted on behalf of the Company, its sole investor and limited partner. As the Company is considered the primary beneficiary, Co-Invest II is consolidated within the Company’s financial statements. As of
December 31, 2019
, the Company has
$
22
of net assets recorded related to Co-Invest II.
The Company previously executed a commitment of
$
83
to purchase common shares in an unaffiliated private business development company ("BDC"). The BDC invests in secured and unsecured fixed maturity and equity securities of middle market companies in the United States. Due to the voting structure of the transaction, the Company does not have voting power. The initial capital call occurred June 30, 2015, with the remaining commitment expected to fund June 2020. The Company has funded
$
69
as of
December 31, 2019
.
F-38
(5)
Derivative Financial Instruments
The carrying amounts of derivative instruments, including derivative instruments embedded in FIA contracts, is as follows:
|
December 31, 2019
|
December 31, 2018
|
||||||
|
Assets:
|
|||||||
|
Derivative investments:
|
|||||||
|
Call options
|
$
|
|
|
$
|
|
|
|
|
Futures contracts
|
|
|
|
|
|||
|
Other invested assets:
|
|||||||
|
Other derivatives and embedded derivatives
|
|
|
|
|
|||
|
Funds withheld:
|
|||||||
|
Call options
|
|
|
|
|
|||
|
$
|
|
|
$
|
|
|
||
|
Liabilities:
|
|||||||
|
Contractholder funds:
|
|||||||
|
FIA embedded derivative
|
$
|
|
|
$
|
|
|
|
|
Other liabilities:
|
|||||||
|
Reinsurance related embedded derivative
|
|
|
|
|
|||
|
Preferred shares reimbursement feature embedded derivative
|
|
|
|
|
|||
|
$
|
|
|
$
|
|
|
||
The change in fair value of derivative instruments included in the accompanying Consolidated Statements of Operations is as follows:
|
Year ended
|
Year ended
|
|||||||||||||||||||||||
|
December 31, 2019
|
December 31, 2018
|
Period from December 1 to December 31, 2017
|
Period from October 1 to November 30, 2017
|
Period from October 1 to December 31, 2016 (Unaudited)
|
September 30, 2017
|
|||||||||||||||||||
|
Predecessor
|
Predecessor
|
Predecessor
|
||||||||||||||||||||||
|
Net investment gains (losses):
|
||||||||||||||||||||||||
|
Call options
|
$
|
|
|
$
|
(
|
)
|
$
|
|
|
$
|
|
|
$
|
|
|
$
|
|
|
||||||
|
Futures contracts
|
|
|
(
|
)
|
|
|
|
|
|
|
|
|
||||||||||||
|
Foreign currency forward
|
|
|
|
|
|
|
|
|
|
|
|
|
||||||||||||
|
Other derivatives and embedded derivatives
|
|
|
(
|
)
|
|
|
|
|
|
|
|
|
||||||||||||
|
Reinsurance related embedded derivatives (a)
|
|
|
(
|
)
|
|
|
|
|
|
|
(
|
)
|
||||||||||||
|
Total net investment gains (losses)
|
$
|
|
|
$
|
(
|
)
|
$
|
|
|
$
|
|
|
$
|
|
|
$
|
|
|
||||||
|
Benefits and other changes in policy reserves:
|
||||||||||||||||||||||||
|
FIA embedded derivatives
|
$
|
|
|
$
|
|
|
$
|
(
|
)
|
$
|
|
|
$
|
(
|
)
|
$
|
|
|
||||||
|
Acquisition and operating expenses, net of deferrals:
|
||||||||||||||||||||||||
|
Preferred shares reimbursement feature embedded derivative (b)
|
$
|
(
|
)
|
$
|
|
|
$
|
|
|
$
|
|
|
$
|
|
|
$
|
|
|
||||||
(a) Change in fair value of reinsurance related embedded derivatives starting December 1, 2017 and after is due to F&G Re and FSRC unaffiliated third party business under the fair value option election. Starting January 1, 2019, the balance also includes activity related to the FGL Insurance and Kubera reinsurance treaty. The predecessor periods activity is due to the FGL Insurance and FSRC reinsurance treaty. See "Note 13. Reinsurance".
(b) Only applicable to periods after December 1, 2017.
F-39
Additional Disclosures
Other Derivatives and Embedded Derivatives
The Company holds a fund-linked note issued by Nomura International Funding Pte. Ltd with a face value of
$
35
. The note provides for an additional payment at maturity based on the value of an embedded derivative in AnchorPath Dedicated Return Fund (the "AnchorPath Fund") which was based on the actual return of the fund. At
December 31, 2019
, the fair value of the fund-linked note and embedded derivative were
$
29
and
$
21
, respectively. At December 31, 2018, the fair value of the fund-linked note and embedded derivative were
$
26
and
$
14
, respectively. At maturity of the fund-linked note, FGL Insurance will receive the
$
35
face value of the note plus the value of the embedded derivative in the AnchorPath Fund. The additional payment at maturity is an embedded derivative reported in "Other invested assets", while the host is an available-for-sale security reported in "Fixed maturities, available-for-sale".
Fixed Index Annuity ("FIA") Embedded Derivative, and Call Options and Futures
The Company has FIA Contracts that permit the holder to elect an interest rate return or an equity index linked component, where interest credited to the contracts is linked to the performance of various equity indices, primarily the S&P 500 Index. This feature represents an embedded derivative under GAAP. The FIA embedded derivative is valued at fair value and included in the liability for contractholder funds in the accompanying Consolidated Balance Sheets with changes in fair value included as a component of “Benefits and other changes in policy reserves” in the Consolidated Statements of Operations. See a description of the fair value methodology used in "Note 6. Fair Value of Financial Instruments".
The Company purchases derivatives consisting of a combination of call options and futures contracts on the applicable market indices to fund the index credits due to FIA contractholders. The call options are
one
,
two
,
three
, and
five
year options purchased to match the funding requirements of the underlying policies. On the respective anniversary dates of the index policies, the index used to compute the interest credit is reset and the Company purchases new
one
,
two
,
three
, or
five
year call options to fund the next index credit. The Company manages the cost of these purchases through the terms of its FIA contracts, which permit the Company to change caps, spreads or participation rates, subject to guaranteed minimums, on each contract’s anniversary date. The change in the fair value of the call options and futures contracts is generally designed to offset the portion of the change in the fair value of the FIA embedded derivative related to index performance through the current credit period. The call options and futures contracts are marked to fair value with the change in fair value included as a component of “Net investment gains (losses).” The change in fair value of the call options and futures contracts includes the gains and losses recognized at the expiration of the instrument's term or upon early termination and the changes in fair value of open positions.
Other market exposures are hedged periodically depending on market conditions and the Company’s risk tolerance. The Company’s FIA hedging strategy economically hedges the equity returns and exposes the Company to the risk that unhedged market exposures result in divergence between changes in the fair value of the liabilities and the hedging assets. The Company uses a variety of techniques, including direct estimation of market sensitivities, to monitor this risk daily. The Company intends to continue to adjust the hedging strategy as market conditions and the Company’s risk tolerance change.
F-40
Credit Risk
The Company is exposed to credit loss in the event of non-performance by its counterparties on the call options and assumptions regarding this non-performance risk are reflected in the fair value of the call options. The non-performance risk is the net counterparty exposure based on the fair value of the open contracts less collateral held. The Company maintains a policy of requiring all derivative contracts to be governed by an International Swaps and Derivatives Association (“ISDA”) Master Agreement.
Information regarding the Company’s exposure to credit loss on the call options it holds is presented in the following table:
|
December 31, 2019
|
||||||||||||||||||
|
Counterparty
|
Credit Rating
(Fitch/Moody's/S&P) (a)
|
Notional
Amount |
Fair Value
|
Collateral
|
Net Credit Risk
|
|||||||||||||
|
Merrill Lynch
|
|
$
|
|
|
$
|
|
|
$
|
|
|
$
|
|
|
|||||
|
Deutsche Bank
|
|
|
|
|
|
|
|
|
|
|||||||||
|
Morgan Stanley
|
|
|
|
|
|
|
|
|
|
|||||||||
|
Barclay's Bank
|
|
|
|
|
|
|
|
|
|
|||||||||
|
Canadian Imperial Bank of Commerce
|
|
|
|
|
|
|
|
|
|
|||||||||
|
Wells Fargo
|
|
|
|
|
|
|
|
|
|
|||||||||
|
Goldman Sachs
|
|
|
|
|
|
|
|
|
|
|||||||||
|
Total
|
$
|
|
|
$
|
|
|
$
|
|
|
$
|
|
|
||||||
|
|
|
|
|
December 31, 2018
|
||||||||||||||
|
Counterparty
|
|
Credit Rating
(Fitch/Moody's/S&P) (a)
|
|
Notional
Amount
|
|
Fair Value
|
|
Collateral
|
|
Net Credit Risk
|
||||||||
|
Merrill Lynch
|
|
|
|
$
|
|
|
|
$
|
|
|
|
$
|
|
|
|
$
|
|
|
|
Deutsche Bank
|
|
|
|
|
|
|
|
|
|
|
|
|
(
|
)
|
||||
|
Morgan Stanley
|
|
|
|
|
|
|
|
|
|
|
|
|
|
|
||||
|
Barclay's Bank
|
|
|
|
|
|
|
|
|
|
|
|
|
|
|
||||
|
Canadian Imperial Bank of Commerce
|
|
|
|
|
|
|
|
|
|
|
|
|
|
|
||||
|
Wells Fargo
|
|
|
|
|
|
|
|
|
|
|||||||||
|
Goldman Sachs
|
|
|
|
|
|
|
|
|
|
|||||||||
|
Total
|
|
|
$
|
|
|
|
$
|
|
|
|
$
|
|
|
|
$
|
|
|
|
(a) An * represents credit ratings that were not available.
F-41
Collateral Agreements
The Company is required to maintain minimum ratings as a matter of routine practice as part of its over-the-counter derivative agreements on ISDA forms. Under some ISDA agreements, the Company has agreed to maintain certain financial strength ratings. A downgrade below these levels provides the counterparty under the agreement the right to terminate the open option contracts between the parties, at which time any amounts payable by the Company or the counterparty would be dependent on the market value of the underlying option contracts. The Company’s current rating doesn't allow any counterparty the right to terminate ISDA agreements. In certain transactions, the Company and the counterparty have entered into a collateral support agreement requiring either party to post collateral when the net exposures exceed pre-determined thresholds. For all counterparties, except one, this threshold is set to zero. As of
December 31, 2019
and
December 31, 2018
, counterparties posted
$
489
and
$
59
of collateral, respectively, of which
$
446
and
$
59
, respectively, is included in "Cash and cash equivalents" with an associated payable for this collateral included in "Other liabilities" on the
Consolidated Balance Sheets
. The remaining
$
43
and
$
0
, respectively, of non-cash collateral was held by a third-party custodian and may not be sold or re-pledged, except in the event of default, and, therefore, is not included in the Company's
Consolidated Balance Sheets
at
December 31, 2019
and
December 31, 2018
, respectively. This collateral generally consists of U.S. treasury bonds and agency mortgage-backed securities ("Agency MBS"). Accordingly, the maximum amount of loss due to credit risk that the Company would incur if parties to the call options failed completely to perform according to the terms of the contracts was
$
101
and
$
38
at
December 31, 2019
and
December 31, 2018
, respectively.
The Company is required to pay counterparties the effective federal funds rate each day for cash collateral posted to FGL for daily mark to market margin changes. The Company reinvests derivative cash collateral to reduce the interest cost. Cash collateral is invested in overnight investment sweep products which are included in "Cash and cash equivalents" in the
Consolidated Balance Sheets
.
The Company held
879
and
664
futures contracts at
December 31, 2019
and
December 31, 2018
, respectively. The fair value of the futures contracts represents the cumulative unsettled variation margin (open trade equity, net of cash settlements). The Company provides cash collateral to the counterparties for the initial and variation margin on the futures contracts which is included in "Cash and cash equivalents" in the
Consolidated Balance Sheets
. The amount of cash collateral held by the counterparties for such contracts was
$
5
and
$
3
at
December 31, 2019
and
December 31, 2018
, respectively.
Preferred Equity Remarketing Reimbursement Embedded Derivative Liability
On November 30, 2017 the Company issued
275,000
Series A cumulative preferred shares and
100,000
Series B cumulative preferred shares (together the “Preferred Shares”). The Preferred Shares do not have a maturity date and are non-callable for the first
five years
.
From and after November 30, 2022, the original holders of the Preferred Shares may request and thus require, the Company (subject to customary blackout provisions) to remarket the Preferred Shares on their existing terms. If the remarketing is successful and the original holders elect to sell their preferred shares at the remarketed price and proceeds from such sale are less than the outstanding balance of the applicable shares (including dividends paid in kind and accumulated but unpaid dividends), the Company will be required to reimburse the sellers, up to a maximum of
10
%
of the par value of the originally issued preferred shares (including dividends paid in kind and accumulated but unpaid dividends) with such amount payable either in cash, ordinary shares, or any combination thereof, at the Company's option (the “Reimbursement Feature”). The Reimbursement Feature represents an embedded derivative that is not clearly and closely related to the preferred stock host and must be bifurcated. The Reimbursement Feature liability is held at fair value within “Other liabilities” in the accompanying Consolidated Balance Sheets and it is determined using a Black Derman Toy model incorporating among other things the paid in kind dividend coupon rate and the Company’s call option. Changes in fair value of this derivative are recognized within “Acquisition and operating expenses, net of deferrals” in the accompanying Consolidated Statements of Operations.
Reinsurance Related Embedded Derivatives
FGL Insurance entered into a reinsurance agreement with Kubera effective December 31, 2018, to cede certain MYGA and deferred annuity statutory reserve on a coinsurance funds withheld basis, net of applicable existing reinsurance. This arrangement creates an obligation for FGL Insurance to pay Kubera at a later date, which results in an embedded derivative. This embedded derivative is considered a total return swap with contractual returns that are attributable to the assets and liabilities associated with this reinsurance arrangement. The fair value
F-42
of the total return swap is based on the change in fair value of the underlying assets held in the funds withheld portfolio. Investment results for the assets that support the coinsurance with funds withheld reinsurance arrangement, including gains and losses from sales, were passed directly to the reinsurer pursuant to contractual terms of the reinsurance arrangement. The reinsurance related embedded derivative is reported in “Other assets” if in a net gain position, or “Other liabilities”, if in a net loss position, on the
Consolidated Balance Sheets
and the related gains or losses are reported in “Net investment gains (losses)” on the
Consolidated Statements of Operations
.
In the predecessor periods, FGL Insurance had a funds withheld coinsurance arrangement with FSRC, meaning that funds were withheld by FGL Insurance. This arrangement resulted in an embedded derivative in predecessor periods, similar to the embedded derivative described above related to the Kubera agreement. Due to the acquisition of FSRC, the reinsurance related embedded derivative is eliminated in consolidation in the periods after December 1, 2017.
F-43
(6)
Fair Value of Financial Instruments
The Company’s measurement of fair value is based on assumptions used by market participants in pricing the asset or liability, which may include inherent risk, restrictions on the sale or use of an asset, or non-performance risk, which may include the Company’s own credit risk. The Company’s estimate of an exchange price is the price in an orderly transaction between market participants to sell the asset or transfer the liability (“exit price”) in the principal market, or the most advantageous market for that asset or liability in the absence of a principal market as opposed to the price that would be paid to acquire the asset or assume a liability (“entry price”). The Company categorizes financial instruments carried at fair value into a three-level fair value hierarchy, based on the priority of inputs to the respective valuation technique. The three-level hierarchy for fair value measurement is defined as follows:
Level 1
- Values are unadjusted quoted prices for identical assets and liabilities in active markets accessible at the measurement date.
Level 2
- Inputs include quoted prices for similar assets or liabilities in active markets, quoted prices from those willing to trade in markets that are not active, or other inputs that are observable or can be corroborated by market data for the term of the instrument. Such inputs include market interest rates and volatilities, spreads, and yield curves.
Level 3
- Certain inputs are unobservable (supported by little or no market activity) and significant to the fair value measurement. Unobservable inputs reflect the Company’s best estimate of what hypothetical market participants would use to determine a transaction price for the asset or liability at the reporting date based on the best information available in the circumstances.
In certain cases, the inputs used to measure fair value may fall into different levels of the fair value hierarchy. In such cases, an investment’s level within the fair value hierarchy is based on the lowest level of input that is significant to the fair value measurement. The Company’s assessment of the significance of a particular input to the fair value measurement in its entirety requires judgment and considers factors specific to the investment.
When a determination is made to classify an asset or liability within Level 3 of the fair value hierarchy, the determination is based upon the significance of the unobservable inputs to the overall fair value measurement. Because certain securities trade in less liquid or illiquid markets with limited or no pricing information, the determination of fair value for these securities is inherently more difficult. In addition to the unobservable inputs, Level 3 fair value investments may include observable components, which are components that are actively quoted or can be validated to market-based sources.
F-44
The carrying amounts and estimated fair values of the Company’s financial instruments for which the disclosure of fair values is required, including financial assets and liabilities measured and carried at fair value on a recurring basis, with the exception of investment contracts, related party loans, portions of other invested assets and debt which are disclosed later within this footnote, was summarized according to the hierarchy previously described, as follows:
|
December 31, 2019
|
|||||||||||||||||||
|
Level 1
|
Level 2
|
Level 3
|
Fair Value
|
Carrying Amount
|
|||||||||||||||
|
Assets
|
|||||||||||||||||||
|
Cash and cash equivalents
|
$
|
|
|
$
|
|
|
$
|
|
|
$
|
|
|
$
|
|
|
||||
|
Fixed maturity securities, available-for-sale:
|
|||||||||||||||||||
|
Asset-backed securities
|
|
|
|
|
|
|
|
|
|
|
|||||||||
|
Commercial mortgage-backed securities
|
|
|
|
|
|
|
|
|
|
|
|||||||||
|
Corporates
|
|
|
|
|
|
|
|
|
|
|
|||||||||
|
Hybrids
|
|
|
|
|
|
|
|
|
|
|
|||||||||
|
Municipals
|
|
|
|
|
|
|
|
|
|
|
|||||||||
|
Residential mortgage-backed securities
|
|
|
|
|
|
|
|
|
|
|
|||||||||
|
U.S. Government
|
|
|
|
|
|
|
|
|
|
|
|||||||||
|
Foreign Governments
|
|
|
|
|
|
|
|
|
|
|
|||||||||
|
Equity securities
|
|
|
|
|
|
|
|
|
|
|
|||||||||
|
Derivative investments
|
|
|
|
|
|
|
|
|
|
|
|||||||||
|
Other invested assets
|
|
|
|
|
|
|
|
|
|
|
|||||||||
|
Funds withheld for reinsurance receivables, at fair value
|
|
|
|
|
|
|
|
|
|
|
|||||||||
|
Total financial assets at fair value
|
$
|
|
|
$
|
|
|
$
|
|
|
$
|
|
|
$
|
|
|
||||
|
Liabilities
|
|||||||||||||||||||
|
Fair value of future policy benefits
|
|
|
|
|
|
|
|
|
|
|
|||||||||
|
Derivatives:
|
|||||||||||||||||||
|
FIA embedded derivatives, included in contractholder funds
|
$
|
|
|
$
|
|
|
$
|
|
|
$
|
|
|
$
|
|
|
||||
|
Reinsurance related embedded derivative, included in other liabilities
|
|
|
|
|
|
|
|
|
|
|
|||||||||
|
Preferred shares reimbursement feature embedded derivative
|
|
|
|
|
|
|
|
|
|
|
|||||||||
|
Total financial liabilities at fair value
|
$
|
|
|
$
|
|
|
$
|
|
|
$
|
|
|
$
|
|
|
||||
F-45
|
December 31, 2018
|
|||||||||||||||||||
|
Level 1
|
Level 2
|
Level 3
|
Fair Value
|
Carrying Amount
|
|||||||||||||||
|
Assets
|
|||||||||||||||||||
|
Cash and cash equivalents
|
$
|
|
|
$
|
|
|
$
|
|
|
$
|
|
|
$
|
|
|
||||
|
Fixed maturity securities, available-for-sale:
|
|||||||||||||||||||
|
Asset-backed securities
|
|
|
|
|
|
|
|
|
|
|
|||||||||
|
Commercial mortgage-backed securities
|
|
|
|
|
|
|
|
|
|
|
|||||||||
|
Corporates
|
|
|
|
|
|
|
|
|
|
|
|||||||||
|
Hybrids
|
|
|
|
|
|
|
|
|
|
|
|||||||||
|
Municipals
|
|
|
|
|
|
|
|
|
|
|
|||||||||
|
Residential mortgage-backed securities
|
|
|
|
|
|
|
|
|
|
|
|||||||||
|
U.S. Government
|
|
|
|
|
|
|
|
|
|
|
|||||||||
|
Foreign Governments
|
|
|
|
|
|
|
|
|
|
|
|||||||||
|
Equity securities
|
|
|
|
|
|
|
|
|
|
|
|||||||||
|
Derivative investments
|
|
|
|
|
|
|
|
|
|
|
|||||||||
|
Other invested assets
|
|
|
|
|
|
|
|
|
|
|
|||||||||
|
Funds withheld for reinsurance receivables, at fair value
|
|
|
|
|
|
|
|
|
|
|
|||||||||
|
Total financial assets at fair value
|
$
|
|
|
$
|
|
|
$
|
|
|
$
|
|
|
$
|
|
|
||||
|
Liabilities
|
|||||||||||||||||||
|
Fair value of future policy benefits
|
|
|
|
|
|
|
|
|
|
|
|||||||||
|
Derivatives:
|
|||||||||||||||||||
|
FIA embedded derivatives, included in contractholder funds
|
|
|
|
|
|
|
|
|
|
|
|||||||||
|
Preferred shares reimbursement feature embedded derivative
|
|
|
|
|
|
|
|
|
|
|
|||||||||
|
Total financial liabilities at fair value
|
$
|
|
|
$
|
|
|
$
|
|
|
$
|
|
|
$
|
|
|
||||
Fixed Maturity Securities & Equity Securities
The Company measures the fair value of its securities based on assumptions used by market participants in pricing the security. The most appropriate valuation methodology is selected based on the specific characteristics of the fixed maturity or equity security, and the Company will then consistently apply the valuation methodology to measure the security’s fair value. The Company's fair value measurement is based on a market approach, which utilizes prices and other relevant information generated by market transactions involving identical or comparable securities. Sources of inputs to the market approach include third-party pricing services, independent broker quotations, or pricing matrices. The Company uses observable and unobservable inputs in its valuation methodologies. Observable inputs include benchmark yields, reported trades, broker-dealer quotes, issuer spreads, two-sided markets, benchmark securities, bids, offers, and reference data. In addition, market indicators and industry and economic events are monitored and further market data will be acquired when certain thresholds are met.
For certain security types, additional inputs may be used, or some of the inputs described above may not be applicable. The significant input used in the fair value measurement of equity securities for which the market approach valuation technique is employed is yield for comparable securities. Increases or decreases in the yields would result in lower or higher, respectively, fair value measurements. To estimate the fair value of fixed maturity securities classified as level 3 in the fair value hierarchy the Company primarily uses prices from independent broker quotes. For broker-quoted only securities, quotes from market makers or broker-dealers are obtained from sources recognized to be market participants. Management believes the broker quotes are prices at which trades could be executed based on historical trades executed at broker-quoted or slightly higher prices. The Company does analyze the third-party valuation methodologies and related inputs to perform assessments and to determine the appropriate level within the fair value hierarchy. The Company did not adjust prices received from third parties as of
December 31, 2019
or
December 31, 2018
.
The Company has an equity investment in a private business development company which is not traded on an exchange or valued by other sources such as analytics or brokers. The Company based the fair value of this investment on an estimated net asset value provided by the investee. Management did not make any adjustments to this valuation.
F-46
Derivative Financial Instruments
The fair value of call option assets represents what the Company would expect to receive or pay at the balance sheet date if it canceled the options, entered into offsetting positions, or exercised the options. Fair values for these instruments are determined internally, based on industry accepted valuation pricing models which use market-observable inputs, including interest rates, yield curve volatilities, and other factors.
The fair value of futures contracts represents the cumulative unsettled variation margin (open trade equity, net of cash settlements) which represents what the Company would expect to receive or pay at the balance sheet date if it canceled the contracts or entered into offsetting positions. These contracts are classified as Level 1.
The fair value measurement of the FIA embedded derivatives included in contractholder funds is determined through a combination of market observable information and significant unobservable inputs using the option budget method. The market observable inputs are the market value of option and interest swap rates. The significant unobservable inputs are the budgeted option cost (i.e., the expected cost to purchase call options in future periods to fund the equity indexed linked feature), surrender rates, mortality multiplier, and non-performance spread. The mortality multiplier at
December 31, 2019
and
December 31, 2018
was applied to the Annuity 2000 mortality tables. Increases or decreases in the market value of an option in isolation would result in a higher or lower, respectively, fair value measurement. Increases or decreases in interest swap rates, mortality multiplier, surrender rates, or non-performance spread in isolation would result in a lower or higher fair value measurement, respectively. Generally, a change in any one unobservable input would not directly result in a change in any other unobservable input.
The fair value of the reinsurance-related embedded derivative in the funds withheld reinsurance agreement with Kubera is estimated based upon the fair value of the assets supporting the funds withheld from reinsurance liabilities. The fair value of the assets is based on a quoted market price of similar assets (Level 2), and therfore the fair value of the embedded derivative is based on market-observable inputs and classified as Level 2.
The fair value of the Reimbursement Feature is determined using a Black Derman Toy model, incorporating the paid in kind dividend coupon, the Company's redemption option and the preferred shareholder's remarketing feature. The remarketing feature allows the shareholder to put the preferred shares to the Company for a value of par after
five years
and, if after a successful remarketing event the amount is less than
90
%
par, up to a maximum of 10% of liquidation price defined. Fair value of this derivative liability
decreased
$
13
during the year ended
December 31, 2019
and increased
$
6
during the year ended December 31, 2018, due primarily to changes in the credit spread applied in the discount rate.
Other Invested Assets
Fair value of the AnchorPath embedded derivative is based on an unobservable input, the net asset value of the AnchorPath fund at the balance sheet date. The embedded derivative is similar to a call option on the net asset value of the AnchorPath fund with a strike price of
zero
since FGL Insurance will not be required to make any additional payments at maturity of the fund-linked note in order to receive the net asset value of the AnchorPath fund on the maturity date. A Black-Scholes model determines the net asset value of the AnchorPath fund as the fair value of the call option regardless of the values used for the other inputs to the option pricing model. The net asset value of the AnchorPath fund is provided by the fund manager at the end of each calendar month and represents the value an investor would receive if it withdrew its investment on the balance sheet date. Therefore, the key unobservable input used in the Black-Scholes model is the value of the AnchorPath fund. As the value of the AnchorPath fund increases or decreases, the fair value of the embedded derivative will increase or decrease.
FSRC and F&G Re Funds Withheld for Reinsurance Receivables and Future Policy Benefits
FSRC and F&G Re elected to apply the Fair Value Option to account for its funds withheld receivables and future policy benefits liability related to its assumed reinsurance. FSRC and F&G Re measures the fair value of the Funds Withheld for Reinsurance Receivables based on the fair values of the securities in the underlying funds withheld portfolio held by the cedant. FSRC and F&G Re use a discounted cash flows approach to measure the fair value of the Future Policy Benefits Reserve. The cash flows associated with future policy premiums and benefits are generated using best estimate assumptions. Included in the cash flows within the fair value for the reinsurance liabilities is a risk premium, which represents compensation a market participant would demand for uncertainty.
The significant unobservable inputs used in the fair value measurement of the FSRC and F&G Re future policy benefit liability are undiscounted cash flows (which are determined using actuarial assumptions related to lapses, surrenders, mortality, partial withdrawals and morbidity), non-performance risk spread and risk margin to reflect uncertainty. Undiscounted cash flows used in our
December 31, 2019
and December 31, 2018 discounted cash flow models equaled $
2,569
and
$
1,199
, respectively. Increases or decreases in non-performance risk spread and risk margin to reflect uncertainty would result in a lower or higher fair value measurement, respectively.
F-47
Quantitative information regarding significant unobservable inputs used for recurring Level 3 fair value measurements of financial instruments carried at fair value as of
December 31, 2019
and
December 31, 2018
are as follows:
|
Fair Value at
|
Range (Weighted average)
|
|||||||||
|
December 31, 2019
|
Valuation Technique
|
Unobservable Input(s)
|
December 31, 2019
|
|||||||
|
Assets
|
||||||||||
|
Asset-backed securities
|
$
|
|
|
Broker-quoted
|
Offered quotes
|
98.65% - 119.35%
(102.02%) |
||||
|
Asset-backed securities
|
|
|
Third-Party Valuation
|
Offered quotes
|
0.00% - 99.43%
(35.96%) |
|||||
|
Commercial mortgage-backed securities
|
|
|
Broker-quoted
|
Offered quotes
|
100.15% - 127.60%
(126.82%) |
|||||
|
Corporates
|
|
|
Broker-quoted
|
Offered quotes
|
83.51% - 106.73%
(99.56%) |
|||||
|
Corporates
|
|
|
Third-Party Valuation
|
Offered quotes
|
98.58% - 119.44%
(105.06%) |
|||||
|
Hybrids
|
|
|
Third-Party Valuation
|
Offered quotes
|
104.72% - 104.72%
(104.72%) |
|||||
|
Municipals
|
|
|
Third-Party Valuation
|
Offered quotes
|
127.68% - 127.68%
(127.68%) |
|||||
|
Residential mortgage-backed securities
|
|
|
Broker-quoted
|
Offered quotes
|
0.00% - 106.50%
(106.28%) |
|||||
|
Foreign governments
|
|
|
Third-Party Valuation
|
Offered quotes
|
110.12% - 118.09%
(112.61%) |
|||||
|
Equity securities (Salus preferred equity)
|
|
|
Income-Approach
|
Yield
|
2.47%
|
|||||
|
Other invested assets:
|
||||||||||
|
Available-for-sale embedded derivative (AnchorPath)
|
|
|
Black Scholes model
|
Market value of AnchorPath fund
|
100.00%
|
|||||
|
Credit linked note
|
|
|
Broker-quoted
|
Offered quotes
|
100.00%
|
|||||
|
Funds withheld for reinsurance receivables at fair value
|
|
|
Broker-quoted
|
Offered quotes
|
100.00%
|
|||||
|
Total
|
$
|
|
|
|||||||
|
Liabilities
|
||||||||||
|
Future policy benefits
|
$
|
|
|
Discounted cash flow
|
Market value of option
|
0.00% - 11.20% (2.50%)
|
||||
|
Mortality multiplier
|
80.00% - 120.00% (95.46%)
|
|||||||||
|
Surrender rates
|
0.00% - 55.00% (21.18%)
|
|||||||||
|
Partial withdrawals
|
0.00% - 4.00% (2.28%)
|
|||||||||
|
Non-performance spread
|
0.00% - 0.08% (0.03%)
|
|||||||||
|
Option cost
|
0.00% - 5.02% (1.28%)
|
|||||||||
|
Risk margin to reflect uncertainty
|
0.23% - 0.96% (0.34%)
|
|||||||||
|
Morbidity risk margin
|
0.00% - 2.00% (0.07%)
|
|||||||||
|
Derivatives:
|
||||||||||
|
FIA embedded derivatives included in contractholder funds
|
|
|
Discounted cash flow
|
Market value of option
|
0.00% - 32.54%
(3.64%) |
|||||
|
SWAP rates
|
1.73% - 1.90%
(1.81%) |
|||||||||
|
Mortality multiplier
|
80.00% - 80.00%
(80.00%) |
|||||||||
|
Surrender rates
|
0.50% - 75.00%
(5.64%) |
|||||||||
F-48
|
Partial withdrawals
|
2.00% - 3.50%
(2.53%) |
|||||||||
|
Non-performance spread
|
0.25% - 0.25%
(0.25%) |
|||||||||
|
Option cost
|
0.18% - 16.61%
(2.12%) |
|||||||||
|
Preferred shares reimbursement feature embedded derivative
|
|
|
Black Derman Toy model
|
Credit Spread
|
3.81%
|
|||||
|
Yield Volatility
|
20.00%
|
|||||||||
|
Total liabilities at fair value
|
$
|
|
|
|||||||
F-49
|
Fair Value at
|
Range (Weighted average)
|
|||||||||
|
December 31, 2018
|
Valuation Technique
|
Unobservable Input(s)
|
December 31, 2018
|
|||||||
|
Assets
|
||||||||||
|
Asset-backed securities
|
$
|
|
|
Broker-quoted
|
Offered quotes
|
97.00% - 102.00% (99.77%)
|
||||
|
Asset-backed securities
|
|
|
Matrix Pricing
|
Quoted prices
|
96.07% - 96.07% (96.07%)
|
|||||
|
Asset-backed securities
|
|
|
Third-Party Valuation
|
Offered quotes
|
0.00% - 99.29% (23.05%)
|
|||||
|
Commercial mortgage-backed securities
|
|
|
Broker-quoted
|
Offered quotes
|
77.12% - 100.08% (85.46%)
|
|||||
|
Commercial mortgage-backed securities
|
|
|
Matrix Pricing
|
Quoted prices
|
117.72% - 117.72% (117.72%)
|
|||||
|
Corporates
|
|
|
Broker-quoted
|
Offered quotes
|
74.63% - 104.62% (97.80%)
|
|||||
|
Corporates
|
|
|
Matrix Pricing
|
Quoted prices
|
91.74% - 113.25% (98.86%)
|
|||||
|
Hybrids
|
|
|
Matrix Pricing
|
Quoted prices
|
96.60% - 96.60% (96.60%)
|
|||||
|
Municipals
|
|
|
Broker-quoted
|
Offered quotes
|
111.23% - 111.23% (111.23%)
|
|||||
|
Residential mortgage-backed securities
|
|
|
Broker-quoted
|
Offered quotes
|
89.80% - 100.99% (100.73%)
|
|||||
|
Foreign governments
|
|
|
Broker-quoted
|
Offered quotes
|
98.38% - 99.01% (98.58%)
|
|||||
|
Equity securities (Salus preferred equity)
|
|
|
Income-Approach
|
Yield
|
7.15%
|
|||||
|
Other invested assets:
|
||||||||||
|
Available-for-sale embedded derivative (AnchorPath)
|
|
|
Black Scholes model
|
Market value of AnchorPath fund
|
100.00%
|
|||||
|
Credit linked note
|
|
|
Broker-quoted
|
Offered quotes
|
100.00%
|
|||||
|
Funds withheld for reinsurance receivables, at fair value
|
|
|
Matrix pricing
|
Calculated prices
|
100.00%
|
|||||
|
Total
|
$
|
|
|
|||||||
|
Liabilities
|
||||||||||
|
Future policy benefits
|
$
|
|
|
Discounted cash flow
|
Non-Performance risk spread
|
0.00% - 0.22% (0.18%)
|
||||
|
Risk margin to reflect uncertainty
|
0.35% - 0.71% (0.68%)
|
|||||||||
|
Derivatives:
|
||||||||||
|
FIA embedded derivatives included in contractholder funds
|
$
|
|
|
Discounted cash flow
|
Market value of option
|
0.00% - 31.06% (0.94%)
|
||||
|
SWAP rates
|
2.57% - 2.71% (2.63%)
|
|||||||||
|
Mortality multiplier
|
80.00% - 80.00% (80.00%)
|
|||||||||
|
Surrender rates
|
0.50% - 75.00% (5.90%)
|
|||||||||
|
Partial withdrawals
|
1.00% - 2.50% (2.00%)
|
|||||||||
|
Non-performance spread
|
0.25% - 0.25% (0.25%)
|
|||||||||
|
Option cost
|
0.11% - 16.61% (2.18%)
|
|||||||||
|
Preferred shares reimbursement feature embedded derivative
|
$
|
|
|
Black Derman Toy model
|
Credit Spread
|
5.14%
|
||||
|
Yield Volatility
|
20.00%
|
|||||||||
|
Total liabilities at fair value
|
$
|
|
|
|||||||
F-50
|
Year ended December 31, 2019
|
|||||||||||||||||||||||||||||||
|
Balance at Beginning
of Period |
Total Gains (Losses)
|
Purchases
|
Sales
|
Settlements
|
Net transfer In (Out) of
Level 3 (a) |
Balance at End of
Period |
|||||||||||||||||||||||||
|
Included in
Earnings |
Included in
AOCI |
||||||||||||||||||||||||||||||
|
Assets
|
|||||||||||||||||||||||||||||||
|
Fixed maturity securities available-for-sale:
|
|||||||||||||||||||||||||||||||
|
Asset-backed securities
|
$
|
|
|
$
|
|
|
$
|
|
|
$
|
|
|
$
|
|
|
$
|
(
|
)
|
$
|
(
|
)
|
$
|
|
|
|||||||
|
Commercial mortgage-backed securities
|
|
|
|
|
|
|
|
|
|
|
(
|
)
|
(
|
)
|
|
|
|||||||||||||||
|
Corporates
|
|
|
|
|
|
|
|
|
(
|
)
|
(
|
)
|
|
|
|
|
|||||||||||||||
|
Hybrids
|
|
|
|
|
|
|
|
|
|
|
|
|
|
|
|
|
|||||||||||||||
|
Municipals
|
|
|
|
|
|
|
|
|
|
|
|
|
|
|
|
|
|||||||||||||||
|
Residential mortgage-backed securities
|
|
|
|
|
|
|
|
|
|
|
(
|
)
|
(
|
)
|
|
|
|||||||||||||||
|
Foreign governments
|
|
|
|
|
|
|
|
|
|
|
|
|
|
|
|
|
|||||||||||||||
|
Equity securities
|
|
|
(
|
)
|
(
|
)
|
|
|
|
|
|
|
|
|
|
|
|||||||||||||||
|
Other invested assets:
|
|||||||||||||||||||||||||||||||
|
Available-for-sale embedded derivative
|
|
|
|
|
|
|
|
|
|
|
|
|
|
|
|
|
|||||||||||||||
|
Credit linked note
|
|
|
|
|
|
|
|
|
|
|
|
|
|
|
|
|
|||||||||||||||
|
Funds withheld for reinsurance receivables, at fair value
|
|
|
|
|
|
|
|
|
(
|
)
|
|
|
(
|
)
|
|
|
|||||||||||||||
|
Total assets at Level 3 fair value
|
$
|
|
|
$
|
|
|
$
|
|
|
$
|
|
|
$
|
(
|
)
|
$
|
(
|
)
|
$
|
(
|
)
|
$
|
|
|
|||||||
|
Liabilities
|
|||||||||||||||||||||||||||||||
|
FIA embedded derivatives, included in contractholder funds
|
$
|
|
|
$
|
|
|
$
|
|
|
$
|
|
|
$
|
|
|
$
|
|
|
$
|
|
|
$
|
|
|
|||||||
|
Future policy benefits (F&G Re and FSRC)
|
|
|
|
|
|
|
|
|
|
|
|
|
|
|
|
|
|||||||||||||||
|
Preferred shares reimbursement feature embedded derivative
|
|
|
(
|
)
|
|
|
|
|
|
|
|
|
|
|
|
|
|||||||||||||||
|
Total liabilities at Level 3 fair value
|
$
|
|
|
$
|
|
|
$
|
|
|
$
|
|
|
$
|
|
|
$
|
|
|
$
|
|
|
$
|
|
|
|||||||
(a) The net transfers out of Level 3 during the year ended December 31, 2019 were exclusively to Level 2.
F-51
|
Year ended December 31, 2018
|
|||||||||||||||||||||||||||||||
|
Balance at Beginning
of Period |
Total Gains (Losses)
|
Purchases
|
Sales
|
Settlements
|
Net transfer In (Out) of
Level 3 (a) |
Balance at End of
Period |
|||||||||||||||||||||||||
|
Included in
Earnings |
Included in
AOCI |
||||||||||||||||||||||||||||||
|
Assets
|
|||||||||||||||||||||||||||||||
|
Fixed maturity securities available-for-sale:
|
|||||||||||||||||||||||||||||||
|
Asset-backed securities
|
$
|
|
|
$
|
|
|
$
|
(
|
)
|
$
|
|
|
$
|
|
|
$
|
(
|
)
|
$
|
(
|
)
|
$
|
|
|
|||||||
|
Commercial mortgage-backed securities
|
|
|
|
|
(
|
)
|
|
|
|
|
(
|
)
|
(
|
)
|
|
|
|||||||||||||||
|
Corporates
|
|
|
|
|
(
|
)
|
|
|
|
|
(
|
)
|
(
|
)
|
|
|
|||||||||||||||
|
Hybrids
|
|
|
|
|
|
|
|
|
|
|
|
|
|
|
|
|
|||||||||||||||
|
Municipals
|
|
|
|
|
(
|
)
|
|
|
|
|
|
|
|
|
|
|
|||||||||||||||
|
Residential mortgage-backed securities
|
|
|
|
|
|
|
|
|
(
|
)
|
(
|
)
|
(
|
)
|
|
|
|||||||||||||||
|
Foreign governments
|
|
|
|
|
(
|
)
|
|
|
|
|
|
|
|
|
|
|
|||||||||||||||
|
Equity securities
|
|
|
|
|
|
|
|
|
|
|
|
|
|
|
|
|
|||||||||||||||
|
Other invested assets:
|
|||||||||||||||||||||||||||||||
|
Available-for-sale embedded derivative
|
|
|
(
|
)
|
|
|
|
|
|
|
|
|
|
|
|
|
|||||||||||||||
|
Credit linked note
|
|
|
|
|
|
|
|
|
|
|
|
|
|
|
|
|
|||||||||||||||
|
Funds withheld for reinsurance receivables, at fair value
|
|
|
|
|
|
|
|
|
|
|
(
|
)
|
(
|
)
|
|
|
|||||||||||||||
|
Total assets at Level 3 fair value
|
$
|
|
|
$
|
(
|
)
|
$
|
(
|
)
|
$
|
|
|
$
|
(
|
)
|
$
|
(
|
)
|
|
$
|
(
|
)
|
$
|
|
|
||||||
|
Liabilities
|
|||||||||||||||||||||||||||||||
|
FIA embedded derivatives, included in contractholder funds
|
$
|
|
|
$
|
|
|
$
|
|
|
$
|
|
|
$
|
|
|
$
|
|
|
$
|
|
|
$
|
|
|
|||||||
|
Future policy benefits (F&G Re and FSRC)
|
|
|
(
|
)
|
(
|
)
|
|
|
|
|
|
|
|
|
|
|
|||||||||||||||
|
Preferred shares reimbursement feature embedded derivative
|
|
|
|
|
|
|
|
|
|
|
|
|
|
|
|
|
|||||||||||||||
|
Total liabilities at Level 3 fair value
|
$
|
|
|
$
|
|
|
$
|
(
|
)
|
$
|
|
|
$
|
|
|
$
|
|
|
$
|
|
|
$
|
|
|
|||||||
(a) The net transfers out of Level 3 during the year ended December 31, 2018 were exclusively to Level 2.
F-52
|
Period from December 1 to December 31, 2017
|
|||||||||||||||||||||||||||||||
|
Balance at Beginning
of Period |
Total Gains (Losses)
|
Purchases
|
Sales
|
Settlements
|
Net transfer In (Out) of
Level 3 (a) |
Balance at End of
Period |
|||||||||||||||||||||||||
|
Included in
Earnings |
Included in
AOCI |
||||||||||||||||||||||||||||||
|
Assets
|
|||||||||||||||||||||||||||||||
|
Fixed maturity securities available-for-sale:
|
|||||||||||||||||||||||||||||||
|
Asset-backed securities
|
$
|
|
|
$
|
|
|
$
|
|
|
$
|
|
|
$
|
|
|
$
|
(
|
)
|
$
|
|
|
$
|
|
|
|||||||
|
Commercial mortgage-backed securities
|
|
|
|
|
|
|
|
|
|
|
|
|
|
|
|
|
|||||||||||||||
|
Corporates
|
|
|
|
|
|
|
|
|
(
|
)
|
(
|
)
|
|
|
|
|
|||||||||||||||
|
Hybrids
|
|
|
|
|
|
|
|
|
|
|
|
|
|
|
|
|
|||||||||||||||
|
Municipals
|
|
|
|
|
|
|
|
|
|
|
|
|
|
|
|
|
|||||||||||||||
|
Residential mortgage-backed securities
|
|
|
|
|
|
|
|
|
|
|
(
|
)
|
|
|
|
|
|||||||||||||||
|
Foreign governments
|
|
|
|
|
|
|
|
|
|
|
|
|
|
|
|
|
|||||||||||||||
|
Equity securities
|
|
|
|
|
|
|
|
|
|
|
|
|
(
|
)
|
|
|
|||||||||||||||
|
Other invested assets:
|
|||||||||||||||||||||||||||||||
|
Available-for-sale embedded derivative
|
|
|
|
|
|
|
|
|
|
|
|
|
|
|
|
|
|||||||||||||||
|
HGI Energy Note
|
|
|
|
|
|
|
|
|
(
|
)
|
|
|
|
|
|
|
|||||||||||||||
|
Funds withheld for reinsurance receivables, at fair value
|
|
|
|
|
|
|
|
|
|
|
|
|
|
|
|
|
|||||||||||||||
|
Total assets at Level 3 fair value
|
$
|
|
|
$
|
|
|
$
|
|
|
$
|
|
|
$
|
(
|
)
|
$
|
(
|
)
|
$
|
|
|
$
|
|
|
|||||||
|
Liabilities
|
|||||||||||||||||||||||||||||||
|
FIA embedded derivatives, included in contractholder funds
|
$
|
|
|
$
|
(
|
)
|
$
|
|
|
$
|
|
|
$
|
|
|
$
|
|
|
$
|
|
|
$
|
|
|
|||||||
|
Future policy benefits (FSRC)
|
|
|
|
|
|
|
|
|
|
|
(
|
)
|
|
|
|
|
|||||||||||||||
|
Preferred shares reimbursement feature embedded derivative
|
|
|
|
|
|
|
|
|
|
|
|
|
|
|
|
|
|||||||||||||||
|
Total liabilities at Level 3 fair value
|
$
|
|
|
$
|
(
|
)
|
$
|
|
|
$
|
|
|
$
|
|
|
$
|
(
|
)
|
$
|
|
|
$
|
|
|
|||||||
(a) The net transfers out of Level 3 during the period from December 1 to December 31, 2017 were exclusively to Level 2.
F-53
|
Period from October 1 to November 30, 2017
|
|||||||||||||||||||||||||||||||
|
Predecessor
|
|||||||||||||||||||||||||||||||
|
Balance at Beginning
of Period |
Total Gains (Losses)
|
Purchases
|
Sales
|
Settlements
|
Net transfer In (Out) of
Level 3 (a) |
Balance at End of
Period |
|||||||||||||||||||||||||
|
Included in
Earnings |
Included in
AOCI |
||||||||||||||||||||||||||||||
|
Assets
|
|||||||||||||||||||||||||||||||
|
Fixed maturity securities available-for-sale:
|
|||||||||||||||||||||||||||||||
|
Asset-backed securities
|
$
|
|
|
$
|
|
|
$
|
|
|
$
|
|
|
$
|
|
|
$
|
|
|
$
|
(
|
)
|
$
|
|
|
|||||||
|
Commercial mortgage-backed securities
|
|
|
|
|
(
|
)
|
|
|
|
|
|
|
(
|
)
|
|
|
|||||||||||||||
|
Corporates
|
|
|
|
|
|
|
|
|
|
|
(
|
)
|
|
|
|
|
|||||||||||||||
|
Hybrids
|
|
|
|
|
|
|
|
|
|
|
|
|
|
|
|
|
|||||||||||||||
|
Municipals
|
|
|
|
|
|
|
|
|
|
|
|
|
|
|
|
|
|||||||||||||||
|
Residential mortgage-backed securities
|
|
|
|
|
|
|
|
|
|
|
|
|
|
|
|
|
|||||||||||||||
|
Foreign governments
|
|
|
|
|
|
|
|
|
|
|
|
|
|
|
|
|
|||||||||||||||
|
Equity securities
|
|
|
|
|
|
|
|
|
|
|
|
|
|
|
|
|
|||||||||||||||
|
Other invested assets:
|
|||||||||||||||||||||||||||||||
|
Available-for-sale embedded derivative
|
|
|
|
|
|
|
|
|
|
|
|
|
|
|
|
|
|||||||||||||||
|
Total assets at Level 3 fair value
|
$
|
|
|
$
|
|
|
$
|
|
|
$
|
|
|
$
|
|
|
$
|
(
|
)
|
$
|
(
|
)
|
$
|
|
|
|||||||
|
Liabilities
|
|||||||||||||||||||||||||||||||
|
FIA embedded derivatives, included in contractholder funds
|
$
|
|
|
$
|
(
|
)
|
$
|
|
|
$
|
|
|
$
|
|
|
$
|
|
|
$
|
|
|
$
|
|
|
|||||||
|
Total liabilities at Level 3 fair value
|
$
|
|
|
$
|
(
|
)
|
|
$
|
|
|
|
$
|
|
|
|
$
|
|
|
|
$
|
|
|
|
$
|
|
|
|
$
|
|
|
|
(a) The net transfers out of Level 3 during the Predecessor period from October 1 to November 30, 2017 were exclusively to Level 2.
F-54
|
Period from October 1 to December 31, 2016 (Unaudited)
|
|||||||||||||||||||||||||||||||
|
Predecessor
|
|||||||||||||||||||||||||||||||
|
Balance at Beginning
of Period |
Total Gains (Losses)
|
Purchases
|
Sales
|
Settlements
|
Net transfer In (Out) of
Level 3 (a) |
Balance at End of
Period |
|||||||||||||||||||||||||
|
Included in
Earnings |
Included in
AOCI |
||||||||||||||||||||||||||||||
|
Assets
|
|||||||||||||||||||||||||||||||
|
Fixed maturity securities available-for-sale:
|
|||||||||||||||||||||||||||||||
|
Asset-backed securities
|
$
|
|
|
$
|
(
|
)
|
$
|
(
|
)
|
$
|
|
|
$
|
|
|
$
|
(
|
)
|
$
|
(
|
)
|
$
|
|
|
|||||||
|
Commercial mortgage-backed securities
|
|
|
|
|
(
|
)
|
|
|
|
|
|
|
|
|
|
|
|||||||||||||||
|
Corporates
|
|
|
(
|
)
|
(
|
)
|
|
|
(
|
)
|
(
|
)
|
|
|
|
|
|||||||||||||||
|
Hybrids
|
|
|
|
|
|
|
|
|
|
|
|
|
|
|
|
|
|||||||||||||||
|
Municipals
|
|
|
|
|
(
|
)
|
|
|
|
|
(
|
)
|
|
|
|
|
|||||||||||||||
|
Foreign governments
|
|
|
|
|
|
|
|
|
|
|
|
|
|
|
|
|
|||||||||||||||
|
Equity securities
|
|
|
(
|
)
|
|
|
|
|
|
|
|
|
|
|
|
|
|||||||||||||||
|
Other invested assets:
|
|||||||||||||||||||||||||||||||
|
Available-for-sale embedded derivative
|
|
|
|
|
|
|
|
|
|
|
|
|
|
|
|
|
|||||||||||||||
|
Loan participations
|
|
|
(
|
)
|
|
|
|
|
|
|
(
|
)
|
|
|
|
|
|||||||||||||||
|
Total assets at Level 3 fair value
|
$
|
|
|
$
|
(
|
)
|
$
|
(
|
)
|
$
|
|
|
$
|
(
|
)
|
$
|
(
|
)
|
$
|
(
|
)
|
$
|
|
|
|||||||
|
Liabilities
|
|||||||||||||||||||||||||||||||
|
FIA embedded derivatives, included in contractholder funds
|
$
|
|
|
$
|
(
|
)
|
$
|
|
|
$
|
|
|
$
|
|
|
$
|
|
|
$
|
|
|
$
|
|
|
|||||||
|
Total liabilities at Level 3 fair value
|
$
|
|
|
$
|
(
|
)
|
$
|
|
|
$
|
|
|
$
|
|
|
$
|
|
|
$
|
|
|
$
|
|
|
|||||||
(a) The net transfers out of Level 3 during the Predecessor period from October 1 to December 30, 2016 (unaudited) were exclusively to Level 2.
F-55
|
Year ended September 30, 2017
|
|||||||||||||||||||||||||||||||
|
Predecessor
|
|||||||||||||||||||||||||||||||
|
Balance at Beginning
of Period |
Total Gains (Losses)
|
Purchases
|
Sales
|
Settlements
|
Net transfer In (Out) of
Level 3 (a) |
Balance at End of
Period |
|||||||||||||||||||||||||
|
Included in
Earnings |
Included in
AOCI |
||||||||||||||||||||||||||||||
|
Assets
|
|||||||||||||||||||||||||||||||
|
Fixed maturity securities available-for-sale:
|
|||||||||||||||||||||||||||||||
|
Asset-backed securities
|
$
|
|
|
$
|
(
|
)
|
$
|
|
|
$
|
|
|
$
|
|
|
$
|
(
|
)
|
$
|
(
|
)
|
$
|
|
|
|||||||
|
Commercial mortgage-backed securities
|
|
|
|
|
|
|
|
|
|
|
(
|
)
|
(
|
)
|
|
|
|||||||||||||||
|
Corporates
|
|
|
(
|
)
|
(
|
)
|
|
|
(
|
)
|
(
|
)
|
(
|
)
|
|
|
|||||||||||||||
|
Hybrids
|
|
|
|
|
|
|
|
|
|
|
|
|
|
|
|
|
|||||||||||||||
|
Municipals
|
|
|
|
|
(
|
)
|
|
|
|
|
(
|
)
|
|
|
|
|
|||||||||||||||
|
Residential mortgage-backed securities
|
|
|
|
|
|
|
|
|
|
|
|
|
|
|
|
|
|||||||||||||||
|
Foreign governments
|
|
|
|
|
|
|
|
|
|
|
|
|
|
|
|
|
|||||||||||||||
|
Equity securities
|
|
|
(
|
)
|
|
|
|
|
|
|
|
|
|
|
|
|
|||||||||||||||
|
Other invested assets:
|
|||||||||||||||||||||||||||||||
|
Available-for-sale embedded derivative
|
|
|
|
|
|
|
|
|
|
|
|
|
|
|
|
|
|||||||||||||||
|
Loan participations
|
|
|
(
|
)
|
|
|
|
|
|
|
(
|
)
|
|
|
|
|
|||||||||||||||
|
Total assets at Level 3 fair value
|
$
|
|
|
$
|
(
|
)
|
$
|
(
|
)
|
$
|
|
|
$
|
(
|
)
|
$
|
(
|
)
|
$
|
(
|
)
|
$
|
|
|
|||||||
|
Liabilities
|
|||||||||||||||||||||||||||||||
|
FIA embedded derivatives, included in contractholder funds
|
$
|
|
|
$
|
|
|
$
|
|
|
$
|
|
|
$
|
|
|
$
|
|
|
$
|
|
|
$
|
|
|
|||||||
|
Total liabilities at Level 3 fair value
|
$
|
|
|
$
|
|
|
$
|
|
|
$
|
|
|
$
|
|
|
$
|
|
|
$
|
|
|
$
|
|
|
|||||||
|
(a)
|
The net transfers out of Level 3 during the Predecessor year ended September 30, 2017 were exclusively to Level 2.
|
The following discussion outlines the methodologies and assumptions used to determine the fair value of our financial instruments not carried at fair value. Judgment is required to develop these assumptions used to measure fair value. Accordingly, the estimates shown are not necessarily indicative of the amounts that would be realized in a one-time, current market exchange.
FHLB Common Stock
The fair value of FHLB common stock is based on cost.
Mortgage Loans
The fair value of mortgage loans is established using a discounted cash flow method based on credit rating, maturity and contractual cash flows. This yield-based approach is sourced from our third-party vendor. The ratings for mortgages in good standing are based on property type, location, market conditions, occupancy, debt service coverage, loan-to-value, quality of tenancy, borrower, and payment record. In the event of an impairment, the carrying value is based on the present value of expected future cash flows discounted at the loan’s effective interest rate, the loan’s market price, or the fair value of the collateral if the loan is collateral-dependent. The inputs used to measure the fair value of our mortgage loans are classified as Level 3 within the fair value hierarchy.
Policy Loans (included within Other Invested Assets)
Fair values for policy loans are estimated from a discounted cash flow analysis, using interest rates currently being offered for loans with similar credit risk. Loans with similar characteristics are aggregated for purposes of the calculations.
F-56
Company Owned Life Insurance
Company owned life insurance (COLI) is a life insurance program used to finance certain employee benefit expenses. The fair value of COLI is based on net realizable value, which is generally cash surrender value.
Affiliated Bank Loan
The fair value of the affiliated bank loan is estimated using a discounted cash flow method based on the weighted average cost of capital ("WACC"). This yield-based approach is sourced from a third-party vendor and the WACC establishes a market participant discount rate by determining the hypothetical capital structure for the asset should it be underwritten as of each period end.
Investment Contracts
Investment contracts include deferred annuities, FIAs, indexed universal life policies ("IULs") and immediate annuities. The fair value of deferred annuity, FIA, and IUL contracts is based on their cash surrender value (i.e. the cost the Company would incur to extinguish the liability) as these contracts are generally issued without an annuitization date. The fair value of immediate annuities contracts is derived by calculating a new fair value interest rate using the updated yield curve and treasury spreads as of the respective reporting date. At
December 31, 2019
and
December 31, 2018
, this resulted in lower fair value reserves relative to the carrying value. The Company is not required to, and has not, estimated the fair value of the liabilities under contracts that involve significant mortality or morbidity risks, as these liabilities fall within the definition of insurance contracts that are exceptions from financial instruments that require disclosures of fair value.
Debt
The fair value of debt is based on quoted market prices. The inputs used to measure the fair value of our outstanding debt are classified as Level 2 within the fair value hierarchy. Our revolving credit facility debt is classified as Level 3 within the fair value hierarchy, and the estimated fair value reflects the carrying value as the revolver has no maturity date.
F-57
The following tables provide the carrying value and estimated fair value of our financial instruments that are carried on the Consolidated Balance Sheets at amounts other than fair value, summarized according to the fair value hierarchy previously described.
|
December 31, 2019
|
|||||||||||||||||||
|
Level 1
|
Level 2
|
Level 3
|
Total Estimated Fair Value
|
Carrying Amount
|
|||||||||||||||
|
Assets
|
|||||||||||||||||||
|
FHLB common stock
|
$
|
|
|
$
|
|
|
$
|
|
|
$
|
|
|
$
|
|
|
||||
|
Commercial mortgage loans
|
|
|
|
|
|
|
|
|
|
|
|||||||||
|
Residential mortgage loans
|
|
|
|
|
|
|
|
|
|
|
|||||||||
|
Policy loans, included in other invested assets
|
|
|
|
|
|
|
|
|
|
|
|||||||||
|
Company-owned life insurance
|
|
|
|
|
|
|
|
|
|
|
|||||||||
|
Affiliated bank loan
|
|
|
|
|
|
|
|
|
|
|
|||||||||
|
Funds withheld for reinsurance receivables, at fair value
|
|
|
|
|
|
|
|
|
|
|
|||||||||
|
Total
|
$
|
|
|
$
|
|
|
$
|
|
|
$
|
|
|
$
|
|
|
||||
|
Liabilities
|
|||||||||||||||||||
|
Investment contracts, included in contractholder funds
|
$
|
|
|
$
|
|
|
$
|
|
|
$
|
|
|
$
|
|
|
||||
|
Debt
|
|
|
|
|
|
|
|
|
|
|
|||||||||
|
Total
|
$
|
|
|
$
|
|
|
$
|
|
|
$
|
|
|
$
|
|
|
||||
|
December 31, 2018
|
|||||||||||||||||||
|
Level 1
|
Level 2
|
Level 3
|
Total Estimated Fair Value
|
Carrying Amount
|
|||||||||||||||
|
Assets
|
|||||||||||||||||||
|
FHLB common stock
|
$
|
|
|
$
|
|
|
$
|
|
|
$
|
|
|
$
|
|
|
||||
|
Commercial mortgage loans
|
|
|
|
|
|
|
|
|
|
|
|||||||||
|
Residential mortgage loans
|
|
|
|
|
|
|
|
|
|
|
|||||||||
|
Policy loans, included in other invested assets
|
|
|
|
|
|
|
|
|
|
|
|||||||||
|
Affiliated other invested assets
|
|
|
|
|
|
|
|
|
|
|
|||||||||
|
Total
|
$
|
|
|
$
|
|
|
$
|
|
|
$
|
|
|
$
|
|
|
||||
|
Liabilities
|
|||||||||||||||||||
|
Investment contracts, included in contractholder funds
|
$
|
|
|
$
|
|
|
$
|
|
|
$
|
|
|
$
|
|
|
||||
|
Debt
|
|
|
|
|
|
|
|
|
|
|
|||||||||
|
Total
|
$
|
|
|
$
|
|
|
$
|
|
|
$
|
|
|
$
|
|
|
||||
|
Carrying Value After Measurement
|
|||||||
|
December 31, 2019
|
December 31, 2018
|
||||||
|
Equity securities available-for-sale
|
$
|
|
|
$
|
|
|
|
|
Limited partnership investment, included in other invested assets
|
|
|
|
|
|||
For investments for which NAV is used as a practical expedient for fair value, the Company does not have any significant restrictions in their ability to liquidate their positions in these investments, other than obtaining general partner approval, nor does the Company believe it is probable a price less than NAV would be received in the event of a liquidation.
F-58
The Company reviews the fair value hierarchy classifications each reporting period. Changes in the observability of the valuation attributes may result in a reclassification of certain financial assets or liabilities. Such reclassifications are reported as transfers in and out of Level 3, or between other levels, at the beginning fair value for the reporting period in which the changes occur. The transfers into and out of Level 3 were related to changes in the primary pricing source and changes in the observability of external information used in determining the fair value.
F-59
The Company’s assessment resulted in gross transfers into and gross transfers out of certain fair value levels by asset class for the years ended
December 31, 2019
and
December 31, 2018
, the period from December 1, 2017 to December 31, 2017, the Predecessor period from October 1, 2017 to November 30, 2017, the Predecessor period from October 1, 2016 to December 31, 2016 (unaudited), and the Predecessor year ended September 30,
2017
, are as follows:
|
Transfers Between Fair Value Levels
|
||||||||||||||||||||||||
|
Level 1
|
Level 2
|
Level 3
|
||||||||||||||||||||||
|
In
|
Out
|
In
|
Out
|
In
|
Out
|
|||||||||||||||||||
|
Year ended December 31, 2019
|
||||||||||||||||||||||||
|
Asset-backed securities
|
$
|
|
|
$
|
|
|
$
|
|
|
$
|
|
|
$
|
|
|
$
|
|
|
||||||
|
Commercial mortgage-backed securities
|
|
|
|
|
|
|
|
|
|
|
|
|
||||||||||||
|
Corporates
|
|
|
|
|
|
|
|
|
|
|
|
|
||||||||||||
|
Residential mortgage-backed securities
|
|
|
|
|
|
|
|
|
|
|
|
|
||||||||||||
|
Equity securities
|
|
|
|
|
|
|
|
|
|
|
|
|
||||||||||||
|
Funds withheld for reinsurance receivables
|
|
|
|
|
|
|
|
|
|
|
|
|
||||||||||||
|
Total transfers
|
$
|
|
|
$
|
|
|
$
|
|
|
$
|
|
|
$
|
|
|
$
|
|
|
||||||
|
Year ended December 31, 2018
|
||||||||||||||||||||||||
|
Asset-backed securities
|
$
|
|
|
$
|
|
|
$
|
|
|
$
|
|
|
$
|
|
|
$
|
|
|
||||||
|
Commercial mortgage-backed securities
|
|
|
|
|
|
|
|
|
|
|
|
|
||||||||||||
|
Corporates
|
|
|
|
|
|
|
|
|
|
|
|
|
||||||||||||
|
Hybrids
|
|
|
|
|
|
|
|
|
|
|
|
|
||||||||||||
|
Residential mortgage-backed securities
|
|
|
|
|
|
|
|
|
|
|
|
|
||||||||||||
|
Equity securities
|
|
|
|
|
|
|
|
|
|
|
|
|
||||||||||||
|
Funds withheld for reinsurance receivables
|
|
|
|
|
|
|
|
|
|
|
|
|
||||||||||||
|
Total transfers
|
$
|
|
|
$
|
|
|
$
|
|
|
$
|
|
|
$
|
|
|
$
|
|
|
||||||
|
Period from December 1 to December 31, 2017
|
||||||||||||||||||||||||
|
Asset-backed securities
|
$
|
|
|
$
|
|
|
$
|
|
|
$
|
|
|
$
|
|
|
$
|
|
|
||||||
|
Commercial mortgage-backed securities
|
|
|
|
|
|
|
|
|
|
|
|
|
||||||||||||
|
Hybrids
|
|
|
|
|
|
|
|
|
|
|
|
|
||||||||||||
|
Equity securities
|
|
|
|
|
|
|
|
|
|
|
|
|
||||||||||||
|
Total transfers
|
$
|
|
|
$
|
|
|
$
|
|
|
$
|
|
|
$
|
|
|
$
|
|
|
||||||
|
Predecessor
|
||||||||||||||||||||||||
|
Period from October 1 to November 30, 2017
|
||||||||||||||||||||||||
|
Asset-backed securities
|
$
|
|
|
$
|
|
|
$
|
|
|
$
|
|
|
$
|
|
|
$
|
|
|
||||||
|
Commercial mortgage-backed securities
|
|
|
|
|
|
|
|
|
|
|
|
|
||||||||||||
|
Corporates
|
|
|
|
|
|
|
|
|
|
|
|
|
||||||||||||
|
Hybrids
|
|
|
|
|
|
|
|
|
|
|
|
|
||||||||||||
|
Equity securities
|
|
|
|
|
|
|
|
|
|
|
|
|
||||||||||||
|
Total transfers
|
$
|
|
|
$
|
|
|
$
|
|
|
$
|
|
|
$
|
|
|
$
|
|
|
||||||
|
Predecessor
|
||||||||||||||||||||||||
|
Period from October 1 to December 31, 2016 (Unaudited)
|
||||||||||||||||||||||||
|
Asset-backed securities
|
$
|
|
|
$
|
|
|
$
|
|
|
$
|
|
|
$
|
|
|
$
|
|
|
||||||
|
Corporates
|
|
|
|
|
|
|
|
|
|
|
|
|
||||||||||||
|
Total transfers
|
$
|
|
|
$
|
|
|
$
|
|
|
$
|
|
|
$
|
|
|
$
|
|
|
||||||
|
Predecessor
|
||||||||||||||||||||||||
|
Year ended September 30, 2017
|
||||||||||||||||||||||||
|
Asset-backed securities
|
$
|
|
|
$
|
|
|
$
|
|
|
$
|
|
|
$
|
|
|
$
|
|
|
||||||
|
Commercial mortgage-backed securities
|
|
|
|
|
|
|
|
|
|
|
|
|
||||||||||||
|
Corporates
|
|
|
|
|
|
|
|
|
|
|
|
|
||||||||||||
|
Total transfers
|
$
|
|
|
$
|
|
|
$
|
|
|
$
|
|
|
$
|
|
|
$
|
|
|
||||||
F-60
(7)
Intangibles
A summary of the changes in the carrying amounts of the Company's VOBA, DAC and DSI intangible assets are as follows:
|
VOBA
|
DAC
|
DSI
|
Total
|
||||||||||||
|
Balance at December 31, 2018
|
$
|
|
|
$
|
|
|
$
|
|
|
$
|
|
|
|||
|
Deferrals
|
|
|
|
|
|
|
|
|
|||||||
|
Amortization
|
(
|
)
|
(
|
)
|
(
|
)
|
(
|
)
|
|||||||
|
Interest
|
|
|
|
|
|
|
|
|
|||||||
|
Unlocking
|
(
|
)
|
(
|
)
|
(
|
)
|
(
|
)
|
|||||||
|
Adjustment for net unrealized investment (gains) losses
|
(
|
)
|
(
|
)
|
(
|
)
|
(
|
)
|
|||||||
|
Balance at December 31, 2019
|
$
|
|
|
$
|
|
|
$
|
|
|
$
|
|
|
|||
|
VOBA
|
DAC
|
DSI
|
Total
|
||||||||||||
|
Balance at December 31, 2017
|
$
|
|
|
$
|
|
|
$
|
|
|
$
|
|
|
|||
|
Deferrals
|
|
|
|
|
|
|
|
|
|||||||
|
Amortization
|
(
|
)
|
(
|
)
|
(
|
)
|
(
|
)
|
|||||||
|
Interest
|
|
|
|
|
|
|
|
|
|||||||
|
Unlocking
|
(
|
)
|
|
|
|
|
(
|
)
|
|||||||
|
Adjustment for net unrealized investment (gains) losses
|
|
|
|
|
|
|
|
|
|||||||
|
Balance at December 31, 2018
|
$
|
|
|
$
|
|
|
$
|
|
|
$
|
|
|
|||
|
VOBA
|
DAC
|
DSI
|
Total
|
|||||||||||||
|
Balance at December 1, 2017
|
$
|
|
|
$
|
|
|
$
|
|
|
$
|
|
|
||||
|
Deferrals
|
|
|
|
|
|
|
|
|
||||||||
|
Amortization
|
(
|
)
|
(
|
)
|
|
|
(
|
)
|
||||||||
|
Interest
|
|
|
|
|
|
|
|
|
||||||||
|
Unlocking
|
|
|
|
|
|
|
|
|
||||||||
|
Adjustment for net unrealized investment (gains) losses
|
(
|
)
|
|
|
|
|
(
|
)
|
||||||||
|
Balance at December 31, 2017
|
$
|
|
|
$
|
|
|
$
|
|
|
$
|
|
|
||||
|
Predecessor
|
VOBA
|
DAC
|
DSI
|
Total
|
||||||||||||
|
Balance at October 1, 2017
|
$
|
|
|
$
|
|
|
$
|
|
|
$
|
|
|
||||
|
Deferrals
|
|
|
|
|
|
|
|
|
||||||||
|
Amortization
|
(
|
)
|
(
|
)
|
(
|
)
|
(
|
)
|
||||||||
|
Interest
|
|
|
|
|
|
|
|
|
||||||||
|
Unlocking
|
|
|
|
|
(
|
)
|
|
|
||||||||
|
Adjustment for net unrealized investment (gains) losses
|
|
|
(
|
)
|
|
|
(
|
)
|
||||||||
|
Balance at November 30, 2017
|
$
|
|
|
$
|
|
|
$
|
|
|
$
|
|
|
||||
|
VOBA
|
DAC
|
DSI
|
Total
|
|||||||||||||
|
Balance at October 1, 2016
|
$
|
|
|
$
|
|
|
$
|
|
|
$
|
|
|
||||
|
Deferrals
|
|
|
|
|
|
|
|
|
||||||||
|
Amortization
|
(
|
)
|
(
|
)
|
(
|
)
|
(
|
)
|
||||||||
|
Interest
|
|
|
|
|
(
|
)
|
|
|
||||||||
|
Unlocking
|
|
|
(
|
)
|
|
|
|
|
||||||||
|
Adjustment for unrealized investment losses (gains)
|
|
|
|
|
|
|
|
|
||||||||
|
Balance at December 31, 2016
|
$
|
|
|
$
|
|
|
$
|
|
|
$
|
|
|
||||
F-61
|
Predecessor
|
VOBA
|
DAC
|
DSI
|
Total
|
||||||||||||
|
Balance at September 30, 2016
|
$
|
|
|
$
|
|
|
$
|
|
|
$
|
|
|
||||
|
Deferrals
|
|
|
|
|
|
|
|
|
||||||||
|
Amortization
|
(
|
)
|
(
|
)
|
(
|
)
|
(
|
)
|
||||||||
|
Interest
|
|
|
|
|
|
|
|
|
||||||||
|
Unlocking
|
|
|
|
|
(
|
)
|
|
|
||||||||
|
Adjustment for net unrealized investment (gains) losses
|
|
|
(
|
)
|
|
|
(
|
)
|
||||||||
|
Balance at September 30, 2017
|
$
|
|
|
$
|
|
|
$
|
|
|
$
|
|
|
||||
Estimated amortization expense for VOBA in future fiscal periods is as follows:
|
Estimated Amortization Expense
|
|||
|
Fiscal Year
|
|||
|
2020
|
|
|
|
|
2021
|
|
|
|
|
2022
|
|
|
|
|
2023
|
|
|
|
|
2024
|
|
|
|
|
Thereafter
|
|
|
|
The Company had an unearned revenue balance of
$(
43
)
as of
December 31, 2019
, including deferrals of
$(
41
)
, amortization of
$(
4
)
, interest of
$(
2
)
, unlocking of
$
1
, and adjustment for net unrealized investment gains (losses) of
$
44
. The Company had an unearned revenue balance of
$(
41
)
as of December 31, 2018, including deferrals of
$(
37
)
, amortization of
$
18
, unlocking of
$
4
, and adjustment for net unrealized investment gains (losses) of
$(
26
)
.
Definite and Indefinite Lived Intangible Assets
On November 30, 2017,
$
467
of goodwill was recognized as a result of the FGL and FSR acquisitions. These transactions were accounted for separately using the acquisition method under which the Company recorded the identifiable assets acquired, including indefinite-lived and definite-lived intangible assets, and liabilities assumed, at their acquisition date fair values.
Other identifiable intangible assets as of
December 31, 2019
consist of the following:
|
December 31, 2019
|
||||||||||||||
|
Cost
|
Accumulated amortization
|
Net carrying amount
|
Weighted average useful life (years)
|
|||||||||||
|
Trade marks / trade names
|
$
|
|
|
$
|
|
|
$
|
|
|
|
||||
|
State insurance licenses
|
|
|
N/A
|
|
|
|
Indefinite
|
|||||||
|
Total
|
$
|
|
|
|||||||||||
F-62
(8)
Debt
On November 30, 2017, FGLH and CF Bermuda, together as borrowers and each as a borrower, entered into a credit agreement with certain financial institutions party thereto, as lenders, and Royal Bank of Canada, as administrative agent and letter of credit issuer, which provides for a
$
250
senior unsecured revolving credit facility with a maturity of
three years
(the “Credit Agreement”). Various financing options are available within the Credit Agreement, including overnight and term based borrowing. In each case, a margin is ascribed based on the Debt to Capitalization ratio of CF Bermuda. The loan proceeds from the Credit Agreement may be used for working capital and general corporate purposes.
On April 20, 2018, FGLH completed a debt offering of
$
550
aggregate principal amount of
5.50
%
senior notes due 2025, issued at
99.5
%
for proceeds of
$
547
. The Company used the net proceeds of the offering (i) to repay
$
135
of borrowings under its revolving credit facility and related expenses and (ii) to redeem in full and satisfy and discharge all of the outstanding
$
300
aggregate principal amount of FGLH's outstanding
6.375
%
Senior Notes due 2021. The remaining proceeds of the offering were used for general corporate purposes, including additional capital contributions to the Company's insurance subsidiaries. This exchange of debt instruments constituted an extinguishment. As a result, the Company recognized a
$
2
gain on the extinguishment of the
6.375
%
Senior Notes.
The Company capitalized
$
7
of debt issuance costs in connection with the
5.50
%
Senior Notes offering, which are classified as an offset within the "Debt" line on the Company's Consolidated Balance Sheets, and are being amortized from the date of issue to the redemption date using the straight-line method.
The carrying amount of the Company's outstanding debt as of
December 31, 2019
and
December 31, 2018
is as follows:
|
December 31, 2019
|
December 31, 2018
|
||||||
|
Debt
|
$
|
|
|
$
|
|
|
|
|
Revolving credit facility
|
|
|
|
|
|||
Interest rates on the revolving credit facility were equal to
4.55
%
and
5.27
%
as of
December 31, 2019
and
December 31, 2018
, respectively. As of
December 31, 2019
and
December 31, 2018
, the amount available to be drawn on the revolver was
$
250
.
The interest expense and amortization of debt issuance costs for the years ended
December 31, 2019
and
December 31, 2018
, the period from December 1, 2017 to December 31, 2017, the Predecessor period from October 1, 2017 to November 30, 2017, the Predecessor period from October 1, 2016 to December 31, 2016 (unaudited), and the Predecessor year ended September 30, 2017, were as follows:
|
Year ended
|
Period from December 1 to December 31, 2017
|
||||||||||||||||||||||
|
December 31, 2019
|
December 31, 2018
|
||||||||||||||||||||||
|
Interest Expense
|
Amortization
|
Interest Expense
|
Amortization
|
Interest Expense
|
Amortization
|
||||||||||||||||||
|
Debt
|
$
|
|
|
$
|
|
|
$
|
|
|
$
|
|
|
$
|
|
|
$
|
|
|
|||||
|
Revolving credit facility
|
|
|
|
|
|
|
|
|
|
|
|
|
|||||||||||
|
Gain on extinguishment of debt
|
|
|
—
|
|
(
|
)
|
—
|
|
|
|
—
|
|
|||||||||||
(9)
Equity
General
The Company is a Cayman Islands exempted company and our affairs are governed by the Companies Law, the common law of the Cayman Islands and our Charter. Pursuant to our Charter, our authorized share capital is
$
90
thousand
divided into
800,000
thousand ordinary shares and
100,000
thousand preferred shares, par value
$
0.0001
per share.
F-63
Common Stock
Ordinary shareholders of record are entitled to one vote for each share held on all matters to be voted on by shareholders. Unless specified in our Charter, or as required by applicable provisions of the Companies Law or applicable stock exchange rules, the affirmative vote of a majority of ordinary shares that are voted is required to approve any matter voted on by our shareholders. Approval of certain actions will require a special resolution under Cayman Islands law, being the affirmative vote of at least two-thirds of ordinary shares that are voted and, pursuant to our Charter, such actions include amending our Charter and approving a statutory merger or consolidation with another company.
The Company consummated the initial public offering ("IPO") of
60,000
thousand ordinary shares for
$
10.00
per share on May 25, 2016. On June 29, 2016, the Company consummated the closing of the sale of
9,000
thousand ordinary shares pursuant to the exercise in full of the underwriter’s over-allotment option. An additional
145,370
thousand ordinary shares were issued for
$
10.00
per share on November 30, 2017 in advance of the Business Combination.
In accordance with the Merger Agreement, FGL’s common stock outstanding as of the date of the business combination were retired and ceased to exist upon conversion.
Preferred Stock
On November 30, 2017, the Company issued
275
thousand shares of Series A Cumulative Preferred Shares ("Series A Preferred Shares"),
$
1,000
liquidation preference per share for
$
275
, and
100
thousand Series B Cumulative Convertible Preferred Shares ("Series B Preferred Shares"),
$
1,000
liquidation per share for
$
100
. In connection with offering of the Series A Preferred Shares and Series B Preferred Shares, the Company incurred
$
12
of issuance costs which have been recorded as a reduction of additional paid-in-capital.
The Series A Preferred Shares and the Series B Preferred Shares (together, the "preferred shares") do not have a maturity date and are non-callable for the first
five years
. The dividend rate of the preferred shares is
7.5
%
per annum, payable quarterly in cash or additional preferred shares, at the Company's option, subject to increase beginning
10
years after issuance based on the then-current three-month LIBOR rate plus
5.5
%
. In addition, commencing
10
years after issuance of the preferred shares, and following a failed remarketing event, the holders of the preferred shares will have the right to convert their preferred shares into ordinary shares of the Company as determined by dividing (i) the aggregate par value (including dividends paid in kind and unpaid accrued dividends) of the preferred shares that the holders of the preferred shares wish to convert by (ii) the higher of (a)
5
%
discount to the 30-day volume weighted average of the ordinary shares following the conversion notice, and (b) the then-current floor price. The floor price will be
$
8.00
per share during the 11th year post-funding,
$
7.00
per share during the 12th year post funding, and
$
6.00
during the 13th year post-funding and thereafter.
Warrants
The Company issued
34,500
thousand warrants as part of the units sold in the IPO. The Company issued
15,800
thousand and
1,500
thousand warrants to CF Capital Growth, LLC, at
$
1.00
per private placement warrant in a private placement consummated simultaneously with the closing of the IPO and upon conversion of working capital loans at the time of the business combination, respectively. In connection with forward purchase agreements, at the closing of the business combination the Company issued
19,083
thousand forward purchase warrants to the anchor investors. The forward purchase warrants have identical terms as the public warrants.
Each whole warrant entitles the holder thereof to purchase one ordinary share at a price of
$
11.50
per share, subject to adjustment as described below, at any time commencing December 30, 2017, provided that the Company has an effective registration statement under the Securities Act covering the ordinary shares issuable upon exercise of the warrants and a current prospectus relating to them is available (or we permit holders to exercise their warrants on a cashless basis under the circumstances specified in the warrant agreement governing the warrants (the “warrant agreement”)) and such shares are registered, qualified or exempt from registration under the securities, or blue sky, laws of the state of residence of the holder. Pursuant to the warrant agreement, a warrant holder may exercise its warrants only for a whole number of ordinary shares. This means only a whole warrant may be exercised at a given time by a warrant holder. No fractional warrants will be issued and only whole warrants trade. The warrants will expire on November 30, 2022, at 5:00 p.m., New York City time, or earlier upon redemption or liquidation.
We have the ability to redeem outstanding warrants at any time after they become exercisable and prior to their expiration, at a price of
$
0.01
per warrant, provided that the last reported sales price of our ordinary shares equals or exceeds
$
18.00
per share for any 20 trading days within a 30 trading-day period ending on the third trading day prior to the date the Company sends the notice of redemption to the warrant holders. If and when the warrants become redeemable by us, the Company may exercise our redemption right even if the Company is unable to register or qualify the underlying securities for sale under all applicable state securities laws.
F-64
The Company conducted an offer to exchange its outstanding warrants for
0.11
ordinary shares of the Company, par value
$
0.0001
(the "Exchange Shares") and
$
0.98
, in cash without interest, per warrant, which expired on October 4, 2018. A total of
65,374
thousand warrants were properly tendered prior to the expiration of the offer to exchange. On October 9, 2018 the Company issued
7,191
thousand shares and paid
$
64
in cash in exchange for the warrants tendered. After completion of the Offer to Exchange,
5,510
thousand warrants still remain outstanding, which will expire on November 30, 2022, or upon earlier redemption or liquidation.
Share Repurchases
On December 19, 2018, the Company's Board of Directors authorized a share repurchase program of up to
$
150
of the Company's outstanding common stock. This program will expire on
December 15, 2020
, and may be modified at any time. Under the share repurchase program, the Company may repurchase shares from time to time in open market transactions or through privately negotiated transactions in accordance with applicable federal securities laws. Repurchases may also be made pursuant to a trading plan under Rule 10b5-1 of the Securities Exchange Act of 1934. The extent to which the Company repurchases its shares, and the timing of such purchases, will depend upon a variety of factors, including market conditions, regulatory requirements and other considerations, as determined by the Company.
During the years ended
December 31, 2019
and
December 31, 2018
, the Company purchased
8,052
and
600
thousand
shares, respectively, for a total cost of $
65
and
$
4
, respectively. As of
December 31, 2019
, the Company had repurchased
8,652
thousand
shares for a total cost of
$
69
.
Dividends
The Company declared the following cash dividends to its common shareholders during the year ended
December 31, 2019
:
|
Date Declared
|
Date Paid
|
Date Shareholders of record
|
Shareholders of record (in thousands)
|
Cash Dividend declared (per share)
|
Total cash paid
|
|||||
|
February 27, 2019
|
April 1, 2019
|
March 18, 2019
|
|
$
|
$
|
|||||
|
May 7, 2019
|
June 10, 2019
|
May 28, 2019
|
|
$
|
$
|
|||||
|
August 7, 2019
|
September 9, 2019
|
August 26, 2019
|
|
$
|
$
|
|||||
|
November 6, 2019
|
December 9, 2019
|
November 25, 2019
|
|
$
|
$
|
|||||
On February 26, 2020, the Company's Board of Directors declared a quarterly cash dividend of
$
0.01
per share. The dividend will be paid on March 30, 2020 to shareholders of record as of the close of business on March 16, 2020.
F-65
The Company declared the following dividends to its preferred shareholders during the years ended
December 31, 2019
and
December 31, 2018
:
|
Type of Preferred Share
|
Date Declared
|
Date Paid
|
Date Shareholders of record
|
Shareholders of record (in thousands)
|
Method of Payment
|
Total cash paid
|
Total shares paid in kind (in thousands)
|
||||||
|
Series A Preferred Shares
|
March 29, 2018
|
April 1, 2018
|
March 15, 2018
|
|
Paid in kind
|
$
|
|
||||||
|
Series B Preferred Shares
|
March 29, 2018
|
April 1, 2018
|
March 15, 2018
|
|
Paid in kind
|
$
|
|
||||||
|
Series A Preferred Shares
|
June 29, 2018
|
July 1, 2018
|
June 15, 2018
|
|
Paid in kind
|
$
|
|
||||||
|
Series B Preferred Shares
|
June 29, 2018
|
July 1, 2018
|
June 15, 2018
|
|
Paid in kind
|
$
|
|
||||||
|
Series A Preferred Shares
|
September 28, 2018
|
October 1, 2018
|
September 15, 2018
|
|
Paid in kind
|
$
|
|
||||||
|
Series B Preferred Shares
|
September 28, 2018
|
October 1, 2018
|
September 15, 2018
|
|
Paid in kind
|
$
|
|
||||||
|
Series A Preferred Shares
|
December 31, 2018
|
January 1, 2019
|
December 15, 2018
|
|
Paid in kind
|
$
|
|
||||||
|
Series B Preferred Shares
|
December 31, 2018
|
January 1, 2019
|
December 15, 2018
|
|
Paid in kind
|
$
|
|
||||||
|
Series A Preferred Shares
|
March 29, 2019
|
April 1, 2019
|
March 15, 2019
|
|
Paid in kind
|
$
|
|
||||||
|
Series B Preferred Shares
|
March 29, 2019
|
April 1, 2019
|
March 15, 2019
|
|
Paid in kind
|
$
|
|
||||||
|
Series A Preferred Shares
|
June 28, 2019
|
July 1, 2019
|
June 15, 2019
|
|
Paid in kind
|
$
|
|
||||||
|
Series B Preferred Shares
|
June 28, 2019
|
July 1, 2019
|
June 15, 2019
|
|
Paid in kind
|
$
|
|
||||||
|
Series A Preferred Shares
|
September 30, 2019
|
October 1, 2019
|
September 15, 2019
|
|
Paid in kind
|
$
|
|
||||||
|
Series B Preferred Shares
|
September 30, 2019
|
October 1, 2019
|
September 15, 2019
|
|
Paid in kind
|
$
|
|
||||||
|
Series A Preferred Shares
|
December 31, 2019
|
January 1, 2020
|
December 15, 2019
|
|
Paid in kind
|
$
|
|
||||||
|
Series B Preferred Shares
|
December 31, 2019
|
January 1, 2020
|
December 15, 2019
|
|
Paid in kind
|
$
|
|
||||||
Restricted Net Assets of Subsidiaries
F-66
(10)
Stock Compensation
On August 8, 2017, the Company adopted a stock-based incentive plan (the “FGL Incentive Plan”) that permits the granting of awards in the form of qualified stock options, non-qualified stock options, restricted stock, restricted stock units, stock appreciation rights, unrestricted stock, performance-based awards, dividend equivalents, cash awards and any combination of the foregoing. The Company’s Compensation Committee is authorized to grant up to
15,006
thousand
equity awards under the Incentive Plan. At
December 31, 2019
,
5,712
thousand
equity awards are available for future issuance.
FGL Incentive Plan
The Company granted
7,749
thousand
and
17,255
thousand
stock options to certain officers during the twelve months ended December 31, 2019 and 2018 that vest based on continued service with the Company or a combination of continued service and Company performance (adjusted operating income return on equity or stock price performance). The total fair value of the awards granted during
twelve months ended
December 31, 2019
and 2018 was
$
12
and
$
32
, respectively.
The fair value of the options is expensed over the requisite service period, which generally corresponds to the vesting period. To value the options granted with service and adjusted operating income return on equity performance vesting conditions, a Black Scholes valuation model was used. To value the options granted with stock price performance vesting conditions, a Monte Carlo simulation was used.
A summary of the Company’s outstanding stock options as of
December 31, 2019
, and related activity during the twelve months ended
December 31, 2019
, is as follows (share amount in thousands):
|
Stock Option Awards
|
Options
|
Weighted Average
Exercise Price
|
||||
|
Stock options outstanding at December 31, 2018
|
|
|
$
|
|
|
|
|
Granted
|
|
|
|
|
||
|
Exercised
|
|
|
|
|
||
|
Forfeited or expired
|
(
|
)
|
|
|
||
|
Stock options outstanding at December 31, 2019
|
|
|
|
|
||
|
Exercisable at December 31, 2019
|
|
|
|
|
||
|
Vested or projected to vest at December 31, 2019
|
|
|
$
|
|
|
|
The Company granted
147
thousand
and
112
thousand
restricted shares to directors in the
twelve months ended
December 31, 2019
and 2018, which vested on
December 31, 2019
and 2018, respectively. The total fair value of the restricted shares granted in the
twelve months ended
December 31, 2019
and 2018 was
$
1
and
$
1
, respectively.
A summary of the Company’s nonvested restricted shares outstanding as of
December 31, 2019
, and related activity during the
twelve months ended
, is as follows (share amount in thousands):
|
Restricted Stock Awards
|
Shares
|
Weighted Average Grant
Date Fair Value
|
|||||
|
Restricted shares outstanding at December 31, 2018
|
|
|
$
|
|
|
||
|
Granted
|
|
|
|
|
|||
|
Vested
|
(
|
)
|
|
|
|||
|
Vested or expected to vest at December 31, 2019
|
|
|
|
|
|||
Management Incentive Plan
In the
twelve months ended
December 31, 2019
and 2018, the Company granted
541
thousand
and
374
thousand
phantom units to members of management under a management incentive plan (the "Management Incentive Plan"). The phantom units are settled in cash, and therefore the Management Incentive Plan is classified as a liability plan. The value of this plan is classified within "Other liabilities" on the Consolidated Balance Sheets and is adjusted each period, with a corresponding adjustment to “Acquisition and operating expenses, net of deferrals”, to reflect changes in the Company’s stock price. See "Note 2. Significant Accounting Policies and Practices" for a more detailed discussion of stock-based compensation. The total fair value of the phantom units granted in the
twelve months ended
December 31, 2019
and 2018 was
$
5
and
$
3
, respectively.
F-67
One half of the phantom units vest in three equal installments on each March 15
th
from 2019 to 2021, subject to awardees continued service with the Company. The other half will begin vesting on March 15, 2020 and cliff vest on March 15, 2021 based on continued service and attainment of a performance metric: adjusted operating income return on equity for the fiscal year 2020.
At
December 31, 2019
, the liability for phantom units of
$
1
was based on the number of units granted, the elapsed portion of the service period and the fair value of the Company’s common stock on that date which was
$
10.65
.
A summary of the Management Incentive Plan nonvested phantom units outstanding as of
December 31, 2019
, and related activity during the
twelve months ended
is as follows (share amount in thousands):
|
Phantom units
|
Shares
|
Weighted Average Grant
Date Fair Value
|
|||||
|
Phantom units outstanding at December 31, 2018
|
|
|
$
|
|
|
||
|
Granted
|
|
|
|
|
|||
|
Vested
|
(
|
)
|
|
|
|||
|
Forfeited or expired
|
(
|
)
|
|
|
|||
|
Phantom units outstanding at December 31, 2019
|
|
|
$
|
|
|
||
The Company recognized total stock compensation expense related to the FGL Incentive Plan and Management Incentive Plan is as follows:
|
Year ended
|
|||||||||
|
December 31, 2019
|
December 31, 2018
|
||||||||
|
Total stock compensation expense
|
|
|
|
|
|||||
|
Related tax benefit
|
|
|
|
|
|||||
|
Net stock compensation expense
|
$
|
|
|
$
|
|
|
|||
The stock compensation expense is included in "Acquisition and operating expenses, net of deferrals" in the Company's Consolidated Statements of Operations.
Total compensation expense related to the FGL Incentive Plan and Management Incentive Plan not yet recognized as of
December 31, 2019
and the weighted-average period over which this expense will be recognized are as follows:
|
Unrecognized Compensation
Expense |
Weighted Average Recognition
Period in Years |
|||||
|
FGL Incentive Plan
|
$
|
|
|
|
||
|
Management Incentive Plan
|
|
|
|
|||
|
Total unrecognized stock compensation expense
|
$
|
|
|
|
||
(11)
Income Taxes
The Company is a Cayman-domiciled corporation that has operations in Bermuda and the U.S. Neither the Cayman Islands nor Bermuda impose a corporate income tax. The Company’s U.S. non-life subsidiaries file a consolidated non-life U.S. Federal income tax return. For tax years prior to December 1, 2017, the non-life members were included in the consolidated U.S. Federal income tax return of HRG, the majority owner of FGL prior to the execution of the FGL Merger Agreement on November 30, 2017. The income tax liabilities of the Company as former members of the consolidated HRG return were calculated using the separate return method as prescribed in ASC 740. The Company’s US life insurance subsidiaries file a separate life subgroup consolidated U.S. Federal income tax return. The life insurance companies will be eligible to join in a consolidated filing with the U.S. non-life companies in 2022.
On May 24, 2017, the Company, HRG Group, Inc. ("HRG"), the majority owner of FGL prior to the execution of the FGL merger agreement on November 30, 2017, and CF Corp executed a letter agreement (the “side letter”)
F-68
which set forth the settlement provisions between the parties related to the Section 338(h)(10) transaction. The Section 338(h)(10) election treated the merger as an asset acquisition for U.S. tax purposes resulting in stub period tax yearends for both the life and non-life subsidiaries within the target group acquired as part of the acquisition. The side letter agreement between the parties specified that the purchase price would be adjusted for incremental tax costs attributable to the election. As such, the Company made two payments to HRG totaling
$
57
in March and May of 2018. The target 338(h)(10) group did not include FSRC, a 953(d) election U.S. tax payer. Any tax liability of the non-life entities’ arising from the deemed asset sale were reflected on HRG’s consolidated return, with the Companies’ non-life entities retaining successor liability. The life entities filed a separate final short-period return reflecting gain (or loss) from the deemed asset sale.
The Company’s U.S. subsidiaries are taxed at corporate rates on taxable income based on existing U.S. tax laws. Current income taxes are charged or credited to net income based upon amounts estimated to be payable or recoverable as a result of taxable operations for the current year.
Deferred income taxes are provided for the tax effect of temporary differences in the financial reporting and income tax bases of assets and liabilities, net operating loss carryforwards and tax credit carryforwards using enacted income tax rates and laws. The effect on deferred income tax assets and deferred income tax liabilities of a change in tax rates is recognized in net income in the period in which the change is enacted. A valuation allowance is required if it is more likely than not that a deferred tax asset will not be realized. In assessing the need for a valuation allowance, we considered the scheduled reversal of deferred tax liabilities, projected future taxable income, and taxable income from prior years available for recovery and tax planning strategies. Based on the available positive and negative evidence regarding future sources of taxable income, we have determined that the establishment of a valuation allowance was necessary for the U.S. non-life companies at December 31, 2019. The valuation allowance reflects a history of cumulative losses for the US nonlife subgroup. In addition, due to the debt structure of the US non-life entities, particularly at the holding company level, it is unlikely the US non-life subgroup will be in a net cumulative taxable income position in a near term projection window. During the quarter ended September 30, 2019, Management determined that a valuation allowance was no longer needed for the ordinary deferred tax assets of FSRC based on positive evidence including: cumulative three-year income, future projected earnings, and management’s ability to implement a future tax planning strategy if needed. Therefore, the valuation allowance against the FSRC deferred tax assets at that date was released and the Company recorded an
$
18
million
gain in operating income during that quarter related to the release. The Company still maintains a valuation allowance against FSRC’s capital deferred tax assets due to lack of sufficient sources of income in which to recognize them. All other deferred tax assets were more likely than not to be realized based on expectations regarding future taxable income and considering all other available evidence, both positive and negative.
The Tax Cut and Jobs Act (“TCJA”) was enacted on December 22, 2017, and it amended many provisions of the Internal Revenue Code that have effects on the Company. Because the TCJA reduced the statutory tax rate from
35
%
to
21
%
, the Company was required to remeasure its deferred tax assets and liabilities using the lower rate at the December 22, 2017, date of enactment. This remeasurement resulted in a reduction of net deferred tax assets of
$
131
, which includes a
$
0
benefit related to deferred taxes previously recognized in accumulated other comprehensive income. The Company evaluated whether or not to make a Section 953(d) election with respect to F&G Life Re Ltd. which would have resulted in F&G Life Re Ltd. being treated as if it were a US Tax Payer. Ultimately, the Company chose to be subject to the Base Erosion and Anti-Abuse Tax ("BEAT") through September 30, 2018 and then recapture the business that was subject to the Modco Agreement. The Modco Agreement was terminated effective September 30, 2018.
The SEC’s Staff Accounting Bulletin No. 118 (“SAB 118”) provides guidance on accounting for the effects of U.S. tax reform in circumstances in which an exact calculation cannot be made, but for which a reasonable estimate can be determined. December 22, 2018 marked the end of the measurement period for purposes of SAB 118. As such, we have completed our analysis based on the legislative updates relating to TCJA currently available. The only provision amount utilized in the preparation of the Company's December 31, 2017 financial statements was tax reserves. There are no provisional amounts utilized in the preparation of the Company’s December 31, 2018 or 2019 financial statements.
F-69
Income tax (expense) benefit is calculated based upon the following components of income before income taxes:
|
|
Year ended
|
Year ended
|
|||||||||||||||||||||||
|
|
December 31, 2019
|
December 31, 2018
|
Period from December 1 to December 31, 2017
|
Period from October 1 to November 30, 2017
|
Period from October 1 to December 31, 2016 (Unaudited)
|
September 30, 2017
|
|||||||||||||||||||
|
Predecessor
|
Predecessor
|
Predecessor
|
|||||||||||||||||||||||
|
Pretax income (loss):
|
|||||||||||||||||||||||||
|
United States
|
$
|
|
|
$
|
(
|
)
|
$
|
(
|
)
|
$
|
|
|
$
|
|
|
$
|
|
|
|||||||
|
Outside the United States
|
|
|
|
|
|
|
|
|
|
|
|
|
|||||||||||||
|
Total pretax income
|
$
|
|
|
$
|
|
|
$
|
|
|
$
|
|
|
$
|
|
|
$
|
|
|
|||||||
The components of income tax (expense) benefit are as follows:
|
|
Year ended
|
Year ended
|
|||||||||||||||||||||||
|
|
December 31, 2019
|
December 31, 2018
|
Period from December 1 to December 31, 2017
|
Period from October 1 to November 30, 2017
|
Period from October 1 to December 31, 2016 (Unaudited)
|
September 30, 2017
|
|||||||||||||||||||
|
Predecessor
|
Predecessor
|
Predecessor
|
|||||||||||||||||||||||
|
Current:
|
|||||||||||||||||||||||||
|
Federal
|
$
|
(
|
)
|
$
|
(
|
)
|
$
|
(
|
)
|
$
|
(
|
)
|
$
|
|
|
$
|
(
|
)
|
|||||||
|
State
|
|
|
|
|
|
|
|
|
|
|
|
|
|||||||||||||
|
Total current
|
$
|
(
|
)
|
$
|
(
|
)
|
$
|
(
|
)
|
$
|
(
|
)
|
$
|
|
|
$
|
(
|
)
|
|||||||
|
|
|||||||||||||||||||||||||
|
Deferred:
|
|||||||||||||||||||||||||
|
Federal
|
$
|
(
|
)
|
$
|
|
|
$
|
(
|
)
|
$
|
|
|
$
|
(
|
)
|
$
|
|
|
|||||||
|
State
|
|
|
|
|
|
|
|
|
|
|
|
|
|||||||||||||
|
Total deferred
|
$
|
(
|
)
|
$
|
|
|
$
|
(
|
)
|
$
|
|
|
$
|
(
|
)
|
$
|
|
|
|||||||
|
|
|||||||||||||||||||||||||
|
Income tax (expense)/benefit
|
$
|
(
|
)
|
$
|
(
|
)
|
$
|
(
|
)
|
$
|
(
|
)
|
$
|
(
|
)
|
$
|
(
|
)
|
|||||||
F-70
The difference between income taxes expected at the U.S. Federal statutory income tax rate of
21
%
and reported income tax (expense) benefit is summarized as follows:
|
|
Year ended
|
Year ended
|
|||||||||||||||||||||||
|
|
December 31, 2019
|
December 31, 2018
|
Period from December 1 to December 31, 2017
|
Period from October 1 to November 30, 2017
|
Period from October 1 to December 31, 2016 (Unaudited)
|
September 30, 2017
|
|||||||||||||||||||
|
Predecessor
|
Predecessor
|
Predecessor
|
|||||||||||||||||||||||
|
Expected income tax (expense)/benefit at Federal statutory rate
|
$
|
(
|
)
|
$
|
(
|
)
|
$
|
(
|
)
|
$
|
(
|
)
|
$
|
(
|
)
|
$
|
(
|
)
|
|||||||
|
Valuation allowance for deferred tax assets
|
|
|
(
|
)
|
|
|
(
|
)
|
|
|
|
|
|||||||||||||
|
Amortization of low income housing tax credits
|
(
|
)
|
(
|
)
|
(
|
)
|
(
|
)
|
|
|
(
|
)
|
|||||||||||||
|
Benefit on LIHTC under proportional amortization method
|
|
|
|
|
|
|
|
|
|
|
|
|
|||||||||||||
|
Write off of expired capital loss carryforward
|
|
|
|
|
|
|
|
|
|
|
|
|
|||||||||||||
|
Remeasurement of deferred taxes under U.S. tax reform
|
|
|
|
|
(
|
)
|
|
|
|
|
|
|
|||||||||||||
|
Dividends received deduction
|
|
|
|
|
|
|
|
|
|
|
|
|
|||||||||||||
|
Benefit on Outside of United States Income taxed at 0%
|
|
|
|
|
|
|
|
|
|
|
|
|
|||||||||||||
|
Withholding Tax on 0% Taxed Jurisdictions
|
(
|
)
|
|
|
|
|
|
|
|
|
|
|
|||||||||||||
|
Write off of 382 Limited NOL
|
|
|
|
|
(
|
)
|
|
|
|
|
|
|
|||||||||||||
|
Base Erosion & Antiabuse Tax "BEAT"
|
|
|
(
|
)
|
|
|
|
|
|
|
|
|
|||||||||||||
|
Other
|
(
|
)
|
|
|
|
|
|
|
|
|
|
|
|||||||||||||
|
Reported income tax (expense)/benefit
|
$
|
(
|
)
|
$
|
(
|
)
|
$
|
(
|
)
|
$
|
(
|
)
|
$
|
(
|
)
|
$
|
(
|
)
|
|||||||
|
Effective tax rate
|
|
%
|
|
%
|
|
%
|
|
%
|
|
%
|
|
%
|
|||||||||||||
For the year ended
December 31, 2019
, the Company’s effective tax rate was
11
%
. The effective tax rate was positively impacted by the valuation allowance release on the US life companies’ prior year unrealized capital losses and the FSRC ordinary deferred tax assets, as well as the benefit of low taxed international income in excess of withholding taxes, and favorable permanent adjustments, including low income housing tax credits ("LIHTC") and the dividends received deduction ("DRD").
For the year ended December 31, 2018, the Company’s effective tax rate was
55
%
. The effective tax rate was negatively impacted by the valuation allowance expense on the US life companies’ unrealized capital losses and the FSRC and non-life insurance companies’ deferred tax assets. The negative impacts of the valuation allowance were partially offset by the benefit of low taxed international income in excess of the BEAT, and favorable permanent adjustments, including LIHTC and the DRD.
For the period December 1, 2017 to December 31, 2017, the Company’s effective tax rate includes the effects of rate change from
35%
to
21%
in connection with TCJA as well as certain reinsurance effects between the Companies' onshore and offshore insurance entities. Reversing out the effects of the tax reform rate change and impacts of FAS 133/DIGB36, (i.e. Embedded Derivatives impacts under Modified Coinsurance Arrangements) in regards to US/offshore reinsurance treatment of unrealized gains on funds withheld assets, results in an adjusted effective rate for the period of approximately
34
%
and is a more useful comparative to prior period rates reflected in the schedule above. The effective tax rate was impacted by tax expense recorded related to the remeasurement of deferred tax assets and liabilities as a result of tax reform. Additionally, the tax rate was positively impacted by income earned by foreign companies that is taxed at
0
%
.
For the Predecessor period October 1, 2017 to November 30, 2017, the Company’s effective tax rate was
37
%
(for Predecessor periods, references to “the Company” are to its predecessor). The negative impact of the valuation allowance expense of the non-life companies was partially offset by the net impact of positive permanent adjustments, including LIHTC and the DRD.
For the Predecessor period October 1, 2016 to December 31, 2016 (unaudited), the Company’s effective tax rate was
34
%
. The effective tax rate was impacted by favorable permanent adjustments, including LIHTC.
F-71
For the Predecessor year ended September 30, 2017, the Company’s effective tax rate was
33
%
. The effective tax rate was positively impacted by a valuation allowance release within the non-life companies and favorable permanent adjustments, including LIHTC and the DRD.
For the year ended
December 31, 2019
, the Company recorded a net valuation allowance release of
$
39
(comprised of a full year valuation allowance release of
$
14
related to the U.S. life insurance companies' unrealized capital losses on equity securities that are recorded through net income and
$
31
related to FSRC ordinary deferred tax assets, partially offset by a net increase to valuation allowance of
$
6
related to the Company's non-life companies).
For the year ended
December 31, 2018
, the company recorded a net valuation allowance expense of
$
38
(comprised of a net increase to valuation allowance of
$
3
related to the Company’s non-life companies, a net increase to valuation allowance of
$
21
related to FSRC, and a net increase to valuation allowance of
$
14
related to the US life insurance companies unrealized capital losses on equity securities that are recorded through net income).
For the period from December 1, 2017 to December 31, 2017, the Company recorded a net valuation allowance release of $
13
primarily related to the DTA write off of the Net Operating Loss ("NOL") on FSRC that would not be able to be utilized as a result of the Section 382 limitation created by the merger with CF Corporation. For the Predecessor period from October 1, 2017 to November 30, 2017, the Company recorded a net valuation allowance expense of $
2
related to the Company’s non-life companies. For the Predecessor period from October 1, 2016 to December 31, 2016 (unaudited), the Company recorded a net valuation allowance release of $
0
.
For the Predecessor year ended September 30, 2017, the Company recorded a net valuation allowance release of
$
1
related to the Company's non-life companies.
The Company records tax expense (benefit) that results from a change in Other Comprehensive Income (“OCI”) directly to OCI. Tax expense recorded directly to OCI includes deferred tax expense arising from a change in unrealized gain (loss) on available-for-sale securities and the tax-effects of other income items that are recorded to OCI. Changes in valuation allowance that are solely due to a deferred tax asset related to the unrealized gain on an available-for-sale security are allocated to other comprehensive income in accordance with ASC 740-10-45-20, "Income Taxes: Other Presentation Matters".
The Company recorded the following deferred tax expense to OCI:
|
|
Year ended
|
Year ended
|
|||||||||||||||||||||||
|
|
December 31, 2019
|
December 31, 2018
|
Period from December 1 to December 31, 2017
|
Period from October 1 to November 30, 2017
|
Period from October 1 to December 31, 2016 (Unaudited)
|
September 30, 2017
|
|||||||||||||||||||
|
Predecessor
|
Predecessor
|
Predecessor
|
|||||||||||||||||||||||
|
Deferred Tax Expense in OCI
|
$
|
(
|
)
|
$
|
|
|
$
|
(
|
)
|
$
|
(
|
)
|
$
|
|
|
$
|
(
|
)
|
|||||||
An excess tax benefit is the realized tax benefit related to the amount of deductible compensation cost reported on an employer’s tax return for equity instruments in excess of the compensation cost for those instruments recognized for financial reporting purposes. The Company adopted ASU-2016-09 (Stock Compensation) effective October 1, 2015. ASU-2016-09 eliminates the requirement for excess tax benefits to be recorded as additional paid-in capital when realized. For the years ended
December 31, 2019
and
December 31, 2018
, the period from December 1, 2017 to December 31, 2017, the Predecessor period from October 1, 2017 to November 30, 2017, the Predecessor period from October 1, 2016 to December 31, 2016 (unaudited), and the Predecessor year ended September 30, 2017, the Company recorded all excess tax benefits in the Consolidated Statements of Operations as a component of current income tax expense in accordance with the newly adopted guidance.
The following table is a summary of the components of deferred income tax assets and liabilities:
F-72
|
|
December 31, 2019
|
December 31, 2018
|
|||||
|
Deferred tax assets:
|
|||||||
|
Net operating loss, credit and capital loss carryforwards
|
$
|
|
|
$
|
|
|
|
|
Insurance reserves and claim related adjustments
|
|
|
|
|
|||
|
Unrealized Investment Losses
|
|
|
|
|
|||
|
Derivatives
|
|
|
|
|
|||
|
Deferred acquisition costs
|
|
|
|
|
|||
|
Funds held under Reinsurance Agreements
|
|
|
|
|
|||
|
Other
|
|
|
|
|
|||
|
Valuation allowance
|
(
|
)
|
(
|
)
|
|||
|
Total deferred tax assets
|
$
|
|
|
$
|
|
|
|
|
Deferred tax liabilities:
|
|||||||
|
Value of business acquired
|
$
|
(
|
)
|
$
|
(
|
)
|
|
|
Unrealized Investment Gains
|
(
|
)
|
|
|
|||
|
Investments
|
(
|
)
|
(
|
)
|
|||
|
Derivatives
|
(
|
)
|
|
|
|||
|
Deferred acquisition costs
|
(
|
)
|
(
|
)
|
|||
|
Transition reserve on new reserve method
|
(
|
)
|
(
|
)
|
|||
|
Funds held under Reinsurance Agreements
|
|
|
(
|
)
|
|||
|
Other
|
(
|
)
|
(
|
)
|
|||
|
Total deferred tax liabilities
|
$
|
(
|
)
|
$
|
(
|
)
|
|
|
Net deferred tax assets and (liabilities)
|
$
|
|
|
$
|
|
|
|
For the year ended
December 31, 2019
, the Company's valuation allowance of $
14
consisted of a full valuation allowance on the Company's non-life insurance net deferred taxes, and a full valuation allowance on FSRC's capital net deferred taxes.
For the year ended
December 31, 2018
, the Company's valuation allowance of
$
154
consisted of a valuation allowance of
$
115
on US life company unrealized capital loss deferred tax assets, a full valuation allowance on the Company's non-life insurance net deferred taxes, and a full valuation allowance on FSRC's net deferred taxes.
For the period from December 1, 2017 to December 31, 2017, the Company’s valuation allowance of
$
15
consisted of a valuation allowance of
$
0
on US life company deferred tax assets, a full valuation allowance on the Company’s non-life insurance net deferred taxes, and a full valuation allowance on FSRC's net deferred taxes.
As of
December 31, 2019
, the Company has NOL carryforwards of
$
165
, consisting of NOL carryforwards of
$
113
on the US life companies and
$
52
on FSRC. A portion of the FSRC losses existed prior to the November 30, 2017 acquisition and are therefore subject to Section 382 limitations. The FSRC NOL carryforwards that existed prior to January 1, 2018 of $31 will expire in years 2031 - 2032, if unused. The remaining NOLs are not subject to any limitation and have an indefinite carryforward period.
F-73
(12)
Commitments and Contingencies
Commitments
The Company has unfunded investment commitments as of
December 31, 2019
based upon the timing of when investments are executed compared to when the actual investments are funded, as some investments require that funding occur over a period of months or years. A summary of unfunded commitments by invested asset class are included below:
|
December 31, 2019
|
||||
|
Asset Type
|
||||
|
Other invested assets
|
$
|
|
|
|
|
Equity securities
|
|
|
||
|
Fixed maturity securities, available-for-sale
|
|
|
||
|
Other assets
|
|
|
||
|
Residential mortgage loans
|
16
|
|
||
|
Total
|
$
|
|
|
|
As of
December 31, 2019
, the Company had unfunded commitments in affiliated investments which are included in the table above. See "Note 14. Related Party Transactions" for further information.
The Company leases office space under non-cancelable operating leases that expire in May 2021 and January 2031. Rent expense and minimum rental commitments under non-cancelable leases are immaterial.
Contingencies
Regulatory and Litigation Matters
The Company is involved in various pending or threatened legal proceedings, including purported class actions, arising in the ordinary course of business. In some instances, these proceedings include claims for unspecified or substantial punitive damages and similar types of relief in addition to amounts for alleged contractual liability or requests for equitable relief. In the opinion of the Company's management and in light of existing insurance and other potential indemnification, reinsurance and established accruals, such litigation is not expected to have a material adverse effect on the Company's financial position, although it is possible that the results of operations and cash flows could be materially affected by an unfavorable outcome in any one period.
The Company is assessed amounts by state guaranty funds to cover losses to policyholders of insolvent or rehabilitated insurance companies. Those mandatory assessments may be partially recovered through a reduction in future premium taxes in certain states. At
December 31, 2019
, the Company has accrued
$
2
for guaranty fund assessments that is expected to be offset by estimated future premium tax deductions of
$
2
.
The Company has received inquiries from a number of state regulatory authorities regarding our use of the U.S. Social Security Administration’s Death Master File (“Death Master File”) and compliance with state claims practices regulations and unclaimed property or escheatment laws. We have established procedures to periodically compare our in-force life insurance and annuity policies against the Death Master File or similar databases; investigate any identified potential matches to confirm the death of the insured; determine whether benefits are due, and attempt to locate the beneficiaries of any benefits due or, if no beneficiary can be located, escheat the benefit to the state as unclaimed property. We believe we have established sufficient reserves with respect to these matters; however, it is possible that third parties could dispute these amounts and additional payments or additional unreported claims or liabilities could be identified which could be significant and could have a material adverse effect on our results of operations.
F-74
On June 30, 2017, a putative class action complaint was filed against FGL Insurance, FGL, and FS Holdco II Ltd in the United States District Court for the District of Maryland, captioned
Brokerage Insurance Partners v. Fidelity & Guaranty Life Insurance Company, Fidelity & Guaranty Life, FS Holdco II Ltd, and John Doe,
No. 17-cv-1815. The complaint alleges that FGL Insurance breached the terms of its agency agreement with Brokerage Insurance Partners (“BIP”) and other agents by changing certain compensation terms. The complaint asserts, among other causes of action, breach of contract, defamation, tortious interference with contract, negligent misrepresentation, and violation of the Racketeer Influenced and Corrupt Organizations Act (“RICO”). The complaint seeks to certify a class composed of all persons who entered into an agreement with FGL Insurance to sell life insurance and who sold at least one life insurance policy between January 1, 2015 and January 1, 2017. The complaint seeks unspecified compensatory, consequential, and punitive damages in an amount not presently determinable, among other forms of relief.
On September 1, 2017, FGL Insurance filed a counterclaim against BIP and John and Jane Does 1-10, asserting, among other causes of action, breach of contract, fraud, civil conspiracy and violations of RICO. On September 22, 2017, Plaintiff filed an Amended Complaint, and on October 16, 2017, FGL Insurance filed an Amended Counterclaim against BIP, Agent Does 1-10, and Other Person Does 1-10. The parties also filed cross-Motions to Dismiss in Part.
On August 17, 2018, the Court in the BIP Litigation denied all pending Motions to Dismiss filed by all parties without prejudice, pending a decision as to whether the BIP Litigation will be consolidated into related litigation, captioned
Fidelity & Guaranty Life Insurance Company v. Network Partners,
et al., Case No. 17-cv-1508. On August 31, 2018, FGL Insurance filed its Answer to BIP’s Amended Complaint. Also on that date, FGL Insurance filed its Answer to Amended Complaint, Affirmative Defenses, and Counterclaim, Filed Pursuant to Fed. R. Civ. P. 12(a)(4)(A).
On October 15, 2019, BIP filed with the Court an Unopposed Motion for Preliminary Approval of Settlement and Class Certification, along with a copy of the Class Action Settlement Agreement signed by all parties. A Fairness Hearing on Plaintiff’s Motion for Preliminary Approval of Class Settlement was held on Monday, January 13, 2020.
On January 15, 2020, the Court issued the Modified Findings and Order Preliminarily Approving Class Settlement Between Plaintiff and Defendants, Granting Conditional Certification of Settlement Class, Directing Issuance of Notice to the Class, and Setting of Final Approval Hearing. In preliminarily approving the Class Settlement, the Court also approved the Settlement Schedule that had been filed by Class Counsel on January 10, 2020.
Final settlement is subject to, among other requirements, satisfactory completion of confirmatory discovery by the Defendants and the Class Representative and final approval by the Court after Court-approved Notice has been provided to the absent members of the putative class.
As of the date of this report, the Company does not have sufficient information to determine whether it has exposure to any losses that would be either probable or reasonably estimable.
(13)
Reinsurance
The Company reinsures portions of its policy risks with other insurance companies. The use of indemnity reinsurance does not discharge an insurer from liability on the insurance ceded. The insurer is required to pay in full the amount of its insurance liability regardless of whether it is entitled to or able to receive payment from the reinsurer. The portion of risks exceeding the Company's retention limit is reinsured. The Company primarily seeks reinsurance coverage in order to limit its exposure to mortality losses and enhance capital management. The Company follows reinsurance accounting when there is adequate risk transfer. Otherwise, the deposit method of accounting is followed. The Company also assumes policy risks from other insurance companies.
F-75
The effect of reinsurance on net premiums earned and net benefits incurred (benefits incurred and reserve changes) for the years ended
December 31, 2019
and
December 31, 2018
, the period from December 1, 2017 to December 31, 2017, the Predecessor period from October 1, 2017 to November 30, 2017, the Predecessor period from October 1, 2016 to December 31, 2016 (unaudited), and the Predecessor year ended September 30, 2017 were as follows:
|
Year ended
|
Period from December 1 to December 31, 2017
|
||||||||||||||||||||||
|
December 31, 2019
|
December 31, 2018
|
||||||||||||||||||||||
|
Net Premiums Earned
|
Net Benefits Incurred
|
Net Premiums Earned
|
Net Benefits Incurred
|
Net Premiums Earned
|
Net Benefits Incurred
|
||||||||||||||||||
|
Direct
|
$
|
|
|
$
|
|
|
$
|
|
|
$
|
|
|
$
|
|
|
$
|
|
|
|||||
|
Assumed
|
|
|
(
|
)
|
|
|
(
|
)
|
|
|
|
|
|||||||||||
|
Ceded
|
(
|
)
|
(
|
)
|
(
|
)
|
(
|
)
|
(
|
)
|
(
|
)
|
|||||||||||
|
Net
|
$
|
|
|
$
|
|
|
$
|
|
|
$
|
|
|
$
|
|
|
$
|
|
|
|||||
|
Period from October 1 to November 30, 2017
|
Period from October 1 to December 31, 2016 (Unaudited)
|
Year ended
|
|||||||||||||||||||||
|
September 30, 2017
|
|||||||||||||||||||||||
|
Predecessor
|
Predecessor
|
Predecessor
|
|||||||||||||||||||||
|
Net Premiums Earned
|
Net Benefits Incurred
|
Net Premiums Earned
|
Net Benefits Incurred
|
Net Premiums Earned
|
Net Benefits Incurred
|
||||||||||||||||||
|
Direct
|
$
|
|
|
$
|
|
|
$
|
|
|
$
|
|
|
$
|
|
|
$
|
|
|
|||||
|
Assumed
|
|
|
|
|
|
|
|
|
|
|
|
|
|||||||||||
|
Ceded
|
(
|
)
|
(
|
)
|
(
|
)
|
(
|
)
|
(
|
)
|
(
|
)
|
|||||||||||
|
Net
|
$
|
|
|
$
|
|
|
$
|
|
|
$
|
|
|
$
|
|
|
$
|
|
|
|||||
Amounts payable or recoverable for reinsurance on paid and unpaid claims are not subject to periodic or maximum limits. The Company did not write off any significant reinsurance balances during the years ended
December 31, 2019
and
December 31, 2018
, the period from December 1, 2017 to December 31, 2017, the Predecessor period from October 1, 2017 to November 30, 2017, or the Predecessor year ended September 30, 2017. The Company did not commute any ceded reinsurance during the years ended
December 31, 2019
and
December 31, 2018
, the period from December 1, 2017 to December 31, 2017, the Predecessor period from October 1, 2017 to November 30, 2017, or the Predecessor year ended September 30, 2017.
The Company has not entered into any reinsurance agreements in which the reinsurer may unilaterally cancel any reinsurance for reasons other than non-payment of premiums or other similar credit issues.
Effective January 1, 2017, FGL Insurance entered into an indemnity reinsurance agreement with Hannover Re, a third party reinsurer, to reinsure an inforce block of its FIA and fixed deferred annuity contracts with GMWB and Guaranteed Minimum Death Benefit (“GMDB”) guarantees. In accordance with the terms of this agreement, FGL Insurance cedes a quota share percentage of the net retention of guarantee payments in excess of account value for GMWB and GMDB guarantees. The effects of this agreement are not accounted for as reinsurance as it does not satisfy the risk transfer requirements for GAAP, since it is not “reasonably possible” that the reinsurer may realize significant loss from assuming the insurance risk. Effective July 1, 2017, FGL Insurance extended this agreement to include new business issued during 2017. Effective January 1, 2018, FGL Insurance extended this agreement to include new business issued during 2018 and extended the recapture period from 8 to 12 years. Effective January 1, 2019, FGL Insurance extended this agreement to include new business issued during 2019. FGL Insurance incurred risk charge fees of
$
17
,
$
11
,
$
2
,
$
2
and
$
4
during the years ended
December 31, 2019
and
December 31, 2018
, the period from December 1, 2017 to December 31, 2017, the Predecessor period from October 1, 2017 to November 30, 2017, and the Predecessor year ended September 30, 2017, respectively, in relation to this reinsurance agreement.
Effective December 31, 2018, FGL Insurance entered into a reinsurance agreement with Kubera to cede approximately
$
758
of certain MYGA and deferred annuity GAAP reserve on a coinsurance funds withheld basis, net of applicable existing reinsurance. In accordance with the terms of this agreement, FGL Insurance cedes a quota share percentage of MYGA and deferred annuity policies for certain issue years to Kubera. Effective June
F-76
30, 2019, FGL Insurance and Kubera executed a letter of intent to amend this agreement and cede an additional
$
185
of MYGA GAAP reserves on a coinsurance funds withheld basis via a quota share percentage of certain issue years. The amended reinsurance agreement was executed on July 31, 2019.
Effective December 31, 2018, FGL Insurance entered into a reinsurance agreement with Kubera to cede approximately
$
4
billion
of certain FIA statutory reserve on a coinsurance funds withheld basis, net of applicable existing reinsurance. In accordance with the terms of this agreement, FGL Insurance cedes a quota share percentage of FIA policies for certain issue years to Kubera. The effects of this agreement are not accounted for as reinsurance as it does not satisfy the risk transfer requirements for GAAP, since it is not “reasonably possible” that the reinsurer may realize significant loss from assuming the insurance risk. Effective June 30, 2019, FGL Insurance and Kubera executed a letter of intent to amend this agreement and cede an additional
$
1
billion
of FIA statutory reserves on a coinsurance funds withheld basis via a quota share percentage of certain issue years. The amended reinsurance agreement was executed on July 31, 2019. The effects of the amendment are also not accounted for as reinsurance as it does not satisfy the risk transfer requirements for GAAP.
Intercompany Reinsurance Agreements
A description of significant intercompany reinsurance agreements appears below. All intercompany balances have been eliminated in the preparation of the Company’s consolidated financial statements. However, these agreements have a material impact on the regulatory capital position of FGL Insurance and the effective tax rate of the Company.
Effective December 31, 2012, FGL Insurance entered into a reinsurance treaty with FSRC, an affiliated reinsurer, whereby FGL Insurance ceded
10
%
of its June 30, 2012 in-force annuity block of business not already reinsured on a funds withheld basis. Effective September 17, 2014, FGL Insurance entered into a second reinsurance treaty with FSRC whereby FGL Insurance ceded
30
%
of any new business of its MYGA issued effective September 17, 2014 and later on a funds withheld basis. The September 17, 2014 treaty was subsequently terminated as to new business effective April 30, 2015, but will remain in effect for policies ceded to FSRC with an effective date between September 17, 2014 and April 30, 2015. Accordingly, MYGA policies issued with an effective date of May 1, 2015 and later will not be ceded to FSRC.
In anticipation of the merger of CF Corp. and FGL, a new Bermuda based reinsurance entity, F&G Life Re Ltd. (“F&G Life Re”) was formed as an indirect wholly owned subsidiary of the Company. Effective December 1, 2017, FGL Insurance entered into an indemnity modified coinsurance agreement with F&G Life Re to reinsure up to
80
%
of its in-force FIA business and
40
%
of its in-force deferred annuity business on a net retained basis. Effective October 1, 2018, FGL Insurance and F&G Life Re mutually agreed to terminate this reinsurance agreement. Upon termination of the reinsurance agreement, F&G Life Re made a
$
1,094
extraordinary dividend to its sole shareholder, CF Bermuda of which
$
830
was contributed to FGL Insurance to support the recapture of the insurance liabilities and to allow FGL Insurance to maintain appropriate solvency ratios. The
$
1,094
extraordinary dividend included
$
750
return of capital which was approved by the Bermuda Monetary Authority (“BMA”).
Effective October 1, 2012, FGL Insurance entered into a reinsurance treaty with Raven Reinsurance Company ("Raven Re"), its wholly-owned captive reinsurance company, to cede the Commissioners Annuity Reserve Valuation Method (CARVM) liability for annuity benefits where surrender charges are waived. In connection with the CARVM reinsurance agreement, FGL Insurance and Raven Re entered into an agreement with Nomura Bank International plc (“NBI”) to establish a
$
295
reserve financing facility in the form of a letter of credit issued by NBI.
Effective January 1, 2019, the letter of credit facility was amended to reduce the available amount to
$
100
and extend the termination date to October 1, 2022, although the facility may terminate earlier, in accordance with the terms of the Reimbursement Agreement. Under the terms of the reimbursement agreement, in the event the letter of credit is drawn upon, Raven Re is required to repay the amounts utilized, and FGLH is obligated to repay the amounts utilized if Raven Re fails to make the required reimbursement. FGLH also is required to make capital contributions to Raven Re in the event that Raven Re’s statutory capital and surplus falls below certain defined levels. As of December 31, 2019 and 2018, Raven Re’s statutory capital and surplus was
$
33
and
$
20
, respectively, in excess of the minimum level required under the Reimbursement Agreement.
As this letter of credit is provided by an unaffiliated financial institution, Raven Re is permitted to carry the letter of credit as an admitted asset on the Raven Re statutory balance sheet.
F-77
F&G Reinsurance Companies
FSRC has entered into various reinsurance agreements on a funds withheld basis, meaning that funds are withheld by the ceding company from the coinsurance premium owed to FSRC as collateral for FSRC's payment obligations. Accordingly, the collateral assets remain under the ultimate ownership of the ceding company. FSRC manages the assets supporting the reserves assumed in accordance with the internal investment policy of the ceding companies and applicable law.
At
December 31, 2019
and
2018
, FSRC had
$
307
and
$
275
of funds withheld receivables and
$
285
and
$
254
of insurance reserves related to these reinsurance treaties, respectively.
F&G Re has entered into multiple reinsurance agreements on a funds withheld basis with unaffiliated parties. At
December 31, 2019
and
December 31, 2018
, F&G Re had
$
1,865
and
$
482
of funds withheld receivables, respectively, and
$
1,668
and
$
471
, respectively, of insurance reserves related to these reinsurance treaties. Effective April 1, 2019, F&G Re entered into a reinsurance agreement with an unaffiliated company to reinsure an inforce block of fixed deferred annuity contracts on a 100% coinsurance funds withheld basis. In accordance with the terms of this agreement, F&G Re established a fair value of funds withheld asset and future policy benefits liability of
$
983
and
$
896
, respectively.
See a description of FSRC’s and F&G Re's accounting policy for its assumed reinsurance contracts as described under the section titled "Reinsurance" in Note 2. Significant Accounting Policies and Practices.
(14)
Related Party Transactions
Affiliated Investments
The Company has determined that related parties would fall into the following categories; (i) affiliates of the entity, (ii) entities for which investments in their equity securities would be required to be accounted for by the equity method by the investing entity, (iii) trusts for the benefit of employees, such as pension and profit-sharing trusts that are managed by or under the trusteeship of management, (iv) principal owners (>10% equity stake) of the entity and members of their immediate families, (v) management (including BOD, CEO, and other persons responsible for achieving the objectives of the entity and who have the authority to establish policies and make decisions) of the entity and other members of their immediate families, (vi) other parties with which the entity may deal if one party controls or can significantly influence the management or operating policies of the other to an extent that one of the transacting parties might be prevented from fully pursuing its own separate interests (vii) other parties that can significantly influence management or operating policies of the transacting parties or that have an ownership interest in one of the transacting parties and can significantly influence the other to an extent that one or more of the transacting parties might be prevented from fully pursuing its own separate business, (viii) attorney in fact of a reciprocal reporting entity or any affiliate of the attorney in fact, and (ix) a U.S. manager of a U.S. branch or any affiliate of the U.S. manager of a U.S. branch. The Company has determined that for the years ended
December 31, 2019
and
December 31, 2018
, the Blackstone Group LP ("Blackstone") and its affiliates as well as the FGL Holdings’ directors and officers (along with their immediate family members) are FGL Holdings' related parties.
FGL Insurance, and certain subsidiaries of the Company, entered into investment management agreements (“IMAs”) with Blackstone ISG-I Advisors LLC (“BISGA”), a wholly-owned subsidiary of Blackstone on December 1, 2017. On December 31, 2019, to be effective as of October 31, 2019, FGL Insurance and certain subsidiaries of the Company entered into amended and restated IMAs (the “Restated IMAs”) with BISGA, pursuant to which BISGA was appointed as investment manager of the Company’s general accounts (the “F&G Accounts”). Pursuant to the terms of the IMAs, BISGA may delegate any or all of its discretionary investment, advisory and other rights, powers, functions and obligations under the IMAs to one or more sub-managers, including its affiliates. BISGA delegated certain investment services to its affiliates, Blackstone Real Estate Special Situations Advisors L.L.C. (“BRESSA”) and GSO Capital Advisors II LLC (“GSO Capital Advisors”), pursuant to sub-management agreements executed between BISGA and each of BRESSA and GSO Capital Advisors. For the year ended December 31, 2019, the fees paid to BISGA under the Restated IMAs and the IMAs were approximately
$
95
. As of
December 31, 2019
and
2018
, the Company has a net liability of
$
47
and
$
20
, respectively, for the services consumed under the Restated IMAs, the IMAs and related sub-management agreements, partially offset by fees received and expense reimbursements from BISGA.
F-78
During the years ended
December 31, 2019
and
December 31, 2018
, the Company received expense reimbursements from BISGA for the services consumed under these agreements. Fees received for these types of services are
$
10
and
$
9
for years ended
December 31, 2019
and
December 31, 2018
.
The Company holds certain fixed income security interests, limited partnerships and bank loans issued by portfolio companies that are affiliates of Blackstone Tactical Opportunities, an affiliate of Blackstone Tactical Opportunities LR Associates-B (Cayman) Ltd (the “Blackstone Fixed Income Securities”) both on a direct and indirect basis. Indirect investments include an investment made in an affiliates’ asset backed fund while direct investments are an investment in affiliates' equity or debt securities. As of
December 31, 2019
and
December 31, 2018
, the Company held
$
2,001
and
$
1,461
in affiliated investments, respectively, which includes foreign exchange unrealized loss of $
(
3
)
and $
(
2
)
, respectively. As of
December 31, 2019
and
December 31, 2018
, the Company had unfunded commitments relating to affiliated investments of
$
993
and
$
990
, respectively.
The Company purchased
$
89
and
$
185
of residential loans from Finance of America Holdings LLC, a Blackstone affiliate, during the year ended
December 31, 2019
and on December 17, 2018, respectively.
The Company earned $
112
, $
33
and $
1
net investment income for the years ended
December 31, 2019
and
December 31, 2018
, and the period from December 1, 2017 to December 31, 2017, respectively, on affiliated investments. The Company had
no
gross realized gains (losses) and realized impairment losses on related party investments during the years ended
December 31, 2019
and
December 31, 2018
and the period from December 1, 2017 to December 31, 2017.
F-79
(15)
Earnings Per Share
The following table sets forth the computation of basic and diluted earnings per share (share amounts in thousands):
|
Year Ended
|
Year ended
|
||||||||||||||||||||||||
|
December 31, 2019
|
December 31, 2018
|
Period from December 1 to December 31, 2017
|
Period from October 1 to November 30, 2017
|
Period from October 1 to December 31, 2016 (Unaudited)
|
September 30, 2017
|
||||||||||||||||||||
|
Predecessor
|
Predecessor
|
Predecessor
|
|||||||||||||||||||||||
|
Net income (loss)
|
$
|
|
|
$
|
|
|
$
|
(
|
)
|
$
|
|
|
$
|
|
|
$
|
|
|
|||||||
|
Less Preferred stock dividend
|
|
|
|
|
|
|
|
|
|
|
|
|
|||||||||||||
|
Net income (loss) available to common shares
|
|
|
(
|
)
|
(
|
)
|
|
|
|
|
|
|
|||||||||||||
|
Weighted-average common shares outstanding - basic
|
|
|
|
|
|
|
|
|
|
|
|
|
|||||||||||||
|
Dilutive effect of unvested restricted stock & PRSU
|
|
|
|
|
|
|
|
|
|
|
|
|
|||||||||||||
|
Dilutive effect of stock options
|
|
|
|
|
|
|
|
|
|
|
|
|
|||||||||||||
|
Weighted-average shares outstanding - diluted
|
|
|
|
|
|
|
|
|
|
|
|
|
|||||||||||||
|
Net income (loss) per common share:
|
|||||||||||||||||||||||||
|
Basic
|
$
|
|
|
$
|
(
|
)
|
$
|
(
|
)
|
$
|
|
|
$
|
|
|
$
|
|
|
|||||||
|
Diluted
|
$
|
|
|
$
|
(
|
)
|
$
|
(
|
)
|
$
|
|
|
$
|
|
|
$
|
|
|
|||||||
The calculation of diluted earnings per share excludes the incremental effect of warrants, preferred shares and options due to their anti-dilutive effect for the following periods:
|
Year Ended
|
Year ended
|
||||||||||||
|
December 31, 2019
|
December 31, 2018
|
Period from December 1 to December 31, 2017
|
Period from October 1 to November 30, 2017
|
Period from October 1 to December 31, 2016 (Unaudited)
|
September 30, 2017
|
||||||||
|
(in thousands)
|
Predecessor
|
Predecessor
|
Predecessor
|
||||||||||
|
Warrants
|
|
|
|
|
|
|
|||||||
|
Preferred shares
|
|
|
|
|
|
|
|||||||
|
Options and restricted shares
|
|
|
|
|
|
|
|||||||
Under applicable accounting guidance, companies in a loss position are required to use basic weighted average common shares outstanding in the calculation of diluted loss per share. Therefore, as a result of our net loss for the year ended
December 31, 2018
, we were required to use basic weighted-average common shares outstanding in the calculation of the year ended
December 31, 2018
diluted loss per share, as the inclusion of shares for restricted stock of
35
thousand
would have been antidilutive to the calculation. If we had not incurred a net loss in the year ended
December 31, 2018
, dilutive potential common shares would have been
216
million
.
F-80
(16)
Insurance Subsidiary Financial Information and Regulatory Matters
The Company’s U.S. insurance subsidiaries file financial statements with state insurance regulatory authorities and the National Association of Insurance Commissioners (“NAIC”) that are prepared in accordance with Statutory Accounting Principles (“SAP”) prescribed or permitted by such authorities, which may vary materially from GAAP. Prescribed SAP includes the Accounting Practices and Procedures Manual of the NAIC as well as state laws, regulations and administrative rules. Permitted SAP encompasses all accounting practices not so prescribed. The principal differences between SAP financial statements and financial statements prepared in accordance with GAAP are that SAP financial statements do not reflect DAC, DSI and VOBA, some bond portfolios may be carried at amortized cost, assets and liabilities are presented net of reinsurance, contractholder liabilities are generally valued using more conservative assumptions and certain assets are non-admitted. Accordingly, SAP operating results and SAP capital and surplus may differ substantially from amounts reported in the GAAP basis financial statements for comparable items.
FSRC (Cayman), F&G Re (Bermuda) and F&G Life Re (Bermuda) file financial statements based on U.S. GAAP with their respective regulators.
The Company’s principal insurance subsidiaries’ statutory (SAP and GAAP) financial statements are based on a December 31 year end. Statutory net income and statutory capital and surplus of the Company’s wholly-owned insurance subsidiaries were as follows:
|
|
Subsidiary (state/country of domicile) (a)
|
|||||||||||
|
|
FGL Insurance (IA)
|
FGL NY Insurance (NY)
|
F&G Life Re (Bermuda)
|
|||||||||
|
Statutory Net Income (loss):
|
||||||||||||
|
Year ended December 31, 2019
|
$
|
|
|
$
|
(
|
)
|
$
|
|
|
|||
|
Year ended December 31, 2018
|
(
|
)
|
(
|
)
|
|
|
||||||
|
Statutory Capital and Surplus:
|
||||||||||||
|
December 31, 2019
|
$
|
|
|
$
|
|
|
$
|
|
|
|||
|
December 31, 2018
|
|
|
|
|
|
|
||||||
|
(a)
|
FGL NY Insurance is a subsidiary of FGL Insurance, and the columns should not be added together.
|
|
|
Subsidiary (state/country of domicile)
|
|||||||
|
|
FSR (Cayman)
|
F&G Re (Bermuda)
|
||||||
|
Statutory Net Income (loss):
|
||||||||
|
Year ended December 31, 2019
|
$
|
(
|
)
|
$
|
|
|
||
|
Year ended December 31, 2018
|
(
|
)
|
(
|
)
|
||||
|
Statutory Capital and Surplus:
|
||||||||
|
December 31, 2019
|
$
|
|
|
$
|
|
|
||
|
December 31, 2018
|
|
|
|
|
||||
Capital Requirements and Restrictions on Dividends and Distribution
U.S. Companies
The amount of statutory capital and surplus necessary to satisfy the applicable regulatory requirements is less than FGL Insurance’s and FGL NY Insurance’s respective statutory capital and surplus.
Life insurance companies domiciled in the U.S. are subject to certain Risk-Based Capital (“RBC”) requirements as specified by the NAIC. The RBC is used to evaluate the adequacy of capital and surplus maintained by an insurance company in relation to risks associated with: (i) asset risk, (ii) insurance risk, (iii) interest rate risk and (iv) business risk. The Company monitors the RBC of FGLH’s insurance subsidiaries. As of
December 31, 2019
and
December 31, 2018
, each of FGLH's insurance subsidiaries had exceeded the minimum RBC requirements.
The Company’s insurance subsidiaries domiciled in the U.S. are restricted by state laws and regulations as to the amount of dividends they may pay to their parent without regulatory approval in any year, the purpose of which is to protect affected insurance policyholders, depositors or investors. Any dividends in excess of limits are deemed “extraordinary” and require regulatory approval. In addition, and pursuant to an order issued in connection with the approval of the Merger Agreement by the Iowa Commissioner on November 28, 2017, FGL Insurance shall not pay any dividend or other distribution to shareholders prior to November 28, 2021 without the prior
F-81
approval of the Iowa Commissioner. In September 2019 and December 2019, upon approval by the Iowa Commissioner, FGL Insurance declared and paid, respectively, extraordinary dividends of
$
100
to its Parent, FGLH.
FGL Insurance applies Iowa-prescribed accounting practices that permit Iowa-domiciled insurers to report equity call options used to economically hedge FIA index credits at amortized cost for statutory accounting purposes and to calculate FIA statutory reserves such that index credit returns will be included in the reserve only after crediting to the annuity contract. This resulted in a
$
110
decrease and
$
30
increase to statutory capital and surplus at
December 31, 2019
and
December 31, 2018
, respectively.
Raven Re is also permitted to follow Iowa prescribed statutory accounting practice for its reserves on reinsurance assumed from FGL Insurance which increased Raven Re’s statutory capital and surplus by
$
6
and
$
0
at
December 31, 2019
and
December 31, 2018
, respectively. Without such permitted statutory accounting practices Raven Re’s statutory capital and (deficit) surplus would be
$(
19
)
and
$(
16
)
at
December 31, 2019
and
December 31, 2018
, respectively, and its risk-based capital would fall below the minimum regulatory requirements. The letter of credit facility is collateralized by NAIC 1 rated debt securities. If the permitted practice was revoked, the letter of credit could be replaced by the collateral assets with Nomura’s consent. FGL Insurance’s statutory carrying value of Raven Re at
December 31, 2019
and
December 31, 2018
was
$
87
and
$
94
, respectively.
Effective April 1, 2019, Raven Re and FGL Insurance executed the third amended and restated Reinsurance Agreement (the "CARVM treaty"). The amendment allowed Raven Re to declare and pay a one-time dividend of up to
$
30
to FGL Insurance provided that the dividend was paid on or before June 30, 2020 and subject to other provisions outlined in the amendment. The Vermont Department of Financial Regulation approved the amendment on April 15, 2019. Pursuant to the provisions of the amended CARVM treaty, Raven Re paid a
$
20
dividend to FGL Insurance in June 2019.
FGL Insurance’s statutory carrying value of Raven Re reflects the effect of permitted practices Raven Re received to treat the available amount of a letter of credit as an admitted asset which increased Raven Re’s statutory capital and surplus by
$
100
and
$
110
at
December 31, 2019
and
December 31, 2018
, respectively.
Pursuant to an order issued in connection with the Merger agreements, F&G Life Re will not, for a period of three (3) years from November 28, 2017, declare, set aside or distribute any dividends or distributions other than solely (a) dividends or distributions that would be permitted in accordance with Section 521A.5(3) of the Iowa Code if F&G Life Re were a life insurance company domesticated in Iowa, upon prior written notice to the Iowa Commissioner, but limited only to the amount necessary to service interest payments on outstanding indebtedness and other obligations of CF Bermuda and FGLH, and (b) dividends or distributions upon written notice to, and with the prior written approval of, the Iowa Commissioner.
The prescribed and permitted statutory accounting practices have no impact on the Company’s unaudited condensed consolidated financial statements which are prepared in accordance with GAAP.
As of
December 31, 2019
, FGL NY Insurance did not follow any prescribed or permitted statutory accounting practices that differ from the NAIC's statutory accounting practices.
On May 14, 2018, FGLH made a dividend payment of
$
27
to FGL US Holdings, Inc. ("FGL US Holdings"). On June 28, 2018, FGL US Holdings issued a
$
65
intercompany note to F&G Life Re and subsequently approved a
$
65
capital contribution to its wholly owned subsidiary, FGLH. On June 28, 2018, FGLH made a capital contribution for
$
125
to FGL Insurance. On July 3, 2018, CF Bermuda issued a
$
50
intercompany note to F&G Life Re and subsequently approved a
$
50
capital contribution to its wholly owned subsidiary, F&G Re. On April 3, 2019, CF Bermuda made a capital contribution of
$
2
to Freestone. In 2019, CF Bermuda made capital contributions of
$
198
to F&G Re.
Non-U.S. companies
As licensed class C insurers in Bermuda, F&G Life Re and F&G Re are required to maintain available capital and surplus at a level equal to or in excess of the applicable enhanced capital requirement ("ECR"), which is established by reference to either the applicable Bermuda Solvency Capital Requirements ("BSCR") model or an approved internal capital model. Furthermore, to enable the Bermuda Monetary Authority ("BMA") to better assess the quality of the insurer’s capital resources, a Class C insurer is required to disclose the makeup of its capital in accordance with its 3-tiered capital system. An insurer may file an application under the Insurance Act to have the aforementioned ECR requirements waived.
In addition to the requirements under the Companies Act (as discussed below), the Insurance Act limits the maximum amount of annual dividends and distributions that may be paid or distributed by F&G Life Re and F&G Re without prior regulatory approval.
F-82
F&G Life Re and F&G Re are prohibited from declaring or paying a dividend if it fails to meet its minimum solvency margin, or ECR, or if the declaration or payment of such dividend would cause such breach. Additionally, annual distributions that would result in a reduction of the insurer’s prior year-end balance of statutory capital and surplus by more than
25%
also requires the prior approval of the BMA.
If F&G Life Re or F&G Re were to fail to meet its minimum solvency margin on the last day of any financial year, it would be prohibited from declaring or paying any dividends during the next financial year without the approval of the BMA.
In addition, as Class C insurers, each of F&G Life Re and F&G Re must: (i) not make any payment from its long-term business fund for any purpose other than a purpose of the insurer’s long-term business, except in so far as such payment can be made out of any surplus certified by the insurer’s approved actuary to be available for distribution otherwise than to policyholders; and (ii) not declare or pay a dividend to any person other than a policyholder unless the value of the assets of its long-term business fund, as certified by the insurer’s approved actuary, exceeds the extent (as to certified) of the liabilities of the insurer’s long-term business. In the event a dividend complies with the above, each of F&G Life Re and F&G Re must ensure the amount of any such dividend does not exceed the aggregate of (i) that excess and (ii) any other funds properly available for the payment of dividend, being funds arising out of business of the insurer other than long-term business.
The Companies Act also limits F&G Life Re’s and F&G Re’s ability to pay dividends and make distributions to its shareholders. Each of F&G Life Re and F&G Re is not permitted to declare or pay a dividend, or make a distribution out of its contributed surplus, if it is, or would after the payment be, unable to pay its liabilities as they become due or if the realizable value of its assets would be less than its liabilities.
The laws and regulations of the Cayman Islands require that, among other things, FSRC maintain minimum levels of statutory capital, surplus and liquidity, meet solvency standards, submit to periodic examinations of its financial condition and restrict payments of dividends and reductions of capital. Statutes, regulations and policies that FSRC is subject to may also restrict the ability of FSRC to write insurance and reinsurance policies, make certain investments and distribute funds. Any failure to meet the applicable requirements or minimum statutory capital requirements could subject it to further examination or corrective action by Cayman Islands Monetary Authority ("CIMA"), including restrictions on dividend payments, limitations on our writing of additional business or engaging in finance activities, supervision or liquidation.
F-83
(17)
Other Liabilities
Other liabilities consisted of the following:
|
|
December 31, 2019
|
December 31, 2018
|
|||||
|
Amounts payable for investment purchases
|
$
|
|
|
$
|
|
|
|
|
Retained asset account
|
|
|
|
|
|||
|
Option collateral liabilities
|
|
|
|
|
|||
|
Remittances and items not allocated
|
|
|
|
|
|||
|
Accrued expenses
|
|
|
|
|
|||
|
Deferred reinsurance revenue
|
|
|
|
|
|||
|
Unearned revenue liability
|
|
|
|
|
|||
|
Preferred shares reimbursement feature embedded derivative
|
|
|
|
|
|||
|
Negative cash liability
|
|
|
|
|
|||
|
Commissions payable
|
|
|
|
|
|||
|
Funds withheld embedded derivative
|
|
|
|
|
|||
|
Rabbi trust investment
|
|
|
|
|
|||
|
Other
|
|
|
(
|
)
|
|||
|
Total
|
$
|
|
|
$
|
|
|
|
(18)
Quarterly Results (Unaudited)
Unaudited q
uarterly results of operations are summarized below.
|
Quarter ended
|
|||||||||||||||
|
December 31, 2019
|
September 30, 2019
|
June 30, 2019
|
March 31, 2019
|
||||||||||||
|
(Dollars in millions, except per share data)
|
|||||||||||||||
|
Premiums
|
$
|
|
|
$
|
|
|
$
|
|
|
$
|
|
|
|||
|
Net investment income
|
|
|
|
|
|
|
|
|
|||||||
|
Net investment gains (losses)
|
|
|
|
|
|
|
|
|
|||||||
|
Insurance and investment product fees and other
|
|
|
|
|
|
|
|
|
|||||||
|
Total revenues
|
|
|
|
|
|
|
|
|
|||||||
|
Total benefits and expenses
|
|
|
|
|
|
|
|
|
|||||||
|
Net income (loss)
|
|
|
|
|
|
|
|
|
|||||||
|
Net income (loss) per common share - basic
|
|
|
|
|
|
|
|
|
|||||||
|
Net income (loss) per common share - diluted
|
|
|
|
|
|
|
|
|
|||||||
|
Quarter ended
|
|||||||||||||||
|
December 31, 2018
|
September 30, 2018
|
June 30, 2018
|
March 31, 2018
|
||||||||||||
|
(Dollars in millions, except per share data)
|
|||||||||||||||
|
Premiums
|
$
|
|
|
$
|
|
|
$
|
|
|
$
|
|
|
|||
|
Net investment income
|
|
|
|
|
|
|
|
|
|||||||
|
Net investment gains (losses)
|
(
|
)
|
|
|
(
|
)
|
(
|
)
|
|||||||
|
Insurance and investment product fees and other
|
|
|
|
|
|
|
|
|
|||||||
|
Total revenues
|
(
|
)
|
|
|
|
|
|
|
|||||||
|
Total expenses
|
(
|
)
|
|
|
|
|
|
|
|||||||
|
Net income (loss)
|
(
|
)
|
|
|
|
|
|
|
|||||||
|
Net income (loss) per common share - basic
|
(
|
)
|
|
|
|
|
|
|
|||||||
|
Net income (loss) per common share - diluted
|
(
|
)
|
|
|
|
|
|
|
|||||||
F-84
The equity market volatility subsequent to December 31, 2019 has the potential to materially impact the fair value of the Company’s invested assets, including derivatives, and policyholder liabilities. In addition, a disruption in the financial and credit markets increases the risk of credit defaults. As of the date of this filing, the Company has not quantified the impact of such equity market volatility on its consolidated financial statements.
F-85
Schedule I
FGL HOLDINGS
Summary of Investments - Other than Investments in Related Parties
December 31, 2019
(in millions)
|
Amortized Cost
|
Fair Value
|
Amount at which shown on the balance sheet
|
||||||||||
|
Fixed Maturities:
|
||||||||||||
|
Bonds:
|
||||||||||||
|
United States Government and government agencies and authorities
|
$
|
|
|
$
|
|
|
$
|
|
|
|||
|
States, municipalities and political subdivisions
|
|
|
|
|
|
|
||||||
|
Foreign governments
|
|
|
|
|
|
|
||||||
|
Public utilities
|
|
|
|
|
|
|
||||||
|
All other corporate bonds
|
|
|
|
|
|
|
||||||
|
Total fixed maturities
|
|
|
|
|
|
|
||||||
|
Equity securities:
|
||||||||||||
|
Common stocks:
|
||||||||||||
|
Banks, trust, and insurance companies
|
|
|
|
|
|
|
||||||
|
Industrial, miscellaneous and all other
|
|
|
|
|
|
|
||||||
|
Nonredeemable preferred stock
|
|
|
|
|
|
|
||||||
|
Total equity securities
|
|
|
|
|
|
|
||||||
|
Derivative investments
|
|
|
|
|
|
|
||||||
|
Mortgage loans
|
|
|
|
|
|
|
||||||
|
Other long-term investments
|
|
|
|
|
|
|
||||||
|
Total investments
|
$
|
|
|
$
|
|
|
$
|
|
|
|||
See Report of Independent Registered Public Accounting Firm.
F-86
Schedule II
FGL HOLDINGS (Parent Only)
CONDENSED BALANCE SHEETS
(in millions)
|
December 31, 2019
|
December 31, 2018
|
||||||
|
ASSETS
|
|||||||
|
Investments in consolidated subsidiaries
|
$
|
|
|
$
|
|
|
|
|
Fixed maturity securities, available for sale
|
|
|
|
|
|||
|
Cash and cash equivalents
|
|
|
|
|
|||
|
Total assets
|
$
|
|
|
$
|
|
|
|
|
LIABILITIES AND SHAREHOLDERS' EQUITY
|
|||||||
|
Other liabilities
|
|
|
|
|
|||
|
Total liabilities
|
|
|
|
|
|||
|
Shareholders' equity
|
|||||||
|
Preferred stock
|
|
|
|
|
|||
|
Common stock
|
|
|
|
|
|||
|
Additional paid in capital
|
|
|
|
|
|||
|
Retained earnings (accumulated deficit)
|
|
|
(
|
)
|
|||
|
Accumulated other comprehensive income (loss)
|
|
|
(
|
)
|
|||
|
Treasury stock
|
(
|
)
|
(
|
)
|
|||
|
Total shareholder's equity
|
|
|
|
|
|||
|
Total liabilities and shareholder's equity
|
$
|
|
|
$
|
|
|
|
See Report of Independent Registered Public Accounting Firm.
F-87
Schedule II
(continued)
FGL HOLDINGS (Parent Only)
CONDENSED STATEMENT OF OPERATIONS
(in millions)
|
Year ended
|
Year ended
|
|||||||||||||||||||||||
|
December 31, 2019
|
December 31, 2018
|
Period from December 1 to December 31, 2017
|
Period from October 1 to November 30, 2017
|
Period from October 1 to December 31, 2016 (Unaudited)
|
September 30, 2017
|
|||||||||||||||||||
|
Predecessor
|
Predecessor
|
Predecessor
|
||||||||||||||||||||||
|
Revenues
|
$
|
|
|
$
|
|
|
$
|
|
|
$
|
|
|
$
|
|
|
$
|
(
|
)
|
||||||
|
|
|
|
|
|
|
|
|
|
|
(
|
)
|
|||||||||||||
|
Operating expenses:
|
—
|
|
||||||||||||||||||||||
|
General and administrative expenses
|
(
|
)
|
|
|
|
|
|
|
|
|
|
|
||||||||||||
|
Total operating expenses
|
(
|
)
|
|
|
|
|
|
|
|
|
|
|
||||||||||||
|
Operating income (loss)
|
|
|
(
|
)
|
|
|
(
|
)
|
(
|
)
|
(
|
)
|
||||||||||||
|
Other income:
|
||||||||||||||||||||||||
|
Equity in net income of subsidiaries
|
|
|
|
|
(
|
)
|
|
|
|
|
|
|
||||||||||||
|
Income (loss) before income taxes
|
|
|
|
|
(
|
)
|
|
|
|
|
|
|
||||||||||||
|
Income tax expense
|
|
|
|
|
|
|
|
|
|
|
|
|
||||||||||||
|
Net income (loss)
|
$
|
|
|
$
|
|
|
$
|
(
|
)
|
$
|
|
|
$
|
|
|
$
|
|
|
||||||
See Report of Independent Registered Public Accounting Firm.
F-88
Schedule II
(continued)
FGL HOLDINGS (Parent Only)
CONDENSED STATEMENT OF CASH FLOWS
(in millions)
|
Year ended
|
Year ended
|
|||||||||||||||||||||||
|
December 31, 2019
|
December 31, 2018
|
Period from December 1 to December 31, 2017
|
Period from October 1 to November 30, 2017
|
Period from October 1 to December 31, 2016 (Unaudited)
|
September 30, 2017
|
|||||||||||||||||||
|
Cash flows from operating activities
|
||||||||||||||||||||||||
|
Net income (loss)
|
$
|
|
|
$
|
|
|
$
|
(
|
)
|
$
|
|
|
$
|
|
|
$
|
|
|
||||||
|
Adjustments to reconcile net income to net cash (used in) provided by operating activities:
|
||||||||||||||||||||||||
|
Realized capital and other gains on investments
|
|
|
|
|
|
|
|
|
|
|
|
|
||||||||||||
|
Equity in net income of subsidiaries
|
(
|
)
|
(
|
)
|
|
|
(
|
)
|
(
|
)
|
(
|
)
|
||||||||||||
|
Stock based compensation
|
|
|
|
|
|
|
|
|
|
|
|
|
||||||||||||
|
Changes in assets and liabilities:
|
||||||||||||||||||||||||
|
Other assets and other liabilities
|
(
|
)
|
|
|
|
|
|
|
|
|
|
|
||||||||||||
|
Net cash provided by (used in) operating activities
|
|
|
|
|
|
|
|
|
|
|
|
|
||||||||||||
|
Cash flows from investing activities:
|
||||||||||||||||||||||||
|
Proceeds from available-for-sale investments, sold, matured or repaid:
|
||||||||||||||||||||||||
|
Proceeds from available-for-sale investments, sold, matured or repaid:
|
|
|
|
|
|
|
|
|
|
|
|
|
||||||||||||
|
Cost of available-for-sale investments:
|
|
|
(
|
)
|
|
|
|
|
|
|
|
|
||||||||||||
|
Net cash provided by (used in) investing activities
|
|
|
(
|
)
|
|
|
|
|
|
|
|
|
||||||||||||
|
Cash flows from financing activities:
|
||||||||||||||||||||||||
|
Cash paid upon warrant tender and capitalized warrant tender costs
|
|
|
(
|
)
|
|
|
|
|
|
|
|
|
||||||||||||
|
Dividends payments
|
(
|
)
|
|
|
|
|
(
|
)
|
(
|
)
|
(
|
)
|
||||||||||||
|
Treasury stock
|
(
|
)
|
(
|
)
|
|
|
|
|
(
|
)
|
(
|
)
|
||||||||||||
|
Distribution to CF Bermuda and subsidiaries
|
|
|
|
|
(
|
)
|
|
|
|
|
(
|
)
|
||||||||||||
|
Net cash provided by (used in) financing activities
|
(
|
)
|
(
|
)
|
(
|
)
|
(
|
)
|
(
|
)
|
(
|
)
|
||||||||||||
|
Change in cash and cash equivalents
|
(
|
)
|
(
|
)
|
(
|
)
|
(
|
)
|
|
|
|
|
||||||||||||
|
Cash and cash equivalents at beginning of period
|
|
|
|
|
|
|
|
|
|
|
|
|
||||||||||||
|
Cash and cash equivalents at end of period
|
$
|
|
|
$
|
|
|
$
|
|
|
$
|
|
|
$
|
|
|
$
|
|
|
||||||
See Report of Independent Registered Public Accounting Firm.
F-89
Schedule III
FGL HOLDINGS
Supplementary Insurance Information
(in millions)
|
Year ended
|
Year ended
|
|||||||||||||||||||||||
|
December 31, 2019
|
December 31, 2018
|
Period from December 1 to December 31, 2017
|
Period from October 1 to November 30, 2017
|
Period from October 1 to December 31, 2016 (Unaudited)
|
September 30, 2017
|
|||||||||||||||||||
|
Predecessor
|
Predecessor
|
Predecessor
|
||||||||||||||||||||||
|
Life Insurance (single segment):
|
||||||||||||||||||||||||
|
Deferred acquisition costs
|
$
|
|
|
$
|
|
|
$
|
|
|
$
|
|
|
$
|
|
|
$
|
|
|
||||||
|
Future policy benefits, losses, claims and loss expenses
|
|
|
|
|
|
|
|
|
|
|
|
|
||||||||||||
|
Other policy claims and benefits payable
|
|
|
|
|
|
|
|
|
|
|
|
|
||||||||||||
|
Premium revenue
|
|
|
|
|
|
|
|
|
|
|
|
|
||||||||||||
|
Net investment income
|
|
|
|
|
|
|
|
|
|
|
|
|
||||||||||||
|
Benefits, claims, losses and settlement expenses
|
(
|
)
|
(
|
)
|
(
|
)
|
(
|
)
|
(
|
)
|
(
|
)
|
||||||||||||
|
Amortization, interest, and unlocking of deferred acquisition costs
|
(
|
)
|
|
|
(
|
)
|
(
|
)
|
(
|
)
|
(
|
)
|
||||||||||||
|
Acquisition and operating expenses, net of deferrals
|
(
|
)
|
(
|
)
|
(
|
)
|
(
|
)
|
(
|
)
|
(
|
)
|
||||||||||||
See Report of Independent Registered Public Accounting Firm.
F-90
Schedule IV
FGL HOLDINGS
Reinsurance
(In millions)
|
For the year ended December 31, 2019
|
Gross Amount
|
Ceded to other companies
|
Assumed from other companies
|
Net Amount
|
Percentage of amount assumed of net
|
|||||||||||||
|
Life insurance in force
|
$
|
|
|
$
|
(
|
)
|
$
|
|
|
$
|
|
|
|
%
|
||||
|
Premiums and other considerations:
|
||||||||||||||||||
|
Traditional life insurance premiums
|
|
|
(
|
)
|
|
|
|
|
|
%
|
||||||||
|
Annuity product charges
|
|
|
(
|
)
|
|
|
|
|
|
%
|
||||||||
|
Total premiums and other considerations
|
$
|
|
|
$
|
(
|
)
|
$
|
|
|
$
|
|
|
|
%
|
||||
|
For the year ended December 31, 2018
|
Gross Amount
|
Ceded to other companies
|
Assumed from other companies
|
Net Amount
|
Percentage of amount assumed of net
|
||||||||||||||
|
Life insurance in force
|
$
|
|
|
$
|
(
|
)
|
$
|
|
|
$
|
|
|
|
%
|
|||||
|
Premiums and other considerations:
|
|||||||||||||||||||
|
Traditional life insurance premiums
|
|
|
(
|
)
|
|
|
|
|
|
%
|
|||||||||
|
Annuity product charges
|
|
|
(
|
)
|
|
|
|
|
|
%
|
|||||||||
|
Total premiums and other considerations
|
$
|
|
|
$
|
(
|
)
|
$
|
|
|
$
|
|
|
|
%
|
|||||
|
For the period from December 1 to December 31, 2017
|
Gross Amount
|
Ceded to other companies
|
Assumed from other companies
|
Net Amount
|
Percentage of amount assumed of net
|
||||||||||||||
|
Life insurance in force
|
$
|
|
|
$
|
(
|
)
|
$
|
|
|
$
|
|
|
|
%
|
|||||
|
Premiums and other considerations:
|
|||||||||||||||||||
|
Traditional life insurance premiums
|
|
|
(
|
)
|
|
|
|
|
|
%
|
|||||||||
|
Annuity product charges
|
|
|
(
|
)
|
|
|
|
|
|
%
|
|||||||||
|
Total premiums and other considerations
|
$
|
|
|
$
|
(
|
)
|
$
|
|
|
$
|
|
|
|
%
|
|||||
|
For the period from October 1 to November 30, 2017
|
Gross Amount
|
Ceded to other companies
|
Assumed from other companies
|
Net Amount
|
Percentage of amount assumed of net
|
||||||||||||||
|
Predecessor
|
|||||||||||||||||||
|
Life insurance in force
|
$
|
|
|
$
|
(
|
)
|
$
|
|
|
$
|
|
|
|
%
|
|||||
|
Premiums and other considerations:
|
|||||||||||||||||||
|
Traditional life insurance premiums
|
|
|
(
|
)
|
|
|
|
|
|
%
|
|||||||||
|
Annuity product charges
|
|
|
(
|
)
|
|
|
|
|
|
%
|
|||||||||
|
Total premiums and other considerations
|
$
|
|
|
$
|
(
|
)
|
$
|
|
|
$
|
|
|
|
%
|
|||||
F-91
(Continued)
|
For the period from October 1 to December 31, 2016 (Unaudited)
|
Gross Amount
|
Ceded to other companies
|
Assumed from other companies
|
Net Amount
|
Percentage of amount assumed of net
|
||||||||||||||
|
Predecessor
|
|||||||||||||||||||
|
Life insurance in force
|
$
|
|
|
$
|
(
|
)
|
$
|
|
|
$
|
|
|
|
%
|
|||||
|
Premiums and other considerations:
|
|||||||||||||||||||
|
Traditional life insurance premiums
|
|
|
(
|
)
|
|
|
|
|
|
%
|
|||||||||
|
Annuity product charges
|
|
|
(
|
)
|
|
|
|
|
|
%
|
|||||||||
|
Total premiums and other considerations
|
$
|
|
|
$
|
(
|
)
|
$
|
|
|
$
|
|
|
|
%
|
|||||
|
For the year ended September 30, 2017
|
Gross Amount
|
Ceded to other companies
|
Assumed from other companies
|
Net Amount
|
Percentage of amount assumed of net
|
||||||||||||||
|
Predecessor
|
|||||||||||||||||||
|
Life insurance in force
|
$
|
|
|
$
|
(
|
)
|
$
|
|
|
$
|
|
|
|
%
|
|||||
|
Premiums and other considerations:
|
|||||||||||||||||||
|
Traditional life insurance premiums
|
|
|
(
|
)
|
|
|
|
|
|
%
|
|||||||||
|
Annuity product charges
|
|
|
(
|
)
|
|
|
|
|
|
%
|
|||||||||
|
Total premiums and other considerations
|
$
|
|
|
$
|
(
|
)
|
$
|
|
|
$
|
|
|
|
%
|
|||||
See Report of Independent Registered Public Accounting Firm.
F-92
TABLE OF CONTENTS
Part IItem 1. BusinessItem 1A. Risk FactorsItem 1B. Unresolved Staff CommentsItem 2. PropertiesItem 3. Legal ProceedingsItem 4. Mine Safety DisclosuresPart IIItem 5. Market For Registrant S Common Equity, Related Stockholder Matters and Issuer Purchases Of Equity SecuritiesItem 6. Selected Financial DataItem 7. Management S Discussion and Analysis Of Financial Condition and Results Of OperationsItem 7A. Quantitative and Qualitative Disclosures About Market RiskItem 8. Financial Statements and Supplementary DataItem 9. Changes in and Disagreements with Accountants on Accounting and Financial DisclosureItem 9A. Controls and ProceduresItem 9B. Other InformationPart IIIItem 10. Directors, Executive Officers and Corporate GovernanceItem 11. Executive CompensationItem 12. Security Ownership Of Certain Beneficial Owners and Management and Related Stockholder MattersItem 13. Certain Relationships and Related Transactions, and Director IndependenceItem 14. Principal Accounting Fees and ServicesPart IVItem 15. Exhibits, Financial Statements and SchedulesItem 16. Form 10-k SummaryNote 19. Subsequent Events