FIRST HORIZON NATIONAL CORP
10-Ks and 10-Qs
|
|
|
|
|
|
|
|
|
|
|
|
|
|
|
|
|
|
|
|
|
|
|
|
|
|
|
|
|
|
|
|
|
|
|
|
|
|
|
|
|
|
|
|
|
|
|
|
|
|
|
|
|
|
|
|
UNITED STATES
SECURITIES AND EXCHANGE COMMISSION
Washington, D.C. 20549
FORM
10-K
|
|
ANNUAL REPORT PURSUANT TO SECTION 13 OR 15(d) OF THE SECURITIES EXCHANGE ACT OF 1934 THE SECURITIES EXCHANGE ACT OF 1934 | ||||
For the fiscal year ended
December 31
, 2020
- or -
|
|
TRANSITION REPORT PURSUANT TO SECTION 13 or 15(d) OF THE SECURITIES EXCHANGE ACT OF 1934 SECURITIES EXCHANGE ACT OF 1934 | ||||
For the Transition period from __________ to__________
Commission File Number:
001-15185

(Exact name of registrant as specified in its charter)
|
|
|
||||||||||
|
(State or other jurisdiction
incorporation of organization) |
(IRS Employer
Identification No.) |
||||||||||
|
|
|||||||||||
|
|
|
|
|||||||||
| (Address of principal executive office) | (Zip Code) | ||||||||||
Registrant’s telephone number, including area code:
901
-
523-4444
Securities registered pursuant to Section 12(b) of the Act:
| Title of Each Class | Trading Symbol(s) | Name of Exchange on which Registered | ||||||
|
|
|
|
||||||
|
a share of Non-Cumulative Perpetual Preferred Stock, Series A |
|
|
||||||
|
a share of Non-Cumulative Perpetual Preferred Stock, Series B |
|
|
||||||
|
a share of Non-Cumulative Perpetual Preferred Stock, Series C |
|
|
||||||
|
a share of Non-Cumulative Perpetual Preferred Stock, Series D |
|
|
||||||
|
a share of Non-Cumulative Perpetual Preferred Stock, Series E |
|
|
||||||
Securities registered pursuant to Section 12(g) of the Act:
None
Indicate by check mark if the registrant is a well-known seasoned issuer, as defined in Rule 405 of the Securities Act. ☒
Yes
☐ No
Indicate by check mark if the registrant is not required to file reports pursuant to Section 13 or Section 15(d) of the Act. ☐ Yes ☒
No
Indicate by check mark whether the registrant (1) has filed all reports required to be filed by Section 13 or 15(d) of the Securities Exchange Act of 1934 during the preceding 12 months (or for such shorter period that the registrant was required to file such reports), and (2) has been subject to such filing requirements for the past 90 days. ☒
Yes
☐ No
Indicate by check mark whether the registrant has submitted electronically every Interactive Data File required to be submitted pursuant to Rule 405 of Regulation S-T (§232.405 of this chapter) during the preceding 12 months (or for such shorter period that the registrant was required to submit such files). ☒
Yes
☐ No
Indicate by check mark whether the registrant is a large accelerated filer, an accelerated filer, a non-accelerated filer, a smaller reporting company, or an emerging growth company. See the definitions of “large accelerated filer,” “accelerated filer,” “smaller reporting company,” and “emerging growth company” in Rule 12b-2 of the Exchange Act.
|
|
☒ | Accelerated filer | ☐ | Non-accelerated filer | ☐ | |||||||||||||||||||||
| Smaller reporting company |
|
Emerging Growth Company |
|
|||||||||||||||||||||||
If an emerging growth company, indicate by check mark if the registrant has elected not to use the extended transition period for complying with any new or revised financial accounting standards provided pursuant to Section 13(a) of the Exchange Act. ☐
Indicate by check mark whether the registrant has filed a report on and attestation to its management’s assessment of the effectiveness of its internal control over financial reporting under Section 404(b) of the Sarbanes-Oxley Act (15 U.S.C. 7262(b)) by the registered public accounting firm that prepared or issued its audit report.
☒
Indicate by check mark whether the registrant is a shell company (as defined in Rule 12b-2 of the Exchange Act).
☐
Yes ☒ No
At June 30, 2020, the aggregate market value of registrant common stock held by non-affiliates of the registrant was approximately $
3.0
billion based on the closing stock price reported for that date. At January 29, 2021, the registrant had
555,468,634
shares of common stock outstanding.
DOCUMENTS INCORPORATED BY REFERENCE:
| CONTENTS OF ANNUAL REPORT ON FORM 10-K | ||||||||||||||
| ITEM | Page | ITEM | Page | |||||||||||||||||
| Glossary of Acronyms and Terms | Item 8. | Financial Statements and Supplementary Data | ||||||||||||||||||
| Executive Summary of Principal Investment Risks | ||||||||||||||||||||
| Forward-Looking Statements | Item 9. | Changes in and Disagreements with Accountants on Accounting and Financial Disclosure | ||||||||||||||||||
|
Part I
|
||||||||||||||||||||
| Item 1. | Business | Item 9A. | Controls and Procedures | |||||||||||||||||
| Item 1A. | Risk Factors | Item 9B. | Other Information | |||||||||||||||||
| Item 1B. | Unresolved Staff Comments | Part III | ||||||||||||||||||
| Item 2. | Properties | Item 10. | Directors and Executive Officers of the Registrant | |||||||||||||||||
| Item 3. | Legal Proceedings | Item 11. | Executive Compensation | |||||||||||||||||
| Item 4. | Mine Safety Disclosures | Item 12. | Security Ownership of Certain Beneficial Owners | |||||||||||||||||
| Supplemental Part I Information | and Management and Related Stockholder Matters | |||||||||||||||||||
| Part II | ||||||||||||||||||||
| Item 5. | Market for the Registrant’s Common Equity, Related Stockholder Matters, and Issuer | Item 13. | Certain Relationships and Related Transactions | |||||||||||||||||
| Purchases of Equity Securities | Item 14. | Principal Accountant Fees and Services | ||||||||||||||||||
| Item 6. | [reserved] | Part IV | ||||||||||||||||||
| Item 7. | Management’s Discussion and Analysis of | Item 15. | Exhibits and Financial Statement Schedules | |||||||||||||||||
| Financial Condition and Results of Operations | Item 16. | Form 10-K Summary | ||||||||||||||||||
| Item 7A. | Quantitative and Qualitative Disclosures about Market Risk | Signatures | ||||||||||||||||||
MD&A and Financial Statement References
In this report: "
2020 MD&A
" and "
2020 MD&A (Item 7)
" generally refer to
Management’s Discussion and Analysis of Financial Condition and Results of Operations
, inclusive of
Glossary of Selected Financial Terms
and
Acronyms
, appearing in Item 7 within Part II of this report;
and, "
2020 Financial Statements
" and "
2020 Financial Statements (Item 8)
" generally refer to our Consolidated Balance Sheets, our Consolidated Statements of Income, our Consolidated Statements of Comprehensive Income, our Consolidated Statements of Changes in Equity, our Consolidated Statements of Cash Flows, and the Notes to the Consolidated Financial Statements, all appearing in Item 8 within Part II of this report.
GLOSSARY OF ACRONYMS AND TERMS
The following is a list of common acronyms and terms used throughout this report:
ACL
Allowance for credit losses
ADR
Average daily revenue
AFS
Available for sale
AIR
Accrued interest receivable
ALCO
Asset/Liability Committee
ALLL
Allowance for loan and lease losses
ALM
Asset/liability management
AOCI
Accumulated other comprehensive income
ASC
FASB Accounting Standards Codification
Associate
Person employed by FHN
ASU
Accounting Standards Update
Bank
First Horizon Bank
BOLI
Bank-owned life insurance
C&I
Commercial, financial, and industrial loan portfolio
CAS
Credit Assurance Services
CARES Act
Coronavirus Aid, Relief, and Economic Security Act
CBF
Capital Bank Financial
CCAR
Comprehensive Capital Analysis and Review
CD
Certificate of deposit
|
FIRST HORIZON CORPORATION
|
3
|
2020 FORM 10-K ANNUAL REPORT | ||||||
CECL
Current expected credit loss
CEO
Chief Executive Officer
CFPB
Consumer Financial Protection Bureau
CMO
Collateralized mortgage obligations
Company
First Horizon Corporation
Corporation
First Horizon Corporation
CRA
Community Reinvestment Act
CRE
Commercial Real Estate
CRMC
Credit Risk Management Committee
DSCR
Debt service coverage ratios
DTA
Deferred tax asset
DTI
Debt-to-income
DTL
Deferred tax liability
ECP
Equity Compensation Plan
EPS
Earnings per share
ESOP
Employee stock ownership plan
FASB
Financial Accounting Standards Board
FDIC
Federal Deposit Insurance Corporation
Federal
Federal Reserve Board
Reserve
Fed
Federal Reserve Board
FFP
Federal funds purchased
FFS
Federal funds sold
FHA
Federal Housing Administration
FHLB
Federal Home Loan Bank
FHLMC
Federal Home Loan Mortgage Corporation or Freddie Mac
FHN
First Horizon Corporation
FHNF
FHN Financial;
FHN's fixed income division
FICO
Fair Isaac Corporation
FINRA
Financial Industry Regulatory Authority
FNMA
Federal National Mortgage Association or Fannie Mae
First Horizon
First Horizon Corporation
FRB
Federal Reserve Bank or the Federal Reserve Board
FTBNA
First Tennessee Bank National Association (former name of the Bank)
FTE
Fully taxable equivalent
FTHC
First Tennessee Housing Corporation
FTNF
FTN Financial (former name of FHNF)
FTNMC
First Tennessee New Markets Corporation
FTRESC
FT Real Estate Securities Company, Inc.
GAAP
Generally accepted accounting principles
GNMA
Government National Mortgage Association or Ginnie Mae
GSE
Government sponsored enterprises, in this filing references Fannie Mae and Freddie Mac
HELOC
Home equity line of credit
HFS
Held for Sale
HTM
Held to maturity
HUD
Department of Housing and Urban Development
IBKC
IBERIABANK Corporation
IPO
Initial public offering
ISDA
International Swap and Derivatives Association
IRS
Internal Revenue Service
LEP
Loss emergence period
LGD
Loss given default
LIBOR
London Inter-Bank Offered Rate
LIHTC
Low Income Housing Tax Credit
LLC
Limited Liability Company
LMC
Loans to mortgage companies
LOCOM
Lower of cost or market
LRRD
Loan Rehab and Recovery Department
LTV
Loan-to-value
MBS
Mortgage-backed securities
MD&A
Management’s Discussion and Analysis of Financial Condition and Results of Operations
MI
Private mortgage insurance
MSR
Mortgage servicing rights
MSRB
Municipal Securities Rulemaking Board
NAICS
North American Industry Classification System
NII
Net interest income
NIM
Net interest margin
NM
Not meaningful
NMTC
New Market Tax Credit
NOL
Net operating loss
NPA
Nonperforming asset
Non-PCD
Non-Purchased Credit Deteriorated Financial Assets
|
FIRST HORIZON CORPORATION
|
4
|
2020 FORM 10-K ANNUAL REPORT | ||||||
NPL
Nonperforming loan
NSF
Non-sufficient funds
OCC
Office of the Comptroller of the Currency
OIS
Overnight indexed swap
OREO
Other Real Estate-owned
OTC
One-time close, a mortgage product which allowed simplified conversion of a construction loan to permanent financing
OTTI
Other than temporary impairment
PCAOB
Public Company Accounting Oversight Board
PCD
Purchased Credit Deteriorated Financial Assets
PCI
Purchased credit impaired
PD
Probability of default
PM
Portfolio managers
PPP
Paycheck Protection Program
PSU
Performance Stock Unit
RE
Real estate
RM
Relationship managers
ROA
Return on assets
ROCE
Return on average common shareholders' equity
ROTCE
Return on tangible common equity
ROU
Right-of-use
RPL
Reasonably Possible Loss
RSU
Restricted stock unit
RWA
Risk-weighted assets
SBA
Small Business Administration
SEC
Securities and Exchange Commission
SVaR
Stressed Value-at-Risk
TA
Tangible assets
TCE
Tangible common equity
TCJA
Tax Cuts and Jobs Act of 2017
TDR
Troubled Debt Restructuring
TRUP
Trust preferred loan
UPB
Unpaid principal balance
USDA
United States Department of Agriculture
VaR
Value-at-Risk
VIE
Variable Interest Entities
we / us / our
First Horizon Corporation
| EXECUTIVE SUMMARY OF PRINCIPAL INVESTMENT RISKS | ||||||||||||||
This section provides an executive summary of the principal risks associated with an investment in our equity or debt securities. Our businesses are complex, and so are the risks associated with them. This summary is not a complete statement of risks a prospective or current investor should consider.
•
The Economy.
Our businesses and our industry are heavily entwined with the U.S. economy. We tend to perform better when economic conditions are favorable, and our performance tends to be weaker when the economy is weaker. That relationship can be quite strong, which can make our income and other key performance measures volatile, especially when compared with companies in many other industries. The economy tends to rise and fall in a cyclical manner which is difficult to predict, which in turn makes our performance difficult to predict. For additional information, see
Cyclicality
beginning on page 15 and
Risks from Economic Downturns and Changes
beginning on page 31.
•
Credit Loss.
Our lending business—accounting for about half of our revenues—is critically dependent on our clients being able to pay us
back. That ability often depends on economic conditions, but many individual factors can be critical as well. If a client defaults on a loan, generally we will experience a financial loss which often is only reduced, not eliminated, by collateral supporting the loan. Accounting rules require us to evaluate current expected credit loss (CECL) each quarter, booking losses based on our expectations. That process can result in a highly volatile pattern of recognizing credit loss each quarter. The first two quarters of 2020 demonstrated this volatility, based on the economic and business disruption associated with the COVID-19 pandemic. For additional information, see
CECL Accounting and COVID-19
beginning on page 12,
Credit Risks
beginning on page 33, and
Risks related to COVID-19 Pandemic
beginning on page 35.
•
Loan Loss vs Loan Profit.
Lending generally is a high-volume, low-margin business. This means that we often need the profits from many loans to make up for the losses from one loan. For our earnings to be strong, we need to hold loan losses to a very low level, which makes our management of credit quality a critical function for us. This
|
FIRST HORIZON CORPORATION
|
5
|
2020 FORM 10-K ANNUAL REPORT | ||||||
imbalance between loss and profit can amplify the potential for volatility in our earnings. For additional information, see
Credit Risks
beginning on page 33.
•
Interest Rate Conditions.
Interest rates and, especially, the shape of the yield curve, are critical drivers of our profit margin from lending. If the yield curve is flat—with long-term rates only slightly higher than short-term rates—our lending margins shrink, and so does our net interest income. Interest rate policy is controlled by federal agencies and by market forces, not by us. For additional information, see
Monetary Policy Shifts
beginning on page 12,
Cyclicality
beginning on page 15,
Risks Associated with Monetary Events
beginning on page 31, and
Interest Rate and Yield Curve Risks
beginning on page 40.
•
Funding Balance.
In our lending business, we aggregate money and lend it out at rates which more than cover our costs. We constantly must balance our funding sources (deposits and borrowings) with our funding needs (lending). Imbalances tend to hurt our earnings. If sources become too large, generally we can cut back short-term borrowing or invest the excess, but our earnings can be modestly weaker as a result. If sources become too small, we might have to forego profitable lending or increase funding by increasing deposit or borrowing costs. For additional information, see
Liquidity and Funding Risks
beginning on page 39.
•
Competition.
Competition for clients and talent in our industry is intense and unlikely to abate. Competition for key revenue-producing talent is a key method of obtaining new client relationships in many parts of our industry. Competition in these areas can pressure us to make concessions to clients and to increase payroll costs. For additional information, see
Competition
beginning on page 13, and
Traditional Competition Risks
beginning on page 27.
•
Banking Consolidation.
Since the advent of nation-wide branching in the 1980s, the banking industry has experienced several waves of substantial consolidation. In the past twenty years, technological improvements have allowed institutions to become extremely large while maintaining adequate client service, and, due to cost efficiencies associated with scalable technology, have rewarded the largest institutions disproportionately, incenting banks to grow larger, faster. Consolidation can abruptly change the competitive environment in our markets. In addition, when we participate in consolidating actions, as we did in 2017 and 2020, typically it creates internal disruption and expense for a time while we integrate systems, consolidate branches, and take other consolidation-related actions.
Moreover, in our industry, the market tends to discount, for a time, the stock price of banks that engage in major mergers, in part due to the transaction and integration expenses mentioned above coupled with the risk that the combination may not achieve management’s strategic or tactical objectives. For additional information, see
Significant Business Developments over Past Five Years
beginning on page 10,
Strategic Transactions
beginning on page 14, and
Traditional Strategic and Macro Risks
beginning on page 27.
•
Industry Disruption
. Technological innovation, and the associated changes in client preferences, are radically transforming our industry and how financial services are delivered to clients. Keeping pace is expensive and difficult, while being a consistent innovation leader is practically impossible for a bank our size. Moreover, rapid innovation has the potential to be destructive of traditional companies in our industry, as it has done and is doing in other industries. For additional information, see
Industry Disruption
beginning on page 28.
•
Regulated Industry
. Our principal businesses are heavily regulated. Our two primary banking regulators can examine us, cause us to change our business operations, and significantly restrict our ability to pursue lines of business, in ways not applicable to companies in most other industries. We also have several secondary regulators, each with significant though less-encompassing powers. The primary missions of the regulators are to protect the banking system as a whole, to protect the federal government’s deposit insurance fund and program, and to protect clients; none exists to enhance our profitability or promote the interests of our investors. Moreover, regulators are government agencies, and as such can experience significant policy changes when the elected branches of government experience such changes. For additional information, see
Regulatory, Legislative, and Legal Risks
beginning on page 36.
•
Security & Technology.
Fraud and theft have always been significant risks for banks. Technology has allowed those risks to grow substantially. Bad actors can impact us from around the world, day or night, both directly and through our clients or vendors. Typically, the more a system is built to be secure and robust, the less that system can be flexible and adaptable. Moreover, high-security often is associated with a sub-optimal user experience. For additional information, see
Operational Risks
beginning on page 30.
•
Expense Control
. In the current low-interest-rate environment, banks in the U.S. are focused on
|
FIRST HORIZON CORPORATION
|
6
|
2020 FORM 10-K ANNUAL REPORT | ||||||
reducing operating costs as much as possible. For additional information, see
Operational Risks
beginning on page 30, and
Risks of Expense Control
beginning on page 38.
For a more complete discussion of the risks associated with our businesses and operations and investment in our securities, see Item 1A, Risk Factors, beginning on page 26.
| FORWARD-LOOKING STATEMENTS | ||||||||||||||
This report on Form 10-K, including materials incorporated into it, contains forward-looking statements within the meaning of the Private Securities Litigation Reform Act of 1995 with respect to FHN's beliefs, plans, goals, expectations, and estimates. Forward-looking statements are not a representation of historical information, but instead pertain to future operations, strategies, financial results or other developments. The words “believe,” “expect,” “anticipate,” “intend,” “estimate,” “should,” “is likely,” “will,” “going forward,” and other expressions that indicate future events and trends identify forward-looking statements.
Forward-looking statements are necessarily based upon estimates and assumptions that are inherently subject to significant business, operational, economic and competitive uncertainties and contingencies, many of which are beyond our control, and many of which, with respect to future business decisions and actions (including acquisitions and divestitures), are subject to change. Examples of uncertainties and contingencies include, among other important factors:
•
the possibility that the anticipated benefits of the IBKC merger will not be realized when expected or at all, including as a result of the impact of, or problems arising from, the integration of the two companies or as a result of the strength of the economy and competitive factors in any or all of FHN’s market areas;
•
the possibility that the IBKC merger may be more expensive to integrate than anticipated, including as a result of unexpected factors or events;
•
potential adverse reactions or changes to business or associate relationships resulting from the IBKC merger;
•
global, general and local economic and business conditions, including economic recession or depression;
•
the potential impacts on FHN’s businesses of the COVID-19 pandemic, including negative impacts from quarantines, market declines, and volatility, and changes in client behavior related to the COVID-19 pandemic;
•
the stability or volatility of values and activity in the residential housing and commercial real estate markets;
•
potential requirements for FHN to repurchase, or compensate for losses from, previously sold or securitized mortgages or securities based on such mortgages;
•
potential claims alleging mortgage servicing failures, individually, on a class basis, or as master servicer of securitized loans;
•
potential claims relating to participation in government programs, especially lending or other financial services programs;
•
expectations of and actual timing and amount of interest rate movements, including the slope and shape of the yield curve, which can have a significant impact on a financial services institution;
•
market and monetary fluctuations, including fluctuations in mortgage markets;
•
the financial condition of borrowers and other counterparties;
•
competition within and outside the financial services industry;
•
the occurrence of natural or man-made disasters, global pandemics, conflicts, or terrorist attacks, or other adverse external events;
•
effectiveness and cost-efficiency of FHN’s hedging practices;
•
fraud, theft, or other incursions through conventional, electronic, or other means directly or indirectly affecting FHN or its clients, business counterparties or competitors;
•
the ability to adapt products and services to changing industry standards and client preferences;
•
risks inherent in originating, selling, servicing, and holding loans and loan-based assets, including prepayment risks, pricing concessions, fluctuation in U.S. housing and other real estate prices, fluctuation of collateral values, and changes in client profiles;
•
the changes in the regulation of the U.S. financial services industry;
•
changes in laws, regulations, and administrative actions, including executive orders, whether or not specific to the financial services industry;
•
changes in accounting policies, standards, and interpretations;
•
evolving capital and liquidity standards under applicable regulatory rules;
•
accounting policies and processes require management to make estimates about matters that are uncertain; and
•
other factors that may affect future results of FHN.
FHN assumes no obligation to update or revise any forward-looking statements that are made in this report on Form 10-K or in any other statement,
|
FIRST HORIZON CORPORATION
|
7
|
2020 FORM 10-K ANNUAL REPORT | ||||||
release, report, or filing from time to time. Actual results could differ and expectations could change, possibly materially, because of one or more factors, including those factors listed above or presented elsewhere in this report, or in those factors listed in material incorporated by reference into this report. In
evaluating forward-looking statements and assessing our prospects, readers of this report should carefully consider the factors mentioned above along with the additional risk factors discussed in Items 1 and 1A of this report and in 2020 MD&A (Item 7), among others.
| PART I | ||||||||||||||
|
ITEM 1. BUSINESS
|
||||||||
| Our Businesses | ||||||||||||||
First Horizon Corporation is a Tennessee corporation. We incorporated in 1968, and are headquartered in Memphis, Tennessee. We are a bank holding company under the Bank Holding Company Act, and a financial holding company under the Gramm-Leach-Bliley Act. Our common stock is listed on the New York Stock Exchange under the symbol “FHN.” In 2020 we shortened our corporate name, which had been First Horizon National Corporation for many years. At December 31, 2020, we had total consolidated assets of $84 billion. We provide diversified financial services primarily through our principal subsidiary, First Horizon Bank. The Bank is a Tennessee banking corporation headquartered in Memphis, Tennessee.
During 2020 approximately 47% of our consolidated revenues were provided by fee and other noninterest income, and approximately 53% of revenues were provided by net interest income.
As a financial holding company, we coordinate the financial resources of the consolidated enterprise and maintain systems of financial, operational, and administrative control intended to coordinate selected policies and activities, including as described in Item 9A of Part II.
The Bank
The Bank was founded in 1864 as First National Bank of Memphis. During 2020, through its various business lines, including consolidated subsidiaries, the Bank reported revenues (net interest income plus noninterest income) of approximately $3.2 billion. The Bank generated a substantial majority of First Horizon’s consolidated revenue. At December 31, 2020, the Bank had $84 billion in total assets, $71 billion in total deposits, and $58 billion in total loans and leases (net of unearned income and net of reserves for credit losses).
Business Segments
Our financial results of operations are reported through operational business segments which are not closely related to the legal structure of our subsidiaries. As a result of our recent merger of equals with IBERIABANK Corporation (see
Significant Business Developments over Past Five Years
starting on page 10 below), in 2020 we changed our segments. Before the merger, we operated through four business segments: regional banking, fixed income, corporate, and non-strategic. By the end of 2020 and going forward, we operate through three segments: regional banking, specialty banking, and corporate. Quarterly results in 2020 were reported originally using the previous segments, while fourth-quarter and full-year results are reported using the current segments. In this report, segment information related to prior periods has been reclassified to conform with the current segments.
Financial and other additional information concerning our segments—including information concerning assets, revenues, and financial results—appears in our 2020 MD&A (Item 7) and Note 20 to our 2020 Financial Statements (Item 8).
Principal Businesses and Brands
As a result of our recent merger of equals with IBERIABANK Corporation (see
Significant Business Developments over Past Five Years
starting on page 10 below), at year-end 2020 many of our principal businesses were conducted primarily under two or more brands. Once conversion and integration of our two companies is completed, we expect to simplify our branding, phasing out certain brands over time. Our principal brands at year-end are summarized in Table 1.1.
|
FIRST HORIZON CORPORATION
|
8
|
2020 FORM 10-K ANNUAL REPORT | ||||||
Table 1.1
Principal Businesses & Brands
At Year End
| Business | Brands | ||||
| Banking & financial services generally |
•
First Horizon & First Horizon Bank
•
IBERIABANK
|
||||
| Fixed income / capital markets |
•
FHN Financial
•
IBERIABANK Capital Markets
|
||||
| Mortgage lending |
•
First Horizon Bank
•
IBERIABANK Mortgage
|
||||
| Title services |
•
Lenders Title Group
|
||||
| Insurance brokerage & management services |
•
First Horizon Advisors
•
IBERIA Financial Services
|
||||
| Wealth management & brokerage services |
•
First Horizon Advisors
•
IBERIA Wealth Advisors
•
IBERIA Financial Services
|
||||
Physical Business Locations
At December 31, 2020, First Horizon’s subsidiaries had well over 500 business locations in 23 U.S. states, excluding off-premises ATMs. Most of those locations were banking centers. At year-end, First Horizon had 492 banking centers in twelve states:
Table 1.2
Banking Centers at Year End
| State | # | State | # | ||||||||
| Tennessee | 165 | Georgia | 12 | ||||||||
| Florida | 97 | South Carolina | 11 | ||||||||
| North Carolina | 89 | Texas | 10 | ||||||||
| Louisiana | 64 | Virginia | 8 | ||||||||
| Arkansas | 16 | Mississippi | 5 | ||||||||
| Alabama | 14 | New York | 1 | ||||||||
Many banking centers contain special-service areas such as wealth management and mortgage lending. At year-end, First Horizon also had client-service offices not physically within banking centers, including fixed income, title services, home mortgage, wealth management, and commercial loan offices. The largest groups of those offices were: 29 fixed income offices in eighteen states across the U.S.; 29 title services offices in Arkansas, Tennessee, and Louisiana; and 15 stand-alone mortgage lending offices in seven states. First Horizon also has operational and administrative offices.
Loans & Deposits
Lending and deposit-taking are core businesses for us. Our largest resource to fund our lending is our deposit base. At year-end 2020, we had total loans (net of unearned income) of $58 billion, total net loans (net of unearned income and net of reserves for credit losses) of $57 billion, and total deposits of $70 billion.
Most of our loans and deposits are held in our regional banking and specialty banking segments. Most of our loans are commercial, and most of them are traditional, unsecured commercial, financial, and industrial loans, or “C&I” loans. The other two major loan portfolios are secured commercial real estate loans, or “CRE” loans, and secured consumer real estate loans. Table 1.3 provides an overview of our loan and deposit balances at December 31, 2020 or averaged over the year 2020.
Table 1.3
Loans & Deposits by Type
| Loans* | Deposits** | |||||||||||||
| Commercial | 78 | % | Savings | 38 | % | |||||||||
| Consumer | 22 | % | Time deposits | 8 | % | |||||||||
| Commercial Portfolios | Other interest | 23 | % | |||||||||||
| C&I | 73 | % | Noninterest | 31 | % | |||||||||
| CRE | 27 | % | ||||||||||||
| Consumer Portfolios | ||||||||||||||
| Real estate | 91 | % | ||||||||||||
| Credit card/other | 9 | % | ||||||||||||
* Percentages at December 31, 2020; includes certain leases.
** Percentages of average deposits for 2020.
Percentages may not add to 100% due to rounding.
The C&I portfolio, more than half of total loans, was $33.1 billion on December 31, 2020. Within C&I, about 26% of loans are to businesses in the financial services industry, including mortgage lending companies, with the rest in a wide range of industries, as shown in Table 1.4.
Table 1.4
C&I Loans* by Line of Business
| Mortgage lenders | 16 | % | |||
| Finance & Insurance | 10 | % | |||
| Health care & social assistance | 8 | % | |||
| Real estate rental & leasing | 7 | % | |||
| Accommodation & food service | 7 | % | |||
| Wholesale trade | 6 | % | |||
| Manufacturing | 6 | % | |||
| Retail trade | 5 | % | |||
| Other C&I | 35 | % | |||
* Percentages of C&I portfolio at December 31, 2020.
Percentages may not add to 100% due to rounding.
Geographically, a significant majority of our loans originate from five states: Tennessee, Florida, Louisiana, North Carolina, and Texas. The geographic dispersion of our loans varies considerably among our three major loan portfolios, as shown in Table 1.5.
|
FIRST HORIZON CORPORATION
|
9
|
2020 FORM 10-K ANNUAL REPORT | ||||||
Table 1.5
Major Loan Portfolios by Geography
| C&I Loans ($33B)* | CRE Loans ($12B)* | Consumer RE Loans ($12B)* | |||||||||||||||||||||
| Tennessee | 21 | % | Florida | 28 | % | Florida | 31 | % | |||||||||||||||
| Florida | 12 | % | North Carolina | 12 | % | Tennessee | 25 | % | |||||||||||||||
| Texas | 9 | % | Louisiana | 11 | % | Louisiana | 10 | % | |||||||||||||||
| Louisiana | 8 | % | Texas | 11 | % | North Carolina | 9 | % | |||||||||||||||
| North Carolina | 8 | % | Tennessee | 9 | % | Texas | 5 | % | |||||||||||||||
| California | 7 | % | Georgia | 8 | % | All other states | 20 | % | |||||||||||||||
| Georgia | 5 | % | All other states | 21 | % | ||||||||||||||||||
| All other states | 30 | % | |||||||||||||||||||||
*Dollars and percentages within each portfolio at December 31, 2020.
Percentages may not add to 100% due to rounding.
Further information regarding deposits and our other major sources of funding is provided in Notes 9, 10, and 11 beginning on pages 168, 169, and 170, respectively, appearing in our 2020 Financial Statements (Item 8), and under the captions
Deposits, Short-term Borrowings,
and
Term Borrowings
beginning on pages 65, 66, and 67, respectively, of our 2020 MD&A (Item 7). Further information regarding our loans is provided in Note 4 beginning on page 149 appearing in our 2020 Financial Statements (Item 8), and under the caption
Analysis of Financial Condition
beginning on page 62 of our 2020 MD&A (Item 7).
Services We Provide
At December 31, 2020, we provided the following services through our subsidiaries and divisions:
•
general banking services for consumers, businesses, financial institutions, and governments
•
fixed income sales and trading; underwriting of bank-eligible securities and other fixed-income securities eligible for underwriting by financial subsidiaries; loan sales; advisory services; and derivative sales
•
mortgage banking services
•
title insurance and loan-closing services
•
brokerage services
•
correspondent banking
•
transaction processing: nationwide check clearing services and remittance processing
•
trust, fiduciary, and agency services
•
credit card products
•
equipment finance services
•
investment and financial advisory services
•
mutual fund sales as agent
•
retail insurance sales as agent
Information about the net interest income and noninterest income we obtained from our largest categories of products and services appears under the caption
Results of Operations — 2020 Compared to 2019
beginning on page 54 of our 2020 MD&A (Item 7).
| Significant Business Developments Over Past Five Years | ||||||||||||||
Over the past five years, our strategic priorities have focused on:
•
targeted expansion of consumer and commercial banking products and markets;
•
opportunistic expansion of commercial lending, mainly through acquisition transactions, talent development, and talent acquisitions;
•
rigorous expense management with continued investment in revenue generating initiatives;
•
managing business units and products with a strong emphasis on risk-adjusted returns on invested capital;
•
providing exceptional client experience as a primary means to differentiate us from competitors; and
•
investment in scalable technology and other infrastructure to attract and retain clients and to support expansion.
Examples of our implementation of these priorities include:
•
In July 2020, we completed a merger of equals transaction with IBERIABANK Corporation and purchased 30 branches from Truist Bank, making 2020 a transformative year. See
IBKC Merger of Equals
and
30-Branch Acquisition
in this Item below for additional information.
|
FIRST HORIZON CORPORATION
|
10
|
2020 FORM 10-K ANNUAL REPORT | ||||||
•
As mentioned below, the COVID-19 pandemic caused us to recognize substantial provision for credit loss in 2020, and reduced our transaction volume and revenues. See
CECL Accounting and COVID-19
beginning on page 12 of this Item 1. However, when the federal government created the Paycheck Protection Program (“PPP”) in the second quarter of 2020, legacy First Horizon and legacy IBKC each were able to help clients obtain $2 billion of PPP loans (more than $4 billion total) over the course of a few short weeks. In doing so, we helped our clients access financial relief to sustain their businesses during the economic downturn. We received significant positive feedback from affected clients and earned origination fees from the PPP, $15 million of which we donated to help low and moderate income communities.
•
In 2017 we merged with Capital Bank Financial Corp., which had $10 billion of total assets and nearly 200 banking centers in four southern U.S. states.
•
Other acquisitions during this period include: a national leader in
trading, securitization, and analysis of Small Business Association loans
(2017); and
a significant restaurant franchise finance business and portfolio (2016).
•
We have made key talent hires in critical areas throughout our company, with the main focus on organically growing economically profitable business lines inside and outside our traditional markets.
•
We have pruned and adapted our physical banking center network to reflect long-term trends in client usage of banking centers, and are making more efficient use of other physical facilities. Correspondingly, we have expanded and enhanced our digital banking products and services.
•
Organic commercial loan growth has been strong in specialty lending areas, such as lending to mortgage companies, where margins tend to be better but outstanding balances tend to fluctuate seasonally and cyclically.
Table 1.6 provides selected data concerning revenues, expenses, assets, liabilities, and shareholders’ equity for the past five years.
Table 1.6
SELECTED CONSOLIDATED FINANCIAL DATA
(Dollars in millions; period-end financial condition data shown as of December 31)
| 2020 | 2019 | 2018 | 2017 | 2016 | |||||||||||||
| Net interest income | $ | 1,662 | $ 1,210 | $ 1,220 | $ 842 | $ 729 | |||||||||||
| Provision (provision credit) for credit losses | 503 | 45 | 8 | (1) | 10 | ||||||||||||
| Noninterest income | 1,492 | 654 | 723 | 490 | 552 | ||||||||||||
| Net income available to common shareholders | 822 | 435 | 539 | 159 | 221 | ||||||||||||
| Total loans and leases | 58,232 | 31,061 | 27,536 | 27,659 | 19,590 | ||||||||||||
| Total assets | 84,209 | 43,311 | 40,832 | 41,423 | 28,555 | ||||||||||||
| Total deposits | 69,982 | 32,430 | 32,683 | 30,620 | 22,672 | ||||||||||||
| Total term borrowings | 1,670 | 791 | 1,171 | 1,218 | 1,041 | ||||||||||||
| Total liabilities | 75,902 | 38,235 | 36,047 | 36,843 | 25,850 | ||||||||||||
| Preferred stock | 470 | 96 | 96 | 96 | 96 | ||||||||||||
| Total shareholders’ equity | 8,307 | 5,076 | 4,785 | 4,580 | 2,705 | ||||||||||||
Events Impacting Year-to-Year Comparisons
IBKC Merger of Equals in 2020
In July 2020, we closed our merger of equals with IBERIABANK Corporation (“IBKC”). IBKC was the parent company of IBERIABANK based in Lafayette, Louisiana. At year-end 2019, IBKC had $31.7 billion of total assets—nearly 75% of our size at that time—and operated over 190 banking centers in 11 states: Louisiana, Texas, Arkansas, Tennessee, Mississippi, Alabama, Georgia, Florida, North and South Carolina, and New York. IBKC’s largest concentrations of banking centers were in Louisiana and Florida. We and IBKC offered many of the same financial services
before the merger, but IBKC exceeded us in several areas, most notably in equipment financing, mortgage, and title services.
After closing, our board expanded to 17 directors, of which nine are from legacy First Horizon and eight are from legacy IBKC. IBKC shareholders collectively were issued 243 million First Horizon common shares (on a net basis), or 44% of our common shares outstanding at year-end 2020.
Under applicable accounting guidance, none of the income or expense recognized by IBKC prior to the merger is included in our income or expense for 2020. As a result, our 2020 operating results
|
FIRST HORIZON CORPORATION
|
11
|
2020 FORM 10-K ANNUAL REPORT | ||||||
essentially consist of two quarters of legacy First Horizon plus two quarters of combined First Horizon and IBKC. In addition, operating results in 2020 were significantly affected by merger-related expenses and by two significant accounting impacts, described in
Large Accounting Impacts from IBKC Merger
below.
30-Branch Acquisition in 2020
In July 2020, we purchased 30 branches in North Carolina (20), Virginia (8), and Georgia (2) from SunTrust Bank (now Truist Bank). Those branches are in markets which we did not serve before July, or in which we did not have a leading market position. Along with the branch facilities, we acquired $0.4 billion of related loans and assumed $2.2 billion of deposits.
Large Accounting Impacts from IBKC Merger
Under applicable accounting guidance, closing the IBKC merger in July created two substantial impacts on our operating results for 2020. First, although we were required to record IBKC’s loans at fair value on the closing date, we also were required to recognize, as credit provision expense, an estimate of current expected credit losses for certain acquired loans. A similar process, with much smaller numbers, occurred for the loans associated with the 30-branch purchase. The overall incremental expense, recorded in third quarter 2020, was $147 million. Moreover, we were required to record, on a preliminary basis, a nontaxable purchase accounting gain from the merger of $533 million, driven by the stock market decline in 2020 associated with the COVID-19 pandemic. The net result of those two impacts was a $386 million uplift to our pretax income in 2020 unrelated to the ordinary operation of our businesses.
Expenses related to IBKC Merger
Closing the IBKC merger, integrating the business operations and systems, and making the changes necessary to achieve intended cost and other synergies, resulted in noninterest expenses in 2020 in excess of $140 million. Additional significant expenses related to integration and optimization will be incurred in 2021.
Low Credit Loss Rates through 2019
During 2016-2019, our provision for credit losses was unusually low, though in 2019 it began to normalize. When provision is low, differences from year to year can be idiosyncratic, driven by just a few clients.
CECL Accounting and COVID-19
Starting in 2020, accounting guidance changed, requiring us to recognize “current expected credit loss” on all loans. The new guidance had the effect of accelerating, compared to prior guidance, the recognition of provision expense at times when general economic conditions deteriorate in a rapid manner. Starting in March 2020, government and
public reaction to the COVID-19 pandemic caused substantial and rapid, and previously unexpected, business disruption and economic deterioration. Those events substantially changed our expectations for future credit loss in the first half of 2020 and, accordingly, our provision expense was significantly elevated. Later in 2020, a positive change in expectations partially moderated that impact. Moreover, the new guidance was not applied retroactively to prior years, making year-to-year comparisons of provision expense less useful.
Fixed Income Volatility
For several of these years, market conditions were quite subdued for our fixed income business. Starting in 2019, however, increased market volatility and the downward direction of interest rates resulted in much higher trading volume and noninterest income in that business. See
Cyclicality—Fixed Income
in this Item, beginning on page 16, for additional information.
Sale of Visa Class B Stock in 2018
In 2018, we sold our remaining legacy stock holdings of Visa, significantly increasing noninterest income that year.
Capital Bank Merger in 2017
Many year-end balance sheet figures (loans, deposits, etc.) increased substantially in 2017 due to the Capital Bank transaction. Full-year operating results were less noticeably impacted until 2018, because the Capital Bank transaction closed late in 2017.
Tax Reform in 2017
Corporate tax reform in December 2017 resulted in significant negative adjustments to net deferred tax asset balance, driving a large net loss in fourth quarter that year. Financial results after 2017, in contrast, benefited significantly from lower tax rates compared to earlier years.
Monetary Policy Shifts
Although interest rates during each of these years were quite low by historical standards, short-term rates were raised modestly starting in 2015 and more vigorously in 2018. Short-term rates were reduced in 2019 and again in 2020, the latter in response to the pandemic. Other actions by the Federal Reserve put downward pressure on long-term interest rates as well, especially in 2020. These changes impacted our net interest margin, raising and lowering it over this period. Net interest margin is a measure of the profit we make on loans and other earning assets in relation to our cost of deposits and other funding sources. Because funding costs cannot realistically fall below zero, the very low rate environment during 2020 resulted in historically low net interest margin levels for us.
|
FIRST HORIZON CORPORATION
|
12
|
2020 FORM 10-K ANNUAL REPORT | ||||||
Trends
Noteworthy trends during this period include:
•
Net loan growth in 2019 (vs. 2018) was purely organic. Organic loan growth occurred in other years as well, but was masked by merger and acquisition transactions.
•
Growth in net interest income was significant through 2018, driven by net loan growth, interest rate increases, and (in 2018) the Capital Bank merger. Growth flattened in 2019 as net loan growth, especially in mortgage warehouse lending, was offset by net interest margin declines. Margin declines continued in 2020, but loans increased substantially with the IBERIABANK merger.
•
In 2016 and 2017, an overall down-trend in noninterest income was due mainly to lower fixed income revenues, driven by challenging market conditions. The large increase in 2018 was mainly due to the Visa stock sale, along with an uptick following the Capital Bank merger. The 2016-17 trend reversed in 2019, and continued in 2020, as interest rates declined, market volatility increased, and fixed income revenues improved markedly. Also, the second half of 2020 enjoyed a substantial increase in noninterest income following the IBERIABANK merger, especially in relation to consumer mortgage originations and related services.
•
The large deposit upticks in 2017 and 2020 were driven substantially by the Capital Bank, IBERIABANK, and 30-branch transactions. Also in
2020, the federal Paycheck Protection Program (“PPP”) contributed to deposit growth as proceeds from PPP loans boosted average deposit account balances. Organic growth in deposits from core banking clients grew throughout this period, even in 2019 and 2020 when interest rates were extremely low. That core growth is masked in some years by deliberate reductions in (more expensive) market-indexed deposits, and in other years by those large transactions.
•
Throughout 2020, economic and business disruption related to the COVID-19 pandemic created substantial challenges for our clients and for our company. Disruption peaked in the spring, diminished significantly in the summer, and resumed in the autumn and winter. Although at some future point significant disruption from the pandemic will end, we are not able to predict with confidence which pre-pandemic trends will resume and which will end or change.
Exited Businesses
Over the past decade, we have focused on traditional banking and fixed income products and services. We exited our legacy nation-wide mortgage banking business in 2008, though we continue to manage related legal exposures and the wind-down of a related loan portfolio. We have partially or fully exited other businesses as well. Exited businesses are managed in our corporate segment currently, and were managed in our non-strategic segment in prior periods.
| Competition | ||||||||||||||
In all aspects of the businesses in which we engage, we face substantial competition from banks doing business in our markets as well as from savings and loan associations, credit unions, other financial institutions, consumer finance companies, trust companies, investment counseling firms, money market and other mutual funds, insurance companies and agencies, securities firms, mortgage banking companies, hedge funds, and other firms offering financial products or services.
Banking
Our regional banking business primarily competes in those areas within the southern U.S. where we have banking center locations. However, competition in our industry is trending away from the traditional geographic footprint model. That trend is happening throughout the industry, but the rate of change is highly uneven among different types of clients, products, and services.
Our regional banking business serves both consumer and commercial clients. The consumer businesses remain strongly linked to our physical banking center locations, even as our delivery of financial services to consumers is increasingly focused on popular non-physical delivery methods, such as online and mobile banking. Online and mobile banking have contributed to a decline in banking center usage, but not (so far) an erosion of the link between banking center versus consumer client location. Increasingly, however, consumers are able to manage, through a single institution, their financial accounts at multiple institutions. If cross-institutional management features become popular, they may hasten a de-linking of consumers to physical banking center networks.
Our commercial businesses, especially in our specialty banking segment, also have a geographic linkage, but it is weaker. Some areas of specialty lending, such franchise finance, and certain other specialty businesses (see
Fixed Income
below) are
|
FIRST HORIZON CORPORATION
|
13
|
2020 FORM 10-K ANNUAL REPORT | ||||||
multi-regional or national in scope rather than being heavily centered on banking center locations.
Key traditional competitors in many of our markets include Wells Fargo Bank N.A., Bank of America N.A., First-Citizens Bank & Trust Company (
dba
First Citizens Bank), Synovus Bank, Truist Bank, Regions Bank, JPMorgan Chase Bank National Association, PNC Bank National Association, BankUnited, Hancock Whitney Bank, and Pinnacle Bank, among many others including many community banks and credit unions.
A number of recent technologies created or operated by non-banks have been integrated into the financial systems used by traditional banks, such as the evolution of ATM cards into debit/credit cards and the evolution of debit/credit cards into smart phones. These sorts of incrementally evolutionary technologies often have expanded the market for banking services overall while siphoning a portion of the revenues from those services away from banks. Prior methods of delivering those services were disrupted, but often at a pace which all but the weakest banks could accommodate.
Recently, some evolutionary pressures have arisen which may prove to be less incremental and more disruptive. For example, in financial planning and wealth management, companies that are not traditional banks, including both long-established firms (such as Vanguard) and new ones (such as Betterment), have developed highly-interactive systems and applications. These services compete directly with traditional banks in offering personal financial advice. The low-cost, high-speed nature of these “robo-advisor” services can be especially attractive to younger, less-affluent clients and potential clients. We and other traditional banks offer similar services, but doing so risks cannibalizing traditional business models for these services.
In recent years, certain financial companies or their affiliates that traditionally were not banks have been
able to compete more directly with the Bank for deposits and other traditional banking services and products. Increased fluidity across traditional boundaries is likely to continue. Non-traditional companies competing with us for traditional banking products and services include investment banks, brokerage firms, insurance company affiliates, peer-to-peer lending arrangers, non-bank deposit acceptors, companies offering payment facilitation services (such as PayPal and pre-paid debit card issuers), and extremely short-term consumer loan companies.
Fixed Income
Our fixed income business, which is part of our specialty banking segment, serves institutional clients, broadly segregated into depositories (including banks, thrifts, and credit unions) and non-depositories (including money managers, insurance companies, governmental units and agencies, public funds, pension funds, and hedge funds). Both client groups are widely dispersed geographically, predominantly within the U.S. We have many competitors within both groups, including major U.S. and international securities firms as well as numerous regional and local firms.
Additional Information
For additional information on the competitive position of FHN and the Bank, refer to the “General” subsection above within this Item 1. Also, refer to the subsections entitled
Supervision and Regulation
and
Effect of Governmental Policies
, both of which are relevant to an analysis of our competitors. Due to the intense competition in the financial services industry we can make no representation that our competitive position has or will remain constant, nor can we predict how it may change in the future.
| Other General Information | ||||||||||||||
Strategic Transactions
An element of our business strategy is to consider acquisitions and divestitures that would enhance long-term shareholder value. Significant acquisitions and divestitures which closed during the past three years are described in Note 2 to our 2020 Financial Statements (Item 8).
The most significant transactions in the past five years are our merger of equals with IBKC in 2020 and our merger with Capital Bank Financial Corp. in 2017. IBKC’s assets comprised roughly three-sevenths of our combined assets immediately after closing in July 2020. Capital Bank’s assets comprised roughly one-
fourth of our combined assets immediately after closing in November 2017. We completed systems integration for the Capital Bank transaction in 2018, and we expect to complete integration with IBKC in the second half of 2021.
Other significant transactions include our purchase of 30 banking centers in July 2020, with over $2 billion of associated deposits, and our acquisition of Coastal Securities, Inc. in 2017, a leader in trading and securitizing SBA loans.
|
FIRST HORIZON CORPORATION
|
14
|
2020 FORM 10-K ANNUAL REPORT | ||||||
Subsidiaries
FHN’s consolidated operating subsidiaries at December 31, 2020 are listed in Exhibit 21. Technical and regulatory details follow:
•
The Bank is supervised and regulated as described in
Supervision and Regulation
in this Item below.
•
The Bank is a government securities dealer. The FHN Financial division of the Bank is registered with the SEC as a municipal securities dealer and the FHN Financial Municipal Advisors division of the Bank is registered with the SEC as a municipal adviser.
•
Martin and Company, Inc., First Horizon Advisors, Inc., and FHN Financial Main Street Advisors, LLC are registered with the SEC as investment advisers.
•
First Horizon Advisors, Inc., FHN Financial Securities Corp., and IBERIA Capital Partners LLC are registered as broker-dealers with the SEC and all states where they conduct business for which registration is required. After year-end 2020, IBERIA Capital Partners LLC began the process to withdraw its registration.
•
First Horizon Insurance Services, Inc., FHIS, Inc., Lenders Title Company, United Title & Abstract L.L.C., United Title of Louisiana, Inc., and First Horizon Insurance Agency, Inc. are licensed as insurance agencies in all states where they do business for which licensing is required. First Horizon Insurance Agency, Inc. is inactive.
•
First Horizon Advisors, Inc. is licensed as an insurance agency in the states where it does business for which licensing is required for the sale of annuity products.
•
Our financial subsidiaries under the Gramm-Leach-Bliley Act are: American Abstract & Title Company; Asset Exchange, Inc.; FHIS, Inc.; FHN Financial Securities Corp.; First Horizon Advisors, Inc.; First Horizon Insurance Agency, Inc.; First Horizon Insurance Services, Inc.; IBERIA Capital Partners LLC; Lenders Title Company; United Title & Abstract L.L.C.; and United Title of Louisiana, Inc.
Client Concentration
Neither we nor any of our significant subsidiaries is dependent upon a single client or very few clients.
Calendar-Year Seasonality
We do not experience material seasonality. We do experience seasonal variation in certain revenues, expenses, and credit trends. Historically, these variations have somewhat increased certain expenses and diminished certain revenues for the regional and specialty banking segments, principally in the first quarter each year. In addition, we experience seasonal variation in certain asset and liability balances, principally in the fourth quarter
(consumer mortgages, related title services, commercial lending related to consumer mortgages, certain trading balances, and certain associate-related reserves) and first quarter (consumer mortgages, related title services, and commercial lending related to consumer mortgages).
Cyclicality
Banking
Financial services facilitate commercial and consumer economic activities in critical ways. In many key respects, modern financial services make modern types and volumes of economic activity possible. Put more simply, we do well when our clients do well, and
vice-versa
. As a result, our banking business is broadly and strongly dependent on the size and strength of the U.S. economy.
Generally, when the U.S. economy is in an expansionary phase of the business cycle, our loan balances rise, income from lending tends to rise (assuming static interest rates), credit losses tend to fall, and fee income tends to increase. In a contracting phase, those patterns tend to reverse. The impact of those factors on our operating results can be substantial, especially if they consistently move up or down at the same time.
Our traditional banking businesses are crucially dependent on the level of interest rates, whether federal monetary policy is easing or tightening, and on the shape of the interest rate yield curve. These factors also are cyclical, and are related in complex ways with the business cycle mentioned above.
These factors, and their impacts on us, often are mixed rather than consistently positive or negative. For example: low interest rates reduce the interest income we earn, reduce our costs of funding, tend to stimulate economic activity and loan growth, and, through lower debt service, tend to ease financial pressure on clients, reducing default risk. If the yield curve remains relatively steep, with long-term interest rates noticeably higher than short rates, our net interest margin will tend not to be significantly compressed by the lower rate environment, since lower short rates will keep our deposit costs down while higher long rates will support the rates we can charge on lending. But if rates fall low enough (as they have in recent years), the yield curve will flatten and our margins will suffer. Moreover, the Federal Reserve tends to lower rates in response to, or to avoid, a weakening economy. Economic weakness tends to diminish client borrowing and other activities which benefit our performance.
Further information on these topics is presented: within Item 1A, in
Risk from Economic Downturns and Changes
(p. 31),
Risks Associated with Monetary Events
(p. 31),
Liquidity and Funding Risks
(p. 39), and
Interest Rate and Yield Curve Risks
(p. 40); and,
|
FIRST HORIZON CORPORATION
|
15
|
2020 FORM 10-K ANNUAL REPORT | ||||||
within 2020 MD&A (Item 7), in
2020
Financial Performance Summary
(p. 53),
Interest Rate Risk Management
(p. 90), and
Market Uncertainties and Prospective Trends
(p. 98).
Fixed Income
Our fixed income and capital markets business, reported as part of our specialty banking segment, is significantly affected by interest rate cycles which, in turn, are affected by general economic and business cycles.
In broad terms, the typical impact of Federal Reserve interest and monetary policy on our fixed income business is summarized in Table 1.7.
Table 1.7
Fed Policy Impact on
Fixed Income Performance
| Federal Reserve Policy Phase | |||||||||||
| Tightening | Neutral | Easing | |||||||||
|
Fixed Income Performance
Tends to be |
Weaker | Average | Stronger | ||||||||
“Tightening” can include actions by the Federal Reserve to raise short-term interest rates, raise long-term rates, tighten credit, shrink the money supply, and decelerate economic activity. “Easing” can include actions by the Federal Reserve to lower short-term interest rates, lower long-term rates, loosen credit, expand the money supply, and accelerate economic activity. Expectations of policy actions can have impacts similar to the actions themselves.
In terms of tightening vs. easing, the Federal Reserve policy phase sometimes is clearly known, but sometimes is not. Although Federal Reserve actions at a given time can consistently support one phase, often they are a mix. For example, The Federal Reserve may want to flatten the yield curve by raising short-term rates while lowering long-term rates, or steepen the curve by taking the opposite actions. Also, major exogenous factors, such as the COVID-19 pandemic, can significantly impact the capital markets and the performance of our fixed income business. In broad terms, these relationships are summarized in Table 1.8.
Table 1.8
Key Drivers of
Fixed Income Performance
| Driver | If Driver Is: | FI Revenues Tend to Be: | ||||||
| Interest rates | Rising | Lower | ||||||
| Falling | Higher | |||||||
| Market volatility | Low | Lower | ||||||
| Moderate | Higher | |||||||
| Yield curve | Flatter | Lower | ||||||
| Steeper | Higher | |||||||
| Credit spreads | Narrower | Lower | ||||||
| Wider | Higher | |||||||
| Economy outlook | Positive | Lower | ||||||
| Negative | Higher | |||||||
In many circumstances these drivers deliver mixed impacts on fixed income performance, with some pushing higher while others push lower, or with some drivers pushing weakly while others are stronger. If most or all drivers strongly push in the same direction at the same time, fixed income performance usually is strongly impacted. Revenue levels in a strongly “higher” year can be more than double what they are in a strongly “lower” year. As a result, fixed income performance can be highly variable from year to year.
Mortgage Origination and Related Services
The strength of consumer mortgage lending activity in the U.S. impacts three businesses of ours: mortgage origination and related services, title services, and commercial lending to other mortgage lenders.
Mortgage lending activity is strongly linked to interest rate cycles. Activity tends to be inversely related to prevailing mortgage rates: when rates are high, home-buying and refinancing decrease, and when rates are low, home-buying and refinancing increase. Moreover, expectations about near-term future mortgage rates can accelerate or delay those impacts, as borrowers rush to avoid future rate increases or wait for future rate decreases.
Human Resources Management
Firstpower Culture
Our principal business is providing financial services to our clients. Although many financial services can be delivered through technology today, we believe that our clients’ experiences with our associates is a critical way we differentiate from our competitors. Specifically, we ask our associates to take advantage of every opportunity to anticipate client needs and exceed client expectations.
For this “differentiated experience” strategy to succeed, we must build and nurture a diverse and inclusive workplace culture that strives to attract, hire, and retain the best people available by compensating
|
FIRST HORIZON CORPORATION
|
16
|
2020 FORM 10-K ANNUAL REPORT | ||||||
and, just as importantly, treating people fairly; ensure that associates have opportunities for professional growth and advancement within the company; support associates with appropriate workplace resources and training; promote constructive collegiality and a sense of workplace community; encourage innovation and the development of better ways to address business challenges; publicly recognize within the company associate achievements, both great and small; and promote behaviors that provide clients with best-in-class service. At First Horizon, we call that culture “Firstpower.”
We have evolved Firstpower as a part of our MOE to incorporate aspects of both organizations—expanded expertise, resources and geographic footprint—into the culture of our company. We have developed the following Purpose, Promise and Principles to guide our associates on our core values and philosophies.
Our Purpose:
First Horizon is a relationship-driven leading provider of financial solutions.
Our Promise:
To strengthen the lives of our associates, clients and communities.
Our Principles:
•
Great Place To Work
– offer a collaborative and inclusive workplace that promotes associate development, performance and success
•
Build Strong Relationships
– exceed clients’ expectations by understanding their unique needs
•
Deliver Results
– consistently deliver shareholder value
•
Give Back
– invest in strategic partnerships to build strong communities
•
Fortitude
– lead with integrity, accountability, agility, resilience and compassion
We use many tools and resources—programs, events, promotions, communication channels—to nurture and enhance our Firstpower culture. We focus on offering a variety of opportunities that promote mentoring, wellness, internships, diversity, inclusion, volunteering, informal shout-outs and formal recognitions, career management and continuing education, resource groups, and parental and care-giver support.
We believe that Firstpower is responsible for awards and recognitions we have received. Our recent recognitions have included: Forbes’ America’s Best Large Employers; Forbes’ World’s Best Banks; Fortune’s Best Workplaces in Finance and Insurance; National Association for Female Executives – Top 50 Companies for Executive Women; Dave Thomas’ Adoption-Friendly Workplaces; Diversity Best Practices Inclusion; and Bloomberg 2019 Gender-Equality Index.
In addition to our Firstpower culture, we have developed five strategic pillars for our Diversity, Equity and Inclusion program that builds upon our track record of success, helps to ensure adoption throughout our organization, and defines a path for sustainable progress. We enable our DEI strategy through:
•
Ensuring representation of diverse talent
•
Strengthening leadership capabilities and accountability
•
Fostering inclusion and equality through fairness and transparency
•
Better serving diverse markets and clients
•
Investing in the well-being of communities
Year-End Statistical Information
At December 31, 2020*, First Horizon had:
•
6,802 associates
, or 6,697 full-time-equivalent associates, not including contract labor for certain services:
◦
68% white, 19% African American, 8% Latino, 3% Asian, and 1% two or more races or ethnicities
◦
66% female and 34% male
•
1,661 corporate managers:
◦
78% white, 11% African American, 8% Latino, 1% Asian, and .1% two or more races or ethnicities
◦
57% female and 43% male
__________
*Percentages may not add to 100% due to rounding
Other Information Associated with this Report
For additional information concerning our business, refer to 2020 MD&A (Item 7).
External Information
Our current internet address is
www.firsthorizon.com
. In the Investor Relations section of our internet website, under the SEC Filings tab, we make available to the public, free of charge, our annual reports on Form 10-K, quarterly reports on Form 10-Q, current reports on Form 8-K, proxy statements, and amendments thereto as soon as reasonably practicable after we file such material with, or furnish such material to, the Securities and Exchange Commission. Additional information regarding materials available on our website is provided in Item 10 of this report beginning on page 232. No information external to this report and its exhibits, unless specifically noted otherwise, is incorporated into this report.
|
FIRST HORIZON CORPORATION
|
17
|
2020 FORM 10-K ANNUAL REPORT | ||||||
| Supervision and Regulation | ||||||||||||||
Scope of this Section
This section describes certain of the material elements of the regulatory framework applicable to bank and financial holding companies and their subsidiaries, and to companies engaged in securities and insurance activities. It also provides certain specific information about us. To the extent that the following information describes statutory and regulatory provisions, it is qualified in its entirety by express reference to each of the particular statutory and regulatory provisions. A change in applicable statutes, regulations, or regulatory policy may have a material effect on our business.
Overview
The Corporation
First Horizon Corporation is a bank holding company and financial holding company within the meaning of the Bank Holding Company Act of 1956, as amended (the “BHCA”), and is registered with the Federal Reserve. We are subject to the regulation and supervision of, and to examination by, the Federal Reserve under the BHCA. We are required to file with the Federal Reserve annual reports and such additional information as the Federal Reserve may require pursuant to the BHCA.
A bank holding company that is not a financial holding company is limited to engaging in “banking” and activities found by the Federal Reserve to be “closely related to banking.” Eligible bank holding companies that elect to become financial holding companies may affiliate with securities firms and insurance companies and engage in activities that are “financial in nature.” “Financial” activities are broader in scope than those which are “closely related to banking.” See
Financial Activities other than Banking
beginning on page 23 below.
The Federal Reserve may approve an application by a bank holding company to acquire a bank located outside the acquirer’s principal state of operations without regard to whether the transaction is prohibited under state law, although state law may still impose certain requirements. See
Interstate Branching and Mergers
beginning on page 23, and
Community Reinvestment Act (“CRA”)
beginning on page 23.
The Tennessee Bank Structure Act of 1974, among other things, prohibits (subject to certain exceptions) a bank holding company from acquiring a bank for which the home state is Tennessee (a “Tennessee bank”) if, upon consummation, the company would directly or indirectly control 30% or more of the total deposits in insured depository institutions in
Tennessee. As of June 30, 2020, the FDIC reports that the Bank held approximately 16% of such deposits.
The Bank
First Horizon Bank, our most significant subsidiary, is a Tennessee banking corporation subject to the regulation and supervision of, and to examination by, the TDFI. In addition to general supervision and examination powers, the TDFI has the power to approve mergers with the Bank, the Bank’s issuance of preferred stock or capital notes, the establishment of banking centers, and many other corporate actions.
The Bank has chosen to be a member of the Federal Reserve; as a result, the Federal Reserve is the Bank’s primary federal regulator. As a member bank, the Bank must buy and hold stock in its district Federal Reserve Bank equal to 6% of the Bank’s capital stock and surplus. The Bank is paid a dividend on its investment at a rate which varies with ten-year U.S. Treasury rates, capped at 6%. The Bank cannot sell its investment in Federal Reserve Bank stock, and the investment provides the Bank with no control over the Federal Reserve System.
Tennessee law requires the Bank, as a member of the Federal Reserve, to comply with federal capital and many other regulatory requirements in lieu of, or sometimes in addition to, state requirements. For that reason, this “Supervision and Regulation” section focuses on federal requirements for many topics related to the Bank, mentioning state requirements only where significant.
From 1864 until October 2019, the Bank was a national banking association subject to the regulation and supervision of, and to examination by, the Office of the Comptroller of the Currency. During October 2019, the Bank converted from a national bank to a Tennessee state bank. Conversion did not significantly alter the scope of the Bank’s activities: Tennessee law generally allows a Tennessee state bank to take any action that a Tennessee-based national bank could take.
The Bank is insured by, and subject to regulation by, the FDIC and is subject to regulation in certain respects by the CFPB. The Bank is also subject to various requirements and restrictions under federal and state law, including requirements to maintain reserves against deposits, restrictions on the types and amounts of loans that may be made and the interest that may be charged, limitations on the types of investments that may be made, activities that may
|
FIRST HORIZON CORPORATION
|
18
|
2020 FORM 10-K ANNUAL REPORT | ||||||
be engaged in, and types of services that may be offered. Various consumer laws and regulations also affect the operations of the Bank. In addition, several of the Bank’s subsidiaries are regulated separately, as discussed in
Subsidiaries
beginning on page 15 of this report.
In addition to the impact of regulation, commercial banks are affected significantly by the actions of the Federal Reserve as it attempts to control money supply and credit availability in order to influence the economy. Also, the Bank and certain of its subsidiaries are prohibited from engaging in certain tie-in arrangements in connection with extensions of credit, leases or sales of property, or furnishing products or services.
The regulatory framework governing banks and the financial industry is intended primarily to protect depositors and the Federal Deposit Insurance Fund, not to protect our Bank or our security holders.
Regulatory Tiers Based on Asset Size
Many rules dealing with critical regulatory topics divide banks into tiers based largely or entirely on asset size. Different topics have different cut-off points for the tiers. Within each topic, different rules apply to the different tiers.
Cut-off points vary significantly. However, as a rough generalization, for many regulatory topics the critical cut-off points are $10 billion, $100 billion, and $250 billion. Companies with less than $10 billion are less regulated in several important ways than we are, and companies with $250 billion or more are regulated much more severely in many important ways than we are. As a result, under current law, compliance costs and restrictions grow with size, they tend to change abruptly as a company crosses to the next tier, and we are in a middle tier in many respects.
The remainder of this
Supervision and Regulation
discussion focuses on current rules which apply to FHN based on our current asset size.
Large-Bank Supervision Risk Categories
Federal regulators have established four risk-based categories for applying enhanced prudential standards (enhanced for larger banks). Category I applies to the global systemically important companies. Categories II, III, and IV apply (with certain exceptions) to institutions with total consolidated assets of at least $700 billion, $250 billion, and $100 billion, respectively. Currently, we and the Bank are below Category IV’s floor and therefore, generally, we are not subject to enhanced prudential standards.
Payment of Dividends
First Horizon Corporation is a legal entity separate and distinct from First Horizon Bank and other subsidiaries. Our principal source of cash flow,
including cash flow to pay dividends on our stock or to pay principal (including premium, if any) and interest on debt securities, is dividends from the Bank. There are statutory and regulatory limitations on the payment of dividends by the Bank to us, as well as by us to ours shareholders.
The Corporation
Under Tennessee corporate law, we are not permitted to pay cash dividends if, after giving effect to such payment, we would not be able to pay our debts as they become due in the usual course of business or our total assets would be less than the sum of our total liabilities plus any amounts needed to satisfy any preferential rights if we were dissolving. In addition, in deciding whether or not to declare a dividend of any particular size, our Board must consider our current and prospective capital, liquidity, and other needs, including the needs of the Bank which we are obligated to support.
The Bank
Under Tennessee corporate law, the Bank (like the Corporation, discussed above) may not pay a dividend if the Bank would not be able to pay its debts when due or if the Bank’s assets would be inadequate, in a dissolution, to pay liabilities and preferential rights. Similarly, the Bank’s Board must consider current and prospective needs in making a decision to declare a dividend.
In addition, in order to pay cash dividends, the Bank must obtain the prior approval of the Federal Reserve and the TDFI Commissioner if the total of all dividends declared by the Bank’s board of directors in any calendar year exceeds the total of (i) the Bank’s retained net income for that year plus (ii) the Bank’s retained net income for the preceding two years, less certain required capital transfers, as applicable. Below that ceiling, approval generally is not required (but see
Other Factors Affecting Dividends
immediately following this discussion). Applying the applicable rules, at January 1, 2021, the Bank could legally declare cash dividends on the Bank's common or preferred stock totaling approximately $897 million without obtaining approval. The application of those restrictions to the Bank is discussed in more detail in the following sections, all of which is incorporated into this Item 1 by reference: under the caption
Liquidity Risk Management
in our 2020 MD&A (Item 7) beginning on page 92 of this report; and under the caption
Restrictions on dividends
in Note 13—Regulatory Capital and Restrictions of our 2020 Financial Statements (Item 8), beginning on page 175.
Other Factors Affecting Dividends
If, in the opinion of the Federal Reserve, we or the Bank are engaged in or about to engage in an unsafe or unsound practice (which, depending on the
|
FIRST HORIZON CORPORATION
|
19
|
2020 FORM 10-K ANNUAL REPORT | ||||||
financial condition of FHN or the Bank, could include the payment of dividends), the Federal Reserve may require us or the Bank to cease and desist from that practice. The federal banking agencies have indicated that paying dividends that deplete a depository institution’s or holding company’s capital base to an inadequate level would be an unsafe and unsound banking practice.
In addition, under the Federal Deposit Insurance Act, an FDIC-insured depository institution (such as the Bank) may not make any capital distributions, pay any management fees to its holding company, or pay any dividend if it is undercapitalized or if such payment would cause it to become undercapitalized.
The payment of cash dividends by us or by the Bank also may be affected or limited by other factors, such as the requirement to maintain adequate capital above regulatory guidelines and requirements imposed by debt covenants. For example, as discussed under
Capital Adequacy
starting on page 20, our ability to pay dividends would be restricted if its capital ratios fell below minimum regulatory requirements plus a capital conservation buffer.
The Federal Reserve generally requires insured banks and bank holding companies to pay dividends only out of current operating earnings. The Federal Reserve has released a supervisory letter advising, among other things, that a bank holding company should inform the Federal Reserve and should eliminate, defer, or significantly reduce its dividends if (i) the bank holding company’s net income available to shareholders for the past four quarters, net of dividends previously paid during that period, is not sufficient to fully fund the dividends; (ii) the bank holding company’s prospective rate of earnings is not consistent with the bank holding company’s capital needs and overall current and prospective financial condition; or (iii) the bank holding company will not meet, or is in danger of not meeting, its minimum regulatory capital adequacy ratios.
Transactions with Affiliates
The Bank’s ability to lend or extend credit to its parent company or nonbank subsidiaries (including for purposes of this paragraph, in certain situations, subsidiaries of the Bank) is restricted. The Bank and its subsidiaries generally may not extend credit to us or to any other affiliate in an amount which exceeds 10% of the Bank’s capital stock and surplus and may not extend credit in the aggregate to all such affiliates in an amount which exceeds 20% of its capital stock and surplus. Extensions of credit and other transactions between the Bank and us or such other affiliates must be on terms and under circumstances, including credit standards, that are substantially the same or at least as favorable to the Bank as those prevailing at the time for comparable transactions with non-affiliated companies. Further, the type,
amount, and quality of collateral which must secure such extensions of credit is regulated.
There are similar legal restrictions on: the Bank’s purchases of or investments in the securities of and purchases of assets from us and our nonbank subsidiaries; the Bank’s loans or extensions of credit to third parties collateralized by the securities or obligations of ours and our nonbank subsidiaries; the issuance of guaranties, acceptances, and letters of credit on behalf of us and our nonbank subsidiaries; and certain bank transactions with us and our nonbank subsidiaries, or with respect to which we and our nonbank subsidiaries act as agent, participate, or have a financial interest.
Capital Adequacy
Federal financial industry regulators require that regulated institutions maintain minimum capital levels. The capital rules in the U.S. are based on international standards known as “Basel III.” Those U.S. rules require the following:
•
Common Equity Tier 1 Capital Ratio.
For all supervised financial institutions, including us and the Bank, the ratio of Common Equity Tier 1 Capital to risk-weighted assets (“Common Equity Tier 1 Capital ratio”) must be at least 4.5%. To be “well capitalized” the Common Equity Tier 1 Capital ratio must be at least 6.5%. Common Equity Tier 1 Capital consists of core components of Tier 1 Capital. The core components consist of common stock plus retained earnings net of goodwill, other intangible assets, and certain other required deduction items. At December 31, 2020, our Common Equity Tier 1 Capital Ratio was 9.68% and the Bank’s was 10.46%.
•
Tier 1 Capital Ratio.
For all supervised financial institutions, including us and the Bank, the ratio of Tier 1 Capital to risk-weighted assets must be at least 6%. To be “well capitalized” the Tier 1 Capital ratio must be at least 8%. Tier 1 Capital consists of the Tier 1 core components discussed in the bulleted paragraph immediately above, plus non-cumulative perpetual preferred stock, a limited amount of minority interests in the equity accounts of consolidated subsidiaries, and a limited amount of cumulative perpetual preferred stock, net of goodwill, other intangible assets, and certain other required deduction items. At December 31, 2020, our Tier 1 Capital Ratio was 10.74% and the Bank’s was 10.93%.
•
Total Capital Ratio.
For all supervised financial institutions, including us and the Bank, the ratio of Total Capital to risk-weighted assets must be at least 8%. To be “well capitalized” the Total Capital ratios must be at least 10%. At December 31, 2020, our Total Capital Ratio was 12.57% and the Bank’s was 12.52%.
|
FIRST HORIZON CORPORATION
|
20
|
2020 FORM 10-K ANNUAL REPORT | ||||||
•
Capital Conservation Buffer.
If a capital conservation buffer of an additional 2.5% above the minimum required Common Equity Tier 1 Capital ratio, Tier 1 Capital ratio, and Total Capital ratio is not maintained, special restrictions would apply to capital distributions, such as dividends and stock repurchases, and on certain compensatory bonuses.
•
Leverage Ratio—Base.
For all supervised financial institutions, including us or the Bank, the Leverage ratio must be at least 4%. To be “well capitalized” the Leverage ratio must be at least 5%. The Leverage ratio is Tier 1 Capital divided by quarterly average assets net of goodwill, certain other intangible assets, and certain required deduction items. At December 31, 2020, our Leverage ratio was 8.24% and the Bank’s was 8.36%.
•
Leverage Ratio—Supplemental.
For the largest internationally active supervised financial institutions, not including us or the Bank, a minimum supplementary Leverage ratio must be maintained that takes into account certain off-balance sheet exposures.
We believe that we and the Bank were in compliance with applicable minimum capital requirements as of December 31, 2020.
Federal regulators have incorporated market and interest-rate risk components into its risk-based capital standards. Those standards explicitly identify concentration of credit risk and certain risks arising from non-traditional activities, and the management of such risks, as important qualitative factors to consider in assessing an institution’s overall capital adequacy.
Federal regulators’ market risk rules are applicable to covered institutions—those with aggregate trading assets and trading liabilities of at least 10% of their total assets or at least $1 billion. We and the Bank are covered institutions under the rule. The rules specify the methodology for calculating the amount of
risk-weighted assets related to trading assets and include, among other things, the addition of a component for stressed value at risk. The rule eliminates the use of credit ratings in calculating specific risk capital requirements for certain debt and securitization positions. Alternative standards of creditworthiness are used for specific standardized risks, such as exposures to sovereign debt, public sector entities, other banking institutions, corporate debt, and securitizations. In addition, an 8% capital surcharge applies to certain covered institutions, not including us or the Bank.
Moreover, the Federal Reserve has indicated that it considers a “Tangible Tier 1 Capital Leverage Ratio” (deducting all intangibles) and other indicia of capital strength in evaluating proposals for expansion or new activities.
Failure to meet capital guidelines could subject a bank to a variety of enforcement remedies, including the termination of deposit insurance by the FDIC, and to certain restrictions on its business and in certain circumstances to the appointment of a conservator or receiver. See
Prompt Corrective Action (PCA)
immediately below for additional information.
In addition, the Bank is required to have a capital structure that the TDFI determines is adequate, based on TDFI’s assessment of the Bank’s businesses and risks. The TDFI may require the Bank to increase its capital, if found to be inadequate.
Prompt Corrective Action (PCA)
Federal banking regulators must take “prompt corrective action” regarding FDIC-insured depository institutions that do not meet minimum capital requirements. For this purpose, insured depository institutions are divided into five capital categories. The specific requirements applicable to us are summarized in Table 1.9
|
FIRST HORIZON CORPORATION
|
21
|
2020 FORM 10-K ANNUAL REPORT | ||||||
Table 1.9
REQUIREMENTS FOR PCA CAPITALIZATION CATEGORIES
| Well capitalized |
•
Common Equity Tier 1 Capital ratio of at least 6.5%
•
Tier 1 Capital ratio of at least 8%
•
Total Capital ratio of at least 10%
•
Leverage ratio of at least 5%
•
Not subject to a directive, order, or written agreement to meet and maintain specific capital levels
|
||||
| Adequately capitalized |
•
Common Equity Tier 1 Capital ratio of at least 4.5%
•
Tier 1 Capital ratio of at least 6%
•
Total Capital ratio of at least 8%
•
Leverage ratio of at least 4%
•
Not subject to a directive, order, or written agreement to meet and maintain specific capital levels
|
||||
| Undercapitalized | Failure to maintain any requirement to be adequately capitalized | ||||
| Significantly Undercapitalized | Failure to maintain Common Equity Tier 1 Capital ratio of at least 3%, Tier 1 Capital ratio of at least 4%, Total Capital ratio of at least 6%, or a Leverage ratio of at least 3% | ||||
| Critically Undercapitalized | Failure to maintain a level of tangible equity equal to at least 2% of total assets | ||||
At December 31, 2020, the Bank had sufficient capital to qualify as “well capitalized” under the regulatory capital requirements discussed above. An institution may be deemed to be in a capitalization category that is lower than is indicated by its actual capital position if it receives an unsatisfactory examination rating. Institutions generally are not allowed to publicly disclose examination results.
An FDIC-insured depository institution generally is prohibited from making any capital distribution (including payment of dividends) or paying any management fee to its holding company if the depository institution would thereafter be undercapitalized. Undercapitalized depository institutions are subject to restrictions on borrowing from the Federal Reserve System. In addition, undercapitalized depository institutions are subject to growth limitations and are required to submit capital restoration plans. An insured depository institution’s holding company must guarantee the capital plan, up to an amount equal to the lesser of 5% of the depository institution’s assets at the time it becomes undercapitalized or the amount of the capital deficiency when the institution fails to comply with the plan, for the plan to be accepted by the applicable federal regulatory authority. The federal banking agencies may not accept a capital plan without determining, among other things, that the plan is based on realistic assumptions and is likely to succeed in restoring the depository institution’s capital. If a depository institution fails to submit an acceptable plan, it is treated as if it were significantly undercapitalized.
Significantly undercapitalized depository institutions may be subject to a number of requirements and restrictions, including orders to sell sufficient voting stock to become adequately capitalized, requirements to reduce total assets and cessation of receipt of deposits from correspondent banks.
Critically undercapitalized depository institutions are subject to appointment of a receiver or conservator, generally within 90 days of the date on which they become critically undercapitalized.
Liquidity Coverage Ratio
The LCR requirement does not apply to institutions with assets of less than $100 billion, and so does not apply to us or the Bank. For larger institutions, the requirement applies based on a bank’s asset size.
Holding Company Structure and Support of Subsidiary Banks
Because we are a holding company, our right to participate in the assets of any subsidiary upon the latter’s liquidation or reorganization will be subject to the prior claims of the subsidiary’s creditors (including depositors in the case of the Bank) except to the extent that we may be a creditor with recognized claims against the subsidiary. In addition, depositors of a bank, and the FDIC as their subrogee, would be entitled to priority over the other creditors in the event of liquidation of the bank.
Under Federal Reserve policy we are expected to act as a source of financial strength to, and to commit resources to support, the Bank. This support may be required at times even if, absent such Federal Reserve policy, we might not wish to provide it. In addition, any capital loans by a bank holding company to any of its subsidiary banks are subordinate in right of payment to deposits and to certain other indebtedness of the subsidiary bank. In the event of a bank holding company’s bankruptcy, any commitment by the bank holding company to a federal bank regulatory agency to maintain the capital of a subsidiary bank will be assumed by the bankruptcy trustee and entitled to a priority of payment.
|
FIRST HORIZON CORPORATION
|
22
|
2020 FORM 10-K ANNUAL REPORT | ||||||
Cross-Guarantee Liability
A depository institution insured by the FDIC can be held liable for any loss incurred by, or reasonably expected to be incurred by, the FDIC in connection with (i) the default of a commonly controlled FDIC-insured depository institution or (ii) any assistance provided by the FDIC to any commonly controlled FDIC-insured depository institution “in danger of default.” “Default” is defined generally as the appointment of a conservator or receiver and “in danger of default” is defined generally as the existence of certain conditions indicating that a default is likely to occur in the absence of regulatory assistance. The FDIC’s claim for damages is superior to claims of shareholders of the insured depository institution or its holding company but is subordinate to claims of depositors, secured creditors, and holders of subordinated debt (other than affiliates) of the commonly controlled insured depository institution.
Currently the Bank is our only depository institution subsidiary. If we were to own or operate another depository institution, any loss suffered by the FDIC in respect of one subsidiary bank would likely result in assertion of the cross-guarantee provisions, the assessment of estimated losses against our other subsidiary bank(s), and a potential loss of our investment in our subsidiary banks.
Interstate Branching and Mergers
As mentioned above, the Bank generally must have TDFI’s approval to establish a new banking center (technically, a “branch”). For a new banking center located outside of Tennessee, Tennessee law requires the Bank to comply with branching laws applicable to the state where the new banking center will be located. Federal law allows the Bank to establish or acquire a branch in another state to the same extent as a bank chartered in that other state would be allowed to establish or acquire a branch in Tennessee.
For an interstate merger or acquisition: the acquiring bank must be well-capitalized and well-managed; concentration limits on liabilities and deposits may not be exceeded; regulators must assess the transaction for incremental systemic risk; and the acquiring bank must have at least “satisfactory” standing under the federal Community Reinvestment Act (discussed immediately below).
Once a bank has established branches in a state through
de novo
or acquired branching or through an interstate merger transaction, the bank may then establish or acquire additional branches within that state to the same extent that a bank chartered in that state is allowed to establish or acquire branches within the state.
Community Reinvestment Act (“CRA”)
The CRA requires each U.S. bank, consistent with safe and sound operation, to help meet the credit needs of each community where the bank accepts deposits, including low- and moderate-income (“LMI”) communities. The Federal Reserve assesses the Bank periodically for CRA compliance, and that assessment is made public. The Bank’s LMI operations and activities traditionally are critical focal points in those assessments.
A CRA rating below “satisfactory” can slow or halt a bank’s plans to expand by branching, acquisition, or merger, and can prevent a bank holding company from becoming a financial holding company. The Bank received a rating of “Satisfactory” in its most recent CRA assessment, issued in 2017. The next CRA assessment is ongoing at the time this report is filed.
Late in 2020, the Federal Reserve proposed changes to its regulations under the CRA. Among other things, the proposal would add quantitative measures to CRA assessments, as well as several new categories of tests. Currently the Federal Reserve, the OCC, and the FDIC have CRA modernization proposals outstanding, and all three differ from each other.
Financial Activities other than Banking
Federal Law
Federal law generally allows financial holding companies broad authority to engage in activities that are financial in nature or incidental to a financial activity. These include: insurance underwriting and brokerage; merchant banking; securities underwriting, dealing, and market-making; real estate development; and such additional activities as the Federal Reserve in consultation with the Secretary of the Treasury determines to be financial in nature or incidental. A bank holding company may engage in these activities directly or through subsidiaries by qualifying as a “financial holding company.” To qualify as a financial holding company, a bank holding company must file an initial declaration with the Federal Reserve, certifying that all of its subsidiary depository institutions are well-managed and well-capitalized.
Federal law also permits banks to engage in certain of these activities through financial subsidiaries. To control or hold an interest in a financial subsidiary, a bank must meet the following requirements:
(1) The bank must receive approval from its primary federal regulator for the financial subsidiary to engage in the activities.
(2) The bank and its depository institution affiliates must each be well-capitalized and well-managed.
(3) The aggregate consolidated total assets of all of the bank’s financial subsidiaries must not exceed the lesser of: 45% of the bank’s consolidated total
|
FIRST HORIZON CORPORATION
|
23
|
2020 FORM 10-K ANNUAL REPORT | ||||||
assets; or $50 billion (subject to indexing for inflation).
(4) The bank must have in place adequate policies and procedures to identify and manage financial and operational risks and to preserve the separate identities and limited liability of the bank and the financial subsidiary.
(5) If the bank is among the 100 largest banks, the bank must meet the long-term debt rating or alternative standards adopted by the Federal Reserve and the U.S. Secretary of the Treasury from time to time. If this fifth requirement ceases to be met after a bank controls or holds an interest in a financial subsidiary, the bank cannot invest additional capital in that subsidiary until the requirement again is met.
No new activity may be commenced unless the bank and all of its depository institution affiliates have at least “satisfactory” CRA ratings. Certain restrictions apply if the bank holding company or the bank fails to continue to meet one or more of the requirements listed above.
In addition, federal law contains a number of other provisions that may affect the Bank’s operations, including limitations on the use and disclosure to third parties of client information.
At December 31, 2020, we are a financial holding company and the Bank has a number of financial subsidiaries, as discussed in
Subsidiaries
beginning on page 15 of this report.
Tennessee Law
Tennessee law does not expressly restrict the activities of a bank holding company or its non-bank affiliates. However, no Tennessee bank may maintain a branch office on the premises of an affiliate if the affiliate is engaged in activities that are not permissible for a bank holding company, a financial holding company, a national bank, or a national bank subsidiary under federal law. Tennessee law permits Tennessee banks to establish subsidiaries and to engage in any activities permissible for a national bank located in Tennessee, subject to compliance with Tennessee regulations relating to the conduct of such activities for the purpose of maintaining bank safety and soundness.
Interchange Fee Restrictions
Regulations severely cap interchange fees which the Bank may charge merchants for debit card transactions.
Volcker Rule
The Volcker rule (1) generally prohibits banks from engaging in proprietary trading, which is engaging as principal (for the bank’s own account) in any purchase or sale of one or more of certain types of
financial instruments, and (2) limits banks’ ability to invest in or sponsor hedge funds or private equity funds.
Consumer Regulation by the CFPB
The CFPB adopts and administers significant rules affecting consumer lending and consumer financial services. Key rules for the Bank include detailed regulation of mortgage servicing practices and detailed regulation of mortgage origination and underwriting practices. The latter rules, among other things, establish the definition of a “qualified mortgage” using traditional underwriting practices involving down payments, credit history, income levels and verification, and so forth. The rules do not prohibit, but do tend to discourage, lenders from originating non-qualified mortgages.
Data Privacy & Security
Federal law restricts the Bank’s ability to share certain information with affiliates and non-affiliates for marketing and/or non-marketing purposes, or to contact clients with marketing offers. Federal law also requires banks to implement a comprehensive information security program that includes administrative, technical and physical safeguards.
Data privacy and protection increasingly is a significant legislative, regulatory, and societal concern. The concern is driven by major technological and societal shifts in the past 20 years, led by relatively unregulated firms such as Amazon.com, Alibaba, Facebook, and Google and their many clients worldwide. Those firms have gathered large amounts of personal details about millions of people, and today have the ability to analyze that data and act on that analysis very quickly. These firms seek to understand enough about a person to know what a person wants before the person does.
Banks (as mentioned above) already are subject to significant privacy regulations. Probably for that reason, the banking industry is not at the political center of these concerns today. Even so, banks are likely to be affected by broader legislative and regulatory responses to the perceived problems. Two prominent responses to date include the European Union General Data Protection Regulation and the California Data Privacy Protection Act. Neither is a banking industry regulation, but both apply to banks in relation to certain clients. To date, neither has had a material impact on the Bank.
FDIC Insurance Assessments; DIFA
U.S. bank deposits generally are insured by the Deposit Insurance Fund (“DIF”), administered by the FDIC. The system of FDIC insurance premium rates charged consists of a rate grid structure in which base rates range from 5 to 35 basis points annually, and fully adjusted rates range from 2.5 to 45 basis
|
FIRST HORIZON CORPORATION
|
24
|
2020 FORM 10-K ANNUAL REPORT | ||||||
points annually. (A basis point is equal to 0.01%.) Key factors in the grid include: the institution’s risk category (I to IV); whether the institution is deemed large and highly complex; whether the institution qualifies for an unsecured debt adjustment; and whether the institution is burdened with a brokered deposit adjustment. Other factors can impact the base against which the applicable rate is applied, including (for example) whether a net loss is realized.
Insurance of deposits may be terminated by the FDIC upon a finding that the institution has engaged in unsafe and unsound practices, is in an unsafe or unsound condition to continue operations, or has violated any applicable law, regulation, rule, order, or condition imposed by a federal bank regulatory agency.
Depositor Preference
Federal law provides that deposits and certain claims for administrative expenses and associate compensation against an insured depository institution would be afforded a priority over other general unsecured claims against such an institution, including federal funds and letters of credit, in the “liquidation or other resolution” of such an institution by any receiver.
Securities Regulation
Certain of our subsidiaries are subject to various securities laws and regulations and capital adequacy requirements promulgated by the regulatory and exchange authorities of the jurisdictions in which they operate.
Our registered broker-dealer subsidiaries are subject to the SEC’s net capital rule, Rule 15c3-1. That rule requires the maintenance of minimum net capital and limits the ability of the broker-dealer to transfer large amounts of capital to a parent company or affiliate. Compliance with the rule could limit operations that require intensive use of capital, such as underwriting and trading.
Certain of our subsidiaries are registered investment advisers which are regulated under the Investment Advisers Act of 1940. Advisory contracts with clients automatically terminate under these laws upon an assignment of the contract by the investment adviser unless appropriate consents are obtained.
Insurance Activities
Certain of our subsidiaries sell various types of insurance as agent in a number of states. Insurance activities are subject to regulation by the states in which such business is transacted. Although most of such regulation focuses on insurance companies and their insurance products, insurance agents and their activities are also subject to regulation by the states, including, among other things, licensing and marketing and sales practices.
Compensation and Risk Management
The Federal Reserve has issued guidance intended to ensure that incentive compensation arrangements at financial organizations take into account risk and are consistent with safe and sound practices. The guidance is based on three “key principles” calling for incentive compensation plans to: appropriately balance risks and rewards; be compatible with effective controls and risk management; and be backed up by strong corporate governance. In response: we operate an enhanced risk management process for assessing risk in incentive compensation plans; several key incentive programs use a net profit approach rather than a revenues-only approach; and mandatory deferral features are used in several key programs, including an executive program.
In 2016 federal agencies proposed regulations which could significantly change the regulation of incentive compensation programs at financial institutions. The proposal would create four tiers of institutions based on asset size. Institutions in the top two tiers would be subject to rules much more detailed and proscriptive than are currently in effect. If interpreted aggressively by the regulators, the proposed rules could be used to prevent, as a practical matter, larger institutions from engaging in certain lines of business where substantial commission and bonus pool arrangements are the norm. In the 2016 proposal, the top two tiers included institutions with more than $50 billion of assets. We and the Bank currently would fall into the lower of those top two tiers. However, prompted by post-2016 legislation which significantly raised several statutory asset-size tiers, if this proposal were finalized today, the $50 billion floor might be raised significantly, allowing us to remain in the third tier. We cannot predict what final rules may be adopted, nor how they may be implemented.
| Effect of Governmental Policies | ||||||||||||||
The Bank is affected by the policies of regulatory authorities, including the Federal Reserve, the TDFI, and the CFPB. The Federal Reserve also sets and manages monetary policy for the U.S. In this latter role, the Federal Reserve’s mandate from Congress is to pursue price stability and full employment.
Among the instruments of monetary policy used by the Federal Reserve are: purchases and sales of U.S. government and other securities in the marketplace; changes in the discount rate, which is the rate any depository institution must pay to borrow from the Federal Reserve; changes in the reserve requirements of depository institutions; changes in the rate paid on banks’ required and excess reserve
|
FIRST HORIZON CORPORATION
|
25
|
2020 FORM 10-K ANNUAL REPORT | ||||||
deposits at the Federal Reserve; and changes in the federal funds rate, which is the rate at which depository institutions lend balances to each other overnight. These instruments are intended to influence economic and monetary growth, interest rate levels, and inflation.
The monetary policies of the Federal Reserve and other governmental policies have had a significant effect on the operating results of commercial banks in the past and are expected to continue to do so in the
future. Because of changing conditions in the national and international economies and in the money markets, as well as the result of actions by monetary and fiscal authorities, it is not possible to predict with certainty future changes in interest rates, deposit levels, loan demand, or the business and results of our operations, or whether changing economic conditions will have a positive or negative effect on operations and earnings.
| Other Proposals | ||||||||||||||
Bills occasionally are introduced in the United States Congress, the Tennessee General Assembly and other state legislatures, and regulations occasionally are proposed by our regulatory agencies, any of which could affect our businesses, financial results, and financial condition.
We are not able to predict what, if any, changes that Congress, state legislatures, or the regulatory agencies will enact or implement in the future, nor the impact that those actions will have upon us.
| Sources and Availability of Funds | ||||||||||||||
Information concerning the sources and availability of funds for our businesses can be found in our 2020 MD&A (Item 7), including the subsection entitled
Liquidity Risk Management
on pages 92-94 of this report, which material is incorporated herein by reference.
|
ITEM 1A. RISK FACTORS
|
||||||||
This Item outlines specific risks that could affect the ability of our various businesses to compete, change our risk profile, or materially impact our operating results or financial condition. Our operating environment continues to evolve and new risks continue to emerge. To address that challenge we have a risk management governance structure that oversees processes for monitoring evolving risks and oversees various initiatives designed to manage and control our potential exposure.
This Item highlights risks that could impact us in material ways by causing future results to differ
materially from past results, by causing future results to differ materially from current expectations, or by causing material changes in our financial condition. In this Item we have outlined risks that we believe are important to us at the present time. However, other risks may prove to be important in the future, and new risks may emerge at any time. We cannot predict all potential developments that could materially affect our financial performance or condition.
|
FIRST HORIZON CORPORATION
|
26
|
2020 FORM 10-K ANNUAL REPORT | ||||||
TABLE OF ITEM 1A TOPICS
| Topic | Page | Topic | Page | |||||||||||||||||
| Traditional Competition Risks................................ | 27 | Risks of Expense Control.................................. | 38 | |||||||||||||||||
| Traditional Strategic and Macro Risks................... | 27 | Geographic Risks.............................................. | 38 | |||||||||||||||||
| Industry Disruption................................................. | 28 | Insurance.......................................................... | 39 | |||||||||||||||||
| Operational Risks.................................................. | 30 | Liquidity and Funding Risks.............................. | 39 | |||||||||||||||||
| Risks from Economic Downturns and Changes .... | 31 | Credit Ratings................................................... | 40 | |||||||||||||||||
| Risks Associated with Monetary Events................ | 31 | Interest Rate and Yield Curve Risks.................. | 40 | |||||||||||||||||
| Risks Related to Businesses We May Exit ........... | 32 | Asset Inventories and Market Risks.................. | 42 | |||||||||||||||||
| Reputation Risks................................................... | 32 | Mortgage Business Risks.................................. | 43 | |||||||||||||||||
| Credit Risks........................................................... | 33 | Pre-2009 Mortgage Business Risks.................. | 44 | |||||||||||||||||
| Service Risks......................................................... | 35 | Accounting & Tax Risks.................................... | 44 | |||||||||||||||||
| Risks related to COVID-19 Pandemic ................... | 35 | Stock-Holding and Governance Risks............... | 45 | |||||||||||||||||
| Regulatory, Legislative, and Legal Risks............... | 36 | |||||||||||||||||||
| Traditional Competition Risks | ||||||||||||||
We are subject to intense competition for clients, and the nature of that competition is changing quickly
.
Our primary areas of competition include: consumer and commercial deposits, commercial loans, consumer loans including home mortgages and lines of credit, financial planning and wealth management, fixed income products and services, title insurance services, and other consumer and commercial financial products and services. Our competitors in these areas include national, state, and non-US banks, savings and loan associations, credit unions, consumer finance companies, trust companies, investment counseling firms, money market and other mutual funds, insurance companies and agencies, securities firms, mortgage banking companies, hedge funds, and other financial services companies that serve in our markets. The emergence of non-traditional, disruptive service providers (see
Industry Disruption
beginning on page 28) has intensified the competitive environment.
Some competitors are traditional banks, subject to the same regulatory framework as we are, while others are not banks and in many cases experience a significantly different or reduced degree of regulation.
Examples of less-regulated activities include check-cashing services, independent ATM services, and “peer-to-peer” lending, where investors provide debt financing and/or capital directly to borrowers.
We expect that competition will continue to grow more intense with respect to most of our products and services.
Heightened competition tends to put downward pressure on revenues from affected items, upward pressure on marketing and other promotional costs, or both. For additional information regarding competition for clients, refer to
Competition
within Item 1 beginning on page 13 of this report.
We compete
for talent
. Our most significant competitors for clients also tend to be our most significant competitors for top talent. See
Operational Risks
beginning on page 30 of this Item 1A for additional information concerning this risk.
We compete
to raise
capital
in the equity and debt markets
. See
Liquidity and Funding Risks
beginning on page 39 of this Item 1A for additional information concerning this risk.
| Traditional Strategic and Macro Risks | ||||||||||||||
We may be unable to successfully implement our strategy to grow our commercial and consumer banking businesses and our fixed income business.
Although our current strategy is expected to evolve as business conditions change, in 2021 our strategy is primarily to invest resources in our banking businesses as we integrate the businesses and operations of First Horizon and IBKC, and seek to exploit opportunities for cost and revenue synergies. Organic growth, including exploitation of revenue synergies, is expected to be coordinated with a focus on strong and stable returns on capital.
Organically, we have enhanced our market share in our traditional banking markets with targeted hires and marketing, expanded into other southern U.S. markets with similar characteristics, and expanded with specialty commercial lending and private client banking.
In the future, we expect to continue to nurture profitable organic growth. We may pursue acquisitions or strategic transactions if appropriate opportunities, within or outside of our current markets, present themselves.
|
FIRST HORIZON CORPORATION
|
27
|
2020 FORM 10-K ANNUAL REPORT | ||||||
Failure to achieve one or more key elements needed for successful organic growth would adversely affect our business and earnings.
We believe that the successful execution of organic growth depends upon a number of key elements, including:
•
our ability to attract and retain clients in our banking market areas, particularly as we integrate First Horizon and IBKC;
•
our ability to achieve and maintain growth in our earnings while pursuing new business opportunities;
•
our ability to maintain a high level of client service while optimizing our physical banking center count due to changing client demand, all while expanding our remote banking services and expanding or enhancing our information processing, technology, compliance, and other operational infrastructures effectively and efficiently;
•
our ability to manage the liquidity and capital requirements associated with growth, especially organic growth and cash-funded acquisitions; and
•
our ability to manage effectively and efficiently the changes and adaptations necessitated by a complex, burdensome, and evolving regulatory environment.
We have in place strategies designed to achieve those elements that are significant to us at present. Our challenge is to execute those strategies and adjust them, or adopt new strategies, as conditions change.
Failure to achieve one or more key elements needed for successful business acquisitions would adversely affect our business and earnings.
In relation to the IBKC merger and the 30-branch acquisition closed in 2020, and to the extent we engage in future bank or non-bank business acquisitions, we face various additional risks, including:
•
our ability to realize planned strategic and tactical objectives, including operating efficiencies and revenue synergies, within a reasonable time period after closing the transaction;
•
our ability to identify, analyze, and correctly assess the execution, credit, contingency, and other risks in the acquisition and to price the transaction appropriately;
•
our ability to properly evaluate loss inherent in the target business’ loan portfolios;
•
our ability to integrate the acquired business’ operations, clients, and properties quickly and cost-effectively;
•
our ability to manage cultural assimilation risks associated with growth through acquisitions, which can be an often-overlooked and often-critical failure point in mergers;
•
our ability to combine the franchise values of the two companies without significant loss from re-branding and other similar changes; and
•
our ability to retain core clients and key associates.
A type of strategic acquisition—a so-called “merger of equals” where the company we nominally acquire has similar size, operating contribution, or value—presents unique opportunities but also unique risks.
Those special risks, which continue to be present in relation to the IBKC transaction, include:
•
the potential for elevated and duplicative operating expenses if we are unable to integrate the two companies efficiently in a reasonable amount of time; and
•
the potential for a significant increase in the time horizon that may be needed before substantial economies of scale can be realized or substantial revenue synergies can be developed effectively.
| Industry Disruption | ||||||||||||||
Through technological innovations and changes in client habits, the manner in which clients use financial services continues to change at a rapid pace.
We provide a large number of services remotely (online and mobile), and physical banking center utilization has been in long-term decline throughout the industry for many years. Technology has helped us reduce costs and improve service, but also has weakened traditional geographic and relationship ties, and has allowed disruptors to enter traditional banking areas.
Through digital marketing and service platforms, many banks are making client inroads unrelated to physical presence. This competitive risk is especially
pronounced from the largest U.S. banks, and from online-only banks, due in part to the investments they are able to sustain in their digital platforms.
Companies as disparate as PayPal (an online payment clearinghouse) and Starbucks (a large chain of cafes) provide payment and exchange services which compete directly with banks in ways not possible traditionally. Recently, some government leaders have discussed having the U.S. Post Office offer banking services.
The nature of technology-driven disruption to our industry is changing, in some cases seeking to displace traditional financial service providers
|
FIRST HORIZON CORPORATION
|
28
|
2020 FORM 10-K ANNUAL REPORT | ||||||
rather than merely enhance traditional services or their delivery.
A number of recent technologies have worked with the existing financial system and traditional banks, such as the evolution of ATM cards into debit/credit cards and the evolution of debit/credit cards into smart phones. These sorts of technologies often have expanded the market for banking services overall while siphoning a portion of the revenues from those services away from banks and disrupting prior methods of delivering those services. But some recent innovations may tend to replace traditional banks as financial service providers rather than merely augment those services.
For example, companies which claim to offer applications and services based on artificial intelligence are beginning to compete much more directly with traditional financial services companies in areas involving personal advice, including high-margin services such as financial planning and wealth management. The low-cost, high-speed nature of these “robo-advisor” services can be especially attractive to younger, less-affluent clients and potential clients, as well as persons interested in “self-service” investment management. Other industry changes, such as zero-commission trading offered by certain large firms able to use trading as a loss-leader, may amplify this trend.
Similarly, inventions based on blockchain technology eventually may be the foundation for greatly enhancing transactional security throughout the banking industry, but also eventually may reduce the need for banks as secure deposit-keepers and intermediaries.
We believe that, over the course of the technology-driven evolution of our industry which is well underway, the “winners” will be those institutions which can know their clients and make those clients feel they are known, even when many clients increasingly do not visit banking centers or have face-to-face live interaction.
Two keys to achieving a psychological connection with such clients are (1) data management and analytics, using artificial intelligence processes, which allow an institution to provide a differentiated, personalized experience for the client at the point of interaction, and (2) seamless integration of real-time client contact with a human being through voice, chat, or other means.
A critical factor in successful data analytics, allowing real-time differentiated interaction with clients, is how traditionally uncaptured, unstructured, or siloed data is acquired, managed, and accessed.
Some banks are experimenting with different methods of addressing this business need, and more will follow. In addition, external vendors are developing processes to provide solutions. A basic challenge for all these efforts is how to integrate analysis of extremely disparate forms of
data and utilize that analysis in each client contact in a manner which most clients not only accept, but value.
Developing workable proprietary solutions to the data analytics challenges ahead of competitors requires substantial investment in information technology systems and innovation.
Even with a substantial IT budget, we cannot outspend, or even come close to matching, the largest U.S. banking institutions. Therefore, like most U.S. banks, our strategy must be focused on leveraging products and solutions which are within our means, including those developed by external vendors. Our goal must be to keep pace with industry developments with a focus on improving the client’s differentiated experience with us by recognizing and responding to client needs.
Technological innovation has tended to reduce barriers to entry based on cost. Put another way, once someone finds a new, better method to accomplish a task in our industry, often others are able to replicate or improve on that method, sometimes quite rapidly. Key risks for us, therefore, are whether we will be able: to catch up to breakthroughs quickly enough to avoid client attrition; to adopt and enhance breakthroughs frequently enough, and without significant technical failures, to attract clients from competitors; and, if we are able to truly innovate, to press our advantage quickly before competitors adopt it.
To thrive as our industry is disrupted, we will need to embrace some of the attitudes of a technology company, and shed some of the attitudes of a traditional bank.
This has required, and will continue to require, an evolution in our corporate culture which, in turn, creates implementation risk. In this process it is critical that we not lose sight of how our clients experience working with us and our systems, including those clients who still want traditionally-delivered services, those who seek and embrace the latest innovations, and those who just want services to be convenient, personalized, and understandable.
Just as disruptive business changes driven by new technologies and new client preferences can adversely impact us and our entire industry, similar events can adversely impact our commercial clients.
In time, a major business disruption can cause dominant businesses to fail, and can shrink or even end entire lines of business. An example of this is the business failure of the Blockbuster video distribution chain and most other video distribution stores, and the rise of Netflix and similar services. Many other examples of this kind of process are ongoing today in many industries, including publishing, retail sales, news, and the creation as well as distribution of audio and video entertainment. To the extent disruptions impact our
|
FIRST HORIZON CORPORATION
|
29
|
2020 FORM 10-K ANNUAL REPORT | ||||||
clients, we may experience elevated loan losses and loss of ongoing business which we may not be able to recapture with new clients.
| Operational Risks | ||||||||||||||
Fraud is a major, and increasing, operational risk for us and all banks.
Two traditional areas, deposit fraud (check kiting, wire fraud, etc.) and loan fraud, continue to be major sources of fraud attempts and loss. The methods used to perpetrate and combat fraud continue to evolve as technology changes. In addition to cybersecurity risk (discussed below), new technologies have made it easier for bad actors to obtain and use client personal information, mimic signatures, and otherwise create false documents that look genuine.
Our anti-fraud actions are both preventive (anticipating lines of attack, educating associates and clients, etc.) and responsive (remediating actual attacks). Our regulators require us to report fraud promptly, and regulators often advise banks of new schemes so that the entire industry can adapt as quickly as possible. However, some level of fraud loss is unavoidable, and the risk of a major loss cannot be eliminated.
Our ability to conduct and grow our businesses is dependent in part upon our ability to create, maintain, expand, and evolve an appropriate operational and organizational infrastructure, manage expenses, and recruit and retain personnel with the ability to manage a complex business.
Operational risk can arise in many ways, including: errors related to failed or inadequate physical, operational, information technology, or other processes; faulty or disabled computer or other technology systems; fraud, theft, physical security breaches, electronic data and related security breaches, or other criminal conduct by associates or third parties; and exposure to other external events. Inadequacies may present themselves in myriad ways. Actions taken to manage one risk may be ineffective against others. For example, information technology systems may be insufficiently redundant to withstand a fire, incursion, malware, or other major casualty, and they may be insufficiently adaptable to new business conditions or opportunities. Efforts to make systems more robust may make them less adaptable, and
vice-versa
. Also, our efforts to control expenses, which is a significant priority for us, increases our operational challenges as we strive to maintain client service and compliance at high quality and low cost.
A serious information technology security (cybersecurity) breach can cause significant damage and at the same time be difficult to detect even after it occurs.
Among other things, that damage can occur due to outright theft or extortion of
our funds, fraud or identity theft perpetrated on clients, or adverse publicity associated with a breach and its potential effects. Perpetrators potentially can be associates, clients, and certain vendors, all of whom legitimately have access to some portion of our systems, as well as outsiders with no legitimate access. Because of the potentially very serious consequences associated with these risks, our electronic systems and their upgrades need to address internal and external security concerns to a high degree, and our systems must comply with applicable banking and other regulations pertaining to bank safety and client protection. Although many of our defenses are systemic and highly technical, others are much older and more basic. For example, periodically we train all our associates to recognize red flags associated with fraud, theft, and other electronic crimes, and we educate our clients as well through regular and episodic security-oriented communications. We expect our systems and regulatory requirements to continue to evolve as technology and criminal techniques also continue to evolve.
The operational functions we outsource to third parties may experience similar disruptions that could adversely impact us and over which we may have limited control and, in some cases, limited ability to obtain an alternate vendor quickly.
To the extent we rely on third party vendors to perform or assist operational functions, the challenge of managing the associated risks may become more difficult.
The operational functions of business counterparties may experience disruptions that could adversely impact us and over which we may have limited or no control.
For example, in recent years a number of major U.S. consumer-oriented firms experienced data systems incursions reportedly resulting in the thefts of credit and debit card information, online account information, and other data of millions of clients. These incursions affected cards issued and deposit accounts maintained by many banks, including our Bank. Although our systems are not breached in third-party incursions, these events can increase account fraud and can cause us to reissue a significant number of account cards and take other costly steps to avoid significant theft loss to our Bank and our clients. Our ability to recoup our losses may be limited legally or practically in many situations. Possible points of incursion or disruption not within our control include retailers, utilities, insurers, health care service
|
FIRST HORIZON CORPORATION
|
30
|
2020 FORM 10-K ANNUAL REPORT | ||||||
providers, internet service and electronic mail providers, social media portals, distant-server (“cloud”) service providers, electronic data security providers, telecommunications companies, and smart phone manufacturers.
Failure to build and maintain, or outsource, the necessary operational infrastructure, failure of that infrastructure to perform its functions, or failure of our disaster preparedness plans if primary infrastructure components suffer damage, can lead to risk of loss of service to clients, legal actions, and noncompliance with applicable regulatory standards.
Additional information concerning operational risks and our management of them, all of which is incorporated into this Item 1A by this reference, appears under the caption
Operational Risk Management
beginning on page 91 of our 2020 MD&A (Item 7).
The delivery of financial services to clients and others increasingly depends upon technologies, systems, and multi-party infrastructures which are new, creating or enhancing several risks discussed elsewhere.
Examples of the risks created or enhanced by the widespread and rapid adoption of relatively untested technologies include: security incursions; operational malfunctions or other disruptions; and legal claims of patent or other intellectual property infringement.
Competition for talent is substantial and increasing. Moreover, revenue growth in some
business lines increasingly depends upon top talent
. In recent years the cost to us of hiring and retaining top revenue-producing talent has increased, and that trend is likely to continue. The primary tools we use to attract and retain talent are: salaries; commission, incentive, and retention compensation programs; retirement benefits; change in control severance benefits; health and other welfare benefits; and our corporate culture. To the extent we are unable to use these tools effectively, we face the risk that, over time, our best talent will leave us and we will be unable to replace those persons effectively.
Incentives might operate poorly or have unintended adverse effects
. Incentive programs are difficult to design well, and even if well-designed often they must be updated to address changes in our business. A poorly designed incentive program—where goals are too difficult, too easy, or not well related to desired outcomes—could provide little useful motivation to key associates, could increase turnover, and could impact client retention. Moreover, even where those pitfalls are avoided, incentive programs may create unintended adverse consequences. For example, a program focused entirely on revenue production, without proper controls, may result in costs growing faster than revenues.
| Risk from Economic Downturns and Changes | ||||||||||||||
Generally, in an economic downturn, our realized credit losses increase, demand for our products and services declines, and the credit quality of our loan portfolio declines.
Delinquencies and realized credit losses generally increase during economic downturns due to an increase in liquidity problems for clients and downward pressure on collateral values. Likewise, demand for loans (at a given level of creditworthiness), deposit and other products, and financial services may decline during an economic downturn, and may be adversely affected by other national, regional, or local economic factors that impact demand for loans and other
financial products and services. Such factors include, for example, changes in employment rates, interest rates, real estate prices, or expectations concerning rates or prices. Accordingly, an economic downturn or other adverse economic change (local, regional, national, or global) can hurt our financial performance in the form of higher loan losses, lower loan production levels, lower deposit levels, compression of our net interest margin, and lower fees from transactions and services. Those effects can continue for many years after the downturn technically ends.
| Risks Associated with Monetary Events | ||||||||||||||
The Federal Reserve has implemented significant economic strategies that have impacted interest rates, inflation, asset values, and the shape of the yield curve. These strategies have had, and will continue to have, a significant impact on our business and on many of our clients.
In response to the recession in 2008 and the following uneven recovery, the Federal Reserve implemented a series
of domestic monetary initiatives designed to lower rates and make credit easier to obtain. The Federal Reserve changed course in 2015, raising rates several times through 2018. The last raise in 2018 was accompanied by a substantial and broad stock market decline. In 2019 the Federal Reserve began to lower rates. In 2020, in response to economic disruption associated with the COVID-19 pandemic,
|
FIRST HORIZON CORPORATION
|
31
|
2020 FORM 10-K ANNUAL REPORT | ||||||
the Federal Reserve quickly reduced short-term rates to extremely low levels and acted to influence the markets to reduce long-term rates as well. For 2021, the Federal Reserve has indicated that future actions will depend upon changes in economic data.
Federal Reserve strategies can, and often are intended to, affect the domestic money supply, inflation, interest rates, and the shape of the yield curve.
Effects on the yield curve often are most pronounced at the short end of the curve, which is of particular importance to us and other banks. Among other things, easing strategies are intended to lower interest rates, flatten the yield curve, expand the money supply, and stimulate economic activity, while tightening strategies are intended to increase interest rates, steepen the yield curve, tighten the money supply, and restrain economic activity.
Many external factors may interfere with the effects of these plans or cause them to be changed, sometimes quickly. Such factors include significant economic trends or events as well as significant international monetary policies and events. Such strategies also can affect the U.S. and world-wide financial systems in ways that may be difficult to predict. Risks associated with interest rates and the yield curve are discussed in this Item 1A under the caption
Interest Rate and Yield Curve Risks
beginning on page 40.
We may be adversely affected by economic and political situations outside the U.S.
The U.S. economy, and the businesses of many of our clients, are linked significantly to economic and market conditions outside the U.S., especially in North and
Central America, Europe, and Asia, and increasingly in South America. Although we have little direct exposure to non-US-dollar-denominated assets or non-US sovereign debt, in the future major adverse events outside the U.S. could have a substantial indirect adverse impact upon us. Key potential events which could have such an impact include (i) sovereign debt default (default by one or more governments in their borrowings), (ii) bank and/or corporate debt default, (iii) market and other liquidity disruptions, and, if stresses become especially severe, (iv) the collapse of governments, alliances, or currencies, and (v) military conflicts. The methods by which such events could adversely affect us are highly varied but broadly include the following: an increase in our cost of borrowed funds or, in a worst case, the unavailability of borrowed funds through conventional markets; impacts upon our hedging and other counterparties; impacts upon our clients; impacts upon the U.S. economy, especially in the areas of employment rates, real estate values, interest rates, and inflation/deflation rates; and impacts upon us from our regulatory environment, which can change substantially and unpredictably from possible political response to major financial disruptions.
| Risks Related to Businesses We May Exit | ||||||||||||||
We may be unable to successfully implement a disposition or wind-down of businesses or units which no longer fit our strategic plans.
We could have closures and divestitures as we continue to adapt to a changing business and regulatory environment. Key risks associated with exiting a business include:
•
our ability to price a sale transaction appropriately and otherwise negotiate acceptable terms;
•
our ability to identify and implement key client, personnel, technology systems, and other transition
actions to avoid or minimize negative effects on retained businesses;
•
our ability to mitigate the loss of any pretax income that the exited business produced;
•
our ability to assess and manage any loss of synergies that the exited business had with our retained businesses; and
•
our ability to manage capital, liquidity, and other challenges that may arise if an exit results in significant legacy cash expenditures or financial loss.
| Reputation Risks | ||||||||||||||
Our ability to conduct and grow our businesses, and to obtain and retain clients, is highly dependent upon external perceptions of our business practices and financial stability.
Our reputation is, therefore, a key asset for us. Our reputation is affected principally by our business practices and how those practices are perceived and
understood by others. Adverse perceptions regarding the practices of our competitors, or our industry as a whole, also may adversely impact our reputation. In addition, negative perceptions relating to parties with whom we have important relationships may adversely impact our reputation. Senior management oversees
|
FIRST HORIZON CORPORATION
|
32
|
2020 FORM 10-K ANNUAL REPORT | ||||||
processes for reputation risk monitoring, assessment, and management.
Damage to our reputation could hinder our ability to access the capital markets or otherwise impact our liquidity, could hamper our ability to attract new clients and retain existing ones, could impact the market value of our stock, could create or aggravate regulatory difficulties, and could undermine our ability to attract and retain talented associates, among other things. Adverse impacts on our reputation, or the reputation of our industry, also may result in greater regulatory and/or legislative scrutiny, which may lead to laws or regulations that change or constrain our business or operations. Events that result in damage to our reputation also may increase our litigation risk.
Political and social fragmentation in the U.S., combined with access to social media platforms, can increase reputation risk in ways that might not be easily avoided by traditional means.
The predominant culture within the banking industry remains traditional: in order to preserve their business reputations, banks generally prefer to avoid direct, public involvement in political or social controversy.
Increasingly, though, certain groups—having highly specific political or social agendas and with the ability to communicate their views effectively using social media platforms—have made it more difficult to maintain a traditional approach. One group, for example, may publicly criticize a bank for having, as a client, a business which “exploits” persons of limited financial means, while another group may criticize a bank for failing to have, as a client, the same business which “serves” such persons in neighborhoods that many businesses avoid. As another example, a group may demand that a bank cease doing business with a specific business client based on the client’s industry or a specific business practice because that industry or practice, though legal, is objectionable to that group. While the potential for such demands has always existed, special interest groups today are more able and willing to publicize their criticisms, and some are willing to use factual exaggerations and inflammatory language in stating their views to the public. Those criticisms, in turn, ultimately may be acted upon by legislators or regulators.
| Credit Risks | ||||||||||||||
We face the risk that our clients may not repay their loans and that the realizable value of collateral may be insufficient to avoid a charge-off.
We also face risks that other counterparties, in a wide range of situations, may fail to honor their obligations to pay us. In our business some level of credit charge-offs is unavoidable and overall levels of credit charge-offs can vary substantially over time. In the last pre-COVID credit cycle, net charge-offs were $132 million in 2007, and increased to $573 million and $832 million in 2008 and 2009, respectively. Beginning in 2010, net charge-offs began to decline, reaching $13 million by 2017 and remaining historically very low through 2019. In 2020, however, net charge-offs rose to $120 million, driven strongly by the COVID-induced recession starting in March.
Our ability to manage credit risks depends primarily upon our ability to assess the creditworthiness of loan clients and other counterparties and the value of any collateral, including real estate, among other things. We further manage credit risk by diversifying our loan portfolio, by managing its granularity, by following per-relationship lending limits, and by recording and managing an allowance for loan and lease losses based on the factors mentioned above and in accordance with applicable accounting rules. We further manage other counterparty credit risk in a variety of ways, some of which are discussed in other parts of this Item 1A and all of which have as a primary goal the avoidance of having too much risk concentrated with any single counterparty.
We record loan charge-offs in accordance with accounting and regulatory guidelines and rules. As indicated in this Item 1A under the caption
Accounting & Tax Risks
beginning on page 44, these guidelines and rules could change and cause provision expense or charge-offs to be more volatile, or to be recognized on an accelerated basis, for reasons not always related to the underlying performance of our portfolio. In fact, as mentioned there, starting in 2020, such an accounting change was made and, when the COVID recession occurred starting in March, loan loss recognition was significantly accelerated. Moreover, the SEC or PCAOB could take accounting positions applicable to our holding company that may be inconsistent with those taken by the Federal Reserve or other banking regulators.
A significant challenge for us is to keep the credit and other models and approaches we use to originate and manage loans updated to take into account changes in the competitive environment, in real estate prices and other collateral values, in the economy, and in the regulatory environment, among other things, based on our experience originating loans and servicing loan portfolios. Changes in modeling could have significant impacts upon our reported financial results and condition. In addition, we use those models and approaches to manage our loan portfolios and lending businesses. To the extent our models and approaches are not consistent with underlying real-world conditions, our management decisions could be misguided or otherwise affected with substantial adverse consequences to us.
|
FIRST HORIZON CORPORATION
|
33
|
2020 FORM 10-K ANNUAL REPORT | ||||||
The recent low-interest rate environment has elevated the traditional challenge for lenders and investors to balance taking on higher risk against the desire for higher income or yield.
This challenge applies not only to credit risk in lending activities but also to default and rate risks regarding investments.
When interest rates eventually rise, default risk likely also will rise.
As borrowers’ obligations to pay interest increase, financial weaknesses generally become more evident. Initially this results in lower consumer credit scores and lower commercial loan grading, and later results in higher default rates.
Realized credit losses tend to increase and decrease in a cyclical manner, although the duration and timing of any given credit cycle is impossible to predict accurately.
Through 2019 we and other U.S. banks experienced an extended period of very low credit losses.
The credit cycle was disrupted by COVID-19.
Our expectation for losses in 2020 rose sharply with the COVID-19 pandemic and its recession, though in many cases actual losses have significantly lagged. Although economic impact may subside with the distribution of vaccines in 2021, there is significant risk that loan provisioning and eventual loss could be elevated for some time. In any case, we do not know what the new “normal” loan loss levels will be once the impacts of the pandemic have fully ended, or what long-term impact the pandemic will have on the credit cycle. It is extremely difficult for banks, and for investors, to know when an uptick in credit loss is merely idiosyncratic or instead portends a major credit cycle change.
Regulatory positions issued during the COVID-19 pandemic may mask the true extent of credit deterioration in certain groups of loans
. For borrowers who qualify, loan payment deferrals and other events that normally would trigger default status are not treated as defaults by lenders or the credit bureaus. Temporarily, these positions may obscure credit quality deterioration in those loans.
The composition of our loans inherently increases our sensitivity to certain credit risks.
At December 31, 2020, approximately 57% of total loans and leases consisted of the commercial, financial, and industrial (C&I) portfolio, while approximately 20% consisted of the consumer real estate portfolio.
The largest component of the C&I portfolio at year end was loans to mortgage companies, a component which represented about 16% of the C&I portfolio at that time. The second largest component was loans to finance and insurance companies. As a result, approximately 26% of the C&I portfolio was sensitive to impacts on the financial services industry. As discussed elsewhere in this Item 1A with respect to our company, the financial services industry is more
sensitive to interest rate and yield curve changes, monetary policy, regulatory policy, changes in real estate and other asset values, and changes in general economic conditions, than many other industries. Negative impacts on the industry could dampen new lending in these lines of business and could create credit impacts for the loans in our portfolio.
The consumer real estate portfolio contains a number of concentrations which affect credit risk assessment of the portfolio.
•
Product concentration
. The consumer real estate portfolio consists primarily of consumer installment loans, and much of the remainder consists of home equity lines of credit.
•
Collateral concentration
. This entire category is secured by residential real estate. Approximately 14% of the consumer real estate portfolio consists of loans secured on a second-lien basis.
•
Geographic concentration
. At year end, about 66% of the consumer real estate portfolio related to clients in three states: Florida, Tennessee, and Louisiana.
The consumer real estate category is highly sensitive to economic impacts on consumer clients and on residential real estate values. Job loss or downward job migration, as well as significant life events such as divorce, death, or disability, can significantly impact credit evaluations of the portfolio. Also, regulatory changes, discussed above and elsewhere in this Item 1A, are more likely to affect the consumer category and our accounting estimates of credit loss than other loan types.
Volatility in the oil and gas industry can impact us.
At year-end, approximately 3% of our total loans were directly related to the oil and gas industry. In addition to general credit and other risks mentioned elsewhere in this Item 1A, these businesses and their related assets are sensitive to a number of factors specific to that industry. Key among those is global demand for energy and other products from oil and gas in relation to supply. The shifting balance between demand and supply is expressed most simply in prices. Significant oil-price volatility, such as that experienced in 2020, can and often does impact our overall business in this industry by increasing provisioning and charge-offs, and by reducing demand for loans. Another set of risks specific to that industry relate to environmental concerns, including the risks of increased regulation or other governmental intervention, and the risks of adverse changes in consumption habits or public perceptions generally.
Additional information concerning credit risks and our management of them is set forth under the caption
|
FIRST HORIZON CORPORATION
|
34
|
2020 FORM 10-K ANNUAL REPORT | ||||||
Asset Quality
beginning on page 70 of our 2020 MD&A (Item 7).
| Service Risks | ||||||||||||||
We
provide
a wide range of
services to clients,
and the provision of these services may
create
claims against us that
we
provided them in a manner that harmed the client or a third party, or
was not compliant with applicable laws or rules.
Our services include lending, loan servicing, fiduciary, custodial, depositary, funds management, insurance, and advisory services, among others. We manage these risks primarily through training programs,
compliance programs, and supervision processes. Additional information concerning these risks and our management of them, all of which is incorporated into this Item 1A by this reference, appears under the captions
Operational Risk Management
and
Compliance Risk Management
, beginning on pages 91 and 92, respectively, of our 2020 MD&A (Item 7).
| Risks Related to COVID-19 Pandemic | ||||||||||||||
The COVID-19 pandemic has led to periods of significant volatility in financial, commodities (including oil and gas) and other markets, has adversely affected our ability to conduct normal business, has adversely affected our clients, and is likely to harm our businesses and future results of operations.
In late 2019, a coronavirus (COVID-19) was reported in China, which quickly spread to most countries in the world. Starting in late February 2020, financial market volatility increased dramatically based on concerns that COVID-19, and the steps being undertaken in many countries to mitigate its spread, would significantly disrupt economic activity.
In March 2020, financial market volatility increased further, with several one-day stock market swings that resulted in significant market declines. Additionally, in March: market pricing deteriorated in virtually all sectors and asset classes except U.S. Treasury securities; the World Health Organization declared COVID-19 to be a pandemic; the U.S. President declared the COVID-19 pandemic to be a national emergency, allowing several federal disaster programs to be accessed by states and cities; many states and cities in the U.S. declared health emergencies, lockdowns, travel restrictions, and quarantines, prohibiting gatherings of more than a small number of people and ordering or urging most businesses and workplaces to close or operate on a very restricted basis; the Federal Reserve lowered short-term interest rates and started a “quantitative easing” program intended to lower longer-term interest rates and foster access to credit; the effective yields of 10-year and 30-year U.S. Treasury securities achieved record low rates; and the U.S. Congress enacted relief legislation. Government actions in the U.S. have included loan programs administered by banks and other private-sector lenders, liquidity programs administered by the U.S. Treasury, and
favorable accounting and regulatory treatment (for lenders) of certain loan payment deferrals.
During the summer of 2020, in the U.S. infection and hospitalization rates declined, and government restrictions on businesses and the public eased in many locales. Late in the year, a new strain of the virus was identified, while infection and hospitalization rates increased sharply, prompting many governments to re-impose earlier restrictions going into 2021.
In 2020 and early 2021, the economic effects of these and related actions and events in the U.S. included: large numbers of partial or full business closures; large numbers of people were furloughed or laid off; large increases in unemployment; large numbers of workers worked from home; and large numbers of consumers were unwilling to undertake significant discretionary spending. In addition, worldwide demand for oil fell, resulting in significant drops in oil prices and in the values of oil-related assets.
We are not able to predict the impact of these still-changing circumstances on our businesses in 2021, although we expect the overall impact to be less in 2021 than in 2020. The full extent of impacts resulting from the COVID-19 pandemic and other events beyond our control will depend on uncertain future developments, including new information which may emerge concerning the severity of new COVID strains, the effectiveness of vaccines on existing and new strains, and further actions governments may take to slow the spread of the virus, treat the ill, distribute the vaccines, and assist affected businesses.
In addition, the pandemic has resulted in modest operational disruptions for us. Clients’ physical access to banking centers has been restricted off and on in many markets, and many non-client-facing associates have worked largely on a remote basis. More significant disruptions in the future could
|
FIRST HORIZON CORPORATION
|
35
|
2020 FORM 10-K ANNUAL REPORT | ||||||
adversely impact our businesses, financial condition, and results of operations. Our post-merger integration efforts may be delayed and adversely affected by the pandemic, and could become more costly.
Vaccines offer the hope of substantially ending the economic disruption caused by COVID-19 during 2021; however, the lead times needed for effective distribution to the U.S population, and for effective immunity to develop in those people who are inoculated, mean that economic disruption is likely to continue for a significant period this year.
Vaccines, reportedly with unusually high effectiveness rates, have been developed and approved for the public in the U.S., and, early in 2021, are being distributed by the various states. Distribution in the U.S. is hampered by special equipment needed to transport and store the vaccine material at very cold temperatures. Other vaccines have been developed and are expected to be approved in the U.S. in the first quarter of 2021. The vaccines reportedly are not fully effective for five or six weeks after first being administered. Also, a few political and other prominent leaders at first publicly signaled doubt regarding the safety or efficacy of the vaccines. These and other similar factors make it difficult to predict when economic restrictions will
substantially relax or end, or when a critical percentage of the population no longer will fear the pandemic.
Changes in interest rates due to Federal Reserve actions and market forces, mentioned above, negatively impacted our net interest margin (a measure of the average profit margin applicable to lending).
Interest rates should begin to normalize when economic conditions improve significantly, but the timing and degree of normalization cannot be predicted.
Also, “spreads” (the difference between U.S. Treasury borrowing rates and private sector borrowing rates) widened in 2020. For post-COVID loans, wider spreads should help mitigate net interest margin compression. However, pre-COVID spreads are fixed by the loan contracts based on pre-COVID pricing.
Our clients and vendors have been adversely impacted by governmental and societal responses to COVID-19.
Those impacts on clients reduced noninterest income, created downward loan migration (a reduction in loan-grading), and increased provision for credit losses.
| Regulatory, Legislative, and Legal Risks | ||||||||||||||
The regulatory environment continues to be challenging.
We operate in a heavily regulated industry. Our regulatory burdens, including both operating restrictions and ongoing compliance costs, are substantial.
We are subject to many banking, deposit, insurance, securities brokerage and underwriting, and consumer lending regulations in addition to the rules applicable to all companies publicly traded in the U.S. securities markets and, in particular, on the New York Stock Exchange. Failure to comply with applicable regulations could result in financial, structural, and operational penalties. In addition, efforts to comply with applicable regulations may increase our costs and/or limit our ability to pursue certain business opportunities. See
Supervision and Regulation
in Item 1 of this report, beginning on page 18, for additional information concerning financial industry regulations. Federal and state regulations significantly limit the types of activities in which we, as a financial institution, may engage. In addition, we are subject to a wide array of other regulations that govern other aspects of how we conduct our business, such as in the areas of employment and intellectual property. Federal and state legislative and regulatory authorities increasingly consider changing these regulations or adopting new ones. Such actions could further limit the amount of interest or fees we can charge, could further restrict our ability to collect loans or realize on collateral, could affect the terms or
profitability of the products and services we offer, or could materially affect us in other ways.
The following paragraphs highlight certain specific important risk areas related to regulatory matters currently. These paragraphs do not describe these risks exhaustively, and they do not describe all such risks that we face currently. Moreover, the importance of specific risks will grow or diminish as circumstances change.
We and our Bank both are required to maintain certain regulatory capital levels and ratios.
U.S. capital standards are discussed in Item 1 of this report, in tabular and narrative form, under the caption
Capital Adequacy
starting on page 20. Pressures to maintain appropriate capital levels and address business needs in a changing economy may lead to actions that could be dilutive or otherwise adverse to our shareholders. Such actions could include: reduction or elimination of dividends; the issuance of common or preferred stock, or securities convertible into stock; or the issuance of any class of stock having rights that are adverse to those of the holders of our existing classes of common or preferred stock.
Additional information concerning these risks and our management of them, all of which is incorporated into this Item 1A by this reference, appears: under the captions
Capital Adequacy
and
Prompt Corrective Action (PCA)
in Item 1 of this report beginning on
|
FIRST HORIZON CORPORATION
|
36
|
2020 FORM 10-K ANNUAL REPORT | ||||||
pages 20 and 21, respectively; under the captions
Capital
,
Capital Risk Management and Adequacy
, and
Market Uncertainties and Prospective Trends
beginning on pages 67, 91, and 97, respectively, of our 2020 MD&A (Item); and under the caption
Regulatory Capital
in Note 13—Regulatory Capital and Restrictions, beginning on page 173 of our 2020 Financial Statements (Item 8).
Legal disputes are an unavoidable part of business, and the outcome of pending or threatened litigation cannot be predicted with any certainty.
We face the risk of litigation from clients, associates, vendors, contractual parties, and other persons, either singly or in class actions, and from federal or state regulators. We manage those risks through internal controls, personnel training, insurance, litigation management, our compliance and ethics processes, and other means. However, the commencement, outcome, and magnitude of litigation cannot be predicted or controlled with any certainty.
Typically, we are unable to estimate our loss exposure from legal claims until relatively late in the litigation process, which can make our financial recognition of loss from litigation unpredictable and highly uneven from one period to the next.
For most of our pending legal matters we have established either no accrual (reserve) or no significant reserve. Financial accounting guidance requires that litigation loss be both estimable and probable before a reserve may be established (recorded as a liability on our balance sheet). Under that guidance, reserves typically are not established for most litigation matters until after preliminary motions to dismiss or to narrow the case are resolved, after discovery is substantially in process, and (in many cases) after preliminary overtures regarding settlement have occurred. Potentially significant cases often are pending for years before any loss is recognized and a reserve is established. Moreover, many cases experience relatively little progress toward resolution for a long period followed by a brief period of rapid development. Lastly, although most cases are resolved with little or no loss to us, for the others our loss typically is recognized either all at once (near the time of resolution) or very unevenly over the life of the case.
Additional information concerning litigation risks and our management of them, all of which is incorporated into this Item 1A by this reference, appears: under the caption
Pre-2009 Mortgage Business Risks
beginning on page 44 of this report; under the captions
Repurchase Obligations, Off-Balance Sheet Arrangements, and Other Contractual Obligations
,
Repurchase Accrual Methodology
,
Market Uncertainties and Prospective Trends
, and
Contingent Liabilities
beginning on pages 95, 95, 97, and 101, respectively, of our 2020 MD&A (Item 7); and under the caption
Contingencies
in Note 17—
Contingencies and Other Disclosures, beginning on page 181 of our 2020 Financial Statements (Item 8).
Political dysfunction and volatility within the federal government, both at the regulatory and Congressional level, creates significant potential for major and abrupt shifts in federal policy regarding bank regulation, taxes, and the economy, any of which could have significant impacts on our business and financial performance.
Moreover, political conflict within and among branches of government, and within and among government agencies, can rise to a level where day-to-day functions could be interrupted or impaired.
Data privacy is becoming a major political concern. The laws governing it are new, and are likely to evolve and expand.
Many non-regulated, non-banking companies have gathered large amounts of personal details about millions of people, and have the ability to analyze that data and act on that analysis very quickly. This situation has prompted governmental responses. Two prominent responses are the European Union General Data Protection Regulation and the California Consumer Privacy Act. Neither is a banking industry regulation, but both apply to banks in relation to certain clients. Further general regulation to protect data privacy appears likely, and banking industry regulations might be enlarged as well.
Public expectations concerning corporate controls on emissions of carbon dioxide, methane, and other greenhouse gases could increase our operating costs in the future without a corresponding increase in revenue, could curtail some aspects of our business, or both.
At present, environmental regulations do not require us to monitor the direct or indirect greenhouse gas emissions associated with building, operating, or maintaining our physical facilities, nor are we taxed or fined in relation to those emissions, because such gases generally are not considered to be pollutants under federal law. Changing expectations could pressure us to physically measure, monitor, and curtail direct emissions and to estimate indirect emissions or impacts, and eventually could result in legal requirements to take those actions or to pay for measured or estimated emissions. Whether or not legally required, any such actions that we take would increase our operating costs. In addition, such expectations could pressure us to discontinue business relationships with certain clients, or groups of clients, that have suboptimal reputations for emissions.
Although currently no proposal has been published, future regulations could discourage us from lending to clients in certain industries judged to be environmentally high-risk, even if those elevated risk factors have a long time
|
FIRST HORIZON CORPORATION
|
37
|
2020 FORM 10-K ANNUAL REPORT | ||||||
horizon or are speculative for other reasons
. Changes of that sort could curtail our ability to pursue profitable business opportunities.
| Risks of Expense Control | ||||||||||||||
Our ability to successfully manage expenses is important to our long-term success, but in part is subject to risks beyond our control.
Many factors can influence the amount of our expenses, as well as how quickly they grow. As our businesses change—whether by acquisition, expansion, or contraction—additional expenses can arise from asset purchases, structural reorganization, evolving business strategies, and changing regulations, among other things.
We manage controllable expenses and risk through a variety of means, including selectively outsourcing or multi-sourcing various functions and procurement coordination and processes. In recent years we have actively sought to make strategic businesses more efficient primarily by investing in technology, re-thinking and right-sizing our physical facilities, and re-thinking and right-sizing our workforce and incentive programs. These efforts usually entail additional near-term expenses in the form of technology purchases and implementation, facility closure or renovation costs, and severance costs, while expected benefits typically are realized with some uncertainty in the future.
We have also focused on the economic profit generated by our business activities and prospects
rather than emphasizing revenues or ordinary profit. Economic profit analysis attempts to relate ordinary profit to the capital employed to create that profit with the goal of achieving higher (more efficient) returns on capital employed overall. Activities with higher capital usage bear a greater burden in economic profit analysis. The process is intended to allow us to more efficiently manage investment and utilization of resources. Economic profit analysis involves significant judgment regarding capital allocation. Mistakes in those judgments could result in a misallocation of resources and diminished profitability over the long run.
Despite our efforts, our costs could rise due to adverse structural changes or market shifts. For example, the overall cost of our health insurance benefit is highly dependent upon regulatory factors and market forces beyond our control.
| Geographic Risks | ||||||||||||||
We are subject to risks of operating in various jurisdictions.
To a significant degree our banking business is exposed to economic, regulatory, natural disaster, and other risks that primarily impact the south-eastern and south-central U.S. states where we do most of our traditional banking business. If those regions of the U.S. were to experience adversity not shared by other parts of the country, we are likely to experience adversity to a degree not shared by those competitors which have a broader or different regional footprint. Examples of these kinds of risks include: earthquakes in Memphis; hurricanes in Florida, Louisiana, the Carolina coasts, or the Texas coast; a major change in health insurance laws impacting the many healthcare companies in middle Tennessee; and automotive industry plant closures.
We have international assets, mainly in the form of loans and letters of credit.
Holding non-U.S.
assets creates a number of risks: the risk that taxes, fees, prohibitions, and other barriers and constraints may be created or increased by the U.S. or other countries that would impact our holdings; the risk that currency exchange rates could move unfavorably so as to diminish the U.S. dollar value of assets, or to enlarge the U.S. dollar value of liabilities; and the risk that legal recourse against foreign counterparties may be limited in unexpected ways. Our ability to manage those and other risks depends upon a number of factors, including: our ability to recognize and anticipate differences in legal, cultural, and other expectations applicable to clients, regulators, vendors, and other business partners and counterparties; and our ability to recognize and manage any exchange rate risks to which we are exposed.
|
FIRST HORIZON CORPORATION
|
38
|
2020 FORM 10-K ANNUAL REPORT | ||||||
| Insurance | ||||||||||||||
Our property and casualty insurance may not cover or may be inadequate to cover the risks that we face, and we are or may be adversely affected by a default by insurers.
We use insurance to manage a number of risks, including damage or destruction of property as well as legal and other liability. Not all such risks are insured, in any given insured situation our insurance may be inadequate to cover all loss, and many risks we face are uninsurable. For those risks that are insured, we also face the risks that the insurer may default on its obligations or that the insurer may refuse to honor them. We treat the risk of default as a type of credit risk, which we manage by reviewing the insurers that we use and by striving to use more than one insurer when practical. The risk of refusal, whether due to honest disagreement or bad faith, is inherent in any contractual situation.
A portion of our consumer loan portfolio involves mortgage default insurance. If a default insurer were to experience a significant credit downgrade or were to become insolvent, that could adversely affect the carrying value of loans insured by that company, which could result in an immediate increase in our loan loss provision or write-down of the carrying value of those loans on our balance sheet and, in either case, a corresponding impact on our financial results. If many default insurers were to experience downgrades or insolvency at the same time, the risk of a financial impact would be amplified.
We own certain bank-owned life insurance policies as assets on our books. Some of those policies are
“general account” and others are “separate account.” The general account policies are subject to the risk that the carrier might experience a significant downgrade or become insolvent. The separate account policies are less susceptible to carrier risk, but do carry a higher risk of value fluctuations in securities which underlie those policies. Both risks are managed through periodic reviews of the carriers and the underlying security values. However, particularly for the general account policies, our ability to liquidate a policy in anticipation of an adverse carrier event is significantly limited by applicable insurance contracts and regulations as well as by a substantial tax penalty which could be levied upon early policy termination.
When we self-insure certain exposures, our estimates of future expenditures may be inadequate for the actual expenditures that occur.
For example, we self-insure our associate health-insurance benefit program. We estimate future expenditures and establish accruals (reserves) based on the estimates. If actual expenditures were to exceed our estimates in a future period, our future expenses could be adversely and unexpectedly increased.
| Liquidity and Funding Risks | ||||||||||||||
Liquidity is essential to our business model and a lack of liquidity, or an increase in the cost of liquidity, may materially and adversely affect our businesses, results of operations, financial conditions and cash flows.
In general, the costs of our funding directly impact our costs of doing business and, therefore, can positively or negatively affect our financial results. Our funding requirements in 2020 were met principally by deposits, by financing from other financial institutions, and by funds obtained from the capital markets.
Deposits traditionally have provided our most affordable funds and by far the largest portion of funding. However, deposit trends can shift with economic conditions. If interest rates fall, deposit levels in our Bank might fall, perhaps fairly quickly if a tipping point is reached, as depositors become more comfortable with risk and seek higher returns in other vehicles. This could pressure us to raise our deposit rates, which could shrink our net interest margin if loan rates do not rise correspondingly.
In the past two years deposit rates have fallen, to remarkably low levels. Although stock market values have climbed (broadly speaking), deposit levels also have climbed. While difficult to explain definitively, it is possible that while a sizable portion of available capital holders are comfortable with risk, another sizable portion are highly risk-averse in light of the severe volatility experienced by the stock markets in 2018, 2019, and 2020.
The market among banks for deposits may be impacted by current capital rules. Those rules generally provide favorable treatment for core deposits. Institutions with less than $100 billion of assets are not required to maintain a minimum Liquidity Coverage ratio. At or above $100 billion, the requirement increases with size and certain activities. The largest banks, which must maintain the highest minimum ratio, may be incented to compete for core deposits vigorously. Although mid-sized banks, like ours, are only lightly impacted by this rule, if some large banks in our markets take aggressive actions
|
FIRST HORIZON CORPORATION
|
39
|
2020 FORM 10-K ANNUAL REPORT | ||||||
we could lose deposit share or be compelled to adjust our deposit pricing and practices in ways that could increase our costs.
We also depend upon financing from private institutional or other investors by means of the capital markets. In spring 2020, before we closed the IBKC merger, we issued and sold $150 million of preferred stock, along with a total of $1.3 billion of senior and subordinated notes. Presently we believe we could access the capital markets again if we desired to do so. Risk remains, however, that capital markets may become unavailable to us for reasons beyond our control.
A number of more general factors could make funding more difficult, more expensive, or unavailable on affordable terms, including, but not limited to, our financial results, organizational or political changes, adverse impacts on our reputation, changes in the activities of our business partners, disruptions in the capital markets, specific events that adversely impact the financial services industry, counterparty
availability, changes affecting our loan portfolio or other assets, changes affecting our corporate and regulatory structure, interest rate fluctuations, ratings agency actions, general economic conditions, and the legal, regulatory, accounting, and tax environments governing our funding transactions. In addition, our ability to raise funds is strongly affected by the general state of the U.S. and world economies and financial markets as well as the policies and capabilities of the U.S. government and its agencies, and may remain or become increasingly difficult due to economic and other factors beyond our control. Changes associated with LIBOR also may impact our funding ability; see
Interest Rate and Yield Curve Risks
beginning on page 40.
Events affecting interest rates, markets, and other factors may adversely affect the demand for our products and services in our fixed income business.
As a result, disruptions in those areas may adversely impact our earnings in that business unit.
| Credit Ratings | ||||||||||||||
Our credit ratings directly affect the availability and cost of our unsecured funding.
Our holding company (the Corporation) and our Bank currently receive ratings from several rating agencies for unsecured borrowings. A rating below investment grade typically reduces availability and increases the cost of market-based funding. A debt rating of Baa3 or higher by Moody’s Investors Service, or BBB- or higher by Fitch Ratings, is considered investment grade for many purposes. At December 31, 2020, both rating agencies rated the unsecured senior debt of the Corporation and of the Bank as investment grade. The ratings outlook was stable from Moody’s and from Fitch for both the Corporation and the Bank. To the extent that in the future we depend on institutional borrowing and the capital markets for funding and capital, we could experience reduced liquidity and increased cost of unsecured funding if our debt ratings were lowered further, particularly if lowered below investment grade. In addition, other actions by ratings agencies can create uncertainty about our ratings in the future and thus can adversely affect the cost and availability of funding, including placing us on negative outlook or on watchlist. Please note that a credit rating is not a recommendation to buy, sell, or hold securities, is subject to revision or withdrawal at any time, and should be evaluated independently of any other rating.
Reductions in our credit ratings could result in counterparties reducing or terminating their relationships with us.
Some parties with whom we do business may have internal policies restricting the business that can be done with financial institutions, such as the Bank, that have credit ratings lower than a certain threshold.
Reductions in our credit ratings could allow some counterparties to terminate and immediately force us to settle certain derivatives agreements, and could force us to provide additional collateral with respect to certain derivatives agreements.
Under our margin agreements, we are required to post collateral in the amount of our derivative liability positions with most derivative counterparties. At this time, only one counterparty has a defined trigger and collateral threshold which references the lower of Standard & Poor’s Financial Services LLC or Moody’s ratings. If a credit rating downgrade had occurred as of December 31, 2020, the maximum specified additional collateral we would have been required to post would have been less than $1 million. Contracts with other counterparties do not have defined thresholds and FHN could be asked to post collateral of an undetermined amount based on changes in credit ratings and derivative value.
| Interest Rate and Yield Curve Risks | ||||||||||||||
We are subject to interest rate risk because a significant portion of our business involves
borrowing and lending money, and investing in financial instruments.
A considerable portion of our
|
FIRST HORIZON CORPORATION
|
40
|
2020 FORM 10-K ANNUAL REPORT | ||||||
funding comes from short-term and demand deposits, while a sizeable portion of our lending and investing is in medium-term and long-term instruments. Changes in interest rates directly impact our revenues and expenses, and could expand or compress our net interest margin. We actively manage our balance sheet to control the risks of a reduction in net interest margin brought about by ordinary fluctuations in rates. In addition, our fixed income business tends to perform better when rates decline or markets are volatile, which tends to partially offset net interest margin compression.
A flat or inverted yield curve may reduce our net interest margin and adversely affect our lending and fixed income businesses.
The yield curve is a reflection of interest rates applicable to short and long term debt. The yield curve is steep when short-term rates are much lower than long-term rates; it is flat when short-term rates and long-term rates are nearly the same; and it is inverted when short-term rates exceed long-term rates. Historically, the yield curve is usually upward sloping (higher rates for longer terms). However, the yield curve can be relatively flat or inverted (downward sloping), which has happened several times in the past few years. A flat or inverted yield curve tends to decrease net interest margin, which would adversely impact our lending businesses, and it tends to reduce demand for long-term debt securities, which would adversely impact the revenues of our fixed income business.
We appear to be at the extreme “easing” end of the spectrum in terms of interest rate policy, with no clear timeline when “tightening” might resume; the uncertainties of the magnitude and timing of future rate actions could adversely affect us.
The Federal Reserve eased substantially in 2020 in response to the COVID pandemic. In addition, the Fed has provided other stimulus through open-market purchases of various bond asset classes and the introduction of several liquidity facilities. As a result, rates cannot move much lower without becoming negative. The Federal Reserve seems determined to begin normalizing rates only in response to significant and sustained economic improvement, maximum employment, and inflation consistent with longer-run goals. We cannot predict when those conditions will exist. Meanwhile, we believe that the current low-rate, low-margin environment will continue for some time. See
Risks Associated with Monetary Events
beginning on page 31 of this report for additional information.
Market-indexed deposit products are very sensitive to changes in short-term rates, and our use of them increases our exposure to such changes.
If market rates rise, an increase in those deposit rates may be necessary before we are able to effect similar increases in loan rates.
Expectations by the market regarding the direction of future interest rate movements can impact the demand for fixed income investments which in turn can impact the revenues of our fixed income business.
This risk is most apparent during times when strong expectations have not yet been reflected in market rates, or when expectations are especially weak or uncertain.
The expected discontinuance of LIBOR as a viable benchmark rate may adversely affect our business and our operating results.
In 2017, the Chief Executive of the United Kingdom Financial Conduct Authority, which regulates the London InterBank Offered Rate (LIBOR), announced that it intends to halt persuading or compelling banks to submit rates for the calculation of LIBOR after 2021. In late 2020 the ICE Benchmark Administration (“Administrator” for LIBOR) posted a consultation on definitive end dates for the publication of USD LIBOR in which certain USD LIBOR tenors may continue to be published in some form after 2021. The consultation feedback and response from the Administrator as well as domestic and foreign regulators is pending. As a result, it is unclear if any LIBOR tenors will continue to be published after 2021.
At this time, it is uncertain as to which reference rate or rates may become accepted alternatives to LIBOR. The uncertainty poses both idiosyncratic and system wide risk. The Alternative Reference Rates Committee (“ARRC”) is a group of private-market participants convened by the Federal Reserve Board and the New York Fed to help ensure a successful transition from USD LIBOR to a more robust reference rate. The ARRC has recommended the Secured Overnight Financing Rate (“SOFR”) as its preferred alternative. SOFR is published by the Federal Reserve Bank of New York but is not directly comparable to LIBOR and cannot easily or simply be substituted for it in outstanding instruments. Key differences between the two are: SOFR is based on secured lending, LIBOR is not; and SOFR historically has been published only as an overnight rate, while LIBOR is published in many short-term forward looking maturity tenors.
Since SOFR is based on secured lending, it is generally considered a “risk-free rate” whereas LIBOR includes an implicit credit spread. There is no clear solution or market-accepted practice to fully address this first difference of SOFR from LIBOR.
In response to the second difference, the Federal Reserve Bank of New York has begun to publish compounded average SOFR rates covering prior 30-, 90-, and 180-day periods. It remains unclear how the market will use this data.
Another potential alternative, the American Interbank Offered Rate (“AMBERIBOR”) Index which is
|
FIRST HORIZON CORPORATION
|
41
|
2020 FORM 10-K ANNUAL REPORT | ||||||
produced by the American Financial Exchange, has gained some market acceptance, but it has been limited. It remains unclear if AMERIBOR will become widely accepted in future. Other new indices, spread adjustments, and methodologies are in development by various providers.
SOFR may become the primary reference rate replacement for certain financial products such as derivatives and adjustable rate mortgages. However, there is no clear market leader in other products. Further, it is impossible to predict the effect on the value of LIBOR-based securities and variable rate loans of adopting SOFR or another alternative.
As a lender, an owner of securities, or a contractual counterparty, our primary exposures to LIBOR are in variable-rate loans and in hedging transactions.
We are not able to determine the impact on us that LIBOR discontinuance will have. The simplicity and long history of using LIBOR, the lack of a definite alternative, and the possibility that different alternatives ultimately may be used in different circumstances, means that LIBOR continues to be used in many new instruments.
A few instruments issued by us, including certain series of preferred stock and certain trust preferred obligations, have floating rate terms based on LIBOR, or have fixed rates that later will convert to floating rate terms based on LIBOR.
As mentioned above, it is not known how long LIBOR will continue in a workable form. We have risk that an adverse outcome of the LIBOR transition after the
expected discontinuation could increase our interest, dividend, and other costs relative to those instruments. We may not be able to refinance those instruments on terms that reduce those costs to the level we would have expected if LIBOR were to continue indefinitely, unchanged. Further, some of these contracts are governed under New York State law where pending legislation would directly impact how the post-LIBOR rate is set. Additional legislative actions, both existing and those that may come in the future, at the Federal and state level may impact these and other facilities in an undetermined manner.
The transition from LIBOR may impact our ability to use hedge accounting, which could impact us as a lender, a securities owner, a counterparty, or an issuer.
However, accounting and tax agencies have issued preliminary guidance that may ease the transition. In late 2020, the International Swap Dealers Association (“ISDA”) published the LIBOR Fallbacks Protocol as a proposed standardized methodology for LIBOR transition for derivatives contracts. The central clearing counterparties (“CCPs”) for derivatives, however, are currently considering an alternative methodology for LIBOR transition for cleared derivatives contracts which differs from the ISDA protocol in various respects. While the final outcome of this matter is uncertain at this time, the alternative methodology being considered by the CCPs, if finalized, may result in operational and accounting implications for our LIBOR transition process for derivatives contracts.
| Asset Inventories and Market Risks | ||||||||||||||
The trading securities inventories and loans held for sale in our fixed income business are subject to market and credit risks.
In the course of that business we hold trading securities inventory and loan positions for purposes of distribution to clients, and we are exposed to certain market risks attributable principally to credit risk and interest rate risk associated with those assets. We manage the risks of holding inventories of securities and loans through certain market risk management policies and procedures, including, for example, hedging activities and Value-at-Risk (“VaR”) limits, trading policies, modeling, and stress analyses. Average fixed income trading securities (long positions) were $1.4 billion for 2020, $1.4 billion for 2019, and $1.6 billion for 2018. Average fixed income trading liabilities (short positions) were $457 million, $503 million, and $683 million for 2020, 2019, and 2018, respectively. Average loans held for sale in our fixed income business were $554 million, $485 million, and $563 million for 2020, 2019, and 2018. Additional information concerning these risks and our
management of them, all of which is incorporated into this Item 1A by this reference, appears under the caption
Market Risk Management
beginning on page 88 of our 2020 MD&A (Item 7).
Declines, disruptions, or precipitous changes in markets or market prices can adversely affect our fees and other income sources.
We earn fees and other income related to our brokerage business and our management of assets for clients. Declines, disruptions, or precipitous changes in markets or market prices can adversely affect those revenue sources.
Significant changes to the securities market’s performance can have a material impact upon our assets, liabilities, and financial results.
We have a number of assets and obligations that are linked, directly or indirectly, to major securities markets. Significant changes in market performance can have a material impact upon our assets, liabilities, and financial results.
|
FIRST HORIZON CORPORATION
|
42
|
2020 FORM 10-K ANNUAL REPORT | ||||||
An example of that linkage is our obligation to fund our pension plan so that it may satisfy benefit claims in the future. Our pension funding obligations generally depend upon actuarial estimates of benefits claims, the discount rate used to estimate the present values of those claims, and estimates of plan asset values. Our obligations to fund the plan can be affected by changes in any of those three factors. Accordingly, our obligations diminish if the plan’s investments perform better than expectations or if estimates are changed anticipating better performance, and can grow if those investments perform poorly or if expectations worsen. A rise in interest rates is likely to negatively impact the values of fixed income assets held in the plan, but would also result in an increase in the discount rate used to measure the present value of future benefit payments. Similarly, our obligations can be impacted by changes in mortality tables or other actuarial inputs. We manage the risk of rate changes by investing plan assets in fixed income securities having maturities aligned with the expected timing of payouts. Because there are no new participants, the actuarial-input risk should slowly diminish over time.
Changes in our funding obligation generally translate into positive or negative changes in our pension expense over time, which in turn affects our financial performance. Our obligations and expenses relative to the plan can be affected by many other things, including changes in our participating associate
population and changes to the plan itself. Although we have taken actions intended to moderate future volatility in this area, risk of some level of volatility is unavoidable.
Our hedging activities may be ineffective, may not adequately hedge our risks, and are subject to credit risk.
In the normal course of our businesses we attempt to create partial or full economic hedges of various, though not all, financial risks. For example: our fixed income unit manages interest rate risk on a portion of its trading portfolio with short positions, futures, and options contracts; we hedge the risk of interest rate movements related to the gap between the time we originate mortgage loans and the time we sell them; and we use derivatives, including swaps, swaptions, caps, forward contracts, options, and collars, that are designed to moderate the impact on earnings as interest rates change. Generally, in the last example these hedged items include certain term borrowings and certain held-to-maturity loans.
Hedging creates certain risks for us, including the risk that the other party to the hedge transaction will fail to perform (counterparty risk, which is a type of credit risk), and the risk that the hedge will not fully protect us from loss as intended (hedge failure risk). Unexpected counterparty failure or hedge failure could have a significant adverse effect on our liquidity and earnings.
| Mortgage Business Risks | ||||||||||||||
We have contractual risks from our mortgage business.
Our traditional mortgage business primarily consists of helping clients obtain home mortgages which we sell, rather than hold, or which qualify for a government-guarantee program. The mortgage terms conform to the requirements of the mortgage buyers or government agencies, and we make representations to those buyers or agencies concerning conformity of each mortgage at origination. Although the buyers and agencies generally take the risk that a mortgage defaults, we retain the risk that our representations were materially incorrect. In such a case, the buyer or agency generally has the power to force us to take the loan back for its face value, or to make the buyer or agency whole for loss.
Some government mortgage programs could impose penalties on us for misrepresentations at the time of obtaining benefits under the program.
Penalties can be severe, up to three times the agency’s loss. As a result, mortgage origination processes need to emphasize being thorough and correct, in compliance with all agency standards. Those processes tend to slow the mortgage lending
process for clients, and increase the complexity of the paperwork.
The mortgage servicing business creates regulatory risks.
Servicing requires continual interaction with consumer clients. Federal, state, and sometimes local laws regulate when and how we interact with consumer clients. The requirements can be complex and difficult for us to administer, especially if a client is having difficulty with the mortgage loan. Failure to follow the applicable rules can result in significant penalties or other loss for us.
The mortgage servicing business creates financial reporting valuation risks.
Our contractual right to service a loan generally is viewed as an asset for financial reporting purposes. Servicing rights are initially recognized at fair value, which affects the gains recognized upon sale of the related loans. Thereafter, servicing rights are amortized and reviewed for impairment. The valuations of servicing rights are dependent upon a number of inputs and assumptions that require management judgment. If our servicing rights become large in relation to our overall size, especially in volatile times, the impact of
|
FIRST HORIZON CORPORATION
|
43
|
2020 FORM 10-K ANNUAL REPORT | ||||||
valuation changes can be significant and difficult to predict.
| Pre-2009 Mortgage Business Risks | ||||||||||||||
We have risks from the mortgage-related businesses we exited in 2008, including mortgage loan repurchase and loss-reimbursement risk, claims of improper foreclosure practices, and claims of non-compliance with contractual and regulatory requirements.
In 2008 we exited our national mortgage and related lending businesses. We retain the risk of liability to clients and contractual parties with whom we dealt in the course of operating those businesses.
Additional information concerning risks related to our former mortgage businesses and our management of
them, all of which is incorporated into this Item 1A by this reference, is set forth: under the captions
Repurchase Obligations, Off-Balance Sheet Arrangements, and Other Contractual Obligations
beginning on page 95, and
Contingent Liabilities
beginning on page 101 of our 2020 MD&A (Item 7); and under the captions
Exposures from pre-2009 Mortgage Business
and
Mortgage Loan Repurchase and Foreclosure Liability
, both beginning on page 182 within Note 17—Contingencies and Other Disclosures, of our 2020 Financial Statements (Item 8).
| Accounting & Tax Risks | ||||||||||||||
The preparation of our consolidated financial statements in conformity with U.S. generally accepted accounting principles requires management to make significant estimates that affect the financial statements.
The estimate that is consistently one of our most critical is the level of the allowance for credit losses.
However, other estimates can be highly significant at discrete times or during periods of varying length, for example the valuation (or impairment) of our deferred tax assets. Estimates are made at specific points in time. As actual events unfold, estimates are adjusted accordingly. Due to the inherent nature of these estimates, it is possible that, at some time in the future, we may significantly increase the allowance for credit losses and/or sustain credit losses that are significantly higher than the provided allowance, or we may recognize a significant provision for impairment of assets, or we may make some other adjustment that will differ materially from the estimates that we make today. Moreover, in some cases, especially concerning litigation and other contingency matters where critical information is inadequate, often we are unable to make estimates until fairly late in a lengthy process.
A significant merger or acquisition requires us to make many estimates, including the fair values of acquired assets and liabilities.
With larger transactions, fair value and other estimations can take up to four quarters to finalize. These estimates, and their revisions, can have a substantial effect on the presentation of our financial condition and operating results after the transaction closes. In addition, the excess of the value “paid” by us in the merger or acquisition over the fair value of the assets acquired, net of liabilities assumed, is recorded as goodwill. Goodwill is subject to periodic impairment
assessment, a process that can result in impairment expense which may be significant and sudden.
Changes in accounting rules can significantly affect how we record and report assets, liabilities, revenues, expenses, and earnings.
Although such changes generally affect all companies in a given industry, in practice changes sometimes have a disparate impact due to differences in the circumstances or business operations of companies within the same industry.
One such accounting change, ASU 2016-13, “Measurement of Credit Losses on Financial Instruments,” substantially revised the measurement and recognition of credit losses for certain assets, including most loans, in a manner that has substantially changed when and how we recognize loan loss. ASU 2016-13 was effective for us on January 1, 2020.
Under ASU 2016-13, when we make or acquire a new loan, we are required to recognize immediately the “current expected credit loss,” or “CECL,” of that loan. We will also re-evaluate CECL each quarter that the loan is outstanding. CECL is the difference between our cost and the net amount we expect to collect over the life of the loan using certain estimation methods that incorporate macroeconomic forecasts and our experience with other, similar loans. In contrast, the pre-2020 accounting standard delayed recognition until loss was “probable” (very likely). We adopted ASU 2016-13 and CECL accounting starting in 2020, with the impact on regulatory capital having a phase-in period. Starting in 2020, recognition of estimated credit loss was significantly accelerated compared to pre-CECL practice, which was aggravated by the actual and projected effects of the pandemic. Additional information concerning ASU 2016-13 and its effects upon us appears in Note 1—Summary of
|
FIRST HORIZON CORPORATION
|
44
|
2020 FORM 10-K ANNUAL REPORT | ||||||
Significant Accounting Policies within our 2020 Financial Statements (Item 8), under the heading
Summary of Accounting Changes
beginning on page 135, and in Item 1 under the caption
CECL Accounting and COVID-19
beginning on page 12, all of which information is incorporated into this Item 1A by reference.
In comparison with former (pre-2020) standards, CECL accounting likely will continue to: result in a significant increase in our provision for credit losses (expense) and allowance (reserve) during any period of loan growth, including organic growth and growth created by acquisition or merger; through the increased provision, adversely impact our earnings and, correspondingly, our regulatory capital levels; and enhance volatility in loan loss provision and allowance levels from quarter to quarter and year to year, especially during times when the economy is in transition or experiencing significant volatility.
Moreover, once fully phased in, CECL creates an incentive for banks to reduce new lending in the “down” part of the economic cycle in order to reduce loss recognition and conserve regulatory capital. That perverse incentive could,
nationwide, prolong a down cycle in the economy and delay a recovery.
Changes in regulatory rules can create significant accounting impacts for us.
Because we operate in a regulated industry, we prepare regulatory financial reports based on regulatory accounting standards. Changes in those standards can have significant impacts upon us in terms of regulatory compliance. In addition, such changes can impact our ordinary financial reporting, and uncertainties related to regulatory changes can create uncertainties in our financial reporting.
Our controls and procedures may fail or be circumvented.
Internal controls, disclosure controls and procedures, and corporate governance policies and procedures (“controls and procedures”) must be effective in order to provide assurance that financial reports are materially accurate. A failure or circumvention of our controls and procedures or failure to comply with regulations related to controls and procedures could have a material adverse effect on our business, financial condition and results of operations.
| Stock-Holding and Governance Risks | ||||||||||||||
The principal source of cash flow to pay dividends on our stock, as well as service our debt, is dividends and distributions from the Bank, and the Bank may become unable to pay dividends to us without regulatory approval.
First Horizon Corporation primarily depends upon common dividends from the Bank for cash to fund dividends we pay to our common and preferred stockholders, and to service our outstanding debt. Regulatory constraints might constrain or prevent the Bank from declaring and paying dividends to us in 2021 without regulatory approval. Applying the applicable regulatory rules, at January 1, 2021, the Bank could legally declare cash dividends on the Bank's common or preferred stock of approximately $897 million without obtaining regulatory approval.
Also, we are required to provide financial support to the Bank. Accordingly, at any given time a portion of our funds may need to be used for that purpose and therefore would be unavailable for dividends.
Furthermore, the Federal Reserve has issued policy statements generally requiring insured banks and bank holding companies only to pay dividends out of current operating earnings. The Federal Reserve has released a supervisory letter advising bank holding companies, among other things, that as a general matter a bank holding company should inform the Federal Reserve and should eliminate, defer or significantly reduce its dividends if (i) the bank holding
company’s net income available to shareholders for the past four quarters, net of dividends previously paid during that period, is not sufficient to fully fund the dividends; (ii) the bank holding company’s prospective rate of earnings is not consistent with the bank holding company’s capital needs and overall current and prospective financial condition; or (iii) the bank holding company will not meet, or is in danger of not meeting, its minimum regulatory capital adequacy ratios.
Our stockholders may suffer dilution if we raise
capital through
public or private
equity financings to fund our operations, to increase our capital, or to expand.
If we raise funds by issuing equity securities or instruments that are convertible into equity securities, the percentage ownership of our current common stockholders will be reduced, the new equity securities may have rights and preferences superior to those of our common or outstanding preferred stock, and additional issuances could be at a sales price which is dilutive to current stockholders. We may also issue equity securities directly as consideration for acquisitions we may make that would be dilutive to stockholders in terms of voting power and share-of-ownership, and could be dilutive financially or economically.
The IBKC merger, for example, resulted in a significant increase in our outstanding shares.
We issued to former IBKC shareholders common
|
FIRST HORIZON CORPORATION
|
45
|
2020 FORM 10-K ANNUAL REPORT | ||||||
shares representing about 44% of our post-closing outstanding shares.
Our issuance of preferred stock raises regulatory capital without issuing common shares, but creates or expands our general obligation to pay all preferred dividends ahead of any common dividends.
Currently we have six series of preferred stock outstanding, one issued by the Bank and five by First Horizon Corporation. Subject to capital needs and market conditions, additional series may be issued in the future.
Provisions of Tennessee law, and certain provisions of our charter and bylaws, could make it more difficult for a third party to acquire control of us or could have the effect of discouraging a third party from attempting to acquire control of us
. These provisions could make it more difficult for a third party to acquire us even if an acquisition might be at a price attractive to many of our stockholders. In addition, federal banking laws prohibit non-financial-industry companies from owning a bank, and require regulatory approval of any change in control of a bank.
Certain legal rights of holders of our common stock and of depositary shares related to Series B, C, and D of our preferred stock to pursue claims against us or the depositary, as applicable, are limited by our bylaws and by the terms of the deposit agreements.
Our bylaws provide that, unless we consent in writing to an alternative forum, a state or federal court located within Shelby County in the State of Tennessee will be the sole and exclusive forum for (i) any derivative action or proceeding brought in our right or name, (ii) any action asserting a claim of breach of a fiduciary duty owed by any director, officer or other associate of ours to us or our shareholders, (iii) any action asserting a claim against
us or any director, officer or other associate of ours arising pursuant to any provision of the Tennessee Business Corporation Act, of our charter or bylaws or (iv) any action asserting a claim against us or any director, officer or other associate of ours that is governed by the internal affairs doctrine. In addition, each deposit agreement between us and the depositary, which govern the rights of the depositary shares related to our Series B, C, and D preferred stock, provide that any action or proceeding arising out of or relating in any way to the deposit agreement may only be brought in a state court located in the State of New York or in the United States District Court for the Southern District of New York.
The foregoing exclusive forum clauses may have the effect of discouraging lawsuits against us or our directors, officers or other associates, or against the depositary, as applicable. Exclusive forum clauses may also lead to increased costs to bring a claim, or may limit the ability of holders of our common stock or depositary shares to bring a claim in a judicial forum they find favorable.
In addition, the exclusive forum clauses in our bylaws and deposit agreement could apply to actions or proceedings that may arise under the federal securities laws, depending on the nature of the claim alleged. To the extent these exclusive forum clauses restrict the courts in which holders of our common stock or depositary shares may bring claims arising under the federal securities laws, there is uncertainty as to whether a court would enforce such provisions. These exclusive forum provisions do not mean that holders of our common stock or depositary shares have waived our obligations to comply with the federal securities laws and the rules and regulations thereunder.
|
ITEM 1B. UNRESOLVED STAFF COMMENTS
|
||||||||
Not applicable.
|
ITEM 2. PROPERTIES
|
||||||||
We own or lease no single physical property that we consider to be materially important to our financial condition or results from operations.
Our banking centers, our fixed income and capital markets offices, our title services offices, our wealth
management offices, and our other physical offices, in the aggregate, remain important to our ability to deliver financial services to a large portion of our clients. For many years, banking center usage by clients has slowly declined, and for many years we have slowly consolidated banking center locations in
|
FIRST HORIZON CORPORATION
|
46
|
2020 FORM 10-K ANNUAL REPORT | ||||||
response to changing utilization patterns. We expect that long-term trend to continue. Information concerning our business locations, including banking center and other client-facing facilities, at year-end 2020 is provided in Item 1 of this report under the caption
Physical Business Locations
beginning on page 9, which information is incorporated into this Item 2 by this reference.
In addition to the banking centers and other offices mentioned in Item 1, we own or lease other offices and office buildings, such as our headquarters
building at 165 Madison Avenue in downtown Memphis, Tennessee. Although some of these other offices contain banking centers or other client-facing offices, primarily they are used for operational and administrative functions. Our operational and administrative offices are located in several cities where we have banking centers.
At December 31, 2020, we believe our physical properties are suitable and adequate for the businesses we conduct.
|
ITEM 3. LEGAL PROCEEDINGS
|
||||||||
The
Contingencies
section from Note 17-Contingencies and Other Disclosures, appearing on pages 181-183 of this report within our 2020 Financial Statements (Item 8), is incorporated herein by reference.
|
ITEM 4. MINE SAFETY DISCLOSURES
|
||||||||
Not applicable.
|
FIRST HORIZON CORPORATION
|
47
|
2020 FORM 10-K ANNUAL REPORT | ||||||
|
SUPPLEMENTAL PART I INFORMATION
|
||||||||
| Executive Officers of the Registrant | ||||||||||||||
The following is a list of our executive officers, as defined by Securities and Exchange Commission rules, along with certain supplemental information, all presented as of February 20, 2021. The executive officers generally are elected at the April meeting of our Board of Directors (following the annual meeting of shareholders) for a term of one year and until their successors are elected and qualified.
| Name & Age | Current (Year First Elected to Office) and Recent Offices & Positions | ||||
|
Terry L. Akins
Age: 57
|
Senior Executive Vice President—Chief Risk Officer of First Horizon & the Bank (2020)
Following the closing of the merger of equals between First Horizon and IBKC, Ms. Akins assumed the role of Senior Executive Vice President—Chief Risk Officer of First Horizon and the Bank. Prior to the merger, she had several roles with IBERIABANK Corporation and IBERIABANK starting in 2002, the most recent of which was Senior Executive Vice President and Chief Risk Officer (2017-2020).
|
||||
|
Elizabeth A. Ardoin
Age: 51
|
Senior Executive Vice President—Chief Communications Officer of First Horizon & the Bank (2020)
Following the closing of the merger of equals between First Horizon and IBKC, Ms. Ardoin assumed the role of Senior Executive Vice President—Chief Communications Officer of First Horizon and the Bank. Prior to the merger, she had several roles with IBERIABANK Corporation and IBERIABANK starting in 2002, the most recent of which was Senior Executive Vice President and Director of Communications (2002-2020), which included marketing, public relations, human resources, and corporate real estate, and she served as chief of staff to the CEO.
|
||||
|
Michael J. Brown
Age: 57
|
President—Regional Banking of First Horizon & the Bank (2020)
Following the closing of the merger of equals between First Horizon and IBKC, Mr. Brown assumed the role of President—Regional Banking of First Horizon and the Bank. Prior to the merger, he had several roles with IBERIABANK Corporation and IBERIABANK starting in 2001, the most recent of which was Vice Chairman and Chief Operating Officer (2010-2020). In that role he was responsible for
management of banking markets, treasury management, and wealth management.
|
||||
|
Daryl G. Byrd
Age: 66
|
Executive Chairman of the Board of First Horizon & the Bank (2020)
Following the closing of the merger of equals between First Horizon and IBKC, Mr. Byrd assumed the role of Executive Chairman of the Board of First Horizon and the Bank. Prior to the merger, he served as President (1999-2020) and Chief Executive Officer (2000-2020) of IBERIABANK Corporation and IBERIABANK.
|
||||
|
Jeff L. Fleming
Age: 59
Principal Accounting Officer
|
Executive Vice President—Chief Accounting Officer and Corporate Controller of First Horizon & the Bank (2012)
Mr. Fleming assumed the role of Executive Vice President—Chief Accounting Officer and Corporate Controller in 2012. Previously, starting in 1984, he held several positions with us, most recently (before his current role) Executive Vice President—Corporate Controller (2010-2011).
|
||||
|
D. Bryan Jordan
Age: 59
Principal Executive Officer
|
President and Chief Executive Officer (2008) of First Horizon & the Bank
Mr. Jordan became President and Chief Executive Officer in 2008. He was Chairman of the Board from 2012 until we closed the merger of equals between First Horizon and IBKC in 2020. From 2007 until 2008 Mr. Jordan was Executive Vice President and Chief Financial Officer of FHN and the Bank. From 2000 until 2002 Mr. Jordan was Comptroller, and from 2002 until 2007 Mr. Jordan was Chief Financial Officer, of Regions Financial Corp. During that time he was also an Executive Vice President and a Senior Executive Vice President of Regions.
|
||||
|
Tammy S. LoCascio
Age: 52
|
Senior Executive Vice President—Chief Human Resources Officer of First Horizon & the Bank (2020)
Following the closing of the merger of equals between First Horizon and IBKC, Ms. LoCascio assumed the role of Senior Executive Vice President—Chief Human Resources Officer of First Horizon and the Bank. Prior to the merger, starting in 2011, she served in several roles with the Bank, most recently (before her current role) Executive Vice President—Consumer Banking (2017-2020). In that role she led the retail, private client/wealth management, mortgage, and small business units.
|
||||
|
FIRST HORIZON CORPORATION
|
48
|
2020 FORM 10-K ANNUAL REPORT | ||||||
|
William C. Losch III
Age: 50
Principal Financial Officer
|
Senior Executive Vice President—Chief Financial Officer of First Horizon & the Bank (2009)
Mr. Losch assumed the role of Executive Vice President—Chief Financial Officer of First Horizon & the Bank in 2009, with “Senior” added to his title in 2020. From 1997 to 2009, Mr. Losch was with Wachovia Corporation and its predecessors. Most recently he served as Senior Vice President and Chief Financial Officer of Wachovia’s General Bank unit (2006-2009).
|
||||
|
David T. Popwell
Age: 61
|
President—Specialty Banking of First Horizon & the Bank (2020)
Following the closing of the merger of equals between First Horizon and IBKC, Mr. Popwell assumed the role of President—Specialty Banking of First Horizon and the Bank. Prior to the merger, starting in 2007, he served in several roles, the most recent of which (before his current role) was President—Regional Banking (2013-2020). From 2004 to 2007 Mr. Popwell was President of SunTrust Bank—Memphis, and prior to that was an Executive Vice President of National Commerce Financial Corp.
|
||||
|
Anthony J. Restel
Age: 51
|
Senior Executive Vice President—Chief Operating Officer of First Horizon & the Bank (2020)
Following the closing of the merger of equals between First Horizon and IBKC, Mr. Restel assumed the role of Senior Executive Vice President—Chief Operating Officer of First Horizon and the Bank. Prior to the merger, he had several roles with IBERIABANK Corporation and IBERIABANK starting in 2001, the most recent of which was Vice Chairman and Chief Financial Officer (2005-2020). During his tenure as Chief Financial Officer, Mr. Restel also served as Chief Credit Officer of IBERIABANK (2007-2009).
|
||||
|
Susan L. Springfield
Age: 56
|
Senior Executive Vice President—Chief Credit Officer of First Horizon & the Bank (2013)
Ms. Springfield assumed the role of Executive Vice President—Chief Credit Officer of First Horizon & the Bank in 2013, with “Senior” added to her title in 2020. Previously, starting in 1998, she served the Bank in several roles, the most recent of which (before her current role) was Executive Vice President—Commercial Banking (2011-2013)
|
||||
| Selected Other Corporate Officers | ||||||||||||||
Clyde A. Billings, Jr.
Senior Vice President, Assistant General
Counsel, and Corporate Secretary
Dane P. Smith
Senior Vice President
Corporate Treasurer
|
FIRST HORIZON CORPORATION
|
49
|
2020 FORM 10-K ANNUAL REPORT | ||||||
| PART II | ||||||||||||||
|
ITEM 5. MARKET FOR THE REGISTRANT’S COMMON EQUITY, RELATED STOCKHOLDER MATTERS, AND ISSUER PURCHASES OF EQUITY SECURITIES
|
||||||||
| Market for Our Common Stock; Common Shareholders | ||||||||||||||
Our sole class of common stock, $0.625 par value, is listed and trades on the New York Stock Exchange LLC under the symbol FHN. As of December 31,
2020, there were approximately 9,987 shareholders of record of our common stock.
| Sales of Unregistered Common and Preferred Stock | ||||||||||||||
Common Stock.
Not applicable.
Preferred Stock.
Not applicable.
| Repurchases by Us of Our Common Stock | ||||||||||||||
Under authorizations from our Board of Directors, we may repurchase shares from time to time for general purposes and for our stock option and other compensation plans, subject to market conditions, accumulation of excess equity, prudent capital management, and legal and regulatory restrictions. We evaluate the level of capital and take action designed to generate or use capital as appropriate for the interests of the shareholders.
Additional information concerning repurchase activity during the final three months of 2020 is presented in Tables 15a and 15b, and the surrounding notes and other text under the caption
Common Stock Purchase Programs
beginning on page 69 of our 2020 MD&A (Item 7), which information is incorporated herein by this reference.
| Total Shareholder Return Performance Graph | ||||||||||||||
The following “Total Shareholder Return 2015-2020” performance graph, which includes the Investment Returns tabular information, is “furnished” and not “filed” as part of this report, and is not deemed to be soliciting material. Notwithstanding anything to the contrary set forth in this report or in any of our previous filings under the Securities Act of 1933, as amended, or the Securities Exchange Act of 1934, as amended, that might incorporate future filings by reference, including this report in whole or in part, the following “Total Shareholder Return 2015-2020” performance graph shall not be incorporated by reference into any such filings.
The following graph compares the yearly percentage change in our cumulative total shareholder return with
returns based on the Standards and Poor’s 500 and Keefe, Bruyette & Woods (KBW) Nasdaq and Regional Bank Indices. The graph assumes $100 is invested on December 31, 2015 and dividends are reinvested. Returns are market-capitalization weighted.
At year-end 2019 and earlier, First Horizon was included in the KBW Regional Bank Index. At year-end 2020, First Horizon is included in the KBW Nasdaq Bank Index. The change in index resulted from the merger of equals in 2020 between First Horizon and IBERIABANK Corporation.
|
FIRST HORIZON CORPORATION
|
50
|
2020 FORM 10-K ANNUAL REPORT | ||||||
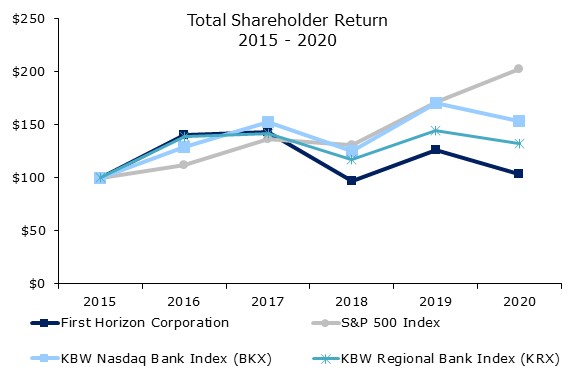
| Investment Returns | 2015 | 2016 | 2017 | 2018 | 2019 | 2020 | ||||||||||||||
|
First Horizon Corporation
|
$100.00
|
$ 140.37
|
$ 143.10
|
$ 96.82
|
$ 126.29
|
$ 103.34
|
||||||||||||||
|
S&P 500 Index
|
$100.00
|
$ 111.95
|
$ 136.38
|
$ 130.39
|
$ 171.44
|
$ 202.96
|
||||||||||||||
|
KBW Nasdaq Bank Index (BKX)
|
$100.00
|
$ 128.51
|
$ 152.41
|
$ 125.42
|
$ 170.72
|
$ 153.12
|
||||||||||||||
|
KBW Regional Bank Index (KRX)
|
$100.00
|
$ 139.12
|
$ 141.63
|
$ 116.86
|
$ 144.76
|
$ 132.18
|
||||||||||||||
Source: Bloomberg
|
ITEM 6.
|
||||||||
[reserved]
|
FIRST HORIZON CORPORATION
|
51
|
2020 FORM 10-K ANNUAL REPORT | ||||||
|
ITEM 7. MANAGEMENT’S DISCUSSION AND ANALYSIS OF FINANCIAL
CONDITION AND RESULTS OF OPERATIONS
|
||||||||
INTRODUCTION
FHN is a financial holding company headquartered in Memphis, Tennessee. FHN provides diversified financial services primarily through its principal subsidiary, First Horizon Bank. First Horizon Bank's principal divisions and subsidiaries operate under the brands of First Horizon Bank, IBERIABANK, First Horizon Advisors, and FHN Financial. FHN offers regional banking, mortgage lending, title insurance, specialized commercial lending, commercial leasing and equipment financing, brokerage, wealth management and capital market services through the First Horizon family of companies. FHN Financial, which operates partly through a division of First Horizon Bank and partly through subsidiaries, is an industry leader in fixed income sales, trading, and strategies for institutional clients in the U.S. and abroad. First Horizon Bank has over 490 banking offices in 12 states and FHN Financial has 29 offices in 18 states across the U.S. In addition, FHN has 29 title services offices in three states and 15 stand-alone mortgage lending offices in seven states.
The following discussion and analysis is intended to assist readers in understanding the consolidated financial condition and results of operations of FHN. It should be read in conjunction with the Consolidated Financial Statements and accompanying Notes to the Consolidated Financial Statements in Part II, Item 8 of this Form 10-K, as well as with the other information contained in this report.
EXECUTIVE OVERVIEW
Recent Events
Merger and Branch Purchase
On July 1, 2020, FHN and IBKC closed their merger of equals transaction. Under the merger agreement, each share of IBKC common stock was converted into 4.584 shares of FHN common stock. FHN issued 243 million shares of FHN common stock and three new series of preferred stock in a transaction valued at $2.5 billion. At the time of closing, IBKC operated 319 offices in 12 states, mostly in the southern U.S. In connection with this transaction, FHN recorded
preliminary purchase price allocations and recognized a purchase accounting gain of $533 million.
On July 17, 2020, First Horizon Bank completed its purchase of 30 branches from Truist Bank. As part of the transaction, FHN assumed $2.2 billion of branch deposits for a 3.40% deposit premium and purchased $423 million of branch loans. The acquired branches are in communities in North Carolina (20 branches), Virginia (8 branches), and Georgia (2 branches).
In relation to these transactions, FHN's operating results include the operating results of the acquired assets and assumed liabilities subsequent to the respective transaction dates. Refer to Note 2 - Acquisitions and Divestitures for additional information.
COVID-19 Pandemic
The COVID-19 pandemic has caused and continues to cause significant, unprecedented disruption to the national economy as well as the local economies within FHN's footprint. FHN continues to closely monitor the pandemic and its effects on clients and the financial markets in which FHN conducts business. The impact of the pandemic on 2020 results is discussed throughout the Results of Operations section of this MD&A. Further detail on FHN's response to the pandemic is discussed in the Market Uncertainties and Prospective Trends section included in this MD&A.
Adoption of CECL
Effective January 1, 2020, FHN adopted ASU 2016-13, "Measurement of Credit Losses on Financial Instruments," (CECL) which resulted in a $107 million increase to the ALLL and a $24 million increase to the reserve for unfunded lending commitments, resulting in a $96 million decrease in retained earnings (net of taxes). See Note 1– Significant Accounting Policies for additional information.
|
FIRST HORIZON CORPORATION
|
52
|
2020 FORM 10-K ANNUAL REPORT | ||||||
Other Recent Transactions
In April 2020, First Horizon Bank issued $450 million of 5.75% Subordinated Notes due May 1, 2030. Interest payments are due semi-annually on May 1 and November 1, commencing November 1, 2020. The sale of the notes resulted in net proceeds to FHN of approximately $447 million. The notes qualify as Tier 2 capital for the Bank as well as FHN, up to certain regulatory limits for minority capital instruments.
In May 2020, FHN issued $450 million of 3.55% Senior Notes due May 26, 2023 and $350 million of 4.00% Senior Notes due May 26, 2025. Interest payments are due semi-annually on May 26 and November 26, commencing November 26, 2020. The sale of these notes resulted in net proceeds to FHN of approximately $795 million.
In May 2020, FHN issued 1,500 shares having an aggregate liquidation preference of $150 million of Series E Non-Cumulative Perpetual Preferred Stock for net proceeds of approximately $144 million. Dividends on the Series E Preferred Stock, if declared, accrue and are payable quarterly, in arrears, at a rate of 6.50% per annum. For the issuance, FHN issued depositary shares, each of which represents a fractional ownership interest in a share of FHN’s preferred stock. The Series E Preferred Stock qualifies as Tier 1 Capital for FHN.
2020 Financial Performance Summary
FHN reported net income available to common shareholders of $822 million, or $1.89 per diluted share, compared to net income of $435 million, or $1.38 per diluted share in 2019 driven by the impact of the July 1, 2020 IBKC merger. FHN's results of operations for 2020 produced a return on average assets of 1.33% and a return on average common equity of 13.66% compared to 1.08% and 9.60% for 2019.
Total revenue of $3.2 billion increased $1.3 billion from 2019. Net interest income was $1.7 billion, an increase of $452 million compared to the prior year.
The increase in net interest income was driven by an increase in average interest-earning assets as a result of the IBKC merger and Truist branch acquisition. Results also reflect the benefit of deposit pricing discipline and PPP lending, which helped to partially offset the impact of lower interest rates. Noninterest income of $1.5 billion increased $838 million compared to 2019 driven by the impact of the IBKC merger, which included a $533 million preliminary purchase accounting gain. Results also reflect increases in fixed income and
mortgage banking and title income that helped to partially offset a reduction in traditional banking fees.
Noninterest expense totaled $1.7 billion, a 39% increase from 2019, largely as a result of the IBKC merger. Results also reflect an increase in charitable contributions, partially offset by lower restructuring and rebranding expenses.
Provision for credit losses of $503 million increased from $45 million in 2019 driven by the adoption of CECL and the deterioration in the overall macro-economic outlook tied to the COVID-19 pandemic. Results also reflect the impact of the IBKC merger and Truist branch acquisition, including provision related to acquired non-PCD loans.
Total assets at December 31, 2020 were $84.2 billion, an increase of $40.9 billion compared to December 31, 2019. The IBKC merger and the Truist branch acquisition contributed $36.0 billion in total assets, including $26.3 billion in loans and leases. Refer to Note 2 - Acquisitions and Divestitures for additional details related to the opening balances from these transactions.
Total deposits at December 31, 2020 of $70.0 billion increased $37.6 billion from 2019 driven by the IBKC merger and Truist branch acquisition which contributed $30.4 billion in total deposits.
FHN maintained strong capital measures. The Tier 1 risk-based capital and total risk-based capital ratios at December 31, 2020 were 10.74% and 12.57%, respectively, compared to 10.15% and 11.22% at December 31, 2019, respectively. The CET1 ratio was 9.68% at December 31, 2020 compared to 9.20% in the prior year.
|
FIRST HORIZON CORPORATION
|
53
|
2020 FORM 10-K ANNUAL REPORT | ||||||
Table 1 - Key Performance Indicators
| For the years ended December 31, | |||||||||||||||||
| (Dollars in millions, except per share data) | 2020 | 2019 | 2018 | ||||||||||||||
| Pre-Provision Net Revenue (a) | $ | 1,436 | $ | 631 | $ | 722 | |||||||||||
| Diluted earnings per common share | $ | 1.89 | $ | 1.38 | $ | 1.65 | |||||||||||
| Return on average assets (b) | 1.33 | % | 1.08 | % | 1.38 | % | |||||||||||
| Return on average common equity (c) | 13.66 | % | 9.60 | % | 12.75 | % | |||||||||||
| Return on average tangible common equity (a) (d) | 19.03 | % | 14.71 | % | 20.28 | % | |||||||||||
| Net interest margin (e) | 2.86 | % | 3.28 | % | 3.45 | % | |||||||||||
| Fee income to total revenue (f) | 47.41 | % | 35.08 | % | 29.48 | % | |||||||||||
| Efficiency ratio (g) | 54.37 | % | 66.15 | % | 70.54 | % | |||||||||||
| Allowance for loan and lease losses to total loans and leases | 1.65 | % | 0.64 | % | 0.66 | % | |||||||||||
| Net charge-offs to average loans and leases | 0.26 | % | 0.09 | % | 0.06 | % | |||||||||||
| Total period-end equity to period-end assets | 9.86 | % | 11.72 | % | 11.72 | % | |||||||||||
| Tangible common equity to tangible assets (a) | 6.89 | % | 7.48 | % | 7.15 | % | |||||||||||
| Cash dividends declared per common share | $ | 0.60 | $ | 0.56 | $ | 0.48 | |||||||||||
| Book value per common share | $ | 13.59 | $ | 15.04 | $ | 13.79 | |||||||||||
| Tangible book value per common share (a) | $ | 10.23 | $ | 10.02 | $ | 8.81 | |||||||||||
| Common equity Tier 1 | 9.68 | % | 9.20 | % | 9.77 | % | |||||||||||
| Market capitalization | $ | 7,082.2 | $ | 5,157.9 | $ | 4,192.4 | |||||||||||
(a)
Represents a non-GAAP measure which is reconciled in the non-GAAP to GAAP reconciliation in Table 28.
(b)
Calculated using net income divided by average assets.
(c)
Calculated using net income available to common shareholders divided by average common equity.
(d)
Calculated using net income available to common shareholders divided by average tangible common equity.
(e)
Net interest margin is computed using total net interest income adjusted to an FTE basis assuming a statutory federal income tax rate of 21% and, where applicable, state income taxes.
(f)
Ratio is fee income excluding securities gains (losses) to total revenue excluding securities gains (losses).
(g)
Ratio is noninterest expense to total revenue excluding securities gains (losses).
RESULTS OF OPERATIONS — 2020 compared to 2019
Net Interest Income
Net interest income is FHN's largest source of revenue and is the difference between the interest earned on interest-earning assets (generally loans, leases and investment securities) and the interest expense incurred in connection with interest-bearing liabilities (generally deposits and borrowed funds). The level of net interest income is primarily a function of the difference between the effective yield on average interest-earning assets and the effective cost of interest-bearing liabilities. These factors are influenced by the pricing and mix of interest-earning assets and interest-bearing liabilities which, in turn, are impacted by external factors such as local economic conditions, competition for loans and deposits, the monetary policy of the FRB and market interest rates.
Net interest income of $1.7 billion in 2020 increased 37% from 2019 driven by the impact of the IBKC
merger and Truist Branch acquisition which helped to more than offset the impact of the challenging interest rate environment.
FHN's net interest margin decreased 42 basis points from 2019 to 2.86% in 2020, while the net interest spread decreased 22 basis points to 2.68% over the same period. Net interest margin and net interest spread were unfavorably impacted by a 113 basis point decrease in earning asset yields as the impact of lower short-term interest rates was partially offset by the benefit of purchase accounting accretion and PPP lending. A lower yield on earning assets was partially offset by a 91 basis point decrease in the cost of interest-bearing liabilities driven by disciplined deposit pricing.
The activity levels and related funding for FHN’s fixed income activities affect the net interest margin. Generally, fixed income activities compress the margin, especially where there are elevated levels of trading inventory, because of the strategy to reduce market risk by economically hedging a portion of its inventory on the balance sheet.
|
FIRST HORIZON CORPORATION
|
54
|
2020 FORM 10-K ANNUAL REPORT | ||||||
The following table presents the major components of net interest income and net interest margin:
Table 2 —Average Balances, Net Interest Income and Yields/Rates
| (Dollars in millions) | 2020 | 2019 | 2018 | |||||||||||||||||||||||||||||||||||||||||||||||||||||
| Assets: | Average Balance | Interest Income/Expense | Yield/Rate | Average Balance | Interest Income/Expense | Yield/Rate | Average Balance | Interest Income/Expense | Yield/Rate | |||||||||||||||||||||||||||||||||||||||||||||||
| Earning assets: | ||||||||||||||||||||||||||||||||||||||||||||||||||||||||
| Loans and leases: | ||||||||||||||||||||||||||||||||||||||||||||||||||||||||
| Commercial loans and leases | $ | 36,146 | $ | 1,324 | 3.66 | % | $ | 22,385 | $ | 1,091 | 4.87 | % | $ | 20,079 | $ | 973 | 4.84 | % | ||||||||||||||||||||||||||||||||||||||
| Consumer loans | 10,037 | 407 | 4.05 | 6,804 | 311 | 4.57 | 7,135 | 322 | 4.51 | |||||||||||||||||||||||||||||||||||||||||||||||
| Total loans and leases | 46,183 | 1,731 | 3.75 | 29,189 | 1,402 | 4.80 | 27,214 | 1,295 | 4.76 | |||||||||||||||||||||||||||||||||||||||||||||||
| Loans held for sale | 835 | 30 | 3.60 | 578 | 31 | 5.39 | 724 | 45 | 6.23 | |||||||||||||||||||||||||||||||||||||||||||||||
| Investment securities | 6,464 | 106 | 1.64 | 4,510 | 121 | 2.69 | 4,728 | 130 | 2.77 | |||||||||||||||||||||||||||||||||||||||||||||||
| Trading securities | 1,433 | 35 | 2.44 | 1,415 | 47 | 3.33 | 1,604 | 59 | 3.70 | |||||||||||||||||||||||||||||||||||||||||||||||
| Other earning assets: | ||||||||||||||||||||||||||||||||||||||||||||||||||||||||
| Federal funds sold | 42 | — | 0.21 | 48 | 1 | 2.63 | 38 | 1 | 2.47 | |||||||||||||||||||||||||||||||||||||||||||||||
| Securities purchased under agreements to resell | 505 | 2 | 0.45 | 555 | 11 | 1.96 | 745 | 12 | 1.63 | |||||||||||||||||||||||||||||||||||||||||||||||
| Interest-bearing deposits with banks | 3,006 | 5 | 0.14 | 871 | 20 | 2.18 | 624 | 13 | 1.89 | |||||||||||||||||||||||||||||||||||||||||||||||
| Total other earning assets | 3,553 | 7 | 0.19 | 1,474 | 32 | 2.11 | 1,407 | 26 | 1.77 | |||||||||||||||||||||||||||||||||||||||||||||||
| Total earning assets / Total interest income | $ | 58,468 | $ | 1,909 | 3.26 | % | $ | 37,166 | $ | 1,633 | 4.39 | % | $ | 35,677 | $ | 1,555 | 4.36 | % | ||||||||||||||||||||||||||||||||||||||
| Non-earning assets: | ||||||||||||||||||||||||||||||||||||||||||||||||||||||||
| Cash and due from banks | 852 | 602 | 585 | |||||||||||||||||||||||||||||||||||||||||||||||||||||
| Goodwill and other intangible assets, net | 1,696 | 1,575 | 1,570 | |||||||||||||||||||||||||||||||||||||||||||||||||||||
| Premises and equipment, net | 604 | 467 | 522 | |||||||||||||||||||||||||||||||||||||||||||||||||||||
| Allowance for loan and lease losses | (700) | (191) | (188) | |||||||||||||||||||||||||||||||||||||||||||||||||||||
| Other assets | 3,426 | 2,125 | 2,059 | |||||||||||||||||||||||||||||||||||||||||||||||||||||
| Total assets | $ | 64,346 | $ | 41,744 | $ | 40,225 | ||||||||||||||||||||||||||||||||||||||||||||||||||
| Liabilities and Shareholders' Equity: | ||||||||||||||||||||||||||||||||||||||||||||||||||||||||
| Interest-bearing liabilities: | ||||||||||||||||||||||||||||||||||||||||||||||||||||||||
| Interest-bearing deposits: | ||||||||||||||||||||||||||||||||||||||||||||||||||||||||
| Savings | $ | 19,780 | $ | 82 | 0.41 | % | $ | 11,663 | $ | 144 | 1.24 | % | $ | 11,289 | $ | 108 | 0.95 | % | ||||||||||||||||||||||||||||||||||||||
| Other interest-bearing deposits | 11,973 | 31 | 0.26 | 8,345 | 79 | 0.94 | 7,932 | 56 | 0.70 | |||||||||||||||||||||||||||||||||||||||||||||||
| Time deposits | 4,347 | 39 | 0.90 | 4,262 | 84 | 1.97 | 3,682 | 53 | 1.44 | |||||||||||||||||||||||||||||||||||||||||||||||
| Total interest-bearing deposits | 36,100 | 152 | 0.42 | 24,270 | 307 | 1.27 | 22,903 | 217 | 0.95 | |||||||||||||||||||||||||||||||||||||||||||||||
| Federal funds purchased | 862 | 3 | 0.34 | 738 | 15 | 2.08 | 405 | 8 | 1.89 | |||||||||||||||||||||||||||||||||||||||||||||||
| Securities sold under agreements to repurchase | 1,109 | 5 | 0.46 | 701 | 13 | 1.89 | 714 | 10 | 1.40 | |||||||||||||||||||||||||||||||||||||||||||||||
| Trading liabilities | 457 | 6 | 1.24 | 503 | 13 | 2.48 | 683 | 19 | 2.83 | |||||||||||||||||||||||||||||||||||||||||||||||
| Other short-term borrowings | 626 | 6 | 0.92 | 538 | 13 | 2.34 | 1,046 | 19 | 1.82 | |||||||||||||||||||||||||||||||||||||||||||||||
| Term borrowings | 1,578 | 64 | 4.02 | 1,117 | 53 | 4.77 | 1,212 | 53 | 4.38 | |||||||||||||||||||||||||||||||||||||||||||||||
| Total interest-bearing liabilities / Total interest expense | $ | 40,732 | $ | 236 | 0.58 | % | $ | 27,867 | $ | 414 | 1.49 | % | $ | 26,963 | $ | 326 | 1.21 | % | ||||||||||||||||||||||||||||||||||||||
| Noninterest-bearing liabilities: | ||||||||||||||||||||||||||||||||||||||||||||||||||||||||
| Noninterest-bearing deposits | 15,779 | 8,133 | 8,001 | |||||||||||||||||||||||||||||||||||||||||||||||||||||
| Other liabilities | 1,226 | 824 | 644 | |||||||||||||||||||||||||||||||||||||||||||||||||||||
| Total liabilities | 57,737 | 36,824 | 35,608 | |||||||||||||||||||||||||||||||||||||||||||||||||||||
|
FIRST HORIZON CORPORATION
|
55
|
2020 FORM 10-K ANNUAL REPORT | ||||||
| Shareholders' equity | 6,314 | 4,625 | 4,322 | |||||||||||||||||||||||||||||||||||||||||||||||||||||
| Noncontrolling interest | 295 | 295 | 295 | |||||||||||||||||||||||||||||||||||||||||||||||||||||
| Total shareholders' equity | 6,609 | 4,920 | 4,617 | |||||||||||||||||||||||||||||||||||||||||||||||||||||
| Total liabilities and shareholders' equity | $ | 64,346 | $ | 41,744 | $ | 40,225 | ||||||||||||||||||||||||||||||||||||||||||||||||||
| Net earnings assets / Net interest income (TE) / Net interest spread | $ | 17,736 | $ | 1,673 | 2.68 | % | $ | 9,299 | $ | 1,219 | 2.90 | % | $ | 8,714 | $ | 1,229 | 3.15 | % | ||||||||||||||||||||||||||||||||||||||
| Taxable equivalent adjustment | (11) | 0.18 | (9) | 0.38 | (9) | 0.30 | ||||||||||||||||||||||||||||||||||||||||||||||||||
| Net interest income / Net interest margin (a) | $ | 1,662 | 2.86 | % | $ | 1,210 | 3.28 | % | $ | 1,220 | 3.45 | % | ||||||||||||||||||||||||||||||||||||||||||||
(a) Calculated using total net interest income adjusted for FTE assuming a statutory federal income tax rate of 21%, and where applicable, state income taxes.
|
FIRST HORIZON CORPORATION
|
56
|
2020 FORM 10-K ANNUAL REPORT | ||||||
The following table presents the change in interest income and interest expense due to changes in both average volume and average rate.
Table 3 - Analysis of Changes in Net Interest Income
| 2020 Compared to 2019 | 2019 Compared to 2018 | |||||||||||||||||||||||||||||||||||||
|
Increase (Decrease) Due to
(a)
|
Increase (Decrease) Due to
(a)
|
|||||||||||||||||||||||||||||||||||||
| (Dollars in millions) |
Rate
(b)
|
Volume
(b)
|
Total |
Rate
(b)
|
Volume
(b)
|
Total | ||||||||||||||||||||||||||||||||
| Interest income: | ||||||||||||||||||||||||||||||||||||||
| Loans and leases | $ | (361) | $ | 689 | $ | 328 | $ | 13 | $ | 95 | $ | 108 | ||||||||||||||||||||||||||
| Loans held for sale | (12) | 11 | (1) | (6) | (8) | (14) | ||||||||||||||||||||||||||||||||
| Investment securities | (58) | 42 | (16) | (4) | (6) | (10) | ||||||||||||||||||||||||||||||||
| Trading securities | (12) | — | (12) | (5) | (7) | (12) | ||||||||||||||||||||||||||||||||
| Other earning assets: | ||||||||||||||||||||||||||||||||||||||
| Federal funds sold | (1) | — | (1) | — | — | — | ||||||||||||||||||||||||||||||||
| Securities purchased under agreements to resell | (8) | (1) | (9) | 2 | (3) | (1) | ||||||||||||||||||||||||||||||||
| Interest-bearing deposits with banks | (30) | 15 | (15) | 2 | 5 | 7 | ||||||||||||||||||||||||||||||||
| Total other earning assets | (39) | 14 | (25) | 4 | 2 | 6 | ||||||||||||||||||||||||||||||||
| Total change in interest income - earning assets | $ | (482) | $ | 756 | $ | 274 | $ | 2 | $ | 76 | $ | 78 | ||||||||||||||||||||||||||
| Interest expense: | ||||||||||||||||||||||||||||||||||||||
| Interest-bearing deposits: | ||||||||||||||||||||||||||||||||||||||
| Savings | $ | (129) | $ | 66 | $ | (63) | $ | 33 | $ | 4 | $ | 37 | ||||||||||||||||||||||||||
| Time deposits | (47) | 2 | (45) | 21 | 9 | 30 | ||||||||||||||||||||||||||||||||
| Other interest-bearing deposits | (72) | 25 | (47) | 20 | 3 | 23 | ||||||||||||||||||||||||||||||||
| Total interest-bearing deposits | (248) | 93 | (155) | 74 | 16 | 90 | ||||||||||||||||||||||||||||||||
| Federal funds purchased | (14) | 2 | (12) | 1 | 7 | 8 | ||||||||||||||||||||||||||||||||
| Securities sold under agreements to repurchase | (13) | 5 | (8) | 3 | — | 3 | ||||||||||||||||||||||||||||||||
| Trading liabilities | (6) | (1) | (7) | (2) | (5) | (7) | ||||||||||||||||||||||||||||||||
| Other short-term borrowings | (9) | 2 | (7) | 5 | (11) | (6) | ||||||||||||||||||||||||||||||||
| Term borrowings | (9) | 20 | 11 | 4 | (4) | — | ||||||||||||||||||||||||||||||||
| Total change in interest expense - interest-bearing liabilities | (299) | 121 | $ | (178) | 85 | 3 | $ | 88 | ||||||||||||||||||||||||||||||
| Net interest income | $ | (183) | $ | 635 | $ | 452 | $ | (83) | $ | 73 | $ | (10) | ||||||||||||||||||||||||||
(a) The changes in interest due to both rate and volume have been allocated to change due to rate and change due to volume in proportion to the absolute and amounts of the changes in each.
(b) Variances are computed on a line-by-line basis and are non-additive.
|
FIRST HORIZON CORPORATION
|
57
|
2020 FORM 10-K ANNUAL REPORT | ||||||
Provision for Credit Losses
Provision for credit losses includes the provision for loan and lease losses and the provision for unfunded lending commitments. The provision for credit losses is the expense necessary to maintain the ALLL and the accrual for unfunded lending commitments at levels appropriate to absorb management’s estimate of credit losses expected over the life of the loan and lease portfolio and the portfolio of unfunded loan commitments.
Provision for credit losses increased to $503 million in 2020, compared to $45 million in 2019 driven by the
adoption of CECL and the impact of the COVID-19 pandemic. Results also reflect the impact of the IBKC merger and Truist branch acquisition including $147 million related to non-PCD loans. For additional information about general asset quality trends refer to the Asset Quality section in this MD&A.
Noninterest Income
The following table reflects noninterest income for the past three years:
Table 4—Noninterest Income
| 2020 vs. 2019 | 2019 vs. 2018 | |||||||||||||||||||||||||||||||||||||||||||
| (Dollars in millions) | 2020 | 2019 | 2018 | $ Change | % Change | $ Change | % Change | |||||||||||||||||||||||||||||||||||||
| Noninterest income: | ||||||||||||||||||||||||||||||||||||||||||||
| Fixed income | $ | 423 | $ | 279 | $ | 168 | $ | 144 | 52 | % | $ | 111 | 66 | % | ||||||||||||||||||||||||||||||
| Deposit transactions and cash management | 148 | 132 | 133 | 16 | 12 | % | (1) | (1) | % | |||||||||||||||||||||||||||||||||||
| Mortgage banking and title income | 129 | 10 | 11 | 119 | NM | (1) | (9) | % | ||||||||||||||||||||||||||||||||||||
| Brokerage, management fees and commissions | 66 | 55 | 55 | 11 | 20 | % | — | — | % | |||||||||||||||||||||||||||||||||||
| Trust services and investment management | 39 | 30 | 30 | 9 | 30 | % | — | — | % | |||||||||||||||||||||||||||||||||||
| Bankcard income | 37 | 28 | 29 | 9 | 32 | % | (1) | (3) | % | |||||||||||||||||||||||||||||||||||
| Securities gains (losses), net | (6) | — | 213 | (6) | NM | (213) | NM | |||||||||||||||||||||||||||||||||||||
| Purchase accounting gain | 533 | — | — | 533 | NM | — | NM | |||||||||||||||||||||||||||||||||||||
| Other income | 123 | 120 | 84 | 3 | 3 | % | 36 | 43 | % | |||||||||||||||||||||||||||||||||||
| Total noninterest income | $ | 1,492 | $ | 654 | $ | 723 | $ | 838 | 128 | % | $ | (69) | (10) | % | ||||||||||||||||||||||||||||||
NM – Not meaningful
Noninterest income totaled $1.5 billion in 2020, $654 million in 2019, and $723 million in 2018, or 47%, 35%, and 37% of total revenue, respectively. The increase in noninterest income in 2020 was
driven by the impact of the IBKC merger and included a preliminary purchase accounting gain of $533 million. Results also reflected the benefit of
strong fixed income revenue during the year and higher mortgage banking and title income from the addition of IBKC.
The major component of fixed income revenue is generated from the purchase and sale of fixed income securities as both principal and agent. Other
noninterest revenues within this line item consist principally of fees from derivative sales, portfolio advisory services and loan sales. Securities inventory positions are procured for distribution to clients by the sales staff. Fixed income increased 52%, or $144 million, to $423 million in 2020. Fixed income product revenue increased 63%, or $143 million, largely driven by favorable market conditions including market volatility and increased depository liquidity, while revenue from other products increased 2%, or $1 million in 2020, largely driven by higher fees from derivative sales and portfolio advisory services, somewhat offset by lower fees from loan sales.
|
FIRST HORIZON CORPORATION
|
58
|
2020 FORM 10-K ANNUAL REPORT | ||||||
Table 5—Fixed Income
| % Change | ||||||||||||||||||||||||||||||||
| (Dollars in millions) | 2020 | 2019 | 2018 | 2020 vs. 2019 | 2019 vs. 2018 | |||||||||||||||||||||||||||
| Noninterest income: | ||||||||||||||||||||||||||||||||
| Fixed income | $ | 371 | $ | 228 | $ | 132 | 63 | % | 73 | % | ||||||||||||||||||||||
| Other product revenue | 52 | 51 | 36 | 2 | % | 42 | % | |||||||||||||||||||||||||
| Total fixed income noninterest income | $ | 423 | $ | 279 | $ | 168 | 52 | % | 66 | % | ||||||||||||||||||||||
Fees from deposit transactions and cash management activities of $148 million in 2020 increased $16 million, or 12%, from 2019. The increase was primarily driven by the impact of the IBKC merger and Truist branch acquisition which partially offset pandemic-related impacts including lower transaction volume and fee waivers.
Mortgage banking and title income of $129 million in 2020 increased from $10 million in 2019 driven by the impact of the IBKC merger
and higher activity due to the low interest rate environment.
Brokerage, management fees and commissions of $66 million increased from $55 million in 2019 driven by the impact of the IBKC merger and an increase in annuity income and advisory fees. Brokerage, management fees and commissions include fees for portfolio management, trade commissions, and annuity and mutual funds sales.
Trust services and investment management income of $39 million increased $9 million from 2019, driven by the IBKC merger.
Bankcard income of $37 million in 2020 increased $9 million from 2019, driven by the impact of the IBKC merger.
Noninterest Expense
The following table reflects noninterest expense for the past three years:
Table 6—Noninterest Expense
| 2020 vs. 2019 | 2019 vs. 2018 | |||||||||||||||||||||||||||||||||||||||||||
| (Dollars in millions) | 2020 | 2019 | 2018 |
$
Change |
% Change | $ Change | % Change | |||||||||||||||||||||||||||||||||||||
| Noninterest expense: | ||||||||||||||||||||||||||||||||||||||||||||
| Personnel expense | $ | 1,033 | $ | 695 | $ | 658 | $ | 338 | 49 | % | $ | 37 | 6 | % | ||||||||||||||||||||||||||||||
| Net occupancy expense | 116 | 80 | 85 | 36 | 45 | % | (5) | (6) | % | |||||||||||||||||||||||||||||||||||
| Computer software | 85 | 61 | 61 | 24 | 39 | % | — | — | % | |||||||||||||||||||||||||||||||||||
| Legal and professional fees | 84 | 72 | 57 | 12 | 17 | % | 15 | 26 | % | |||||||||||||||||||||||||||||||||||
| Operations services | 56 | 46 | 56 | 10 | 22 | % | (10) | (18) | % | |||||||||||||||||||||||||||||||||||
| Contributions | 41 | 11 | 1 | 30 | NM | 10 | NM | |||||||||||||||||||||||||||||||||||||
| Equipment expense | 42 | 34 | 39 | 8 | 24 | % | (5) | (13) | % | |||||||||||||||||||||||||||||||||||
| Amortization of intangible assets | 40 | 25 | 26 | 15 | 60 | % | (1) | (4) | % | |||||||||||||||||||||||||||||||||||
| Communications and delivery | 31 | 25 | 30 | 6 | 24 | % | (5) | (17) | % | |||||||||||||||||||||||||||||||||||
| Advertising and public relations | 18 | 34 | 25 | (16) | (47) | % | 9 | 36 | % | |||||||||||||||||||||||||||||||||||
| Other expense | 172 | 150 | 183 | 22 | 15 | % | (33) | (18) | % | |||||||||||||||||||||||||||||||||||
| Total noninterest expense | $ | 1,718 | $ | 1,233 | $ | 1,221 | $ | 485 | 39 | % | $ | 12 | 1 | % | ||||||||||||||||||||||||||||||
NM - Not meaningful
Total noninterest expense of $1.7 billion increased $485 million driven by the impact of the IBKC merger
and Truist branch acquisition mitigated in part by a reduction in noninterest expense as a result of both
|
FIRST HORIZON CORPORATION
|
59
|
2020 FORM 10-K ANNUAL REPORT | ||||||
the COVID-19 shutdown and expense discipline, including the benefit of merger cost saves
.
Personnel expense of $1.0 billion increased $338 million from 2019 driven by the impact of
the IBKC merger and Truist branch acquisition. Results also reflect an increase tied to
higher revenue-based compensation due to increased revenues in fixed income and mortgage banking, a one-time bonus to certain employees, and COVID-related vacation carryover accrual costs. A decrease in restructuring costs from 2019 to 2020 partially offset these changes.
Net occupancy expense of $116 million in 2020 increased 45% from 2019 driven by the impact of the IBKC merger and the Truist branch acquisition.
Computer software expense was $85 million in 2020, a 39% increase compared to $61 million in 2019, primarily the result of the inclusion of IBKC computer software and service expenses in the second half of 2020, and to a lesser extent, merger- and integration-related expenses.
Legal and professional fees increased $12 million, or 17%, to $84 million in 2020, primarily
the result of an increase in merger and integration-related expenses and the inclusion of IBKC, partially offset by lower restructuring costs associated with efficiency initiatives recognized in 2019.
Operations services expense increased $10 million, or 22%, to $56 million in 2020, primarily from the inclusion of IBKC expenses in the second half of 2020.
Contributions increased $30 million in
2020
, primarily due to a
$20 million c
ontribution to the Louisiana First Horizon Foundation in connection with the IBKC merger and a
$15 million
donation of Paycheck Protection Plan fees to the First Horizon Foundation to assist low- and moderate-income communities.
Equipment expense increased $8 million, or 24%, in 2020 driven by the impact of the IBKC merger and Truist branch acquisition.
Amortization of intangible assets of $40 million in 2020 increased $15 million compared to 2019 primarily due to the intangible assets created in the IBKC merger.
Income Taxes
FHN recorded income tax expense of $76 million in 2020 compared to $134 million in 2019, resulting in
an effective tax rate of 8.2% and 22.8% respectively. The decrease in the effective tax rate from 2019 to 2020 was primarily the result of the preliminary purchase accounting gain from the IBKC merger, which is not taxable.
FHN’s effective tax rate is favorably affected by recurring items such as bank-owned life insurance, tax-exempt income, and tax credits and other tax benefits from tax credit investments. The effective rate is unfavorably affected by the non-deductibility of a portion of FHN's FDIC premium, executive compensation and merger expenses. The effective tax rate also may be affected by items that may occur in any given period but are not consistent from period to period, such as changes in unrecognized tax benefits.
A deferred tax asset or deferred tax liability is recognized for the tax consequences of temporary differences between the financial statement carrying amounts and the tax bases of existing assets and liabilities. The tax consequence is calculated by applying enacted statutory tax rates, applicable to future years, to these temporary differences. FHN’s net DTA was less than $1 million and $69 million at December 31, 2020 and 2019, respectively.
As of December 31, 2020, FHN had deferred tax asset balances related to federal and state income tax carryforwards of $47 million and $9 million, which will expire at various dates. Refer to Note 15 - Income Taxes for additional information.
FHN’s gross DTA after valuation allowance was $471 million and $250 million as of December 31, 2020 and 2019, respectively. Based on current analysis, FHN believes that its ability to realize the remaining DTA is more likely than not. FHN monitors its DTA and the need for a valuation allowance on a quarterly basis. A significant adverse change in FHN’s taxable earnings outlook could result in the need for a valuation allowance.
FHN and its eligible subsidiaries are included in a consolidated federal income tax return. FHN files separate returns for subsidiaries that are not eligible to be included in a consolidated federal income tax return. Based on the laws of the applicable states where it conducts business operations, FHN either files consolidated, combined, or separate returns. With few exceptions, FHN tax returns are not currently under federal or state tax examination. In 2020, FHN finalized IRS examinations for the FHN federal consolidated tax returns for 2013 through 2015 and for the Capital Bank Financial Corporation federal consolidated tax returns for 2010 through 2012.
IBKC's federal consolidated tax returns for
|
FIRST HORIZON CORPORATION
|
60
|
2020 FORM 10-K ANNUAL REPORT | ||||||
2017 and 2018 are currently under examination by the IRS.
See Note 15 - Income Taxes for additional information.
Business Segment Results
During the fourth quarter of 2020, FHN reorganized its internal management structure and, accordingly, its segment reporting structure. Historically, FHN's primary business segments were Regional Banking, Fixed Income, Corporate, and Non-strategic. On July 1, 2020, FHN and IBKC closed their merger of equals transaction. This transaction prompted organizational changes to better integrate and execute the combined Company's strategic priorities across all lines of businesses. As a result, FHN revised its reportable segments as described below.
•
Regional Banking segment offers financial products and services, including traditional lending and deposit taking, to consumer and commercial clients primarily in the southern U.S. and other selected markets. Regional Banking also provides investment, wealth management, financial planning, trust and asset management services for consumer clients.
•
Specialty Banking segment consists of lines of business that deliver product offerings and services with specialized industry knowledge.
Specialty Banking’s lines of business include asset-based lending, mortgage warehouse lending, commercial real estate, franchise finance, correspondent banking, equipment finance, mortgage, and title insurance.
In addition to traditional lending and deposit taking, Specialty Banking also delivers treasury management solutions, loan syndications, international banking and SBA lending.
Additionally, Specialty Banking has a line of business focused on fixed income securities sales, trading, underwriting, and strategies for institutional clients in the U.S. and abroad, as well as loan sales, portfolio advisory services, and derivative sales.
•
Corporate segment consists primarily of corporate support functions including risk management, audit, accounting, finance, executive office, and corporate communications. Shared support services such as human resources, properties, technology, credit risk and bank operations are allocated to the activities of Regional Banking, Specialty Banking and Corporate.
Additionally, the Corporate segment includes centralized management of capital and funding to support the business activities of the company including management of wholesale funding, liquidity, and capital
management and allocation. Finally, the Corporate segment also includes the revenue and expense associated with run-off businesses such as pre-2009 mortgage banking elements, run-off consumer and trust preferred loan portfolios, and other exited businesses.
Segment results for years prior to 2020 have been recast to adjust for the realignment of the segment reporting structure. See Note 20 - Business Segment Information for additional disclosures related to FHN's operating segments.
Regional Banking
Pre-tax income within the Regional Banking segment decreased $54 million, or 13%, in 2020 reflecting increases in the provision for credit losses and noninterest expense, somewhat offset by an increase in revenue.
Net interest income increased $534 million, or 69%, in 2020 driven by merger-related earning asset growth, deposit pricing discipline, and PPP lending, partially offset by the negative impact of the low rate environment.
Noninterest income increased $54 million, or 19%, largely attributable to increases in other fee income driven by the addition of IBKC.
Provision for credit losses increased to $392 million in 2020 from $24 million in 2019, primarily the result of the adoption of CECL, deterioration in the economic forecast attributable to the effects of the COVID-19 pandemic, and provision related to acquired non-PCD loans.
Noninterest expense was $900 million in 2020, an increase of $274 million compared to 2019, primarily as a result of the addition of IBKC.
Specialty Banking
Pre-tax income in the Specialty Banking segment was $551 million in 2020 compared to $374 million in 2019. The improvement in results in 2020 was driven by higher revenue which outpaced an increase in expenses.
Net interest income increased $139 million, or 31%, in 2020 primarily driven by merger-related earning asset growth, partially offset by the negative impact of the low rate environment.
Noninterest income increased $258 million, or 81%, from 2019 primarily driven by strong fixed income
|
FIRST HORIZON CORPORATION
|
61
|
2020 FORM 10-K ANNUAL REPORT | ||||||
revenue from favorable market conditions and higher mortgage banking and title income as a result of the IBKC merger and increased activity due to the low rate environment.
Provision for credit losses increased to $117 million compared to $37 million in 2019 as a result of the same factors listed above for the Regional Banking segment.
Noninterest expense increased $140 million, or 40%, to $491 million in 2020, largely attributable to the addition of IBKC in the second half of the year. Personnel expense contributed $128 million of this increase, a result of increased headcount from the merger and branch acquisition as well as higher incentive compensation.
Corporate
Pre-tax income for the Corporate segment was $24 million for 2020 compared to a pre-tax loss of $200 million for 2019, primarily driven by the preliminary purchase accounting gain from the IBKC merger.
Net interest expense was $228 million in 2020 compared to $7 million in 2019. Net interest expense was unfavorably impacted by the funds transfer pricing methodology, with the offset in the Regional Banking segment.
Noninterest income was $573 million, up from $47 million in 2019, primarily from the preliminary purchase accounting gain related to the IBKC merger.
Noninterest expense increased to $327 million in 2020 from $256 million in 2019, primarily from a $116 million increase in merger and integration-related charges and expenses associated with the inclusion
of IBKC, somewhat offset by $40 million of restructuring, repositioning, and efficiency initiative costs recognized in 2019.
Restructuring, Repositioning, and Efficiency Initiatives
Beginning in first quarter 2019, FHN initiated a company-wide review of business practices with the goal of optimizing its expense base to improve profitability and create capacity to reinvest savings into technology and revenue production activities. The net charges for restructuring, repositioning, and efficiency initiatives were $40 million in 2019, primarily associated with professional fees, asset impairments, and severance and other employee costs. These charges were insignificant in 2020. Due to the broad nature of the actions being taken, many components of expense are expected to benefit from the efficiency initiatives. See Note 25 - Restructuring, Repositioning, and Efficiency for additional information.
RESULTS OF OPERATIONS - 2019 compared with 2018
For a description of FHN's results of operations for 2019, see the "Income Statement Review - 2019 compared to 2018; 2018 compared to 2017" section of Item 7 in our 2019 Form 10-K.
ANALYSIS OF FINANCIAL CONDITION
Investment Securities
The following table presents the carrying value of securities by category as of December 31 for the years indicated:
Table 7 - Composition of Securities Portfolio
| 2020 | 2019 | ||||||||||||||||||||||
| (Dollars in millions) | Balance | Mix | Balance | Mix | |||||||||||||||||||
| Securities available for sale: | |||||||||||||||||||||||
| U.S. treasuries | $ | 613 | 8 | % | $ | — | — | ||||||||||||||||
| Government agency issued MBS and CMO | 6,218 | 77 | % | 4,019 | 90 | % | |||||||||||||||||
| Other U.S. government agencies (a) | 684 | 9 | % | 307 | 7 | ||||||||||||||||||
| Corporate and other debt | 40 | — | % | 40 | 1 | ||||||||||||||||||
| States and municipalities | 460 | 6 | % | 60 | 1 | ||||||||||||||||||
| SBA-interest only strips | 32 | — | % | 19 | 1 | ||||||||||||||||||
| Total securities available for sale | $ | 8,047 | 100 | % | $ | 4,445 | 100 | % | |||||||||||||||
(a) Includes securities issued by government sponsored entities which are not backed by the full faith and credit of the U.S. Government.
|
FIRST HORIZON CORPORATION
|
62
|
2020 FORM 10-K ANNUAL REPORT | ||||||
FHN’s investment portfolio consists principally of debt securities including government agency issued mortgage-backed securities and collateralized mortgage obligations, all of which are classified as AFS. The securities portfolio provides a source of income and liquidity and is an important tool used to balance the interest rate risk of the loan and deposit portfolios.The securities portfolio is periodically evaluated in light of established ALM objectives, changing market conditions that could affect the profitability of the portfolio, the regulatory environment, and the level of interest rate risk to
which FHN is exposed. These evaluations may result in steps taken to adjust the overall balance sheet positioning.
Investment securities were $8.0 billion and $4.4 billion on December 31, 2020 and 2019, representing 10% of total assets for both periods. The increase in investment securities was due primarily to the IBKC merger which contributed $3.5 billion in securities. See Note 3 - Investment Securities in Item 8 for additional detail.
The following table presents an analysis of the amortized cost, remaining contractual maturities, and weighted-average yields by contractual maturity for the debt securities portfolio.
Table 8—Contractual Maturities of Investment Securities
| As of December 31, 2020 | ||||||||||||||||||||||||||||||||||||||||||||||||||
| After 1 year | After 5 years | |||||||||||||||||||||||||||||||||||||||||||||||||
| Within 1 year | Within 5 years | Within 10 years | After 10 years | |||||||||||||||||||||||||||||||||||||||||||||||
| (Dollars in millions) | Amount | Yield (b) | Amount | Yield (b) | Amount | Yield (b) | Amount | Yield (b) | ||||||||||||||||||||||||||||||||||||||||||
| Securities available for sale: | ||||||||||||||||||||||||||||||||||||||||||||||||||
| Government agency issued MBS and CMO (a) | $ | 21 | 2.85 | % | $ | 428 | 1.82 | % | $ | 1,224 | 1.50 | % | $ | 4,429 | 1.41 | % | ||||||||||||||||||||||||||||||||||
| U.S. treasuries | 613 | 0.13 | — | — | — | — | — | — | ||||||||||||||||||||||||||||||||||||||||||
| Other U.S. government agencies | 126 | 2.78 | 43 | 2.62 | 32 | 1.16 | 471 | 1.65 | ||||||||||||||||||||||||||||||||||||||||||
| States and municipalities | 2 | 3.08 | 92 | 0.63 | 152 | 1.15 | 199 | 2.44 | ||||||||||||||||||||||||||||||||||||||||||
| Corporate and other debt | 15 | 5.96 | 25 | 4.04 | — | — | — | — | ||||||||||||||||||||||||||||||||||||||||||
| Total securities available for sale | $ | 777 | 0.75 | % | $ | 588 | 1.78 | % | $ | 1,408 | 1.45 | % | $ | 5,099 | 1.47 | % | ||||||||||||||||||||||||||||||||||
(a) Represents government agency-issued mortgage-backed securities and collateralized mortgage obligations which, when adjusted for early pay downs, have an estimated average life of 3.5 years.
(b) Weighted average yields were calculated using amortized cost on a fully-taxable equivalent basis, assuming a 25% tax rate where applicable.
|
FIRST HORIZON CORPORATION
|
63
|
2020 FORM 10-K ANNUAL REPORT | ||||||
Loans and Leases
The following table provides detail regarding FHN's loans and leases:
Table 9— Loans and Leases
| (Dollars in millions) | 2020 (a) | Percent of total | 2020 (a) Growth Rate | 2019 | Percent of total | 2019 Growth Rate | 2018 | Percent of total | 2018 Growth Rate | |||||||||||||||||||||||||||||||||||||||||||||||
| Commercial: | ||||||||||||||||||||||||||||||||||||||||||||||||||||||||
| Commercial, financial, and industrial (b) | $ | 33,104 | 57 | % | 65 | % | $ | 20,051 | 65 | % | 21 | % | $ | 16,514 | 60 | % | 3 | % | ||||||||||||||||||||||||||||||||||||||
| Commercial real estate | 12,275 | 21 | 183 | 4,337 | 14 | 8 | 4,031 | 15 | (4) | |||||||||||||||||||||||||||||||||||||||||||||||
| Total commercial | 45,379 | 78 | 86 | 24,388 | 79 | 19 | 20,545 | 75 | 1 | |||||||||||||||||||||||||||||||||||||||||||||||
| Consumer: | ||||||||||||||||||||||||||||||||||||||||||||||||||||||||
| Consumer real estate (c) | 11,725 | 20 | 90 | 6,177 | 20 | (5) | 6,472 | 23 | (4) | |||||||||||||||||||||||||||||||||||||||||||||||
| Credit card and other | 1,128 | 2 | 127 | 496 | 1 | (4) | 518 | 2 | (16) | |||||||||||||||||||||||||||||||||||||||||||||||
| Total consumer | 12,853 | 22 | 93 | 6,673 | 21 | (5) | 6,990 | 25 | (5) | |||||||||||||||||||||||||||||||||||||||||||||||
| Total loans and leases | $ | 58,232 | 100 | % | 87 | % | $ | 31,061 | 100 | % | 13 | % | $ | 27,535 | 100 | % | — | % | ||||||||||||||||||||||||||||||||||||||
(a) 2020 includes the impact of balances related to the IBKC merger on July 1, 2020 and Truist Bank branch acquisition on July 17, 2020.
(b) Includes equipment financing loans and leases.
(c) 2018 include $16 million of restricted and secured real estate loans. There were no such restricted and secured loans at December 31, 2020 or 2019.
Total loans and leases were $58.2 billion on December 31, 2020, up from $31.1 billion on December 31, 2019, driven
primarily by acquired IBKC and Truist Bank loans, as well as the origination of PPP loans.
C&I loans are the largest component of the loan and lease portfolio, comprising 57% of total loans and leases in 2020 and 65% in 2019. C&I loans increased 65%, or $13.1 billion, from 2019 largely driven by acquired loans and PPP loan originations, as well as strong loan growth within the mortgage warehouse lending portfolio of Specialty Banking and commercial portfolios of both Regional Banking and Specialty
Banking. Growth in other specialty lending areas within Specialty Banking, such as energy and healthcare, also meaningfully contributed to the overall growth in C&I loans from 2019. Commercial real estate loans increased 183% to $12.3 billion in 2020, also primarily driven by acquired IBKC loans.
Total consumer loans increased 93%, or $6.2 billion, from the end of 2019, largely a result of the growth of real estate installment loans and home equity lines of credit within the Regional Banking segment, driven by acquired IBKC loans, offset by the continued wind-down of portfolios within the Corporate segment.
|
FIRST HORIZON CORPORATION
|
64
|
2020 FORM 10-K ANNUAL REPORT | ||||||
The following table provides a detail of contractual maturities on December 31, 2020.
Table 10—Contractual Maturities of Loans and Leases
| As of December 31, 2020 | |||||||||||||||||||||||||||||
| (Dollars in millions) | Within 1 Year |
After 1 Year
Within 5 Years |
After 5 Years Within 15 Years | After 15 Years | Total | ||||||||||||||||||||||||
| Commercial, financial, and industrial | $ | 10,004 | $ | 17,371 | $ | 5,278 | $ | 451 | $ | 33,104 | |||||||||||||||||||
| Commercial real estate | 2,553 | 7,022 | 2,618 | 82 | 12,275 | ||||||||||||||||||||||||
| Consumer real estate | 292 | 1,093 | 2,550 | 7,790 | 11,725 | ||||||||||||||||||||||||
| Credit card and other | 267 | 318 | 154 | 389 | 1,128 | ||||||||||||||||||||||||
| Total loans and leases | $ | 13,116 | $ | 25,804 | $ | 10,600 | $ | 8,712 | $ | 58,232 | |||||||||||||||||||
| For maturities over one year at fixed interest rates: | |||||||||||||||||||||||||||||
| Commercial, financial, and industrial | $ | 7,784 | $ | 2,556 | $ | 79 | $ | 10,419 | |||||||||||||||||||||
| Commercial real estate | 2,274 | 805 | 17 | 3,096 | |||||||||||||||||||||||||
| Consumer real estate | 944 | 1,952 | 1,880 | 4,776 | |||||||||||||||||||||||||
| Credit card and other | 122 | 134 | 41 | 297 | |||||||||||||||||||||||||
| Total loans and leases at fixed interest rates | $ | 11,124 | $ | 5,447 | $ | 2,017 | $ | 18,588 | |||||||||||||||||||||
| For maturities over one year at floating interest rates: | |||||||||||||||||||||||||||||
| Commercial, financial, and industrial | $ | 9,587 | $ | 2,722 | $ | 372 | $ | 12,681 | |||||||||||||||||||||
| Commercial real estate | 4,748 | 1,813 | 65 | 6,626 | |||||||||||||||||||||||||
| Consumer real estate | 149 | 598 | 5,910 | 6,657 | |||||||||||||||||||||||||
| Credit card and other | 196 | 20 | 348 | 564 | |||||||||||||||||||||||||
| Total loans and leases at floating interest rates | $ | 14,680 | $ | 5,153 | $ | 6,695 | $ | 26,528 | |||||||||||||||||||||
| Total maturities over one year | $ | 25,804 | $ | 10,600 | $ | 8,712 | $ | 45,116 | |||||||||||||||||||||
Because of various factors, the contractual maturities of consumer loans are not indicative of the actual lives of such loans. A significant component of FHN’s loan portfolio consists of consumer real estate loans, a majority of which are home equity lines of credit and home equity installment loans. These loans have an initial period where the borrower is only required to pay the periodic interest. After the interest-only period, the loan will require the payment of both principal and interest over the remaining term. Numerous factors can contribute to the actual life of a home equity line or installment loan. As a result, the actual average life of home equity lines and loans is difficult to predict and changes in any of these factors could result in changes in projections of average lives.
Loans Held for Sale
FHN obtained IBKC's mortgage banking operations which included origination and servicing of residential first lien mortgages which primarily consist of fixed rate single-family residential mortgage loans originated by IBKC and committed to be sold in the
secondary market.
The legacy FHN loans HFS portfolio consists of small business, other consumer loans, the mortgage warehouse, USDA, student, and home equity loans. The average balance of loans HFS increased
to $835 milli
on in
2020
from
$578
million in 2019. On December 31, 2020, loans HFS were
$1.0 billio
n, a $428 million increase compared to December 31, 2019. Th
e increase in loans HFS was primarily driven by the additional volume of mortgage loans originated from the IBKC merger. Held-for-sale consumer mortgage loans secured by residential real estate in process of foreclosure totaled $2 million and $7 million at
December 31, 2020
and 2019, respectively.
Deposits
Total deposits were $70.0 billion at December 31, 2020, up $37.6 billion from $32.4 billion for year-end 2019, driven by $28.2 billion in acquired IBKC deposits and $2.2 billion in acquired Truist deposits. In addition, deposit balances were impacted by significant client deposit inflows beginning in March 2020 as brokerage clients exited equity markets to
|
FIRST HORIZON CORPORATION
|
65
|
2020 FORM 10-K ANNUAL REPORT | ||||||
move into cash positions given the market volatility associated with the COVID-19 pandemic, municipalities received federal stimulus payments, and PPP funding began. As short-term rates have come down, particularly in the latter half of the year, bank deposits provide institutional clients with overnight liquidity at a competitive, and often superior, rate to other short-term cash management options. Additionally, there has been a notable shift from
interest-bearing deposits to noninterest-bearing deposits within many of FHN's institutional relationships. The following table summarizes FHN's deposits for 2020, 2019, and 2018. See Table 2 - Average Balances, Net Interest Income and Yields/Rates in this Report for information on average deposits including average rates paid.
Table 11— Deposits
| (Dollars in millions) | 2020 | Percent of Total | 2020 Growth Rate | 2019 | Percent of Total | 2019 Growth Rate | 2018 | Percent of Total | 2018 Growth Rate | |||||||||||||||||||||||||||||||||||||||||||||||
| Savings | $ | 27,324 | 39 | % | 134 | % | $ | 11,665 | 36 | % | (3) | % | $ | 12,064 | 37 | % | 11 | % | ||||||||||||||||||||||||||||||||||||||
| Time deposits | 5,070 | 7 | 40 | 3,618 | 11 | (12) | 4,106 | 12 | 24 | |||||||||||||||||||||||||||||||||||||||||||||||
| Other interest-bearing deposits | 15,415 | 22 | 77 | 8,718 | 27 | 4 | 8,372 | 26 | — | |||||||||||||||||||||||||||||||||||||||||||||||
| Interest-bearing deposits | 47,809 | 68 | 99 | 24,001 | 74 | (2) | 24,542 | 75 | 9 | |||||||||||||||||||||||||||||||||||||||||||||||
| Noninterest-bearing | 22,173 | 32 | 163 | 8,429 | 26 | 4 | 8,141 | 25 | 1 | |||||||||||||||||||||||||||||||||||||||||||||||
| Total deposits | $ | 69,982 | 100 | % | 116 | % | $ | 32,430 | 100 | % | (1) | % | $ | 32,683 | 100 | % | 7 | % | ||||||||||||||||||||||||||||||||||||||
Table 12 — Total Uninsured Deposits
| For the Year Ended December 31, | ||||||||||||||||||||
| (Dollars in millions) | 2020 | 2019 | 2018 | |||||||||||||||||
| Uninsured deposits | $ | 33,057 | $ | 12,176 | $ | 12,263 | ||||||||||||||
Table 13 — Uninsured Time Deposits by Maturity
| (Dollars in millions) | December 31, 2020 | |||||||
| Portion of U.S. time deposits in excess of insurance limit | $ | 925 | ||||||
| Time deposits otherwise uninsured with a maturity of: | ||||||||
| 3 months or less | 300 | |||||||
| Over 3 months through 6 months | 224 | |||||||
| Over 6 months through 12 months | 275 | |||||||
| Over 12 months | 126 | |||||||
Short-Term Borrowings
Short-term borrowings include federal funds purchased, securities sold under agreements to repurchase, trading liabilities, and other short-term borrowings. Total short-term borrowings were $2.6 billion on December 31, 2020, a $1.5 billion decrease from December 31, 2019 attributable to decreases in other short-term borrowings and trading liabilities partially offset by increases in federal funds purchased and securities sold under agreements to repurchase.
The balance of other short-term borrowings fluctuates largely based on the level of FHLB borrowing as a result of loan demand, deposit levels and balance sheet funding strategies. The decrease in other short-term borrowings in 2020 was primarily attributable to a decrease in FHLB advances as FHN was able to use client deposits to support balance sheet funding.Trading liabilities fluctuate based on various factors, including levels of trading securities and hedging strategies. Federal funds purchased fluctuate depending on the amount of excess funding of FHN's correspondent bank clients. Balances of securities sold under agreements to resell fluctuate based on cost attractiveness relative to FHLB borrowing levels and the ability to pledge securities toward such
|
FIRST HORIZON CORPORATION
|
66
|
2020 FORM 10-K ANNUAL REPORT | ||||||
transactions. See Note 10 - Short-Term Borrowings for additional information.
Term Borrowings
Term borrowings include senior and subordinated borrowings with original maturities greater than one year. Total term borrowings were $1.7 billion on December 31, 2020, a $879 million increase from $791 million on December 31, 2019. The increase was primarily the result of the issuance of $450 million of subordinated notes by First Horizon Bank, the issuance of $800 million of senior notes by FHN, and the acquisition of $120 million in junior subordinated debt from IBKC. These increases were offset by the redemption of $500 million in senior notes. See Note 11 - Term Borrowings for additional information.
CAPITAL
Management’s objectives are to provide capital sufficient to cover the risks inherent in FHN’s businesses, to maintain excess capital to well-capitalized standards, and to assure ready access to the capital markets. Total equity increased $3.2 billion to $8.3 billion on December 31, 2020 from $5.1 billion on December 31, 2019. The increase was primarily attributable to $2.5 billion in equity issued in connection with the IBKC merger.
In addition, FHN issued
1,500 shares of Series E Non-Cumulative Perpetual Preferred Stock in May 2020 for net proceeds of $144 million. Other significant changes included net income of $857 million and an increase in AOCI of $99 million, which were partially offset by $286 million in common and preferred stock dividends declared and a $96 million adjustment related to the adoption of CECL.
The following tables provide a reconciliation of Shareholders’ equity from the Consolidated Balance Sheets to Common Equity Tier 1, Tier 1 and Total Regulatory Capital as well as certain selected capital ratios:
Table 14—Regulatory Capital and Ratios
|
(
Dollars in millions
)
|
December 31, 2020 | December 31, 2019 | ||||||||||||
| Shareholders’ equity | $ | 8,012 | $ | 4,781 | ||||||||||
| Modified CECL transitional amount (a) | 191 | — | ||||||||||||
| FHN non-cumulative perpetual preferred | (470) | (96) | ||||||||||||
| Common equity tier 1 before regulatory adjustments | $ | 7,733 | $ | 4,685 | ||||||||||
| Regulatory adjustments: | ||||||||||||||
| Disallowed goodwill and other intangibles | (1,757) | (1,506) | ||||||||||||
| Net unrealized (gains) losses on securities available for sale | (108) | (31) | ||||||||||||
| Net unrealized (gains) losses on pension and other postretirement plans | 260 | 274 | ||||||||||||
| Net unrealized (gains) losses on cash flow hedges | (12) | (3) | ||||||||||||
| Disallowed deferred tax assets | (5) | (9) | ||||||||||||
| Other deductions from common equity tier 1 | (1) | (1) | ||||||||||||
| Common equity tier 1 | $ | 6,110 | $ | 3,409 | ||||||||||
| FHN non-cumulative perpetual preferred (b) | 377 | 96 | ||||||||||||
| Qualifying noncontrolling interest—First Horizon Bank preferred stock | 295 | 256 | ||||||||||||
| Tier 1 capital | $ | 6,782 | $ | 3,761 | ||||||||||
| Tier 2 capital | 1,153 | 394 | ||||||||||||
| Total regulatory capital | $ | 7,935 | $ | 4,155 | ||||||||||
| Risk-Weighted Assets | ||||||||||||||
| First Horizon Corporation | $ | 63,140 | $ | 37,046 | ||||||||||
| First Horizon Bank | 62,508 | 36,627 | ||||||||||||
| Average Assets for Leverage | ||||||||||||||
| First Horizon Corporation | 82,347 | 41,583 | ||||||||||||
| First Horizon Bank | 81,709 | 40,867 | ||||||||||||
|
FIRST HORIZON CORPORATION
|
67
|
2020 FORM 10-K ANNUAL REPORT | ||||||
| December 31, 2020 | December 31, 2019 | |||||||||||||||||||||||||
| Ratio | Amount | Ratio | Amount | |||||||||||||||||||||||
| Common Equity Tier 1 | ||||||||||||||||||||||||||
| First Horizon Corporation | 9.68 | % | $ | 6,110 | 9.20 | % | $ | 3,409 | ||||||||||||||||||
| First Horizon Bank | 10.46 | 6,530 | 9.38 | 3,434 | ||||||||||||||||||||||
| Tier 1 | ||||||||||||||||||||||||||
| First Horizon Corporation | 10.74 | 6,782 | 10.15 | 3,760 | ||||||||||||||||||||||
| First Horizon Bank | 10.93 | 6,825 | 10.18 | 3,729 | ||||||||||||||||||||||
| Total | ||||||||||||||||||||||||||
| First Horizon Corporation | 12.57 | 7,935 | 11.22 | 4,155 | ||||||||||||||||||||||
| First Horizon Bank | 12.52 | 7,819 | 10.77 | 3,945 | ||||||||||||||||||||||
| Tier 1 Leverage | ||||||||||||||||||||||||||
| First Horizon Corporation | 8.24 | 6,782 | 9.04 | 3,760 | ||||||||||||||||||||||
| First Horizon Bank | 8.36 | 6,825 | 9.12 | 3,729 | ||||||||||||||||||||||
| Other Capital Ratios | ||||||||||||||||||||||||||
| Total period-end equity to period-end assets | 9.86 | 11.72 | ||||||||||||||||||||||||
| Tangible common equity to tangible assets (c) | 6.89 | 7.48 | ||||||||||||||||||||||||
| Adjusted tangible common equity to risk weighted assets (c) | 8.82 | 8.34 | ||||||||||||||||||||||||
(a) The modified CECL transitional amount is calculated as defined in the final rule issued by the banking regulators on August 26, 2020 and includes the full amount of the impact to retained earnings from the initial adoption of CECL plus 25% of the change in the adjusted allowance for credit losses since FHN’s initial adoption of CECL through December 31, 2020.
(b) At December 31, 2020, the $93 million carrying value of the Series D preferred stock does not qualify as Tier 1 capital because the earliest redemption date is less than five years from the issuance date.
(c) Tangible common equity to tangible assets and Adjusted tangible common equity to risk-weighted assets are non-GAAP measures and are reconciled to total equity to total assets (GAAP) in the Non-GAAP to GAAP Reconciliation - Table 28.
Banking regulators define minimum capital ratios for bank holding companies and their bank subsidiaries. Based on the capital rules and definitions prescribed by the banking regulators, should any depository institution’s capital ratios decline below predetermined levels, it would become subject to a series of increasingly restrictive regulatory actions. The system categorizes a depository institution’s capital position into one of five categories ranging from well-capitalized to critically under-capitalized. For an institution the size of FHN to qualify as well-capitalized, Common Equity Tier 1, Tier 1 Capital, Total Capital, and Leverage capital ratios must be at least 6.50%, 8.00%, 10.00%, and 5.00%, respectively. Furthermore, beginning January 1, 2019, a capital conservation buffer of 50 basis points above these levels must be maintained on the Common Equity Tier 1, Tier 1 Capital and Total Capital ratios to avoid restrictions on dividends, share repurchases and certain discretionary bonuses. As of December 31, 2020, each of FHN and First Horizon Bank had sufficient capital to qualify as well-capitalized institutions and to meet the capital conservation buffer requirement. Capital ratios for both FHN and First Horizon Bank as of December 31, 2020 are calculated under the final rule issued by the banking regulators in late August 2020 to delay the
effects of CECL on regulatory capital for two years, followed by a three-year transition period.
For both FHN and First Horizon Bank, the risk-based regulatory capital ratios increased in 2020 relative to 2019 primarily from the issuance of preferred and common equity in connection with the IBKC merger, offset by the intangible assets created in the IBKC merger and Truist Bank branch acquisition. Regulatory capital ratios were also favorably impacted by the impact of net income less dividends during 2020. For the Bank only, the risk-based regulatory capital ratios were impacted by a reduction of $115 million in its equity investment in its financial subsidiary, FHN Financial Securities Corp. In addition, the Tier 1 Capital ratio for FHN benefited from the issuance of $150 million of Non-Cumulative Perpetual Preferred Stock, Series E. The Total Capital ratios for both FHN and First Horizon Bank benefited from the Bank’s issuance of $450 million of Tier 2 qualifying subordinated notes. The Tier 1 leverage ratio declined for both FHN and First Horizon Bank as average assets for leverage in 2020 increased relative to 2019 primarily in connection with the IBKC merger. During 2021, capital ratios are expected to remain above well-capitalized standards plus the required capital conservation buffer.
|
FIRST HORIZON CORPORATION
|
68
|
2020 FORM 10-K ANNUAL REPORT | ||||||
Stress Testing
The Economic Growth, Regulatory Relief, and Consumer Protection Act, along with an interagency regulatory statement effectively exempted both FHN and First Horizon Bank from Dodd-Frank Act stress testing requirements starting in 2018.
For 2020, FHN and First Horizon Bank completed a company run stress test using the Comprehensive Capital Analysis and Review (CCAR) Resubmission scenarios published in September 2020.
Results of these tests indicate that both FHN and First Horizon Bank would be able to maintain capital well in excess of Basel III Adequately Capitalized standards under the hypothetical severe global recession of the 2020 CCAR Resubmission Severely Adverse scenario. A summary of those results was posted in the “News & Events-Stress Testing Results” section on FHN’s investor relations website on December 28, 2020. Neither FHN’s stress test posting, nor any other material found on FHN’s website generally, is part of this report or incorporated herein.
FHN anticipates that it will continue performing an annual enterprise-wide stress test as part of its capital and risk management process. Results of this test will be presented to executive management and the Board.
The disclosures in this “Stress Testing” section include forward-looking statements. Please refer to “Forward-Looking Statements” for additional information concerning the characteristics and limitations of statements of that type.
Common Stock Purchase Programs
Pursuant to Board authority, FHN may repurchase shares of its common stock from time to time and will evaluate the level of capital and take action designed
to generate or use capital, as appropriate, for the interests of the shareholders, subject to legal and regulatory restrictions. Two common stock purchase programs currently authorized are discussed below. FHN’s board has not authorized a preferred stock purchase program.
In January 2021, FHN's Board of Directors approved a new $500 million common share purchase program that will expire on January 31, 2023. The new program is not tied to any compensation plan, and replaces the general share repurchase program mentioned below, which was terminated by the Board. Purchases may be made in the open market or through privately negotiated transactions, including under Rule 10b5-1 plans as well as accelerated share repurchase and other structured transactions. The timing and exact amount of common share repurchases will be subject to various factors, including FHN's capital position, financial performance, capital impacts of strategic initiatives, market conditions and regulatory considerations.
Table 15a—Issuer Purchases of Common Stock - General Authority
On January 23, 2018, FHN announced a $250 million share purchase authority with an expiration date of January 31, 2020. On January 29, 2019, FHN announced a $250 million increase in that authority along with an extension of the expiration date to January 31, 2021. Purchases could be made in the open market or through privately negotiated transactions and were subject to various factors, including FHN's capital position, financial performance, capital impacts of strategic initiatives, market conditions, and regulatory considerations. As of December 31, 2020, $229 million in purchases had been made under this authority at an average price per share of $15.09 ($15.07 excluding commissions).
| (Dollar values and volume in thousands, except per share data) |
Total number
of shares purchased |
Average price
paid per share (a) |
Total number of
shares purchased as part of publicly announced programs |
Maximum approximate dollar value that may yet be purchased under the programs (b) | ||||||||||||||||||||||
| 2020 | ||||||||||||||||||||||||||
| October 1 to October 31 | — | N/A | — | $ | 270,654 | |||||||||||||||||||||
| November 1 to November 30 | — | N/A | — | $ | 270,654 | |||||||||||||||||||||
| December 1 to December 31 | — | N/A | — | $ | 270,654 | |||||||||||||||||||||
| Total | — | N/A | — | |||||||||||||||||||||||
| (a) Represents total costs including commissions paid | ||||||||||||||||||||||||||
| (b) On December 31, 2020, the maximum dollar value of shares that may be purchased under the program was $271 million. In January 2021, the current plan was terminated and FHN's Board of Directors approved a new $500 million common share repurchase program. | ||||||||||||||||||||||||||
| N/A - Not applicable | ||||||||||||||||||||||||||
|
FIRST HORIZON CORPORATION
|
69
|
2020 FORM 10-K ANNUAL REPORT | ||||||
On January 27, 2021, FHN announced a $500 million share purchase authority with an expiration date of January 31, 2023. This new authority replaced the previous one. Purchases may be made in the open market or through privately negotiated transactions and are subject to various factors, including FHN's capital position, financial performance, capital impacts of strategic initiatives, market conditions, and regulatory considerations.
Table 15b—Issuer Purchase of Common Stock - Compensation Authority
A consolidated compensation plan share purchase program was announced on August 6, 2004. This program consolidated all of the previously authorized compensation plan share programs into a single share purchase program, as well as the renewal of the authorization to purchase shares for use in connection with two compensation plans for which the share purchase authority had expired. The total
amount authorized under this consolidated compensation plan share purchase program, inclusive of a program amendment on April 24, 2006, is 29.6 million shares calculated before adjusting for stock dividends distributed through January 1, 2011. The authorization has been reduced for that portion which relates to compensation plans for which no options remain outstanding. The shares may be purchased over the option exercise period of the various compensation plans on or before December 31, 2023. Purchases may be made in the open market or through privately negotiated transactions and are subject to various factors, including FHN's capital position, financial performance, capital impacts of strategic initiatives, market conditions, and regulatory considerations. As of December 31, 2020, the maximum number of shares that may be purchased under the program was 24 million shares. Management currently does not anticipate purchasing a material number of shares under this authority during 2021.
| (Volume in thousands, except per share data) |
Total number
of shares purchased |
Average price
paid per share |
Total number of
shares purchased as part of publicly announced programs |
Maximum number
of shares that may yet be purchased under the programs |
||||||||||||||||||||||
| 2020 | ||||||||||||||||||||||||||
| October 1 to October 31 | 9 | $ | 9.93 | 9 | 24,036 | |||||||||||||||||||||
| November 1 to November 30 | — | N/A | — | 24,036 | ||||||||||||||||||||||
| December 1 to December 31 | 5 | $ | 12.68 | 5 | 24,031 | |||||||||||||||||||||
| Total | 14 | $ | 10.92 | 14 | ||||||||||||||||||||||
| N/A - Not applicable | ||||||||||||||||||||||||||
ASSET QUALITY
Loan and Lease Portfolio Composition
FHN groups its loans into portfolio segments based on internal classifications reflecting the manner in which the ALLL is established and how credit risk is measured, monitored, and reported. From time to time, and if conditions are such that certain subsegments are uniquely affected by economic or market conditions or are experiencing greater deterioration than other components of the loan portfolio, management may determine the ALLL at a more granular level. Commercial loans are composed of C&I loans and CRE loans. Consumer loans are composed of consumer real estate loans and credit card and other loans. In first quarter 2020, FHN consolidated its permanent mortgage portfolio into consumer real estate. Loans previously classified in permanent mortgage included p
rimarily jumbo mortgages and one-time-close completed construction loans that were originated through pre-2009 mortgage businesses.
Underwriting Policies and Procedures
The following sections describe each portfolio as well as general underwriting procedures for each. As economic and real estate conditions develop, enhancements to underwriting and credit policies and procedures may be necessary or desirable. Loan policies and procedures for all portfolios are reviewed by credit risk working groups and management risk committees comprised of business line managers and credit administration professionals as well as by various other reviewing bodies within FHN. Policies and procedures are approved by key executives and/or senior managers leading the applicable credit risk working groups as well as by management risk committees.
The credit risk working groups and management risk committees strive to ensure that the approved policies and procedures address the associated risks and establish reasonable underwriting criteria that appropriately mitigate risk. Policies and procedures are reviewed, revised and re-issued periodically at
|
FIRST HORIZON CORPORATION
|
70
|
2020 FORM 10-K ANNUAL REPORT | ||||||
established review dates or earlier if changes in the economic environment, portfolio performance, the size of portfolio or industry concentrations, or regulatory guidance warrant an earlier review.
Commercial Loan and Lease Portfolios
FHN’s commercial loan approval process grants lending authority based upon job description, experience, and performance. The lending authority is delegated to the business line (Market Managers, Departmental Managers, Regional Presidents, Relationship Managers (RM) and Portfolio Managers (PM) and to Credit Risk Managers. While individual limits vary, the predominant amount of approval authority is vested with the Credit Risk Management function. Portfolio, industry, and borrower concentration limits for the various portfolios are established by executive management and approved by the Executive and Risk Committee of the Board.
FHN’s commercial lending process incorporates an RM and a PM for most commercial credits. This model is being implemented in the legacy IBKC markets. The RM is primarily responsible for communications with the borrower and maintaining the relationship, while the PM is responsible for assessing the credit quality of the borrower, beginning with the initial underwriting and continuing through the servicing period. Other specialists and the assigned RM/PM are organized into units called deal teams. Deal teams are constructed with specific job attributes that facilitate FHN’s ability to identify, mitigate, document, and manage ongoing risk. PMs and credit analysts provide enhanced analytical support during loan origination and servicing, including monitoring of the financial condition of the borrower and tracking compliance with loan agreements. Loan closing officers and the construction loan management unit specialize in loan documentation and the management of the construction lending process. FHN strives to identify problem assets early through comprehensive policies and guidelines, targeted portfolio reviews, more frequent servicing on lower rated borrowers, and an emphasis on frequent grading. For smaller commercial credits, generally $5 million or less, and income-producing CRE credits greater than $10 million to non-professional real estate developers and smaller professional real estate investors/developers, FHN utilizes a centralized underwriting unit in order to originate and grade small business loans more efficiently and consistently.
FHN may utilize availability of guarantors/sponsors to support commercial lending decisions during the credit underwriting process and when determining the
assignment of internal loan grades. Reliance on the guaranty as a viable secondary source of repayment is a function of an analysis proving capability to pay, factoring in, among other things, liquidity and direct/indirect cash flows. FHN also considers the volume and amount of guaranties provided for all global indebtedness and the likelihood of realization. FHN presumes a guarantor’s willingness to perform until there is any current or prior indication or future expectation that the guarantor may not willingly and voluntarily perform under the terms of the guaranty. In FHN’s risk grading approach, it is deemed that financial support becomes necessary generally at a point when the loan would otherwise be graded substandard, reflecting a well-defined weakness. At that point, provided willingness and capacity to support are appropriately demonstrated, a strong, legally enforceable guaranty can mitigate the risk of default or loss, justify a less severe rating, and consequently reduce the level of allowance or charge-off that might otherwise be deemed appropriate.
C&I
The C&I portfolio was $33.1 billion on December 31, 2020 and is comprised of loans used for general business purposes
. Typical products include working capital lines of credit, term loan financing of owner-occupied real estate and fixed assets, direct financing and sales-type leases, and trade credit enhancement through letters of credit. The largest geographical concentrations of balances as of December 31, 2020, are in Tennessee (21%), Florida (12%), Texas (9%), Louisiana (8%), North Carolina (8%), California (7%), and Georgia (5%), with no other state representing more than 5% of the portfolio.
C&I loans are underwritten in accordance with a well-defined credit origination process. This process includes applying minimum underwriting standards as well as separation of origination and credit approval roles on transaction sizes over PM authorization limits. Underwriting typically includes due diligence of the borrower and the applicable industry of the borrower, analysis of the borrower’s available financial information, identification and analysis of the various sources of repayment and identification of the primary risk attributes. Stress testing the borrower’s financial capacity, adherence to loan documentation requirements, and assigning credit risk grades using internally developed scorecards are also used to help quantify the risk when appropriate. Underwriting parameters also include loan-to-value ratios which vary depending on collateral type, use of guaranties, loan agreement requirements, and other recommended terms such as equity requirements, amortization, and maturity. Approval decisions also consider various financial ratios and performance
|
FIRST HORIZON CORPORATION
|
71
|
2020 FORM 10-K ANNUAL REPORT | ||||||
measures of the borrowers, such as cash flow and balance sheet leverage, liquidity, coverage of fixed charges, and working capital. Additionally, approval decisions consider the capital structure of the borrower, sponsorship, and quality/value of collateral. Generally, guideline and policy exceptions are identified and mitigated during the approval process. Pricing of C&I loans is based upon the determined credit risk specific to the individual borrower. These loans typically have variable rates tied to the LIBOR or the prime rate of interest plus or minus the appropriate margin.
The following table provides the composition of the C&I portfolio by industry as of December 31, 2020 and
2019
. For purposes of this disclosure, industries are determined based on the NAICS industry codes used by Federal statistical agencies in classifying business establishments for the collection, analysis, and publication of statistical data related to the U.S. business economy.
Table 16—C&I Loan Portfolio by Industry
| December 31, 2020 | December 31, 2019 | |||||||||||||||||||||||||
| (Dollars in millions) | Amount | Percent | Amount | Percent | ||||||||||||||||||||||
| Industry: | ||||||||||||||||||||||||||
| Loans to mortgage companies | $ | 5,404 | 16 | % | $ | 4,411 | 22 | % | ||||||||||||||||||
| Finance and insurance | 3,130 | 10 | 2,778 | 14 | ||||||||||||||||||||||
| Health care and social assistance | 2,689 | 8 | 1,499 | 7 | ||||||||||||||||||||||
| Real estate rental and leasing (a) | 2,365 | 7 | 1,454 | 7 | ||||||||||||||||||||||
| Accommodation & food service | 2,303 | 7 | 1,365 | 7 | ||||||||||||||||||||||
| Wholesale trade | 2,079 | 6 | 1,372 | 7 | ||||||||||||||||||||||
| Manufacturing | 1,907 | 6 | 1,151 | 6 | ||||||||||||||||||||||
| Retail trade | 1,531 | 5 | 847 | 4 | ||||||||||||||||||||||
| Other (energy, construction, professional, scientific, and technical, etc) (b) | 11,696 | 35 | 5,174 | 26 | ||||||||||||||||||||||
| Total C&I loan portfolio | $ | 33,104 | 100 | % | $ | 20,051 | 100 | % | ||||||||||||||||||
(a)
Leasing, rental of real estate, equipment, and goods.
(b)
Industries in this category each comprise less than 5% for 2020.
|
FIRST HORIZON CORPORATION
|
72
|
2020 FORM 10-K ANNUAL REPORT | ||||||
Industry Concentrations
Loan concentrations are considered to exist for a financial institution when there are loans to numerous borrowers engaged in similar activities that would cause them to be similarly impacted by economic or other conditi
ons. 26% of
FHN’s C&I loans are to mortgage companies or borrowers in the finance and insurance industry, and as a result could be affected by items that uniquely impact the financial services industry. Except “Loans to Mortgage Companies” and “Finance and Insurance”, as discussed below, on December 31, 2020, FHN did not have any other concentrations of C&I loans in any single industry of 10% or more of total loans.
Loans to Mortgage Companies
The balance of loans to mortgage companies was 16% of the C&I portfolio as of December 31, 2020, and 22% of the C&I portfolio as of December 31, 2019, and includes balances related to both home purchase and refinance activity. This portfolio class, which generally fluctuates with mortgage rates and seasonal factors, includes commercial lines of credit to qualified mortgage companies primarily for the temporary warehousing of eligible mortgage loans prior to the borrower’s sale of those mortgage loans to third party investors. Generally, lending to mortgage lenders increases when there is a decline in m
ortgage rates and decreases when rates rise. The increase in loans to mortgage companies year over year was due to higher client count, greater utilization levels and moderately larger credit lines. In 2020, approximately 40% of the loans funded were home purchases and 60% were refi
nance transactions.
Finance and Insurance
The finance and insurance component represents 10% of the C&I portfolio as of December 31, 2020 compar
ed to 14% as the end of
2019
and includes TRUPs (i.e., long-term unsecured loans to bank and insurance-related businesses), loans to bank holding companies, and asset-based lending to consumer finance companies. As of December 31, 2020, asset-based lending to
consumer finance companies represents approximately $1.2 billion of the finance and insurance component.
TRUPs lending was originally extended as a form of “bridge” financing to participants in the pooled trust preferred securitization program offered primarily to smaller banking (generally less than $15 billion in total assets) and insurance institutions through FHN’s fixed income business. Origination of TRUPs lending ceased in early 2008. Individual TRUPs are re-graded
at least quarterly as part of FHN’s commercial loan review process. The terms of these loans generally include a scheduled 30-year balloon payoff and include an option to defer interest for up to 20 consecutive quarte
rs. As of December 31, 2020, no TRUP relationship was on interest deferral. As of December 31, 2020, the UPB of trust preferred loans totaled $228 million. Inclusive of an amortizing discount on TRUPs of $18 million, total reserves (ALLL plus the amortizing discount) for TRUPs and other bank-related loans were $28 million or 12% of outstanding UPB.
Commercial Real Estate
The CRE portfolio was $12.3 billion on December 31, 2020, a $7.9 billion, or 183%, increase compared to December 31, 2019. The increase was driven primarily by the inclusion of IBKC CRE loans. The CRE portfolio includes both financings for commercial construction and nonconstruction loans.
The largest geographical concentrations of balances as of December 31, 2020, are in Florida (28%), North Carolina (12%), Louisiana (11%), Texas (11%), Tennessee (9%), and Georgia (8%) with no other state representing more than 5% of the portfolio. This portfolio contains loans and draws on lines and letters of credit to commercial real estate developers for the construction and mini-permanent financing of income-producing real estate. Subcategories of income CRE consist of multi-family (27%), office (22%), retail (19%), hospitality (11%), industrial (10%), land/land development (2%), and other (9%).
Residential CRE loans include loans to residential builders and developers for the purpose of constructing single-family homes, condominiums, and town homes, and on a limited basis, for developing residential subdivisions. After the fulfillment of existing commitments over the near term, the residential CRE class will be in a wind-down state with the expectation of full runoff in the foreseeable future.
Income-producing CRE loans are underwritten in accordance with credit policies and underwriting guidelines that are reviewed at least annually and revised as necessary based on market conditions. Loans are underwritten based upon project type, size, location, sponsorship, and other market-specific data. Generally, minimum requirements for equity, debt service coverage ratios, and level of pre-leasing activity are established based on perceived risk in each subcategory. Loan-to-value (value is defined as the lower of cost or market) limits are set below regulatory prescribed ceilings and generally range
|
FIRST HORIZON CORPORATION
|
73
|
2020 FORM 10-K ANNUAL REPORT | ||||||
between 50% and 80% depending on underlying product set. Term and amortization requirements are set based on prudent standards for interim real estate lending. Equity requirements are established based on the quality and liquidity of the primary source of repayment. For example, more equity would be required for a speculative construction project or land loan than for a property fully leased to a credit tenant or a roster of tenants. Typically, a borrower must have at least 15% of cost invested in a project before FHN will fund loan dollars. Income properties are required to achieve a debt service coverage ratio greater than or equal to 125% at inception or stabilization of the project based on loan amortization and a minimum underwriting interest rate. Some product types that possess a greater risk profile require a higher level of equity, as well as a higher debt service coverage ratio threshold. A proprietary minimum underwriting interest rate is used to calculate compliance with underwriting standards. Generally, specific levels of pre-leasing must be met for construction loans on income properties. A global cash flow analysis is performed at the sponsor level. The majority of the portfolio is on a floating rate basis tied to appropriate spreads over LIBOR.
The credit administration and ongoing monitoring consists of multiple internal control processes. Construction loans are closed and administered by a centralized control unit. Underwriters and credit approval personnel stress the borrower’s/project’s financial capacity utilizing numerous attributes such as interest rates, vacancy, and discount rates. Key information is captured from the various portfolios and then stressed at the aggregate level. Results are utilized to assist with the assessment of the adequacy of the ALLL and to steer portfolio management strategies.
Consumer Loan Portfolios
Consumer Real Estate
The consumer real estate portfolio was $11.7 billion on December 31, 2020 and is primarily composed of home equity lines and installment loans.
The largest geographical concentrations of balances as of December 31, 2020 are in Florida (31%), Tennessee (25%), Louisiana (10%), North Carolina (9%), and Texas (5%), with no other state representing more than 5% of the portfolio.
As of December 31, 2020, approximately 86% of the consumer real estate portfolio was in a first lien
position. As of December 31, 2020, the weighted average FICO score at origination of this portfolio was 753 and the refreshed FICO scores averaged 763, no significant change from FICO scores of 755 and 753, respectively, as of December 31, 2019.
Generally, performance of this portfolio is affected by life events that affect borrowers’ finances, the level of unemployment, and home prices.
As of December 31, 2020 and 2019, FHN had held-to-maturity consumer mortgage loans secured by real estate totaling $36 million and $19 million, respectively, that were in the process of foreclosure.
Home equity lines of credit comprise $2.4 billion of the consumer real estate portfolio as of December 31, 2020. FHN’s HELOCs typically have a 5 or 10 year draw period followed by a 10 or 20 year repayment period, respectively. During the draw period, a borrower is able to draw on the line and is only required to make interest payments. The line is frozen if a borrower becomes past due on payments. Once the draw period has concluded, the line is closed and the borrower is required to make both principal and interest payments monthly until the loan matures. The principal payment generally is fully amortizing, but payment amounts will adjust when variable rates reset to reflect changes in the prime rate.
As of December 31, 2020, approximately 86% of FHN's HELOCs were in the draw period compared to 76% at the end of the prior year. Based on when draw periods are scheduled to end per the line agreement, it is expected that $455 million, or 21%, of HELOCs currently in the draw period will enter the repayment period during the next 60 months. Generally, delinquencies for HELOCs that have entered the repayment period are initially higher than HELOCs still in the draw period because of the increased minimum payment requirement; however, after some seasoning, performance of these loans usually begins to stabilize. The home equity lines of the consumer real estate portfolio are monitored closely for those nearing the end of the draw period and borrowers are initially contacted at least 6 months before the repayment period begins to remind the client of the terms of their agreement and to inform them of options.
The following table shows the HELOCs currently in the draw period and expected timing of conversion to the repayment period.
|
FIRST HORIZON CORPORATION
|
74
|
2020 FORM 10-K ANNUAL REPORT | ||||||
Table 17—HELOC Draw To Repayment Schedule
| December 31, 2020 | December 31, 2019 | |||||||||||||||||||||||||
| (Dollars in millions) |
Repayment
Amount |
Percent |
Repayment
Amount |
Percent | ||||||||||||||||||||||
| Months remaining in draw period: | ||||||||||||||||||||||||||
| 0-12 | $ | 73 | 4 | % | $ | 47 | 5 | % | ||||||||||||||||||
| 13-24 | 66 | 3 | 59 | 6 | ||||||||||||||||||||||
| 25-36 | 62 | 3 | 66 | 7 | ||||||||||||||||||||||
| 37-48 | 67 | 3 | 68 | 7 | ||||||||||||||||||||||
| 49-60 | 187 | 8 | 75 | 7 | ||||||||||||||||||||||
| >60 | 1,662 | 79 | 666 | 68 | ||||||||||||||||||||||
| Total | $ | 2,117 | 100 | % | $ | 981 | 100 | % | ||||||||||||||||||
Underwriting
For the majority of loans in this portfolio, underwriting decisions are made through a centralized loan underwriting center. To obtain a consumer real estate loan, the loan applicant(s) in most cases must first meet a minimum qualifying FICO score. Minimum FICO score requirements are established by management for both loans secured by real estate as well as non-real estate loans. Management also establishes maximum loan amounts, loan-to-value ratios, and debt-to-income ratios for each consumer real estate product. Applicants must have the financial capacity (or available income) to service the debt by not exceeding a calculated debt-to-income ratio. The amount of the loan is limited to a percentage of the lesser of the current appraised value or sales price of the collateral. Identified guideline and policy exceptions require established mitigating factors that have been approved for use by Credit Risk Management.
HELOC interest rates are variable and adjust with movements in the index rate stated in the loan agreement. Such loans can have elevated risks of default, particularly in a rising interest rate environment, potentially stressing borrower capacity to repay the loan at the higher interest rate. FHN’s current underwriting practice requires HELOC borrowers to qualify based on a sensitized interest rate (above the current note rate), fully amortized payment methodology. FHN’s underwriting guidelines require borrowers to qualify at an interest rate that is 200 basis points above the note rate. This mitigates risk to FHN in the event of a sharp rise in interest rates over a relatively short time horizon.
HELOC Portfolio Risk Management
FHN performs continuous HELOC account reviews in order to identify higher-risk home equity lines and initiate preventative and corrective actions. The reviews consider a number of account activity patterns and characteristics such as the number of times delinquent within recent periods, changes in credit bureau score since origination, score degradation, performance of the first lien, and account utilization. In accordance with FHN’s interpretation of regulatory guidance, FHN may block future draws on accounts in order to mitigate risk of loss to FHN.
Credit Card and Other
Driven by acquired IBKC loans, FHN's credit card and other portfolio increased $632 million from the prior year-end to $1.1 billion as of December 31, 2020, and primarily includes consumer-related credits, including home equity and other personal consumer loans, credit card receivables, and automobile loans.
Allowance for Loan and Lease Losses
Effective January 1, 2020, FHN adopted the provisions of ASU 2016-13, "Measurement of Credit Losses on Financial Instruments," and related ASUs. Refer to Note 1 - Significant Accounting Policies for additional information about the standard and its impact on FHN.
Management’s policy is to maintain the ALLL at a level sufficient
to recognize current expected credit losses on the amortized cost basis of the loan
portfolio. The total allowance for loan and lease losses increased to $963 million on December 31,
|
FIRST HORIZON CORPORATION
|
75
|
2020 FORM 10-K ANNUAL REPORT | ||||||
2020, or 1.65% of total loans and leases, an increase of $763 million or 101 basis points from the end of 2019. The ALLL as of December 31, 2020 and the increase in the ALLL from 2019 reflects the adoption of ASU 2016-13, the steep decline in the economic forecast attributable to the COVID-19 pandemic, an initial allowance on acquired PCD loans of $287 million, and $147 million recognized on acquired non-PCD loans from the IBKC merger and Truist branch acquisition.
The provision for loan and lease losses is the charge to (or release of) earnings necessary to maintain the ALLL at a sufficient level reflecting management’s estimate of current expected losses on the amortized cost basis of the loan portfolio. Provision expense was $489 million in 2020 compared to $47 million in 2019. The increase is primarily attributable to a $147 million provision for non-PCD assets acquired in the IBKC merger and Truist Bank branch acquisition, as well as from the decline in the economic forecast attributable to the COVID-19 pandemic.
Asset quality trends may be impacted by the economic uncertainty attributable to the COVID-19 pandemic. The C&I portfolio reflects a broad mix of categories with the heaviest concentration in loans to mortgage companies which carry minimal credit risk. The C&I portfolio as of December 31, 2020 includes $4.1 billion of loans made under the Paycheck Protection Program of the SBA. PPP loans are fully government guaranteed with the SBA. Due to the government guarantee and forgiveness provisions, PPP loans are considered to have no credit risk. The CRE portfolio metrics could be impacted by the COVID-19 pandemic due to travel and occupancy restrictions set by state and local governments affecting CRE- Hospitality and CRE-Retail. The consumer portfolio could be impacted by the COVID-19 pandemic if consumer unemployment continues to remain elevated and clients are unable to continue making loan payments. The consumer portfolio, however, is high quality with no subprime exposure and minimal exposure to other traditional categories of high-risk lending.
Net Charge-offs
Net charge-offs were $120 million in 2020 compared to $27 million in 2019. Net charge-offs in 2020 exclude loans that were immediately charged-off (with an associated reduction in the allowance) that relate to acquired IBKC loans that had been written off prior to acquisition (whether full or partial), or which met FHN's charge-off policy at the time of acquisition. See Note 5 - Allowance for Credit Losses for additional information.
Net charge-offs in the C&I portfolio were $120 million, an increase of $93 million from 2019, driven by higher energy charge-offs in the current year. Net charge-offs in the commercial real estate portfolio were minimal. In the consumer portfolio, net recoveries for both the current and prior year were minimal, as net recoveries in the consumer real estate portfolio of $10 million were offset by net charge-offs in the credit card and other portfolio of $9 million.
|
FIRST HORIZON CORPORATION
|
76
|
2020 FORM 10-K ANNUAL REPORT | ||||||
Table 18—Analysis of Allowance for Loan and Lease Losses and Charge-offs
| December 31 | |||||||||||||||||||||||
| (Dollars in millions) | 2020 | 2019 | 2018 | ||||||||||||||||||||
| Allowance for loan and lease losses (a) | |||||||||||||||||||||||
| C&I | $ | 453 | $ | 123 | $ | 99 | |||||||||||||||||
| CRE | 242 | 36 | 31 | ||||||||||||||||||||
| Consumer Real Estate | 242 | 28 | 37 | ||||||||||||||||||||
| Credit Card & Other | 26 | 13 | 13 | ||||||||||||||||||||
| Total allowance for loan and lease losses | $ | 963 | $ | 200 | $ | 180 | |||||||||||||||||
| Period-end loans and leases (b) | |||||||||||||||||||||||
| C&I | $ | 33,104 | $ | 20,051 | $ | 16,514 | |||||||||||||||||
| CRE | 12,275 | 4,337 | 4,031 | ||||||||||||||||||||
| Consumer Real Estate | 11,725 | 6,177 | 6,472 | ||||||||||||||||||||
| Credit Card & Other | 1,128 | 496 | 519 | ||||||||||||||||||||
| Total period-end loans and leases | $ | 58,232 | $ | 31,061 | $ | 27,536 | |||||||||||||||||
| ALLL / loans and leases % (a) | |||||||||||||||||||||||
| C&I | 1.37 | % | 0.62 | % | 0.60 | % | |||||||||||||||||
| CRE | 1.97 | % | 0.83 | % | 0.78 | % | |||||||||||||||||
| Consumer Real Estate | 2.07 | % | 0.45 | % | 0.58 | % | |||||||||||||||||
| Credit Card & Other | 2.34 | % | 2.68 | % | 2.46 | % | |||||||||||||||||
| Total ALLL / loans and leases % | 1.65 | % | 0.64 | % | 0.66 | % | |||||||||||||||||
| Net charge-offs (recoveries) | |||||||||||||||||||||||
| C&I | $ | 120 | $ | 27 | $ | 11 | |||||||||||||||||
| CRE | 1 | 1 | — | ||||||||||||||||||||
| Consumer Real Estate | (10) | (12) | (11) | ||||||||||||||||||||
| Credit Card & Other | 9 | 11 | 16 | ||||||||||||||||||||
| Total net charge-offs | $ | 120 | $ | 27 | $ | 16 | |||||||||||||||||
| Average loans and leases (b) | |||||||||||||||||||||||
| C&I | $ | 27,638 | $ | 18,283 | $ | 15,873 | |||||||||||||||||
| CRE | 8,508 | 4,102 | 4,206 | ||||||||||||||||||||
| Consumer Real Estate | 9,191 | 6,299 | 6,582 | ||||||||||||||||||||
| Credit Card & Other | 846 | 505 | 553 | ||||||||||||||||||||
| Total average loans and leases | $ | 46,183 | $ | 29,189 | $ | 27,214 | |||||||||||||||||
| Charge-off % | |||||||||||||||||||||||
| C&I | 0.43 | % | 0.15 | % | 0.07 | % | |||||||||||||||||
| CRE | 0.01 | % | 0.02 | % | 0.01 | % | |||||||||||||||||
| Consumer Real Estate | NM | NM | NM | ||||||||||||||||||||
| Credit Card & Other | 1.04 | % | 2.25 | % | 2.83 | % | |||||||||||||||||
| Total charge-off % | 0.26 | % | 0.09 | % | 0.06 | % | |||||||||||||||||
| ALLL / net charge-offs | |||||||||||||||||||||||
| C&I | 3.76 | x | 4.53 | x | 8.76 | x | |||||||||||||||||
| CRE | 436.70 | x | 52.13 | x | 70.47 | x | |||||||||||||||||
|
FIRST HORIZON CORPORATION
|
77
|
2020 FORM 10-K ANNUAL REPORT | ||||||
| Consumer Real Estate | N/M | N/M | N/M | ||||||||||||||||||||
| Credit Card & Other | 2.99 | x | 1.17 | x | 0.81 | x | |||||||||||||||||
| Total ALLL / net charge-offs | 8.08 | x | 7.39 | x | 11.18 | x | |||||||||||||||||
| ALLL / NPLs | |||||||||||||||||||||||
| C&I | 3.15 | x | 1.66 | x | 2.47 | x | |||||||||||||||||
| CRE | 4.15 | x | 19.73 | x | 10.47 | x | |||||||||||||||||
| Consumer Real Estate | 1.33 | x | 0.33 | x | 0.36 | x | |||||||||||||||||
| Credit Card & Other | 13.13 | x | 38.92 | x | 20.40 | x | |||||||||||||||||
| Total ALLL / NPLs | 2.49 | x | 1.24 | x | 1.22 | x | |||||||||||||||||
NM - not meaningful
(a)
The increase in the ALLL in 2020 is attributable to the adoption of ASU 2016-13, the allowance recorded on acquired non-PCD loans, and the decline in the economic forecast attributable to the COVID-19 pandemic.
(b)
The increase in period-end and average loans and leases in 2020 is primarily the result of $26.3 billion in acquired loans and leases.
|
FIRST HORIZON CORPORATION
|
78
|
2020 FORM 10-K ANNUAL REPORT | ||||||
Nonperforming Assets
Nonperforming loans are loans placed on nonaccrual if it becomes evident that full collection of principal and interest is at risk, if impairment has been recognized as a partial charge-off of principal balance due to insufficient collateral value and past due status, or (on a case-by-case basis), if FHN continues to receive payments but there are other borrower-specific issues. Included in nonaccruals are loans that FHN continues to receive payments, including residential real estate loans where the borrower has been discharged of personal obligation through bankruptcy. Nonperforming loans, along with OREO (excluding OREO from government insured mortgages), represent nonperforming assets.
Driven by acquired NPAs, total NPAs (including NPLs HFS) increased $224 million to $406 million on December 31, 2020. The nonperforming assets ratio
(nonperforming assets excluding NPLs HFS to total period-end loans plus OREO and other assets) was 0.69% as of December 31, 2020, a 12 basis point increase compared to 0.57% as of December 31, 2019. The increase in nonperforming loans was driven primarily by the C&I and consumer real estate portfolios.
The ratio of the ALLL to NPLs was 2.49 times as of December 31, 2020, compared to 1.24 times as of December 31, 2019. Certain nonperforming loans in both the commercial and consumer portfolios are deemed collateral-dependent and are charged down to an estimate of collateral value less costs to sell. Because the estimated loss has been recognized through a partial charge-off, typically an ALLL is not recorded.
Table 19—Nonaccrual/Nonperforming Loans, Foreclosed Assets, and Other Disclosures (a) (b)
| December 31 | |||||||||||||||||||||||
| (Dollars in millions) | 2020 | 2019 | 2018 | ||||||||||||||||||||
| Period-end loans and leases | |||||||||||||||||||||||
| C&I | $ | 33,104 | $ | 20,051 | $ | 16,514 | |||||||||||||||||
| CRE | 12,275 | 4,337 | 4,031 | ||||||||||||||||||||
| Consumer Real Estate | 11,725 | 6,177 | 6,472 | ||||||||||||||||||||
| Credit Card & Other | 1,128 | 496 | 519 | ||||||||||||||||||||
| Total period-end loans and leases | $ | 58,232 | $ | 31,061 | $ | 27,536 | |||||||||||||||||
| Remaining unfunded commitments | $ | 20,796 | $ | 12,355 | $ | 10,885 | |||||||||||||||||
| Average loans and leases, net of unearned income | $ | 46,183 | $ | 29,189 | $ | 27,214 | |||||||||||||||||
| Nonperforming loans and leases | |||||||||||||||||||||||
| C&I | $ | 144 | $ | 74 | $ | 40 | |||||||||||||||||
| CRE | 58 | 2 | 3 | ||||||||||||||||||||
| Consumer Real Estate | 182 | 86 | 104 | ||||||||||||||||||||
| Credit Card & Other | 2 | — | 1 | ||||||||||||||||||||
| Total nonperforming loans and leases (c) (d) | $ | 386 | $ | 162 | $ | 148 | |||||||||||||||||
| Nonperforming loans held-for-sale (d) | $ | 5 | $ | 4 | $ | 5 | |||||||||||||||||
| Foreclosed real estate and other assets (e) | 15 | 16 | 22 | ||||||||||||||||||||
| Total nonperforming assets (d) (f) | $ | 406 | $ | 182 | $ | 175 | |||||||||||||||||
| NPL % | |||||||||||||||||||||||
| C&I | 0.43 | % | 0.37 | % | 0.24 | % | |||||||||||||||||
| CRE | 0.48 | % | 0.04 | % | 0.07 | % | |||||||||||||||||
| Consumer Real Estate | 1.56 | % | 1.39 | % | 1.61 | % | |||||||||||||||||
| Credit Card & Other | 0.18 | % | 0.07 | % | 0.12 | % | |||||||||||||||||
| Total NPL % | 0.66 | % | 0.52 | % | 0.54 | % | |||||||||||||||||
|
FIRST HORIZON CORPORATION
|
79
|
2020 FORM 10-K ANNUAL REPORT | ||||||
| Accruing restructured loans and leases (g) | |||||||||||||||||||||||
| C&I | $ | 77 | $ | 10 | $ | 13 | |||||||||||||||||
| CRE | 6 | — | 1 | ||||||||||||||||||||
| Consumer Real Estate | 79 | 110 | 128 | ||||||||||||||||||||
| Credit Card & Other | — | 1 | 1 | ||||||||||||||||||||
| Total accruing restructured loans | $ | 162 | $ | 121 | $ | 143 | |||||||||||||||||
| Nonaccruing restructured loans and leases (g) (h) | |||||||||||||||||||||||
| C&I | $ | 66 | $ | 32 | $ | 24 | |||||||||||||||||
| CRE | 18 | 1 | — | ||||||||||||||||||||
| Consumer Real Estate | 61 | 52 | 62 | ||||||||||||||||||||
| Credit Card & Other | — | — | — | ||||||||||||||||||||
| Total nonaccruing restructured loans and leases | $ | 145 | $ | 85 | $ | 86 | |||||||||||||||||
| 30+ Delinquency (accruing) | |||||||||||||||||||||||
| C&I | $ | 15 | $ | 9 | $ | 11 | |||||||||||||||||
| CRE | 23 | 1 | 2 | ||||||||||||||||||||
| Consumer Real Estate | 69 | 43 | 54 | ||||||||||||||||||||
| Credit Card & Other | 10 | 5 | 8 | ||||||||||||||||||||
| Total 30+ Delinquency | $ | 117 | $ | 58 | $ | 75 | |||||||||||||||||
| 30+ Delinq. % (a) | |||||||||||||||||||||||
| C&I | 0.05 | % | 0.05 | % | 0.06 | % | |||||||||||||||||
| CRE | 0.19 | % | 0.02 | % | 0.06 | % | |||||||||||||||||
| Consumer Real Estate | 0.58 | % | 0.70 | % | 0.83 | % | |||||||||||||||||
| Credit Card & Other | 0.87 | % | 0.93 | % | 1.63 | % | |||||||||||||||||
| Total 30+ Delinquency % | 0.20 | % | 0.19 | % | 0.27 | % | |||||||||||||||||
(a)
Balances for 2019 and 2018 do not include PCI loans even though the client may be contractually past due. PCI loans were recorded at fair value upon acquisition and accrete interest income over the remaining life of the loan. PCI loans were transitioned to PCD status upon adoption of CECL.
(b)
Unless otherwise noted, increases in balances from 2019 to 2020 were primarily driven by acquired nonperforming assets. The 2019 increase over 2018 was driven by three relationships transferring to nonaccrual.
(c)
Under the original terms of the loans, estimated interest income would have been approximately $18 million, $11 million, and $9 million during 2020, 2019 and 2018, respectively.
(d)
Excludes loans and leases that are 90 or more days past due and still accruing interest.
(e)
Foreclosed real estate from GNMA loans totaled $2 million, $2 million, and $3 million at December 31, 2020, 2019, and 2018, respectively.
(f)
Balances do not include government-insured foreclosed real estate. Balances for 2019 and 2018 also do not include PCI loans. PCI loans were transitioned to PCD status upon adoption of CECL.
(g)
Excludes TDRs that are classified as held for sale, nearly all of which are accounted for under the fair value option.
(h)
Amounts also included in nonperforming loans above.
|
FIRST HORIZON CORPORATION
|
80
|
2020 FORM 10-K ANNUAL REPORT | ||||||
Nonperforming C&I loans increased $70 million from December 31, 2019, to $144 million on December 31, 2020, while the NPL ratio increased 6 basis points to 0.43% of C&I loans, primarily driven by acquired NPLs from IBKC. The 30+ delinquency ratio was 0.05% of total loans as of both December 31, 2020 and 2019. Net charge-offs were $120 million in 2020, $93 million higher than in 2019, primarily driven by losses in the energy portfolio.
In the
CRE portfolio, nonperforming loans were up $56 million from December 31, 2019. Nonperforming loans as a percentage of total CRE loans increased 44 basis points from 2019 to 0.48% as of December 31, 2020. Accruing delinquencies as a percentage of period-end loans increased 17 basis points to 0.19% as of December 31, 2020 as total accruing delinquencies increased $22 million. Net charge-offs were minimal in both 2020 and 2019.
Overall, performance of the consumer real estate portfolio remained stable in 2020 despite slight deterioration in some metrics compared to prior year. While NPLs were up 17 basis points from the prior year, 30+ delinquencies were down 12 basis points from December 31, 2019. Driven by acquired loans, no
nperf
orming loans increased $96 million from the end of 2019 to $182 million on December 31, 2020. Loans delinquent 30 or more days and still accruing increased $26 million to $69 million as of December 31, 2020. The portfolio realized net recoveries of $10 million in 2020 compared to net recoveries of $12 million in 2019.
Similar to the consumer real estate portfolio, asset quality in the credit card and other consumer loan portfolio remained stable in 2020. Despite an uptick in the NPL%, 30+ delinquencies decreased to 0.87% of total loans as of December 31, 2020.
|
FIRST HORIZON CORPORATION
|
81
|
2020 FORM 10-K ANNUAL REPORT | ||||||
The following table provides nonperforming assets by business segment:
Table 20—Nonperforming Assets by Segment
| December 31 | |||||||||||||||||||||||
| (Dollars in millions) | 2020 | 2019 | 2018 | ||||||||||||||||||||
| Nonperforming loans and leases (a) (b) | |||||||||||||||||||||||
| Regional Banking | $ | 216 | $ | 45 | $ | 42 | |||||||||||||||||
| Specialty Banking | 117 | 68 | 37 | ||||||||||||||||||||
| Corporate | 53 | 49 | 69 | ||||||||||||||||||||
| Consolidated | $ | 386 | $ | 162 | $ | 148 | |||||||||||||||||
| Foreclosed real estate (c) | |||||||||||||||||||||||
| Regional Banking | $ | 12 | $ | 12 | $ | 18 | |||||||||||||||||
| Specialty Banking | 1 | 1 | — | ||||||||||||||||||||
| Corporate | 2 | 3 | 4 | ||||||||||||||||||||
| Consolidated | $ | 15 | $ | 16 | $ | 22 | |||||||||||||||||
| Nonperforming Assets (a) (b) (c) | |||||||||||||||||||||||
| Regional Banking | $ | 228 | $ | 57 | $ | 60 | |||||||||||||||||
| Specialty Banking | 118 | 69 | 37 | ||||||||||||||||||||
| Corporate | 55 | 52 | 73 | ||||||||||||||||||||
| Consolidated | $ | 401 | $ | 178 | $ | 170 | |||||||||||||||||
| NPL % | |||||||||||||||||||||||
| Regional Banking | 0.54 | % | 0.27 | % | 0.27 | % | |||||||||||||||||
| Specialty Banking | 0.68 | 0.51 | 0.35 | ||||||||||||||||||||
| Corporate | 5.70 | 5.22 | 5.64 | ||||||||||||||||||||
| Consolidated | 0.66 | % | 0.52 | % | 0.54 | % | |||||||||||||||||
| NPA % (d) | |||||||||||||||||||||||
| Regional Banking | 0.57 | % | 0.34 | % | 0.38 | % | |||||||||||||||||
| Specialty Banking | 0.68 | 0.52 | 0.35 | ||||||||||||||||||||
| Corporate | 5.87 | 5.48 | 5.94 | ||||||||||||||||||||
| Consolidated | 0.69 | % | 0.57 | % | 0.62 | % | |||||||||||||||||
Certain previously reported amounts have been reclassified to agree with current presentation.
(a)
Excludes loans and leases that are 90 or more days past due and still accruing interest.
(b)
Excludes loans classified as held for sale.
(c)
Excludes foreclosed real estate and receivables related to government insured mortgages of $5 million, $10 million, $3 million during 2020, 2019, and 2018, respectively.
(d)
Ratio is non-performing assets related to the loan and lease portfolio to total loans plus foreclosed real estate and other assets.
|
FIRST HORIZON CORPORATION
|
82
|
2020 FORM 10-K ANNUAL REPORT | ||||||
The following table provides an activity rollforward of OREO balances for December 31, 2020 and 2019. The balance of OREO, exclusive of inventory from government insured mortgages, decreased $1 million to $15 million as of December 31, 2020, as acquired OREO from IBKC was offset by disposals during the year.
Table 21—Rollforward of OREO
| (Dollars in millions) | 2020 | 2019 | ||||||||||||
| Beginning balance, January 1 | $ | 16 | $ | 22 | ||||||||||
| Acquired | 9 | — | ||||||||||||
| Valuation adjustments | (1) | (1) | ||||||||||||
| New foreclosed property | 2 | 9 | ||||||||||||
| Disposals | (11) | (14) | ||||||||||||
| Ending balance, December 31 (a) | $ | 15 | $ | 16 | ||||||||||
(a)
Excludes OREO and receivables related to government insured mortgages of $5 million and $10 million as of December 31, 2020 and 2019, respectively.
Past Due Loans and Potential Problem Assets
Past due loans are loans contractually past due as to interest or principal payments, but which have not yet been put on nonaccrual status. In accordance with revised Interagency Guidance issued in 2020, FHN is not required to designate loans with deferrals granted in response to COVID-19 as past due because of such deferrals. If a borrower defers payment, this may result in no contractual payments being past due, and as such, loans would not be considered past due during the period of deferral, and as a result, are excluded from the table and discussion that follows. For additional information on borrower deferrals, see Lending Assistance for Borrowers in the Market Uncertainties and Prospective Trends section of this Report.
Loans in the portfolio that are 90 days or more past due and still accruing were $17 million on December 31, 2020, a decrease of $5 million compared to December 31, 2019. Loans 30 to 89 days past due increased $64 million from year-end 2019 to $100 million on December 31, 2020. The
increase was driven by acquired loans, most notably in the CRE and consumer real estate portfolios.
Potential problem assets represent those assets where information about possible credit problems of borrowers has caused management to have serious doubts about the borrower’s ability to comply with present repayment terms and includes loans past due 90 days or more and still accruing. This definition is believed to be substantially consistent with the standards established by the
Federal banking regulators
for loans classified as substandard. At year-end 2020, potential problem assets in the loan portfolio increased $371 million from December 31, 2019 and $20 million from September 30, 2020 to $718 million on December 31, 2020. The increase year-over-year in potential problem assets was due to acquired loans in 2020 and a net increase in classified commercial loans within the C&I portfolio. The current expectation of losses from potential problem assets has been included in management’s analysis for assessing the adequacy of the allowance for loan and lease losses.
|
FIRST HORIZON CORPORATION
|
83
|
2020 FORM 10-K ANNUAL REPORT | ||||||
Table 22—Accruing Delinquencies and Other Credit Disclosures
| December 31 | |||||||||||||||||||||||
| (Dollars in millions) | 2020 | 2019 | 2018 | ||||||||||||||||||||
| Loans past due 90 days or more and still accruing (a) (b): | |||||||||||||||||||||||
| Commercial: | |||||||||||||||||||||||
| Commercial, financial, and industrial | $ | — | $ | 2 | $ | 2 | |||||||||||||||||
| Commercial real estate | — | — | 2 | ||||||||||||||||||||
| Total commercial | — | 2 | 4 | ||||||||||||||||||||
| Consumer: | |||||||||||||||||||||||
| Consumer real estate | 16 | 18 | 27 | ||||||||||||||||||||
| Credit card & other | 1 | 2 | 2 | ||||||||||||||||||||
| Total consumer | 17 | 20 | 29 | ||||||||||||||||||||
| Total loans past due 90 days or more and still accruing (a) (b) | $ | 17 | $ | 22 | $ | 33 | |||||||||||||||||
| Loans 30 to 89 days past due | $ | 100 | $ | 36 | $ | 43 | |||||||||||||||||
| Loans 30 to 89 days past due - guaranteed portion (c) | — | — | — | ||||||||||||||||||||
| Loans held-for-sale 30 to 89 days past due (b) | 6 | 4 | 6 | ||||||||||||||||||||
| Loans held-for-sale 30 to 89 days past due - guaranteed portion (b) (c) | 5 | 3 | 5 | ||||||||||||||||||||
| Loans held-for-sale 90 days past due (b) | 12 | 6 | 7 | ||||||||||||||||||||
| Loans held-for-sale 90 days past due - guaranteed portion (b) (c) | 10 | 6 | 7 | ||||||||||||||||||||
| Potential problem assets (d) | $ | 718 | $ | 347 | $ | 317 | |||||||||||||||||
(a)
Excludes loans classified as held for sale.
(b)
Amounts are not included in nonperforming/nonaccrual loans.
(c)
Guaranteed loans include FHA, VA, and GNMA loans repurchased through the GNMA buyout program.
(d)
Includes past due loans.
Troubled Debt Restructuring and Loan Modifications
As part of FHN’s ongoing risk management practices, FHN attempts to work with borrowers when appropriate to extend or modify loan terms to better align with their current ability to repay. Extensions and modifications to loans are made in accordance with internal policies and guidelines which conform to regulatory guidance. Each occurrence is unique to the borrower and is evaluated separately. In a situation where an economic concession has been granted to a borrower that is experiencing financial difficulty, FHN identifies and reports that loan as a TDR.
For loan modifications that were made during the year ended December 31, 2020 that met the TDR relief provisions outlined in either the CARES Act, as extended by the CAA, or revised Interagency Guidance, FHN has excluded these modifications from consideration as a TDR, and has excluded loans with these qualifying modifications from designation as a TDR in the information and discussion that follows. See Note 1 - Significant Accounting Policies
and Note 4 – Loans and Leases for further discussion regarding TDRs and loan modifications.
Commercial Loan Modifications
As part of FHN’s credit risk management governance processes, the Loan Rehab and Recovery Department (LRRD) is responsible for managing most commercial relationships with borrowers whose financial condition has deteriorated to such an extent that the credits are being considered for impairment, classified as substandard or worse, placed on nonaccrual status, foreclosed or in process of foreclosure, or in active or contemplated litigation. LRRD has the authority and responsibility to enter into workout and/or rehabilitation agreements with troubled commercial borrowers in order to mitigate and/or minimize the amount of credit losses recognized from these problem assets. While every circumstance is different, LRRD will generally use forbearance agreements (generally 6-12 months) as an element of commercial loan workouts, which might include reduced interest rates, reduced payments, release of guarantor, or entering into short sale agreements.
|
FIRST HORIZON CORPORATION
|
84
|
2020 FORM 10-K ANNUAL REPORT | ||||||
The individual impairment assessments completed on commercial loans in accordance with the Accounting Standards Codification Topic related to Troubled Debt Restructurings (“ASC 310-40”) include loans classified as TDRs as well as loans that may have been modified yet not classified as TDRs by management. For example, a modification of loan terms that management would generally not consider to be a TDR could be a temporary extension of maturity to allow a borrower to complete an asset sale whereby the proceeds of such transaction are to be paid to satisfy the outstanding debt. Additionally, a modification that extends the term of a loan but does not involve reduction of principal or accrued interest, in which the interest rate is adjusted to reflect current market rates for similarly situated borrowers, is not considered a TDR. Nevertheless, each assessment will take into account any modified terms and will be comprehensive to ensure appropriate impairment assessment. If individual impairment is identified, management will either hold specific reserves on the amount of impairment, or, if the loan is collateral dependent, write down the carrying amount of the asset to the net realizable value of the collateral.
Consumer Loan Modifications
FHN does not currently participate in any of the loan modification programs sponsored by the U.S. government but does generally structure modified consumer loans using the parameters of the former Home Affordable Modification Program. Generally, a majority of loans modified under any such proprietary programs are classified as TDRs.
Within the HELOC and RE installment loans classes of the consumer portfolio segment, TDRs are typically modified by reducing the interest rate (in increments of 25 basis points to a minimum of 1% for up to 5 years) and a possible maturity date extension to reach an affordable housing debt-to-income ratio. After 5 years, the interest rate generally returns to the original interest rate prior to modification; for certain modifications, the modified interest rate increases 2% per year until the original interest rate prior to modification is achieved. Permanent mortgage TDRs are typically modified by reducing the interest rate (in increments of 25 basis points to a minimum of 2% for up to 5 years) and a possible maturity date extension to reach an affordable housing debt-to-income ratio. After 5 years, the interest rate steps up 1 percent every year until it reaches the Federal Home Loan Mortgage Corporation Weekly Survey Rate cap. Contractual maturities may be extended to 40 years on permanent mortgages and to 30 years for consumer real estate loans. Within the credit card class of the consumer portfolio segment, TDRs are typically modified through either a short-term credit card hardship program or a longer-term credit card
workout program. In the credit card hardship program, borrowers may be granted rate and payment reductions for 6 months to 1 year. In the credit card workout program, clients are granted a rate reduction to 0% and term extensions for up to 5 years to pay off the remaining balance.
Following classification as a TDR, modified loans within the consumer portfolio, which were previously evaluated for impairment on a collective basis determined by their smaller balances and homogenous nature, become subject to the impairment guidance in ASC 310-10-35, which requires individual evaluation of the debt for impairment. However, as applicable accounting guidance allows, FHN may aggregate certain smaller-balance homogeneous TDRs and use historical statistics, such as aggregated charge-off amounts and average amounts recovered, along with a composite effective interest rate to measure impairment when such impaired loans have risk characteristics in common.
On December 31, 2020 and 2019, FHN had $307 million and $206 million portfolio loans classified as TDRs, respectively. For TDRs in the loan portfolio, FHN had loan loss reserves of $12 million and $20 million, or 4% and 10% of TDR balances, as of December 31, 2020 and 2019, respectively. Additionally, FHN had $42 million and $51 million of HFS loans classified as TDRs at year-end 2020 and 2019, respectively. Total held-to-maturity TDRs increased $101 million, with the increase attributable to the addition of IBKC TDRs in the current year, primarily in the commercial portfolio.
|
FIRST HORIZON CORPORATION
|
85
|
2020 FORM 10-K ANNUAL REPORT | ||||||
The following table provides a summary of TDRs for the periods ended December 31, 2020 and 2019. In accordance with regulatory guidance, loans that were modified during the year ended December 31, 2020 whose modifications met criteria outlined in either the CARES Act or revised interagency statement were not accounted for as a TDR and have been excluded from the table below.
Table 23 —Troubled Debt Restructurings
| (Dollars in millions) |
As of
December 31, 2020 |
As of
December 31, 2019 |
||||||||||||
| Held to maturity: | ||||||||||||||
| Consumer real estate (a): | ||||||||||||||
| Current | $ | 77 | $ | 105 | ||||||||||
| Delinquent | 2 | 5 | ||||||||||||
| Non-accrual (b) | 61 | 52 | ||||||||||||
| Total consumer real estate | 140 | 162 | ||||||||||||
| Credit card and other: | ||||||||||||||
| Current | 1 | 1 | ||||||||||||
| Delinquent | — | — | ||||||||||||
| Non-accrual | — | — | ||||||||||||
| Total credit card and other | 1 | 1 | ||||||||||||
| Commercial loans: | ||||||||||||||
| Current | 82 | 10 | ||||||||||||
| Delinquent | — | — | ||||||||||||
| Non-accrual | 84 | 33 | ||||||||||||
| Total commercial loans | 166 | 43 | ||||||||||||
| Total held to maturity | $ | 307 | $ | 206 | ||||||||||
| Held for sale: | ||||||||||||||
| Current | $ | 36 | $ | 39 | ||||||||||
| Delinquent | 5 | 8 | ||||||||||||
| Non-accrual | 1 | 4 | ||||||||||||
| Total held for sale | 42 | 51 | ||||||||||||
| Total troubled debt restructurings | $ | 349 | $ | 257 | ||||||||||
(a)
In 2020, the permanent mortgage portfolio was combined into the consumer real estate portfolio. All prior periods have been revised for comparability.
(b)
Balances as of December 31, 2020 and 2019, include $11 million and $13 million, respectively, of discharged bankruptcies.
|
FIRST HORIZON CORPORATION
|
86
|
2020 FORM 10-K ANNUAL REPORT | ||||||
RISK MANAGEMENT
FHN derives revenue from providing services and, in many cases, assuming and managing risk for profit which exposes FHN to business strategy and reputational, interest rate, liquidity, market, capital adequacy, operational, compliance, and credit risks that require ongoing oversight and management. FHN has an enterprise-wide approach to risk governance, measurement, management, and reporting including an economic capital allocation process that is tied to risk profiles used to measure risk-adjusted returns. Through an enterprise-wide risk governance structure and a statement of risk tolerance approved by the Board, management continually evaluates the balance of risk/return and earnings volatility with shareholder value.
FHN’s enterprise-wide risk governance structure begins with the Board. The Board, working with the Executive & Risk Committee of the Board, establishes FHN’s risk tolerance by approving policies and limits that provide standards for the nature and the level of risk FHN is willing to assume. The Board regularly receives reports on management’s performance against FHN’s risk tolerance primarily through the Board’s Executive & Risk and Audit Committees.
To further support the risk governance provided by the Board, FHN has established accountabilities, control processes, procedures, and a management governance structure designed to align risk management with risk-taking throughout FHN. The control procedures are aligned with FHN’s four components of risk governance: (1) Specific Risk Committees; (2) the Risk Management Organization; (3) Business Unit Risk Management; and (4) Independent Assurance Functions.
1.
Specific Risk Committees: The Board has delegated authority to the Chief Executive Officer to manage Business Strategy and Reputation Risk, and the general business affairs of FHN under the Board’s oversight. The CEO utilizes the executive management team and the Management Risk Committee to carry out these duties and to analyze existing and emerging strategic and reputation risks and determines the appropriate course of action. The Management Risk Committee is comprised of the CEO and certain officers designated by the CEO. The Management Risk Committee is supported by a set of specific risk committees focused on unique risk types (e.g. liquidity,
credit, operational, etc). These risk committees provide a mechanism that assembles the necessary expertise and perspectives of the management team to discuss emerging risk issues, monitor FHN’s risk-taking activities, and evaluate specific transactions and exposures. These committees also monitor the direction and trend of risks relative to business strategies and market conditions and direct management to respond to risk issues.
2.
The Risk Management Organization: FHN’s risk management organization, led by the Chief Risk Officer and Chief Credit Officer, provides objective oversight of risk-taking activities. The risk management organization translates FHN’s overall risk tolerance into approved limits and formal policies and is supported by corporate staff functions, including the Corporate Secretary, Legal, Finance, Human Resources, and Technology. Risk management also works with business units and functional experts to establish appropriate operating standards and monitor business practices in relation to those standards. Additionally, risk management proactively works with business units and senior management to focus management on key risks in FHN and emerging trends that may change FHN’s risk profile. The Chief Risk Officer has overall responsibility and accountability for enterprise risk management and aggregate risk reporting.
3.
Business Unit Risk Management: FHN’s business units are responsible for identifying, acknowledging, quantifying, mitigating, and managing all risks arising within their respective units. They determine and execute their business strategies, which puts them closest to the changing nature of risks and they are best able to take the needed actions to manage and mitigate those risks. The business units are supported by the risk management organization that helps identify and consider risks when making business decisions. Management processes, structure, and policies are designed to help ensure compliance with laws and regulations as well as provide
|
FIRST HORIZON CORPORATION
|
87
|
2020 FORM 10-K ANNUAL REPORT | ||||||
organizational clarity for authority, decision-making, and accountability. The risk governance structure supports and promotes the escalation of material items to executive management and the Board.
4.
Independent Assurance Functions: Internal Audit, Credit Assurance Services, and Model Validation provide an independent and objective assessment of the design and execution of FHN’s internal control system, including management processes, risk governance, and policies and procedures. These groups’ activities are designed to provide reasonable assurance that risks are appropriately identified and communicated; resources are safeguarded; significant financial, managerial, and operating information is complete, accurate, and reliable; and employee actions are in compliance with FHN’s policies and applicable laws and regulations. Internal Audit and CAS report to the Chief Audit Executive, who is appointed by and reports to the Audit Committee of the Board. Internal Audit reports quarterly to the Audit Committee of the Board, while CAS reports quarterly to the Executive & Risk Committee of the Board. Model Validation reports to the Chief Risk Officer and reports annually to the Audit Committee of the Board.
MARKET RISK MANAGEMENT
Market risk is the risk that changes in market conditions will adversely impact the value of assets or liabilities, or otherwise negatively impact FHN’s earnings. Market risk is inherent in the financial instruments associated with FHN’s operations, primarily trading activities within FHN Financial, but also through non-trading activities which are primarily affected by interest rate risk that is managed by the ALCO within FHN.
FHN is exposed to market risk related to the trading securities inventory and loans held for sale maintained by FHN Financial in connection with its fixed income distribution activities. Various types of securities inventory positions are procured for distribution to clients by the sales staff. When these securities settle on a delayed basis, they are considered forward contracts. Refer to the "Determination of Fair Value - Trading securities and trading liabilities" section of Note 24 - Fair Value of Assets and Liabilities, which section is incorporated into this MD&A by this reference.
FHN’s market risk appetite is approved by the Executive & Risk Committee of the Board of Directors and executed through management policies and procedures of ALCO and the FHN Financial Risk Committee. These policies contain various market risk limits including, for example, VaR limits for the trading securities inventory, and individual position limits and sector limits for products with credit risk, among others. Risk measures are computed and reviewed on a daily basis to ensure compliance with market risk management policies.
Value-at-Risk and Stress Testing
VaR is a statistical risk measure used to estimate the potential loss in value from adverse market movements over an assumed fixed holding period within a stated confidence level. FHN employs a model to compute daily VaR measures for its trading securities inventory. FHN computes VaR using historical simulation with a 1-year lookback period at a 99 percent confidence level and 1-day and 10-day time horizons. Additionally, FHN computes a Stressed VaR measure. The SVaR computation uses the same model but with model inputs reflecting historical data from a continuous 12-month period that reflects a period of significant financial stress appropriate for our trading securities portfolio.
|
FIRST HORIZON CORPORATION
|
88
|
2020 FORM 10-K ANNUAL REPORT | ||||||
A summary of FHN's VaR and SVaR measures for 1-day and 10-day time horizons is as follows:
Table 24—VaR and SVaR Measures
| Year Ended December 31, 2020 |
As of
December 31, 2020 |
|||||||||||||||||||||||||
| (Dollars in millions) | Mean | High | Low | |||||||||||||||||||||||
| 1-day | ||||||||||||||||||||||||||
| VaR | $ | 3 | $ | 7 | $ | 1 | $ | 2 | ||||||||||||||||||
| SVaR | 5 | 18 | 1 | 2 | ||||||||||||||||||||||
| 10-day | ||||||||||||||||||||||||||
| VaR | 13 | 25 | 2 | 10 | ||||||||||||||||||||||
| SVaR | 18 | 43 | 6 | 10 | ||||||||||||||||||||||
| Year Ended December 31, 2019 |
As of
December 31, 2019 |
|||||||||||||||||||||||||
| (Dollars in millions) | Mean | High | Low | |||||||||||||||||||||||
| 1-day | ||||||||||||||||||||||||||
| VaR | $ | 1 | $ | 2 | $ | 1 | $ | 1 | ||||||||||||||||||
| SVaR | 6 | 10 | 3 | 5 | ||||||||||||||||||||||
| 10-day | ||||||||||||||||||||||||||
| VaR | 3 | 7 | 1 | 2 | ||||||||||||||||||||||
| SVaR | 17 | 28 | 9 | 15 | ||||||||||||||||||||||
2020 VaR and SVaR increased due to extreme volatility as a result of economic uncertainty associated with the COVID-19 pandemic.
FHN’s overall VaR measure includes both interest rate risk and credit spread risk. Separate measures of these component risks are as follows:
Table 25—Schedule of Risks Included in VaR
| As of December 31, 2020 | As of December 31, 2019 | |||||||||||||||||||||||||
| (Dollars in millions) | 1-day | 10-day | 1-day | 10-day | ||||||||||||||||||||||
| Interest rate risk | $ | 1 | $ | 2 | $ | 1 | $ | 4 | ||||||||||||||||||
| Credit spread risk | 2 | 6 | — | 1 | ||||||||||||||||||||||
The potential risk of loss reflected by FHN’s VaR measures assumes the trading securities inventory is static. Because FHN Financial procures fixed income securities for purposes of distribution to clients, its trading securities inventory turns over regularly. Additionally, FHNF traders actively manage the trading securities inventory continuously throughout each trading day. Accordingly, FHN’s trading securities inventory is highly dynamic, rather than static. As a result, it would be rare for FHNF to incur a negative revenue day in its fixed income activities of the level indicated by its VaR measurements.
In addition to being used in FHN’s daily market risk management process, the VaR and SVaR measures are also used by FHN in computing its regulatory market risk capital requirements in accordance with the Market Risk Capital rules. For additional
information regarding FHN's capital adequacy refer to the "Capital" section of this MD&A.
FHN also performs stress tests on its trading securities portfolio to calculate the potential loss under various assumed market scenarios. Key assumed stresses used in those tests are:
Down 25 bps
- assumes an instantaneous downward move in interest rates of 25 basis points at all points on the interest rate yield curve.
Up 25 bps
- assumes an instantaneous upward move in interest rates of 25 basis points at all points on the interest rate yield curve.
Curve flattening
- assumes an instantaneous flattening of the interest rate yield curve through an
|
FIRST HORIZON CORPORATION
|
89
|
2020 FORM 10-K ANNUAL REPORT | ||||||
increase in short-term rates and a decrease in long-term rates. The 2-year point on the Treasury yield curve is assumed to increase 15 basis points and the 10-year point on the Treasury yield curve is assumed to decrease 15 basis points. Shifts in other points on the yield curve are predicted based on their correlation to the 2-year and 10-year points.
Curve steepening
- assumes an instantaneous steepening of the interest rate yield curve through a decrease in short-term rates and an increase in long-term rates. The 2-year point on the Treasury yield curve is assumed to decrease 15 basis points and the 10-year point on the Treasury yield curve is assumed to increase 15 basis points. Shifts in other points on the yield curve are predicted based on their correlation to the 2-year and 10-year points.
Credit spread widening
- assumes an instantaneous increase in credit spreads (the difference between yields on Treasury securities and non-Treasury securities) of 25 basis points.
Model Validation
Trading risk management personnel within FHN Financial have primary responsibility for model risk management with respect to the model used by FHN to compute its VaR measures and perform stress testing on the trading inventory. Among other procedures, these personnel monitor model results and perform periodic backtesting as part of an ongoing process of validating the accuracy of the model. These model risk management activities are subject to annual review by FHN’s Model Validation Group, an independent assurance group charged with oversight responsibility for FHN’s model risk management.
INTEREST RATE RISK MANAGEMENT
Interest rate risk is the risk to earnings or capital arising from movement in interest rates. ALCO is responsible for overseeing the management of existing and emerging interest rate risk in the company within risk tolerances established by the Board. FHN primarily manages interest rate risk by structuring the balance sheet to maintain a desired level of associated earnings and to protect the economic value of FHN’s capital.
Net interest income and the value of equity are affected by changes in the level of market interest rates because of the differing repricing characteristics of assets and liabilities, the exercise of prepayment options held by loan clients, the early withdrawal options held by deposit clients, and changes in the basis between and changing shapes of the various yield curves used to price assets and liabilities. To
isolate the repricing, basis, option, and yield curve components of overall interest rate risk, FHN employs Gap, Earnings at Risk, and Economic Value of Equity analyses generated by a balance sheet simulation model.
Net Interest Income Simulation Analysis
The information provided in this section, including the discussion regarding the outcomes of simulation analysis and rate shock analysis, is forward-looking. Actual results, if the assumed scenarios were to occur, could differ because of interest rate movements, the ability of management to execute its business plans, and other factors, including those presented in the Forward-Looking Statements section of this Report.
Management uses a simulation model to measure interest rate risk and to formulate strategies to improve balance sheet positioning, earnings, or both, within FHN’s interest rate risk, liquidity, and capital guidelines. Interest rate exposure is measured by forecasting 12 months of NII under various interest rate scenarios and comparing the percentage change in NII for each scenario to a base case scenario where interest rates remain unchanged. Assumptions are made regarding future balance sheet composition, interest rate movements, and loan and deposit pricing. In addition, assumptions are made about the magnitude of asset prepayments and earlier than anticipated deposit withdrawals. The results of these scenarios help FHN develop strategies for managing exposure to interest rate risk. While management believes the assumptions used and scenarios selected in its simulations are reasonable, simulation modeling provides only an estimate, not a precise calculation, of exposure to any given change in interest rates.
Based on a static balance sheet as of December 31, 2020, NII exposures over the next 12 months assuming rate shocks of plus 25 basis points, 50 basis points, 100 basis points, and 200 basis points are estimated to have favorable variances of 2.0%, 3.8%, 7.5%, and 12.6%, respectively compared to base NII. A steepening yield curve scenario where long-term rates increase by 50 basis points and short-term rates are static, results in a favorable NII variance of 1.0%. A flattening yield curve scenario where long-term rates decrease by 50 basis points and short-term rates are static, results in an unfavorable NII variance of 1.1%. Rate shocks of minus 25 basis points and 50 basis points result in unfavorable NII variances of 1.9% and 2.1%, assuming the absence of negative rates. These hypothetical scenarios are used to create a risk
|
FIRST HORIZON CORPORATION
|
90
|
2020 FORM 10-K ANNUAL REPORT | ||||||
measurement framework, and do not necessarily represent management’s current view of future interest rates or market developments.
FHN’s net interest income has been, and likely will continue to be, impacted by the disruption from the COVID-19 pandemic and the low rate environment. The increase in the unemployment rate, client loan deferral requests, the impact of government assistance programs, and other developments have influenced net interest income results. FHN is monitoring current economic trends and potential exposures closely.
Fair Value Shock Analysis
Interest rate risk and the slope of the yield curve also affect the fair value of FHN's trading inventory that is reflected in noninterest income.
Generally, low or declining interest rates with a positively sloped yield curve tend to increase income through higher demand for fixed income products. Additionally, the fair value of FHN's trading inventory can fluctuate as a result of differences between current interest rates and the interest rates of fixed income securities in the trading inventory.
Derivatives
In the normal course of business, FHN utilizes various financial instruments (including derivative contracts and credit-related agreements) to manage the risk of loss arising from adverse changes in the fair value of certain financial instruments generally caused by changes in interest rates including FHN's securities inventory, certain term borrowings, and certain loans. Additionally, FHN may enter into derivative contracts in order to meet clients' needs. However, such derivative contracts are typically offset with a derivative contract entered into with an upstream counterparty in order to mitigate risk associated with changes in interest rates.
The simulation models and related hedging strategies discussed above exclude the dynamics related to how fee income and noninterest expense may be affected by actual changes in interest rates or expectations of changes. See Note 22 - Derivatives for additional discussion of these instruments.
CAPITAL RISK MANAGEMENT AND ADEQUACY
The capital management objectives of FHN are to provide capital sufficient to cover the risks inherent in FHN’s businesses, to maintain excess capital to well-capitalized standards and Board policy, and to assure ready access to the capital markets. The Capital & Stress Testing Committee, chaired by the Senior Vice
President and Corporate Treasurer, reports to ALCO and is responsible for capital management oversight and provides a forum for addressing management issues related to capital adequacy. This committee reviews sources and uses of capital, key capital ratios, segment economic capital allocation methodologies, coordinates the annual enterprise-wide stress testing process, and other factors in monitoring and managing current capital levels, as well as potential future sources and uses of capital. The Capital & Stress Testing Committee also recommends capital management policies, which are submitted for approval to ALCO and the Executive & Risk Committee and the Board as necessary.
OPERATIONAL RISK MANAGEMENT
Operational risk is the risk of loss from inadequate or failed internal processes, people, or systems or from external events including data or network security breaches of FHN or of third parties affecting FHN or its clients. This risk is inherent in all businesses. Operational risk is divided into the following risk areas, which have been established at the corporate level to address these risks across the entire organization:
•
Business Continuity Planning
•
Records Management
•
Compliance/Legal
•
Program Governance
•
Fiduciary
•
Financial Crimes (including Bank Secrecy Act, know your customer, security, and fraud)
•
Financial (including disclosure controls and procedures)
•
Information Technology (including cybersecurity)
•
Vendor
Management, measurement, and reporting of operational risk are overseen by the Operational Risk, Fiduciary, Financial Governance, FHN Financial Risk, and Investment Rationalization Board Committees. Key representatives from the business segments, operating units, and supporting units are represented on these committees as appropriate. These governance committees manage the individual operational risk types across FHN by setting standards, monitoring activity, initiating actions, and reporting exposures and results. Key Committee activities and decisions are reported to the appropriate governance committee or included in the Enterprise Risk Report, a quarterly analysis of risk within the organization that is provided to the Executive and Risk Committee. Emphasis is dedicated to refinement of processes and tools to aid
|
FIRST HORIZON CORPORATION
|
91
|
2020 FORM 10-K ANNUAL REPORT | ||||||
in measuring and managing material operational risks and providing for a culture of awareness and accountability.
COMPLIANCE RISK MANAGEMENT
Compliance risk is the risk of legal or regulatory sanctions, material financial loss, or loss to reputation as a result of failure to comply with laws, regulations, rules, self-regulatory organization standards, and codes of conduct applicable to FHN’s activities. Management, measurement, and reporting of compliance risk are overseen by the Operational Risk Committee. Key executives from the business segments, legal, risk management, and service functions are represented on the Committee. Summary reports of Committee activities and decisions are provided to the appropriate governance committees. Reports include the status of regulatory activities, internal compliance program initiatives, compliance testing results and evaluation of emerging compliance risk areas.
CREDIT RISK MANAGEMENT
Credit risk is the risk of loss due to adverse changes in a borrower’s or counterparty’s ability to meet its financial obligations under agreed upon terms. FHN is subject to credit risk in lending, trading, investing, liquidity/funding, and asset management activities although lending activities have the most exposure to credit risk. The nature and amount of credit risk depends on the types of transactions, the structure of those transactions, collateral received, the use of guarantors and the parties involved.
FHN assesses and manages credit risk through a series of policies, processes, measurement systems, and controls. The Credit Risk Management Committee is responsible for overseeing the management of existing and emerging credit risks in the company within the broad risk tolerances established by the Board. The CRMC reports through the Management Risk Committee. The Credit Risk Management function, led by the Chief Credit Officer, provides strategic and tactical credit leadership by maintaining policies, overseeing credit approval, assessing new credit products, strategies and processes, and managing portfolio composition and performance.
While the Credit Risk function oversees FHN’s credit risk management, there is significant coordination between the business lines and the Credit Risk function in order to manage FHN’s credit risk and maintain strong asset quality. The Credit Risk function recommends portfolio, industry/sector, and individual client limits to the Executive & Risk Committee of the
Board for approval. Adherence to these approved limits is vigorously monitored by Credit Risk which provides recommendations to slow or cease lending to the business lines as commitments near established lending limits. Credit Risk also ensures subject matter experts are providing oversight, support and credit approvals, particularly in the specialty lending areas where industry-specific knowledge is required. Management emphasizes general portfolio servicing such that emerging risks are able to be spotted early enough to correct potential deficiencies, prevent further credit deterioration, and mitigate credit losses.
The Credit Risk Management function assesses the asset quality trends and results, as well as lending processes, adherence to underwriting guidelines (portfolio-specific underwriting guidelines are discussed further in the Asset Quality Trends section), and utilizes this information to inform management regarding the current state of credit quality and as a factor of the estimation process for determining the allowance for loan losses. The CRMC reviews on a periodic basis various reports issued by assurance functions which provide an independent assessment of the adequacy of loan servicing, grading accuracy, and other key functions. Additionally, CRMC is presented with and discusses various portfolios, lending activity and lending-related projects.
All of the above activities are subject to independent review by FHN’s Credit Assurance Services Group. CAS reports to the Chief Audit Executive, who is appointed by and reports to the Audit Committee of the Board, and provides quarterly reports to the Executive & Risk Committee of the Board. CAS is charged with providing the Executive & Risk Committee of the Board and executive management with independent, objective, and timely assessments of FHN’s portfolio quality, credit policies, and credit risk management processes.
LIQUIDITY RISK MANAGEMENT
ALCO is also responsible for liquidity management: the funding of assets with liabilities of appropriate duration, while mitigating the risk of unexpected cash needs. ALCO and the Board of Directors have adopted a Liquidity Policy. The objective of the Liquidity Policy is to ensure that FHN meets its cash and collateral obligations promptly, in a cost-effective manner and with the highest degree of reliability. The maintenance of adequate levels of asset and liability liquidity should provide FHN with the ability to meet both expected and unexpected cash and collateral needs. Key liquidity ratios, asset liquidity levels and the amount available from funding sources are reported to ALCO on a regular basis. FHN’s Liquidity
|
FIRST HORIZON CORPORATION
|
92
|
2020 FORM 10-K ANNUAL REPORT | ||||||
Policy establishes liquidity limits that are deemed appropriate for FHN’s risk profile.
In accordance with the Liquidity Policy, ALCO manages FHN’s exposure to liquidity risk through a dynamic, real time forecasting methodology. Base liquidity forecasts are reviewed by ALCO and are updated as financial conditions dictate. In addition to the baseline liquidity reports, robust stress testing of assumptions and funds availability are periodically reviewed. FHN maintains a contingency funding plan that may be executed, should unexpected difficulties arise in accessing funding that affects FHN, the industry as a whole, or both. Subject to market conditions and compliance with applicable regulatory requirements from time to time, funds are available from a number of sources including the available-for-sale securities portfolio, dealer and commercial client repurchase agreements, access to the overnight and term Federal Funds markets, incremental borrowing cap
acity at the F
HLB ($14.7 billion was available at December 31, 2020), brokered deposits, loan sales, syndications, and access to the Federal Reserve Bank.
Core deposits are a significant source of funding and have historically been a stable source of liquidity for banks. Generally, core deposits represent funding from a financial institution's client base which provide inexpensive, predictable pricing. The FDIC insures these deposits to the extent authorized by law. Generally, these limits are $250 thousand per account owner for interest bearing and non-interest bearing accounts. The ratio of total loans, excluding loans HFS and restricted real estate loans, to core deposits was 97% on December 31, 2020 compared to 98% on December 31, 2019.
FHN may also use unsecured short-term borrowings as a source of liquidity. Federal funds purchased from correspondent bank clients are considered to be substantially more stable than funds purchased in the national broker markets for federal funds due to the long, historical, and reciprocal nature of banking services provided by FHN to these correspondent banks. The remainder of FHN’s wholesale short-term borrowings consists of securities sold under agreements to repurchase transactions accounted for as secured borrowings with business clients or broker dealer counterparties.
Both FHN and First Horizon Bank may access the debt markets in order to provide funding through the issuance of senior or subordinated unsecured debt subject to market conditions and compliance with applicable regulatory requirements. In May 2020, FHN issued $800 million of senior notes. In April 2020, First Horizon Bank issued $450 million of subordinated notes. These subordinated notes qualify
as Tier 2 capital for First Horizon Bank as well as FHN, up to certain regulatory limits for minority interest capital instruments.
Both FHN and First Horizon Bank have the ability to generate liquidity by issuing preferred equity, and (for FHN) by issuing common equity, subject to market conditions and compliance with applicable regulatory requirements. As of December 31, 2020, FHN had outstanding $470 million in non-cumulative perpetual preferred stock, which includes $145 million issued in May 2020. As of December 31, 2020, First Horizon Bank and subsidiaries had outstanding preferred shares of $295 million, which are reflected as noncontrolling interest on the Consolidated Balance Sheets.
Parent company liquidity is primarily provided by cash flows stemming from dividends and interest payments collected from subsidiaries. These sources of cash represent the primary sources of funds to pay cash dividends to shareholders and principal and interest to debt holders of FHN. The amount paid to the parent company through First Horizon Bank common dividends is managed as part of FHN’s overall cash management process, subject to applicable regulatory restrictions. Certain regulatory restrictions exist regarding the ability of First Horizon Bank to transfer funds to FHN in the form of cash, common dividends, loans, or advances. At any given time, the pertinent portions of those regulatory restrictions allow First Horizon Bank to declare preferred or common dividends without prior regulatory approval in an aggregate amount equal to First Horizon Bank’s retained net income for the two most recent completed years plus the current year to date. For any period, First Horizon Bank’s ‘retained net income’ generally is equal to First Horizon Bank’s regulatory net income reduced by the preferred and common dividends declared by First Horizon Bank. Applying the dividend restrictions imposed under applicable federal and state rules as outlined above, the Bank’s total amount available for dividends was $897 million as of January 1, 2021. Consequently, on that date the Bank could pay common dividends up to that amount to its sole common stockholder, FHN, or to its preferred shareholders without prior regulatory approval. Additionally, a capital conservation buffer must be maintained (as described in the Capital section of this Report) to avoid restrictions on dividends.
First Horizon Bank declared and paid common dividends to the parent company in the amount of $180 million in 2020 and $345 million in 2019. In January 2021, First Horizon Bank declared and paid a common dividend to the parent company in the amount of $183 million. First Horizon Bank declared
|
FIRST HORIZON CORPORATION
|
93
|
2020 FORM 10-K ANNUAL REPORT | ||||||
and paid preferred dividends in each quarter of 2020 and 2019 and declared preferred dividends in the first quarter of 2021 which are payable in April 2021.
Payment of a dividend to shareholders of FHN is dependent on several factors which are considered by the Board. These factors include FHN’s current and prospective capital, liquidity, and other needs, applicable regulatory restrictions, and also availability of funds to FHN through a dividend from First Horizon Bank. FHN also must meet capital conservation buffer requirements to avoid restrictions on dividends. Additionally, banking regulators generally require insured banks and bank holding companies to pay cash dividends only out of current operating earnings. Consequently, the decision of whether FHN will pay future dividends and the amount of dividends will be affected by current operating results. FHN paid a cash dividend of $0.15 per common share on January 4, 2021. FHN paid cash dividends of $1,550 per Series A preferred share and $1,625 per Series E preferred share on January 11, 2021 and $331.25 per Series B preferred share and $165 per Series C preferred share on February 1, 2021. In addition, in January 2021, the Board approved cash dividends per share in the following amounts:
| Dividend/Share | Record Date | Payment Date | ||||||||||||||||||
| Common Stock | $ | 0.15 | 3/12/2021 | 4/1/2021 | ||||||||||||||||
| Preferred Stock | ||||||||||||||||||||
| Series A | $ | 1,550.00 | 3/26/2021 | 4/12/2021 | ||||||||||||||||
| Series C | $ | 165.00 | 4/16/2021 | 5/3/2021 | ||||||||||||||||
| Series D | $ | 305.00 | 4/16/2021 | 5/3/2021 | ||||||||||||||||
| Series E | $ | 1,625.00 | 3/26/2021 | 4/12/2021 | ||||||||||||||||
CREDIT RATINGS
FHN is currently able to fund a majority of the balance sheet through core deposits, which are generally not as sensitive to FHN’s credit ratings as other types of funding. However, maintaining adequate credit ratings on debt issues and preferred stock is critical to liquidity should FHN need to access funding from other sources, including from long-term debt issuances and certain brokered deposits, at an attractive rate. The availability and cost of funds other than core deposits is also dependent upon marketplace perceptions of the financial soundness of FHN, which include such factors as capital levels, asset quality, and reputation. The availability of core deposit funding is stabilized by federal deposit insurance, which can be removed only in extraordinary circumstances, but may also be influenced to some extent by the same factors that affect other funding sources. FHN’s credit ratings are also referenced in various respects in agreements
with certain derivative counterparties as discussed in Note 22 - Derivatives.
|
FIRST HORIZON CORPORATION
|
94
|
2020 FORM 10-K ANNUAL REPORT | ||||||
The following table provides FHN’s most recent credit ratings:
Table 26 - Credit Ratings
| Moody's (a) | Fitch (b) | ||||||||||||||||
| First Horizon Corporation | |||||||||||||||||
| Overall credit rating: Long-term/Short-term/Outlook | Baa3/--/Stable | BBB/F2/Stable | |||||||||||||||
| Long-term senior debt | Baa3 | BBB | |||||||||||||||
| Subordinated debt (c) | Baa3 | BBB- | |||||||||||||||
| Junior subordinated debt (c) | Ba1 | BB- | |||||||||||||||
| Preferred stock | Ba2 | BB- | |||||||||||||||
| First Horizon Bank | |||||||||||||||||
| Overall credit rating: Long-term/Short-term/Outlook | Baa3/P-2/Stable | BBB/F2/Stable | |||||||||||||||
| Long-term/short-term deposits | A3/P-2 | BBB+/F2 | |||||||||||||||
| Long-term/short-term senior debt | Baa3/P-2 | BBB/F2 | |||||||||||||||
| Subordinated debt | Baa3 | BBB- | |||||||||||||||
| Preferred stock | Ba2 | BB- | |||||||||||||||
| FT Real Estate Securities Company, Inc. | |||||||||||||||||
| Preferred stock | Ba1 | ||||||||||||||||
A rating is not a recommendation to buy, sell, or hold securities and is subject to revision or withdrawal at any time and should be evaluated independently of any other rating.
(a) Last change in ratings was on May 14, 2015; ratings/outlook affirmed on November 5, 2019.
(b) Last change in ratings was on May 6, 2020 and outlook was affirmed.
(c) Ratings are preliminary/implied.
REPURCHASE OBLIGATIONS, OFF-BALANCE SHEET ARRANGEMENTS, AND OTHER CONTRACTUAL OBLIGATIONS
Repurchase Accrual Methodology
Prior to September 2008, FHN originated loans through its pre-2009 mort
gage business, primarily first lien home loans, with the intention of selling them.
As discussed in Note 17 - Contingencies and Other Disclosures, FHN's principal remaining exposures for those activities relate to (i) indemnification claims by underwriters, loan purchasers, and other parties which assert that FHN-originated loans caused or contributed to losses which FHN is legally obliged to indemnify, and (ii) indemnification or other claims related to FHN's servicing of pre-2009 mortgage loans.
FHN’s approach for determining the adequacy of the repurchase and foreclosure reserve has evolved, sometimes substantially, based on changes in information available. Repurchase/make-whole rates vary based on purchaser, vintage, and claim type. For those loans repurchased or covered by a make-whole payment, cumulative average loss severities range between 50 and 60 percent of the UPB.
Repurchase Accrual Approach
In determining potential loss content, claims are analyzed by purchaser, vintage, and claim type. FHN
considers various inputs including claim rate estimates, historical average repurchase and loss severity rates, mortgage insurance cancellations, and mortgage insurance curtailment requests. Inputs are applied to claims in the active pipeline, as well as to historical average inflows to estimate loss content related to potential future inflows. Management also evaluates the nature of claims from purchasers and/or servicers of loans sold to determine if qualitative adjustments are appropriate.
Repurchase and Foreclosure Liability
The repurchase and foreclosure liability is comprised of accruals to cover estimated loss content in the active pipeline (consisting of mortgage loan repurchase, make-whole, foreclosure/servicing demands and certain related exposures), estimated future inflows, and estimated loss content related to certain known claims not currently included in the active pipeline. The liability contemplates repurchase/make-whole and damages obligations and estimates for probable incurred losses associated with loan populations excluded from the settlements with the GSEs, as well as other whole loans sold, mortgage insurance cancellations rescissions, and loans included in bulk servicing sales effected prior to the settlements with the GSEs. FHN compares the estimated probable incurred losses determined under the applicable loss estimation approaches for the respective periods with current reserve levels. Changes in the estimated required liability levels are
|
FIRST HORIZON CORPORATION
|
95
|
2020 FORM 10-K ANNUAL REPORT | ||||||
recorded as necessary through the repurchase and foreclosure provision. The repurchase and foreclosure liability increased to $16 million on December 31, 2020 from $15 million on December 31, 2019.
Other Contractual Obligations
Pension obligations are funded by FHN to provide current and future benefits to participants in FHN’s noncontributory, defined benefit pension plan. On December 31, 2020, the annual measurement date, pension obligations (representing the present value of estimated future benefit payments), including obligations of the unfunded plans, were $893 million with $896 million of assets (measured at current fair value) in the qualified plan’s trust to fund the qualified plan’s obligations. The discount rate for 2020 of 2.63% for the qualified pension plan and 2.24% for the nonqualified supplemental executive retirement plan was determined by using a hypothetical AA yield curve represented by a series of annualized individual discount rates from one-half to thirty years. The discount rates for the pension and nonqualified supplemental executive retirement plans are selected based on data specific to FHN’s plans and participant populations. See Note 18 - Pension, Savings, and Other Employee Benefits for additional information. As of December 31, 2020, the plan assets exceeded the projected benefit obligation and the accumulated benefit obligation for the qualified pension plan. Decisions to contribute to the plan are based upon pension funding requirements under the Pension Protection Act, the maximum amount deductible under the Internal Revenue Code, the actual
performance of plan assets, and trends in the regulatory environment. FHN made no contributions to the qualified pension plan in 2020 and 2019 and made an insignificant contribution to the qualified pension plan in 2018. Management does not currently anticipate that FHN will make a contribution to the qualified pension plan in 2021.
The nonqualified pension plans and other postretirement benefit plans, excluding the retiree medical plan, are unfunded. Benefit payments under the non-qualified plans were $5 million in 2020. FHN anticipates 2021 benefit payments to be $5 million.
FHN has various other financial obligations which may require future cash payments. The following table sets forth contractual obligations representing required and potential cash outflows as of December 31, 2020. Purchase obligations represent obligations under agreements to purchase goods or services that are enforceable and legally binding on FHN and that specify all significant terms, including fixed or minimum quantities to be purchased; fixed, minimum, or variable price provisions; and the approximate timing of the transaction. In addition, FHN enters into commitments to extend credit to borrowers, including loan commitments, standby letters of credit, and commercial letters of credit.
These commitments do not necessarily represent future cash requirements in that these commitments often expire without being drawn upon and are not included in the table.
Table 27—Contractual Obligations as of December 31, 2020
| Payments due by period (a) | ||||||||||||||||||||||||||||||||
| Less than | 1 year - | 3 years - | After 5 | |||||||||||||||||||||||||||||
| (Dollars in millions) | 1 year | < 3 years | < 5 years | years | Total | |||||||||||||||||||||||||||
| Contractual obligations: | ||||||||||||||||||||||||||||||||
| Time deposit maturities (b) (c) | $ | 3,952 | $ | 933 | $ | 153 | $ | 32 | $ | 5,070 | ||||||||||||||||||||||
| Term borrowings (b) (d) | — | 450 | — | 1,274 | 1,724 | |||||||||||||||||||||||||||
| Annual rental commitments under noncancelable leases (b) (e) | 52 | 93 | 78 | 257 | 480 | |||||||||||||||||||||||||||
| Purchase obligations | 153 | 132 | 53 | 13 | 351 | |||||||||||||||||||||||||||
| Total contractual obligations | $ | 4,157 | $ | 1,608 | $ | 284 | $ | 1,576 | $ | 7,625 | ||||||||||||||||||||||
(a)
Excludes a $70 million liability for unrecognized tax benefits as the timing of payment cannot be reasonably estimated.
(b)
Amounts do not include interest.
(c)
See Note 9 - Deposits for further details.
(d)
See Note 11 - Term Borrowings for further details.
(e)
See Note 6 - Premises, Equipment and Leases for further details.
|
FIRST HORIZON CORPORATION
|
96
|
2020 FORM 10-K ANNUAL REPORT | ||||||
MARKET UNCERTAINTIES AND PROSPECTIVE TRENDS
FHN’s future results could be affected both positively and negatively by several known trends. Key among those are changes in the U.S. and global economy and outlook, government actions affecting interest rates, and the availability and administration of stimulus relief for the economy. Additional impacts include how the pandemic affects FHN’s clients, as well as political uncertainty, potential changes in federal policies and the potential impact to our clients, and FHN’s strategic initiatives.
The global COVID-19 pandemic has led to periods of significant volatility in financial commodities (including oil and gas) and other markets, and has adversely affected FHN’s and its clients' ability to conduct normal business, and could harm FHN’s business and future results of operations.
In March 2020, the Federal Reserve lowered short-term interest rates twice and started a “quantitative easing” program intended to lower longer-term interest rates and foster access to credit. The effective yields of 10-year and 30-year U.S. Treasury securities achieved record low rates and the U.S. Congress enacted relief legislation which, among other things, was intended to provide emergency credit to businesses at risk for failure from government and public actions related to the COVID-19 pandemic, and to mitigate the severity of an economic recession. These changes in interest rates and the volatility in the market negatively impacted FHN’s net interest margin. Amortization of net processing fees related to government relief programs, including the Paycheck Protection Program, has offset a portion of the net interest margin decline.
The economic effects of the COVID-19 pandemic have significantly altered business in the U.S. and globally leading to partial or full business closures, individuals being furloughed or laid off, significant increases in unemployment, and workers being partially or wholly ordered to work from home. Disruption to FHN’s clients due to governmental and societal responses to COVID-19 have adversely affected FHN’s loan and deposit fee income, created downward loan migration and a corresponding increase in provision for credit losses. In addition, loan charge-offs may increase over time, especially if economic disruption related to the COVID-19 pandemic continues for an extended period of time. Furthermore, government programs under the CARES Act and other guidance intended to provide relief to clients through temporary modifications and
deferrals, may in some instances mask or postpone reporting of credit problems and potential defaults. In these circumstances, current credit quality indicators may not be reflective of the underlying health of FHN's portfolios.
It is difficult to predict the impact of these still-changing circumstances on FHN's businesses in the future, although we expect the overall impact to be less in 2021 than in 2020. The full extent of impacts resulting from the COVID-19 pandemic and other events beyond our control will depend on uncertain future developments, including new information which may emerge concerning the severity of new COVID strains, the effectiveness of vaccines on existing and new strains, and further actions governments may take to slow the spread of the virus, treat the ill, distribute the vaccines, and assist affected businesses.
FHN Response to the COVID-19 Pandemic
The pandemic has resulted in modest operational disruptions for FHN. Clients’ physical access to banking centers has been restricted off and on in many markets, and many non-client-facing associates have worked largely on a remote basis. FHN has also implemented
additional sick time and child care assistance for associates
.
FHN is act
ively monitoring the COVID-19 pandemic and its impact on clients and FHN’s credit quality. FHN continues to reach out to clients to discuss challenges and solutions, provide line draws and new extensions to existing clients, provide support for small businesses through the PPP (discussed in more detail below) and other stimulus programs, as well as provide lending and deposit assistance through deferrals and waived fees. Additionally, in certain sectors, FHN has reduced or stopped new lending.
Paycheck Protection Program
In 2020, Congress created the foundation for the PPP, under which qualifying businesses may receive loans from private lenders, such as FHN, that are fully guaranteed by the Small Business Administration. These loans potentially are partly or fully forgivable, depending upon the borrower’s use of the funds and maintenance of employment levels; to the extent forgiven, the borrower is relieved from payment, while the lender still is paid from the program. Congress revised the initial PPP multiple times during 2020 and created a second round of PPP lending with the Consolidated Appropriations Act, 2021 which was signed into law in December 2020. Lenders making PPP loans are paid a fee by the Small Business
|
FIRST HORIZON CORPORATION
|
97
|
2020 FORM 10-K ANNUAL REPORT | ||||||
Administration. Gross lender fees range from 1% to 5% of the loan amount. Agents may be utilized to assist in the preparation of PPP applications, with the costs of the agent potentially being paid from the gross lender fee. Additionally, originating banks have certain internal costs of originating PPP loans.
At December 31, 2020, FHN had 32,510 PPP loans with an aggregate principal of $4.1 billion. For these loans, FHN anticipates being paid net lender fees of approximately $37 million in relation to the PPP loans held at year-end. FHN has decided to hold its PPP loans for investment. Therefore, the amount of SBA fees net of total direct origination costs are deferred as a discount to the recorded carrying value of the PPP loans. This discount is being amortized prospectively to interest income. SBA loan forgiveness payments are considered prepayments of the related loans. Under existing accounting principles, amortization of net origination fees can reflect expected prepayment activity if prepayments are determined to be probable and both the timing and volume can be reasonably estimated. Based on the current terms of the PPP loans, including the expected end of the payment deferral period, FHN estimates that substantially all of the prepayment-eligible portions of existing PPP loans will be prepaid by the end of 2021 as these loans are forgiven. These estimated prepayments result in a similar amount of the net fees being recognized in interest income.
Since PPP loans carry a full SBA guarantee, they do not have any credit risk and will not affect the amount of provision and ALLL recorded. FHN has assigned a risk weight of zero to PPP loans for regulatory capital purposes.
Lending Assistance for Borrowers
Other client support initiatives include incremental lending assistance for borrowers through delayed payment programs and fee waivers. The following table provides the UPB of loans related to deferrals granted to FHN’s clients that have been processed through December 31, 2020.
| (Dollars in millions) | As of December 31, 2020 | |||||||
| Commercial: | ||||||||
| Commercial and industrial | $ | 104 | ||||||
| Loans to mortgage companies | — | |||||||
| Commercial real estate | 194 | |||||||
| Total Commercial | $ | 298 | ||||||
| Consumer: | ||||||||
| HELOC | $ | 14 | ||||||
| RE installment loans | 202 | |||||||
| Credit Card and Other | 4 | |||||||
| Total Consumer | $ | 220 | ||||||
| Total | $ | 518 | ||||||
Commercial deferrals processed in our different lines of business were
comprised primarily of professional commercial real estate (44% or $132 million), general commercial (40% or $119 million), and private client (12% or $36 million).
LIBOR Reform
In 2017, the Chief Executive of the United Kingdom Financial Conduct Authority, which regulates the
London Inter-Bank Offered Rate (LIBOR)
, announced that it intends to halt persuading or compelling banks to submit rates for the calculation of LIBOR after 2021. As a result, LIBOR as currently operated may not continue after 2021. FHN is not currently able to predict the impact that the transition from LIBOR will have on FHN; however, because FHN has instruments with floating rate terms based on LIBOR, FHN may experience increases in interest, dividends, and other costs relative to these instruments subsequent to 2021. Additionally, the transition from LIBOR could impact or change FHN’s hedge accounting practices. FHN has initiated efforts to 1) develop an inventory of affected loans, securities, and derivatives, 2) evaluate and assess modifications as needed to address loans outstanding at the time of LIBOR discontinuance, 3) obtain an understanding of the potential effects for applicable securities and derivatives, 4) assess revisions to systems, processes, and pricing needed to implement alternative reference rates, and (5) update fallback language for all new loans that reference LIBOR. In March 2020, the FASB issued ASU 2020-04, “Facilitation of the Effects of Reference Rate Reform on Financial Reporting,” which provides several optional expedients and exceptions to ease the potential burden in accounting for reference rate reform. The scope of ASU 2020-04 was expanded with the January 2021 issuance of ASU 2021-01, "Scope". Refer to the Accounting Changes Issued but Not Currently Effective section of Note 1 - Significant Accounting Policies for additional information.
Additionally, the IRS has released guidance that is intended to facilitate the transition of existing
|
FIRST HORIZON CORPORATION
|
98
|
2020 FORM 10-K ANNUAL REPORT | ||||||
contracts from LIBOR to new reference rates without triggering modification accounting or taxable exchange treatment for those contracts. This guidance specifies what must be met in order to qualify for the beneficial transition approach and FHN is considering this guidance in its transition plans.
CRITICAL ACCOUNTING POLICIES AND ESTIMATES
Allowance for Loan and Lease Losses
Management’s policy is to maintain the ALLL at a level sufficient to absorb expected credit losses in the loan and lease portfolio. Management performs periodic and systematic detailed reviews of its loan and lease portfolio to identify trends and to assess the overall collectability of the portfolio. Management believes the accounting estimate related to the ALLL is a “critical accounting estimate” as: (1) changes in it can materially affect the provision for loan and lease losses and net income, (2) it requires management to predict borrowers’ likelihood or capacity to repay, including evaluation of inherently uncertain future economic conditions, (3) prepayment activity must be projected to estimate the life of loans that often are shorter than contractual terms, (4) it requires estimation of a reasonable and supportable forecast period for credit losses for loan portfolio segments before reversion to historical loss levels over the remaining life of a loan and (5) expected future recoveries of amounts previously charged off must be estimated. Accordingly, this is a highly subjective process and requires significant judgment since it is difficult to evaluate current and future economic conditions in relation to an overall credit cycle and estimate the timing and extent of loss events that are expected to occur prior to end of a loan’s estimated life. The ALLL is increased by the provision for loan and lease losses and recoveries and is decreased by charged-off loans and leases. Principal loan amounts are charged off against the ALLL in the period in which the loan or any portion of the loan is deemed to be uncollectible. A management committee comprised of representatives from Risk Management, Finance, Credit, and Treasury performs a quarterly review of the assumptions used in FHN’s ALLL analytical models, makes qualitative assessments of the loan and lease portfolio, and determines if qualitative adjustments should be recommended to be added to the modeled results. On a quarterly basis, as a part of Enterprise Risk reporting and discussion, management addresses the credit reserve adequacy and credit losses with the Executive and Risk Committee of FHN’s Board of Directors.
FHN believes that the critical assumptions underlying the accounting estimates made by management include: (1) the commercial loan portfolio has been properly risk graded based on information about borrowers in specific industries and specific issues with respect to single borrowers; (2) borrower specific information made available to FHN is current and accurate; (3) the loan portfolio has been segmented properly and individual loans have similar credit risk characteristics and will behave similarly; (4) the lives for loan portfolio pools have been estimated properly, including consideration of expected prepayments; (5) the economic forecasts utilized in the modeling of expected credit losses are reflective of future economic conditions; (6) entity-specific historical loss information has been properly assessed for all loan portfolio segments as the initial basis for estimating expected credit losses; (7) the reasonable and supportable periods for loan portfolio segments have been properly determined; (8) the reversion methodologies and timeframes for migration from the reasonable and supportable period to the use of historical loss rates are reasonable; (9) expected recoveries of prior charge off amounts have been properly estimated; and (10) qualitative adjustments to modeled loss results reasonably reflect expected future credit losses as of the date of the financial statements.
While management uses the best information available to establish the ALLL, future adjustments to the ALLL and methodology may be necessary if economic or other conditions differ substantially from the assumptions used in making the estimates. Such adjustments to original estimates, as necessary, are made in the period in which these factors and other relevant considerations indicate that loss levels vary from previous estimates.
See Note 1 - Significant Accounting Policies and Note 5 - Allowance for Credit Losses for detail regarding FHN’s processes, models, and methodology for determining the ALLL.
Business Combinations
Pursuant to applicable accounting guidance FHN generally recognizes assets acquired, including identified intangible assets, and the liabilities assumed in acquisitions at their fair values as of the acquisition date, with the related transaction costs expensed in the period incurred. Specified items such as net investment in leases as lessor, acquired operating lease assets and liabilities as lessee, employee benefit plans and income-tax related balances are recognized in accordance with accounting guidance that results in measurements that may differ from fair value. Determining the fair
|
FIRST HORIZON CORPORATION
|
99
|
2020 FORM 10-K ANNUAL REPORT | ||||||
value of assets acquired, including identified intangible assets, and liabilities assumed follows the fair value hierarchy described in Note 24 – Fair Value of Assets & Liabilities. This often involves estimates based on internal or third-party valuations which include appraisals, discounted cash flow analysis or other valuation techniques that may include estimates of attrition, inflation, asset growth rates, discount rates, credit risk, multiples of earnings or other relevant factors. The determination of fair value may require management to make point-in-time estimates about discount rates, future expected cash flows, market conditions and other future events that can be volatile in nature and challenging to assess. While FHN uses the best estimates and assumptions to accurately value assets acquired and liabilities assumed at the acquisition date, the estimates are inherently uncertain and subject to refinement.The credit allowance for PCD assets is recognized within business combination accounting. The credit allowance for non-PCD assets is recognized as provision expense in the same reporting period as the business combination. Estimated credit losses for acquired loans and leases are determined using methodologies that are described in Note 1 - Significant Accounting Policies.
Premiums and discounts on acquired AFS debt securities and loans and leases held for investment are amortized to interest income over their estimated remaining lives, which may include prepayment estimates in certain circumstances. Premiums and discounts on acquired debt are amortized to interest expense over their remaining lives. In addition, the determination of the useful lives over which identified finite-life intangible assets will be amortized is subjective. Intangible assets are generally amortized using an accelerated methodology that reflects the cash flow projections utilized in the applicable valuation.
Income Taxes
FHN is subject to the income tax laws of the U.S. and the states and jurisdictions in which it operates. FHN accounts for income taxes in accordance with ASC 740, "Income Taxes". Significant judgments and estimates are required in the determination of the consolidated income tax expense. FHN income tax expense, deferred tax assets and liabilities, and liabilities for unrecognized tax benefits reflect management’s best estimate of current and future taxes to be paid.
Income tax expense consists of both current and deferred taxes. Current income tax expense is an estimate of taxes to be paid or refunded for the current period and includes income tax expense related to uncertain tax positions. A DTA or a DTL is recognized for the tax consequences of temporary
differences between the financial statement carrying amounts and the tax bases of existing assets and liabilities. Deferred taxes can be affected by changes in tax rates applicable to future years, either as a result of statutory changes or business changes that may change the jurisdictions in which taxes are paid. Additionally, DTAs are subject to a “more likely than not” test to determine whether the full amount of the DTAs should be realized in the financial statements. FHN evaluates the likelihood of realization of the DTA based on both positive and negative evidence available at the time, including (as appropriate) scheduled reversals of DTLs, projected future taxable income, tax planning strategies, and recent financial performance. Realization is dependent on generating sufficient taxable income prior to the expiration of the carryforwards attributable to or generated with respect to the DTA. In projecting future taxable income, FHN incorporates assumptions including the amount of future state and federal pretax operating income, the reversal of temporary differences, and the implementation of feasible and prudent tax planning strategies. These assumptions require significant judgment about the forecasts of future taxable income and are consistent with the plans and estimates used to manage the underlying business. If the “more likely than not” test is not met, a valuation allowance must be established against the DTA.
The income tax laws of the jurisdictions in which FHN operate are complex and subject to different interpretations by the taxpayer and the relevant government taxing authorities. In establishing a provision for income tax expense, FHN must make judgments and interpretations about the application of these inherently complex tax laws. Interpretations may be subjected to review during examination by taxing authorities and disputes may arise over the respective tax positions. FHN attempts to resolve disputes that may arise during the tax examination and audit process. However, certain disputes may ultimately be resolved through the federal and state court systems.
FHN monitors relevant tax authorities and revises estimates of accrued income taxes on a quarterly basis. Changes in estimates may occur due to changes in income tax laws and their interpretation by the courts and regulatory authorities. Revisions of estimates may also result from income tax planning and from the resolution of income tax controversies. Such revisions in estimates may be material to operating results for any given period.
See also Note 15 - Income Taxes for additional information.
|
FIRST HORIZON CORPORATION
|
100
|
2020 FORM 10-K ANNUAL REPORT | ||||||
Contingent Liabilities
A liability is contingent if the amount or outcome is not presently known, but may become known in the future as a result of the occurrence of some uncertain future event. FHN estimates its contingent liabilities based on management’s estimates about the probability of outcomes and their ability to estimate the range of exposure. Accounting standards require that a liability be recorded if management determines that it is probable that a loss has occurred and the loss can be reasonably estimated. In addition, it must be probable that the loss will be confirmed by some future event. As part of the estimation process, management is required to make assumptions about matters that are by their nature highly uncertain.
The assessment of contingent liabilities, including legal contingencies, involves the use of critical estimates, assumptions, and judgments. Management’s estimates are based on their belief that future events will validate the current assumptions regarding the ultimate outcome of these exposures. However, there can be no assurance that future events, such as court decisions or decisions of arbitrators, will not differ from management’s assessments. Whenever practicable, management consults with third-party experts (e.g., attorneys, accountants, claims administrators, etc.) to assist with the gathering and evaluation of information related to contingent liabilities. Based on internally and/or externally prepared evaluations, management makes a determination whether the potential exposure requires accrual in the financial statements.
See Note 17 - Contingencies and Other Disclosures for additional information.
ACCOUNTING CHANGES WITH EXTENDED TRANSITION PERIODS
Refer to Note 1 – Significant Accounting Policies for a detail of accounting standards that have been issued but are not currently effective, which section is incorporated into this MD&A by this reference.
|
FIRST HORIZON CORPORATION
|
101
|
2020 FORM 10-K ANNUAL REPORT | ||||||
NON-GAAP INFORMATION
Certain measures are included in the narrative and tables in this MD&A that are “non-GAAP”, meaning they are not presented in accordance with U.S. GAAP and also are not codified in U.S. banking regulations currently applicable to FHN. Although other entities may use calculation methods that differ from those used by FHN for non-GAAP measures, FHN’s management believes such measures are relevant to understanding the capital position or financial results of FHN. Non-GAAP measures are reported to FHN’s management and Board of Directors through various internal reports.
Presentation of regulatory measures, even those which are not GAAP, provide a meaningful base for comparability to other financial institutions subject to the same regulations as FHN, as demonstrated by their use by banking regulators in reviewing capital adequacy of financial institutions. Although not GAAP
terms, these regulatory measures are not considered “non-GAAP” under U.S. financial reporting rules as long as their presentation conforms to regulatory standards. Regulatory measures used in this MD&A include: common equity tier 1 capital, generally defined as common equity less goodwill, other intangibles, and certain other required regulatory deductions; tier 1 capital, generally defined as the sum of core capital (including common equity and instruments that cannot be redeemed at the option of the holder) adjusted for certain items under risk based capital regulations; and risk-weighted assets, which is a measure of total on- and off-balance sheet assets adjusted for credit and market risk, used to determine regulatory capital ratios.
The non-GAAP measures presented in this filing are return on average tangible common equity, tangible common equity to tangible assets and adjusted tangible common equity to risk-weighted assets.
The following table provides a reconciliation of non-GAAP items presented in this MD&A to the most comparable GAAP presentation:
Table 28—Non-GAAP to GAAP Reconciliation
| (Dollars in millions; shares in thousands) | 2020 | 2019 | 2018 | |||||||||||||||||
| Pre-provision Net Revenue (Non-GAAP) | ||||||||||||||||||||
| Net interest income (GAAP) | $ | 1,662 | $ | 1,210 | $ | 1,220 | ||||||||||||||
| Plus: Noninterest income (GAAP) | 1,492 | 654 | 723 | |||||||||||||||||
| Total Revenues (GAAP) | 3,154 | 1,864 | 1,943 | |||||||||||||||||
| Less: Noninterest expense (GAAP) | 1,718 | 1,233 | 1,221 | |||||||||||||||||
| Pre-provision Net Revenue (Non-GAAP) | $ | 1,436 | $ | 631 | $ | 722 | ||||||||||||||
| Tangible Common Equity (Non-GAAP) | ||||||||||||||||||||
| (A) Total equity (GAAP) | $ | 8,307 | $ | 5,076 | $ | 4,785 | ||||||||||||||
| Less: Noncontrolling interest (a) | 295 | 295 | 295 | |||||||||||||||||
| Less: Preferred stock (a) | 470 | 96 | 96 | |||||||||||||||||
| (B) Total common equity | 7,542 | 4,685 | 4,394 | |||||||||||||||||
| Less: Goodwill and other intangible assets (GAAP) (b) | 1,865 | 1,563 | 1,588 | |||||||||||||||||
| (C) Tangible common equity (Non-GAAP) | 5,677 | 3,122 | 2,806 | |||||||||||||||||
| Less: Unrealized gains (losses) on AFS securities, net of tax | 108 | 31 | (76) | |||||||||||||||||
| (D) Adjusted tangible common equity (Non-GAAP) | $ | 5,569 | $ | 3,091 | $ | 2,882 | ||||||||||||||
| Tangible Assets (Non-GAAP) | ||||||||||||||||||||
| (E) Total assets (GAAP) | $ | 84,209 | $ | 43,311 | $ | 40,832 | ||||||||||||||
| Less: Goodwill and other intangible assets (GAAP) (b) | 1,865 | 1,563 | 1,588 | |||||||||||||||||
| (F) Tangible assets (Non-GAAP) | $ | 82,344 | $ | 41,748 | $ | 39,244 | ||||||||||||||
| Average Tangible Common Equity (Non-GAAP) | ||||||||||||||||||||
| Average total equity (GAAP) | $ | 6,609 | $ | 4,920 | $ | 4,617 | ||||||||||||||
| Less: Average noncontrolling interest (a) | 295 | 295 | 295 | |||||||||||||||||
| Less: Average preferred stock (a) | 297 | 96 | 96 | |||||||||||||||||
| (G) Total average common equity | 6,017 | 4,529 | 4,226 | |||||||||||||||||
| Less: Average goodwill and other intangible assets (GAAP) (b) | 1,696 | 1,575 | 1,570 | |||||||||||||||||
|
FIRST HORIZON CORPORATION
|
102
|
2020 FORM 10-K ANNUAL REPORT | ||||||
| (H) Average tangible common equity (Non-GAAP) | $ | 4,321 | $ | 2,954 | $ | 2,656 | ||||||||||||||
| Net Income Available to Common Shareholders | ||||||||||||||||||||
| (I) Net income available to common shareholders | $ | 822 | $ | 435 | $ | 539 | ||||||||||||||
| Risk Weighted Assets | ||||||||||||||||||||
| (J) Risk weighted assets (c) | $ | 63,140 | $ | 37,046 | $ | 33,003 | ||||||||||||||
| Period-end shares outstanding | ||||||||||||||||||||
| (K) Period-end shares outstanding | 555,031 | 311,469 | 318,573 | |||||||||||||||||
| Ratios | ||||||||||||||||||||
| (A)/(E) Total period-end equity to period-end assets (GAAP) | 9.86 | % | 11.72 | % | 11.72 | % | ||||||||||||||
| (C)/(F) Tangible common equity to tangible assets (Non-GAAP) | 6.89 | 7.48 | 7.15 | |||||||||||||||||
| (D)/(J) Adjusted tangible common equity to risk weighted assets (Non-GAAP) | 8.82 | 8.34 | 8.73 | |||||||||||||||||
| (I)/(G) Return on average common equity (GAAP) | 13.66 | 9.60 | 12.75 | |||||||||||||||||
| (I)/(H) Return on average tangible common equity (Non-GAAP) | 19.03 | 14.72 | 20.28 | |||||||||||||||||
| (B)/(K) Book value per common share (GAAP) | $ | 13.59 | $ | 15.04 | $ | 13.79 | ||||||||||||||
| (C)/(K) Tangible book value per common share (Non-GAAP) | $ | 10.23 | $ | 10.02 | $ | 8.81 | ||||||||||||||
(a)
Included in Total equity on the Consolidated Balance Sheets.
(b)
Includes Goodwill and other intangible assets, net of amortization.
(c)
Defined by and calculated in conformity with bank regulations applicable to FHN.
|
FIRST HORIZON CORPORATION
|
103
|
2020 FORM 10-K ANNUAL REPORT | ||||||
|
ITEM 7A. QUANTITATIVE AND QUALITATIVE DISCLOSURES ABOUT MARKET RISK
|
||||||||
The information called for by this Item is incorporated herein by reference to: 2020 MD&A (Item 7); and to Note 22-Derivatives and Note 23-Master Netting and Similar Agreements - Repurchase, Reverse Repurchase, and Securities Borrowing Transactions of 2020 Financial Statements (Item 8), which appear, respectively, on pages 202-209 and 210-211 of 2020
Financial Statements (Item 8). Within 2020 MD&A, these sections are especially pertinent to this Item 7A:
Market Risk Management
and
Interest Rate Risk Management
appearing, respectively, on pages 88-90 and 90-91 of this report.
|
FIRST HORIZON CORPORATION
|
104
|
2020 FORM 10-K ANNUAL REPORT | ||||||
|
ITEM 8. FINANCIAL STATEMENTS AND SUPPLEMENTARY DATA
|
||||||||
Financial statements, related notes, and certain reports and other information required by this Item is presented following this page.
|
FIRST HORIZON CORPORATION
|
105
|
2020 FORM 10-K ANNUAL REPORT | ||||||
REPORT OF MANAGEMENT
ON INTERNAL CONTROL OVER FINANCIAL REPORTING
Management at First Horizon Corporation is responsible for establishing and maintaining adequate internal control over financial reporting as defined in Rules 13a-15(f) and 15d-15(f) under the Securities Exchange Act of 1934. First Horizon Corporation’s internal control over financial reporting is a process designed to provide reasonable assurance regarding the reliability of financial reporting and the preparation of financial statements for external purposes in accordance with generally accepted accounting principles.
Even effective internal controls, no matter how well designed, have inherent limitations such as the possibility of human error or of circumvention or overriding of controls, and consideration of cost in relation to benefit of a control. Moreover, effectiveness must necessarily be considered according to the existing state of the art of internal control. Further, because of changes in conditions, the effectiveness of internal controls may diminish over time.
Management assessed the effectiveness of First Horizon Corporation’s internal control over financial reporting as of December 31, 2020. This assessment was based on criteria established in
Internal Control – Integrated Framework (2013)
issued by the Committee of Sponsoring Organizations of the Treadway Commission (COSO).
Based on our assessment and those criteria, management believes that First Horizon Corporation maintained effective internal control over financial reporting as of December 31, 2020.
On July 1, 2020, First Horizon Corporation (FHN) and IBERIABANK Corporation (IBKC) closed their merger of equals transaction. See Note 2 – Acquisitions and Divestitures of our consolidated financial statements for additional information. IBKC represented approximately 33% of our consolidated total assets as of December 31, 2020 and approximately 18% of our consolidated total revenues for the year then ended. As permitted by the Securities and Exchange Commission, management has elected to exclude IBKC from its assessment of internal control over financial reporting as of December 31, 2020.
KPMG LLP, the independent registered public accounting firm that audited FHN’s financial statements, issued an audit report on FHN’s internal control over financial reporting. That report appears on the following page.
|
FIRST HORIZON CORPORATION
|
106
|
2020 FORM 10-K ANNUAL REPORT | ||||||
Report of Independent Registered Public Accounting Firm
To the Shareholders and Board of Directors
First Horizon Corporation:
Opinion on Internal Control Over Financial Reporting
We have audited First Horizon Corporation and subsidiaries' (the Company) internal control over financial reporting as of December 31, 2020, based on criteria established in
Internal Control – Integrated Framework (2013)
issued by the Committee of Sponsoring Organizations of the Treadway Commission. In our opinion, the Company maintained, in all material respects, effective internal control over financial reporting as of December 31, 2020, based on criteria established in
Internal Control – Integrated Framework (2013)
issued by the Committee of Sponsoring Organizations of the Treadway Commission.
We also have audited, in accordance with the standards of the Public Company Accounting Oversight Board (United States) (PCAOB), the consolidated balance sheets of the Company as of December 31, 2020 and 2019, the related consolidated statements of income, comprehensive income, changes in equity, and cash flows for each of the years in the three-year period ended December 31, 2020, and the related notes (collectively, the consolidated financial statements), and our report dated February 25, 2021 expressed an unqualified opinion on those consolidated financial statements.
The Company acquired IBERIABANK Corporation during the year ended December 31, 2020, and management excluded from its assessment of the effectiveness of the Company’s internal control over financial reporting as of December 31, 2020, IBERIABANK Corporation’s internal control over financial reporting associated with approximately 33% of total assets and approximately 18% of total revenue included in the consolidated financial statements of the Company as of and for the year ended December 31, 2020. Our audit of internal control over financial reporting of the Company also excluded an evaluation of the internal control over financial reporting of IBERIABANK Corporation.
Basis for Opinion
The Company’s management is responsible for maintaining effective internal control over financial reporting and for its assessment of the effectiveness of internal control over financial reporting, included in the accompanying Report of Management on Internal Control Over Financial Reporting. Our responsibility is to express an opinion on the Company’s internal control over financial reporting based on our audit. We are a public accounting firm registered with the PCAOB and are required to be independent with respect to the Company in accordance with the U.S. federal securities laws and the applicable rules and regulations of the Securities and Exchange Commission and the PCAOB.
We conducted our audit in accordance with the standards of the PCAOB. Those standards require that we plan and perform the audit to obtain reasonable assurance about whether effective internal control over financial reporting was maintained in all material respects. Our audit of internal control over financial reporting included obtaining an understanding of internal control over financial reporting, assessing the risk that a material weakness exists, and testing and evaluating the design and operating effectiveness of internal control based on the assessed risk. Our audit also included performing such other procedures as we considered necessary in the circumstances. We believe that our audit provides a reasonable basis for our opinion.
Definition and Limitations of Internal Control Over Financial Reporting
A company’s internal control over financial reporting is a process designed to provide reasonable assurance regarding the reliability of financial reporting and the preparation of financial statements for external purposes in accordance with generally accepted accounting principles. A company’s internal control over financial reporting includes those policies and procedures that (1) pertain to the maintenance of records that, in reasonable detail, accurately and fairly reflect the transactions and dispositions of the assets of the company; (2) provide reasonable assurance that transactions are recorded as necessary to permit preparation of financial statements in accordance with generally accepted accounting principles, and that receipts and expenditures of the company are being made only in accordance with authorizations of management and directors of the company; and (3) provide reasonable assurance regarding prevention or timely detection of unauthorized acquisition, use, or disposition of the company’s assets that could have a material effect on the financial statements.
|
FIRST HORIZON CORPORATION
|
107
|
2020 FORM 10-K ANNUAL REPORT | ||||||
Because of its inherent limitations, internal control over financial reporting may not prevent or detect misstatements. Also, projections of any evaluation of effectiveness to future periods are subject to the risk that controls may become inadequate because of changes in conditions, or that the degree of compliance with the policies or procedures may deteriorate.

Memphis, Tennessee
February 25, 2021
|
FIRST HORIZON CORPORATION
|
108
|
2020 FORM 10-K ANNUAL REPORT | ||||||
Report of Independent Registered Public Accounting Firm
To the Shareholders and Board of Directors
First Horizon Corporation:
Opinion on the Consolidated Financial Statements
We have audited the accompanying consolidated balance sheets of First Horizon Corporation and subsidiaries' (the Company) as of December 31, 2020 and 2019, the related consolidated statements of income, comprehensive income, changes in equity, and cash flows for each of the years in the three-year period ended December 31, 2020, and the related notes (collectively, the consolidated financial statements). In our opinion, the consolidated financial statements present fairly, in all material respects, the financial position of the Company as of December 31, 2020 and 2019, and the results of its operations and its cash flows for each of the years in the three-year period ended December 31, 2020, in conformity with U.S. generally accepted accounting principles.
We also have audited, in accordance with the standards of the Public Company Accounting Oversight Board (United States) (PCAOB), the Company’s internal control over financial reporting as of December 31, 2020, based on criteria established in
Internal Control – Integrated Framework (2013)
issued by the Committee of Sponsoring Organizations of the Treadway Commission, and our report dated February 25, 2021 expressed an unqualified opinion on the effectiveness of the Company’s internal control over financial reporting.
Change in Accounting Principle
As discussed in Note 1 to the consolidated financial statements, the Company has changed its method of accounting for the recognition and measurement of credit losses as of January 1, 2020 due to the adoption of ASC Topic 326,
Financial Instruments - Credit Losses
.
Basis for Opinion
These consolidated financial statements are the responsibility of the Company’s management. Our responsibility is to express an opinion on these consolidated financial statements based on our audits. We are a public accounting firm registered with the PCAOB and are required to be independent with respect to the Company in accordance with the U.S. federal securities laws and the applicable rules and regulations of the Securities and Exchange Commission and the PCAOB.
We conducted our audits in accordance with the standards of the PCAOB. Those standards require that we plan and perform the audit to obtain reasonable assurance about whether the consolidated financial statements are free of material misstatement, whether due to error or fraud. Our audits included performing procedures to assess the risks of material misstatement of the consolidated financial statements, whether due to error or fraud, and performing procedures that respond to those risks. Such procedures included examining, on a test basis, evidence regarding the amounts and disclosures in the consolidated financial statements. Our audits also included evaluating the accounting principles used and significant estimates made by management, as well as evaluating the overall presentation of the consolidated financial statements. We believe that our audits provide a reasonable basis for our opinion.
Critical Audit Matters
The critical audit matters communicated below are matters arising from the current period audit of the consolidated financial statements that were communicated or required to be communicated to the audit committee and that: (1) relate to accounts or disclosures that are material to the consolidated financial statements and (2) involved our especially challenging, subjective, or complex judgments. The communication of critical audit matters does not alter in any way our opinion on the consolidated financial statements, taken as a whole, and we are not, by communicating the critical audit matters below, providing separate opinions on the critical audit matters or on the accounts or disclosures to which they relate.
Adoption of ASC 326 and allowance for loan losses for loans collectively evaluated for impairment
As discussed in Note 1 to the consolidated financial statements, the Company adopted ASU No. 2016-13, Financial Instruments – Credit Losses (ASC Topic 326), as of January 1, 2020. The total allowance for loan
|
FIRST HORIZON CORPORATION
|
109
|
2020 FORM 10-K ANNUAL REPORT | ||||||
losses as of January 1, 2020 was $107 million, a portion of which related to the allowance for loan losses evaluated on a collective basis (the January 1, 2020 collective ALLL). As discussed in Notes 1 and 5 to the consolidated financial statements, the Company’s allowance for loan losses was $963 million, of which a portion related to the allowance for loan losses at December 31, 2020 (the December 31, 2020 collective ALLL). The January 1, 2020 collective ALLL and the December 31, 2020 collective ALLL (both, the collective ALLL) include the measure of expected loan losses on a collective (pooled) basis for those loans that share similar risk characteristics. The Company estimated the collective ALLL using a current expected loan losses methodology which is based on relevant information about historical experience, current conditions, and reasonable and supportable forecasts that affect the collectability of the loan balances. The expected loan losses are the product of multiplying the Company’s estimates of probability of default (PD), loss given default (LGD), and individual loan level exposure as default (EAD) on an undiscounted basis. The Company uses models to develop the PD and LGD, which incorporate a single macroeconomic forecast over a four year reasonable and supportable forecast period. After the reasonable and supportable forecast period, the Company immediately reverts to its historical loss averages, evaluated over the historical observation period, for the remaining life of the loans. The Company uses prepayment models which project prepayments over the life of the loans. In order to capture the unique risks of the loan portfolio within the PD, LGD, and prepayment models, the Company segments the portfolio into pools, incorporating loan grades for commercial loans. The Company uses qualitative adjustments to adjust historical loss information in situations where current loan characteristics differ from those in the historical loss information and for recent changes in economic conditions, macroeconomic forecasts and other factors.
We identified the assessment of the collective ALLL as a critical audit matter. A high degree of audit effort, including specialized skills and knowledge, and subjective and complex auditor judgment was involved in the assessment due to significant measurement uncertainty. Specifically, the assessment encompassed the evaluation of the collective ALLL methodology, including the methods and models used to estimate (1) the PD, LGD, and prepayments and their significant assumptions, including portfolio segmentation, the economic forecast scenario and macroeconomic assumptions, the reasonable and supportable forecast periods, the historical observation period, and loan grades for commercial loans, and (2) the qualitative adjustments, and their significant assumptions, including the identification and evaluation of model and data limitations and the assessment of stressed loan portfolios that are most exposed to the effects of the COVID-19 pandemic. The assessment also included an evaluation of the conceptual soundness and performance of the PD, LGD and prepayment models. In addition, auditor judgment was required to evaluate the sufficiency of the audit evidence obtained.
The following are the primary procedures we performed to address this critical audit matter. We evaluated the design and tested the operating effectiveness of certain internal controls related to the Company’s measurement of the collective ALLL estimates, including controls over the:
•
development of the collective ALLL methodology
•
development of the PD, LGD, and prepayment models
•
performance monitoring of the PD, LGD and prepayment models for the December 31, 2020 collective ALLL
•
identification and determination of the significant assumptions used in the PD, LGD, and prepayment models
•
development of the qualitative adjustments, including the significant assumptions used in the measurement of the qualitative adjustments
•
analysis of the collective ALLL results, trends, and ratios.
We evaluated the Company’s process to develop the collective ALLL estimates by testing certain sources of data, factors, and assumptions that the Company used, and considered the relevance and reliability of such data, factors and assumptions. In addition, we involved credit risk professionals with specialized skills and knowledge, who assisted in:
•
evaluating the Company’s collective ALLL methodology for compliance with U.S. generally accepted accounting principles
|
FIRST HORIZON CORPORATION
|
110
|
2020 FORM 10-K ANNUAL REPORT | ||||||
•
evaluating judgments made by the Company relative to the development and performance testing of the PD, LGD, and prepayment models by comparing to relevant Company specific metrics and trends and the applicable industry and regulatory practices
•
assessing the conceptual soundness and performance testing of the PD, LGD, and prepayment models by inspecting model documentation to determine whether the models are suitable for their intended use
•
evaluating the selection of the economic forecast scenario by comparing to the Company’s business environment and relevant industry practices
•
evaluating the length of the historical observation period and reasonable and supportable forecast periods by comparing to the specific portfolio risk characteristics and trends
•
determining whether the loan portfolio is segmented by similar risk characteristics by comparing to the Company’s business environment and relevant industry practices
•
testing individual credit risk ratings for a selection of commercial loan borrower relationships by evaluating the financial performance of the borrower, sources of repayment, underlying collateral, and relevant guarantees
•
evaluating the methodology used to develop the qualitative adjustments and the effect of those adjustments on the collective ALLL compared with relevant credit risk factors and consistency with credit trends and identified limitations of underlying quantitative models.
We also assessed the sufficiency of the audit evidence obtained related to the collective ALLL by evaluating the:
•
cumulative results of the audit procedures
•
qualitative aspects of the Company’s accounting practice
•
potential bias in the accounting estimates.
Assessment of the allowance for loan losses for loans evaluated on a collective basis acquired in the acquisition of IBERIABANK Corporation
As discussed in Notes 2 and 5 to the consolidated financial statements, on July 1, 2020, First Horizon Corporation closed on a merger of equals with IBERIABANK Corporation (IBKC). The Company’s allowance for loan losses for acquired loans evaluated on a collective basis was $431 million, a substantial portion of which related to IBKC at July 1, 2020 (the July 1, 2020 IBKC collective ALLL). As discussed in Notes 1 and 5 to the consolidated financial statements, the Company’s allowance for loan losses was $963 million, a portion of which related to the allowance for loan losses for IBKC loans evaluated on a collective basis at December 31, 2020 (the December 31, 2020 IBKC collective ALLL). The July 1, 2020 IBKC collective ALLL and December 31, 2020 IBKC collective ALLL (both, the IBKC collective ALLL) includes the measure of expected loan losses on a collective (pooled) basis for those loans that share similar risk characteristics. The Company estimates the IBKC collective ALLL using a current expected loans losses methodology which is based on relevant information about historical experience, current conditions, and reasonable and supportable forecasts that affect the collectability of the loan balances. The expected loan losses are the product of multiplying the Company’s estimates of probability of default (PD), loss given default (LGD), and individual loan level exposure as default (EAD) on an undiscounted basis. The Company uses models to develop the PD and LGD, which incorporate a single macroeconomic forecast over a four year reasonable and supportable forecast period. After the reasonable and supportable forecast period, the Company immediately reverts to its historical loss averages, evaluated over the historical observation period, for the remaining life of the loans. The Company uses prepayment models which project prepayments over the life of the loans. In order to capture the unique risks of the loan portfolio within the PD, LGD, and prepayment models, the Company segments the portfolio into pools, incorporating loan grades for C&I and CRE construction loans. The Company uses qualitative adjustments to adjust historical
|
FIRST HORIZON CORPORATION
|
111
|
2020 FORM 10-K ANNUAL REPORT | ||||||
loss information in situations where current loan characteristics differ from those in the historical loss information and for recent changes in economic conditions, macroeconomic forecasts and other factors.
We identified the assessment of the IBKC collective ALLL as a critical audit matter. A high degree of audit effort, including specialized skills and knowledge, and subjective and complex auditor judgment was involved in the assessment due to significant measurement uncertainty. Specifically, the assessment encompassed the evaluation of the IBKC collective ALLL methodology, including the methods and models used to estimate (1) the PD, LGD, and prepayments and their significant assumptions, including portfolio segmentation, the economic forecast scenario and macroeconomic assumptions, the reasonable and supportable forecast periods, the historical observation period, and loan grades for C&I and CRE construction loans, and (2) the qualitative adjustments, and their significant assumptions, including the identification and evaluation of model and data limitations and the assessment of stressed loan portfolios that are most exposed to the effects of the COVID-19 pandemic. The assessment also included an evaluation of the conceptual soundness and performance of the PD, LGD and prepayments models. In addition, auditor judgment was required to evaluate the sufficiency of the audit evidence obtained.
The following are the primary procedures we performed to address this critical audit matter. We evaluated the design of certain internal controls related to the Company’s measurement of the IBKC collective ALLL estimates, including controls over the:
•
development of the IBKC collective ALLL methodology
•
development of the PD, LGD, and prepayment models
•
performance monitoring of the PD, LGD and prepayment models for the December 31, 2020 IBKC collective ALLL
•
identification and determination of the significant assumptions used in the PD, LGD, and prepayment models
•
development of the qualitative adjustments, including the significant assumptions used in the measurement of the qualitative adjustments
•
analysis of the IBKC collective ALLL results, trends, and ratios.
In addition, we evaluated the design and tested the operating effectiveness of certain internal controls related to the Company’s measurement of the July 1, 2020 IBKC collective ALLL, including controls over the appropriateness of risk ratings and the evaluation of the methodology and assumptions used in the estimation of the July 1, 2020 IBKC collective ALLL, including the development of qualitative adjustments and analysis of results.
We evaluated the Company’s process to develop the IBKC collective ALLL estimates by testing certain sources of data, factors, and assumptions that the Company used, and considered the relevance and reliability of such data, factors and assumptions. In addition, we involved credit risk professionals with specialized skills and knowledge, who assisted in:
•
evaluating the Company’s IBKC collective ALLL methodology for compliance with U.S. generally accepted accounting principles
•
evaluating judgments made by the Company relative to the development and performance testing of the PD, LGD, and prepayment models by comparing them to relevant Company-specific metrics and trends and the applicable industry and regulatory practices
•
assessing the conceptual soundness and performance testing of the PD, LGD, and prepayment models by inspecting model documentation to determine whether the models are suitable for their intended use
•
evaluating the selection of the economic forecast scenario by comparing to the Company’s business environment and relevant industry practices
|
FIRST HORIZON CORPORATION
|
112
|
2020 FORM 10-K ANNUAL REPORT | ||||||
•
evaluating the length of the historical observation period and reasonable and supportable forecast periods by comparing to the specific portfolio risk characteristics and trends
•
determining whether the loan portfolio is segmented by similar risk characteristics by comparing to the Company’s business environment and relevant industry practices
•
testing individual credit risk ratings for a selection of C&I and CRE construction loan borrower relationships by evaluating the financial performance of the borrower, sources of repayment, underlying collateral, and relevant guarantees
•
evaluating the methodology used to develop the qualitative adjustments and the effect of those adjustments on the IBKC collective ALLL compared with relevant credit risk factors and consistency with credit trends and identified limitations of underlying quantitative models.
We also assessed the sufficiency of the audit evidence obtained related to the IBKC collective ALLL by evaluating the:
•
cumulative results of the audit procedures
•
qualitative aspects of the Company’s accounting practice
•
potential bias in the accounting estimates.
Valuation of acquired loans and the core deposit intangible in the acquisition of IBERIABANK Corporation
As discussed in Note 2 and 7 to the consolidated financial statements, on July 1, 2020, First Horizon Corporation (the Company) closed on a merger of equals transaction with IBERIABANK Corporation (the Merger). The assets acquired and liabilities assumed are generally required to be measured at fair value at the date of acquisition under the purchase method of accounting. The Company acquired loans and leases with a fair value of $26 billion and established a core deposit intangible (CDI) asset with a fair value of $207 million. The fair value of acquired loans and leases is based on a discounted cash flow methodology that projected principal and interest payments using key assumptions of market implied credit losses (probability of default, loss given default), discount rate, and prepayment rate. The fair value of the CDI asset is based on an income approach methodology whereby projected net cash flow benefits are derived from estimating costs to carry deposits compared to alternative funding costs, and includes key assumptions related to discount rates, interest costs, deposit attrition rates, alternative costs of funds, and net maintenance costs.
We identified the valuation of acquired loans and leases and the CDI asset in the Merger as a critical audit matter. These fair value measurements involved a high degree of measurement uncertainty and subjectivity, which required specialized skills and knowledge to evaluate. Specifically, the assessment of these fair value measurements encompassed the evaluation of the methodologies used to measure the fair value of acquired loans and leases and the CDI asset, including the key assumptions and the inputs used to develop the key assumptions. In addition, auditor judgment was required to evaluate the sufficiency of the audit evidence obtained.
The following are the primary procedures we performed to address this critical audit matter. We evaluated the design and tested the operating effectiveness of certain internal control related to the Company’s valuation of acquired loans and leases and the CDI asset, including controls over:
•
development of the fair value methodologies
•
identification and determination of the key assumptions
•
assessment of the overall valuation.
We evaluated the Company’s process to develop the valuation of acquired loans and leases and the CDI asset by testing certain sources of data and assumptions that the Company used and considered the relevance and reliability of such data and assumptions. We involved valuation professionals with specialized skills and knowledge, who assisted in:
|
FIRST HORIZON CORPORATION
|
113
|
2020 FORM 10-K ANNUAL REPORT | ||||||
•
evaluating the overall fair value methodology used by the Company to estimate the fair value for certain acquired loans and leases and the CDI asset for compliance with U.S. generally accepted accounting principles
•
developing independent ranges of fair value for certain acquired loans and leases, including the development of independent assumptions utilizing market data for implied credit loss, discount rate and prepayment rate assumptions
•
assessing the Company’s estimate of fair value for certain acquired loans and leases by comparing it to the independently developed ranges
•
developing an independent range of fair value for the CDI asset, including 1) evaluating deposit attrition rates, by calculating deposit attrition rates using the Company’s account closure data and comparing them to publicly available deposit attrition data 2) deriving net maintenance costs, alternative cost of funds and interest costs from publicly available data and 3) developing an independent assumption for the discount rate, utilizing market data
•
assessing the Company’s estimate of the fair value for the CDI asset by comparing it to the independently developed range.
We also assessed the sufficiency of the audit evidence obtained related to the valuation of acquired loans and the CDI asset by evaluating the:
•
cumulative results of the audit procedures
•
qualitative aspects of the Company’s accounting practice
•
potential bias in the accounting estimates.
We have served as the Company’s auditor since 2002.
Memphis, Tennessee
February 25, 2021
|
FIRST HORIZON CORPORATION
|
114
|
2020 FORM 10-K ANNUAL REPORT | ||||||
CONSOLIDATED BALANCE SHEETS
| December 31 | ||||||||||||||
| (Dollars in millions, except per share amounts) | 2020 | 2019 | ||||||||||||
| Assets | ||||||||||||||
| Cash and due from banks | $ |
|
$ |
|
||||||||||
| Interest-bearing deposits with banks |
|
|
||||||||||||
| Federal funds sold and securities purchased under agreements to resell |
|
|
||||||||||||
| Trading securities |
|
|
||||||||||||
| Securities available for sale at fair value |
|
|
||||||||||||
|
Loans held for sale (including $
|
|
|
||||||||||||
|
Loans and leases (including $
|
|
|
||||||||||||
| Allowance for loan and lease losses |
(
|
(
|
||||||||||||
| Net loans and leases |
|
|
||||||||||||
| Premises and equipment |
|
|
||||||||||||
| Goodwill |
|
|
||||||||||||
| Other intangible assets |
|
|
||||||||||||
| Other assets |
|
|
||||||||||||
| Total assets | $ |
|
$ |
|
||||||||||
| Liabilities | ||||||||||||||
| Noninterest-bearing deposits | $ |
|
$ |
|
||||||||||
| Interest-bearing deposits |
|
|
||||||||||||
| Total deposits |
|
|
||||||||||||
| Trading liabilities |
|
|
||||||||||||
| Short-term borrowings |
|
|
||||||||||||
| Term borrowings |
|
|
||||||||||||
| Other liabilities |
|
|
||||||||||||
| Total liabilities |
|
|
||||||||||||
| Equity | ||||||||||||||
|
Preferred stock, Non-cumulative perpetual, no par value; authorized
|
|
|
||||||||||||
|
Common stock, $
|
|
|
||||||||||||
| Capital surplus |
|
|
||||||||||||
| Retained earnings |
|
|
||||||||||||
| Accumulated other comprehensive loss, net |
(
|
(
|
||||||||||||
| FHN shareholders' equity |
|
|
||||||||||||
| Noncontrolling interest |
|
|
||||||||||||
| Total equity |
|
|
||||||||||||
| Total liabilities and equity | $ |
|
$ |
|
||||||||||
Certain previously reported amounts have been reclassified to agree with current presentation.
See accompanying notes to consolidated financial statements.
|
FIRST HORIZON CORPORATION
|
115
|
2020 FORM 10-K ANNUAL REPORT | ||||||
CONSOLIDATED STATEMENTS OF INCOME
| Year Ended December 31 | ||||||||||||||||||||
| (Dollars in millions, except per share data; shares in thousands) | 2020 | 2019 | 2018 | |||||||||||||||||
| Interest income | ||||||||||||||||||||
| Interest and fees on loans and leases | $ |
|
$ |
|
$ |
|
||||||||||||||
| Interest and fees on loans held for sale |
|
|
|
|||||||||||||||||
| Interest on securities available for sale |
|
|
|
|||||||||||||||||
| Interest on trading securities |
|
|
|
|||||||||||||||||
| Interest on other earning assets |
|
|
|
|||||||||||||||||
| Total interest income |
|
|
|
|||||||||||||||||
| Interest expense | ||||||||||||||||||||
| Interest on deposits |
|
|
|
|||||||||||||||||
| Interest on trading liabilities |
|
|
|
|||||||||||||||||
| Interest on short-term borrowings |
|
|
|
|||||||||||||||||
| Interest on term borrowings |
|
|
|
|||||||||||||||||
| Total interest expense |
|
|
|
|||||||||||||||||
| Net interest income |
|
|
|
|||||||||||||||||
| Provision for credit losses |
|
|
|
|||||||||||||||||
| Net interest income after provision for credit losses |
|
|
|
|||||||||||||||||
| Noninterest income | ||||||||||||||||||||
| Fixed income |
|
|
|
|||||||||||||||||
| Deposit transactions and cash management |
|
|
|
|||||||||||||||||
| Mortgage banking and title income |
|
|
|
|||||||||||||||||
| Brokerage, management fees and commissions |
|
|
|
|||||||||||||||||
| Trust services and investment management |
|
|
|
|||||||||||||||||
| Bankcard income |
|
|
|
|||||||||||||||||
| Securities gains (losses), net |
(
|
|
|
|||||||||||||||||
| Purchase accounting gain |
|
|
|
|||||||||||||||||
| Other income |
|
|
|
|||||||||||||||||
| Total noninterest income |
|
|
|
|||||||||||||||||
| Noninterest expense | ||||||||||||||||||||
| Personnel expense |
|
|
|
|||||||||||||||||
| Net occupancy expense |
|
|
|
|||||||||||||||||
| Computer software |
|
|
|
|||||||||||||||||
| Legal and professional fees |
|
|
|
|||||||||||||||||
| Operations services |
|
|
|
|||||||||||||||||
| Contributions |
|
|
|
|||||||||||||||||
| Equipment expense |
|
|
|
|||||||||||||||||
| Amortization of intangible assets |
|
|
|
|||||||||||||||||
| Communications and delivery |
|
|
|
|||||||||||||||||
| Advertising and public relations |
|
|
|
|||||||||||||||||
| Other expense |
|
|
|
|||||||||||||||||
| Total noninterest expense |
|
|
|
|||||||||||||||||
| Income before income taxes |
|
|
|
|||||||||||||||||
| Income tax expense |
|
|
|
|||||||||||||||||
| Net income | $ |
|
$ |
|
$ |
|
||||||||||||||
|
FIRST HORIZON CORPORATION
|
116
|
2020 FORM 10-K ANNUAL REPORT | ||||||
| Net income attributable to noncontrolling interest |
|
|
|
|||||||||||||||||
| Net income attributable to controlling interest | $ |
|
$ |
|
$ |
|
||||||||||||||
| Preferred stock dividends |
|
|
|
|||||||||||||||||
| Net income available to common shareholders | $ |
|
$ |
|
$ |
|
||||||||||||||
| Basic earnings per share | $ |
|
$ |
|
$ |
|
||||||||||||||
| Diluted earnings per share | $ |
|
$ |
|
$ |
|
||||||||||||||
| Weighted average common shares |
|
|
|
|||||||||||||||||
| Diluted average common shares |
|
|
|
|||||||||||||||||
Certain previously reported amounts have been reclassified to agree with current presentation.
See accompanying notes to consolidated financial statements.
|
FIRST HORIZON CORPORATION
|
117
|
2020 FORM 10-K ANNUAL REPORT | ||||||
CONSOLIDATED STATEMENTS OF COMPREHENSIVE INCOME
| Year Ended December 31 | ||||||||||||||||||||
| (Dollars in millions) | 2020 | 2019 | 2018 | |||||||||||||||||
| Net income | $ |
|
$ |
|
$ |
|
||||||||||||||
| Other comprehensive income (loss), net of tax: | ||||||||||||||||||||
| Net unrealized gains (losses) on securities available for sale |
|
|
(
|
|||||||||||||||||
| Net unrealized gains (losses) on cash flow hedges |
|
|
(
|
|||||||||||||||||
| Net unrealized gains (losses) on pension and other postretirement plans |
|
|
|
|||||||||||||||||
| Other comprehensive income (loss) |
|
|
(
|
|||||||||||||||||
| Comprehensive income |
|
|
|
|||||||||||||||||
| Comprehensive income attributable to noncontrolling interest |
|
|
|
|||||||||||||||||
| Comprehensive income attributable to controlling interest | $ |
|
$ |
|
$ |
|
||||||||||||||
| Income tax expense (benefit) of items included in Other comprehensive income: | ||||||||||||||||||||
| Net unrealized gains (losses) on securities available for sale | $ |
|
$ |
|
$ |
(
|
||||||||||||||
| Net unrealized gains (losses) on cash flow hedges |
|
|
(
|
|||||||||||||||||
| Net unrealized gains (losses) on pension and other postretirement plans |
|
|
|
|||||||||||||||||
See accompanying notes to consolidated financial statements.
|
FIRST HORIZON CORPORATION
|
118
|
2020 FORM 10-K ANNUAL REPORT | ||||||
CONSOLIDATED STATEMENTS OF CHANGES IN EQUITY
| Preferred Stock | Common Sock | |||||||||||||||||||||||||||||||||||||||||||||||||||||||
| (Dollars in millions, except per share data, shares in thousands) | Shares | Amount | Shares | Amount |
Capital
Surplus |
Retained Earnings |
Accumulated
Other Comprehensive Income (Loss) (a) |
Noncontrolling Interest | Total | |||||||||||||||||||||||||||||||||||||||||||||||
| Balance, December 31, 2017 |
|
$ |
|
|
$ |
|
$ |
|
$ |
|
$ |
(
|
$ |
|
$ |
|
||||||||||||||||||||||||||||||||||||||||
| — | — | — | — | — |
|
(
|
— | — | ||||||||||||||||||||||||||||||||||||||||||||||||
| Beginning balance, as adjusted |
|
|
|
|
|
|
(
|
|
|
|||||||||||||||||||||||||||||||||||||||||||||||
| Net income | — | — | — | — | — |
|
— |
|
|
|||||||||||||||||||||||||||||||||||||||||||||||
| Other comprehensive income (loss) | — | — | — | — | — | — |
(
|
— |
(
|
|||||||||||||||||||||||||||||||||||||||||||||||
| Comprehensive income (loss) | — | — | — | — | — |
|
(
|
|
|
|||||||||||||||||||||||||||||||||||||||||||||||
| Cash dividends declared: | ||||||||||||||||||||||||||||||||||||||||||||||||||||||||
|
Preferred stock ($
|
— | — | — | — | — |
(
|
— | — |
(
|
|||||||||||||||||||||||||||||||||||||||||||||||
|
Common stock $
|
— | — | — | — | — |
(
|
— | — |
(
|
|||||||||||||||||||||||||||||||||||||||||||||||
| Common stock repurchased (b) | — | — |
(
|
(
|
(
|
— | — | — |
(
|
|||||||||||||||||||||||||||||||||||||||||||||||
| Common stock issued for: | ||||||||||||||||||||||||||||||||||||||||||||||||||||||||
| Stock options and restricted stock - equity awards | — | — |
|
|
|
— | — | — |
|
|||||||||||||||||||||||||||||||||||||||||||||||
| Acquisition equity adjustment | — | — |
(
|
(
|
(
|
— | — | — |
(
|
|||||||||||||||||||||||||||||||||||||||||||||||
| Stock-based compensation expense | — | — | — | — |
|
— | — | — |
|
|||||||||||||||||||||||||||||||||||||||||||||||
| Dividends declared - noncontrolling interest of subsidiary preferred stock | — | — | — | — | — | — | — |
(
|
(
|
|||||||||||||||||||||||||||||||||||||||||||||||
| Other | — | — |
(
|
— | — | — | — | — | — | |||||||||||||||||||||||||||||||||||||||||||||||
| Balance, December 31, 2018 |
|
|
|
|
|
|
(
|
|
|
|||||||||||||||||||||||||||||||||||||||||||||||
| — | — | — | — | — |
(
|
— | — |
(
|
||||||||||||||||||||||||||||||||||||||||||||||||
| Beginning balance, as adjusted |
|
|
|
|
|
|
(
|
|
|
|||||||||||||||||||||||||||||||||||||||||||||||
| Net income | — | — | — | — | — |
|
— |
|
|
|||||||||||||||||||||||||||||||||||||||||||||||
| Other comprehensive income (loss) | — | — | — | — | — | — |
|
— |
|
|||||||||||||||||||||||||||||||||||||||||||||||
| Comprehensive income (loss) | — | — | — | — | — |
|
|
|
|
|||||||||||||||||||||||||||||||||||||||||||||||
| Cash dividends declared: | ||||||||||||||||||||||||||||||||||||||||||||||||||||||||
|
Preferred stock ($
|
— | — | — | — | — |
(
|
— | — |
(
|
|||||||||||||||||||||||||||||||||||||||||||||||
|
Common stock ($
|
— | — | — | — | — |
(
|
— | — |
(
|
|||||||||||||||||||||||||||||||||||||||||||||||
| Common stock repurchased (b) | — | — |
(
|
(
|
(
|
— | — | — |
(
|
|||||||||||||||||||||||||||||||||||||||||||||||
| Common stock issued for: | ||||||||||||||||||||||||||||||||||||||||||||||||||||||||
| Stock options and restricted stock - equity awards | — | — |
|
|
|
— | — | — |
|
|||||||||||||||||||||||||||||||||||||||||||||||
| Stock-based compensation expense | — | — | — | — |
|
— | — | — |
|
|||||||||||||||||||||||||||||||||||||||||||||||
| Dividends declared - noncontrolling interest of subsidiary preferred stock | — | — | — | — | — | — | — |
(
|
(
|
|||||||||||||||||||||||||||||||||||||||||||||||
| Balance, December 31, 2019 |
|
|
|
|
|
|
(
|
|
|
|||||||||||||||||||||||||||||||||||||||||||||||
| — | — | — | — | — |
(
|
— | — |
(
|
||||||||||||||||||||||||||||||||||||||||||||||||
| Beginning balance, as adjusted |
|
|
|
|
|
|
(
|
|
|
|||||||||||||||||||||||||||||||||||||||||||||||
| Net income | — | — | — | — | — |
|
— |
|
|
|||||||||||||||||||||||||||||||||||||||||||||||
| Other comprehensive income (loss) | — | — | — | — | — | — |
|
— |
|
|||||||||||||||||||||||||||||||||||||||||||||||
| Comprehensive income (loss) | — |
|
— | — | — |
|
|
|
|
|||||||||||||||||||||||||||||||||||||||||||||||
| Cash dividends declared: | ||||||||||||||||||||||||||||||||||||||||||||||||||||||||
| Preferred stock | — | — | — | — | — |
(
|
— | — |
(
|
|||||||||||||||||||||||||||||||||||||||||||||||
|
Common stock ($
|
— | — | — | — | — |
(
|
— | — |
(
|
|||||||||||||||||||||||||||||||||||||||||||||||
|
Preferred stock issuance (
|
|
|
— | — | — | — | — | — |
|
|||||||||||||||||||||||||||||||||||||||||||||||
| Common stock repurchased (b) | — | — |
(
|
— |
(
|
— | — | — |
(
|
|||||||||||||||||||||||||||||||||||||||||||||||
| Common stock issued for: | ||||||||||||||||||||||||||||||||||||||||||||||||||||||||
| Stock options and restricted stock - equity awards | — | — |
|
— |
|
— | — | — |
|
|||||||||||||||||||||||||||||||||||||||||||||||
| Issued in business combination (c) |
|
|
|
|
|
— | — | — |
|
|||||||||||||||||||||||||||||||||||||||||||||||
| Stock-based compensation expense | — | — | — | — |
|
— | — | — |
|
|||||||||||||||||||||||||||||||||||||||||||||||
| Dividends declared - noncontrolling interest of subsidiary preferred stock | — | — | — | — | — | — | — |
(
|
(
|
|||||||||||||||||||||||||||||||||||||||||||||||
| Other (d) | — | — |
(
|
— |
(
|
— | — | — |
(
|
|||||||||||||||||||||||||||||||||||||||||||||||
| Balance, December 31, 2020 |
|
$ |
|
|
$ |
|
$ |
|
$ |
|
$ |
(
|
$ |
|
$ |
|
||||||||||||||||||||||||||||||||||||||||
See accompanying notes to consolidated financial statements.
(a)
Due to the nature of the preferred stock issued by FHN and its subsidiaries, all components of Other comprehensive income (loss) have been attributed solely to FHN as the controlling interest holder.
|
FIRST HORIZON CORPORATION
|
119
|
2020 FORM 10-K ANNUAL REPORT | ||||||
(b)
2020, 2019, and 2018 include $
4
million, $
130
million, and $
99
million, respectively, repurchased under share repurchase programs.
(c)
See Note 2- Acquisitions and Divestitures for additional information.
(d)
Represents shares canceled in connection with the resolution of remaining CBF dissenters' appraisal process and to cover taxes on the IBKC equity compensation grants that automatically vested as part of the merger.
|
FIRST HORIZON CORPORATION
|
120
|
2020 FORM 10-K ANNUAL REPORT | ||||||
CONSOLIDATED STATEMENTS OF CASH FLOWS
| Year Ended December 31 | ||||||||||||||||||||
| (Dollars in millions) | 2020 | 2019 | 2018 | |||||||||||||||||
| Operating Activities | ||||||||||||||||||||
| Net income | $ |
|
$ |
|
$ |
|
||||||||||||||
| Adjustments to reconcile net income to net cash provided by (used in) operating activities: | ||||||||||||||||||||
| Provision for credit losses |
|
|
|
|||||||||||||||||
| Deferred income tax expense (benefit) |
(
|
|
|
|||||||||||||||||
| Depreciation and amortization of premises and equipment |
|
|
|
|||||||||||||||||
| Amortization of intangible assets |
|
|
|
|||||||||||||||||
| Net other amortization and accretion |
(
|
(
|
(
|
|||||||||||||||||
| Net (increase) decrease in derivatives |
(
|
(
|
|
|||||||||||||||||
| Purchase accounting gain |
(
|
|
|
|||||||||||||||||
| Stock-based compensation expense |
|
|
|
|||||||||||||||||
| Securities (gains) losses, net |
|
|
(
|
|||||||||||||||||
| Net (gains) losses on sale/disposal of fixed assets |
|
|
(
|
|||||||||||||||||
| (Gain) loss on BOLI |
(
|
(
|
(
|
|||||||||||||||||
| Loans held for sale: | ||||||||||||||||||||
| Purchases and originations |
(
|
(
|
(
|
|||||||||||||||||
| Gross proceeds from settlements and sales |
|
|
|
|||||||||||||||||
| (Gain) loss due to fair value adjustments and other |
(
|
(
|
|
|||||||||||||||||
| Other operating activities, net |
|
|
|
|||||||||||||||||
| Total adjustments |
(
|
|
(
|
|||||||||||||||||
| Net cash provided by (used in) operating activities |
|
|
|
|||||||||||||||||
| Investing Activities | ||||||||||||||||||||
| Proceeds from sales of securities available for sale |
|
|
|
|||||||||||||||||
| Proceeds from maturities of securities available for sale |
|
|
|
|||||||||||||||||
| Purchases of securities available for sale |
(
|
(
|
(
|
|||||||||||||||||
| Proceeds from sales of premises and equipment |
|
|
|
|||||||||||||||||
| Purchases of premises and equipment |
(
|
(
|
(
|
|||||||||||||||||
| Proceeds from sales and pay down of loans classified as held to maturity |
|
|
|
|||||||||||||||||
| Proceeds from BOLI |
|
|
|
|||||||||||||||||
| Net (increase) decrease in loans and leases |
(
|
(
|
|
|||||||||||||||||
| Net (increase) decrease in interest-bearing deposits with banks |
(
|
|
(
|
|||||||||||||||||
| Cash (paid) received for acquisitions, net |
|
|
(
|
|||||||||||||||||
| Other investing activities, net |
|
|
|
|||||||||||||||||
| Net cash provided by (used in) investing activities |
(
|
(
|
|
|||||||||||||||||
| Financing Activities | ||||||||||||||||||||
| Common stock: | ||||||||||||||||||||
| Stock options exercised |
|
|
|
|||||||||||||||||
| Cash dividends paid |
(
|
(
|
(
|
|||||||||||||||||
| Repurchase of shares (a) |
(
|
(
|
(
|
|||||||||||||||||
| Cancellation of common shares |
(
|
|
|
|||||||||||||||||
| Preferred stock issuance |
|
|
|
|||||||||||||||||
| Cash dividends paid - preferred stock - noncontrolling interest |
(
|
(
|
(
|
|||||||||||||||||
| Cash dividends paid - preferred stock |
(
|
(
|
(
|
|||||||||||||||||
| Net increase (decrease) in deposits |
|
(
|
|
|||||||||||||||||
| Net increase (decrease) in short-term borrowings |
(
|
|
(
|
|||||||||||||||||
| Proceeds from issuance of term borrowings |
|
|
|
|||||||||||||||||
| Payments/maturities on term borrowings |
(
|
(
|
(
|
|||||||||||||||||
| Increases (decreases) in restricted and secured term borrowings |
(
|
|
|
|||||||||||||||||
| Net cash provided by (used in) financing activities |
|
|
(
|
|||||||||||||||||
|
FIRST HORIZON CORPORATION
|
121
|
2020 FORM 10-K ANNUAL REPORT | ||||||
| Net increase (decrease) in cash and cash equivalents |
|
(
|
(
|
|||||||||||||||||
| Cash and cash equivalents at beginning of period |
|
|
|
|||||||||||||||||
| Cash and cash equivalents at end of period | $ |
|
$ |
|
$ |
|
||||||||||||||
| Supplemental Disclosures | ||||||||||||||||||||
| Total interest paid | $ |
|
$ |
|
$ |
|
||||||||||||||
| Total taxes paid |
|
|
|
|||||||||||||||||
| Total taxes refunded |
|
|
|
|||||||||||||||||
| Transfer from loans to OREO |
|
|
|
|||||||||||||||||
| Transfer from loans HFS to trading securities |
|
|
|
|||||||||||||||||
| Transfer from loans to loans HFS |
|
|
|
|||||||||||||||||
Certain previously reported amounts have been reclassified to agree with current presentation.
See accompanying notes to consolidated financial statements.
(a)
2019 and 2018 include $
130
million and $
99
million, respectively, repurchased under share repurchase programs.
|
FIRST HORIZON CORPORATION
|
122
|
2020 FORM 10-K ANNUAL REPORT | ||||||
NOTES TO THE CONSOLIDATED FINANCIAL STATEMENTS
Note 1 –
Significant Accounting Policies
Basis of Accounting.
The consolidated financial statements of FHN, including its subsidiaries, have been prepared in conformity with accounting principles generally accepted in the United States of America and follow general practices within the industries in which it operates. This preparation requires management to make estimates and assumptions that affect the amounts reported in the financial statements and accompanying notes. These estimates and assumptions are based on information available as of the date of the financial statements and could differ from actual results.
Merger with IBERIABANK Corporation.
On July 1, 2020, FHN and IBERIABANK Corporation closed their merger of equals transaction. Historical periods prior to the closing of the merger only reflect results of legacy FHN operations. Subsequent to closing, results reflect all post-merger activity. Refer to Note 2 – Acquisitions and Divestitures for additional information regarding the transaction.
Revenues.
Revenue is recognized when the performance obligations under the terms of a contract with a client are satisfied in an amount that reflects the consideration FHN expects to be entitled. FHN derives a significant portion of its revenues from fee-based services. Noninterest income from transaction-based fees is generally recognized immediately upon completion of the transaction. Noninterest income from service-based fees is generally recognized over the period in which FHN provides the service. Any services performed over time generally require that FHN render services each period and therefore FHN measures progress in completing these services based upon the passage of time and recognizes revenue as invoiced.
Following is a discussion of FHN's key revenues within the scope of ASC 606, "Revenue from Contracts with Customers", except as noted.
Fixed Income.
Fixed income includes fixed income securities sales, trading, and strategies, loan sales and derivative sales which are not within the scope of revenue from contracts with customers. Fixed income also includes investment banking fees earned for services related to underwriting debt securities and performing portfolio advisory services. FHN's performance obligation for underwriting services is satisfied on the trade date while advisory services is satisfied over time.
Mortgage banking and title income.
As a result of the IBKC merger on July 1, 2020, mortgage banking and title income has become a more significant revenue source. Mortgage banking and title income includes mortgage servicing income, title income, mortgage loan originations and sales, derivative settlements, as well as any changes in fair value recorded on mortgage loans and derivatives. Mortgage banking income from 1) sale of loans, 2) settlement of derivatives, 3) changes in fair value of loans, derivatives and servicing rights and 4) servicing of loans are not within the scope of revenue from contracts with customers. Title income is earned when FHN fulfills its performance obligation at the point in time when the services are completed.
Deposit Transactions and Cash Management.
Deposit transactions and cash management activities include fees for services related to consumer and
|
FIRST HORIZON CORPORATION
|
123
|
2020 FORM 10-K ANNUAL REPORT | ||||||
commercial deposit products (such as service charges on checking accounts), cash management products and services such as electronic transaction processing (Automated Clearing House and Electronic Data Interchange), account reconciliation services, cash vault services, lockbox processing, and information reporting to large corporate clients. FHN's obligation for transaction-based services is satisfied at the time of the transaction when the service is delivered while FHN's obligation for service based fees is satisfied over the course of each month.
Brokerage, Management Fees and Commissions.
Brokerage, management fees and commissions include fees for portfolio management, trade commissions, and annuity and mutual fund sales. Asset-based management fees are charged based on the market value of the client’s assets. The services associated with these revenues, which include investment advice and active management of client assets are generally performed and recognized over a month or quarter. Transactional revenues are based on the size and number of transactions executed at the client’s direction and are generally recognized on the trade date.
Trust Services and Investment Management.
Trust services and investment management fees include investment management, personal trust, employee benefits, and custodial trust services. Obligations for trust services are generally satisfied over time but may be satisfied at points in time for certain activities that are transactional in nature.
Bankcard Income.
Bankcard income includes credit interchange and network revenues and various card-related fees. Interchange income is recognized concurrently with the delivery of services on a daily basis. Card-related fees such as late fees, currency conversion, and cash advance fees are loan-related and excluded from the scope of ASC 606.
Contract Balances.
As of December 31, 2020, accounts receivable related to products and services on non-interest income were $
10
million. For the year ended December 31, 2020, FHN had no material impairment losses on non-interest accounts receivable and there were no material contract assets, contract liabilities or deferred contract costs recorded on the Consolidated Balance Sheets as of December 31, 2020. Credit risk is assessed on these accounts receivable each reporting period and the amount of estimated uncollectible receivables is not material.
Refer to Note 20 - Business Segment Information for a reconciliation of disaggregated revenue by major product line and reportable segment.
Debt Investment Securities.
Debt securities that may be sold prior to maturity are classified as AFS and are carried at fair value. The unrealized gains and losses on debt securities AFS, including securities for which no credit impairment exists, are excluded from earnings and are reported, net of tax, as a component of other comprehensive income within shareholders’ equity and the Consolidated Statements of Comprehensive Income. Debt securities which management has the intent and ability to hold to maturity are reported at amortized cost. Interest-only strips that are classified as securities AFS are valued at elected fair value. See Note 24 - Fair Value of Assets and Liabilities for additional information. Realized gains and losses (i.e., from sales) for debt investment securities are determined by the specific identification method and reported in noninterest income.
In periods subsequent to 2019, the evaluation of credit risk for HTM debt securities mirrors the process described below for loans held for investment. AFS debt securities are reviewed for potential credit impairment at the individual security level. The evaluation of credit risk includes consideration of third-party and government guarantees (both explicit and implicit), senior or subordinated status, credit ratings of the issuer, the effects of interest rate changes since purchase and observable market information such as issuer-specific credit spreads. Credit losses for AFS debt securities are generally recognized through establishment of an allowance for credit losses that cannot exceed the amount by which amortized cost exceeds fair value. Charge-offs are recorded as reductions of the security’s amortized cost and the credit allowance. Subsequent improvements in estimated credit losses result in reduction of the credit allowance, but not beyond zero. However, if FHN has the intent to sell or if it is more-likely-than-not that it will be compelled to sell a security with an unrecognized loss, the difference between the security's carrying value and fair value is
|
FIRST HORIZON CORPORATION
|
124
|
2020 FORM 10-K ANNUAL REPORT | ||||||
recognized through earnings and a new amortized cost basis is established for the security (i.e., no allowance for credit losses is recognized).
FHN has elected to exclude accrued interest receivable from the fair value and amortized cost basis on AFS debt securities when assessing whether these securities have experienced credit impairment. Additionally, FHN has elected to not measure an allowance for credit losses on AIR for AFS debt securities based on its policy to write off uncollectible interest in a timely manner, which generally occurs when delinquency reaches no more than 90 days for all security types. Any such write offs are recognized as a reduction of interest income. AIR for AFS debt securities is included within Other assets in the Consolidated Balance Sheet.
In periods prior to 2020, both AFS and HTM securities were reviewed quarterly for possible other-than-temporary impairment. The review included an analysis of the facts and circumstances of each individual investment such as the degree of loss, the length of time the fair value had been below cost, the expectation for that security’s performance, the creditworthiness of the issuer and FHN’s intent and ability to hold the security.
Declines in value judged to be OTTI based on FHN’s analysis of the facts and circumstances related to an individual investment, including securities that FHN had the intent to sell, were determined by the specific identification method. For HTM debt securities, OTTI recognized was typically credit-related and was reported in noninterest income. For impaired AFS debt securities that FHN did not intend to sell and was not required to sell prior to recovery but for which credit losses existed, the OTTI recognized was allocated between the total impairment related to credit losses which was reported in noninterest income, and the impairment related to all other factors which was excluded from earnings and reported, net of tax, as a component of other comprehensive income within shareholders’ equity and the Consolidated Statements of Comprehensive Income.
Equity Investment Securities.
Equity securities are classified in Other assets. Banks organized under state law may apply to be members of the Federal Reserve System. Each member bank is required to own stock in its regional Federal Reserve Bank. Given this requirement, FRB stock may not be sold, traded, or pledged as collateral for loans. Membership in the Federal Home Loan Bank network requires ownership of capital stock. Member banks are entitled to borrow funds from the FHLB and are
required to pledge mortgage loans as collateral. Investments in the FHLB are non-transferable and, generally, membership is maintained primarily to provide a source of liquidity as needed. FRB and FHLB stock are recorded at cost and are subject to impairment reviews. FHN's subsidiary, First Horizon Bank, was a state member bank throughout 2020.
Other equity investments primarily consist of mutual funds which are marked to fair value through earnings. Smaller balances of equity investments without a readily determinable fair value are recorded at cost minus impairment with adjustments through earnings for observable price changes in orderly transactions for the identical or a similar investment of the same issuer.
Securities Purchased Under Agreements to Resell and Securities Sold Under Agreements to Repurchase.
FHN purchases short-term securities under agreements to resell which are accounted for as collateralized financings except where FHN does not have an agreement to sell the same or substantially the same securities before maturity at a fixed or determinable price. All of FHN’s securities purchased under agreements to resell are recognized as collateralized financings. Securities delivered under these transactions are delivered to either the dealer custody account at the FRB or to the applicable counterparty. Securities sold under agreements to repurchase are offered to cash management clients as an automated, collateralized investment account. Securities sold under agreements to repurchase are also used by the consumer/commercial bank to obtain favorable borrowing rates on its purchased funds. All of FHN's securities sold under agreements to repurchase are secured borrowings.
Collateral is valued daily and FHN may require counterparties to deposit additional securities or cash as collateral, or FHN may return cash or securities previously pledged by counterparties, or FHN may be required to post additional securities or cash as collateral, based on the contractual requirements for these transactions.
FHN’s fixed income business utilizes securities borrowing arrangements as part of its trading
|
FIRST HORIZON CORPORATION
|
125
|
2020 FORM 10-K ANNUAL REPORT | ||||||
operations. Securities borrowing transactions generally require FHN to deposit cash with the securities lender. The amount of cash advanced is recorded within Securities purchased under agreements to resell in the Consolidated Balance Sheets. These transactions are not considered purchases and the securities borrowed are not recognized by FHN. FHN does not conduct securities lending transactions.
Securities purchased under agreements to resell and securities borrowing arrangements are evaluated for credit risk each reporting period. As presented in Note 23 - Master Netting and Similar Agreements - Repurchase, Reverse Repurchase, and Securities Borrowing Transactions, these agreements are collateralized by the related securities and collateral maintenance provisions with counterparties, including replenishment and adjustment on a transaction specific basis. This collateral includes both the securities collateral for each transaction as well as offsetting securities sold under agreements to repurchase with the same counterparty. Given the history of no credit losses and collateralized nature of these transactions, no credit loss has been recognized.
Loans Held for Sale.
Loans originated or purchased for which management lacks the intent to hold are included in loans held for sale in the Consolidated Balance Sheets. FHN generally accounts for loans held for sale at the lower of amortized cost or market value, with an exception for certain mortgage loans held for sale and repurchased loans that are not governmentally insured which are carried under the fair value option of reporting.
On July 1, 2020 as part of the IBKC merger, FHN obtained operations that generate two types of loans held for sale:
•
Fair Value Option Election. These loans, which represent the majority of the IBKC loans held for sale portfolio, consist of fixed rate single-family residential mortgage loans originated by IBKC and committed to be sold in the secondary market. Gains and losses on these mortgage loans are included in mortgage banking and title income.
amount outstanding. Loan origination fees and direct costs as well as premiums and discounts are amortized as level yield adjustments over the respective loan terms. Unamortized net fees or costs, premiums and discounts are recognized in interest income upon early repayment of the loans. Cash collections from loans that were fully charged off prior to acquisition are recognized in noninterest income. Loan commitment fees are generally deferred and amortized on a straight-line basis over the commitment period.
As a result of the IBKC merger, FHN obtained equipment financing leases to commercial clients, which are primarily classified as direct financing and sales-type leases. Equipment financing leases are reported at the net lease investment, which represents the sum of minimum lease payments over the lease term and the estimated residual value, less unearned interest income. Interest income is accrued as earned over the term of the lease based on the net investment in leases. Fees incurred to originate the lease are deferred and recognized as an adjustment of the yield on the lease.
FHN also obtained a small amount of loans held for investment in the IBKC merger which are accounted for at elected fair value. See Note 24 - Fair Value of Assets and Liabilities for further discussion of these loans.
FHN has elected to exclude accrued interest receivable from the amortized cost basis on its held-for-investment loan portfolio. FHN has also elected to not measure an allowance for credit losses on AIR for loans held for investment based on its policy to write off uncollectible interest in a timely manner, which occurs when a loan is placed on nonaccrual status. Such write-offs are recognized as a reduction of interest income. AIR for held-for-investment loans is included within Other assets in the Consolidated Balance Sheets.
FHN has continued to accrue interest on loans for which payment deferrals have been extended to borrowers affected by the COVID-19 pandemic. Deferrals are typically made in increments of three or six months. Cumulative deferrals of six months or longer are beyond FHN's normal write-off practices for accrued interest. Therefore, these interest deferrals do not qualify for FHN's election to not recognize a credit loss allowance for accrued interest. Accordingly, FHN has estimated credit losses for COVID-19 interest deferrals which is included within AIR in Other assets in the Consolidated Balance Sheets.
|
FIRST HORIZON CORPORATION
|
126
|
2020 FORM 10-K ANNUAL REPORT | ||||||
that full collection of principal and interest is at risk, impairment has been recognized as a partial charge-off of principal balance due to insufficient collateral value and past due status, or on a case-by-case basis if FHN continues to receive payments, but there are other borrower-specific issues.
•
The accrual status policy for commercial TDRs follows the same internal policies and procedures as other commercial portfolio loans.
•
Residential real estate secured loans discharged in bankruptcy that have not been reaffirmed by the borrower (“discharged bankruptcies”) are placed on nonaccrual regardless of delinquency status and are reported as TDRs.
•
Current second lien residential real estate loans that are junior to first liens are placed on nonaccrual status if the first lien is 90 or more days past due, is a bankruptcy, or is a troubled debt restructuring.
•
Consumer real estate (HELOC and residential real estate installment loans), if not already on nonaccrual per above situations, are placed on nonaccrual if the loan is 30 or more days delinquent at the time of modification and is also determined to be a TDR.
•
Government guaranteed/insured residential mortgage loans remain on accrual (even if the loan falls into one of the above categories) because the collection of principal and interest is reasonably assured.
For commercial and consumer loans within each portfolio segment and class that have been placed on nonaccrual status, accrued but uncollected interest is reversed and charged against interest income when the loan is placed on nonaccrual status. Management may elect to continue the accrual of interest when the estimated net realizable value of collateral is sufficient to recover the principal balance and accrued interest. Interest payments received on nonaccrual loans are normally applied to outstanding principal first. Once all principal has been received, additional interest payments are recognized on a cash basis as interest income.
Generally, commercial and consumer loans within each portfolio segment and class that have been placed on nonaccrual status can be returned to accrual status if all principal and interest is current and FHN expects full repayment of the remaining contractual principal and interest. This typically requires that a borrower make payments in accordance with the contractual terms for a sustained period of time (generally for a minimum of six months) before being returned to accrual status. For TDRs, FHN may also consider a borrower’s sustained
historical repayment performance for a reasonable time prior to the restructuring in assessing whether the borrower can meet the restructured terms, as it may indicate whether the borrower is capable of servicing the level of debt under the modified terms.
Residential real estate loans discharged through Chapter 7 bankruptcy and not reaffirmed by the borrower are not returned to accrual status. For current second liens that have been placed on nonaccrual because the first lien is 90 or more days past due or is a TDR or bankruptcy, the second lien may be returned to accrual upon pay-off or cure of the first lien.
Charge-offs.
For all commercial and consumer loan portfolio segments, all losses of principal are charged to the ALLL in the period in which the loan is deemed to be uncollectible.
For consumer loans, the timing of a full or partial charge-off generally depends on the loan type and delinquency status. Generally, for the consumer real estate and permanent mortgage portfolio segments, a loan will be either partially or fully charged-off when it becomes 180 days past due. At this time, if the collateral value does not support foreclosure, balances are fully charged-off and other avenues of recovery are pursued. If the collateral value supports foreclosure, the loan is charged-down to net realizable value (collateral value less estimated costs to sell) and is placed on nonaccrual status. For residential real estate loans discharged in Chapter 7 bankruptcy and not reaffirmed by the borrower, the fair value of the collateral position is assessed at the time FHN is made aware of the discharge and the loan is charged down to the net realizable value (collateral value less estimated costs to sell). Within the credit card and other portfolio segment, credit cards and installment loans secured by automobiles are normally charged-off upon reaching 180 days past due while other non-real estate consumer loans are charged-off upon reaching 120 days past due.
For acquired PCD loans where all or a portion of the loan balance had been charged off prior to acquisition, and for which active collection efforts are still underway, the ALLL recorded at acquisition is immediately charged off if required by FHN’s existing charge off policy. Additionally, FHN is required to consider its existing policies in determining whether to charge off any financial assets, regardless of whether a charge-off was recorded by the predecessor company. The initial ALLL recognized on PCD assets includes the gross-up of the loan balance reduced by immediate charge-offs for loans previously charged off by the predecessor company or which meet FHN’s charge-off policy on the date of acquisition. Charge-
|
FIRST HORIZON CORPORATION
|
127
|
2020 FORM 10-K ANNUAL REPORT | ||||||
Purchased Credit-Deteriorated Loans.
Subsequent to 2019, at the time of acquisition FHN evaluates all acquired loans to determine if they have experienced a more-than-insignificant deterioration in credit quality since origination. PCD loans can be identified on either an 1) individual or 2) pooled basis when the loans share similar risk characteristics. FHN evaluates various absolute factors to assist in the identification of PCD loans, including criteria such as, existing PCD status, risk rating of special mention or lower, nonaccrual or impaired status, identification of prior TDRs, and delinquency status. FHN also utilizes relative factors to identify PCD loans such as commercial loan grade migration, expansion of borrower credit spreads, declines in external risk ratings and changes in consumer loan characteristics (e.g., FICO decline or LTV increase). In addition, factors reflective of broad economic considerations are also considered in identifying PCD loans. These include industry, collateral type, and geographic location for the borrower’s operations. Internal factors for origination of new loans that are similar to the acquired loans are also evaluated to assess loans for PCD status, including increases in required yields, necessity of borrowers’ providing additional collateral and/or guarantees and changes in acceptable loan duration. Other indicators may also be used to evaluate loans for PCD status depending on borrower-specific communications and actions, such public statements, initiation of loan modification discussions and obtaining emergency funding from alternate sources.
Upon acquisition, the expected credit losses are allocated to the purchase price of individual PCD loans to determine each individual asset's amortized cost basis, typically resulting in a reduction of the discount that is accreted prospectively to interest income. At the acquisition date and prospectively, only the unpaid principal balance is incorporated within the estimation of expected credit losses for PCD loans. Otherwise, the process for estimation of expected credit losses is consistent with that discussed below. As discussed below FHN applies undiscounted cash flow methodologies for the estimation of expected credit losses, which results in the calculated amount of credit losses at acquisition that is added to the amortized cost basis of the related PCD loans to exceed the discounted value of estimated credit losses included in the loan valuation.
For PCD loans where all or a portion of the loan balance has been previously written-off, or would be subject to write-off under FHN’s charge-off policy, the
initial ALLL included as part of the grossed-up loan balance at acquisition was immediately written-off, resulting in a zero period-end allowance balance and no impact on the ALLL rollforward.
Purchased Credit-Impaired Loans.
Prior to 2020, ASC 310-30 “Accounting for Certain Loans or Debt Securities Acquired in a Transfer,” established guidance for acquired loans that exhibited deterioration of credit quality between origination and the time of acquisition and for which the timely collection of the interest and principal was not reasonably assured. PCI loans were initially recorded at fair value which was estimated by discounting expected cash flows at acquisition date. The expected cash flows included all contractually expected amounts (including interest) and incorporated an estimate for future expected credit losses, pre-payment assumptions, and yield requirement for a market participant, among other things. To the extent possible, certain PCI loans were aggregated into pools with composite interest rate and cash flows expected to be collected for the pool. Aggregation into loan pools was based upon common risk characteristics that include similar credit risk or risk ratings, and one or more predominant risk characteristics. Each PCI pool was accounted for as a single unit.
Accretable yield was initially established at acquisition and is the excess of cash flows expected at acquisition over the initial investment in the loan and was recognized in interest income over the remaining life of the loan, or pool of loans. Nonaccretable difference was initially established at acquisition and was the difference between the contractually required payments at acquisition and the cash flows expected to be collected at acquisition. FHN estimated expected cash flows for PCI loans on a quarterly basis. Increases in expected cash flows from the last measurement resulted in reversal of any nonaccretable difference (or allowance for loan and lease losses to the extent any has previously been recorded) with a prospective positive impact on interest income. Decreases to the expected cash flows resulted in an increase in the allowance for loan and lease losses through provision expense.
FHN did not report PCI loans as nonperforming loans due to the accretion of interest income. Additionally, PCI loans that had been pooled and subsequently modified were not reported as troubled debt restructurings since the pool was the unit of measurement.
Subsequent to 2019, PCI loans have transitioned to purchased-credit-deteriorated status and are accounted for as discussed above.
|
FIRST HORIZON CORPORATION
|
128
|
2020 FORM 10-K ANNUAL REPORT | ||||||
Allowance for Credit Losses.
The nature of the process by which FHN determines the appropriate ACL requires the exercise of considerable judgment. See Note 5 - Allowance for Credit Losses for a discussion of FHN’s ACL methodology and a description of the models utilized in the estimation process for the commercial and consumer loan portfolios. The discussion herein reflects periods before and after the implementation of a change in credit loss estimation processes that was effective January 1, 2020.
Future adjustments to the ACL may be necessary if economic or other conditions differ substantially from the assumptions used in making the estimates or, if required by regulators, based upon information at the time of their examinations or upon future regulatory guidance. Such adjustments to original estimates, as necessary, are made in the period in which these factors and other relevant considerations indicate that loss levels vary from previous estimates.
Subsequent to 2019
Management's estimate of expected credit losses in the loan and lease portfolio is recorded in the ALLL and the reserve for unfunded lending commitments, collectively the ACL. The ACL is maintained at a level that management determines is sufficient to absorb current expected credit losses in the loan and lease portfolio and unfunded lending commitments. Management uses analytical models to estimate expected credit losses in the loan and lease portfolio and unfunded lending commitments as of the balance sheet date. The models are carefully reviewed to identify trends that may not be captured in the modeled loss estimates. Management uses qualitative adjustments for those items not reflected in the modeled loss information such as recent changes from the macroeconomic forecasts utilized in model calculations, results of additional stressed modeling scenarios, observed and/or expected changes affecting borrowers in specific industries or geographic areas, exposure to large lending relationships and expected recoveries of prior charge offs. Qualitative adjustments are also used to accommodate for the imprecision of certain assumptions and uncertainties inherent in the model calculations as well as to align certain differences in models used by acquired loan portfolios to the policies described herein. Loans accounted for at elected fair value are excluded from CECL measurements.
The ALLL is increased by the provision for loan and lease losses and is decreased by loan charge-offs. The ALLL is determined in accordance with ASC 326-20 "Financial Instruments - Credit Losses". Credit
loss estimation is based on the amortized cost of loans, which includes the following:
1.
Unpaid principal balance for originated assets or acquisition price for purchased assets
2.
Accrued interest (see elections discussed previously)
3.
Accretion or amortization of premium, discount, and net deferred fees or costs
4.
Collection of cash
5.
Charge-offs
Premiums, discounts and net deferred origination costs/fees affect the calculated amount of expected credit losses but they are not considered when determining the amount of expected credit losses that are recorded.
Under CECL, a loan must be pooled when it shares similar risk characteristics with other loans. Loans that do not share similar risk characteristics are evaluated individually. Expected credit loss is estimated for the remaining life of loan(s), which is limited to the remaining contractual term(s), adjusted for prepayment estimates, which are included as separate inputs into modeled loss estimates. Renewals and extensions are not anticipated unless they are included in existing loan documentation and are not unconditionally cancellable by the lender. However, losses are estimated over the estimated remaining life of reasonably expected TDRs which can extend beyond the current remaining contractual term.
Management has developed multiple current expected credit losses models which segment the loan and lease portfolio by borrower type and loan or lease type to estimate expected lifetime expected credit losses for loans and leases that share similar risk characteristics. Estimates of expected credit losses incorporate consideration of available information that is relevant to assessing the collectability of future cash flows. This includes internal and external information relating to past events, current conditions and reasonable and supportable forecasts of future conditions. FHN utilizes internal and external historical loss information, as applicable, for all available historical periods as the initial point for estimating expected credit losses. Given the duration of historical information available, FHN considers its internal loss history to fully incorporate the effects of prior credit cycles. The historical loss information may be adjusted in situations where current loan characteristics (e.g., underwriting criteria) differ from those in existence at the time the historical losses occurred. Historical loss information is also adjusted for differences in economic conditions, macroeconomic forecasts and other factors
|
FIRST HORIZON CORPORATION
|
129
|
2020 FORM 10-K ANNUAL REPORT | ||||||
management considers relevant over a period extending beyond the measurement date which is considered reasonable and supportable.
FHN generally measures expected credit losses using undiscounted cash flow methodologies. Credit enhancements (e.g., guarantors) that are not freestanding are considered in the estimation of uncollectible cash flows. Estimation of expected credit losses for loan agreements involving collateral maintenance provisions include consideration of the value of the collateral and replenishment requirements, with the maximum loss limited to the difference between the amortized cost of the loan and the fair value of the collateral. Expected credit losses for loans for which foreclosure is probable are measured at the fair value of collateral, less estimated costs to sell when disposition through sale is anticipated. Additionally, for borrowers experiencing financial difficulty certain loans are valued at the fair value of collateral when repayment is expected to be provided substantially through the operation of the collateral. The fair value of the collateral is reduced for estimated costs to sell when repayment is expected through sale of the collateral. Expected credit losses for TDRs are measured in accordance with ASC 310-40, which generally requires a discounted cash flow methodology, whereby the loans are measured based on the present value of expected future payments discounted at the loan’s original effective interest rate.
Expected recoveries of previously charged-off amounts are also included as a qualitative adjustment in the estimation of expected credit losses, which reduces the amount of the allowance recognized. Estimates of recoveries on previously charged-off assets included in the allowance for loan losses do not exceed the aggregate of amounts previously written off and expected to be written off for an individual loan or pool.
Since CECL requires the estimation of credit losses for the entire expected life of loans, loss estimates are highly sensitive to changes in macroeconomic forecasts, especially when those forecasts change dramatically in short time periods. Additionally, under CECL credit loss estimates are more likely to increase rapidly in periods of loan growth.
Expected credit losses for unfunded commitments are estimated for periods where the commitment is not unconditionally cancellable by FHN. The measurement of expected credit losses for unfunded commitments mirrors that of loans with the additional estimate of future draw rates (timing and amount).The liability for credit losses inherent in lending-related commitments, such as letters of credit and unfunded loan commitments, is included in Other liabilities on
the Consolidated Balance Sheets and established through a charge to the provision for credit losses.
Prior to 2020
The ALLL was maintained at a level that management determined was sufficient to absorb estimated probable incurred losses in the loan portfolio. The ALLL was increased by the provision for loan losses and loan recoveries and was decreased by loan charge-offs. The ALLL was determined in accordance with ASC 450-20-50 "Contingencies - Accruals for Loss Contingencies" and was composed of reserves for commercial loans evaluated based on pools of credit graded loans and reserves for pools of smaller-balance homogeneous consumer and commercial loans. The reserve factors applied to these pools were an estimate of probable incurred losses based on management’s evaluation of historical net losses from loans with similar characteristics. Additionally, the ALLL included specific reserves established in accordance with ASC 310-10-35 for loans determined by management to be individually impaired as well as reserves associated with PCI loans. Management used analytical models to estimate probable incurred losses in the loan portfolio as of the balance sheet date. The models, which were primarily driven by historical losses, were carefully reviewed to identify trends that may not have been captured in the historical loss factors used in the models. Management used qualitative adjustments for those items not yet captured in the models like then-current events, recent trends in the portfolio, current underwriting guidelines, and local and macroeconomic trends, among other things.
Key components of the estimation process were as follows: (1) commercial loans determined by management to be individually impaired loans were evaluated individually and specific reserves were determined based on the difference between the outstanding loan amount and the estimated net realizable value of the collateral (if collateral dependent), the present value of expected future cash flows or by observable market prices; (2) individual commercial loans not considered to be individually impaired were segmented based on similar credit risk characteristics and evaluated on a pool basis; (3) reserve rates for the commercial segment were calculated based on historical net charge-offs and were subject to adjustment by management to reflect current events, trends, and conditions (including economic considerations and trends); (4) management’s estimate of probable incurred losses reflected the reserve rates applied against the balance of loans in the commercial segment of the loan portfolio; (5) consumer loans were generally segmented based on loan type; (6)
|
FIRST HORIZON CORPORATION
|
130
|
2020 FORM 10-K ANNUAL REPORT | ||||||
reserve amounts for each consumer portfolio segment were calculated using analytical models based on delinquency trends and net loss experience and were subject to adjustment by management to reflect current events, trends, and conditions (including economic considerations and trends); and (7) the reserve amount for each consumer portfolio segment reflected management’s estimate of probable incurred losses in the consumer segment of the loan portfolio.
Impairment related to individually impaired loans was measured in accordance with ASC 310-10. All commercial portfolio segments, commercial TDRs and other individually impaired commercial loans were measured based on the present value of expected future payments discounted at the loan’s effective interest rate (“the DCF method”), observable market prices, or for loans that are solely dependent on the collateral for repayment, the net realizable value (collateral value less estimated costs to sell). Impaired loans also included consumer TDRs.
loans to OREO, there is a charge-off against the ALLL if the estimated fair value less costs to sell is less than the loan’s cost basis. Subsequent declines in fair value and gains or losses on dispositions, if any, are charged to other expense on the Consolidated Statements of Income. Properties acquired by foreclosure in compliance with HUD servicing guidelines prior to January 1, 2015, are included in OREO and are carried at the estimated amount of the underlying government insurance or guarantee.
Required developmental costs associated with acquired property under construction are capitalized and included in determining the estimated net realizable value of the property, which is reviewed periodically, and any write-downs are charged against current earnings.
Servicing Rights
. FHN recognizes the rights to service mortgage and other loans as separate assets, which are recorded in other assets in the Consolidated Balance Sheets, when purchased or when servicing is contractually separated from the underlying loans by sale with servicing rights retained. For loan sales with servicing retained, a servicing right, generally an asset, is recorded at fair value at the time of sale for the right to service the loans sold. All servicing rights are identified by class and amortized over the remaining life of the loan with periodic reviews for impairment.
Transfers of Financial Assets.
Transfers of financial assets, or portions thereof which meet the definition of a participating interest, are accounted for as sales when control over the assets has been surrendered. Control over transferred assets is deemed to be surrendered when 1) the assets have been legally isolated from FHN, 2) the transferee has the right to pledge or exchange the assets with no conditions that
|
FIRST HORIZON CORPORATION
|
131
|
2020 FORM 10-K ANNUAL REPORT | ||||||
Derivative Financial Instruments.
FHN accounts for derivative financial instruments in accordance with ASC 815 which requires recognition of all derivative instruments on the balance sheet as either an asset or liability measured at fair value through adjustments to either accumulated other comprehensive income within shareholders’ equity or current earnings. Fair value is defined as the price that would be received to sell a derivative asset or paid to transfer a derivative liability in an orderly transaction between market participants on the transaction date. Fair value is determined using available market information and appropriate valuation methodologies. FHN has elected to present its derivative assets and liabilities gross on the Consolidated Balance Sheets. Amounts of collateral posted or received have not been netted with the related derivatives unless the collateral amounts are considered legal settlements of the related derivative positions. See Note 22 - Derivatives for discussion on netting of derivatives.
FHN prepares written hedge documentation, identifying the risk management objective and designating the derivative instrument as a fair value hedge or cash flow hedge as applicable, or as a free-standing derivative instrument entered into as an economic hedge or to meet clients’ needs. All transactions designated as ASC 815 hedges must be assessed at inception and on an ongoing basis as to the effectiveness of the derivative instrument in offsetting changes in fair value or cash flows of the hedged item. For a fair value hedge, changes in the fair value of the derivative instrument and changes in the fair value of the hedged asset or liability attributable to the hedged risk are recognized currently in earnings. For a cash flow hedge, changes in the fair value of the derivative instrument are recorded in accumulated other comprehensive income and subsequently reclassified to earnings as the hedged transaction impacts net income. For fair value hedges, the entire change in the fair value of the hedging instrument included in the assessment of effectiveness is recorded to the same financial statement line item (e.g., interest expense) used to present the earnings effect of the hedged item. For
cash flow hedges, the entire fair value change of the hedging instrument that is included in the assessment of hedge effectiveness is initially recorded in other comprehensive income and later recycled into earnings as the hedged transaction(s) affect net income with the income statement effects recorded in the same financial statement line item used to present the earnings effect of the hedged item (e.g., interest income). For free-standing derivative instruments, changes in fair values are recognized currently in earnings. See Note 22 - Derivatives for additional information.
Cash flows from derivative contracts are reported as operating activities on the Consolidated Statements of Cash Flows.
Leases.
At inception, all arrangements are evaluated to determine if they contain a lease, which is defined as a contract, or part of a contract, that conveys the right to control the use of identified property, plant, or equipment for a period of time in exchange for consideration. Control is deemed to exist when a lessor has granted and a lessee has received both the right to obtain substantially all of the economic benefits from use of the identified asset and the right to direct the use of the identified asset throughout the period of use.
Lessee.
As a lessee, FHN recognizes lease (right-of-use) assets and lease liabilities for all leasing arrangements with lease terms that are greater than one year. The lease asset and lease liability are recognized at the present value of estimated future lease payments, including estimated renewal periods, with the discount rate reflecting a fully-collateralized rate matching the estimated lease term. Renewal options are included in the estimated lease term if they are considered reasonably certain of exercise. Periods covered by termination options are included in the lease term if it is reasonably certain they will not be exercised. Additionally, prepaid or accrued lease payments, lease incentives and initial direct costs related to lease arrangements are recognized within the right-of-use asset. Each lease is classified as a financing or operating lease which depends on the relationship of the lessee’s rights to the economic value of the leased asset. For finance leases, interest on the lease liability is recognized separately from amortization of the right-of-use asset in earnings, resulting in higher expense in the earlier portion of the lease term. For operating leases, a single lease cost is calculated so that the cost of the lease is allocated over the lease term on a generally straight-line basis. Substantially all of FHN’s lessee arrangements are classified as operating leases. For leases with a term of 12 months or less, FHN does not to recognize lease assets and lease liabilities and expense is
|
FIRST HORIZON CORPORATION
|
132
|
2020 FORM 10-K ANNUAL REPORT | ||||||
generally recognized on a straight-line basis over the lease term.
Lease assumptions and classification are reassessed upon the occurrence of events that result in changes to the estimated lease term or consideration. Modifications to lease contracts are evaluated to determine 1) if a right to use an additional asset has been obtained, 2) if only the lease term and/or consideration have been revised or 3) if a full or partial termination has occurred. If an additional right-of use-asset has been obtained, the modification is treated as a separate contract and its classification is evaluated as a new lease arrangement. If only the lease term or consideration are changed, the lease liability is revalued with an offset to the lease asset and the lease classification is re-assessed. If a modification results in a full or partial termination of the lease, the lease liability is revalued through earnings along with a proportionate reduction in the value of the related lease asset and subsequent expense recognition is similar to a new lease arrangement.
Lease assets are evaluated for impairment when triggering events occur, such as a change in management intent regarding the continued occupation of the leased space. If a lease asset is impaired, it is written down to the present value of estimated future cash flows and the prospective expense recognition for that lease follows the accelerated expense recognition methodology applicable to finance leases, even if it remains classified as an operating lease.
Sublease arrangements are accounted for consistent with the lessor accounting described below. Sublease arrangements are evaluated to determine if changes to estimates for the primary lease are warranted or if the sublease terms reflect impairment of the related lease asset.
offsetting recognition of a lease receivable that is evaluated for impairment similar to loans. Other than equipment lease entered into as part of commercial lease financing arrangements, all of FHN's lessor arrangements are considered operating leases.
Lease income for operating leases is recognized over the life of the lease, generally on a straight line basis. Lease incentives and initial direct costs are capitalized and amortized over the estimated life of the lease. Lease income is not significant for any reporting periods and is classified as a reduction of Occupancy expense in the Consolidated Statements of Income.
Income Taxes.
FHN accounts for income taxes using the asset and liability method pursuant to ASC 740, “Income Taxes,” which requires the recognition of deferred tax assets and liabilities for the expected future tax consequences of events that have been included in the financial statements. Under this method, FHN’s deferred tax assets and liabilities are determined based on differences between financial statement carrying amounts and the corresponding tax basis of certain assets and liabilities using enacted tax rates in effect for the year in which the differences are expected to reverse. The effect of a change in tax rates on DTAs and DTLs is recognized in income in the period that includes the enactment date.
Additionally, DTAs are subject to a “more likely than not” test to determine whether the full amount of the DTAs should be recognized in the financial statements. FHN evaluates the likelihood of realization of the DTA based on both positive and negative evidence available at the time, including (as appropriate) scheduled reversals of DTLs, projected future taxable income, tax planning strategies, and recent financial performance. If the “more likely than not” test is not met, a valuation allowance must be established against the DTA. In the event FHN determines that DTAs are realizable in the future in excess of their net recorded amount, FHN would
|
FIRST HORIZON CORPORATION
|
133
|
2020 FORM 10-K ANNUAL REPORT | ||||||
make an adjustment to the valuation allowance, which would reduce income tax expense.
FHN records uncertain tax positions in accordance with ASC 740 on the basis of a two-step process in which (1) it is determined whether it is more likely than not that the tax positions will be sustained on the basis of the technical merits of the position and (2) for those tax positions that meet the more-likely-than-not recognition threshold, the largest amount of tax benefit that is more than 50 percent likely to be realized upon ultimate settlement with the related tax authority is recognized. FHN's ASC 740 policy is to recognize interest and penalties related to unrecognized tax benefits as a component of income tax expense. Accrued interest and penalties are included within the related tax asset/liability line in the consolidated balance sheet.
expense is recognized using the straight-line method over the requisite service period (generally the vesting period). Forfeitures are recognized when they occur. For awards vesting based on a performance measure, anticipated performance is projected to determine the number of awards expected to vest, and the corresponding aggregate expense is adjusted to reflect the elapsed portion of the performance period. If a performance period extends beyond the required service term, total expense is adjusted for changes in estimated achievement through the end of the performance period. Some performance awards include a total shareholder return modifier (“TSR Modifier”) that operates after determination of the performance criteria, affecting only the quantity of awards issued if the minimum performance threshold is attained. The effect of the TSR Modifier is included in the grant date fair value of the related performance awards using a Monte Carlo valuation technique. The fair value of equity awards with cash payout requirements, as well as awards for which fair value cannot be estimated at grant date, is remeasured each reporting period through vesting date. Performance awards with pre-grant date achievement criteria are expensed over the period from the start of the performance period through the end of the service vesting term. Awards are amortized using the nonsubstantive vesting methodology which requires that expense associated with awards having only service vesting criteria that continue vesting after retirement be recognized over a period ending no later than an employee’s retirement eligibility date.
As a result of the IBKC merger, as of July 1, 2020, FHN assumed phantom stock awards under various plans to directors, officers, and other key employees. Phantom stock awards are accounted for as liability awards and are remeasured at each reporting period based on changes in their fair value, which is based on changes in common share prices, until the date of settlement. Compensation cost for each reporting period until settlement is based on the change (or a portion of the change, depending on the percentage of the requisite service that has been rendered at the reporting date) in the fair value of the phantom stock award for each reporting period.
|
FIRST HORIZON CORPORATION
|
134
|
2020 FORM 10-K ANNUAL REPORT | ||||||
Contingency Accruals.
Contingent liabilities arise in the ordinary course of business, including those related to lawsuits, arbitration, mediation, and other forms of litigation. FHN establishes loss contingency liabilities for matters when loss is both probable and reasonably estimable in accordance with ASC 450-20-50 “Contingencies - Accruals for Loss Contingencies”. If loss for a matter is probable and a range of possible loss outcomes is the best estimate available, accounting guidance generally requires a liability to be established at the low end of the range. Expected recoveries from insurance and indemnification arrangements are recognized if they are considered equally as probable and reasonably estimable as the related loss contingency up to the recognized amount of the estimated loss. Gain contingencies and expected recoveries from insurance and indemnification arrangements in excess of the associated recorded estimated losses are generally recognized when received. Recognized recoveries are recorded as offsets to the related expense in the Consolidated Statements of Income. The favorable resolution of a gain contingency generally results in the recognition of other income in the Consolidated Statements of Income. Contingencies assumed in business combinations are evaluated through the end of the one-year post-closing measurement period. If the acquisition-date fair value of the contingency can be determined during the measurement period, recognition occurs as part of the acquisition-date fair value of the acquired business. If the acquisition-date fair value of the contingency cannot be determined, but loss is considered probable as of the acquisition date and can be reasonably estimated within the measurement period, then the estimated amount is recorded within acquisition accounting. If the requirements for inclusion of the contingency as part of the acquisition are not met, subsequent recognition of the contingency is included in earnings.
Business Combinations
Assets and liabilities acquired in business combinations are generally recognized at their fair values as of the acquisition date, with the related transaction costs expensed in the period incurred. Specified items such as net investment in leases as lessor, acquired operating lease assets and liabilities as lessee, employee benefit plans and income-tax related balances are recognized in accordance with
accounting guidance that results in measurements that may differ from fair value. FHN may record provisional amounts at the time of acquisition based on available information. The provisional valuation estimates may be adjusted for a period of up to one year (“measurement period”) from the date of acquisition if new information is obtained about facts and circumstances that existed as of the acquisition date that, if known, would have affected the measurement of the amounts recognized as of that date. Adjustments recorded during the measurement period are recognized in the current reporting period.
The excess of purchase price over the valuation of specifically identified assets and liabilities is recorded as goodwill. In certain circumstances the net values of assets and liabilities acquired may exceed the purchase price, which is recognized within non-interest income as a purchase accounting gain.
Summary of Accounting Changes.
In June 2016, the FASB issued ASU 2016-13, “Measurement of Credit Losses on Financial Instruments,” which revises the measurement and recognition of credit losses for assets measured at amortized cost (e.g., HTM loans and debt securities) and AFS debt securities. Under ASU 2016-13, for assets measured at amortized cost, the current expected credit loss (CECL) is measured as the difference between amortized cost and the net amount expected to be collected. This represents a departure from prior GAAP as the “incurred loss” methodology for recognizing credit losses delayed recognition until it was probable a loss had been incurred. Under CECL the full amount of expected credit losses will be recognized at the time of loan origination. The measurement of current expected credit losses is based on relevant information about past events, including historical experience, current conditions, and reasonable and supportable forecasts that affect the collectability of the reported amount. Additionally, current disclosures of credit quality indicators in relation to the amortized cost of financing receivables are further disaggregated by year of origination. ASU 2016-13 leaves the methodology for measuring credit losses on AFS debt securities largely unchanged,with the maximum credit loss representing the difference between amortized cost and fair value. However, such credit losses are recognized through an allowance for credit losses, which permits recovery of previously recognized credit losses if circumstances change.
ASU 2016-13 also revises the recognition of credit losses for purchased financial assets with a more-than insignificant amount of credit deterioration since
|
FIRST HORIZON CORPORATION
|
135
|
2020 FORM 10-K ANNUAL REPORT | ||||||
origination (“PCD assets”). For PCD assets, the initial allowance for credit losses is added to the purchase price. Only subsequent changes in the allowance for credit losses are recorded as a credit loss expense for PCD assets. Interest income for PCD assets is recognized based on the effective interest rate, excluding the discount embedded in the purchase price that is attributable to the acquirer’s assessment of credit losses at acquisition. Previously, credit losses for purchased credit-impaired assets were included in the initial basis of the assets with subsequent declines in credit resulting in expense while subsequent improvements in credit were reflected as an increase in the future yield from the assets. For non-PCD assets, expected credit losses are recognized through earnings upon acquisition and the entire premium or discount accreted to interest income over the remaining life of the loan. Credit allowances for acquired non-PCD assets are established through immediate recognition of credit loss expense (similar to originated loans) and do not consider purchase discounts related to estimated credit losses.
The provisions of ASU 2016-13 were generally adopted through a cumulative-effect adjustment to retained earnings as of the beginning of the first reporting period in the year of adoption. Prospective implementation was required for debt securities for which an other-than-temporary-impairment (“OTTI”) had been previously recognized. Amounts previously recognized in accumulated other comprehensive income (“AOCI”) as of the date of adoption that relate to improvements in cash flows expected to be collected continue to be accreted into income over the remaining life of the asset. Recoveries of amounts previously written off relating to improvements in cash flows after the date of adoption are recorded in earnings when received. A prospective transition approach was used for existing PCD assets where, upon adoption, the amortized cost basis was increased to offset the initial recognition of the allowance for credit losses. Thus, an entity was not required to reassess its purchased financial assets that existed as of the date of adoption to determine whether they would have met at acquisition the new criteria of more-than-insignificant credit deterioration since origination. An entity accretes the remaining noncredit discount (based on the revised amortized cost basis) into interest income at the effective interest rate at the adoption date.
ASU 2016-13 was effective for fiscal years beginning after December 15, 2019, including interim periods within those fiscal years. FHN’s most significant implementation activities included review of loan portfolio segments and classes, identification and
evaluation of collateral dependent loans and loans secured by collateral replenishment arrangements, selection of measurement methodologies and related model development, data accumulation and verification, development of loan life estimates, identification of reasonable and supportable forecast periods, selection of time lines and methods for reversion to unadjusted historical information, multiple preliminary analysis including parallel runs against existing loan loss estimation processes, and design and evaluation of internal controls over the new estimation processes. FHN utilizes undiscounted cash flow methods for loans except for troubled debt restructurings, which require use of discounted cash flow methodologies.
A significant portion of the adoption impact for ASU 2016-13 relates to increased reserves within the consumer portfolios, given the longer contractual maturities associated with many of these products as well as increased reserves for acquired loans that previously considered purchase discounts. Based on its implementation efforts, FHN recorded the following adoption adjustments effective January 1, 2020.
| (Dollars in millions) | January 1, 2020 | |||||||
| Loans and leases (a) | $ |
|
||||||
| Allowance for loan and lease losses |
(
|
|||||||
| Other assets (deferred taxes) |
|
|||||||
| Total assets | $ |
(
|
||||||
| Other liabilities (unfunded commitments) | $ |
|
||||||
| Retained earnings |
(
|
|||||||
| Total liabilities and equity | $ |
(
|
||||||
FHN also assessed several asset classes other than loans that are within the scope of CECL and determined that the adoption effects for the change in measurement of credit risk were minimal for these classes. This includes Fed funds sold which have no history of credit losses due to their short (typically overnight) duration and counterparty risk assessment processes. This also includes securities borrowed and securities purchased under agreements to resell which have collateral maintenance agreements that incorporate master netting provisions resulting in minimal uncollateralized positions as of any date as evidenced by the disclosures provided in Note 23 - Master Netting and Similar Agreements-Repurchase, Reverse Repurchase, and Securities Borrowing Transactions. Additionally, FHN also evaluated the composition of its AFS securities and determined that the changes in ASU 2016-13 did not have an effect on the current portfolio.
|
FIRST HORIZON CORPORATION
|
136
|
2020 FORM 10-K ANNUAL REPORT | ||||||
In April 2019, the FASB issued ASU 2019-04, "Codification Improvements to Topic 326, Financial Instruments-Credit Losses, Topic 815, Derivatives and Hedging, and Topic 825, Financial Instruments,"
which provides an election to either 1) not measure or 2) measure separately an allowance for credit losses for accrued interest receivable (“AIR"). Entities electing to not measure an allowance for AIR must write off uncollectible interest in a timely manner. Additionally, an election is provided for the write off of uncollectible interest to be recorded either as a reversal of interest income or a charge against the allowance for credit losses or a combination of both. Disclosures are required depending upon which elections are made.
ASU 2019-04 also clarifies that when loans and securities are transferred between balance sheet categories (e.g., loans from held-for-investment to held-for-sale or securities from held-to-maturity to available-for-sale) the associated allowance for credit losses should be reversed to income and prospective accounting follows the requirements for the new classification. Further, ASU 2019-04 clarifies that recoveries should be incorporated within the estimation of the allowance for credit losses. Expected recoveries should not exceed the aggregate amount of prior write-offs and expected future write-offs. The inclusion of expected recoveries in the measurement of expected credit losses may result in a negative credit allowance in certain circumstances. Additionally, for collateral dependent financial assets, the allowance for credit losses that is added to the amortized cost basis should not exceed amounts previously written off.
ASU 2019-04 also makes several changes when a discounted cash flow approach is used to measure expected credit losses. ASU 2019-04 removes ASU 2016-03’s prohibition of using projections of future interest rate environments when using a discounted cash flow method to measure expected credit losses on variable-rate financial instruments. If an entity uses projections or expectations of future interest rate environments in estimating expected cash flows, the same assumptions should be used in determining the effective interest rate used to discount those expected cash flows. The effective interest rate should also be adjusted to consider the effects of expected prepayments on the timing of expected future cash flows. ASU 2019-04 provides an election to adjust the effective interest rate used in discounting expected cash flows to isolate credit risk in measuring the allowance for credit losses. Further, the discount rate should not be adjusted for subsequent changes in expected prepayments if a financial asset is restructured in a troubled debt restructuring.
Related to collateral-dependent financial assets, ASU 2019-04 requires inclusion of estimated costs to sell in the measurement of expected credit losses in situations where the entity intends to sell rather than operate the collateral. Additionally, the estimated costs to sell should be undiscounted when the entity intends to sell rather than operate the collateral.
Finally, ASU 2019-04 specifies that contractual renewal or extension options, except those treated as derivatives, should be included in the determination of the contractual term for a financial asset when included in the original or modified contract as of the reporting date if they are not unconditionally cancellable by the entity.
The effective date and transition requirements for these components of ASU 2019-04 are consistent with the requirements for ASU 2016-13 and FHN incorporated these changes and revisions within its implementation efforts. Based on its previous existing practices for the timely write off uncollectible AIR, FHN elected to not measure an allowance for credit losses for AIR and to continue recognition of related write-offs as a reversal of interest income.
In May 2019, the FASB issued ASU 2019-05, “Financial Instruments - Credit Losses, Targeted Transition Relief,” which provides an option to irrevocably elect the fair value option for certain financial assets previously measured at amortized cost basis that are in the scope of ASU 2016-13, applied on an instrument-by-instrument basis. The fair value option election does not apply to HTM debt securities. The effective date and transition requirements for ASU 2019-05 are consistent with the requirements for ASU 2016-13. FHN did not elect to apply the fair value option to any asset classes that are in scope for CECL.
In November 2019, the FASB issued ASU 2019-11, “Codification Improvements to Topic 326, Financial Instruments-Credit Losses” which clarifies that expected recoveries should be included in the amortized cost basis previously written off or expected to be written off in the valuation allowance for PCD assets. ASU 2019-11 also clarifies that recoveries or expected recoveries of the unamortized noncredit discount or premium should not be included in the allowance for credit losses. ASU 2019-11 provides specific transition relief for existing troubled debt restructurings and extends the disclosure relief of ASU 2019-04 for accrued interest receivable balances to additional relevant disclosures involving amortized cost basis. Related to the assessment of credit risk for collateralized assets, ASU 2019-11
|
FIRST HORIZON CORPORATION
|
137
|
2020 FORM 10-K ANNUAL REPORT | ||||||
indicates that an entity should assess whether it reasonably expects the borrower will be able to continually replenish collateral securing the financial asset to apply the practical expedient of ASU 2016-13 while also requiring an estimation of expected credit losses for any difference between the amount of the amortized cost basis that is greater than the fair value of the collateral securing the financial asset.
The effective date and transition requirements for ASU 2019-11 are consistent with the requirements for ASU 2016-13 and FHN incorporated these changes and revisions within its implementation efforts and the effects are embedded within the adoption effects of ASU 2016-13. Consistent with non-PCD assets, the effect of including recoveries and expected recoveries within the measurement of expected credit losses for PCD assets may result in a negative credit allowance in certain circumstances.
On March 22, 2020, The Board of Governors of the Federal Reserve System, the Federal Deposit Insurance Corporation, the National Credit Union Administration, the Office of the Comptroller of the Currency, and the Consumer Financial Protection Bureau issued guidance that interprets, but does not suspend, ASC 310-40 related to the identification of TDRs. Also on that day, the FASB issued a statement indicating that the Interagency Guidance had been developed in consultation with the staff of the FASB who concurred with the approach. The Interagency Guidance indicates that a lender can conclude that a borrower is not experiencing financial difficulty if either 1) short-term (e.g., six months) modifications are made in response to the economic effects of the COVID-19 pandemic, such as payment deferrals, fee waivers, extensions of repayment terms, or other delays in payment that are insignificant related to loans in which the borrower is less than 30 days past due on its contractual payments at the time a modification program is implemented, or 2) the modification or deferral program is mandated by the federal government or a state government. Accordingly, any loan modification made in response to COVID-19 pandemic that meets either of these practical expedients would not be considered a TDR because the borrower is not experiencing financial difficulty. Consistent with this perspective, financial institutions are generally not expected to designate loans with deferrals granted due to COVID-19 as past due or nonaccrual because of a deferral.
On March 27, 2020, the CARES Act was signed into law. The CARES Act provides relief from certain requirements under U.S. GAAP. Section 4013 of the CARES Act provides entities optional temporary relief from the accounting and disclosure requirements for
TDRs under ASC 310-40 in certain situations. Section 4013 of the CARES Act permits the suspension of ASC 310-40 for loan modifications that are made by financial institutions in response to the COVID-19 pandemic if 1) the borrower was not more than 30 days past due as of December 31, 2019, and 2) the modifications are related to arrangements that defer or delay the payment of principal or interest, or change the interest rate on the loan. The CARES provisions apply to loan modifications relating to COVID-19 that are made between March 1, 2020 and the earlier of December 31, 2020 or 60 days after the national emergency related to COVID-19 ends.
On April 3, 2020, the Chief Accountant of the SEC issued a statement indicating that the staff would not object to the conclusion that elective application of the provisions of CARES Act are in accordance with GAAP for the periods that such elections are available.
On April 7, 2020, revised Interagency Guidance was issued to reflect the interaction of the CARES Act provisions and the Interagency Guidance, clarifying that the CARES Act guidance can be applied for regulatory purposes. Loan modifications outside the scope of the CARES Act and organizations that elect to not apply the CARES Act guidance should continue to apply ASC 310-40 as interpreted by the Interagency Guidance.
On December 27, 2020, the Consolidated Appropriations Act, 2021 (CAA) was signed into law. The CAA extends the CARES Act TDR relief provisions to apply to modifications executed between March 1, 2020 and the earlier of (1) 60 days following the date the COVID-19 national emergency comes to an end and (2) January 1, 2022.
FHN has evaluated the provisions of the CARES Act and the Interagency Guidance related to loan modification programs instituted as a result of the COVID-19 pandemic. FHN’s programs primarily involve the deferral of principal and interest payments, fee waivers and mortgage modifications required in response to government modification requirements. With the duration of the economic effects from the pandemic continuing, in third quarter 2020, FHN initiated additional modification programs for extensions of certain borrowers which result in total deferral periods exceeding 6 months or temporary conversion of amortizing loans to interest-only status. Accordingly, FHN has applied the provisions of the CARES Act to its most recent modification programs.
|
FIRST HORIZON CORPORATION
|
138
|
2020 FORM 10-K ANNUAL REPORT | ||||||
Accounting Changes With Extended Transition Periods
In March 2020, the FASB issued ASU 2020-04, “Facilitation of the Effects of Reference Rate Reform on Financial Reporting” which provides several optional expedients and exceptions to ease the potential burden in accounting for (or recognizing the effects of) reference rate reform on financial reporting. The provisions of ASU 2020-04 primarily affect 1) contract modifications (e.g., loans, leases, debt, and derivatives) made in anticipation that a reference rate (e.g., LIBOR) will be discontinued and 2) the application of hedge accounting for existing relationships affected by those modifications. The provisions of ASU 2020-04 are effective upon release and apply only to contracts, hedging relationships, and other transactions that reference LIBOR or another reference rate expected to be discontinued because of reference rate reform. The expedients and exceptions provided by ASU 2020-04 do not apply to contract modifications made and hedging relationships entered into or evaluated after December 31, 2022, except for hedging relationships existing as of December 31, 2022, that an entity has elected certain optional expedients for and that are retained through the end of the hedging relationship. FHN has been identifying contracts affected by reference rate reform and developing modification plans for those contracts. As described below FHN has elected to utilize the optional expedients and exceptions provided by ASU 2020-04 for certain contract modifications made in 2020. FHN anticipates that it will continue to utilize the expedients and exceptions in situations where they mitigate potential accounting outcomes that do not faithfully represent management's intent or risk management activities which is consistent with the purpose of the standard.
In January 2021, the FASB issued ASU 2021-01, "Scope" to expand the scope of ASU 2020-04 to apply to certain contract modifications that were implemented in October 2020 by derivative clearinghouses for the use of Secure Overnight Funding Rate (SOFR) in discounting, margining and price alignment for centrally cleared derivatives, including derivatives utilized in hedging relationships. ASU 2021-01 also applies to derivative contracts affected by the change in discounting convention regardless of whether they are centrally cleared (i.e., bi-lateral contracts can also be modified) and regardless of whether they reference LIBOR. ASU 2021-01 was effective immediately upon issuance with retroactive application permitted. FHN elected to retroactively apply the provisions of ASU 2021-01 because its centrally cleared derivatives were
affected by the change in discounting convention and because it has other bi-lateral derivative contracts that may be modified to conform to the use of SOFR for discounting. Adoption did not have a significant effect on FHN's reporting financial condition or earnings.
|
FIRST HORIZON CORPORATION
|
139
|
2020 FORM 10-K ANNUAL REPORT | ||||||
Note 2 –
Acquisitions and Divestitures
The following schedule details a preliminary allocation of merger consideration to the valuations of the identifiable tangible and intangible assets acquired and liabilities assumed from IBKC as of July 1, 2020.
| (Dollars in millions) | IBERIABANK Corporation | |||||||||||||
| Assets: | ||||||||||||||
| Cash and due from banks | $ |
|
||||||||||||
| Interest-bearing deposits with banks |
|
|||||||||||||
| Securities available for sale at fair value |
|
|||||||||||||
| Loans held for sale |
|
|||||||||||||
| Loans and leases (a) |
|
|||||||||||||
| Allowance for loan and lease losses |
(
|
|||||||||||||
| Other intangible assets |
|
|||||||||||||
| Premises and equipment |
|
|||||||||||||
| OREO |
|
|||||||||||||
| Other assets |
|
|||||||||||||
| Total assets acquired | $ |
|
||||||||||||
| Liabilities: | ||||||||||||||
| Deposits | $ |
|
||||||||||||
| Short-term borrowings |
|
|||||||||||||
| Term borrowings |
|
|||||||||||||
| Other liabilities |
|
|||||||||||||
| Total liabilities assumed | $ |
|
||||||||||||
| Net assets acquired | $ |
|
||||||||||||
| Consideration paid: | ||||||||||||||
| Consideration for outstanding common stock | $ |
|
||||||||||||
| Consideration for equity awards |
|
|||||||||||||
| Consideration for preferred stock |
|
|||||||||||||
| Total consideration paid | $ |
|
||||||||||||
| Preliminary purchase accounting gain | $ |
(
|
||||||||||||
(a) Includes $
1.3
billion of initial net investments in sales-type and direct financing leases.
In relation to the merger of equals, FHN recorded a preliminary $
533
million purchase accounting gain, representing the shortfall of the purchase price under the acquisition accounting value of net assets acquired, net of deferred taxes. The preliminary purchase accounting gain is not taxable. Due to the fact that back office functions (including loan and deposit processing) still have not been integrated, the evaluation of post-merger activity, and the extended
information gathering and management review processes required to properly record acquired assets and liabilities, FHN considers its valuations of IBKC's loans and leases, other assets, tax receivables and payables, other liabilities and acquired contingencies to be provisional as management continues to identify and assess information regarding the nature of these assets and liabilities and reviews the associated valuation
|
FIRST HORIZON CORPORATION
|
140
|
2020 FORM 10-K ANNUAL REPORT | ||||||
assumptions and methodologies. Accordingly, the amounts recorded for current and deferred tax assets and liabilities are also considered provisional as FHN continues to evaluate the nature and extent of permanent and temporary (timing) differences between the book and tax bases of the acquired assets and liabilities assumed. Additionally, the
accounting policies of both FHN and IBKC are in the process of being reviewed in detail. Upon completion of such review, conforming adjustments or financial statement reclassification may be determined.
The following is a description of the methods used to determine the fair values of significant assets acquired and liabilities assumed presumed above.
Cash and due from banks and interest-bearing deposits with banks:
The carrying amount of these assets is a reasonable estimate of fair value based on the short-term nature of these assets.
Securities available for sale:
Fair values for securities were based on quoted market prices where available. If quoted market prices are not available, fair value estimates are based on observable inputs obtained from market transactions in similar securities. Securities held to maturity were reclassified to securities available for sale based on FHN's intent at closing.
Loans:
Fair values for loans were based on a discounted cash flow methodology that considered factors including loan type and related collateral, classification status, remaining term of the loan, fixed or variable interest rate, amortization status and current discount rates. Expected cash flows were derived using inputs consistent with management's assessment of credit risk for allowance measurement with adjustments for consistency with fair value measurement concepts. Large loans were specifically reviewed to evaluate credit risk. Loans were valued individually although multiple inputs were applied to loans with similar characteristics as appropriate. The discount rate did not include an explicit factor for credit losses, as that was included as a reduction to the estimated cash flows.
Leases:
Sales-type and direct financing leases were valued at the net investment in the lease which consists of both the lease receivable (including both the remaining lease payments and the guaranteed residual asset value) and the unguaranteed residual asset, if any. Discounting of the lease receivable was performed using the rate implicit in the lease. The unguaranteed residual asset represents the difference in the fair value of the underlying asset and the lease receivable and therefore includes consideration of all terms and conditions in the lease.
Intangible assets:
Core deposit intangible asset represents the value of the relationships with deposit clients.
The fair value for the core deposit intangible asset was estimated based on a discounted cash flow methodology that gave appropriate consideration to
expected client attrition rates, net maintenance cost of the deposit base, alternative costs of funds, and the interest costs associated with the client deposits. The core deposit intangible asset is being amortized over its estimated useful life of approximately
ten years
utilizing an accelerated method. Client relationship intangibles are valued using a discounted cash flow methodology that reflects the estimated value of the future net earnings from the relationships which includes adjustments for estimated attrition.
Loans Held for Sale:
The valuation of loans held for sale, primarily conforming mortgages, reflected quotes or bids on these loans directly from the purchasing financial institutions.
Allowance for Loan and Lease Losses:
As discussed in Note 1, the adoption of ASU 2016-13 impacted the way in which the allowance for credit losses is determined for acquired loans. Prior to the IBKC merger, on January 1, 2020, IBKC also adopted ASU 2016-13 through the development of multiple current expected credit loss models (ECL Models) which segmented IBKC’s loan and lease portfolio by borrower and loan type to estimate lifetime expected credit losses for loans and leases. Within each ECL Model, loans and leases were further segregated based on additional risk characteristics specific to that loan or lease type and the ECL Models used both internal and external historical loss data, as appropriate.
While there were significant similarities in the manner of adoption of ASU 2016-13 by legacy FHN and legacy IBKC, numerous steps were taken to align the IBKC process to ensure that the ACL reported at the time of the IBKC merger in the table below and in all subsequent reporting periods is consistent with the ACL policies as outlined in Note 1 – Significant Accounting Policies and Note 5 – Allowance for Credit Losses. This included conforming certain IBKC assumptions (e.g., the reasonable and supportable forecast of future economic conditions and the reasonable and supportable forecast period, among others) to that of FHN. This was accomplished primarily through qualitative adjustments for alignment.
|
FIRST HORIZON CORPORATION
|
141
|
2020 FORM 10-K ANNUAL REPORT | ||||||
Derivatives:
Derivative assets and liabilities are included in Other assets and Other liabilities. Forward sales contracts are valued using current transactions involving identical securities. Interest rate swaps, interest rate locks, interest rate collars, interest rate floors, and equity indexed derivatives are estimated using prices of financial instruments with similar characteristics and observable inputs. Risk participations also incorporate an estimate of credit risk.
Lease Assets and Lease Liabilities:
Lease assets and lease liabilities were
measured using a methodology that involved estimating the future rental payments over the remaining lease term with discounting using a fully-collateralized discount rate. The lease term was determined for individual leases based on management's assessment of the probability of exercising existing renewal options. The net effect of any off-market terms in a lease were also discounted and applied to the balance of the lease asset.
Premises and Equipment:
Land and buildings held for use are valued at appraised values, which reflect considerations of recent disposition values for similar property types with adjustments for characteristics of individual properties. Locations held for sale are valued at appraised values which also reference recent disposition values for similar property types but also considers marketability discounts for vacant properties. The valuations of locations held for sale are reduced by estimated costs to sell. Other fixed assets are valued using a discounted cash flow methodology which reflects estimates of future value of assets to a hypothetical buyer.
OREO:
OREO properties are valued at estimated fair value less estimated costs to sell the real estate. Estimated fair value is determined using appraised values which includes consideration of recent disposition values for similar property types with adjustments for characteristics of individual properties.
Deposits
: The fair values used for the demand and savings deposits by definition equal the amount payable on demand at the acquisition date. Fair values for time deposits were estimated using a discounted cash flow analysis applying interest rates currently offered to the contractual interest rates on such time deposits.
Short-term borrowings:
The carrying amount of these liabilities is a reasonable estimate of fair value based on the short-term nature of these liabilities.
Term Borrowings:
The fair values of long-term debt instruments are estimated based on quoted market prices for instrument if available, or for similar instruments if not available. For redeemable debt instruments, an evaluation of the debt terms in comparison to current financing alternatives was performed to evaluate if the redemption value represented the fair value relevant to a market participant. If pricing for similar instruments is not available, a discounted cash flow analysis is utilized based on estimated current borrowing rates for similar types of instruments and considers whether the debt is currently callable. Estimated discount rates are determined from the perspective of the post-merger combined entity rather than the acquiree and/or original issuers.
FHN's operating results for the year ended December 31, 2020 include the operating results of the acquired assets and assumed liabilities of IBKC subsequent to the merger of equals transaction on July 1, 2020. Due to various system conversions of IBKC during the second half of 2020, as well as other streamlining and integration of the operating activities into those of the Company, historical reporting for the former IBKC operations is impracticable and thus disclosures of the revenue from the assets acquired and income before income taxes is impracticable for the period subsequent to acquisition.
|
FIRST HORIZON CORPORATION
|
142
|
2020 FORM 10-K ANNUAL REPORT | ||||||
The following table presents pro forma information as if the IBKC transaction occurred on January 1, 2019. The pro forma information does not necessarily reflect the results of operations that would have occurred had the two companies combined on January 1, 2019. Furthermore, cost savings and other business synergies related to the transaction are not reflected in the pro forma amounts.
| Pro Forma Information for the Years Ended | ||||||||||||||
| (Dollars in millions) | December 31, 2020 | December 31, 2019 (a) | ||||||||||||
| Net interest income | $ |
|
$ |
|
||||||||||
| Noninterest income |
|
|
||||||||||||
| Net income (loss) |
|
|
||||||||||||
(a) Does not include the impact of CECL which was adopted January 1, 2020.
Total merger and integration expenses for the IBKC merger recognized for the years ended December 31, 2020 and 2019 are presented in the table below:
| (Dollars in millions) | 2020 | 2019 | ||||||||||||
| Legal and professional fees (a) | $ |
|
$ |
|
||||||||||
| Personnel expense (b) |
|
|
||||||||||||
| Contribution expense (c) |
|
|
||||||||||||
| Miscellaneous expense (d) |
|
|
||||||||||||
| Total IBKC merger expense | $ |
|
$ |
|
||||||||||
(a) Primarily comprised of fees for legal, accounting, and merger consultants.
(b) Primarily comprised of fees for severance and retention.
(c) Comprised of contribution expense related to the establishment of the Louisiana First Horizon Foundation.
(d) Primarily comprised of fees for travel and entertainment, contract employment and other miscellaneous expenses.
On July 17, 2020, First Horizon Bank completed its purchase of
30
branches from Truist Bank. As part of the transaction, FHN assumed approximately $
2.2
billion of branch deposits for a
3.40
% deposit premium and purchased approximately $
423
million of branch loans. The branches are in communities in North Carolina (
20
branches), Virginia (
8
branches), and Georgia (
2
branches). This transaction qualifies as a business combination.
As of December 31, 2020, the valuation of the acquired assets and liabilities from the Truist branches acquisition was final.
|
FIRST HORIZON CORPORATION
|
143
|
2020 FORM 10-K ANNUAL REPORT | ||||||
The following schedule details the fair value of the identifiable tangible and intangible assets acquired and liabilities assumed from Truist Bank as of July 17, 2020.
| (Dollars in millions) | Truist Bank | |||||||||||||
| Assets: | ||||||||||||||
| Cash and due from banks | $ |
|
||||||||||||
| Loans and leases |
|
|||||||||||||
| Allowance for loan and lease losses |
(
|
|||||||||||||
| Other intangible assets |
|
|||||||||||||
| Premises and equipment |
|
|||||||||||||
| Other assets |
|
|||||||||||||
| Total assets acquired | $ |
|
||||||||||||
| Liabilities: | ||||||||||||||
| Deposits | $ |
|
||||||||||||
| Other liabilities |
|
|||||||||||||
| Total liabilities assumed | $ |
|
||||||||||||
| Net assets acquired | $ |
|
||||||||||||
| Consideration paid: | ||||||||||||||
| Cash | $ |
|
||||||||||||
| Total consideration paid | $ |
|
||||||||||||
| Goodwill | $ |
|
||||||||||||
In relation to the acquisition, FHN recorded $
78
million in goodwill, representing the excess of acquisition consideration over the estimated fair value of net assets acquired. All goodwill has been attributed to FHN's Regional Banking segment (refer to Note 7 - Intangible Assets for additional information). This goodwill is the result of expected synergies, operational efficiencies and other factors.
FHN's operating results for the year ended December 31, 2020 include the operating results of the acquired assets and assumed liabilities of Truist Bank subsequent to the acquisition on July 17, 2020. Expenses related to FHN's merger and integration activities are recorded in FHN's Corporate segment.
|
FIRST HORIZON CORPORATION
|
144
|
2020 FORM 10-K ANNUAL REPORT | ||||||
Total other merger and integration expense recognized for the years ended December 31, 2020 and 2019 are presented in the table below:
| Years ended December 31, | ||||||||||||||
| (Dollars in millions) | 2020 | 2019 | ||||||||||||
| Legal and professional fees (a) | $ |
|
$ |
|
||||||||||
| Personnel expense (b) |
|
|
||||||||||||
| Contract employment and outsourcing (c) |
|
|
||||||||||||
| Net occupancy expense (d) |
|
|
||||||||||||
| Miscellaneous expense (e) |
|
|
||||||||||||
| All other expense (f) |
|
|
||||||||||||
| Total | $ |
|
$ |
|
||||||||||
Certain previously reported amounts have been reclassified to agree with current presentation.
(a) Primarily comprised of fees for legal, accounting, and merger consultants.
(b) Primarily comprised of fees for severance and retention.
(c) Primarily relates to fees for temporary assistance for merger and integration activities.
(d) Primarily relates to expenses associated with lease exits.
(e) Consists of fees for operations services, communications and courier, equipment rentals, depreciation and maintenance, supplies, travel and entertainment, computer software, and advertising and public relations.
(f) Primarily relates to contract termination charges, internal technology development costs, costs of shareholder matters and asset impairments, as well as other miscellaneous expenses.
In addition to the transactions mentioned above, FHN acquires or divests assets from time to time in transactions that are considered business combinations or divestitures but are not material to FHN individually or in the aggregate. In April 2019, FHN sold a subsidiary acquired as part of the CBF merger in 2017 that did not fit within FHN's risk profile. The sale resulted in the removal of approximately $
25
million UPB of subprime consumer loans from Loans held for sale on FHN's Consolidated Balance Sheets.
|
FIRST HORIZON CORPORATION
|
145
|
2020 FORM 10-K ANNUAL REPORT | ||||||
Note 3 –
Investment Securities
The following tables summarize FHN’s investment securities on December 31, 2020 and 2019:
| December 31, 2020 | ||||||||||||||||||||||||||
| (Dollars in millions) |
Amortized
Cost |
Gross
Unrealized Gains |
Gross
Unrealized Losses |
Fair
Value |
||||||||||||||||||||||
| Securities available for sale: | ||||||||||||||||||||||||||
| U.S. treasuries | $ |
|
$ |
|
$ |
|
$ |
|
||||||||||||||||||
| Government agency issued MBS |
|
|
(
|
|
||||||||||||||||||||||
| Government agency issued CMO |
|
|
(
|
|
||||||||||||||||||||||
| Other U.S. government agencies |
|
|
|
|
||||||||||||||||||||||
| Corporate and other debt |
|
|
(
|
|
||||||||||||||||||||||
| States and municipalities |
|
|
|
|
||||||||||||||||||||||
| $ |
|
$ |
|
$ |
(
|
|
||||||||||||||||||||
| AFS securities recorded at fair value through earnings: | ||||||||||||||||||||||||||
| SBA-interest only strips (a) |
|
|||||||||||||||||||||||||
| Total securities available for sale (b) | $ |
|
||||||||||||||||||||||||
(a)
SBA-interest only strips are recorded at elected fair value. See Note 24 - Fair Value of Assets and Liabilities for additional information.
(b)
Includes $
6.4
billion of securities pledged to secure public deposits, securities sold under agreements to repurchase, and for other purposes.
| December 31, 2019 | ||||||||||||||||||||||||||
| (Dollars in millions) |
Amortized
Cost |
Gross
Unrealized Gains |
Gross
Unrealized Losses |
Fair
Value |
||||||||||||||||||||||
| Securities available for sale: | ||||||||||||||||||||||||||
| U.S. treasuries | $ |
|
$ |
|
$ |
|
$ |
|
||||||||||||||||||
| Government agency issued MBS |
|
|
(
|
|
||||||||||||||||||||||
| Government agency issued CMO |
|
|
(
|
|
||||||||||||||||||||||
| Other U.S. government agencies |
|
|
(
|
|
||||||||||||||||||||||
| Corporate and other debt |
|
|
|
|
||||||||||||||||||||||
| States and municipalities |
|
|
|
|
||||||||||||||||||||||
| $ |
|
$ |
|
$ |
(
|
|
||||||||||||||||||||
| AFS securities recorded at fair value through earnings: | ||||||||||||||||||||||||||
| SBA-interest only strips (a) |
|
|||||||||||||||||||||||||
| Total securities available for sale (b) | $ |
|
||||||||||||||||||||||||
(a)
SBA-interest only strips are recorded at elected fair value. See Note 24 - Fair Value of Assets and Liabilities for additional information.
(b)
Includes $
3.8
billion of securities pledged to secure public deposits, securities sold under agreements to repurchase, and for other purposes.
|
FIRST HORIZON CORPORATION
|
146
|
2020 FORM 10-K ANNUAL REPORT | ||||||
The amortized cost and fair value by contractual maturity for the available-for-sale debt securities portfolio on December 31, 2020 is provided below:
| Available for Sale | ||||||||||||||
| (Dollars in millions) |
Amortized
Cost |
Fair
Value |
||||||||||||
| Within 1 year | $ |
|
$ |
|
||||||||||
| After 1 year through 5 years |
|
|
||||||||||||
| After 5 years through 10 years |
|
|
||||||||||||
| After 10 years |
|
|
||||||||||||
| Subtotal |
|
|
||||||||||||
| Government agency issued MBS and CMO (a) |
|
|
||||||||||||
| Total | $ |
|
$ |
|
||||||||||
(a)
Expected maturities will differ from contractual maturities because borrowers may have the right to call or prepay obligations with or without call or prepayment penalties.
Gross gains on sales of debt investment securities for the years ended December 31, 2020, 2019 and 2018 were insignificant. Gross losses on sales of debt investment securities were $
4
million for the year ended 2020 and insignificant for the years ended December 31, 2019 and 2018. Cash proceeds from the sale of available-for-sale securities during 2020 and 2019 were $
629
million and $
192
million, respectively and were
no
t material in 2018.
The following tables provide information on investments within the available-for-sale portfolio that had unrealized losses as of December 31, 2020 and 2019:
| As of December 31, 2020 | ||||||||||||||||||||||||||||||||||||||
| Less than 12 months | 12 months or longer | Total | ||||||||||||||||||||||||||||||||||||
| (Dollars in millions) | Fair Value | Unrealized Losses | Fair Value | Unrealized Losses | Fair Value | Unrealized Losses | ||||||||||||||||||||||||||||||||
| U.S. treasuries | $ |
|
$ |
|
$ |
|
$ |
|
$ |
|
$ |
|
||||||||||||||||||||||||||
| Government agency issued MBS |
|
(
|
|
|
|
(
|
||||||||||||||||||||||||||||||||
| Government agency issued CMO |
|
(
|
|
|
|
(
|
||||||||||||||||||||||||||||||||
| Other U.S. government agencies |
|
(
|
|
|
|
(
|
||||||||||||||||||||||||||||||||
| States and municipalities |
|
|
|
|
|
|
||||||||||||||||||||||||||||||||
| Total | $ |
|
$ |
(
|
$ |
|
$ |
|
$ |
|
$ |
(
|
||||||||||||||||||||||||||
| As of December 31, 2019 | ||||||||||||||||||||||||||||||||||||||
| Less than 12 months | 12 months or longer | Total | ||||||||||||||||||||||||||||||||||||
| (Dollars in millions) | Fair Value | Unrealized Losses | Fair Value | Unrealized Losses | Fair Value | Unrealized Losses | ||||||||||||||||||||||||||||||||
| Government agency issued MBS | $ |
|
$ |
(
|
$ |
|
$ |
(
|
$ |
|
$ |
(
|
||||||||||||||||||||||||||
| Government agency issued CMO |
|
(
|
|
(
|
|
(
|
||||||||||||||||||||||||||||||||
| Other U.S. government agencies |
|
(
|
|
|
|
(
|
||||||||||||||||||||||||||||||||
| States and municipalities |
|
|
|
|
|
|
||||||||||||||||||||||||||||||||
| Total | $ |
|
$ |
(
|
$ |
|
$ |
(
|
$ |
|
$ |
(
|
||||||||||||||||||||||||||
For periods subsequent to 2019, FHN has evaluated all AFS debt securities that were in unrealized loss positions in accordance with its accounting policy for recognition of credit losses. No AFS debt securities
were determined to have credit losses because the primary cause of the decline in value was attributable to changes in interest rates. Total AIR not included in the fair value or amortized cost basis of AFS debt securities was $
22
million as of December 31, 2020.
|
FIRST HORIZON CORPORATION
|
147
|
2020 FORM 10-K ANNUAL REPORT | ||||||
Consistent with FHN's review of the related securities, there were no credit-related write downs of AIR for AFS securities during the reporting period. Additionally, for AFS debt securities with unrealized losses as of the balance sheet date, FHN does not intend to sell them and it is more-likely-than-not that FHN will not be required to sell them prior to recovery. Therefore, no write downs of these investments to fair value occurred during the reporting period.
For periods prior to 2020, FHN reviewed debt investment securities that were in unrealized loss positions in accordance with its accounting policy for OTTI and did not consider them other-than-temporarily impaired. For debt securities with unrealized losses, FHN did not intend to sell them and it is more-likely-than-not that FHN would not be
required to sell them prior to recovery. The decline in value was primarily attributable to changes in interest rates and not credit losses.
The carrying amount of equity investments without a readily determinable fair value was $
57
million and $
26
million at December 31, 2020 and 2019,
respectively. The year-to-date 2020 and 2019 gross amounts of upward and downward valuation adjustments were not significant.
Unrealized gains of $
7
million and unrealized losses of $
7
million were recognized during 2020 and 2019, respectively, for equity investments with readily determinable fair values.
|
FIRST HORIZON CORPORATION
|
148
|
2020 FORM 10-K ANNUAL REPORT | ||||||
Note 4 –
Loans and Leases
Tables and data as of December 31, 2020 include the loan and lease balances acquired in the IBKC merger and Truist Bank branch acquisition, which were recorded at fair value on their respective transaction closing dates. See Note 2 - Acquisitions and Divestitures for further information.
As discussed in Note 1 - Significant Accounting Policies, the ALLL estimation process was revised on January 1, 2020 to reflect the adoption of ASU 2016-13. All information contained in the following disclosures reflects the application of requirements from the adoption of ASU 2016-13 for periods after 2019. Information for periods prior to 2020 has been retained with the content consistent with prior disclosures.
The loan and lease portfolio is disaggregated into portfolio segments and then further disaggregated into classes for certain disclosures. GAAP defines a portfolio segment as the level at which an entity develops and documents a systematic method for determining its allowance for credit losses. A class is generally a disaggregation of a portfolio segment and is generally determined based on risk characteristics of the loan and FHN’s method for monitoring and assessing credit risk and performance. FHN's loan and lease portfolio segments are commercial and consumer. The classes of loans and leases are: (1) commercial, financial, and industrial, which includes commercial and industrial loans and leases and loans to mortgage companies, (2) commercial real estate, (3) consumer real estate, which includes both real estate installment and home equity lines of credit, and (4) credit card and other.
| December 31, | ||||||||||||||
| (Dollars in millions) | 2020 | 2019 | ||||||||||||
| Commercial: | ||||||||||||||
| Commercial and industrial (a) (b) | $ |
|
$ |
|
||||||||||
| Loans to mortgage companies |
|
|
||||||||||||
| Total commercial, financial, and industrial |
|
|
||||||||||||
| Commercial real estate |
|
|
||||||||||||
| Consumer: | ||||||||||||||
| HELOC |
|
|
||||||||||||
| Real estate installment loans |
|
|
||||||||||||
| Total consumer real estate |
|
|
||||||||||||
| Credit card and other |
|
|
||||||||||||
| Loans and leases | $ |
|
$ |
|
||||||||||
| Allowance for loan and lease losses |
(
|
(
|
||||||||||||
| Total net loans and leases | $ |
|
$ |
|
||||||||||
|
FIRST HORIZON CORPORATION
|
149
|
2020 FORM 10-K ANNUAL REPORT | ||||||
(a)
December 31, 2020 balance includes equipment financing leases of $
587
million.
(b)
Includes PPP loans fully guaranteed by the SBA of
$
4.1
billion as of December 31, 2020.
Restrictions
Loans and leases with carrying values of $
38.6
billion and $
19.2
billion were pledged as collateral for borrowings at December 31, 2020 and 2019, respectively.
At December 31, 2020 and 2019, FHN had pledged $
7.8
billion and $
5.2
billion of commercial loans to secure potential discount window borrowings from the Federal Reserve Bank, which included all of its first and second lien mortgages, HELOCs, and commercial real estate loans to secure potential borrowings from the FHLB-Cincinnati.
Concentrations of Credit Risk
Most of the FHN’s business activity is with clients located in the southern United States. FHN’s lending activity is concentrated in its market areas within those states. As of December 31, 2020, FHN had loans to mortgage companies totaling $
5.4
billion and loans to finance and insurance companies total $
3.1
billion. As a result,
26
% of the C&I segment is sensitive to impacts on the financial services industry.
Credit Quality Indicators
FHN employs a dual grade commercial risk grading methodology to assign an estimate for the probability of default and the loss given default for each commercial loan using factors specific to various industry, portfolio, or product segments that result in a rank ordering of risk and the assignment of grades
PD
1
to PD
16
. This credit grading system is intended to identify and measure the credit quality of the loan and lease portfolio by analyzing the migration between grading categories. It is also integral to the estimation methodology utilized in determining the ALLL since an allowance is established for pools of commercial loans based on the credit grade assigned. Each PD grade corresponds to an estimated one-year default probability percentage. PD grades are continually evaluated, but require a formal scorecard annually. As a response to the COVID-19 pandemic, FHN identified a segment of its commercial portfolio that requires a quarterly re-grading process. As borrowers recover, they can be removed from the quarterly re-grading process with credit officer concurrence.
PD
1
through PD
12
are “pass” grades. PD grades
13
-
16
correspond to the regulatory-defined categories of special mention (
13
), substandard (
14
), doubtful (
15
), and loss (
16
). Special mention loans and leases have potential weaknesses that, if left uncorrected, may result in deterioration of FHN's credit position at some future date. Substandard commercial loans and leases have well-defined weaknesses and are characterized by the distinct possibility that FHN will sustain some loss if the deficiencies are not corrected. Doubtful commercial loans and leases have the same weaknesses as substandard loans and leases with the added characteristics that the probability of loss is high and collection of the full amount is improbable.
The following tables provide the amortized cost basis of the commercial loan and lease portfolio by year of origination and credit quality indicator as of December 31, 2020:
| C&I | ||||||||||||||||||||||||||||||||||||||||||||||||||||||||||||||
| (Dollars in millions) | 2020 | 2019 | 2018 | 2017 | 2016 | Prior to 2016 | LMC (a) |
Revolving
Loans |
Revolving
Loans Converted to Term Loans (b) |
Total | ||||||||||||||||||||||||||||||||||||||||||||||||||||
| Credit Quality Indicator: | ||||||||||||||||||||||||||||||||||||||||||||||||||||||||||||||
| Pass (PD grades 1 through 12) (c) | $ |
|
$ |
|
$ |
|
$ |
|
$ |
|
$ |
|
$ |
|
$ |
|
$ |
|
$ |
|
||||||||||||||||||||||||||||||||||||||||||
| Special Mention (PD grade 13) |
|
|
|
|
|
|
|
|
|
|
||||||||||||||||||||||||||||||||||||||||||||||||||||
| Substandard, Doubtful, or Loss (PD grades 14,15, and 16) |
|
|
|
|
|
|
|
|
|
|
||||||||||||||||||||||||||||||||||||||||||||||||||||
| Total C&I | $ |
|
$ |
|
$ |
|
$ |
|
$ |
|
$ |
|
$ |
|
$ |
|
$ |
|
$ |
|
||||||||||||||||||||||||||||||||||||||||||
(a)
LMC includes non-revolving commercial lines of credit to qualified mortgage companies primarily for the temporary warehousing of eligible mortgage loans prior to the borrower's sale of those mortgage loans to third party investors. The loans are of short duration with maturities less than one year.
(b) $
50
million of C&I loans were converted from revolving to term in 2020.
(c) 2020 balance includes PPP loans.
|
FIRST HORIZON CORPORATION
|
150
|
2020 FORM 10-K ANNUAL REPORT | ||||||
| CRE | ||||||||||||||||||||||||||||||||||||||||||||||||||||||||
| (Dollars in millions) | 2020 | 2019 | 2018 | 2017 | 2016 | Prior to 2016 |
Revolving
Loans |
Revolving
Loans Converted to Term Loans |
Total | |||||||||||||||||||||||||||||||||||||||||||||||
| Credit Quality Indicator: | ||||||||||||||||||||||||||||||||||||||||||||||||||||||||
| Pass (PD grades 1 through 12) | $ |
|
$ |
|
$ |
|
$ |
|
$ |
|
$ |
|
$ |
|
$ |
|
$ |
|
||||||||||||||||||||||||||||||||||||||
| Special Mention (PD grade 13) |
|
|
|
|
|
|
|
|
|
|||||||||||||||||||||||||||||||||||||||||||||||
| Substandard, Doubtful, or Loss (PD grades 14,15, and 16) |
|
|
|
|
|
|
|
|
|
|||||||||||||||||||||||||||||||||||||||||||||||
| Total CRE | $ |
|
$ |
|
$ |
|
$ |
|
$ |
|
$ |
|
$ |
|
$ |
|
$ |
|
||||||||||||||||||||||||||||||||||||||
The following tables provide the balances of commercial loan portfolio classes with associated allowance, disaggregated by PD grade as of December 31, 2019:
| (Dollars in millions) |
C&I (a) |
Loans to
Mortgage Companies |
CRE |
Total |
Percentage
of Total |
Allowance
for Loan Losses |
||||||||||||||||||||||||||||||||
| PD Grade: | ||||||||||||||||||||||||||||||||||||||
| Pass (PD grades 1 through 12) | $ |
|
$ |
|
$ |
|
$ |
|
|
% | $ |
|
||||||||||||||||||||||||||
| Special Mention (PD grade 13) |
|
|
|
|
|
|
||||||||||||||||||||||||||||||||
| Substandard, Doubtful, or Loss (PD grades 14, 15, and 16) |
|
|
|
|
|
|
||||||||||||||||||||||||||||||||
| Collectively evaluated for impairment |
|
|
|
|
|
|
||||||||||||||||||||||||||||||||
| Individually evaluated for impairment |
|
|
|
|
|
|
||||||||||||||||||||||||||||||||
| Purchased credit-impaired loans |
|
|
|
|
|
|
||||||||||||||||||||||||||||||||
| Total commercial loans | $ |
|
$ |
|
$ |
|
$ |
|
|
% | $ |
|
||||||||||||||||||||||||||
(a)
C&I includes TRUPS loans, which are presented net of a $
19
million valuation allowance.
The consumer portfolio is comprised primarily of smaller-balance loans which are very similar in nature in that most are standard products and are backed by residential real estate. Because of the similarities of consumer loan types, FHN is able to utilize the FICO
score, among other attributes, to assess the credit quality of consumer borrowers. FICO scores are refreshed on a quarterly basis in an attempt to reflect the recent risk profile of the borrowers. Accruing delinquency amounts are indicators of asset quality within the credit card and other consumer portfolio.
|
FIRST HORIZON CORPORATION
|
151
|
2020 FORM 10-K ANNUAL REPORT | ||||||
| Consumer real estate | ||||||||||||||||||||||||||||||||||||||||||||||||||||||||
| (Dollars in millions) | 2020 | 2019 | 2018 | 2017 | 2016 | Prior to 2016 | Revolving loans | Revolving Loans converted to term loans (a) | Total | |||||||||||||||||||||||||||||||||||||||||||||||
| FICO score 740 or greater | $ |
|
$ |
|
$ |
|
$ |
|
$ |
|
$ |
|
$ |
|
$ |
|
$ |
|
||||||||||||||||||||||||||||||||||||||
| FICO score 720-739 |
|
|
|
|
|
|
|
|
|
|||||||||||||||||||||||||||||||||||||||||||||||
| FICO score 700-719 |
|
|
|
|
|
|
|
|
|
|||||||||||||||||||||||||||||||||||||||||||||||
| FICO score 660-699 |
|
|
|
|
|
|
|
|
|
|||||||||||||||||||||||||||||||||||||||||||||||
| FICO score 620-659 |
|
|
|
|
|
|
|
|
|
|||||||||||||||||||||||||||||||||||||||||||||||
| FICO score less than 620 |
|
|
|
|
|
|
|
|
|
|||||||||||||||||||||||||||||||||||||||||||||||
| Total | $ |
|
$ |
|
$ |
|
$ |
|
$ |
|
$ |
|
$ |
|
$ |
|
$ |
|
||||||||||||||||||||||||||||||||||||||
(a) $
36
million of HELOC loans were converted from revolving to term in 2020.
The following table reflects the amortized cost basis by year of origination and refreshed FICO scores for credit card and other loans as of December 31, 2020.
| Credit card and other | ||||||||||||||||||||||||||||||||||||||||||||||||||||||||
| (Dollars in millions) | 2020 | 2019 | 2018 | 2017 | 2016 | Prior to 2016 | Revolving loans | Revolving Loans converted to term loans | Total | |||||||||||||||||||||||||||||||||||||||||||||||
| FICO score 740 or greater | $ |
|
$ |
|
$ |
|
$ |
|
$ |
|
$ |
|
$ |
|
$ |
|
$ |
|
||||||||||||||||||||||||||||||||||||||
| FICO score 720-739 |
|
|
|
|
|
|
|
|
|
|||||||||||||||||||||||||||||||||||||||||||||||
| FICO score 700-719 |
|
|
|
|
|
|
|
|
|
|||||||||||||||||||||||||||||||||||||||||||||||
| FICO score 660-699 |
|
|
|
|
|
|
|
|
|
|||||||||||||||||||||||||||||||||||||||||||||||
| FICO score 620-659 |
|
|
|
|
|
|
|
|
|
|||||||||||||||||||||||||||||||||||||||||||||||
| FICO score less than 620 |
|
|
|
|
|
|
|
|
|
|||||||||||||||||||||||||||||||||||||||||||||||
| Total | $ |
|
$ |
|
$ |
|
$ |
|
$ |
|
$ |
|
$ |
|
$ |
|
$ |
|
||||||||||||||||||||||||||||||||||||||
The following table reflects the percentage of balances outstanding by average refreshed FICO scores, for the HELOC and real estate installment classes of loans as of December 31, 2019 :
| HELOC |
RE Installment
Loans |
|||||||||||||||||||
| FICO score 740 or greater |
|
% |
|
% | ||||||||||||||||
| FICO score 720-739 |
|
|
||||||||||||||||||
| FICO score 700-719 |
|
|
||||||||||||||||||
| FICO score 660-699 |
|
|
||||||||||||||||||
| FICO score 620-659 |
|
|
||||||||||||||||||
| FICO score less than 620 (a) |
|
|
||||||||||||||||||
| Total |
|
% |
|
% | ||||||||||||||||
(a)
For this group, a majority of the loan balances had FICO scores at the time of the origination that exceeded 620 but have since deteriorated as the loans have seasoned.
Nonaccrual and Past Due Loans and Leases
Loans and leases are placed on nonaccrual if it becomes evident that full collection of principal and interest is at risk, impairment has been recognized as a partial charge-off of principal balance due to
insufficient collateral value and past due status, or on a case-by-case basis if FHN continues to receive payments but there are other borrower-specific
|
FIRST HORIZON CORPORATION
|
152
|
2020 FORM 10-K ANNUAL REPORT | ||||||
issues. Included in nonaccrual are loans for which FHN continues to receive payments including residential real estate loans where the borrower has been discharged of personal obligation through bankruptcy.
Past due loans are loans contractually past due as to interest or principal payments, but which have not yet been put on nonaccrual status. In accordance with revised Interagency Guidance issued in 2020, FHN is
not required to designate loans with deferrals granted in response to COVID-19 as past due because of such deferrals. If a borrower defers payment, this may result in no contractual payments being past due, and as such, loans would not be considered past due during the period of deferral, and as a result, are excluded from loans past due 30-89 days and loans 90+ days past due in the table below.
The following table reflects accruing and non-accruing loans and leases by class on December 31, 2020:
| Accruing | Non-Accruing | |||||||||||||||||||||||||||||||||||||||||||||||||||||||
| (Dollars in millions) | Current |
30-89
Days Past Due |
90+
Days Past Due |
Total
Accruing |
Current |
30-89
Days Past Due |
90+
Days Past Due |
Total
Non- Accruing |
Total
Loans |
|||||||||||||||||||||||||||||||||||||||||||||||
| Commercial, financial, and industrial: | ||||||||||||||||||||||||||||||||||||||||||||||||||||||||
| C&I (a) (b) | $ |
|
$ |
|
$ |
|
$ |
|
$ |
|
$ |
|
$ |
|
$ |
|
$ |
|
||||||||||||||||||||||||||||||||||||||
| Loans to mortgage companies |
|
|
|
|
|
|
|
|
|
|||||||||||||||||||||||||||||||||||||||||||||||
| Total commercial, financial, and industrial |
|
|
|
|
|
|
|
|
|
|||||||||||||||||||||||||||||||||||||||||||||||
| Commercial real estate: | ||||||||||||||||||||||||||||||||||||||||||||||||||||||||
| CRE |
|
|
|
|
|
|
|
|
|
|||||||||||||||||||||||||||||||||||||||||||||||
| Consumer real estate: | ||||||||||||||||||||||||||||||||||||||||||||||||||||||||
| HELOC |
|
|
|
|
|
|
|
|
|
|||||||||||||||||||||||||||||||||||||||||||||||
| RE installment loans |
|
|
|
|
|
|
|
|
|
|||||||||||||||||||||||||||||||||||||||||||||||
| Total consumer real estate |
|
|
|
|
|
|
|
|
|
|||||||||||||||||||||||||||||||||||||||||||||||
| Credit card and other: | ||||||||||||||||||||||||||||||||||||||||||||||||||||||||
| Credit card |
|
|
|
|
|
|
|
|
|
|||||||||||||||||||||||||||||||||||||||||||||||
| Other |
|
|
|
|
|
|
|
|
|
|||||||||||||||||||||||||||||||||||||||||||||||
| Total credit card and other |
|
|
|
|
|
|
|
|
|
|||||||||||||||||||||||||||||||||||||||||||||||
| Total loans and leases | $ |
|
$ |
|
$ |
|
$ |
|
$ |
|
$ |
|
$ |
|
$ |
|
$ |
|
||||||||||||||||||||||||||||||||||||||
(a) $
101
million of C&I loans are nonaccrual loans that have been specifically reviewed for impairment with no related allowance.
(b) C&I loans include TRUPs loans of $
210
million, which is net of an amortizing discount of $
18
million.
|
FIRST HORIZON CORPORATION
|
153
|
2020 FORM 10-K ANNUAL REPORT | ||||||
The following table reflects accruing and non-accruing loans by class on December 31, 2019:
| Accruing | Non-Accruing | |||||||||||||||||||||||||||||||||||||||||||||||||||||||
| (Dollars in millions) | Current |
30-89
Days Past Due |
90+
Days Past Due |
Total
Accruing |
Current |
30-89
Days Past Due |
90+
Days Past Due |
Total
Non- Accruing |
Total
Loans |
|||||||||||||||||||||||||||||||||||||||||||||||
| Commercial, financial, and industrial: | ||||||||||||||||||||||||||||||||||||||||||||||||||||||||
| C&I (a) | $ |
|
$ |
|
$ |
|
$ |
|
$ |
|
$ |
|
$ |
|
$ |
|
$ |
|
||||||||||||||||||||||||||||||||||||||
| Loans to mortgage companies |
|
|
|
|
|
|
|
|
|
|||||||||||||||||||||||||||||||||||||||||||||||
| Purchased credit-impaired loans |
|
|
|
|
|
|
|
|
|
|||||||||||||||||||||||||||||||||||||||||||||||
| Total commercial, financial, and industrial |
|
|
|
|
|
|
|
|
|
|||||||||||||||||||||||||||||||||||||||||||||||
| Commercial real estate: | ||||||||||||||||||||||||||||||||||||||||||||||||||||||||
| Total commercial real estate |
|
|
|
|
|
|
|
|
|
|||||||||||||||||||||||||||||||||||||||||||||||
| Purchased credit-impaired loans |
|
|
|
|
|
|
|
|
|
|||||||||||||||||||||||||||||||||||||||||||||||
| Total commercial real estate |
|
|
|
|
|
|
|
|
|
|||||||||||||||||||||||||||||||||||||||||||||||
| Consumer real estate: | ||||||||||||||||||||||||||||||||||||||||||||||||||||||||
| HELOC |
|
|
|
|
|
|
|
|
|
|||||||||||||||||||||||||||||||||||||||||||||||
| RE installment loans |
|
|
|
|
|
|
|
|
|
|||||||||||||||||||||||||||||||||||||||||||||||
| Purchased credit-impaired loans |
|
|
|
|
|
|
|
|
|
|||||||||||||||||||||||||||||||||||||||||||||||
| Total consumer real estate |
|
|
|
|
|
|
|
|
|
|||||||||||||||||||||||||||||||||||||||||||||||
| Credit card and other: | ||||||||||||||||||||||||||||||||||||||||||||||||||||||||
| Credit card |
|
|
|
|
|
|
|
|
|
|||||||||||||||||||||||||||||||||||||||||||||||
| Other |
|
|
|
|
|
|
|
|
|
|||||||||||||||||||||||||||||||||||||||||||||||
| Purchased credit-impaired loans |
|
|
|
|
|
|
|
|
|
|||||||||||||||||||||||||||||||||||||||||||||||
| Total credit card and other |
|
|
|
|
|
|
|
|
|
|||||||||||||||||||||||||||||||||||||||||||||||
| Total loans | $ |
|
$ |
|
$ |
|
$ |
|
$ |
|
$ |
|
$ |
|
$ |
|
$ |
|
||||||||||||||||||||||||||||||||||||||
Certain previously reported amounts have been reclassified to agree with current presentation.
(a) C&I loans include $
218
million in TRUPs loans, which are presented net of a valuation allowance of $
19
million.
Collateral-Dependent Loans
Collateral-dependent loans are defined as loans for which repayment is expected to be derived substantially through the operation or sale of the collateral and where the borrower is experiencing financial difficulty.
At a minimum, the estimated value of the collateral for each loan equals the current book value.
As of December 31, 2020, FHN had C&I loans with amortized cost of approxima
tely $
167
million that was based on the value of underlying collateral. The collateral for these loans generally consists of business assets including land, buildings, equipment and financial assets. During the year ended December 31, 2020, FHN recognized total charge-offs of approximately $
36
million on collateral
dependent loans related to reductions in
estimated collateral values, $
26
million of which were on collateral dependent loans at December 31, 2020.
Consumer HELOC and installment loans with amortized cost based on t
he value of underlying real estate collateral were approximately $
9
million and $
26
million, respectively, as of December 31, 2020. Charge-offs during the year ended
December 31, 2020
were not significant for either portfolio class.
Troubled Debt Restructurings
As part of FHN’s ongoing risk management practices, FHN attempts to work with borrowers when necessary to extend or modify loan terms to better align with their current ability to repay. Extensions and modifications to loans are made in accordance with internal policies and guidelines which conform to
|
FIRST HORIZON CORPORATION
|
154
|
2020 FORM 10-K ANNUAL REPORT | ||||||
regulatory guidance. Each occurrence is unique to the borrower and is evaluated separately.
A modification is classified as a TDR if the borrower is experiencing financial difficulty and it is determined that FHN has granted a concession to the borrower. FHN may determine that a borrower is experiencing financial difficulty if the borrower is currently in default on any of its debt, or if it is probable that a borrower may default in the foreseeable future. Many aspects of a borrower’s financial situation are assessed when determining whether they are experiencing financial difficulty. Concessions could include extension of the maturity date, reductions of the interest rate (which may make the rate lower than current market for a new loan with similar risk), reduction or forgiveness of accrued interest, or principal forgiveness. The assessments of whether a borrower is experiencing (or is likely to experience) financial difficulty, and whether a concession has been granted, are subjective in nature and management’s judgment is required when determining whether a modification is classified as a TDR. In accordance with regulatory guidance, loans were not accounted for as a TDR and have been excluded from the disclosures below. For loan modifications that were made during the year ended December 31, 2020 that met the TDR relief provisions outlined in either the CARES Act, as extended by the CAA, or revised Interagency Guidance, FHN has excluded these modifications from consideration as a TDR, and has excluded loans with these qualifying modifications from designation as a TDR in the information and discussion that follows. See Note 1 - Significant Accounting Policies and Note 4 – Loans and Leases for further discussion regarding TDRs and loan modifications.
For all classes within the commercial portfolio segment, TDRs are typically modified through forbearance agreements (generally
6
to
12
months). Forbearance agreements could include reduced interest rates, reduced payments, release of guarantor, or entering into short sale agreements. FHN’s proprietary modification programs for consumer loans are generally structured using parameters of U.S. government-sponsored programs such as the former Home Affordable Modification
Program. Within the HELOC and RE installment loans classes of the consumer portfolio segment, TDRs are typically modified by reducing the interest rate (in increments of
25
basis points to a minimum of
1
% for up to
5
years) and a possible maturity date extension to reach an affordable housing debt-to-income ratio. After
5
years, the interest rate generally returns to the original interest rate prior to modification; for certain modifications, the modified interest rate increases
2
% per year until the original interest rate prior to modification is achieved. Permanent mortgage TDRs are typically modified by reducing the interest rate (in increments of
25
basis points to a minimum of
2
% for up to
5
years) and a possible maturity date extension to reach an affordable housing debt-to-income ratio. After
5
years, the interest rate steps up
1
% every year until it reaches the Federal Home Loan Mortgage Corporation Weekly Survey Rate cap. Contractual maturities may be extended to
40
years on permanent mortgages and to
30
years for consumer real estate loans. Within the credit card class of the consumer portfolio segment, TDRs are typically modified through either a short-term credit card hardship program or a longer-term credit card workout program. In the credit card hardship program, borrowers may be granted rate and payment reductions for
6
months to
1
year. In the credit card workout program, clients are granted a rate reduction to
0
% and term extensions for up to
5
years to pay off the remaining balance.
Despite the absence of a loan modification, the discharge of personal liability through bankruptcy proceedings is considered a concession. As a result, FHN classifies all non-reaffirmed residential real estate loans discharged in Chapter 7 bankruptcy as nonaccruing TDRs.
On December 31, 2020 and 2019, FHN had $
307
million and $
206
million of portfolio loans classified as TDRs, respectively. For TDRs in the loan portfolio, FHN had an ALLL of $
12
million, or
4
% as of December 31, 2020, and $
20
million, or
10
% as of December 31, 2019. Additionally, $
42
million and $
51
million of loans held for sale as of December 31, 2020 and 2019, respectively, were classified as TDRs.
|
FIRST HORIZON CORPORATION
|
155
|
2020 FORM 10-K ANNUAL REPORT | ||||||
The following tables present the end of period balance for loans modified in a TDR during the years ended December 31, 2020 and 2019:
| 2020 | 2019 | |||||||||||||||||||||||||||||||||||||
| (Dollars in millions) | Number |
Pre-Modification
Outstanding Recorded Investment |
Post-Modification
Outstanding Recorded Investment |
Number |
Pre-Modification
Outstanding Recorded Investment |
Post-Modification
Outstanding Recorded Investment |
||||||||||||||||||||||||||||||||
| Commercial, financial, and industrial: | ||||||||||||||||||||||||||||||||||||||
| C&I |
|
$ |
|
$ |
|
|
$ |
|
$ |
|
||||||||||||||||||||||||||||
| Commercial real estate: | ||||||||||||||||||||||||||||||||||||||
| CRE |
|
|
|
|
|
|
||||||||||||||||||||||||||||||||
| Consumer real estate: | ||||||||||||||||||||||||||||||||||||||
| HELOC |
|
|
|
|
|
|
||||||||||||||||||||||||||||||||
| RE installment loans |
|
|
|
|
|
|
||||||||||||||||||||||||||||||||
| Total consumer real estate |
|
|
|
|
|
|
||||||||||||||||||||||||||||||||
| Credit card and other |
|
|
|
|
|
|
||||||||||||||||||||||||||||||||
| Total TDRs |
|
$ |
|
$ |
|
|
$ |
|
$ |
|
||||||||||||||||||||||||||||
The following tables present TDRs which re-defaulted during 2020 and 2019, and as to which the modification occurred 12 months or less prior to the re-default. For purposes of this disclosure, FHN generally defines payment default as 30 or more days past due.
| 2020 | 2019 | |||||||||||||||||||||||||
| (Dollars in millions) | Number |
Recorded
Investment |
Number |
Recorded
Investment |
||||||||||||||||||||||
| Commercial, financial, and industrial: | ||||||||||||||||||||||||||
| C&I |
|
$ |
|
|
$ |
|
||||||||||||||||||||
| Consumer real estate: | ||||||||||||||||||||||||||
| HELOC |
|
|
|
|
||||||||||||||||||||||
| RE installment loans |
|
|
|
|
||||||||||||||||||||||
| Total consumer real estate |
|
|
|
|
||||||||||||||||||||||
| Credit card and other |
|
|
|
|
||||||||||||||||||||||
| Total TDRs |
|
$ |
|
|
$ |
|
||||||||||||||||||||
Loans Acquired with Deteriorated Credit Quality
Upon FHN's adoption of CECL, PCD loans are recorded at an initial amortized cost, which is the sum of the purchase price and the estimated credit losses recorded in the ALLL. Subsequent to this initial recognition, PCD loans are accounted for under the same methodology as non-PCD loans.
As discussed in Note 2, on July 1, 2020, FHN and IBKC closed their merger of equals transaction. On July 17, 2020, First Horizon Bank completed its purchase of
30
branches from Truist Bank. In
connection with these transactions, FHN acquired approximately $
25.9
billion in loans from IBKC and purchased approximately $
423
million of branch loans from Truist Bank.
|
FIRST HORIZON CORPORATION
|
156
|
2020 FORM 10-K ANNUAL REPORT | ||||||
For PCD loans acquired or purchased during 2020, a reconciliation of the unpaid principal balance, contractual cash flow owed to FHN at acquisition date, and purchase price is presented in the following table.
| (Dollars in millions) | C&I | CRE | Consumer Real Estate | Credit Card and Other | Total | |||||||||||||||||||||||||||
| Par value (UPB) | $ |
|
$ |
|
$ |
|
$ |
|
$ |
|
||||||||||||||||||||||
| Allowance for loan and lease losses |
(
|
(
|
(
|
(
|
(
|
|||||||||||||||||||||||||||
| (Discount) premium |
(
|
|
(
|
|
(
|
|||||||||||||||||||||||||||
| Purchase price | $ |
|
$ |
|
$ |
|
$ |
|
$ |
|
||||||||||||||||||||||
Purchased Credit-Impaired Loans
Before the adoption of CECL on January 1, 2020, FHN applied the guidance in ASC 310-30 to loans that were identified as PCI loans at the acquisition date.
The following table presents a rollforward of the accretable yield for the year ended December 31, 2019 and 2018:
| Year Ended December 31, | ||||||||||||||
| (Dollars in millions) | 2019 | 2018 | ||||||||||||
| Balance, beginning of period | $ |
|
$ |
|
||||||||||
| Accretion |
(
|
(
|
||||||||||||
| Adjustment for payoffs |
(
|
(
|
||||||||||||
| Adjustment for charge-offs |
(
|
(
|
||||||||||||
| Increase in accretable yield (a) |
|
|
||||||||||||
| Other |
|
(
|
||||||||||||
| Balance, end of period | $ |
|
$ |
|
||||||||||
(a)
Includes changes in the accretable yield due to both transfers from the nonaccretable difference and the impact of changes in the expected timing of the cash flows.
At December 31, 2019, the ALLL related to PCI loans was $
2
million. Net charge-offs related to PCI loans
during 2019 were $
6
million, compared to $
7
million in 2018. The provision for loan losses related to PCI loans during both 2019 and 2018 was $
1
million.
The following table reflects the outstanding principal balance and carrying amounts of the acquired PCI loans as of December 31, 2019:
| December 31, 2019 | ||||||||||||||
| (Dollars in millions) | Carrying value | Unpaid balance | ||||||||||||
| Commercial, financial and industrial | $ |
|
$ |
|
||||||||||
| Commercial real estate |
|
|
||||||||||||
| Consumer real estate |
|
|
||||||||||||
| Credit card and other |
|
|
||||||||||||
| Total | $ |
|
$ |
|
||||||||||
Impaired Loans
|
FIRST HORIZON CORPORATION
|
157
|
2020 FORM 10-K ANNUAL REPORT | ||||||
| December 31, 2019 | ||||||||||||||||||||||||||||||||
| (Dollars in millions) |
Recorded
Investment |
Unpaid
Principal Balance |
Related
Allowance |
Average Recorded
Investment |
Interest
Income Recognized |
|||||||||||||||||||||||||||
| Impaired loans with no related allowance recorded: | ||||||||||||||||||||||||||||||||
| Commercial: | ||||||||||||||||||||||||||||||||
| C&I | $ |
|
$ |
|
$ | — | $ |
|
$ |
|
||||||||||||||||||||||
| Loans to mortgage companies |
|
|
— |
|
|
|||||||||||||||||||||||||||
| CRE |
|
|
— |
|
|
|||||||||||||||||||||||||||
| Total | $ |
|
$ |
|
$ | — | $ |
|
$ |
|
||||||||||||||||||||||
| Consumer: | ||||||||||||||||||||||||||||||||
| HELOC (a) | $ |
|
$ |
|
$ | — | $ |
|
$ |
|
||||||||||||||||||||||
| RE installment loans (a) |
|
|
— |
|
|
|||||||||||||||||||||||||||
| Total | $ |
|
$ |
|
$ | — | $ |
|
$ |
|
||||||||||||||||||||||
| Impaired loans with related allowance recorded: | ||||||||||||||||||||||||||||||||
| Commercial: | ||||||||||||||||||||||||||||||||
| C&I | $ |
|
$ |
|
$ |
|
$ |
|
$ |
|
||||||||||||||||||||||
| Consumer: | ||||||||||||||||||||||||||||||||
| HELOC | $ |
|
$ |
|
$ |
|
$ |
|
$ |
|
||||||||||||||||||||||
| RE installment loans |
|
|
|
|
|
|||||||||||||||||||||||||||
| Credit card and other |
|
|
|
|
|
|||||||||||||||||||||||||||
| Total | $ |
|
$ |
|
$ |
|
$ |
|
$ |
|
||||||||||||||||||||||
| Total commercial | $ |
|
$ |
|
$ |
|
$ |
|
$ |
|
||||||||||||||||||||||
| Total consumer | $ |
|
$ |
|
$ |
|
$ |
|
$ |
|
||||||||||||||||||||||
| Total impaired loans | $ |
|
$ |
|
$ |
|
$ |
|
$ |
|
||||||||||||||||||||||
(a)
All discharged bankruptcy loans are charged down to an estimate of net realizable value and do not carry any allowance.
|
FIRST HORIZON CORPORATION
|
158
|
2020 FORM 10-K ANNUAL REPORT | ||||||
Note 5 –
Allowance for Credit Losses
Management's estimate of expected credit losses in the loan and lease portfolios is recorded in the ALLL and the reserve for unfunded lending commitments, collectively the ACL. Upon adoption of CECL effective January 1, 2020, FHN's ACL methodology changed to estimate expected credit losses over the contractual life of loans and leases. See Note 1 - Significant Accounting Policies for a further discussion of FHN's ACL methodology for periods prior to 2020.
As previously discussed, on July 1, 2020 FHN completed the IBKC merger. This resulted in an increase in the ACL during the third quarter of 2020 to reflect the estimate of expected credit losses on the acquired IBKC loan portfolio. Of the increase, $
284
million reflects the initial allowance on legacy IBKC loans acquired with purchased credit deterioration. See Note 2 – Acquisition and Divestitures for discussion of the alignment of the ACL policies.
The ACL is maintained at a level management believes to be appropriate to absorb expected lifetime credit losses over the contractual life of the loan and lease portfolio and unfunded lending commitments. The determination of the ACL is based on periodic evaluation of the loan and lease portfolios and unfunded lending commitments considering a number of relevant underling factors, including key assumptions and evaluation of quantitative and qualitative information.
The expected loan losses are the product of multiplying FHN’s estimates of probability of default (PD), loss given default (LGD), and individual loan level exposure as default (EAD) on an undiscounted basis. FHN uses models to develop the PD and LGD, which incorporates a single macroeconomic forecast over a four year reasonable and supportable forecast period. After the reasonable and supportable forecast period, the Company immediately reverts to its historical loss averages, evaluated over the historical observation period, for the remaining estimated life of the loans. FHN uses prepayment models which project prepayments over the life of the loans. In order to capture the unique risks of the loan portfolio within the PD, LGD, and prepayment models, FHN segments the portfolio into pools, incorporating loan grades for commercial loans. FHN uses qualitative adjustments to adjust historical loss
information in situations where current loan characteristics differ from those in the historical loss information and for differences in economic conditions, macroeconomic forecasts and other factors.
The evaluation of quantitative and qualitative information is performed through assessments of groups of assets that share similar risk characteristics and certain individual loans and leases that do not share similar risk characteristics with the collective group. As described in Note 4 - Loans and Leases, loans are grouped generally by product type and significant loan portfolios are assessed for credit losses using analytical models. The quantitative evaluation of the adequacy of the ACL utilizes a single economic forecast as its foundation, and is primarily based on analytical models that use known or estimated data as of the balance sheet date and forecasted data over the reasonable and supportable period. The ACL may also be affected by a variety of qualitative factors that FHN considers to reflect current judgment of various events and risks that are not measured in the statistical procedures.
In accordance with its accounting policy elections, FHN does not recognize a separate allowance for expected credit losses for AIR and records reversals of AIR as reductions of interest income. FHN reverses previously accrued but uncollected interest when an asset is placed on nonaccrual status. As of December 31, 2020, FHN recognized approximately $
1
million in allowance for expected credit losses on COVID-19 deferrals that do not qualify for the election which is not reflected in the table below. AIR and the related allowance for expected credit losses is included as a component of other assets. The total amount of interest reversals from loans placed on nonaccrual status and the amount of income recognized on nonaccrual loans during the year ended December 31, 2020 were not material.
Expected credit losses for unfunded commitments are estimated for periods where the commitment is not unconditionally cancellable. The measurement of expected credit losses for unfunded commitments mirrors that of loans and leases with the additional estimate of future draw rates (timing and amount).
|
FIRST HORIZON CORPORATION
|
159
|
2020 FORM 10-K ANNUAL REPORT | ||||||
Note 5 – Allowance for Credit Losses (Continued)
| (Dollars in millions) | Commercial, Financial, and Industrial (a) |
Commercial
Real Estate |
Consumer
Real Estate |
Credit Card
and Other |
Total | |||||||||||||||||||||||||||
| Allowance for loan and lease losses: | ||||||||||||||||||||||||||||||||
| Balance as of January 1, 2020 | $ |
|
$ |
|
$ |
|
$ |
|
$ |
|
||||||||||||||||||||||
| Adoption of ASU 2016-13 |
|
(
|
|
|
|
|||||||||||||||||||||||||||
| Balance as of January 1, 2020, as adjusted |
|
|
|
|
|
|||||||||||||||||||||||||||
| Charge-offs (b) |
(
|
(
|
(
|
(
|
(
|
|||||||||||||||||||||||||||
| Recoveries |
|
|
|
|
|
|||||||||||||||||||||||||||
| Initial allowance on loans purchased with credit deterioration (b) |
|
|
|
|
|
|||||||||||||||||||||||||||
| Provision for loan and lease losses (c) |
|
|
|
|
|
|||||||||||||||||||||||||||
| Balance as of December 31, 2020 |
|
|
|
|
|
|||||||||||||||||||||||||||
| Reserve for unfunded lending commitments: | ||||||||||||||||||||||||||||||||
| Balance as of January 1, 2020 |
|
|
|
|
|
|||||||||||||||||||||||||||
| Adoption of ASU 2016-13 |
|
|
|
|
|
|||||||||||||||||||||||||||
| Balance as of January 1, 2020, as adjusted |
|
|
|
|
|
|||||||||||||||||||||||||||
| Initial reserve on loans acquired |
|
|
|
|
|
|||||||||||||||||||||||||||
| Provision for unfunded lending commitments |
|
(
|
|
|
|
|||||||||||||||||||||||||||
| Balance as of December 31, 2020 | $ |
|
$ |
|
$ |
|
$ |
|
$ |
|
||||||||||||||||||||||
| Allowance for loan losses: | ||||||||||||||||||||||||||||||||
| Balance as of January 1, 2019 | $ |
|
$ |
|
$ |
|
$ |
|
$ |
|
||||||||||||||||||||||
| Charge-offs |
(
|
(
|
(
|
(
|
(
|
|||||||||||||||||||||||||||
| Recoveries |
|
|
|
|
|
|||||||||||||||||||||||||||
| Provision (provision credit) for loan losses |
|
|
(
|
|
|
|||||||||||||||||||||||||||
| Balance as of December 31, 2019 |
|
|
|
|
|
|||||||||||||||||||||||||||
| Reserve for unfunded lending commitments: | ||||||||||||||||||||||||||||||||
| Balance as of January 1, 2019 |
|
|
|
|
|
|||||||||||||||||||||||||||
| Provision (provision credit) for unfunded lending commitments |
|
(
|
|
|
(
|
|||||||||||||||||||||||||||
| Balance as of December 31, 2019 | $ |
|
$ |
|
$ |
|
$ |
|
$ |
|
||||||||||||||||||||||
| Allowance for loan losses: | ||||||||||||||||||||||||||||||||
| Balance as of January 1, 2018 | $ |
|
$ |
|
$ |
|
$ |
|
$ |
|
||||||||||||||||||||||
| Charge-offs |
(
|
(
|
(
|
(
|
(
|
|||||||||||||||||||||||||||
| Recoveries |
|
|
|
|
|
|||||||||||||||||||||||||||
| Provision (provision credit) for loan losses |
|
|
(
|
|
|
|||||||||||||||||||||||||||
| Balance as of December 31, 2018 |
|
|
|
|
|
|||||||||||||||||||||||||||
| Reserve for unfunded lending commitments: | ||||||||||||||||||||||||||||||||
| Balance as of January 1, 2018 |
|
|
|
|
|
|||||||||||||||||||||||||||
| Provision (provision credit) for unfunded lending commitments |
|
|
|
|
|
|||||||||||||||||||||||||||
| Balance as of December 31, 2018 | $ |
|
$ |
|
$ |
|
$ |
|
$ |
|
||||||||||||||||||||||
(a) C&I loans as of December 31, 2020 include $
4.1
billion in PPP loans which due to the government guarantee and forgiveness provisions are considered to have no credit risk and therefore have no ALLL.
(b) The year ended December 31, 2020 excludes day 1 charge-offs and the related initial allowance on PCD loans is net of these amounts. Under the new CECL standard, the initial ALLL recognized on PCD assets included an additional $
237
million for charged-off loans that had been written off prior to acquisition (whether full or partial) or which met FHN's charge-off policy at the time of acquisition. After charging these amounts off immediately upon acquisition, the net impact was $
287
million of additional ALLL for PCD loans.
|
FIRST HORIZON CORPORATION
|
160
|
2020 FORM 10-K ANNUAL REPORT | ||||||
Note 5 – Allowance for Credit Losses (Continued)
The difference in the ACL as of December 31, 2020 as compared to December 31, 2019 continues to be driven by the Company's adoption of CECL on January 1, 2020, as well as the COVID-19 pandemic and the resulting economic impacts, including to economic forecasts. Additionally, the ACL increased during the third quarter of 2020 to reflect the estimate of expected credit losses on the acquired IBKC loan portfolio.
In developing credit loss estimates for its loan and lease portfolios, FHN selected Moody’s baseline forecast as the primary source for its macroeconomic inputs, which included assumptions that were generally in line with Blue Chip Economic Indicators, including:
•
An unemployment rate of 7.4% and 6.2% for 2021 and 2022, respectively
•
GDP growth rates of 4.1% and 4.7% for 2021 and 2022, respectively
•
No further serious business disruption related to COVID-19, and
•
An unchanged target Fed funds range until late 2023.
As there can be no certainty that actual economic performance will precisely follow any specific macroeconomic forecast, FHN also evaluated other macroeconomic forecasts provided by Moody’s and adjusted the modeled outputs through a qualitative adjustment to account for uncertainties inherent in the macroeconomic forecast process. Additionally, where macroeconomic forecast variables used in the models did not take into effect the impact of federal stimulus and bank-supported payment deferral and forbearance programs on the timing of grade migration and recognition of loss content, management adjusted model outputs qualitatively to account for this assistance.
During the year ended December 31, 2020, FHN also utilized targeted reviews of higher stressed loan portfolios or industries that are most exposed to the effects of the COVID-19 pandemic, including Franchise Finance, Energy, Non-Profit, Arts and Entertainment, Restaurants outside of Franchise Finance, Nursing/Assisted Living and Hospitality within the C&I segment and CRE-Hospitality and CRE-Retail within the Commercial Real Estate segment. This analysis reviewed the level of impact from COVID-19 and the likelihood of additional financial assistance needed beyond 180 days. This analysis was utilized in developing qualitative adjustments to increase the recorded ALLL attributable to these components beyond the modeled results. FHN reviewed consumer deferrals and forbearance payment rates to analyze the likelihood clients will have difficulty making payments after the
|
FIRST HORIZON CORPORATION
|
161
|
2020 FORM 10-K ANNUAL REPORT | ||||||
Note 6 –
Premises, Equipment, and Leases
Premises and equipment were comprised of the following at December 31, 2020 and 2019:
| (Dollars in millions) | December 31, 2020 | December 31, 2019 | ||||||||||||
| Land | $ |
|
$ |
|
||||||||||
| Buildings |
|
|
||||||||||||
| Leasehold improvements |
|
|
||||||||||||
| Furniture, fixtures, and equipment |
|
|
||||||||||||
| Fixed assets held for sale (a) |
|
|
||||||||||||
| Total premises and equipment |
|
|
||||||||||||
| Less accumulated depreciation and amortization |
(
|
(
|
||||||||||||
| Premises and equipment, net | $ |
|
$ |
|
||||||||||
In 2020 and 2019, FHN recognized $
12
million and $
27
million, respectively, of fixed asset impairments and lease abandonment charges related to branch closures which are included in Other expense on the Consolidated Statements of Income. In 2020 and 2019, FHN had an insignifcant amount and $
2
million of net gains, respectively, related to the sales of bank branches which are included in Other income on the Consolidated Statements of Income.
First Horizon as Lessee
FHN has operating, financing, and short-term leases for branch locations, corporate offices and certain equipment. Substantially all of these leases are classified as operating leases.
The following table provides a detail of the classification of FHN's right-of-use assets and lease liabilities included in the Consolidated Balance Sheets.
| (Dollars in millions) | December 31, 2020 | December 31, 2019 | ||||||||||||
| Lease Right-of-Use Assets: | Classification | |||||||||||||
| Operating lease right-of use assets | $ |
|
$ |
|
||||||||||
| Finance lease right-of use assets |
|
|
||||||||||||
| Total Lease Right-of Use Assets | $ |
|
$ |
|
||||||||||
| Lease Liabilities: | ||||||||||||||
| Operating lease liabilities | $ |
|
$ |
|
||||||||||
| Finance lease liabilities |
|
|
||||||||||||
| Total Lease Liabilities | $ |
|
$ |
|
||||||||||
|
FIRST HORIZON CORPORATION
|
162
|
2020 FORM 10-K ANNUAL REPORT | ||||||
The calculated amount of the ROU assets and lease liabilities in the table above are impacted by the length of the lease term and the discount rate used to present value the minimum lease payments.
The
| December 31, 2020 | December 31, 2019 | ||||||||||
| Weighted Average Remaining Lease Terms | |||||||||||
| Operating leases |
|
|
|||||||||
| Finance leases |
|
|
|||||||||
| Weighted Average Discount Rate | |||||||||||
| Operating leases |
|
% |
|
% | |||||||
| Finance leases |
|
% |
|
% | |||||||
The following table provides a detail of the components of lease expense and other lease information for the years ended December 31, 2020 and 2019:
| (Dollars in millions) | 2020 | 2019 | |||||||||
| Lease cost | |||||||||||
| Operating lease cost | $ |
|
$ |
|
|||||||
| Sublease income |
(
|
|
|||||||||
| Total lease cost | $ |
|
$ |
|
|||||||
| Other information | |||||||||||
| (Gain) loss on right-of-use asset impairment - operating leases | $ |
|
$ |
|
|||||||
| Cash paid for amounts included in the measurement of lease liabilities: | |||||||||||
| Operating cash flows from operating leases |
|
|
|||||||||
| Right-of-use assets obtained in exchange for new lease obligations: | |||||||||||
| Operating leases |
|
|
|||||||||
| Finance leases |
|
|
|||||||||
The following table provides a detail of the maturities of FHN's operating and finance lease liabilities as of December 31, 2020:
| (Dollars in millions) | December 31, 2020 | |||||||
| 2021 | $ |
|
||||||
| 2022 |
|
|||||||
| 2023 |
|
|||||||
| 2024 |
|
|||||||
| 2025 |
|
|||||||
| 2026 and thereafter |
|
|||||||
| Total lease payments |
|
|||||||
| Less lease liability interest |
(
|
|||||||
| Total | $ |
|
||||||
FHN had no aggregate undiscounted contractual obligations for lease arrangements that have not commenced as of December 31, 2020.
|
FIRST HORIZON CORPORATION
|
163
|
2020 FORM 10-K ANNUAL REPORT | ||||||
First Horizon as Lessor
As a lessor, FHN engages in the leasing of equipment to commercial clients primarily through direct financing and sales-type leases. Direct financing and sales-type leases are similar to other forms of installment lending in that lessors generally do not retain benefits and risks incidental to ownership of the property subject to leases. Such arrangements are essentially financing transactions that permit lessees to acquire and use property. As lessor, the sum of all minimum lease payments over the lease term and the estimated residual value, less unearned interest income, is recorded as the net investment in the lease on the commencement date and is included in loans and leases in the Consolidated Balance Sheets. Interest income is accrued as earned over the term of the lease based on the net investment in leases. Fees incurred to originate the lease are deferred on the commencement date and recognized as an adjustment of the yield on the lease.
FHN’s portfolio of direct financing and sales-type leases contains terms of
2
to
23
years. Some of these leases contain options to extend the leases for up to
12
months and/or to terminate the lease within one year. These direct financing and sales-type leases typically include a payment structure set at lease inception and do not provide any additional services. Expenses associated with the leased equipment, such as maintenance and insurance, are paid by the lessee directly to third parties. The lease agreement typically contains an option for the purchase of the leased property by the lessee at the end of the lease term at either the property’s residual value or a specified price. In all cases, FHN expects to sell or re-lease the equipment at the end of the lease term. Due to the nature and structure of FHN’s direct financing and sales-type leases, there is no selling profit or loss on these transactions.
The components of the Company’s net investment in leases as of December 31, 2020 were as follows:
| (Dollars in millions) | |||||
| Lease receivable | $ |
|
|||
| Unearned income |
(
|
||||
| Guaranteed residual |
|
||||
| Unguaranteed residual |
|
||||
| Total net investment | $ |
|
|||
For the year ended December 31, 2020, interest income for direct financing or sales-type leases totaled $
10
million. During the year ended December 31, 2020, there was no profit or loss recognized at the commencement date for direct financing or sales-type leases.
Maturities of the Company's lease receivables as of December 31, 2020 were as follows:
| (Dollars in millions) | December 31, 2020 | |||||||
| 2021 | $ |
|
||||||
| 2022 |
|
|||||||
| 2023 |
|
|||||||
| 2024 |
|
|||||||
| 2025 |
|
|||||||
| 2026 and thereafter |
|
|||||||
| Total future minimum lease payments | $ |
|
||||||
|
FIRST HORIZON CORPORATION
|
164
|
2020 FORM 10-K ANNUAL REPORT | ||||||
Note 7 –
Goodwill and Other Intangible Assets
Goodwill
On July 1, 2020, FHN completed its merger of equals transaction with IBERIABANK Corporation. In connection with the merger, FHN recorded a $
533
million purchase accounting gain, based on preliminary fair value estimates.
On July 17, 2020, FHN completed its purchase of
30
branches from Truist Bank. In relation to the acquisition, FHN recorded $
78
million in goodwill, based on preliminary fair value estimates. See Note 2 - Acquisitions and Divestitures
for additional information regarding these transactions.
FHN performed the required annual goodwill impairment test as of October 1, 2020. The annual impairment test did not indicate impairment in any of
FHN’s reporting units as of the testing date. Following the testing date, management evaluated the events and circumstances that could indicate that goodwill might be impaired and concluded that a subsequent interim test was not necessary.
As further discussed in Note 20 - Business Segment Information, FHN reorganized its management reporting structure during the fourth quarter of 2020 and, accordingly, its segment reporting structure and goodwill reporting units. In connection with the reorganization, management reallocated goodwill to the new reporting units using a relative fair value approach.
Accounting estimates and assumptions were made about FHN’s future performance and cash flows, as well as other prevailing market factors (e.g., interest rates, economic trends, etc.) when determining fair value as part of the goodwill impairment test. While management used the best information available to estimate future performance for each reporting unit, future adjustments to management’s projections may be necessary if conditions differ substantially from the assumptions used in making the estimates.
The following table presents goodwill allocated to each reportable segment at December 31, 2020:
| (Dollars in millions) |
Regional
Banking |
Specialty
Banking |
Total | |||||||||||||||||
| December 31, 2017 | $ |
|
$ |
|
$ |
|
||||||||||||||
| Additions |
|
|
|
|||||||||||||||||
| December 31, 2018 | $ |
|
$ |
|
$ |
|
||||||||||||||
| Additions |
|
|
|
|||||||||||||||||
| December 31, 2019 | $ |
|
$ |
|
$ |
|
||||||||||||||
| Additions |
|
|
|
|||||||||||||||||
| December 31, 2020 | $ |
|
$ |
|
$ |
|
||||||||||||||
Other intangible assets
In connection with the IBKC merger and the Truist branch acquisition, FHN recorded $
207
million and $
7
million of core deposit intangible assets, respectively. Core deposit intangible assets are subject to amortization over a
year period. In connection with the IBKC merger, FHN recorded
$
14
million of client relationship intangible assets, $
10
million of purchased credit card intangible assets, and $
10
million of title plant related to title company operations. The following table, which excludes fully amortized intangibles, presents other intangible assets included in the Consolidated Balance Sheets:
|
FIRST HORIZON CORPORATION
|
165
|
2020 FORM 10-K ANNUAL REPORT | ||||||
| December 31, 2020 | December 31, 2019 | |||||||||||||||||||||||||||||||||||||
| (Dollars in millions) |
Gross Carrying
Amount |
Accumulated
Amortization |
Net Carrying
Value |
Gross Carrying
Amount |
Accumulated
Amortization |
Net Carrying
Value |
||||||||||||||||||||||||||||||||
| Core deposit intangibles | $ |
|
$ |
(
|
$ |
|
$ |
|
$ |
(
|
$ |
|
||||||||||||||||||||||||||
| Client relationships |
|
(
|
|
|
(
|
|
||||||||||||||||||||||||||||||||
| Other (a) |
|
(
|
|
|
(
|
|
||||||||||||||||||||||||||||||||
| Total | $ |
|
$ |
(
|
$ |
|
$ |
|
$ |
(
|
$ |
|
||||||||||||||||||||||||||
Amortization expense was $
40
million, $
25
million, and $
26
million for the years ended December 31,
2020, 2019 and 2018, respectively.
As of December 31, 2020 the estimated aggregated amortization expense is expected to be:
| (Dollars in millions) | ||||||||
| Year | Amortization | |||||||
| 2021 | $ |
|
||||||
| 2022 |
|
|||||||
| 2023 |
|
|||||||
| 2024 |
|
|||||||
| 2025 |
|
|||||||
|
FIRST HORIZON CORPORATION
|
166
|
2020 FORM 10-K ANNUAL REPORT | ||||||
Note 8 –
Mortgage Banking Activity
On July 1, 2020 as part of the IBKC merger, FHN obtained IBKC mortgage banking operations which included origination and servicing of residential first lien mortgages that conform to standards established by GSEs that are major investors in U.S. home mortgages, but can also consist of junior lien loans secured by residential property. These loans are primarily sold to private companies that are unaffiliated with the GSEs on a servicing-released basis. Gains and losses on these mortgage loans are included in mortgage banking and title income on the Consolidated Statements of Income. Prior to the
merger, FHN’s mortgage banking operations were not significant; however, at December 31, 2020 FHN had approximately $
55
million of loans that remained from pre-2009 Mortgage Business operations. Activity related to the pre-2009 mortgage loans was primarily limited to payments and write-offs in 2020, with no new originations or loan sales and only an insignificant amount of repurchases and is excluded from the disclosure below.
The following table summarizes activity relating to residential mortgage loans held for sale for the year ended December 31, 2020:
| (Dollars in millions) | Year ended December 31, 2020 | |||||||
| Balance at beginning of period | $ |
|
||||||
| Acquired |
|
|||||||
| Originations and purchases |
|
|||||||
| Sales, net of gains |
(
|
|||||||
| Mortgage loans transferred to held for investment |
(
|
|||||||
| Balance at end of period | $ |
|
||||||
Mortgage Servicing Rights
Effective with the IBKC merger, FHN made an election to record mortgage servicing rights at the lower of cost or market value and amortize over the remaining servicing life of the loans, with consideration given to prepayment assumptions.
Mortgage servicing rights are included in Other assets on the Consolidated Balance Sheets.
Mortgage servicing rights had the following carrying values as of the period indicated.
| December 31, 2020 | ||||||||||||||||||||
| (Dollars in millions) |
Gross Carrying
Amount |
Accumulated
Amortization |
Net Carrying Amount | |||||||||||||||||
| Mortgage servicing rights | $ |
|
$ |
(
|
$ |
|
||||||||||||||
|
FIRST HORIZON CORPORATION
|
167
|
2020 FORM 10-K ANNUAL REPORT | ||||||
Note 9 –
Deposits
The composition of deposits is presented in the following table:
| (Dollars in millions) | 2020 | 2019 | ||||||||||||
| Savings | $ |
|
$ |
|
||||||||||
| Time deposits |
|
|
||||||||||||
| Other interest-bearing deposits |
|
|
||||||||||||
| Interest-bearing deposits |
|
|
||||||||||||
| Noninterest-bearing |
|
|
||||||||||||
| Total deposits | $ |
|
$ |
|
||||||||||
Time deposits tha
t exceed t
he FDIC insurance limit of $250,000 at December 31, 2020 and 2019 were $
1.4
billion and $
0.9
billion, respectively.
Scheduled maturities of time deposits as of December 31, 2020 were as follows:
| (Dollars in millions) | ||||||||
| 2021 | $ |
|
||||||
| 2022 |
|
|||||||
| 2023 |
|
|||||||
| 2024 |
|
|||||||
| 2025 |
|
|||||||
| 2026 and after |
|
|||||||
| Total | $ |
|
||||||
|
FIRST HORIZON CORPORATION
|
168
|
2020 FORM 10-K ANNUAL REPORT | ||||||
Note 10 –
Short-Term Borrowings
A summary of short-term borrowings for the years 2020, 2019 and 2018 is presented in the following table:
| (Dollars in millions) | Trading Liabilities | Federal Funds Purchased | Securities Sold Under Agreements to Repurchase | Other Short-term Borrowings | ||||||||||||||||||||||
| 2020 | ||||||||||||||||||||||||||
| Average balance | $ |
|
$ |
|
$ |
|
$ |
|
||||||||||||||||||
| Year-end balance |
|
|
|
|
||||||||||||||||||||||
| Maximum month-end outstanding |
|
|
|
|
||||||||||||||||||||||
| Average rate for the year |
|
% |
|
% |
|
% |
|
% | ||||||||||||||||||
| Average rate at year-end |
|
|
|
|
||||||||||||||||||||||
| 2019 | ||||||||||||||||||||||||||
| Average balance | $ |
|
$ |
|
$ |
|
$ |
|
||||||||||||||||||
| Year-end balance |
|
|
|
|
||||||||||||||||||||||
| Maximum month-end outstanding |
|
|
|
|
||||||||||||||||||||||
| Average rate for the year |
|
% |
|
% |
|
% |
|
% | ||||||||||||||||||
| Average rate at year-end |
|
|
|
|
||||||||||||||||||||||
| 2018 | ||||||||||||||||||||||||||
| Average balance | $ |
|
$ |
|
$ |
|
$ |
|
||||||||||||||||||
| Year-end balance |
|
|
|
|
||||||||||||||||||||||
| Maximum month-end outstanding |
|
|
|
|
||||||||||||||||||||||
| Average rate for the year |
|
% |
|
% |
|
% |
|
% | ||||||||||||||||||
| Average rate at year-end |
|
|
|
|
||||||||||||||||||||||
Federal funds purchased and securities sold under agreements to repurchase generally have maturities of less than
90
days. Trading liabilities, which represent short positions in securities, are generally held for less than 90 days. Other short-term borrowings have original maturities of one year or less. On December 31, 2020, fixed income trading securities with a fair value of $
2
million were pledged to secure other short-term borrowings.
|
FIRST HORIZON CORPORATION
|
169
|
2020 FORM 10-K ANNUAL REPORT | ||||||
Note 11 –
Term Borrowings
The following table presents information pertaining to term borrowings on December 31,:
|
(
Dollars in millions
)
|
2020 | 2019 | ||||||||||||
| First Horizon Bank: | ||||||||||||||
| Subordinated notes (a) | ||||||||||||||
|
Maturity date – May 1, 2030 -
|
$ |
|
$ |
|
||||||||||
| Other collateralized borrowings - Maturity date – December 22, 2037 | ||||||||||||||
|
|
|
|
||||||||||||
| Other collateralized borrowings - SBA loans (c) |
|
|
||||||||||||
| First Horizon Corporation: | ||||||||||||||
| Senior notes | ||||||||||||||
|
Maturity date – December 15, 2020 –
|
|
|
||||||||||||
|
Maturity date – May 26, 2023 -
|
|
|
||||||||||||
|
Maturity date – May 26, 2025 -
|
|
|
||||||||||||
| Junior subordinated debentures (e) | ||||||||||||||
|
Maturity date - July 31, 2031 -
|
|
|
||||||||||||
|
Maturity date - November 15, 2032 -
|
|
|
||||||||||||
|
Maturity date - March 26, 2033 -
|
|
|
||||||||||||
|
Maturity date - June 17, 2033 -
|
|
|
||||||||||||
|
Maturity date - March 17, 2034 -
|
|
|
||||||||||||
|
Maturity date - September 20, 2034 -
|
|
|
||||||||||||
|
Maturity date - June 28, 2035 -
|
|
|
||||||||||||
|
Maturity date - December 15, 2035 -
|
|
|
||||||||||||
|
Maturity date - March 15, 2036 -
|
|
|
||||||||||||
|
Maturity date - March 15, 2036 -
|
|
|
||||||||||||
|
Maturity date - June 30, 2036 -
|
|
|
||||||||||||
|
Maturity date - July 7, 2036 -
|
|
|
||||||||||||
|
Maturity date - October 7, 2036 -
|
|
|
||||||||||||
|
Maturity date - December 30, 2036 -
|
|
|
||||||||||||
|
Maturity date - June 15, 2037 -
|
|
|
||||||||||||
|
Maturity date - September 6, 2037 -
|
|
|
||||||||||||
|
Maturity date - September 15, 2037 -
|
|
|
||||||||||||
|
Maturity date - December 15, 2037 -
|
|
|
||||||||||||
|
Maturity date - December 15, 2037 -
|
|
|
||||||||||||
|
Maturity date - June 15, 2038 -
|
|
|
||||||||||||
|
Notes payable - New market tax credit investments,
|
|
|
||||||||||||
| FT Real Estate Securities Company, Inc.: | ||||||||||||||
| Cumulative preferred stock (f) | ||||||||||||||
|
Maturity date – March 31, 2031 –
|
|
|
||||||||||||
| Total | $ |
|
$ |
|
||||||||||
|
FIRST HORIZON CORPORATION
|
170
|
2020 FORM 10-K ANNUAL REPORT | ||||||
(a)
Qualifies for Tier 2 capital under the risk-based capital guidelines for First Horizon Bank as well as First Horizon Corporation, up to certain limits for minority interest capital instruments.
(b)
Secured by trust preferred loans.
(c)
Collateralized borrowings associated with SBA loan sales that did not meet sales criteria. The loans have remaining terms of
2
to
24
years. These borrowings had a weighted average interest rate of
3.90
% and
3.95
% on December 31, 2020 and 2019, respectively.
(d)
Early redeemed on November 15, 2020. Changes in the fair value of debt attributable to interest rate risk are hedged. Refer to Note 22 – Derivatives.
(e)
Acquired in conjunction with the acquisitions of CBF and merger with IBKC. A portion qualifies for Tier 2 capital under the risk-based capital guidelines.
(f)
In 2020, a portion qualifies for Tier 2 capital under the risk-based capital guidelines for both First Horizon Bank and First Horizon Corporation. In 2019, only a portion qualified as Tier 2 capital.
Annual principal repayment requirements as of December 31, 2020 are as follows:
|
(
Dollars in millions
)
|
||||||||
| 2021 | $ |
|
||||||
| 2022 |
|
|||||||
| 2023 |
|
|||||||
| 2024 |
|
|||||||
| 2025 and after |
|
|||||||
In conjunction with its transactions, FHN obtained junior subordinated debentures, each of which is held by a wholly-owned trust that has issued trust preferred securities to external investors and loaned the funds to FHN as junior subordinated debt. The book value for each issuance represents the purchase accounting fair value as of the closing date less accumulated amortization of the associated discount, as applicable. Through various contractual arrangements FHN assumed a full and unconditional
guarantee for each trust’s obligations with respect to the securities. While the maturity dates are typically
30
years from the original issuance date, FHN has the option to redeem each of the junior subordinated debentures at par on any future interest payment date, which would trigger redemption of the related trust preferred securities. A portion of FHN's junior subordinated notes qualify as Tier 2 capital under the risk-based capital guidelines.
|
FIRST HORIZON CORPORATION
|
171
|
2020 FORM 10-K ANNUAL REPORT | ||||||
Note 12 –
Preferred Stock
FHN Preferred Stock
The following table presents a summary of FHN's non-cumulative perpetual preferred stock:
| December 31, | |||||||||||||||||||||||||||||||||||||||||||||||
| 2020 | 2019 | ||||||||||||||||||||||||||||||||||||||||||||||
| (Dollars in millions) | Issuance Date | Earliest Redemption Date (a) | Annual Dividend Rate | Dividend Payments | Shares Outstanding | Liquidation Amount | Carrying Amount | Carrying Amount | |||||||||||||||||||||||||||||||||||||||
| Series A | 1/31/2013 | 4/10/2018 |
|
% | Quarterly |
|
$ |
|
$ |
|
$ |
|
|||||||||||||||||||||||||||||||||||
| Series B | 7/2/2020 | 8/1/2025 |
|
% | (b) | Semi-annually |
|
|
|
|
|||||||||||||||||||||||||||||||||||||
| Series C | 7/2/2020 | 5/1/2026 |
|
% | (c) | Quarterly |
|
|
|
|
|||||||||||||||||||||||||||||||||||||
| Series D | 7/2/2020 | 5/1/2024 |
|
% | (d) | Semi-annually |
|
|
|
|
|||||||||||||||||||||||||||||||||||||
| Series E | 5/28/2020 | 10/10/2025 |
|
% | Quarterly |
|
|
|
|
||||||||||||||||||||||||||||||||||||||
|
|
$ |
|
$ |
|
$ |
|
|||||||||||||||||||||||||||||||||||||||||
(a) Denotes earliest optional redemption date. Earlier redemption is possible, at FHN's election, if certain regulatory capital events occur.
(b) Fixed dividend rate will reset on August 1, 2025 to three-month LIBOR plus
4.262
%
(c) Fixed dividend rate will reset on May 1, 2026 to three-month LIBOR plus
4.920
%
(d) Fixed dividend rate will reset on May 1, 2024 to three-month LIBOR plus
3.859
%
Subsidiary Preferred Stock
First Horizon Bank has issued
300,000
shares of Class A Non-Cumulative Perpetual Preferred Stock (Class A Preferred Stock) with a liquidation preference of $
1,000
per share. Dividends on the Class A Preferred Stock, if declared, accrue and are payable each quarter, in arrears, at a floating rate equal to the greater of the three month LIBOR plus
0.85
% or
3.75
% per annum. These securities qualify fully as Tier 1 capital for First Horizon Bank, while for FHN they qualify partially as Tier 1 capital and partially as Tier 2 capital. On December 31, 2020 and 2019, $
295
million of Class A Preferred Stock was recognized as Noncontrolling interest on the Consolidated Balance Sheets.
FT Real Estate Securities Company, Inc. (FTRESC), an indirect subsidiary of FHN, has issued
50
shares of
9.50
% Cumulative Preferred Stock, Class B (Class B Preferred Shares), with a liquidation preference of $
1
million per share; of those shares,
47
were issued to nonaffiliates. FTRESC is a real estate investment trust established for the purpose of acquiring, holding, and managing real estate mortgage assets. Dividends on the Class B Preferred Shares are cumulative and are payable semi-annually. At December 31, 2020, the Class B Preferred Shares partially qualified as Tier 2 regulatory capital. For all periods presented, these securities are presented in the Consolidated Balance Sheets as Term borrowings.
|
FIRST HORIZON CORPORATION
|
172
|
2020 FORM 10-K ANNUAL REPORT | ||||||
Note 13 –
Regulatory Capital and Restrictions
Regulatory Capital.
FHN is subject to various regulatory capital requirements administered by the federal banking agencies. Failure to meet minimum capital requirements can initiate certain mandatory, and possibly additional discretionary actions by regulators that, if undertaken, could have a direct material effect on FHN’s financial statements. Under capital adequacy guidelines and the regulatory framework for prompt corrective action, FHN must meet specific capital guidelines that involve quantitative measures of assets, liabilities, and certain off-balance sheet items calculated pursuant to regulatory directives. Capital amounts and classification are also subject to qualitative judgment by the regulators such as capital components, asset risk weightings, and other factors.
Management believes that, as of December 31, 2020, FHN and First Horizon Bank met all capital adequacy requirements to which they were subject. As of
December 31, 2020, First Horizon Bank was classified as well-capitalized under the regulatory framework for prompt corrective action. To be categorized as well-capitalized, an institution must maintain minimum Total Risk-Based, Tier 1 Risk-Based, Common Equity Tier 1 and Tier 1 Leverage ratios as set forth in the following table. Management believes that no events or changes have occurred subsequent to year-end that would change this designation.
Quantitative measures established by regulation to ensure capital adequacy require FHN to maintain minimum ratios as set forth in the following table. FHN and First Horizon Bank are also subject to a 2.5% capital conservation buffer which is an amount above the minimum levels designed to ensure that banks remain well-capitalized, even in adverse economic scenarios.
|
FIRST HORIZON CORPORATION
|
173
|
2020 FORM 10-K ANNUAL REPORT | ||||||
The actual capital amounts and ratios of FHN and First Horizon Bank are presented in the table below.
| (Dollars in millions) | First Horizon Corporation | First Horizon Bank | ||||||||||||||||||||||||
| Amount | Ratio | Amount | Ratio | |||||||||||||||||||||||
| On December 31, 2020 | ||||||||||||||||||||||||||
| Actual: | ||||||||||||||||||||||||||
| Total Capital | $ |
|
|
% | $ |
|
|
% | ||||||||||||||||||
| Tier 1 Capital |
|
|
|
|
||||||||||||||||||||||
| Common Equity Tier 1 |
|
|
|
|
||||||||||||||||||||||
| Leverage |
|
|
|
|
||||||||||||||||||||||
| Minimum Requirement for Capital Adequacy Purposes: | ||||||||||||||||||||||||||
| Total Capital |
|
|
|
|
||||||||||||||||||||||
| Tier 1 Capital |
|
|
|
|
||||||||||||||||||||||
| Common Equity Tier 1 |
|
|
|
|
||||||||||||||||||||||
| Leverage |
|
|
|
|
||||||||||||||||||||||
| Minimum Requirement to be Well Capitalized Under Prompt Corrective Action Provisions: | ||||||||||||||||||||||||||
| Total Capital |
|
|
||||||||||||||||||||||||
| Tier 1 Capital |
|
|
||||||||||||||||||||||||
| Common Equity Tier 1 |
|
|
||||||||||||||||||||||||
| Leverage |
|
|
||||||||||||||||||||||||
| On December 31, 2019 | ||||||||||||||||||||||||||
| Actual: | ||||||||||||||||||||||||||
| Total Capital | $ |
|
|
% | $ |
|
|
% | ||||||||||||||||||
| Tier 1 Capital |
|
|
|
|
||||||||||||||||||||||
| Common Equity Tier 1 |
|
|
|
|
||||||||||||||||||||||
| Leverage |
|
|
|
|
||||||||||||||||||||||
| Minimum Requirement for Capital Adequacy Purposes: | ||||||||||||||||||||||||||
| Total Capital |
|
|
|
|
||||||||||||||||||||||
| Tier 1 Capital |
|
|
|
|
||||||||||||||||||||||
| Common Equity Tier 1 |
|
|
|
|
||||||||||||||||||||||
| Leverage |
|
|
|
|
||||||||||||||||||||||
| Minimum Requirement to be Well Capitalized Under Prompt Corrective Action Provisions: | ||||||||||||||||||||||||||
| Total Capital |
|
|
||||||||||||||||||||||||
| Tier 1 Capital |
|
|
||||||||||||||||||||||||
| Common Equity Tier 1 |
|
|
||||||||||||||||||||||||
| Leverage |
|
|
||||||||||||||||||||||||
|
FIRST HORIZON CORPORATION
|
174
|
2020 FORM 10-K ANNUAL REPORT | ||||||
Restrictions on cash and due from banks.
Under the Federal Reserve Act and Regulation D, First Horizon Bank is required to maintain a certain amount of cash reserves. However, as a result of the COVID-19 pandemic, the Fed announced it has reduced its reserve requirement to zero, and as a result, on December 31, 2020, First Horizon Bank was not required to maintain cash reserves after the consideration of $
397
million in average vault cash. On December 31, 2019, First Horizon Bank's net required reserves were $
396
million. The remaining net reserve requirement was met with Federal Reserve Bank deposits.
Restrictions on dividends.
Cash dividends are paid by FHN from its assets, which are mainly provided by dividends from its subsidiaries. Certain regulatory restrictions exist regarding the ability of First Horizon Bank to transfer funds to FHN in the form of cash, dividends, loans, or advances. As of December 31, 2020, First Horizon Bank had undivided profits of $
1.8
billion, of which a limited amount was available for distribution to FHN as dividends without prior regulatory approval. At any given time, the pertinent portions of those regulatory restrictions allow First Horizon Bank to declare preferred or common dividends without prior regulatory approval in an amount equal to First Horizon Bank's retained net income for the two most recent completed years plus the current year to date. For any period, First Horizon Bank’s ‘retained net income’ generally is equal to First Horizon Bank’s regulatory net income reduced by the preferred and common dividends declared by First Horizon Bank. Applying the dividend restrictions imposed under applicable federal and state rules, First Horizon Bank’s total amount available for dividends was $
897
million at January 1, 2021. First Horizon Bank declared and paid common dividends to the parent company in the amount of $
180
million in 2020 and $
345
million in 2019. During 2020 and
2019, First Horizon Bank declared and paid dividends on its preferred stock according to the payment terms of its issuances as noted in Note 12 - Preferred Stock.
The payment of cash dividends by FHN and First Horizon Bank may also be affected or limited by other factors, such as the requirement to maintain adequate capital above regulatory guidelines. Furthermore, the Federal Reserve generally requires insured banks and bank holding companies only to pay dividends out of current operating earnings.
Restrictions on intercompany transactions.
Under current Federal banking laws, First Horizon Bank may not enter into covered transactions with any affiliate including the parent company and certain financial subsidiaries in excess of
10
% of the bank’s capital stock and surplus, as defined, or $
804
million, on December 31, 2020. Covered transactions include a loan or extension of credit to an affiliate, a purchase of or an investment in securities issued by an affiliate and the acceptance of securities issued by the affiliate as collateral for any loan or extension of credit. The equity investment, including retained earnings, in certain of a bank’s financial subsidiaries is also treated as a covered transaction. On December 31, 2020, the parent company had covered transactions of less than $
1
million from First Horizon Bank and two of the bank’s financial subsidiaries, FHN Financial Securities Corp. and First Horizon Advisors, Inc., had covered transactions from First Horizon Bank totaling $
394
million and $
42
million, respectively. In addition, the aggregate amount of covered transactions with all affiliates, as defined, is limited to
20
% of the bank’s capital stock and surplus, as defined, or $
1.6
billion, on December 31, 2020. First Horizon Bank’s total covered transactions with all affiliates including the parent company on December 31, 2020 were $
436
million.
|
FIRST HORIZON CORPORATION
|
175
|
2020 FORM 10-K ANNUAL REPORT | ||||||
Note 14 –
Components of Other Comprehensive Income (Loss)
The following table provides the changes in accumulated other comprehensive income (loss) by component, net of tax, for the years ended December 31, 2020, 2019, and 2018:
| (Dollars in millions) | Securities AFS |
Cash Flow
Hedges |
Pension and
Post-retirement Plans |
Total | ||||||||||||||||||||||
| Balance as of December 31, 2017 | $ |
(
|
$ |
(
|
$ |
(
|
$ |
(
|
||||||||||||||||||
| Adjustment to reflect adoption of ASU 2018-02 |
(
|
(
|
(
|
(
|
||||||||||||||||||||||
| Balance as of December 31, 2017, as adjusted |
(
|
(
|
(
|
(
|
||||||||||||||||||||||
| Net unrealized gains (losses) |
(
|
(
|
(
|
(
|
||||||||||||||||||||||
| Amounts reclassified from AOCI |
|
|
|
|
||||||||||||||||||||||
| Other comprehensive income (loss) |
(
|
(
|
|
(
|
||||||||||||||||||||||
| Balance as of December 31, 2018 |
(
|
(
|
(
|
(
|
||||||||||||||||||||||
| Net unrealized gains (losses) |
|
|
|
|
||||||||||||||||||||||
| Amounts reclassified from AOCI |
|
|
|
|
||||||||||||||||||||||
| Other comprehensive income (loss) |
|
|
|
|
||||||||||||||||||||||
| Balance as of December 31, 2019 |
|
|
(
|
(
|
||||||||||||||||||||||
| Net unrealized gains (losses) |
|
|
|
|
||||||||||||||||||||||
| Amounts reclassified from AOCI |
|
(
|
|
|
||||||||||||||||||||||
| Other comprehensive income (loss) |
|
|
|
|
||||||||||||||||||||||
| Balance as of December 31, 2020 | $ |
|
$ |
|
$ |
(
|
$ |
(
|
||||||||||||||||||
Reclassifications from AOCI, and related tax effects, were as follows:
| (Dollars in millions) | ||||||||||||||||||||||||||
| Details about AOCI | 2020 | 2019 | 2018 | Affected line item in the statement where net income is presented | ||||||||||||||||||||||
| Securities AFS: | ||||||||||||||||||||||||||
| Realized (gains) losses on securities AFS | $ |
|
$ |
|
$ |
|
Securities gains (losses), net | |||||||||||||||||||
| Tax expense (benefit) |
(
|
|
|
Income tax expense | ||||||||||||||||||||||
|
|
|
|
||||||||||||||||||||||||
| Cash flow hedges: | ||||||||||||||||||||||||||
| Realized (gains) losses on cash flow hedges |
(
|
|
|
Interest and fees on loans and leases | ||||||||||||||||||||||
| Tax expense (benefit) |
|
(
|
(
|
Income tax expense | ||||||||||||||||||||||
|
(
|
|
|
||||||||||||||||||||||||
| Pension and Postretirement Plans: | ||||||||||||||||||||||||||
| Amortization of prior service cost and net actuarial (gain) loss |
|
|
|
All other expense | ||||||||||||||||||||||
| Tax expense (benefit) |
(
|
(
|
(
|
Income tax expense | ||||||||||||||||||||||
|
|
|
|
||||||||||||||||||||||||
| Total reclassification from AOCI | $ |
|
$ |
|
$ |
|
||||||||||||||||||||
|
FIRST HORIZON CORPORATION
|
176
|
2020 FORM 10-K ANNUAL REPORT | ||||||
Note 15 –
Income Taxes
The aggregate amount of income taxes included in the Consolidated Statements of Income and the Consolidated Statements of Changes in Equity for the years ended December 31, were as follows:
| (Dollars in millions) | 2020 | 2019 | 2018 | |||||||||||||||||
| Consolidated Statements of Income: | ||||||||||||||||||||
| Income tax expense | $ |
|
$ |
|
$ |
|
||||||||||||||
| Consolidated Statements of Changes in Equity: | ||||||||||||||||||||
| Income tax expense (benefit) related to: | ||||||||||||||||||||
| Net unrealized gains on pension and other postretirement plans |
|
|
|
|||||||||||||||||
| Net unrealized gains (losses) on securities available for sale |
|
|
(
|
|||||||||||||||||
| Net unrealized gains (losses) on cash flow hedges |
|
|
(
|
|||||||||||||||||
| Total | $ |
|
$ |
|
$ |
|
||||||||||||||
The components of income tax expense (benefit) for the years ended December 31, were as follows:
| (Dollars in millions) | 2020 | 2019 | 2018 | |||||||||||||||||
| Current: | ||||||||||||||||||||
| Federal | $ |
|
$ |
|
$ |
|
||||||||||||||
| State |
|
|
|
|||||||||||||||||
| Deferred: | ||||||||||||||||||||
| Federal |
(
|
|
|
|||||||||||||||||
| State |
(
|
|
|
|||||||||||||||||
| Total | $ |
|
$ |
|
$ |
|
||||||||||||||
The TCJA was signed into law at the end of 2017 and companies were provided up to a year to complete their assessment of its effects. In 2018, FHN
recorded a tax benefit of $
7
million related to the finalization of tax items for the 2017 tax return.
A reconciliation of expected income tax expense (benefit) at the federal statutory rate of 21% for 2020, 2019, and 2018, respectively to the total income tax expense follows:
| (Dollars in millions) | 2020 | 2019 | 2018 | |||||||||||||||||
| Federal income tax rate |
|
|
|
|||||||||||||||||
| Tax computed at statutory rate | $ |
|
$ |
|
$ |
|
||||||||||||||
| Increase (decrease) resulting from: | ||||||||||||||||||||
| State income taxes, net of federal income tax benefit |
|
|
|
|||||||||||||||||
| Bank-owned life insurance |
(
|
(
|
(
|
|||||||||||||||||
| 401(k) – employee stock ownership plan |
(
|
(
|
(
|
|||||||||||||||||
| Tax-exempt interest |
(
|
(
|
(
|
|||||||||||||||||
| Non-deductible expenses |
|
|
|
|||||||||||||||||
| LIHTC credits and benefits, net of amortization |
(
|
(
|
(
|
|||||||||||||||||
| Other tax credits |
(
|
|
(
|
|||||||||||||||||
| Other changes in unrecognized tax benefits |
(
|
|
|
|||||||||||||||||
| Purchase accounting gain |
(
|
|
|
|||||||||||||||||
| Effect of TCJA |
|
|
(
|
|||||||||||||||||
| Other |
|
(
|
(
|
|||||||||||||||||
| Total | $ |
|
$ |
|
$ |
|
||||||||||||||
|
FIRST HORIZON CORPORATION
|
177
|
2020 FORM 10-K ANNUAL REPORT | ||||||
As of December 31, 2020, FHN had net deferred tax asset balances related to federal and state income tax carryforwards of $
47
million and $
9
million, respectively, which will expire at various dates as follows:
| (Dollars in millions) | Expiration Dates |
Net Deferred Tax
Asset Balance |
||||||||||||
| Losses - federal | 2026 - 2035 | $ |
|
|||||||||||
| Net operating losses - states | 2026 - 2040 |
|
||||||||||||
| Credits - federal | 2040 |
|
||||||||||||
A DTA or DTL is recognized for the tax consequences of temporary differences between the financial statement carrying amounts and the tax bases of existing assets and liabilities. The tax consequence is calculated by applying enacted statutory tax rates, applicable to future years, to these temporary differences. In order to support the recognition of the DTA, FHN’s management must believe that the realization of the DTA is more likely than not. FHN evaluates the likelihood of realization of the DTA based on both positive and negative evidence available at the time, including (as appropriate) scheduled reversals of DTLs, projected future taxable income, tax planning strategies, and recent financial performance. Realization is dependent on generating sufficient taxable income prior to the expiration of the carryforwards attributable to the DTA. In projecting
future taxable income, FHN incorporates assumptions including the estimated amount of future state and federal pretax operating income, the reversal of temporary differences, and the implementation of feasible and prudent tax planning strategies. These assumptions require significant judgment about the forecasts of future taxable income and are consistent with the plans and estimates used to manage the underlying business.
As of December 31, 2020, FHN's net DTA was less than $1 million compared to $
69
million at December 31, 2019. At December 31, 2020, FHN's gross DTA (net of a valuation allowance) and gross DTL were $
471
million and $
471
million, respectively. Although realization is not assured, FHN believes that it meets the more-likely-than-not requirement with respect to the net DTA after valuation allowance.
Temporary differences which gave rise to deferred tax assets and deferred tax liabilities on December 31, 2020 and 2019 were as follows:
| (Dollars in millions) | 2020 | 2019 | ||||||||||||
| Deferred tax assets: | ||||||||||||||
| Loss reserves | $ |
|
$ |
|
||||||||||
| Employee benefits |
|
|
||||||||||||
| Accrued expenses |
|
|
||||||||||||
| Lease liability |
|
|
||||||||||||
| Federal loss carryforwards |
|
|
||||||||||||
| State loss carryforwards |
|
|
||||||||||||
| Other |
|
|
||||||||||||
| Gross deferred tax assets |
|
|
||||||||||||
| Deferred tax liabilities: | ||||||||||||||
| Depreciation and amortization | $ |
|
$ |
|
||||||||||
| Investment in debt securities (ASC 320) (a) |
|
|
||||||||||||
| Equity investments |
|
|
||||||||||||
| Other intangible assets |
|
|
||||||||||||
| Prepaid expenses |
|
|
||||||||||||
| ROU lease asset |
|
|
||||||||||||
| Leasing |
|
|
||||||||||||
| Other |
|
|
||||||||||||
| Gross deferred tax liabilities |
|
|
||||||||||||
| Net deferred tax assets | $ |
|
$ |
|
||||||||||
(a) Tax effects of unrealized gains and losses are tracked on a security-by-security basis.
|
FIRST HORIZON CORPORATION
|
178
|
2020 FORM 10-K ANNUAL REPORT | ||||||
The total unrecognized tax benefits at December 31, 2020 and 2019, was $
70
million and $
24
million, respectively. To the extent such unrecognized tax benefits as of December 31, 2020 are subsequently recognized, $
29
million of tax benefits could impact tax expense and FHN’s effective tax rate in future periods.
FHN is currently in audit in several jurisdictions. It is reasonably possible that the unrecognized tax benefits related to federal and state exposures could decrease by $
44
million and $
7
million, respectively, during 2021 if audits are completed and settled and if
the applicable statutes of limitations expire as scheduled.
FHN recognizes interest accrued and penalties related to unrecognized tax benefits within income tax expense. FHN had approximately $
11
million and $
3
million accrued for the payment of interest as of December 31, 2020 and 2019, respectively. The total amount of interest and penalties recognized in the Consolidated Statements of Income during 2020 and 2019 was an expense of $
8
million and $
1
million, respectively.
The rollforward of unrecognized tax benefits is shown below:
| (Dollars in millions) | ||||||||
| Balance at December 31, 2018 | $ |
|
||||||
| Increases related to prior year tax positions |
|
|||||||
| Increases related to current year tax positions |
|
|||||||
| Lapse of statutes |
(
|
|||||||
| Balance at December 31, 2019 | $ |
|
||||||
| Increases related to prior year tax positions |
|
|||||||
| Increases related to current year tax positions |
|
|||||||
| Settlements |
(
|
|||||||
| Lapse of statutes |
(
|
|||||||
| Balance at December 31, 2020 | $ |
|
||||||
|
FIRST HORIZON CORPORATION
|
179
|
2020 FORM 10-K ANNUAL REPORT | ||||||
Note 16 –
Earnings Per Share
The following table provides reconciliations of net income to net income available to common shareholders and the difference between average basic common shares outstanding and average diluted common shares outstanding:
| (Dollars in millions, except per share data, shares in thousands) | 2020 | 2019 | 2018 | |||||||||||||||||
| Net income | $ |
|
$ |
|
$ |
|
||||||||||||||
| Net income attributable to noncontrolling interest |
|
|
|
|||||||||||||||||
| Net income attributable to controlling interest |
|
|
|
|||||||||||||||||
| Preferred stock dividends |
|
|
|
|||||||||||||||||
| Net income available to common shareholders | $ |
|
$ |
|
$ |
|
||||||||||||||
| Weighted average common shares outstanding—basic |
|
|
|
|||||||||||||||||
| Effect of dilutive securities |
|
|
|
|||||||||||||||||
| Weighted average common shares outstanding—diluted |
|
|
|
|||||||||||||||||
| Basic earnings per common share | $ |
|
$ |
|
$ |
|
||||||||||||||
| Diluted earnings per common share | $ |
|
$ |
|
$ |
|
||||||||||||||
The following table presents outstanding options and other equity awards that were excluded from the calculation of diluted earnings per share because they were either anti-dilutive (the exercise price was higher than the weighted-average market price for the period) or the performance conditions have not been met:
| (Shares in thousands) | 2020 | 2019 | 2018 | |||||||||||||||||
| Stock options excluded from the calculation of diluted EPS |
|
|
|
|||||||||||||||||
| Weighted average exercise price of stock options excluded from the calculation of diluted EPS | $ |
|
$ |
|
$ |
|
||||||||||||||
| Other equity awards excluded from the calculation of diluted EPS |
|
|
|
|||||||||||||||||
|
FIRST HORIZON CORPORATION
|
180
|
2020 FORM 10-K ANNUAL REPORT | ||||||
Note 17 –
Contingencies and Other Disclosures
CONTINGENCIES
Contingent Liabilities Overview
Contingent liabilities arise in the ordinary course of business. Often they are related to lawsuits, arbitration, mediation, and other forms of litigation. Various litigation matters are threatened or pending against FHN and its subsidiaries. Also, FHN at times receives requests for information, subpoenas, or other inquiries from federal, state, and local regulators, from other government authorities, and from other parties concerning various matters relating to FHN’s current or former businesses. Certain matters of that sort are pending at most times, and FHN generally cooperates when those matters arise. Pending and threatened litigation matters sometimes are settled by the parties, and sometimes pending matters are resolved in court or before an arbitrator, or are withdrawn. Regardless of the manner of resolution, frequently the most significant changes in status of a matter occur over a short time period, often following a lengthy period of little substantive activity. In view of the inherent difficulty of predicting the outcome of these matters, particularly where the claimants seek very large or indeterminate damages, or where the cases present novel legal theories or involve a large number of parties, or where claims or other actions may be possible but have not been brought, FHN cannot reasonably determine what the eventual outcome of the matters will be, what the timing of the ultimate resolution of these matters may be, or what the eventual loss or impact related to each matter may be. FHN establishes a loss contingency liability for a litigation matter when loss is both probable and reasonably estimable as prescribed by applicable financial accounting guidance. If loss for a matter is probable and a range of possible loss outcomes is the best estimate available, accounting guidance requires a liability to be established at the low end of the range.
Based on current knowledge, and after consultation with counsel, management is of the opinion that loss contingencies related to threatened or pending litigation matters should not have a material adverse effect on the consolidated financial condition of FHN, but may be material to FHN’s operating results for any particular reporting period depending, in part, on the results from that period.
Material Loss Contingency Matters
Summary
As used in this Note, except for matters that are reported as having been substantially settled or otherwise substantially resolved, FHN's “material loss contingency matters” generally fall into at least one of the following categories: (i) FHN has determined material loss to be probable and has established a material loss liability in accordance with applicable financial accounting guidance; (ii) FHN has determined material loss to be probable but is not reasonably able to estimate an amount or range of material loss liability; or (iii) FHN has determined that material loss is not probable but is reasonably possible, and the amount or range of that reasonably possible material loss is estimable. As defined in applicable accounting guidance, loss is reasonably possible if there is more than a remote chance of a material loss outcome for FHN. FHN provides contingencies note disclosures for certain pending or threatened litigation matters each quarter, including all matters mentioned in categories (i) or (ii) and, occasionally, certain matters mentioned in category (iii). In addition, in this Note, certain other matters, or groups of matters, are discussed relating to FHN’s pre-2009 mortgage origination and servicing businesses. In all litigation matters discussed in this Note, unless settled or otherwise resolved, FHN believes it has meritorious defenses and intends to pursue those defenses vigorously.
FHN reassesses the liability for litigation matters each quarter as the matters progress. At December 31, 2020, the aggregate amount of liabilities established for all such loss contingency matters was $
1
million. These liabilities are separate from those discussed under the heading
Mortgage
Loan Repurchase and Foreclosure Liability
below.
In each material loss contingency matter, except as otherwise noted, there is more than a remote chance that any of the following outcomes will occur: the plaintiff will substantially prevail; the defense will substantially prevail; the plaintiff will prevail in part; or the matter will be settled by the parties. At December 31, 2020, FHN estimates that for all material loss contingency matters, estimable reasonably possible losses in future periods in excess of currently established liabilities could aggregate in a range from zero to less than $
1
million.
As a result of the general uncertainties discussed above and the specific uncertainties discussed for each matter mentioned below, it is possible that the
|
FIRST HORIZON CORPORATION
|
181
|
2020 FORM 10-K ANNUAL REPORT | ||||||
ultimate future loss experienced by FHN for any particular matter may materially exceed the amount, if any, of currently established liability for that matter.
Material Matters
A former shareholder of CBF has filed a putative class action suit, Searles v. DeMartini et al, No. 2020-0136 (Del. Chancery), against certain former directors, officers, and shareholders of CBF, alleging, among other things, that defendants breached certain fiduciary duties in connection with CBF's merger with FHN in 2017. Plaintiff claims unspecified damages related to the merger consideration and opportunity loss. FHN is unable to estimate an RPL range for this matter due to significant uncertainties regarding: whether a class will be certified and, if so, the composition of the class; the amount of potential damages that might be awarded, if any; of any such damages amount, the amount that FHN would be obliged to indemnify; the availability of applicable insurance; and the outcome of discovery.
Exposures from pre-2009 Mortgage Business
FHN is contending with indemnification claims related to "other whole loans sold," which were mortgage loans originated by FHN before 2009 and sold outside of an FHN securitization. These claims generally assert that FHN-originated loans contributed to losses in connection with mortgage loans securitized by the buyer of the loans. The claims generally do not include specific deficiencies for specific loans sold by FHN. Instead, the claims generally assert that FHN is liable for a share of the claimant's loss estimated by assessing the totality of the other whole loans sold by FHN to claimant in relation to the totality of the larger number of loans securitized by claimant. FHN is unable to estimate an RPL range for these matters due to significant uncertainties regarding: the number of, and the facts underlying, the loan originations which claimants assert are indemnifiable; the applicability of FHN’s contractual indemnity covenants to those facts and originations; and, in those cases where an indemnity claim may be supported, whether any legal defenses, counterclaims, other counter-positions, or third-party claims might eliminate or reduce claims against FHN or their impact on FHN.
FHN also has indemnification claims related to servicing obligations. The most significant is from Nationstar Mortgage LLC, currently doing business as “Mr. Cooper.” Nationstar was the purchaser of FHN’s mortgage servicing obligations and assets in 2013 and 2014 and, was FHN’s subservicer. Nationstar asserts several categories of indemnity obligations in connection with mortgage loans under the
subservicing arrangement and under the purchase transaction. This matter currently is not in litigation, but litigation in the future is possible. FHN is unable to estimate an RPL range for this matter due to significant uncertainties regarding: the exact nature of each of Nationstar’s claims and its position in respect of each; the number of, and the facts underlying, the claimed instances of indemnifiable events; the applicability of FHN’s contractual indemnity covenants to those facts and events; and, in those cases where the facts and events might support an indemnity claim, whether any legal defenses, counterclaims, other counter-positions, or third-party claims might eliminate or reduce claims against FHN or their impact on FHN.
FHN has additional potential exposures related to its pre-2009 mortgage businesses. A few of those matters have become litigation which FHN currently estimates are immaterial, some are non-litigation claims or threats, some are mere subpoenas or other requests for information, and in some areas FHN has no indication of any active or threatened dispute. Some of those matters might eventually result in settlements, and some might eventually result in adverse litigation outcomes, but none are included in the material loss contingency liabilities mentioned above or in the RPL range mentioned above.
Mortgage Loan Repurchase and Foreclosure Liability
FHN’s repurchase and foreclosure liability, primarily related to its pre-2009 mortgage businesses, is comprised of accruals to cover estimated loss content in the active pipeline (consisting of mortgage loan repurchase, make-whole, foreclosure/servicing demands and certain related exposures), estimated future inflows, and estimated loss content related to certain known claims not currently included in the active pipeline. FHN compares the estimated probable incurred losses determined under the applicable loss estimation approaches for the respective periods with current reserve levels. Changes in the estimated required liability levels are recorded as necessary through the repurchase and foreclosure provision.
Based on currently available information and experience to date, FHN has evaluated its loan repurchase, make-whole, foreclosure, and certain related exposures and has accrued for losses of $
16
million and $
15
million as of December 31, 2020 and December 31, 2019, respectively. Accrued liabilities for FHN’s estimate of these obligations are reflected in Other liabilities on the Consolidated Balance Sheets. Charges/expense reversals to increase/decrease the liability are included within Other income on the Consolidated Statements of Income.
|
FIRST HORIZON CORPORATION
|
182
|
2020 FORM 10-K ANNUAL REPORT | ||||||
The estimates are based upon currently available information and fact patterns that exist as of each balance sheet date and could be subject to future changes. Changes to any one of these factors could significantly impact the estimate of FHN’s liability.
OTHER DISCLOSURES
Indemnification Agreements and Guarantees
In the ordinary course of business, FHN enters into indemnification agreements for legal proceedings against its directors and officers and standard representations and warranties for underwriting agreements, merger and acquisition agreements, loan sales, contractual commitments, and various other business transactions or arrangements.
The extent of FHN’s obligations under these agreements depends upon the occurrence of future events; therefore, it is not possible to estimate a maximum potential amount of payouts that could be required by such agreements.
|
FIRST HORIZON CORPORATION
|
183
|
2020 FORM 10-K ANNUAL REPORT | ||||||
Note 18 –
Pension, Savings, and Other Employee Benefits
Pension plan.
FHN sponsors a noncontributory, qualified defined benefit pension plan to employees hired or re-hired on or before September 1, 2007. Pension benefits are based on years of service, average compensation near retirement or other termination, and estimated social security benefits at age
65
. Benefits under the plan are “frozen” so that years of service and compensation changes after 2012 do not affect the benefit owed. Minimum contributions are based upon actuarially determined amounts necessary to fund the total benefit obligation. Decisions to contribute to the plan are based upon pension funding requirements under the Pension Protection Act, the maximum amount deductible under the Internal Revenue Code, the actual performance of plan assets, and trends in the regulatory environment. FHN made no contributions to the qualified pension plan in 2020 and 2019, and made an insignificant contribution to the qualified pension plan in 2018. Management does not currently anticipate that FHN will make a contribution to the qualified pension plan in 2021.
FHN also maintains non-qualified plans including a supplemental retirement plan that covers certain employees whose benefits under the qualified pension plan have been limited by tax rules. These other non-qualified plans are unfunded, and contributions to these plans cover all benefits paid under the non-qualified plans. Payments made under the non-qualified plans were $
5
million for 2020. FHN anticipates making benefit payments under the non-qualified plans of $
5
million in 2021.
Savings plan.
FHN provides all qualifying full-time employees with the opportunity to participate in FHN's tax qualifi
ed 401(k) savings plan. The qualified plan allows employees to defer receipt of earned salary, up to tax law limits, on a tax-
advantaged basis. Accounts, which are held in trust, may be invested in a wide range of mutual funds and in FHN common stock. Up to tax law limits, FHN provides a
100
percent match for the first
6
percent of salary deferred, with company matching contributions invested according to a participant’s current investment election. Through a non-qualified savings restoration plan, FHN provides a restorative benefit to certain highly-compensated employees who participate in the savings plan and whose contribution elections are capped by tax limitations.
FHN also provides “flexible dollars” to assist employees with the cost of annual benefits and/or allow the employee to contribute to his or her qualified savings plan account. These “flexible
dollars” are pre-tax contributions and are based upon the employees’ years of service and qualified compensation. Contributions made by FHN through the flexible benefits plan and the company matches were $
37
million for 2020, $
28
million for 2019, and $
29
million for 2018.
Other employee benefits.
FHN provides postretirement life insurance benefits to certain employees and also provides postretirement medical insurance benefits to retirement-eligible employees. The postretirement medical plan is contributory with FHN contributing a fixed amount for certain participants. FHN’s postretirement benefits include certain prescription drug benefits.
Actuarial assumptions.
FHN’s process for developing the long-term expected rate of return of pension plan assets is based on capital market exposure as the source of investment portfolio returns. Capital market exposure refers to the plan’s allocation of its assets to asset classes, which primarily represent fixed income investments. FHN also considers expectations for inflation, real interest rates, and various risk premiums based primarily on the historical risk premium for each asset class. The expected return is based upon a time horizon of
thirty years
. Given its funded status, the asset allocation strategy for the qualified pension plan utilizes fixed income instruments that closely match the estimated duration of payment obligations. Consequently, FHN selected a
3.45
% assumption for 2020 for the qualified defined benefit pension plan and a
0.90
% assumption for
postretirement medical plan assets dedicated to employees who retired prior to January 1, 1993. FHN selected a
6.40
% assumption for 2020 for postretirement medical plan assets dedicated to employees who retired after January 1, 1993.
The discount rates for the three years ended 2020 for pension and other benefits were determined by using a hypothetical AA yield curve represented by a series of annualized individual discount rates from one-half to
thirty years
. The discount rates are selected based upon data specific to FHN’s plans and employee population. The bonds used to create the hypothetical yield curve were subjected to several requirements to ensure that the resulting rates were representative of the bonds that would be selected by management to fulfill the company’s funding obligations. In addition to the AA rating, only non-callable bonds were included. Each bond issue was required to have at least $
300
million par outstanding so that each issue was sufficiently marketable. Finally, bonds more than two standard deviations from the average yield were removed. When selecting the discount rate, FHN
|
FIRST HORIZON CORPORATION
|
184
|
2020 FORM 10-K ANNUAL REPORT | ||||||
matches the duration of high quality bonds with the duration of the obligations of the plan as of the measurement date. For all years presented, the
measurement date of the benefit obligations and net periodic benefit costs was December 31.
The actuarial assumptions used in the defined benefit pension plans and other employee benefit plans were as follows:
| Benefit Obligations | Net Periodic Benefit Cost | |||||||||||||||||||||||||||||||||||||
| 2020 | 2019 | 2018 | 2020 | 2019 | 2018 | |||||||||||||||||||||||||||||||||
| Discount rate | ||||||||||||||||||||||||||||||||||||||
| Qualified pension |
|
|
|
|
|
|
||||||||||||||||||||||||||||||||
| Nonqualified pension |
|
|
|
|
|
|
||||||||||||||||||||||||||||||||
| Other nonqualified pension |
|
|
|
|
|
|
||||||||||||||||||||||||||||||||
| Postretirement benefits |
|
|
|
|
|
|
||||||||||||||||||||||||||||||||
| Expected long-term rate of return | ||||||||||||||||||||||||||||||||||||||
|
Qualified pension/
postretirement benefits |
N/A | N/A | N/A |
|
|
|
||||||||||||||||||||||||||||||||
| Postretirement benefit (retirees post January 1, 1993) | N/A | N/A | N/A |
|
|
|
||||||||||||||||||||||||||||||||
| Postretirement benefit (retirees prior to January 1, 1993) | N/A | N/A | N/A |
|
|
|
||||||||||||||||||||||||||||||||
Since the benefits in the defined benefit pension plan are frozen, the rate of compensation increase has no effect on qualified pension benefits.
FHN has
one
pension plan where participants' benefits are affected by interest crediting rates. The plan's projected benefit obligation as of December 31, 2020, 2019 and 2018 and interest crediting rates for the respective years are:
| (Dollars in millions) | 2020 | 2019 | 2018 | |||||||||||||||||
| Projected benefit obligation | $ |
|
$ |
|
$ |
|
||||||||||||||
| Interest crediting rate |
|
% |
|
% |
|
% | ||||||||||||||
|
FIRST HORIZON CORPORATION
|
185
|
2020 FORM 10-K ANNUAL REPORT | ||||||
The components of net periodic benefit cost for the plan years 2020, 2019 and 2018 were as follows:
| (Dollars in millions) | Pension Benefits | Other Benefits | ||||||||||||||||||||||||||||||||||||
| 2020 | 2019 | 2018 | 2020 | 2019 | 2018 | |||||||||||||||||||||||||||||||||
| Components of net periodic benefit cost | ||||||||||||||||||||||||||||||||||||||
| Interest cost | $ |
|
$ |
|
$ |
|
$ |
|
$ |
|
$ |
|
||||||||||||||||||||||||||
| Expected return on plan assets |
(
|
(
|
(
|
(
|
(
|
(
|
||||||||||||||||||||||||||||||||
| Amortization of unrecognized: | ||||||||||||||||||||||||||||||||||||||
| Actuarial (gain) loss |
|
|
|
|
|
|
||||||||||||||||||||||||||||||||
| Net periodic benefit cost | $ |
|
$ |
|
$ |
|
$ |
|
$ |
|
$ |
|
||||||||||||||||||||||||||
The long-term expected rate of return is applied to the market-related value of plan assets in determining the expected return on plan assets. FHN determines the market-related value of plan assets using a calculated value that recognizes changes in the fair value of plan assets over five years, as permitted by GAAP.
FHN utilizes a spot rate approach which applies duration-specific rates from the full yield curve to estimated future benefit payments for the determination of interest cost.
The following tables set forth the plans’ benefit obligations and plan assets for 2020 and 2019:
| (Dollars in millions) | Pension Benefits | Other Benefits | ||||||||||||||||||||||||
| 2020 | 2019 | 2020 | 2019 | |||||||||||||||||||||||
| Change in benefit obligation | ||||||||||||||||||||||||||
| Benefit obligation, beginning of year | $ |
|
$ |
|
$ |
|
$ |
|
||||||||||||||||||
| Interest cost |
|
|
|
|
||||||||||||||||||||||
| Plan amendments |
|
|
|
|
||||||||||||||||||||||
| Actuarial (gain) loss (a) |
|
|
|
|
||||||||||||||||||||||
| Actual benefits paid |
(
|
(
|
(
|
(
|
||||||||||||||||||||||
| Premium paid for annuity purchase (b) |
|
(
|
|
|
||||||||||||||||||||||
| Benefit obligation, end of year | $ |
|
$ |
|
$ |
|
$ |
|
||||||||||||||||||
| Change in plan assets | ||||||||||||||||||||||||||
| Fair value of plan assets, beginning of year | $ |
|
$ |
|
$ |
|
$ |
|
||||||||||||||||||
| Actual return on plan assets |
|
|
|
|
||||||||||||||||||||||
| Employer contributions |
|
|
|
|
||||||||||||||||||||||
| Actual benefits paid – settlement payments |
(
|
|
(
|
(
|
||||||||||||||||||||||
| Actual benefits paid – other payments |
(
|
(
|
|
|
||||||||||||||||||||||
| Premium paid for annuity purchase (b) |
|
(
|
|
|
||||||||||||||||||||||
| Fair value of plan assets, end of year | $ |
|
$ |
|
$ |
|
$ |
|
||||||||||||||||||
| Funded (unfunded) status of the plans | $ |
|
$ |
(
|
$ |
(
|
$ |
(
|
||||||||||||||||||
| Amounts recognized in the Balance Sheets | ||||||||||||||||||||||||||
| Other assets | $ |
|
$ |
|
$ |
|
$ |
|
||||||||||||||||||
| Other liabilities |
(
|
(
|
(
|
(
|
||||||||||||||||||||||
| Net asset (liability) at end of year | $ |
|
$ |
(
|
$ |
(
|
$ |
(
|
||||||||||||||||||
(a)
Variances in the actuarial (gain) loss are due to normal activity such as changes in discount rates, updates to participant demographic information and revisions to life expectancy assumptions.
(b)
2019 amounts represent settlements of certain retired participants in the qualified pension plan that occurred during the year.
|
FIRST HORIZON CORPORATION
|
186
|
2020 FORM 10-K ANNUAL REPORT | ||||||
The projected benefit obligation for unfunded plans was as follows:
| Pension Benefits | Other Benefits | |||||||||||||||||||||||||
| (Dollars in millions) | 2020 | 2019 | 2020 | 2019 | ||||||||||||||||||||||
| Projected benefit obligation | $ |
|
$ |
|
$ |
|
$ |
|
||||||||||||||||||
The qualified pension plan was overfunded as of December 31, 2020 by $
41
million. Because of the pension freeze as of the end of 2012, the pension benefit obligation and the accumulated benefit obligation are the same as of December 31, 2020 and
2019. The qualified pension plan was overfunded as of December 31, 2019 by $
27
million. FHN's funded post retirement plan was also in an overfunded status as of December 31, 2020 and 2019.
Unrecognized actuarial gains and losses and unrecognized prior service costs and credits are recognized as a component of accumulated other comprehensive income.
Balances reflected in accumulated other comprehensive income on a pre-tax basis for the years ended December 31, 2020 and 2019 consist of:
| (Dollars in millions) | Pension Benefits | Other Benefits | ||||||||||||||||||||||||
| 2020 | 2019 | 2020 | 2019 | |||||||||||||||||||||||
| Amounts recognized in accumulated other comprehensive income | ||||||||||||||||||||||||||
| Net actuarial (gain) loss | $ |
|
$ |
|
$ |
|
$ |
(
|
||||||||||||||||||
The pre-tax amounts recognized in other comprehensive income during 2020 and 2019 were as follows:
| (Dollars in millions) | Pension Benefits | Other Benefits | ||||||||||||||||||||||||
| 2020 | 2019 | 2020 | 2019 | |||||||||||||||||||||||
| Changes in plan assets and benefit obligation recognized in other comprehensive income | ||||||||||||||||||||||||||
| Net actuarial (gain) loss arising during measurement period | $ |
(
|
$ |
(
|
$ |
|
$ |
|
||||||||||||||||||
| Items amortized during the measurement period: | ||||||||||||||||||||||||||
| Net actuarial gain (loss) |
(
|
(
|
|
|
||||||||||||||||||||||
| Total recognized in other comprehensive income | $ |
(
|
$ |
(
|
$ |
|
$ |
|
||||||||||||||||||
FHN utilizes the minimum amortization method in determining the amount of actuarial gains or losses to include in plan expense. Under this approach, the net deferred actuarial gain or loss that exceeds a threshold is amortized over the average remaining service period of active plan participants. The threshold is measured as the greater of:
10
percent of
a plan’s projected benefit obligation as of the beginning of the year or
10
percent of the market related value of plan assets as of the beginning of the year. FHN amortizes actuarial gains and losses using the estimated average remaining life expectancy of the remaining participants since all participants are considered inactive due to the freeze.
The following table provides detail on expected benefit payments, which reflect expected future service, as appropriate:
| (Dollars in millions) |
Pension
Benefits |
Other
Benefits |
||||||||||||
| 2021 | $ |
|
$ |
|
||||||||||
| 2022 |
|
|
||||||||||||
| 2023 |
|
|
||||||||||||
| 2024 |
|
|
||||||||||||
| 2025 |
|
|
||||||||||||
| 2026-2030 |
|
|
||||||||||||
|
FIRST HORIZON CORPORATION
|
187
|
2020 FORM 10-K ANNUAL REPORT | ||||||
Plan assets.
FHN’s overall investment goal is to create, over the life of the pension plan and retiree medical plan, an adequate pool of sufficiently liquid assets to support the qualified pension benefit obligations to participants, retirees, and beneficiaries, as well as to partially support the medical obligations to retirees and beneficiaries. Thus, the qualified pension plan and retiree medical plan seek to achieve a level of investment return consistent with changes in projected benefit obligations.
Qualified pension plan assets primarily consist of fixed income securities which include U.S. treasuries, corporate bonds of companies from diversified industries, municipal bonds, and foreign bonds. Fixed income investments generally have long durations
consistent with the estimated pension liabilities of FHN. This duration-matching strategy is intended to hedge substantially all of the plan’s risk associated with future benefit payments. Retiree medical funds are kept in short-term investments, primarily money market funds and mutual funds. On December 31, 2020 and 2019, FHN did not have any significant concentrations of risk within the plan assets related to the pension plan or the retiree medical plan.
| (Dollars in millions) | December 31, 2020 | |||||||||||||||||||||||||
| Level 1 | Level 2 | Level 3 | Total | |||||||||||||||||||||||
| Cash equivalents and money market funds | $ |
|
$ |
|
$ |
|
$ |
|
||||||||||||||||||
| Fixed income securities: | ||||||||||||||||||||||||||
| U.S. treasuries |
|
|
|
|
||||||||||||||||||||||
| Corporate, municipal and foreign bonds |
|
|
|
|
||||||||||||||||||||||
| Common and collective funds: | ||||||||||||||||||||||||||
| Fixed income |
|
|
|
|
||||||||||||||||||||||
| Total | $ |
|
$ |
|
$ |
|
$ |
|
||||||||||||||||||
| (Dollars in millions) | December 31, 2019 | |||||||||||||||||||||||||
| Level 1 | Level 2 | Level 3 | Total | |||||||||||||||||||||||
| Cash equivalents and money market funds | $ |
|
$ |
|
$ |
|
$ |
|
||||||||||||||||||
| Fixed income securities: | ||||||||||||||||||||||||||
| U.S. treasuries |
|
|
|
|
||||||||||||||||||||||
| Corporate, municipal and foreign bonds |
|
|
|
|
||||||||||||||||||||||
| Common and collective funds: | ||||||||||||||||||||||||||
| Fixed income |
|
|
|
|
||||||||||||||||||||||
| Total | $ |
|
$ |
|
$ |
|
$ |
|
||||||||||||||||||
The Pension and Savings Investment Committees, comprised of senior managers within the organization, meet regularly to review asset performance and potential portfolio revisions.
Adjustments to the qualified pension plan asset allocation primarily reflect changes in anticipated liquidity needs for plan benefits.
The fair value of FHN’s retiree medical plan assets at December 31, 2020 and 2019 by asset category are as follows:
| (Dollars in millions) | December 31, 2020 | |||||||||||||||||||||||||
| Level 1 | Level 2 | Level 3 | Total | |||||||||||||||||||||||
| Mutual funds: | ||||||||||||||||||||||||||
| Equity mutual funds | $ |
|
$ |
|
$ |
|
$ |
|
||||||||||||||||||
| Fixed income mutual funds |
|
|
|
|
||||||||||||||||||||||
| Total | $ |
|
$ |
|
$ |
|
$ |
|
||||||||||||||||||
|
FIRST HORIZON CORPORATION
|
188
|
2020 FORM 10-K ANNUAL REPORT | ||||||
| (Dollars in millions) | December 31, 2019 | |||||||||||||||||||||||||
| Level 1 | Level 2 | Level 3 | Total | |||||||||||||||||||||||
| Mutual funds: | ||||||||||||||||||||||||||
| Equity mutual funds | $ |
|
$ |
|
$ |
|
$ |
|
||||||||||||||||||
| Fixed income mutual funds |
|
|
|
|
||||||||||||||||||||||
| Total | $ |
|
$ |
|
$ |
|
$ |
|
||||||||||||||||||
|
FIRST HORIZON CORPORATION
|
189
|
2020 FORM 10-K ANNUAL REPORT | ||||||
Note 19 -
Stock Options, Restricted Stock, and Dividend Reinvestment Plans
Equity compensation plans
FHN currently has two plans which authorize the grant of new stock-based awards, the Equity Compensation Plan (ECP) and the IBERIABANK Corporation 2019 Stock Incentive Plan (SIP). New awards under the ECP may be granted to any of FHN's directors, officers, or associates. New awards under the SIP are limited to directors, officers, and associates who had one or more of those roles with IBKC before the merger closed. Most awards outstanding at year end were granted under these plans, though older stock options and certain deferred stock units remain outstanding under several plans which are no longer active.
The ECP authorizes a broad range of award types, including restricted shares, stock units, and stock options. Stock units may be paid in shares or cash, depending upon the terms of the award. The ECP also authorizes the grant of stock appreciation rights, though
no
such grants have been made. The SIP authorizes the granting of awards in the form of stock options, restricted stock, and restricted share units. Unvested awards have service and/or performance conditions which must be met in order for the shares to vest. Awards generally have service-vesting conditions, meaning that the associate must remain employed by FHN for certain periods in order for the award to vest. Some outstanding awards also have performance conditions, and one outstanding award has performance conditions associated with FHN’s stock price. FHN operates the ECP by establishing award programs, each of which is intended to cover a specific need. Programs are created, changed, or terminated as needs change.
On December 31, 2020, there were
3,115,117
shares available for new awards under the ECP and
10,558,375
shares available for new awards under the SIP. The ECP imposes a separate limit on full-value (non-option) awards which is included within the overall limit. At December 31, 2020, there were
2,311,791
shares available to be granted as full-value awards under the ECP and
5,279,187
shares available to be granted as full-value awards under the SIP.
Service condition full-value awards.
Awards may be granted with service conditions only. In recent years, programs using these awards have included annual programs for executives and selected management associates, a mandatory deferral program for executives tied to annual bonuses earned, other mandatory or elective deferral programs, various retention programs, and special
hiring-incentive situations. Details of the awards vary by program, but most are settled in shares at vesting rather than cash, and vesting rarely begins earlier than the first anniversary of grant and rarely extends beyond the fifth anniversary of grant. Annual programs tend to use multiple annual vesting dates while retention programs tend to use a single vesting date, but there are exceptions.
Performance condition awards.
Under FHN’s long-term incentive and corporate performance programs, performance stock units (PSUs) (executives) and cash units (selected management employees) are granted annually and vest only if predetermined performance measures are met. The measures are changed each year based on goals and circumstances prevailing at the time of grant. In recent years the performance periods have been
three years
, with service-vesting near the third anniversary of the grant. PSUs granted after 2014 also have a post-vest holding period of
two years
. Recent annual performance awards require pro-rated forfeiture for performance falling between a threshold level and a maximum. Performance awards sometimes are used to provide a narrow, targeted incentive to a single person or small group; one such award which includes a market performance condition to FHN’s CEO is discussed in the next paragraph. Of the annual program awards paid during 2020 or outstanding on December 31, 2020: the 2015 units vested in 2018 and their two year post-vesting holding period ended during 2020, 2016 and 2017 units vested in 2019 and 2020 at the
104.2
% payout level, respectively, and remain in a two year post-vesting holding period; the
three years
performance period of the 2018 units has ended but performance is measured relative to peers and has not yet been determined; and, the
three years
performance periods for the 2019 and 2020 units have not ended.
Market condition award.
In 2016, FHN made a special grant of performance stock units to FHN’s CEO which will vest at the end of a performance period of
seven years
. The award has no provision for pro-rated payment based on partial performance. The award’s performance goal is based on achievement of a specific level of total shareholder return during the performance period.
Director awards.
Non-employee directors receive cash and annual grants of service-conditioned stock units under a program approved by the board of directors. Director stock units granted prior to the IBKC merger vest in the year following the year of
|
FIRST HORIZON CORPORATION
|
190
|
2020 FORM 10-K ANNUAL REPORT | ||||||
Note 19 - Stock Options, Restricted Stock, and Dividend Reinvestment Plans (Continued)
grant, require a payment deferral of
two years
, and settle in shares after the deferral period. In 2020 and 2019, each director received $
85,000
or prorated equivalent of stock units, representing a portion of their annual retainer. Effective with the IBKC merger on July 1, 2020, the annual grant of director stock units was increased to $
122,000
or prorated
equivalent of stock units and all directors then in office received a supplemental grant to bring all directors up to the new annual grant level. Prior to 2005, directors could elect to defer cash compensation in the form of discount-priced stock options, some of which remain outstanding.
Stock and stock unit awards.
A summary of restricted and performance stock and unit activity during the year ended December 31, 2020, is presented below:
|
Shares/
Units (a) |
Weighted
average
grant date
fair value
(per share)
(b)
|
|||||||||||||
| January 1, 2020 |
|
$ |
|
|||||||||||
| Shares/units converted from IBKC |
|
|
||||||||||||
| Shares/units granted |
|
|
||||||||||||
| Shares/units vested/distributed |
(
|
|
||||||||||||
| Shares/units canceled |
(
|
|
||||||||||||
| December 31, 2020 |
|
$ |
|
|||||||||||
(a)
Includes only units that settle in shares; nonvested performance units are included at
100
% payout level.
(b)
The weighted average grant date fair value for shares/units granted in 2019 and 2018 was $
16.25
and $
18.70
, respectively.
On December 31, 2020, there was $
38
million of unrecognized compensation cost related to nonvested restricted stock awards. That cost is expected to be recognized over a weighted-average period of
2.5
years. The total grant date fair value of shares vested during 2020, 2019 and 2018, was $
24
million, $
15
million, and $
13
million, respectively.
Stock option awards.
Currently FHN operates only a single option program, calling for annual grants of service-vested options to executives. In the past, however, option programs varied widely in their uses and terms, and many old-program options, granted under the ECP or its predecessor plans, remain outstanding today. All options granted since 2005 provide for the issuance of FHN common stock at a price fixed at its fair market value on the grant date. Except for converted options and a special retention stock option award to the CEO in 2016, all options granted since 2008 vest fully no later than the fourth
anniversary of grant, and all such options expire
7
years from the grant date. CBF converted options and IBKC converted options granted prior to November 3, 2019 (the merger agreement date) are fully vested and expire
years from grant date. IBKC converted options granted subsequent to the merger agreement vest fully no later than the fifth anniversary of the grant date and expire
years from grant date. The 2016 retention award vests beginning on the fourth anniversary of grant and extends through the sixth anniversary of grant. A deferral program, which was discontinued in 2005, allowed for foregone compensation plus the exercise price to equal the fair market value of the stock on the date of grant if the grantee agreed to receive the options in lieu of compensation. Deferral options still outstanding expire
20
years from the grant date.
|
FIRST HORIZON CORPORATION
|
191
|
2020 FORM 10-K ANNUAL REPORT | ||||||
Note 19 - Stock Options, Restricted Stock, and Dividend Reinvestment Plans (Continued)
The summary of stock option activity for the year ended December 31, 2020, is shown below:
|
Options
Outstanding |
Weighted
Average
Exercise Price
(per share)
|
Weighted
Average Remaining Contractual Term (years) |
Aggregate
Intrinsic Value
(millions)
|
|||||||||||||||||||||||
| January 1, 2020 |
|
$ |
|
|||||||||||||||||||||||
| Converted IBKC |
|
|
||||||||||||||||||||||||
| Options granted |
|
|
||||||||||||||||||||||||
| Options exercised |
(
|
|
||||||||||||||||||||||||
| Options expired/canceled |
(
|
|
||||||||||||||||||||||||
| December 31, 2020 |
|
$ |
|
|
$ |
|
||||||||||||||||||||
| Options exercisable |
|
|
|
|
||||||||||||||||||||||
| Options expected to vest |
|
|
|
|
||||||||||||||||||||||
The total intrinsic value of options exercised during 2020, 2019 and 2018 was $
3
million, $
4
million, and $
3
million, respectively. On December 31, 2020, there was $
1
million of unrecognized compensation cost related to nonvested stock options. That cost is expected to be recognized over a weighted-average period of
2.6
years.
FHN granted or converted
4,182,737
,
530,787
and
394,296
stock options with a weighted average fair
value of $
2.13
, $
2.69
, and $
3.89
per option at grant date in 2020, 2019 and 2018, respectively.
FHN used the Black-Scholes Option Pricing Model to estimate the fair value of stock options granted or converted in 2020, 2019, and 2018 with the following assumptions:
| 2020 | 2019 | 2018 | ||||||||||||||||||
| Expected dividend yield |
|
|
|
|||||||||||||||||
| Expected weighted-average lives of options granted |
|
|
|
|||||||||||||||||
| Expected weighted-average volatility |
|
|
|
|||||||||||||||||
| Expected volatility range |
|
|
|
|||||||||||||||||
| Risk-free interest rate |
|
|
|
|||||||||||||||||
Expected lives of options granted are determined based on the vesting period, historical exercise patterns and contractual term of the options. FHN uses a blend of historical and implied volatility in determining expected volatility. A portion of the weighted average volatility rate is derived by compiling daily closing stock prices over a historical period approximating the expected lives of the options. Additionally, because of market volatility due to economic conditions and the impact on stock prices of financial institutions, FHN also incorporates a measure of implied volatility so as to incorporate more recent market conditions in the estimation of future volatility.
Phantom stock awards.
As a result of the IBKC merger, FHN assumed phantom stock awards under various plans to officers and other key associates. The awards are subject to a vesting period of
years and are paid out in cash upon vesting. The
amount paid per vesting period is calculated as the number of vested share equivalents multiplied by closing market price of a share of the Company's common stock on the vesting date. Share equivalents are calculated on the date of grant as the total award's dollar value divided by the closing market price of a share of the Company's common stock on the grant date. As of December 31, 2020, there were
659,597
share equivalents of phantom stock awards outstanding. See Note 1 - Significant Accounting Policies for more discussion on FHN's phantom stock awards.
Compensation Cost.
The compensation cost that has been included in the Consolidated Statements of Income pertaining to stock-based awards was $
32
million, $
22
million, and $
23
million for 2020, 2019, and 2018, respectively. The corresponding total income tax benefits recognized were $
8
million in 2020, $
6
million in 2019, and $
6
million in 2018.
|
FIRST HORIZON CORPORATION
|
192
|
2020 FORM 10-K ANNUAL REPORT | ||||||
Note 19 - Stock Options, Restricted Stock, and Dividend Reinvestment Plans (Continued)
|
FIRST HORIZON CORPORATION
|
193
|
2020 FORM 10-K ANNUAL REPORT | ||||||
Note 20 -
Business Segment Information
During the fourth quarter of 2020, FHN reorganized its internal management structure and, accordingly, its segment reporting structure. Historically, FHN's reportable business segments were Regional Banking, Fixed Income, Corporate, and Non-strategic. On July 1, 2020, FHN and IBKC closed their merger of equals transaction. This transaction prompted organizational changes to better integrate and execute the combined Company's strategic priorities across all lines of businesses. As a result, FHN revised its reportable segments as described below. Prior period segment information has been reclassified to conform to the current period presentation.
FHN is composed of the following operating segments:
•
Regional Banking segment offers financial products and services, including traditional lending and deposit taking, to consumer and commercial clients primarily in the southern U.S. and other selected markets. Regional Banking also provides investment, wealth management, financial planning, trust and asset management services for consumer clients.
•
Specialty Banking segment consists of lines of business that deliver product offerings and services with specialized industry knowledge.
Specialty Banking’s lines of business include asset-based lending, mortgage warehouse lending, commercial real estate, franchise finance, correspondent banking, equipment finance, mortgage, and title insurance.
In addition to traditional lending and deposit taking, Specialty Banking also delivers treasury management solutions, loan syndications, international banking and SBA lending.
Additionally, Specialty Banking has
a line of business focused on fixed income securities sales, trading, underwriting, and strategies for institutional clients in the U.S. and abroad, as well as loan sales, portfolio advisory services, and derivative sales.
•
Corporate segment consists primarily of corporate support functions including risk management, audit, accounting, finance, executive office, and corporate communications. Shared support services such as human resources, properties, technology, credit risk and bank operations are allocated to the activities of Regional Banking, Specialty Banking and Corporate.
Additionally, the Corporate segment includes centralized management of capital and funding to support the business activities of the company including management of wholesale funding, liquidity, and capital management and allocation. The Corporate segment also includes the revenue and expense associated with run-off businesses such as pre-2009 mortgage banking elements, run-off consumer and trust preferred loan portfolios, and other exited businesses.
Periodically, FHN adapts its segments to reflect managerial or strategic changes. FHN may also modify its methodology of allocating expenses and equity among segments which could change historical segment results. Business segment revenue, expense, asset, and equity levels reflect those which are specifically identifiable or which are allocated based on an internal allocation method. Because the allocations are based on internally developed assignments and allocations, to an extent they are subjective. Generally, all assignments and allocations have been consistently applied for all periods presented.
|
FIRST HORIZON CORPORATION
|
194
|
2020 FORM 10-K ANNUAL REPORT | ||||||
The following tables present financial information for each reportable segment for the years ended December 31:
| (Dollars in millions) | 2020 | 2019 | 2018 | |||||||||||||||||
| Consolidated | ||||||||||||||||||||
| Net interest income | $ |
|
$ |
|
$ |
|
||||||||||||||
| Provision for credit losses (a) |
|
|
|
|||||||||||||||||
| Noninterest income |
|
|
|
|||||||||||||||||
| Noninterest expense |
|
|
|
|||||||||||||||||
| Income before income taxes |
|
|
|
|||||||||||||||||
| Income tax expense |
|
|
|
|||||||||||||||||
| Net income | $ |
|
$ |
|
$ |
|
||||||||||||||
| Average assets | $ |
|
$ |
|
$ |
|
||||||||||||||
| Depreciation and amortization |
|
|
|
|||||||||||||||||
| Expenditures for long-lived assets |
|
|
|
|||||||||||||||||
| (a) Increase in provision for credit losses in 2020 is primarily due to provision related to non-PCD loans acquired in the IBKC merger and Truist branch acquisition and the economic forecast attributable to the COVID-19 pandemic. | ||||||||||||||||||||
|
FIRST HORIZON CORPORATION
|
195
|
2020 FORM 10-K ANNUAL REPORT | ||||||
| (Dollars in millions) | 2020 | 2019 | 2018 | |||||||||||||||||
| Regional Banking | ||||||||||||||||||||
| Net interest income | $ |
|
$ |
|
$ |
|
||||||||||||||
| Provision for credit losses |
|
|
|
|||||||||||||||||
| Noninterest income |
|
|
|
|||||||||||||||||
| Noninterest expense |
|
|
|
|||||||||||||||||
| Income before income taxes |
|
|
|
|||||||||||||||||
| Income tax expense |
|
|
|
|||||||||||||||||
| Net income | $ |
|
$ |
|
$ |
|
||||||||||||||
| Average assets | $ |
|
$ |
|
$ |
|
||||||||||||||
| Depreciation and amortization |
(
|
|
|
|||||||||||||||||
| Expenditures for long-lived assets |
|
|
|
|||||||||||||||||
| Specialty Banking | ||||||||||||||||||||
| Net interest income | $ |
|
$ |
|
$ |
|
||||||||||||||
| Provision for loan losses |
|
|
|
|||||||||||||||||
| Noninterest income |
|
|
|
|||||||||||||||||
| Noninterest expense |
|
|
|
|||||||||||||||||
| Income before income taxes |
|
|
|
|||||||||||||||||
| Income tax expense |
|
|
|
|||||||||||||||||
| Net income | $ |
|
$ |
|
$ |
|
||||||||||||||
| Average assets | $ |
|
$ |
|
$ |
|
||||||||||||||
| Depreciation and amortization |
|
|
|
|||||||||||||||||
| Expenditures for long-lived assets |
|
|
|
|||||||||||||||||
| Corporate | ||||||||||||||||||||
| Net interest expense | $ |
(
|
$ |
(
|
$ |
(
|
||||||||||||||
| Provision credit for loan losses |
(
|
(
|
(
|
|||||||||||||||||
| Noninterest income (a) |
|
|
|
|||||||||||||||||
| Noninterest expense (b)(c)(d) |
|
|
|
|||||||||||||||||
| Income (loss) before income taxes |
|
(
|
|
|||||||||||||||||
| Income tax benefit |
(
|
(
|
(
|
|||||||||||||||||
| Net income (loss) | $ |
|
$ |
(
|
$ |
|
||||||||||||||
| Average assets | $ |
|
$ |
|
$ |
|
||||||||||||||
| Depreciation and amortization |
|
|
|
|||||||||||||||||
| Expenditures for long-lived assets |
|
|
|
|||||||||||||||||
Certain previously reported amounts have been reclassified to agree with current presentation.
(a) 2020 includes $
533
million purchase accounting gain associated with the IBKC merger; 2018 includes a $
213
million pre-tax gain from the sale of Visa Class B shares.
(b) 2019 includes restructuring-related costs associated with efficiency initiatives; refer to Note 25 - Restructuring, Repositioning, and Efficiency for additional information. 2020, 2019 and 2018 include merger-related expenses; refer to Note 2 - Acquisitions and Divestitures for additional information.
(c) 2019 includes $
21
million of asset impairments, professional fees, and other client-contact and technology-related expenses associated with rebranding initiatives.
(d) 2020 and 2019 include $
41
million and $
11
million, respectively of contributions to FHN's foundations.
|
FIRST HORIZON CORPORATION
|
196
|
2020 FORM 10-K ANNUAL REPORT | ||||||
The following tables reflect a disaggregation of FHN’s noninterest income by major product line and reportable segment for the years ended December 31, 2020, 2019, and 2018:
| December 31, 2020 | ||||||||||||||||||||||||||
| (Dollars in millions) | Regional Banking | Specialty Banking | Corporate | Consolidated | ||||||||||||||||||||||
| Noninterest income: | ||||||||||||||||||||||||||
| Fixed income (a) | $ |
|
$ |
|
$ |
|
$ |
|
||||||||||||||||||
| Deposit transactions and cash management |
|
|
|
|
||||||||||||||||||||||
| Mortgage banking and title income |
|
|
|
|
||||||||||||||||||||||
| Brokerage, management fees and commissions |
|
|
|
|
||||||||||||||||||||||
| Trust services and investment management |
|
|
|
|
||||||||||||||||||||||
| Bankcard income |
|
|
|
|
||||||||||||||||||||||
| Securities gains (losses), net (b) |
|
|
(
|
(
|
||||||||||||||||||||||
| Purchase accounting gain |
|
|
|
|
||||||||||||||||||||||
| Other income (c) |
|
|
|
|
||||||||||||||||||||||
| Total noninterest income | $ |
|
$ |
|
$ |
|
$ |
|
||||||||||||||||||
| December 31, 2019 | ||||||||||||||||||||||||||
| (Dollars in millions) | Regional Banking | Specialty Banking | Corporate | Consolidated | ||||||||||||||||||||||
| Noninterest income: | ||||||||||||||||||||||||||
| Fixed income (a) | $ |
|
$ |
|
$ |
|
$ |
|
||||||||||||||||||
| Deposit transactions and cash management |
|
|
|
|
||||||||||||||||||||||
| Mortgage banking and title income |
|
|
|
|
||||||||||||||||||||||
| Brokerage, management fees and commissions |
|
|
|
|
||||||||||||||||||||||
| Trust services and investment management |
|
|
|
|
||||||||||||||||||||||
| Bankcard income |
|
|
|
|
||||||||||||||||||||||
| Other income (c) |
|
|
|
|
||||||||||||||||||||||
| Total noninterest income | $ |
|
$ |
|
$ |
|
$ |
|
||||||||||||||||||
| December 31, 2018 | ||||||||||||||||||||||||||
| (Dollars in millions) | Regional Banking | Specialty Banking | Corporate | Consolidated | ||||||||||||||||||||||
| Noninterest income: | ||||||||||||||||||||||||||
| Fixed income (a) | $ |
|
$ |
|
$ |
|
$ |
|
||||||||||||||||||
| Deposit transactions and cash management |
|
|
|
|
||||||||||||||||||||||
| Mortgage banking and title income |
|
|
|
|
||||||||||||||||||||||
| Brokerage, management fees and commissions |
|
|
|
|
||||||||||||||||||||||
| Trust services and investment management |
|
|
|
|
||||||||||||||||||||||
| Bankcard income |
|
|
|
|
||||||||||||||||||||||
| Securities gains (losses), net (b) |
|
|
|
|
||||||||||||||||||||||
| Other income (c) |
|
|
|
|
||||||||||||||||||||||
| Total noninterest income | $ |
|
$ |
|
$ |
|
$ |
|
||||||||||||||||||
Certain previously reported amounts have been reclassified to agree with current presentation.
(a)
For years ended 2020, 2019 and 2018, includes $
39
million, $
34
million and $
29
million, respectively, of underwriting, portfolio advisory, and other noninterest income in scope of ASC 606, "Revenue From Contracts With Customers." 2019 and 2018 include $
1
million and $
4
million, respectively, of gains from the reversal of a previous valuation adjustment due to sales and payoffs of TRUPS loans excluded from the scope of ASC 606 in the Corporate segment.
(b)
Represents noninterest income excluded from the scope of ASC 606. Amount is presented for informational purposes to reconcile total non-interest income. 2018 includes a pre-tax gain of $
213
million from the sale of FHN's remaining holdings of Visa Class B shares.
(c)
Includes other service charges, ATM and interchange fees, electronic banking fees, and insurance commissions in scope of ASC 606.
|
FIRST HORIZON CORPORATION
|
197
|
2020 FORM 10-K ANNUAL REPORT | ||||||
Note 21 -
Variable Interest Entities
FHN makes equity investments in various entities that are considered VIEs, as defined by GAAP. A VIE typically does not have sufficient equity at risk to finance its activities without additional subordinated financial support from other parties. The Company’s variable interest arises from contractual, ownership or other monetary interests in the entity, which change with fluctuations in the fair value of the entity's net assets. FHN consolidates a VIE if it is the primary beneficiary of the entity. FHN is the primary beneficiary of a VIE if its variable interest provides it with the power to direct the activities that most significantly impact the VIE and the right to receive benefits (or the obligation to absorb losses) that could potentially be significant to the VIE. To determine whether or not a variable interest held could potentially be significant to the VIE, FHN considers both qualitative and quantitative factors regarding the nature, size and form of its involvement with the VIE. FHN assesses whether or not it is the primary beneficiary of a VIE on an ongoing basis.
Consolidated Variable Interest Entities
The following table summarizes the carrying value of assets and liabilities associated with rabbi trusts used for deferred compensation plans which are consolidated by FHN as of December 31, 2020 and 2019:
| December 31, 2020 | December 31, 2019 | |||||||||||||||||||
|
(
Dollars in millions
)
|
||||||||||||||||||||
| Assets: | ||||||||||||||||||||
| Other assets | $ |
|
$ |
|
||||||||||||||||
| Total assets | $ |
|
$ |
|
||||||||||||||||
| Liabilities: | ||||||||||||||||||||
| Other liabilities | $ |
|
$ |
|
||||||||||||||||
| Total liabilities | $ |
|
$ |
|
||||||||||||||||
Nonconsolidated Variable Interest Entities
Low Income Housing Tax Credit Partnerships.
Through designated wholly-owned subsidiaries, First Horizon Bank, makes equity investments as a limited partner in various partnerships that sponsor affordable housing projects utilizing the LIHTC. The purpose of these investments is to achieve a satisfactory return on capital and to support FHN’s community reinvestment initiatives. LIHTC partnerships are managed by unrelated general partners that have the power to direct the activities
which most significantly affect the performance of the partnerships. FHN is therefore not the primary beneficiary of any LIHTC partnerships. Accordingly, FHN does not consolidate these VIEs and accounts for these investments in other assets on the Consolidated Balance Sheets.
FHN accounts for all qualifying LIHTC investments under the proportional amortization method. Under this method an entity amortizes the initial cost of the investment in proportion to the tax credits and other tax benefits received and recognizes the net investment performance as a component of income tax expense. LIHTC investments that do not qualify
|
FIRST HORIZON CORPORATION
|
198
|
2020 FORM 10-K ANNUAL REPORT | ||||||
for the proportional amortization method are accounted for using the equity method. Expenses
associated with non-qualifying LIHTC investments were not material during 2020, 2019, and 2018.
The following table summarizes the impact to Income tax expense on the Consolidated Statements of Income for the years ended December 31, 2020, 2019 and 2018 for LIHTC investments accounted for under the proportional amortization method.
|
(
Dollars in millions
)
|
2020 | 2019 | 2018 | |||||||||||||||||
| Income tax expense (benefit): | ||||||||||||||||||||
| Amortization of qualifying LIHTC investments | $ |
|
$ |
|
$ |
|
||||||||||||||
| Low income housing tax credits |
(
|
(
|
(
|
|||||||||||||||||
| Other tax benefits related to qualifying LIHTC investments |
(
|
(
|
(
|
|||||||||||||||||
Other Tax Credit Investments.
Through designated subsidiaries, First Horizon Bank, periodically makes equity investments as a non-managing member in various LLCs that sponsor community development projects utilizing the NMTC. First Horizon Bank also makes equity investments as a limited partner or non-managing member in entities that receive tax credits from solar and historic tax credits. The purpose of these investments is to achieve a satisfactory return on capital and to support FHN’s community reinvestment initiatives. These entities are considered VIEs as First Horizon Bank's subsidiaries represent the holders of the equity investment at risk, but do not have the ability to direct the activities that most significantly affect the performance of the entities.
Small Issuer Trust Preferred Holdings
. First Horizon Bank holds variable interests in trusts which have issued mandatorily redeemable preferred capital securities (“trust preferreds”) for smaller banking and insurance enterprises. First Horizon Bank has no voting rights for the trusts’ activities. The trusts’ only assets are junior subordinated debentures of the issuing enterprises. The creditors of the trusts hold no recourse to the assets of First Horizon Bank. Since First Horizon Bank is solely a holder of the trusts’ securities, it has no rights which would give it the power to direct the activities that most significantly impact the trusts’ economic performance and thus it is not considered the primary beneficiary of the trusts. First Horizon Bank has no contractual requirements to provide financial support to the trusts.
On-Balance Sheet Trust Preferred Securitization.
In 2007, First Horizon Bank executed a securitization of certain small issuer trust preferreds for which the underlying trust meets the definition of a VIE as the holders of the equity investment at risk do not have the power through voting rights, or similar rights, to direct the activities that most significantly impact the entity’s economic performance. Since First Horizon Bank did not retain servicing or other decision making rights, First Horizon Bank is not the primary beneficiary as it does not have the power to direct the
activities that most significantly impact the trust’s economic performance. Accordingly, First Horizon Bank has accounted for the funds received through the securitization as a term borrowing in its Consolidated Balance Sheets. First Horizon Bank has no contractual requirements to provide financial support to the trust.
Holdings in Agency Mortgage-Backed Securities.
FHN holds securities issued by various Agency securitization trusts. Based on their restrictive nature, the trusts meet the definition of a VIE since the holders of the equity investments at risk do not have the power through voting rights, or similar rights, to direct the activities that most significantly impact the entities’ economic performance. FHN could potentially receive benefits or absorb losses that are significant to the trusts based on the nature of the trusts’ activities and the size of FHN’s holdings. However, FHN is solely a holder of the trusts’ securities and does not have the power to direct the activities that most significantly impact the trusts’ economic performance, and is not considered the primary beneficiary of the trusts. FHN has no contractual requirements to provide financial support to the trusts.
Commercial Loan Troubled Debt Restructurings.
For certain troubled commercial loans, First Horizon Bank restructures the terms of the borrower’s debt in an effort to increase the probability of receipt of amounts contractually due. Following a troubled debt restructuring, the borrower entity typically meets the definition of a VIE as the initial determination of whether an entity is a VIE must be reconsidered as events have proven that the entity’s equity is not sufficient to permit it to finance its activities without additional subordinated financial support or a restructuring of the terms of its financing. As First Horizon Bank does not have the power to direct the activities that most significantly impact such troubled commercial borrowers’ operations, it is not considered the primary beneficiary even in situations where, based on the size of the financing provided, First Horizon Bank is exposed to potentially significant
|
FIRST HORIZON CORPORATION
|
199
|
2020 FORM 10-K ANNUAL REPORT | ||||||
benefits and losses of the borrowing entity. First Horizon Bank has no contractual requirements to provide financial support to the borrowing entities beyond certain funding commitments established upon restructuring of the terms of the debt that allows for preparation of the underlying collateral for sale.
Proprietary Trust Preferred Issuances
. In conjunction with its acquisitions, FHN acquired junior subordinated debt underlying multiple issuances of trust preferred debt. All of the trusts are considered VIEs because the ownership interests from the capital contributions to these trusts are not considered “at risk” in evaluating whether the holders of the equity investments at risk in the trusts have the ability to direct the activities that most significantly impact the entities’ economic performance. Thus, FHN cannot be the trusts’ primary beneficiary because its ownership interests in the trusts are not considered variable interests as they are not considered “at risk”. Consequently, none of the trusts are consolidated by FHN.
Other.
Prior to 2020, FHN had other investments that were determined to be VIE's, which included a sale
leaseback transaction and proprietary residential mortgage securitizations.
First Horizon Bank had entered into an agreement with a single asset leasing entity whereby First Horizon Bank entered into a construction loan agreement with the leasing entity for renovation of the building. Upon adoption of ASU 2016-02, the transaction qualified as a seller-financed sale-leaseback. First Horizon Bank was not considered the primary beneficiary and thus was precluded from consolidating the leasing entity. The maximum loss exposure at December 31, 2019 was $
18
million.
Prior to 2020, FHN also held variable interests in proprietary residential mortgage securitization trusts that were established prior to 2008 as a source of liquidity for its mortgage banking operations. First Horizon Bank was not considered the primary beneficiary and thus did not consolidate the leasing entity. The maximum loss exposure at December 31, 2019 was $
1
million.
The following table summarizes FHN’s nonconsolidated VIEs as of December 31, 2020:
| (Dollars in millions) |
Maximum
Loss Exposure |
Liability
Recognized |
Classification | |||||||||||||||||
| Type: | ||||||||||||||||||||
| Low income housing partnerships | $ |
|
$ |
|
(a) | |||||||||||||||
| Other tax credit investments (b) |
|
|
Other assets | |||||||||||||||||
| Small issuer trust preferred holdings (c) |
|
|
Loans and leases | |||||||||||||||||
| On-balance sheet trust preferred securitization |
|
|
(d) | |||||||||||||||||
| Holdings of agency mortgage-backed securities (c) |
|
|
(e) | |||||||||||||||||
| Commercial loan troubled debt restructurings (f) |
|
|
Loans and leases | |||||||||||||||||
| Proprietary trust preferred issuances (g) |
|
|
Term borrowings | |||||||||||||||||
(a) Maximum loss exposure represents $
206
million of current investments and $
132
million of accrued contractual funding commitments. Accrued funding commitments represent unconditional contractual obligations for future funding events, and are recognized in Other liabilities. FHN currently expects to be required to fund these accrued commitments by the end of 2024.
(b) Maximum loss exposure represents the value of current investments.
(c) Maximum loss exposure represents the value of current investments. A liability is not recognized as FHN is solely a holder of the trusts’ securities.
(d) Includes $
112
million classified as Loans and leases, and $
2
million classified as Trading securities which are offset by $
82
million classified as Term borrowings.
(e) Includes $
0.8
billion classified as Trading securities and $
6.2
billion classified as Securities available for sale.
(f) Maximum loss exposure represents $
176
million of current receivables and $
10
million of contractual funding commitments on loans related to commercial borrowers involved in a troubled debt restructuring.
(g) No exposure to loss due to nature of FHN's involvement.
|
FIRST HORIZON CORPORATION
|
200
|
2020 FORM 10-K ANNUAL REPORT | ||||||
The following table summarizes FHN’s nonconsolidated VIEs as of December 31, 2019:
| (Dollars in millions) |
Maximum
Loss Exposure |
Liability
Recognized |
Classification | |||||||||||||||||
| Type: | ||||||||||||||||||||
| Low income housing partnerships | $ |
|
$ |
|
(a) | |||||||||||||||
| Other tax credit investments (b) (c) |
|
|
Other assets | |||||||||||||||||
| Small issuer trust preferred holdings (d) |
|
|
Loans and leases | |||||||||||||||||
| On-balance sheet trust preferred securitization |
|
|
(e) | |||||||||||||||||
| Proprietary residential mortgage securitizations |
|
|
Trading securities | |||||||||||||||||
| Holdings of agency mortgage-backed securities (d) |
|
|
(f) | |||||||||||||||||
| Commercial loan troubled debt restructurings (g) |
|
|
Loans and leases | |||||||||||||||||
| Sale-leaseback transaction |
|
|
(h) | |||||||||||||||||
| Proprietary trust preferred issuances (i) |
|
|
Term borrowings | |||||||||||||||||
(a)
Maximum loss exposure represents $
101
million of current investments and $
137
million of accrued contractual funding commitments. Accrued funding commitments represent unconditional contractual obligations for future funding events, and are also recognized in Other liabilities.
(b)
A liability is not recognized as investments are written down over the life of the related tax credit.
(c)
Maximum loss exposure represents current investment balance. As of December 31, 2019, there were no investments funded through loans from community development enterprises.
(d)
Maximum loss exposure represents the value of current investments. A liability is not recognized as FHN is solely a holder of the trusts’ securities.
(e)
Includes $
112
million classified as Loans and leases and $
2
million classified as Trading securities, which are offset by $
81
million classified as Term borrowings.
(f)
Includes $
0.5
billion classified as Trading securities and $
4.0
billion classified as Securities available for sale.
(g)
Maximum loss exposure represents $
43
million of current receivables and $
2
million of contractual funding commitments on loans related to commercial borrowers involved in a troubled debt restructuring.
(h)
Maximum loss exposure represents the current loan balance plus additional funding commitments less amounts received from the buyer-lessor.
(i)
No exposure to loss due to nature of FHN's involvement.
|
FIRST HORIZON CORPORATION
|
201
|
2020 FORM 10-K ANNUAL REPORT | ||||||
Note 22 -
Derivatives
In the normal course of business, FHN utilizes various financial instruments (including derivative contracts and credit-related agreements) through its fixed income and risk management operations, as part of its risk management strategy and as a means to meet clients’ needs. Derivative instruments are subject to credit and market risks in excess of the amount recorded on the balance sheet as required by GAAP. The contractual or notional amounts of these financial instruments do not necessarily represent the amount of credit or market risk. However, they can be used to measure the extent of involvement in various types of financial instruments. Controls and monitoring procedures for these instruments have been established and are routinely reevaluated. The ALCO controls, coordinates, and monitors the usage and effectiveness of these financial instruments.
Credit risk represents the potential loss that may occur if a party to a transaction fails to perform according to the terms of the contract. The measure of credit exposure is the replacement cost of contracts with a positive fair value. FHN manages credit risk by entering into financial instrument transactions through national exchanges, primary dealers or approved counterparties, and by using mutual margining and master netting agreements whenever possible to limit potential exposure. FHN also maintains collateral posting requirements with certain counterparties to limit credit risk. Daily margin posted or received with central clearinghouses is considered a legal settlement of the related derivative contracts which results in a net presentation for
each contract in the Consolidated Balance Sheets. Treatment of daily margin as a settlement has no effect on hedge accounting or gains/losses for the applicable derivative contracts. On December 31, 2020 and 2019, respectively, FHN had $
280
million and $
137
million of cash receivables and $
166
million and $
53
million of cash payables related to collateral posting under master netting arrangements, inclusive of collateral posted related to contracts with adjustable collateral posting thresholds and over-collateralized positions, with derivative counterparties. With exchange-traded contracts, the credit risk is limited to the clearinghouse used. For non-exchange traded instruments, credit risk may occur when there is a gain in the fair value of the financial instrument and the counterparty fails to perform according to the terms of the contract and/or when the collateral proves to be of insufficient value. See additional discussion regarding master netting agreements and collateral posting requirements later in this note under the heading “Master Netting and Similar Agreements.” Market risk represents the potential loss due to the
decrease in the value of a financial instrument caused primarily by changes in interest rates or the prices of debt instruments. FHN manages market risk by establishing and monitoring limits on the types and degree of risk that may be undertaken. FHN continually measures this risk through the use of models that measure value-at-risk and earnings-at-risk.
Derivative Instruments.
FHN enters into various derivative contracts both to facilitate client transactions and as a risk management tool. Where contracts have been created for clients, FHN enters into upstream transactions with dealers to offset its risk exposure. Contracts with dealers that require central clearing are novated to a clearing agent who becomes FHN’s counterparty. Derivatives are also used as a risk management tool to hedge FHN’s exposure to changes in interest rates or other defined market risks.
Forward contracts are over-the-counter contracts where two parties agree to purchase and sell a specific quantity of a financial instrument at a specified price, with delivery or settlement at a specified date. Futures contracts are exchange-traded contracts where two parties agree to purchase and sell a specific quantity of a financial instrument at a specified price, with delivery or settlement at a specified date. Interest rate option contracts give the purchaser the right, but not the obligation, to buy or sell a specified quantity of a financial instrument, at a specified price, during a specified period of time. Caps and floors are options that are linked to a notional principal amount and an underlying indexed interest rate. Interest rate swaps involve the exchange of interest payments at specified intervals between two parties without the exchange of any underlying principal. Swaptions are options on interest rate swaps that give the purchaser the right, but not the obligation, to enter into an interest rate swap agreement during a specified period of time.
Trading Activities
FHNF trades U.S. Treasury, U.S. Agency, government-guaranteed loan, mortgage-backed, corporate and municipal fixed income securities, and other securities for distribution to clients. When these securities settle on a delayed basis, they are considered forward contracts. FHNF also enters into interest rate contracts, including caps, swaps, and floors for its clients. In addition, FHNF enters into futures and option contracts to economically hedge interest rate risk associated with a portion of its
|
FIRST HORIZON CORPORATION
|
202
|
2020 FORM 10-K ANNUAL REPORT | ||||||
securities inventory. These transactions are measured at fair value, with changes in fair value recognized in noninterest income. Related assets and liabilities are recorded on the Consolidated Balance Sheets as derivative assets and derivative liabilities within Other assets and Other liabilities. The FHNF Risk Committee and the Credit Risk Management Committee collaborate to mitigate credit risk related to these transactions. Credit risk is controlled through
credit approvals, risk control limits, and ongoing monitoring procedures. Total trading revenues were $
371
million, $
228
million and $
132
million for the years ended December 31, 2020, 2019 and 2018, respectively. Trading revenues are inclusive of both derivative and non-derivative financial instruments, and are included in Fixed income on the Consolidated Statements of Income.
The following tables summarize derivatives associated with FHNF's trading activities as of December 31, 2020 and 2019:
| December 31, 2020 | ||||||||||||||||||||
| (Dollars in millions) | Notional | Assets | Liabilities | |||||||||||||||||
| Customer interest rate contracts | $ |
|
$ |
|
$ |
|
||||||||||||||
| Offsetting upstream interest rate contracts |
|
|
|
|||||||||||||||||
| Forwards and futures purchased |
|
|
|
|||||||||||||||||
| Forwards and futures sold |
|
|
|
|||||||||||||||||
| December 31, 2019 | ||||||||||||||||||||
| (Dollars in millions) | Notional | Assets | Liabilities | |||||||||||||||||
| Customer interest rate contracts | $ |
|
$ |
|
$ |
|
||||||||||||||
| Offsetting upstream interest rate contracts |
|
|
|
|||||||||||||||||
| Option contracts purchased |
|
|
|
|||||||||||||||||
| Forwards and futures purchased |
|
|
|
|||||||||||||||||
| Forwards and futures sold |
|
|
|
|||||||||||||||||
Interest Rate Risk Management
FHN’s ALCO focuses on managing market risk by controlling and limiting earnings volatility attributable to changes in interest rates. Interest rate risk exists to the extent that interest-earning assets and interest-bearing liabilities have different maturity or repricing characteristics. FHN uses derivatives, primarily swaps, that are designed to moderate the impact on earnings as interest rates change. Interest paid or received for swaps utilized by FHN to hedge the fair value of long term debt is recognized as an adjustment of the interest expense of the liabilities whose risk is being managed. FHN’s interest rate risk management policy is to use derivatives to hedge interest rate risk or market value of assets or liabilities, not to speculate. In addition, FHN has entered into certain interest rate swaps and caps as a part of a product offering to commercial clients that
includes customer derivatives paired with upstream offsetting market instruments that, when completed, are designed to mitigate interest rate risk. These contracts do not qualify for hedge accounting and are measured at fair value with gains or losses included in current earnings in Noninterest expense on the Consolidated Statements of Income.
FHN had designated derivative transactions in hedging strategies to manage interest rate risk on $
400
million of senior debt prior to its maturity in 2019 and on $
500
million of senior debt with a maturity in December 2020. These transactions qualified for hedge accounting using the long-haul method. FHN early redeemed the $
400
million senior debt in 2019 and the $
500
million senior debt in November 2020.
|
FIRST HORIZON CORPORATION
|
203
|
2020 FORM 10-K ANNUAL REPORT | ||||||
The following tables summarize FHN’s derivatives associated with interest rate risk management activities as of December 31, 2020 and 2019:
| December 31, 2020 | ||||||||||||||||||||
| (Dollars in millions) | Notional | Assets | Liabilities | |||||||||||||||||
| Customer Interest Rate Contracts Hedging | ||||||||||||||||||||
| Hedging Instruments and Hedged Items: | ||||||||||||||||||||
| Customer interest rate contracts | $ |
|
$ |
|
$ |
|
||||||||||||||
| Offsetting upstream interest rate contracts |
|
|
|
|||||||||||||||||
| December 31, 2019 | ||||||||||||||||||||
| (Dollars in millions) | Notional | Assets | Liabilities | |||||||||||||||||
| Customer Interest Rate Contracts Hedging | ||||||||||||||||||||
| Hedging Instruments and Hedged Items: | ||||||||||||||||||||
| Customer interest rate contracts | $ |
|
$ |
|
$ |
|
||||||||||||||
| Offsetting upstream interest rate contracts |
|
|
|
|||||||||||||||||
| Debt Hedging | ||||||||||||||||||||
| Hedging Instruments: | ||||||||||||||||||||
| Interest rate swaps | $ |
|
N/A | $ |
|
|||||||||||||||
| Hedged Items: | ||||||||||||||||||||
| Term borrowings: | ||||||||||||||||||||
| Par | N/A | N/A | $ |
|
||||||||||||||||
| Cumulative fair value hedging adjustments | N/A | N/A |
(
|
|||||||||||||||||
| Unamortized premium (discount) and issuance costs | N/A | N/A |
(
|
|||||||||||||||||
| Total carrying value | N/A | N/A | $ |
|
||||||||||||||||
The following table summarizes gains (losses) on FHN’s derivatives associated with interest rate risk management activities for the years ended December 31, 2020, 2019, and 2018:
| Year Ended December 31, | ||||||||||||||||||||
| 2020 | 2019 | 2018 | ||||||||||||||||||
| (Dollars in millions) | Gains (Losses) | Gains (Losses) | Gains (Losses) | |||||||||||||||||
| Customer Interest Rate Contracts Hedging | ||||||||||||||||||||
| Hedging Instruments and Hedged Items: | ||||||||||||||||||||
| Customer interest rate contracts (a) | $ |
|
$ |
|
$ |
|
||||||||||||||
| Offsetting upstream interest rate contracts (a) |
(
|
(
|
(
|
|||||||||||||||||
| Debt Hedging | ||||||||||||||||||||
| Hedging Instruments: | ||||||||||||||||||||
| Interest rate swaps (b) | $ |
|
$ |
|
$ |
(
|
||||||||||||||
| Hedged Items: | ||||||||||||||||||||
| Term borrowings (a) (c) |
(
|
(
|
|
|||||||||||||||||
(a)
Gains (losses) included in Other expense within the Consolidated Statements of Income.
(b)
Gains (losses) included in Interest expense.
(c)
Represents gains and losses attributable to changes in fair value due to interest rate risk as designated in ASC 815-20 hedging relationships.
Cash Flow Hedges
FHN has outstanding pay floating, receive fixed interest rate swaps designed to manage its exposure to the variability in cash flows related to interest
payments on debt instruments, which primarily consist of held-to-maturity trust preferred loans. In conjunction with the IBKC merger, FHN acquired interest rate contracts (floors and collars) which have been re-designated as cash flow hedges. The debt instruments primarily consist of held-to-maturity
|
FIRST HORIZON CORPORATION
|
204
|
2020 FORM 10-K ANNUAL REPORT | ||||||
commercial loans that have variable interest payments based on 1-month LIBOR.
In a cash flow hedge, the entire change in the fair value of the interest rate swap included in the
assessment of hedge effectiveness is initially recorded in OCI and is subsequently reclassified from OCI to current period earnings (interest income or interest expense) in the same period that the hedged item affects earnings.
The following tables summarize FHN’s derivative activities associated with cash flow hedges as of December 31, 2020 and 2019:
| December 31, 2020 | ||||||||||||||||||||
| (Dollars in millions) | Notional | Assets | Liabilities | |||||||||||||||||
| Cash Flow Hedges | ||||||||||||||||||||
| Hedging Instruments: | ||||||||||||||||||||
| Interest rate contracts | $ |
|
$ |
|
$ |
|
||||||||||||||
| Hedged Items: | ||||||||||||||||||||
| Variability in cash flows related to debt instruments (primarily loans) | N/A | $ |
|
N/A | ||||||||||||||||
| December 31, 2019 | ||||||||||||||||||||
| (Dollars in millions) | Notional | Assets | Liabilities | |||||||||||||||||
| Cash Flow Hedges | ||||||||||||||||||||
| Hedging Instruments: | ||||||||||||||||||||
| Interest rate contracts | $ |
|
N/A | $ |
|
|||||||||||||||
| Hedged Items: | ||||||||||||||||||||
| Variability in cash flows related to debt instruments (primarily loans) | N/A | $ |
|
N/A | ||||||||||||||||
The following table summarizes gains (losses) on FHN’s derivatives associated with cash flow hedges for the years ended December 31, 2020, 2019, and 2018:
| Year Ended December 31, | ||||||||||||||||||||
| 2020 | 2019 | 2018 | ||||||||||||||||||
| (Dollars in millions) | Gains (Losses) | Gains (Losses) | Gains (Losses) | |||||||||||||||||
| Cash Flow Hedges | ||||||||||||||||||||
| Hedging Instruments: | ||||||||||||||||||||
| Interest rate contracts (a) | $ |
|
$ |
|
$ |
(
|
||||||||||||||
| Gain (loss) recognized in Other comprehensive income (loss) |
|
|
(
|
|||||||||||||||||
| Gain (loss) reclassified from AOCI into Interest income |
(
|
|
|
|||||||||||||||||
(a)
Approximately $
28
million of pre-tax gains are expected to be reclassified into earnings in the next twelve months.
Other Derivatives
As part of the merger with IBKC, FHN acquired mortgage banking operations that include the origination and sale of loans into the secondary market. As part of the origination of loans, FHN enters into interest rate lock commitments with borrowers.
Additionally, FHN enters into forward sales contracts with buyers for delivery of loans at a future date. Both of these contracts qualify as freestanding derivatives and are recognized at fair value through earnings.
The notional and fair values of these contracts are presented in the table below. Balances and activity for periods prior to the IBKC merger were not significant.
|
FIRST HORIZON CORPORATION
|
205
|
2020 FORM 10-K ANNUAL REPORT | ||||||
| December 31, 2020 | ||||||||||||||||||||
| (Dollars in millions) | Notional | Assets | Liabilities | |||||||||||||||||
| Mortgage Banking Hedges | ||||||||||||||||||||
| Option contracts written | $ |
|
$ |
|
$ |
|
||||||||||||||
| Forward contracts purchased |
|
|
|
|||||||||||||||||
The following table summarizes gains (losses) on FHN's derivatives associated with mortgage banking activities for the year ended December 31, 2020.
|
Year Ended
December 31, |
|||||||||||
| 2020 | |||||||||||
| (Dollars in millions) | Gains (Losses) | ||||||||||
| Mortgage Banking Hedges | |||||||||||
| Option contracts written | $ |
|
|||||||||
| Forward contracts purchased |
(
|
||||||||||
In conjunction with the sales of a portion of its Visa Class B shares in 2010 and 2011, FHN and the purchaser entered into derivative transactions whereby FHN will make or receive cash payments whenever the conversion ratio of the Visa Class B shares into Visa Class A shares is adjusted. FHN is also required to make periodic financing payments to the purchasers until all of Visa's covered litigation matters are resolved. In third quarter 2018, FHN sold the remainder of its Visa Class B shares, entering into a similar derivative arrangement with the counterparty. All of these derivatives extend until the end of Visa’s Covered Litigation matters. In September 2018, Visa reached a preliminary settlement for one class of plaintiffs in its Payment Card Interchange matter, which later received final court approval in December 2019. In accordance with the agreement terms, several individual plaintiffs opted out of the settlement and have the opportunity to separately pursue resolution with Visa. Settlement has not been reached with the second class of plaintiffs in this matter and other covered litigation matters are also pending judicial resolution. Accordingly, the value and timing for completion of Visa’s Covered Litigation matters are uncertain.
The derivative transaction executed in third quarter 2018 includes a contingent accelerated termination clause based on the credit ratings of FHN and First Horizon Bank. FHN has not received or paid collateral related to this contract.
As of December 31, 2020 and December 31, 2019, the derivative liabilities associated with the sales of Visa Class B shares were $
13
million and $
23
million, respectively. See Note 24 - Fair Value of Assets and Liabilities for discussion of the valuation inputs and processes for these Visa-related derivatives.
FHN utilizes cross currency swaps and cross currency interest rate swaps to economically hedge its exposure to foreign currency risk and interest rate risk associated with non-U.S. dollar denominated loans. As of December 31, 2020 and December 31, 2019, these loans were valued at $
12
million and $
18
million, respectively. The balance sheet amount and the gains/losses associated with these derivatives were not significant.
Related to its loan participation/syndication activities, FHN enters into risk participation agreements, under which it assumes exposure for, or receives indemnification for, borrowers’ performance on underlying interest rate derivative contracts. FHN’s counterparties in these contracts are other lending institutions involved in the loan participation/syndication arrangements for which the underlying interest rate derivative contract is intended to hedge interest rate risk for the borrower. FHN will make (other institution is the lead bank) or receive (FHN is the lead bank) payments for risk participations if the borrower defaults on its obligation to perform under the terms of its interest rate derivative agreement with the lead bank in the participation. As of December 31, 2020, the notional values of FHN’s risk participations were $
233
million of derivative assets and $
464
million of derivative liabilities. The notional value for risk participation/syndication agreements is consistent with the percentage of participation in the lending arrangement. FHN’s maximum exposure or benefit in the risk participation agreements is contingent on the fair value of the underlying interest rate derivative contracts for which the borrower is in a liability position at the time of default. FHN monitors the credit risk associated with the borrowers to which the risk participations relate through the same credit risk assessment process utilized for establishing
|
FIRST HORIZON CORPORATION
|
206
|
2020 FORM 10-K ANNUAL REPORT | ||||||
credit loss estimates for its loan portfolio. These credit risk estimates are included in the determination of fair value for the risk participations. As of December 31, 2020, FHN had recognized $
280
thousand of derivative assets and $
820
thousand of derivative liabilities associated with risk participation agreements.
In conjunction with the IBKC merger, FHN obtained certain certificates of deposit with the rate of return based on an equity index which is considered an embedded derivative as a written option that must be separately recognized. The risks of the written option are offset by purchasing an option with terms that mirror the written option, which is also carried at fair value on the Company’s Consolidated Balance Sheets. As of December 31, 2020, FHN had recognized $
1
million of both assets and liabilities associated with these contracts.
Master Netting and Similar Agreements
FHN uses master netting agreements, mutual margining agreements and collateral posting requirements to minimize credit risk on derivative contracts. Master netting and similar agreements are used when counterparties have multiple derivatives contracts that allow for a “right of setoff,” meaning that a counterparty may net offsetting positions and collateral with the same counterparty under the contract to determine a net receivable or payable. The following discussion provides an overview of these arrangements which may vary due to the derivative type and market in which a derivative transaction is executed.
Interest rate derivatives are subject to agreements consistent with standard agreement forms of the ISDA. Currently, all interest rate derivative contracts are entered into as over-the-counter transactions and collateral posting requirements are based on the net asset or liability position with each respective counterparty. For contracts that require central clearing, novation to a counterparty with access to a clearinghouse occurs and initial margin is posted. Cash margin received (posted) that is considered settlements for the derivative contracts is included in the respective derivative asset (liability) value. Cash margin that is considered collateral received (posted) for interest rate derivatives is recognized as a liability (asset) on FHN’s Consolidated Balance Sheet.
Interest rate derivatives with clients that are smaller financial institutions typically require posting of collateral by the counterparty to FHN. This collateral is subject to a threshold with daily adjustments based upon changes in the level or fair value of the derivative position. Positions and related collateral
can be netted in the event of default. Collateral pledged by a counterparty is typically cash or securities. The securities pledged as collateral are not recognized within FHN’s Consolidated Balance Sheets. Interest rate derivatives associated with lending arrangements share the collateral with the related loan(s). The derivative and loan positions may be netted in the event of default. For disclosure purposes, the entire collateral amount is allocated to the loan.
The net fair value, determined by individual counterparty, of all derivative instruments with adjustable collateral posting thresholds was $
200
million of assets and $
5
million of liabilities on December 31, 2020, and $
63
million of assets and $
6
million of liabilities on December 31, 2019. As of December 31, 2020 and 2019, FHN had received collateral of $
320
million and $
149
million and posted collateral of $
34
million and $
18
million, respectively, in the normal course of business related to these agreements.
Certain agreements entered into prior to required central clearing also contain accelerated termination provisions, inclusive of the right of offset, if a counterparty’s credit rating falls below a specified level. If a counterparty’s debt rating (including FHN’s and First Horizon Bank's) were to fall below these minimums, these provisions would be triggered, and the counterparties could terminate the agreements and require immediate settlement of all derivative contracts under the agreements. The net fair value, determined by individual counterparty, of all interest rate derivative instruments with credit-risk-related contingent accelerated termination provisions was $
216
million of assets and $
17
million of liabilities on December 31, 2020, and $
63
million of assets and $
10
million of liabilities on December 31, 2019. As of December 31, 2020 and 2019, FHN had received collateral of $
343
million and $
149
million and posted collateral of $
53
million and $
23
million, respectively, in the normal course of business related to these contracts.
FHNF buys and sells various types of securities for its clients. When these securities settle on a delayed basis, they are considered forward contracts, and are generally not subject to master netting agreements. For futures and options, FHN transacts through a third party, and the transactions are subject to margin and collateral maintenance requirements. In the event of default, open positions can be offset along with the associated collateral.
For this disclosure, FHN considers the impact of master netting and other similar agreements which
|
FIRST HORIZON CORPORATION
|
207
|
2020 FORM 10-K ANNUAL REPORT | ||||||
allow FHN to settle all contracts with a single counterparty on a net basis and to offset the net derivative asset or liability position with the related securities and cash collateral. The application of the
collateral cannot reduce the net derivative asset or liability position below zero, and therefore any excess collateral is not reflected in the following tables.
The following table provides details of derivative assets and collateral received as presented on the Consolidated Balance Sheets as of December 31, 2020 and 2019:
|
Gross amounts not
offset in the Balance Sheets |
||||||||||||||||||||||||||||||||||||||
| (Dollars in millions) |
Gross amounts
of recognized assets |
Gross amounts
offset in the Balance Sheets |
Net amounts of
assets presented in the Balance Sheets (a) |
Derivative liabilities
available for offset |
Collateral
received |
Net amount | ||||||||||||||||||||||||||||||||
| Derivative assets: | ||||||||||||||||||||||||||||||||||||||
| December 31, 2020 | ||||||||||||||||||||||||||||||||||||||
| Interest rate derivative contracts | $ |
|
$ |
|
$ |
|
$ |
(
|
$ |
(
|
$ |
|
||||||||||||||||||||||||||
| Forward contracts |
|
|
|
(
|
(
|
|
||||||||||||||||||||||||||||||||
| $ |
|
$ |
|
$ |
|
$ |
(
|
$ |
(
|
$ |
|
|||||||||||||||||||||||||||
| December 31, 2019 | ||||||||||||||||||||||||||||||||||||||
| Interest rate derivative contracts | $ |
|
$ |
|
$ |
|
$ |
(
|
$ |
(
|
$ |
|
||||||||||||||||||||||||||
| Forward contracts |
|
|
|
(
|
(
|
|
||||||||||||||||||||||||||||||||
| $ |
|
$ |
|
$ |
|
$ |
(
|
$ |
(
|
$ |
|
|||||||||||||||||||||||||||
(a)
Included in Other assets on the Consolidated Balance Sheets. As of December 31, 2020 and 2019, $
4
million and $
0.1
million, respectively, of derivative assets have been excluded from these tables because they are generally not subject to master netting or similar agreements.
|
FIRST HORIZON CORPORATION
|
208
|
2020 FORM 10-K ANNUAL REPORT | ||||||
The following table provides details of derivative liabilities and collateral pledged as presented on the Consolidated Balance Sheets as of December 31, 2020 and 2019:
|
Gross amounts not offset
in the Balance Sheets |
||||||||||||||||||||||||||||||||||||||
| (Dollars in millions) |
Gross amounts
of recognized liabilities |
Gross
amounts offset in the Balance Sheets |
Net amounts of
liabilities presented in the Balance Sheets (a) |
Derivative assets
available for offset |
Collateral
pledged |
Net amount | ||||||||||||||||||||||||||||||||
| Derivative liabilities: | ||||||||||||||||||||||||||||||||||||||
| December 31, 2020 | ||||||||||||||||||||||||||||||||||||||
| Interest rate derivative contracts | $ |
|
$ |
|
$ |
|
$ |
(
|
$ |
(
|
$ |
|
||||||||||||||||||||||||||
| Forward contracts |
|
|
|
(
|
(
|
|
||||||||||||||||||||||||||||||||
| $ |
|
$ |
|
$ |
|
$ |
(
|
$ |
(
|
$ |
|
|||||||||||||||||||||||||||
| December 31, 2019 | ||||||||||||||||||||||||||||||||||||||
| Interest rate derivative contracts | $ |
|
$ |
|
$ |
|
$ |
(
|
$ |
(
|
$ |
|
||||||||||||||||||||||||||
| Forward contracts |
|
|
|
(
|
(
|
|
||||||||||||||||||||||||||||||||
| $ |
|
$ |
|
$ |
|
$ |
(
|
$ |
(
|
$ |
|
|||||||||||||||||||||||||||
(a)
Included in Other liabilities on the Consolidated Balance Sheets. As of December 31, 2020 and 2019, $
22
million and $
23
million, respectively, of derivative liabilities (primarily Visa-related derivatives) have been excluded from these tables because they are generally not subject to master netting or similar agreements.
|
FIRST HORIZON CORPORATION
|
209
|
2020 FORM 10-K ANNUAL REPORT | ||||||
Note 23 -
Master Netting and Similar Agreements - Repurchase, Reverse Repurchase, and Securities Borrowing Transactions
For repurchase, reverse repurchase and securities borrowing transactions, FHN and each counterparty have the ability to offset all open positions and related collateral in the event of default. Due to the nature of these transactions, the value of the collateral for each transaction approximates the value of the corresponding receivable or payable. For repurchase agreements through FHN’s fixed income business (securities purchased under agreements to resell and securities sold under agreements to repurchase), transactions are collateralized by securities and/or government guaranteed loans which are delivered on the settlement date and are maintained throughout the term of the transaction. For FHN’s repurchase agreements through banking activities (securities sold under agreements to repurchase), securities are typically pledged at settlement and not released until maturity. For asset positions, the collateral is not included on FHN’s Consolidated Balance Sheets. For
liability positions, securities collateral pledged by FHN is generally represented within FHN’s trading or available-for-sale securities portfolios.
For this disclosure, FHN considers the impact of master netting and other similar agreements that allow FHN to settle all contracts with a single counterparty on a net basis and to offset the net asset or liability position with the related securities collateral. The application of the collateral cannot reduce the net asset or liability position below zero, and therefore any excess collateral is not reflected in the tables below.
Securities purchased under agreements to resell is included in Federal funds sold and securities purchased under agreements to resell in the Consolidated Balance Sheets. Securities sold under agreements to repurchase is included in Short-term borrowings.
The following table provides details of securities purchased under agreements to resell and collateral pledged by counterparties as of December 31:
|
Gross amounts not offset in the
Balance Sheets |
||||||||||||||||||||||||||||||||||||||
| (Dollars in millions) |
Gross amounts
of recognized assets |
Gross amounts
offset in the Balance Sheets |
Net amounts of
assets presented in the Balance Sheets |
Offsetting
securities sold under agreements to repurchase |
Securities collateral
(not recognized on FHN’s Balance Sheets) |
Net amount | ||||||||||||||||||||||||||||||||
| Securities purchased under agreements to resell: | ||||||||||||||||||||||||||||||||||||||
| 2020 | $ |
|
$ |
|
$ |
|
$ |
|
$ |
(
|
$ |
|
||||||||||||||||||||||||||
| 2019 |
|
|
|
(
|
(
|
|
||||||||||||||||||||||||||||||||
The following table provides details of securities sold under agreements to repurchase and collateral pledged by FHN as of December 31:
|
Gross amounts not offset in the
Balance Sheets |
||||||||||||||||||||||||||||||||||||||
| (Dollars in millions) |
Gross amounts
of recognized liabilities |
Gross amounts
offset in the Balance Sheets |
Net amounts of
liabilities presented in the Balance Sheets |
Offsetting
securities purchased under agreements to resell |
Securities/
government guaranteed loans collateral |
Net amount | ||||||||||||||||||||||||||||||||
| Securities sold under agreements to repurchase: | ||||||||||||||||||||||||||||||||||||||
| 2020 | $ |
|
$ |
|
$ |
|
$ |
|
$ |
(
|
$ |
|
||||||||||||||||||||||||||
| 2019 |
|
|
|
(
|
(
|
|
||||||||||||||||||||||||||||||||
|
FIRST HORIZON CORPORATION
|
210
|
2020 FORM 10-K ANNUAL REPORT | ||||||
Note 23 - Master Netting and Similar Agreements - Repurchase, Reverse Repurchase, and Securities Borrowing Transactions (Continued)
Due to the short duration of securities sold under agreements to repurchase and the nature of collateral involved, the risks associated with these transactions are considered minimal.
The following tables provide
| December 31, 2020 | |||||||||||||||||
| (Dollars in millions) |
Overnight and
Continuous |
Up to 30 Days | Total | ||||||||||||||
| Securities sold under agreements to repurchase: | |||||||||||||||||
| U.S. treasuries | $ |
|
$ |
|
$ |
|
|||||||||||
| Government agency issued MBS |
|
|
|
||||||||||||||
| Government agency issued CMO |
|
|
|
||||||||||||||
| Other U.S. government agencies |
|
|
|
||||||||||||||
| Government guaranteed loans (SBA and USDA) |
|
|
|
||||||||||||||
| Total securities sold under agreements to repurchase | $ |
|
$ |
|
$ |
|
|||||||||||
| December 31, 2019 | |||||||||||||||||
| (Dollars in millions) |
Overnight and
Continuous |
Up to 30 Days | Total | ||||||||||||||
| Securities sold under agreements to repurchase: | |||||||||||||||||
| U.S. treasuries | $ |
|
$ |
|
$ |
|
|||||||||||
| Government agency issued MBS |
|
|
|
||||||||||||||
| Other U.S. government agencies |
|
|
|
||||||||||||||
| Government guaranteed loans (SBA and USDA) |
|
|
|
||||||||||||||
| Total securities sold under agreements to repurchase | $ |
|
$ |
|
$ |
|
|||||||||||
|
FIRST HORIZON CORPORATION
|
211
|
2020 FORM 10-K ANNUAL REPORT | ||||||
Note 24 -
Fair Value of Assets and Liabilities
FHN groups its assets and liabilities measured at fair value in three levels, based on the markets in which the assets and liabilities are traded and the reliability of the assumptions used to determine fair value. This hierarchy requires FHN to maximize the use of observable market data, when available, and to minimize the use of unobservable inputs when determining fair value. Each fair value measurement is placed into the proper level based on the lowest level of significant input. These levels are:
•
Level 1—Valuation is based upon quoted prices for identical instruments traded in active markets.
•
Level 2—Valuation is based upon quoted prices for similar instruments in active
•
markets, quoted prices for identical or similar instruments in markets that are not active, and model-based valuation techniques for which all significant assumptions are observable in the market.
•
Level 3—Valuation is generated from model-based techniques that use significant assumptions not observable in the market. These unobservable assumptions reflect management’s estimates of assumptions that market participants would use in pricing the asset or liability. Valuation techniques include use of option pricing models, discounted cash flow models, and similar techniques.
|
FIRST HORIZON CORPORATION
|
212
|
2020 FORM 10-K ANNUAL REPORT | ||||||
Recurring Fair Value Measurements
The following tables present the balances of assets and liabilities measured at fair value on a recurring basis as of December 31, 2020 and 2019:
| December 31, 2020 | ||||||||||||||||||||||||||
| (Dollars in millions) | Level 1 | Level 2 | Level 3 | Total | ||||||||||||||||||||||
| Trading securities: | ||||||||||||||||||||||||||
| U.S. treasuries | $ |
|
$ |
|
$ |
|
$ |
|
||||||||||||||||||
| Government agency issued MBS |
|
|
|
|
||||||||||||||||||||||
| Government agency issued CMO |
|
|
|
|
||||||||||||||||||||||
| Other U.S. government agencies |
|
|
|
|
||||||||||||||||||||||
| States and municipalities |
|
|
|
|
||||||||||||||||||||||
| Corporate and other debt |
|
|
|
|
||||||||||||||||||||||
| Total trading securities |
|
|
|
|
||||||||||||||||||||||
| Loans held for sale (elected fair value) |
|
|
|
|
||||||||||||||||||||||
| Loans held for investment (elected fair value) |
|
|
|
|
||||||||||||||||||||||
| Securities available for sale: | ||||||||||||||||||||||||||
| U.S. treasuries |
|
|
|
|
||||||||||||||||||||||
| Government agency issued MBS |
|
|
|
|
||||||||||||||||||||||
| Government agency issued CMO |
|
|
|
|
||||||||||||||||||||||
| Other U.S. government agencies |
|
|
|
|
||||||||||||||||||||||
| States and municipalities |
|
|
|
|
||||||||||||||||||||||
| Corporate and other debt |
|
|
|
|
||||||||||||||||||||||
| Interest-only strips (elected fair value) |
|
|
|
|
||||||||||||||||||||||
| Total securities available for sale |
|
|
|
|
||||||||||||||||||||||
| Other assets: | ||||||||||||||||||||||||||
| Deferred compensation mutual funds |
|
|
|
|
||||||||||||||||||||||
| Equity, mutual funds, and other |
|
|
|
|
||||||||||||||||||||||
| Derivatives, forwards and futures |
|
|
|
|
||||||||||||||||||||||
| Derivatives, interest rate contracts |
|
|
|
|
||||||||||||||||||||||
| Derivatives, other |
|
|
|
|
||||||||||||||||||||||
| Total other assets |
|
|
|
|
||||||||||||||||||||||
| Total assets | $ |
|
$ |
|
$ |
|
$ |
|
||||||||||||||||||
| Trading liabilities: | ||||||||||||||||||||||||||
| U.S. treasuries | $ |
|
$ |
|
$ |
|
$ |
|
||||||||||||||||||
| Government issued agency MBS |
|
|
|
|
||||||||||||||||||||||
| Corporate and other debt |
|
|
|
|
||||||||||||||||||||||
| Total trading liabilities |
|
|
|
|
||||||||||||||||||||||
| Other liabilities: | ||||||||||||||||||||||||||
| Derivatives, forwards and futures |
|
|
|
|
||||||||||||||||||||||
| Derivatives, interest rate contracts |
|
|
|
|
||||||||||||||||||||||
| Derivatives, other |
|
|
|
|
||||||||||||||||||||||
| Total other liabilities |
|
|
|
|
||||||||||||||||||||||
| Total liabilities | $ |
|
$ |
|
$ |
|
$ |
|
||||||||||||||||||
|
FIRST HORIZON CORPORATION
|
213
|
2020 FORM 10-K ANNUAL REPORT | ||||||
| December 31, 2019 | ||||||||||||||||||||||||||
| (Dollars in millions) | Level 1 | Level 2 | Level 3 | Total | ||||||||||||||||||||||
| Trading securities: | ||||||||||||||||||||||||||
| U.S. treasuries | $ |
|
$ |
|
$ |
|
$ |
|
||||||||||||||||||
| Government agency issued MBS |
|
|
|
|
||||||||||||||||||||||
| Government agency issued CMO |
|
|
|
|
||||||||||||||||||||||
| Other U.S. government agencies |
|
|
|
|
||||||||||||||||||||||
| States and municipalities |
|
|
|
|
||||||||||||||||||||||
| Corporate and other debt |
|
|
|
|
||||||||||||||||||||||
| Equity, mutual funds, and other |
|
|
|
|
||||||||||||||||||||||
| Total trading securities |
|
|
|
|
||||||||||||||||||||||
| Trading securities—mortgage banking |
|
|
|
|
||||||||||||||||||||||
| Loans held for sale (elected fair value) |
|
|
|
|
||||||||||||||||||||||
| Securities available for sale: | ||||||||||||||||||||||||||
| Government agency issued MBS |
|
|
|
|
||||||||||||||||||||||
| Government agency issued CMO |
|
|
|
|
||||||||||||||||||||||
| Other U.S. government agencies |
|
|
|
|
||||||||||||||||||||||
| States and municipalities |
|
|
|
|
||||||||||||||||||||||
| Corporate and other debt |
|
|
|
|
||||||||||||||||||||||
| Interest-only strips (elected fair value) |
|
|
|
|
||||||||||||||||||||||
| Total securities available for sale |
|
|
|
|
||||||||||||||||||||||
| Other assets: | ||||||||||||||||||||||||||
| Deferred compensation mutual funds |
|
|
|
|
||||||||||||||||||||||
| Equity, mutual funds, and other |
|
|
|
|
||||||||||||||||||||||
| Derivatives, forwards and futures |
|
|
|
|
||||||||||||||||||||||
| Derivatives, interest rate contracts |
|
|
|
|
||||||||||||||||||||||
| Total other assets |
|
|
|
|
||||||||||||||||||||||
| Total assets | $ |
|
$ |
|
$ |
|
$ |
|
||||||||||||||||||
| Trading liabilities: | ||||||||||||||||||||||||||
| U.S. treasuries | $ |
|
$ |
|
$ |
|
$ |
|
||||||||||||||||||
| Corporates and other debt |
|
|
|
|
||||||||||||||||||||||
| Total trading liabilities |
|
|
|
|
||||||||||||||||||||||
| Other liabilities: | ||||||||||||||||||||||||||
| Derivatives, forwards and futures |
|
|
|
|
||||||||||||||||||||||
| Derivatives, interest rate contracts |
|
|
|
|
||||||||||||||||||||||
| Derivatives, other |
|
|
|
|
||||||||||||||||||||||
| Total other liabilities |
|
|
|
|
||||||||||||||||||||||
| Total liabilities | $ |
|
$ |
|
$ |
|
$ |
|
||||||||||||||||||
|
FIRST HORIZON CORPORATION
|
214
|
2020 FORM 10-K ANNUAL REPORT | ||||||
Changes in Recurring Level 3 Fair Value Measurements
The changes in Level 3 assets and liabilities measured at fair value for the years ended December 31, 2020, 2019 and 2018 on a recurring basis are summarized as follows:
| Year Ended December 31, 2020 | |||||||||||||||||||||||||||||||||||
| (Dollars in millions) |
Trading
securities |
Interest-only strips- AFS | Loans held for sale | Loans held for investment |
Net derivative
liabilities |
||||||||||||||||||||||||||||||
| Balance on January 1, 2020 | $ |
|
$ |
|
$ |
|
$ |
|
$ |
(
|
|||||||||||||||||||||||||
| Acquired |
|
|
|
|
|
||||||||||||||||||||||||||||||
| Total net gains (losses) included in net income |
(
|
(
|
|
|
(
|
||||||||||||||||||||||||||||||
| Purchases |
|
|
|
|
|
||||||||||||||||||||||||||||||
| Sales |
|
(
|
|
(
|
|
||||||||||||||||||||||||||||||
| Settlements |
|
|
(
|
(
|
|
||||||||||||||||||||||||||||||
| Net transfers into (out of) Level 3 |
|
|
(b) |
|
|
|
|||||||||||||||||||||||||||||
| Balance on December 31, 2020 | $ |
|
$ |
|
$ |
|
$ |
|
$ |
(
|
|||||||||||||||||||||||||
| Net unrealized gains (losses) included in net income | $ |
|
(a) | $ |
(
|
(c) | $ |
|
(a) | $ |
|
$ |
(
|
(d) | |||||||||||||||||||||
| Year Ended December 31, 2019 | |||||||||||||||||||||||||||||
| (Dollars in millions) |
Trading
securities |
Interest-only strips- AFS | Loans held for sale |
Net derivative
liabilities |
|||||||||||||||||||||||||
| Balance on January 1, 2019 | $ |
|
$ |
|
$ |
|
$ |
(
|
|||||||||||||||||||||
| Total net gains (losses) included in net income |
|
(
|
|
(
|
|||||||||||||||||||||||||
| Purchases |
|
|
|
|
|||||||||||||||||||||||||
| Sales |
|
(
|
|
|
|||||||||||||||||||||||||
| Settlements |
(
|
|
(
|
|
|||||||||||||||||||||||||
| Net transfers into (out of) Level 3 |
|
|
(b) |
|
|
||||||||||||||||||||||||
| Balance on December 31, 2019 | $ |
|
$ |
|
$ |
|
$ |
(
|
|||||||||||||||||||||
| Net unrealized gains (losses) included in net income | $ |
|
(a) | $ |
(
|
(c) | $ |
|
(a) | $ |
(
|
(d) | |||||||||||||||||
| Year Ended December 31, 2018 | |||||||||||||||||||||||||||||
| (Dollars in millions) |
Trading
securities |
Interest-only strips- AFS | Loans held for sale |
Net derivative
liabilities |
|||||||||||||||||||||||||
| Balance on January 1, 2018 | $ |
|
$ |
|
$ |
|
$ |
(
|
|||||||||||||||||||||
| Total net gains (losses) included in net income |
|
|
|
(
|
|||||||||||||||||||||||||
| Purchases |
|
|
|
(
|
(e) | ||||||||||||||||||||||||
| Sales |
|
(
|
|
|
|||||||||||||||||||||||||
| Settlements |
(
|
|
(
|
|
|||||||||||||||||||||||||
| Net transfers into (out of) Level 3 |
|
|
(b) |
|
|
||||||||||||||||||||||||
| Balance on December 31, 2018 | $ |
|
$ |
|
$ |
|
$ |
(
|
|||||||||||||||||||||
| Net unrealized gains (losses) included in net income | $ |
|
(a) | $ |
(
|
(c) | $ |
|
(a) | $ |
(
|
(d) | |||||||||||||||||
(a)
Primarily included in mortgage banking and title income on the Consolidated Statements of Income.
(b)
Transfers into interest-only strips - AFS level 3 measured on a recurring basis reflect movements from loans held for sale (Level 2 nonrecurring).
(c)
Primarily included in fixed income on the Consolidated Statements of Income.
(d)
Included in Other expense.
(e)
Increase related to Visa-related derivatives, see Note 22-Derivatives.
There were
no
net unrealized gains (losses) for Level 3 assets and liabilities included in other
comprehensive income as of December 31, 2020, 2019 and 2018.
|
FIRST HORIZON CORPORATION
|
215
|
2020 FORM 10-K ANNUAL REPORT | ||||||
Nonrecurring Fair Value Measurements
From time to time, FHN may be required to measure certain other financial assets at fair value on a nonrecurring basis in accordance with GAAP. These adjustments to fair value usually result from the application of lower of cost or market (“LOCOM”) accounting or write-downs of individual assets.
For
assets measured at fair value on a nonrecurring basis which were still held on the Consolidated Balance Sheets at December 31, 2020, 2019 and 2018, respectively, the following tables provide the level of valuation assumptions used to determine each adjustment and the related carrying value.
| Carrying value at December 31, 2020 | Year Ended December 31, 2020 | |||||||||||||||||||||||||||||||
| (Dollars in millions) | Level 1 | Level 2 | Level 3 | Total | Net gains (losses) | |||||||||||||||||||||||||||
| Loans held for sale—SBAs and USDA | $ |
|
$ |
|
$ |
|
$ |
|
$ |
(
|
||||||||||||||||||||||
| Loans held for sale—first mortgages |
|
|
|
|
|
|||||||||||||||||||||||||||
| Loans and leases (a) |
|
|
|
|
(
|
|||||||||||||||||||||||||||
| OREO (b) |
|
|
|
|
(
|
|||||||||||||||||||||||||||
| Other assets (c) |
|
|
|
|
(
|
|||||||||||||||||||||||||||
| $ |
(
|
|||||||||||||||||||||||||||||||
| Carrying value at December 31, 2019 | Year Ended December 31, 2019 | |||||||||||||||||||||||||||||||
| (Dollars in millions) | Level 1 | Level 2 | Level 3 | Total | Net gains (losses) | |||||||||||||||||||||||||||
| Loans held for sale—SBAs and USDA | $ |
|
$ |
|
$ |
|
$ |
|
$ |
(
|
||||||||||||||||||||||
| Loans held for sale—first mortgages |
|
|
|
|
|
|||||||||||||||||||||||||||
| Loans and leases (a) |
|
|
|
|
(
|
|||||||||||||||||||||||||||
| OREO (b) |
|
|
|
|
(
|
|||||||||||||||||||||||||||
| Other assets (c) |
|
|
|
|
(
|
|||||||||||||||||||||||||||
| $ |
(
|
|||||||||||||||||||||||||||||||
| Carrying value at December 31, 2018 | Year Ended December 31, 2018 | |||||||||||||||||||||||||||||||
| (Dollars in millions) | Level 1 | Level 2 | Level 3 | Total | Net gains (losses) | |||||||||||||||||||||||||||
| Loans held for sale—other consumer | $ |
|
$ |
|
$ |
|
$ |
|
$ |
(
|
||||||||||||||||||||||
| Loans held for sale—SBAs and USDA |
|
|
|
|
(
|
|||||||||||||||||||||||||||
| Loans held for sale—first mortgages |
|
|
|
|
|
|||||||||||||||||||||||||||
| Loans and leases (a) |
|
|
|
|
(
|
|||||||||||||||||||||||||||
| OREO (b) |
|
|
|
|
(
|
|||||||||||||||||||||||||||
| Other assets (c) |
|
|
|
|
(
|
|||||||||||||||||||||||||||
| $ |
(
|
|||||||||||||||||||||||||||||||
(a)
Represents carrying value of loans for which adjustments are required to be based on the appraised value of the collateral less estimated costs to sell. Write-downs on these loans are recognized as part of provision for credit losses.
(b)
Represents the fair value and related losses of foreclosed properties that were measured subsequent to their initial classification as OREO. Balance excludes OREO related to government insured mortgages.
(c)
Represents tax credit investments accounted for under the equity method.
In 2020, FHN recognized $
7
million of fixed asset impairments and $
6
million of impairments for lease assets primarily related to continuing merger and acquisition integration efforts associated with reduction of leased office space and branch optimization. These amounts were primarily recognized in the Corporate segment.
In 2019, FHN recognized $
5
million of impairments and $
1
million of impairment reversals, respectively, related to dispositions of acquired properties and $
2
million of impairments for lease assets related to continuing acquisition integration efforts associated with reduction of leased office space and branch optimization. Related to its restructuring,
|
FIRST HORIZON CORPORATION
|
216
|
2020 FORM 10-K ANNUAL REPORT | ||||||
repositioning, and efficiency efforts, FHN recognized $
14
million of impairments and $
1
million of impairment reversals, respectively, for tangible long-lived assets and lease assets. Related to its rebranding initiative, FHN recognized $
7
million of impairments for long-lived tangible assets, primarily signage, related to FHN's rebranding initiative. These amounts were recognized in the Corporate segment.
In 2018, FHN recognized $
4
million of impairments of long-lived assets primarily related to optimization efforts for its facilities. Also, in 2018, $
2
million of impairment charges previously recognized in 2017 in the Corporate segment were reversed based on the disposition prices for the applicable locations.
Lease asset impairments recognized in 2020 and 2019 represent the reduction in value of the right-of-use assets associated with leases that are being exited in advance of the contractual lease expiration.
Impairments are measured using a discounted cash flow methodology, which is considered a Level 3 valuation.
Impairments of long-lived tangible assets reflect locations where the associated land and building are either owned or leased. The fair values of owned sites were determined using estimated sales prices from appraisals and broker opinions less estimated costs to sell with adjustments upon final disposition. The fair values of owned assets in leased sites (e.g., leasehold improvements) were determined using a discounted cash flow approach, based on the revised estimated useful lives of the related assets. Both measurement methodologies are considered Level 3 valuations. Impairment adjustments recognized upon disposition of a location are considered Level 2 valuations.
|
FIRST HORIZON CORPORATION
|
217
|
2020 FORM 10-K ANNUAL REPORT | ||||||
Level 3 Measurements
The following tables provide information regarding the unobservable inputs utilized in determining the fair value of Level 3 recurring and non-recurring measurements as of December 31, 2020 and 2019:
| (Dollars in millions) | ||||||||||||||||||||||||||||||||
| Values Utilized | ||||||||||||||||||||||||||||||||
| Level 3 Class | Fair Value at December 31, 2020 | Valuation Techniques | Unobservable Input | Range | Weighted Average (d) | |||||||||||||||||||||||||||
| Available for sale securities SBA - interest only strips | $ |
|
Discounted cash flow | Constant prepayment rate |
|
|
||||||||||||||||||||||||||
| Bond equivalent yield |
|
|
||||||||||||||||||||||||||||||
| Loans held for sale - residential real estate | $ |
|
Discounted cash flow | Prepayment speeds - First mortgage |
|
|
||||||||||||||||||||||||||
| Foreclosure losses |
|
|
||||||||||||||||||||||||||||||
| Loss severity trends - First mortgage |
|
|
||||||||||||||||||||||||||||||
| Loans held for sale - unguaranteed interest in SBA loans | $ |
|
Discounted cash flow | Constant prepayment rate |
|
|
||||||||||||||||||||||||||
| Bond equivalent yield |
|
|
||||||||||||||||||||||||||||||
| Loans held for investment | $ |
|
Discounted cash flow | Constant prepayment rate |
|
|
||||||||||||||||||||||||||
| Constant default rate |
|
|
||||||||||||||||||||||||||||||
| Loss severity trends |
|
|
||||||||||||||||||||||||||||||
| Derivative liabilities, other | $ |
|
Discounted cash flow | Visa covered litigation resolution amount |
$
|
$
|
||||||||||||||||||||||||||
| Probability of resolution scenarios |
|
|
||||||||||||||||||||||||||||||
| Time until resolution |
|
|
||||||||||||||||||||||||||||||
| Loans and leases (a) | $ |
|
Appraisals from comparable properties | Marketability adjustments for specific properties |
|
NM | ||||||||||||||||||||||||||
| Other collateral valuations | Borrowing base certificates adjustment |
|
NM | |||||||||||||||||||||||||||||
| Financial Statements/Auction values adjustment |
|
NM | ||||||||||||||||||||||||||||||
| OREO (b) | $ |
|
Appraisals from comparable properties | Adjustment for value changes since appraisal |
|
NM | ||||||||||||||||||||||||||
| Other assets (c) | $ |
|
Discounted cash flow | Adjustments to current sales yields for specific properties |
|
NM | ||||||||||||||||||||||||||
| Appraisals from comparable properties | Marketability adjustments for specific properties |
|
NM | |||||||||||||||||||||||||||||
NM - Not meaningful.
(a)
Represents carrying value of loans for which adjustments are required to be based on the appraised value of the collateral less estimated costs to sell. Write-downs on these loans are recognized as part of provision for credit losses.
(b)
Represents the fair value of foreclosed properties that were measured subsequent to their initial classification as OREO. Balance excludes OREO related to government insured mortgages.
(c)
Represents tax credit investments accounted for under the equity method.
|
FIRST HORIZON CORPORATION
|
218
|
2020 FORM 10-K ANNUAL REPORT | ||||||
(d)
Weighted averages are determined by the relative fair value of the instruments or the relative contribution to an instrument's fair value.
| (Dollars in millions) | ||||||||||||||||||||||||||||||||
| Values Utilized | ||||||||||||||||||||||||||||||||
| Level 3 Class | Fair Value at December 31, 2019 | Valuation Techniques | Unobservable Input | Range | Weighted Average (d) | |||||||||||||||||||||||||||
| Available for sale securities SBA - interest only strips | $ |
|
Discounted cash flow | Constant prepayment rate |
|
|
||||||||||||||||||||||||||
| Bond equivalent yield |
|
|
||||||||||||||||||||||||||||||
| Loans held for sale - residential real estate | $ |
|
Discounted cash flow | Prepayment speeds - First mortgage |
|
|
||||||||||||||||||||||||||
| Prepayment speeds - HELOC |
|
|
||||||||||||||||||||||||||||||
| Foreclosure losses |
|
|
||||||||||||||||||||||||||||||
| Loss severity trends - First mortgage |
|
|
||||||||||||||||||||||||||||||
| Loss severity trends - HELOC |
|
|
||||||||||||||||||||||||||||||
| Loans held for sale - unguaranteed interest in SBA loans | $ |
|
Discounted cash flow | Constant prepayment rate |
|
|
||||||||||||||||||||||||||
| Bond equivalent yield |
|
|
||||||||||||||||||||||||||||||
| Derivative liabilities, other | $ |
|
Discounted cash flow | Visa covered litigation resolution amount |
$
|
$
|
||||||||||||||||||||||||||
| Probability of resolution scenarios |
|
|
||||||||||||||||||||||||||||||
| Time until resolution |
|
|
||||||||||||||||||||||||||||||
| Loans and leases (a) | $ |
|
Appraisals from comparable properties | Marketability adjustments for specific properties |
|
NM | ||||||||||||||||||||||||||
| Other collateral valuations | Borrowing base certificates adjustment |
|
NM | |||||||||||||||||||||||||||||
| Financial Statements/Auction values adjustment |
|
NM | ||||||||||||||||||||||||||||||
| OREO (b) | $ |
|
Appraisals from comparable properties | Adjustment for value changes since appraisal |
|
NM | ||||||||||||||||||||||||||
| Other assets (c) | $ |
|
Discounted cash flow | Adjustments to current sales yields for specific properties |
|
NM | ||||||||||||||||||||||||||
| Appraisals from comparable properties | Marketability adjustments for specific properties |
|
NM | |||||||||||||||||||||||||||||
NM - Not meaningful.
(a)
Represents carrying value of loans for which adjustments are required to be based on the appraised value of the collateral less estimated costs to sell. Write-downs on these loans are recognized as part of provision for credit losses.
(b)
Represents the fair value of foreclosed properties that were measured subsequent to their initial classification as OREO. Balance excludes OREO related to government insured mortgages.
(c)
Represents tax credit investments accounted for under the equity method.
(d)
Weighted averages are determined by the relative fair value of the instruments or the relative contribution to an instrument's fair value.
|
FIRST HORIZON CORPORATION
|
219
|
2020 FORM 10-K ANNUAL REPORT | ||||||
Securities AFS
. Increases (decreases) in estimated prepayment rates and bond equivalent yields negatively (positively) affect the value of SBA interest only strips. Management additionally considers whether the loans underlying related SBA-interest only strips are delinquent, in default or prepaying, and adjusts the fair value down 20 - 100% depending on the length of time in default.
Loans held for sale.
Foreclosure losses and prepayment rates are significant unobservable inputs used in the fair value measurement of FHN’s residential real estate loans held for sale. Loss severity trends are also assessed to evaluate the reasonableness of fair value estimates resulting from discounted cash flows methodologies as well as to estimate fair value for newly repurchased loans and loans that are near foreclosure. Significant increases (decreases) in any of these inputs in isolation would result in significantly lower (higher) fair value measurements. All observable and unobservable inputs are re-assessed quarterly.
Increases (decreases) in estimated prepayment rates and bond equivalent yields negatively (positively) affect the value of unguaranteed interests in SBA loans. Unguaranteed interest in SBA loans held for sale are carried at less than the outstanding balance due to credit risk estimates. Credit risk adjustments may be reduced if prepayment is likely or as consistent payment history is realized. Management also considers other factors such as delinquency or default and adjusts the fair value accordingly.
Loans held for investment.
Constant prepayment rate, constant default rate and loss severity trends are significant unobservable inputs used in the fair value measurement of loans held for investment. Increases (decreases) in each of these inputs in isolation result in negative (positive) effects on the valuation of the associated loans.
Derivative liabilities.
In conjunction with the sales of its Visa Class B shares, FHN and the purchasers entered into derivative transactions whereby FHN will make, or receive, cash payments whenever the conversion ratio of the Visa Class B shares into Visa Class A shares is adjusted. FHN uses a discounted cash flow methodology in order to estimate the fair value of FHN’s derivative liabilities associated with its prior sales of Visa Class B shares. The methodology includes estimation of both the resolution amount for Visa’s Covered Litigation matters as well as the length of time until the resolution occurs. Significant increases (decreases) in either of these inputs in isolation would result in significantly higher (lower) fair value measurements for the derivative liabilities.
Additionally, FHN performs a probability weighted multiple resolution scenario to calculate the estimated fair value of these derivative liabilities. Assignment of higher (lower) probabilities to the larger potential resolution scenarios would result in an increase (decrease) in the estimated fair value of the derivative liabilities. Since this estimation process requires application of judgment in developing significant unobservable inputs used to determine the possible outcomes and the probability weighting assigned to each scenario, these derivatives have been classified within Level 3 in fair value measurements disclosures.
Loans and leases and Other Real Estate Owned.
Collateral-dependent loans and OREO are primarily valued using appraisals based on sales of comparable properties in the same or similar markets. Other collateral (receivables, inventory, equipment, etc.) is valued through borrowing base certificates, financial statements and/or auction valuations. These valuations are discounted based on the quality of reporting, knowledge of the marketability/collectability of the collateral and historical disposition rates.
Other assets – tax credit investments.
The estimated fair value of tax credit investments accounted for under the equity method is generally determined in relation to the yield (i.e., future tax credits to be received) an acquirer of these investments would expect in relation to the yields experienced on current new issue and/or secondary market transactions. Thus, as tax credits are recognized, the future yield to a market participant is reduced, resulting in consistent impairment of the individual investments. Individual investments are reviewed for impairment quarterly, which may include the consideration of additional marketability discounts related to specific investments which typically includes consideration of the underlying property’s appraised value.
Fair Value Option
FHN has elected the fair value option on a prospective basis for substantially all types of mortgage loans originated for sale purposes except for mortgage origination operations which utilize the platform acquired from CBF. FHN determined that the election reduces certain timing differences and better matches changes in the value of such loans with changes in the value of derivatives and forward delivery commitments used as economic hedges for these assets at the time of election.
Repurchased loans relating to mortgage banking operations conducted prior to the IBKC merger are recognized within loans held for sale at fair value at
|
FIRST HORIZON CORPORATION
|
220
|
2020 FORM 10-K ANNUAL REPORT | ||||||
the time of repurchase, which includes consideration of the credit status of the loans and the estimated liquidation value. FHN has elected to continue recognition of these loans at fair value in periods subsequent to reacquisition. Due to the credit-distressed nature of the vast majority of repurchased loans and the related loss severities experienced upon repurchase, FHN believes that the fair value election provides a more timely recognition of changes in value for these loans that occur subsequent to repurchase. Absent the fair value election, these loans would be subject to valuation at the LOCOM value, which would prevent subsequent
values from exceeding the initial fair value, determined at the time of repurchase, but would require recognition of subsequent declines in value. Thus, the fair value election provides for a more timely recognition of any potential future recoveries in asset values while not affecting the requirement to recognize subsequent declines in value.
FHN also has a portion of mortgage loans held for investment for which the fair value option was elected upon origination and which continue to be accounted for at fair value.
The following tables reflect the differences between the fair value carrying amount of residential real estate loans held for sale and held for investment measured at fair value in accordance with management’s election and the aggregate unpaid principal amount FHN is contractually entitled to receive at maturity.
| December 31, 2020 | ||||||||||||||||||||
| (Dollars in millions) |
Fair value
carrying amount |
Aggregate
unpaid principal |
Fair value carrying amount
less aggregate unpaid principal |
|||||||||||||||||
| Residential real estate loans held for sale reported at fair value: | ||||||||||||||||||||
| Total loans | $ |
|
$ |
|
$ |
(
|
||||||||||||||
| Nonaccrual loans |
|
|
(
|
|||||||||||||||||
| Loans held for investment reported at fair value: | ||||||||||||||||||||
| Total loans |
|
|
(
|
|||||||||||||||||
| Nonaccrual loans |
|
|
|
|||||||||||||||||
| December 31, 2019 | ||||||||||||||||||||
| (Dollars in millions) |
Fair value
carrying amount |
Aggregate
unpaid principal |
Fair value carrying amount
less aggregate unpaid principal |
|||||||||||||||||
| Residential real estate loans held for sale reported at fair value: | ||||||||||||||||||||
| Total loans | $ |
|
$ |
|
$ |
(
|
||||||||||||||
| Nonaccrual loans |
|
|
(
|
|||||||||||||||||
Assets and liabilities accounted for under the fair value election are initially measured at fair value with subsequent changes in fair value recognized in earnings. Such changes in the fair value of assets
and liabilities for which FHN elected the fair value option are included in current period earnings with classification in the income statement line item reflected in the following table:
| Year Ended December 31, | |||||||||||||||||
| (Dollars in millions) | 2020 | 2019 | 2018 | ||||||||||||||
| Changes in fair value included in net income: | |||||||||||||||||
| Mortgage banking and title noninterest income | |||||||||||||||||
| Loans held for sale | $ |
|
$ |
|
$ |
|
|||||||||||
For the years ended December 31, 2020, 2019 and 2018, the amount for residential real estate loans held for sale included an insignificant amount of gains in pretax earnings that are attributable to changes in instrument-specific credit risk. The portion of the fair value adjustments related to credit risk was
determined based on estimated default rates and estimated loss severities. Interest income on residential real estate loans held for sale measured at fair value is calculated based on the note rate of the loan and is recorded in the interest income section of the Consolidated Statements of Income as interest on loans held for sale.
|
FIRST HORIZON CORPORATION
|
221
|
2020 FORM 10-K ANNUAL REPORT | ||||||
FHN has elected to account for retained interest-only strips from guaranteed SBA loans recorded in available-for-sale securities at fair value through earnings. Since these securities are subject to the risk that prepayments may result in FHN not recovering all or a portion of its recorded investment, the fair value election results in a more timely recognition of the effects of estimated prepayments through earnings rather than being recognized through other comprehensive income with periodic review for other-than-temporary impairment. Gains or losses are recognized through fixed income revenues and are presented in the recurring measurements table.
Determination of Fair Value
Fair values are based on the price that would be received to sell an asset or paid to transfer a liability in an orderly transaction between market participants at the measurement date. The following describes the assumptions and methodologies used to estimate the fair value of financial instruments recorded at fair value in the Consolidated Balance Sheets and for estimating the fair value of financial instruments for which fair value is disclosed.
Short-term financial assets.
Federal funds sold, securities purchased under agreements to resell, and interest bearing deposits with other financial institutions and the Federal Reserve are carried at historical cost. The carrying amount is a reasonable estimate of fair value because of the relatively short time between the origination of the instrument and its expected realization.
Trading securities and trading liabilities.
Trading securities and trading liabilities are recognized at fair value through current earnings. Trading inventory held for broker-dealer operations is included in trading securities and trading liabilities. Broker-dealer long positions are valued at bid price in the bid-ask spread. Short positions are valued at the ask price. Inventory positions are valued using observable inputs including current market transactions, benchmark yields, credit spreads and consensus prepayment speeds. Trading loans are valued using observable inputs including current market transactions, swap rates, mortgage rates, and consensus prepayment speeds.
Prior to December 31, 2020, trading securities also included retained interests in prior mortgage securitizations that qualify as financial assets, which include primarily principal-only strips. FHN uses inputs including yield curves, credit spreads, and prepayment speeds to determine the fair value of principal-only strips.
Securities available for sale.
Valuations of available-for-sale securities are performed using observable inputs obtained from market transactions in similar securities. Typical inputs include benchmark yields, consensus prepayment speeds and credit spreads. Trades from similar securities and broker quotes are used to support these valuations.
Interest only strips are valued at elected fair value based on an income approach using an internal valuation model. The internal valuation model includes assumptions regarding projections of future cash flows, prepayment rates, default rates and interest only strip terms. These securities bear the risk of loan prepayment or default that may result in FHN not recovering all or a portion of its recorded investment. When appropriate, valuations are adjusted for various factors including default or prepayment status of the underlying SBA loans. Because of the inherent uncertainty of valuation, those estimated values may be higher or lower than the values that would have been used had a ready market for the securities existed, and may change in the near term.
Loans held for sale.
FHN determines the fair value of loans held for sale using either current transaction prices or discounted cash flow models. Fair values are determined using current transaction prices and/or values on similar assets when available, including committed bids for specific loans or loan portfolios. Uncommitted bids may be adjusted based on other available market information.
Fair value of residential real estate loans held for sale determined using a discounted cash flow model incorporates both observable and unobservable inputs. Inputs in the discounted cash flow model include current mortgage rates for similar products, estimated prepayment rates, foreclosure losses, and various loan performance measures (delinquency, LTV, credit score). Adjustments for delinquency and other differences in loan characteristics are typically reflected in the model’s discount rates. Loss severity trends and the value of underlying collateral are also considered in assessing the appropriate fair value for severely delinquent loans and loans in foreclosure. The valuation of HELOCs also incorporates estimated cancellation rates for loans expected to become delinquent.
Non-mortgage consumer loans held for sale are valued using committed bids for specific loans or loan portfolios or current market pricing for similar assets with adjustments for differences in credit standing (delinquency, historical default rates for similar loans), yield, collateral values and prepayment rates. If
|
FIRST HORIZON CORPORATION
|
222
|
2020 FORM 10-K ANNUAL REPORT | ||||||
pricing for similar assets is not available, a discounted cash flow methodology is utilized, which incorporates all of these factors into an estimate of investor required yield for the discount rate.
FHN utilizes quoted market prices of similar instruments or broker and dealer quotations to value the SBA and USDA guaranteed loans. FHN values SBA-unguaranteed interests in loans held for sale based on individual loan characteristics, such as industry type and pay history which generally follows an income approach. Furthermore, these valuations are adjusted for changes in prepayment estimates and are reduced due to restrictions on trading. The fair value of other non-residential real estate loans held for sale is approximated by their carrying values based on current transaction values.
Mortgage loans held for investment at fair value option.
The fair value of mortgage loans held for investment at fair value option is determined by a third party using a discounted cash flow model using various assumptions about future loan performance (constant prepayment rate, constant default rate and loss severity trends) and market discount rates.
Loans held for investment.
The fair values of mortgage loans are estimated using an exit price methodology that is based on present values using the interest rate that would be charged for a similar loan to a borrower with similar risk, weighted for varying maturity dates and adjusted for a liquidity discount based on the estimated time period to complete a sale transaction with a market participant.
Other loans and leases are valued based on present values using the interest rate that would be charged for a similar instrument to a borrower with similar risk, applicable to each category of instruments, and adjusted for a liquidity discount based on the estimated time period to complete a sale transaction with a market participant.
For loans measured using the estimated fair value of collateral less costs to sell, fair value is estimated using appraisals of the collateral. Collateral values are monitored and additional write-downs are recognized if it is determined that the estimated collateral values have declined further. Estimated costs to sell are based on current amounts of disposal costs for similar assets. Carrying value is considered to reflect fair value for these loans.
Derivative assets and liabilities
. The fair value for forwards and futures contracts is based on current transactions involving identical securities. Futures contracts are exchange-traded and thus have no
credit risk factor assigned as the risk of non-performance is limited to the clearinghouse used.
Valuations of other derivatives (primarily interest rate contracts) are based on inputs observed in active markets for similar instruments. Typically inputs include benchmark yields, option volatility and option skew. Starting in October 2020, centrally cleared derivatives are discounted using SOFR as required by clearinghouses. In measuring the fair value of these derivative assets and liabilities, FHN has elected to consider credit risk based on the net exposure to individual counterparties. Credit risk is mitigated for these instruments through the use of mutual margining and master netting agreements as well as collateral posting requirements. For derivative contracts with daily cash margin requirements that are considered settlements, the daily margin amount is netted within derivative assets or liabilities. Any remaining credit risk related to interest rate derivatives is considered in determining fair value through evaluation of additional factors such as client loan grades and debt ratings. Foreign currency related derivatives also utilize observable exchange rates in the determination of fair value. The determination of fair value for FHN’s derivative liabilities associated with its prior sales of Visa Class B shares are classified within Level 3 in the fair value measurements disclosure as previously discussed in the unobservable inputs discussion.
The fair value of risk participations is determined in reference to the fair value of the related derivative contract between the borrower and the lead bank in the participation structure, which is determined consistent with the valuation process discussed above. This value is adjusted for the pro rata portion of the reference derivative’s notional value and an assessment of credit risk for the referenced borrower.
OREO.
OREO primarily consists of properties that have been acquired in satisfaction of debt. These properties are carried at the lower of the outstanding loan amount or estimated fair value less estimated costs to sell the real estate. Estimated fair value is determined using appraised values with subsequent adjustments for deterioration in values that are not reflected in the most recent appraisal.
Other assets.
For disclosure purposes, other assets consist of tax credit investments, FRB and FHLB Stock, deferred compensation mutual funds and equity investments (including other mutual funds) with readily determinable fair values. Tax credit investments accounted for under the equity method are written down to estimated fair value quarterly based on the estimated value of the associated tax
|
FIRST HORIZON CORPORATION
|
223
|
2020 FORM 10-K ANNUAL REPORT | ||||||
credits which incorporates estimates of required yield for hypothetical investors. The fair value of all other tax credit investments is estimated using recent transaction information with adjustments for differences in individual investments. Deferred compensation mutual funds are recognized at fair value, which is based on quoted prices in active markets.
Investments in the stock of the Federal Reserve Bank and Federal Home Loan Banks are recognized at historical cost in the Consolidated Balance Sheets which is considered to approximate fair value. Investments in mutual funds are measured at the funds’ reported closing net asset values. Investments in equity securities are valued using quoted market prices when available.
Defined maturity deposits.
The fair value of these deposits is estimated by discounting future cash flows to their present value. Future cash flows are discounted by using the current market rates of similar instruments applicable to the remaining maturity. For disclosure purposes, defined maturity deposits include all time deposits.
Short-term financial liabilities.
The fair value of federal funds purchased, securities sold under agreements to repurchase and other short-term borrowings are approximated by the book value. The carrying amount is a reasonable estimate of fair value because of the relatively short time between the origination of the instrument and its expected realization.
Loan commitments.
Fair values of these commitments are based on fees charged to enter into similar agreements taking into account the remaining terms of the agreements and the counterparties’ credit standing.
Other commitments.
Fair values of these commitments are based on fees charged to enter into similar agreements.
The following fair value estimates are determined as of a specific point in time utilizing various assumptions and estimates. The use of assumptions and various valuation techniques, as well as the absence of secondary markets for certain financial instruments, reduces the comparability of fair value disclosures between financial institutions. Due to market illiquidity, the fair values for loans and leases, loans held for sale, and term borrowings as of December 31, 2020 and December 31, 2019, involve the use of significant internally-developed pricing assumptions for certain components of these line items. The assumptions and valuations utilized for this disclosure are considered to reflect inputs that market participants would use in transactions involving these instruments as of the measurement date. The valuations of legacy assets, particularly consumer loans and TRUPS loans within the Corporate segment, are influenced by changes in economic conditions since origination and risk perceptions of the financial sector. These considerations affect the estimate of a potential acquirer’s cost of capital and cash flow volatility assumptions from these assets and the resulting fair value measurements may depart significantly from FHN’s internal estimates of the intrinsic value of these assets.
Assets and liabilities that are not financial instruments have not been included in the following table such as the value of long-term relationships with deposit and trust clients, premises and equipment, goodwill and other intangibles, deferred taxes, and certain other assets and other liabilities. Additionally, these measurements are solely for financial instruments as of the measurement date and do not consider the earnings potential of our various business lines. Accordingly, the total of the fair value amounts does not represent, and should not be construed to represent, the underlying value of FHN.
|
FIRST HORIZON CORPORATION
|
224
|
2020 FORM 10-K ANNUAL REPORT | ||||||
The following tables summarize the book value and estimated fair value of financial instruments recorded in the Consolidated Balance Sheets as of December 31, 2020 and December 31, 2019:
| December 31, 2020 | ||||||||||||||||||||||||||||||||
|
Book
Value |
Fair Value | |||||||||||||||||||||||||||||||
| (Dollars in millions) | Level 1 | Level 2 | Level 3 | Total | ||||||||||||||||||||||||||||
| Assets: | ||||||||||||||||||||||||||||||||
| Loans and leases, net of allowance for loan and lease losses | ||||||||||||||||||||||||||||||||
| Commercial: | ||||||||||||||||||||||||||||||||
| Commercial, financial and industrial | $ |
|
$ |
|
$ |
|
$ |
|
$ |
|
||||||||||||||||||||||
| Commercial real estate |
|
|
|
|
|
|||||||||||||||||||||||||||
| Consumer: | ||||||||||||||||||||||||||||||||
| Consumer real estate (a) |
|
|
|
|
|
|||||||||||||||||||||||||||
| Credit card & other |
|
|
|
|
|
|||||||||||||||||||||||||||
| Total loans and leases, net of allowance for loan and lease losses |
|
|
|
|
|
|||||||||||||||||||||||||||
| Short-term financial assets: | ||||||||||||||||||||||||||||||||
| Interest-bearing deposits with banks |
|
|
|
|
|
|||||||||||||||||||||||||||
| Federal funds sold |
|
|
|
|
|
|||||||||||||||||||||||||||
| Securities purchased under agreements to resell |
|
|
|
|
|
|||||||||||||||||||||||||||
| Total short-term financial assets |
|
|
|
|
|
|||||||||||||||||||||||||||
| Trading securities (b) |
|
|
|
|
|
|||||||||||||||||||||||||||
| Loans held for sale: | ||||||||||||||||||||||||||||||||
| Mortgage loans (elected fair value) (b) |
|
|
|
|
|
|||||||||||||||||||||||||||
| USDA & SBA loans - LOCOM |
|
|
|
|
|
|||||||||||||||||||||||||||
| Other loans - LOCOM |
|
|
|
|
|
|||||||||||||||||||||||||||
| Mortgage loans - LOCOM |
|
|
|
|
|
|||||||||||||||||||||||||||
| Total loans held for sale |
|
|
|
|
|
|||||||||||||||||||||||||||
| Securities available for sale (b) |
|
|
|
|
|
|||||||||||||||||||||||||||
| Derivative assets (b) |
|
|
|
|
|
|||||||||||||||||||||||||||
| Other assets: | ||||||||||||||||||||||||||||||||
| Tax credit investments |
|
|
|
|
|
|||||||||||||||||||||||||||
| Deferred compensation mutual funds |
|
|
|
|
|
|||||||||||||||||||||||||||
| Equity, mutual funds, and other (c) |
|
|
|
|
|
|||||||||||||||||||||||||||
| Total other assets |
|
|
|
|
|
|||||||||||||||||||||||||||
| Total assets | $ |
|
$ |
|
$ |
|
$ |
|
$ |
|
||||||||||||||||||||||
| Liabilities: | ||||||||||||||||||||||||||||||||
| Defined maturity deposits | $ |
|
$ |
|
$ |
|
$ |
|
$ |
|
||||||||||||||||||||||
| Trading liabilities (b) |
|
|
|
|
|
|||||||||||||||||||||||||||
| Short-term financial liabilities: | ||||||||||||||||||||||||||||||||
| Federal funds purchased |
|
|
|
|
|
|||||||||||||||||||||||||||
| Securities sold under agreements to repurchase |
|
|
|
|
|
|||||||||||||||||||||||||||
| Other short-term borrowings |
|
|
|
|
|
|||||||||||||||||||||||||||
| Total short-term financial liabilities |
|
|
|
|
|
|||||||||||||||||||||||||||
| Term borrowings: | ||||||||||||||||||||||||||||||||
| Real estate investment trust-preferred |
|
|
|
|
|
|||||||||||||||||||||||||||
| Term borrowings—new market tax credit investment |
|
|
|
|
|
|||||||||||||||||||||||||||
| Secured borrowings |
|
|
|
|
|
|||||||||||||||||||||||||||
| Junior subordinated debentures |
|
|
|
|
|
|||||||||||||||||||||||||||
| Other long term borrowings |
|
|
|
|
|
|||||||||||||||||||||||||||
| Total term borrowings |
|
|
|
|
|
|||||||||||||||||||||||||||
| Derivative liabilities (b) |
|
|
|
|
|
|||||||||||||||||||||||||||
| Total liabilities | $ |
|
$ |
|
$ |
|
$ |
|
$ |
|
||||||||||||||||||||||
(a)
In first quarter 2020, the Permanent Mortgage portfolio was combined into Consumer Real Estate portfolio, all prior periods were revised for comparability.
(b)
Classes are detailed in the recurring and nonrecurring measurement tables.
(c)
Level 1 primarily consists of mutual funds with readily determinable fair values. Level 3 includes restricted investments in FHLB-Cincinnati stock of $
61
million and FRB stock of $
202
million.
|
FIRST HORIZON CORPORATION
|
225
|
2020 FORM 10-K ANNUAL REPORT | ||||||
| December 31, 2019 | ||||||||||||||||||||||||||||||||
|
Book
Value |
Fair Value | |||||||||||||||||||||||||||||||
| (Dollars in millions) | Level 1 | Level 2 | Level 3 | Total | ||||||||||||||||||||||||||||
| Assets: | ||||||||||||||||||||||||||||||||
| Loans and leases, net of allowance for loan and lease losses | ||||||||||||||||||||||||||||||||
| Commercial: | ||||||||||||||||||||||||||||||||
| Commercial, financial and industrial | $ |
|
$ |
|
$ |
|
$ |
|
$ |
|
||||||||||||||||||||||
| Commercial real estate |
|
|
|
|
|
|||||||||||||||||||||||||||
| Consumer: | ||||||||||||||||||||||||||||||||
| Consumer real estate |
|
|
|
|
|
|||||||||||||||||||||||||||
| Credit card & other |
|
|
|
|
|
|||||||||||||||||||||||||||
| Total loans and leases, net of allowance for loan and lease losses |
|
|
|
|
|
|||||||||||||||||||||||||||
| Short-term financial assets: | ||||||||||||||||||||||||||||||||
| Interest-bearing deposits with banks |
|
|
|
|
|
|||||||||||||||||||||||||||
| Federal funds sold |
|
|
|
|
|
|||||||||||||||||||||||||||
| Securities purchased under agreements to resell |
|
|
|
|
|
|||||||||||||||||||||||||||
| Total short-term financial assets |
|
|
|
|
|
|||||||||||||||||||||||||||
| Trading securities (a) |
|
|
|
|
|
|||||||||||||||||||||||||||
| Loans held for sale: | ||||||||||||||||||||||||||||||||
| Mortgage loans (elected fair value) (a) |
|
|
|
|
|
|||||||||||||||||||||||||||
| USDA & SBA loans - LOCOM |
|
|
|
|
|
|||||||||||||||||||||||||||
| Other loans - LOCOM |
|
|
|
|
|
|||||||||||||||||||||||||||
| Mortgage loans - LOCOM |
|
|
|
|
|
|||||||||||||||||||||||||||
| Total loans held for sale |
|
|
|
|
|
|||||||||||||||||||||||||||
| Securities available for sale (a) |
|
|
|
|
|
|||||||||||||||||||||||||||
| Securities held to maturity |
|
|
|
|
|
|||||||||||||||||||||||||||
| Derivative assets (a) |
|
|
|
|
|
|||||||||||||||||||||||||||
| Other assets: | ||||||||||||||||||||||||||||||||
| Tax credit investments |
|
|
|
|
|
|||||||||||||||||||||||||||
| Deferred compensation assets |
|
|
|
|
|
|||||||||||||||||||||||||||
| Equity, mutual funds, and other (b) |
|
|
|
|
|
|||||||||||||||||||||||||||
| Total other assets |
|
|
|
|
|
|||||||||||||||||||||||||||
| Total assets | $ |
|
$ |
|
$ |
|
$ |
|
$ |
|
||||||||||||||||||||||
| Liabilities: | ||||||||||||||||||||||||||||||||
| Defined maturity deposits | $ |
|
$ |
|
$ |
|
$ |
|
$ |
|
||||||||||||||||||||||
| Trading liabilities (a) |
|
|
|
|
|
|||||||||||||||||||||||||||
| Short-term financial liabilities: | ||||||||||||||||||||||||||||||||
| Federal funds purchased |
|
|
|
|
|
|||||||||||||||||||||||||||
| Securities sold under agreements to repurchase |
|
|
|
|
|
|||||||||||||||||||||||||||
| Other short-term borrowings |
|
|
|
|
|
|||||||||||||||||||||||||||
| Total short-term financial liabilities |
|
|
|
|
|
|||||||||||||||||||||||||||
| Term borrowings: | ||||||||||||||||||||||||||||||||
| Real estate investment trust-preferred |
|
|
|
|
|
|||||||||||||||||||||||||||
| Secured borrowings |
|
|
|
|
|
|||||||||||||||||||||||||||
| Junior subordinated debentures |
|
|
|
|
|
|||||||||||||||||||||||||||
| Other long term borrowings |
|
|
|
|
|
|||||||||||||||||||||||||||
| Total term borrowings |
|
|
|
|
|
|||||||||||||||||||||||||||
| Derivative liabilities (a) |
|
|
|
|
|
|||||||||||||||||||||||||||
| Total liabilities | $ |
|
$ |
|
$ |
|
$ |
|
$ |
|
||||||||||||||||||||||
Certain previously reported amounts have been reclassified to agree with current presentation.
(a)
Classes are detailed in the recurring and nonrecurring measurement tables.
(b)
Level 1 primarily consists of mutual funds with readily determinable fair values. Level 3 includes restricted investments in FHLB-Cincinnati stock of $
76
million and FRB stock of $
131
million.
|
FIRST HORIZON CORPORATION
|
226
|
2020 FORM 10-K ANNUAL REPORT | ||||||
The following table presents the contractual amount and fair value of unfunded loan commitments and standby and other commitments as of December 31, 2020 and December 31, 2019:
| Contractual Amount | Fair Value | |||||||||||||||||||||||||
| (Dollars in millions) | December 31, 2020 | December 31, 2019 | December 31, 2020 | December 31, 2019 | ||||||||||||||||||||||
| Unfunded Commitments: | ||||||||||||||||||||||||||
| Loan commitments | $ |
|
$ |
|
$ |
|
$ |
|
||||||||||||||||||
| Standby and other commitments |
|
|
|
|
||||||||||||||||||||||
|
FIRST HORIZON CORPORATION
|
227
|
2020 FORM 10-K ANNUAL REPORT | ||||||
Note 25 –
Restructuring, Repositioning, and Efficiency
Beginning in 2019, FHN initiated a company-wide review of business practices with the goal of optimizing its expense base to improve profitability and create capacity to reinvest savings into technology and revenue production activities. Restructuring, repositioning, and efficiency charges related to these corporate-driven actions were not significant in 2020 and were $
40
million in 2019. These expenses are included in the Corporate segment. Significant expenses resulted from the following actions:
•
Severance and other employee costs primarily related to efficiency initiatives within
corporate and bank services functions which are classified as personnel expense within noninterest expense.
•
Expense largely related to the identification of efficiency opportunities within the organization which is reflected in legal and professional fees.
•
Expense related to costs associated with asset impairments which is reflected in other expense.
Settlement of the obligations arising from current initiatives will be funded from operating cash flows.
Total expense recognized for the year ended December 31, 2019 is presented in the table below:
| (Dollars in millions) | Year Ended December 31, 2019 | |||||||
| Personnel expense | $ |
|
||||||
| Legal and professional fees |
|
|||||||
| Net occupancy expense |
|
|||||||
| Other |
|
|||||||
| Total restructuring, repositioning, and efficiency charges | $ |
|
||||||
|
FIRST HORIZON CORPORATION
|
228
|
2020 FORM 10-K ANNUAL REPORT | ||||||
Note 26 -
Parent Company Financial Information
Following are statements of the parent company:
| Balance Sheets | December 31, | |||||||||||||
| (Dollars in millions) | 2020 | 2019 | ||||||||||||
| Assets: | ||||||||||||||
| Cash | $ |
|
$ |
|
||||||||||
| Notes receivable |
|
|
||||||||||||
| Investments in subsidiaries: | ||||||||||||||
| Bank |
|
|
||||||||||||
| Non-bank |
|
|
||||||||||||
| Other assets |
|
|
||||||||||||
| Total assets | $ |
|
$ |
|
||||||||||
| Liabilities and equity: | ||||||||||||||
| Accrued employee benefits and other liabilities | $ |
|
$ |
|
||||||||||
| Term borrowings |
|
|
||||||||||||
| Total liabilities |
|
|
||||||||||||
| Total equity |
|
|
||||||||||||
| Total liabilities and equity | $ |
|
$ |
|
||||||||||
| Statements of Income | Year Ended December 31, | |||||||||||||||||||
| (Dollars in millions) | 2020 | 2019 | 2018 | |||||||||||||||||
| Dividend income: | ||||||||||||||||||||
| Bank | $ |
|
$ |
|
$ |
|
||||||||||||||
| Non-bank |
|
|
|
|||||||||||||||||
| Total dividend income |
|
|
|
|||||||||||||||||
| Other income |
|
|
|
|||||||||||||||||
| Total income |
|
|
|
|||||||||||||||||
| Provision (provision credit) for credit losses |
|
(
|
|
|||||||||||||||||
| Interest expense - term borrowings |
|
|
|
|||||||||||||||||
| Compensation, employee benefits and other expense |
|
|
|
|||||||||||||||||
| Total expense |
|
|
|
|||||||||||||||||
| Income before income taxes |
|
|
|
|||||||||||||||||
| Income tax benefit |
(
|
(
|
(
|
|||||||||||||||||
| Income before equity in undistributed net income of subsidiaries |
|
|
|
|||||||||||||||||
| Equity in undistributed net income (loss) of subsidiaries: | ||||||||||||||||||||
| Bank |
|
|
|
|||||||||||||||||
| Non-bank |
|
(
|
(
|
|||||||||||||||||
| Net income attributable to the controlling interest | $ |
|
$ |
|
$ |
|
||||||||||||||
|
FIRST HORIZON CORPORATION
|
229
|
2020 FORM 10-K ANNUAL REPORT | ||||||
| Statements of Cash Flows | ||||||||||||||||||||
| (Dollars in millions) | 2020 | 2019 | 2018 | |||||||||||||||||
| Operating activities: | ||||||||||||||||||||
| Net income | $ |
|
$ |
|
$ |
|
||||||||||||||
| Less undistributed net income of subsidiaries |
|
|
|
|||||||||||||||||
| Income before undistributed net income of subsidiaries |
|
|
|
|||||||||||||||||
| Adjustments to reconcile income to net cash provided by operating activities: | ||||||||||||||||||||
| Depreciation, amortization, and other |
|
(
|
|
|||||||||||||||||
| (Gain) loss on derivative transactions |
|
|
|
|||||||||||||||||
| Deferred income tax expense |
|
|
|
|||||||||||||||||
| Stock-based compensation expense |
|
|
|
|||||||||||||||||
| Other operating activities, net |
|
|
|
|||||||||||||||||
| Total adjustments |
|
|
|
|||||||||||||||||
| Net cash provided by operating activities |
|
|
|
|||||||||||||||||
| Investing activities: | ||||||||||||||||||||
| Proceeds from sales and prepayments of securities |
|
|
|
|||||||||||||||||
| Purchases of securities |
(
|
|
|
|||||||||||||||||
| (Investment in) return on subsidiary |
(
|
|
|
|||||||||||||||||
| Cash received (paid for) business combination, net |
|
|
(
|
|||||||||||||||||
| Net cash provided by (used in) investing activities |
|
|
(
|
|||||||||||||||||
| Financing activities: | ||||||||||||||||||||
| Proceeds from issuance of preferred stock |
|
|
|
|||||||||||||||||
| Cash dividends paid - preferred stock |
(
|
(
|
(
|
|||||||||||||||||
| Common stock: | ||||||||||||||||||||
| Stock options exercised |
|
|
|
|||||||||||||||||
| Cash dividends paid |
(
|
(
|
(
|
|||||||||||||||||
| Repurchase of shares |
(
|
(
|
(
|
|||||||||||||||||
| Proceeds from issuance of term borrowings |
|
|
|
|||||||||||||||||
| Repayment of term borrowings |
(
|
|
(
|
|||||||||||||||||
| Other financing activities, net |
(
|
|
|
|||||||||||||||||
| Net cash provided by (used in) financing activities |
|
(
|
(
|
|||||||||||||||||
| Net increase in cash and cash equivalents |
|
|
|
|||||||||||||||||
| Cash and cash equivalents at beginning of year |
|
|
|
|||||||||||||||||
| Cash and cash equivalents at end of year | $ |
|
$ |
|
$ |
|
||||||||||||||
| Total interest paid | $ |
|
$ |
|
$ |
|
||||||||||||||
| Income taxes received from subsidiaries |
|
|
|
|||||||||||||||||
|
ITEM 9. CHANGES IN AND DISAGREEMENTS WITH ACCOUNTANTS ON ACCOUNTING AND FINANCIAL DISCLOSURE
|
||||||||
Not applicable.
|
FIRST HORIZON CORPORATION
|
230
|
2020 FORM 10-K ANNUAL REPORT | ||||||
|
ITEM 9A. CONTROLS AND PROCEDURES
|
||||||||
| Evaluation of Disclosure Controls and Procedures | ||||||||||||||
Our management, with the participation of our Chief Executive Officer and Chief Financial Officer, has evaluated the effectiveness of our disclosure controls and procedures (as defined in Exchange Act Rule 13a-15(e)) as of the end of the period covered by this report. Based on that evaluation, the Chief Executive Officer and the Chief Financial Officer have concluded that our disclosure controls and procedures were effective as of the end of the period covered by this report.
| Reports on Internal Control over Financial Reporting | ||||||||||||||
The report of management required by Item 308(a) of Regulation S-K, and the attestation report required by Item 308(b) of Regulation S-K, appear at pages 106-108 of our 2020 Financial Statements (Item 8) and are incorporated herein by this reference.
| Changes in Internal Control over Financial Reporting | ||||||||||||||
Other than as explained below, there have not been any changes in our internal control over financial reporting during our fourth fiscal quarter that have materially affected, or are reasonably likely to materially affect, our internal control over financial reporting.
On July 1, 2020, FHN and IBERIABANK Corporation ("IBKC") closed their merger of equals transaction. As
permitted by Securities and Exchange Commission rules, we have elected to exclude IBKC from our assessment of internal control over financial reporting as of December 31, 2020. Our integration of IBKC’s systems and processes with our own could cause changes to our internal controls over financial reporting in future periods.
|
ITEM 9B. OTHER INFORMATION
|
||||||||
Not applicable.
|
FIRST HORIZON CORPORATION
|
231
|
2020 FORM 10-K ANNUAL REPORT | ||||||
| PART III | ||||||||||||||
|
ITEM 10. DIRECTORS AND EXECUTIVE OFFICERS OF THE REGISTRANT
|
||||||||
| Required Item 10 Information | ||||||||||||||
In 2020 there were no material amendments to the procedures, described in our 2021 Proxy Statement under the caption
Shareholder Recommendations of Director Nominees; Shareholder Nominations
, by which security holders may recommend nominees to our Board of Directors.
Our bylaws contain a process, if certain conditions are met, for a shareholder to nominate a person for election to the Board in advance of an annual meeting, and to require us to include that nomination in our annual meeting proxy statement. Additional information regarding this process is available in our 2021 Proxy Statement under the captions:
Shareholder Recommendations of Director Nominees; Shareholder Nominations
and
Shareholder Proposal & Nomination Deadlines
, which information is incorporated herein by reference.
Our Board of Directors has adopted a Code of Ethics for Senior Financial Officers that applies to the Chief Executive Officer, Chief Financial Officer, and Chief Accounting Officer and also applies to all
professionals serving in the financial, accounting, or audit areas of FHN and its subsidiaries. A copy of the Code has been filed or incorporated by reference as Exhibit 14 to this report and is posted on our current internet website (at www.firsthorizon.com: click on “Investor Relations,” at the bottom of the web page, then hover over the Investor Relations box at the top of the page, then hover over “Corporate Governance,” and lastly click on “Governance Documents.”) A paper copy of the Code is available without charge upon written request addressed to our Corporate Secretary at our main office, 165 Madison Avenue, Memphis, Tennessee 38103. We intend to satisfy our disclosure obligations under Item 5.05 of Form 8-K related to Code amendments or waivers by posting such information on our internet website, the address for which is listed in this paragraph above.
Other information required by this Item related to the topics mentioned in Table 10.1 is incorporated herein by reference to the disclosures indicated in the Table.
Table 10.1
| Item 10 Topics | Incorporated Disclosures | ||||
| Directors and nominees for director of FHN, the Audit Committee of our Board of Directors, members of the Audit Committee, and audit committee financial experts |
Independence & Categorical Standards
,
Committee Charters & Committee Composition
,
The Audit Committee
, and
Vote Item 1—Election of Directors
in our 2021 Proxy Statement (excluding the Audit Committee Report and the statements regarding the existence and location of the Audit Committee’s charter)
|
||||
| Executive officers |
Executive Officers of the Registrant
in the Supplemental Part I Information following Item 4 of this report
|
||||
| Compliance with Section 16(a) of the Securities Exchange Act of 1934 | not applicable | ||||
|
FIRST HORIZON CORPORATION
|
232
|
2020 FORM 10-K ANNUAL REPORT | ||||||
|
First Horizon Board of Directors
(at February 20, 2021)
|
||||||||||||||
Table 10.2
|
Harry V. Barton, Jr.
Age 66
CPA, registered investment advisor, and Owner,
Barton Advisory Services, LLC,
an investment advisory firm
|
Kenneth A. Burdick
Age 62
Retired Executive Vice President,
Products and Markets,
Centene Corporation,
a healthcare services company
|
Daryl G. Byrd
Age 66
Executive Chairman of the Board,
First Horizon Corporation,
a financial services company
|
||||||
|
John N. Casbon
Age 72
Executive Vice President,
First American Title Insurance Company,
a title insurance company
|
John C. Compton
Age 59
Partner,
Clayton, Dubilier & Rice, LLC
a private equity firm
|
Wendy P. Davidson
Age 51
President-Americas,
Glanbia Performance Nutrition,
a global nutrition company
|
||||||
|
William H. Fenstermaker
Age 72
Chairman and Chief Executive Officer,
C.H. Fenstermaker and Associates, LLC,
a surveying, mapping, engineering, and environmental consulting company
|
D. Bryan Jordan
Age 59
President and
Chief Executive Officer,
First Horizon Corporation,
a financial services company
|
J. Michael Kemp, Sr.
Age 50
Founder and Chief Executive Officer,
Kemp Management Solutions,
a program management and
consulting firm
|
||||||
|
Rick E. Maples
Age 62
Retired Co-Head of Investment Banking,
Stifel Financial Corp.,
a financial services company
|
Vicki R. Palmer
Age 67
President,
The Palmer Group, LLC
a general consulting firm
|
Colin V. Reed
Age 73
Chairman of the Board and
Chief Executive Officer,
Ryman Hospitality Properties, Inc.
a real estate investment trust
|
||||||
|
E. Stewart Shea III
Age 69
Private Investor
|
Cecelia D. Stewart
Age 62
Retired President, U.S. Consumer & Commercial Banking,
Citigroup, Inc.
a financial services company
|
Rajesh Subramaniam
Age 55
President and
Chief Operating Officer,
FedEx Corp.
a provider of transportation, e-commerce, and business services
|
||||||
|
Rosa Sugrañes
Age 63
Founder and former
Chief Executive Officer,
Iberia Tiles,
a ceramic tile manufacturer
|
R. Eugene Taylor
Age 73
Retired Chairman of the Board and
Chief Executive Officer,
Capital Bank Financial Corp.,
a financial services company
|
|||||||
|
ITEM 11. EXECUTIVE COMPENSATION
|
||||||||
The information called for by this Item is incorporated herein by reference to the following sections of our 2021 Proxy Statement:
The Compensation Committee
,
Compensation Committee Interlocks & Insider Participation
,
Compensation Discussion & Analysis
,
Recent Compensation
,
Post-Employment Compensation
,
Director Compensation
,
Other Legal Disclosures
, and each Appendix to our Proxy Statement referenced in those sections.
The sub-section of our 2021 Proxy Statement captioned
Compensation Risk
, within
The Compensation Committee
section, provides information concerning our management of certain risks associated with our compensation policies and practices. We do not believe those risks are reasonably likely to have a material adverse effect
upon us; accordingly, we do not believe that information is required to be provided in this Item.
The information required by Item 407(e)(5) of Regulation S-K is provided in our 2021 Proxy Statement within
The Compensation Committee
section under the sub-section captioned
Compensation Committee Report
. As permitted by the instructions for that Item, the information under that sub-section is not “filed” with this report.
|
FIRST HORIZON CORPORATION
|
233
|
2020 FORM 10-K ANNUAL REPORT | ||||||
|
ITEM 12. SECURITY OWNERSHIP OF CERTAIN BENEFICIAL OWNERS AND MANAGEMENT AND RELATED STOCKHOLDER MATTERS
|
||||||||
| Securities Authorized for Issuance under Equity Compensation Plans | ||||||||||||||
The information required for this Item pursuant to Item 201(d) of Regulation S-K is presented in our 2021 Proxy Statement under the heading
Equity Compensation Plan Information.
That information is incorporated into this Item by reference.
| Beneficial Ownership of Corporation Stock | ||||||||||||||
The information required for this Item pursuant to Item 403(a) and (b) of Regulation S-K is presented in our 2021 Proxy Statement under the heading
Stock Ownership Information.
That information is incorporated into this Item by reference
| Change in Control Arrangements | ||||||||||||||
We are not aware of any arrangements which may result in a change in control of First Horizon Corporation.
|
ITEM 13. CERTAIN RELATIONSHIPS AND RELATED TRANSACTIONS
|
||||||||
The information called for by this Item is presented in the following sections of our 2021 Proxy Statement:
Independence & Categorical Standards
,
Approval, Monitoring & Ratification Procedures for Related Party Transactions
, and
Transactions with Related Persons
. That information is incorporated into this
Item by reference. Our independent directors and nominees are identified in the first paragraph of the
Independence
discussion within the
Independence & Categorical Standards
section of our 2021 Proxy Statement.
|
ITEM 14. PRINCIPAL ACCOUNTANT FEES AND SERVICES
|
||||||||
The Audit Committee of the Board of Directors has a policy providing for pre-approval of all audit and non-audit services to be performed by our registered public accounting firm that performs the audit of our consolidated financial statements (our “Auditor”). Services either may be approved in advance by the Audit Committee specifically on a case-by-case basis (“specific pre-approval”) or may be approved in advance (“advance pre-approval”). Advance pre-
approval requires the Committee to identify in advance the specific types of service that may be provided and the fee limits applicable to such types of service, which limits may be expressed as a limit by type of service or by category of services. All requests to provide services that have been pre-approved in advance must be submitted to the Chief Accounting Officer prior to the provision of such services for a determination that the service to be provided is of the
|
FIRST HORIZON CORPORATION
|
234
|
2020 FORM 10-K ANNUAL REPORT | ||||||
type and within the fee limit that has been pre-approved. Unless the type of service to be provided by our Auditor has received advance pre-approval under the policy and the fee for such service is within the limit pre-approved, the service will require specific pre-approval by the Committee.
The terms of and fee for the annual audit engagement must receive the specific pre-approval of the Committee. “Audit,” “Audit-related,” “Tax,” and “All Other” services, as those terms are defined in the policy, have the advance pre-approval of the Committee, but only to the extent those services have been specified by the Committee and only in amounts that do not exceed the fee limits specified by the Committee. Such advance pre-approval is to be for a term of 12 months following the date of pre-approval unless the Committee specifically provides for a different term. Unless the Committee specifically determines otherwise, the aggregate amount of the fees pre-approved for All Other services for the fiscal year must not exceed seventy-five percent (75%) of the aggregate amount of the fees pre-approved for the fiscal year for Audit services, Audit-related services, and those types of Tax services that represent tax compliance or tax return preparation. The policy delegates the authority to pre-approve services to be provided by our Auditor, other than the annual audit engagement and any changes thereto, to the chair of the Committee. The chair may not, however, make a determination that causes the 75% limit described above to be exceeded. Any service pre-approved by the chair will be reported to the Committee at its next regularly scheduled meeting.
Information regarding fees billed to FHN by our Auditor, KPMG LLP, for the two most recent fiscal years is incorporated herein by reference to the section of our 2021 Proxy Statement captioned
Vote Item 4—Ratification of Appointment of Auditors
. No services were approved by the Audit Committee pursuant to Rule 2-01(c)(7)(i)(C) of Regulation S-X.
|
FIRST HORIZON CORPORATION
|
235
|
2020 FORM 10-K ANNUAL REPORT | ||||||
| PART IV | ||||||||||||||
|
ITEM 15. EXHIBITS AND FINANCIAL STATEMENT SCHEDULES
|
||||||||
The documents listed under the following headings are filed as part of this report:
| Financial Statements and Related Reports | ||||||||||||||
Our consolidated financial statements, the notes thereto, and the reports of management and independent public accountants, as listed below, are incorporated herein by reference to the pages of 2020 Financial Statements (Item 8) indicated below.
Table 15.1
| Item 8 Page | Statement, Note, or Report Incorporated into Item 15 | ||||
| 106 | Report of Management on Internal Control over Financial Reporting | ||||
| 107-114 | Reports of Independent Registered Public Accounting Firm | ||||
| 115 | Consolidated Balance Sheets as of December 31, 2020 and 2019 | ||||
| 116-117 | Consolidated Statements of Income for the years ended December 31, 2020, 2019, and 2018 | ||||
| 118 | Consolidated Statements of Comprehensive Income for the years ended December 31, 2020, 2019, and 2018 | ||||
| 119-120 | Consolidated Statements of Changes in Equity for the years ended December 31, 2020, 2019, and 2018 | ||||
| 121-122 | Consolidated Statements of Cash Flows for the years ended December 31, 2020, 2019, and 2018 | ||||
| 123-230 | Notes to the Consolidated Financial Statements | ||||
| Financial Statement Schedules | ||||||||||||||
Not applicable.
| Exhibits | ||||||||||||||
In the exhibit table that follows: the “Filed Here” column denotes each exhibit which is filed or furnished (as applicable) with this report; the “Mngt Exh” column denotes each exhibit that represents a management contract or compensatory plan or arrangement required to be identified as such; the “Furnished” column denotes each exhibit that is “furnished” pursuant to 18 U.S.C. Section 1350 or otherwise, and is not “filed” as part of this report or as a separate disclosure document; and the phrase “2020 named executive officers” refers to those executive officers whose 2020 compensation is described in our 2021 Proxy Statement. All references to “First Horizon National Corporation” or
to "First Tennessee National Corporation" refer to us, under previous corporate names.
In many agreements filed as exhibits, each party makes representations and warranties to other parties. Those representations and warranties are made only to and for the benefit of those other parties in the context of a business contract. Exceptions to such representations and warranties may be partially or fully waived by such parties, or not enforced by such parties, in their discretion. No such representation or warranty may be relied upon by any other person for any purpose.
|
FIRST HORIZON CORPORATION
|
236
|
2020 FORM 10-K ANNUAL REPORT | ||||||
10-K EXHIBIT TABLE
Table 15.2
| Exh No | Description of Exhibit to this 10-K Report | Filed Here | Mngt Exh | Furn-ished | Incorporated by Reference to | ||||||||||||||||||
| Form | Exh No | Filing Date | |||||||||||||||||||||
| Corporate Exhibits | |||||||||||||||||||||||
| 2.1 | 8-K | 2.1 | 11/7/2019 | ||||||||||||||||||||
| 3.1 | 8-K | 3.1 | 10/29/2020 | ||||||||||||||||||||
| 3.2 | 8-K | 3.1 | 12/1/2020 | ||||||||||||||||||||
| 3.3 | 8-K | 3.2 | 12/1/2020 | ||||||||||||||||||||
| 4.1 | 8-K | 4.1 | 1/31/2013 | ||||||||||||||||||||
| 4.2 | 8-K | 4.1 | 1/31/2013 | ||||||||||||||||||||
| 4.3 | 8-K | 4.1 | 1/31/2013 | ||||||||||||||||||||
| 4.4 | 8-K | 4.1 | 7/2/2020 | ||||||||||||||||||||
| 4.5 | 8-K | 4.4 | 7/2/2020 | ||||||||||||||||||||
| 4.6 | 8-K | 4.2 | 7/2/2020 | ||||||||||||||||||||
| 4.7 | 8-K | 4.5 | 7/2/2020 | ||||||||||||||||||||
| 4.8 | 8-K | 4.3 | 7/2/2020 | ||||||||||||||||||||
| 4.9 | 8-K | 4.6 | 7/2/2020 | ||||||||||||||||||||
| 4.10 | 8-K | 4.1 | 5/28/2020 | ||||||||||||||||||||
| 4.11 | 8-K | 4.2 | 5/28/2020 | ||||||||||||||||||||
| 4.12 | 8-K | 4.3 | 5/28/2020 | ||||||||||||||||||||
| 4.13 |
10-Q
3Q20 |
4.13 | 11/5/2020 | ||||||||||||||||||||
| 4.14 | FHN agrees to furnish to the Securities and Exchange Commission upon request a copy of each instrument defining the rights of the holders of the senior and subordinated long-term debt of FHN and its consolidated subsidiaries | ||||||||||||||||||||||
| Equity-Based Award Plans | |||||||||||||||||||||||
| 10.1 (a) | X | Proxy 2016 | App. A | 3/14/2016 | |||||||||||||||||||
| 10.1 (b) | X | X | |||||||||||||||||||||
| 10.1 (c) | X | X | |||||||||||||||||||||
| 10.1 (d) | X | X | |||||||||||||||||||||
| 10.1 (e) | X |
10-Q
2Q09 |
10.2(d) | 8/6/2009 | |||||||||||||||||||
| 10.1 (f) | X |
10-Q
2Q09 |
10.1(e) | 8/6/2009 | |||||||||||||||||||
| Performance-Based Equity Award Documents | |||||||||||||||||||||||
|
FIRST HORIZON CORPORATION
|
237
|
2020 FORM 10-K ANNUAL REPORT | ||||||
| Exh No | Description of Exhibit to this 10-K Report | Filed Here | Mngt Exh | Furn-ished | Incorporated by Reference to | ||||||||||||||||||
| Form | Exh No | Filing Date | |||||||||||||||||||||
| 10.2 (a) | X |
10-Q
1Q16 |
10.6 | 5/6/2016 | |||||||||||||||||||
| 10.2 (b) | X |
10-Q
1Q18 |
10.1 | 5/8/2018 | |||||||||||||||||||
| 10.2 (c) | X |
10-Q
1Q19 |
10.1 | 5/8/2019 | |||||||||||||||||||
| 10.2 (d) | X |
10-Q
1Q20 |
10.1 | 5/8/2020 | |||||||||||||||||||
| Stock Option Award Documents | |||||||||||||||||||||||
| 10.3 (a) | X |
10-Q
2Q17 |
10.1 | 8/8/2017 | |||||||||||||||||||
| 10.3 (b) | X |
10-K
2004 |
10.5(e) | 3/14/2005 | |||||||||||||||||||
| 10.3 (c) | X |
10-K
2006 |
10.5(o) | 2/28/2007 | |||||||||||||||||||
| 10.3 (d) | X | 10-Q 1Q14 | 10.3 | 5/8/2014 | |||||||||||||||||||
| 10.3 (e) | X | 10-Q 1Q15 | 10.2 | 5/7/2015 | |||||||||||||||||||
| 10.3 (f) | X | 10-Q 1Q16 | 10.2 | 5/6/2016 | |||||||||||||||||||
| 10.3 (g) | X | 10-Q 1Q16 | 10.5 | 5/6/2016 | |||||||||||||||||||
| 10.3 (h) | X | 10-Q 1Q17 | 10.2 | 5/8/2017 | |||||||||||||||||||
| 10.3 (i) | X | 10-Q 1Q18 | 10.2 | 5/8/2018 | |||||||||||||||||||
| 10.3 (j) | X | 10-Q 1Q19 | 10.2 | 5/8/2019 | |||||||||||||||||||
| 10.3 (k) | X | 10-Q 1Q20 | 10.2 | 5/8/2020 | |||||||||||||||||||
| 10.3 (l) | X | X | |||||||||||||||||||||
| Other Equity-Based Award Documents | |||||||||||||||||||||||
| 10.4 (a) | X | 10-Q 1Q18 | 10.3 | 5/8/2018 | |||||||||||||||||||
| 10.4 (b) | X | 10-Q 1Q19 | 10.3 | 5/8/2019 | |||||||||||||||||||
| 10.4 (c) | X | 10-Q 1Q20 | 10.3 | 5/8/2020 | |||||||||||||||||||
| 10.4 (d) | X | 10-Q 1Q20 | 10.3 | 5/8/2020 | |||||||||||||||||||
| 10.4 (e) | X | 10-K 2019 | 10.4(e) | 2/28/2020 | |||||||||||||||||||
| 10.4 (f) | X | X | |||||||||||||||||||||
| 10.4 (g) | X | 10-Q 3Q20 | 10.2 | 11/5/2020 | |||||||||||||||||||
| Management Cash Incentive Plan Documents | |||||||||||||||||||||||
| 10.5 (a) | X | Proxy 2016 | App B | 3/14/2016 | |||||||||||||||||||
| Other Exhibits relating to Employment, Retirement, Severance, or Separation | |||||||||||||||||||||||
| 10.6 (a) | X | 8-K | 10.7(a2) | 2/26/2007 | |||||||||||||||||||
| 10.6 (b) | X |
10-Q
3Q07 |
10.7(a4) | 11/7/2007 | |||||||||||||||||||
| 10.6 (c) | X |
10-Q
3Q07 |
10.7(a5) | 11/7/2007 | |||||||||||||||||||
| 10.6 (d) | X | 8-K | 10.2 | 11/24/2008 | |||||||||||||||||||
| 10.6 (e) | X | 8-K | 10.1 | 1/29/2021 | |||||||||||||||||||
| 10.6 (f) | X | 10-Q 3Q07 | 10.7(e) | 11/7/2007 | |||||||||||||||||||
|
FIRST HORIZON CORPORATION
|
238
|
2020 FORM 10-K ANNUAL REPORT | ||||||
| Exh No | Description of Exhibit to this 10-K Report | Filed Here | Mngt Exh | Furn-ished | Incorporated by Reference to | ||||||||||||||||||
| Form | Exh No | Filing Date | |||||||||||||||||||||
| 10.6 (g) | X |
10-K
2009 |
10.7(d2) | 2/26/2010 | |||||||||||||||||||
| 10.6 (h) | X | 10-Q 3Q11 | 10.2 | 11/8/2011 | |||||||||||||||||||
| 10.6 (i) | X | 8-K | 10.1 | 7/17/2012 | |||||||||||||||||||
| 10.6 (j) | X | 8-K | 10.1 | 11/7/2019 | |||||||||||||||||||
| 10.6 (k) | X | 8-K | 10.2 | 11/7/2019 | |||||||||||||||||||
| 10.6 (l) | X | X | |||||||||||||||||||||
| 10.6 (m) | X | X | |||||||||||||||||||||
| 10.6 (n) | X | 8-K | 99.1 | 11/7/2019 | |||||||||||||||||||
| 10.6 (o) | X | X | |||||||||||||||||||||
| 10.6 (p) | X | 8-K | 10.1 | 7/2/2020 | |||||||||||||||||||
| Documents Related to Other Deferral Plans and Programs | |||||||||||||||||||||||
| 10.7 (a) | X | 10-Q 2Q17 | 10.4 | 8/8/2017 | |||||||||||||||||||
| 10.7 (b) | X | 10-Q 3Q07 | 10.1(a3) | 11/7/2007 | |||||||||||||||||||
| 10.7 (c) | X | 10-Q 3Q20 | 10.3 | 11/5/2020 | |||||||||||||||||||
| 10.7 (d) | X |
10-K
2018 |
10.7(d) | 2/28/2019 | |||||||||||||||||||
| 10.7 (e) | X | 10-Q 3Q07 | 10.1(c) | 11/7/2007 | |||||||||||||||||||
| 10.7 (f) | X | 10-Q 3Q07 | 10.1(j) | 11/7/2007 | |||||||||||||||||||
| 10.7 (g) | X | 8-K | 10(z) | 1/3/2005 | |||||||||||||||||||
| Other Exhibits related to Management or Directors | |||||||||||||||||||||||
| 10.8 (a) | X | 10-Q 3Q06 | 10.8 | 11/8/2006 | |||||||||||||||||||
| 10.8 (b) | X | X | |||||||||||||||||||||
| 10.8 (c) | X | 10-Q 2Q17 | 10.2 | 8/8/2017 | |||||||||||||||||||
| 10.8 (d) | X | 10-Q 2Q17 | 10.3 | 8/8/2017 | |||||||||||||||||||
| 10.8 (e) | X | 8-K | 10.4 | 4/28/2008 | |||||||||||||||||||
| 10.8 (f) | X | 8-K | 10.5 | 4/28/2008 | |||||||||||||||||||
| 10.8 (g) | X | X | |||||||||||||||||||||
| 10.8 (h) | X | X | |||||||||||||||||||||
| Other Exhibits | |||||||||||||||||||||||
| 14 |
10-K
2008 |
14 | 2/26/2009 | ||||||||||||||||||||
| 21 | X | ||||||||||||||||||||||
| 23 | X | ||||||||||||||||||||||
|
FIRST HORIZON CORPORATION
|
239
|
2020 FORM 10-K ANNUAL REPORT | ||||||
| Exh No | Description of Exhibit to this 10-K Report | Filed Here | Mngt Exh | Furn-ished | Incorporated by Reference to | ||||||||||||||||||
| Form | Exh No | Filing Date | |||||||||||||||||||||
| 24 | X | ||||||||||||||||||||||
| 31(a) | X | ||||||||||||||||||||||
| 31(b) | X | ||||||||||||||||||||||
| 32(a) | X | X | |||||||||||||||||||||
| 32(b) | X | X | |||||||||||||||||||||
| XBRL Exhibits | |||||||||||||||||||||||
| 101 |
The following financial information from First Horizon Corporation’s Annual Report on Form 10-K for the year ended December 31, 2020, formatted in Inline XBRL:
(i) Consolidated Balance Sheets at December 31, 2020 and 2019
(ii) Consolidated Statements of Income for the Years Ended December 31, 2020, 2019, and 2018
(iii) Consolidated Statements of Comprehensive Income for the Years Ended December 31, 2020, 2019, and 2018.
(iv) Consolidated Statements of Changes in Equity for the Years Ended December 31, 2020, 2019, and 2018.
(v) Consolidated Statements of Cash Flows for the Years Ended December 31, 2020, 2019, and 2018.
(vi) Notes to the Consolidated Financial Statements
|
X | |||||||||||||||||||||
| 101. INS | XBRL Instance Document-the instance document does not appear in the Interactive Data File because its XBRL tags are embedded within the Inline XBRL document | X | |||||||||||||||||||||
| 101. SCH | Inline XBRL Taxonomy Extension Schema | X | |||||||||||||||||||||
| 101. CAL | Inline XBRL Taxonomy Extension Calculation Linkbase | X | |||||||||||||||||||||
| 101. DEF | Inline XBRL Taxonomy Extension Definition Linkbase | X | |||||||||||||||||||||
| 101. LAB | Inline XBRL Taxonomy Extension Label Linkbase | X | |||||||||||||||||||||
| 101. PRE | Inline XBRL Taxonomy Extension Presentation Linkbase | X | |||||||||||||||||||||
| 104 | Cover Page Interactive Data File, formatted in Inline XBRL (included in Exhibit 101) | X | |||||||||||||||||||||
|
ITEM 16. FORM 10-K SUMMARY
|
||||||||
Not applicable.
|
FIRST HORIZON CORPORATION
|
240
|
2020 FORM 10-K ANNUAL REPORT | ||||||
| SIGNATURES | ||||||||||||||
Pursuant to the requirements of Section 13 or 15(d) of the Securities Exchange Act of 1934, the registrant has duly caused this report to be signed on its behalf by the undersigned, thereunto duly authorized.
|
FIRST HORIZON CORPORATION
|
||||||||||||||
|
Date: February 25, 2021
|
By: | /s/ William C. Losch III | ||||||||||||
| Name: | William C. Losch III | |||||||||||||
| Title: | Senior Executive Vice President and Chief Financial Officer | |||||||||||||
| (Duly Authorized Officer and Principal Financial Officer) | ||||||||||||||
Pursuant to the requirements of the Securities Exchange Act of 1934, this report has been signed below by the following persons on behalf of the registrant and in the capacities and on the dates indicated.
| Signature* | Title | Date* | Signature* | Title | Date* | ||||||||||||
|
D. Bryan Jordan
D. Bryan Jordan
|
President, Chief Executive Officer, and a Director (principal executive officer) | * |
William C. Losch III
William C. Losch III
|
Senior Executive Vice President and Chief Financial Officer (principal financial officer) | * | ||||||||||||
|
Jeff L. Fleming
Jeff L. Fleming
|
Executive Vice President and Chief Accounting Officer (principal accounting officer) | * |
Harry V. Barton, Jr.
Harry V. Barton, Jr.
|
Director | * | ||||||||||||
|
Kenneth A. Burdick
Kenneth A. Burdick
|
Director | * |
Daryl G. Byrd
Daryl G. Byrd
|
Director | * | ||||||||||||
|
John N. Casbon
John N. Casbon
|
Director | * |
John C. Compton
John C. Compton
|
Director | * | ||||||||||||
|
Wendy P. Davidson
Wendy P. Davidson
|
Director | * |
William H. Fenstermaker
William H. Fenstermaker
|
Director | * | ||||||||||||
|
J. Michael Kemp, Sr.
J. Michael Kemp, Sr.
|
Director | * |
Rick E. Maples
Rick E. Maples
|
Director | * | ||||||||||||
|
Vicki R. Palmer
Vicki R. Palmer
|
Director | * |
Colin V. Reed
Colin V. Reed
|
Director | * | ||||||||||||
|
E. Stewart Shea III
E. Stewart Shea III
|
Director | * |
Cecelia D. Stewart
Cecelia D. Stewart
|
Director | * | ||||||||||||
|
Rajesh Subramaniam
Rajesh Subramaniam
|
Director | * |
Rosa Sugrañes
Rosa Sugrañes
|
Director | * | ||||||||||||
|
R. Eugene Taylor
R. Eugene Taylor
|
Director | * | |||||||||||||||
|
*By:
/s/ Clyde A. Billings, Jr.
|
February 25, 2021
|
|||||||||||||
| Clyde A. Billings, Jr. | ||||||||||||||
| As Attorney-in-Fact | ||||||||||||||
|
FIRST HORIZON CORPORATION
|
241
|
2020 FORM 10-K ANNUAL REPORT | ||||||
TABLE OF CONTENTS
Part IItem 1. BusinessItem 1A. Risk FactorsItem 1B. Unresolved Staff CommentsItem 2. PropertiesItem 3. Legal ProceedingsItem 4. Mine Safety DisclosuresPart IIItem 5. Market For The Registrant S Common Equity, Related Stockholder Matters, and Issuer Purchases Of Equity SecuritiesItem 7. Management S Discussion and Analysis Of Financial Condition and Results Of OperationsItem 7. Management S Discussion and Analysis Of FinancialItem 7A. Quantitative and Qualitative Disclosures About Market RiskItem 8. Financial Statements and Supplementary DataNote 1 Significant Accounting PoliciesNote 1 Financial Information (continued)Note 2 Acquisitions and DivestituresNote 2 Acquisitions and Divestitures (continued)Note 3 Investment SecuritiesNote 3 Investment Securities (continued)Note 4 Loans and LeasesNote 4 Loans and Leases (continued)Note 5 Allowance For Credit LossesNote 5 Allowance For Credit Losses (continued)Note 6 Premises, Equipment, and LeasesNote 6 Premises, Equipment, and Leases (continued)Note 7 Goodwill and Other Intangible AssetsNote 7 Goodwill and Other Intangible Assets (continued)Note 8 Mortgage Banking ActivityNote 9 DepositsNote 10 Short-term BorrowingsNote 11 Term BorrowingsNote 11 Term Borrowings (continued)Note 12 Preferred StockNote 13 Regulatory Capital and RestrictionsNote 13 Regulatory Capital and Restrictions (continued)Note 14 Components Of Other Comprehensive Income (loss)Note 15 Income TaxesNote 15 Income Taxes (continued)Note 16 Earnings Per ShareNote 17 Contingencies and Other DisclosuresNote 17 - Contingencies and Other Disclosures (continued)Note 18 Pension, Savings, and Other Employee BenefitsNote 18 Pension, Savings, and Other Employee Benefits (continued)Note 19 - Stock Options, Restricted Stock, and Dividend Reinvestment PlansNote 19 - Stock Options, Restricted Stock, and Dividend Reinvestment Plans (continued)Note 20 - Business Segment InformationNote 20 - Business Segment Information (continued)Note 21 - Variable Interest EntitiesNote 21 - Variable Interest Entities (continued)Note 22 - DerivativesNote 22 - Derivatives (continued)Note 23 - Master Netting and Similar Agreements - Repurchase, Reverse Repurchase, and Securities Borrowing TransactionsNote 24 - Fair Value Of Assets and LiabilitiesNote 24 - Fair Value Of Assets and Liabilities (continued)Note 25 Restructuring, Repositioning, and EfficiencyNote 26 - Parent Company Financial InformationNote 26 - Parent Company Financial Information (continued)Item 9. Changes in and Disagreements with Accountants on Accounting and Financial DisclosureItem 9A. Controls and ProceduresItem 9B. Other InformationPart IIIItem 10. Directors and Executive Officers Of The RegistrantItem 10 Topicsincorporated DisclosuresItem 10 TopicsItem 11. Executive CompensationItem 12. Security Ownership Of Certain Beneficial Owners and Management and Related Stockholder MattersItem 13. Certain Relationships and Related TransactionsItem By Reference. Our Independent Directors and Nominees Are Identified in The First Paragraph Of TheItem 14. Principal Accountant Fees and ServicesPart IVItem 15. Exhibits and Financial Statement SchedulesItem 8 Pagestatement, Note, Or Report Incorporated Into Item 15Item 8 PageItem 16. Form 10-k Summary