FRANK'S INTERNATIONAL N.V.
10-Ks and 10-Qs
|
|
|
|
|
|
|
|
|
|
|
|
|
|
|
|
|
|
|
|
|
|
|
|
|
|
|
|
|
|
|
|
|
|
|
|
|
|
|
|
|
|
|
|
|
|
|
|
|
|
UNITED STATES
SECURITIES AND EXCHANGE COMMISSION
Washington, D.C. 20549
FORM 10-K
(Mark One)
þ
Annual Report Pursuant to Section 13 or 15(d) of
the Securities Exchange Act of 1934
For the fiscal year ended
December 31, 2018
OR
¨
Transition Report Pursuant to Section 13 or 15(d) of
the Securities Exchange Act of 1934
For the transition period from ______ to ______
Commission file number: 001-36053
Frank’s International N.V.
(Exact name of registrant as specified in its charter)
|
The Netherlands
|
98-1107145
|
|||
|
(State or other jurisdiction of
incorporation or organization)
|
(IRS Employer
Identification number)
|
|||
|
Mastenmakersweg 1
|
||||
|
1786 PB Den Helder, the Netherlands
|
Not Applicable
|
|||
|
(Address of principal executive offices)
|
(Zip Code)
|
|||
Registrant’s telephone number, including area code: +31 (0)22 367 0000
|
Securities registered pursuant to Section 12(b) of the Act:
|
||||
|
Title of each class
|
Name of exchange on which registered
|
|||
|
Common Stock, €0.01 par value
|
New York Stock Exchange
|
|||
|
Securities registered pursuant to Section 12(g) of the Act: None
|
||||
Indicate by check mark if the registrant is a well-known seasoned issuer, as defined in Rule 405 of the Securities Act. Yes
¨
No
þ
Indicate by check mark if the registrant is not required to file reports pursuant to Section 13 or Section 15(d) of the Act. Yes
¨
No
þ
Indicate by check mark whether the registrant (1) has filed all reports required to be filed by Section 13 or 15(d) of the Securities Exchange Act of 1934 during the preceding 12 months (or for such shorter period that the Registrant was required to file such reports), and (2) has been subject to such filing requirements for the past 90 days. Yes
þ
No
¨
Indicate by check mark whether the registrant has submitted electronically every Interactive Data File required to be submitted pursuant to Rule 405 of Regulation S-T (§232.405 of this chapter) during the preceding 12 months (or for such shorter period that the registrant was required to submit such files). Yes
þ
No
¨
Indicate by check mark if disclosure of delinquent filers pursuant to Item 405 of Regulation S-K (§229.405 of this chapter) is not contained herein, and will not be contained, to the best of the registrant’s knowledge, in definitive proxy or information statements incorporated by reference in Part III of this Form 10-K or any amendment to this Form 10-K.
¨
Indicate by check mark whether the registrant is a large accelerated filer, an accelerated filer, a non-accelerated filer, a smaller reporting company or an emerging growth company. See the definitions of “large accelerated filer,” “accelerated filer”, “smaller reporting company” and “emerging growth company” in Rule 12b-2 of the Exchange Act.
|
Large accelerated filer
|
¨
|
Accelerated filer
|
þ
|
Non-accelerated filer
|
¨
|
Smaller reporting company
|
¨
|
Emerging growth company
|
¨
|
If an emerging growth company, indicate by check mark if the registrant has elected not to use the extended transition period for complying with any new or revised financial accounting standards provided pursuant to Section 13(a) of the Exchange Act.
¨
Indicate by check mark whether the registrant is a shell company (as defined in Rule 12b-2 of the Act). Yes
¨
No
þ
As of
June 30, 2018
, the aggregate market value of the common stock of the registrant held by non-affiliates of the registrant was approximately
$585.1 million
.
As of
February 18, 2019
, there were
224,455,806
shares of common stock, €0.01 par value per share, outstanding.
DOCUMENTS INCORPORATED BY REFERENCE
Portions of the Proxy Statement in connection with the
2019
Annual Meeting of Stockholders, to be filed no later than 120 days after the end of the fiscal year to which this Form 10-K relates, are incorporated by reference into Part III of this Form 10-K.
|
FRANK’S INTERNATIONAL N.V.
|
||
|
FORM 10-K FOR THE YEAR ENDED DECEMBER 31, 2018
|
||
|
TABLE OF CONTENTS
|
||
|
Page
|
||
|
PART I
|
||
|
Item 1.
|
||
|
Item 1A.
|
||
|
Item 1B.
|
||
|
Item 2.
|
||
|
Item 3.
|
||
|
Item 4.
|
||
|
PART II
|
||
|
Item 5.
|
||
|
Item 6.
|
||
|
Item 7.
|
||
|
Item 7A.
|
||
|
Item 8.
|
||
|
Item 9.
|
||
|
Item 9A.
|
||
|
Item 9B.
|
||
|
PART III
|
||
|
Item 10.
|
||
|
Item 11.
|
||
|
Item 12.
|
||
|
Item 13.
|
||
|
Item 14.
|
||
|
PART IV
|
||
|
Item 15.
|
||
|
Item 16.
|
100
|
|
2
CAUTIONARY NOTE REGARDING FORWARD-LOOKING STATEMENTS
This Annual Report on Form 10-K (this “Form 10-K”) includes certain “forward-looking statements” within the meaning of Section 27A of the Securities Act of 1933, as amended (the “Securities Act”), and Section 21E of the Securities Exchange Act of 1934, as amended (the “Exchange Act”). Forward-looking statements include those that express a belief, expectation or intention, as well as those that are not statements of historical fact. Forward-looking statements include information regarding our future plans and goals and our current expectations with respect to, among other things:
|
•
|
our business strategy and prospects for growth;
|
|
•
|
our cash flows and liquidity;
|
|
•
|
our financial strategy, budget, projections and operating results;
|
|
•
|
the amount, nature and timing of capital expenditures;
|
|
•
|
the availability and terms of capital;
|
|
•
|
competition and government regulations; and
|
|
•
|
general economic conditions.
|
Our forward-looking statements are generally accompanied by words such as “anticipate,” “believe,” “estimate,” “expect,” “goal,” “plan,” “potential,” “predict,” “project,” or other terms that convey the uncertainty of future events or outcomes, although not all forward-looking statements contain such identifying words. The forward-looking statements in this Form 10-K speak only as of the date of this report; we disclaim any obligation to update these statements unless required by law, and we caution you not to rely on them unduly. Forward-looking statements are not assurances of future performance and involve risks and uncertainties. We have based these forward-looking statements on our current expectations and assumptions about future events. While our management considers these expectations and assumptions to be reasonable, they are inherently subject to significant business, economic, competitive, regulatory and other risks, contingencies and uncertainties, most of which are difficult to predict and many of which are beyond our control. These risks, contingencies and uncertainties include, but are not limited to, the following:
|
•
|
the level of activity in the oil and gas industry;
|
|
•
|
further or sustained declines in oil and gas prices, including those resulting from weak global demand;
|
|
•
|
the timing, magnitude, probability and/or sustainability of any oil and gas price recovery;
|
|
•
|
unique risks associated with our offshore operations;
|
|
•
|
political, economic and regulatory uncertainties in our international operations;
|
|
•
|
our ability to develop new technologies and products;
|
|
•
|
our ability to protect our intellectual property rights;
|
|
•
|
our ability to employ and retain skilled and qualified workers;
|
|
•
|
the level of competition in our industry;
|
|
•
|
operational safety laws and regulations;
|
|
•
|
international trade laws and sanctions;
|
|
•
|
weather conditions and natural disasters; and
|
|
•
|
policy changes domestically in the United States.
|
These and other important factors that could affect our operating results and performance are described in (1) Part I, Item 1A “Risk Factors” and in Part II, Item 7 “Management’s Discussion and Analysis of Financial Condition and Results of Operations” of this Form 10-K, and elsewhere within this Form 10-K, (2) our other reports and filings we make with the Securities and Exchange Commission (“SEC”) from time to time and (3) other announcements we make from time to time. Should one or more of the risks or uncertainties described in the documents above or in this Form 10-K occur, or should underlying assumptions prove incorrect, our actual results, performance, achievements or plans could differ materially from those expressed or implied in any forward-looking statements. All such forward-looking statements in the Form 10-K are expressly qualified in their entirety by the cautionary statements in this section.
3
PART I
Item 1.
Business
General
Frank’s International N.V. (“FINV”) is a Netherlands limited liability company (
Naamloze Vennootschap
) and includes the activities of Frank’s International C.V. (“FICV”), Blackhawk Group Holdings, LLC (“Blackhawk”) and their wholly owned subsidiaries (either individually or together, as context requires, the “Company,” “we,” “us” and “our”). We were established in 1938 and are an industry-leading global provider of highly engineered tubular services, tubular fabrication and specialty well construction and well intervention solutions to the oil and gas industry. We provide our services and products to leading exploration and production companies in both offshore and onshore environments, with a focus on complex and technically demanding wells. We believe that we are one of the largest global providers of tubular services to the oil and gas industry.
Our Operations
Tubular services involve the handling and installation of multiple joints of pipe to establish a cased wellbore and the installation of smaller diameter pipe inside a cased wellbore to provide a conduit for produced oil and gas to reach the surface. The casing of a wellbore isolates the wellbore from the surrounding geologic formations and water table, provides well structure and pressure integrity, and allows well operators to target specific zones for production. Given the central role that our services play in the structural integrity, reliability and safety of a well, and the importance of efficient tubular services to managing the overall cost of a well, we believe that our role is vital to the process of producing oil and gas.
In addition to our services offerings, we design and manufacture certain products that we sell directly to external customers, including large outside diameter (“OD”) pipe connectors. We also provide specialized fabrication and welding services in support of deepwater projects in the U.S. Gulf of Mexico, including drilling and production risers, flowlines and pipeline end terminations, as well as long-length tubulars (up to 300 feet in length) for use as caissons or pilings. Finally, we distribute large OD pipe manufactured by third parties, and generally maintain an inventory of this pipe in order to support our pipe sales and distribution operations.
On November 1, 2016, we completed our acquisition of Blackhawk, the ultimate parent company of Blackhawk Specialty Tools, LLC, a leading provider of well construction and well intervention services and products. The acquisition of this new segment allowed us to combine Blackhawk’s cementing tool expertise and well intervention services with our global tubular services to offer our customers an integrated well construction solution across land, shelf and deepwater.
We offer our tubular services, tubular sales, and other well construction and well intervention services and products through our four operating segments: (1) International Services, (2) U.S. Services, (3) Tubular Sales and (4) Blackhawk, each of which is described in more detail in “Description of Business Segments.” The table below shows our consolidated revenue and each segment’s revenue and percentage of consolidated revenue for the periods indicated (revenue in thousands):
|
Year Ended December 31,
|
|||||||||||||||||||
|
2018
|
2017
|
2016
|
|||||||||||||||||
|
Revenue
|
Percent
|
Revenue
|
Percent
|
Revenue
|
Percent
|
||||||||||||||
|
International Services
|
$
|
222,992
|
|
42.6%
|
$
|
206,746
|
|
45.5
|
%
|
$
|
237,207
|
|
48.7
|
%
|
|||||
|
U.S. Services
|
148,941
|
|
28.5%
|
118,815
|
|
26.1
|
%
|
152,827
|
|
31.3
|
%
|
||||||||
|
Tubular Sales
|
61,415
|
|
11.8%
|
58,210
|
|
12.8
|
%
|
87,515
|
|
18.0
|
%
|
||||||||
|
Blackhawk
(1)
|
89,145
|
|
17.1%
|
71,024
|
|
15.6
|
%
|
9,982
|
|
2.0
|
%
|
||||||||
|
Total
|
$
|
522,493
|
|
100.0%
|
$
|
454,795
|
|
100.0
|
%
|
$
|
487,531
|
|
100.0
|
%
|
|||||
(1)
We purchased Blackhawk in November 2016, which resulted in the creation of a new segment. As such, 2016 revenues are for the two months ended December 31, 2016.
4
Our Corporate Structure
We are a publicly traded company on the New York Stock Exchange (“NYSE”). As part of our initial public offering (“IPO”) in August 2013, we issued 52,976,000 shares of our Series A convertible preferred stock (the “Preferred Stock”) and a 25.7% limited partnership interest in FICV, our subsidiary, to Mosing Holdings, LLC (“Mosing Holdings”), a Delaware limited liability company and affiliate of the Company with Mosing family entities as its shareholders. Under our Amended Articles of Association in effect at time of the IPO, upon the written election of Mosing Holdings, each Preferred Share, together with a unit in FICV, our subsidiary, was convertible into a share of our common stock on a one-for-one basis.
On August 19, 2016, we received notice from Mosing Holdings exercising its right to exchange (the “Exchange Right”) for an equivalent number of each of the following securities for common shares: (i) 52,976,000 Preferred Shares and (ii) 52,976,000 units in FICV. We issued 52,976,000 common shares to Mosing Holdings on August 26, 2016. As a result, there are no remaining issued Preferred Shares and Mosing Holdings no longer has a minority interest holding in FICV. As of
February 18, 2019
, the Mosing family collectively owns approximately
62%
of our common shares.
Description of Business Segments
International Services
The International Services segment provides tubular services in international offshore markets and in several onshore international regions in approximately
50
countries on six continents.
Our customers in these international markets are primarily large exploration and production companies, including integrated oil and gas companies and national oil and gas companies, and other oilfield services companies.
U.S. Services
The U.S. Services segment provides tubular services in the active onshore oil and gas drilling regions in the U.S., including the
Permian Basin, Eagle Ford Shale, Haynesville Shale, Marcellus/Utica Shale, Niobrara Shale, Woodford Shale, Green River Basin and Uintah Basin, as well as in the U.S. Gulf of Mexico.
Tubular Sales
The Tubular Sales segment designs, manufactures and distributes large OD pipe, connectors and casing attachments and sells large OD pipe originally manufactured by various pipe mills. We also provide specialized fabrication and welding services in support of offshore projects, including drilling and production risers, flowlines and pipeline end terminations, as well as long-length tubulars (up to 300 feet in length) for use as caissons or pilings. This segment also designs and manufactures proprietary equipment for use in our International Services and U.S. Services segments.
Blackhawk
The Blackhawk segment provides well construction and well intervention services and products, in addition to cementing tool expertise, in the U.S. and Mexican Gulf of Mexico, onshore U.S. and other select international locations. Blackhawk’s customer base consists primarily of major and independent oil and gas companies as well as other oilfield services companies.
Suppliers and Raw Materials
We acquire component parts, products and raw materials from suppliers, including foundries, forge shops, and original equipment manufacturers. The prices we pay for our raw materials may be affected by, among other things, energy, steel and other commodity prices, tariffs and duties on imported materials and foreign currency exchange rates. Certain of our product lines (primarily pipe) are only available from a limited number of suppliers (primarily in the Tubular Sales segment).
Our ability to source low cost raw materials and components, such as steel castings and forgings, is critical to our ability to manufacture our casing products competitively and, in turn, our ability to provide onshore and offshore casing services. In order to purchase raw materials and components in a cost effective manner, we have developed a broad international
5
sourcing capability and we maintain quality assurance and testing programs to analyze and test these raw materials and components.
Patents
We currently hold multiple U.S. and international patents and have a number of pending patent applications. Although in the aggregate our patents and licenses are important to us, we do not regard any single patent or license as critical or essential to our business as a whole.
Seasonality
A substantial portion of our business is not significantly impacted by changing seasons. We can be impacted by hurricanes, ocean currents, winter storms and other disruptions.
Customers
Our customers consist primarily of oil and gas exploration and production companies, both domestic and international, including major and independent companies, national oil companies and, on occasion, other service companies that have contractual obligations to provide casing and handling services or comparable services. Demand for our services depends primarily upon the capital spending of oil and gas companies and the level of drilling activity in the U.S. and internationally. We do not believe the loss of any of our individual customers would have a material adverse effect on our business. No single customer accounted for more than 10% of our revenue for the year ended December 31, 2018. In 2017 and 2016, one customer accounted for 10% and 13% of our revenues, respectively. For both years, all four of our segments generated revenue from this customer.
Competition
The markets in which we operate are competitive. We compete with a number of companies, some of which have financial and other resources greater than ours. The principal competitive factors in our markets are the quality, price and availability of products and services and a company’s responsiveness to customer needs and its reputation for safety. In general, we face a larger number of smaller, more regionally-specific competitors in the U.S. onshore market as compared to offshore markets, where larger competitors dominate.
We believe several factors give us a strong competitive position. In particular, we believe our products and services in each segment fulfill our customer’s requirements for international capability, availability of tools, range of services provided, intellectual property, technological sophistication, quality assurance systems and availability of equipment, along with reputation and safety record. We seek to differentiate ourselves from our competitors by providing a rapid response to the needs of our customers, a high level of customer service and innovative product development initiatives. Although we have no single competitor across all of our product lines, we believe that Weatherford International represents our most direct competitor across our segments for providing tubular services, specialty well construction and well intervention services and products on an aggregate, global basis.
Market Environment
Despite recent headwinds, in 2019 we expect to see increased customer spending globally on oil and natural gas exploration and production in response to the continued stabilization of commodity prices. Much of the anticipated increase in spending will continue to be associated with U.S. onshore projects, although we anticipate the rate of spending outside of U.S. onshore to increase in 2019. Activity in the deep and ultra-deep offshore markets is expected to see some modest improvement in 2019, and pricing of newly sanctioned projects is estimated to be marginally higher than recent trends. In many international offshore shelf markets, we are seeing increased activity as operators are increasingly seeing improved economics at current commodity prices. In response, we will continue our efforts to expand products and services historically weighted to the U.S. market to international markets, reducing costs through operational efficiency gains and prioritizing projects that improve market share and profitability.
6
Inventories and Working Capital
An important consideration for many of our customers in selecting a vendor is timely availability of the product or service. Often customers will pay a premium for earlier or immediate availability because of the cost of delays in critical operations. This availability is especially critical for our proprietary products, causing us to carry inventories for these products. For critical capital items for which demand is expected to be strong, we often build certain items before we have a firm order. Having such goods available on short notice can be of great value to our customers.
Inventories are required to be stated at the lower of cost or net realizable value. During 2017, we recorded an impairment of
$51.2 million
related to a lower of cost or net realizable value adjustment for our pipe and connectors inventory, which is included in the financial statement line item severance and other charges (credits), net on our consolidated statements of operations. The factors that led to this impairment included new technology (external and internal), oil and gas prices below levels necessary for our customers to sanction a significant amount of new offshore projects in the near-term and a change in customers’ preferences for newer technologies, all of which significantly impacted the net realizable value of our connectors inventory.
We cannot accurately predict what or how many products our customers will need in the future. Orders are placed with our suppliers based on forecasts of customer demand and, in some instances, we may establish buffer inventories to accommodate anticipated demand. If we overestimate customer demand, we may allocate resources to the purchase of material or manufactured products that we may not be able to sell when we expect to, if at all.
Environmental, Occupational Health and Safety Regulation
Our operations are subject to numerous stringent and complex laws and regulations governing the emission and discharge of materials into the environment, occupational health and safety aspects of our operations, or otherwise relating to environmental protection. Failure to comply with these laws or regulations or to obtain or comply with permits may result in the assessment of administrative, civil and criminal penalties, imposition of remedial or corrective action requirements, and the imposition of orders or injunctions to prohibit or restrict certain activities or force future compliance.
Numerous governmental authorities, such as the U.S. Environmental Protection Agency (“EPA”), analogous state agencies and, in certain circumstances, citizens’ groups, have the power to enforce compliance with these laws and regulations and the permits issued under them. Certain environmental laws may impose joint and several liability, without regard to fault or the legality of the original conduct, on classes of persons who are considered to be responsible for the release of a hazardous substance into the environment. The trend in environmental regulation has been to impose increasingly stringent restrictions and limitations on activities that may impact the environment, and thus, any changes in environmental laws and regulations or in enforcement policies that result in more stringent and costly waste handling, storage, transport, disposal, or remediation requirements could have a material adverse effect on our operations and financial position. Moreover, accidental releases or spills of regulated substances may occur in the course of our operations, and we cannot assure that we will not incur significant costs and liabilities as a result of such releases or spills, including any third-party claims for damage to property, natural resources or persons.
The following is a summary of the more significant existing environmental, health and safety laws and regulations to which our business operations are subject and for which compliance could have a material adverse impact on our capital expenditures, results of operations or financial position.
Hazardous Substances and Waste
The Resource Conservation and Recovery Act (“RCRA”) and comparable state statutes, regulate the generation, transportation, treatment, storage, disposal and cleanup of hazardous and non-hazardous wastes. Under the auspices of the EPA, the individual states administer some or all of the provisions of RCRA, sometimes in conjunction with their own, more stringent requirements. We are required to manage the transportation, storage and disposal of hazardous and non-hazardous wastes in compliance with RCRA. Certain petroleum exploration and production wastes are excluded from RCRA’s hazardous waste regulations. However, it is possible that these wastes will in the future be designated as hazardous wastes and therefore be subject to more rigorous and costly disposal requirements. For example, in December 2016, the EPA and environmental groups entered into a consent decree to address EPA’s alleged failure to timely assess its RCRA
7
Subtitle D criteria regulations exempting certain exploration and production related oil and gas wastes from regulation as hazardous wastes. The consent decree requires EPA to propose a rulemaking no later than March 15, 2019 for any revisions relating to oil and gas wastes or to sign a determination that revision of the regulations is not necessary. Any such changes in the laws and regulations could have a material adverse effect on our operating expenses or the operating expenses of our customers, which could result in decreased demand for our services.
The Comprehensive Environmental Response, Compensation, and Liability Act (“CERCLA”), also known as the Superfund law, imposes joint and several liability, without regard to fault or legality of conduct, on classes of persons who are considered to be responsible for the release of a hazardous substance into the environment. These persons include the owner or operator of the site where the release occurred, and anyone who disposed or arranged for the disposal of a hazardous substance released at the site. We currently own, lease, or operate numerous properties that have been used for manufacturing and other operations for many years. We also contract with waste removal services and landfills. These properties and the substances disposed or released on them may be subject to CERCLA, RCRA and analogous state laws. Under such laws, we could be required to remove previously disposed substances and wastes, remediate contaminated property, or perform remedial operations to prevent future contamination. In addition, it is not uncommon for neighboring landowners and other third parties to file claims for personal injury and property damage allegedly caused by hazardous substances released into the environment.
Water Discharges
The Federal Water Pollution Control Act (the “Clean Water Act”) and analogous state laws impose restrictions and strict controls with respect to the discharge of pollutants, including spills and leaks of oil and other substances, into waters of the United States. The discharge of pollutants into regulated waters is prohibited, except in accordance with the terms of a permit issued by the EPA or an analogous state agency. A responsible party includes the owner or operator of a facility from which a discharge occurs. Previously, in 2015, the EPA and the U.S. Army Corps of Engineers finalized a rule that would significantly expand the scope of the Clean Water Act’s jurisdictional, potential expanding the areas that would require permits prior to commencing construction or exploration and production activities. This rule has the potential to adversely affect our U.S. customers, which in turn could decrease demand for our services. However, in December 2018 the EPA proposed several legal challenges to the rule followed, along with attempts to stay implementation following the change in presidential administration. Currently, the rule is being implemented in 22 states but is enjoined in 28 states. Recently, in December 2018, the EPA and the Corps proposed a replacement rule that provides for more limited Clean Water Act Jurisdiction. Several groups have already announced their intentions to challenge the proposed rule. Therefore, the scope of jurisdiction under the Clean Water Act is uncertain at this time. The Clean Water Act and analogous state laws provide for administrative, civil and criminal penalties for unauthorized discharges and, together with the Oil Pollution Act of 1990, impose rigorous requirements for spill prevention and response planning, as well as substantial potential liability for the costs of removal, remediation, and damages in connection with any unauthorized discharges. Pursuant to these laws and regulations, we may be required to obtain and maintain approvals or permits for the discharge of wastewater or storm water from our operations and may be required to develop and implement spill prevention, control and countermeasure plans, also referred to as “SPCC plans,” in connection with on-site storage of significant quantities of oil, including refined petroleum products.
Air Emissions
The federal Clean Air Act and comparable state laws regulate emissions of various air pollutants through air emissions permitting programs and the imposition of other emission control requirements. In addition, the EPA has developed, and continues to develop, stringent regulations governing emissions of toxic air pollutants at specified sources. Non-compliance with air permits or other requirements of the federal Clean Air Act and associated state laws and regulations can result in the imposition of administrative, civil and criminal penalties, as well as the issuance of orders or injunctions limiting or prohibiting non-compliant operations. Over the next several years, we may be required to incur certain capital expenditures for air pollution control equipment or other air emissions related issues. For example, in October 2015, the EPA lowered the National Ambient Air Quality Standard, or NAAQS, for ozone from 75 to 70 parts per billion and completed attainment/nonattainment designation in July 2018. State implementation of the revised NAAQS could result in stricter air emissions permitting requirements, delay or prohibit our ability to obtain such permits, and result in increased expenditures for pollution control equipment, the costs of which could be significant. We do not believe that any of our operations are subject to the federal Clean Air Act permitting or regulatory requirements for major sources of air emissions, but some of our facilities
8
could be subject to state “minor source” air permitting requirements and other state regulatory requirements applicable to air emissions, such as source registration and recordkeeping requirements.
Climate Change
The EPA has determined that emissions of carbon dioxide, methane and other “greenhouse gases” present an endangerment to public health and the environment because emissions of such gases are contributing to warming of the Earth’s atmosphere and other climatic changes. Based on these findings, the EPA has begun adopting and implementing regulations to restrict emissions of greenhouse gases under existing provisions of the federal Clean Air Act. The EPA has proposed various measures regulating the emission of greenhouse gases, including proposed performance standards for new and existing power plants, and pre-construction and operating permit requirements for certain large stationary sources already subject to the Clean Air Act. Many of these actions are currently subject to legal challenge and we cannot predict what the final scope of federal greenhouse gas regulations may be or the costs that our operations or the operations of our customers may incur as a result of such regulations. The EPA has also adopted rules requiring the reporting of greenhouse gas emissions from specified large greenhouse gas emission sources in the United States, as well as onshore and offshore oil and gas production facilities, on an annual basis.
The EPA had previously finalized standards in June 2016 designed to reduce methane emissions from certain oil and gas facilities by installing additional pollution controls and requiring enhanced leak detection and repair programs. In June 2017, the EPA published a proposed rule to stay portions of these 2016 standards for two years and reconsider the entirety of the 2016 standards, but in July 2017, the U.S. Court of Appeals for the District of Columbia Circuit ruled that such a stay was unlawful. In September 2018, the EPA proposed amendments to the 2016 standards that would relax the rule’s fugitive emissions monitoring requirements and expand exceptions to pneumatic pump requirements, among other changes. Various industry and environmental groups separately challenged the original and amended methane requirements and the EPA’s attempts to delay implementation of the rules. In addition, in April 2018, several states filed a lawsuit that seeks to compel the EPA to issue methane performance standards for existing sources in the oil and natural gas source category. These methane rules, to the extent implemented, have the potential to impose significant costs on our customers. Moreover, as a result of the developments described above, substantial uncertainty exists with respect to implementation of the EPA’s 2016 methane rule. However, given the long-term trend toward increasing regulation, future federal greenhouse regulations of the oil and gas industry remain a possibility, and several states have separately imposed their own regulations on methane emissions from oil and gas production activities.
While the U.S. Congress has yet to adopt legislation to reduce emissions of greenhouse gases, many of the states have already taken legal measures to reduce emissions of greenhouse gases. For example, the state of California has adopted a “cap and trade program” that requires major sources of greenhouse gas emissions to acquire and surrender emission allowances. The number of allowances available for purchase is reduced each year in an effort to achieve the overall greenhouse gas emission reduction goal. On an international level, the United States is one of almost 200 nations that, in December 2015, agreed to an international climate change agreement in Paris, France, that calls for countries to set their own greenhouse gas emissions targets and be transparent about the measures each country will use to achieve its greenhouse gas emissions targets (“Paris Agreement”). The Paris Agreement was signed by the United States in April 2016 and entered into force on November 4, 2016; however, the Paris Agreement does not impose any binding obligations on its participants. In August 2017, the U.S. Department of State officially informed the United Nations of the United States’ intent to withdraw from the Paris Agreement. The Paris Agreement provides for a four-year exit process beginning when it took effect in November 2016, which would result in an effective exit date of November 2020. The United States’ adherence to the exit process and/or the terms on which the United States may reenter the Paris Agreement or a separately negotiated agreement are unclear at this time.
The adoption of legislation or regulatory programs in the U.S. or abroad designed to reduce emissions of greenhouse gases could require us or our customers to incur increased operating costs, such as costs to purchase and operate emissions control systems, to acquire emissions allowances, pay carbon taxes, or comply with new regulatory or reporting requirements. Also, new legislation or regulatory programs related to the control of greenhouse gas emissions could encourage the use of alternative fuels or otherwise increase the cost of consuming, and thereby reduce demand for, the oil and gas produced by our customers. Consequently, legislation and regulatory programs to reduce emissions of greenhouse gases could have an adverse effect on our business, financial condition and results of operations.
9
Recently, activists concerned about the potential effects of climate change have directed their attention at sources of funding for energy companies, which has resulted in certain financial institutions, funds and other sources of capital restricting or eliminating or reducing their investment in oil and natural gas activities. Ultimately, this could make it more difficult to secure funding for exploration, development, production, and acquisition activities, which in turn could decrease demand for our services and products and adversely affect our business and results of operations. Shareholder activists have also put forth proposals directly to energy companies that, if successful, could require such companies to adopt carbon emission reduction targets or otherwise shift their operations away from less carbon intensive activities. Notwithstanding potential risks related to climate change, the International Energy Agency estimates that global energy demand will continue to rise and will not peak until after 2040 and that oil and gas will continue to represent a substantial percentage of global energy use over that time. Finally, it should be noted that some scientists have concluded that increasing concentrations of greenhouse gases in the Earth’s atmosphere may produce climate changes that have significant physical effects, such as increased frequency and severity of storms, droughts, and floods and other extreme weather events. Offshore operations are particularly susceptible to damage from extreme weather events. If any of the potential effects of climate change were to occur, they could have an adverse effect on our business, financial condition and results of operations.
Hydraulic Fracturing
Hydraulic fracturing is an important and common practice in the oil and gas industry. The process involves the injection of water, sand and chemicals under pressure into a formation to fracture the surrounding rock and stimulate production of hydrocarbons. While we may provide supporting products through Blackhawk, we do not perform hydraulic fracturing, but many of our onshore customers utilize this technique. Certain environmental advocacy groups and regulatory agencies have suggested that additional federal, state and local laws and regulations may be needed to more closely regulate the hydraulic fracturing process, and have made claims that hydraulic fracturing techniques are harmful to surface water and drinking water resources and may cause earthquakes. Various governmental entities (within and outside the United States) are in the process of studying, restricting, regulating or preparing to regulate hydraulic fracturing, directly or indirectly. For example, the EPA has already begun to regulate certain hydraulic fracturing operations involving diesel under the Underground Injection Control program of the federal Safe Drinking Water Act. In December 2016, the EPA released its final report on the potential impacts of hydraulic fracturing on drinking water resources, which concluded “water cycle” activities associated with hydraulic fracturing may impact drinking water sources “under some circumstances,” noting that the following hydraulic fracturing water cycle activities and local - or regional - scale factors are more likely than others to result in more frequent or more severe impacts: water withdrawals for fracturing in times or areas of low water availability; surface spills during the management of fracturing fluids, chemicals or produced water; injection of fracturing fluids into wells with inadequate mechanical integrity; injection of fracturing fluids directly into groundwater resources; discharge of inadequately treated fracturing wastewater to surface waters; and disposal or storage of fracturing wastewater in unlined pits. Based on the report’s findings, additional regulation of hydraulic fracturing by the EPA appears unlikely at this time. However, states and local governments may also seek to limit hydraulic fracturing activities through time, place, and manner restrictions on operations or ban the process altogether. The adoption of legislation or regulatory programs that restrict hydraulic fracturing could adversely affect, reduce or delay well drilling and completion activities, increase the cost of drilling and production, and thereby reduce demand for our services.
Employee Health and Safety
We are subject to a number of federal and state laws and regulations, including the Occupational Safety and Health Act (“OSHA”) and comparable state statutes, establishing requirements to protect the health and safety of workers. In addition, the OSHA hazard communication standard, the EPA community right-to-know regulations under Title III of the federal Superfund Amendment and Reauthorization Act and comparable state statutes require that information be maintained concerning hazardous materials used or produced in our operations and that this information be provided to employees, state and local government authorities and the public. Substantial fines and penalties can be imposed and orders or injunctions limiting or prohibiting certain operations may be issued in connection with any failure to comply with laws and regulations relating to worker health and safety.
We also operate in non-U.S. jurisdictions, which may impose similar legal requirements. We do not believe that compliance with existing environmental laws and regulations will have a material adverse impact on us. However, we also believe that it is reasonably likely that the trend in environmental legislation and regulation will continue toward stricter standards and, thus, we cannot give any assurance that we will not be adversely affected in the future.
10
Operating Risk and Insurance
We maintain insurance coverage of types and amounts that we believe to be customary and reasonable for companies of our size and with similar operations. In accordance with industry practice, however, we do not maintain insurance coverage against all of the operating risks to which our business is exposed. Therefore, there is a risk our insurance program may not be sufficient to cover any particular loss or all losses.
Currently, our insurance program includes, among other things, general liability, umbrella liability, sudden and accidental pollution, personal property, vehicle, workers’ compensation, and employer’s liability coverage. Our insurance includes various limits and deductibles or retentions, which must be met prior to or in conjunction with recovery.
Employees
At
December 31, 2018
, we had approximately 3,100 employees worldwide. We are a party to collective bargaining agreements or other similar arrangements in certain international areas in which we operate, such as Brazil, Asia Pacific, Africa and Europe. We consider our relations with our employees to be satisfactory.
Available Information
Our principal executive offices are located at Mastenmakersweg 1, 1786 PB Den Helder, the Netherlands, and our telephone number at that address is +31 (0)22 367 0000. Our primary U.S. offices are located at 10260 Westheimer Rd., Houston, Texas 77042, and our telephone number at that address is (281) 966-7300. Our website address is
www.franksinternational.com
, and we make available free of charge through our website our Annual Reports on Form 10-K, Proxy Statements, Quarterly Reports on Form 10-Q, Current Reports on Form 8-K, and all amendments to those reports, as soon as reasonably practicable after such materials are electronically filed with or furnished to the SEC. Our website also includes general information about us, including our Corporate Code of Business Conduct and Ethics, Financial Code of Ethics, Corporate Governance Guidelines, Whistleblower Policy and charters for the Audit Committee, Compensation Committee and Nominating and Governance Committee of our Board of Supervisory Directors. We may from time to time provide important disclosures to investors by posting them in the investor relations section of our website, as allowed by SEC rules. Also, it is our intention to provide disclosure of amendments and waivers by website posting. Information on our website or any other website is not incorporated by reference herein and does not constitute a part of this report.
Our common stock is traded on the NYSE under the symbol (“FI”).
Item 1A.
Risk Factors
Risks Related to Our Business
You should carefully consider the risks described below together with the other information contained in this Form 10-K. Realization of any of the following risks could have a material adverse effect on our business, financial condition, cash flows and results of operations.
Our business depends on the level of activity in the oil and gas industry, which is significantly affected by oil and gas prices and other factors.
Our business depends on the level of activity in oil and gas exploration, development and production in market sectors worldwide. Oil and gas prices and market expectations of potential changes in these prices significantly affect this level of activity. However, higher commodity prices do not necessarily translate into increased drilling or well construction and completion activity, since customers’ expectations of future commodity prices typically drive demand for our services. The availability of quality drilling prospects, exploration success, relative production costs, the stage of reservoir development and political and regulatory environments also affect the demand for our services. Worldwide military, political and economic events have in the past contributed to oil and gas price volatility and are likely to do so in the future. The demand for our products and services may be affected by numerous factors, including:
11
|
•
|
the level of worldwide oil and gas exploration and production;
|
|
•
|
the cost of exploring for, producing and delivering oil and gas;
|
|
•
|
demand for energy, which is affected by worldwide economic activity and population growth;
|
|
•
|
the level of excess production capacity;
|
|
•
|
the discovery rate of new oil and gas reserves;
|
|
•
|
the ability of the Organization of the Petroleum Exporting Countries (“OPEC”) to set and maintain production levels for oil;
|
|
•
|
the level of production by non-OPEC countries;
|
|
•
|
U.S. and global political and economic uncertainty, socio-political unrest and instability or hostilities;
|
|
•
|
demand for, availability of and technological viability of, alternative sources of energy; and
|
|
•
|
technological advances affecting energy exploration, production, transportation and consumption.
|
Demand for our offshore services substantially depends on the level of activity in offshore oil and gas exploration, development and production. The level of offshore activity is historically cyclical and characterized by large fluctuations in response to relatively minor changes in a variety of factors, including oil and gas prices, which could have a material adverse effect on our business, financial condition and results of operations.
A significant amount of our U.S. onshore business is focused on unconventional shale resource plays. The demand for those services is substantially affected by oil and gas prices and market expectations of potential changes in these prices. If commodity prices go below a certain threshold for an extended period of time, demand for our services and products in the U.S. onshore market could be reduced, which could have a material adverse effect on our business, financial condition and results of operations.
Oil and gas prices are extremely volatile and have fluctuated during the year ended
December 31, 2018
, with average daily prices for New York Mercantile Exchange West Texas Intermediate ranging from a low of approximately $44/Bbl in December
2018
to a high of approximately $77/Bbl in June
2018
. Any actual or anticipated reduction in oil or gas prices may reduce the level of exploration, drilling and production activities. Prolonged lower oil prices have resulted in softer demand for our products and services. Further, we have reduced pricing in some of our customer contracts in light of the volatility of the oil and gas market.
Furthermore, the oil and gas industry has historically experienced periodic downturns, which have been characterized by reduced demand for oilfield products and services and downward pressure on the prices we charge. A significant downturn in the oil and gas industry has adversely affected the demand for oilfield services and our business, financial condition and results of operations.
The recent downturn in the oil and gas industry has negatively affected and will likely continue to affect our ability to accurately predict customer demand, causing us to potentially hold excess or obsolete inventory and experience a reduction in gross margins and financial results.
We cannot accurately predict what or how many products our customers will need in the future. Orders are placed with our suppliers based on forecasts of customer demand and, in some instances, we may establish buffer inventories to accommodate anticipated demand. Our forecasts of customer demand are based on multiple assumptions, each of which may introduce errors into the estimates. In addition, many of our suppliers, such as those for certain of our standardized valves, require a longer lead time to provide products than our customers demand for delivery of our finished products. If we overestimate customer demand, we may allocate resources to the purchase of material or manufactured products that we may not be able to sell when we expect to, if at all. As a result, we would hold excess or obsolete inventory, which would reduce gross margin and adversely affect financial results. Conversely, if we underestimate customer demand or if insufficient manufacturing capacity is available, we would miss revenue opportunities and potentially lose market share and damage our customer relationships. In addition, any future significant cancellations or deferrals of product orders or the return of previously sold products could materially and adversely affect profit margins, increase product obsolescence and restrict our ability to fund our operations.
12
Physical dangers are inherent in our operations and may expose us to significant potential losses. Personnel and property may be harmed during the process of drilling for oil and gas.
Drilling for and producing oil and gas, and the associated services that we provide, include inherent dangers that may lead to property damage, personal injury, death or the discharge of hazardous materials into the environment. Many of these events are outside our control. Typically, we provide services at a well site where our personnel and equipment are located together with personnel and equipment of our customers and third parties, such as other service providers. At many sites, we depend on other companies and personnel to conduct drilling operations in accordance with applicable environmental laws and regulations and appropriate safety standards. From time to time, personnel are injured or equipment or property is damaged or destroyed as a result of accidents, failed equipment, faulty products or services, failure of safety measures, uncontained formation pressures, or other dangers inherent in drilling for oil and gas. Often, our services are deployed on more challenging prospects, particularly deepwater offshore drilling sites, where the occurrence of the types of events mentioned above can have an even more catastrophic impact on people, equipment and the environment. Such events may expose us to significant potential losses, which could adversely affect our business, financial condition and results of operations.
We are vulnerable to risks associated with our offshore operations that could negatively impact our business, financial condition and results of operations.
We conduct offshore operations in the U.S. Gulf of Mexico and almost every significant international offshore market, including Africa, the Middle East, Latin America, Europe, the Asia Pacific region and several other producing regions. Our operations and financial results could be significantly impacted by conditions in some of these areas because we are vulnerable to certain unique risks associated with operating offshore, including those relating to:
|
•
|
hurricanes, ocean currents and other adverse weather conditions;
|
|
•
|
terrorist attacks, such as piracy;
|
|
•
|
failure of offshore equipment and facilities;
|
|
•
|
local and international political and economic conditions and policies and regulations related to offshore drilling;
|
|
•
|
unavailability of offshore drilling rigs in the markets that we operate;
|
|
•
|
the cost of offshore exploration for, and production and transportation of, oil and gas;
|
|
•
|
successful exploration for, and production and transportation of, oil and gas from onshore sources;
|
|
•
|
the availability and rate of discovery of new oil and gas reserves in offshore areas;
|
|
•
|
the availability of infrastructure to support oil and gas operations; and
|
|
•
|
the ability of oil and gas companies to generate or otherwise obtain funds for exploration and production.
|
While the impact of these factors is difficult to predict, any one or more of these factors could adversely affect our business, financial condition and results of operations.
Our international operations and revenue expose us to political, economic and other uncertainties inherent to international business.
We have substantial international operations, and we intend to grow those operations further. For the years ended
December 31, 2018
,
2017
and
2016
, international operations accounted for approximately 46%, 46% and 49%, respectively, of our revenue. Our international operations are subject to a number of risks inherent in any business operating in foreign countries, including, but not limited to, the following:
|
•
|
political, social and economic instability;
|
|
•
|
potential expropriation, seizure or nationalization of assets;
|
|
•
|
deprivation of contract rights;
|
|
•
|
increased operating costs;
|
13
|
•
|
inability to collect revenues due to shortages of convertible currency;
|
|
•
|
unwillingness of foreign governments to make new onshore and offshore areas available for drilling;
|
|
•
|
civil unrest and protests, strikes, acts of terrorism, war or other armed conflict;
|
|
•
|
import/export quotas;
|
|
•
|
confiscatory taxation or other adverse tax policies;
|
|
•
|
continued application of foreign tax treaties;
|
|
•
|
currency exchange controls;
|
|
•
|
currency exchange rate fluctuations and devaluations;
|
|
•
|
restrictions on the repatriation of funds; and
|
|
•
|
other forms of government regulation which are beyond our control.
|
Instability and disruptions in the political, regulatory, economic and social conditions of the foreign countries in which we conduct business, including economically and politically volatile areas such as Africa, the Middle East, Latin America and the Asia Pacific region, could cause or contribute to factors that could have an adverse effect on the demand for the products and services we provide. Worldwide political, economic, and military events have contributed to oil and gas price volatility and are likely to continue to do so in the future. Depending on the market prices of oil and gas, oil and gas exploration and development companies may cancel or curtail their drilling programs, thereby reducing demand for our services.
While the impact of these factors is difficult to predict, any one or more of these factors could adversely affect our business, financial condition and results of operations.
To compete in our industry, we must continue to develop new technologies and products to support our operations, secure and maintain patents related to our current and new technologies and products and protect and enforce our intellectual property rights.
The markets for our services and products are characterized by continual technological developments. While we believe that the proprietary products we have developed provide us with technological advances in providing services to our customers, substantial improvements in the scope and quality of the products in the market we operate may occur over a short period of time. In addition, alternative products and services may be developed which may compete with or displace our products and services. If we are not able to develop commercially competitive products in a timely manner in response, our ability to service our customers’ demands may be adversely affected. Our future ability to develop new products in order to support our services depends on our ability to design and produce products that allow us to meet the needs of our customers and third parties on an integrated basis, and obtain and maintain patent protection.
We may encounter resource constraints, technical barriers, or other difficulties that would delay introduction of new services and related products in the future. Our competitors may introduce new products or obtain patents before we do and achieve a competitive advantage. Additionally, the time and expense invested in product development may not result in commercial applications.
We currently hold multiple U.S. and international patents and have multiple pending patent applications for products and processes. Patent rights give the owner of a patent the right to exclude third parties from making, using, selling, and offering for sale the inventions claimed in the patents in the applicable country. Patent rights do not necessarily grant the owner of a patent the right to practice the invention claimed in a patent, but merely the right to exclude others from practicing the invention claimed in the patent. It may also be possible for a third party to design around our patents. Furthermore, patent rights have strict territorial limits. Some of our work will be conducted in international waters and would, therefore, not fall within the scope of any country’s patent jurisdiction. We may not be able to enforce our patents against infringement occurring in international waters and other “non-covered” territories. Also, we do not have patents in every jurisdiction in which we conduct business and our patent portfolio will not protect all aspects of our business and may relate to obsolete or unusual methods, which would not prevent third parties from entering the same market.
14
We attempt to limit access to and distribution of our technology and trade secrets by customarily entering into confidentiality agreements with our employees, customers and potential customers and suppliers. However, our rights in our confidential information, trade secrets, and confidential know-how will not prevent third parties from independently developing similar information. Publicly available information (for example, information in expired issued patents, published patent applications, and scientific literature) can also be used by third parties to independently develop technology. We cannot provide assurance that this independently developed technology will not be equivalent or superior to our proprietary technology.
In addition, we may become involved in legal proceedings from time to time to protect and enforce our intellectual property rights. Third parties from time to time may initiate litigation against us by asserting that the conduct of our business infringes, misappropriates or otherwise violates intellectual property rights. We may not prevail in any such legal proceedings related to such claims, and our products and services may be found to infringe, impair, misappropriate, dilute or otherwise violate the intellectual property rights of others. Any legal proceeding concerning intellectual property could be protracted and costly and is inherently unpredictable and could have a material adverse effect on our business, regardless of its outcome. Further, our intellectual property rights may not have the value that management believes them to have and such value may change over time as we and others develop new product designs and improvements.
Our operations may be adversely affected by various laws and regulations in countries in which we operate relating to the equipment and operation of drilling units, oil and gas exploration and development, as well as import and export activities.
Governments in some foreign countries have been increasingly active in regulating and controlling the ownership of concessions and companies holding concessions, the exploration for oil and gas and other aspects of the oil and gas industries in their countries, including local content requirements for participating in tenders for certain tubular and well construction services. We operate in several of these countries, including Angola, Nigeria, Indonesia, Malaysia, Brazil and Canada. Many governments favor or effectively require that contracts be awarded to local contractors or require foreign contractors to employ citizens of, or purchase supplies from, a particular jurisdiction. These practices may result in inefficiencies or put us at a disadvantage when we bid for contracts against local competitors.
In addition, the shipment of goods, services and technology across international borders subjects us to extensive trade laws and regulations. Our import and export activities are governed by unique customs laws and regulations in each of the countries where we operate. Moreover, many countries control the import and export of certain goods, services and technology and impose related import and export recordkeeping and reporting obligations. Governments also may impose economic sanctions against certain countries, persons and other entities that may restrict or prohibit transactions involving such countries, persons and entities, and we are also subject to the U.S. anti-boycott law. In addition, certain anti-dumping regulations in the U.S. and other countries in which we operate may prohibit us from purchasing pipe from certain suppliers.
The laws and regulations concerning import and export activity, recordkeeping and reporting, import and export control and economic sanctions are complex and constantly changing. These laws and regulations may be enacted, amended, enforced or interpreted in a manner materially impacting our operations. An economic downturn may increase some foreign governments’ efforts to enact, enforce, amend or interpret laws and regulations as a method to increase revenue. Materials that we import can be delayed and denied for varying reasons, some of which are outside our control and some of which may result from failure to comply with existing legal and regulatory regimes. Shipping delays or denials could cause unscheduled operational downtime. Any failure to comply with these applicable legal and regulatory obligations also could result in criminal and civil penalties and sanctions, such as fines, imprisonment, debarment from government contracts, seizure of shipments and loss of import and export privileges.
We may be exposed to unforeseen risks in our services and product manufacturing, which could adversely affect our results of operations.
We operate a number of manufacturing facilities to support our operations. In addition, we also manufacture certain products, including large OD pipe connectors and cementing products that we sell directly to external customers. The equipment and management systems necessary for such operations may break down, perform poorly or fail, resulting in fluctuations in manufacturing efficiencies. Additionally, some of our U.S. onshore business may be conducted under fixed
15
price or “turnkey” contracts. Under fixed price contracts, we agree to perform a defined scope of work for a fixed price. Prices for these contracts are based largely upon estimates and assumptions relating to project scope and specifications, personnel and material needs.
Fluctuations in our manufacturing process and inaccurate estimates and assumptions used in our projects may occur due to factors out of our control, resulting in cost overruns, which we may be required to absorb and could have a material adverse effect on our business, financial condition and results of operations. Such fluctuations or incorrect estimates may affect our ability to deliver services and products to our customers on a timely basis and we may suffer financial penalties and a diminution of our commercial reputation and future product orders, which could adversely affect our business, financial condition and results of operations.
We may be unable to employ a sufficient number of skilled and qualified workers to sustain or expand our current operations.
Our operations require personnel with specialized skills and experience. Our ability to be productive and profitable will depend upon our ability to employ and retain skilled workers. In addition, our ability to expand our operations depends in part on our ability to increase the size of our skilled labor force. The demand for skilled workers is high, the supply can be limited in certain jurisdictions, and the cost to attract and retain qualified personnel has increased over the past few years. In addition, we are currently a party to collective bargaining or similar agreements in certain international areas in which we operate, which could result in increases in the wage rates that we must pay to retain our employees. Furthermore, a significant increase in the wages paid by competing employers could result in a reduction of our skilled labor force, increases in the wage rates that we must pay, or both. If any of these events were to occur, our capacity could be diminished, our ability to respond quickly to customer demands or strong market conditions may be inhibited and our growth potential could be impaired, any of which could have a material adverse effect on our business, financial condition and results of operations.
We operate in an intensively competitive industry, and if we fail to compete effectively, our business will suffer.
Our competitors may attempt to increase their market share by reducing prices, or our customers may adopt competing technologies. The drilling industry is driven primarily by cost minimization, and our strategy is aimed at reducing drilling costs through the application of new technologies. Our competitors, many of whom have a more diverse product line and access to greater amounts of capital than we do, have the ability to compete against the cost savings generated by our technology by reducing prices and by introducing competing technologies. Our competitors may also have the ability to offer bundles of products and services to customers that we do not offer. We have limited resources to sustain prolonged price competition and maintain the level of investment required to continue the commercialization and development of our new technologies. Any failure to continue to do so could adversely affect our business, financial condition or results of operations.
Our business depends upon our ability to source low cost raw materials and components, such as steel castings and forgings. Increased costs of raw materials and other components may result in increased operating expenses.
Our ability to source low cost raw materials and components, such as steel castings and forgings, is critical to our ability to manufacture our drilling products competitively and, in turn, our ability to provide onshore and offshore drilling services. Should our current suppliers be unable to provide the necessary raw materials or components or otherwise fail to deliver such materials and components timely and in the quantities required, resulting delays in the provision of products or services to customers could have a material adverse effect on our business.
In particular, we have experienced increased costs in recent years due to rising steel prices. There is also strong demand within the industry for forgings, castings and outsourced coating services necessary for us to make our products. We cannot assure that we will be able to continue to purchase these raw materials on a timely basis or at historical prices. Our results of operations may be adversely affected by our inability to manage the rising costs and availability of raw materials and components used in our products.
16
We are subject to the risk of supplier concentration.
Certain of our product lines in the Tubular Sales segment and Blackhawk segment depend on a limited number of third party suppliers. The suppliers for the Tubular Sales segment are concentrated in Japan (2) and Germany (2) and are vendors for pipe (driven by customer requirements) while the three suppliers for the Blackhawk segment are concentrated in the U.S. As a result of this concentration in some of our supply chains, our business and operations could be negatively affected if our key suppliers were to experience significant disruptions affecting the price, quality, availability or timely delivery of their products. The partial or complete loss of any one of our key suppliers, or a significant adverse change in the relationship with any of these suppliers, through consolidation or otherwise, would limit our ability to manufacture or sell certain of our products.
Our services and products are provided in connection with operations that are subject to potential hazards inherent in the oil and gas industry, and, as a result, we are exposed to potential liabilities that may affect our financial condition and reputation.
Our services and products are provided in connection with potentially hazardous drilling, completion and production applications in the oil and gas industry where an accident can potentially have catastrophic consequences. This is particularly true in deepwater operations. Risks inherent to these applications, such as equipment malfunctions and failures, equipment misuse and defects, explosions, blowouts and uncontrollable flows of oil, gas or well fluids and natural disasters, on land or in deepwater or shallow water environments, can cause personal injury, loss of life, suspension of operations, damage to formations, damage to facilities, business interruption and damage to or destruction of property, surface water and drinking water resources, equipment, natural resources and the environment. If our services fail to meet specifications or are involved in accidents or failures, we could face warranty, contract, fines or other litigation claims, which could expose us to substantial liability for personal injury, wrongful death, property damage, loss of oil and gas production, pollution and other environmental damages. Our insurance policies may not be adequate to cover all liabilities. Further, insurance may not be generally available in the future or, if available, insurance premiums may make such insurance commercially unjustifiable. Moreover, even if we are successful in defending a claim, it could be time-consuming and costly to defend.
In addition, the frequency and severity of such incidents will affect operating costs, insurability and relationships with customers, employees and regulators. In particular, our customers may elect not to purchase our services if they view our safety record as unacceptable, which could cause us to lose customers and substantial revenues. In addition, these risks may be greater for us because we may acquire companies that have not allocated significant resources and management focus to safety and have a poor safety record requiring rehabilitative efforts during the integration process and we may incur liabilities for losses before such rehabilitation occurs.
The imposition of stringent restrictions or prohibitions on offshore drilling by any governing body may have a material adverse effect on our business.
Events in recent years have heightened environmental and regulatory concerns about the oil and gas industry. From time to time, governing bodies have enacted and may propose legislation or regulations that would materially limit or prohibit offshore drilling in certain areas. If laws are enacted or other governmental action is taken that restrict or prohibit offshore drilling in our expected areas of operation, our expected future growth in offshore services could be reduced and our business could be materially adversely affected.
For example, in April 2016 the U.S. Bureau of Safety and Environmental Enforcement (“BSEE”) finalized more stringent standards relating to well control equipment used in connection with offshore well drilling operations. The standards focus on blowout preventers, along with well design, well control, casing, cementing, real-time well monitoring, and subsea containment requirements. However, in September 2018, the BSEE published final revisions to its regulations regarding offshore drilling safety equipment, removing certain requirements such as third-party equipment certification and reducing equipment monitoring and reporting obligations. However, government agencies could issue new safety and environmental guidelines or regulations for drilling in the U.S. Gulf of Mexico that could disrupt or delay drilling operations, increase the cost of drilling operations or reduce the area of operations for drilling. Any new regulation could dampen demand for our equipment and services and have an adverse effect on our business.
17
We may not be fully indemnified against financial losses in all circumstances where damage to or loss of property, personal injury, death or environmental harm occur.
As is customary in our industry, our contracts typically provide that our customers indemnify us for claims arising from the injury or death of their employees, the loss or damage of their equipment, damage to the reservoir and pollution emanating from the customer’s equipment or from the reservoir (including uncontained oil flow from a reservoir). Conversely, we typically indemnify our customers for claims arising from the injury or death of our employees, the loss or damage of our equipment, or pollution emanating from our equipment. Our contracts typically provide that our customer will indemnify us for claims arising from catastrophic events, such as a well blowout, fire or explosion.
Our indemnification arrangements may not protect us in every case. For example, from time to time (i) we may enter into contracts with less favorable indemnities or perform work without a contract that protects us, (ii) our indemnity arrangements may be held unenforceable in some courts and jurisdictions or (iii) we may be subject to other claims brought by third parties or government agencies. Furthermore, the parties from which we seek indemnity may not be solvent, may become bankrupt, may lack resources or insurance to honor their indemnities, or may not otherwise be able to satisfy their indemnity obligations to us. The lack of enforceable indemnification could expose us to significant potential losses.
Further, our assets generally are not insured against loss from political violence such as war, terrorism or civil unrest. If any of our assets are damaged or destroyed as a result of an uninsured cause, we could recognize a loss of those assets.
We may incur liabilities, fines, penalties or additional costs, or we may be unable to provide services to certain customers, if we do not maintain safe operations.
If we fail to comply with safety regulations or maintain an acceptable level of safety in connection with our tubular or other well construction services, we may incur civil fines, penalties or other liabilities or may be held criminally liable. We expect to incur additional costs over time to upgrade equipment or conduct additional training or otherwise incur costs in connection with compliance with safety regulations. Failure to maintain safe operations or achieve certain safety performance metrics could disqualify us from doing business with certain customers, particularly major oil companies. Because we provide tubular and other well construction services to a large number of major oil companies, any such failure could adversely affect our business, financial condition and results of operations.
Our business is dependent on our ability to provide highly reliable and safe equipment. If our equipment does not meet statutory regulations, or equipment certification requirements, and/or our clients do not accept the quality of our equipment, we could encounter loss of contracts and/or loss of reputation, which could materially impact our operations and profitability. Further, the failure of our equipment could subject us to litigation, regulatory fines and/or adverse customer reaction. In addition, equipment certification requirements vary by region and changes in these requirements could impact our ability to operate in certain markets if our tools do not comply with these requirements.
The industry in which we operate is undergoing continuing consolidation that may impact results of operations.
Some of our largest customers have consolidated in recent years and are using their size and purchasing power to achieve economies of scale and pricing concessions. This consolidation may result in reduced capital spending by such customers or the acquisition of one or more of our other primary customers, which may lead to decreased demand for our products and services. If we cannot maintain sales levels for customers that have consolidated or replace such revenues with increased business activities from other customers, this consolidation activity could have a significant negative impact on our business, financial condition and results of operations. We are unable to predict what effect consolidations in our industry may have on prices, capital spending by customers, selling strategies, competitive position, ability to retain customers or ability to negotiate favorable agreements with customers.
18
Our operations and our customers’ operations are subject to a variety of governmental laws and regulations that may increase our costs, limit the demand for our services and products or restrict our operations.
Our business and our customers’ businesses may be significantly affected by:
|
•
|
federal, state and local and non-U.S. laws and other regulations relating to oilfield operations, worker safety and protection of the environment and natural resources;
|
|
•
|
changes in these laws and regulations; and
|
|
•
|
the level of enforcement of these laws and regulations.
|
In addition, we depend on the demand for our services and products from the oil and gas industry. This demand is affected by changing taxes, price controls and other laws and regulations relating to the oil and gas industry in general. For example, the adoption of laws and regulations curtailing exploration and development drilling for oil and gas for economic or other policy reasons could adversely affect our operations by limiting demand for our products. In addition, some non-U.S. countries may adopt regulations or practices that give advantage to indigenous oil companies in bidding for oil leases, or require indigenous companies to perform oilfield services currently supplied by international service companies. To the extent that such companies are not our customers, or we are unable to develop relationships with them, our business may suffer. We cannot determine the extent to which our future operations and earnings may be affected by new legislation, new regulations or changes in existing regulations.
Because of our non-U.S. operations and sales, we are also subject to changes in non-U.S. laws and regulations that may encourage or require hiring of local contractors or require non-U.S. contractors to employ citizens of, or purchase supplies from, a particular jurisdiction. If we fail to comply with any applicable law or regulation, our business, financial condition and results of operations may be adversely affected.
Our business is dependent on capital spending by our customers, and reductions in capital spending could have a material adverse effect on our business.
Any change in capital expenditures by our customers or reductions in their capital spending could directly impact our business by reducing demand for our products and services and could have a material adverse effect on our business. Our customers are subject to risks which, in turn, could impact our business, including volatile oil and gas prices, difficulty accessing capital on economically advantageous terms and adverse developments in their own business or operations. With respect to national oil company customers, we are also subject to risk of policy, regime and budgetary changes.
An inability to obtain visas and work permits for our employees on a timely basis could negatively affect our operations and have an adverse effect on our business.
Our ability to provide services worldwide depends on our ability to obtain the necessary visas and work permits for our personnel to travel in and out of, and to work in, the jurisdictions in which we operate. Governmental actions in some of the jurisdictions in which we operate may make it difficult for us to move our personnel in and out of these jurisdictions by delaying or withholding the approval of these permits. If we are not able to obtain visas and work permits for the employees we need for conducting our tubular and other well construction services on a timely basis, we might not be able to perform our obligations under our contracts, which could allow our customers to cancel the contracts. If our customers cancel some of our contracts, and we are unable to secure new contracts on a timely basis and on substantially similar terms, our business, financial condition and results of operations could be materially adversely affected.
19
Our operations are subject to environmental and operational safety laws and regulations that may expose us to significant costs and liabilities.
Our operations are subject to numerous stringent and complex laws and regulations governing the discharge of materials into the environment, health and safety aspects of our operations, or otherwise relating to occupational health and safety and environmental protection. These laws and regulations may, among other things, regulate the management and disposal of hazardous and non-hazardous wastes; require acquisition of environmental permits related to our operations; restrict the types, quantities, and concentrations of various materials that can be released into the environment; limit or prohibit operational activities in certain ecologically sensitive and other protected areas; regulate specific health and safety criteria addressing worker protection; require compliance with operational and equipment standards; impose testing, reporting and record-keeping requirements; and require remedial measures to mitigate pollution from former and ongoing operations. Failure to comply with these laws and regulations or to obtain or comply with permits may result in the assessment of administrative, civil and criminal penalties, imposition of remedial or corrective action requirements and the imposition of injunctions to limit or prohibit certain activities or force future compliance. Certain environmental laws may impose joint and several liability, without regard to fault or legality of conduct, on classes of persons who are considered to be responsible for the release of a hazardous substance into the environment.
Analogous or stricter laws exist in other countries where we operate. The trend in environmental regulation has been to impose increasingly stringent restrictions and limitations on activities that may impact the environment. Some countries have even established constitutional rights relating to the environment. The implementation of new laws and regulations could result in materially increased costs, stricter standards and enforcement, larger fines and liability and increased capital expenditures and operating costs, particularly for our customers.
Our operations in countries outside of the United States are subject to a number of U.S. federal laws and regulations, including restrictions imposed by the Foreign Corrupt Practices Act, as well as trade sanctions administered by the Office of Foreign Assets Control and the Commerce Department.
We operate internationally and in some countries with high levels of perceived corruption commonly gauged according to the Transparency International Corruption Perceptions Index. We must comply with complex foreign and U.S. laws including the United States Foreign Corrupt Practices Act (“FCPA”), the UK Bribery Act 2010 and the United Nations Convention Against Corruption, which prohibit engaging in certain activities to obtain or retain business or to influence a person working in an official capacity. We do business and may in the future do additional business in countries and regions in which we may face, directly or indirectly, corrupt demands by officials, tribal or insurgent organizations, or by private entities in which corrupt offers are expected or demanded. Furthermore, many of our operations require us to use third parties to conduct business or to interact with people who are deemed to be governmental officials under the anticorruption laws. Thus, we face the risk of unauthorized payments or offers of payments or other things of value by our employees, contractors or agents. It is our policy to implement compliance procedures to prohibit these practices. However, despite those safeguards and any future improvements to them, our employees, contractors, and agents may engage in conduct for which we might be held responsible, regardless of whether such conduct occurs within or outside the United States. We may also be held responsible for any violations by an acquired company that occur prior to an acquisition, or subsequent to the acquisition but before we are able to institute our compliance procedures. In addition, our non-U.S. competitors that are not subject to the FCPA or similar anticorruption laws may be able to secure business or other preferential treatment in such countries by means that such laws prohibit with respect to us. A violation of any of these laws, even if prohibited by our policies, may result in severe criminal and/or civil sanctions and other penalties, and could have a material adverse effect on our business. Actual or alleged violations could damage our reputation, be expensive to defend, and impair our ability to do business.
We are currently conducting an internal investigation of the operations of certain of our foreign subsidiaries in West Africa for possible violations of the FCPA, our policies and other applicable laws, and in June 2016, we voluntarily disclosed the existence of our extensive internal review to the SEC, the U.S. Department of Justice (“DOJ”) and other governmental entities. We are unable to predict the ultimate resolution of these matters before the SEC and DOJ. Adverse action by these government agencies could have a material adverse effect on our business.
20
Compliance with U.S. regulations on trade sanctions and embargoes administered by the United States Department of the Treasury’s Office of Foreign Assets Control also poses a risk to us. We cannot provide products or services to certain countries subject to U.S. or other international trade sanctions. Furthermore, the laws and regulations concerning import activity, export recordkeeping and reporting, export control and economic sanctions are complex and constantly changing. Any failure to comply with applicable legal and regulatory trading obligations could result in criminal and civil penalties and sanctions, such as fines, imprisonment, debarment from governmental contracts, seizure of shipments and loss of import and export privileges.
Compliance with and changes in laws could be costly and could affect operating results.
We have operations in the U.S. and in approximately
50
countries that can be impacted by expected and unexpected changes in the legal and business environments in which we operate. Political instability and regional issues in many of the areas in which we operate may contribute to such changes with greater significance or frequency. Our ability to manage our compliance costs and compliance programs will impact our business, financial condition and results of operations. Compliance-related issues could also limit our ability to do business in certain countries. Changes that could impact the legal environment include new legislation, new regulations, new policies, investigations and legal proceedings and new interpretations of existing legal rules and regulations, in particular, changes in export control laws or exchange control laws, additional restrictions on doing business in countries subject to sanctions and changes in laws in countries where we operate or intend to operate.
Restrictions on emissions of greenhouse gases could increase our operating costs or reduce demand for our products and services.
Environmental advocacy groups and regulatory agencies in the United States and other countries have focused considerable attention on emissions of carbon dioxide, methane and other greenhouse gases (“GHGs”) and their potential role in climate change. The EPA has adopted regulations to reduce GHG emissions under existing provisions of the federal Clean Air Act. For example, in June 2016, the EPA finalized rules that establish new controls for emissions of methane, known as Subpart OOOOa, for new, modified or reconstructed sources in the oil and natural gas source category. However, there have been attempts to modify these regulations, and litigation concerning the regulations is ongoing. The BLM finalized similar rules in November 2016; however, in September 2018, the BLM issued a final rule rescinding the agency’s 2016 methane rule, and litigation challenging the rescission is pending. As a result, future implementation of these federal methane rules remains uncertain at this time. However, given the long term trend towards stricter regulations of GHGs, it is likely that some form of federal methane regulation may be proposed again in the future. Some oil and gas producing states also have methane emission control requirements. To the extent implemented, these rules have the potential to impose significant costs on our customers.
While Congress has from time to time considered legislation to reduce emissions of GHGs, no significant legislation to reduce GHG emissions has been adopted at the federal level. In the absence of federal climate legislation, a number of state and regional GHG reduction efforts have emerged, either through emission cap and trade programs or legal requirements for the promotion of renewable energy. Analogous or stricter regulations exist in many of the other countries in which we provide services. For example, the European Union (“EU”) Emissions Trading System requires companies in many industries, including oil and gas production, to redeem allowances to cover their GHG emissions. Separately, in December 2018, the EU finalized a second Renewable Energy Directive, which requires member states to fulfill 32% of their energy demand from renewable sources by 2030. The adoption of additional legislation or regulatory programs to reduce emissions of greenhouse gases could require us to incur increased operating costs and could reduce demand for hydrocarbons that our customers produce. Consequently, legislation and regulatory programs to reduce emissions of greenhouse gases could have an adverse effect on our business, financial condition and results of operations.
Moreover, activists concerned about the potential effects of climate change have directed their attention at sources of funding for fossil-fuel energy companies, which has resulted in certain sources of capital restricting or eliminating their investment in oil and natural gas activities. Additionally, activist shareholders have introduced proposals that may seek to force companies to adopt aggressive emission reduction targets or restrict more carbon-intensive activities. While we cannot predict the outcomes of such proposals, they could make it more difficult for operators to engage in exploration and production activities, ultimately reducing demand for our services. Notwithstanding potential risks related to climate change, the
21
International Energy Agency estimates that global energy demand will continue to rise and will not peak until 2040 and that oil and gas will continue to represent a substantial percentage of global energy use over that time. Finally, many scientists have concluded that increasing concentrations of greenhouse gases in the Earth’s atmosphere may produce climate changes that have significant physical effects, such as increased frequency and severity of storms, droughts, and floods and other extreme weather events. Offshore operations are particularly susceptible to damage from extreme weather events. If any of the potential effects of climate change were to occur, they could have an adverse effect on our business, financial condition and results of operations.
We face risks related to natural disasters and pandemic diseases, which could result in severe property damage or materially and adversely disrupt our operations and affect travel required for our worldwide operations.
Some of our operations involve risks of, among other things, property damage, which could curtail our operations. For example, disruptions in operations or damage to a manufacturing plant could reduce our ability to produce products and satisfy customer demand. In particular, we have offices and manufacturing facilities in Houston, Texas and Houma and Lafayette, Louisiana as well as in various places throughout the Gulf Coast region of the United States. These offices and facilities are particularly susceptible to severe tropical storms, hurricanes and flooding, which may disrupt our operations. If one or more manufacturing facilities we own are damaged by severe weather or any other disaster, accident, catastrophe or event, our operations could be significantly interrupted. Similar interruptions could result from damage to production or other facilities that provide supplies or other raw materials to our plants or other stoppages arising from factors beyond our control. These interruptions might involve significant damage to, among other things, property, and repairs might take from a week or less for a minor incident to many months or more for a major interruption.
In addition, a portion of our business involves the movement of people and certain parts and supplies to or from foreign locations. Any restrictions on travel or shipments to and from foreign locations, due to the occurrence of natural disasters such as earthquakes, floods or hurricanes, or an epidemic or outbreak of diseases in these locations, could significantly disrupt our operations and decrease our ability to provide services to our customers. In addition, our local workforce could be affected by such an occurrence or outbreak which could also significantly disrupt our operations and decrease our ability to provide services to our customers.
Our business could be negatively affected by cybersecurity threats and other disruptions.
We rely heavily on information systems to conduct and protect our business. These information systems are increasingly subject to sophisticated cybersecurity threats such as unauthorized access to data and systems, loss or destruction of data (including confidential customer information), computer viruses, or other malicious code, phishing and cyberattacks, and other similar events. These threats arise from numerous sources, not all of which are within our control, including fraud or malice on the part of third parties, accidental technological failure, electrical or telecommunication outages, failures of computer servers or other damage to our property or assets, or outbreaks of hostilities or terrorist acts.
Given the rapidly evolving nature of cyber threats, there can be no assurance that the systems we have designed and implemented to prevent or limit the effects of cyber incidents or attacks will be sufficient in preventing all such incidents or attacks, or avoiding a material impact to our systems when such incidents or attacks do occur. If we were to be subject to a cyber incident or attack, it could result in the disclosure of confidential or proprietary customer information, theft or loss of intellectual property, damage to our reputation with our customers and the market, failure to meet customer requirements or customer dissatisfaction, theft or exposure to litigation, damage to equipment (which could cause environmental or safety issues) and other financial costs and losses. In addition, as cybersecurity threats continue to evolve, we may be required to devote additional resources to continue to enhance our protective measures or to investigate or remediate any cybersecurity vulnerabilities.
Our exposure to currency exchange rate fluctuations may result in fluctuations in our cash flows and could have an adverse effect on our financial condition and results of operations.
From time to time, fluctuations in currency exchange rates could be material to us depending upon, among other things, the principal regions in which we provide our services and products. For the year ended
December 31, 2018
, on a U.S.
22
dollar-equivalent basis, approximately
24%
of our revenue was represented by currencies other than the U.S. dollar. In particular, we are sensitive to fluctuations in currency exchange rates between the U.S. dollar and each of the Euro, Norwegian Krone, British Pound, Canadian Dollar and Brazilian Real. There may be instances in which costs and revenue will not be matched with respect to currency denomination. As a result, to the extent that we continue our expansion on a global basis, as expected, we expect that increasing portions of revenue, costs, assets and liabilities will be subject to fluctuations in foreign currency valuations. We may experience economic loss and a negative impact on earnings or net assets solely as a result of foreign currency exchange rate fluctuations. Further, the markets in which we operate could restrict the removal or conversion of the local or foreign currency, resulting in our inability to hedge against these risks.
Seasonal and weather conditions could adversely affect demand for our services and operations.
Weather can have a significant impact on demand as consumption of energy is seasonal, and any variation from normal weather patterns, such as cooler or warmer summers and winters, can have a significant impact on demand. Adverse weather conditions, such as hurricanes and ocean currents in the U.S. Gulf of Mexico or typhoons in the Asia Pacific region, may interrupt or curtail our operations, or our customers’ operations, cause supply disruptions and result in a loss of revenue and damage to our equipment and facilities, which may or may not be insured. Extreme winter conditions in Canada, Russia, or the North Sea, or droughts in more arid regions in which we do business may interrupt or curtail our operations, or our customers’ operations, and result in a loss of revenue.
Legislation or regulations restricting the use of hydraulic fracturing could reduce demand for our services.
Hydraulic fracturing is an important and common practice in the oil and gas industry. The process involves the injection of water, sand and chemicals under pressure into a formation to fracture the surrounding rock and stimulate production of hydrocarbons. While we do not perform hydraulic fracturing, many of our customers utilize this technique. Certain environmental advocacy groups and regulatory agencies have suggested that additional federal, state and local laws and regulations may be needed to more closely regulate the hydraulic fracturing process, and have made claims that hydraulic fracturing techniques are harmful to surface water and drinking water resources and may cause earthquakes. Various governmental entities (within and outside the United States) are in the process of studying, restricting, regulating or preparing to regulate hydraulic fracturing, directly or indirectly. For example, in December 2016, the EPA released its final report on the potential impacts of hydraulic fracturing on drinking water resources, which concluded that “water cycle” activities associated with hydraulic fracturing may impact drinking water sources under certain limited circumstances. In addition, the BLM finalized rules in March 2015 that impose new or more stringent standards for performing hydraulic fracturing on federal and American Indian lands, but this rule was repealed in December 2017. Litigation concerning this rescission is ongoing. The adoption of legislation or regulatory programs that restrict hydraulic fracturing could adversely affect, reduce or delay well drilling and completion activities, increase the cost of drilling and production, and thereby reduce demand for our services.
Customer credit risks could result in losses.
The concentration of our customers in the energy industry may impact our overall exposure to credit risk as customers may be similarly affected by prolonged changes in economic and industry conditions. Those countries that rely heavily upon income from hydrocarbon exports would be hit particularly hard by a drop in oil prices. Further, laws in some jurisdictions in which we operate could make collection difficult or time consuming. We perform ongoing credit evaluations of our customers and do not generally require collateral in support of our trade receivables. While we maintain reserves for potential credit losses, we cannot assure such reserves will be sufficient to meet write-offs of uncollectible receivables or that our losses from such receivables will be consistent with our expectations.
Furthermore, some of our customers may be highly leveraged and subject to their own operating and regulatory risks, which increases the risk that they may default on their obligations to us. To the extent one or more of our key customers is in financial distress or commences bankruptcy proceedings, contracts with these customers may be subject to renegotiation or rejection under applicable provisions of the United States Bankruptcy Code and similar international laws. Any material nonpayment or nonperformance by our key customers could adversely affect our business, financial condition and results of operations.
23
If our long-lived assets, goodwill, other intangible assets and other assets are impaired, we may be required to record significant non-cash charges to our earnings.
We recognize impairments of goodwill when the fair value of any of our reporting units becomes less than its carrying value. Our estimates of fair value are based on assumptions about future cash flows of each reporting unit, discount rates applied to these cash flows and current market estimates of value. Based on the uncertainty of future revenue growth rates, gross profit performance, and other assumptions used to estimate our reporting units’ fair value, future reductions in our expected cash flows could cause a material non-cash impairment charge of goodwill, which could have a material adverse effect on our results of operations and financial condition.
We also have certain long-lived assets, other intangible assets and other assets which could be at risk of impairment or may require reserves based upon anticipated future benefits to be derived from such assets. Any change in the valuation of such assets could have a material effect on our profitability.
We may be unable to identify or complete acquisitions or strategic alliances.
We expect that acquisitions and strategic alliances will be an important element of our business strategy going forward. We can give no assurance that we will be able to identify and acquire additional businesses or negotiate with suitable venture partners in the future on terms favorable to us or that we will be able to integrate successfully the assets and operations of acquired businesses with our own business. Any inability on our part to integrate and manage the growth of acquired businesses may have a material adverse effect on our business, financial condition and results of operations.
Our executive officers and certain key personnel are critical to our business, and these officers and key personnel may not remain with us in the future.
Our future success depends in substantial part on our ability to hire and retain our executive officers and other key personnel who possess extensive expertise, talent and leadership and are critical to our success. The diminution or loss of the services of these individuals, or other integral key personnel affiliated with entities that we acquire in the future, could have a material adverse effect on our business. Furthermore, we may not be able to enforce all of the provisions in any agreement we have entered into with certain of our executive officers, and such agreements may not otherwise be effective in retaining such individuals. In addition, we may not be able to retain key employees of entities that we acquire in the future. This may impact our ability to successfully integrate or operate the assets we acquire.
Control of oil and gas reserves by state-owned oil companies may impact the demand for our services and create additional risks in our operations.
Much of the world’s oil and gas reserves are controlled by state-owned oil companies, and we provide services and products for a number of those companies. State-owned oil companies may require their contractors to meet local content requirements or other local standards, such as joint ventures, that could be difficult or undesirable for us to meet. The failure to meet the local content requirements and other local standards may adversely impact our operations in those countries. In addition, our ability to work with state-owned oil companies is subject to our ability to negotiate and agree upon acceptable contract terms.
Restrictions in the agreement governing the New ABL Credit Facility could adversely affect our business, financial condition and results of operations.
On November 5, 2018, FICV, Frank's International, LLC and Blackhawk, as borrowers, and FINV, certain of FINV's subsidiaries, including FICV, Frank’s International, LLC, Blackhawk, Frank's International GP, LLC, Frank's International, LP, Frank's International LP B.V., Frank's International Partners B.V., Frank's International Management B.V., Blackhawk Intermediate Holdings, LLC, Blackhawk Specialty Tools, LLC, and Trinity Tool Rentals, L.L.C., as guarantors, entered into a five-year senior secured revolving credit facility (the “New ABL Credit Facility”) with JPMorgan Chase Bank, N.A., as administrative agent (the “ABL Agent”), and other financial institutions as lenders with total commitments of $100.0 million, including up to $15.0 million available for letters of credit. The operating and financial restrictions in the New ABL Credit Facility and any future financing agreements could restrict our ability to finance future operations or capital needs,
24
or otherwise pursue our business activities. For example, the New ABL Credit Facility limits our and our subsidiaries’ ability to, among other things:
|
•
|
incur debt or issue guarantees;
|
|
•
|
incur or permit certain liens to exist;
|
|
•
|
make certain investments, acquisitions or other restricted payments;
|
|
•
|
dispose of assets;
|
|
•
|
engage in certain types of transactions with affiliates;
|
|
•
|
merge, consolidate or transfer all or substantially all of our assets; and
|
|
•
|
prepay certain indebtedness.
|
Furthermore, the New ABL Credit Facility contains a covenant requiring us to maintain a minimum fixed charge coverage ratio of 1.0 to 1.0 based on the ratio of (a) consolidated EBITDA (as defined therein) minus unfinanced capital expenditures to (b) Fixed Charges (as defined therein) when availability under the New ABL Credit Facility falls below the greater of (a) $12.5 million and (b) 15% of the lesser of the borrowing base and aggregate commitments. Accounts receivable received by FINV’s U.S. subsidiaries that are parties to the New ABL Credit Facility will be deposited into deposit accounts subject to deposit control agreements in favor of the ABL Agent. In the event FINV does not maintain the minimum fixed charge coverage ratio discussed above, these deposit accounts would be subject to “springing” cash dominion.
In addition, any borrowings under the New ABL Credit Facility may be at variable rates of interest that expose us to interest rate risk. If interest rates increase, our debt service obligations on the variable rate indebtedness will increase even though the amount borrowed will remain the same, and our net income and cash flows will correspondingly decrease.
A failure to comply with the covenants in the agreement governing the New ABL Credit Facility could result in an event of default, which, if not cured or waived, would permit the exercise of remedies against us that could have a material adverse effect on our business, results of operations and financial position. Remedies under the New ABL Credit Facility include foreclosure on the collateral securing the indebtedness and termination of the commitments under the New ABL Credit Facility, and any outstanding borrowings under the New ABL Credit Facility may be declared immediately due and payable.
Please see “Management’s Discussion & Analysis of Financial Condition and Results of Operation—Liquidity and Capital Resources—Credit Facilities.”
Risks Related to Our Corporate Structure
We are a holding company and our sole material assets are our direct and indirect equity interests in our operating subsidiaries, and we are accordingly dependent upon distributions from such subsidiaries to pay taxes, make payments under the tax receivable agreement (“TRA”), and pay dividends.
We are a holding company and have no material assets other than our direct and indirect equity interests in our operating subsidiaries. We have no independent means of generating revenue. We intend to cause our subsidiaries to make distributions in an amount sufficient to cover (i) all applicable taxes at assumed tax rates, (ii) payments under the TRA we entered into with Mosing Holdings in connection with the IPO and (iii) dividends, if any, declared by us. To the extent that we need funds and our subsidiaries are restricted from making such distributions under applicable law or regulation or under the terms of their financing or other contractual arrangements, or is otherwise unable to provide such funds, it could materially adversely affect our liquidity and financial condition.
25
The Mosing family holds a majority of the total voting power of the Company’s common stock (the “FINV Stock”) and, accordingly, could have substantial control over our management and affairs.
The Mosing family (either individually or through various holding entities of the Mosing family members) currently collectively owns approximately
62%
of the total voting power entitled to vote at annual or special meetings. While the Mosing family members have terminated a voting agreement with respect to the shares they own, the Mosing family has the ability (but not the requirement) to designate on an annual basis who will comprise our Board of Supervisory Directors nominated to the shareholders based on the amount of shares that they collectively own. Moreover, pursuant to our amended and restated articles of association, our board of directors will consist of no more than nine individuals. The Mosing family has the right to recommend one director for nomination to the supervisory board for each 10% of the outstanding FINV Stock they collectively beneficially own, up to a maximum of five directors. The remaining directors are nominated by our supervisory board. Our supervisory board currently consists of nine members, three of whom are members of the Mosing family. The existence of significant shareholders may also have the effect of deterring hostile takeovers, delaying or preventing changes in control or changes in management, or limiting the ability of our other shareholders to approve transactions that they may deem to be in the best interests of our company. So long as the Mosing family continues to own a significant amount of the FINV Stock, even if such amount represents less than 50% of the aggregate voting power, they will continue to be able to influence matters requiring shareholder approval, regardless of whether or not other shareholders believe that the transaction is in their own best interests.
The Mosing family may have interests that conflict with holders of shares of our common stock.
The Mosing family may have conflicting interests with other holders of shares of our common stock. For example, the Mosing family may have different tax positions from us or other holders of shares of our common stock which could influence their decisions regarding whether and when to cause us to dispose of assets, whether and when to cause us to incur new or refinance existing indebtedness, especially in light of the existence of the TRA that we entered into in connection with the IPO. In addition, the structuring of future transactions may take into consideration the Mosing family’s tax or other considerations even where no similar benefit would accrue to us.
We are required under the TRA to pay Mosing Holdings or its permitted transferees for certain tax benefits we may claim, and the amounts we may pay could be significant.
We entered into the TRA with FICV and Mosing Holdings in connection with the IPO. This agreement generally provides for the payment by us of 85% of actual reductions, if any, in payments of U.S. federal, state and local income tax or franchise tax in periods after the IPO as a result of (i) the tax basis increases resulting from the transfer of FICV interests to us in connection with the conversion of shares of Preferred Stock into shares of our common stock and (ii) imputed interest deemed to be paid by us as a result of, and additional tax basis arising from, payments under the TRA. In addition, the TRA provides for interest earned from the due date (without extensions) of the corresponding tax return to the date of payment specified by the TRA.
The payment obligations under the TRA are our obligations and are not obligations of FICV. The term of the TRA continues until all such tax benefits have been utilized or expired, unless we exercise our sole right to terminate the TRA early.
Estimating the timing of payments that may be made under the TRA is by its nature imprecise, insofar as the calculation of amounts payable depends on a variety of factors. The timing of any payments under the TRA will vary depending upon a number of factors, including the amount and timing of the taxable income we realize in the future and the tax rate then applicable, our use of loss carryovers and the portion of our payments under the TRA constituting imputed interest or depreciable or amortizable basis. We expect that the payments that we will be required to make under the TRA will be substantial. There may be a substantial negative impact on our liquidity if, as a result of timing discrepancies or otherwise, (i) the payments under the TRA exceed the actual benefits we realize in respect of the tax attributes subject to the TRA or (ii) distributions to us by FICV are not sufficient to permit us to make payments under the TRA subsequent to the payment of our taxes and other obligations. The payments under the TRA are not conditioned upon a holder of rights under a TRA having a continued ownership interest in either FICV or us. While we may defer payments under the TRA to the extent we do not have sufficient cash to make such payments, except in the case of an acceleration of payments thereunder occurring
26
in connection with an early termination of the TRA or certain mergers or changes of control, any such unpaid obligation will accrue interest. Additionally, during any such deferral period, we are prohibited from paying dividends on our common stock.
In certain cases, payments under the TRA to Mosing Holdings or its permitted transferees may be accelerated or significantly exceed the actual benefits, if any, we realize in respect of the tax attributes subject to the TRA.
The TRA provides that we may terminate it early. If we elect to exercise our sole right to terminate the TRA early, we are required to make an immediate payment equal to the present value of the anticipated future tax benefits subject to the TRA (based upon certain assumptions and deemed events set forth in the TRA, including the assumption that we have sufficient taxable income to fully utilize such benefits and that any interests in FICV that Mosing Holdings or its transferees own on the termination date are deemed to be exchanged on the termination date). Any early termination payment may be made significantly in advance of the actual realization, if any, of such future benefits. In addition, payments due under the TRA are similarly accelerated following certain mergers or other changes of control. In these situations, our obligations under the TRA could have a substantial negative impact on our liquidity and could have the effect of delaying, deferring or preventing certain mergers, asset sales, other forms of business combinations or other changes of control. For example, if the TRA were terminated on
December 31, 2018
, the estimated termination payment would be approximately $
44.6 million
(calculated using a discount rate of
5.87%
). The foregoing number is merely an estimate and the actual payment could differ materially. There can be no assurance that we will be able to finance our obligations under the TRA. If we were unable to finance our obligations due under the TRA, we would be in breach of the agreement. Any such breach could adversely affect our business, financial condition or results of operations.
Payments under the TRA will be based on the tax reporting positions that we will determine. If the Internal Revenue Service (the “IRS”) were to successfully challenge a tax basis increase or other benefits arising under the TRA, the holders of rights under the TRA will not reimburse us for any payments previously made under the TRA if such basis increases or other benefits are subsequently disallowed, except that excess payments made to any such holder will be netted against payments otherwise to be made, if any, to such holder after our determination of such excess. As a result, in such circumstances, we could make payments that are greater than our actual cash tax savings, if any, and may not be able to recoup those payments, which could adversely affect our liquidity.
Risks Related to Our Common Stock
Future sales of our common stock in the public market could lower our stock price, and any additional capital raised by us through the sale of equity may dilute your ownership in us.
As of
February 18, 2019
, we had
224,455,806
outstanding shares of our common stock. We may sell additional shares of common stock in subsequent public offerings. Members of the Mosing family own, both directly and indirectly, approximately
62%
of our total outstanding FINV Stock. All of these shares may be sold into the market in the future.
We cannot predict the size of future issuances of our common stock or the effect, if any, that future issuances and sales of shares of our common stock will have on the market price of our common stock. Sales of substantial amounts of our common stock (including shares issued in connection with an acquisition), or the perception that such sales could occur, may adversely affect prevailing market prices of our common stock.
Our declaration of dividends is within the discretion of our management board, with the approval of our supervisory board, and subject to certain limitations under Dutch law, and there can be no assurance that we will pay dividends.
Our dividend policy is within the discretion of our management board, with the approval of our supervisory board, and the amount of future dividends, if any, will depend upon various factors, including our results of operations, financial condition, capital requirements and investment opportunities. We can provide no assurance that we will pay dividends on our common stock. No dividends on our common stock will accrue in arrears. In addition, Dutch law contains certain restrictions on a company’s ability to pay cash dividends, and we can provide no assurance that those restrictions will not prevent us from paying a dividend in future periods.
27
As a Dutch company with limited liability, the rights of our shareholders may be different from the rights of shareholders in companies governed by the laws of U.S. agencies.
We are a Dutch company with limited liability (
Naamloze Vennootschap
). Our corporate affairs are governed by our articles of association and by the laws governing companies incorporated in the Netherlands. The rights of shareholders and the responsibilities of members of our management board and supervisory board may be different from those in companies governed by the laws of U.S. jurisdictions.
For example, resolutions of the general meeting of shareholders may be taken with majorities different from the majorities required for adoption of equivalent resolutions in, for example, Delaware corporations. Although shareholders will have the right to approve legal mergers or demergers, Dutch law does not grant appraisal rights to a company’s shareholders who wish to challenge the consideration to be paid upon a legal merger or demerger of a company.
In addition, if a third party is liable to a Dutch company, under Dutch law shareholders generally do not have the right to bring an action on behalf of the company or to bring an action on their own behalf to recover damages sustained as a result of a decrease in value, or loss of an increase in value, of their ordinary shares. Only in the event that the cause of liability of such third party to the company also constitutes a tortious act directly against such shareholder and the damages sustained are permanent, may that shareholder have an individual right of action against such third party on its own behalf to recover damages. The Dutch Civil Code provides for the possibility to initiate such actions collectively. A foundation or an association whose objective, as stated in its articles of association, is to protect the rights of persons having similar interests may institute a collective action. The collective action cannot result in an order for payment of monetary damages but may result in a declaratory judgment (
verklaring voor recht
), for example declaring that a party has acted wrongfully or has breached a fiduciary duty. The foundation or association and the defendant are permitted to reach (often on the basis of such declaratory judgment) a settlement which provides for monetary compensation for damages. A designated Dutch court may declare the settlement agreement binding upon all the injured parties, whereby an individual injured party will have the choice to opt-out within the term set by the court (at least three months). Such individual injured party, may also individually institute a civil claim for damages within the before mentioned term.
Furthermore, certain provisions of Dutch corporate law have the effect of concentrating control over certain corporate decisions and transactions in the hands of our management board and supervisory board. As a result, holders of our shares may have more difficulty in protecting their interests in the face of actions by members of our management board and supervisory board than if we were incorporated in the United States.
In the performance of its duties, our management board and supervisory board will be required by Dutch law to act in the interest of the company and its affiliated business, and to consider the interests of our company, our shareholders, our employees and other stakeholders in all cases with reasonableness and fairness. It is possible that some of these parties will have interests that are different from, or in addition to, interests of our shareholders.
Our articles of association and Dutch corporate law contain provisions that may discourage a takeover attempt.
Provisions contained in our amended and restated articles of association and the laws of the Netherlands could make it more difficult for a third party to acquire us, even if doing so might be beneficial to our shareholders. Provisions of our articles of association impose various procedural and other requirements, which could make it more difficult for shareholders to effect certain corporate actions. Among other things, these provisions:
|
•
|
authorize our management board, with the approval of our supervisory board, for a period of five years (which ends on May 19, 2022, unless extended) to issue common stock, including for defensive purposes, without shareholder approval; and
|
|
•
|
do not provide for shareholder action by written consent, thereby requiring all shareholder actions to be taken at a general meeting of shareholders.
|
These provisions, alone or together, could delay hostile takeovers and changes in control of our company or changes in our management.
28
It may be difficult for you to obtain or enforce judgments against us or some of our executive officers and directors in the United States or the Netherlands.
We were formed under the laws of the Netherlands and, as such, the rights of holders of our ordinary shares and the civil liability of our directors will be governed by the laws of the Netherlands and our amended and restated articles of association.
In the absence of an applicable convention between the United States and the Netherlands providing for the reciprocal recognition and enforcement of judgments (other than arbitration awards and divorce decrees) in civil and commercial matters, a judgment rendered by a court in the United States will not automatically be recognized by the courts of the Netherlands. In principle, the courts of the Netherlands will be free to decide, at their own discretion, if and to what extent a judgment rendered by a court in the United States should be recognized in the Netherlands.
Without prejudice to the above, in order to obtain enforcement of a judgment rendered by a United States court in the Netherlands, a claim against the relevant party on the basis of such judgment should be brought before the competent court of the Netherlands. During the proceedings such court will assess, when requested, whether a foreign judgment meets the above conditions. In the affirmative, the court may order that substantive examination of the matter shall be dispensed with. In such case, the court will confine itself to an order reiterating the foreign judgment against the party against whom it had been obtained. Otherwise, a new substantive examination will take place.
In all of the above situations, we note the following rules as applied by Dutch courts:
|
•
|
where all other elements relevant to the situation at the time of the choice are located in a country other than the country whose law has been chosen, the choice of the parties shall not prejudice the application of provisions of the law of that other country which cannot be derogated from by agreement;
|
|
•
|
the overriding mandatory provisions of the law of the courts remain applicable (irrespective of the law chosen);
|
|
•
|
effect may be given to overriding mandatory provisions of the law of the country where the obligations arising out of the relevant transaction documents have to be or have been performed, insofar as those overriding mandatory provisions render the performance of the contract unlawful; and
|
|
•
|
the application of the law of any jurisdiction may be refused if such application is manifestly incompatible with the public policy (openbare orde) of the courts.
|
Under our amended and restated articles of association, we will indemnify and hold our officers and directors harmless against all claims and suits brought against them, subject to limited exceptions. Under our amended and restated articles of association, to the extent allowed by law, the rights and obligations among or between us, any of our current or former directors, officers and employees and any current or former shareholder will be governed exclusively by the laws of the Netherlands and subject to the jurisdiction of Dutch courts, unless those rights or obligations do not relate to or arise out of their capacities listed above. Although there is doubt as to whether U.S. courts would enforce such provision in an action brought in the United States under U.S. securities laws, this provision could make judgments obtained outside of the Netherlands more difficult to have recognized and enforced against our assets in the Netherlands or jurisdictions that would apply Dutch law. Insofar as a release is deemed to represent a condition, stipulation or provision binding any person acquiring our ordinary shares to waive compliance with any provision of the Securities Act or of the rules and regulations of the SEC, such release will be void.
Tax Risks
Changes in tax laws, treaties or regulations or adverse outcomes resulting from examination of our tax returns could adversely affect our financial results.
Our future effective tax rates could be adversely affected by changes in tax laws, treaties and regulations, both in the United States and internationally. Tax laws, treaties and regulations are highly complex and subject to interpretation. Consequently, we are subject to changing tax laws, treaties and regulations in and between countries in which we operate or are resident. Our income tax expense is based upon the interpretation of the tax laws in effect in various countries at the time that the expense was incurred. A change in these tax laws, treaties or regulations, or in the interpretation thereof, could
29
result in a materially higher tax expense or a higher effective tax rate on our worldwide earnings. If any country successfully challenges our income tax filings based on our structure, or if we otherwise lose a material tax dispute, our effective tax rate on worldwide earnings could increase substantially and our financial results could be materially adversely affected.
U.S. tax authorities could treat us as a “passive foreign investment company,” which could have adverse U.S. federal income tax consequences to U.S. holders.
A foreign corporation will be treated as a “passive foreign investment company,” or PFIC, for U.S. federal income tax purposes if either (1) at least 75% of its gross income for any taxable year consists of certain types of “passive income” or (2) at least 50% of the average value of the corporation’s assets for any taxable year produce or are held for the production of those types of “passive income.” For purposes of these tests, “passive income” includes dividends, interest and gains from the sale or exchange of investment property and rents and royalties other than certain rents and royalties which are received from unrelated parties in connection with the active conduct of a trade or business, but does not include income derived from the performance of services. U.S. shareholders of a PFIC are subject to a disadvantageous U.S. federal income tax regime with respect to the income derived by the PFIC, the distributions they receive from the PFIC, and the gain, if any, they derive from the sale or other disposition of their interests in the PFIC.
We believe that we will not be a PFIC for the current taxable year or for any future taxable year. However, this involves a facts and circumstances analysis and it is possible that the IRS would not agree with our conclusion, or the U.S. tax laws could change significantly.
U.S. “anti-inversion” tax laws could negatively affect our results and could result in a reduced amount of foreign tax credit for U.S. holders.
Under rules contained in U.S. tax law, we would be subject to tax as a U.S. corporation in the event that we acquire substantially all of the assets of a U.S. corporation and the equity owners of that U.S. corporation own at least 80% (calculated without regard for any stock issued in a public offering) of our stock by reason of holding stock in the U.S. corporation.
We acquired the assets of Mosing Holdings (a Delaware limited liability company); however, the ownership of Mosing Holdings in our stock, taking into account common stock that Mosing Holdings is deemed to own under the “stock equivalent” rules, is below the 80% standard for the application of the rules. Accordingly, we do not believe these rules should apply.
There can be no assurance that the IRS will not challenge our determination that these rules are inapplicable. In the event that these rules were applicable, we would be subject to U.S. federal income tax on our worldwide income, which would negatively impact our cash available for distribution and the value of our common stock. Application of the rules could also adversely affect the ability of a U.S. holder to obtain a U.S. tax credit with respect to any Dutch withholding tax imposed on a distribution.
Item 1B.
Unresolved Staff Comments
None.
Item 2.
Properties
In order to design, manufacture and service the proprietary products that support our operations, as well as those that we offer for sale directly to external customers, we maintain several manufacturing and service facilities around the world. Though our manufacturing and service capabilities are primarily concentrated in the U.S., we currently provide our services and products in approximately
50
countries.
30
The following table details our material facilities by segment, owned or leased by us as of
December 31, 2018
.
|
Location
|
Leased or
Owned
|
Principal/Most Significant Use
|
||
|
All Segments
|
||||
|
Houston, Texas
|
Leased
|
Corporate office
|
||
|
Den Helder, the Netherlands
|
Owned
|
Regional operations and administration
|
||
|
U.S. Services and Tubular Sales Segments
|
||||
|
Lafayette, Louisiana
|
Owned
|
Regional operations, manufacturing, engineering and administration
|
||
|
New Iberia, Louisiana
|
Leased
|
Regional operations
|
||
|
International Services Segment
|
||||
|
Aberdeen, Scotland
|
Owned
|
Regional operations, engineering and administration
|
||
|
Dubai, United Arab Emirates
|
Leased
|
Regional operations and administration
|
||
|
Kuala Lumpur, Malaysia
|
Leased
|
Regional operations and administration
|
||
|
Macaé, Brazil
|
Leased
|
Regional operations and administration
|
||
|
Blackhawk Segment
|
||||
|
Houma, Louisiana
|
Leased
|
Regional operations, manufacturing and administration
|
||
Our largest manufacturing facility is located in Lafayette, Louisiana, where we manufacture a substantial portion of our tubular handling tools. The facility serves our U.S. Services segment in the U.S. Gulf of Mexico and our Tubular Sales segment. The Lafayette facility is our global headquarters for the design and manufacture of our equipment and is situated on a total of 170 acres. The main facility occupies 148 acres and consists of manufacturing, operations, pipe storage, training and administration. The remaining 22 acres located off of the main campus consists of manufacturing, warehousing and administration. There is a total of 16 buildings onsite and 16 buildings offsite. Our manufacturing operations occupy 15 of the 32 buildings, with the remaining buildings dedicated to administration, training and other operational tasks. The main administrative building within the facility is approximately 172,636 square feet. We believe the facilities that we currently occupy are suitable for their intended use.
Item 3.
Legal Proceedings
We are the subject of lawsuits and claims arising in the ordinary course of business from time to time. A liability is accrued when a loss is both probable and can be reasonably estimated. We had no material accruals for loss contingencies, individually or in the aggregate, as of
December 31, 2018
. We believe the probability is remote that the ultimate outcome of these matters would have a material adverse effect on our financial position, results of operations or cash flows. See Note 18—Commitments and Contingencies in the Notes to Consolidated Financial Statements, which are incorporated herein by reference to Part II, Item 8 “Financial Statements and Supplementary Data” of this Form 10-K.
We are conducting an internal investigation of the operations of certain of our foreign subsidiaries in West Africa including possible violations of the FCPA, our policies and other applicable laws. In June 2016, we voluntarily disclosed the existence of our extensive internal review to the SEC, the DOJ and other governmental entities. It is our intent to continue to fully cooperate with these agencies and any other applicable authorities in connection with any further investigation that may be conducted in connection with this matter. To date, our review has not indicated that there has been any material impact on our previously filed financial statements, although we have continued to collect information and cooperate with the authorities.
In addition, during the course of the investigation, we discovered historical business transactions (and bids to enter into business transactions) in certain countries that may have been subject to U.S. and other international sanctions. We disclosed this information to the U.S. Department of Commerce’s Bureau of Industry and Security, Office of Export Enforcement (“OEE”) and to the U.S. Department of the Treasury’s Office of Foreign Assets Control (“OFAC”) (as well as to the agencies involved in our ongoing investigation discussed above). We received a No Action Letter dated April 20, 2018 from OEE,
31
stating that OEE had closed its investigation without taking further action. In addition, we received a No Action Letter dated April 23, 2018 from OFAC, stating that OFAC had closed its investigation without taking further action.
As disclosed above, our investigation into possible violations of the FCPA remains ongoing, and it is our intent to continue to cooperate with the SEC, DOJ and other relevant governmental entities in connection therewith. At this time, we are unable to predict the ultimate resolution of these matters with these agencies, including any financial impact to us. Our board and management are committed to continuously enhancing our internal controls that support improved compliance and transparency throughout our global operations.
Item 4.
Mine Safety Disclosures
Not applicable.
32
PART II
Item 5.
Market for the Registrant’s Common Equity, Related Stockholder Matters and Issuer Purchases of Equity Securities
Market Information
Our common stock is traded on the NYSE under the symbol “FI”.
On
February 18, 2019
, we had
224,455,806
shares of common stock outstanding. The common shares outstanding at
February 18, 2019
were held by approximately 29 record holders. The actual number of shareholders is greater than the number of holders of record.
See Part III, Item 12, “Security Ownership of Certain Beneficial Owners and Management and Related Stockholder Matters” for discussion of equity compensation plans.
Dividend Policy
The declaration and payment of future dividends will be at the discretion of the Board of Supervisory Directors and will depend upon, among other things, future earnings, general financial condition, liquidity, capital requirements and general business conditions. Accordingly, there can be no assurance that we will pay dividends. On October 27, 2017, the Board of Managing Directors of the Company, with the approval of the Board of Supervisory Directors of the Company, approved a plan to suspend the Company’s quarterly dividend in order to preserve capital for various purposes, including to invest in growth opportunities.
Unregistered Sales of Equity
Securities
We did not have any sales of unregistered equity securities during the year ended
December 31, 2018
that we have not previously reported on a Quarterly Report on Form 10-Q or a Current Report on Form 8-K.
Issuer Purchases of Equity Securities
None.
33
Performance Graph
The following performance graph compares the performance of our common stock to the PHLX Oil Service Sector Index, Russell 2000 Index and to a peer group established by management. The peer group consists of the following companies: Baker Hughes Inc., Core Laboratories N.V., Diamond Offshore Drilling, Inc., Dril-Quip, Inc., Ensco plc, Forum Energy Technologies, Inc., Halliburton Company, Helmerich & Payne, Inc., Hornbeck Offshore Services, Inc., Nabors Industries Ltd., National Oilwell Varco, Inc., Oceaneering International, Inc., Patterson-UTI Energy, Inc., Rowan Companies plc, Schlumberger N.V., Transocean Ltd. and Weatherford International Ltd.
The graph below compares the cumulative total return to holders of our common stock with the cumulative total returns of the PHLX Oil Service Sector Index, Russell 2000 Index and our peer group for the period from December 31, 2013 through December 31, 2018. The graph assumes that the value of the investment in our common stock was $100 at December 31, 2013 and for each index (including reinvestment of dividends) and tracks the return on the investment through December 31, 2018. The shareholder return set forth herein is not necessarily indicative of future performance.
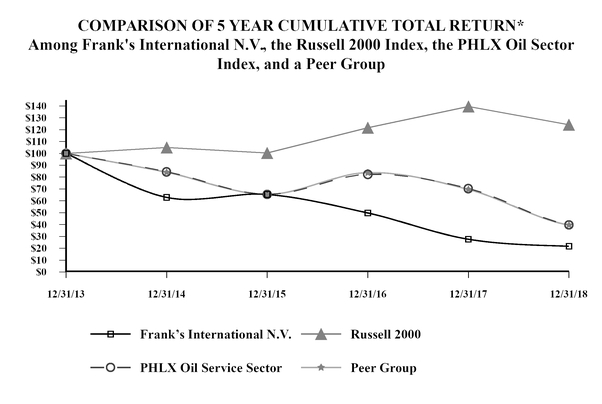
|
*$100 invested on 12/31/2013, including reinvestment of dividends.
Fiscal year ending December 31.
|
The performance graph above and related information shall not be deemed “soliciting material” or to be “filed” with the SEC, nor shall such information be incorporated by reference into any future filing under the Securities Act or the Exchange Act, except to the extent that we specifically incorporate by reference.
34
Item 6.
Selected Financial Data
The selected consolidated financial information contained below is derived from our Consolidated Financial Statements and should be read in conjunction with Part II, Item 7, “Management's Discussion and Analysis of Financial Condition and Results of Operations” and our audited Consolidated Financial Statements that are included in this Form 10-K. Our historical results are not necessarily indicative of our results to be expected in any future period.
|
Year Ended December 31,
|
|||||||||||||||||||
|
2018
|
2017
|
2016
|
2015
|
2014
|
|||||||||||||||
|
(in thousands, except per share amounts)
|
|||||||||||||||||||
|
Financial Statement Data:
|
|||||||||||||||||||
|
Revenue
|
$
|
522,493
|
|
$
|
454,795
|
|
$
|
487,531
|
|
$
|
974,600
|
|
$
|
1,152,632
|
|
||||
|
Net income (loss)
|
(90,733
|
)
|
(159,457
|
)
|
(156,079
|
)
|
106,110
|
|
229,312
|
|
|||||||||
|
Total assets
|
1,193,929
|
|
1,261,769
|
|
1,588,061
|
|
1,726,838
|
|
1,758,681
|
|
|||||||||
|
Debt
|
5,627
|
|
4,721
|
|
276
|
|
7,321
|
|
304
|
|
|||||||||
|
Total equity
|
1,034,772
|
|
1,115,901
|
|
1,311,319
|
|
1,451,426
|
|
1,472,536
|
|
|||||||||
|
Earnings Per Share Information:
|
|||||||||||||||||||
|
Basic income (loss) per common share
|
$
|
(0.41
|
)
|
$
|
(0.72
|
)
|
$
|
(0.77
|
)
|
$
|
0.51
|
|
$
|
1.03
|
|
||||
|
Diluted income (loss) per common share
|
$
|
(0.41
|
)
|
$
|
(0.72
|
)
|
$
|
(0.77
|
)
|
$
|
0.50
|
|
$
|
1.03
|
|
||||
|
Weighted average common shares outstanding:
|
|||||||||||||||||||
|
Basic
|
223,999
|
|
222,940
|
|
176,584
|
|
154,662
|
|
153,814
|
|
|||||||||
|
Diluted
|
223,999
|
|
222,940
|
|
176,584
|
|
209,152
|
|
207,828
|
|
|||||||||
|
Cash dividends per common share
|
$
|
—
|
|
$
|
0.225
|
|
$
|
0.45
|
|
$
|
0.60
|
|
$
|
0.45
|
|
||||
|
Other Data:
|
|||||||||||||||||||
|
Adjusted EBITDA
(1)
|
$
|
33,232
|
|
$
|
5,715
|
|
$
|
25,031
|
|
$
|
319,086
|
|
$
|
451,513
|
|
||||
|
(1)
|
Adjusted EBITDA is a supplemental non-GAAP financial measure that is used by management and external users of our financial statements, such as industry analysts, investors, lenders and rating agencies. For a definition and a reconciliation of Adjusted EBITDA to our income from continuing operations, its most directly comparable financial measure presented in accordance with GAAP, see Part II, Item 7, “Management’s Discussion and Analysis of Financial Condition and Results of Operations - How We Evaluate Our Operations - Adjusted EBITDA and Adjusted EBITDA Margin.”
|
35
Item 7.
Management’s Discussion and Analysis of Financial Condition and Results of Operation
The following discussion and analysis of our financial condition and results of operations should be read in conjunction with the consolidated financial statements and the related notes thereto included in Part II, Item 8, “Financial Statements and Supplementary Data” included in this Form 10-K.
This section contains forward-looking statements that are based on management’s current expectations, estimates and projections about our business and operations, and involve risks and uncertainties. Our actual results may differ materially from those currently anticipated and expressed in such forward-looking statements because of various factors, including those described in the sections titled “Cautionary Note Regarding Forward-Looking Statements,” Part I, Item 1A, “Risk Factors” and elsewhere in this Form 10-K.
Overview of Business
We are a global provider of highly engineered tubular services, tubular fabrication and specialty well construction and well intervention solutions to the oil and gas industry and have been in business for 80 years. We provide our services and products to leading exploration and production companies in both offshore and onshore environments, with a focus on complex and technically demanding wells.
We conduct our business through four operating segments:
|
•
|
International Services.
We currently provide our
tubular services
in approximately
50
countries on six continents. Our customers in these international markets are primarily large exploration and production companies, including integrated oil and gas companies and national oil and gas companies
, and other oilfield services companies
.
|
|
•
|
U.S. Services.
We provide tubular services in the active onshore oil and gas drilling regions in the U.S., including the
Permian Basin, Eagle Ford Shale, Haynesville Shale, Marcellus/Utica Shale, Niobrara Shale, Woodford Shale, Green River Basin and Uintah Basin, as well as in the U.S. Gulf of Mexico.
|
|
•
|
Tubular Sales.
We design, manufacture and distribute large OD pipe, connectors and casing attachments
and sell large OD pipe originally manufactured by various pipe mills.
We also provide specialized fabrication and welding services in support of offshore projects, including drilling and production risers, flowlines and pipeline end terminations, as well as long-length tubulars (up to 300 feet in length) for use as caissons or pilings.
This segment also designs and manufactures proprietary equipment for use in our International and U.S. Services segments.
|
|
•
|
Blackhawk.
We provide well construction and well intervention services and products, in addition to cementing tool expertise, in the U.S. and Mexican Gulf of Mexico, onshore U.S. and other select international locations.
Blackhawk’s customer base consists primarily of major and independent oil and gas companies as well as other oilfield services companies.
|
How We Generate Our Revenue
The
majority of our services revenues are derived primarily from providing tubular services, which involves the
handling and installation of multiple joints of pipe to establish a cased wellbore and the installation of smaller diameter pipe inside a cased wellbore.
In contrast, our product revenues are derived from sales of certain products, including large OD pipe connectors and large OD pipe manufactured by third parties, directly to external customers.
Our Blackhawk revenues are derived from
well construction and well intervention services and products.
The revenues have historically been split evenly between service revenue and product revenue.
In addition, our customers typically reimburse us for transportation costs that we incur in connection with transporting our products and equipment from our staging areas to the customers’ job sites.
36
Outlook
Despite recent headwinds, in 2019 we expect to see increased customer spending globally on oil and natural gas exploration and production in response to the continued stabilization of commodity prices. Much of the anticipated increase in spending will continue to be associated with U.S. onshore projects, although we anticipate the rate of spending outside of U.S. onshore to increase in 2019. Activity in the deep and ultra-deep offshore markets is expected to see some modest improvement in 2019, and pricing of newly sanctioned projects is estimated to be marginally higher than recent trends. In many international offshore shelf markets, we are seeing increased activity as operators are increasingly seeing improved economics at current commodity prices. In response, we will continue our efforts to expand products and services historically weighted to the U.S. market to international markets, reducing costs through operational efficiency gains and prioritizing projects that improve market share and profitability.
For our offshore businesses, both in the U.S. and internationally, we expect the trend of the last few years of less predictable, shorter-term projects to stabilize, if not reverse slightly in 2019. In 2018, we made significant market share gains globally and expect to continue to maintain those gains in certain markets, but competitive pricing is likely to persist that could result in lower growth in both revenue and margins.
Our onshore operations are expected to see sequential improvement, particularly in the U.S. onshore market, as drilling activity levels remain robust. The increase in demand for our services combined with a leaner cost structure is expected to result in higher revenues and improved profitability for this business in 2019.
The Tubular Sales segment is primarily driven by specialized needs of our customers and the timing of projects, specifically in the Gulf of Mexico. We expect to benefit from increased sales in select international markets that are predicted to supplement our flat to slightly down outlook in the offshore Gulf of Mexico.
The Blackhawk segment product and service lines are expected to see meaningful improvement in 2019. The U.S. onshore products and services will likely improve significantly from the expansion of new physical presence into new basins previously underrepresented. The growth of Blackhawk into international offshore markets is expected to see a significant sequential improvement as new equipment is built, certified and deployed in these markets. However, the U.S. Gulf of Mexico market expects to see continued headwinds as operator activity is expected to be flat to slightly down.
Overall, our market outlook continues to be modestly improved. The onshore markets in the U.S. are stable and we are expecting higher activity from select international offshore markets. We expect to continue to deploy new tools and services into select international markets with historical underrepresentation by the Blackhawk and Tubular Sales segments. We remain in a very strong position financially with a significant cash balance relative to our debt.
How We Evaluate Our Operations
We use a number of financial and operational measures to routinely analyze and evaluate the performance of our business, including revenue, Adjusted EBITDA, Adjusted EBITDA margin and safety performance.
Revenue
We analyze our revenue growth by comparing actual monthly revenue to our internal projections for each month to assess our performance. We also assess incremental changes in our monthly revenue across our operating segments to identify potential areas for improvement.
Adjusted EBITDA and Adjusted EBITDA Margin
We define Adjusted EBITDA as net income (loss) before interest income, net, depreciation and amortization, income tax benefit or expense, asset impairments, gain or loss on disposal of assets, foreign currency gain or loss, equity-based compensation, unrealized and realized gain or loss, the effects of the TRA, other non-cash adjustments and other charges or credits. Adjusted EBITDA margin reflects our Adjusted EBITDA as a percentage of our revenues. We review Adjusted
37
EBITDA and Adjusted EBITDA margin on both a consolidated basis and on a segment basis. We use Adjusted EBITDA and Adjusted EBITDA margin to assess our financial performance because it allows us to compare our operating performance on a consistent basis across periods by removing the effects of our capital structure (such as varying levels of interest expense), asset base (such as depreciation and amortization), items outside the control of our management team (such as income tax and foreign currency exchange rates) and other charges outside the normal course of business. Adjusted EBITDA and Adjusted EBITDA margin have limitations as analytical tools and should not be considered as an alternative to net income (loss), operating income (loss), cash flow from operating activities or any other measure of financial performance presented in accordance with generally accepted accounting principles in the U.S. (“GAAP”).
The following table presents a reconciliation of Adjusted EBITDA and Adjusted EBITDA margin to net loss for each of the periods presented (in thousands):
|
Year Ended December 31,
|
|||||||||||
|
2018
|
2017
|
2016
|
|||||||||
|
Net loss
|
$
|
(90,733
|
)
|
$
|
(159,457
|
)
|
$
|
(156,079
|
)
|
||
|
Interest income, net
|
(4,243
|
)
|
(2,309
|
)
|
(2,073
|
)
|
|||||
|
Depreciation and amortization
|
111,292
|
|
122,102
|
|
114,215
|
|
|||||
|
Income tax expense (benefit)
|
(2,950
|
)
|
72,918
|
|
(25,643
|
)
|
|||||
|
(Gain) loss on disposal of assets
|
(1,309
|
)
|
(2,045
|
)
|
1,117
|
|
|||||
|
Foreign currency (gain) loss
|
5,675
|
|
(2,075
|
)
|
10,819
|
|
|||||
|
TRA related adjustments
(1)
|
1,359
|
|
(122,515
|
)
|
—
|
|
|||||
|
Charges and credits
(2)
|
14,141
|
|
99,096
|
|
82,675
|
|
|||||
|
Adjusted EBITDA
|
$
|
33,232
|
|
$
|
5,715
|
|
$
|
25,031
|
|
||
|
Adjusted EBITDA margin
|
6.4
|
%
|
1.3
|
%
|
5.1
|
%
|
|||||
(1) Please see Note 13—Related Party Transactions in the Notes to Consolidated Financial Statements for further discussion.
|
(2)
|
Comprised of Equity-based compensation expense (2018:
$10,621
; 2017:
$13,862
; 2016:
$15,978
), Mergers and acquisition expense (2018:
$58
; 2017:
$459
; 2016:
$13,784
), Severance and other charges (credits), net (2018:
$(310)
; 2017:
$75,354
; 2016:
$46,406
), Unrealized and realized (gains) losses (2018:
$(1,682)
; 2017:
$2,791
; 2016:
$110
), Investigation-related matters (2018:
$5,454
; 2017:
$6,143
; 2016: $
6,397
) and Other adjustments (2018:
none
; 2017:
$487
; 2016:
none
).
|
Safety Performance
Safety is our primary core value. Maintaining a strong safety record is a critical component of our operational success. Many of our customers have safety standards we must satisfy before we can perform services. As a result, we continually monitor and improve our safety performance through the evaluation of safety observations, job and customer surveys, and safety data. The primary measure for our safety performance is the tracking of the Total Recordable Incident Rate (“TRIR”). TRIR is a measure of the rate of recordable workplace injuries, normalized on the basis of 100 full time employees for an annual period. The factor is derived by multiplying the number of recordable injuries in a calendar year by 200,000 and dividing this value by the total hours actually worked in the year. A recordable injury includes occupational death, nonfatal occupational illness, and other occupational injuries that involve loss of consciousness, lost time injuries, restriction of work or motion cases, transfer to another job, or medical treatment cases other than first aid.
The table below presents our worldwide TRIR for the years ended December 31,
2018
,
2017
and
2016
:
|
Year Ended December 31,
|
||||||||
|
2018
|
2017
|
2016
|
||||||
|
TRIR
|
0.84
|
|
0.57
|
|
0.87
|
|
||
38
Results of Operations
The following table presents our consolidated results for the periods presented (in thousands):
|
Year Ended December 31,
|
|||||||||||
|
2018
|
2017
|
2016
|
|||||||||
|
Revenues:
|
|||||||||||
|
Services
|
$
|
416,781
|
|
$
|
364,061
|
|
$
|
397,369
|
|
||
|
Products
|
105,712
|
|
90,734
|
|
90,162
|
|
|||||
|
Total revenue
|
522,493
|
|
454,795
|
|
487,531
|
|
|||||
|
Operating expenses:
|
|||||||||||
|
Cost of revenues, exclusive of depreciation and amortization
|
|||||||||||
|
Services
|
265,688
|
|
223,222
|
|
246,652
|
|
|||||
|
Products
|
84,429
|
|
87,200
|
|
70,616
|
|
|||||
|
General and administrative expenses
|
155,584
|
|
163,704
|
|
171,887
|
|
|||||
|
Depreciation and amortization
|
111,292
|
|
122,102
|
|
114,215
|
|
|||||
|
Severance and other charges (credits), net
|
(310
|
)
|
75,354
|
|
46,406
|
|
|||||
|
(Gain) loss on disposal of assets
|
(1,309
|
)
|
(2,045
|
)
|
1,117
|
|
|||||
|
Operating loss
|
(92,881
|
)
|
(214,742
|
)
|
(163,362
|
)
|
|||||
|
Other income (expense):
|
|||||||||||
|
TRA related adjustments
(1)
|
(1,359
|
)
|
122,515
|
|
—
|
|
|||||
|
Other income
|
2,047
|
|
1,763
|
|
4,170
|
|
|||||
|
Interest income, net
|
4,243
|
|
2,309
|
|
2,073
|
|
|||||
|
Mergers and acquisition expense
|
(58
|
)
|
(459
|
)
|
(13,784
|
)
|
|||||
|
Foreign currency gain (loss)
|
(5,675
|
)
|
2,075
|
|
(10,819
|
)
|
|||||
|
Total other income (expense)
|
(802
|
)
|
128,203
|
|
(18,360
|
)
|
|||||
|
Loss before income taxes
|
(93,683
|
)
|
(86,539
|
)
|
(181,722
|
)
|
|||||
|
Income tax expense (benefit)
|
(2,950
|
)
|
72,918
|
|
(25,643
|
)
|
|||||
|
Net loss
|
(90,733
|
)
|
(159,457
|
)
|
(156,079
|
)
|
|||||
|
Less: Net loss attributable to noncontrolling interest
|
—
|
|
—
|
|
(20,741
|
)
|
|||||
|
Net loss attributable to Frank’s International N.V.
|
$
|
(90,733
|
)
|
$
|
(159,457
|
)
|
$
|
(135,338
|
)
|
||
(1)
Please see Note 13—Related Party Transactions in the Notes to Consolidated Financial Statements for further discussion.
Consolidated Results of Operations
Year Ended December 31, 2018
Compared to
Year Ended December 31, 2017
Revenues
. Revenues from external customers, excluding intersegment sales, for the year ended
December 31, 2018
increased
by
$67.7 million
, or
14.9%
, to
$522.5 million
from
$454.8 million
for the year ended
December 31, 2017
. Revenues increased across all of our segments primarily as a result of improved activity levels, particularly in the western hemisphere.
Revenues for our segments are discussed separately below under the heading “Operating Segment Results.”
Cost of revenues, exclusive of depreciation and amortization
. Cost of revenues for the year ended
December 31, 2018
increased
by
$39.7 million
, or
12.8%
, to
$350.1 million
from
$310.4 million
for the year ended
December 31, 2017
.
The increase was primarily due to
higher activity levels and mix of work in the U.S. Services and Blackhawk segments, partially offset by productivity actions taken in 2017 and 2018.
General and administrative expenses.
General and administrative (“G&A”) expenses for the year ended
December 31, 2018
decreased
by
$8.1 million
, or
5.0%
, to
$155.6 million
from
$163.7 million
for the year ended
December 31, 2017
,
39
primarily due to lower professional fees and stock-based compensation expense, as well as reduced expenses associated with aircraft sold in 2017.
Depreciation and amortization.
Depreciation and amortization for the year ended
December 31, 2018
decreased
by
$10.8 million
, or
8.9%
, to
$111.3 million
from
$122.1 million
for the year ended
December 31, 2017
, as a result of a lower depreciable base due to decreased capital expenditures in recent years.
Severance and other charges (credits), net.
Severance and other charges (credits), net for the year ended
December 31, 2018
changed by
$75.7 million
to a credit of
$0.3 million
from a charge of
$75.4 million
for the year ended
December 31, 2017
. In 2017, we recorded impairments of our pipe and connectors inventory of
$51.2 million
and accounts receivable write offs of
$15.0 million
related to Venezuela, Nigeria and Angola. During the fourth quarter of 2017, management decided to significantly reduce our footprint in Nigeria and Angola by exiting certain bases and temporarily abandoning our investment in Venezuela. In 2018, we recovered
$4.9 million
of previously written off receivables from a customer in Angola.
See Note 19
—
Severance and Other Charges (Credits), net in the Notes to Consolidated Financial Statements for additional information.
Foreign currency gain (loss)
. Foreign currency gain (loss) for the year ended
December 31, 2018
changed by
$7.8 million
to a loss of
$5.7 million
from a gain of
$2.1 million
for the year ended
December 31, 2017
. The change in foreign currency results was primarily driven by the strengthening of the U.S. dollar against other currencies.
Income tax expense (benefit).
Income tax expense (benefit) for the year ended
December 31, 2018
changed by
$75.9 million
to a benefit of
$3.0 million
from an expense of
$72.9 million
for the year ended
December 31, 2017
.
The effective income tax rate was
3.1%
and
(84.3)%
for the years ended
December 31, 2018
and
December 31, 2017
, respectively.
The change from 2017 to 2018 was primarily because in 2017 we: (1) recorded valuation allowances against our net deferred tax assets, (2) reversed deferred taxes in conjunction with the derecognition of the TRA, and (3) recorded the effect of a change in U.S. federal income tax rates on our deferred tax assets and liabilities. In addition, in 2018 we recorded a deferred tax benefit in conjunction with the reorganization of our intercompany leasing operations. Excluding these one-time items, the effective income tax rate and income tax expense (benefit) for 2017 would have been 57.4% and $(49.7) million, respectively and the effective income tax rate and income tax expense (benefit) for 2018 would have been 8.8% and $(8.3) million, respectively. The change from 2017 to 2018, excluding one-time items, is primarily due to changes in the jurisdictional mix of earnings and the application of the reduced U.S. tax rate of 21% to our U.S. operations.
We are subject to many U.S. and foreign tax jurisdictions and many tax agreements and treaties among the various taxing authorities. Our operations in these jurisdictions are taxed on various bases such as income before taxes, deemed profits (which is generally determined using a percentage of revenues rather than profits) and withholding taxes based on revenues; consequently, the relationship between our pre-tax income from operations and our income tax provision varies from period to period.
Year Ended December 31, 2017 Compared to Year Ended December 31, 2016
Revenues.
Revenues from external customers, excluding intersegment sales, for the year ended December 31, 2017 decreased by $32.7 million, or 6.7%, to $454.8 million from $487.5 million for the year ended December 31, 2016. The decrease was primarily attributable to lower revenues in the majority of our segments due to declining activity as depressed oil and gas prices resulted in reduced rig count in offshore markets, downward pricing pressures, rig cancellations and delays as well as deferred work scopes in the International and offshore U.S. Services regions. Tubular Sales decreased due to lower international demand and decreased deepwater fabrication revenue. The decreased revenues were partially offset by an increase in revenues from our Blackhawk segment of $61.0 million resulting from our acquisition of Blackhawk in November 2016 and improved U.S. onshore revenues. See Note 3—Acquisitions and Divestitures in the Notes to Consolidated Financial Statements for additional information on our Blackhawk acquisition. Revenues for our segments are discussed separately below under the heading “Operating Segment Results.”
Cost of revenues, exclusive of depreciation and amortization.
Cost of revenues for the year ended December 31, 2017 decreased by $6.8 million, or 2.2%, to $310.4 million from $317.3 million for the year ended December 31, 2016. The decrease was primarily due to lower cost of product sales in our Tubular Sales segment driven by lower activity volumes
40
and cost cutting initiatives, partially offset by $26.6 million in additional cost of revenues related to our Blackhawk acquisition, which was acquired in November 2016.
General and administrative expenses.
General and administrative (“G&A”) expenses for the year ended December 31, 2017 decreased by $8.2 million, or 4.8%, to $163.7 million from $171.9 million for the year ended December 31, 2016, primarily due to the bad debt expense related to Venezuelan receivables in 2016, a reduction in compensation and benefit related expenses, and one-time property tax credits earned in 2017, partially offset by higher IT expenses and increased G&A expense related to the Blackhawk acquisition. Expense related to the write-off of Venezuelan receivables in 2017 is included in severance and other charges (credits), net.
Depreciation and amortization.
Depreciation and amortization for the year ended December 31, 2017 increased by $7.9 million, or 6.9%, to $122.1 million from $114.2 million for the year ended December 31, 2016. The increase was primarily attributable to our Blackhawk acquisition, partially offset by a lower depreciable base as a result of asset retirements during the fourth quarter of 2016.
Severance and other charges (credits), net.
Severance and other charges (credits), net for the year ended December 31, 2017 increased $28.9 million, or 62.4%, to $75.4 million, primarily due to impairments of our pipe and connectors inventory of $51.2 million and accounts receivable write offs of $15.0 million related to Venezuela, Nigeria and Angola. During the fourth quarter of 2017, management decided to significantly reduce our footprint in Nigeria and Angola by exiting certain bases and temporarily abandoning our investment in Venezuela. This was partially offset by lower severance and other costs of $13.8 million and lower fixed asset retirements and abandonments of $23.4 million as compared to the prior year. See Note 19—Severance and Other Charges (Credits), net in the Notes to Consolidated Financial Statements for additional information.
Foreign currency gain (loss).
Foreign currency gain (loss) for the year ended December 31, 2017 changed by $12.9 million to a gain of $2.1 million from a loss of $10.8 million for the year ended December 31, 2016. The change was primarily due to the devaluation of the Nigerian Naira during 2016.
Income tax expense (benefit).
Income tax expense (benefit) for the year ended December 31, 2017 changed by $98.6 million to an expense of $72.9 million from a benefit of $25.6 million for the year ended December 31, 2016. The effective income tax rate was (84.3)% and 14.1% for the years ended December 31, 2017 and December 31, 2016, respectively. The change from 2016 to 2017 was primarily because of recording valuation allowances against our net deferred tax assets, and the reversal of deferred taxes associated with the derecognition of the TRA. Excluding these one-time items, the effective income tax rate and income tax expense (benefit) for 2017 would have been 57.4% and $(49.7) million, respectively. The change from 2016 to 2017, excluding one-time items, is primarily due to changes in the jurisdictional mix of earnings.
We are subject to many U.S. and foreign tax jurisdictions and many tax agreements and treaties among the various taxing authorities. Our operations in these jurisdictions are taxed on various bases such as income before taxes, deemed profits (which is generally determined using a percentage of revenues rather than profits) and withholding taxes based on revenues; consequently, the relationship between our pre-tax income from operations and our income tax provision varies from period to period.
On December 22, 2017, the Tax Cuts and Jobs Act (“Tax Act”) was enacted into law. Among the significant changes made by the Act was the reduction of the federal income tax rate from 35% to 21% as well as the imposition of a one-time repatriation tax on deemed repatriated earnings of certain foreign subsidiaries. US GAAP requires that the impact of the Tax Act be recognized in the period in which the law was enacted. Because of the change in tax rate, the Company recorded a $23.8 million reduction in the value of its deferred tax assets and liabilities. The reduction in value was fully offset by a corresponding change in valuation allowance. The net effect on total tax expense was zero. Due to its legal structure, the Company did not incur any liability with respect to the repatriation tax.
41
Operating Segment Results
The following table presents revenues and Adjusted EBITDA by segment (in thousands):
|
Year Ended December 31,
|
|||||||||||
|
2018
|
2017
|
2016
|
|||||||||
|
Revenue:
|
|||||||||||
|
International Services
|
$
|
222,992
|
|
$
|
206,746
|
|
$
|
237,207
|
|
||
|
U.S. Services
|
148,941
|
|
118,815
|
|
152,827
|
|
|||||
|
Tubular Sales
|
61,415
|
|
58,210
|
|
87,515
|
|
|||||
|
Blackhawk
|
89,145
|
|
71,024
|
|
9,982
|
|
|||||
|
Total
|
$
|
522,493
|
|
$
|
454,795
|
|
$
|
487,531
|
|
||
|
Segment Adjusted EBITDA:
(1)
|
|||||||||||
|
International Services
|
$
|
35,498
|
|
$
|
30,801
|
|
$
|
33,264
|
|
||
|
U.S. Services
(2)
|
(18,115
|
)
|
(39,357
|
)
|
(11,012
|
)
|
|||||
|
Tubular Sales
|
3,153
|
|
3,181
|
|
1,741
|
|
|||||
|
Blackhawk
|
12,696
|
|
11,090
|
|
1,038
|
|
|||||
|
Total
|
$
|
33,232
|
|
$
|
5,715
|
|
$
|
25,031
|
|
||
|
(1)
|
Adjusted EBITDA is a supplemental non-GAAP financial measure that is used by management and external users of our financial statements, such as industry analysts, investors, lenders and rating agencies. (For a reconciliation of our Adjusted EBITDA, see “—Adjusted EBITDA and Adjusted EBITDA Margin.”)
|
|
(2)
|
Includes all corporate general and administrative expenses.
|
Year Ended December 31, 2018
Compared to
Year Ended December 31, 2017
International Services
Revenue for the International Services segment was
$223.0 million
for the year ended
December 31, 2018
, an
increase
of
$16.2 million
, or
7.9%
, compared to
$206.7 million
for the same period in
2017
, primarily due to activity improvements in offshore Western Hemisphere, Asia Pacific and the Middle East, which were partially offset by lower activity levels in Africa and decreased work scope in the North Sea.
Adjusted EBITDA for the International Services segment was
$35.5 million
for the year ended
December 31, 2018
, an
increase
of
$4.7 million
, or
15.2%
, compared to
$30.8 million
for the same period in
2017
, primarily due to efficiency gains with higher revenues and upsell work in offshore Western Hemisphere, partially offset by decreased work scope in the North Sea. Prior year results were positively impacted by a tax credit that did not repeat in 2018.
U.S. Services
Revenue for the U.S. Services segment was
$148.9 million
for the year ended
December 31, 2018
, an
increase
of
$30.1 million
, or
25.4%
, compared to
$118.8 million
for the same period in
2017
. Onshore services revenue increased by
$18.8 million
as a result of improved activity from increased rig counts. The offshore business saw an increase in revenue of
$11.3 million
as a result of increased rig counts and higher service activity in the Gulf of Mexico.
Adjusted EBITDA for the U.S. Services segment was a loss of
$18.1 million
for the year ended
December 31, 2018
, a favorable change of
$21.2 million
, or
54.0%
, compared to a loss of
$39.4 million
for the same period in
2017
, primarily due to an increase in onshore services activity and lower corporate costs, partially offset by lower pricing for our offshore services.
42
Tubular Sales
Revenue for the Tubular Sales segment was
$61.4 million
for the year ended
December 31, 2018
, an
increase
of
$3.2 million
, or
5.5%
, compared to
$58.2 million
for the same period in
2017
, primarily as a result of increased cavern well activity and higher sales activity in Mexico.
Adjusted EBITDA for the Tubular Sales segment was
$3.2 million
for the year ended
December 31, 2018
, which was flat compared to
2017
, as increased profitability from improved activity levels was offset by higher manufacturing costs.
Blackhawk
Revenue for the Blackhawk Segment was
$89.1 million
for the year ended
December 31, 2018
, an
increase
of
$18.1 million
, or
25.5%
, compared to
$71.0 million
for the same period in
2017
, driven by strong activity in the U.S. onshore market, growth in international markets and increased market share and new product offerings in the Gulf of Mexico.
Adjusted EBITDA for the Blackhawk segment was
$12.7 million
for the year ended
December 31, 2018
, an
increase
of
$1.6 million
, or
14.5%
, compared to
$11.1 million
for the same period in
2017
, primarily due to improved operational results, partially offset by higher corporate overhead expense driven by bonus and medical claims expense allocations. See Note 1—Basis of Presentation and Significant Accounting Policies in the Notes to Consolidated Financial Statements.
Year Ended December 31, 2017
Compared to
Year Ended December 31, 2016
International Services
Revenue for the International Services segment was
$206.7 million
for the year ended December 31, 2017, a decrease of $30.5 million, or 12.8%, compared to
$237.2 million
for the same period in 2016, primarily due to lower offshore rig counts globally and increased pricing pressure on new contracts. Revenue declines in our Africa, Europe, and Asia Pacific regions were mostly attributable to our major customers reducing the amount of work they do in the regions, which was partially offset by our attempts to expand into countries with drilling activity where we have historically had a smaller presence and increases in Canada and the Middle East due to higher activity with key customers.
Adjusted EBITDA for the International Services segment was
$30.8 million
for the year ended December 31, 2017, a decrease of $2.5 million, or 7.4%, compared to
$33.3 million
for the same period in 2016, primarily due to the decrease in revenue, which was partially offset by lower expenses due to reduced activity and cost-cutting measures.
U.S. Services
Revenue for the U.S. Services segment was
$118.8 million
for the year ended December 31, 2017, a decrease of $34.0 million, or 22.3%, compared to
$152.8 million
for the same period in 2016, primarily due to a decrease in offshore services revenue of $51.4 million as a result of overall lower activity from weaknesses seen in the Gulf of Mexico due to rig cancellations and delays, coupled with downward pricing pressures. This was partially offset by an increase in onshore services revenue of $17.4 million as a result of improved activity due to increased oil prices, which has led to higher rig counts and more favorable pricing.
Adjusted EBITDA for the U.S. Services segment was a loss of
$39.4 million
for the year ended December 31, 2017, a decrease of $28.3 million, or 257.4%, compared to a loss of
$11.0 million
for the same period in 2016, primarily due to higher pricing concessions, increased asset related expenses and higher labor costs to support increased land activity, as well as higher corporate and other costs, which were attributable to ongoing global corporate initiatives.
Tubular Sales
Revenue for the Tubular Sales segment was
$58.2 million
for the year ended December 31, 2017, a decrease of $29.3 million, or 33.5%, compared to
$87.5 million
for the same period in 2016, primarily as a result of lower deepwater activity in the Gulf of Mexico.
43
Adjusted EBITDA for the Tubular Sales segment was
$3.2 million
for the year ended December 31, 2017, an increase of $1.4 million, or 82.7%, compared to
$1.7 million
for the same period in 2016, due to cost cutting measures and lower product costs, offset by an increase in freight costs associated with project work.
Blackhawk
The Blackhawk segment is comprised solely of the assets we acquired on November 1, 2016. Revenues and Adjusted EBITDA for the segment were $71.0 million and $11.1 million, respectively, for the year ended December 31, 2017, compared to $10.0 million and $1.0 million, respectively, for the two months ended December 31, 2016.
Liquidity and Capital Resources
Liquidity
At
December 31, 2018
, we had cash and cash equivalents and short-term investments of
$212.8 million
and debt of
$5.6 million
. Our primary sources of liquidity to date have been cash flows from operations. Our primary uses of capital have been for organic growth capital expenditures and acquisitions. We continually monitor potential capital sources, including equity and debt financing, in order to meet our investment and target liquidity requirements.
Our total capital expenditures are estimated to range between $40.0 million and $50.0 million for 2019, of which we expect approximately 65% will be used for the purchase and manufacture of equipment and 35% for other property, plant and equipment, inclusive of the purchase or construction of facilities. The actual amount of capital expenditures for the manufacture of equipment may fluctuate based on market conditions. During the years ended
December 31, 2018
,
2017
and
2016
, purchases of property, plant and equipment and intangibles were
$56.5 million
,
$22.0 million
and
$42.1 million
, respectively, all of which were funded from internally generated sources. We believe our cash on hand and cash flows from operations will be sufficient to fund our capital expenditure and liquidity requirements for the next twelve months.
The timing, declaration, amount of, and payment of any dividends is within the discretion of our board of managing directors subject to the approval of our Board of Supervisory Directors and will depend upon many factors, including our financial condition, earnings, capital requirements, covenants associated with certain of our debt service obligations, legal requirements, regulatory constraints, industry practice, ability to access capital markets, and other factors deemed relevant by our board of managing directors and our Board of Supervisory Directors. We do not have a legal obligation to pay any dividend and there can be no assurance that we will be able to do so. On October 27, 2017, the Board of Managing Directors of the Company, with the approval from the Board of Supervisory Directors of the Company, approved a plan to suspend the Company’s quarterly dividend in order to preserve capital for various purposes, including to invest in growth opportunities.
Credit Facilities
New
Asset Based Revolving Credit Facility
On November 5, 2018, FICV, Frank’s International, LLC and Blackhawk, as borrowers, and FINV, certain of FINV’s subsidiaries, including FICV, Frank’s International, LLC, Blackhawk, Frank’s International GP, LLC, Frank’s International, LP, Frank’s International LP B.V., Frank’s International Partners B.V., Frank’s International Management B.V., Blackhawk Intermediate Holdings, LLC, Blackhawk Specialty Tools, LLC, and Trinity Tool Rentals, L.L.C., as guarantors, entered into a
five
-year senior secured revolving credit facility (the “New ABL Credit Facility”) with JPMorgan Chase Bank, N.A., as administrative agent (the “ABL Agent”), and other financial institutions as lenders with total commitments of
$100.0 million
including up to
$15.0 million
available for letters of credit. Subject to the terms of the New ABL Credit Facility, we have the ability to increase the commitments to
$200.0 million
. The maximum amount that the Company may borrow under the New ABL Credit Facility is subject to a borrowing base, which is based on a percentage of certain eligible accounts receivable and eligible inventory, subject to customary reserves and other adjustments.
44
All obligations under the New ABL Credit Facility are fully and unconditionally guaranteed jointly and severally by FINV’s subsidiaries, including FICV, Frank’s International, LLC, Blackhawk, Frank’s International GP, LLC, Frank’s International, LP, Frank’s International LP B.V., Frank’s International Partners B.V.,
Frank’s International Management B.V.,
Blackhawk Intermediate Holdings, LLC, Blackhawk Specialty Tools, LLC, and Trinity Tool Rentals, L.L.C., subject to customary exceptions and exclusions. In addition, the obligations under the New ABL Credit Facility are secured by first priority liens on substantially all of the assets and property of the borrowers and guarantors, including pledges of equity interests in certain of FINV’s subsidiaries, subject to certain exceptions. Borrowings under the New ABL Credit Facility bear interest at FINV’s option at either (a) the Alternate Base Rate (
“
ABR
”
) (as defined therein), calculated as the greatest of (i) the rate of interest publicly quoted by the Wall Street Journal, as the “prime rate,” subject to each increase or decrease in such prime rate effective as of the date such change occurs, (ii) the federal funds effective rate that is subject to a
0.00%
interest rate floor plus
0.50%
, and (iii) the one-month Adjusted LIBO Rate (as defined therein) plus
1.00%
, or (b) the Adjusted LIBO Rate (as defined therein), plus, in each case, an applicable margin.
The applicable interest rate margin ranges from
1.00%
to
1.50%
per annum for ABR loans and
2.00%
to
2.50%
per annum for Eurodollar loans and, in each case, is based on FINV’s leverage ratio. The unused portion of the New ABL Credit Facility is subject to a commitment fee that varies from
0.250%
to
0.375%
per annum, according to average daily unused commitments under the New ABL Credit Facility. Interest on Eurodollar loans is payable at the end of the selected interest period, but no less frequently than quarterly. Interest on ABR loans is payable monthly in arrears.
The New ABL Credit Facility contains various covenants and restrictive provisions which limit, subject to certain customary exceptions and thresholds, FINV’s ability to, among other things, (1) enter into asset sales; (2) incur additional indebtedness; (3) make investments, acquisitions, or loans and create or incur liens; (4) pay certain dividends or make other distributions and (5) engage in transactions with affiliates. The New ABL Credit Facility also requires FINV to maintain a minimum fixed charge coverage ratio of
1.0
to
1.0
based on the ratio of (a) consolidated EBITDA (as defined therein) minus unfinanced capital expenditures to (b) Fixed Charges (as defined therein), when either (i) an event of default occurs under the New ABL Facility or (ii) availability under the New ABL Credit Facility falls for at least two consecutive calendar days below the greater of (A)
$12.5 million
and (B)
15%
of the lesser of the borrowing base and aggregate commitments (a “FCCR Trigger Event”). Accounts receivable received by FINV’s U.S. subsidiaries that are parties to the New ABL Credit Facility will be deposited into deposit accounts subject to deposit control agreements in favor of the ABL Agent. After a FCCR Trigger Event, these deposit accounts would be subject to “springing” cash dominion.
After a FCCR Trigger Event, the Company will be subject to compliance with the fixed charge coverage ratio and “springing” cash dominion until no default exists under the New ABL Credit Facility and availability under the facility for the preceding thirty consecutive days has been equal to at least the greater of (x)
$12.5 million
and (y)
15%
of the lesser of the borrowing base and the aggregate commitments.
If FINV fails to perform its obligations under the agreement that results in an event of default, the commitments under the New ABL Credit Facility could be terminated and any outstanding borrowings under the New ABL Credit Facility may be declared immediately due and payable. The New ABL Credit Facility also contains cross default provisions that apply to FINV’s other indebtedness.
As of
December 31, 2018
, FINV had
no
borrowings outstanding under the New ABL Credit Facility, letters of credit outstanding of
$4.9 million
and availability of
$69.7 million
.
Insurance Notes Payable
In 2018, we entered into a note to finance our annual insurance premiums totaling
$6.8 million
. The note bears interest at an annual rate of
3.9%
with a final maturity date in
October 2019
. At
December 31, 2018
, the total outstanding balance was
$5.6 million
.
In 2017, we entered into
three
notes to finance our annual insurance premiums totaling
$5.1 million
. The notes bear interest at an annual rate of
2.9%
with a final maturity date in
October 2018
. At December 31,
2017
, the total outstanding balance was
$4.7 million
.
45
Cash Flows from Operating, Investing and Financing Activities
Cash flows provided by (used in) our operations, investing and financing activities are summarized below (in thousands):
|
Year Ended December 31,
|
|||||||||||
|
2018
|
2017
|
2016
|
|||||||||
|
Operating activities
|
$
|
(32,644
|
)
|
$
|
24,774
|
|
$
|
(10,831
|
)
|
||
|
Investing activities
|
10,403
|
|
(77,709
|
)
|
(178,915
|
)
|
|||||
|
Financing activities
|
(7,946
|
)
|
(52,471
|
)
|
(96,765
|
)
|
|||||
|
(30,187
|
)
|
(105,406
|
)
|
(286,511
|
)
|
||||||
|
Effect of exchange rate changes on cash activities
|
3,384
|
|
(1,105
|
)
|
3,678
|
|
|||||
|
Decrease in cash and cash equivalents
|
$
|
(26,803
|
)
|
$
|
(106,511
|
)
|
$
|
(282,833
|
)
|
||
Statements of cash flows for entities with international operations that use the local currency as the functional currency exclude the effects of the changes in foreign currency exchange rates that occur during any given year, as these are noncash changes. As a result, changes reflected in certain accounts on the consolidated statements of cash flows may not reflect the changes in corresponding accounts on the consolidated balance sheets.
Operating Activities
Cash flow provided by (used in) operating activities was
$(32.6) million
for the year ended
December 31, 2018
as compared to
$24.8 million
in
2017
. The increase in cash flow used by operating activities in
2018
of
$57.4 million
as compared to 2017 was primarily a result of unfavorable accounts receivable changes. Most of the increase in cash provided by operating activities during 2017 was due to tax refunds of $29.7 million.
The increase in cash flow provided by operating activities for the year ended December 31,
2017
of
$35.6 million
as compared to the year ended December 31, 2016 was primarily due to positive working capital changes and the 2017 tax refunds of $29.7 million.
Investing Activities
Cash flow provided by (used in) investing activities was
$10.4 million
for the year ended
December 31, 2018
as compared to
$(77.7) million
for the year ended December 31,
2017
. The increase of
$88.1 million
was primarily a result of net investment activity of
$129.5 million
offset by lower proceeds from sale of assets of
$6.9 million
and higher purchases of property, plant and equipment from related parties of
$36.7 million
.
Cash flow used in investing activities was
$77.7 million
for the year ended December 31, 2017 as compared to
$178.9 million
for the year ended December 31, 2016. The decrease of
$101.2 million
period over period was primarily related to related to the acquisition of Blackhawk during 2016, for which $150.4 million in cash was used. In addition, lower purchases of property plant and equipment of $20.2 million and higher proceeds from sale of assets of $10.2 million also contributed to the decrease. These changes were partially offset by a net increase in purchase of investments of $79.8 million, primarily related to net purchases of investments with original maturities greater than three months but less than twelve months.
Financing Activities
Cash flow used in financing activities was
$7.9 million
for the year ended
December 31, 2018
as compared to
$52.5 million
for the year ended December 31,
2017
. The decrease of
$44.5 million
period over period is primarily related to lower dividends paid on common stock of
$50.2 million
, offset by higher repayments on borrowings of
$5.2 million
.
Cash flow used in financing activities was
$52.5 million
for the year ended December 31,
2017
as compared to
$96.8 million
for the year ended December 31, 2016. The decrease of
$44.3 million
period over period is primarily related to
46
lower dividends paid on common stock of $28.9 million, the absence of a payment to our noncontrolling interest of $8.0 million and lower repayments on borrowings of $6.5 million.
Contractual Obligations
We are a party to various contractual obligations. A portion of these obligations are reflected in our financial statements, such as debt, while other obligations, such as operating leases and purchase obligations, are not reflected on our balance sheet. The following is a summary of our contractual obligations as of
December 31, 2018
(in thousands):
|
Payments Due by Period
|
|||||||||||||||||||
|
Less than
|
More than
|
||||||||||||||||||
|
Total
|
1 year
|
1-3 years
|
3-5 years
|
5 years
|
|||||||||||||||
|
Debt
|
$
|
5,627
|
|
$
|
5,627
|
|
$
|
—
|
|
$
|
—
|
|
$
|
—
|
|
||||
|
Noncancellable operating leases
|
50,394
|
|
10,544
|
|
16,490
|
|
10,257
|
|
13,103
|
|
|||||||||
|
Purchase obligations
(1)
|
42,172
|
|
24,174
|
|
17,998
|
|
—
|
|
—
|
|
|||||||||
|
Total
|
$
|
98,193
|
|
$
|
40,345
|
|
$
|
34,488
|
|
$
|
10,257
|
|
$
|
13,103
|
|
||||
|
(1)
|
Includes purchase commitments related to connectors and pipe inventory. We enter into purchase commitments as needed.
|
In addition to the above, the Company has issued purchase orders in the ordinary course of business for the purchase of goods and services. These purchase orders are enforceable and legally binding. However, none of the Company’s purchase obligations call for deliveries of goods or services for time periods in excess of one year. Not included in the table above are uncertain tax positions of
$0.3 million
.
Tax Receivable Agreement
We entered into a TRA with FICV and Mosing Holdings in connection with our IPO. The TRA generally provides for the payment by us to Mosing Holdings of 85% of the amount of the actual reductions, if any, in payments of U.S. federal, state and local income tax or franchise tax in periods after our IPO (which reductions we refer to as “cash savings”) as a result of (i) the tax basis increases resulting from the transfer of FICV interests to us in connection with the conversion of shares of Preferred Stock into shares of our common stock on August 26, 2016 and (ii) imputed interest deemed to be paid by us as a result of, and additional tax basis arising from, payments under the TRA. In addition, the TRA provides for interest earned from the due date (without extensions) of the corresponding tax return to the date of payment specified by the TRA. We will retain the remaining 15% of cash savings, if any. The payment obligations under the TRA are our obligations and not obligations of FICV. The term of the TRA continues until all such tax benefits have been utilized or expired, unless we exercise our right to terminate the TRA.
If we elect to execute our sole right to terminate the TRA early, we would be required to make an immediate payment equal to the present value of the anticipated future tax benefits subject to the TRA (based upon certain assumptions and deemed events set forth in the TRA, including the assumption that it has sufficient taxable income to fully utilize such benefits and that any FICV interests that Mosing Holdings or its transferees own on the termination date are deemed to be exchanged on the termination date). In addition, payments due under the TRA will be similarly accelerated following certain mergers or other changes of control.
In certain circumstances, we may be required to make payments under the TRA that we have entered into with Mosing Holdings. In most circumstances, these payments will be associated with the actual cash savings that we recognize in connection with the conversion of Preferred Stock, which would reduce the actual tax benefit to us. If we were to elect to exercise our sole right to terminate the TRA early or enter into certain change of control transactions, we may incur payment obligations prior to the time we actually incur any tax benefit. In those circumstances, we would need to pay the amounts out of cash on hand, finance the payments or refrain from triggering the obligation. Though we do not have any present intention of triggering an advance payment under the TRA, based on our current liquidity and our expected ability to access debt and equity financing, we believe we would be able to make such a payment if necessary. Any such payment could reduce our cash on hand and our borrowing availability, however, which would also reduce the amount of cash available
47
to operate our business, to fund capital expenditures and to be paid as dividends to our stockholders, among other things. Please see Note 13—Related Party Transactions in the Notes to Consolidated Financial Statements.
Off-Balance Sheet Arrangements
At
December 31, 2018
, we had no off-balance sheet arrangements with the exception of operating leases and purchase obligations.
Critical Accounting Policies
The preparation of consolidated financial statements in conformity with GAAP requires management to select appropriate accounting principles from those available, to apply those principles consistently and to make reasonable estimates and assumptions that affect revenues and associated costs as well as reported amounts of assets and liabilities, and related disclosure of contingent assets and liabilities. Certain accounting policies involve judgments and uncertainties. We evaluate estimates and assumptions on a regular basis. We base our respective estimates on historical experience and various other assumptions that we believe to be reasonable under the circumstances, the results of which form the basis for making judgments about the carrying values of assets and liabilities that are not readily apparent from other sources. Actual results may differ from the estimates and assumptions used in preparation of our consolidated financial statements. We consider the following policies to be the most critical to understanding the judgments that are involved and the uncertainties that could impact our results of operations, financial condition and cash flows.
Revenue Recognition
Revenues are recognized when control of the promised goods or services is transferred to our customers, in an amount that reflects the consideration we expect to be entitled to in exchange for those goods or services. Payment terms on services and products generally range from
30
days to
120
days. Given the short-term nature of our service and product offerings, our contracts do not have a significant financing component and the consideration we receive is generally fixed.
Service revenues are recognized over time as services are performed or rendered. Rates for services are typically priced on a per day, per man-hour or similar basis. We generally perform services either under direct service purchase orders or master service agreements which are supplemented by individual call-out provisions. For customers contracted under such arrangements, an accrual is recorded in unbilled revenue for revenue earned but not yet invoiced.
Revenues on product sales are generally recognized at a point in time when the product has shipped and significant risks of ownership have passed to the customer. The sales arrangements typically do not include a right of return or other similar provisions, nor do they contain any other post-delivery obligations.
Some of our Tubular Sales and Blackhawk segment customers have requested that we store pipe, connectors and cementing products purchased from us in our facilities. We recognize revenues for these “bill and hold” sales once the following criteria have been met: (1) there is a substantive reason for the arrangement, (2) the product is identified as the customer’s asset, (3) the product is ready for delivery to the customer, and (4) we cannot use the product or direct it to another customer.
Income Taxes
The liability method is used for determining our income tax provisions, under which current and deferred tax liabilities and assets are recorded in accordance with enacted tax laws and rates. Under this method, the amounts of deferred tax liabilities and assets at the end of each period are determined using the tax rate expected to be in effect when taxes are actually paid or recovered. Valuation allowances are established to reduce deferred tax assets when it is more likely than not that some portion or all the deferred tax assets will not be realized. In determining the need for valuation allowances, we have made judgments and estimates regarding future taxable income and ongoing prudent and feasible tax planning strategies. These estimates and judgments include some degree of uncertainty, and changes in these estimates and assumptions could require us to adjust the valuation allowances for our deferred tax assets. Historically, changes to valuation allowances have been caused by major changes in the business cycle in certain countries and changes in local country law. The ultimate
48
realization of the deferred tax assets depends on the generation of sufficient taxable income in the applicable taxing jurisdictions.
Through FICV, we operate in approximately
50
countries under many legal forms. As a result, we are subject to the jurisdiction of numerous U.S. and foreign tax authorities, as well as to tax agreements and treaties among these governments. Our operations in these different jurisdictions are taxed on various bases: actual income before taxes, deemed profits (which are generally determined using a percentage of revenue rather than profits) and withholding taxes based on revenue. Determination of taxable income in any jurisdiction requires the interpretation of the related tax laws and regulations and the use of estimates and assumptions regarding significant future events such as the amount, timing and character of deductions, permissible revenue recognition methods under the tax law and the sources and character of income and tax credits. Changes in tax laws, regulations, agreements and treaties, foreign currency exchange restrictions or our level of operations or profitability in each taxing jurisdiction could have an impact on the amount of income taxes that we provide during any given year.
Our tax filings for open tax periods are subject to audit by the tax authorities. These audits may result in assessments of additional taxes that are resolved either with the tax authorities or through the courts. These assessments may occasionally be based on erroneous and even arbitrary interpretations of local tax law. Resolution of these situations inevitably includes some degree of uncertainty; accordingly, we provide taxes only for the amounts we believe will ultimately result from these proceedings. The resulting change to our tax liability, if any, is dependent on numerous factors including, among others, the amount and nature of additional taxes potentially asserted by local tax authorities; the willingness of local tax authorities to negotiate a fair settlement through an administrative process; the impartiality of the local courts; the number of countries in which we do business; and the potential for changes in the tax paid to one country to either produce, or fail to produce, an offsetting tax change in other countries. Our experience has been that the estimates and assumptions used to provide for future tax assessments have proven to be appropriate. However, past experience is only a guide, and the potential exists that the tax resulting from the resolution of current and potential future tax controversies may differ materially from the amount accrued.
In addition to the aforementioned assessments received from various tax authorities, we also provide for taxes for uncertain tax positions where formal assessments have not been received. The determination of these liabilities requires the use of estimates and assumptions regarding future events. Once established, we adjust these amounts only when more information is available or when an event occurs necessitating a change to the reserves such as changes in the facts or law, judicial decisions regarding the application of existing law or a favorable audit outcome. We believe that the resolution of tax matters will not have a material effect on our consolidated financial condition, although a resolution could have a material impact on our consolidated statements of operations for a particular period and on our effective tax rate for any period in which such resolution occurs.
Goodwill
Goodwill is not subject to amortization and is tested for impairment annually or more frequently if events or changes in circumstances indicate that the asset might be impaired. A qualitative assessment is allowed to determine if goodwill is potentially impaired. The qualitative assessment determines whether it is more likely than not that a reporting unit’s fair value is less than its carrying amount. If it is more likely than not that the fair value of the reporting unit is less than the carrying amount, then a quantitative impairment test is performed. The quantitative goodwill impairment test is used to identify both the existence of impairment and the amount of impairment loss. The test compares the fair value of a reporting unit with its carrying amount, including goodwill. The amount of impairment for goodwill is measured as the excess of its carrying value over its fair value. We complete our assessment of goodwill impairment as of October 31 each year.
No
goodwill impairment was recorded for years ended December 31,
2018
,
2017
and
2016
. Our goodwill is allocated to our operating segments as follows: U.S. Services - approximately
$16.2 million
; Tubular Sales - approximately
$2.4 million
; Blackhawk - approximately
$192.4 million
. The inputs used in the determination of fair value are generally level 3 inputs.
49
Allowance for Doubtful Accounts
We evaluate whether client receivables are collectible. We perform ongoing credit evaluations of our clients and monitor collections and payments in order to maintain a provision for estimated uncollectible accounts based on our historical collection experience and our current aging of client receivables outstanding in addition to clients’ representations and our understanding of the economic environment in which our clients operate. Based on our review, we establish or adjust allowances for specific clients and the accounts receivable as a whole.
Recent Accounting Pronouncements
See Note 1—Basis of Presentation and Significant Accounting Policies in the Notes to Consolidated Financial Statements set forth in Part II, Item 8, “Financial Statements and Supplementary Data,” under the heading “Recent Accounting Pronouncements” included in this Form 10-K.
Item 7A.
Quantitative and Qualitative Disclosures About Market Risk
We are exposed to certain market risks that are inherent in our financial instruments and arise from changes in foreign currency exchange rates and interest rates. A discussion of our market risk exposure in financial instruments is presented below.
The primary objective of the following information is to provide forward-looking quantitative and qualitative information about our potential exposure to market risks. The disclosures are not meant to be precise indicators of expected future losses or gains, but rather indicators of reasonably possible losses or gains. This forward-looking information provides indicators of how we view and manage our ongoing market risk exposures.
Foreign Currency Exchange Rates
We operate in virtually every oil and natural gas exploration and production region in the world. In some parts of the world, the currency of our primary economic environment is the U.S. dollar, and we use the U.S. dollar as our functional currency. In other parts of the world, such as Europe, Norway, Africa and Brazil, we conduct our business in currencies other than the U.S. dollar, and the functional currency is the applicable local currency. Assets and liabilities of entities for which the functional currency is the local currency are translated into U.S. dollars using the exchange rates in effect at the balance sheet date, resulting in translation adjustments that are reflected in accumulated other comprehensive income (loss) in the shareholders’ equity section on our consolidated balance sheets. A portion of our net assets are impacted by changes in foreign currencies in relation to the U.S. dollar.
For the year ended
December 31, 2018
, on a U.S. dollar-equivalent basis, approximately
24%
of our revenue was represented by currencies other than the U.S. dollar. However, no single foreign currency poses a primary risk to us. A hypothetical 10% decrease in the exchange rates for each of the foreign currencies in which a portion of our revenues is denominated would result in a
2.2%
decrease in our overall revenues for the year ended
December 31, 2018
.
We enter into short-duration foreign currency forward contracts to mitigate our exposure to non-local currency operating working capital. We are also exposed to market risk on our forward contracts related to potential non-performance by our counterparty. It is our policy to enter into derivative contracts with counterparties that are creditworthy institutions.
We account for our derivative activities under the accounting guidance for derivatives and hedging. Derivatives are recognized on the consolidated balance sheet at fair value. Although the derivative contracts will serve as an economic hedge of the cash flow of our currency exchange risk exposure, they are not formally designated as hedge contracts for hedge accounting treatment. Accordingly, any changes in the fair value of the derivative instruments during a period will be included in our consolidated statements of operations.
50
As of
December 31, 2018
and
2017
, we had the following foreign currency derivative contracts outstanding in U.S. dollars (in thousands):
|
Foreign Currency
|
Notional Amount
|
Contractual Exchange Rate
|
Fair Value at December 31, 2018
|
||||||||
|
Canadian dollar
|
$
|
2,248
|
|
1.3343
|
|
$
|
48
|
|
|||
|
Euro
|
6,967
|
|
1.1421
|
|
(50
|
)
|
|||||
|
Norwegian krone
|
7,713
|
|
8.5566
|
|
66
|
|
|||||
|
Pound sterling
|
16,452
|
|
1.2655
|
|
(165
|
)
|
|||||
|
$
|
(101
|
)
|
|||||||||
|
Foreign Currency
|
Notional Amount
|
Contractual Exchange Rate
|
Fair Value at December 31, 2017
|
||||||||
|
Canadian dollar
|
$
|
6,226
|
|
1.2850
|
|
$
|
(165
|
)
|
|||
|
Euro
|
5,326
|
|
1.1836
|
|
(101
|
)
|
|||||
|
Norwegian krone
|
6,212
|
|
8.3704
|
|
(157
|
)
|
|||||
|
Pound sterling
|
6,039
|
|
1.3419
|
|
(64
|
)
|
|||||
|
$
|
(487
|
)
|
|||||||||
Based on the derivative contracts that were in place as of
December 31, 2018
, a simultaneous 10% weakening of the U.S. dollar as compared to the Canadian dollar, Euro, Norwegian krone, and Pound sterling would result in a
$3.5 million
decrease in the market value of our forward contracts.
Interest Rate Risk
As of
December 31, 2018
, we did not have an outstanding funded debt balance under the New ABL Credit Facility. If we borrow under the New ABL Credit Facility in the future, we will be exposed to changes in interest rates on our floating rate borrowings under the New ABL Credit Facility. Although we do not currently utilize interest rate derivative instruments to reduce interest rate exposure, we may do so in the future.
Customer Credit Risk
Financial instruments that potentially subject us to concentrations of credit risk are trade receivables. We extend credit to customers and other parties in the normal course of business. International sales also present various risks including governmental activities that may limit or disrupt markets and restrict the movement of funds. We operate in approximately
50
countries and, as a result, our accounts receivables are spread over many countries and customers.
We are also exposed to credit risk because our customers are concentrated in the oil and natural gas industry. This concentration of customers may impact overall exposure to credit risk, either positively or negatively, because our customers may be similarly affected by changes in economic and industry conditions, including sensitivity to commodity prices. While current energy prices are important contributors to positive cash flow for our customers, expectations about future prices and price volatility are generally more important for determining future spending levels. However, any prolonged increase or decrease in oil and natural gas prices affects the levels of exploration, development and production activity, as well as the entire health of the oil and natural gas industry and can therefore negatively impact spending by our customers.
51
Item 8.
Financial Statements and Supplementary Data
|
INDEX TO CONSOLIDATED FINANCIAL STATEMENTS
|
||
|
Page
|
||
52
Management’s Report on Internal Control
Over Financial Reporting
Management of the Company, including the Chief Executive Officer and the Chief Financial Officer, is responsible for establishing and maintaining adequate internal control over financial reporting, as defined in Rules 13a-15(f) and 15d-15(f) of the Securities Exchange Act of 1934, as amended. Internal control over financial reporting is a process designed by, or under the supervision of, our Chief Executive Officer and Chief Financial Officer, to provide reasonable assurance regarding the reliability of financial reporting and the preparation of financial statements for external purposes in accordance with generally accepted accounting principles. Our internal control over financial reporting includes those policies and procedures that (i) pertain to the maintenance of records that in reasonable detail accurately and fairly reflect the transactions and dispositions of our assets; (ii) provide reasonable assurance that transactions are recorded as necessary to permit the preparation of financial statements in accordance with generally accepted accounting principles, and that receipts and expenditures are being made only in accordance with authorizations of our management and directors; and (iii) provide reasonable assurance regarding prevention or timely detection of unauthorized acquisition, use or disposition of our assets that could have a material effect on the financial statements.
We conducted an evaluation of the effectiveness of our internal control over financial reporting as of
December 31, 2018
based on the
Internal Control—Integrated Framework
issued by the Committee of Sponsoring Organizations of the Treadway Commission in 2013. Based on our evaluation, management has concluded that our internal control over financial reporting was effective as of
December 31, 2018
.
The effectiveness of our internal control over financial reporting as of
December 31, 2018
has been audited by KPMG LLP, an independent registered public accounting firm, as stated in their report which is included herein.
53
Report of Independent Registered Public Accounting Firm
To the Stockholders and Board of Directors Frank’s International N.V.:
Opinion on the Consolidated Financial Statements
We have audited the accompanying consolidated balance sheet of Frank’s International N.V. (and subsidiaries) (the Company) as of December 31, 2018, the related consolidated statements of operations, comprehensive loss, stockholders’ equity, and cash flows for the year ended December 31, 2018, and the related notes to financial statements, (and financial statement Schedule II - Valuation and Qualifying Accounts) (collectively, the consolidated financial statements). In our opinion, the consolidated financial statements present fairly, in all material respects, the financial position of the Company as of December 31, 2018, and the results of its operations and its cash flows for the year ended December 31, 2018, in conformity with U.S. generally accepted accounting principles.
We also have audited, in accordance with the standards of the Public Company Accounting Oversight Board (United States) (PCAOB), the Company’s internal control over financial reporting as of December 31, 2018, based on criteria established in
Internal Control - Integrated Framework (2013)
issued by the Committee of Sponsoring Organizations of the Treadway Commission, and our report dated February 25, 2019 expressed an unqualified opinion on the effectiveness of the Company’s internal control over financial reporting.
Basis for Opinion
These consolidated financial statements are the responsibility of the Company’s management. Our responsibility is to express an opinion on these consolidated financial statements based on our audits. We are a public accounting firm registered with the PCAOB and are required to be independent with respect to the Company in accordance with the U.S. federal securities laws and the applicable rules and regulations of the Securities and Exchange Commission and the PCAOB.
We conducted our audits in accordance with the standards of the PCAOB. Those standards require that we plan and perform the audit to obtain reasonable assurance about whether the consolidated financial statements are free of material misstatement, whether due to error or fraud. Our audits included performing procedures to assess the risks of material misstatement of the consolidated financial statements, whether due to error or fraud, and performing procedures that respond to those risks. Such procedures included examining, on a test basis, evidence regarding the amounts and disclosures in the consolidated financial statements. Our audits also included evaluating the accounting principles used and significant estimates made by management, as well as evaluating the overall presentation of the consolidated financial statements. We believe that our audits provide a reasonable basis for our opinion.
/s/ KPMG LLP
We have served as the Company’s auditor since 2018.
Houston, Texas
February 25, 2019
54
Report of Independent Registered Public Accounting Firm
To the Stockholders and Board of Directors Frank’s International N.V.:
Opinion on Internal Control Over Financial Reporting
We have audited Frank’s International N.V. (and subsidiaries) (the Company) internal control over financial reporting as of December 31, 2018, based on criteria established in
Internal Control - Integrated Framework (2013)
issued by the Committee of Sponsoring Organizations of the Treadway Commission. In our opinion, the Company maintained, in all material respects, effective internal control over financial reporting as of December 31, 2018, based on the criteria established in
Internal Control - Integrated Framework (2013)
issued by the Committee of Sponsoring Organizations of the Treadway Commission.
We also have audited, in accordance with the standards of the Public Company Accounting Oversight Board (United States) (PCAOB), the consolidated balance sheet of the Company as of December 31, 2018, the related consolidated statements of operations, comprehensive loss, stockholders’ equity, and cash flows for the year ended December 31, 2018, and the related notes to financial statements, (and financial statement Schedule II - Valuation and Qualifying Accounts) (collectively, the consolidated financial statements), and our report dated February 25, 2019 expressed an unqualified opinion on those consolidated financial statements.
Basis for Opinion
The Company’s management is responsible for maintaining effective internal control over financial reporting and for its assessment of the effectiveness of internal control over financial reporting, included in the accompanying Management’s Report on Internal Control Over Financial Reporting. Our responsibility is to express an opinion on the Company’s internal control over financial reporting based on our audit. We are a public accounting firm registered with the PCAOB and are required to be independent with respect to the Company in accordance with the U.S. federal securities laws and the applicable rules and regulations of the Securities and Exchange Commission and the PCAOB.
We conducted our audit in accordance with the standards of the PCAOB. Those standards require that we plan and perform the audit to obtain reasonable assurance about whether effective internal control over financial reporting was maintained in all material respects. Our audit of internal control over financial reporting included obtaining an understanding of internal control over financial reporting, assessing the risk that a material weakness exists, and testing and evaluating the design and operating effectiveness of internal control based on the assessed risk. Our audit also included performing such other procedures as we considered necessary in the circumstances. We believe that our audit provides a reasonable basis for our opinion.
Definition and Limitations of Internal Control Over Financial Reporting
A company’s internal control over financial reporting is a process designed to provide reasonable assurance regarding the reliability of financial reporting and the preparation of financial statements for external purposes in accordance with generally accepted accounting principles. A company’s internal control over financial reporting includes those policies and procedures that (1) pertain to the maintenance of records that, in reasonable detail, accurately and fairly reflect the transactions and dispositions of the assets of the company; (2) provide reasonable assurance that transactions are recorded as necessary to permit preparation of financial statements in accordance with generally accepted accounting principles, and that receipts and expenditures of the company are being made only in accordance with authorizations of management and directors of the company; and (3) provide reasonable assurance regarding prevention or timely detection of unauthorized acquisition, use, or disposition of the company’s assets that could have a material effect on the financial statements.
Because of its inherent limitations, internal control over financial reporting may not prevent or detect misstatements. Also, projections of any evaluation of effectiveness to future periods are subject to the risk that controls may become inadequate because of changes in conditions, or that the degree of compliance with the policies or procedures may deteriorate.
/s/ KPMG LLP
Houston, Texas
February 25, 2019
55
Report of Independent Registered Public Accounting Firm
To the Board of Supervisory Directors and Stockholders of Frank’s International N.V.
Opinion on the Financial Statements
We have audited the consolidated balance sheet of Frank’s International N.V. and its subsidiaries (the “Company”) as of December 31, 2017, and the related consolidated statements of operations, comprehensive loss, stockholders’ equity, and cash flows for each of the two years in the period ended December 31, 2017, including the related notes and schedule of valuation and qualifying accounts for each of the two years in the period ended December 31, 2017 appearing under Item 15(a)(2) (collectively referred to as the “consolidated financial statements”). In our opinion, the consolidated financial statements present fairly, in all material respects, the financial position of the Company as of December 31, 2017, and the results of its operations and its cash flows for each of the two years in the period ended December 31, 2017 in conformity with accounting principles generally accepted in the United States of America.
Change in Accounting Principle
As discussed in Note 1 to the accompanying consolidated financial statements, the Company changed the manner in which it accounts for goodwill impairment in 2017.
Basis for Opinion
These consolidated financial statements are the responsibility of the Company's management. Our responsibility is to express an opinion on the Company’s consolidated financial statements based on our audits. We are a public accounting firm registered with the Public Company Accounting Oversight Board (United States) (PCAOB) and are required to be independent with respect to the Company in accordance with the U.S. federal securities laws and the applicable rules and regulations of the Securities and Exchange Commission and the PCAOB.
We conducted our audits of these consolidated financial statements in accordance with the standards of the PCAOB. Those standards require that we plan and perform the audit to obtain reasonable assurance about whether the consolidated financial statements are free of material misstatement, whether due to error or fraud.
Our audits included performing procedures to assess the risks of material misstatement of the consolidated financial statements, whether due to error or fraud, and performing procedures that respond to those risks. Such procedures included examining, on a test basis, evidence regarding the amounts and disclosures in the consolidated financial statements. Our audits also included evaluating the accounting principles used and significant estimates made by management, as well as evaluating the overall presentation of the consolidated financial statements. We believe that our audits provide a reasonable basis for our opinion.
/s/ PricewaterhouseCoopers LLP
Houston, Texas
February 27, 2018
We served as the Company's auditor from 2008
to 2018.
56
|
FRANK’S INTERNATIONAL N.V.
|
|||||||
|
CONSOLIDATED BALANCE SHEETS
|
|||||||
|
(In thousands, except share data)
|
|||||||
|
December 31,
|
|||||||
|
2018
|
2017
|
||||||
|
Assets
|
|||||||
|
Current assets:
|
|||||||
|
Cash and cash equivalents
|
$
|
186,212
|
|
$
|
213,015
|
|
|
|
Short-term investments
|
26,603
|
|
81,021
|
|
|||
|
Accounts receivables, net
|
189,414
|
|
127,210
|
|
|||
|
Inventories, net
|
69,382
|
|
76,420
|
|
|||
|
Assets held for sale
|
7,828
|
|
3,792
|
|
|||
|
Other current assets
|
12,651
|
|
10,437
|
|
|||
|
Total current assets
|
492,090
|
|
511,895
|
|
|||
|
Property, plant and equipment, net
|
416,490
|
|
469,646
|
|
|||
|
Goodwill
|
211,040
|
|
211,040
|
|
|||
|
Intangible assets, net
|
31,069
|
|
33,895
|
|
|||
|
Deferred tax assets, net
|
14,621
|
|
—
|
|
|||
|
Other assets
|
28,619
|
|
35,293
|
|
|||
|
Total assets
|
$
|
1,193,929
|
|
$
|
1,261,769
|
|
|
|
Liabilities and Equity
|
|||||||
|
Current liabilities:
|
|||||||
|
Short-term debt
|
$
|
5,627
|
|
$
|
4,721
|
|
|
|
Accounts payable and accrued liabilities
|
123,981
|
|
108,885
|
|
|||
|
Deferred revenue
|
116
|
|
4,703
|
|
|||
|
Total current liabilities
|
129,724
|
|
118,309
|
|
|||
|
Deferred tax liabilities
|
221
|
|
229
|
|
|||
|
Other non-current liabilities
|
29,212
|
|
27,330
|
|
|||
|
Total liabilities
|
159,157
|
|
145,868
|
|
|||
|
Commitments and contingencies (Note 18)
|
|
|
|
|
|||
|
Stockholders’ equity:
|
|||||||
|
Common stock, €0.01 par value, 798,096,000 shares authorized, 225,478,506 and 224,228,071 shares issued and 224,289,902 and 223,289,389 shares outstanding
|
2,829
|
|
2,814
|
|
|||
|
Additional paid-in capital
|
1,062,794
|
|
1,050,873
|
|
|||
|
Retained earnings
|
16,860
|
|
106,923
|
|
|||
|
Accumulated other comprehensive loss
|
(32,338
|
)
|
(30,972
|
)
|
|||
|
Treasury stock (at cost), 1,188,604 and 938,682 shares
|
(15,373
|
)
|
(13,737
|
)
|
|||
|
Total stockholders’ equity
|
1,034,772
|
|
1,115,901
|
|
|||
|
Total liabilities and equity
|
$
|
1,193,929
|
|
$
|
1,261,769
|
|
|
The accompanying notes are an integral part of these consolidated financial statements.
57
|
FRANK’S INTERNATIONAL N.V.
|
|||||||||||
|
CONSOLIDATED STATEMENTS OF OPERATIONS
|
|||||||||||
|
(In thousands, except per share data)
|
|||||||||||
|
Year Ended December 31,
|
|||||||||||
|
2018
|
2017
|
2016
|
|||||||||
|
Revenues:
|
|||||||||||
|
Services
|
$
|
416,781
|
|
$
|
364,061
|
|
$
|
397,369
|
|
||
|
Products
|
105,712
|
|
90,734
|
|
90,162
|
|
|||||
|
Total revenue
|
522,493
|
|
454,795
|
|
487,531
|
|
|||||
|
Operating expenses:
|
|||||||||||
|
Cost of revenues, exclusive of depreciation and amortization
|
|||||||||||
|
Services
|
265,688
|
|
223,222
|
|
246,652
|
|
|||||
|
Products
|
84,429
|
|
87,200
|
|
70,616
|
|
|||||
|
General and administrative expenses
|
155,584
|
|
163,704
|
|
171,887
|
|
|||||
|
Depreciation and amortization
|
111,292
|
|
122,102
|
|
114,215
|
|
|||||
|
Severance and other charges (credits), net
|
(310
|
)
|
75,354
|
|
46,406
|
|
|||||
|
(Gain) loss on disposal of assets
|
(1,309
|
)
|
(2,045
|
)
|
1,117
|
|
|||||
|
Operating loss
|
(92,881
|
)
|
(214,742
|
)
|
(163,362
|
)
|
|||||
|
Other income (expense):
|
|||||||||||
|
Tax receivable agreement (“TRA”) related adjustments
|
(1,359
|
)
|
122,515
|
|
—
|
|
|||||
|
Other income, net
|
2,047
|
|
1,763
|
|
4,170
|
|
|||||
|
Interest income, net
|
4,243
|
|
2,309
|
|
2,073
|
|
|||||
|
Mergers and acquisition expense
|
(58
|
)
|
(459
|
)
|
(13,784
|
)
|
|||||
|
Foreign currency gain (loss)
|
(5,675
|
)
|
2,075
|
|
(10,819
|
)
|
|||||
|
Total other income (expense)
|
(802
|
)
|
128,203
|
|
(18,360
|
)
|
|||||
|
Loss before income taxes
|
(93,683
|
)
|
(86,539
|
)
|
(181,722
|
)
|
|||||
|
Income tax expense (benefit)
|
(2,950
|
)
|
72,918
|
|
(25,643
|
)
|
|||||
|
Net loss
|
(90,733
|
)
|
(159,457
|
)
|
(156,079
|
)
|
|||||
|
Net loss attributable to noncontrolling interest
|
—
|
|
—
|
|
(20,741
|
)
|
|||||
|
Net loss attributable to Frank’s International N.V.
|
$
|
(90,733
|
)
|
$
|
(159,457
|
)
|
$
|
(135,338
|
)
|
||
|
Preferred stock dividends
|
—
|
|
—
|
|
(1
|
)
|
|||||
|
Net loss attributable to Frank’s International N.V.
common shareholders
|
$
|
(90,733
|
)
|
$
|
(159,457
|
)
|
$
|
(135,339
|
)
|
||
|
Dividends per common share:
|
$
|
—
|
|
$
|
0.225
|
|
$
|
0.45
|
|
||
|
Loss per common share:
|
|||||||||||
|
Basic and diluted
|
$
|
(0.41
|
)
|
$
|
(0.72
|
)
|
$
|
(0.77
|
)
|
||
|
Weighted average common shares outstanding:
|
|||||||||||
|
Basic and diluted
|
223,999
|
|
222,940
|
|
176,584
|
|
|||||
The accompanying notes are an integral part of these consolidated financial statements.
58
|
FRANK’S INTERNATIONAL N.V.
|
|||||||||||
|
CONSOLIDATED STATEMENTS OF COMPREHENSIVE LOSS
|
|||||||||||
|
(In thousands)
|
|||||||||||
|
Year Ended December 31,
|
|||||||||||
|
2018
|
2017
|
2016
|
|||||||||
|
Net loss
|
$
|
(90,733
|
)
|
$
|
(159,457
|
)
|
$
|
(156,079
|
)
|
||
|
Other comprehensive income (loss):
|
|||||||||||
|
Foreign currency translation adjustments
|
(1,452
|
)
|
2,345
|
|
546
|
|
|||||
|
Marketable securities:
|
|||||||||||
|
Unrealized gain (loss) on marketable securities
|
86
|
|
(103
|
)
|
1,214
|
|
|||||
|
Reclassification to net income
|
—
|
|
(395
|
)
|
—
|
|
|||||
|
Deferred tax asset / liability change
|
—
|
|
158
|
|
(418
|
)
|
|||||
|
Unrealized gain (loss) on marketable securities, net of tax
|
86
|
|
(340
|
)
|
796
|
|
|||||
|
Total other comprehensive income (loss)
|
(1,366
|
)
|
2,005
|
|
1,342
|
|
|||||
|
Comprehensive loss
|
(92,099
|
)
|
(157,452
|
)
|
(154,737
|
)
|
|||||
|
Less: Comprehensive loss attributable to
noncontrolling interest
|
—
|
|
—
|
|
(20,180
|
)
|
|||||
|
Add: Transfer of Mosing Holdings interest to FINV attributable to comprehensive loss (See Note 12)
|
—
|
|
—
|
|
(8,203
|
)
|
|||||
|
Comprehensive loss attributable to Frank’s International N.V.
|
$
|
(92,099
|
)
|
$
|
(157,452
|
)
|
$
|
(142,760
|
)
|
||
The accompanying notes are an integral part of these consolidated financial statements.
59
|
FRANK’S INTERNATIONAL N.V.
|
||||||||||||||||||||||||||||||
|
CONSOLIDATED STATEMENTS OF STOCKHOLDERS’ EQUITY
|
||||||||||||||||||||||||||||||
|
(In thousands)
|
||||||||||||||||||||||||||||||
|
Accumulated
|
||||||||||||||||||||||||||||||
|
Additional
|
Other
|
Non-
|
Total
|
|||||||||||||||||||||||||||
|
Common Stock
|
Paid-In
|
Retained
|
Comprehensive
|
Treasury
|
controlling
|
Stockholders’
|
||||||||||||||||||||||||
|
Shares
|
Value
|
Capital
|
Earnings
|
Income (Loss)
|
Stock
|
Interest
|
Equity
|
|||||||||||||||||||||||
|
Balances at December 31, 2015
|
155,146
|
|
$
|
2,045
|
|
$
|
712,486
|
|
$
|
531,621
|
|
$
|
(25,555
|
)
|
$
|
(9,298
|
)
|
$
|
240,127
|
|
$
|
1,451,426
|
|
|||||||
|
Net loss
|
—
|
|
—
|
|
—
|
|
(135,338
|
)
|
—
|
|
—
|
|
(20,741
|
)
|
(156,079
|
)
|
||||||||||||||
|
Foreign currency translation adjustments
|
—
|
|
—
|
|
—
|
|
—
|
|
165
|
|
—
|
|
381
|
|
546
|
|
||||||||||||||
|
Unrealized gain on marketable securities
|
—
|
|
—
|
|
—
|
|
—
|
|
616
|
|
—
|
|
180
|
|
796
|
|
||||||||||||||
|
Equity-based compensation expense
|
—
|
|
—
|
|
15,978
|
|
—
|
|
—
|
|
—
|
|
—
|
|
15,978
|
|
||||||||||||||
|
Distributions to noncontrolling interest
|
—
|
|
—
|
|
—
|
|
—
|
|
—
|
|
—
|
|
(8,027
|
)
|
(8,027
|
)
|
||||||||||||||
|
Common stock dividends ($0.45 per share)
|
—
|
|
—
|
|
—
|
|
(79,012
|
)
|
—
|
|
—
|
|
—
|
|
(79,012
|
)
|
||||||||||||||
|
Preferred stock dividends
|
—
|
|
—
|
|
—
|
|
(1
|
)
|
—
|
|
—
|
|
—
|
|
(1
|
)
|
||||||||||||||
|
Transfer of Mosing Holdings interest to FINV
|
—
|
|
—
|
|
239,871
|
|
—
|
|
(8,203
|
)
|
—
|
|
(211,920
|
)
|
19,748
|
|
||||||||||||||
|
Common shares issued on conversion of Series A preferred stock
|
52,976
|
|
597
|
|
—
|
|
—
|
|
—
|
|
—
|
|
—
|
|
597
|
|
||||||||||||||
|
Common shares issued upon vesting of share-based awards
|
1,644
|
|
19
|
|
(19
|
)
|
—
|
|
—
|
|
—
|
|
—
|
|
—
|
|
||||||||||||||
|
TRA and associated deferred taxes
|
—
|
|
—
|
|
(76,409
|
)
|
—
|
|
—
|
|
—
|
|
—
|
|
(76,409
|
)
|
||||||||||||||
|
Common shares issued for employee stock purchase plan (“ESPP”)
|
76
|
|
1
|
|
972
|
|
—
|
|
—
|
|
—
|
|
—
|
|
973
|
|
||||||||||||||
|
Blackhawk acquisition
|
12,804
|
|
140
|
|
143,907
|
|
—
|
|
—
|
|
—
|
|
—
|
|
144,047
|
|
||||||||||||||
|
Treasury shares withheld
|
(245
|
)
|
—
|
|
—
|
|
—
|
|
—
|
|
(3,264
|
)
|
—
|
|
(3,264
|
)
|
||||||||||||||
|
Balances at December 31, 2016
|
222,401
|
|
$
|
2,802
|
|
$
|
1,036,786
|
|
$
|
317,270
|
|
$
|
(32,977
|
)
|
$
|
(12,562
|
)
|
$
|
—
|
|
$
|
1,311,319
|
|
|||||||
|
Net loss
|
—
|
|
—
|
|
—
|
|
(159,457
|
)
|
—
|
|
—
|
|
—
|
|
(159,457
|
)
|
||||||||||||||
|
Foreign currency translation adjustments
|
—
|
|
—
|
|
—
|
|
—
|
|
2,345
|
|
—
|
|
—
|
|
2,345
|
|
||||||||||||||
|
Unrealized loss on marketable securities
|
—
|
|
—
|
|
—
|
|
—
|
|
(340
|
)
|
—
|
|
—
|
|
(340
|
)
|
||||||||||||||
|
Equity-based compensation expense
|
—
|
|
—
|
|
13,825
|
|
—
|
|
—
|
|
—
|
|
—
|
|
13,825
|
|
||||||||||||||
|
Common stock dividends ($0.225 per share)
|
—
|
|
—
|
|
—
|
|
(50,154
|
)
|
—
|
|
—
|
|
—
|
|
(50,154
|
)
|
||||||||||||||
|
Common shares issued upon vesting of share-based awards
|
1,017
|
|
11
|
|
(11
|
)
|
—
|
|
—
|
|
—
|
|
—
|
|
—
|
|
||||||||||||||
|
Common shares issued for ESPP
|
50
|
|
1
|
|
523
|
|
—
|
|
—
|
|
—
|
|
—
|
|
524
|
|
||||||||||||||
|
Treasury shares issued upon vesting of share-based awards
|
4
|
|
—
|
|
(84
|
)
|
—
|
|
—
|
|
66
|
|
—
|
|
(18
|
)
|
||||||||||||||
|
Treasury shares issued for ESPP
|
105
|
|
—
|
|
(166
|
)
|
(736
|
)
|
—
|
|
1,642
|
|
—
|
|
740
|
|
||||||||||||||
|
Treasury shares withheld
|
(288
|
)
|
—
|
|
—
|
|
—
|
|
—
|
|
(2,883
|
)
|
—
|
|
(2,883
|
)
|
||||||||||||||
|
Balances at December 31, 2017
|
223,289
|
|
$
|
2,814
|
|
$
|
1,050,873
|
|
$
|
106,923
|
|
$
|
(30,972
|
)
|
$
|
(13,737
|
)
|
$
|
—
|
|
$
|
1,115,901
|
|
|||||||
|
Cumulative effect of accounting change
|
—
|
|
—
|
|
—
|
|
670
|
|
—
|
|
—
|
|
—
|
|
670
|
|
||||||||||||||
|
Net loss
|
—
|
|
—
|
|
—
|
|
(90,733
|
)
|
—
|
|
—
|
|
—
|
|
(90,733
|
)
|
||||||||||||||
|
Foreign currency translation adjustments
|
—
|
|
—
|
|
—
|
|
—
|
|
(1,452
|
)
|
—
|
|
—
|
|
(1,452
|
)
|
||||||||||||||
|
Unrealized gain on marketable securities
|
—
|
|
—
|
|
—
|
|
—
|
|
86
|
|
—
|
|
—
|
|
86
|
|
||||||||||||||
|
Equity-based compensation expense
|
—
|
|
—
|
|
10,621
|
|
—
|
|
—
|
|
—
|
|
—
|
|
10,621
|
|
||||||||||||||
|
Common shares issued upon vesting of share-based awards
|
1,018
|
|
12
|
|
(12
|
)
|
—
|
|
—
|
|
—
|
|
—
|
|
—
|
|
||||||||||||||
|
Common shares issued for ESPP
|
233
|
|
3
|
|
1,312
|
|
—
|
|
—
|
|
—
|
|
—
|
|
1,315
|
|
||||||||||||||
|
Treasury shares withheld
|
(250
|
)
|
—
|
|
—
|
|
—
|
|
—
|
|
(1,636
|
)
|
—
|
|
(1,636
|
)
|
||||||||||||||
|
Balances at December 31, 2018
|
224,290
|
|
$
|
2,829
|
|
$
|
1,062,794
|
|
$
|
16,860
|
|
$
|
(32,338
|
)
|
$
|
(15,373
|
)
|
$
|
—
|
|
$
|
1,034,772
|
|
|||||||
The accompanying notes are an integral part of these consolidated financial statements.
60
|
FRANK’S INTERNATIONAL N.V.
|
|||||||||||
|
CONSOLIDATED STATEMENTS OF CASH FLOWS
|
|||||||||||
|
(In thousands)
|
|||||||||||
|
Year Ended December 31,
|
|||||||||||
|
2018
|
2017
|
2016
|
|||||||||
|
Cash flows from operating activities
|
|||||||||||
|
Net loss
|
$
|
(90,733
|
)
|
$
|
(159,457
|
)
|
$
|
(156,079
|
)
|
||
|
Adjustments to reconcile net loss to cash provided by (used in) operating activities
|
|||||||||||
|
Derecognition of the TRA liability
|
—
|
|
(122,515
|
)
|
—
|
|
|||||
|
Depreciation and amortization
|
111,292
|
|
122,102
|
|
114,215
|
|
|||||
|
Equity-based compensation expense
|
10,621
|
|
13,825
|
|
15,978
|
|
|||||
|
Loss on asset write-off and retirements
|
—
|
|
71,942
|
|
29,881
|
|
|||||
|
Amortization of deferred financing costs
|
58
|
|
267
|
|
164
|
|
|||||
|
Deferred tax provision (benefit)
|
(14,634
|
)
|
15,543
|
|
(27,536
|
)
|
|||||
|
Reversal of deferred tax assets associated with the TRA
|
—
|
|
46,874
|
|
—
|
|
|||||
|
Provision for bad debts
|
159
|
|
950
|
|
11,581
|
|
|||||
|
(Gain) loss on disposal of assets
|
(1,309
|
)
|
(2,045
|
)
|
1,117
|
|
|||||
|
Changes in fair value of investments
|
1,199
|
|
(2,627
|
)
|
(1,123
|
)
|
|||||
|
Unrealized (gain) loss on derivative
|
(386
|
)
|
634
|
|
64
|
|
|||||
|
Realized loss on sale of investment
|
—
|
|
478
|
|
—
|
|
|||||
|
Other
|
843
|
|
(1,876
|
)
|
—
|
|
|||||
|
Changes in operating assets and liabilities, net of effects from acquisitions
|
|||||||||||
|
Accounts receivable
|
(63,654
|
)
|
21,271
|
|
70,388
|
|
|||||
|
Inventories
|
(2,917
|
)
|
12,102
|
|
27,379
|
|
|||||
|
Other current assets
|
4,581
|
|
8,677
|
|
4,039
|
|
|||||
|
Other assets
|
258
|
|
674
|
|
(692
|
)
|
|||||
|
Accounts payable and accrued liabilities
|
15,310
|
|
15,774
|
|
(47,068
|
)
|
|||||
|
Deferred revenue
|
(354
|
)
|
(13,373
|
)
|
(39,659
|
)
|
|||||
|
Other noncurrent liabilities
|
(2,978
|
)
|
(4,446
|
)
|
(13,480
|
)
|
|||||
|
Net cash provided by (used in) operating activities
|
(32,644
|
)
|
24,774
|
|
(10,831
|
)
|
|||||
|
Cash flows from investing activities
|
|||||||||||
|
Acquisition of Blackhawk (net of acquired cash)
|
—
|
|
—
|
|
(150,437
|
)
|
|||||
|
Purchase of property, plant and equipment and intangibles
|
(19,734
|
)
|
(21,990
|
)
|
(42,127
|
)
|
|||||
|
Purchase of property, plant and equipment from related parties
|
(36,737
|
)
|
—
|
|
—
|
|
|||||
|
Proceeds from sale of assets and equipment
|
7,089
|
|
14,030
|
|
3,858
|
|
|||||
|
Purchase of investments
|
(84,040
|
)
|
(123,048
|
)
|
(1,003
|
)
|
|||||
|
Proceeds from sale of investments
|
143,825
|
|
53,299
|
|
11,101
|
|
|||||
|
Other
|
—
|
|
—
|
|
(307
|
)
|
|||||
|
Net cash provided by (used in) investing activities
|
10,403
|
|
(77,709
|
)
|
(178,915
|
)
|
|||||
|
Cash flows from financing activities
|
|||||||||||
|
Repayments of borrowings
|
(5,892
|
)
|
(680
|
)
|
(7,201
|
)
|
|||||
|
Proceeds from borrowings
|
—
|
|
—
|
|
363
|
|
|||||
|
Dividends paid on common stock
|
—
|
|
(50,154
|
)
|
(79,013
|
)
|
|||||
|
Dividends paid on preferred stock
|
—
|
|
—
|
|
(1
|
)
|
|||||
|
Deferred financing costs
|
(1,733
|
)
|
—
|
|
—
|
|
|||||
|
Cost of Series A convertible preferred stock conversion to common stock
|
—
|
|
—
|
|
(595
|
)
|
|||||
|
Distribution to noncontrolling interest
|
—
|
|
—
|
|
(8,027
|
)
|
|||||
|
Treasury shares withheld
|
(1,636
|
)
|
(2,901
|
)
|
(3,264
|
)
|
|||||
|
Proceeds from the issuance of ESPP shares
|
1,315
|
|
1,264
|
|
973
|
|
|||||
|
Net cash used in financing activities
|
(7,946
|
)
|
(52,471
|
)
|
(96,765
|
)
|
|||||
|
Effect of exchange rate changes on cash
|
3,384
|
|
(1,105
|
)
|
3,678
|
|
|||||
|
Net decrease in cash
|
(26,803
|
)
|
(106,511
|
)
|
(282,833
|
)
|
|||||
|
Cash and cash equivalents at beginning of period
|
213,015
|
|
319,526
|
|
602,359
|
|
|||||
|
Cash and cash equivalents at end of period
|
$
|
186,212
|
|
$
|
213,015
|
|
$
|
319,526
|
|
||
The accompanying notes are an integral part of these consolidated financial statements.
61
FRANK’S INTERNATIONAL N.V.
NOTES TO CONSOLIDATED FINANCIAL STATEMENTS
Note 1—Basis of Presentation and Significant Accounting Policies
Nature of Business
Frank’s International N.V. (“FINV”), a limited liability company organized under the laws of the Netherlands, is a global provider of highly engineered tubular services, tubular fabrication and specialty well construction and well intervention solutions to the oil and gas industry. FINV provides services to leading exploration and production companies in both offshore and onshore environments with a focus on complex and technically demanding wells.
Basis of Presentation
The consolidated financial statements of FINV for the years ended December 31,
2018
,
2017
and
2016
include the activities of Frank’s International C.V. (“FICV”), Blackhawk Group Holdings, LLC (“Blackhawk”) and their wholly owned subsidiaries (collectively, “Company,” “we,” “us” and “our”). All intercompany accounts and transactions have been eliminated for purposes of preparing these consolidated financial statements.
Our accompanying consolidated financial statements and related financial information have been prepared in accordance with generally accepted accounting principles in the United States of America (“GAAP”). In the opinion of management, these consolidated financial statements reflect all adjustments consisting solely of normal accruals that are necessary for the fair presentation of financial results as of and for the periods presented.
The consolidated financial statements have been prepared on a historical cost basis using the United States dollar as the reporting currency. Our functional currency is primarily the United States dollar.
Reclassifications
Certain prior-year amounts have been reclassified to conform to the current year’s presentation. These reclassifications had no impact on our net income (loss), working capital, cash flows or total equity previously reported.
During 2018, the Company’s chief operating decision maker (“CODM”) changed the methodology used to allocate bonus and medical claims expenses among segments. Previously, all U.S. bonus and medical claims expenses were absorbed by our U.S. Services segment. Beginning in the first quarter of 2018 for bonus expenses and the second quarter of 2018 for medical claims expenses, a portion of these expenses attributable to Blackhawk employees were allocated to the Blackhawk segment. The change in the allocation of all U.S. bonus and medical claims expenses had no impact on our consolidated operating income (loss), net income (loss), adjusted EBITDA, working capital, cash flows or total equity previously reported. However, segment operating income (loss) and segment adjusted EBITDA for the Blackhawk and U.S. Services segments were impacted. The Blackhawk segment for the year ended December 31, 2018 was charged
$4.5 million
for bonus and medical claims expenses which would have previously been charged to the U.S. Services segment.
Significant Accounting Policies
Accounting Estimates
The preparation of consolidated financial statements in conformity with accounting principles generally accepted in the United States requires management to make estimates and assumptions that affect the reported amounts of assets and liabilities, and the disclosure of contingent assets and liabilities at the date of the consolidated financial statements, and the reported amounts of revenues and expenses during the reporting period. Actual results could differ from these estimates.
Accounts Receivable
We establish an allowance for doubtful accounts based on various factors including historical experience, the current aging status of our customer accounts, the financial condition of our customers and the business and political environment in which our customers operate. Provisions for doubtful accounts are recorded when it becomes probable that customer accounts are uncollectible.
62
FRANK’S INTERNATIONAL N.V.
NOTES TO CONSOLIDATED FINANCIAL STATEMENTS
Cash and Cash Equivalents
We consider all highly liquid financial instruments purchased with an original maturity of three months or less to be cash equivalents. Throughout the year, we have cash balances in excess of federally insured limits deposited with various financial institutions. We have not experienced any losses in such accounts and believe we are not exposed to any significant credit risk on cash and cash equivalents.
Cash Surrender Value of Life Insurance Policies
We have cash surrender value of life insurance policies that are held within a Rabbi Trust for the purpose of paying future executive deferred compensation benefit obligations. Income (loss) associated with these policies is included in other income, net on our consolidated statements of operations. Income (loss) on changes in the cash surrender value of life insurance policies was
$(1.2) million
,
$2.4 million
and
$1.1 million
for the years ended December 31,
2018
,
2017
and
2016
, respectively.
Comprehensive Income
Accounting standards on reporting comprehensive income require that certain items, including foreign currency translation adjustments and unrealized gains and losses on marketable securities be presented as components of comprehensive income. The cumulative amounts recognized by us under these standards are reflected in the consolidated balance sheet as accumulated other comprehensive loss, a component of stockholders’ equity.
Contingencies
Certain conditions may exist as of the date our consolidated financial statements are issued that may result in a loss to us, but which will only be resolved when one or more future events occur or fail to occur. Our management, with input from legal counsel, assesses such contingent liabilities, and such assessment inherently involves an exercise in judgment. In assessing loss contingencies related to legal proceedings pending against us or unasserted claims that may result in proceedings, our management, with input from legal counsel, evaluates the perceived merits of any legal proceedings or unasserted claims as well as the perceived merits of the amount of relief sought or expected to be sought therein.
If the assessment of a contingency indicates it is probable a material loss has been incurred and the amount of liability can be estimated, then the estimated liability would be accrued in our consolidated financial statements. If the assessment indicates a potentially material loss contingency is not probable but is reasonably possible, or is probable but cannot be estimated, then the nature of the contingent liability, together with an estimate of the range of possible loss if determinable and material, is disclosed.
Loss contingencies considered remote are generally not disclosed unless they involve guarantees, in which case the guarantees would be disclosed.
Derivative Financial Instruments
When we deem appropriate, we use foreign currency forward derivative contracts to mitigate the risk of fluctuations in foreign currency exchange rates. We use these instruments to mitigate our exposure to non-local currency working capital. We do not hold or issue financial instruments for trading or other speculative purposes. We account for our derivative activities under the provisions of accounting guidance for derivatives and hedging. Derivatives are recognized on the consolidated balance sheet at fair value. Although the derivative contracts will serve as an economic hedge of the cash flow of our currency exchange risk exposure, they are not formally designated as hedge contracts for hedge accounting treatment. Accordingly, any changes in the fair value of the derivative instruments during a period will be included in our consolidated statements of operations.
63
FRANK’S INTERNATIONAL N.V.
NOTES TO CONSOLIDATED FINANCIAL STATEMENTS
Income (Loss) Per Share
Basic income (loss) per share excludes dilution and is computed by dividing net income (loss) available to common shareholders by the weighted average number of common shares outstanding for the period. Diluted income (loss) per share reflects the potential dilution that could occur if securities to issue common stock were exercised or converted to common stock.
Fair Value of Financial Instruments
Our financial instruments consist primarily of cash and cash equivalents, short-term investments, trade accounts receivable, available-for-sale securities, derivative financial instruments, obligations under trade accounts payable and short -term debt. Due to their short-term nature, the carrying values for cash and cash equivalents, short-term investments, trade accounts receivable, trade accounts payable and short-term debt approximate fair value. Refer to Note 10—Fair Value Measurements for the fair values of our available-for-sale securities, derivative financial instruments, and other obligations.
Foreign Currency Translations and Transactions
Results of operations for foreign subsidiaries with functional currencies other than the U.S. dollar are translated using average exchange rates during the period. Assets and liabilities of these foreign subsidiaries are translated using the exchange rates in effect at the balance sheet dates. Gains and losses resulting from these translations are included in accumulated other comprehensive loss within stockholders’ equity.
For those foreign subsidiaries that have designated the U.S. dollar as the functional currency, gains and losses resulting from balance sheet remeasurement of foreign operations are included in the consolidated statements of operations as incurred. Gains and losses resulting from transactions denominated in a foreign currency are also included in the consolidated statements of operations as incurred.
Goodwill
Goodwill is not subject to amortization and is tested for impairment annually or more frequently if events or changes in circumstances indicate that the asset might be impaired. A qualitative assessment is allowed to determine if goodwill is potentially impaired. The qualitative assessment determines whether it is more likely than not that a reporting unit’s fair value is less than its carrying amount. If it is more likely than not that the fair value of the reporting unit is less than the carrying amount, then a quantitative impairment test is performed. The quantitative goodwill impairment test is used to identify both the existence of impairment and the amount of impairment loss. The test compares the fair value of a reporting unit with its carrying amount, including goodwill. The amount of impairment for goodwill is measured as the excess of its carrying value over its fair value.
During the fourth quarter of 2017, we elected to change the timing of our annual goodwill impairment testing from December 31 to October 31 for our U.S Services, International Services, Tubular Sales and Manufacturing reporting units. This accounting change is considered to be preferable because it allows for additional time to complete the annual goodwill impairment test, better aligns with our planning process, and synchronizes the testing date for all of our reporting units as October 31, which is the Blackhawk reporting unit's annual impairment testing date. This change did not result in adjustments to previously issued financial statements.
No
goodwill impairment was recorded for years ended December 31,
2018
,
2017
and
2016
. Our goodwill is allocated to our operating segments as follows: U.S. Services - approximately
$16.2 million
; Tubular Sales - approximately
$2.4 million
; Blackhawk - approximately
$192.4 million
. The inputs used in the determination of fair value are generally level 3 inputs. See Note 10—Fair Value Measurements in these Notes to Consolidated Financial Statements for a discussion of fair value measures.
64
FRANK’S INTERNATIONAL N.V.
NOTES TO CONSOLIDATED FINANCIAL STATEMENTS
Impairment of Long-Lived Assets
Long-lived assets, which include property, plant and equipment, and certain other assets to be held and used by us, are reviewed when events or changes in circumstances indicate that the carrying amount of the assets may not be recoverable based on estimated future cash flows. If this assessment indicates that the carrying values will not be recoverable, as determined based on undiscounted cash flows over the remaining useful lives, an impairment loss is recognized based on the fair value of the asset.
Income Taxes
We operate under many legal forms in approximately
50
countries. As a result, we are subject to many U.S. and foreign tax jurisdictions and many tax agreements and treaties among the various taxing authorities. Our operations in these different jurisdictions are taxed on various bases such as income before taxes, deemed profits (which is generally determined using a percentage of revenues rather than profits), and withholding taxes based on revenues. Determination of taxable income in any jurisdiction requires the interpretation of the related tax laws and regulations and the use of estimates and assumptions regarding significant future events. Changes in tax laws, regulations, agreements and treaties, foreign currency exchange restrictions, or our level of operations or profitability in each taxing jurisdiction could have an impact upon the amount of income taxes that we provide during any given year.
We provide for income tax expense based on the liability method of accounting for income taxes based on the authoritative accounting guidance. Deferred tax assets and liabilities are recorded based upon temporary differences between the tax basis of assets and liabilities and their carrying values for financial reporting purposes, and are measured using the tax rates and laws expected to be in effect when the differences are projected to reverse. Valuation allowances are established to reduce deferred tax assets when it is more likely than not that some portion or all of the deferred tax assets will not be realized. In determining the need for valuation allowances, we have made judgments and estimates regarding future taxable income. These estimates and judgments include some degree of uncertainty, and changes in these estimates and assumptions could require us to adjust the valuation allowances for our deferred tax assets. The ultimate realization of the deferred tax assets depends on the generation of sufficient taxable income in the applicable taxing jurisdictions. Deferred tax expense or benefit is the result of changes in deferred tax assets and liabilities and associated valuation allowances during the period. The impact of an uncertain tax position taken or expected to be taken on an income tax return is recognized in the financial statements at the largest amount that is more likely than not to be sustained upon examination by the relevant taxing authority.
Intangible Assets
Identifiable intangible assets are amortized using the straight-line method over the estimated useful lives of the assets. We evaluate impairment of our intangible assets on an asset group basis whenever circumstances indicate that the carrying value may not be recoverable. Intangible assets deemed to be impaired are written down to their fair value discounted cash flows and, if available, comparable market values.
The following table provides information related to our intangible assets as of
December 31, 2018
and
2017
(in thousands):
|
December 31, 2018
|
December 31, 2017
|
||||||||||||||||||||||
|
Gross Carrying Amount
|
Accumulated Amortization
|
Total
|
Gross Carrying Amount
|
Accumulated Amortization
|
Total
|
||||||||||||||||||
|
Customer relationships
|
$
|
39,050
|
|
$
|
(23,688
|
)
|
$
|
15,362
|
|
$
|
39,050
|
|
$
|
(17,577
|
)
|
$
|
21,473
|
|
|||||
|
Trade name
|
11,407
|
|
(9,203
|
)
|
2,204
|
|
11,407
|
|
(6,494
|
)
|
4,913
|
|
|||||||||||
|
Intellectual property
|
17,889
|
|
(4,386
|
)
|
13,503
|
|
9,892
|
|
(2,463
|
)
|
7,429
|
|
|||||||||||
|
Non-compete agreement
|
1,160
|
|
(1,160
|
)
|
—
|
|
1,160
|
|
(1,080
|
)
|
80
|
|
|||||||||||
|
Total intangible assets
|
$
|
69,506
|
|
$
|
(38,437
|
)
|
$
|
31,069
|
|
$
|
61,509
|
|
$
|
(27,614
|
)
|
$
|
33,895
|
|
|||||
65
FRANK’S INTERNATIONAL N.V.
NOTES TO CONSOLIDATED FINANCIAL STATEMENTS
Amortization expense for intangibles assets was
$10.8 million
,
$11.4 million
and
$3.5 million
for the years ended December 31,
2018
,
2017
and
2016
, respectively.
As of
December 31, 2018
, estimated amortization expense for the intangible assets for each of the next five years was as follows (in thousands):
|
Period
|
Amount
|
||
|
2019
|
$
|
11,020
|
|
|
2020
|
7,737
|
|
|
|
2021
|
6,320
|
|
|
|
2022
|
935
|
|
|
|
2023
|
923
|
|
|
|
Thereafter
|
4,134
|
|
|
|
Total
|
$
|
31,069
|
|
Inventories
Inventories are stated at the lower of cost (primarily average cost) or net realizable value. Work in progress and finished goods include the cost of materials, labor, and manufacturing overhead. Inventory placed in service is either capitalized and included in equipment or expensed based upon our capitalization policies.
Property, Plant and Equipment
Property, plant and equipment are stated at cost less accumulated depreciation. Expenditures for significant improvements and betterments are capitalized when they enhance or extend the useful life of the asset. Expenditures for routine repairs and maintenance, which do not improve or extend the life of the related assets, are expensed when incurred. When properties or equipment are sold, retired or otherwise disposed of, the related cost and accumulated depreciation are removed from the books and the resulting gain or loss is recognized on the consolidated statements of operations.
Depreciation on fixed assets is computed using the straight-line method over the estimated useful lives of the individual assets. Leasehold improvements are amortized on a straight-line basis over the shorter of their estimated useful lives or the lease term. Depreciation expense was
$100.5 million
,
$110.7 million
and
$110.7 million
for the years ended December 31,
2018
,
2017
and
2016
, respectively.
Revenue Recognition
Revenues are recognized when control of the promised goods or services is transferred to our customers, in an amount that reflects the consideration we expect to be entitled to in exchange for those goods or services. Payment terms on services and products generally range from
30
days to
120
days. Given the short-term nature of our service and product offerings, our contracts do not have a significant financing component and the consideration we receive is generally fixed.
Service revenues are recognized over time as services are performed or rendered. Rates for services are typically priced on a per day, per man-hour or similar basis. We generally perform services either under direct service purchase orders or master service agreements which are supplemented by individual call-out provisions. For customers contracted under such arrangements, an accrual is recorded in unbilled revenue for revenue earned but not yet invoiced.
Revenues on product sales are generally recognized at a point in time when the product has shipped and significant risks of ownership have passed to the customer. The sales arrangements typically do not include a right of return or other similar provisions, nor do they contain any other post-delivery obligations.
Some of our Tubular Sales and Blackhawk segment customers have requested that we store pipe, connectors and cementing products purchased from us in our facilities. We recognize revenues for these “bill and hold” sales once the
66
FRANK’S INTERNATIONAL N.V.
NOTES TO CONSOLIDATED FINANCIAL STATEMENTS
following criteria have been met: (1) there is a substantive reason for the arrangement, (2) the product is identified as the customer’s asset, (3) the product is ready for delivery to the customer, and (4) we cannot use the product or direct it to another customer.
Short‑term investments
Short‑term investments consist of commercial paper, classified as held-to-maturity and a fund that primarily invests in short-term debt securities. These investments have original maturities of greater than three months but less than twelve months. At
December 31, 2018
and
2017
, the carrying amount of our short-term investments was
$26.6 million
and
$81.0 million
, respectively.
Stock-Based Compensation
Our 2013 Long-Term Incentive Plan provides for the granting of stock options, stock appreciation rights (“SARs”), restricted stock, restricted stock units (“RSUs”), performance restricted stock units (“PRSUs”), dividend equivalent rights and other types of equity and cash incentive awards to employees, non-employee directors and service providers. Stock-based compensation expense is measured at the grant date of the share-based awards based on their value. Stock-based compensation expense is recognized on a straight-line basis over the vesting period and is included in general and administrative expense in the consolidated statements of operations.
Our stock-based compensation currently consists of RSUs and PRSUs. The grant date fair value of the RSUs, which are not entitled to receive dividends until vested, is measured by reducing the share price at that date by the present value of the dividends expected to be paid during the requisite vesting period, discounted at the appropriate risk-free interest rate. The grant date fair value and compensation expense of PRSU grants is estimated based on a Monte Carlo simulation using the Company's closing stock price as of the day before the grant date.
Recent Accounting Pronouncements
Changes to GAAP are established by the Financial Accounting Standards Board (“FASB”) in the form of accounting standards updates (“ASUs”) to the FASB’s Accounting Standards Codification.
We consider the applicability and impact of all accounting pronouncements. ASUs not listed below were assessed and were either determined to be not applicable or are expected to have immaterial impact on our consolidated financial position, results of operations and cash flows.
In June 2018, the FASB issued new guidance which is intended to simplify aspects of share-based compensation issued to non-employees by making the guidance consistent with the accounting for employee share-based compensation. The guidance is effective for annual periods beginning after December 15, 2018, including interim periods within those periods. We adopted the guidance on January 1, 2019 and the adoption did not have a material impact on our consolidated financial statements.
In May 2017, the FASB issued new guidance to clarify and reduce both (i) diversity in practice and (ii) cost and complexity when accounting for a change to the terms and conditions of a share-based payment award. The guidance is effective for annual periods beginning after December 15, 2017, including interim periods within those periods. The amendments in this guidance should be applied prospectively to an award modified on or after the adoption date. We adopted the guidance on January 1, 2018 and the adoption did not have an impact on our consolidated financial statements.
In January 2017, the FASB issued new accounting guidance for business combinations clarifying the definition of a business. The objective of the guidance is to help companies and other organizations which have acquired or sold a business to evaluate whether transactions should be accounted for as acquisitions (or disposals) of assets or businesses. For public entities, the guidance is effective for annual periods beginning after December 15, 2017, including interim periods within those periods. We adopted the guidance on January 1, 2018 and the adoption did not have an impact on our consolidated financial statements.
67
FRANK’S INTERNATIONAL N.V.
NOTES TO CONSOLIDATED FINANCIAL STATEMENTS
In June 2016, the FASB issued new accounting guidance for credit losses on financial instruments. The guidance includes the replacement of the “incurred loss” approach for recognizing credit losses on financial assets, including trade receivables, with a methodology that reflects expected credit losses, which considers historical and current information as well as reasonable and supportable forecasts. For public entities, the guidance is effective for financial statements issued for fiscal years beginning after December 15, 2019, including interim periods within those fiscal years. Early application is permitted for all entities for fiscal years beginning after December 15, 2018, including interim periods within those fiscal years. Management is evaluating the provisions of this new accounting guidance, including which period to adopt, and has not determined what impact the adoption will have on our consolidated financial statements.
In February 2016, the FASB issued new accounting guidance for leases. The main objective of the accounting guidance is to increase transparency and comparability among organizations by recognizing lease assets and lease liabilities on the balance sheet and disclosing key information about leasing arrangements. The main difference between previous GAAP and the new guidance is the recognition of lease assets and lease liabilities by lessees for those leases classified as operating leases. The new guidance requires lessees to recognize assets and liabilities arising from leases on the balance sheet and further defines a lease as a contract that conveys the right to control the use of identified property, plant, or equipment for a period of time in exchange for consideration. Control over the use of the identified asset means that the customer has both (1) the right to obtain substantially all of the economic benefit from the use of the asset and (2) the right to direct the use of the asset. The accounting guidance requires disclosures by both lessees and lessors to meet the objective of enabling users of financial statements to assess the amount, timing, and uncertainty of cash flows arising from leases. Further, in July 2018, the FASB amended the new lease accounting standard in an effort to reduce the burden of adoption. With the adoption of the new lease accounting standard, as amended, companies have the option of electing to apply the new lease accounting standard either on a retrospective or prospective basis. For public entities, the guidance is effective for financial statements issued for fiscal years beginning after December 15, 2018, including interim periods within those fiscal years. We adopted the new lease accounting standard, as amended, on a prospective basis effective January 1, 2019. Additionally, we are implementing an enterprise-wide lease management system to assist in the accounting and are evaluating additional changes to our processes and internal controls to ensure we meet the standard's reporting and disclosure requirements.
We will make an accounting policy election to keep leases with an initial term of 12 months or less off of the balance sheet. We will recognize those lease payments in the consolidated statements of operations on a straight-line basis over the lease term. We estimate adoption of the standard will result in the recognition of right of use assets and lease liabilities for operating leases of between
$30.0 million
and
$40.0 million
as of January 1, 2019. We do not anticipate the adoption of the new lease accounting standard will materially affect our statement of operations or statement of cash flows.
In May 2014, the FASB issued amendments to guidance on the recognition of revenue based upon the entity’s contracts with customers to transfer goods or services. Under the new revenue standard, an entity should recognize revenue to depict the transfer of promised goods or services to customers in an amount that reflects the consideration to which the entity expects to be entitled in exchange for those goods or services. The standard creates a five-step model that requires companies to exercise judgment when considering the terms of a contract and all relevant facts and circumstances. The standard allows for two transition methods: (a) a full retrospective adoption in which the standard is applied to all periods presented, or (b) a modified retrospective adoption in which the standard is applied only to the most current period presented in the financial statements, including additional disclosures of the standard’s application impact to individual financial statement line items. In July 2015, the FASB deferred the effective date to December 15, 2017 for annual periods, and interim reporting periods within those fiscal years, beginning after that date.
We adopted the new revenue standard effective January 1, 2018 using the modified retrospective method. We recognized the cumulative effect of initially applying the new revenue standard as an adjustment to the opening balance of retained earnings. Our adjustment related solely to revenues from certain product sales with bill-and-hold arrangements in our Tubular Sales segment. The comparative information has not been restated and continues to be reported under the accounting standards which were in effect for those periods. The impact to revenue of applying the new revenue recognition standard for the year ended
December 31, 2018
was immaterial. We expect the impact of the adoption of the new standard to be immaterial to our financial results on an ongoing basis.
We elected to apply certain practical expedients available under the new revenue standard. We elected to expense cost of obtaining contracts, such as sales commissions, when incurred because the amortization period would have been one
68
FRANK’S INTERNATIONAL N.V.
NOTES TO CONSOLIDATED FINANCIAL STATEMENTS
year or less due to the length of our contracts. We have also elected not to assess immaterial promises in the context of our contracts as performance obligations and to exclude taxes from the assessment of transaction price in arrangements where taxes are collected by the entity from a customer.
We do not disclose the value of unsatisfied performance obligations for contracts with an original expected duration of one year or less. Because our contracts with customers are short-term in nature and fall within this exemption, we do not have significant unsatisfied performance obligations as defined by the new revenue standard.
The cumulative effect of the changes made to our consolidated January 1, 2018 balance sheet for the adoption of the new revenue standard was as follows (in thousands):
|
Balance at
|
Impact of
|
Balance at
|
|||||||||
|
December 31, 2017
|
Adjustments
|
January 1, 2018
|
|||||||||
|
Balance Sheet
|
|||||||||||
|
Assets
|
|||||||||||
|
Inventories, net
|
$
|
76,420
|
|
$
|
(3,560
|
)
|
$
|
72,860
|
|
||
|
Liabilities
|
|||||||||||
|
Deferred revenue
|
4,703
|
|
(4,230
|
)
|
473
|
|
|||||
|
Stockholders’ Equity
|
|||||||||||
|
Retained earnings
|
106,923
|
|
670
|
|
107,593
|
|
|||||
Note 2—Noncontrolling Interest
We hold an economic interest in FICV and are responsible for all operational, management and administrative decisions relating to FICV’s business. As a result, the financial results of FICV are consolidated with ours.
We recorded a noncontrolling interest on our consolidated balance sheet with respect to the remaining economic interest in FICV held by Mosing Holdings. Net loss attributable to noncontrolling interest on the statements of operations represented the portion of losses attributable to the economic interest in FICV held by Mosing Holdings. The allocable domestic loss from FICV to FINV is subject to U.S. taxation. Effective with the August 2016 conversion of all of Mosing Holdings’ Series A preferred stock (see Note 12—Preferred Stock), Mosing Holdings transferred all its interest in FICV to us and the noncontrolling interest was eliminated. As a result, the amount included in net loss attributable to noncontrolling interest for the year ended December 31, 2016 is through August 26, 2016.
A reconciliation of net loss attributable to noncontrolling interest is detailed as follows (in thousands):
|
Year Ended
December 31, |
|||
|
2016
|
|||
|
Net loss
|
$
|
(156,079
|
)
|
|
Add: Net loss after Mosing Holdings contributed interest to FINV
(1)
|
84,541
|
|
|
|
Add: Benefit for U.S. income taxes of FINV
(2)
|
(10,414
|
)
|
|
|
Less: Loss of FINV
(3)
|
23
|
|
|
|
Net loss subject to noncontrolling interest
|
(81,929
|
)
|
|
|
Noncontrolling interest percentage
(4)
|
25.2
|
%
|
|
|
Net loss attributable to noncontrolling interest
|
$
|
(20,741
|
)
|
|
(1)
|
Represents net loss after August 26, 2016 when Mosing Holdings transferred its interest to FINV.
|
|
(2)
|
Represents income tax benefit of entities outside of FICV as well as income tax attributable to our proportionate share of the U.S. operations of our partnership interests in FICV as of August 26, 2016.
|
|
(3)
|
Represents results of operations for entities outside of FICV as of August 26, 2016.
|
69
FRANK’S INTERNATIONAL N.V.
NOTES TO CONSOLIDATED FINANCIAL STATEMENTS
|
(4)
|
Represents the economic interest in FICV held by Mosing Holdings before the preferred stock conversion on August 26, 2016. Effective August 26, 2016, Mosing Holdings delivered its economic interest in FICV to us.
|
Note 3—Acquisitions and Divestitures
Related Party Acquisition
On November 2, 2018, Frank’s International, LLC entered into a purchase agreement with Mosing Ventures, LLC, Mosing Land & Cattle Company, LLC, Mosing Queens Row Properties, LLC, and 4-M Investments, each of which are companies related to us by common ownership (the “Mosing Companies”). Under the purchase agreement, we acquired real property that we previously leased from the Mosing Companies, and two additional properties located adjacent to those properties. The total purchase price was
$37.0 million
, including legal fees and closing adjustments for normal operating activity. The purchase closed on December 18, 2018. Please see Note 13—Related Party Transactions.
Blackhawk Acquisition
On November 1, 2016, we completed a transaction to acquire all outstanding shares in Blackhawk, the ultimate parent company of Blackhawk Specialty Tools LLC, pursuant to the terms of a definitive merger agreement (“Merger Agreement”) dated October 6, 2016. Blackhawk is a leading provider of well construction and well intervention services and products. In conjunction with the acquisition, FI Tools Holdings, LLC, our newly formed subsidiary, merged with and into Blackhawk with Blackhawk, surviving the Merger as our wholly-owned subsidiary. The merger consideration was comprised of a combination of
$150.4 million
of cash on hand and
12.8 million
shares of our common stock (“Common Stock”), on a cash-free, debt-free basis, for total consideration of
$294.6 million
(based on our closing share price on October 31, 2016 of
$11.25
and including working capital adjustments).
Accordingly, the results of Blackhawk's operations from November 1, 2016 are included in our consolidated financial statements. For the year ended December 31, 2016, Blackhawk contributed revenue of
$10.0 million
and operating losses of
$7.4 million
.
The intention of this transaction was to augment our tubular services business by providing us the opportunity to diversify our offerings and emerge as a leader in a new business line and a significantly larger addressable market. In addition to what we believe is a line of well-regarded, market leading, technically differentiated specialty cementation tools, Blackhawk also provides well intervention products through its line of brute packers and related products, and is continuing its development of products for onshore and offshore applications. In conjunction with the merger, we created a fourth segment, Blackhawk, and recorded goodwill of
$192.4 million
in that segment.
Divestitures
Beginning in 2017, we committed to sell certain of our buildings in the International Services segment and aircraft in our U.S. Services segment. See Note 6—Property, Plant and Equipment for additional information.
During the first quarter of 2018, we sold a building classified as held for sale for
$0.8 million
and recorded an immaterial loss. During the third quarter of 2018, we sold a building classified as held for sale with a net book value of
$0.3 million
for
$2.6 million
. During the fourth quarter of 2018, we sold a building classified as held for sale with a net book value of
$4.2 million
and recorded an immaterial gain.
During the first quarter of 2017, we sold a fully depreciated aircraft for a total sales price of
$1.3 million
and recorded a gain on sale of
$1.3 million
. During the third quarter of 2017, we sold an additional aircraft for a net sales price of
$4.9 million
and recorded an immaterial loss. We also sold a building in the Middle East for a net sales price of
$2.7 million
and recorded a gain on sale of
$0.6 million
. During the fourth quarter of 2017, we sold a building in Canada for a total sales price of
$2.4 million
and recorded a gain on sale of
$0.3 million
. We also sold our third and last aircraft for a total sales price of
$0.7 million
to a related party and recorded a gain on sale of
$0.7 million
. See Note 13—Related Party Transactions for additional information.
70
FRANK’S INTERNATIONAL N.V.
NOTES TO CONSOLIDATED FINANCIAL STATEMENTS
Note 4—Accounts Receivable, net
Accounts receivable at
December 31, 2018
and
2017
were as follows (in thousands):
|
December 31,
|
|||||||
|
2018
|
2017
|
||||||
|
Trade accounts receivable, net of allowance of $3,925 and $4,777, respectively
|
$
|
114,630
|
|
$
|
83,482
|
|
|
|
Unbilled receivables
|
54,591
|
|
25,670
|
|
|||
|
Taxes receivable
|
15,762
|
|
11,305
|
|
|||
|
Affiliated
(1)
|
549
|
|
716
|
|
|||
|
Other receivables
|
3,882
|
|
6,037
|
|
|||
|
Total accounts receivable, net
|
$
|
189,414
|
|
$
|
127,210
|
|
|
|
(1)
|
Amounts represent expenditures on behalf of non-consolidated affiliates.
|
Note 5—Inventories, net
Inventories at
December 31, 2018
and
2017
were as follows (in thousands):
|
December 31,
|
|||||||
|
2018
|
2017
|
||||||
|
Pipe and connectors, net of allowance of $21,270 and $20,064, respectively
|
$
|
18,026
|
|
$
|
33,620
|
|
|
|
Finished goods, net of allowance of $1,354 and $1,520, respectively
|
22,608
|
|
14,541
|
|
|||
|
Work in progress
|
8,285
|
|
9,206
|
|
|||
|
Raw materials, components and supplies
|
20,463
|
|
19,053
|
|
|||
|
Total inventories, net
|
$
|
69,382
|
|
$
|
76,420
|
|
|
Note 6—Property, Plant and Equipment
The following is a summary of property, plant and equipment at
December 31, 2018
and
2017
(in thousands):
|
December 31,
|
|||||||||
|
Estimated Useful Lives in Years
|
2018
|
2017
|
|||||||
|
Land
(1)
|
—
|
$
|
32,945
|
|
$
|
15,314
|
|
||
|
Land improvements
|
8-15
|
8,316
|
|
14,594
|
|
||||
|
Buildings and improvements
(1)
|
13-39
|
125,088
|
|
119,380
|
|
||||
|
Rental machinery and equipment
|
7
|
887,064
|
|
898,146
|
|
||||
|
Machinery and equipment - other
|
7
|
61,796
|
|
55,049
|
|
||||
|
Furniture, fixtures and computers
|
5
|
24,745
|
|
27,259
|
|
||||
|
Automobiles and other vehicles
|
5
|
29,696
|
|
29,971
|
|
||||
|
Leasehold improvements
|
7-15, or lease term if shorter
|
15,392
|
|
10,030
|
|
||||
|
Construction in progress - machinery and equipment and buildings
|
—
|
65,152
|
|
61,836
|
|
||||
|
1,250,194
|
|
1,231,579
|
|
||||||
|
Less: Accumulated depreciation
|
(833,704
|
)
|
(761,933
|
)
|
|||||
|
Total property, plant and equipment, net
|
$
|
416,490
|
|
$
|
469,646
|
|
|||
|
(1)
|
The balances as of December 31, 2018 include the acquisition of land and buildings of
$18.5 million
and
$18.5 million
, respectively. See Note 13—Related Party Transactions for additional information.
|
71
FRANK’S INTERNATIONAL N.V.
NOTES TO CONSOLIDATED FINANCIAL STATEMENTS
During the third quarter of 2017, we committed to sell certain of our buildings in the International Services segment and determined those assets met the criteria to be classified as held for sale in our consolidated balance sheet. As a result, we reclassified the buildings, with a net book value of
$4.1 million
, from property, plant and equipment to assets held for sale and recognized a
$0.3 million
loss.
During the third quarter of 2018, a building in the International Services segment with a net book value of
$5.0 million
met the criteria to be classified as held for sale and was reclassified from property, plant and equipment to assets held for sale on our consolidated balance sheet.
No
impairments were recognized during the years ended
December 31, 2018
,
2017
or
2016
.
The following table presents the depreciation and amortization associated with each line for the periods ended
December 31, 2018
,
2017
and
2016
(in thousands):
|
December 31,
|
||||||||||||
|
2018
|
2017
|
2016
|
||||||||||
|
Cost of revenues
|
||||||||||||
|
Services
|
$
|
93,280
|
|
$
|
102,212
|
|
$
|
101,260
|
|
|||
|
Products
|
4,354
|
|
4,971
|
|
4,254
|
|
||||||
|
General and administrative expenses
|
13,658
|
|
14,919
|
|
8,701
|
|
||||||
|
Total
|
$
|
111,292
|
|
$
|
122,102
|
|
$
|
114,215
|
|
|||
Note 7—Other Assets
Other assets at
December 31, 2018
and
2017
consisted of the following (in thousands):
|
December 31,
|
|||||||
|
2018
|
2017
|
||||||
|
Cash surrender value of life insurance policies
(1)
|
$
|
23,784
|
|
$
|
30,351
|
|
|
|
Deposits
|
2,269
|
|
2,564
|
|
|||
|
Other
|
2,566
|
|
2,378
|
|
|||
|
Total other assets
|
$
|
28,619
|
|
$
|
35,293
|
|
|
|
(1)
|
See Note 10—Fair Value Measurements.
|
Note 8— Accounts Payable and Accrued Liabilities
Accounts payable and accrued liabilities at
December 31, 2018
and
2017
consisted of the following (in thousands):
|
December 31,
|
|||||||
|
2018
|
2017
|
||||||
|
Accounts payable
|
$
|
31,960
|
|
$
|
33,912
|
|
|
|
Accrued compensation
|
30,822
|
|
25,510
|
|
|||
|
Accrued property and other taxes
|
16,301
|
|
16,908
|
|
|||
|
Accrued severance and other charges
|
2,328
|
|
1,444
|
|
|||
|
Income taxes
|
12,075
|
|
8,091
|
|
|||
|
Accrued purchase orders and other
|
30,495
|
|
23,020
|
|
|||
|
Total accounts payable and accrued liabilities
|
$
|
123,981
|
|
$
|
108,885
|
|
|
72
FRANK’S INTERNATIONAL N.V.
NOTES TO CONSOLIDATED FINANCIAL STATEMENTS
Note 9—Debt
Credit Facilities
We had a
$100.0 million
revolving credit facility with certain financial institutions, including up to
$20.0 million
in letters of credit and up to
$10.0 million
in swingline loans, which matured in
August 2018
. At
December 31, 2017
, we had
$2.8 million
in letters of credit outstanding under this facility.
New
Asset Based Revolving Credit Facility
On November 5, 2018, FICV, Frank’s International, LLC and Blackhawk, as borrowers, and FINV, certain of FINV’s subsidiaries, including FICV, Frank’s International, LLC, Blackhawk, Frank’s International GP, LLC, Frank’s International, LP, Frank’s International LP B.V., Frank’s International Partners B.V., Frank’s International Management B.V., Blackhawk Intermediate Holdings, LLC, Blackhawk Specialty Tools, LLC, and Trinity Tool Rentals, L.L.C., as guarantors, entered into a
five
-year senior secured revolving credit facility (the “New ABL Credit Facility”) with JPMorgan Chase Bank, N.A., as administrative agent (the “ABL Agent”), and other financial institutions as lenders with total commitments of
$100.0 million
including up to
$15.0 million
available for letters of credit. Subject to the terms of the New ABL Credit Facility, we have the ability to increase the commitments to
$200.0 million
. The maximum amount that the Company may borrow under the New ABL Credit Facility is subject to a borrowing base, which is based on a percentage of certain eligible accounts receivable and eligible inventory, subject to customary reserves and other adjustments.
All obligations under the New ABL Credit Facility are fully and unconditionally guaranteed jointly and severally by FINV’s subsidiaries, including FICV, Frank’s International, LLC, Blackhawk, Frank’s International GP, LLC, Frank’s International, LP, Frank’s International LP B.V., Frank’s International Partners B.V.,
Frank’s International Management B.V.,
Blackhawk Intermediate Holdings, LLC, Blackhawk Specialty Tools, LLC, and Trinity Tool Rentals, L.L.C., subject to customary exceptions and exclusions. In addition, the obligations under the New ABL Credit Facility are secured by first priority liens on substantially all of the assets and property of the borrowers and guarantors, including pledges of equity interests in certain of FINV’s subsidiaries, subject to certain exceptions. Borrowings under the New ABL Credit Facility bear interest at FINV’s option at either (a) the Alternate Base Rate (
“
ABR
”
) (as defined therein), calculated as the greatest of (i) the rate of interest publicly quoted by the Wall Street Journal, as the “prime rate,” subject to each increase or decrease in such prime rate effective as of the date such change occurs, (ii) the federal funds effective rate that is subject to a
0.00%
interest rate floor plus
0.50%
, and (iii) the one-month Adjusted LIBO Rate (as defined therein) plus
1.00%
, or (b) the Adjusted LIBO Rate (as defined therein), plus, in each case, an applicable margin.
The applicable interest rate margin ranges from
1.00%
to
1.50%
per annum for ABR loans and
2.00%
to
2.50%
per annum for Eurodollar loans and, in each case, is based on FINV’s leverage ratio. The unused portion of the New ABL Credit Facility is subject to a commitment fee that varies from
0.250%
to
0.375%
per annum, according to average daily unused commitments under the New ABL Credit Facility. Interest on Eurodollar loans is payable at the end of the selected interest period, but no less frequently than quarterly. Interest on ABR loans is payable monthly in arrears.
The New ABL Credit Facility contains various covenants and restrictive provisions which limit, subject to certain customary exceptions and thresholds, FINV’s ability to, among other things, (1) enter into asset sales; (2) incur additional indebtedness; (3) make investments, acquisitions, or loans and create or incur liens; (4) pay certain dividends or make other distributions and (5) engage in transactions with affiliates. The New ABL Credit Facility also requires FINV to maintain a minimum fixed charge coverage ratio of
1.0
to
1.0
based on the ratio of (a) consolidated EBITDA (as defined therein) minus unfinanced capital expenditures to (b) Fixed Charges (as defined therein), when either (i) an event of default occurs under the New ABL Facility or (ii) availability under the New ABL Credit Facility falls for at least two consecutive calendar days below the greater of (A)
$12.5 million
and (B)
15%
of the lesser of the borrowing base and aggregate commitments (a “FCCR Trigger Event”). Accounts receivable received by FINV’s U.S. subsidiaries that are parties to the New ABL Credit Facility will be deposited into deposit accounts subject to deposit control agreements in favor of the ABL Agent. After a FCCR Trigger Event, these deposit accounts would be subject to “springing” cash dominion.
After a FCCR Trigger Event, the Company will be subject to compliance with the fixed charge coverage ratio and “springing” cash dominion until no default exists under the New ABL Credit Facility and availability under the facility for the preceding thirty consecutive
73
FRANK’S INTERNATIONAL N.V.
NOTES TO CONSOLIDATED FINANCIAL STATEMENTS
days has been equal to at least the greater of (x)
$12.5 million
and (y)
15%
of the lesser of the borrowing base and the aggregate commitments.
If FINV fails to perform its obligations under the agreement that results in an event of default, the commitments under the New ABL Credit Facility could be terminated and any outstanding borrowings under the New ABL Credit Facility may be declared immediately due and payable. The New ABL Credit Facility also contains cross default provisions that apply to FINV’s other indebtedness.
As of
December 31, 2018
, FINV had
no
borrowings outstanding under the New ABL Credit Facility, letters of credit outstanding of
$4.9 million
and availability of
$69.7 million
.
Insurance Notes Payable
In 2018, we entered into a note to finance our annual insurance premiums totaling
$6.8 million
. The note bears interest at an annual rate of
3.9%
with a final maturity date in
October 2019
. At
December 31, 2018
, the total outstanding balance was
$5.6 million
.
In 2017, we entered into
three
notes to finance our annual insurance premiums totaling
$5.1 million
. The notes bear interest at an annual rate of
2.9%
with a final maturity date in
October 2018
. At December 31,
2017
, the total outstanding balance was
$4.7 million
.
Note 10—Fair Value Measurements
We follow fair value measurement authoritative accounting guidance for measuring fair values of assets and liabilities in financial statements. Fair value is the price that would be received to sell an asset or paid to transfer a liability in an orderly transaction between market participants at the measurement date. We utilize market data or assumptions that market participants who are independent, knowledgeable, and willing and able to transact would use in pricing the asset or liability, including assumptions about risk and the risks inherent in the inputs to the valuation technique. We are able to classify fair value balances based on the observability of these inputs. The authoritative guidance for fair value measurements establishes three levels of the fair value hierarchy, defined as follows:
|
•
|
Level 1: Unadjusted, quoted prices for identical assets or liabilities in active markets.
|
|
•
|
Level 2: Quoted prices in markets that are not considered to be active or financial instruments for which all significant inputs are observable, either directly or indirectly for substantially the full term of the asset or liability.
|
|
•
|
Level 3: Significant, unobservable inputs for use when little or no market data exists, requiring a significant degree of judgment.
|
The hierarchy gives the highest priority to Level 1 measurements and the lowest priority to Level 3 measurements. Depending on the particular asset or liability, input availability can vary depending on factors such as product type, longevity of a product in the market and other particular transaction conditions. In some cases, certain inputs used to measure fair value may be categorized into different levels of the fair value hierarchy. For disclosure purposes under the accounting guidance, the lowest level that contains significant inputs used in valuation should be chosen.
74
FRANK’S INTERNATIONAL N.V.
NOTES TO CONSOLIDATED FINANCIAL STATEMENTS
Financial Assets and Liabilities
A summary of financial assets and liabilities that are measured at fair value on a recurring basis, as of
December 31, 2018
and
2017
were as follows (in thousands):
|
Quoted Prices
in Active
Markets
|
Significant
Other
Observable
Inputs
|
Significant
Unobservable
Inputs
|
|||||||||||||
|
(Level 1)
|
(Level 2)
|
(Level 3)
|
Total
|
||||||||||||
|
December 31, 2018
|
|||||||||||||||
|
Assets:
|
|||||||||||||||
|
Investments:
|
|||||||||||||||
|
Cash surrender value of life insurance policies - deferred compensation plan
|
$
|
—
|
|
$
|
23,784
|
|
$
|
—
|
|
$
|
23,784
|
|
|||
|
Marketable securities - other
|
37
|
|
—
|
|
—
|
|
37
|
|
|||||||
|
Liabilities:
|
|||||||||||||||
|
Derivative financial instruments
|
—
|
|
101
|
|
—
|
|
101
|
|
|||||||
|
Deferred compensation plan
|
—
|
|
23,663
|
|
—
|
|
23,663
|
|
|||||||
|
December 31, 2017
|
|||||||||||||||
|
Assets:
|
|||||||||||||||
|
Investments:
|
|||||||||||||||
|
Cash surrender value of life insurance policies - deferred compensation plan
|
$
|
—
|
|
$
|
30,351
|
|
$
|
—
|
|
$
|
30,351
|
|
|||
|
Marketable securities - other
|
113
|
|
—
|
|
—
|
|
113
|
|
|||||||
|
Liabilities:
|
|||||||||||||||
|
Derivative financial instruments
|
—
|
|
487
|
|
—
|
|
487
|
|
|||||||
|
Deferred compensation plan
|
—
|
|
26,797
|
|
—
|
|
26,797
|
|
|||||||
Our derivative financial instruments consist of short-duration foreign currency forward contracts. The fair value of derivative financial instruments is based on quoted market values including foreign exchange forward rates and interest rates. The fair value is computed by discounting the projected future cash flow amounts to present value. At
December 31, 2018
and
2017
, derivative financial instruments are included in the financial statement line item accounts payable and accrued liabilities in our consolidated balance sheets.
Our investments associated with our deferred compensation plan consist primarily of the cash surrender value of life insurance policies and is included in other assets on the consolidated balance sheets. The liability associated with our deferred compensation plan is included in other liabilities on the consolidated balance sheets. Our investments change as a result of contributions, payments, and fluctuations in the market. Assets and liabilities, measured using significant observable inputs, are reported at fair value based on third-party broker statements, which are derived from the fair value of the funds' underlying investments. We also have marketable securities in publicly traded equity securities as an indirect result of strategic investments. They are reported at fair value based on the price of the stock and are included in other assets on the consolidated balance sheets.
75
FRANK’S INTERNATIONAL N.V.
NOTES TO CONSOLIDATED FINANCIAL STATEMENTS
Assets and Liabilities Measured at Fair Value on a Non-recurring Basis
We apply the provisions of the fair value measurement standard to our non-recurring, non-financial measurements including business combinations and assets identified as held for sale, as well as impairment related to goodwill and other long-lived assets. For business combinations, the purchase price is allocated to the assets acquired and liabilities assumed based on a discounted cash flow model for most intangibles as well as market assumptions for the valuation of equipment and other fixed assets.
We perform our goodwill impairment assessment for each reporting unit by comparing the estimated fair value of each reporting unit to the reporting unit’s carrying value, including goodwill. We estimate the fair value for each reporting unit using a discounted cash flow analysis based on management’s short-term and long-term forecast of operating performance. This analysis includes significant assumptions regarding discount rates, revenue growth rates, expected profitability margins, forecasted capital expenditures and the timing of expected future cash flows based on market conditions. If the estimated fair value of a reporting unit exceeds its carrying amount, goodwill of the reporting unit is not considered impaired. If the carrying amount of a reporting unit exceeds its estimated fair value, an impairment loss is measured and recorded.
When conducting an impairment test on long-lived assets, other than goodwill, we first compare estimated future undiscounted cash flows associated with the asset to the asset’s carrying amount. If the undiscounted cash flows are less than the asset’s carrying amount, we then determine the asset’s fair value by using a discounted cash flow analysis. These analyses are based on estimates such as management’s short-term and long-term forecast of operating performance, including revenue growth rates and expected profitability margins, estimates of the remaining useful life and service potential of the asset, and a discount rate based on our weighted average cost of capital. For assets that meet the criteria to be classified as held for sale, a market approach is used to determine fair value based on third-party appraisal reports.
The impairment assessments discussed above incorporate inherent uncertainties, including projected commodity pricing, supply and demand for our services and future market conditions, which are difficult to predict in volatile economic environments and could result in impairment charges in future periods if actual results materially differ from the estimated assumptions utilized in our forecasts. If crude oil prices decline significantly and remain at low levels for a sustained period of time, we could be required to record an impairment of the carrying value of our long-lived assets in the future which could have a material adverse impact on our operating results. Given the unobservable nature of the inputs, the discounted cash flow models are deemed to use Level 3 inputs.
Other Fair Value Considerations
The carrying values on our consolidated balance sheet of our cash and cash equivalents, short-term investments, trade accounts receivable, other current assets, accounts payable, accrued and other current liabilities and lines of credit approximate fair values due to their short maturities.
Note 11— Derivatives
We enter into short-duration foreign currency forward derivative contracts to reduce the risk of foreign currency fluctuations. We use these instruments to mitigate our exposure to non-local currency operating working capital. We record these contracts at fair value on our consolidated balance sheets. Although the derivative contracts will serve as an economic hedge of the cash flow of our currency exchange risk exposure, they are not formally designated as hedge contracts for hedge accounting treatment. Accordingly, any changes in the fair value of the derivative instruments during a period will be included in our consolidated statements of operations.
76
FRANK’S INTERNATIONAL N.V.
NOTES TO CONSOLIDATED FINANCIAL STATEMENTS
As of
December 31, 2018
and
2017
, we had the following foreign currency derivative contracts outstanding in U.S. dollars (in thousands):
|
December 31, 2018
|
||||||||
|
Notional
|
Contractual
|
Settlement
|
||||||
|
Derivative Contracts
|
Amount
|
Exchange Rate
|
Date
|
|||||
|
Canadian dollar
|
$
|
2,248
|
|
1.3343
|
3/18/2019
|
|||
|
Euro
|
6,967
|
|
1.1421
|
3/18/2019
|
||||
|
Norwegian krone
|
7,713
|
|
8.5566
|
3/18/2019
|
||||
|
Pound sterling
|
16,452
|
|
1.2655
|
3/18/2019
|
||||
|
December 31, 2017
|
||||||||
|
Notional
|
Contractual
|
Settlement
|
||||||
|
Derivative Contracts
|
Amount
|
Exchange Rate
|
Date
|
|||||
|
Canadian dollar
|
$
|
6,226
|
|
1.2850
|
3/15/2018
|
|||
|
Euro
|
5,326
|
|
1.1836
|
3/15/2018
|
||||
|
Norwegian krone
|
6,212
|
|
8.3704
|
3/15/2018
|
||||
|
Pound sterling
|
6,039
|
|
1.3419
|
3/15/2018
|
||||
The following table summarizes the location and fair value amounts of all derivative contracts in the consolidated balance sheets as of
December 31, 2018
and
2017
(in thousands):
|
Derivatives not designated as Hedging Instruments
|
Consolidated Balance Sheet Location
|
December 31, 2018
|
December 31, 2017
|
|||||||
|
Foreign currency contracts
|
Accounts payable and accrued liabilities
|
$
|
(101
|
)
|
$
|
(487
|
)
|
|||
The following table summarize the location and amounts of the unrealized and realized gains and losses on derivative contracts in the consolidated statements of operations as of
December 31, 2018
,
2017
and
2016
(in thousands):
|
Derivatives not designated as Hedging Instruments
|
Location of gain (loss) recognized in income on derivative contracts
|
December 31, 2018
|
December 31, 2017
|
December 31, 2016
|
||||||||||
|
Unrealized gain (loss) on foreign currency contracts
|
Other income, net
|
$
|
386
|
|
$
|
(634
|
)
|
$
|
(64
|
)
|
||||
|
Realized gain (loss) on foreign currency contracts
|
Other income, net
|
1,661
|
|
(1,699
|
)
|
(296
|
)
|
|||||||
|
Total net gain (loss) on foreign currency contracts
|
$
|
2,047
|
|
$
|
(2,333
|
)
|
$
|
(360
|
)
|
|||||
Our derivative transactions are governed through International Swaps and Derivatives Association master agreements. These agreements include stipulations regarding the right of offset in the event that we or our counterparty default on our performance obligations. If a default were to occur, both parties have the right to net amounts payable and receivable into a single net settlement between parties. Our accounting policy is to offset derivative assets and liabilities executed with the same counterparty when a master netting arrangement exists.
77
FRANK’S INTERNATIONAL N.V.
NOTES TO CONSOLIDATED FINANCIAL STATEMENTS
The following table presents the gross and net fair values of our derivatives as of
December 31, 2018
and
2017
(in thousands):
|
Derivative Asset Positions
|
Derivative Liability Positions
|
|||||||||||||||
|
December 31,
|
December 31,
|
|||||||||||||||
|
2018
|
2017
|
2018
|
2017
|
|||||||||||||
|
Gross position - asset / (liability)
|
$
|
113
|
|
$
|
—
|
|
$
|
(214
|
)
|
$
|
(487
|
)
|
||||
|
Netting adjustment
|
(113
|
)
|
—
|
|
113
|
|
—
|
|
||||||||
|
Net position - asset / (liability)
|
$
|
—
|
|
$
|
—
|
|
$
|
(101
|
)
|
$
|
(487
|
)
|
||||
Note 12—Preferred Stock
On August 19, 2016, we received notice from Mosing Holdings that it was exercising its right to exchange, for
52,976,000
common shares, each of the following securities: (i)
52,976,000
shares of Preferred Stock and (ii)
52,976,000
units in FICV. On August 26, 2016, we issued
52,976,000
common shares to Mosing Holdings. Each share of Preferred Stock had a liquidation preference equal to its par value of
€0.01
per share and was entitled to an annual dividend equal to
0.25%
of its par value. Additionally, each share of Preferred Stock entitled its holder to
one
vote. Preferred stockholders voted with the common stockholders as a single class on all matters presented to FINV’s shareholders for their vote.
Upon conversion of the Preferred Stock, we had
no
issued or outstanding convertible preferred shares and the number of common shares of authorized capital was increased by
52,976,000
shares, equal to the number of convertible preferred shares that were converted into common shares. Additionally, upon the exchange of the convertible preferred stock, Mosing Holdings was entitled to receive an amount in cash equal to the nominal value of each convertible preferred share plus any accrued but unpaid dividends with respect to such stock. The cash payment of
$0.6 million
was paid on September 23, 2016. In conjunction with the conversion, Mosing Holdings delivered its interest in FICV to us and no longer owns any interest in FICV. As a result of the transaction, we have also reallocated the accumulated other comprehensive loss attributable to the noncontrolling interest.
Note 13—Related Party Transactions
We have engaged in certain transactions with other companies related to us by common ownership. We have entered into various operating leases to lease facilities from these affiliated companies. Rent expense associated with our related party leases was
$6.5 million
,
$6.9 million
and
$8.0 million
for the years ended
December 31, 2018
,
2017
and
2016
, respectively.
On November 2, 2018, Frank’s International, LLC entered into a purchase agreement with Mosing Ventures, LLC, Mosing Land & Cattle Company, LLC, Mosing Queens Row Properties, LLC, and 4-M Investments, each of which are companies related to us by common ownership (the “Mosing Companies”). Under the purchase agreement, we acquired real property that we previously leased from the Mosing Companies, and two additional properties located adjacent to those properties. The total purchase price was
$37.0 million
, including legal fees and closing adjustments for normal operating activity. The purchase closed on December 18, 2018. The properties are conveyed as-is, except that until
10
years following the Closing Date, the parties will continue to have certain rights and obligations under the terms of the agreements by which some of the purchased properties were acquired by the Mosing Companies at the time of our initial public offering. We made improvements on the purchased properties during the lease period, and the purchase price was calculated excluding the value of those improvements. As of the purchase close, we no longer lease the acquired properties from the Mosing Companies.
We were a party to certain agreements relating to the rental of aircraft to Western Airways (“WA”), an entity owned by the Mosing family. The WA agreements reflected both dry lease and wet lease rental, whereby we were charged a flat monthly fee primarily for crew, hangar, maintenance and administration costs in addition to other variable costs for fuel and maintenance. We also earned charter income from third party usage through a revenue sharing agreement. We recorded an immaterial amount of charter expense for the year ended December 31, 2018. We recorded net charter
expense
of
$1.1
78
FRANK’S INTERNATIONAL N.V.
NOTES TO CONSOLIDATED FINANCIAL STATEMENTS
million
and
$1.3 million
for the years ended December 31,
2017
and
2016
, respectively. In August 2017, we paid WA a
$0.2 million
commission for brokering the sale of a plane. In December 2017, we sold a plane to Mosing Aviation, LLC, an entity owned by the Mosing family, for
$0.7 million
. The rental agreements were terminated with WA effective December 29, 2017 upon the sale of our last aircraft.
Tax Receivable Agreement
Mosing Holdings and its permitted transferees converted all of their Preferred Stock into shares of our common stock on a
one
-for-one basis on August 26, 2016, subject to customary conversion rate adjustments for stock splits, stock dividends and reclassifications and other similar transactions, by delivery of an equivalent portion of their interests in FICV to us (the “Conversion”). FICV made an election under Section 754 of the Internal Revenue Code. Pursuant to the Section 754 election, the Conversion resulted in an adjustment to the tax basis of the tangible and intangible assets of FICV with respect to the portion of FICV now held by FINV. These adjustments are allocated to FINV. The adjustments to the tax basis of the tangible and intangible assets of FICV described above would not have been available absent this Conversion. The basis adjustments may reduce the amount of tax that FINV would otherwise be required to pay in the future. These basis adjustments may also decrease gains (or increase losses) on future dispositions of certain capital assets to the extent tax basis is allocated to those capital assets.
The TRA that we entered into with FICV and Mosing Holdings in connection with our initial public offering (“IPO”) generally provides for the payment by FINV of
85%
of the amount of the actual reductions, if any, in payments of U.S. federal, state and local income tax or franchise tax (which reductions we refer to as “cash savings”) in periods after our IPO as a result of (i) the tax basis increases resulting from the Conversion and (ii) imputed interest deemed to be paid by us as a result of, and additional tax basis arising from, payments under the TRA. In addition, the TRA provides for payment by us of interest earned from the due date (without extensions) of the corresponding tax return to the date of payment specified by the TRA. The payments under the TRA will not be conditioned upon a holder of rights under the TRA having a continued ownership interest in either FICV or FINV. We will retain the remaining
15%
of cash savings, if any.
The estimation of the liability under the TRA is by its nature imprecise and subject to significant assumptions regarding the amount and timing of future taxable income. As of
December 31, 2018
, FINV has a cumulative loss over the prior
36
month period. Based on this history of losses, as well as uncertainty regarding the timing and amount of future taxable income, we are no longer able to conclude that there will be future cash savings that will lead to additional payouts under the TRA beyond the estimated
$0.2 million
as of
December 31, 2018
. Additional TRA liability may be recognized in the future based on changes in expectations regarding the timing and likelihood of future cash savings.
The payment obligations under the TRA are our obligations and are not obligations of FICV. The term of the TRA will continue until all such tax benefits have been utilized or expired, unless FINV elects to exercise its sole right to terminate the TRA early. If FINV elects to terminate the TRA early, which it may do so in its sole discretion, it would be required to make an immediate payment equal to the present value of the anticipated future tax benefits subject to the TRA (based upon certain assumptions and deemed events set forth in the TRA, including the assumption that it has sufficient taxable income to fully utilize such benefits and that any FICV interests that Mosing Holdings or its transferees own on the termination date are deemed to be exchanged on the termination date). Any early termination payment may be made significantly in advance of the actual realization, if any, of such future benefits. In addition, payments due under the TRA will be similarly accelerated following certain mergers or other changes of control. In these situations, FINV’s obligations under the TRA could have a substantial negative impact on our liquidity and could have the effect of delaying, deferring or preventing certain mergers, asset sales, other forms of business combinations or other changes of control. For example, if the TRA were terminated on
December 31, 2018
, the estimated termination payment would be approximately
$44.6 million
(calculated using a discount rate of
5.87%
). The foregoing number is merely an estimate and the actual payment could differ materially.
Because FINV is a holding company with no operations of its own, its ability to make payments under the TRA is dependent on the ability of FICV to make distributions to it in an amount sufficient to cover FINV’s obligations under such agreements; this ability, in turn, may depend on the ability of FICV’s subsidiaries to provide payments to it. The ability of FICV and its subsidiaries to make such distributions will be subject to, among other things, the applicable provisions of Dutch law that may limit the amount of funds available for distribution and restrictions in our debt instruments. To the
79
FRANK’S INTERNATIONAL N.V.
NOTES TO CONSOLIDATED FINANCIAL STATEMENTS
extent that FINV is unable to make payments under the TRA for any reason, except in the case of an acceleration of payments thereunder occurring in connection with an early termination of the TRA or certain mergers or change of control, such payments will be deferred and will accrue interest until paid, and FINV will be prohibited from paying dividends on its common stock.
Note 14—Loss Per Common Share
Basic loss per common share is determined by dividing net loss by the weighted average number of common shares outstanding during the period. Diluted loss per share is determined by dividing loss attributable to common stockholders by the weighted average number of common shares outstanding, assuming all potentially dilutive shares were issued.
We apply the treasury stock method to determine the dilutive weighted average common shares represented by the unvested restricted stock units and ESPP shares. Through August 26, 2016, the date of the conversion of all of Mosing Holdings' Preferred Stock and Mosing Holdings' transfer of interest in FICV to us, the diluted loss per share calculation assumed the conversion of 100% of our outstanding Preferred Stock on an as if converted basis. Accordingly, the numerator was also adjusted to include the earnings allocated to the noncontrolling interest after taking into account the tax effect of such exchange.
The following table summarizes the basic and diluted loss per share calculations (in thousands, except per share amounts):
|
Year Ended December 31,
|
|||||||||||
|
2018
|
2017
|
2016
|
|||||||||
|
Numerator
|
|||||||||||
|
Net loss
|
$
|
(90,733
|
)
|
$
|
(159,457
|
)
|
$
|
(156,079
|
)
|
||
|
Less: Net loss attributable to noncontrolling interest
|
—
|
|
—
|
|
20,741
|
|
|||||
|
Less: Preferred stock dividends
|
—
|
|
—
|
|
(1
|
)
|
|||||
|
Net loss available to common shareholders
|
$
|
(90,733
|
)
|
$
|
(159,457
|
)
|
$
|
(135,339
|
)
|
||
|
Denominator
|
|||||||||||
|
Basic and diluted weighted average common shares
(1)
|
223,999
|
|
222,940
|
|
176,584
|
|
|||||
|
Loss per common share:
|
|||||||||||
|
Basic and diluted
|
$
|
(0.41
|
)
|
$
|
(0.72
|
)
|
$
|
(0.77
|
)
|
||
|
(1)
|
Approximate number of shares of potentially convertible preferred stock to common stock up until the time of conversion on August 26, 2016, unvested restricted stock units and stock to be issued pursuant to the ESPP have been excluded from the computation of diluted loss per share as the effect would be anti-dilutive when the results from operations are at a net loss.
|
922
|
|
648
|
|
35,556
|
|
|||
Note 15—Stock-Based Compensation
2013 Long-Term Incentive Plan
Under our 2013 Long-Term Incentive Plan (the “LTIP”), stock options, SARs, restricted stock, restricted stock units, dividend equivalent rights and other types of equity and cash incentive awards may be granted to employees, non-employee directors and service providers. The LTIP expires after
10
years, unless prior to that date the maximum number of shares available for issuance under the plan has been issued or our board of directors terminates the plan. There are
20,000,000
shares of common stock reserved for issuance under the LTIP. As of December 31,
2018
,
12,714,143
shares remained available for issuance.
80
FRANK’S INTERNATIONAL N.V.
NOTES TO CONSOLIDATED FINANCIAL STATEMENTS
Restricted Stock Units
Upon completion of the IPO and pursuant to the LTIP, we began granting restricted stock units. Substantially all RSUs granted under the LTIP vest ratably over a period of
one
to
three
years. Our treasury stock consists of shares that were withheld from employees to settle personal tax obligations that arose as a result of restricted stock units that vested. Certain restricted stock unit awards provide for accelerated vesting for qualifying terminations of employment or service.
Employees granted RSUs are not entitled to dividends declared on the underlying shares while the restricted stock unit is unvested. As such, the grant date fair value of the award is measured by reducing the grant date price of our common stock by the present value of the dividends expected to be paid on the underlying shares during the requisite service period, discounted at the appropriate risk-free interest rate. The weighted average grant date fair value of RSUs granted during the years ended December 31,
2018
,
2017
and
2016
was
$9.5 million
,
$12.1 million
and
$11.6 million
, respectively. Compensation expense is recognized ratably over the vesting period. Forfeitures are recorded as they occur.
Stock-based compensation expense relating to RSUs included in general and administrative expenses on the consolidated statements of operations for the years ended December 31,
2018
,
2017
and
2016
was
$8.9 million
,
$12.8 million
and
$15.6 million
, respectively. The total fair value of RSUs vested during the years ended December 31,
2018
,
2017
and
2016
was
$6.7 million
,
$9.9 million
and
$22.6 million
, respectively. Unamortized stock compensation expense as of December 31,
2018
relating to RSUs totaled approximately
$8.6 million
, which will be expensed over a weighted average period of
1.69 years
.
Non-vested RSUs outstanding as of December 31,
2018
and the changes during the year were as follows:
|
Number of
Shares |
Weighted Average
Grant Date Fair Value |
|||||
|
Non-vested at December 31, 2017
|
1,865,300
|
|
$
|
10.55
|
|
|
|
Granted
|
1,507,609
|
|
6.28
|
|
||
|
Vested
|
(1,017,843
|
)
|
10.89
|
|
||
|
Forfeited
|
(166,101
|
)
|
7.73
|
|
||
|
Non-vested at December 31, 2018
|
2,188,965
|
|
$
|
7.66
|
|
|
Performance Restricted Stock Units
The purpose of the PRSUs is to closely align the incentive compensation of the executive leadership team for the duration of the performance cycle with returns to FINV’s shareholders and thereby further motivate the executive leadership team to create sustained value to FINV shareholders. The design of the PRSU grants effectuates this purpose by placing a material amount of incentive compensation for each executive at risk by offering an extraordinary reward for the attainment of extraordinary results. Design features of the PRSU grant that in furtherance of this purpose include the following: (1) The vesting of the PRSUs is based on total shareholder return (“TSR”) based on a comparison to the returns of a peer group. (2) TSR is computed over the entire Performance Period (using a
30
-day averaging period for the first
30
calendar days and the last
30
calendar days of the Performance Period to mitigate the effect of stock price volatility). The TSR calculation will assume reinvestment of dividends. (3) The ultimate number of shares to be issued pursuant to the PRSU awards will vary in proportion to the actual TSR achieved as a percentile compared to the peer group during the Performance Period as follows: (i)
no
shares will be issued if the Company’s performance falls below the
25
th percentile; (ii)
50%
of the Target Level if the Company achieves a rank in the
25
th percentile (the threshold level); (iii)
100%
of the Target Level if the Company achieves a rank in the
50
th percentile (the target level); (iv)
150%
of the Target Level if the Company achieves a rank in the
75
th percentile (the maximum level for the 2016 and 2017 grants); and
200%
of the Target Level if the Company achieves a rank in the
90
th percentile and above (the maximum level for the 2018 grant). (4) Unless there is a qualifying termination as defined in the PRSU award agreement, the PRSU’s of an executive will be forfeited upon an executive’s termination of employment during the Performance Period.
81
FRANK’S INTERNATIONAL N.V.
NOTES TO CONSOLIDATED FINANCIAL STATEMENTS
Though the value of the PRSU grant may change for each participant, the compensation expense recorded by the Company is determined on the date of grant. Expected volatility is based on historical equity volatility of our stock based on
50%
of historical and
50%
of implied volatility weighting commensurate with the expected term of the PRSU. The expected volatility considers factors such as the historical volatility of our share price and our peer group companies, implied volatility of our share price, length of time our shares have been publicly traded, and split- and dividend-adjusted closing stock prices. We assumed
no
forfeiture rate for the PRSUs.
In
2018
, we granted PRSUs with a fair value of
$2.0 million
or
275,550
units (“Target Level”). The performance period for these grants is
three
one
-year periods from January 1, 2018 to December 31, 2018, January 1, 2019 to December 31, 2019 and January 1, 2020 to December 31, 2020 (“Performance Period”).
The weighted average assumptions for the PRSUs granted in
2018
are as follows:
|
2018
|
|
|
Total expected term (in years)
|
2.86
|
|
Expected volatility
|
39.0%
|
|
Risk-free interest rate
|
2.35%
|
|
Correlation range
|
11.0% to 85.7%
|
In
2017
, we granted PRSUs with a fair value of
$2.6 million
or
293,083
units (“Target Level”). The performance period for these grants is a
three
-year period from either January 1, 2017 to December 31, 2019 or September 27, 2017 to September 26, 2020 (“Performance Period”).
The weighted average assumptions for the PRSUs granted in
2017
are as follows:
|
2017
|
|
|
Expected term (in years)
|
2.92
|
|
Expected volatility
|
42.1%
|
|
Risk-free interest rate
|
1.51%
|
|
Correlation range
|
26.8% to 76.0%
|
In
2016
, we granted PRSUs with a fair value of
$2.8 million
or
199,168
units (“Target Level”). The performance period for these grants is a
three
-year period from January 1, 2016 to December 31, 2018 (“Performance Period”).
The weighted average assumptions for the PRSUs granted in
2016
are as follows:
|
2016
|
|
|
Expected term (in years)
|
2.86
|
|
Expected volatility
|
42.7%
|
|
Risk-free interest rate
|
0.88%
|
|
Correlation range
|
24.4% to 71.0%
|
In the event of death or disability, the restrictions related to forfeiture as defined in the performance awards agreement will lapse with respect to
100%
of the PRSUs at the target level effective on the date of such event. In the event of involuntary termination except for cause, the Company will enter into a special vesting agreement with the executive under which the restrictions for forfeiture will not lapse upon such termination. In the event of a termination for any other reason prior to the end of the Performance Period, all PRSUs will be forfeited.
Stock-based compensation expense related to PRSUs included in general and administrative expenses on the consolidated statements of operations for the years ended December 31,
2018
,
2017
and
2016
was
$1.2 million
,
$0.6 million
and
$0.8 million
, respectively. The total fair value of PRSUs vested during the year ended December 31,
2017
was
$0.2
82
FRANK’S INTERNATIONAL N.V.
NOTES TO CONSOLIDATED FINANCIAL STATEMENTS
million
. There were
no
PRSU vestings during the years ended December 31,
2018
and
2016
. Unamortized stock compensation expense as of December 31,
2018
relating to PRSUs totaled approximately
$2.0 million
, which will be expensed over a weighted average period of
1.90
years.
Non-vested PRSUs outstanding as of
December 31, 2018
and the changes during the year were as follows:
|
Number of
Shares |
Weighted Average
Grant Date Fair Value |
|||||
|
Non-vested at December 31, 2017
|
384,245
|
|
$
|
9.01
|
|
|
|
Granted
|
275,550
|
|
7.26
|
|
||
|
Forfeited
|
(65,808
|
)
|
10.20
|
|
||
|
Non-vested at December 31, 2018
|
593,987
|
|
$
|
8.06
|
|
|
Employee Stock Purchase Plan
Under the Frank's International N.V. ESPP, eligible employees have the right to purchase shares of common stock at the lesser of (i)
85%
of the last reported sale price of our common stock on the last trading date immediately preceding the first day of the option period, or (ii)
85%
of the last reported sale price of our common stock on the last trading date immediately preceding the last day of the option period. The ESPP is intended to qualify as an employee stock purchase plan under Section 423 of the Internal Revenue Code. We have reserved
3.0 million
shares of our common stock for issuance under the ESPP, of which
2.5 million
shares were available for issuance as of
December 31, 2018
. Shares issued to our employees under the ESPP totaled
232,592
in
2018
and
155,673
shares in
2017
. For the years ended
December 31, 2018
,
2017
and
2016
, we recognized
$0.5 million
,
$0.4 million
and
$0.3 million
of compensation expense related to stock purchased under the ESPP, respectively.
In
January 2018
, we issued
99,225
shares of our common stock to our employees under this plan to satisfy the employee purchase period from
July 1, 2017
to
December 31, 2017
, which increased our common stock outstanding.
In
July 2018
, we issued
133,367
shares of our common stock to our employees under this plan to satisfy the employee purchase period from
January 1, 2018
to
June 30, 2018
, which increased our common stock outstanding.
Note 16—Employee Benefit Plans
U.S. Benefit Plans
401(k) Savings and Investment Plan
. Frank’s International, LLC administers a 401(k) savings and investment plan (the “Plan”) as part of the employee benefits package. Employees are required to complete
one month
of service before becoming eligible to participate in the Plan. Under the terms of the Plan, we match
100%
of the first
3%
of eligible compensation an employee contributes to the Plan up to the annual allowable IRS limit. Additionally, the Company provides a
50%
match on any employee contributions between
4%
to
6%
of eligible compensation. Our matching contributions to the Plan totaled
$4.5 million
,
$3.7 million
and
$3.8 million
for the
years ended December 31,
2018
,
2017
and
2016
, respectively.
Executive Deferred Compensation Plan
. In December 2004, we and certain affiliates adopted the Frank’s Executive Deferred Compensation Plan (the “EDC Plan”). The purpose of the EDC Plan is to provide participants with an opportunity to defer receipt of a portion of their salary, bonus, and other specified cash compensation. Participant contributions are immediately vested. Our contributions vest after
five
years of service. All participant benefits under this EDC Plan shall be paid directly from the general funds of the applicable participating subsidiary or a grantor trust, commonly referred to as a Rabbi Trust, created for the purpose of informally funding the EDC Plan, and other than such Rabbi Trust, no special or separate fund shall be established and no other segregation of assets shall be made to assure payment. The assets of our EDC Plan’s trust are invested in a corporate owned split-dollar life insurance policy and an amalgamation of mutual funds (See Note 7—Other Assets).
83
FRANK’S INTERNATIONAL N.V.
NOTES TO CONSOLIDATED FINANCIAL STATEMENTS
We recorded compensation expense related to the vesting of the Company’s contribution of
$1.0 million
and
$1.7 million
for the years ended
December 31, 2018
and
2016
, respectively.
No
compensation expense related to the vesting of the Company’s contribution was recorded for the year ended December 31,
2017
. The total liability recorded at
December 31, 2018
and
2017
, related to the EDC Plan was
$23.7 million
and
$26.8 million
, respectively, and was included in other noncurrent liabilities on the consolidated balance sheets.
Note 17—Income Taxes
Loss before income tax expense (benefit) was comprised of the following for the periods indicated (in thousands):
|
Year Ended December 31,
|
|||||||||||
|
2018
|
2017
|
2016
|
|||||||||
|
United States
|
$
|
(85,342
|
)
|
$
|
(167,908
|
)
|
$
|
(128,396
|
)
|
||
|
Foreign
|
(8,341
|
)
|
81,369
|
|
(53,326
|
)
|
|||||
|
Loss before income tax expense (benefit)
|
$
|
(93,683
|
)
|
$
|
(86,539
|
)
|
$
|
(181,722
|
)
|
||
Income taxes have been provided for based upon the tax laws and rates in the countries in which operations are conducted and income is earned. Components of income tax expense (benefit) consist of the following for the periods indicated (in thousands):
|
Year Ended December 31,
|
|||||||||||
|
2018
|
2017
|
2016
|
|||||||||
|
Current
|
|||||||||||
|
U.S. federal
|
$
|
—
|
|
$
|
—
|
|
$
|
(13,389
|
)
|
||
|
U.S. state and local
|
7
|
|
(15
|
)
|
379
|
|
|||||
|
Foreign
|
11,677
|
|
10,516
|
|
14,903
|
|
|||||
|
Total current
|
11,684
|
|
10,501
|
|
1,893
|
|
|||||
|
Deferred
|
|||||||||||
|
U.S. federal
|
—
|
|
56,621
|
|
(25,838
|
)
|
|||||
|
U.S. state and local
|
—
|
|
2,420
|
|
(1,512
|
)
|
|||||
|
Foreign
|
(14,634
|
)
|
3,376
|
|
(186
|
)
|
|||||
|
Total deferred
|
(14,634
|
)
|
62,417
|
|
(27,536
|
)
|
|||||
|
Total income tax expense (benefit)
|
$
|
(2,950
|
)
|
$
|
72,918
|
|
$
|
(25,643
|
)
|
||
For the year ending December 31, 2017, the Company reported, on a provisional basis, the tax impacts resulting from the enactment of the Tax Cuts and Jobs Act (“Tax Act”) on December 22, 2017. During 2018, the Company completed its analysis of the impacts of the Tax Act during the measurement period without further adjustment. The Company has completed the accounting for the impacts of the Tax Act, although adjustments may be necessary in future periods due to technical corrections and/or regulatory guidance that may be issued by the Internal Revenue Service.
84
FRANK’S INTERNATIONAL N.V.
NOTES TO CONSOLIDATED FINANCIAL STATEMENTS
Foreign taxes were incurred in the following regions for the periods indicated (in thousands):
|
Year Ended December 31,
|
|||||||||||
|
2018
|
2017
|
2016
|
|||||||||
|
Latin America
|
$
|
1,261
|
|
$
|
5,469
|
|
$
|
1,159
|
|
||
|
West Africa
|
2,692
|
|
3,243
|
|
3,687
|
|
|||||
|
Middle East
|
2,249
|
|
1,633
|
|
1,880
|
|
|||||
|
Europe
|
461
|
|
1,348
|
|
5,132
|
|
|||||
|
Asia Pacific
|
922
|
|
1,388
|
|
1,364
|
|
|||||
|
Other
|
(10,542
|
)
|
812
|
|
1,495
|
|
|||||
|
Total foreign income tax expense (benefit)
|
$
|
(2,957
|
)
|
$
|
13,893
|
|
$
|
14,717
|
|
||
A reconciliation of the differences between the income tax provision computed at the
21%
U.S. statutory rate in effect at December 31, 2018 and the reported provision for income taxes for the periods indicated is as follows (in thousands):
|
Year Ended December 31,
|
|||||||||||
|
2018
|
2017
|
2016
|
|||||||||
|
Income tax expense (benefit) at statutory rate
|
$
|
(19,673
|
)
|
$
|
(30,289
|
)
|
$
|
(63,603
|
)
|
||
|
Branch profits tax
|
(4,267
|
)
|
(4,871
|
)
|
(3,805
|
)
|
|||||
|
State taxes, net of federal benefit
|
(27
|
)
|
2,405
|
|
(674
|
)
|
|||||
|
Restricted stock units tax shortfall
|
1,025
|
|
1,651
|
|
2,758
|
|
|||||
|
Taxes on foreign earnings at less than the U.S. statutory rate
|
13,095
|
|
(22,464
|
)
|
30,737
|
|
|||||
|
Effect of tax rate change
|
(2,929
|
)
|
23,843
|
|
—
|
|
|||||
|
Effect of moving activity to higher tax rate jurisdiction
|
(14,620
|
)
|
—
|
|
—
|
|
|||||
|
Management fee charged to international operations
|
1,515
|
|
1,213
|
|
—
|
|
|||||
|
Tax effect of TRA derecognition
|
—
|
|
46,874
|
|
—
|
|
|||||
|
Establishment of valuation allowances
|
22,892
|
|
51,911
|
|
2,644
|
|
|||||
|
Return-to-provision adjustments
|
(521
|
)
|
3,551
|
|
(1,130
|
)
|
|||||
|
Noncontrolling interest
|
—
|
|
—
|
|
7,367
|
|
|||||
|
Other
|
560
|
|
(906
|
)
|
63
|
|
|||||
|
Total income tax expense (benefit)
|
$
|
(2,950
|
)
|
$
|
72,918
|
|
$
|
(25,643
|
)
|
||
A reconciliation using the Netherlands statutory rate was not provided as there are no significant operations in the Netherlands.
85
FRANK’S INTERNATIONAL N.V.
NOTES TO CONSOLIDATED FINANCIAL STATEMENTS
Deferred tax assets and liabilities are recorded for the anticipated future tax effects of temporary differences between the financial statement basis and tax basis of our assets and liabilities and are measured using the tax rates and laws expected to be in effect when the differences are projected to reverse. A valuation allowance is recorded when it is not more likely than not that some or all the benefit from the deferred tax asset will be realized. Significant components of deferred tax assets and liabilities are as follows (in thousands):
|
December 31,
|
|||||||
|
2018
|
2017
|
||||||
|
Deferred tax assets
|
|||||||
|
Foreign net operating loss
|
$
|
13,290
|
|
$
|
13,023
|
|
|
|
U.S. net operating loss
|
76,349
|
|
52,289
|
|
|||
|
Research and development credit
|
609
|
|
297
|
|
|||
|
TRA
|
—
|
|
566
|
|
|||
|
Intangibles
|
5,933
|
|
5,935
|
|
|||
|
Inventory
|
2,350
|
|
1,488
|
|
|||
|
Property and equipment
|
14,621
|
|
—
|
|
|||
|
Investment in partnership
|
23,931
|
|
20,248
|
|
|||
|
Other
|
773
|
|
419
|
|
|||
|
Valuation allowance
|
(84,972
|
)
|
(60,524
|
)
|
|||
|
Total deferred tax assets
|
52,884
|
|
33,741
|
|
|||
|
Deferred tax liabilities
|
|||||||
|
Investment in partnership
|
(27,352
|
)
|
(23,594
|
)
|
|||
|
Property and equipment
|
(3,652
|
)
|
(4,293
|
)
|
|||
|
Goodwill
|
(7,259
|
)
|
(5,854
|
)
|
|||
|
Other
|
(221
|
)
|
(229
|
)
|
|||
|
Total deferred liabilities
|
(38,484
|
)
|
(33,970
|
)
|
|||
|
Net deferred tax assets (liabilities)
|
$
|
14,400
|
|
$
|
(229
|
)
|
|
As of December 31, 2018, we have income tax net operating loss (“NOL”) carryforwards related to both our U.S. and foreign operations of approximately $
326.7
million. In addition, we have research and development tax credit carryforwards of approximately $
0.6
million. The ultimate utilization of the NOLs and research and development credits depend on the ability to generate sufficient taxable income in the appropriate tax jurisdiction. These tax attributes expire as follows:
|
Year of Expiration
|
U.S. NOLs
|
Foreign NOLs
|
R&D Credits
|
|||||||||
|
2019 - 2023
|
$
|
—
|
|
$
|
9,022
|
|
$
|
—
|
|
|||
|
2024 - 2028
|
—
|
|
1,901
|
|
—
|
|
||||||
|
2028 - 2038
|
194,381
|
|
208
|
|
609
|
|
||||||
|
Does not expire
|
78,315
|
|
42,852
|
|
—
|
|
||||||
|
$
|
272,696
|
|
$
|
53,983
|
|
$
|
609
|
|
||||
The valuation allowance increased from
$60.5 million
to
$85.0 million
during
2018
as a result of accumulated tax losses in both the U.S. and various foreign tax jurisdictions. We evaluated all available evidence and determined that it is more likely than not that these losses will not be realized.
It is our intention that all cash and earnings of our subsidiaries as of
December 31, 2018
are permanently reinvested and will be used to meet operating cash flow needs. Existing plans do not demonstrate a need to repatriate foreign cash to fund parent company activity, however, should we determine that parent company funding is required, we estimate that any such cash needs may be met without adverse tax consequences.
86
FRANK’S INTERNATIONAL N.V.
NOTES TO CONSOLIDATED FINANCIAL STATEMENTS
As of
December 31, 2018
and
2017
, we had total gross unrecognized tax benefits of
$0.3 million
and
$0.2 million
, respectively. Substantially all of the uncertain tax positions, if recognized in the future, would impact our effective tax rate. We have elected to classify interest and penalties incurred on income taxes as income tax expense.
We file income tax returns in the U.S. and various international tax jurisdictions. As of
December 31, 2018
, our U.S. tax returns remain open to examination for the tax years 2017 through 2018, and the major foreign taxing jurisdictions to which we are subject to tax are open to examination for the tax years 2010 through 2018.
Note 18—Commitments and Contingencies
Commitments
We are committed under various noncancelable operating lease agreements primarily related to facilities and equipment that expire at various dates throughout the next several years. Future minimum lease commitments under noncancelable operating leases with initial or remaining terms of one year or more at
December 31, 2018
, are as follows (in thousands):
|
Year Ending December 31,
|
Amount
|
||
|
2019
|
$
|
10,544
|
|
|
2020
|
9,120
|
|
|
|
2021
|
7,370
|
|
|
|
2022
|
6,006
|
|
|
|
2023
|
4,251
|
|
|
|
Thereafter
|
13,103
|
|
|
|
Total future lease commitments
|
$
|
50,394
|
|
Total rent expense incurred under operating leases was
$16.8 million
,
$18.7 million
, and
$19.1 million
for the years ended
December 31, 2018
,
2017
and
2016
, respectively.
We also have purchase commitments related to inventory in the amount of
$42.2 million
. We enter into purchase commitments as needed.
Contingencies
We are the subject of lawsuits and claims arising in the ordinary course of business from time to time. A liability is accrued when a loss is both probable and can be reasonably estimated. We had no material accruals for loss contingencies, individually or in the aggregate, as of
December 31, 2018
and
December 31, 2017
. We believe the probability is remote that the ultimate outcome of these matters would have a material adverse effect on our financial position, results of operations or cash flows.
We are conducting an internal investigation of the operations of certain of our foreign subsidiaries in West Africa including possible violations of the U.S. Foreign Corrupt Practices Act (“FCPA”), our policies and other applicable laws. In June 2016, we voluntarily disclosed the existence of our extensive internal review to the SEC, the U.S. Department of Justice (“DOJ”) and other governmental entities. It is our intent to continue to fully cooperate with these agencies and any other applicable authorities in connection with any further investigation that may be conducted in connection with this matter. While our review has not indicated that there has been any material impact on our previously filed financial statements, we have continued to collect information and cooperate with the authorities, but at this time are unable to predict the ultimate resolution of these matters with these agencies.
In addition, during the course of the investigation, we discovered historical business transactions (and bids to enter into business transactions) in certain countries that may have been subject to U.S. and other international sanctions. We disclosed this information to the U.S. Department of Commerce’s Bureau of Industry and Security, Office of Export Enforcement (“OEE”) and to the U.S. Department of the Treasury’s Office of Foreign Assets Control (“OFAC”) (as well as to the agencies
87
FRANK’S INTERNATIONAL N.V.
NOTES TO CONSOLIDATED FINANCIAL STATEMENTS
involved in our ongoing investigation discussed above). We received a No Action Letter dated April 20, 2018 from OEE, stating that OEE had closed its investigation without taking further action. In addition, we received a No Action Letter dated April 23, 2018 from OFAC, stating that OFAC had closed its investigation without taking further action.
As disclosed above, our investigation into possible violations of the FCPA remains ongoing, and we will continue to cooperate with the SEC, DOJ and other relevant governmental entities in connection therewith. At this time, we are unable to predict the ultimate resolution of these matters with these agencies, including any financial impact to us. Our board and management are committed to continuously enhancing our internal controls that support improved compliance and transparency throughout our global operations.
Note 19—Severance and Other Charges (Credits), net
We recognize severance and other charges for costs associated with workforce reductions, facility closures, exiting or reducing our footprint in certain countries, inventory impairment and the retirement of excess machinery and equipment based on economic utility. As a result of the downturn in the industry and its impact on our business outlook, we continue to take actions to adjust our operations and cost structure to reflect current and expected activity levels. Depending on future market conditions, further actions may be necessary to adjust our operations, which may result in additional charges.
Our severance and other charges (credits), net are summarized below (in thousands):
|
Year Ended December 31,
|
|||||||||||
|
2018
|
2017
|
2016
|
|||||||||
|
Severance and other costs
|
$
|
4,552
|
|
$
|
2,697
|
|
$
|
16,525
|
|
||
|
Fixed asset retirements and abandonments
|
—
|
|
6,454
|
|
29,881
|
|
|||||
|
Inventory impairment
|
—
|
|
51,181
|
|
—
|
|
|||||
|
Accounts receivable write-off (recovery)
|
(4,862
|
)
|
15,022
|
|
—
|
|
|||||
|
$
|
(310
|
)
|
$
|
75,354
|
|
$
|
46,406
|
|
|||
Severance and other costs
: We incurred costs due to a continued effort to adjust our cost base, including reducing our workforce to meet the depressed demand in the industry.
Fixed asset retirements and abandonments
: During the year ended December 31, 2016, we identified certain equipment that based on specifications and current market conditions no longer had economic utility and therefore had reached the end of its useful life. Accordingly, management decided to retire this equipment, which resulted in charges of
$29.9 million
. During the year ended December 31, 2017, we retired additional equipment prior to the end of its originally estimated useful lives, as well as abandoned capital projects, which resulted in a charge of
$6.5 million
.
Inventory impairment
: During 2017, we determined the cost of our connector inventory exceeded its net realizable value, which resulted in a charge of
$51.2 million
.
Accounts receivable write-off (recovery)
: We have experienced payment delays from certain customers in Nigeria, Angola and Venezuela. During the fourth quarter of 2017 management decided to significantly reduce our footprint in Nigeria and Angola and temporarily cease operations in Venezuela, which we believe will diminish our ability to collect amounts owed. As a result, we wrote off trade accounts receivable of
$15.0 million
during the year ended December 31, 2017. In 2018, we recovered
$4.9 million
of previously written off receivables from a customer in Angola.
88
FRANK’S INTERNATIONAL N.V.
NOTES TO CONSOLIDATED FINANCIAL STATEMENTS
Note 20—Supplemental Cash Flow Information
Supplemental cash flows and non-cash transactions were as follows for the periods indicated (in thousands):
|
Year Ended December 31,
|
|||||||||||
|
2018
|
2017
|
2016
|
|||||||||
|
Cash paid for interest
|
$
|
273
|
|
$
|
296
|
|
$
|
447
|
|
||
|
Cash paid (received) for income taxes, net of refunds
|
1,848
|
|
(20,732
|
)
|
8,754
|
|
|||||
|
Non-cash transactions:
|
|||||||||||
|
Change in accruals related to purchases of property, plant and equipment and intangibles
|
$
|
5,910
|
|
$
|
5,761
|
|
$
|
1,658
|
|
||
|
Insurance premium financed by note payable
|
6,798
|
|
5,125
|
|
—
|
|
|||||
|
Net transfers from inventory to property, plant and equipment
|
4,529
|
|
4,689
|
|
—
|
|
|||||
|
Value of shares issued for Blackhawk Group acquisition
|
—
|
|
—
|
|
144,047
|
|
|||||
|
Conversion of Preferred Stock
|
—
|
|
—
|
|
55,941
|
|
|||||
|
TRA liability
|
—
|
|
—
|
|
124,531
|
|
|||||
|
Deferred tax impact of TRA
|
—
|
|
—
|
|
68,590
|
|
|||||
Note 21—Segment Information
Reporting Segments
Operating segments are defined as components of an enterprise for which separate financial information is available that is regularly evaluated by the chief operating decision maker (“CODM”) in deciding how to allocate resources and assess performance. We are comprised of
four
reportable segments: International Services, U.S. Services, Tubular Sales and Blackhawk.
The International Services segment provides tubular services in international offshore markets and in several onshore international regions. Our customers in these international markets are primarily large exploration and production companies, including integrated oil and gas companies and national oil and gas companies, and other oilfield services companies.
The U.S. Services segment provides tubular services in the active onshore oil and gas drilling regions in the U.S., including the
Permian Basin, Eagle Ford Shale, Haynesville Shale, Marcellus/Utica Shale, Niobrara Shale, Woodford Shale, Green River Basin and Uintah Basin, as well as in the U.S. Gulf of Mexico.
The Tubular Sales segment designs, manufactures and distributes large outside diameter (
“
OD
”
) pipe, connectors and casing attachments
and sells large OD pipe originally manufactured by various pipe mills.
We also provide specialized fabrication and welding services in support of offshore projects, including drilling and production risers, flowlines and pipeline end terminations, as well as long length tubulars (up to
300
feet in length) for use as caissons or pilings.
This segment also designs and manufactures proprietary equipment for use in our International and U.S. Services segments.
The Blackhawk segment provides well construction and well intervention services and products, in addition to cementing tool expertise, in the U.S. and Mexican Gulf of Mexico, onshore U.S. and other select international locations. Blackhawk’s customer base consists primarily of major and independent oil and gas companies as well as other oilfield services companies.
89
FRANK’S INTERNATIONAL N.V.
NOTES TO CONSOLIDATED FINANCIAL STATEMENTS
Revenues
We disaggregate our revenue from contracts with customers by geography for each of our segments, as we believe this best depicts how the nature, amount, timing and uncertainty of our revenue and cash flows are affected by economic factors.
The following tables presents our revenues disaggregated by geography based on the location where our services were provided and products sold (in thousands):
|
Year Ended December 31, 2018
|
|||||||||||||||||||
|
International Services
|
U.S. Services
|
Tubular Sales
|
Blackhawk
|
Consolidated
|
|||||||||||||||
|
United States
|
$
|
—
|
|
$
|
148,941
|
|
$
|
59,338
|
|
$
|
72,316
|
|
$
|
280,595
|
|
||||
|
International
|
222,992
|
|
—
|
|
2,077
|
|
16,829
|
|
241,898
|
|
|||||||||
|
Total Revenues
|
$
|
222,992
|
|
$
|
148,941
|
|
$
|
61,415
|
|
$
|
89,145
|
|
$
|
522,493
|
|
||||
|
Year Ended December 31, 2017
|
|||||||||||||||||||
|
International Services
|
U.S. Services
|
Tubular Sales
|
Blackhawk
|
Consolidated
|
|||||||||||||||
|
United States
|
$
|
—
|
|
$
|
118,815
|
|
$
|
55,862
|
|
$
|
70,007
|
|
$
|
244,684
|
|
||||
|
International
|
206,746
|
|
—
|
|
2,348
|
|
1,017
|
|
210,111
|
|
|||||||||
|
Total Revenues
|
$
|
206,746
|
|
$
|
118,815
|
|
$
|
58,210
|
|
$
|
71,024
|
|
$
|
454,795
|
|
||||
|
Year Ended December 31, 2016
|
|||||||||||||||||||
|
International Services
|
U.S. Services
|
Tubular Sales
|
Blackhawk
|
Consolidated
|
|||||||||||||||
|
United States
|
$
|
—
|
|
$
|
152,827
|
|
$
|
85,055
|
|
$
|
9,982
|
|
$
|
247,864
|
|
||||
|
International
|
237,207
|
|
—
|
|
2,460
|
|
—
|
|
239,667
|
|
|||||||||
|
Total Revenues
|
$
|
237,207
|
|
$
|
152,827
|
|
$
|
87,515
|
|
$
|
9,982
|
|
$
|
487,531
|
|
||||
Revenue by geographic area was as follows (in thousands):
|
Year Ended
|
||||||||||||
|
December 31,
|
||||||||||||
|
2018
|
2017
|
2016
|
||||||||||
|
United States
|
$
|
280,595
|
|
$
|
244,684
|
|
$
|
247,864
|
|
|||
|
Europe/Middle East/Africa
|
135,786
|
|
138,304
|
|
160,651
|
|
||||||
|
Latin America
|
46,553
|
|
33,131
|
|
35,390
|
|
||||||
|
Asia Pacific
|
27,509
|
|
20,573
|
|
30,325
|
|
||||||
|
Other countries
|
32,050
|
|
18,103
|
|
13,301
|
|
||||||
|
Total Revenues
|
$
|
522,493
|
|
$
|
454,795
|
|
$
|
487,531
|
|
|||
We are a Netherlands based company and we derive our revenue from services and product sales to clients primarily in the oil and gas industry.
No
single customer accounted for more than
10%
of our revenue for the year ended
December 31, 2018
. For the years ended December 31,
2017
and
2016
,
one
customer accounted for
10%
and
13%
of our revenues, respectively. In both years, all
four
of our segments generated revenue from this customer.
The revenue generated in the Netherlands was immaterial for the years ended
December 31, 2018
,
2017
and
2016
. Other than the United States,
no
individual country represented more than
10%
of our revenue for the years ended
December 31, 2018
,
2017
and
2016
.
90
FRANK’S INTERNATIONAL N.V.
NOTES TO CONSOLIDATED FINANCIAL STATEMENTS
Adjusted EBITDA
We define Adjusted EBITDA as net income (loss) before interest income, net, depreciation and amortization, income tax benefit or expense, asset impairments, gain or loss on disposal of assets, foreign currency gain or loss, equity-based compensation, unrealized and realized gain or loss, the effects of the TRA, other non-cash adjustments and other charges or credits.
We review Adjusted EBITDA on both a consolidated basis and on a segment basis. We use Adjusted EBITDA to assess our financial performance because it allows us to compare our operating performance on a consistent basis across periods by removing the effects of our capital structure (such as varying levels of interest expense), asset base (such as depreciation and amortization), income tax, foreign currency exchange rates and other charges and credits. Adjusted EBITDA has limitations as an analytical tool and should not be considered as an alternative to net income (loss), operating income (loss), cash flow from operating activities or any other measure of financial performance presented in accordance with GAAP.
Our CODM uses Adjusted EBITDA as the primary measure of segment reporting performance.
The following table presents a reconciliation of Segment Adjusted EBITDA to net loss (in thousands):
|
Year Ended December 31,
|
|||||||||||
|
2018
|
2017
|
2016
|
|||||||||
|
Segment Adjusted EBITDA:
|
|||||||||||
|
International Services
|
$
|
35,498
|
|
$
|
30,801
|
|
$
|
33,264
|
|
||
|
U.S. Services
(1)
|
(18,115
|
)
|
(39,357
|
)
|
(11,012
|
)
|
|||||
|
Tubular Sales
|
3,153
|
|
3,181
|
|
1,741
|
|
|||||
|
Blackhawk
|
12,696
|
|
11,090
|
|
1,038
|
|
|||||
|
Total
|
33,232
|
|
5,715
|
|
25,031
|
|
|||||
|
Interest income, net
|
4,243
|
|
2,309
|
|
2,073
|
|
|||||
|
Income tax (expense) benefit
|
2,950
|
|
(72,918
|
)
|
25,643
|
|
|||||
|
Depreciation and amortization
|
(111,292
|
)
|
(122,102
|
)
|
(114,215
|
)
|
|||||
|
Gain (loss) on disposal of assets
|
1,309
|
|
2,045
|
|
(1,117
|
)
|
|||||
|
Foreign currency gain (loss)
|
(5,675
|
)
|
2,075
|
|
(10,819
|
)
|
|||||
|
TRA related adjustments
(2)
|
(1,359
|
)
|
122,515
|
|
—
|
|
|||||
|
Charges and credits
(3)
|
(14,141
|
)
|
(99,096
|
)
|
(82,675
|
)
|
|||||
|
Net loss
|
$
|
(90,733
|
)
|
$
|
(159,457
|
)
|
$
|
(156,079
|
)
|
||
|
(1)
|
Includes all corporate general and administrative expenses.
|
|
(2)
|
Please see Note 13—Related Party Transactions for further discussion.
|
|
(3)
|
Comprised of Equity-based compensation expense (2018:
$10,621
; 2017:
$13,862
; 2016:
$15,978
), Mergers and acquisition expense (2018:
$58
; 2017:
$459
; 2016:
$13,784
), Severance and other (charges) credits (2018:
$310
; 2017:
$(75,354)
; 2016:
$(46,406)
), Unrealized and realized gains (losses) (2018:
$1,682
; 2017:
$(2,791)
; 2016:
$(110)
), Investigation-related matters (2018:
$5,454
; 2017:
$6,143
; 2016: $
6,397
) and Other adjustments (2018:
none
; 2017:
$487
; 2016:
none
).
|
91
FRANK’S INTERNATIONAL N.V.
NOTES TO CONSOLIDATED FINANCIAL STATEMENTS
The following table sets forth certain financial information with respect to our reportable segments (in thousands):
|
International
Services
|
U.S.
Services
|
Tubular Sales
|
Blackhawk
|
Eliminations
|
Total
|
||||||||||||||||||
|
Year Ended December 31, 2018
|
|||||||||||||||||||||||
|
Revenue from external customers
|
$
|
222,992
|
|
$
|
148,941
|
|
$
|
61,415
|
|
$
|
89,145
|
|
$
|
—
|
|
$
|
522,493
|
|
|||||
|
Inter-segment revenues
|
(222
|
)
|
17,821
|
|
1,695
|
|
3,387
|
|
(22,681
|
)
|
—
|
|
|||||||||||
|
Operating income (loss)
|
(15,328
|
)
|
(71,824
|
)
|
442
|
|
(6,171
|
)
|
—
|
|
(92,881
|
)
|
|||||||||||
|
Adjusted EBITDA
|
35,498
|
|
(18,115
|
)
|
3,153
|
|
12,696
|
|
—
|
|
*
|
||||||||||||
|
Depreciation and amortization
|
54,450
|
|
37,100
|
|
2,481
|
|
17,261
|
|
—
|
|
111,292
|
|
|||||||||||
|
Property, plant and equipment
|
143,424
|
|
168,372
|
|
75,259
|
|
29,435
|
|
—
|
|
416,490
|
|
|||||||||||
|
Purchases of property, plant and equipment and intangibles
|
1,864
|
|
35,206
|
|
12,668
|
|
6,733
|
|
—
|
|
56,471
|
|
|||||||||||
|
Year Ended December 31, 2017
|
|||||||||||||||||||||||
|
Revenue from external customers
|
$
|
206,746
|
|
$
|
118,815
|
|
$
|
58,210
|
|
$
|
71,024
|
|
$
|
—
|
|
$
|
454,795
|
|
|||||
|
Inter-segment revenues
|
23
|
|
17,071
|
|
14,132
|
|
129
|
|
(31,355
|
)
|
—
|
|
|||||||||||
|
Operating loss
|
(44,199
|
)
|
(101,602
|
)
|
(51,397
|
)
|
(17,544
|
)
|
—
|
|
(214,742
|
)
|
|||||||||||
|
Adjusted EBITDA
|
30,801
|
|
(39,357
|
)
|
3,181
|
|
11,090
|
|
—
|
|
*
|
||||||||||||
|
Depreciation and amortization
|
54,873
|
|
38,151
|
|
3,697
|
|
25,381
|
|
—
|
|
122,102
|
|
|||||||||||
|
Property, plant and equipment
|
197,305
|
|
173,501
|
|
66,153
|
|
32,687
|
|
—
|
|
469,646
|
|
|||||||||||
|
Purchases of property, plant and equipment and intangibles
|
7,042
|
|
9,618
|
|
268
|
|
5,062
|
|
—
|
|
21,990
|
|
|||||||||||
|
Year Ended December 31, 2016
|
|||||||||||||||||||||||
|
Revenue from external customers
|
$
|
237,207
|
|
$
|
152,827
|
|
$
|
87,515
|
|
$
|
9,982
|
|
$
|
—
|
|
$
|
487,531
|
|
|||||
|
Inter-segment revenues
|
68
|
|
19,590
|
|
19,456
|
|
—
|
|
(39,114
|
)
|
—
|
|
|||||||||||
|
Operating loss
|
(41,668
|
)
|
(116,603
|
)
|
(2,884
|
)
|
(2,207
|
)
|
—
|
|
(163,362
|
)
|
|||||||||||
|
Adjusted EBITDA
|
33,264
|
|
(11,012
|
)
|
1,741
|
|
1,038
|
|
—
|
|
*
|
||||||||||||
|
Depreciation and amortization
|
59,435
|
|
47,438
|
|
4,087
|
|
3,255
|
|
—
|
|
114,215
|
|
|||||||||||
|
Property, plant and equipment
|
247,913
|
|
201,772
|
|
73,316
|
|
44,023
|
|
—
|
|
567,024
|
|
|||||||||||
|
Purchases of property, plant and equipment and intangibles
|
23,461
|
|
18,112
|
|
540
|
|
14
|
|
—
|
|
42,127
|
|
|||||||||||
* Non-GAAP financial measure not disclosed.
The CODM does not review total assets by segment as part of the financial information provided; therefore, no asset information is provided in the above table.
|
December 31,
|
|||||||
|
2018
|
2017
|
||||||
|
Long-Lived Assets (PP&E)
|
|||||||
|
United States
|
$
|
272,476
|
|
$
|
272,342
|
|
|
|
International
|
144,014
|
|
197,304
|
|
|||
|
$
|
416,490
|
|
$
|
469,646
|
|
||
Based on the unique nature of our operating structure, revenue generating assets are interchangeable between two categories: (i) offshore and (ii) onshore. In addition, some onshore assets can only be used in the U.S. based upon certification. Long-lived assets in the Netherlands were insignificant in each of the years presented.
92
FRANK’S INTERNATIONAL N.V.
NOTES TO CONSOLIDATED FINANCIAL STATEMENTS
Note 22—Quarterly Financial Data (Unaudited)
Summarized quarterly financial data for the years ended
December 31, 2018
and
2017
is set forth below (in thousands, except per share data).
|
First
|
Second
|
Third
|
Fourth
|
||||||||||||||||
|
Quarter
|
Quarter
|
Quarter
|
Quarter
|
Total
|
|||||||||||||||
|
2018
|
|||||||||||||||||||
|
Revenue
|
$
|
115,569
|
|
$
|
132,085
|
|
$
|
128,986
|
|
$
|
145,853
|
|
$
|
522,493
|
|
||||
|
Gross profit
(1)
|
8,896
|
|
21,331
|
|
20,204
|
|
24,311
|
|
74,742
|
|
|||||||||
|
Operating loss
|
(34,907
|
)
|
(23,782
|
)
|
(13,591
|
)
|
(20,601
|
)
|
(92,881
|
)
|
|||||||||
|
Net loss
|
(42,073
|
)
|
(25,763
|
)
|
(6,999
|
)
|
(15,898
|
)
|
(90,733
|
)
|
|||||||||
|
Loss per common share:
(4)
|
|||||||||||||||||||
|
Basic and diluted
|
$
|
(0.19
|
)
|
$
|
(0.12
|
)
|
$
|
(0.03
|
)
|
$
|
(0.07
|
)
|
$
|
(0.41
|
)
|
||||
|
2017
|
|||||||||||||||||||
|
Revenue
|
$
|
110,731
|
|
$
|
117,659
|
|
$
|
108,083
|
|
$
|
118,322
|
|
$
|
454,795
|
|
||||
|
Gross profit
(1)
|
8,827
|
|
11,811
|
|
9,411
|
|
7,141
|
|
37,190
|
|
|||||||||
|
Operating loss
(2)
|
(36,610
|
)
|
(33,966
|
)
|
(35,080
|
)
|
(109,086
|
)
|
(214,742
|
)
|
|||||||||
|
Net income (loss)
(3)
|
(26,663
|
)
|
(25,950
|
)
|
2,296
|
|
(109,140
|
)
|
(159,457
|
)
|
|||||||||
|
Income (loss) per common share:
(4)
|
|||||||||||||||||||
|
Basic and diluted
|
$
|
(0.12
|
)
|
$
|
(0.12
|
)
|
$
|
0.01
|
|
$
|
(0.49
|
)
|
$
|
(0.72
|
)
|
||||
|
(1)
|
Gross profit is defined as total revenue less cost of revenues less depreciation and amortization attributed to cost of revenues.
|
|
(2)
|
Fourth quarter includes inventory impairments of
$51.2 million
and accounts receivable write-offs of
$15.0 million
. Please see Note 19—Severance and Other Charges (Credits), net in these Notes to Consolidated Financial Statements.
|
|
(3)
|
Third quarter includes the impact of the derecognition of the TRA liability. Please see Note 13—Related Party Transactions in these Notes to Consolidated Financial Statements.
|
|
(4)
|
The sum of the individual quarterly income (losses) per share amounts may not agree with year-to-date net income (loss) per common share as each quarterly computation is based on the weighted average number of common shares outstanding during that period.
|
93
Item 9.
Changes in and Disagreements with Accountants on Accounting and Financial Disclosure
None.
Item 9A.
Controls and Procedures
Evaluation of Disclosure Controls and Procedures
As required by Rule 13a-15(b) of the Exchange Act, we have evaluated, under the supervision and with the participation of our management, including our principal executive officer and principal financial officer, the effectiveness of the design and operation of our disclosure controls and procedures (as defined in Rules 13a-15(e) and 15d-15(e) under the Exchange Act) as of the end of the period covered by this Form 10-K. Our disclosure controls and procedures are designed to provide reasonable assurance that the information required to be disclosed by us in reports that we submit under the Exchange Act is accumulated and communicated to our management, including our principal executive officer and principal financial officer, as appropriate, to allow timely decisions regarding required disclosure, and such information is recorded, processed, summarized and reported within the time periods specified in the rules and forms of the SEC. Based upon the evaluation, our principal executive officer and principal financial officer have concluded that our disclosure controls and procedures were effective as of
December 31, 2018
at the reasonable assurance level.
Management’s Report Regarding Internal Control
See
Management’s Report on Internal Control Over Financial Reporting
under Part II, Item 8, “Financial Statements and Supplementary Data” of this Form 10-K.
Attestation Report of the Registered Public Accounting Firm
See
Report of Independent Registered Public Accounting Firm
under Part II, Item 8, “Financial Statements and Supplementary Data” of this Form 10-K.
Changes in Control Over Financial Reporting
There have been no changes in our internal control over financial reporting that occurred during the quarter ended
December 31, 2018
, that have materially affected, or are reasonably likely to materially affect, our internal control over financial reporting.
Item 9B.
Other Information
None.
94
PART III
Item 10. Directors, Executive Officers, and Corporate Governance
Item 10 is incorporated by reference to our definitive proxy statement to be filed pursuant to Regulation 14A under the Exchange Act. We expect to file the definitive proxy statement with the SEC within 120 days after December 31,
2018
.
Item 11. Executive Compensation
Item 11 is incorporated by reference to our definitive proxy statement to be filed pursuant to Regulation 14A under the Exchange Act. We expect to file the definitive proxy statement with the SEC within 120 days after December 31,
2018
.
Item 12. Security Ownership of Certain Beneficial Owners and Management and Related Stockholder Matters
Item 12 is incorporated by reference to our definitive proxy statement to be filed pursuant to Regulation 14A under the Exchange Act. We expect to file the definitive proxy statement with the SEC within 120 days after December 31,
2018
.
Item 13. Certain Relationships and Related Transactions, and Director Independence
Item 13 is incorporated by reference to our definitive proxy statement to be filed pursuant to Regulation 14A under the Exchange Act. We expect to file the definitive proxy statement with the SEC within 120 days after December 31,
2018
.
Item 14. Principal Accounting Fees and Services
Item 14 is incorporated by reference to our definitive proxy statement to be filed pursuant to Regulation 14A under the Exchange Act. We expect to file the definitive proxy statement with the SEC within 120 days after December 31,
2018
.
95
PART IV
Item 15.
Exhibits and Financial Statement Schedules
(a)(1) Financial Statements
Our Consolidated Financial Statements are included under Part II, Item 8, “Financial Statements and Supplementary Data” of this Form 10-K. For a listing of these statements and accompanying footnotes, see “Index to Consolidated Financial Statements” at page 52.
(a)(2) Financial Statement Schedules
Schedule II - Valuation and Qualifying Accounts
Financial statement schedules are listed on page 101. Schedules not listed above have been omitted because they are not applicable or not required or the information required to be set forth therein is included in Item 8, “Financial Statements and Supplementary Data” or notes thereto.
(a)(3) Exhibits
The following exhibits are filed or furnished with this Report or incorporated by reference:
|
3.1
|
|
|
*10.1
|
|
|
*10.2
|
|
|
*10.3
|
|
|
†10.4
|
|
|
†10.5
|
|
|
†10.6
|
|
|
†10.7
|
|
96
|
†10.8
|
|
|
†10.9
|
|
|
†10.10
|
|
|
†10.11
|
|
|
†10.12
|
|
|
†10.13
|
|
|
†10.14
|
|
|
†10.15
|
|
|
†10.16
|
|
|
†10.17
|
|
|
†10.18
|
|
|
*†10.19
|
|
|
†10.20
|
|
|
†10.21
|
|
|
†10.22
|
|
|
†10.23
|
|
|
†10.24
|
|
|
†10.25
|
|
97
|
†10.26
|
|
|
†10.27
|
|
|
*†10.28
|
|
|
†10.29
|
|
|
†10.30
|
|
|
†10.31
|
|
|
†10.32
|
|
|
†10.33
|
|
|
†10.34
|
|
|
†10.35
|
|
|
†10.36
|
|
|
†10.37
|
|
|
†10.38
|
|
|
†10.39
|
|
|
†10.40
|
|
|
†10.41
|
|
|
†10.42
|
|
|
†10.43
|
|
98
|
†10.44
|
|
|
†10.45
|
|
|
†10.46
|
|
|
†10.47
|
|
|
†10.48
|
|
|
†10.49
|
|
|
†10.50
|
|
|
†10.51
|
|
|
*†10.52
|
|
|
†10.53
|
|
|
*†10.54
|
|
|
†10.55
|
|
|
10.56
|
|
|
10.57
|
|
|
10.58
|
|
|
10.59
|
|
|
10.60
|
|
|
10.61
|
|
99
|
†10.62
|
|
|
*21.1
|
|
|
*23.1
|
|
|
*23.2
|
|
|
*31.1
|
|
|
*31.2
|
|
|
**32.1
|
|
|
**32.2
|
|
|
*101.INS
|
XBRL Instance Document.
|
|
*101.SCH
|
XBRL Taxonomy Extension Schema Document.
|
|
*101.CAL
|
XBRL Taxonomy Calculation Linkbase Document.
|
|
*101.DEF
|
XBRL Taxonomy Definition Linkbase Document.
|
|
*101.LAB
|
XBRL Taxonomy Extension Label Linkbase Document.
|
|
*101.PRE
|
XBRL Taxonomy Extension Presentation Linkbase Document.
|
|
†
|
Represents management contract or compensatory plan or arrangement.
|
|
*
|
Filed herewith.
|
|
**
|
Furnished herewith.
|
Item 16.
Form 10-K Summary
None
.
100
|
FRANK’S INTERNATIONAL N.V.
|
|||||||||||||||||||
|
Schedule II - Valuation and Qualifying Accounts
|
|||||||||||||||||||
|
(In thousands)
|
|||||||||||||||||||
|
Balance at
Beginning of
Period
|
Additions /
Charged to
Expense
|
Deductions
|
Other
|
Balance at
End of
Period
|
|||||||||||||||
|
Year Ended December 31, 2018
|
|||||||||||||||||||
|
Allowance for doubtful accounts
|
$
|
4,777
|
|
$
|
348
|
|
$
|
(1,200
|
)
|
$
|
—
|
|
$
|
3,925
|
|
||||
|
Allowance for excess and obsolete inventory
|
21,584
|
|
1,800
|
|
(760
|
)
|
—
|
|
22,624
|
|
|||||||||
|
Allowance for deferred tax assets
|
60,524
|
|
24,448
|
|
—
|
|
—
|
|
84,972
|
|
|||||||||
|
Year Ended December 31, 2017
|
|||||||||||||||||||
|
Allowance for doubtful accounts
|
$
|
14,337
|
|
$
|
346
|
|
$
|
(9,725
|
)
|
$
|
(181
|
)
|
$
|
4,777
|
|
||||
|
Allowance for excess and obsolete inventory
|
4,626
|
|
19,727
|
|
(2,769
|
)
|
—
|
|
21,584
|
|
|||||||||
|
Allowance for deferred tax assets
|
5,442
|
|
56,207
|
|
(1,125
|
)
|
—
|
|
60,524
|
|
|||||||||
|
Year Ended December 31, 2016
|
|||||||||||||||||||
|
Allowance for doubtful accounts
|
$
|
2,528
|
|
$
|
10,374
|
|
$
|
(761
|
)
|
$
|
2,196
|
|
$
|
14,337
|
|
||||
|
Allowance for excess and obsolete inventory
(1)
|
2,200
|
|
1,762
|
|
(1,855
|
)
|
2,519
|
|
4,626
|
|
|||||||||
|
Allowance for deferred tax assets
|
2,798
|
|
2,644
|
|
—
|
|
—
|
|
5,442
|
|
|||||||||
|
(1)
|
“Other” includes allowances acquired through business combinations and reductions in the allowance credited to expense.
|
101
SIGNATURES
Pursuant to the requirements of the Securities Exchange Act of 1934, the registrant has duly caused this report to be signed on its behalf by the undersigned, thereunto duly authorized.
|
By:
|
Frank’s International N.V.
|
|||
|
(Registrant)
|
||||
|
Date:
|
February 25, 2019
|
By:
|
/s/ Kyle McClure
|
|
|
Kyle McClure
|
||||
|
Chief Financial Officer
|
||||
Pursuant to the requirements of the Securities Exchange Act of 1934, this report has been signed below by the following persons on behalf of the registrant and in the capacities indicated on
February 25, 2019
.
|
Signature
|
Title
|
|
|
/s/ Michael C. Kearney
|
Chairman, President and Chief Executive Officer
|
|
|
Michael C. Kearney
|
(Principal Executive Officer)
|
|
|
/s/ Kyle McClure
|
Senior Vice President and Chief Financial Officer
|
|
|
Kyle McClure
|
(Principal Financial Officer)
|
|
|
/s/ Darren C. Miles
|
Chief Accounting Officer and Vice President - Tax
|
|
|
Darren C. Miles
|
(Principal Accounting Officer)
|
|
|
/s/ William B. Berry
|
Supervisory Lead Director
|
|
|
William B. Berry
|
||
|
/s/ Robert W. Drummond
|
Supervisory Director
|
|
|
Robert W. Drummond
|
||
|
/s/ Michael E. McMahon
|
Supervisory Director
|
|
|
Michael E. McMahon
|
||
|
/s/ D. Keith Mosing
|
Supervisory Director
|
|
|
D. Keith Mosing
|
||
|
/s/ Kirkland D. Mosing
|
Supervisory Director
|
|
|
Kirkland D. Mosing
|
||
|
/s/ S. Brent Mosing
|
Supervisory Director
|
|
|
S. Brent Mosing
|
||
|
/s/ Melanie M. Trent
|
Supervisory Director
|
|
|
Melanie M. Trent
|
||
|
/s/ Alexander Vriesendorp
|
Supervisory Director
|
|
|
Alexander Vriesendorp
|
||
102
TABLE OF CONTENTS
Part IItem 1. BusinessItem 1A. Risk FactorsItem 1B. Unresolved Staff CommentsItem 2. PropertiesItem 3. Legal ProceedingsItem 4. Mine Safety DisclosuresPart IIItem 5. Market For The Registrant S Common Equity, Related Stockholder Matters and Issuer Purchases Of Equity SecuritiesItem 6. Selected Financial DataItem 7. Management S Discussion and Analysis Of Financial Condition and Results Of OperationItem 7A. Quantitative and Qualitative Disclosures About Market RiskItem 8. Financial Statements and Supplementary DataNote 1 Basis Of Presentation and Significant Accounting PoliciesNote 2 Noncontrolling InterestNote 3 Acquisitions and DivestituresNote 4 Accounts Receivable, NetNote 5 Inventories, NetNote 6 Property, Plant and EquipmentNote 7 Other AssetsNote 8 Accounts Payable and Accrued LiabilitiesNote 9 DebtNote 10 Fair Value MeasurementsNote 11 DerivativesNote 12 Preferred StockNote 13 Related Party TransactionsNote 14 Loss Per Common ShareNote 15 Stock-based CompensationNote 16 Employee Benefit PlansNote 17 Income TaxesNote 18 Commitments and ContingenciesNote 19 Severance and Other Charges (credits), NetNote 20 Supplemental Cash Flow InformationNote 21 Segment InformationNote 22 Quarterly Financial Data (unaudited)Item 9. Changes in and Disagreements with Accountants on Accounting and Financial DisclosureItem 9A. Controls and ProceduresItem 9B. Other InformationPart IIIItem 10. Directors, Executive Officers, and Corporate GovernanceItem 11. Executive CompensationItem 12. Security Ownership Of Certain Beneficial Owners and Management and Related Stockholder MattersItem 13. Certain Relationships and Related Transactions, and Director IndependenceItem 14. Principal Accounting Fees and ServicesPart IVItem 15. Exhibits and Financial Statement SchedulesItem 16. Form 10-k Summary