FIRST INTERSTATE BANCSYSTEM INC
10-Ks and 10-Qs
|
|
|
|
|
|
|
|
|
|
|
|
|
|
|
|
|
|
|
|
|
|
|
|
|
|
|
|
|
|
|
|
|
|
|
|
|
|
|
|
|
|
|
|
|
|
|
|
|
|
|
|
|
UNITED STATES SECURITIES AND EXCHANGE COMMISSION
Washington D.C. 20549
FORM 10-K
(Mark One)
|
þ
|
Annual Report Pursuant to Section 13 or 15(d) of the Securities Exchange Act of 1934
|
For the fiscal year ended
December 31, 2018
or
|
o
|
Transition Report Pursuant to Section 13 or 15(d) of the Securities Exchange Act of 1934
|
For the transition period from
to
.
Commission File Number: 001-34653
FIRST INTERSTATE BANCSYSTEM, INC.
(Exact name of registrant as specified in its charter)
|
Montana
(State or other jurisdiction of incorporation or organization)
|
|
81-0331430
(IRS Employer Identification No.)
|
|
401 North 31st Street
Billings, Montana
(Address of principal executive offices)
|
|
59116
(Zip Code)
|
(406) 255-5390
(Registrant’s telephone number, including area code)
Securities registered pursuant to Section 12(b) of the Act:
|
Class A common stock
(Title of each class)
|
|
NASDAQ Stock Market
(Name of each exchange on which registered)
|
Securities registered pursuant to Section 12(g) of the Act:
Class B common stock
(Title of class)
Indicate by check mark if the registrant is a well-known seasoned issuer, as defined in Rule 405 of the Securities Act.
o
Yes
þ
No
Indicate by check mark if the registrant is not required to file reports pursuant to Section 13 or Section 15(d) of the Act.
o
Yes
þ
No
Indicate by check mark whether the registrant: (1) has filed all reports required to be filed by Section 13 or 15(d) of the Securities Exchange Act of 1934 during the preceding 12 months (or for such shorter period that the registrant was required to file such reports), and (2) has been subject to such filing requirements for the past 90 days.
þ
Yes
o
No
Indicate by check mark whether the registrant has submitted electronically every Interactive Data File required to be submitted pursuant to Rule 405 of Regulation S-T (§223.405 of this chapter) during the preceding 12 months (or for such shorter period that registrant was required to submit such files).
þ
Yes
o
No
Indicate by check mark if disclosure of delinquent filers pursuant to Item 405 of Regulation S-K is not contained herein, and will not be contained, to the best of the registrant’s knowledge, in definitive proxy or information statements incorporated by reference in Part III of this Form 10-K or any amendment to this Form 10-K.
o
Indicate by check mark whether the registrant is a large accelerated filer, an accelerated filer, a non-accelerated filer, a smaller reporting company, or an emerging growth company. See the definitions of “large accelerated filer,” “accelerated filer,” “smaller reporting company” and “emerging growth company” in Rule 12b-2 of the Exchange Act. (Check one):
|
þ
Large accelerated filer
|
o
Accelerated filer
|
o
Non-accelerated filer
(Do not check if a smaller reporting company)
|
o
Smaller reporting company
|
|
o
Emerging growth company
|
|||
If an emerging growth company, indicate by check mark if the registrant has elected not to use the extended transition period for complying with any new or revised financial accounting standards provided pursuant to Section 13(a) of the Exchange Act.
o
Indicate by check mark if the registrant is a shell company (as defined in Rule 12b-2 of the Act.)
o
Yes
þ
No
The aggregate market value of voting and non-voting common equity held by non-affiliates, computed by reference to the price at which the common equity was last sold, based upon the closing price per share of the registrant’s common stock as reported on the NASDAQ, as of the last business day of the registrant’s most recently completed second fiscal quarter, was
$1,544,721,547
.
Indicate the number of shares outstanding of each of the registrant’s classes of common stock as of
January 31, 2019
:
|
Class A common stock
|
38,179,174
|
|
|
Class B common stock
|
22,451,963
|
|
Documents Incorporated by Reference
The registrant intends to file a definitive Proxy Statement for the Annual Meeting of Shareholders scheduled to be held
May 2, 2019
. The information required by Part III of this Form 10-K is incorporated by reference to such Proxy Statement.
|
FIRST INTERSTATE BANCSYSTEM, INC. AND SUBSIDIARIES
|
||
|
Index
|
||
|
December 31, 2018
|
||
|
Page Nos.
|
||
|
Item 1
|
||
|
Item 1A
|
||
|
Item 1B
|
||
|
Item 2
|
||
|
Item 3
|
||
|
Item 4
|
||
|
Item 5
|
||
|
Item 6
|
||
|
Item 7
|
||
|
Item 7A
|
||
|
Item 8
|
||
|
Item 9
|
||
|
Item 9A
|
||
|
Item 9B
|
||
|
Item 10
|
||
|
Item 11
|
||
|
Item 12
|
||
|
Item 13
|
||
|
Item 14
|
||
|
Item 15
|
||
|
Financial Statement Schedules (None required)
|
||
|
Item 16
|
Form 10-K Summary (None)
|
|
PART I
Item 1. Business
The disclosures set forth in this report are qualified by Item 1A. Risk Factors included herein and the section captioned “Cautionary Note Regarding Forward-Looking Statements and Factors that Could Affect Future Results” included in Part II, Item 7. Management’s Discussion and Analysis of Financial Condition and Results of Operations. When we refer to “we,” “our,” “us,” “First Interstate” or the “Company” in this annual report, we mean First Interstate BancSystem, Inc. and our consolidated subsidiaries, including our wholly-owned subsidiary, First Interstate Bank, unless the context indicates that we refer only to the parent company, First Interstate BancSystem, Inc. When we refer to the “Bank” or “FIB” in this annual report, we mean First Interstate Bank.
Our Company
We are a financial and bank holding company incorporated as a Montana corporation in 1971, headquartered in Billings, Montana. Our Class A common stock is listed on the NASDAQ under the symbol
“
FIBK.
”
As of
December 31, 2018
, we had consolidated assets of
$13.3 billion
, deposits of
$10.7 billion
, total loans of
$8.5 billion
, and total stockholders’ equity of
$1.7 billion
. We currently operate
147
banking offices, including detached drive-up facilities, in communities across Idaho, Montana, Oregon, South Dakota, Washington, and Wyoming in addition to Internet and mobile banking services. Through our bank subsidiary, FIB, we deliver a comprehensive range of banking products and services to individuals, businesses, municipalities, and other entities throughout our market areas. Our customers participate in a wide variety of industries, including agriculture, construction, education, energy, governmental services, healthcare, mining, professional services, retail, technology, tourism, and wholesale trade.
Our goal is to be the premier financial services provider within the communities we serve. With that as the backdrop, we are committed to being a leader in the financial and social fabric of our communities by continuously strengthening our relationships with our employees and our clients while driving long-term shareholder value. As a community bank we adhere to six common values that provide a foundation for our growth and success. They are: (1) we put people first; (2) we strive for excellence; (3) we act with integrity; (4) we embrace change; (5) we are committed to our communities; and (6) we celebrate success. These values support our commitment to our employees, our clients, our communities, and our shareholders.
We have grown our business by adhering to this set of values and we have a long-term perspective that emphasizes providing high-quality financial products and services, delivering exceptional client service, influencing business leadership through professional and dedicated managers and employees, assisting our communities through financial contributions and socially responsible leadership, and cultivating a strong corporate culture. In addition, we plan to continue to expand our business in a disciplined and prudent manner, fueled by organic growth in our existing market areas and expansion into new and complementary markets when appropriate opportunities arise.
Recent Acquisitions
On
August 16, 2018
, the Company completed its acquisition of Northwest Bancorporation, Inc. (“Northwest”), the parent company of Inland Northwest Bank (“INB”), a Spokane, Washington based community bank with
20
banking offices across Idaho, Oregon, and Washington. Consideration for the acquisition totaled
$176.3 million
, consisting of the issuance of
3.84 million
shares of the Company's Class A common stock valued at
$45.15
per share, the closing price of the Company's Class A common stock as quoted on the NASDAQ stock exchange on the acquisition date. The Company paid approximately
$3.0 million
in cash related to Northwest warrants, which was included in the consideration paid. Holders of each share of Northwest common stock received
0.516
shares of First Interstate Class A common stock for each share of Northwest common stock. Additionally, all Northwest stock purchase warrants outstanding immediately prior to the close of the transaction were canceled in exchange for the right to receive a cash payment as provided in the Agreement. Unvested Northwest restricted stock awards outstanding immediately prior to the close of the transaction vested and were considered issued and outstanding at acquisition close. Integration of INB into FIB was completed on
November 9, 2018
.
1
On
May 30, 2017
, we acquired all of the outstanding stock of Cascade Bancorp, parent company of Bank of the Cascades (“BOTC”), an Oregon-based community bank with
46
banking offices across Oregon, Idaho and Washington. Each outstanding share of Cascade Bancorp converted into the right to receive
0.14864
shares of our Class A common stock and
$1.91
in cash. The merger consideration represented an aggregate purchase price of
$541.0 million
. With the completion of the merger, we became a regional community bank with a geographic footprint that spans Idaho, Montana, Oregon, South Dakota, Washington, and Wyoming. Integration of BOTC into FIB was completed on August 11, 2017.
On August 12, 2016, we acquired all of the outstanding stock of Flathead Bank of Bigfork, or Flathead Bank, a wholly-owned subsidiary of Flathead Holding Company of Bigfork, with branches located in Western and Northwestern Montana. The acquisition was completed for cash consideration of $34.1 million.
For additional information regarding these acquisitions, see “Managements’ Discussion and Analysis — Recent Trends and Developments” included in Part II, Item 7 and “Notes to Consolidated Financial Statements — Acquisitions” included in Part IV, Item 15.
Pending Acquisitions
On
October 11, 2018
, the Company entered into a definitive agreement to acquire all of the outstanding stock of Idaho Independent Bank ("IIBK"), a community bank headquartered in Coeur d' Alene, Idaho with
11
banking offices across Idaho, in an all-stock transaction valued at approximately $181.3 million in aggregate, or
$22.73
per share of IIBK stock, based on a per share price of First Interstate Class A common stock of $45.45 per share as of October 5, 2018. IIBK shareholders will be entitled to receive 0.50 shares of First Interstate Class A common stock for each share of IIBK common stock they own. The transaction has been approved by the boards of directors of both companies and is expected to close and convert data processing systems in the second quarter of 2019, subject to customary conditions, including regulatory and shareholder approvals.
Also on
October 11, 2018
, the Company entered into a definitive agreement to acquire all of the outstanding stock of Community 1st Bank ("CMYF"), a community bank headquartered in Post Falls, Idaho with
three
banking offices in North Idaho, in an all-stock transaction valued at approximately $21.5 million in aggregate, or
$17.20
per share of CMYF stock, based on a per share price of First Interstate Class A common stock of $45.45 per share as of October 5, 2018. CMYF stockholders will be entitled to receive 0.3784 shares of First Interstate Class A common stock for each share of CMYF common stock they own. The transaction has been approved by the boards of directors of both companies and is expected to close and convert data processing systems in the second quarter of 2019, subject to customary conditions, including regulatory and shareholder approvals.
For additional information regarding these acquisitions, see “Managements’ Discussion and Analysis — Recent Trends and Developments” included in Part II, Item 7 and “Notes to Consolidated Financial Statements — Acquisitions” included in Part IV, Item 15. For additional information regarding risks associated with the pending acquisition, see "Risk Factors" included in Item 1A herein.
Community Banking
Community banking encompasses commercial and consumer banking services provided through our Bank, primarily the acceptance of deposits; extensions of credit; mortgage loan origination and servicing; and trust, employee benefit, investment and insurance services. Our community banking philosophy emphasizes providing customers with commercial and consumer banking products and services locally using a personalized service approach while strengthening the communities in our market areas through community service activities. We grant our banking offices significant authority in delivering products in response to local market considerations and customer needs. This authority enables our banking offices to remain competitive by responding quickly to local market conditions and enhances their relationships with the customers they serve. We also require accountability by having company-wide standards and established limits on the authority and discretion of each banking office. This combination of authority and accountability allows our banking offices to provide personalized customer service and be in close contact with our communities, while at the same time promoting strong performance and remaining focused on our overall financial performance.
2
Lending Activities
We offer real estate, consumer, commercial, agricultural and other loans to individuals and businesses in our market areas. We have comprehensive credit policies establishing company-wide underwriting and documentation standards to assist management in the lending process and to limit our risk. Each loan must meet minimum underwriting standards specified in our credit policies. Minimum underwriting standards generally specify that loans: (i) are made to borrowers located within our market footprint with the exception of participation loans and loans to national accounts; (ii) are made only for identified legal purposes; (iii) have specifically identified sources of repayment; (iv) mature within designated maximum maturity periods that coincide with repayment sources; (v) are appropriately collateralized whenever possible; (vi) are supported by current credit information; (vii) do not exceed the Bank’s legal lending limit; (viii) include medium-term fixed interest rates or variable rates that are adjusted within designated time frames; and (ix) require a flood determination prior to closing. In addition, our minimum underwriting standards include lending limitations to prevent concentrations of credit in agricultural, commercial, real estate or consumer loans. Further, each minimum underwriting standard must be documented, with exceptions noted, as part of the loan approval process.
While each loan must meet minimum underwriting standards established in our credit policies, lending officers and branch loan officers are granted levels of credit authority in approving and pricing loans to assure that the banking offices are responsive to competitive issues and community needs in each market area. Lending authorities are established at individual, branch and market levels. Credit authorities are established and assigned based on the credit experience and credit acumen of each branch loan officer. Credit authority is under the direction of our Chief Credit Officer or such officer’s designee and is reviewed on an ongoing basis. Credits over the authority of branch loan officers are approved by our credit risk management group.
Deposit Products
We offer traditional depository products including checking, savings and time deposits. Deposits at the Bank are insured by the Federal Deposit Insurance Corporation, (“FDIC”), up to statutory limits. We also offer repurchase agreements primarily to commercial and municipal depositors. Under repurchase agreements, we sell investment securities held by the Bank to our customers under an agreement to repurchase the investment securities at a specified time or on demand. All outstanding repurchase agreements are due in one business day.
Wealth Management
We provide a wide range of trust, employee benefit, investment management, insurance, agency and custodial services to individuals, businesses and nonprofit organizations. These services include the administration of estates and personal trusts; management of investment accounts for individuals, employee benefit plans and charitable foundations; and insurance planning.
Centralized Services
We have centralized certain operational activities to provide consistent service levels to our customers company-wide, to gain efficiency in management of those activities and to ensure regulatory compliance. Centralized operational activities generally support our banking offices in the delivery of products and services to customers and include marketing; credit review; credit cards; mortgage loan sales and servicing; indirect consumer loan purchasing and processing; loan collections; and other operational activities. Additionally, specialized staff support services have been centralized to enable our branches to serve their markets more efficiently. These services include credit risk management, finance, accounting, human resource management, internal audit, facilities management, technology, risk management, compliance and other support services.
3
Market Area
The following table reflects our deposit market share and branch locations by state, inclusive of INB:
|
Deposit Market Share and Branch Locations by State
|
|||||
|
|
% of Market Deposits
(1)
|
Deposit Market Share Rank
(1)
|
Number of Branches
(2)
|
||
|
Montana
|
17.83%
|
2nd
|
48
|
||
|
Idaho
|
2.53
|
12th
|
17
|
||
|
Oregon
|
2.42
|
9th
|
33
|
||
|
South Dakota
|
0.14
|
12th
|
15
|
||
|
Washington
|
0.38
|
30th
|
18
|
||
|
Wyoming
|
15.53
|
2nd
|
16
|
||
|
Total
|
147
|
||||
(1)
Source: FDIC.gov-data as of June 30, 2018.
(2)
As of December 31, 2018
.
We operate in markets that have a diverse employment base covering numerous industries and we believe our community bank approach to providing client service is a competitive advantage that strengthens the Company’s ability to effectively provide financial products and services to businesses and individuals in its markets.
Competition
There is significant competition among commercial banks in our market areas. We also compete with other providers of financial services, such as savings and loan associations, credit unions, financial technology companies, internet banks, consumer finance companies, brokerage firms, mortgage banking companies, insurance companies, securities firms, mutual funds and certain government agencies as well as major retailers, all actively engaged in providing various types of loans and other financial services. Some of our competitors have greater resources and, as such, may have higher lending limits and may offer other services that we do not provide. We generally compete on the basis of customer service and responsiveness to customer needs, available loan and deposit products, rates of interest charged on loans, rates of interest paid for deposits, and the availability and pricing of services such as trust, employee benefit, investment and insurance services.
Employees
We recognize quality, engaged employees are critical to our ability to serve our customers and to the success of our company. We strive to be the employer of choice in the markets we serve. At
December 31, 2018
, we employed
2,330
full-time equivalent employees, none of whom are represented by a collective bargaining agreement. We consider our employee relations to be good.
Regulation and Supervision
Regulatory Authorities
We are subject to extensive regulation under federal and state laws. A description of certain material laws and regulations applicable to us is summarized below. This description is not intended to summarize all laws and regulations applicable to us. Descriptions of statutory and regulatory provisions and requirements do not purport to be complete and are qualified in their entirety by reference to those provisions. In addition to laws and regulations, state and federal banking regulatory agencies may issue policy statements, interpretive letters and similar written guidance that may impose additional regulatory obligations or otherwise affect the conduct of our business. Additionally, proposals to change laws and regulations are frequently introduced at both the federal and state levels. The likelihood and timing of any such changes and their impact on the Company cannot be determined with any certainty.
As a public company, we are subject to the disclosure and regulatory requirements of the Securities Exchange Act of 1934, as amended, or the Exchange Act, as administered by the Securities and Exchange Commission (“SEC”).
4
As a financial and bank holding company, we are subject to regulation under the Bank Holding Company Act of 1956, as amended, and to supervision, regulation and regular examination by the Board of Governors of the Federal Reserve System (“Federal Reserve”).
The Bank is subject to supervision and regular examination by its primary banking regulators, the Federal Reserve, the Montana Department of Administration, Division of Banking and Financial Institutions (“Montana Division”), and the Consumer Financial Protection Bureau (“CFPB”).
The Bank’s deposits are insured by the Deposit Insurance Fund (“DIF”), of the FDIC in the manner and to the extent provided by law. The Bank is subject to the Federal Deposit Insurance Act (“FDIA”), and FDIC regulations relating to deposit insurance and may also be subject to supervision and examination by the FDIC.
The Company and the Bank are currently subject to the regulatory capital framework and guidelines reached by Basel III as adopted by the Office of the Comptroller of the Currency (“OCC”), and Federal Reserve. The OCC and Federal Reserve have risk-based capital adequacy guidelines intended to measure capital adequacy with regard to a banking organization’s balance sheet, including off-balance sheet exposures such as unused portions of loan commitments, letters of credit, and recourse arrangements.
The Durbin Amendment to the Dodd-Frank Wall Street Reform and Consumer Protection Act of 2010 (“Dodd-Frank Act”), alters the competitive structure of the debit card payment processing industry and caps debit card interchange fees for banks with over $10 billion in assets. The final rule establishes standards for assessing whether debit card interchange fees received by debit card issuers are reasonable and proportional to the costs incurred by issuers for electronic debit transactions.
The extensive regulation of the Bank limits both the activities in which the Bank may engage and the conduct of its permitted activities. Further, the laws and regulations impose reporting and information collection obligations on the Bank. The Bank incurs significant costs relating to compliance with various laws and regulations and the collection and retention of information. As the regulatory framework for bank holding companies and banks continues to grow and become more complex, the cost of complying with regulatory requirements continues to increase.
Financial and Bank Holding Company
We are a bank holding company and have registered as a financial holding company under regulations issued by the Federal Reserve. As a financial holding company, we may engage in certain business activities that are determined by the Federal Reserve to be financial in nature or incidental to financial activities as well as all activities authorized to bank holding companies generally. We may engage in authorized financial activities, provided that we remain a financial holding company and are “well capitalized” and “well managed.” We do not currently engage in significant financial holding company businesses or activities not otherwise permitted for bank holding companies generally.
Under federal law, we are required to serve as a source of financial and managerial strength to the Bank, which may include providing financial assistance to the Bank if the Bank experiences financial distress. Under existing Federal Reserve source of strength policies, the Federal Reserve may require a bank holding company to make capital injections into a troubled subsidiary bank. The Federal Reserve may also determine that the bank holding company is engaging in unsafe and unsound practices if it fails to commit resources to a subsidiary bank.
We are required by the Bank Holding Company Act to obtain Federal Reserve approval prior to acquiring, directly or indirectly, ownership or control of voting shares of any bank, if, after such acquisition, we would own or control more than 5% of its voting stock. The Federal Reserve considers a number of factors in evaluating acquisitions including, but not limited to, the financial and managerial resources and future prospects of the parties, the convenience and needs of the communities served, and competitive factors. Under the Dodd-Frank Act, when considering an application, the Federal Reserve is also required to evaluate whether the transaction would result in more concentrated risks to the United States banking or financial system. Under federal law and regulations, a bank holding company may acquire banks in states other than its home state if, among other things, the bank holding company is both “well capitalized” and “well managed” both before and after the acquisition.
5
Banks may also merge across state lines. With additional changes made to federal statutes under the Dodd-Frank Act, banks are also permitted to establish new interstate branches if a bank located in the target state could establish a new branch at the proposed location without regard to state laws limiting interstate de novo branching. A state can prohibit interstate mergers entirely or prohibit them if the continuing bank would control insured bank deposits in excess of a specified percentage of total insured bank deposits in the state. Under Montana law, a bank cannot acquire control of a bank located in Montana if, after the acquisition, the acquiring institution would control, in the aggregate, more than 22% of the total deposits of insured depository institutions located in Montana. As of June 30, 2018, based on publicly available information provided by the FDIC, the Bank controlled approximately
17.8%
of the total deposits of all insured depository institutions located in Montana. The state limitation may limit our ability to directly or indirectly acquire additional banks located in Montana.
In order to assess the financial strength of the bank holding company, the Federal Reserve and the State of Montana may conduct periodic on-site and off-site inspections and credit reviews throughout the year. The federal banking agencies, including the Federal Reserve, may require additional information and reports from us. In addition, the Federal Reserve may examine, and require reports and information regarding, any entity that we control, including entities other than banks or entities engaged in financial activities. In certain circumstances, the Federal Reserve may require us to divest of non-bank entities or limit the activities of those entities even if the activities are otherwise permitted to bank holding companies under governing law.
Dividends and Restrictions on Transfers of Funds
Dividends from the Bank are the primary source of funds for the payment of our operating expenses and for the payment of dividends to our shareholders, and are limited by state and federal laws and regulations. The Company and the Bank are also subject to various regulatory restrictions relating to capital distributions, including dividends, regulatory capital minimums and the requirement to remain “well-capitalized” under the prompt corrective action regulations summarized in the “Capital Standards and Prompt Corrective Action” section below. In general, the Bank is limited to paying dividends that do not exceed the current year net profits together with retained earnings from the two preceding calendar years unless the prior consent of the Federal Reserve is obtained. In addition, the Bank may not pay dividends in excess of the previous two years’ net earnings without providing notice to the Montana Division.
The capital buffer rules adopted by the federal banking regulators in accordance with the Basel Accords impose further limitations on the Bank’s ability to pay dividends. In general, the Bank’s ability to pay dividends is limited under the capital buffer rules unless the Bank’s common equity conservation buffer exceeds the minimum required capital ratio by a specified amount which, when fully phased-in, will be 2.5% of risk-weighted assets.
A state or federal banking regulator may impose, by regulatory order or agreement of the Bank, specific dividend limitations or prohibitions in certain circumstances. The Bank is not currently subject to a specific regulatory dividend limitation.
The Federal Reserve has issued a policy statement regarding the payment of dividends and the repurchase of common stock by bank holding companies. In general, the policy provides that dividends should be paid only out of current earnings and only if the prospective rate of earnings retention by the holding company appears consistent with the organization’s capital needs, asset quality and overall financial condition. Regulatory guidance provides for prior regulatory consultation with respect to capital distributions in certain circumstances such as where the company’s net income for the past four quarters (net of previous capital distributions) is insufficient to fully fund the dividend or the company’s overall rate of earnings retention is inconsistent with the company’s capital needs and overall financial condition. The ability of a holding company to pay dividends may be restricted if a subsidiary bank becomes under-capitalized. The policy statement also states that a holding company should inform the Federal Reserve supervisory staff prior to redeeming or repurchasing common stock or perpetual preferred stock if the holding company is experiencing financial weaknesses or if the repurchase or redemption would result in a net reduction, as of the end of a quarter, in the amount of such equity instruments outstanding compared with the beginning of the quarter in which the redemption or repurchase occurred. These regulatory policies may affect our ability to pay dividends, repurchase shares of common stock or otherwise engage in capital distributions.
6
Capital Standards and Prompt Corrective Action
Banks and bank holding companies are subject to various regulatory capital requirements administered by state and federal banking agencies, which involve quantitative measures of assets, liabilities and certain off-balance sheet items calculated under regulatory accounting practices. Capital amounts and classifications are also subject to qualitative judgments by regulators about components, risk weighting and other factors. The capital requirements are intended to ensure that banking organizations have adequate capital given the risk levels of assets and off-balance sheet financial instruments and are applied separately to the Bank and the Company.
Federal regulations require FDIC-insured depository institutions and bank holding companies to meet several minimum capital standards: a common equity Tier 1 capital to risk-based assets ratio of 4.5%, a Tier 1 capital to risk-based assets ratio of 6.0%, a total capital to risk-based assets of 8.0%, and a 4.0% Tier 1 capital to total assets leverage ratio. The existing capital requirements were effective January 1, 2015 and are based on recommendations of the Basel Committee on Banking Supervision and certain requirements of the Dodd-Frank Act.
For purposes of the regulatory capital requirements, common equity Tier 1 capital is generally defined as common stockholders’ equity and retained earnings and is reduced by substantially all of the regulatory deductions including items such as goodwill and other intangibles and certain deferred tax assets. Tier 1 capital is generally defined as common equity Tier 1 and additional Tier 1 capital. Additional Tier 1 capital includes certain noncumulative perpetual preferred stock and related surplus and minority interests in equity accounts of consolidated subsidiaries. Total capital includes Tier 1 capital (common equity Tier 1 capital plus additional Tier 1 capital) and Tier 2 capital. Tier 2 capital is comprised of capital instruments and related surplus, meeting specified requirements, and may include cumulative preferred stock and long-term perpetual preferred stock, mandatory convertible securities, intermediate preferred stock and subordinated debt. Also included in Tier 2 capital is the allowance for loan and lease losses limited to a maximum of 1.25% of risk-weighted assets and, for institutions like us that have exercised an opt-out election regarding the treatment of Accumulated Other Comprehensive Income (“AOCI”), up to 45.0% of net unrealized gains on available-for-sale equity securities with readily determinable fair market values. Institutions that have not exercised the AOCI opt-out have AOCI incorporated into common equity Tier 1 capital (including unrealized gains and losses on available-for-sale-securities). Calculation of all types of regulatory capital is subject to deductions and adjustments specified in the regulations.
In determining the amount of risk-weighted assets for purposes of calculating risk-based capital ratios, all assets, including certain off-balance sheet assets (e.g., recourse obligations, direct credit substitutes, residual interests), are multiplied by a risk weight factor assigned by the regulations based on the risks believed inherent in the type of asset. Higher levels of capital are required for asset categories believed to present greater risk. For example, a risk weight of 0% is assigned to cash and U.S. government securities, a risk weight of 50% is generally assigned to prudently underwritten first lien one- to four-family residential mortgages, a risk weight of 100% is assigned to commercial and consumer loans, a risk weight of 150% is assigned to certain past due loans and a risk weight of between 0% to 600% is assigned to permissible equity interests, depending on certain specified factors.
In addition to establishing the minimum regulatory capital requirements, the regulations limit capital distributions and certain discretionary bonus payments to management if the institution does not hold a “capital conservation buffer” consisting of 2.5% of common equity Tier 1 capital to risk-weighted asset above the amount necessary to meet its minimum risk-based capital requirements. The capital conservation buffer requirement is phased in beginning January 1, 2016 at 0.625% of risk-weighted assets and increasing each year until fully implemented at 2.5% on January 1, 2019.
In assessing an institution’s capital adequacy, the Federal Reserve takes into consideration, not only these numeric factors, but qualitative factors as well, and has the authority to establish higher capital requirements in individual cases where deemed necessary. The Federal Reserve has not established individual capital requirements applicable to us or the Bank.
The Dodd-Frank Act and the revised regulations limit the use of hybrid capital instruments in meeting regulatory capital requirements, including instruments similar to those which we currently have issued and outstanding. At this time, we meet the criteria for grandfathering under the Dodd-Frank Act, therefore, the limitations on use of hybrid capital instruments do not apply to our outstanding instruments. However, once the Company surpasses $15.0 billion in assets, we may lose Tier 1 qualification of trust preferred securities.
7
Federal law requires the federal banking agencies to take “prompt corrective action” in respect of depository institutions that do not meet minimum capital requirements. The law sets forth the following five capital tiers: “well capitalized,” “adequately capitalized,” “under-capitalized,” “significantly under-capitalized” and “critically under-capitalized.” A depository institution’s capital tier will depend upon how its capital levels compare with various relevant capital measures and certain other factors, as established by regulation. The relevant capital measures are the common equity tier 1 capital ratio, total capital ratio, the tier 1 capital ratio and the leverage ratio.
A depository institution is generally prohibited from making any capital distributions (including payment of a dividend) or paying any management fee to its parent holding company if the depository institution would thereafter be under-capitalized. Under-capitalized institutions may be subject to growth limitations and other restrictions and are required to submit a capital restoration plan. If a depository institution fails to submit an acceptable plan, it is treated as if it is “significantly under-capitalized.”
“Significantly under-capitalized” depository institutions are subject to additional requirements and restrictions, such as orders to sell sufficient stock to become “adequately capitalized,” to reduce total assets, restrict interest rates paid, remove management and directors and cease receipt of deposits from correspondent banks. “Critically under-capitalized” institutions are subject to the appointment of a receiver or conservator.
The capital stock of banks organized under Montana law, such as the Bank, may be subject to assessment upon the direction of the Montana Department of Administration under the Montana Bank Act. Under the Montana Bank Act, if the Department of Administration determines an impairment of a bank’s capital exists, it may notify the bank’s board of directors of the impairment and require payment of an assessment on the bank stock. If the bank fails to do so, the Department of Administration may, among other things, take charge of the bank and proceed to liquidate the bank.
Restrictions on Transactions with Affiliates, Directors and Officers
Under the Federal Reserve Act, the Bank may not lend funds or otherwise extend credit to us or any other affiliate, except on specified types and amounts of collateral generally upon market terms and conditions. The Federal Reserve also has authority to define and limit the transactions between banks and their affiliates. The Federal Reserve’s Regulation W and relevant federal statutes, among other things, impose significant limitations on transactions in which the Bank may engage with us or with other affiliates, including per affiliate and aggregate limits on affiliate transactions.
Federal Reserve Regulation O restricts loans to the Bank and Company insiders, which includes directors, certain officers and principal stockholders and their respective related interests. All extensions of credit to the insiders and their related interests must be on the same terms as, and subject to the same loan underwriting requirements as, loans to persons who are not insiders. In addition, Regulation O imposes lending limits on loans to insiders and their related interests and imposes, in certain circumstances, requirements for prior approval of the loans by the Bank board of directors.
Safety and Soundness Standards and Other Supervisory and Enforcement Mechanisms
The federal banking agencies have adopted guidelines establishing standards for safety and soundness, asset quality and earnings, internal controls and audit systems. These standards are designed to identify potential concerns and ensure action is taken to address those concerns before they pose a risk to the DIF. If a federal banking agency determines that an institution fails to meet any of these standards, the agency may require the institution to submit an acceptable plan to achieve compliance with the standard. If the institution fails to submit an acceptable plan within the time allowed by the agency or fails in any material respect to implement an accepted plan, the agency must, by order, require the institution to correct the deficiency and may take other supervisory action.
Pursuant to the Dodd-Frank Act, federal banking regulators impose additional supervisory measures on banking organizations when they exceed $10 billion in assets. These include enhanced risk management and corporate governance processes and stress-testing requirements based on scenarios specified by the regulators.
8
The Federal Reserve has authority to bring enforcement action against a bank or bank holding company and all “institution-affiliated parties” of a bank or bank holding company, including directors, officers, stockholders, and under certain circumstances, attorneys, appraisers and accountants for the bank or holding company. Formal enforcement actions may include measures such as the issuance of a capital directive or cease and desist order to removal of officers and/or directors or the appointment of a receiver or conservator. Civil money penalties cover a wide range of violations and actions, and can range up to $25,000 per day, unless a finding of reckless disregard is made, in which case penalties may be as high as $1 million per day. The FDIC also has the authority to terminate deposit insurance or recommend to the Federal Reserve that enforcement action be taken with respect to a particular bank. If such action is not taken, the FDIC has authority to take the action under specified circumstances. Montana law also provides the Montana Division with various enforcement mechanisms and, ultimately, authority to appoint a receiver or conservator for a Montana bank.
Deposit Insurance
The FDIC insures our customer deposits through the DIF up to $250,000 per depositor. The amount of FDIC assessments paid by each DIF member institution is based on financial measures and supervisory ratings derived from a statistical model estimating the probability of failure within a three-year period, with banks deemed more risky paying higher assessment.
The FDIC was required by the Dodd-Frank Act to take actions necessary to cause the DIF to reach a reserve ratio of 1.35% of total estimated insured deposits by September 30, 2020. Consequently, effective July 1, 2016, the FDIC revised its system to impose surcharges on institutions with $10 billion or more in assets and credit smaller institutions for any future payments toward reaching the 1.35% ratio. On September 30, 2018, the Deposit Insurance Fund Reserve Ratio reached 1.36 percent, exceeding the statutorily required minimum reserve ratio of 1.35 percent ahead of the September 30, 2020, deadline required under the Dodd-Frank Act. FDIC regulations provide for two changes to deposit insurance assessments upon reaching the minimum: (1) surcharges on insured depository institutions with total consolidated assets of $10 billion or more (large banks) will cease; and (2) small banks will receive assessment credits for the portion of their assessments that contributed to the growth in the reserve ratio from between 1.15 percent and 1.35 percent, to be applied when the reserve ratio is at or above 1.38 percent.
All FDIC-insured institutions are also required to pay assessments to the FDIC to fund interest payments on bonds issued by the Financing Corporation, or the FICO, an agency of the Federal government established to recapitalize the predecessor to the DIF. The assessment rate is applied to total average assets less tangible equity, as defined under the Dodd-Frank Act. The assessment rate schedule can change from time to time at the discretion of the FDIC, subject to certain limits. Under the current system, premiums are assessed quarterly.
Customer Privacy and Other Consumer Protections
Federal law imposes customer privacy requirements on any company engaged in financial activities, including the Bank and us. Under these requirements, a financial company is required to protect the security and confidentiality of customer nonpublic personal information. In addition, for customers who obtain a financial product such as a loan for personal, family, or household purposes, a financial holding company is required to disclose its privacy policy to the customer at the time the relationship is established and annually thereafter. The financial company must also disclose its policies concerning the sharing of the customer’s nonpublic personal information with affiliates and third parties. Finally, a financial company is prohibited from disclosing an account number or similar item to a third party for use in telemarketing, direct mail marketing, or marketing through electronic mail.
The Bank is subject to a variety of federal and state laws, regulations and reporting obligations aimed at protecting consumers and Bank customers. Failure to comply with these laws and regulations may, among other things, impair the collection of loans made in violation of the laws and regulations, provide borrowers or other customers certain rights and remedies or result in the imposition of penalties on the Bank. Certain of these laws and regulations are described below.
The Equal Credit Opportunity Act generally prohibits discrimination in credit transactions on, among other things, the basis of race, color, religion, national origin, sex, marital status or age and, in certain circumstances, limits the Bank’s ability to require co-obligors or guarantors as a condition of the extension of credit to an individual.
The Real Estate Settlement Procedures Act (“RESPA”), requires certain disclosures be provided to borrowers in real estate loan closings or other real estate settlements. In addition, RESPA limits or prohibits certain settlement practices, fee sharing, kickbacks, and similar practices that are considered to be abusive.
9
The Truth in Lending Act (“TILA”), requires disclosures to borrowers and other parties in consumer loans including, among other things, disclosures relating to interest rates and other finance charges, payments and payment schedules and annual percentage rates. TILA provides remedies to borrowers upon certain failures in compliance by a lender.
The Fair Housing Act regulates, among other things, lending practices in residential lending and prohibits discrimination in housing-related lending activities on the basis of race, color, religion, national origin, sex, handicap, disability, or familial status.
The Home Mortgage Disclosure Act requires certain lenders and other firms engaged in the home mortgage industry to collect and report information relating to applicants, borrowers and home mortgage lending activities in which they engage in their market areas or communities. The information is used for, among other purposes, evaluation of discrimination or other impermissible acts in home mortgage lending.
The Home Ownership and Equity Protection Act regulates terms and disclosures of certain closed-end home mortgage loans that are not purchase money loans and includes loans classified as “high-cost loans.”
The Fair Credit Reporting Act, as amended by the Fair and Accurate Credit Transactions Act, generally limits lenders and other financial firms in their collection, use or dissemination of customer credit information, gives customers some access to, and control over, their credit information and requires financial firms to establish policies and procedures intended to deter identity theft and related frauds.
The Fair Debt Collection Practices Act regulates actions that may be taken in the collection of consumer debts and provides consumers with certain rights of access to information related to collection actions.
The Electronic Fund Transfer Act regulates fees and other terms on electronic funds transactions.
The CFPB has promulgated numerous regulations relating to consumer financial services-related topics, such as mortgage origination disclosures, mortgage servicing practices, and others.
The Community Reinvestment Act (“CRA”), generally requires the federal banking agencies to evaluate the record of a financial institution in meeting the credit needs of its local communities, including low and moderate income neighborhoods. In addition to substantial penalties and corrective measures that may be assessed for a violation of fair lending laws, the federal banking agencies may take compliance with such laws and the CRA into account when evaluating applications for such transactions as mergers and new branches.
In connection with its assessment of CRA performance, the appropriate bank regulatory agency assigns a rating of “outstanding,” “satisfactory,” “needs to improve” or “substantial noncompliance.” The Bank received an “outstanding” rating on its most recent published examination. Although the Bank’s policies and procedures are designed to achieve compliance with all fair lending and CRA requirements, instances of non-compliance are occasionally identified through normal operational activities. Management endeavors to respond pro-actively to any instances of non-compliance and to implement and update appropriate procedures to prevent instances of non-compliance and other violations from occurring.
USA PATRIOT Act
The USA PATRIOT Act of 2001 amended the Bank Secrecy Act of 1970 and the Money Laundering Control Act of 1986 and adopted additional measures requiring insured depository institutions, broker-dealers and certain other financial institutions to have policies, procedures and controls to detect, prevent and report money laundering and terrorist financing. The laws and related regulations also provide for information sharing, subject to conditions, between federal law enforcement agencies and financial institutions, as well as among financial institutions, for counter-terrorism purposes. Federal banking regulators are required, when reviewing bank holding company acquisition or merger applications, to take into account the effectiveness of the anti-money laundering activities of the applicants.
10
Office of Foreign Asset Control
The United States Treasury Office of Foreign Asset Control enforces economic and trade sanctions imposed by the United States on foreign persons and governments. Among other authorities, the Office of Foreign Asset Control may require United States financial institutions to block or “freeze” assets of identified foreign persons or governments which come within the control of the financial institution. Financial institutions are required to adopt procedures for identification of new and existing deposit accounts and other relationships with persons or governments identified by the Office of Foreign Asset Control and to timely report the accounts or relationships to the Office of Foreign Asset Control.
Incentive Compensation
In May 2016, the Federal Reserve Board, other federal banking agencies and the SEC jointly published re-proposed rule-making designed to implement provisions of the Dodd-Frank Act prohibiting incentive compensation arrangements that would encourage inappropriate risk taking at a covered institution, which includes a bank or bank holding company with $1 billion or more of assets, such as us. The proposed rule (i) prohibits incentive-based compensation arrangements that encourage executive officers, employees, directors or principal shareholders to expose the institution to inappropriate risks by providing excessive compensation (based on the standards for excessive compensation adopted pursuant to the FDIA) and (ii) prohibits incentive-based compensation arrangements for executive officers, employees, directors or principal shareholders that could lead to a material financial loss for the institution. The proposed rule requires covered institutions to establish policies and procedures for monitoring and evaluating their compensation practices. The comment period ended in July 2016. Although final rules had not been adopted as of February 2019, if these or other regulations are adopted in a form similar to the proposed rule-making, they will impose limitations on the manner in which we may structure compensation for our executives.
Cyber-security
In March 2015, federal regulators issued two related statements regarding cyber-security. One statement indicates that financial institutions should design multiple layers of security controls to establish lines of defense and to ensure that their risk management processes also address the risk posed by compromised customer credentials, including security measures to reliably authenticate customers accessing internet-based services of the financial institution. The other statement indicates that a financial institution’s management is expected to maintain sufficient business continuity planning processes to ensure the rapid recovery, resumption and maintenance of the institution’s operations after a cyber-attack involving destructive malware. A financial institution is also expected to develop appropriate processes to enable recovery of data and business operations and address rebuilding network capabilities and restoring data if the institution or its critical service providers fall victim to this type of cyber-attack. If we fail to observe the regulatory guidance, we could be subject to various regulatory sanctions, including financial penalties.
In the ordinary course of business, we rely on electronic communications and information systems to conduct our operations and to store sensitive data. We employ a variety of preventative and detective tools to monitor, block, and provide alerts regarding suspicious activity, as well as to report on any suspected advanced persistent threats. Notwithstanding the strength of our defensive measures, the threat from cyber-attacks is severe, attacks are sophisticated and increasing in volume, and attackers respond rapidly to changes in defensive measures. While to date we have not experienced a significant compromise, significant data loss or any material financial losses related to cyber-security attacks, our systems and those of our customers and third-party service providers are under constant threat and it is possible that we could experience a significant event in the future. Risks and exposures related to cyber-security attacks are expected to remain high for the foreseeable future due to the rapidly evolving nature and sophistication of these threats, as well as due to the expanding use of Internet banking, mobile banking and other technology-based products and services by us and our customers. See Item 1A. Risk Factors for a further discussion of risks related to cyber-security.
Website Access to SEC Filings
The Company’s electronic filings with the SEC, including Annual Reports on Form 10-K, Quarterly Reports on Form 10-Q, Current Reports on Form 8-K and Proxy Statements, as well as amendments to these reports and statements filed or furnished pursuant to Section 13(a) or 15(d) of the Exchange Act, are made available at no cost through our website at
www.FIBK.com
as soon as reasonably practicable after the Company files such material with, or furnishes it to, the SEC. The Company’s SEC filings are also available through the SEC’s website at
www.sec.gov
. Our website and the information contained therein or connected thereto is not intended to be incorporated into this report and should not be considered a part of this report.
11
Item 1A. Risk Factors
Like other financial and bank holding companies, we are subject to a number of risks, many of which are outside of our control. If any of the events or circumstances described in the following risk factors actually occurs, our business, financial condition, results of operations and prospects could be harmed. These risks are not the only ones that we may face. Other risks of which we are not aware, including those which relate to the banking and financial services industry in general and us in particular, or those which we do not currently believe are material, may harm our future business, financial condition, results of operations and prospects. You should consider carefully the following important factors in evaluating us, our business and an investment in our securities.
Risks Relating to the Market and Our Business
A decline in economic conditions could reduce demand for our products and services, which could have an adverse effect on our results of operations.
Our customers are located predominantly in Idaho, Montana, Oregon, South Dakota, Washington, and Wyoming. Our profitability largely depends on the general economic conditions in these areas.
Deterioration in economic conditions could result in the following consequences, any of which could have a material adverse effect on our business, financial condition, liquidity and results of operations:
|
•
|
demand for our products and services may decline;
|
|
•
|
loan delinquencies, problem assets, and foreclosures may increase;
|
|
•
|
collateral for loans, especially real estate, may decline in value;
|
|
•
|
future borrowing power of our customers may be reduced;
|
|
•
|
the value of our securities portfolio may decline; and
|
|
•
|
the net worth and liquidity of loan guarantors may decline, impairing their ability to honor commitments to us.
|
Additionally, a significant decline in general economic conditions caused by inflation, recession, acts of terrorism, an outbreak of hostilities or other international or domestic calamities, unemployment, or other economic and geopolitical factors beyond our control, could further impact these local economic conditions and negatively affect our business and results of operations.
Deflationary pressures, while possibly lowering our operating costs, could also have a significant negative effect on our borrowers, especially our business borrowers, and the values of underlying collateral securing loans, which could negatively affect our business, financial condition, and results of operations.
We are subject to lending risks.
We take on credit risk by virtue of making loans and extending loan commitments and letters of credit. Our credit standards, procedures and policies may not prevent us from incurring substantial credit losses, particularly in light of market developments.
While our loan portfolio is diversified across business sectors, it is concentrated in commercial real estate and commercial business loans. As of
December 31, 2018
, we had
$4.5 billion
of commercial loans, including
$3.2 billion
of commercial real estate loans, representing approximately
52.9%
of our total loan portfolio. These loans may involve greater risks than other types of lending. Because payments on such loans are often dependent on the successful operation or development of the property or business involved, repayment of such loans is more sensitive than other types of loans to adverse conditions in the real estate market or the general economy. Commercial loans typically are made on the basis of the borrowers’ ability to make repayment from the cash flow of the commercial venture. If the cash flow from business operations is reduced, the borrower’s ability to repay the loan may be impaired. Due to the larger average size of each commercial loan as compared with other loans, as well as the collateral that is generally less readily-marketable, losses incurred on commercial loans could have a material adverse impact on our business, financial condition, and results of operations.
12
In addition, at
December 31, 2018
, we had
$2.5 billion
of agricultural, construction, residential and other real estate loans, representing approximately
29.4%
of our total loan portfolio. Deterioration in economic conditions or in the real estate market could result in increased delinquencies and foreclosures and could have an adverse effect on the collateral value for many of these loans and on the repayment ability of many of our borrowers. Deterioration in economic conditions or in the real estate market could also reduce the number of loans we make to businesses in the construction and real estate industry, which could negatively impact our interest income and results of operations. Similarly, the occurrence of a natural or manmade disaster in our market areas could impair the value of the collateral we hold for real estate secured loans. Any one or a combination of the factors identified above could negatively impact our business, financial condition, results of operations and prospects.
Changes in interest rates may have an adverse effect on demand for our products and services and on our profitability.
Our earnings and financial condition are largely dependent on net interest income, which is the difference between interest income earned on interest-earning assets such as loans and securities and interest expense paid on interest-bearing liabilities such as deposits and borrowed funds. The narrowing of interest rate spreads could adversely affect our earnings and financial condition. We cannot control or predict with certainty changes in interest rates. Regional and local economic conditions, competitive pressures and the policies of regulatory authorities, including monetary policies of the Federal Open Market Committee, affect interest income and interest expense. Changes in monetary policy, including changes in interest rates, could influence not only the interest we receive on loans and securities and the amount of interest we pay on deposits and borrowings, but such changes could also adversely affect (1) our ability to originate loans and obtain deposits, (2) the fair value of our financial assets and liabilities, including mortgage servicing rights, (3) our ability to realize gains on the sale of assets and (4) the average duration of our mortgage-backed securities and collateralized mortgage obligations portfolios. For example, rising interest rates could adversely affect our mortgage banking business because higher interest rates could cause customers to apply for fewer mortgages. Similarly, rising interest rates would increase the required periodic payment for variable rate loans and may result in an increase in non-performing loans. Additionally, rising interest rates may increase the cost of our deposits, which are a primary source of funding. Any substantial, unexpected or prolonged change in market interest rates could have a material adverse effect on our cash flows, financial condition and results of operations.
Changes in U.S. trade policies and other factors beyond the Company’s control, including the imposition of tariffs and retaliatory tariffs, may adversely impact our business, financial condition and results of operations.
Following the U.S. presidential election in 2016, there has been discussion and dialogue regarding potential changes to U.S. trade policies, legislation, treaties and tariffs, including trade policies and tariffs affecting other countries, including China, the European Union, Canada and Mexico and retaliatory tariffs by such countries. Tariffs and retaliatory tariffs have been imposed, and additional tariffs and retaliation tariffs have been proposed. Such tariffs, retaliatory tariffs or other trade restrictions on products and materials that our customers import or export, including among others, agricultural products, could cause the prices of our customers’ products to increase which could reduce demand for such products, or reduce our customer margins, and adversely impact their revenues, financial results and ability to service debt; which, in turn, could adversely affect our financial condition and results of operations. In addition, to the extent changes in the political environment have a negative impact on us or on the markets in which we operate our business, results of operations and financial condition could be materially and adversely impacted in the future. It remains unclear what the U.S. administration or foreign governments will or will not do with respect to tariffs already imposed, additional tariffs that may be imposed, or international trade agreements and policies.
On October 1, 2018, the United States, Canada, and Mexico agreed to a new trade deal to replace the North American Free Trade Agreement ("NAFTA"), which is subject to congressional approval, expected sometime in 2019, and various components of the agreement are not effective until 2020. The full impact of this agreement on us, our customers and on the economic conditions in our region is currently unknown. A trade war or other governmental action related to tariffs or international trade agreements or policies has the potential to negatively impact ours and/or our customers' costs, demand for our customers' products, and/or the U.S. economy or certain sectors thereof and, thus, adversely impact our business, financial condition and results of operations.
13
Our acquisitions, including our recent acquisition of Northwest and pending acquisitions, and the integration of acquired businesses subject us to various risks and may not result in all of the cost savings and benefits anticipated, which could adversely affect our financial condition or results of operations.
We have in the past, and may in the future, seek to grow our business by acquiring other businesses. In August 2018, we completed our acquisition of Northwest. In November 2018, we performed the system conversion and the integration of Northwest’s bank subsidiary, INB, into FIB. In October 2018, we entered into definitive agreements to acquire IIBK and CMYF. There is risk that our acquisitions may not have the anticipated positive impact on the Company because, for example, we failed to correctly assess the asset quality of the assets being acquired; the total cost and time required to complete the integration successfully was greater than estimated; being unable to profitably deploy funds acquired in an acquisition; or poor overall performance of the combined entity.
Acquisitions may also result in business disruptions that could cause customers to remove their accounts from us and move their business to competing financial institutions. It is possible that the integration process related to acquisitions could result in the disruption of our ongoing businesses or inconsistencies in standards, controls, procedures and policies that could adversely affect our ability to maintain relationships with clients, customers, and employees. The loss of key employees in connection with an acquisition could adversely affect our ability to successfully conduct our business. Acquisition and integration efforts could divert management attention and resources, which could have an adverse effect on our financial condition and results of operations. Additionally, the operation of the acquired branches may adversely affect our existing profitability, and we may not be able to achieve results in the future similar to those achieved by the existing banking business or manage growth resulting from the acquisition effectively.
If we experience loan losses in excess of estimated amounts, our earnings could be adversely affected.
The risk of credit losses on loans varies with, among other things, general economic conditions, the composition of our loan portfolio, the creditworthiness of the borrower over the term of the loan and, in the case of a collateralized loan, the value and marketability of the collateral for the loan. We maintain an allowance for loan losses based upon, among other things, historical experience, delinquency trends, economic conditions, and regular reviews of loan portfolio quality. Based upon such factors, management makes various assumptions and judgments about the ultimate collectability of our loan portfolio and provides an allowance for loan losses. These assumptions and judgments are complex and difficult to determine given the significant uncertainty surrounding future conditions in the general economy and banking industry. If management’s assumptions and judgments prove to be incorrect and the allowance for loan losses is inadequate, or if banking authorities or regulations require us to increase the allowance for loan losses, our net income may be adversely affected. As a result, an increase in loan losses could have a material adverse effect on our earnings, financial condition, results of operations and prospects.
Loss of deposits or a change in mix could increase the Company’s funding costs.
Deposits are a low cost and stable source of funding. We depend on checking and savings, negotiable order of withdrawal, and money market deposit account balances and other forms of customer deposits as our primary source of funding. The availability of internet banking products has increased the mobility of customer deposits. We compete with banks and other financial institutions for deposits. Funding costs may increase because the Company may lose deposits and replace them with more expensive sources of funding. Customers may shift their deposits into higher-cost products or the Company may need to raise its interest rates to remain competitive in the marketplace. Higher funding costs reduce the Company’s net interest income and net income.
Many of our loans and our obligations for borrowed money are priced based on variable interest rates tied to the London Interbank Offered Rate (“LIBOR”). We are subject to risks that LIBOR may no longer be available, or may become unreliable, as a result of the United Kingdom’s Financial Conduct Authority ceasing to require the submission of LIBOR quotes as of December 31, 2021.
The potential cessation of LIBOR quotes or the future unavailability or unreliability of LIBOR creates substantial risks to the banking industry, including us. Unless alternative rates can be negotiated, our variable-rate loans, funding and derivative obligations that specify the use of a LIBOR index, would no longer be able to adjust as anticipated. This would adversely affect our asset/liability management and could lead to more asset and liability mismatches and interest rate risk unless appropriate LIBOR alternatives are developed. It could also disrupt the capital and credit markets as a result of confusion or uncertainty.
14
The Federal Reserve has sponsored the Alternative Reference Rates Committee, (“ARRC”), which serves as a forum to coordinate and track planning as market participants currently using LIBOR consider (a) transitioning to alternative reference rates where it is deemed appropriate and (b) addressing risks in legacy contracts language given the possibility that LIBOR might cease publication. On April 3, 2018 the Federal Reserve began publishing three new reference rates, including the Secured Overnight Financing Rate (“SOFR”). ARRC has recommended SOFR as the alternative to LIBOR, and published fallback interest rate consultations for public comment and a Paced Transition Plan to SOFR use. The Financial Stability Board has taken an interest in LIBOR and possible replacement indices as a matter of risk management. The International Organisation of Securities Commissions, or IOSCO, has been active in this area and is expected to call on market participants to have backup options if a reference rate, such as LIBOR, ceases publication. The International Swap Dealers Association has published guidance on interest rate benchmarks and alternatives in July and August 2018. It cannot be predicted whether SOFR or another index or indices will become a market standard that replaces LIBOR, and if so, the effects on our customers, or our future results of operations or financial condition.
We may be adversely affected by declining oil and gas prices, and declining demand for coal.
Oil and gas drilling and production in Wyoming and in the Bakken Formation in Montana and North Dakota have been important contributors to our region’s economic growth over the years. As of
December 31, 2018
, our direct exposure to the oil and gas industry was approximately $78.2 million in loan commitments, including approximately $61.8 million advanced to oil and gas service companies. As of
December 31, 2018
, we also had commitments to lend an additional $16.4 million to oil and gas borrowers. These borrowers may be significantly affected by volatility in oil and gas prices and declines in the level of drilling and production activity. A prolonged period of low oil and gas prices or other events that result in a decline in drilling activity could have a negative impact on the economies of our market areas and on our customers. We carefully monitor the impact of volatility in oil and gas prices on our loan portfolio. As of
December 31, 2018
, 52.1% of our outstanding oil and gas loans were criticized.
Additionally, adverse developments in the demand for coal due to tightening environmental regulations, the suspension of new coal leasing on federal lands, slower growth in electricity demand, and fuel competition from low natural gas prices, may impact the economies of the Powder River Basin in Montana and Wyoming.
Adverse developments in the energy sector could have spillover effects on the broader economies of our market areas, including commercial and residential real estate values and the general level of economic activity. The State of Wyoming derives a significant portion of its operating budget from energy extraction and related industries. As such, reductions in oil, gas and coal related revenues may have additional negative economic implications for the State of Wyoming. There is no assurance that our business, financial condition, results of operations and cash flows will not be adversely impacted by increases in non-performing oil and gas loans, or by the direct and indirect effects of current and future conditions in the energy industry.
Our goodwill may become impaired, which may adversely impact our results of operations and financial condition.
The excess purchase price over the fair value of net assets from acquisitions, or goodwill, is evaluated for impairment at least annually and on an interim basis if an event or circumstance indicates that it is likely an impairment has occurred. In testing for impairment, the fair value of net assets is estimated based on analyses of our market value, discounted cash flows and peer values. Consequently, the determination of the fair value of goodwill is sensitive to market-based economics and other key assumptions. Variability in market conditions or in key assumptions could result in impairment of goodwill, which is recorded as a non-cash adjustment to income. An impairment of goodwill could have a material adverse effect on our business, financial condition and results of operations. As of
December 31, 2018
, we had goodwill of
$546.7 million
, or
32.3%
of our total stockholders’ equity.
Changes in accounting standards could materially impact our financial statements.
From time to time, the Financial Accounting Standards Board (“FASB”), and the SEC change the financial accounting and reporting standards that govern the preparation of our financial statements. These changes can materially impact how we record and report our financial condition and results of operations. For example, the FASB issued amendments to its guidance on the credit impairment of financial instruments. The amendments, which will be effective for our first fiscal year after December 15, 2019, would introduce a new impairment model based on current expected credit losses (“CECL”), rather than incurred losses. The CECL model would apply to most debt instruments, including loan receivables and loan commitments. The amendment may require us to increase our allowance for loan losses, may cause volatility in our allowance for loan losses, may negatively impact our capital ratios, and the costs of collecting, reviewing, and analyzing the additional data required may have an adverse effect on our operational results.
15
We are dependent upon the services of our management team and directors.
Our future success and profitability is substantially dependent upon the management skills of our executive officers and directors, many of whom have held officer and director positions with us for many years. We currently have employment agreements or non-competition agreements with five of our key executives: Kevin P. Riley, our president and chief executive officer, Marcy D. Mutch, our chief financial officer, Renee L. Newman, our chief banking officer, Jodi Delahunt Hubbell, our chief operating officer, and Philip G. Gaglia, our chief risk officer. We do not have employment agreements with the other executives. The unanticipated loss or unavailability of key employees could harm our ability to operate our business or execute our business strategy. We may not be successful in retaining key employees or finding and integrating suitable successors in the event of key employee loss or unavailability.
We may not be able to attract and retain qualified employees to operate our business effectively.
As a result of low unemployment rates in our historical geographical footprint and the Northwest region of the U.S., there is substantial competition for qualified personnel in our markets. It may be difficult for us to attract and retain qualified employees at all management and staffing levels. Failure to attract and retain employees and maintain adequate staffing of qualified personnel could adversely impact our operations and our ability to execute our business strategy. Furthermore, relatively low unemployment rates may lead to significant increases in salaries, wages and employee benefits expenses as we compete for qualified and skilled employees, which could negatively impact our results of operations and prospects.
Changes in new governmental regulation and new or changes in existing regulation could have a material adverse effect on the Company.
The Company is extensively regulated under federal and state banking laws and regulations that are intended primarily for the protection of depositors, the DIF and the banking system as a whole. Both the scope of the laws and regulations and the intensity of the supervision to which our business is subject have increased in recent years, in response, we believe, to the financial crisis as well as other factors such as technological and market changes. Regulatory enforcement and fines have also increased across the banking and financial services sector. Many of these changes have occurred as a result of the Dodd-Frank Act and its implementing regulations, most of which are now in place. The Company expects its business will remain subject to extensive regulation and supervision.
Regulations, along with the currently existing tax, accounting, securities, insurance, employment, monetary and other laws and regulations, rules, standards, policies and interpretations control the methods by which we conduct business, implement strategic initiatives and tax compliance and govern financial reporting and disclosures. In addition, the Company is subject to changes in federal and state laws as well as changes in banking and credit regulations and governmental economic and monetary policies. Congress may enact legislation from time to time that affects the regulation of the financial services industry, and state legislatures may enact legislation from time to time affecting the regulation of financial institutions chartered by or operating in those states. Federal and state regulatory agencies also periodically propose and adopt changes to their regulations or change the manner in which existing regulations are applied. The regulatory environment for financial institutions entails significant potential increases in compliance requirements and associated costs, including those related to consumer credit, such as mortgage lending. Any regulatory changes could adversely and materially affect the Company.
We may be subject to more stringent capital requirements in the future.
Federal and state banking regulators also possess broad powers to take supervisory actions as they deem appropriate. These supervisory actions may result in higher capital requirements, higher deposit insurance premiums and limitations on the Company’s activities that could have a material adverse effect on its business and profitability. For example, in July 2013, the FDIC and the federal banking agencies approved a new rule that substantially amended the regulatory risk-based capital rules applicable to us by adopting “Basel III” regulatory capital reforms and, other change required by the Dodd-Frank Act.
16
That rule included minimum risk-based capital and leverage ratios, which became effective for us on January 1, 2015, and refined the definition of what constitutes “capital” for calculating these ratios. The rule required unrealized gains and losses on certain “available-for-sale” securities holdings to be included for calculating regulatory capital requirements unless a one-time opt-out is exercised. In addition, the final rule established a “capital conservation buffer” that, once fully phased in and combined with established minimum common equity, risk based assets capital, and total capital ratios, will exceed the prompt corrective action “well-capitalized” thresholds. (According to the Federal Deposit Insurance Corporation Improvement Act of 1991, a depository institution is “well-capitalized” if it has a total risk-based capital ratio of 10% or greater; a Tier 1 risk-based capital ratio of 8.0% or greater; a Tier 1 leverage ratio of 5.0% or greater; a common equity Tier 1 capital ratio of 6.5% or greater; and is not subject to a regulatory order, agreement, or directive to meet and maintain a specific capital level for any capital measure.)
In January 2019, the phase-in of the new capital conservation buffer requirement was completed. An institution will be subject to limitations on paying dividends, engaging in share repurchases and paying discretionary bonuses if its capital level falls below the buffer amount. These limitations will establish a maximum percentage of eligible retained income that can be utilized for such actions.
The table below compares minimum required capital ratios and the well-capitalized minimums to current actual ratios for the Company and the Bank on a transitional phase-in basis as of
December 31, 2018
. The well-capitalized standard for the Company is from Regulation Y and the well-capitalized standard for the Bank is from Prompt Corrective Action, or PCA, regulations.
|
Phase-In
|
Fully Phased-In
|
Well-Capitalized Minimums
|
|||||
|
Minimum Regulatory
|
Minimum Ratio + Capital
|
Minimum Ratio + Capital
|
|||||
|
Capital Ratio
|
Conservation Buffer
|
Conservation Buffer
|
For the Company
|
For the Bank
|
The Company
|
The Bank
|
|
|
Common Equity Tier 1 Capital Ratio
|
4.50%
|
6.375%
|
7.00%
|
N/A
|
6.50%
|
11.40%
|
11.27%
|
|
Tier 1 Capital Ratio
|
6.00%
|
7.875%
|
8.50%
|
6.00%
|
8.00%
|
12.26%
|
11.27%
|
|
Total Capital Ratio
|
8.00%
|
9.875%
|
10.50%
|
8.00%
|
10.00%
|
12.99%
|
12.01%
|
|
Tier 1 Leverage Ratio
|
4.00%
|
N/A
|
N/A
|
N/A
|
5.00%
|
9.47%
|
8.97%
|
Our Company faces cybersecurity risks, including
“
denial-of-service attacks,
”
“
hacking
”
and
“
identity theft
”
that could result in the disclosure of confidential information, adversely affect our business or reputation and create significant legal and financial exposure.
Our computer systems and network infrastructure are subject to security risks and could be susceptible to cyber-attacks, such as denial of service attacks, hacking, terrorist activities, or identity theft. Financial services institutions and companies engaged in data processing have reported breaches in the security of their websites or other systems, some of which have involved sophisticated and targeted attacks intended to obtain unauthorized access to confidential information, destroy data, disable or degrade service, or sabotage systems, often through the introduction of computer viruses, malware, cyber-attacks, and other means. Denial-of-service attacks have been launched against a number of large financial services institutions, primarily resulting in inconvenience. Future cyber-attacks could be more disruptive and damaging. Hacking and identity theft risks, in particular, could cause serious reputational harm to the Company and the Bank.
In addition, we provide our customers with the ability to bank remotely, including online, through their mobile device and over the telephone. The secure transmission of confidential information over the internet and other remote channels is a critical element of remote banking. Our network could be vulnerable to unauthorized access, computer viruses, phishing schemes and other internal and external security breaches. We may be required to spend significant capital and other resources to protect against the threat of security breaches and computer viruses, or to alleviate problems caused by security breaches or viruses. To the extent that our activities or the activities of our customers involve the storage and transmission of confidential information, security breaches and viruses could expose us to claims, regulatory scrutiny, litigation, and other possible liabilities.
17
Despite efforts to ensure the integrity of our systems, cyber threats are rapidly evolving and we may not be able to anticipate or prevent all such attacks, nor may we be able to implement guaranteed preventive measures against such security breaches. The techniques used by cyber criminals change frequently, may not be recognized until launched, and can originate from a wide variety of sources, including outside groups such as external service providers. These risks may increase in the future as we continue to increase our mobile payment and other internet-based product offerings and expand our internal usage of web-based products and applications.
Further, targeted social engineering attacks may be sophisticated and difficult to prevent and our employees, customers or other users of our systems may be fraudulently induced to disclose sensitive information, allowing cyber criminals to gain access to our data or data of our customers.
A successful penetration or circumvention of system security could cause us serious negative consequences, including significant disruption of operations, misappropriation of confidential information, or damage to our computers or systems or to those of our customers and counterparties. A successful security breach could result in violations of applicable privacy and other laws, financial loss to us or to our customers, loss of confidence in our security measures, significant litigation exposure, and harm to our reputation, all of which could have a material adverse effect on our business, financial condition, results of operations, and prospects.
We are subject to liquidity risks.
Liquidity is the ability to meet current and future cash flow needs on a timely basis at a reasonable cost. Our liquidity is used to make loans and to repay deposit liabilities as they become due or are demanded by customers. Potential alternative sources of liquidity include federal funds purchased and securities sold under repurchase agreements. We maintain a portfolio of investment securities and hold overnight funds that may be used as a secondary source of liquidity to the extent the securities are not pledged for collateral. Other potential sources of liquidity include the sale of loans, the utilization of available government and regulatory assistance programs, the ability to acquire brokered deposits, the issuance of additional collateralized borrowings such as Federal Home Loan Bank advances, the issuance of debt or equity securities and borrowings through the Federal Reserve’s discount window. Without sufficient liquidity from these potential sources, we may not be able to meet the cash flow requirements of our depositors and borrowers.
Additionally, our access to funding sources in amounts adequate to finance our activities or on terms that are acceptable to us could be impaired by factors specific to us, the financial services industry or the economy in general. Factors that could reduce our access to liquidity sources include a downturn in our local or national economies, difficult or illiquid credit markets or adverse regulatory actions against us. A failure to maintain adequate liquidity could have a material adverse effect on our regulatory standing, business, financial condition, and results of operations.
The Company may not be able to complete future acquisitions, or grow organically or through acquisitions.
Historically, the Company has expanded through a combination of organic growth and acquisitions. If market and regulatory conditions were to become challenging, the Company may be unable to grow organically or successfully complete potential future acquisitions. The Company has historically used its strong stock currency to complete acquisitions. Downturns in the stock market and the Company’s stock could have an impact on future acquisitions. Furthermore, there can be no assurance that the Company can successfully complete such transactions, since they are subject to regulatory review and approval.
Costs associated with repossessed properties, including environmental remediation, may adversely impact our results of operations, cash flows and financial condition.
A significant portion of our loan portfolio is secured by real property. During the ordinary course of business, we may foreclose on and take title to properties serving as collateral for certain loans. There are significant costs associated with our ownership of these properties including, but not limited to, personnel costs, taxes and insurance, completion and repair costs, and valuation adjustments. Additionally, we may experience unfavorable pricing in connection with our disposition of foreclosed properties. These costs, along with unfavorable pricing upon disposition, may adversely affect our cash flows, financial condition and results of operations.
18
If hazardous or toxic substances are found on these properties, we may be liable for remediation costs, as well as for personal injury and property damage. Environmental laws may require us to incur substantial expenses and may materially reduce the affected property’s value or limit our ability to use or sell the affected property. In addition, future laws or more stringent interpretations or enforcement policies with respect to existing laws may increase our exposure to environmental liability. The remediation costs and any other financial liabilities associated with an environmental hazard could have a material adverse effect on our cash flows, financial condition and results of operations.
Our systems of internal operating controls may not be effective.
We establish and maintain systems of internal operational controls that provide us with critical information used to manage our business. These systems are subject to various inherent limitations, including cost, judgments used in decision-making, assumptions about the likelihood of future events, the soundness of our systems, the possibility of human error and the risk of fraud. Moreover, controls may become inadequate because of changes in conditions or processes and the risk that the degree of compliance with policies or procedures may deteriorate over time. Because of these limitations, any system of internal operating controls may not be successful in preventing all errors or fraud or in making all material information known in a timely manner to the appropriate levels of management. From time to time, control deficiencies and losses from operational malfunctions or fraud have occurred and may occur in the future. Any future deficiencies, weaknesses or losses related to internal operating control systems could have an adverse effect on our business, financial condition, results of operations, and prospects.
The Company may experience significant competition from new or existing competitors, which may reduce its customer base or cause it to lower prices for its products and services in order to maintain market share.
There is intense competition among banks in the Company’s market area. In addition, the Company competes with other providers of financial services, such as savings and loan associations, credit unions, consumer finance companies, securities firms, insurance companies, commercial finance and leasing companies, factoring companies, the mutual funds industry, fin-tech companies, full-service brokerage firms, and discount brokerage firms, some of which are subject to less extensive regulations than us with respect to the products and services they provide. Our success depends, in part, on our ability to adapt our products and services to evolving industry standards and customer expectations. There is increasing pressure to provide products and services at lower prices. Lower prices can reduce our net interest margin and revenues from our fee-based products and services.
In addition, the adoption of new technologies by competitors, including internet banking services, mobile applications and advanced ATM functionality could require us to make substantial expenditures to modify or adapt our existing products and services. Also, these and other capital investments in our business may not produce expected growth in earnings anticipated at the time of the expenditure. The Company may not be successful in introducing new products and services, achieving market acceptance of its products and services, anticipating or reacting to consumers’ changing technological preferences or developing and maintaining loyal customers. In addition, we could lose market share to the shadow banking system or other non-traditional banking organizations.
Some of our larger competitors may have greater capital and resources than the Company, may have higher lending limits and may offer products and services not offered by us. Any potential adverse reactions to our financial condition or status in the marketplace, as compared to its competitors, could limit our ability to attract and retain customers and to compete for new business opportunities. The inability to attract and retain customers or to effectively compete for new business may have a material and adverse effect on our financial condition and results of operations.
The Company also experiences competition from nonbank companies inside and outside of its market area and, in some cases, from companies other than those traditionally considered financial sector participants. In particular, technology companies have begun to focus on the financial sector and offer software and products primarily over the Internet, with an increasing focus on mobile device delivery. These companies generally are not subject to regulatory requirements comparable to those to which financial institutions are subject, and may accordingly realize certain cost savings and offer products and services at more favorable rates and with greater convenience to the customer. For example, a number of companies offer bill pay and funds transfer services that allow customers to avoid using a bank. Technology companies are generally positioned and structured to quickly adapt to technological advances and directly focus resources on implementing those advances. This competition could result in the loss of fee income and customer deposits and related income. In addition, changes in consumer spending and saving habits could adversely affect our operations, and the Company may be unable to develop competitive and timely new products and services in response. As the pace of technology and change advance, continuous innovation is expected to exert long-term pressure on the financial services industry.
19
The Company relies on other companies to provide certain key components of its business infrastructure.
We are reliant upon certain external vendors to provide products and services necessary to maintain our day-to-day operations and we outsource many of our major systems, such as certain data processing, loan servicing and deposit processing systems. While the Company has selected these external vendors and systems carefully, and continues to manage and oversee these vendors, it does not control their operations. Failure of certain external vendors or systems to perform or provide services in accordance with contractual arrangements could be disruptive to our operations and limit our ability to provide certain products and services demanded by our customers. Because our information technology and telecommunications systems interface with and depend on third-party systems, we could experience disruptions if demand for such services exceeds capacity or such third-party systems fail or experience interruptions. If significant, sustained or repeated, a system failure or disruption could compromise our ability to operate effectively, damage our reputation, result in a loss of customer business, and/or subject us to additional regulatory scrutiny and possible financial liability. Any of the failures or disruptions mentioned above, could negatively impact our financial condition, results of operations, cash flows, and prospects. Replacing these third party vendors could also entail significant delay and expense.
The resolution of litigation, if unfavorable, could have a material adverse effect on our results of operations for a particular period.
We face legal risks in our businesses, and the volume of claims and amount of damages and penalties claimed in litigation and regulatory proceedings against financial institutions remains high. Legal liability against us could have material adverse financial effects or cause harm to our reputation, which in turn could adversely impact our business prospects.
Additionally, some of the services we provide, such as trust and investment services, require us to act as fiduciaries for our customers and others. From time to time, third parties may make claims and take legal action against us pertaining to the performance of our fiduciary responsibilities. If these claims and legal actions are not resolved in a manner favorable to us, we may be exposed to significant financial liability and/or our reputation could be damaged. Either of these results may adversely impact demand for our products and services or otherwise have a harmful effect on our business, financial condition, and results of operations.
We may not effectively implement new technology-driven products and services or be successful in marketing these products and services to our customers.
The financial services industry is continually undergoing rapid technological change with frequent introductions of new technology-driven products and services. The effective use of technology enables financial institutions to better serve customers and to perform more efficiently. Our future success depends, in part, upon our ability to use technology to provide products and services that will satisfy customers’ demands for convenience, as well as to create additional efficiencies in our operations. Many of our competitors have substantially greater resources to invest in technological improvements. We may not be able to effectively implement new technology-driven products and services or be successful in marketing these products and services to our customers. Failure to successfully keep pace with technological change affecting the financial services industry could have a material adverse impact on our business and, in turn, on our financial condition, results of operations and prospects.
The soundness of other financial institutions could adversely affect the Company.
Financial services companies are interrelated as a result of trading, clearing, counterparty or other relationships. We have exposure to many different industries and counterparties. For example, we execute transactions with counterparties in the financial services industry, including brokers and dealers, commercial banks, investment banks and other institutional clients. As a result, defaults by, or even rumors or questions about, one or more financial services companies or the financial services industry generally, have led to market-wide liquidity problems and could lead to losses or defaults by us or by other institutions. Many of these transactions expose us to increased credit risk in the event of default of a counterparty or client.
Our business is subject to the risks of earthquakes, tsunamis, floods, fires, and other natural catastrophic events.
A major catastrophe, such as an earthquake, tsunami, flood, fire, winter storms, or other natural disaster could adversely affect our financial condition or result in a prolonged interruption of our business. We have operations and customers in the Northwest, a geographical region that has been or may be affected by earthquake, volcano, tsunami, and flooding activity, which could be adversely impacted by these natural disasters or other severe weather in the region. Unpredictable natural and other disasters could have an adverse effect on the Company in that such events could materially disrupt our operations or the ability or willingness of our customers to access the financial services offered by the Company. These events could reduce our earnings and cause volatility in its financial results for any fiscal quarter or year and have a material adverse effect on our financial condition and/or results of operations and prospects.
20
Risks Relating to Our Common Stock
Volatility in the price and volume of our stock may be unfavorable.
The market price of our Class A common stock is volatile and could be subject to wide fluctuations in price in response to various factors, some of which are beyond our control. These factors include:
|
•
|
prevailing market conditions;
|
|
•
|
our historical performance and capital structure;
|
|
•
|
estimates of our business potential and earnings prospects;
|
|
•
|
an overall assessment of our management;
|
|
•
|
conversion by our Class B shareholders of their shares into Class A common stock to liquidate their holdings;
|
|
•
|
our performance relative to our peers;
|
|
•
|
market demand for our shares;
|
|
•
|
perceptions of the banking industry in general;
|
|
•
|
political influences on investor sentiment; and
|
|
•
|
consumer confidence.
|
At times the stock markets, including the NASDAQ Stock Market, on which our Class A common stock is listed, may experience significant price and volume fluctuations. As a result, the market price of our Class A common stock is likely to be similarly volatile and investors in our Class A common stock may experience a decrease in the value of their shares, including decreases unrelated to our operating performance or prospects. Further, because our Class B common stock is convertible on a share-for-share basis into Class A common stock and the share price of our Class B common stock is based upon the share price of our Class A common stock, our Class B common stock price is similarly impacted by the factors affecting our Class A common stock.
In addition, following periods of volatility in the overall market and the market price of a company’s securities, securities class action litigation has often been instituted against companies. This litigation, if instituted against us, could result in substantial costs and a diversion of our management’s attention and resources.
Our dividend policy, or our ability to pay dividends, may change.
We are a legal entity separate and distinct from our subsidiary Bank. Since we are a holding company with no significant assets other than the capital stock of our subsidiaries, we depend upon dividends from our Bank for a substantial part of our revenue. Accordingly, our ability to pay dividends, cover operating expenses, and acquire other institutions depends primarily upon the receipt of dividends or other capital distributions from the Bank. The ability of our Bank to pay dividends to us is subject to, among other things, its earnings, financial condition and need for funds, as well as federal and state governmental policies and regulations applicable to us and the Bank, which limit the amount that may be paid as dividends without prior approval.
Although we have historically paid dividends to our stockholders, we have no obligation to continue doing so and may change our dividend policy at any time without notice to our stockholders. Holders of our common stock are only entitled to receive such cash dividends as our board of directors may declare out of funds legally available for such payments. The amount of any dividend declaration is subject to our evaluation of our strategic plans, growth initiatives, capital availability, projected liquidity needs and other factors.
An investment in our common stock is not an insured deposit.
Our Class A and Class B common stock is not a bank savings account or deposit and, therefore, is not insured against loss by the FDIC, any other deposit insurance fund or any other public or private entity. As a result, holders of our common stock could lose some or all of their investment.
21
Holders of the Class B common stock have voting control of the Company and are able to determine virtually all matters submitted to stockholders, including potential change in control transactions.
Members of the Scott family control a majority of the voting power of our outstanding common stock. Due to their holdings of common stock, members of the Scott family are able to determine the outcome of virtually all matters submitted to stockholders for approval, including the election of directors, amendment of our articles of incorporation (except when a class vote is required by law or pursuant to our articles of incorporation), any merger or consolidation requiring common stockholder approval and the sale of all or substantially all of our assets. Accordingly, such holders have the ability to prevent change in control transactions as long as they maintain voting control of the company.
In addition, because these holders have the ability to elect all of our directors they are able to control our policies and operations, including the appointment of management, the payments of dividends on our common stock, and entering into extraordinary transactions, and their interests may not in all cases be aligned with the interests of all stockholders. The Scott family members have entered into a stockholder agreement giving family members a right of first refusal to purchase shares of Class B common stock that are intended to be sold or transferred, subject to certain exceptions, by other family members. This agreement may have the effect of continuing ownership of the Class B common stock and control within the Scott family. This concentrated control limits stockholders’ ability to influence corporate matters. As a result, the market price of our Class A common stock could be adversely affected.
“Anti-takeover” provisions and the regulations to which we are subject may also make it more difficult for a third party to acquire control of us, even if the change in control would be beneficial to stockholders.
We are a financial and bank holding company incorporated in the State of Montana. Anti-takeover provisions in Montana law and our articles of incorporation and bylaws, as well as regulatory approvals that would be required under federal law, could make it more difficult for a third party to acquire control of us and may prevent stockholders from receiving a premium for their shares of our Class A common stock. These provisions could adversely affect the market price of our Class A common stock and could reduce the amount that Class A and Class B stockholders might receive if we are sold.
Our articles of incorporation provide that our Board may issue up to 100,000 shares of preferred stock, in one or more series, without stockholder approval and with such terms, conditions, rights, privileges and preferences as the Board may deem appropriate. In addition, our articles of incorporation provide for staggered terms for our Board and limitations on persons authorized to call a special meeting of stockholders. In addition, certain provisions of Montana law may have the effect of inhibiting a third party from making a proposal to acquire us or of impeding a change of control under circumstances that otherwise could provide the holders of our Class A and Class B common stock with the opportunity to realize a premium over the then-prevailing market price of such Class A common stock.
Further, the acquisition of specified amounts of our common stock (in some cases, the acquisition or control of more than 5% of our voting stock) may require certain regulatory approvals, including the approval of the Federal Reserve and one or more of our state banking regulatory agencies. The filing of applications with these agencies and the accompanying review process can take several months. Additionally, as discussed above, the holders of the Class B common stock will have voting control of the Company. This and the other factors described above may hinder or even prevent a change in control of us, even if a change in control would be beneficial to our stockholders.
We qualify as a “controlled company” under the NASDAQ Marketplace Rules and may rely on exemptions from certain corporate governance requirements.
Due to the combined voting power of the members of the Scott family, we qualify as a “controlled company” under the NASDAQ Marketplace Rules. As a “controlled company” we are exempt from certain NASDAQ corporate governance requirements, including the requirements that:
|
•
|
a majority of the board of directors consist of independent directors;
|
|
•
|
the compensation of officers be determined, or recommended to the board of directors for determination, by a majority of the independent directors or a compensation committee comprised solely of independent directors; and
|
|
•
|
director nominees be selected, or recommended for the board of directors’ selection, by a majority of the independent directors or a nominating committee comprised solely of independent directors with a written charter or board resolution addressing the nomination process.
|
22
As a result, our future compensation and governance and nominating committees may not consist entirely of independent directors. As long as we choose to rely on these exemptions from NASDAQ Marketplace Rules, stockholders will not have the same protections afforded to stockholders of companies that are subject to all of the NASDAQ corporate governance requirements.
Future equity issuances could result in dilution, which could cause our common stock price to decline.
We may issue additional Class A common stock in the future pursuant to current or future employee equity compensation plans or in connection with future acquisitions or financings. Should we choose to raise capital by selling shares of Class A common stock for any reason, the issuance would have a dilutive effect on the holders of our Class A and Class B common stock and could have a material negative effect on the market price of our Class A common stock. In addition, our Class B common stock is convertible into Class A common stock at any time at the sole discretion of the holders of Class B shares or automatically if, on the record date for any meeting of stockholders, the number of outstanding Class B shares constitutes less than twenty percent of the aggregate number of common stock then outstanding.
The common stock is equity and is subordinate to our existing and future indebtedness.
Shares of our Class A and Class B common stock are equity interests and do not constitute indebtedness. As such, shares of our Class A and Class B common stock rank junior to all our indebtedness, including any subordinated term loans, subordinated debentures held by trusts that have issued trust preferred securities other non-equity claims on us with respect to assets available to satisfy claims on us. In the future, we may make additional offerings of debt or equity securities or, we may issue additional debt or equity securities as consideration for future mergers and acquisitions.
Item 1B. Unresolved Staff Comments
None.
Item 2. Properties
Our principal executive offices and one of our banking offices are anchor tenants in an eighteen story commercial building located in Billings, Montana. The building is owned by a joint venture limited liability company in which FIB owns a
50.0%
interest. We lease approximately 105,616 square feet of office space in the building. We also own a 65,226 square foot building that houses our operations center in Billings, Montana. We provide banking services at an additional
147
locations in Idaho, Montana, Oregon, South Dakota, Washington, and Wyoming, of which
39
properties are leased from independent third parties and
108
properties are owned by us. We believe each of our facilities is suitable and adequate to meet our current operational needs.
Item 3. Legal Proceedings
In the normal course of business, we are named or threatened to be named as a defendant in various lawsuits. Management, following consultation with legal counsel, does not expect the ultimate disposition of one or a combination of these matters to have a material adverse effect on our business.
Item 4. Mine Safety Disclosures
Not applicable.
23
PART II
Item 5. Market for Registrant’s Common Equity, Related Stockholder Matters and Issuer Purchases of Equity Securities
Description of Our Capital Stock
Our articles provide for Class A and Class B common stock. Class B common stock is convertible into Class A common stock as described below. Our common stock is uncertificated.
Our authorized capital stock consists of
200,100,000
shares, each with no par value per share, of which:
|
•
|
100,000,000
shares are designated as Class A common stock;
|
|
•
|
100,000,000
shares are designated as Class B common stock; and
|
|
•
|
100,000
shares are designated as preferred stock.
|
At
December 31, 2018
, we had issued and outstanding
38,169,575
shares of Class A common stock and
22,453,672
shares of Class B common stock. At
December 31, 2018
, we also had outstanding stock options to purchase an aggregate of 338,329 shares of our Class A common stock and 89,847 shares of our Class B common stock.
Members of the Scott family control 71.0% of the voting power of our outstanding common stock. The Scott family members have entered into a stockholder agreement giving family members a right of first refusal to purchase shares of Class B common stock that are intended to be sold or transferred, subject to certain exceptions, by other family members. This agreement may have the effect of continuing ownership of the Class B common stock and control of our Company within the Scott family.
Due to the ownership and control of our Company by members of the Scott family, we are a “controlled company” as that term is used under the NASDAQ Marketplace Rules. As a “controlled company,” we may rely on exemptions from certain NASDAQ corporate governance requirements, including those regarding independent director requirements for the Board and committees of the Board.
Preferred Stock
Our Board is authorized, without approval of the holders of Class A common stock or Class B common stock, to provide for the issuance of preferred stock from time to time in one or more series in such number and with such designations, preferences, powers and other special rights as may be stated in the resolution or resolutions providing for such preferred stock. Our Board may cause us to issue preferred stock with voting, conversion and other rights that could adversely affect the holders of Class A common stock or Class B common stock or make it more difficult to effect a change in control.
Common Stock
The holders of our Class A common stock are entitled to
one
vote per share and the holders of our Class B common stock are entitled to
five
votes per share on any matter to be voted upon by the stockholders. Holders of Class A common stock and Class B common stock vote together as a single class on all matters (including the election of directors) submitted to a vote of stockholders, unless otherwise required by law, if Class A common stock and Class B common stockholders would receive different economic benefits, or if certain changes to our articles of incorporation are proposed.
The holders of common stock are not entitled to cumulative voting rights with respect to the election of directors, which means that the holders of a majority of the shares voted can elect all of the directors then standing for election. Directors are elected by a plurality of shares present in person or represented by proxy at a shareholder meeting.
The holders of our Class A common stock and Class B common stock are entitled to share equally in any dividends that our Board may declare from time to time from legally available funds and assets, subject to limitations under Montana law and the preferential rights of holders of any outstanding shares of preferred stock. If a dividend is paid in the form of shares of common stock or rights to acquire shares of common stock, the holders of Class A common stock will be entitled to receive Class A common stock, or rights to acquire Class A common stock, as the case may be and the holders of Class B common stock will be entitled to receive Class B common stock, or rights to acquire Class B common stock, as the case may be.
24
Upon any voluntary or involuntary liquidation, dissolution, distribution of assets or winding up of our company, the holders of our Class A common stock and Class B common stock are entitled to share equally, on a per share basis, in all our assets available for distribution, after payment to creditors and subject to any prior distribution rights granted to holders of any outstanding shares of preferred stock.
Our Class A common stock is not convertible into any other shares of our capital stock. Any holder of Class B common stock may at any time convert his or her shares into shares of Class A common stock on a share-for-share basis. The shares of Class B common stock will automatically convert into shares of Class A common stock on a share-for-share basis:
|
•
|
when the number of shares of Class B Common Stock constitutes less than 20% of the aggregate number of shares of Common Stock then outstanding as of the record date for a shareholder meeting, as determined by the Board of Directors of the Corporation, each share of Class B Common Stock then issued and outstanding is automatically converted into one fully paid and non-assessable share of Class A Common Stock and will have one vote per share; or
|
|
•
|
upon any transfer, whether or not for value, except for transfers to the holder’s spouse, certain of the holder’s relatives, the trustees of certain trusts established for their benefit, corporations and partnerships wholly-owned by the holders and their relatives, the holder’s estate and other holders of Class B common stock.
|
Once converted into Class A common stock, the Class B common stock cannot be reissued. No class of common stock may be subdivided or combined unless the other class of common stock concurrently is subdivided or combined in the same proportion and in the same manner.
Other than in connection with dividends and distributions, subdivisions or combinations, the exercise of stock options for Class B shares or certain other circumstances, we are not authorized to issue additional shares of Class B common stock.
Class A and Class B common stock do not have any preemptive rights.
The Class B common stock is not and will not be listed on the NASDAQ Stock Market or any other exchange. Therefore, no trading market is expected to develop in the Class B common stock. Class A common stock is listed on the NASDAQ Stock Market under the symbol “FIBK.”
The table below sets forth, for each quarter in the past two years, the quarterly high and low sales prices per share of the Class A common stock, as reported by the NASDAQ Stock Market, and dividends paid per share on our common stock.
|
Quarter Ended
|
High
|
Low
|
Common Dividends Paid
|
|||
|
March 31, 2017
|
$45.35
|
$37.15
|
$0.24
|
|||
|
June 30, 2017
|
41.05
|
33.70
|
0.24
|
|||
|
September 30, 2017
|
38.40
|
33.33
|
0.24
|
|||
|
December 31, 2017
|
41.25
|
36.00
|
0.24
|
|||
|
March 31, 2018
|
42.90
|
38.10
|
0.28
|
|||
|
June 30, 2018
|
44.95
|
38.70
|
0.28
|
|||
|
September 30, 2018
|
47.05
|
41.95
|
0.28
|
|||
|
December 31, 2018
|
46.51
|
34.61
|
0.28
|
|||
As of
December 31, 2018
, we had 1,267 record shareholders, including the Wealth Management division of FIB as trustee for 698,484 shares of Class A common stock held on behalf of 745 individual participants in the Savings and Profit Sharing Plan for Employees of First Interstate BancSystem, Inc., or the Savings Plan. The Savings Plan Trustee votes the shares based on the instructions of each participant. In the event the participant does not provide the Savings Plan Trustee with instructions, the Savings Plan Trustee votes those shares in accordance with voting instructions received from a majority of the participants in the plan.
25
Dividends
It is our policy to pay a quarterly dividend to all common shareholders. The Board recently announced an increase in its quarterly cash dividends amount to
$0.31
per share of common stock. We currently intend to continue paying quarterly dividends; however, the Board may change or eliminate the payment of future dividends.
Dividend Restrictions
For a description of restrictions on the payment of dividends, see Part I, Item 1, “Business — Regulation and Supervision — Dividends and Restrictions on Transfers of Funds,” and Part II, Item7, “Management’s Discussion and Analysis of Financial Condition and Results of Operations — Capital Resources and Liquidity Management” included herein.
Sales of Unregistered Securities
There were no sales of unregistered equity securities by us during the years ended
December 31, 2018
,
2017
, or
2016
that were not registered under the Securities Act of 1933.
Equity Compensation Plan Information
Information regarding securities authorized for issuance under equity compensation plans is provided in Part III, “Item 12. Security Ownership of Certain Beneficial Owners and Management and Related Stockholder Matters” of this Report.
Purchases of Equity Securities by the Issuer and Affiliated Purchasers
The following table provides information with respect to purchases made by or on behalf of us or any “affiliated purchasers” (as defined in Rule 10b-18(a)(3) under the Exchange Act), of our common stock during the three months ended
December 31, 2018
.
|
Total Number of
|
Maximum Number
|
|||||||||
|
Shares Purchased as Part
|
of Shares That May
|
|||||||||
|
Total Number of
|
Average Price
|
of Publicly Announced
|
Yet Be Purchased Under
|
|||||||
|
Period
|
Shares Purchased (1)
|
Paid Per Share
|
Plans or Programs
|
the Plans or Programs
|
||||||
|
October 2018
|
—
|
$
|
—
|
|
—
|
24,123
|
||||
|
November 2018
|
—
|
—
|
|
—
|
24,123
|
|||||
|
December 2018
|
581
|
44.07
|
|
—
|
24,123
|
|||||
|
Total
|
581
|
$
|
44.07
|
|
—
|
24,123
|
||||
|
(1)
|
Stock repurchases were redemptions of vested restricted shares tendered in lieu of cash for payment of income tax withholding amounts by participants of the Company’s 2015 Equity Compensation Plan.
|
26
Performance Graph
The performance graph below compares the cumulative total shareholder return on our Class A common stock with the cumulative total return on equity securities of companies included in the NASDAQ Composite Index and the SNL U.S. Bank NASDAQ index, measured on the last trading day of each year shown. The SNL U.S. Bank NASDAQ index is a comparative peer index comprised of financial companies, including banks, savings institutions and related holding companies that perform banking-related functions, listed on the NASDAQ Stock Market. The NASDAQ Composite Index is a comparative broad market index comprised of all domestic and international common stocks listed on the NASDAQ Stock Market. This graph assumes a $100 investment in our Class A common stock on
December 31, 2013
, and reinvestment of dividends on the date of payment without commissions. The plot points on the graph were provided by SNL Financial LC, Charlottesville, VA. The performance graph represents past performance, which may not be indicative of the future performance of our Class A common stock.
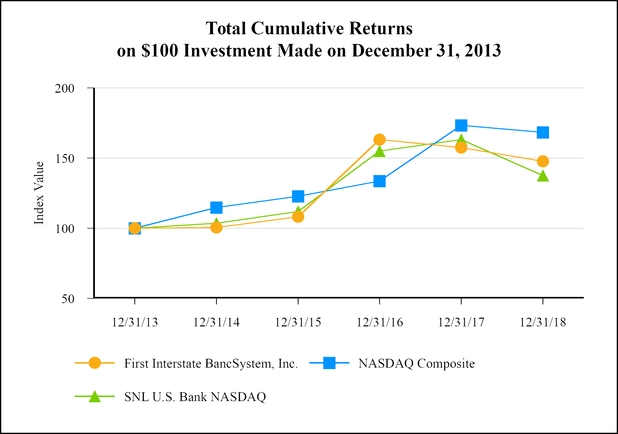
|
|
||||||||||||||||||
|
Index
|
12/31/13
|
12/31/14
|
12/31/15
|
12/31/16
|
12/31/17
|
12/31/18
|
||||||||||||
|
First Interstate BancSystem, Inc.
|
$
|
100.00
|
|
$
|
100.49
|
|
$
|
108.15
|
|
$
|
163.23
|
|
$
|
157.53
|
|
$
|
147.67
|
|
|
NASDAQ Composite
|
100.00
|
|
114.75
|
|
122.74
|
|
133.62
|
|
173.22
|
|
168.30
|
|
||||||
|
SNL U.S. Bank NASDAQ
|
100.00
|
|
103.57
|
|
111.80
|
|
155.02
|
|
163.20
|
|
137.56
|
|
||||||
27
Item 6. Selected Consolidated Financial Data
The following selected consolidated financial data with respect to our consolidated financial position as of
December 31, 2018
and
2017
, and the results of our operations for the fiscal years ended
December 31, 2018
,
2017
and
2016
, has been derived from our audited consolidated financial statements included in Part IV, Item 15. This data should be read in conjunction with Part II, Item 7, “Management’s Discussion and Analysis of Financial Condition and Results of Operations” and such consolidated financial statements, including the notes thereto. The selected consolidated financial data with respect to our consolidated financial position as of
December 31, 2016
,
2015
and
2014
, and the results of our operations for the fiscal years ended
December 31, 2015
and
2014
, has been derived from our audited consolidated financial statements not included herein.
|
Five Year Summary
(Dollars in millions except share and per share data)
|
|||||||||||||||
|
As of or for the year ended December 31,
|
2018
|
2017
|
2016
|
2015
|
2014
|
||||||||||
|
Selected Balance Sheet Data:
|
|
|
|
|
|
||||||||||
|
Net loans
|
$
|
8,430.7
|
|
$
|
7,542.2
|
|
$
|
5,402.3
|
|
$
|
5,169.4
|
|
$
|
4,823.2
|
|
|
Investment securities
|
2,677.5
|
|
2,693.2
|
|
2,124.5
|
|
2,057.5
|
|
2,287.1
|
|
|||||
|
Total assets
|
13,300.2
|
|
12,213.3
|
|
9,063.9
|
|
8,728.2
|
|
8,609.9
|
|
|||||
|
Deposits
|
10,680.7
|
|
9,934.9
|
|
7,376.1
|
|
7,088.9
|
|
7,006.2
|
|
|||||
|
Securities sold under repurchase agreements
|
712.4
|
|
643.0
|
|
537.6
|
|
510.6
|
|
502.3
|
|
|||||
|
Long-term debt
|
15.8
|
|
13.1
|
|
28.0
|
|
27.9
|
|
38.1
|
|
|||||
|
Subordinated debentures held by subsidiary trusts
|
86.9
|
|
82.5
|
|
82.5
|
|
82.5
|
|
82.5
|
|
|||||
|
Common stockholders’ equity
|
$
|
1,693.9
|
|
$
|
1,427.6
|
|
$
|
982.6
|
|
$
|
950.5
|
|
$
|
908.9
|
|
|
Selected Income Statement Data:
|
|||||||||||||||
|
Interest income
|
$
|
473.4
|
|
$
|
377.8
|
|
$
|
297.4
|
|
$
|
282.4
|
|
$
|
267.1
|
|
|
Interest expense
|
40.9
|
|
28.0
|
|
17.6
|
|
18.1
|
|
18.6
|
|
|||||
|
Net interest income
|
432.5
|
|
349.8
|
|
279.8
|
|
264.3
|
|
248.5
|
|
|||||
|
Provision for loan losses
|
8.6
|
|
11.0
|
|
10.0
|
|
6.8
|
|
(6.6
|
)
|
|||||
|
Net interest income after provision for loan losses
|
423.9
|
|
338.8
|
|
269.8
|
|
257.5
|
|
255.1
|
|
|||||
|
Non-interest income
|
143.3
|
|
141.8
|
|
136.5
|
|
121.5
|
|
111.8
|
|
|||||
|
Non-interest expense
|
360.9
|
|
323.9
|
|
261.0
|
|
248.6
|
|
237.3
|
|
|||||
|
Income before income taxes
|
206.3
|
|
156.7
|
|
145.3
|
|
130.4
|
|
129.6
|
|
|||||
|
Income tax expense
|
46.1
|
|
50.2
|
|
49.6
|
|
43.7
|
|
45.2
|
|
|||||
|
Net income available to common shareholders
|
$
|
160.2
|
|
$
|
106.5
|
|
$
|
95.7
|
|
$
|
86.7
|
|
$
|
84.4
|
|
|
Common Share Data:
|
|||||||||||||||
|
Earnings per share:
|
|||||||||||||||
|
Basic
|
$
|
2.77
|
|
$
|
2.07
|
|
$
|
2.15
|
|
$
|
1.92
|
|
$
|
1.89
|
|
|
Diluted
|
2.75
|
|
2.05
|
|
2.13
|
|
1.90
|
|
1.87
|
|
|||||
|
Dividends per share
|
1.12
|
|
0.96
|
|
0.88
|
|
0.80
|
|
0.64
|
|
|||||
|
Book value per share (1)
|
27.94
|
|
25.28
|
|
21.87
|
|
20.92
|
|
19.85
|
|
|||||
|
Tangible book value per share (2)
|
$
|
17.52
|
|
$
|
16.04
|
|
$
|
16.92
|
|
$
|
16.19
|
|
$
|
15.07
|
|
|
Weighted average shares outstanding:
|
|||||||||||||||
|
Basic
|
57,778,857
|
|
51,429,366
|
|
44,511,774
|
|
45,184,091
|
|
44,615,060
|
|
|||||
|
Diluted
|
58,217,123
|
|
51,903,209
|
|
44,910,396
|
|
45,646,418
|
|
45,210,561
|
|
|||||
28
|
Five Year Summary (continued)
(Dollars in millions except share and per share data)
|
|||||||||||||||
|
As of or for the year ended December 31,
|
2018
|
2017
|
2016
|
2015
|
2014
|
||||||||||
|
Financial Ratios:
|
|
|
|
|
|
||||||||||
|
Return on average assets
|
1.27
|
%
|
0.98
|
%
|
1.10
|
%
|
1.02
|
%
|
1.06
|
%
|
|||||
|
Return on average common stockholders’ equity
|
10.50
|
|
8.57
|
|
9.93
|
|
9.37
|
|
9.86
|
|
|||||
|
Return on average tangible common equity (3)
|
16.70
|
|
12.76
|
|
12.81
|
|
12.23
|
|
12.88
|
|
|||||
|
Average stockholders’ equity to average assets
|
12.10
|
|
11.45
|
|
11.04
|
|
10.87
|
|
10.77
|
|
|||||
|
Yield on average earning assets
|
4.24
|
|
3.93
|
|
3.80
|
|
3.70
|
|
3.75
|
|
|||||
|
Cost of average interest bearing liabilities
|
0.51
|
|
0.39
|
|
0.30
|
|
0.31
|
|
0.34
|
|
|||||
|
Interest rate spread
|
3.73
|
|
3.54
|
|
3.50
|
|
3.39
|
|
3.41
|
|
|||||
|
Net interest margin (4)
|
3.88
|
|
3.64
|
|
3.57
|
|
3.46
|
|
3.49
|
|
|||||
|
Efficiency ratio (5)
|
61.31
|
|
64.77
|
|
61.88
|
|
63.55
|
|
65.24
|
|
|||||
|
Common stock dividend payout ratio (6)
|
40.43
|
|
46.38
|
|
40.93
|
|
41.65
|
|
33.83
|
|
|||||
|
Loan to deposit ratio
|
79.62
|
|
76.64
|
|
74.27
|
|
74.01
|
|
69.90
|
|
|||||
|
Asset Quality Ratios:
|
|
|
|
|
|
|
|
|
|||||||
|
Non-performing loans to total loans (7)
|
0.68
|
%
|
0.95
|
%
|
1.40
|
%
|
1.37
|
%
|
1.32
|
%
|
|||||
|
Non-performing assets to total loans and other real estate owned (OREO) (8)
|
0.85
|
|
1.08
|
|
1.58
|
|
1.49
|
|
1.59
|
|
|||||
|
Non-performing assets to total assets
|
0.55
|
|
0.68
|
|
0.96
|
|
0.90
|
|
0.91
|
|
|||||
|
Allowance for loan losses to total loans
|
0.86
|
|
0.95
|
|
1.39
|
|
1.46
|
|
1.52
|
|
|||||
|
Allowance for loan losses to non-performing loans
|
125.65
|
|
99.40
|
|
99.52
|
|
106.71
|
|
114.58
|
|
|||||
|
Net charge-offs to average loans
|
0.10
|
|
0.23
|
|
0.20
|
|
0.08
|
|
0.10
|
|
|||||
|
Capital Ratios:
|
|
|
|
|
|
|
|
|
|
|
|||||
|
Tangible common equity to tangible assets (9)
|
8.39
|
%
|
7.75
|
%
|
8.60
|
%
|
8.64
|
%
|
8.22
|
%
|
|||||
|
Common equity tier 1 capital ratio (10)
|
11.40
|
|
11.04
|
|
12.65
|
|
12.69
|
|
13.08
|
|
|||||
|
Tier 1 capital ratio
|
12.26
|
|
11.93
|
|
13.89
|
|
13.99
|
|
14.52
|
|
|||||
|
Total capital ratio
|
12.99
|
|
12.76
|
|
15.13
|
|
15.36
|
|
16.15
|
|
|||||
|
Tier 1 leverage ratio
|
9.47
|
|
8.86
|
|
10.11
|
|
10.12
|
|
9.61
|
|
|||||
|
(1)
|
For purposes of computing book value per share, book value equals common stockholders’ equity.
|
|
(2)
|
Tangible book value per share is a non-GAAP financial measure that management uses to evaluate our capital adequacy. For purposes of computing tangible book value per share, tangible book value equals total common stockholders’ equity less goodwill, and other intangible assets (excluding mortgage servicing rights). Tangible book value per share is calculated as tangible common stockholders’ equity divided by common shares outstanding, and its most directly comparable GAAP financial measure is book value per share. See below our reconciliation of non-GAAP financial measures to their most directly comparable GAAP financial measures under the caption “—Non-GAAP Financial Measures” in this Part II, Item 6.
|
|
(3)
|
Return on average tangible common equity is a non-GAAP financial measure. For purposes of computing return on average tangible common equity, average tangible common stockholders’ equity equals average total stockholders’ equity less average goodwill and average other intangible assets (excluding mortgage servicing rights). Return on average tangible common equity is calculated as net income available to common shareholders divided by average tangible common stockholders’ equity, and its most directly comparable GAAP financial measure is return on average common stockholders’ equity. See below our reconciliation of non-GAAP financial measures to their most directly comparable GAAP financial measures under the caption “—Non-GAAP Financial Measures” in this Part II, Item 6.
|
|
(4)
|
Net interest margin ratio is presented on a fully taxable equivalent, or FTE, basis.
|
|
(5)
|
In 2017, the Company conformed our efficiency ratio definition to the FDIC definition for all periods presented as non-interest expense less amortization of intangible assets divided by net interest income plus non-interest income.
|
|
(6)
|
Common stock dividend payout ratio represents dividends per common share divided by basic earnings per common share.
|
|
(7)
|
Non-performing loans include non-accrual loans and loans past due 90 days or more and still accruing interest.
|
|
(8)
|
Non-performing assets include non-accrual loans, loans past due 90 days or more and still accruing interest and OREO.
|
|
(9)
|
Tangible common equity to tangible assets is a non-GAAP financial measure that management uses to evaluate our capital adequacy. For purposes of computing tangible common equity to tangible assets, tangible common equity is calculated as total common stockholders’ equity less goodwill and other intangible assets (excluding mortgage servicing assets), and tangible assets is calculated as total assets less goodwill and other intangible assets (excluding mortgage servicing rights). The most directly comparable GAAP financial measure to tangible common equity to tangible assets is common equity to assets. See below our reconciliation of non-GAAP financial measures to their most directly comparable GAAP financial measures under the caption “—Non-GAAP Financial Measures” in this Part II, Item 6.
|
|
(10)
|
For purposes of computing tier 1 common capital to total risk-weighted assets, tier 1 common capital excludes preferred stock and trust preferred securities.
|
29
Non-GAAP Financial Measures
In addition to results presented in accordance with generally accepted accounting principles (“GAAP”) in the United States of America, this annual report contains the following non-GAAP financial measures that management uses to evaluate our capital adequacy: return on average common tangible equity, tangible book value per common share, tangible common equity to tangible assets and net tangible common equity to tangible assets. Return on average common tangible equity is calculated as net income available to common shareholders divided by average tangible common stockholders’ equity. Tangible book value per common share is calculated as tangible common stockholders’ equity divided by common shares outstanding. Tangible assets is calculated as total assets less goodwill and other intangible assets (excluding mortgage servicing assets). Tangible common equity to tangible assets is calculated as tangible common stockholders’ equity divided by tangible assets. Net tangible common equity to tangible assets is calculated as net tangible common stockholders’ equity divided by tangible assets. These non-GAAP financial measures may not be comparable to similarly titled measures reported by other companies because other companies may not calculate these non-GAAP measures in the same manner. They also should not be considered in isolation or as a substitute for measures prepared in accordance with GAAP.
The following table shows a reconciliation from ending total common stockholders’ equity (GAAP) to ending tangible common stockholders’ equity (non-GAAP) and ending net tangible common stockholders’ equity (non-GAAP) and ending total assets (GAAP) to ending tangible assets (non-GAAP), their most directly comparable GAAP financial measures, in each instance as of the periods presented. It also shows a reconciliation from ending total common stockholders’ equity (GAAP) to ending average tangible common stockholders’ equity (non-GAAP).
|
Non-GAAP Financial Measures - Five Year Summary
(Dollars in millions except share and per share data)
|
|||||||||||||||
|
As of December 31,
|
2018
|
2017
|
2016
|
2015
|
2014
|
||||||||||
|
Total common stockholders’ equity (GAAP)
|
$
|
1,693.9
|
|
$
|
1,427.6
|
|
$
|
982.6
|
|
$
|
950.5
|
|
$
|
908.9
|
|
|
Less goodwill and other intangible assets
(excluding mortgage servicing rights)
|
631.6
|
|
521.8
|
|
222.5
|
|
215.1
|
|
218.9
|
|
|||||
|
Tangible common stockholders’ equity
(Non-GAAP)
|
1,062.3
|
|
905.8
|
|
760.1
|
|
735.4
|
|
690.0
|
|
|||||
|
Total Assets (GAAP)
|
$
|
13,300.2
|
|
$
|
12,213.3
|
|
$
|
9,063.9
|
|
$
|
8,728.2
|
|
$
|
8,609.9
|
|
|
Less goodwill and other intangible assets
(excluding mortgage servicing rights)
|
631.6
|
|
521.8
|
|
222.5
|
|
215.1
|
|
218.9
|
|
|||||
|
Tangible assets (Non-GAAP)
|
$
|
12,668.6
|
|
$
|
11,691.5
|
|
$
|
8,841.4
|
|
$
|
8,513.1
|
|
$
|
8,391.0
|
|
|
Average Balances:
|
|||||||||||||||
|
Total common stockholders’ equity (GAAP)
|
$
|
1,525.8
|
|
$
|
1,243.7
|
|
$
|
963.5
|
|
$
|
926.1
|
|
$
|
855.9
|
|
|
Less goodwill and other intangible assets
(excluding mortgage servicing rights)
|
566.6
|
|
408.9
|
|
216.7
|
|
216.5
|
|
200.7
|
|
|||||
|
Average tangible common stockholders’ equity (Non-GAAP)
|
$
|
959.2
|
|
$
|
834.8
|
|
$
|
746.8
|
|
$
|
709.6
|
|
$
|
655.2
|
|
|
Common shares outstanding
|
60,623,247
|
|
56,465,559
|
|
44,926,176
|
|
45,458,255
|
|
45,788,415
|
|
|||||
|
Net income available to common shareholders
|
$
|
160.2
|
|
$
|
106.5
|
|
$
|
95.7
|
|
$
|
86.8
|
|
$
|
84.4
|
|
|
Book value per common share (GAAP)
|
$
|
27.94
|
|
$
|
25.28
|
|
$
|
21.87
|
|
$
|
20.91
|
|
$
|
19.85
|
|
|
Tangible book value per common share
(Non-GAAP)
|
17.52
|
|
16.04
|
|
16.92
|
|
16.18
|
|
15.07
|
|
|||||
|
Tangible common equity to tangible assets (Non-GAAP)
|
8.39
|
%
|
7.75
|
%
|
8.60
|
%
|
8.64
|
%
|
8.22
|
%
|
|||||
|
Return on average common tangible equity (Non-GAAP)
|
16.70
|
|
12.76
|
|
12.81
|
|
12.23
|
|
12.88
|
|
|||||
30
Item 7. Management’s Discussion and Analysis of Financial Condition and Results of Operations
Cautionary Note Regarding Forward-Looking Statements and Factors that Could Affect Future Results
This report contains “forward-looking statements” within the meaning of Section 27A of the Securities Act of 1933, as amended, and Rule 175 promulgated thereunder, and Section 21E of the Securities Exchange Act of 1934, as amended, and Rule 3b-6 promulgated thereunder, that involve inherent risks and uncertainties. Any statements about our plans, objectives, expectations, strategies, beliefs, or future performance or events constitute forward-looking statements. Such statements are identified by words or phrases such as “believes,” “expects,” “anticipates,” “plans,” “trends,” “objectives,” “continues” or similar expressions, or future or conditional verbs such as “will,” “would,” “should,” “could,” “might,” “may” or similar expressions. Forward-looking statements involve known and unknown risks, uncertainties, assumptions, estimates and other important factors that could cause actual results to differ materially from any results, performance or events expressed or implied by such forward-looking statements. The following factors, among others, may cause actual results to differ materially from current expectations in the forward-looking statements, including those set forth in this report:
|
•
|
political, legal, regulatory, and general economic or business conditions, either nationally or regionally;
|
|
•
|
geopolitical uncertainties throughout the world that may impact our business and our customers’ businesses;
|
|
•
|
weather-related, disease, and other adverse climate or other conditions that may impact our business and our customers’ business;
|
|
•
|
changes in the interest rate environment or interest rate changes made by the Federal Reserve;
|
|
•
|
credit performance of our loan portfolio;
|
|
•
|
adequacy of the allowance for loan losses and access to low-cost funding sources;
|
|
•
|
the unavailability of LIBOR:
|
|
•
|
impairment of goodwill;
|
|
•
|
dependence on the Company’s management team and ability to attract and retain qualified employees;
|
|
•
|
governmental regulation and changes in regulatory, tax and accounting rules and interpretations;
|
|
•
|
stringent capital requirements;
|
|
•
|
future FDIC insurance premium increases;
|
|
•
|
CFPB restrictions on our ability to originate and sell mortgage loans;
|
|
•
|
cyber-security risks, including items such as “denial of service,” “hacking” and “identity theft”;
|
|
•
|
significant litigation and regulatory proceedings;
|
|
•
|
inability to meet liquidity requirements;
|
|
•
|
environmental remediation and other costs;
|
|
•
|
ineffective internal operational controls;
|
|
•
|
competitive pressures among depository and other financial institutions may increase significantly;
|
|
•
|
competitors may have greater financial resources or develop products that enable them to compete more successfully and may be subject to different regulatory standards than us;
|
|
•
|
reliance on external vendors;
|
|
•
|
soundness of other financial institutions;
|
|
•
|
failure of technology and failure to effectively implement technology-driven products and services;
|
|
•
|
risks associated with introducing and implementing new lines of business, products or services;
|
|
•
|
failure to execute on strategic or operational plans, including the ability to complete mergers and acquisitions or fully achieve expected cost savings or revenue growth associated with mergers and acquisitions;
|
|
•
|
deposit attrition, customer loss and/or revenue loss following completed mergers/acquisitions;
|
|
•
|
anti-takeover provisions;
|
|
•
|
change in dividend policy and the inability of our bank subsidiary to pay dividends;
|
|
•
|
uninsured nature of any investment in Class A and Class B common stock;
|
|
•
|
decline in market price and volatility of Class A and Class B common stock;
|
|
•
|
voting control of Class B stockholders;
|
|
•
|
dilution as a result of future equity issuances;
|
|
•
|
controlled company status; and,
|
|
•
|
subordination of Class A and Class B common stock to Company debt.
|
These factors are not necessarily all of the factors that could cause our actual results, performance or achievements to differ materially from those expressed in or implied by any of our forward-looking statements. Other unknown or unpredictable factors also could harm our results.
31
All forward-looking statements attributable to us or persons acting on our behalf are expressly qualified in their entirety by the cautionary statements set forth herein. Forward-looking statements speak only as of the date they are made and we do not undertake or assume any obligation to update publicly any of these statements to reflect actual results, new information or future events, changes in assumptions or changes in other factors affecting forward-looking statements, except to the extent required by applicable laws. If we update one or more forward-looking statements, no inference should be drawn that we will make additional updates with respect to those or other forward-looking statements.
Executive Overview
We are a financial and bank holding company headquartered in Billings, Montana. As of
December 31, 2018
, we had consolidated assets of
$13.3 billion
, deposits of
$10.7 billion
, total loans of
$8.5 billion
and total stockholders’ equity of
$1.7 billion
.
We currently operate
147
banking offices, including detached drive-up facilities, in communities across Idaho, Montana, Oregon, South Dakota, Washington, and Wyoming in addition to Internet and mobile banking services. Through our bank subsidiary, FIB, we deliver a comprehensive range of banking products and services to individuals, businesses, municipalities and other entities throughout our market areas. Our customers participate in a wide variety of industries, including agriculture, construction, education, energy, governmental services, healthcare, mining, professional services, retail, tourism, and wholesale trade.
Our Business
Our principal business activity is lending to, accepting deposits from and conducting financial transactions, with and for individuals, businesses, municipalities and other entities. We derive our income principally from interest charged on loans and, to a lesser extent, from interest and dividends earned on investments. We also derive income from non-interest sources such as fees received in connection with various lending and deposit services; trust, employee benefit, investment and insurance services; mortgage loan originations, sales and servicing; merchant and electronic banking services; and from time to time, gains on sales of assets. Our principal expenses include interest expense on deposits and borrowings, operating expenses, provisions for loan losses and income tax expense.
Our loan portfolio consists of a mix of real estate, consumer, commercial, agricultural and other loans, including fixed and variable rate loans. Our real estate loans comprise commercial real estate, construction (including residential, commercial and land development loans), residential, agricultural and other real estate loans. Fluctuations in the loan portfolio are directly related to the economies of the communities we serve. While each loan originated must meet minimum underwriting standards established in our credit policies, lending officers are granted discretion within pre-approved limits in approving and pricing loans to assure that the banking offices are responsive to competitive issues and community needs in each market area. We fund our loan portfolio primarily with the core deposits from our customers, generally without utilizing brokered deposits and with minimal reliance on wholesale funding sources. For additional information about our underwriting standards and loan approval process, see “Business—Lending Activities,” included in Part I, Item 1 of this report.
Recent Trends and Developments
Acquisitions
On
August 16, 2018
, we acquired all of the outstanding stock of Northwest, the parent company of INB, a Spokane, Washington based community bank with
20
banking offices across Idaho, Oregon and Washington. The Company merged INB with its existing bank subsidiary, FIB, on
November 9, 2018
. Consideration for the acquisition included
$176.3 million
, consisting of the issuance of
3.84 million
shares of the Company’s Class A common stock valued at
$45.15
per share, the closing price of the Company’s Class A common stock as quoted on the NASDAQ stock exchange on the acquisition date. The Company paid approximately
$3.0 million
in cash related to Northwest warrants, which was included in the consideration paid. Holders of each share of Northwest common stock received
0.516
shares of First Interstate Class A common stock for each share of Northwest common stock.
32
On
October 11, 2018
, the Company entered into a definitive agreement to acquire all of the outstanding stock of IIBK, a community bank headquartered in Coeur d' Alene, Idaho with
11
banking offices across Idaho, in an all-stock transaction valued at approximately $181.3 million in aggregate, or
$22.73
per share of IIBK stock, based on a per share price of First Interstate Class A common stock of $45.45 per share as of October 5, 2018. IIBK shareholders will be entitled to receive 0.50 shares of First Interstate Class A common stock for each share of IIBK common stock they own. The transaction has been approved by the boards of directors of both companies and is expected to close and convert data processing systems in the second quarter of 2019, subject to customary conditions, including regulatory and shareholder approvals.
Also on
October 11, 2018
, the Company entered into a definitive agreement to acquire all of the outstanding stock of CMYF, a community bank headquartered in Post Falls, Idaho with
three
banking offices in North Idaho, in an all-stock transaction valued at approximately $21.5 million in aggregate, or
$17.20
per share of CMYF stock, based on a per share price of First Interstate Class A common stock of $45.45 per share as of October 5, 2018. CMYF stockholders will be entitled to receive 0.3784 shares of First Interstate Class A common stock for each share of CMYF common stock they own. The transaction has been approved by the boards of directors of both companies and is expected to close and convert data processing systems in the second quarter of 2019, subject to customary conditions, including regulatory and shareholder approvals.
For additional information regarding these acquisitions, see “Risk Factors” included in Part I, Item 1A and “Notes to Consolidated Financial Statements — Acquisitions” included in Part IV, Item 15 of this report.
Regulation
On July 2, 2013, the Board of Governors of the Federal Reserve Bank issued a final rule implementing a revised regulatory capital framework for U.S. banks in accordance with the Basel III international accord. The revised regulatory capital framework, or Basel III, became effective for the Company on January 1, 2015. Basel III includes a more stringent definition of capital and introduces a new common equity tier 1, or CET1, capital requirement, sets forth a comprehensive methodology for calculating risk-weighted assets, introduces a conservation buffer and sets out minimum capital ratios and overall capital adequacy standards. Certain deductions and adjustments to regulatory capital phased in starting January 1, 2015 and were fully implemented by January 1, 2018. The capital conservation buffer phased in beginning January 1, 2016 and was fully implemented by January 1, 2019. As of
December 31, 2018
, we had capital levels that, in all cases, exceeded the well capitalized guidelines. For additional information regarding our capital levels, see “Capital Resources and Liquidity Management” included herein and “Notes to Consolidated Financial Statements—Regulatory Capital,” included in Part IV, Item 15 of this report.
Primary Factors Used in Evaluating Our Business
As a banking institution, we manage and evaluate various aspects of both our financial condition and our results of operations. We monitor our financial condition and performance and evaluate the levels and trends of the line items included in our balance sheet and statements of income, as well as various financial ratios that are commonly used in our industry. We analyze these ratios and financial trends against both our own historical levels and the financial condition and performance of comparable banking institutions in our region and nationally.
Results of Operations
Principal tools we use in managing and evaluating our results of operations include tracking performance as measured by certain metrics including return on average equity, net interest income, non-interest income, non-interest expense and net income. Net interest income is affected by a number of factors such as the level of interest rates, changes in interest rates and changes in the volume and composition of interest earning assets and interest bearing liabilities. Changes in interest rate spread, which is the difference between interest earned on assets and interest paid on liabilities, has the most significant impact on net interest income. Other factors like volume of loans, investment securities, and other interest earning assets, compared to the volume of interest bearing deposits and indebtedness also cause changes in our net interest income between periods. Non-interest bearing sources of funds, such as demand deposits and stockholders’ equity, help to support earning assets.
The impact of funding, including non-interest bearing deposit sources, is captured in the net interest margin, which is calculated as net interest income divided by average earning assets. We evaluate our net interest income by assessing the yields on our loans and other earning assets, the costs of our deposits and other funding sources, and the levels of our net interest spread and net interest margin.
33
We seek to increase our non-interest income over time, and we evaluate our non-interest income relative to the trends of the individual types of non-interest income in view of prevailing market conditions.
We manage our non-interest expenses in consideration of growth opportunities and our community banking model that emphasizes customer service and responsiveness. We evaluate our non-interest expense on factors that include our non-interest expense relative to our average assets, our efficiency ratio and the trends of the individual categories of non-interest expense.
Finally, we seek to increase our net income and provide favorable shareholder returns over time, and we evaluate our net income relative to the performance of similar bank holding companies on factors that include return on average assets, return on average equity, total shareholder return, and growth in earnings.
Financial Condition
Managing and evaluating our financial condition, we focus on liquidity, the diversification and quality of our loans, the adequacy of our allowance for loan losses, the diversification and terms of our deposits and other funding sources, the re-pricing characteristics and maturities of our assets and liabilities, including potential interest rate exposure, and the adequacy of our capital levels. We seek to maintain sufficient levels of cash and investment securities to meet potential payment and funding obligations, and we evaluate our liquidity on factors that include the levels of cash and highly liquid assets relative to our liabilities, the quality and maturities of our investment securities, the ratio of loans to deposits and any reliance on brokered certificates of deposit or other wholesale funding sources.
We seek to maintain a diverse and high quality loan portfolio and evaluate our asset quality on factors that include the allocation of our loans among loan types, credit exposure to any single borrower or industry type, non-performing assets as a percentage of total loans and OREO, and loan charge-offs as a percentage of average loans. We seek to maintain our allowance for loan losses at a level adequate to absorb probable losses inherent in our loan portfolio at each balance sheet date, and we evaluate the level of our allowance for loan losses relative to our overall loan portfolio and the level of non-performing loans and potential charge-offs.
We seek to fund our assets primarily using core customer deposits spread among various deposit categories, and we evaluate our deposit and funding mix on factors that include the allocation of our deposits among deposit types, the level of our non-interest bearing deposits, the ratio of our core deposits (i.e. excluding time deposits above $100,000) to our total deposits, and our reliance on brokered deposits or other wholesale funding sources, such as borrowings from other banks or agencies. We seek to manage the mix, maturities and re-pricing characteristics of our assets and liabilities to maintain relative stability of our net interest rate margin in a changing interest rate environment, and we evaluate our asset-liability management using models to evaluate the changes to our net interest income under different interest rate scenarios.
Finally, we seek to maintain adequate capital levels to absorb unforeseen operating losses and to help support the growth of our balance sheet. We evaluate our capital adequacy using the regulatory and financial capital ratios including leverage capital ratio, tier 1 risk-based capital ratio, total risk-based capital ratio, tangible common equity to tangible assets, and tier 1 common capital to total risk-weighted assets.
Critical Accounting Estimates and Significant Accounting Policies
Our consolidated financial statements are prepared in accordance with GAAP and follow general practices within the banking industry. Application of these principles requires management to make estimates, assumptions and judgments that affect the amounts reported in the consolidated financial statements and accompanying notes. The most significant accounting policies we follow are summarized in “Notes to Consolidated Financial Statements—Summary of Significant Accounting Policies” included in Part IV, Item 15 of this report.
Our critical accounting estimates are summarized below. Management considers an accounting estimate to be critical if: (1) the accounting estimate requires management to make particularly difficult, subjective and/or complex judgments about matters that are inherently uncertain and (2) changes in the estimate that are reasonably likely to occur from period to period, or the use of different estimates that management could have reasonably used in the current period, would have a material impact on our consolidated financial statements, results of operations, or liquidity.
34
Allowance for Loan Losses
The provision for loan losses creates an allowance for loan losses known and inherent in the loan portfolio at each balance sheet date. The allowance for loan losses represents management’s estimate of probable credit losses inherent in the loan portfolio.
We perform a quarterly assessment of the risks inherent in our loan portfolio, as well as a detailed review of each significant loan we have assessed to have weaknesses. Based on this analysis, we record a provision for loan losses in order to maintain the allowance for loan losses at appropriate levels. In determining the allowance for loan losses, we estimate losses on specific loans, or groups of loans, where the probable loss can be identified and reasonably determined. Loans acquired in business combinations are recorded at their estimated fair values on the date of acquisition. Accordingly, no allowance for loan losses related to these loans is recorded at the date of transfer. An allowance for loan losses is recorded for credit deterioration occurring subsequent to the transfer date. Determining the amount of the allowance for loan losses is considered a critical accounting estimate because it requires significant judgment and the use of subjective measurements, including management’s assessment of the internal risk classifications of loans, historical loan loss rates, changes in the nature of the loan portfolio, overall portfolio quality, industry concentrations, delinquency trends and the impact of current local, regional, and national economic factors on the quality of the loan portfolio. Changes in these estimates and assumptions are possible and may have a material impact on our allowance, and as a result, on our consolidated financial statements or results of operations. The allowance for loan losses is maintained at an amount we believe is sufficient to provide for estimated losses inherent in our loan portfolio at each balance sheet date, and fluctuations in the provision for loan losses result from management’s assessment of the adequacy of the allowance for loan losses. The loan loss rates for 2018 incorporate the available loss history data from BOTC prior to the merger date to represent a consolidated institutional loss rate for both originated and acquired portfolios. Management monitors qualitative and quantitative trends in the loan portfolio, including changes in the levels of past due, internally classified and non-performing loans. See “Notes to Consolidated Financial Statements—Summary of Significant Accounting Policies” for a description of the methodology used to determine the allowance for loan losses. A discussion of the factors driving changes in the amount of the allowance for loan losses is included herein under the heading “—Financial Condition—Allowance for Loan Losses.” See also Part I, Item 1A, “Risk Factors—Risks Relating to the Market and Our Business.”
Goodwill
The excess purchase price over the fair value of net assets from acquisitions, or goodwill, is evaluated for impairment at least annually and on an interim basis if an event or circumstance indicates that it is likely impairment has occurred. Goodwill impairment is determined by comparing the fair value of a reporting unit to its carrying amount. In any given year the Company may elect to perform a qualitative assessment to determine whether it is more likely than not that the fair value of a reporting unit is in excess of its carrying value. If it is not more likely than not that the fair value of the reporting unit is in excess of the carrying value, or if the Company elects to bypass the qualitative assessment, a quantitative impairment test is performed. In performing a quantitative test for impairment, the fair value of net assets is estimated based on analyses of the Company’s market value, discounted cash flows and peer values. The determination of goodwill impairment is sensitive to market-based economics and other key assumptions used in determining or allocating fair value. Variability in the market and changes in assumptions or subjective measurements used to estimate fair value are reasonably possible and may have a material impact on our consolidated financial statements or results of operations.
Our annual goodwill impairment test is performed each year as of July 1
st
. The Company performed its annual goodwill impairment qualitative assessment as of
2018
and determined the Company’s goodwill was
no
t considered impaired. We will continue to monitor our performance and evaluate our goodwill for impairment annually or more frequently as needed.
For additional information regarding goodwill, see “Notes to Consolidated Financial Statements—Summary of Significant Accounting Policies,” included in Part IV, Item 15 of this report and “Risk Factors—Risks Relating to the Market and Our Business,” included in Part I, Item 1A of this report.
Fair Values of Loans Acquired in Business Combinations
Loans acquired in business combinations are initially recorded at fair value with no carryover of the related allowance for credit losses. Credit risks are included in the determination of fair value. Determining the fair value of the loans involves estimating the amount and timing of principal and interest cash flows initially expected to be collected on the loans and discounting those cash flows at an appropriate market rate of interest.
35
For loans with no significant evidence of credit deterioration since origination, the difference between the fair value and the unpaid principal balance of the loan at the acquisition date is amortized into interest income using the effective interest method over the remaining period to contractual maturity. Loans acquired with evidence of deterioration in credit quality since origination are accounted for in accordance with Accounting Standards Codification (“ASC”) Topic 310-30 “Loans and Debt Securities Acquired with Deteriorated Credit Quality.” For loans that meet the criteria stipulated in ASC Topic 310-30, the excess of all cash flows expected at acquisition over the initial fair value of the loans acquired (“accretable yield”) is amortized to interest income over the expected remaining contractual lives of the underlying loans using the effective interest method. The Company continues to evaluate the reasonableness of expectations for the timing and amount of cash to be collected. Increases in expected cash flows subsequent to the initial measurement are recognized prospectively through adjustment of the yield on the loan over its remaining life. Decreases in expected cash flows are recognized as impairment.
For additional information regarding acquired loans, see “Notes to Consolidated Financial Statements—Summary of Significant Accounting Policies,” “Notes to Consolidated Financial Statements—Acquisitions” and “Notes to Consolidated Financial Statements—Loans,” included in Part IV, Item 15 of this report.
Results of Operations
The following discussion of our results of operations compares the years ended
December 31, 2018
to
December 31, 2017
and the years ended
December 31, 2017
to
December 31, 2016
.
Net Interest Income
Net interest income, the largest source of our operating income, is derived from interest, dividends, and fees received on interest earning assets, less interest expense incurred on interest bearing liabilities. Interest earning assets primarily include loans and investment securities. Interest bearing liabilities include deposits and various forms of indebtedness. Net interest income is affected by the level of interest rates, changes in interest rates and changes in the composition of interest earning assets and interest bearing liabilities.
Changes in interest rate spread, which is the difference between interest earned on assets and interest paid on liabilities, has the most significant impact on net interest income. Other factors like volume of loans, investment securities, and other interest earning assets compared to the volume of interest bearing deposits and indebtedness also cause changes in our net interest income between periods. Non-interest bearing sources of funds, such as demand deposits and stockholders’ equity, help to support earning assets.
36
The following table presents, for the periods indicated, condensed average balance sheet information, together with interest income and yields earned on average interest earning assets and interest expense and rates paid on average interest bearing liabilities.
Average Balance Sheets, Yields and Rates
(Dollars in millions)
|
|
Year Ended December 31,
|
|||||||||||||||||||||||||
|
|
2018
|
2017
|
2016
|
|||||||||||||||||||||||
|
Average
Balance
|
Interest
|
Average
Rate
|
Average
Balance |
Interest
|
Average
Rate |
Average
Balance |
Interest
|
Average
Rate |
||||||||||||||||||
|
Interest earning assets:
|
|
|
|
|
|
|
|
|
|
|||||||||||||||||
|
Loans (1) (2)
|
$
|
7,985.0
|
|
$
|
405.9
|
|
5.08
|
%
|
$
|
6,675.4
|
|
$
|
327.4
|
|
4.90
|
%
|
$
|
5,378.3
|
|
$
|
261.7
|
|
4.87
|
%
|
||
|
Investment securities (2)
|
2,639.4
|
|
58.4
|
|
2.21
|
|
2,417.5
|
|
47.6
|
|
1.97
|
|
2,093.5
|
|
37.6
|
|
1.80
|
|
||||||||
|
Interest bearing deposits in banks
|
573.6
|
|
11.3
|
|
1.97
|
|
634.2
|
|
7.1
|
|
1.13
|
|
478.9
|
|
2.6
|
|
0.54
|
|
||||||||
|
Federal funds sold
|
11.1
|
|
—
|
|
—
|
|
0.7
|
|
—
|
|
—
|
|
1.6
|
|
—
|
|
—
|
|
||||||||
|
Total interest earnings assets
|
11,209.1
|
|
475.6
|
|
4.24
|
|
9,727.8
|
|
382.1
|
|
3.93
|
|
7,952.3
|
|
301.9
|
|
3.80
|
|
||||||||
|
Non-earning assets
|
1,405.6
|
|
1,133.7
|
|
772.1
|
|
||||||||||||||||||||
|
Total assets
|
$
|
12,614.7
|
|
$
|
10,861.5
|
|
$
|
8,724.4
|
|
|||||||||||||||||
|
Interest bearing liabilities:
|
|
|
|
|||||||||||||||||||||||
|
Demand deposits
|
$
|
2,882.8
|
|
$
|
8.1
|
|
0.28
|
%
|
$
|
2,553.1
|
|
$
|
5.5
|
|
0.21
|
%
|
$
|
2,162.6
|
|
$
|
2.2
|
|
0.10
|
%
|
||
|
Savings deposits
|
3,166.7
|
|
12.5
|
|
0.39
|
|
2,739.2
|
|
7.7
|
|
0.28
|
|
2,037.4
|
|
2.7
|
|
0.13
|
|
||||||||
|
Time deposits
|
1,199.5
|
|
12.0
|
|
1.00
|
|
1,112.7
|
|
8.2
|
|
0.73
|
|
1,094.2
|
|
7.8
|
|
0.71
|
|
||||||||
|
Repurchase agreements
|
642.8
|
|
2.7
|
|
0.42
|
|
587.1
|
|
1.3
|
|
0.21
|
|
481.0
|
|
0.4
|
|
0.09
|
|
||||||||
|
Other borrowed funds
|
1.7
|
|
0.2
|
|
11.76
|
|
23.9
|
|
1.5
|
|
6.42
|
|
—
|
|
—
|
|
—
|
|
||||||||
|
Long-term debt
|
17.6
|
|
1.3
|
|
7.39
|
|
8.0
|
|
0.6
|
|
7.48
|
|
28.2
|
|
1.8
|
|
6.43
|
|
||||||||
|
Subordinated debentures held by subsidiary trusts
|
84.1
|
|
4.1
|
|
4.88
|
|
82.5
|
|
3.1
|
|
3.85
|
|
82.5
|
|
2.8
|
|
3.34
|
|
||||||||
|
Total interest bearing liabilities
|
7,995.2
|
|
40.9
|
|
0.51
|
|
7,106.5
|
|
27.9
|
|
0.39
|
|
5,885.9
|
|
17.7
|
|
0.30
|
|
||||||||
|
Non-interest bearing deposits
|
2,984.3
|
|
2,430.9
|
|
1,812.6
|
|
||||||||||||||||||||
|
Other non-interest bearing liabilities
|
109.4
|
|
80.4
|
|
62.4
|
|
||||||||||||||||||||
|
Stockholders’ equity
|
1,525.8
|
|
1,243.7
|
|
963.5
|
|
||||||||||||||||||||
|
Total liabilities and stockholders’ equity
|
$
|
12,614.7
|
|
$
|
10,861.5
|
|
$
|
8,724.4
|
|
|||||||||||||||||
|
Net FTE interest income
|
$
|
434.7
|
|
|
$
|
354.2
|
|
$
|
284.2
|
|
||||||||||||||||
|
Less FTE adjustments (2)
|
(2.2
|
)
|
|
(4.4
|
)
|
(4.5
|
)
|
|||||||||||||||||||
|
Net interest income from consolidated statements of income
|
$
|
432.5
|
|
|
$
|
349.8
|
|
$
|
279.7
|
|
||||||||||||||||
|
Interest rate spread
|
3.73
|
%
|
|
3.54
|
%
|
3.50
|
%
|
|||||||||||||||||||
|
Net FTE interest margin (3)
|
3.88
|
%
|
|
3.64
|
%
|
3.57
|
%
|
|||||||||||||||||||
|
Cost of funds, including non-interest bearing demand deposits (4)
|
0.37
|
%
|
0.29
|
%
|
0.23
|
%
|
||||||||||||||||||||
|
(1)
|
Average loan balances include non-accrual loans. Interest income on loans includes amortization of deferred loan fees net of deferred loan costs, which is not material.
|
|
(2)
|
Interest income and average rates for tax exempt loans and securities are presented on a fully taxable equivalent, or FTE, basis. The federal income tax rate of 21%, 35%, and 35% was utilized at
December 31, 2018
,
2017
, and
2016
, respectively.
|
|
(3)
|
Net FTE interest margin during the period equals (i) the difference between interest income on interest earning assets and the interest expense on interest bearing liabilities, divided by (ii) average interest earning assets for the period.
|
|
(4)
|
Cost of funds including non-interest bearing demand deposits is calculated by dividing total interest on interest bearing liabilities by the sum of total interest bearing liabilities plus non-interest bearing deposits.
|
37
Net FTE interest income increased
$80.5 million
to
$434.7 million
during
2018
, as compared to
$354.2 million
in
2017
, primarily due to higher outstanding loan balances as a result of the full year impact of the BOTC acquisition, the INB acquisition, and organic loan growth, combined with increases in yields earned on interest earning assets, which were partially offset by a higher cost of funds, as a result of increasing our rates on client deposits in response to increases in the Federal Fund rate. Also contributing to the increase in net FTE interest income during
2018
, as compared to
2017
, was interest accretion related to the fair value of loans. Interest accretion related to the fair valuation of acquired loans was
$13.7 million
during
2018
as compared to
$10.7 million
in
2017
, of which
$5.9 million
was the result of early loan payoffs during
2018
as compared to
$5.1 million
in
2017
. Net FTE interest income was also positively impacted by recoveries of previously charged-off interest of
$4.0 million
in
2018
, as compared to
$5.6 million
in
2017
. The Company’s net interest margin ratio increased
24
basis points to
3.88%
during
2018
, as compared to
3.64%
in
2017
. Exclusive of interest accretion related to acquired loans and the impact of recoveries of charged-off interest, our
2018
net interest margin ratio increased
25
basis points over our similarly calculated net interest margin ratio in
2017
.
Net FTE interest income increased $70.0 million to $354.2 million during
2017
, as compared to $284.2 million in 2016, primarily due to higher outstanding loan balances as a result of the BOTC acquisition and organic loan growth, combined with increases in yields earned on interest earning assets, which were partially offset by a higher cost of funds, as a result of increasing our rates on client deposits in response to increases in the Federal Fund rate. Also contributing to the increase in net FTE interest income during 2017, as compared to 2016, was interest accretion related to the fair value of loans. Interest accretion related to the fair valuation of acquired loans was $10.7 million during 2017 as compared to $6.3 million in 2016, of which $5.1 million was the result of early loan payoffs during 2017 as compared to $3.8 million in 2016. Net FTE interest income was also positively impacted by recoveries of previously charged-off interest of $5.6 million in 2017, as compared to $2.6 million in 2016. The Company’s net interest margin ratio increased seven basis points to 3.64% during 2017, as compared to 3.57% in 2016. Exclusive of interest accretion related to acquired loans and the impact of recoveries of charged-off interest, our 2017 net interest margin ratio increased two basis points over our similarly calculated net interest margin ratio in 2016.
The table below sets forth, for the periods indicated, a summary of the changes in interest income and interest expense resulting from estimated changes in average asset and liability balances (volume) and estimated changes in average interest rates (rate). Changes which are not due solely to volume or rate have been allocated to these categories based on the respective percent changes in average volume and average rate as they compare to each other.
|
Analysis of Interest Changes Due To Volume and Rates
(Dollars in millions)
|
|||||||||||||||||||||||||||||
|
Year Ended December 31, 2018
compared with
December 31, 2017
|
Year Ended December 31, 2017
compared with December 31, 2016 |
Year Ended December 31, 2016
compared with December 31, 2015 |
|||||||||||||||||||||||||||
|
|
Volume
|
Rate
|
Net
|
Volume
|
Rate
|
Net
|
Volume
|
Rate
|
Net
|
||||||||||||||||||||
|
Interest earning assets:
|
|
|
|
|
|
|
|
|
|
||||||||||||||||||||
|
Loans (1)
|
$
|
64.2
|
|
$
|
14.3
|
|
$
|
78.5
|
|
$
|
63.1
|
|
$
|
2.6
|
|
$
|
65.7
|
|
$
|
15.8
|
|
$
|
(2.1
|
)
|
$
|
13.7
|
|
||
|
Investment Securities (1)
|
4.4
|
|
6.4
|
|
10.8
|
|
5.8
|
|
4.1
|
|
9.9
|
|
(1.7
|
)
|
2.1
|
|
0.4
|
|
|||||||||||
|
Interest bearing deposits in banks
|
(0.7
|
)
|
4.9
|
|
4.2
|
|
0.8
|
|
3.7
|
|
4.5
|
|
(0.1
|
)
|
1.1
|
|
1.0
|
|
|||||||||||
|
Total change
|
67.9
|
|
25.6
|
|
93.5
|
|
69.7
|
|
10.4
|
|
80.1
|
|
14.0
|
|
1.1
|
|
15.1
|
|
|||||||||||
|
Interest bearing liabilities:
|
|
|
|
|
|
|
|||||||||||||||||||||||
|
Demand deposits
|
0.7
|
|
1.9
|
|
2.6
|
|
0.4
|
|
2.9
|
|
3.3
|
|
0.1
|
|
—
|
|
0.1
|
|
|||||||||||
|
Savings deposits
|
1.2
|
|
3.6
|
|
4.8
|
|
0.9
|
|
4.1
|
|
5.0
|
|
0.1
|
|
—
|
|
0.1
|
|
|||||||||||
|
Time deposits
|
0.6
|
|
3.2
|
|
3.8
|
|
0.1
|
|
0.2
|
|
0.3
|
|
(0.6
|
)
|
(0.1
|
)
|
(0.7
|
)
|
|||||||||||
|
Repurchase agreements
|
0.1
|
|
1.3
|
|
1.4
|
|
0.1
|
|
0.7
|
|
0.8
|
|
—
|
|
0.2
|
|
0.2
|
|
|||||||||||
|
Other borrowed funds
|
(1.4
|
)
|
0.1
|
|
(1.3
|
)
|
—
|
|
1.5
|
|
1.5
|
|
—
|
|
—
|
|
—
|
|
|||||||||||
|
Long-term debt
|
0.7
|
|
—
|
|
0.7
|
|
(1.3
|
)
|
0.1
|
|
(1.2
|
)
|
(0.8
|
)
|
0.4
|
|
(0.4
|
)
|
|||||||||||
|
Subordinated debentures held by subsidiary trusts
|
0.1
|
|
0.9
|
|
1.0
|
|
—
|
|
0.4
|
|
0.4
|
|
—
|
|
0.3
|
|
0.3
|
|
|||||||||||
|
Total change
|
2.0
|
|
11.0
|
|
13.0
|
|
0.2
|
|
9.9
|
|
10.1
|
|
(1.2
|
)
|
0.8
|
|
(0.4
|
)
|
|||||||||||
|
Increase (decrease) in FTE net interest income (1)
|
$
|
65.9
|
|
$
|
14.6
|
|
$
|
80.5
|
|
$
|
69.5
|
|
$
|
0.5
|
|
$
|
70.0
|
|
$
|
15.2
|
|
$
|
0.3
|
|
$
|
15.5
|
|
||
|
(1)
|
Interest income and average rates for tax exempt loans and securities are presented on a FTE basis.
|
38
Provision for Loan Losses
During
2018
, we recorded a provision for loan losses of
$8.6 million
, as compared to
$11.0 million
in
2017
. The decrease in provision for loan losses recorded in
2018
was primarily a result of improvement in credit quality and lower levels of net loan charge-offs. During
2017
, we recorded a provision for loan losses of
$11.0 million
, as compared to
$10.0 million
in
2016
. The increase in provision for loans losses recorded in
2017
was primarily a result of a higher level of net loan charge-offs. The provision for loans losses recorded in
2016
was primarily attributable to the application of historical loan loss rates to loan growth combined with increases in net loan charge-offs. For information regarding our non-performing loans, see “Non-Performing Assets” included herein. For information regarding our allowance for losses, see “Financial Condition—Allowance for Loan Losses” included herein.
Non-interest Income
Our principal sources of non-interest income primarily include fee-based revenues such as payment services, mortgage banking and wealth management revenues, service charges on deposit accounts and other service charges, commissions and fees. The following table presents the composition of our non-interest income as of the dates indicated:
|
Non-interest income
(Dollars in millions)
|
||||||||||||||||||
|
Year Ended December 31,
|
% Change
|
|||||||||||||||||
|
|
2018
|
2017
|
2016
|
2018 vs 2017
|
2017 vs 2016
|
|||||||||||||
|
Payment services revenues
|
$
|
43.3
|
|
$
|
43.3
|
|
$
|
34.4
|
|
—
|
%
|
25.9
|
%
|
|||||
|
Mortgage banking revenues
|
24.9
|
|
28.9
|
|
37.2
|
|
(13.8
|
)
|
(22.3
|
)
|
||||||||
|
Wealth management revenues
|
23.2
|
|
21.1
|
|
20.5
|
|
10.0
|
|
2.9
|
|
||||||||
|
Service charges on deposit accounts
|
21.8
|
|
21.3
|
|
18.4
|
|
2.3
|
|
15.8
|
|
||||||||
|
Other service charges, commissions and fees
|
15.1
|
|
13.3
|
|
11.5
|
|
13.5
|
|
15.7
|
|
||||||||
|
Loss on termination of interest rate swap
|
—
|
|
(1.1
|
)
|
—
|
|
NM
|
|
NM
|
|
||||||||
|
Investment securities (losses) gains, net
|
(0.1
|
)
|
0.7
|
|
0.3
|
|
NM
|
|
NM
|
|
||||||||
|
Other income
|
15.1
|
|
14.3
|
|
10.0
|
|
5.6
|
|
43.0
|
|
||||||||
|
Non-recurring litigation recovery
|
—
|
|
—
|
|
4.2
|
|
NM
|
|
NM
|
|
||||||||
|
Total non-interest income
|
$
|
143.3
|
|
$
|
141.8
|
|
$
|
136.5
|
|
1.1
|
%
|
3.9
|
%
|
|||||
Non-interest income increased
$1.5 million
, or
1.1%
, to
$143.3 million
in
2018
, as compared to
$141.8 million
in
2017
, and
$5.3 million
, or
3.9%
, to
$141.8 million
in
2017
as compared to
$136.5 million
in
2016
. Significant components of these fluctuations are discussed below.
Payment services revenues consist of interchange fees that merchants pay for processing electronic payment transactions and ATM service fees. Payment services revenues was stable in
2018
, as compared to
$43.3 million
for the same period in
2017
, and increased
$8.9 million
, or
25.9%
, to
$43.3 million
in
2017
, as compared to
$34.4 million
in
2016
. These changes were attributable to additional interchange income due to increased debit card and credit card transaction volumes. Additionally, 2018 reflects a decrease in payment services revenues of $6.5 million attributable to the Durbin Amendment rule (which limits the amount of interchange fees certain banks may charge), which impacted our Company beginning July 1, 2018.
Mortgage banking revenues include origination and processing fees on residential real estate loans held for sale and gains on residential real estate loans sold to third parties. Fluctuations in market interest rates have a significant impact on mortgage banking revenues. Higher interest rates can reduce the demand for home loans and loans to refinance existing mortgages. Conversely, lower interest rates generally stimulate refinancing and home loan origination. Mortgage banking revenues decreased
$4.0 million
, or
13.8%
, to
$24.9 million
in
2018
, as compared to
$28.9 million
in
2017
. The decrease is primarily attributable to a lack of demand in the refinance market and reduced gain on sale margins. Loans originated for home purchases accounted for approximately 79.3% of 2018 loan production, as compared to approximately 71.9% in 2017.
Mortgage banking revenues decreased
$8.3 million
, or
22.3%
, to
$28.9 million
in 2017, as compared to
$37.2 million
in 2016. The decrease is mainly attributable to a softening in the refinance market, given rising interest rates. Loans originated for home purchases accounted for approximately 71.9% of 2017 loan production, as compared to approximately 57.7% in 2016.
39
Wealth management revenues are principally comprised of fees earned for management of trust assets and investment services. Wealth management revenues increased
$2.1 million
, or
10.0%
, as compared to
$21.1 million
for the same period in
2017
and were stable in
2017
, as compared to
$20.5 million
in
2016
. The
2018
increase is driven by a concentrated effort on revenue growth through a consistent sales practice coupled with a change in our pricing exception protocol.
Service charges on deposit accounts were stable in
2018
at
$21.8 million
, as compared to
$21.3 million
for the same period in
2017
and increased
$2.9 million
, or
15.8%
, in
2017
, as compared to
$18.4 million
in
2016
, primarily due to the BOTC acquisition in May 2017.
Other service charges, commissions and fees primarily include mortgage servicing fees, fees earned on certain derivative interest rate contracts and insurance commissions. Other service charges, commissions and fees increased
$1.8 million
, or
13.5%
, as compared to the same period in
2017
and increased
$1.8 million
, or
15.7%
, in
2017
, as compared to
$11.5 million
in
2016
, primarily due to the INB acquisition in August 2018 and the BOTC acquisition in May 2017, respectively. Additionally, mortgage loan servicing fee income increased year-over-year as a result of an increase in the number of loans serviced and additional fees earned on derivative interest rate swap contracts offered to customers.
Other income primarily includes company-owned life insurance revenues, check printing income, agency stock dividends and gains on sales of miscellaneous assets. Other income was relatively stable in
2018
at
$15.1 million
, as compared to
$14.3 million
for the same period in
2017
. Other income increased
$4.3 million
, or
43.0%
, in
2017
, as compared to
$10.0 million
in
2016
, primarily due to the one-time gain of $3.0 million on the sale of Health Savings Accounts.
During 2016, we recorded non-recurring litigation recoveries of $4.2 million related to a lender liability lawsuit originally settled in 2015.
Non-interest Expense
The following table presents the composition of our non-interest expense as of the dates indicated:
|
Non-interest expense
(Dollars in millions)
|
||||||||||||||||||
|
Year Ended December 31,
|
% Change
|
|||||||||||||||||
|
|
2018
|
2017
|
2016
|
2018 vs 2017
|
2017 vs 2016
|
|||||||||||||
|
Salaries and wages
|
$
|
146.4
|
|
$
|
122.7
|
|
$
|
108.7
|
|
19.3
|
%
|
12.9
|
%
|
|||||
|
Employee benefits
|
47.9
|
|
37.6
|
|
35.2
|
|
27.4
|
|
6.8
|
|
||||||||
|
Outsourced technology services
|
28.7
|
|
25.1
|
|
20.5
|
|
14.3
|
|
22.4
|
|
||||||||
|
Occupancy, net
|
25.4
|
|
22.4
|
|
17.7
|
|
13.4
|
|
26.6
|
|
||||||||
|
Furniture and equipment
|
12.7
|
|
11.5
|
|
9.6
|
|
10.4
|
|
19.8
|
|
||||||||
|
OREO expense, net of income
|
0.3
|
|
0.4
|
|
—
|
|
(25.0
|
)
|
—
|
|
||||||||
|
Professional fees
|
6.9
|
|
6.8
|
|
5.0
|
|
1.5
|
|
36.0
|
|
||||||||
|
FDIC insurance premiums
|
5.6
|
|
4.7
|
|
4.5
|
|
19.1
|
|
4.4
|
|
||||||||
|
Mortgage servicing rights amortization
|
3.1
|
|
3.0
|
|
3.0
|
|
3.3
|
|
—
|
|
||||||||
|
Mortgage servicing rights impairment recovery
|
—
|
|
(0.1
|
)
|
—
|
|
NM
|
|
NM
|
|
||||||||
|
Core deposit intangibles amortization
|
7.9
|
|
5.5
|
|
3.4
|
|
43.6
|
|
61.8
|
|
||||||||
|
Other expenses
|
63.6
|
|
57.1
|
|
50.6
|
|
11.4
|
|
12.8
|
|
||||||||
|
Acquisition related expenses
|
12.4
|
|
27.2
|
|
2.8
|
|
(54.4
|
)
|
871.4
|
|
||||||||
|
Total non-interest expense
|
$
|
360.9
|
|
$
|
323.9
|
|
$
|
261.0
|
|
11.4
|
%
|
24.1
|
%
|
|||||
Non-interest expense increased
$37.0 million
, or
11.4%
, to
$360.9 million
in
2018
, as compared to
$323.9 million
in
2017
, and increased
$62.9 million
, or
24.1%
, to
$323.9 million
in
2017
, as compared to
$261.0 million
in
2016
. Significant components of these increases are discussed in more detail below.
Salaries and wages expense increased
$23.7 million
, or
19.3%
, to
$146.4 million
in
2018
, as compared to
$122.7 million
in
2017
. The increase was primarily due to inflationary wage increases, one-time separation payments, higher incentive compensation, and increased personnel costs associated with the INB acquisition in August 2018 and the full-year impact of the BOTC acquisition in May 2017.
40
Salaries and wages expense increased
$14.0 million
, or
12.9%
, to
$122.7 million
in
2017
, as compared to
$108.7 million
in
2016
. The increase was primarily due to inflationary wage increases, one-time separation payments, and increased personnel costs associated with the BOTC acquisition in May 2017 and the full-year impact of the Flathead Bank acquisition in August 2016.
Employee benefits expense increased
$10.3 million
, or
27.4%
, to
$47.9 million
in
2018
, as compared to
$37.6 million
in
2017
. The increase in employee benefits expense in
2018
, as compared to
2017
, was primarily due to higher profit sharing contributions and additional benefit costs resulting from the INB acquisition in August 2018 and the full-year impact of the BOTC acquisition in May 2017 and an increase in our group insurance costs.
Employee benefits expense increased
$2.4 million
, or
6.8%
, to
$37.6 million
in
2017
, as compared to
$35.2 million
in
2016
. The increase in employee benefits expense in 2017, as compared to 2016, were due to additional benefits costs resulting from the BOTC acquisition in May 2017 and the full-year impact of the Flathead Bank acquisition in August 2016.
Outsourced technology services expense increased
$3.6 million
or
14.3%
, to
$28.7 million
in
2018
, as compared to
$25.1 million
in
2017
. The increase was primarily due to expenses resulting from the INB acquisition in August 2018 and the full-year impact of the BOTC acquisition in May 2017.
Outsourced technology services expense increased
$4.6 million
or
22.4%
, to
$25.1 million
in
2017
, as compared to
$20.5 million
in
2016
. The increase was primarily due to expenses resulting from the BOTC acquisition in May 2017.
Occupancy, net expense increased
$3.0 million
or
13.4%
, to
$25.4 million
in
2018
, as compared to
$22.4 million
in
2017
. The increase was primarily due to expenses resulting from the INB acquisition in August 2018 and the full-year impact of the BOTC acquisition in May 2017.
Occupancy, net expense increased
$4.7 million
or
26.6%
, to
$22.4 million
in
2017
, as compared to
$17.7 million
in
2016
. The increase was primarily due to expenses resulting from the BOTC acquisition in May 2017.
Core deposit intangibles represent the intangible value of depositor relationships resulting from deposit liabilities assumed, as a result of acquisitions, and are amortized based on the estimated useful lives of the related deposits. Core deposit intangibles amortization expense increased
$2.4 million
or
43.6%
, to
$7.9 million
in
2018
, as compared to
$5.5 million
in
2017
, and increased
$2.1 million
or
61.8%
, to
$5.5 million
in
2017
, as compared to
$3.4 million
in
2016
, due to additional amortization of core deposit intangibles recorded in conjunction with recent acquisitions. We acquired core deposit intangibles of
$15.7 million
in conjunction with our acquisition of INB in August 2018,
$48.0 million
in conjunction with our acquisition of BOTC in May 2017, and $2.5 million in conjunction with our acquisition of Flathead in August 2016. For additional information regarding acquired core deposit intangibles, see “Notes to Consolidated Financial Statements—Acquisitions,” included in Part IV, Item 15 of this report.
Other expenses primarily include advertising and public relations costs; office supply, postage, freight, telephone and travel expenses; donations expense; debit and credit card expenses; board of director fees; legal expenses; and, other losses. Other expenses increased
$6.5 million
, or
11.4%
, to
$63.6 million
in
2018
, as compared to
$57.1 million
in
2017
. Increases in other expenses are due to the additional operating expenses resulting from the INB acquisition in August 2018 and the BOTC acquisition in May 2017, and higher new market tax credit amortization as a result of our participation in additional new market tax credit projects.
Other expenses increased
$6.5 million
, or
12.8%
, to
$57.1 million
in
2017
, as compared to
$50.6 million
in
2016
. Increases in other expenses are due to the additional operating expenses resulting from the BOTC acquisition in May 2017 and the Flathead Bank acquisition in August 2016. The increase is also due to higher advertising and promotional expenses incurred to promote the Company’s brand awareness in its new markets in the West Division, along with consultant fees related to our client experience program.
During
2018
,
2017
and
2016
, we recorded acquisition related expenses of
$12.4 million
,
$27.2 million
and
$2.8 million
, respectively. Acquisition related expenses primarily include legal and professional fees; technology, conversion and contract termination costs; employee retention payments, and; travel expenses. For additional information regarding our acquisitions, see “Recent Developments” included herein and “Notes to Consolidated Financial Statements—Acquisitions,” included in Part IV, Item 15 of this report.
41
Income Tax Expense
Our effective federal tax rate was
17.1%
for the year ended
December 31, 2018
,
27.2%
for the year ended
December 31, 2017
and
29.7%
for the year ended
December 31, 2016
. Our federal tax rate was reduced as a result of the Tax Cuts and Jobs Act enacted on December 22, 2017. The effective tax rate for 2017 was impacted by the adjustment of our deferred tax assets and liabilities related to the tax rate change as a result of the Tax Cuts and Jobs Act. Fluctuations in effective federal income tax rates are primarily due to the re-measurement of deferred tax assets and liabilities resulting from the enactment of federal tax reform for (2017 only), and the timing of federal tax credits resulting from our participation in the New Markets Tax Credits Program, a program through the U.S. Department of Treasury, aimed at attracting private capital into low-income communities. For additional information about our participation in the New Markets Tax Credits Program, see “Notes to Consolidated Financial Statements—Summary of Significant Accounting Policies,” included in Part IV, Item 15 of this report.
State income tax applies primarily to pretax earnings generated within California, Idaho, Montana, Oregon and South Dakota for
2018
and
2017
and Montana and South Dakota for
2016
. Our effective state tax rate was
5.2%
for the year ended
December 31, 2018
,
4.8%
for the year ended
December 31, 2017
and
4.4%
for the year ended
December 31, 2016
.
Net Income
Net income was
$160.2 million
, or
$2.75
per diluted share, in
2018
, compared to
$106.5 million
, or
$2.05
per diluted share, in
2017
and
$95.7 million
, or
$2.13
per diluted share, in
2016
. The after-tax impact of acquisition related expenses on earnings per share was $0.17, $0.34, and $0.04, respectively for the periods.
Summary of Quarterly Results
The following tables present the Company’s summarized quarterly financial information for the fiscal years ended
December 31, 2018
and
2017
.
|
Quarterly Results
(Unaudited)
(Dollars in millions except per share data)
|
||||||||||||
|
First
Quarter
|
Second
Quarter
|
Third
Quarter
|
Fourth
Quarter
|
|||||||||
|
Year Ended December 31, 2018
(1)
|
|
|
|
|
||||||||
|
Interest income
|
$
|
107.6
|
|
$
|
113.0
|
|
$
|
121.2
|
|
$
|
131.6
|
|
|
Interest expense
|
7.8
|
|
9.2
|
|
11.2
|
|
12.7
|
|
||||
|
Net interest income
|
99.8
|
|
103.8
|
|
110.0
|
|
118.9
|
|
||||
|
Provision for loan losses
|
2.1
|
|
2.9
|
|
2.0
|
|
1.6
|
|
||||
|
Net interest income after provision for loan losses
|
97.7
|
|
100.9
|
|
108.0
|
|
117.3
|
|
||||
|
Non-interest income
|
35.2
|
|
37.6
|
|
36.2
|
|
34.3
|
|
||||
|
Non-interest expense
|
85.9
|
|
84.9
|
|
90.7
|
|
99.4
|
|
||||
|
Income before income taxes
|
47.0
|
|
53.6
|
|
53.5
|
|
52.2
|
|
||||
|
Income tax expense
|
10.3
|
|
11.9
|
|
12.1
|
|
11.8
|
|
||||
|
Net income
|
$
|
36.7
|
|
$
|
41.7
|
|
$
|
41.4
|
|
$
|
40.4
|
|
|
Basic earnings per common share
|
$
|
0.65
|
|
$
|
0.74
|
|
$
|
0.71
|
|
$
|
0.67
|
|
|
Diluted earnings per common share
|
0.65
|
|
0.74
|
|
0.71
|
|
0.67
|
|
||||
|
Dividends paid per common share
|
0.28
|
|
0.28
|
|
0.28
|
|
0.28
|
|
||||
|
(1)
Quarterly amounts may not add to annual amounts due to the effect of rounding on a quarterly basis.
|
||||||||||||
42
|
Quarterly Results
(Unaudited)
(Dollars in millions except per share data)
|
||||||||||||
|
First
Quarter
|
Second
Quarter
|
Third
Quarter
|
Fourth
Quarter
|
|||||||||
|
Year Ended December 31, 2017:
|
|
|
|
|
||||||||
|
Interest income
|
$
|
74.4
|
|
$
|
85.8
|
|
$
|
108.8
|
|
$
|
108.7
|
|
|
Interest expense
|
5.5
|
|
6.5
|
|
8.0
|
|
7.9
|
|
||||
|
Net interest income
|
68.9
|
|
79.3
|
|
100.8
|
|
100.8
|
|
||||
|
Provision for loan losses
|
1.7
|
|
2.3
|
|
3.5
|
|
3.5
|
|
||||
|
Net interest income after provision for loan losses
|
67.2
|
|
77.0
|
|
97.3
|
|
97.3
|
|
||||
|
Non-interest income
|
29.1
|
|
37.1
|
|
38.3
|
|
37.2
|
|
||||
|
Non-interest expense
|
63.7
|
|
80.4
|
|
94.6
|
|
85.1
|
|
||||
|
Income before income taxes
|
32.6
|
|
33.7
|
|
41.0
|
|
49.4
|
|
||||
|
Income tax expense
|
9.4
|
|
11.8
|
|
13.7
|
|
15.2
|
|
||||
|
Net income
|
$
|
23.2
|
|
$
|
21.9
|
|
$
|
27.3
|
|
$
|
34.2
|
|
|
Basic earnings per common share
|
$
|
0.52
|
|
$
|
0.46
|
|
$
|
0.49
|
|
$
|
0.61
|
|
|
Diluted earnings per common share
|
0.51
|
|
0.45
|
|
0.48
|
|
0.61
|
|
||||
|
Dividends paid per common share
|
0.24
|
|
0.24
|
|
0.24
|
|
0.24
|
|
||||
|
(1)
Quarterly amounts may not add to annual amounts due to the effect of rounding on a quarterly basis.
|
||||||||||||
Financial Condition
Total assets increased
$1,086.9 million
, or
8.9%
, to
$13,300.2 million
as of
December 31, 2018
, from
$12,213.3 million
as of
December 31, 2017
, with
$797.0 million
of the increase attributable to the INB acquisition. The remaining increase was primarily due to the deployment of funds generated primarily through organic deposit growth into interest earning assets.
Total assets increased $3,149.4 million, or 34.7%, to $12,213.3 million as of December 31, 2017, from $9,063.9 million as of December 31, 2016, with
$3,041.3 million
of the increase attributable to the BOTC acquisition.
Loans
Our loan portfolio consists of a mix of real estate, consumer, commercial, agricultural and other loans, including fixed and variable rate loans. Fluctuations in the loan portfolio are directly related to the economies of the communities we serve. While each loan originated generally must meet minimum underwriting standards established in our credit policies, lending officers are granted certain levels of authority in approving and pricing loans to assure that the banking offices are responsive to competitive issues and community needs in each market area. For additional information regarding our underwriting standards and loan approval policies, see “Community Banking—Lending Activities,” included in Part I, Item 1 of this report.
Total loans
increased
$889.4 million
, or
11.7%
, to
$8,503.7 million
as of
December 31, 2018
, from
$7,614.3 million
as of
December 31, 2017
. Approximately
$713.1 million
of this increase was attributable to the acquisition of INB in August 2018. Exclusive of the INB acquisition, total loans grew organically
$176.3 million
, or
2.3%
, with all major categories of loans held for investment showing growth.
Total loans increased $2,135.8 million, or 39.0%, to $7,614.3 million as of December 31, 2017, from $5,478.5 million as of December 31, 2016. Approximately $2,089.6 million of this increase was attributable to the acquisition of BOTC in May 2017. Exclusive of the BOTC acquisition, total loans grew organically $45.1 million, or 0.8%, with the most notable growth occurring in commercial real estate, indirect consumer, and commercial loans. These increases were partially offset by declines in construction and agricultural real estate loans.
43
The following table presents the composition of our loan portfolio as of the dates indicated:
|
Loans Outstanding
(Dollars in millions)
|
|||||||||||||||||||||||||||||
|
|
As of December 31,
|
||||||||||||||||||||||||||||
|
|
2018
|
Percent
|
2017
|
Percent
|
2016
|
Percent
|
2015
|
Percent
|
2014
|
Percent
|
|||||||||||||||||||
|
Loans
|
|
|
|
|
|
|
|
|
|
|
|||||||||||||||||||
|
Real estate:
|
|
|
|
|
|
|
|
|
|
|
|||||||||||||||||||
|
Commercial
|
$
|
3,235.4
|
|
38.0
|
%
|
$
|
2,822.9
|
|
37.1
|
%
|
$
|
1,834.4
|
|
33.5
|
%
|
$
|
1,793.3
|
|
34.2
|
%
|
$
|
1,639.4
|
|
33.6
|
%
|
||||
|
Construction
|
838.7
|
|
9.9
|
|
708.3
|
|
9.3
|
|
482.0
|
|
8.8
|
|
430.7
|
|
8.2
|
|
418.3
|
|
8.5
|
|
|||||||||
|
Residential
|
1,542.0
|
|
18.1
|
|
1,487.4
|
|
19.5
|
|
1,027.4
|
|
18.8
|
|
1,032.9
|
|
19.7
|
|
999.9
|
|
20.4
|
|
|||||||||
|
Agricultural
|
217.4
|
|
2.6
|
|
158.2
|
|
2.1
|
|
170.2
|
|
3.1
|
|
156.2
|
|
3.0
|
|
167.6
|
|
3.4
|
|
|||||||||
|
Consumer
|
1,070.2
|
|
12.6
|
|
1,034.4
|
|
13.6
|
|
970.3
|
|
17.7
|
|
844.4
|
|
16.1
|
|
762.5
|
|
15.6
|
|
|||||||||
|
Commercial
|
1,310.3
|
|
15.4
|
|
1,215.4
|
|
15.9
|
|
797.9
|
|
14.6
|
|
792.4
|
|
15.1
|
|
740.1
|
|
15.1
|
|
|||||||||
|
Agricultural
|
254.8
|
|
3.0
|
|
136.2
|
|
1.8
|
|
132.9
|
|
2.4
|
|
142.2
|
|
2.7
|
|
124.8
|
|
2.5
|
|
|||||||||
|
Other loans
|
1.6
|
|
—
|
|
4.9
|
|
0.1
|
|
1.6
|
|
—
|
|
1.3
|
|
—
|
|
4.0
|
|
0.1
|
|
|||||||||
|
Mortgage loans held for sale
|
33.3
|
|
0.4
|
|
46.6
|
|
0.6
|
|
61.8
|
|
1.1
|
|
52.9
|
|
1.0
|
|
40.8
|
|
0.8
|
|
|||||||||
|
Total loans
|
8,503.7
|
|
100.0
|
%
|
7,614.3
|
|
100.0
|
%
|
5,478.5
|
|
100.0
|
%
|
5,246.3
|
|
100.0
|
%
|
4,897.4
|
|
100.0
|
%
|
|||||||||
|
Less allowance for loan losses
|
73.0
|
|
|
72.1
|
|
|
76.2
|
|
|
76.8
|
|
|
74.2
|
|
|
||||||||||||||
|
Net loans
|
$
|
8,430.7
|
|
|
$
|
7,542.2
|
|
|
$
|
5,402.3
|
|
|
$
|
5,169.5
|
|
|
$
|
4,823.2
|
|
|
|||||||||
|
Ratio of allowance to total loans
|
0.86
|
%
|
|
0.95
|
%
|
|
1.39
|
%
|
|
1.46
|
%
|
|
1.52
|
%
|
|
||||||||||||||
Real Estate Loans.
We provide interim construction and permanent financing for both single-family and multi-unit properties, medium-term loans for commercial, agricultural and industrial property and/or buildings and equity lines of credit secured by real estate.
Commercial real estate loans
.
Commercial real estate loans include loans for property and improvements used commercially by the borrower or for lease to others for the production of goods or services. Approximately 49.2% and 47.1% of our commercial real estate loans were owner occupied as of
December 31, 2018
and
2017
, respectively. Commercial real estate loans increased
$412.5 million
, or
14.6%
, to
$3,235.4 million
as of
December 31, 2018
, from
$2,822.9 million
as of
December 31, 2017
. Exclusive of
$303.8 million
of INB acquired loans, commercial loans increased organically
$108.7 million
, or
3.9%
. Organic growth primarily occurred in Western Montana and Wyoming.
Commercial real estate loans increased $988.5 million or 53.9%, to $2,822.9 million as of December 31, 2017, from $1,834.4 million as of December 31, 2016, with approximately 96.9% of the increase attributable to the BOTC acquisition.
Construction loans
.
Construction loans are primarily to commercial builders for residential lot development and the construction of single-family residences and commercial real estate properties. Construction loans are generally underwritten pursuant to pre-approved permanent financing. As of
December 31, 2018
, our construction loan portfolio was divided among the following categories: approximately
$242.8 million
, or
28.9%
, residential construction; approximately
$274.3 million
, or
32.7%
, commercial construction; and, approximately
$321.6 million
, or
38.4%
, land acquisition and development. This compares to approximately $240.2 million, or 33.9%, residential construction; approximately $119.4 million, or 16.9%, commercial construction; and, approximately $348.7 million, or 49.2%, land acquisition and development as of December 31, 2017.
Construction loans increased
$130.4 million
, or
18.4%
, to
$838.7 million
as of
December 31, 2018
, from
$708.3 million
as of
December 31, 2017
. Exclusive of
$64.0 million
of INB acquired loans, construction loans increased organically
$66.4 million
, or
9.4%
, due to increases in commercial construction loans, which were partially offset by decreases in land acquisition and development and residential construction loans. Construction loans increased $226.3 million, or 46.9%, to $708.3 million as of December 31, 2017, from $482.0 million as of December 31, 2016, with the increase attributable to the BOTC acquisition. Exclusive of acquired loans, construction loans decreased organically $11.1 million, or 2.3%, due to decreases in land acquisition and development and commercial construction loans, which were partially offset by an increase in residential construction loans.
44
Residential real estate loans
.
Retained residential real estate loans are typically secured by first liens on the financed property and generally mature in less than fifteen years. Included in residential real estate loans were home equity loans and lines of credit of
$409.5 million
and
$397.0 million
as of
December 31, 2018
and
December 31, 2017
, respectively. Residential real estate loans increased
$54.6 million
, or
3.7%
, to
$1,542.0 million
as of
December 31, 2018
, from
$1,487.4 million
as of
December 31, 2017
. Exclusive of
$83.0 million
of INB acquired loans, residential real estate loans decreased
$28.4 million
, or
1.9%
.
Residential real estate loans increased $460.0 million, or 44.8%, to $1,487.4 million as of December 31, 2017, from $1,027.4 million as of December 31, 2016, with the increase attributable to the BOTC acquisition. Exclusive of acquired loans, residential real estate loans were constant from December 31, 2016.
During 2018 and
2017
, we sold most of our residential real estate loan production to secondary investors.
Consumer Loans.
Our consumer loans include direct personal loans; credit card loans and lines of credit; and, indirect loans created when we purchase consumer loan contracts advanced for the purchase of automobiles, boats and other consumer goods from the consumer product dealer network within the market areas we serve. Personal loans and indirect dealer loans are generally secured by automobiles, recreational vehicles, boats and other types of personal property and are made on an installment basis. Credit cards are offered to customers in our market areas. Lines of credit are generally floating rate loans that are unsecured or secured by personal property. Approximately
73.6%
and 75.9% of our consumer loans as of
December 31, 2018
and
2017
, respectively, were indirect consumer loans.
Consumer loans increased
$35.8 million
, or
3.5%
, to
$1,070.2 million
as of
December 31, 2018
, from
$1,034.4 million
as of
December 31, 2017
. Exclusive of
$7.7 million
of INB acquired loans, consumer loans increased organically
$28.1 million
, or
2.7%
, across all consumer loan categories. Consumer loans increased $64.1 million, or 6.6%, to $1,034.4 million as of December 31, 2017, from $970.3 million as of December 31, 2016, with approximately $42.8 million of the increase attributable to the BOTC acquisition. Exclusive of acquired loans, consumer loans increased organically $21.3 million, or 2.2%, primarily due to an increase in indirect consumer loans, which was partially offset by decreases in direct consumer and credit card loans.
Commercial Loans.
We provide a mix of variable and fixed rate commercial loans. The loans are typically made to small and medium-sized manufacturing, wholesale, retail and service businesses for working capital needs and business expansions. Commercial loans generally include lines of credit, business credit cards and loans with maturities of five years or less and outstanding balances tend to be cyclical in nature. The loans are generally made with business operations as the primary source of repayment, and are typically collateralized by inventory, accounts receivable, equipment and/or personal guarantees.
Commercial loans increased
$94.9 million
, or
7.8%
, to
$1,310.3 million
as of
December 31, 2018
, from
$1,215.4 million
as of
December 31, 2017
. Exclusive of
$110.9 million
of INB acquired loans, commercial loans decreased
$16.0 million
, or
1.3%
. Commercial loans increased $417.5 million, or 52.3%, to $1,215.4 million as of December 31, 2017, from $797.9 million as of December 31, 2016. Exclusive of the BOTC acquisition, commercial loans increased $27.5 million primarily due to organic growth across the footprint.
Agricultural Loans.
Our agricultural loans generally consist of short and medium-term loans and lines of credit that are primarily used for crops, livestock, equipment and general operations. Agricultural loans are ordinarily secured by assets such as livestock or equipment and are repaid from the operations of the farm or ranch. Agricultural loans generally have maturities of five years or less, with operating lines for one production season. Agricultural loans increased
$118.6 million
, or
87.1%
, to
$254.8 million
as of
December 31, 2018
, from
$136.2 million
as of
December 31, 2017
. Exclusive of
$101.7 million
of INB acquired loans, agricultural loans increased organically
$16.9 million
, or
12.4%
. The increase is primarily attributable to Montana and South Dakota. Agricultural loans increased $3.3 million, or 2.5%, to $136.2 million as of December 31, 2017, from $132.9 million as of December 31, 2016. Exclusive of agricultural loans acquired in the BOTC acquisition, agricultural loans increased $2.6 million, or 2.0%.
45
The following table presents the maturity distribution of our loan portfolio and the sensitivity of the loans to changes in interest rates as of
December 31, 2018
:
|
Maturities and Interest Rate Sensitivities
(Dollars in millions)
|
||||||||||||
|
Within
One Year
|
One Year to
Five Years
|
After
Five Years
|
Total
|
|||||||||
|
Real estate
|
$
|
1,605.1
|
|
$
|
2,388.6
|
|
$
|
1,839.8
|
|
$
|
5,833.5
|
|
|
Consumer
|
329.7
|
|
649.7
|
|
90.8
|
|
1,070.2
|
|
||||
|
Commercial
|
621.0
|
|
529.7
|
|
159.6
|
|
1,310.3
|
|
||||
|
Agricultural
|
205.6
|
|
45.7
|
|
3.5
|
|
254.8
|
|
||||
|
Other
|
—
|
|
—
|
|
1.6
|
|
1.6
|
|
||||
|
Mortgage loans held for sale
|
33.3
|
|
—
|
|
—
|
|
33.3
|
|
||||
|
Total loans
|
$
|
2,794.7
|
|
$
|
3,613.7
|
|
$
|
2,095.3
|
|
$
|
8,503.7
|
|
|
Loans at fixed interest rates
|
$
|
1,517.1
|
|
$
|
2,216.8
|
|
$
|
339.9
|
|
$
|
4,073.8
|
|
|
Loans at variable interest rates
|
1,277.6
|
|
1,396.9
|
|
1,701.1
|
|
4,375.6
|
|
||||
|
Non-accrual loans
|
—
|
|
—
|
|
54.3
|
|
54.3
|
|
||||
|
Total loans
|
$
|
2,794.7
|
|
$
|
3,613.7
|
|
$
|
2,095.3
|
|
$
|
8,503.7
|
|
Non-Performing Assets
Non-performing assets include non-accrual loans, loans contractually past due by 90 days or more and still accruing interest, and OREO. The following table sets forth information regarding non-performing assets as of the dates indicated:
|
Non-Performing Assets and Troubled Debt Restructurings
(Dollars in thousands)
|
|||||||||||||||
|
As of December 31,
|
2018
|
2017
|
2016
|
2015
|
2014
|
||||||||||
|
Non-performing loans:
|
|
|
|
|
|
||||||||||
|
Non-accrual loans
|
$
|
54.3
|
|
$
|
69.4
|
|
$
|
72.8
|
|
$
|
66.3
|
|
$
|
62.2
|
|
|
Accruing loans past due 90 days or more
|
3.8
|
|
3.1
|
|
3.8
|
|
5.6
|
|
2.5
|
|
|||||
|
Total non-performing loans
|
58.1
|
|
72.5
|
|
76.6
|
|
71.9
|
|
64.7
|
|
|||||
|
OREO
|
14.4
|
|
10.1
|
|
10.0
|
|
6.3
|
|
13.6
|
|
|||||
|
Total non-performing assets
|
$
|
72.5
|
|
$
|
82.6
|
|
$
|
86.6
|
|
$
|
78.2
|
|
$
|
78.3
|
|
|
Troubled debt restructurings not included above (1)
|
$
|
5.6
|
|
$
|
12.6
|
|
$
|
22.3
|
|
$
|
15.4
|
|
$
|
21.0
|
|
|
Non-performing loans to total loans (2)
|
0.68
|
%
|
0.95
|
%
|
1.40
|
%
|
1.37
|
%
|
1.32
|
%
|
|||||
|
Non-performing assets to total loans and OREO (3)
|
0.85
|
|
1.08
|
|
1.58
|
|
1.49
|
|
1.59
|
|
|||||
|
Non-performing assets to total assets (4)
|
0.55
|
|
0.68
|
|
0.96
|
|
0.90
|
|
0.91
|
|
|||||
|
Allowance for loan losses to non-performing loans (5)
|
125.65
|
|
99.40
|
|
99.52
|
|
106.71
|
|
114.58
|
|
|||||
|
(1)
|
Accruing loans modified in troubled debt restructurings are not considered non-performing loans. While still considered impaired under applicable accounting guidance, these loans are performing as agreed under their modified terms and management expects performance to continue.
|
|
(2)
|
Including accruing troubled debt restructurings described in footnote 1, the ratio of non-performing loans to total loans would be
0.75%
,
1.12%
,
1.81%
,
1.67%
and
1.75%
as of
December 31, 2018
,
2017
,
2016
,
2015
and
2014
, respectively.
|
|
(3)
|
Including accruing troubled debt restructurings described in footnote 1, the ratio of non-performing assets to total loans and OREO would be
0.92%
,
1.25%
,
1.98%
,
1.78%
and
2.02%
as of
December 31, 2018
,
2017
,
2016
,
2015
and
2014
, respectively.
|
|
(4)
|
Including accruing troubled debt restructurings described in footnote 1, the ratio of non-performing assets to total assets would be
0.59%
,
0.78%
,
1.20%
,
1.07%
and
1.15%
as of
December 31, 2018
,
2017
,
2016
,
2015
and
2014
, respectively.
|
|
(5)
|
Including accruing troubled debt restructurings described in footnote 1, the ratio of allowance for loan losses to non-performing loans would be
114.55%
,
84.72%
,
77.04%
,
87.89%
and
86.57%
as of
December 31, 2018
,
2017
,
2016
,
2015
, and
2014
, respectively.
|
46
Non-performing loans
. Non-performing loans include non-accrual loans and loans contractually past due 90 days or more and still accruing interest. Impaired loans include all loans risk rated doubtful, loans placed on non-accrual status and loans renegotiated in troubled debt restructurings, with the exception of consumer loans. We monitor and evaluate collateral values on impaired loans quarterly. Appraisals are required on all impaired loans every 18-24 months, or sooner as conditions necessitate. We update valuations on collateral underlying oil and gas credits based on recent market-based oil price forecasts provided by an independent third party. We also monitor real estate values by market for our larger market areas. Based on trends in real estate values, adjustments may be made to the appraised value based on time elapsed between the appraisal date and the impairment analysis or a new appraisal may be ordered. Appraised values in our smaller market areas may be adjusted based on trends identified through discussions with local realtors and appraisers. Appraisals are also adjusted for selling costs. The collateral valuation is compared to the loan balance and any resulting shortfall is recorded in the allowance for loan losses as a specific valuation allowance. Provisions for loan losses are impacted by changes in the specific valuation allowances and historical or general valuation elements of the allowance for loan losses.
Total non-performing loans decreased
$14.4 million
, or
19.9%
, to
$58.1 million
as of
December 31, 2018
, from
$72.5 million
as of
December 31, 2017
. Non-accrual loans, the largest component of non-performing loans, decreased
$15.1 million
, or
21.8%
, to
$54.3 million
as of
December 31, 2018
, from
$69.4 million
as of
December 31, 2017
. This decrease was primarily due to the movement of non-performing loans out of the portfolio through pay-downs, charge-offs and the sale of $9.3 million of construction and commercial real estate loans.
Total non-performing loans increased $4.1 million, or 5.4%, to $72.5 million as of December 31, 2017, from $76.6 million as of December 31, 2016. Non-accrual loans decreased $3.3 million, or 4.6%, to $69.5 million as of December 31, 2017, from $72.8 million as of December 31, 2016. This decrease was primarily due to the movement of non-performing loans out of the portfolio through pay-downs, charge-offs and foreclosures.
The following table sets forth the allocation of our non-performing loans among our different types of loans as of the dates indicated.
|
Non-Performing Loans by Loan Type
(Dollars in millions)
|
|||||||||||||||||||||||||||||
|
|
As of December 31,
|
||||||||||||||||||||||||||||
|
|
2018
|
Percent
|
2017
|
Percent
|
2016
|
Percent
|
2015
|
Percent
|
2014
|
Percent
|
|||||||||||||||||||
|
Real estate:
|
|
|
|
|
|
|
|
|
|
|
|||||||||||||||||||
|
Commercial
|
$
|
10.0
|
|
17.2
|
%
|
$
|
27.1
|
|
37.4
|
%
|
$
|
26.5
|
|
34.6
|
%
|
$
|
24.2
|
|
33.6
|
%
|
$
|
27.7
|
|
42.8
|
%
|
||||
|
Construction:
|
|
|
|
|
|
|
|
|
|
|
|||||||||||||||||||
|
Land acquisition and development
|
3.9
|
|
6.7
|
|
3.3
|
|
4.6
|
|
5.3
|
|
6.9
|
|
7.9
|
|
11.0
|
|
8.2
|
|
12.7
|
|
|||||||||
|
Residential
|
1.0
|
|
1.7
|
|
1.7
|
|
2.3
|
|
0.5
|
|
0.6
|
|
0.3
|
|
0.4
|
|
0.3
|
|
0.4
|
|
|||||||||
|
Commercial
|
0.2
|
|
0.3
|
|
3.8
|
|
5.2
|
|
0.8
|
|
1.0
|
|
1.0
|
|
1.3
|
|
2.6
|
|
4.0
|
|
|||||||||
|
Total construction
|
5.1
|
|
8.7
|
|
8.8
|
|
12.1
|
|
6.6
|
|
8.5
|
|
9.2
|
|
12.7
|
|
11.1
|
|
17.1
|
|
|||||||||
|
Residential
|
6.8
|
|
11.8
|
|
8.6
|
|
11.8
|
|
7.1
|
|
9.3
|
|
7.3
|
|
10.2
|
|
4.6
|
|
7.0
|
|
|||||||||
|
Agricultural
|
12.6
|
|
21.7
|
|
3.6
|
|
5.0
|
|
4.3
|
|
5.7
|
|
5.3
|
|
7.4
|
|
6.8
|
|
10.6
|
|
|||||||||
|
Total real estate
|
34.5
|
|
59.4
|
|
48.1
|
|
66.3
|
|
44.5
|
|
58.1
|
|
46.0
|
|
63.9
|
|
50.2
|
|
77.5
|
|
|||||||||
|
Consumer
|
3.5
|
|
6.0
|
|
3.3
|
|
4.6
|
|
2.9
|
|
3.8
|
|
1.9
|
|
2.7
|
|
1.3
|
|
2.0
|
|
|||||||||
|
Commercial
|
17.1
|
|
29.4
|
|
20.3
|
|
28.0
|
|
26.2
|
|
34.2
|
|
23.0
|
|
32.0
|
|
12.8
|
|
19.8
|
|
|||||||||
|
Agricultural
|
3.0
|
|
5.2
|
|
0.8
|
|
1.1
|
|
3.0
|
|
3.9
|
|
0.7
|
|
1.0
|
|
0.4
|
|
0.7
|
|
|||||||||
|
Other
|
—
|
|
—
|
|
—
|
|
—
|
|
—
|
|
—
|
|
0.3
|
|
0.4
|
|
—
|
|
—
|
|
|||||||||
|
Total non-performing loans
|
$
|
58.1
|
|
100.0
|
%
|
$
|
72.5
|
|
100.0
|
%
|
$
|
76.6
|
|
100.0
|
%
|
$
|
71.9
|
|
100.0
|
%
|
$
|
64.7
|
|
100.0
|
%
|
||||
Non-accrual loans
. We generally place loans, excluding acquired credit impaired loans, on non-accrual when they become 90 days past due, unless they are well secured and in the process of collection. When a loan is placed on non-accrual status, any interest previously accrued but not collected is reversed from income. If all loans on non-accrual status had been current in accordance with their original terms, gross interest income of approximately
$3.0 million
,
$3.5 million
and
$3.4 million
would have been accrued for the years ended
December 31, 2018
,
2017
and
2016
, respectively.
47
Loans are returned to accrual status when all principal and interest amounts contractually due are brought current and when, in the opinion of management, the loans are estimated to be fully collectible as to both principal and interest. Loans returned to accrual status are no longer considered impaired.
For additional information regarding non-performing loans, see “Notes to Consolidated Financial Statements—Loans” included in financial statements included Part IV, Item 15 of this report.
OREO
. OREO consists of real property acquired through foreclosure on the collateral underlying defaulted loans. We initially record OREO at fair value less estimated selling costs. Any excess of loan carrying value over the fair value of the real estate acquired is recorded as a charge against the allowance for loan losses. Estimated losses that result from the ongoing periodic valuation of these properties are charged to earnings in the period in which they are identified. The fair values of OREO properties are estimated using appraisals and management estimates of current market conditions. OREO properties are appraised every 18-24 months unless deterioration in local market conditions indicates the need to obtain new appraisals sooner. OREO properties are evaluated by management quarterly to determine if additional write-downs are appropriate or necessary based on current market conditions. Quarterly evaluations include a review of the most recent appraisal of the property and reviews of recent appraisals and comparable sales data for similar properties in the same or adjacent market areas. Commercial and agricultural OREO properties are listed with unrelated third party professional real estate agents or brokers local to the areas where the marketed properties are located. Residential properties are typically listed with local realtors, after any redemption period has expired. We rely on these local real estate agents and/or brokers to list the properties on the local multiple listing system, to provide marketing materials and advertisements for the properties and to conduct open houses.
OREO increased
$4.3 million
, or
42.6%
, to
$14.4 million
as of
December 31, 2018
, from
$10.1 million
as of
December 31, 2017
. During
2018
, we recorded additions to OREO of
$12.1 million
, acquired
$0.6 million
in conjunction with the INB acquisition, wrote down the fair value of OREO properties by
$0.1 million
and sold OREO with a book value of
$8.3 million
. As of
December 31, 2018
, 17.2% of our OREO balance related to land and land development properties, 68.5% to commercial properties, 13.9% to residential real estate properties and 0.4% to construction properties.
OREO remained constant at $10.1 million as of December 31, 2017 as compared to December 31, 2016. During 2017, we recorded additions to OREO of $6.6 million, $1.2 million of which was acquired in conjunction with the BOTC acquisition, wrote down the fair value of OREO properties by $0.4 million and sold OREO with a book value of $6.1 million. As of December 31, 2017, 18.7% of our OREO balance related to land and land development properties, 54.1% to commercial properties, 26.6% to residential real estate properties and 0.6% to construction properties.
Troubled Debt Restructurings
. Modifications of performing loans are made in the ordinary course of business and are completed on a case-by-case basis as negotiated with the borrower. Loan modifications typically include interest rate concessions, interest-only periods, short-term payment deferrals and extension of amortization periods to provide payment relief. A loan modification is considered a troubled debt restructuring if the borrower is experiencing financial difficulties and we, for economic or legal reasons, grant a concession to the borrower that we would not otherwise consider. Those modifications deemed to be troubled debt restructurings are monitored centrally to ensure proper classification as a troubled debt restructuring and if or when the loan may be placed on accrual status.
As of
December 31, 2018
, we had loans renegotiated in troubled debt restructurings of
$23.4 million
, of which
$17.8 million
were reported as non-accrual loans in the non-performing asset and troubled debt restructurings and non-performing loan tables above. The remaining
$5.6 million
were on accrual status and are reported as troubled debt restructurings in the non-performing asset and troubled debt restructurings table above.
As of December 31, 2017, we had loans renegotiated in troubled debt restructurings of $44.5 million, of which $31.9 million were reported as non-accrual loans in the non-performing asset and troubled debt restructurings and non-performing loan tables above. The remaining $12.6 million were on accrual status and are reported as troubled debt restructurings in the non-performing asset and troubled debt restructurings table above.
For additional information regarding loans modified in troubled debt restructurings, see “Notes to Consolidated Financial Statements—Loans” included in financial statements included Part IV, Item 15 of this report.
48
Allowance for Loan Losses
The Company performs a quarterly assessment of the adequacy of its allowance for loan losses in accordance with GAAP. The methodology used to assess the adequacy is consistently applied to the Company’s loan portfolio. The allowance for loan losses is established through a provision for loan losses based on our evaluation of known and inherent risk in our loan portfolio at each balance sheet date. In determining the allowance for loan losses, we estimate losses on specific loans, or groups of loans, where the probable loss can be identified and reasonably determined. The balance of the allowance for loan losses is based on internally assigned risk classifications of loans, historical loan loss rates, changes in the nature of the loan portfolio, overall portfolio quality, industry concentrations, delinquency trends, current economic factors and the estimated impact of current economic conditions on certain historical loan loss rates. See the discussion under “Critical Accounting Estimates and Significant Accounting Policies — Allowance for Loan Losses” above.
The allowance for loan losses is increased by provisions charged against earnings and net recoveries of charged-off loans and is reduced by negative provisions credited to earnings and net loan charge-offs. Loans, or portions thereof, are charged-off when management believes that the collectability of the principal is unlikely or, with respect to consumer installment and credit card loans, according to established delinquency schedules. The allowance for loan losses consists of three elements:
|
(1)
|
Specific valuation allowances associated with impaired loans. Specific valuation allowances are determined based on assessment of the fair value of the collateral underlying the loans as determined through independent appraisals, the present value of future cash flows, observable market prices and any relevant qualitative or environmental factors impacting the loan. No specific valuation allowances are recorded for impaired loans that are adequately secured.
|
|
(2)
|
Historical valuation allowances based on loan loss experience for similar loans with similar characteristics and trends. Historical valuation allowances are determined by applying percentage loss factors to the credit exposures from outstanding loans. For commercial, agricultural and real estate loans, loss factors are applied based on the internal risk classifications of these loans. For consumer loans, loss factors are applied on a portfolio basis. For commercial, agriculture and real estate loans, loss factor percentages are based on a migration analysis of our historical loss experience, designed to account for credit deterioration. For consumer loans, loss factor percentages are based on a three-year loss history.
|
|
(3)
|
General valuation allowances determined based on changes in the nature of the loan portfolio, overall portfolio quality, industry concentrations, delinquency trends, general economic conditions and other qualitative risk factors both internal and external to us.
|
Based on the assessment of the adequacy of the allowance for loan losses, the Company records provisions for loan losses to maintain the allowance for loan losses at appropriate levels.
Loans acquired in business combinations are recorded at fair value with no allowance for loan losses on the date of acquisition. Subsequent to the acquisition date, an allowance for loan loss is recorded for the emergence of new probable and estimable losses on loans acquired without evidence of credit impairment. Loans acquired with evidence of credit impairment are regularly monitored and to the extent that the performance has deteriorated from the Company’s expectations at the date of acquisition, an allowance for loan losses is established. As of
December 31, 2018
and
2017
, management determined that an allowance of
$0.8 million
and
$1.0 million
, respectively, related to loans acquired in prior year acquisitions with evidence of credit impairment was required under GAAP.
Loans, or portions thereof, are charged-off against the allowance for loan losses when management believes that the collectability of the principal is unlikely, or, with respect to consumer installment loans, according to an established delinquency schedule. Generally, loans are charged-off when (1) there has been no material principal reduction within the previous 90 days and there is no pending sale of collateral or other assets, (2) there is no significant or pending event which will result in principal reduction within the upcoming 90 days, (3) it is clear that we will not be able to collect all or a portion of the loan, (4) payments on the loan are sporadic, will result in an excessive amortization or are not consistent with the collateral held or (5) foreclosure or repossession actions are pending. Loan charge-offs do not directly correspond with the receipt of independent appraisals or the use of observable market data if the collateral value is determined to be sufficient to repay the principal balance of the loan.
49
If the impaired loan is adequately collateralized, a specific valuation allowance is not recorded. As such, significant changes in impaired and non-performing loans do not necessarily correspond proportionally with changes in the specific valuation component of the allowance for loan losses. Additionally, the Company expects the timing of charge-offs will vary between quarters and will not necessarily correspond proportionally to changes in the allowance for loan losses or changes in non-performing or impaired loans due to timing differences among the initial identification of an impaired loan, recording of a specific valuation allowance for the impaired loan and any resulting charge-off of uncollectible principal.
During
2018
, we recorded provisions for loan losses of
$8.6 million
, as compared to
$11.0 million
in
2017
. The decrease in provisions for loan losses during
2018
, as compared to
2017
, is reflective of improved credit quality and lower levels of net loan charge-offs.
During 2017, we recorded provisions for loan losses of $11.0 million, as compared to $10.0 million in 2016. Increases in provisions for loan losses during 2017, as compared to 2016, are reflective of higher levels of net loan charge-offs.
The following table sets forth information regarding our allowance for loan losses as of the dates and for the periods indicated.
|
Allowance for Loan Losses
(Dollars in millions)
|
|||||||||||||||
|
As of and for the year ended December 31,
|
2018
|
2017
|
2016
|
2015
|
2014
|
||||||||||
|
Balance at the beginning of period
|
$
|
72.1
|
|
$
|
76.2
|
|
$
|
76.8
|
|
$
|
74.2
|
|
$
|
85.3
|
|
|
Charge-offs:
|
|||||||||||||||
|
Real estate
|
|||||||||||||||
|
Commercial
|
1.9
|
|
2.3
|
|
3.5
|
|
0.3
|
|
2.0
|
|
|||||
|
Construction
|
0.7
|
|
0.8
|
|
0.7
|
|
2.4
|
|
0.3
|
|
|||||
|
Residential
|
1.1
|
|
1.2
|
|
1.0
|
|
0.7
|
|
0.7
|
|
|||||
|
Agricultural
|
—
|
|
—
|
|
—
|
|
0.7
|
|
—
|
|
|||||
|
Consumer
|
11.3
|
|
11.3
|
|
8.6
|
|
5.6
|
|
4.9
|
|
|||||
|
Commercial
|
4.7
|
|
6.8
|
|
5.8
|
|
1.7
|
|
6.0
|
|
|||||
|
Agricultural
|
—
|
|
0.4
|
|
0.2
|
|
0.2
|
|
0.1
|
|
|||||
|
Total charge-offs
|
19.7
|
|
22.8
|
|
19.8
|
|
11.6
|
|
14.0
|
|
|||||
|
Recoveries:
|
|||||||||||||||
|
Real estate
|
|||||||||||||||
|
Commercial
|
1.9
|
|
0.9
|
|
0.5
|
|
1.8
|
|
1.0
|
|
|||||
|
Construction
|
0.9
|
|
0.2
|
|
1.8
|
|
0.9
|
|
2.0
|
|
|||||
|
Residential
|
0.9
|
|
0.3
|
|
0.3
|
|
0.4
|
|
0.4
|
|
|||||
|
Agricultural
|
—
|
|
—
|
|
0.6
|
|
—
|
|
—
|
|
|||||
|
Consumer
|
4.5
|
|
4.2
|
|
2.8
|
|
2.6
|
|
2.3
|
|
|||||
|
Commercial
|
3.6
|
|
2.1
|
|
3.2
|
|
1.7
|
|
3.8
|
|
|||||
|
Agricultural
|
0.2
|
|
—
|
|
—
|
|
—
|
|
—
|
|
|||||
|
Total recoveries
|
12.0
|
|
7.7
|
|
9.2
|
|
7.4
|
|
9.5
|
|
|||||
|
Net charge-offs
|
7.7
|
|
15.1
|
|
10.6
|
|
4.2
|
|
4.5
|
|
|||||
|
Provision for loan losses
|
8.6
|
|
11.0
|
|
10.0
|
|
6.8
|
|
(6.6
|
)
|
|||||
|
Balance at end of period
|
$
|
73.0
|
|
$
|
72.1
|
|
$
|
76.2
|
|
$
|
76.8
|
|
$
|
74.2
|
|
|
Period end loans
|
$
|
8,503.7
|
|
$
|
7,614.3
|
|
$
|
5,478.5
|
|
$
|
5,246.2
|
|
$
|
4,897.4
|
|
|
Average loans
|
7,985.0
|
|
6,675.4
|
|
5,378.3
|
|
5,056.8
|
|
4,602.9
|
|
|||||
|
Net charge-offs to average loans
|
0.10
|
%
|
0.23
|
%
|
0.20
|
%
|
0.08
|
%
|
0.10
|
%
|
|||||
|
Allowance to period-end loans
|
0.86
|
|
0.95
|
|
1.39
|
|
1.46
|
|
1.52
|
|
|||||
The allowance for loan losses was
$73.0 million
, or
0.86%
of period-end loans, at
December 31, 2018
, compared to
$72.1 million
, or
0.95%
of period-end loans, at
December 31, 2017
, and
$76.2 million
, or
1.39%
of period-end loans, at
December 31, 2017
. The decrease in the allowance for loan losses as a percentage of total loans as of
December 31, 2018
, compared to
December 31, 2017
and
December 31, 2016
, is primarily due to the addition of acquired loans which are initially recorded at fair value with no carryover of the related allowance for loan losses.
50
During second quarter 2016, we performed an in-depth review of qualitative factors used in determining the appropriate level of the allowance for loan losses to better reflect our loss experience. The review resulted in reductions in general reserves allocated to commercial real estate and construction loans. Decreases in general reserves were more than offset by increases in specific reserves on commercial real estate loans. The adjustment of qualitative factors combined with management’s assessment of losses on specific loans with identified weaknesses did not result in a material impact to the overall level of our allowance for loan losses.
As of
December 31, 2018
, our direct exposure to the energy sector was approximately $78.2 million in loan commitments, including approximately $61.8 million outstanding loans related to drilling and extraction activity, of which, approximately $28.6 million in loans are advanced to service companies. We also had commitments to lend an additional $16.4 million to energy borrowers. Reserves allocated to energy loans as a percentage of total energy loans totaled 8.2% as of
December 31, 2018
, compared to 8.8% as of
December 31, 2017
. The decrease in reserves allocated to energy loans was primarily due to the charge-off of specific reserves related to one borrower.
Although we have established our allowance for loan losses in accordance with GAAP in the United States and we believe that the allowance for loan losses is adequate to provide for known and inherent losses in the portfolio at all times, future provisions will be subject to on-going evaluations of the risks in the loan portfolio. If the economy declines or asset quality deteriorates, material additional provisions could be required.
The allowance for loan losses is allocated to loan categories based on the relative risk characteristics, asset classifications and actual loss experience of the loan portfolio. The following table provides a summary of the allocation of the allowance for loan losses for specific loan categories as of the dates indicated. The allocations presented should not be interpreted as an indication that charges to the allowance for loan losses will be incurred in these amounts or proportions, or that the portion of the allowance allocated to each loan category represents the total amount available for future losses that may occur within these categories. The unallocated portion of the allowance for loan losses and the total allowance are applicable to the entire loan portfolio.
|
Allocation of the Allowance for Loan Losses
(Dollars in thousands)
|
|||||||||||||||||||||||||
|
As of December 31,
|
2018
|
2017
|
2016
|
2015
|
2014
|
||||||||||||||||||||
|
|
Allocated
Reserves
|
% of
Loan
Category
to Total
Loans
|
Allocated
Reserves
|
% of
Loan
Category
to Total
Loans
|
Allocated
Reserves |
% of
Loan Category to Total Loans |
Allocated
Reserves |
% of
Loan Category to Total Loans |
Allocated
Reserves |
% of
Loan Category to Total Loans |
|||||||||||||||
|
Real estate
|
$
|
31.0
|
|
68.6
|
%
|
$
|
31.7
|
|
68.0
|
%
|
$
|
28.6
|
|
64.2
|
%
|
$
|
52.3
|
|
65.1
|
%
|
$
|
53.9
|
|
65.9
|
%
|
|
Consumer
|
8.7
|
|
12.6
|
|
8.7
|
|
13.6
|
|
7.7
|
|
17.7
|
|
5.1
|
|
16.1
|
|
5.0
|
|
15.6
|
|
|||||
|
Commercial
|
31.3
|
|
15.4
|
|
30.5
|
|
16.0
|
|
38.1
|
|
14.6
|
|
18.8
|
|
15.1
|
|
14.3
|
|
15.2
|
|
|||||
|
Agricultural
|
2.0
|
|
3.0
|
|
1.2
|
|
1.8
|
|
1.8
|
|
2.4
|
|
0.6
|
|
2.7
|
|
1.0
|
|
2.5
|
|
|||||
|
Mortgage loans held for sale
|
—
|
|
0.4
|
|
—
|
|
0.6
|
|
—
|
|
1.1
|
|
—
|
|
1.0
|
|
—
|
|
0.8
|
|
|||||
|
Unallocated
|
—
|
|
N/A
|
|
—
|
|
N/A
|
|
—
|
|
N/A
|
|
—
|
|
N/A
|
|
—
|
|
N/A
|
|
|||||
|
Totals
|
$
|
73.0
|
|
100.0
|
%
|
$
|
72.1
|
|
100.0
|
%
|
$
|
76.2
|
|
100.0
|
%
|
$
|
76.8
|
|
100.0
|
%
|
$
|
74.2
|
|
100.0
|
%
|
The allowance for loan losses allocated to real estate loans decreased
2.2%
to
$31.0 million
as of
December 31, 2018
, from
$31.7 million
as of
December 31, 2017
, primarily due to lower levels of specific reserves and lower loss rates in the real estate portfolio. The allowance for loan losses allocated to real estate loans increased 10.5% to $31.6 million as of December 31, 2017, from $28.6 million as of December 31, 2016, primarily due to higher levels of specific reserves and higher loss rates in the real estate portfolio.
The allowance for loan losses allocated to commercial loans increased
2.6%
to
$31.3 million
as of
December 31, 2018
, from
$30.5 million
as of
December 31, 2017
, primarily due to higher levels of specific reserves and higher loss rates within the commercial portfolio. The allowance for loan losses allocated to commercial loans decreased 19.7% to $30.6 million as of December 31, 2017, from $38.1 million as of December 31, 2016, primarily due to lower levels of specific reserves and lower rates within the commercial portfolio.
51
Investment Securities
We manage our investment portfolio to obtain the highest yield possible, while meeting our risk tolerance and liquidity guidelines and satisfying the pledging requirements for deposits of state and political subdivisions and securities sold under repurchase agreements. Our portfolio principally comprises U.S. government agency residential mortgage-backed securities and collateralized mortgage obligations, U.S. government agency securities and tax exempt securities. Federal funds sold and interest bearing deposits in bank are additional investments that are classified as cash equivalents rather than as investment securities. Investment securities classified as available-for-sale are recorded at fair value, while investment securities classified as held-to-maturity are recorded at amortized cost. Unrealized gains or losses, net of the deferred tax effect, on available-for-sale securities are reported as increases or decreases in accumulated other comprehensive income or loss, a component of stockholders’ equity.
Investment securities
decreased
$15.7 million
, or
0.6%
, to
$2,677.5 million
as of
December 31, 2018
, from
$2,693.2 million
as of
December 31, 2017
. The decrease is due to normal fluctuations in our investment portfolio. Investment securities increased $568.7 million, or 26.8%, to $2,693.2 million as of December 31, 2017, from $2,124.5 million as of December 31, 2016. Approximately $481.6 million of this increase was attributable to the acquisition of BOTC in May 2017 with the remaining increase due to normal fluctuations in our investment portfolio.
52
The following table sets forth the book value, percentage of total investment securities and weighted average yields on investment securities as of
December 31, 2018
. Weighted-average yields have been computed on a fully taxable-equivalent basis using a tax rate of 21%.
|
Securities Maturities and Yield
(Dollars in millions)
|
|||||||
|
Book
Value
|
% of Total
Investment
Securities
|
Weighted
Average
FTE Yield
|
|||||
|
U.S. Treasuries
|
|
|
|
||||
|
Maturing within one year
|
$
|
2.6
|
|
0.10
|
%
|
3.79
|
%
|
|
Mark-to-market adjustments on securities available-for-sale
|
—
|
|
—
|
|
NA
|
|
|
|
Total
|
2.6
|
|
0.10
|
|
3.79
|
|
|
|
U.S. Government agency securities
|
|
|
|
||||
|
Maturing within one year
|
107.7
|
|
4.02
|
|
1.53
|
|
|
|
Maturing in one to five years
|
430.1
|
|
16.06
|
|
4.15
|
|
|
|
Maturing in five to ten years
|
51.3
|
|
1.92
|
|
2.77
|
|
|
|
Mark-to-market adjustments on securities available-for-sale
|
(10.1
|
)
|
(0.38
|
)
|
NA
|
|
|
|
Total
|
579.0
|
|
21.62
|
|
3.61
|
|
|
|
Mortgage-backed securities
|
|
|
|
||||
|
Maturing within one year
|
361.8
|
|
13.51
|
|
2.61
|
|
|
|
Maturing in one to five years
|
1,172.2
|
|
43.78
|
|
1.78
|
|
|
|
Maturing in five to ten years
|
120.6
|
|
4.50
|
|
3.02
|
|
|
|
Maturing after ten years
|
173.6
|
|
6.48
|
|
3.19
|
|
|
|
Mark-to-market adjustments on securities available-for-sale
|
(23.4
|
)
|
(0.87
|
)
|
NA
|
|
|
|
Total
|
1,804.8
|
|
67.40
|
|
2.22
|
|
|
|
Marketable CDs
|
|
|
|
||||
|
Maturing within one year
|
1.2
|
|
0.05
|
|
2.06
|
|
|
|
Maturing in one to five years
|
0.7
|
|
0.03
|
|
2.17
|
|
|
|
Mark-to-market adjustments on securities available-for-sale
|
—
|
|
—
|
|
NA
|
|
|
|
Total
|
1.9
|
|
0.08
|
|
2.11
|
|
|
|
Tax exempt securities
|
|
|
|
||||
|
Maturing within one year
|
11.9
|
|
0.45
|
|
2.55
|
|
|
|
Maturing in one to five years
|
61.2
|
|
2.29
|
|
3.13
|
|
|
|
Maturing in five to ten years
|
71.0
|
|
2.65
|
|
3.86
|
|
|
|
Maturing after ten years
|
6.8
|
|
0.25
|
|
4.89
|
|
|
|
Mark-to-market adjustments on securities available-for-sale
|
—
|
|
—
|
|
NA
|
|
|
|
Total
|
150.9
|
|
5.64
|
|
3.51
|
|
|
|
Corporate securities
|
|||||||
|
Maturing within one year
|
56.7
|
|
2.12
|
|
1.81
|
|
|
|
Maturing in one to five years
|
76.5
|
|
2.86
|
|
2.32
|
|
|
|
Maturing after ten years
|
6.0
|
|
0.22
|
|
5.75
|
|
|
|
Mark-to-market adjustments on securities available-for-sale
|
(1.0
|
)
|
(0.04
|
)
|
NA
|
|
|
|
Total
|
138.2
|
|
5.16
|
|
2.28
|
|
|
|
Other securities
|
|
|
|
||||
|
Maturing in five to ten years
|
0.1
|
|
—
|
|
7.66
|
|
|
|
Mark-to-market adjustments on securities available-for-sale
|
—
|
|
—
|
|
NA
|
|
|
|
Total
|
0.1
|
|
—
|
|
7.66
|
|
|
|
Total
|
$
|
2,677.5
|
|
100.00
|
%
|
2.21
|
%
|
Maturities of securities noted above reflect
$64.7 million
of investment securities at their final maturities which have call provisions within the next year. Based on current market interest rates, management expects approximately $2.0 million of these securities will be called in
2019
.
53
As of
December 31, 2018
, the estimated duration of our investment portfolio was 2.5 years, as compared to 2.7 years as of
December 31, 2017
. The weighted average yield on investment securities increased
24
basis points to
2.21%
in
2018
, from
1.97%
in
2017
, and increased
17
basis points to
1.97%
in
2017
, from
1.80%
in
2016
.
As of
December 31, 2018
, investment securities with amortized costs and fair values of
$1,943.1 million
and
$1,908.4 million
, respectively, were pledged to secure public deposits and securities sold under repurchase agreements, as compared to $2,087.7 million and $2,062.6 million, respectively, as of
December 31, 2017
. For additional information concerning securities sold under repurchase agreements, see “—Securities Sold Under Repurchase Agreements” included herein.
Mortgage-backed securities, and to a limited extent other securities, have uncertain cash flow characteristics that present additional interest rate risk in the form of prepayment or extension risk primarily caused by changes in market interest rates. This additional risk is generally rewarded in the form of higher yields. Maturities of mortgage-backed securities presented above have been adjusted to reflect shorter maturities based upon estimated prepayments of principal. As of
December 31, 2018
, the carrying value of our investments in non-agency mortgage-backed securities totaled
$72.0 million
. All other mortgage-backed securities included in the table above were issued by U.S. government agencies and corporations. As of
December 31, 2018
, there were no significant concentrations of investments (greater than 10% of stockholders’ equity) in any individual security issuer, except for U.S. government or agency-backed securities.
Approximately
76.5%
and 77.4% of our tax-exempt securities were general obligation securities as of
December 31, 2018
and
2017
, respectively, of which
57.8%
and 81.0%, respectively, were issued by political subdivisions or agencies within the states of Idaho, Montana, Oregon, South Dakota, Washington, and Wyoming.
We evaluate our investment portfolio quarterly for other-than-temporary declines in the market value of individual investment securities. This evaluation includes monitoring credit ratings; market, industry and corporate news; volatility in market prices; and, determining whether the market value of a security has been below its cost for an extended period of time. As of
December 31, 2018
, we had investment securities with fair values aggregating
$995.9 million
that had been in a continuous loss position more than twelve months. Gross unrealized losses on these securities totaled
$20.0 million
as of
December 31, 2018
, and were primarily attributable to changes in interest rates. No impairment losses were recorded during
2018
,
2017
or
2016
.
For additional information concerning investment securities, see “Notes to Consolidated Financial Statements — Investment Securities” included in Part IV, Item 15.
Goodwill and Intangibles
Goodwill
increased
$102.0 million
, or
22.94%
, to
$546.7 million
as of
December 31, 2018
, from
$444.7 million
as of
December 31, 2017
, attributable to the provisional goodwill recorded in conjunction with the acquisition of INB and the finalization of provisional amounts related to prior acquisitions. Goodwill increased $231.9 million, or 109.0%, to $444.7 million as of December 31, 2017, from $212.8 million as of December 31, 2016, attributable to the goodwill recorded in conjunction with the acquisition of BOTC.
Core deposit intangibles represent the intangible value of depositor relationships resulting from deposit liabilities assumed and are amortized based on the estimated useful lives of the related deposits. Core deposit intangibles, net of accumulated amortization,
increased
$7.8 million
, or
15.9%
, to
$56.9 million
as of
December 31, 2018
, from
$49.1 million
as of
December 31, 2017
, attributable to the core deposit intangibles recorded in conjunction with the acquisition of INB. Core deposit intangibles, net of accumulated amortization increased $39.5 million, or 411.5%, to $49.1 million as December 31, 2017, from $9.6 million as of December 31, 2016, attributable to the core deposit intangibles recorded in conjunction with the acquisition of BOTC. We acquired core deposit intangibles of
$15.7 million
in conjunction with our acquisition of INB in August 2018, $48.0 million in conjunction with our acquisition of BOTC in May 2017, and $2.5 million in conjunction with our acquisition of Flathead in August 2016.
54
Deposits
We emphasize developing relationships with our customers in order to increase our core deposit base, which is our primary funding source. Our deposits consist of non-interest bearing and interest bearing demand, savings, individual retirement and time deposit accounts.
The following table summarizes our deposits as of the dates indicated:
|
Deposits
(Dollars in millions)
|
|||||||||||||||||||||||||
|
As of December 31,
|
2018
|
Percent
|
2017
|
Percent
|
2016
|
Percent
|
2015
|
Percent
|
2014
|
Percent
|
|||||||||||||||
|
Non-interest bearing demand
|
$
|
3,158.3
|
|
29.6
|
%
|
$
|
2,900.0
|
|
29.2
|
%
|
$
|
1,906.3
|
|
25.8
|
%
|
$
|
1,823.7
|
|
25.6
|
%
|
$
|
1,791.4
|
|
25.6
|
%
|
|
Interest bearing:
|
|||||||||||||||||||||||||
|
Demand
|
2,957.5
|
|
27.7
|
|
2,787.5
|
|
28.1
|
|
2,276.5
|
|
30.9
|
|
2,178.4
|
|
30.8
|
|
2,133.3
|
|
30.4
|
|
|||||
|
Savings
|
3,247.9
|
|
30.4
|
|
3,095.4
|
|
31.2
|
|
2,141.8
|
|
29.0
|
|
1,955.2
|
|
27.6
|
|
1,843.4
|
|
26.3
|
|
|||||
|
Time, $100 or more
|
547.6
|
|
5.1
|
|
432.0
|
|
4.3
|
|
461.4
|
|
6.3
|
|
487.4
|
|
6.9
|
|
520.1
|
|
7.4
|
|
|||||
|
Time, other
|
769.4
|
|
7.2
|
|
720.0
|
|
7.2
|
|
590.1
|
|
8.0
|
|
644.2
|
|
9.1
|
|
718.1
|
|
10.3
|
|
|||||
|
Total interest bearing
|
7,522.4
|
|
70.4
|
|
7,034.9
|
|
70.8
|
|
5,469.8
|
|
74.2
|
|
5,265.2
|
|
74.4
|
|
5,214.9
|
|
74.4
|
|
|||||
|
Total deposits
|
$
|
10,680.7
|
|
100.0
|
%
|
$
|
9,934.9
|
|
100.0
|
%
|
$
|
7,376.1
|
|
100.0
|
%
|
$
|
7,088.9
|
|
100.0
|
%
|
$
|
7,006.3
|
|
100.0
|
%
|
Total deposits
increased
$745.8 million
, or
7.51%
, to
$10,680.7 million
as of
December 31, 2018
, from
$9,934.9 million
as of
December 31, 2017
, with approximately
$696.3 million
of the increase attributable to the INB acquisition in August 2018. Total deposits increased
$2,558.8 million
, or
34.7%
, to
$9,934.9 million
as of
December 31, 2017
, from
$7,376.1 million
as of
December 31, 2016
, with the increase attributable to the BOTC acquisition in May 2017. During
2018
, the mix of deposits shifted slightly from lower-costing savings and demand deposits to higher-costing time deposits.
Non-interest bearing demand deposits.
Non-interest bearing demand deposits
increased
$258.3 million
, or
8.9%
, to
$3,158.3 million
as of
December 31, 2018
, from
$2,900.0 million
as of
December 31, 2017
. Approximately
$231.8 million
of this increase was attributable to the acquisition of INB in August 2018. Exclusive of the INB acquisition, non-interest bearing demand deposits increased organically
$26.5 million
, or
0.9%
. Non-interest bearing demand deposits increased $993.7 million, or 52.1%, to $2,900.0 million as of December 31, 2017, from $1,906.3 million as of December 31, 2016, with the increase attributable to the BOTC acquisition in May 2017. Exclusive of acquired deposits, non-interest bearing demand deposits decreased $15.0 million, or 0.8%.
Interest bearing demand deposits.
Interest bearing demand deposits
increased
$170.0 million
, or
6.1%
, to
$2,957.5 million
as of
December 31, 2018
, from
$2,787.5 million
as of
December 31, 2017
. Approximately
$158.2 million
of this increase was attributable to the acquisition of INB in August 2018. Exclusive of the INB acquisition, interest bearing demand deposits increased organically
$11.8 million
, or
0.4%
. Interest bearing demand deposits increased $511.0 million, or 22.4%, to $2,787.5 million as of December 31, 2017, from $2,276.5 million as of December 31, 2016, with the increase attributable to the BOTC acquisition in May 2017. Exclusive of acquired deposits, interest bearing demand deposits decreased organically $106.2 million, or 4.7%.
Savings deposits.
Savings deposits
increased
$152.5 million
, or
4.9%
, to
$3,247.9 million
as of
December 31, 2018
, from
$3,095.4 million
as of
December 31, 2017
. Approximately
$204.6 million
of this increase was attributable to the acquisition of INB in August 2018. Exclusive of the INB acquisition, savings deposits decreased
$52.1 million
, or
1.7%
. Savings deposits increased $953.6 million, or 44.5%, to $3,095.4 million as of December 31, 2017, from $2,141.8 million as of December 31, 2016, with approximately $902.5 million of the increase attributable to the BOTC acquisition in May 2017. Exclusive of acquired deposits, savings deposits increased organically $51.1 million, or 2.4%, net of the health savings deposits sold in 2017.
55
Time deposits of $100,000 or more.
Time deposits of $100,000 or more
increased
$115.6 million
, or
26.8%
, to
$547.6 million
as of
December 31, 2018
, from
$432.0 million
as of
December 31, 2017
. Approximately
$28.7 million
of this increase was attributable to the acquisition of INB in August 2018. Exclusive of the INB acquisition, time deposits of $100,000 or more increased organically
$86.9 million
, or
20.1%
. Time deposits of $100,000 or more decreased $29.4 million, or 6.4%, to $432.0 million as of December 31, 2017, from $461.4 million as of December 31, 2016. Exclusive of acquired deposits, time deposits of $100,000 or more decreased $83.2 million, or 18.0%.
Other time deposits.
Other time deposits
increased
$49.4 million
, or
6.9%
, to
$769.4 million
as of
December 31, 2018
, from
$720.0 million
as of
December 31, 2017
. Approximately
$73.0 million
of this increase was attributable to the acquisition of INB in August 2018. Exclusive of the INB acquisition, other time deposits decreased
$23.6 million
, or
3.3%
. Other time deposits increased $129.9 million, or 22.0%, to $720.0 million as of December 31, 2017, from $590.1 million as of December 31, 2016. Exclusive of other time deposits acquired in the BOTC acquisition in May 2017, other time deposits decreased $40.4 million, or 6.8%, from December 31, 2016 to December 31, 2017.
As of
December 31, 2018
and
2017
, we had Certificate of Deposit Account Registry Service, or CDARS, deposits of
$87.1 million
and
$94.2 million
, respectively. As of
December 31, 2018
and
2017
, we had brokered deposits of
$24.1 million
and
zero
, respectively. Our brokered deposits were acquired through acquisitions.
For additional information concerning customer deposits, including the use of repurchase agreements, see “Business—Community Banking—Deposit Products,” included in Part I, Item 1 and “Notes to Consolidated Financial Statements—Deposits,” included in Part IV, Item 15 of this report.
Securities Sold Under Repurchase Agreements
Under repurchase agreements with commercial and municipal depositors, customer deposit balances are invested in short-term U.S. government agency securities overnight and are then repurchased the following day. All outstanding repurchase agreements are due in one day and balances fluctuate in the normal course of business. Repurchase agreement balances
increased
$69.4 million
, or
10.8%
, to
$712.4 million
as of
December 31, 2018
, from
$643.0 million
as of
December 31, 2017
, and increased
$105.4 million
, or
19.6%
, as of
December 31, 2017
from
$537.6 million
as of
December 31, 2016
.
The following table sets forth certain information regarding securities sold under repurchase agreements as of the dates indicated:
|
Securities Sold Under Repurchase Agreements
(Dollars in millions)
|
|||||||||
|
As of and for the year ended December 31,
|
2018
|
2017
|
2016
|
||||||
|
Securities sold under repurchase agreements:
|
|
|
|
||||||
|
Balance at period end
|
$
|
712.4
|
|
$
|
643.0
|
|
$
|
537.6
|
|
|
Average balance
|
642.8
|
|
587.1
|
|
481.0
|
|
|||
|
Maximum amount outstanding at any month-end
|
712.4
|
|
704.4
|
|
537.6
|
|
|||
|
Average interest rate:
|
|
|
|
||||||
|
During the year
|
0.42
|
%
|
0.21
|
%
|
0.09
|
%
|
|||
|
At period end
|
0.59
|
|
0.26
|
|
0.18
|
|
|||
Long-Term Debt
Long-term debt increased
$2.7 million
, or
20.6%
, to
$15.8 million
as of
December 31, 2018
, from
$13.1 million
as of
December 31, 2017
, primarily due to
$2.6 million
related to two note payables related to a New Market Tax Credit (“NMTC”). On
March 21, 2018
, the Company borrowed
$2.0 million
on a note payable maturing on
March 31, 2038
, with interest only at a
1.30%
fixed rate, payable monthly, until
March 31, 2025
and then principal and interest payable at a
3.25%
fixed rate until maturity. The note is collateralized by the Company’s equity interest in FC Sub CDE, LLC, a community development entity, or CDE, owned
99.9%
by the Company. On
March 29, 2018
, the Company borrowed
$0.6 million
on a
1.30%
fixed rate note payable maturing on
June 1, 2034
, with interest only, payable monthly, until
March 31, 2025
and then principal and interest payable until maturity. The note is collateralized by the Company’s equity interest in BH Sub CDE, LLC, a CDE owned
99.9%
by the Company.
56
Long-term debt decreased $14.9 million, or 53.2%, to $13.1 million as of December 31, 2017, from $28.0 million as of December 31, 2016 due to the reclassification of $20.0 million of subordinated debt to other borrowed funds, as the maturity of the debt was then under one year, which was offset by an increase on November 16, 2017, when the Company borrowed $5.1 million related to a NMTC on a 1.0% fixed rate note payable maturing on December 31, 2041. The note payable is interest only, payable quarterly, until December 31, 2025 and then principal and interest payable until maturity. The note is collateralized by the Company’s equity interest related to a NMTC in BFCC Sub CDE, LLC, a CDE owned 99.9% by the Company. For additional information regarding the long-term debt, see “Notes to Consolidated Financial Statements—Long-Term Debt,” included in Part IV, Item 15 of this report.
Accounts Payable and Accrued Expenses
Accounts payable and accrued expenses
increased
$7.5 million
, or
8.7%
, to
$94.1 million
as of
December 31, 2018
, from
$86.6 million
as of
December 31, 2017
. This increase was attributable to accruals as a result of the acquisition of INB in August 2018 and fluctuations in the normal course of business. Accounts payable and accrued expenses increased
$41.7 million
, or
92.9%
, to
$86.6 million
as of
December 31, 2017
, from
$44.9 million
as of December 31, 2016. This increase was primarily attributable to deferred compensation accruals as a result of the acquisition of BOTC in May 2017.
Deferred Tax Liability/Asset
As of
December 31, 2018
, we had a net deferred tax liability of
$8.6 million
, as compared to a net deferred tax asset of
$4.0 million
as of
December 31, 2017
. The shift in deferred taxes from a net asset to a net liability was primarily due to decreases in deferred tax assets as a result of the utilization of NOL carryforwards and federal tax credit carryforwards offset by increases in deferred tax liabilities related to amortization of intangible assets and depreciation of fixed assets.
As of
December 31, 2017
, we had a net deferred tax asset of
$4.0 million
, as compared to a net deferred tax liability of
$6.8 million
as of
December 31, 2016
. The shift in deferred taxes from a net liability to a net asset was primarily due to increases in deferred tax assets related to NOL carryforwards and federal tax credits from the BOTC merger. These increases were partially offset by increases in deferred tax liabilities related to depreciation of fixed assets.
Contractual Obligations
Contractual obligations as of
December 31, 2018
are summarized in the following table.
|
Contractual Obligations
(Dollars in millions)
|
|||||||||||||||
|
|
Payments Due
|
||||||||||||||
|
Within
One Year
|
One Year to
Three Years
|
Three Years
to Five Years
|
After
Five Years
|
Total
|
|||||||||||
|
Deposits without a stated maturity
|
$
|
9,363.7
|
|
$
|
—
|
|
$
|
—
|
|
$
|
—
|
|
$
|
9,363.7
|
|
|
Time deposits
|
823.4
|
|
452.5
|
|
41.1
|
|
—
|
|
1,317.0
|
|
|||||
|
Securities sold under repurchase agreements
|
712.4
|
|
—
|
|
—
|
|
—
|
|
712.4
|
|
|||||
|
Long-term debt obligations (1)
|
—
|
|
—
|
|
5.0
|
|
9.4
|
|
14.4
|
|
|||||
|
Capital lease obligations
|
0.1
|
|
0.2
|
|
0.2
|
|
0.9
|
|
1.4
|
|
|||||
|
Operating lease obligations
|
6.0
|
|
11.2
|
|
10.4
|
|
18.1
|
|
45.7
|
|
|||||
|
Purchase obligations (2)
|
2.7
|
|
—
|
|
—
|
|
—
|
|
2.7
|
|
|||||
|
Subordinated debentures held by subsidiary trusts (3)
|
—
|
|
—
|
|
—
|
|
86.9
|
|
86.9
|
|
|||||
|
Total contractual obligations
|
$
|
10,908.3
|
|
$
|
463.9
|
|
$
|
56.7
|
|
$
|
115.3
|
|
$
|
11,544.2
|
|
|
(1)
|
Long-term debt obligations consists of fixed rate note payables with various interest rates from
1.00%
to
6.24%
and maturities from
July 29, 2022
through
March 31, 2038
. For additional information concerning long-term debt, see “Notes to Consolidated Financial Statements — Long Term Debt and Other Borrowed Funds” included in Part IV, Item 15.
|
|
(2)
|
Purchase obligations relate to obligations under construction contracts to build or renovate banking offices.
|
|
(3)
|
The subordinated debentures are unsecured, with various interest rates and maturities from
June 30, 2035
through
April 1, 2038
. Interest distributions are payable quarterly; however, we may defer interest payments at any time for a period not exceeding 20 consecutive quarters. For additional information concerning the subordinated debentures, see “Notes to Consolidated Financial Statements — Subordinated Debentures Held by Subsidiary Trusts” included in Part IV, Item 15.
|
57
We also have obligations under a post-retirement healthcare benefit plan. These obligations represent actuarially determined future benefit payments to eligible plan participants. See “Notes to Consolidated Financial Statements — Employee Benefit Plans” included in Part IV, Item 15.
Off-Balance Sheet Arrangements
We have entered into various arrangements not reflected on the consolidated balance sheet that have or are reasonably likely to have a current or future effect on our financial condition, results of operations or liquidity. These include guarantees, commitments to extend credit and standby letters of credit.
We guarantee the distributions and payments for redemption or liquidation of capital trust preferred securities issued by our wholly-owned subsidiary business trusts to the extent of funds held by the trusts. Although the guarantees are not separately recorded, the obligations underlying the guarantees are fully reflected on our consolidated balance sheets as subordinated debentures held by subsidiary trusts. The subordinated debentures currently qualify as tier 1 capital under the Federal Reserve capital adequacy guidelines. For additional information regarding the subordinated debentures, see “Notes to Consolidated Financial Statements — Subordinated Debentures Held by Subsidiary Trusts” included in Part IV, Item 15.
We are a party to financial instruments with off-balance sheet risk in the normal course of business to meet the financing needs of our customers. These financial instruments include commitments to extend credit and standby letters of credit. For additional information regarding our off-balance sheet arrangements, see “Notes to Consolidated Financial Statements — Financial Instruments with Off-Balance Sheet Risk” included in Part IV, Item 15.
Capital Resources and Liquidity Management
Capital Resources
Stockholders’ equity is influenced primarily by earnings, dividends, sales and redemptions of common stock and changes in the unrealized holding gains or losses, net of taxes, on available-for-sale investment securities. Stockholders’ equity
increased
$266.3 million
, or
18.7%
, to
$1,693.9 million
as of
December 31, 2018
from
$1,427.6 million
as of
December 31, 2017
, due primarily to the retention of earnings, stock-based compensation, proceeds from stock option exercises, and issuance of additional Class A common stock as partial consideration for the acquisition of Northwest. This increase was offset by other comprehensive losses, stock repurchases of vested restricted shares tendered in lieu of cash for payment of income tax withholding amounts by participants, and aggregate cash dividends of
$64.1 million
to common shareholders during
2018
.
On
January 29, 2019
, we declared a quarterly dividend to common stockholders of
$0.31
per share, which was paid on
February 21, 2019
to shareholders of record as of
February 11, 2019
. For additional information regarding the repurchases, see “Notes to Consolidated Financial Statements — Capital Stock and Dividend Restrictions” included in Part IV, Item 15 of this report.
Stockholders’ equity increased
$445.0 million
, or
45.3%
, to
$1,427.6 million
as of
December 31, 2017
from
$982.6 million
as of
December 31, 2016
, due primarily to the retention of earnings and issuance of common stock as partial consideration for the acquisition of Cascade Bancorp. Increases in stockholders’ equity due to earnings retention were partially offset by the repurchase and retirement of our common stock and aggregate cash dividends of
$48.6 million
to common shareholders during
2017
.
On
August 16, 2018
, the Company issued
3,837,540
shares of its Class A common stock with an aggregate value of
$173.3 million
as partial consideration for the acquisition of Northwest. In addition, during
2018
, the Company issued
11,389
shares of its Class A common stock to directors for their annual service on the Company’s board of directors. The aggregate value of the shares issued to directors of
$0.5 million
is included in stock-based compensation expense in the accompanying consolidated statements of changes in stockholders’ equity.
On June 8, 2018, we filed a registration statement on Form S-4, as amended on July 2, 2018, to register 3,982,842 shares of Class A common stock to be issued as partial consideration for our acquisition of Northwest.
On November 28, 2018, we filed a registration statement on Form S-4, as amended on January 16, 2019, to register 4,045,302 shares of Class A common stock to be issued as partial consideration for our acquisition of IIBK.
58
On November 28, 2018, we filed a registration statement on Form S-4, as amended on January 16, 2019, to register 492,069 shares of Class A common stock to be issued as partial consideration for our acquisition of CMYF.
For additional information regarding the acquisition, see “—Executive Overview—Recent Trends and Developments” included above “Notes to Consolidated Financial Statements—Acquisitions,” included in Part IV, Item 15 of this report.
On July 2, 2013, the Board of Governors of the Federal Reserve Bank, or the Federal Reserve Board, issued a final rule implementing a revised regulatory capital framework for U.S. banks in accordance with the Basel III international accord and satisfying related mandates under the Dodd-Frank Act. Under the final rule, minimum capital requirements will increase for both quantity and quality of capital held by banking organizations. The final rule includes a new common equity tier 1 minimum capital requirement of 4.5% of risk-weighted assets and increases the minimum tier 1 capital requirement from 4.0% to 6.0% of risk-weighted assets. The minimum total risk-based capital remains unchanged at 8.0% of total risk-weighted assets. In addition to the minimum common equity tier 1, tier 1 and total risk-based capital requirements, the final rule requires banking organizations to hold a buffer of common equity tier 1 capital in an amount above 2.5% of total risk-weighted assets to avoid restrictions on capital distributions and discretionary bonus payments to executive officers. The minimum regulatory capital requirements and compliance with a standardized approach for determining risk-weighted assets of the final rule became effective for us on January 1, 2015. The capital conservation buffer framework transition period began January 1, 2016, with full implementation effective January 1, 2019.
As of
December 31, 2018
and
2017
, we had capital levels that, in all cases, exceeded the well capitalized guidelines. Additionally, our calculations indicate that as of
December 31, 2018
, we would meet all fully phased-in Basel III capital adequacy requirements. For additional information regarding the impact of this final rule, see “Regulation and Supervision — Capital Standards and Prompt Corrective Action” included in Part I, Item 1 of this report. For additional information regarding our capital levels, see “Notes to Consolidated Financial Statements—Regulatory Capital,” included in Part IV, Item 15 of this report.
Liquidity
Liquidity measures our ability to meet current and future cash flow needs on a timely basis and at a reasonable cost. We manage our liquidity position to meet the daily cash flow needs of customers, while maintaining an appropriate balance between assets and liabilities to meet the return on investment objectives of our shareholders. Our liquidity position is supported by management of liquid assets and liabilities and access to alternative sources of funds. Liquid assets include cash, interest bearing deposits in banks, federal funds sold, available-for-sale investment securities and maturing or prepaying balances in our held-to-maturity investment and loan portfolios. Liquid liabilities include core deposits, federal funds purchased, securities sold under repurchase agreements and borrowings. Other sources of liquidity include the sale of loans, the ability to acquire additional national market funds through non-core deposits, the issuance of additional collateralized borrowings such as FHLB advances, the issuance of debt securities, additional borrowings through the Federal Reserve’s discount window and the issuance of preferred or common securities.
Our short-term and long-term liquidity requirements are primarily to fund on-going operations, including payment of interest on deposits and debt, extensions of credit to borrowers, capital expenditures and shareholder dividends. These liquidity requirements are met primarily through cash flow from operations, redeployment of prepaying and maturing balances in our loan and investment portfolios, debt financing and increases in customer deposits. For additional information regarding our operating, investing and financing cash flows, see “Consolidated Financial Statements—Consolidated Statements of Cash Flows,” included in Part IV, Item 15 of this report.
As a holding company, we are a corporation separate and apart from our subsidiary Bank and, therefore, we provide for our own liquidity. Our main sources of funding include management fees and dividends declared and paid by our subsidiaries and access to capital markets. There are statutory, regulatory and debt covenant limitations that affect the ability of our Bank to pay dividends to us. Management believes that such limitations will not impact our ability to meet our ongoing short-term cash obligations. For additional information regarding dividend restrictions, see “—Financial Condition—Capital Resources and Liquidity Management” above and “Business—Regulation and Supervision—Restrictions on Transfers of Funds to Us and the Bank” and “Risk Factors—Risks Relating to the Market and Our Business.”
Management continuously monitors our liquidity position and adjustments are made to the balance between sources and uses of funds as deemed appropriate. Our management is not aware of any events that are reasonably likely to have a material adverse effect on our liquidity, capital resources or operations. In addition, our management is not aware of any regulatory recommendations regarding liquidity, which if implemented, would have a material adverse effect on us.
59
Item 7A. Quantitative and Qualitative Disclosures About Market Risk
Our primary market risk exposure is interest rate risk. Our business and the composition of our balance sheet consists of investments in interest earning assets (principally loans and investment securities) which are primarily funded by interest bearing liabilities (deposits and indebtedness). Such financial instruments have varying levels of sensitivity to changes in market interest rates. Interest rate risk results when, due to different maturity dates and repricing intervals, interest rate indices for interest earning assets fluctuate adversely relative to interest bearing liabilities, thereby creating a risk of decreased net earnings and cash flow.
Although we characterize some of our interest-sensitive assets as securities available-for-sale, such securities are not purchased with the intent to sell in the near term. Rather, such securities may be sold in response to or in anticipation of changes in interest rates and resulting prepayment risk. See “Notes to Consolidated Financial Statements—Summary of Significant Accounting Policies” included in Part IV, Item 15 of this report.
Asset Liability Management
The goal of asset liability management is the prudent control of market risk, liquidity and capital. Asset liability management is governed by policies, goals and objectives adopted and reviewed by the Bank’s board of directors. Development of asset liability management strategies is the responsibility of the Asset Liability Committee, or ALCO, which is composed of members of senior management.
Interest Rate Risk
Interest rate risk is the risk of loss of future earnings or long-term value due to changes in interest rates. Our primary source of earnings is net interest income, which is affected by changes in interest rates, the relationship between rates on interest bearing assets and liabilities, the impact of interest rate fluctuations on asset prepayments and the mix of interest bearing assets and liabilities.
The ability to optimize net interest income is largely dependent upon the achievement of an interest rate spread that can be managed during periods of fluctuating interest rates. Interest sensitivity is a measure of the extent to which net interest income will be affected by market interest rates over a period of time. Interest rate sensitivity is related to the difference between amounts of interest earning assets and interest bearing liabilities which either reprice or mature within a given period of time. The difference is known as interest rate sensitivity gap.
60
The following table shows interest rate sensitivity gaps and the earnings sensitivity ratio for different intervals as of
December 31, 2018
. The information presented in the table is based on our mix of interest earning assets and interest bearing liabilities and historical experience regarding their interest rate sensitivity.
|
Interest Rate Sensitivity Gaps
(Dollars in millions)
|
|||||||||||||||
|
|
Projected Maturity or Repricing
|
||||||||||||||
|
Three
Months
or Less
|
Three
Months to
One Year
|
One
Year to
Five Years
|
After
Five Years
|
Total
|
|||||||||||
|
Interest earning assets:
|
|
|
|
|
|
||||||||||
|
Loans (1)
|
$
|
2,727.6
|
|
$
|
1,559.1
|
|
$
|
3,648.8
|
|
$
|
513.9
|
|
$
|
8,449.4
|
|
|
Investment securities (2)
|
207.2
|
|
423.8
|
|
1,412.3
|
|
634.2
|
|
2,677.5
|
|
|||||
|
Interest bearing deposits in banks
|
577.8
|
|
—
|
|
—
|
|
—
|
|
577.8
|
|
|||||
|
Federal funds sold
|
0.1
|
|
—
|
|
—
|
|
—
|
|
0.1
|
|
|||||
|
Total interest earning assets
|
$
|
3,512.7
|
|
$
|
1,982.9
|
|
$
|
5,061.1
|
|
$
|
1,148.1
|
|
$
|
11,704.8
|
|
|
Interest bearing liabilities:
|
|
|
|
|
|
||||||||||
|
Interest bearing demand accounts (3)
|
$
|
841.1
|
|
$
|
667.6
|
|
$
|
1,448.8
|
|
$
|
—
|
|
$
|
2,957.5
|
|
|
Savings deposits (3)
|
1,380.4
|
|
243.6
|
|
1,623.9
|
|
—
|
|
3,247.9
|
|
|||||
|
Time deposits, $100 or more
|
63.5
|
|
247.9
|
|
236.2
|
|
—
|
|
547.6
|
|
|||||
|
Other time deposits
|
249.4
|
|
262.6
|
|
257.4
|
|
—
|
|
769.4
|
|
|||||
|
Securities sold under repurchase agreements
|
712.4
|
|
—
|
|
—
|
|
—
|
|
712.4
|
|
|||||
|
Long-term debt
|
—
|
|
0.1
|
|
5.4
|
|
10.3
|
|
15.8
|
|
|||||
|
Subordinated debentures held by subsidiary trusts
|
86.9
|
|
—
|
|
—
|
|
—
|
|
86.9
|
|
|||||
|
Total interest bearing liabilities
|
$
|
3,333.7
|
|
$
|
1,421.8
|
|
$
|
3,571.7
|
|
$
|
10.3
|
|
$
|
8,337.5
|
|
|
Rate gap
|
$
|
179.0
|
|
$
|
561.1
|
|
$
|
1,489.4
|
|
$
|
1,137.8
|
|
$
|
3,367.3
|
|
|
Cumulative rate gap
|
179.0
|
|
740.1
|
|
2,229.5
|
|
3,367.3
|
|
|
||||||
|
Cumulative rate gap as a percentage of total interest earning assets
|
1.53
|
%
|
6.32
|
%
|
19.05
|
%
|
28.77
|
%
|
28.77
|
%
|
|||||
|
(1)
|
Does not include non-accrual loans of
$54.3 million
. Variable rate loans are included in the three months or less category in the above table although certain of these loans have reached interest rate floors and may not immediately reprice.
|
|
(2)
|
Adjusted to reflect: (a) expected shorter maturities based upon our historical experience of early prepayments of principal, and (b) the redemption of callable securities on their next call date.
|
|
(3)
|
Interest bearing demand and savings deposits, while technically subject to immediate withdrawal, actually display sensitivity characteristics that generally fall within one to five years. Their allocation is presented based on those sensitivity characteristics. If these deposits were included in the three month or less category, the above table would reflect a negative three month gap of $3.8 million, a negative cumulative one year gap of $2.3 million and a positive cumulative one to five year gap of $2.2 million.
|
Net Interest Income Sensitivity
We believe net interest income sensitivity provides the best perspective of how day-to-day decisions affect our interest rate risk profile. We monitor net interest income sensitivity by utilizing an income simulation model to subject twelve month net interest income to various rate movements. Simulations modeled quarterly include scenarios where market rates change instantaneously up or down in a parallel manner and scenarios where market rates gradually increase 200 basis points. Estimates produced by our income simulation model are based on numerous assumptions including, but not limited to: (1) the timing of changes in interest rates, (2) shifts or rotations in the yield curve, (3) repricing characteristics for market rate sensitive instruments, (4) differing sensitivities of financial instruments due to differing underlying rate indices, (5) varying loan prepayment speeds for different interest rate scenarios, (6) the effect of interest rate limitations in our assets, such as caps and floors, and (7) overall growth and repayment rates and product mix of assets and liabilities. Because of limitations inherent in any approach used to measure interest rate risk, simulation results are not intended as a forecast of the actual effect of a change in market interest rates on our results, but rather to provide insight into our current interest rate exposure and execute appropriate asset/liability management strategies accordingly.
61
We target a mix of interest earning assets and interest bearing liabilities such that no more than 4.0% of the net interest income will be at risk over a one-year period, should interest rates immediately shift up or down 100 basis points, or gradually shift up 200 basis points over a 12 month period. As of
December 31, 2018
, our income simulation model predicted net interest income would increase $2.0 million, or 0.42% on an immediate 100 basis point shock. Assuming a 0.5% increase in interest rates during each of the next four consecutive quarters, net interest income would increase $6.3 million or 1.33%. Both scenarios predict that our interest bearing assets reprice faster than our interest bearing liabilities. We are not engaged in significant derivative or balance sheet hedging activities to manage our interest rate risk.
The preceding interest rate sensitivity analysis does not represent a forecast and should not be relied upon as being indicative of expected operating results.
Recent Accounting Pronouncements
The expected impact of accounting standards recently issued but not yet adopted are discussed in “Notes to Consolidated Financial Statements—Authoritative Accounting Guidance” included in Part IV, Item 15 of this report.
Item 8. Financial Statements and Supplementary Data
The following consolidated financial statements of First Interstate BancSystem, Inc. and subsidiaries are contained in Part IV, Item 15 of this report and are incorporated herein by reference.
Report of RSM US LLP, Independent Registered Public Accounting Firm
Consolidated Balance Sheets —
December 31, 2018
and
2017
Consolidated Statements of Income — Years Ended
December 31, 2018
,
2017
and
2016
Consolidated Statements of Comprehensive Income — Years Ended
December 31, 2018
,
2017
and
2016
Consolidated Statements of Stockholders’ Equity — Years Ended
December 31, 2018
,
2017
and
2016
Consolidated Statements of Cash Flows — Years Ended
December 31, 2018
,
2017
and
2016
Notes to Consolidated Financial Statements
Item 9. Changes in and Disagreements with Accountants on Accounting and Financial Disclosure
There have been no disagreements with accountants on accounting and financial disclosure.
Item 9A. Controls and Procedures
Disclosure Controls and Procedures
We have established and maintain disclosure controls and procedures, as defined under Rules 13a-15(e) and 15d-15(e) of the Exchange Act. As of
December 31, 2018
, our management evaluated, under the supervision and with the participation of the Chief Executive Officer and Chief Financial Officer, the effectiveness of the design and operation of our disclosure controls and procedures. Based on that evaluation, the Chief Executive Officer and Chief Financial Officer concluded that our disclosure controls and procedures, as of
December 31, 2018
, were effective in ensuring that information required to be disclosed by us in reports that we file or submit under the Exchange Act is recorded, processed, summarized, and reported within the time periods required by the SEC’s rules and forms and is accumulated and communicated to our management, including our Chief Executive Officer and Chief Financial Officer, as appropriate to allow timely decisions regarding required disclosure.
62
Management’s Report on Internal Control over Financial Reporting
The Company’s management is responsible for establishing and maintaining adequate internal control over financial reporting, as such term is defined in the Exchange Act Rules 13a-15(f) and 15d-15(f). Internal control over financial reporting includes controls and procedures designed to provide reasonable assurance to our management and board of directors regarding the preparation and fair presentation of our published financial statements in accordance with U.S. generally accepted accounting principles.
All internal control systems, no matter how well designed, have inherent limitations. Therefore, even systems that are deemed to be effective can provide only reasonable assurance with respect to financial statement preparation and presentation. Also, projections of any evaluation of effectiveness to future periods are subject to the risk that controls may become inadequate due to changes in conditions, or that the degree of compliance with the policies or procedures may deteriorate.
As permitted by guidance provided by the staff of the U.S. Securities and Exchange Commission, the scope of management’s assessment of internal control over financial reporting as of
December 31, 2018
has excluded the Company’s wholly owned subsidiary, Inland Northwest Bank, which was acquired on
August 16, 2018
, but did not merge with and into First Interstate Bank until
November 9, 2018
.
Our management, including the Chief Executive Officer and the Chief Financial Officer, assessed the effectiveness of our system of internal control over financial reporting as of
December 31, 2018
based on the guidelines established in the
Internal Control--Integrated Framework
(2013 framework) issued by the Committee of Sponsoring Organizations of the Treadway Commission. Based on our assessment, we believe that, as of
December 31, 2018
, our system of internal control over financial reporting was effective to provide reasonable assurance regarding the reliability of our financial reporting and the preparation of our financial statements for external purposes in accordance with U.S. generally accepted accounting principles.
RSM US LLP, the independent registered public accounting firm that audited our consolidated financial statements included in this Annual Report on Form 10-K, has issued an attestation report on the effectiveness of our internal control over financial reporting as of
December 31, 2018
. The report, which expresses an unqualified opinion on the effectiveness of our internal control over financial reporting as of
December 31, 2018
, is included below.
63
Report of Independent Registered Public Accounting Firm
To the Shareholders and the Board of Directors of First Interstate BancSystem, Inc.
Opinion on the Internal Control Over Financial Reporting
We have audited First Interstate BancSystem, Inc. and subsidiaries’ (the Company) internal control over financial reporting as of December 31, 2018, based on criteria established in
Internal Control - Integrated Framework
issued by the Committee of Sponsoring Organizations of the Treadway Commission in 2013. In our opinion, the Company maintained, in all material respects, effective internal control over financial reporting as of December 31, 2018, based on criteria established in
Internal Control - Integrated Framework
issued by the Committee of Sponsoring Organizations of the Treadway Commission in 2013.
We have also audited, in accordance with the standards of the Public Company Accounting Oversight Board (United States) (PCAOB), the consolidated balance sheets as of December 31, 2018 and 2017, and the consolidated statements of income, comprehensive income, stockholders’ equity and cash flows for each of the three years in the period ended December 31, 2018, and the related notes to the consolidated financial statements of the Company and our report dated
February 27, 2019
expressed an unqualified opinion.
As described in Management’s Report on Internal Control over Financial Reporting, management has excluded Inland Northwest Bank from its assessment of internal control over financial reporting as of December 31, 2018, because it was acquired by the Company in a purchase business combination in the third quarter of 2018. We have also excluded Inland Northwest Bank from our audit of internal control over financial reporting. Inland Northwest Bank operated as a wholly-owned subsidiary of the Company from August 16, 2018 (the date of acquisition) until it was merged into First Interstate Bank on November 9, 2018. Inland Northwest Bank’s total assets represented approximately 6.0% of the Company’s related consolidated assets as of the date of the merger.
Basis for Opinion
The Company’s management is responsible for maintaining effective internal control over financial reporting and for its assessment of the effectiveness of internal control over financial reporting in the accompanying Management’s Report on Internal Control Over Financial Reporting. Our responsibility is to express an opinion on the Company’s internal control over financial reporting based on our audit. We are a public accounting firm registered with the PCAOB and are required to be independent with respect to the Company in accordance with U.S. federal securities laws and the applicable rules and regulations of the Securities and Exchange Commission and the PCAOB.
We conducted our audit in accordance with the standards of the PCAOB. Those standards require that we plan and perform the audit to obtain reasonable assurance about whether effective internal control over financial reporting was maintained in all material respects. Our audit included obtaining an understanding of internal control over financial reporting, assessing the risk that a material weakness exists, and testing and evaluating the design and operating effectiveness of internal control based on the assessed risk. Our audit also included performing such other procedures as we considered necessary in the circumstances. We believe that our audit provides a reasonable basis for our opinion.
Definition and Limitations of Internal Control Over Financial Reporting
A company’s internal control over financial reporting is a process designed to provide reasonable assurance regarding the reliability of financial reporting and the preparation of financial statements for external purposes in accordance with generally accepted accounting principles. A company’s internal control over financial reporting includes those policies and procedures that (1) pertain to the maintenance of records that, in reasonable detail, accurately and fairly reflect the transactions and dispositions of the assets of the company; (2) provide reasonable assurance that transactions are recorded as necessary to permit preparation of financial statements in accordance with generally accepted accounting principles, and that receipts and expenditures of the company are being made only in accordance with authorizations of management and directors of the company; and (3) provide reasonable assurance regarding prevention or timely detection of unauthorized acquisition, use or disposition of the company’s assets that could have a material effect on the financial statements.
Because of its inherent limitations, internal control over financial reporting may not prevent or detect misstatements. Also, projections of any evaluation of effectiveness to future periods are subject to the risk that controls may become inadequate because of changes in conditions, or that the degree of compliance with the policies or procedures may deteriorate.
/s/ RSM US LLP
Des Moines, Iowa
February 27, 2019
64
Item 9B. Other Information
There were no items required to be disclosed in a report on Form 8-K during the fourth quarter of
2018
that were not reported.
PART III
Item 10. Directors, Executive Officers and Corporate Governance
Information concerning directors, executive officers and corporate governance is set forth under the heading, “Directors and Executive Officers” and “Corporate Governance” in our Proxy Statement relating to our
2019
annual meeting of shareholders and is herein incorporated by reference.
Information concerning our compliance with section 16(a) of the Securities Exchange Act of 1934 is set forth under the heading “Section 16(a) Beneficial Ownership Reporting Compliance” in our Proxy Statement relating to our
2019
annual meeting of shareholders and is herein incorporated by reference.
Item 11. Executive Compensation
Information concerning executive compensation is set forth under the headings “Compensation Discussion and Analysis” and “Compensation of Executive Officers and Directors” in our Proxy Statement relating to our
2019
annual meeting of shareholders and is herein incorporated by reference.
Item 12. Security Ownership of Certain Beneficial Owners and Management and Related Stockholder Matters
Information concerning security ownership of certain beneficial owners and management as well as related stockholder matters is set forth under the heading “Security Ownership of Certain Beneficial Owners and Management” and “Equity Compensation Plans” in our Proxy Statement relating to our
2019
annual meeting of shareholders and is herein incorporated by reference.
The following table provides information, as of
December 31, 2018
, regarding our equity compensation plans.
|
Number of Securities to be
|
Weighted Average
|
Number of Securities
|
||||
|
Issued Upon Exercise of
|
Exercise Price of
|
Remaining Available
|
||||
|
Outstanding Options,
|
Outstanding Options,
|
For Future Issuance Under
|
||||
|
Plan Category
|
Warrants and Rights
|
Warrants and Rights
|
Equity Compensation Plans(1)
|
|||
|
Equity compensation plans
|
||||||
|
approved by shareholders(2)
|
428,176
|
$15.61
|
1,727,765
|
|||
|
Equity compensation plans not
|
||||||
|
approved by shareholders
|
NA
|
NA
|
NA
|
|||
|
(1)
|
Excludes number of securities to be issued upon exercise of outstanding options, warrants and rights.
|
|
(2)
|
Represents stock options issued pursuant to the 2015 Equity Compensation Plan, as amended and restated. For additional information, see “Notes to Consolidated Financial Statements—Stock Based Compensation” included in financial statements included Part IV, Item 15 of this report.
|
65
Item 13. Certain Relationships and Related Transactions and Director Independence
Information concerning relationships and related party transactions of certain of our executive officers, directors, and greater than 5% shareholders as well as the independence of our directors is set forth under the headings “Directors and Executive Officers” and “Certain Relationships and Related Transactions” in our Proxy Statement relating to our
2019
annual meeting of shareholders and is herein incorporated by reference. In addition, see “Notes to Consolidated Financial Statements—Related Party Transactions” included in Part IV, Item 15.
Item 14. Principal Accountant Fees and Services
Information concerning principal accountant fees and services is set forth under the heading “Directors and Executive Officers — Principal Accounting Fees and Services” in our Proxy Statement relating to our
2019
annual meeting of shareholders and is herein incorporated by reference.
PART IV
Item 15. Exhibits and Financial Statement Schedules
|
(a)
|
1. Our audited consolidated financial statements follow.
|
66
REPORT OF INDEPENDENT REGISTERED PUBLIC ACCOUNTING FIRM
To the Shareholders and the Board of Directors First Interstate BancSystem, Inc.
Opinion on the Financial Statements
We have audited the accompanying consolidated balance sheets of First Interstate BancSystem, Inc. and subsidiaries (the Company) as of December 31, 2018 and 2017, the related consolidated statements of income, comprehensive income, stockholders’ equity and cash flows for each of the three years in the period ended December 31, 2018, and the related notes to the consolidated financial statements (collectively, the financial statements). In our opinion, the financial statements present fairly, in all material respects, the financial position of the Company as of December 31, 2018 and 2017, and the results of its operations and its cash flows for each of the three years in the period ended December 31, 2018, in conformity with accounting principles generally accepted in the United States of America.
We have also audited, in accordance with the standards of the Public Company Accounting Oversight Board (United States) (PCAOB), the Company’s internal control over financial reporting as of December 31, 2018, based on criteria established in
Internal Control - Integrated Framework
issued by the Committee of Sponsoring Organizations of the Treadway Commission in 2013, and our report dated
February 27, 2019
expressed an unqualified opinion on the effectiveness of the Company’s internal control over financial reporting.
Basis for Opinion
These financial statements are the responsibility of the Company’s management. Our responsibility is to express an opinion on the Company’s financial statements based on our audits. We are a public accounting firm registered with the PCAOB and are required to be independent with respect to the Company in accordance with U.S. federal securities laws and the applicable rules and regulations of the Securities and Exchange Commission and the PCAOB.
We conducted our audits in accordance with the standards of the PCAOB. Those standards require that we plan and perform the audits to obtain reasonable assurance about whether the financial statements are free of material misstatement, whether due to error or fraud. Our audits included performing procedures to assess the risks of material misstatement of the financial statements, whether due to error or fraud, and performing procedures that respond to those risks. Such procedures included examining, on a test basis, evidence regarding the amounts and disclosures in the financial statements. Our audits also included evaluating the accounting principles used and significant estimates made by management, as well as evaluating the overall presentation of the financial statements. We believe that our audits provide a reasonable basis for our opinion.
/s/ RSM US LLP
We have served as the Company’s auditor since 2004.
Des Moines, Iowa
February 27, 2019
67
|
FIRST INTERSTATE BANCSYSTEM, INC. AND SUBSIDIARIES
CONSOLIDATED BALANCE SHEETS
(In millions, except share data)
|
|||||||
|
December 31,
|
2018
|
2017
|
|||||
|
Assets
|
|
|
|||||
|
Cash and due from banks
|
$
|
244.1
|
|
$
|
196.5
|
|
|
|
Interest bearing deposits in banks
|
577.8
|
|
562.3
|
|
|||
|
Federal funds sold
|
0.1
|
|
0.1
|
|
|||
|
Total cash and cash equivalents
|
822.0
|
|
758.9
|
|
|||
|
Investment securities:
|
|
|
|||||
|
Available-for-sale
|
2,270.7
|
|
2,208.7
|
|
|||
|
Held-to-maturity (estimated fair values of $400.7 and $483.3 at December 31, 2018 and 2017, respectively)
|
406.8
|
|
484.5
|
|
|||
|
Total investment securities
|
2,677.5
|
|
2,693.2
|
|
|||
|
Loans held for investment
|
8,470.4
|
|
7,567.7
|
|
|||
|
Mortgage loans held for sale
|
33.3
|
|
46.6
|
|
|||
|
Total loans
|
8,503.7
|
|
7,614.3
|
|
|||
|
Less allowance for loan losses
|
73.0
|
|
72.1
|
|
|||
|
Net loans
|
8,430.7
|
|
7,542.2
|
|
|||
|
Goodwill
|
546.7
|
|
444.7
|
|
|||
|
Company-owned life insurance
|
275.1
|
|
260.6
|
|
|||
|
Premises and equipment, net of accumulated depreciation
|
245.2
|
|
241.9
|
|
|||
|
Core deposit intangibles, net of accumulated amortization
|
56.9
|
|
49.1
|
|
|||
|
Accrued interest receivable
|
44.9
|
|
38.0
|
|
|||
|
Mortgage servicing rights, net of accumulated amortization and impairment reserve
|
27.7
|
|
24.8
|
|
|||
|
Other real estate owned (“OREO”)
|
14.4
|
|
10.1
|
|
|||
|
Deferred tax asset, net
|
—
|
|
4.0
|
|
|||
|
Other assets
|
159.1
|
|
145.8
|
|
|||
|
Total assets
|
$
|
13,300.2
|
|
$
|
12,213.3
|
|
|
|
Liabilities and Stockholders’ Equity
|
|
|
|||||
|
Deposits:
|
|
|
|||||
|
Non-interest bearing
|
$
|
3,158.3
|
|
$
|
2,900.0
|
|
|
|
Interest bearing
|
7,522.4
|
|
7,034.9
|
|
|||
|
Total deposits
|
10,680.7
|
|
9,934.9
|
|
|||
|
Securities sold under repurchase agreements
|
712.4
|
|
643.0
|
|
|||
|
Accounts payable and accrued expenses
|
94.1
|
|
86.6
|
|
|||
|
Accrued interest payable
|
7.8
|
|
5.6
|
|
|||
|
Deferred tax liability, net
|
8.6
|
|
—
|
|
|||
|
Long-term debt
|
15.8
|
|
13.1
|
|
|||
|
Other borrowed funds
|
—
|
|
20.0
|
|
|||
|
Subordinated debentures held by subsidiary trusts
|
86.9
|
|
82.5
|
|
|||
|
Total liabilities
|
11,606.3
|
|
10,785.7
|
|
|||
|
Stockholders’ equity:
|
|
|
|||||
|
Nonvoting noncumulative preferred stock without par value; authorized 100,000 shares; no shares issued or outstanding as of December 31, 2018 and 2017
|
—
|
|
—
|
|
|||
|
Common stock
|
866.7
|
|
687.0
|
|
|||
|
Retained earnings
|
851.8
|
|
752.6
|
|
|||
|
Accumulated other comprehensive income (loss), net
|
(24.6
|
)
|
(12.0
|
)
|
|||
|
Total stockholders’ equity
|
1,693.9
|
|
1,427.6
|
|
|||
|
Total liabilities and stockholders’ equity
|
$
|
13,300.2
|
|
$
|
12,213.3
|
|
|
See accompanying notes to consolidated financial statements.
68
|
FIRST INTERSTATE BANCSYSTEM, INC. AND SUBSIDIARIES
CONSOLIDATED STATEMENTS OF INCOME
(In millions, except per share data)
|
|||||||||||
|
Year Ended December 31,
|
2018
|
2017
|
2016
|
||||||||
|
Interest income:
|
|
|
|
||||||||
|
Interest and fees on loans
|
$
|
404.3
|
|
$
|
324.7
|
|
$
|
259.2
|
|
||
|
Interest and dividends on investment securities:
|
|||||||||||
|
Taxable
|
55.4
|
|
42.8
|
|
32.2
|
|
|||||
|
Exempt from federal taxes
|
2.4
|
|
3.2
|
|
3.4
|
|
|||||
|
Interest on deposits in banks
|
11.3
|
|
7.1
|
|
2.6
|
|
|||||
|
Total interest income
|
473.4
|
|
377.8
|
|
297.4
|
|
|||||
|
Interest expense:
|
|
|
|
||||||||
|
Interest on deposits
|
32.6
|
|
21.4
|
|
12.7
|
|
|||||
|
Interest on securities sold under repurchase agreements
|
2.7
|
|
1.3
|
|
0.4
|
|
|||||
|
Interest on other borrowed funds
|
0.2
|
|
0.5
|
|
—
|
|
|||||
|
Interest on long-term debt
|
1.3
|
|
1.7
|
|
1.8
|
|
|||||
|
Interest on subordinated debentures held by subsidiary trusts
|
4.1
|
|
3.1
|
|
2.7
|
|
|||||
|
Total interest expense
|
40.9
|
|
28.0
|
|
17.6
|
|
|||||
|
Net interest income
|
432.5
|
|
349.8
|
|
279.8
|
|
|||||
|
Provision for loan losses
|
8.6
|
|
11.0
|
|
10.0
|
|
|||||
|
Net interest income after provision for loan losses
|
423.9
|
|
338.8
|
|
269.8
|
|
|||||
|
Non-interest income:
|
|
|
|
||||||||
|
Payment services revenues
|
43.3
|
|
43.3
|
|
34.4
|
|
|||||
|
Mortgage banking revenues
|
24.9
|
|
28.9
|
|
37.2
|
|
|||||
|
Wealth management revenues
|
23.2
|
|
21.1
|
|
20.5
|
|
|||||
|
Service charges on deposit accounts
|
21.8
|
|
21.3
|
|
18.4
|
|
|||||
|
Other service charges, commissions and fees
|
15.1
|
|
13.3
|
|
11.5
|
|
|||||
|
Loss on termination of interest rate swap
|
—
|
|
(1.1
|
)
|
—
|
|
|||||
|
Investment securities (losses) gains, net
|
(0.1
|
)
|
0.7
|
|
0.3
|
|
|||||
|
Other income
|
15.1
|
|
14.3
|
|
10.0
|
|
|||||
|
Non-recurring litigation recovery
|
—
|
|
—
|
|
4.2
|
|
|||||
|
Total non-interest income
|
143.3
|
|
141.8
|
|
136.5
|
|
|||||
|
Non-interest expense:
|
|
|
|
||||||||
|
Salaries and wages
|
146.4
|
|
122.7
|
|
108.7
|
|
|||||
|
Employee benefits
|
47.9
|
|
37.6
|
|
35.2
|
|
|||||
|
Outsourced technology services
|
28.7
|
|
25.1
|
|
20.5
|
|
|||||
|
Occupancy, net
|
25.4
|
|
22.4
|
|
17.7
|
|
|||||
|
Furniture and equipment
|
12.7
|
|
11.5
|
|
9.6
|
|
|||||
|
Professional fees
|
6.9
|
|
6.8
|
|
5.0
|
|
|||||
|
FDIC insurance premiums
|
5.6
|
|
4.7
|
|
4.5
|
|
|||||
|
Mortgage servicing rights amortization
|
3.1
|
|
3.0
|
|
3.0
|
|
|||||
|
Mortgage servicing rights impairment recovery
|
—
|
|
(0.1
|
)
|
—
|
|
|||||
|
OREO expense, net of income
|
0.3
|
|
0.4
|
|
—
|
|
|||||
|
Core deposit intangibles amortization
|
7.9
|
|
5.5
|
|
3.4
|
|
|||||
|
Other expenses
|
63.6
|
|
57.1
|
|
50.6
|
|
|||||
|
Acquisition related expenses
|
12.4
|
|
27.2
|
|
2.8
|
|
|||||
|
Total non-interest expense
|
360.9
|
|
323.9
|
|
261.0
|
|
|||||
|
Income before income tax expense
|
206.3
|
|
156.7
|
|
145.3
|
|
|||||
|
Income tax expense
|
46.1
|
|
50.2
|
|
49.6
|
|
|||||
|
Net income
|
$
|
160.2
|
|
$
|
106.5
|
|
$
|
95.7
|
|
||
|
Basic earnings per common share
|
$
|
2.77
|
|
$
|
2.07
|
|
$
|
2.15
|
|
||
|
Diluted earnings per common share
|
2.75
|
|
2.05
|
|
2.13
|
|
|||||
See accompanying notes to consolidated financial statements.
69
|
FIRST INTERSTATE BANCSYSTEM, INC. AND SUBSIDIARIES
CONSOLIDATED STATEMENTS OF COMPREHENSIVE INCOME
(In millions)
|
|||||||||||
|
Year ended December 31,
|
2018
|
2017
|
2016
|
||||||||
|
Net income
|
$
|
160.2
|
|
$
|
106.5
|
|
$
|
95.7
|
|
||
|
Other comprehensive income (loss) before tax:
|
|||||||||||
|
Investment securities available-for-sale:
|
|||||||||||
|
Change in net unrealized gains (losses) during the period
|
(13.9
|
)
|
(6.5
|
)
|
(19.4
|
)
|
|||||
|
Reclassification adjustment for net losses (gains) included in income
|
0.1
|
|
(0.7
|
)
|
(0.3
|
)
|
|||||
|
Change in unamortized loss on available-for-sale investment securities transferred into held-to-maturity
|
1.6
|
|
1.9
|
|
1.9
|
|
|||||
|
Change in net unrealized gain (loss) on derivatives
|
—
|
|
(1.1
|
)
|
(0.2
|
)
|
|||||
|
Reclassification adjustment for derivative net losses included in income
|
—
|
|
1.1
|
|
—
|
|
|||||
|
Defined benefit post-retirement benefit plans:
|
|||||||||||
|
Change in net actuarial loss
|
(0.6
|
)
|
(1.3
|
)
|
3.9
|
|
|||||
|
Other comprehensive income (loss), before tax
|
(12.8
|
)
|
(6.6
|
)
|
(14.1
|
)
|
|||||
|
Deferred tax benefit (expense) related to other comprehensive income (loss)
|
3.3
|
|
2.8
|
|
5.5
|
|
|||||
|
Other comprehensive income (loss), net of tax
|
(9.5
|
)
|
(3.8
|
)
|
(8.6
|
)
|
|||||
|
Comprehensive income
|
$
|
150.7
|
|
$
|
102.7
|
|
$
|
87.1
|
|
||
See accompanying notes to consolidated financial statements.
70
|
FIRST INTERSTATE BANCSYSTEM, INC. AND SUBSIDIARIES
CONSOLIDATED STATEMENTS OF STOCKHOLDERS’ EQUITY
(In millions, except share and per share data)
|
|||||||||||||||
|
Common
Stock
|
Retained
Earnings
|
Accumulated
Other
Comprehensive
Income (Loss)
|
Total
Stockholders’
Equity
|
||||||||||||
|
Balance at December 31, 2015
|
$
|
311.7
|
|
$
|
638.4
|
|
$
|
0.4
|
|
$
|
950.5
|
|
|||
|
Net income
|
—
|
|
95.7
|
|
—
|
|
95.7
|
|
|||||||
|
Other comprehensive loss, net of tax expense
|
—
|
|
—
|
|
(8.6
|
)
|
(8.6
|
)
|
|||||||
|
Common stock transactions:
|
|||||||||||||||
|
1,015,389 common shares purchased and retired
|
(26.9
|
)
|
—
|
|
—
|
|
(26.9
|
)
|
|||||||
|
16,347 common shares issued
|
—
|
|
—
|
|
—
|
|
—
|
|
|||||||
|
190,239 non-vested common shares issued
|
—
|
|
—
|
|
—
|
|
—
|
|
|||||||
|
29,844 non-vested common shares forfeited or canceled
|
—
|
|
—
|
|
—
|
|
—
|
|
|||||||
|
336,598 common shares purchased and retired 104,643 shares tendered in payment of option price and income tax withholding amounts
|
4.7
|
|
—
|
|
—
|
|
4.7
|
|
|||||||
|
Tax benefit of stock-based compensation
|
2.2
|
|
—
|
|
—
|
|
2.2
|
|
|||||||
|
Stock-based compensation expense
|
4.4
|
|
—
|
|
—
|
|
4.4
|
|
|||||||
|
Common cash dividends declared ($0.88 per share)
|
—
|
|
(39.4
|
)
|
—
|
|
(39.4
|
)
|
|||||||
|
Balance at December 31, 2016
|
$
|
296.1
|
|
$
|
694.7
|
|
$
|
(8.2
|
)
|
|
$
|
982.6
|
|
||
|
Net income
|
—
|
|
106.5
|
|
—
|
|
106.5
|
|
|||||||
|
Other comprehensive loss, net of tax expense
|
—
|
|
—
|
|
(3.8
|
)
|
(3.8
|
)
|
|||||||
|
Common stock transactions:
|
|
|
|||||||||||||
|
33,063 common shares purchased and retired
|
(1.3
|
)
|
—
|
|
—
|
|
(1.3
|
)
|
|||||||
|
11,267,676 common shares issued
|
386.0
|
|
—
|
|
—
|
|
386.0
|
|
|||||||
|
140,246 non-vested common shares issued
|
—
|
|
—
|
|
—
|
|
—
|
|
|||||||
|
53,571 non-vested common shares forfeited or canceled
|
—
|
|
—
|
|
—
|
|
—
|
|
|||||||
|
218,095 common shares purchased and retired 67,792 shares tendered in payment of option price and income tax withholding amounts
|
2.4
|
|
—
|
|
—
|
|
2.4
|
|
|||||||
|
Stock-based compensation expense
|
3.8
|
|
—
|
|
—
|
|
3.8
|
|
|||||||
|
Common cash dividends declared ($0.96 per share)
|
—
|
|
(48.6
|
)
|
—
|
|
(48.6
|
)
|
|||||||
|
Balance at December 31, 2017
|
$
|
687.0
|
|
$
|
752.6
|
|
$
|
(12.0
|
)
|
$
|
1,427.6
|
|
|||
|
Net income
|
—
|
|
160.2
|
|
—
|
|
160.2
|
|
|||||||
|
Reclassification of the income tax effects of the Tax Cut and Jobs Act from AOCI
|
—
|
|
3.1
|
|
(3.1
|
)
|
—
|
|
|||||||
|
Other comprehensive income, net of tax expense
|
—
|
|
—
|
|
(9.5
|
)
|
(9.5
|
)
|
|||||||
|
Common stock transactions:
|
|||||||||||||||
|
24,271 common shares purchased and retired
|
(1.0
|
)
|
—
|
|
—
|
|
(1.0
|
)
|
|||||||
|
3,848,929 common shares issued
|
173.3
|
|
—
|
|
—
|
|
173.3
|
|
|||||||
|
214,892 non-vested common shares issued
|
—
|
|
—
|
|
—
|
|
—
|
|
|||||||
|
43,079 non-vested common shares forfeited or canceled
|
—
|
|
—
|
|
—
|
|
—
|
|
|||||||
|
161,217 common shares purchased and retired 38,450 shares tendered in payment of option price and income tax withholding amounts
|
1.8
|
|
—
|
|
—
|
|
1.8
|
|
|||||||
|
Stock-based compensation expense
|
5.6
|
|
—
|
|
—
|
|
5.6
|
|
|||||||
|
Common cash dividends declared ($1.12 per share)
|
—
|
|
(64.1
|
)
|
—
|
|
(64.1
|
)
|
|||||||
|
Balance at December 31, 2018
|
$
|
866.7
|
|
$
|
851.8
|
|
$
|
(24.6
|
)
|
$
|
1,693.9
|
|
|||
See accompanying notes to consolidated financial statements.
71
|
FIRST INTERSTATE BANCSYSTEM, INC. AND SUBSIDIARIES
CONSOLIDATED STATEMENTS OF CASH FLOWS
(In millions)
|
|||||||||||
|
Year Ended December 31,
|
2018
|
2017
|
2016
|
||||||||
|
Cash flows from operating activities:
|
|
|
|
||||||||
|
Net income
|
$
|
160.2
|
|
$
|
106.5
|
|
$
|
95.7
|
|
||
|
Adjustments to reconcile net income from operations to net cash provided by operating activities:
|
|
||||||||||
|
Provision for loan losses
|
8.6
|
|
11.0
|
|
10.0
|
|
|||||
|
Net (gain) loss on disposal of property and equipment
|
—
|
|
0.2
|
|
0.6
|
|
|||||
|
Depreciation and amortization
|
27.6
|
|
18.4
|
|
19.5
|
|
|||||
|
Net premium amortization on investment securities
|
10.0
|
|
11.6
|
|
12.5
|
|
|||||
|
Net (gain) loss on investment securities transactions
|
0.1
|
|
(0.7
|
)
|
(0.3
|
)
|
|||||
|
Realized and unrealized net gains on mortgage banking activities
|
(23.0
|
)
|
(25.2
|
)
|
(26.8
|
)
|
|||||
|
Net loss (gain) on sale of OREO
|
(0.8
|
)
|
0.1
|
|
(0.9
|
)
|
|||||
|
Write-down of OREO and other assets pending disposal
|
0.1
|
|
0.4
|
|
0.8
|
|
|||||
|
Net (gain) on sale of Health Savings Accounts
|
—
|
|
(3.1
|
)
|
—
|
|
|||||
|
Mortgage servicing rights recovery
|
—
|
|
(0.1
|
)
|
—
|
|
|||||
|
Deferred income tax expense (benefit)
|
15.8
|
|
20.9
|
|
3.4
|
|
|||||
|
Net increase in cash surrender value of company-owned life insurance policies
|
(5.0
|
)
|
(5.4
|
)
|
(4.5
|
)
|
|||||
|
Stock-based compensation expense
|
5.6
|
|
3.9
|
|
4.4
|
|
|||||
|
Tax benefits from stock-based compensation
|
—
|
|
—
|
|
2.1
|
|
|||||
|
Excess tax benefits from stock-based compensation
|
—
|
|
—
|
|
(1.6
|
)
|
|||||
|
Originations of mortgage loans held for sale
|
(768.1
|
)
|
(815.0
|
)
|
(1,042.5
|
)
|
|||||
|
Proceeds from sales of mortgage loans held for sale
|
798.4
|
|
860.1
|
|
1,054.5
|
|
|||||
|
Changes in operating assets and liabilities:
|
|||||||||||
|
(Increase) decrease in interest receivable
|
(3.3
|
)
|
(0.6
|
)
|
(1.1
|
)
|
|||||
|
Decrease (increase) in other assets
|
(8.0
|
)
|
(6.1
|
)
|
(2.2
|
)
|
|||||
|
Increase (decrease) in interest payable
|
2.2
|
|
0.2
|
|
0.4
|
|
|||||
|
Increase (decrease) in accounts payable and accrued expenses
|
(0.2
|
)
|
(22.5
|
)
|
(6.0
|
)
|
|||||
|
Net cash provided by operating activities
|
220.2
|
|
154.6
|
|
|
118.0
|
|
||||
|
Cash flows from investing activities:
|
|
|
|
||||||||
|
Purchases of investment securities:
|
|
|
|
||||||||
|
Held-to-maturity
|
(2.0
|
)
|
(12.8
|
)
|
(18.2
|
)
|
|||||
|
Available-for-sale
|
(541.0
|
)
|
(614.3
|
)
|
(905.9
|
)
|
|||||
|
Proceeds from maturities, pay-downs, calls and sales of investment securities:
|
|||||||||||
|
Held-to-maturity
|
79.3
|
|
97.4
|
|
112.6
|
|
|||||
|
Available-for-sale
|
460.0
|
|
426.2
|
|
814.6
|
|
|||||
|
Extensions of credit to customers, net of repayments
|
(221.7
|
)
|
(99.7
|
)
|
(168.3
|
)
|
|||||
|
Recoveries of loans charged-off
|
12.0
|
|
7.8
|
|
9.2
|
|
|||||
|
Proceeds from sales of OREO
|
9.1
|
|
5.9
|
|
5.3
|
|
|||||
|
Acquisition of intangible assets
|
—
|
|
(28.0
|
)
|
—
|
|
|||||
|
Proceeds from the sale of Health Savings Accounts
|
—
|
|
6.1
|
|
—
|
|
|||||
|
Proceeds from sale of loan production office
|
—
|
|
—
|
|
0.9
|
|
|||||
|
Acquisition of bank and bank holding company, net of cash and cash equivalents received
|
28.1
|
|
91.8
|
|
18.6
|
|
|||||
|
Capital expenditures, net of proceeds from sales
|
(6.1
|
)
|
(11.0
|
)
|
(11.9
|
)
|
|||||
|
Net cash provided by (used in) investing activities
|
$
|
(182.3
|
)
|
$
|
(130.6
|
)
|
$
|
(143.1
|
)
|
||
72
|
FIRST INTERSTATE BANCSYSTEM, INC. AND SUBSIDIARIES
CONSOLIDATED STATEMENTS OF CASH FLOWS (CONTINUED)
(In millions)
|
|||||||||||
|
Year Ended December 31,
|
2018
|
2017
|
2016
|
||||||||
|
Cash flows from financing activities:
|
|
|
|
||||||||
|
Net increase (decrease) in deposits
|
$
|
49.5
|
|
$
|
(110.2
|
)
|
$
|
77.6
|
|
||
|
Net increase (decrease) in securities sold under repurchase agreements
|
69.4
|
|
105.4
|
|
8.9
|
|
|||||
|
Net increase (decrease) in other borrowed funds
|
(26.1
|
)
|
0.1
|
|
—
|
|
|||||
|
Repayments of long-term debt
|
(7.1
|
)
|
0.1
|
|
(0.1
|
)
|
|||||
|
Advances on long-term debt
|
2.8
|
|
5.0
|
|
0.2
|
|
|||||
|
Proceeds from issuance of common stock
|
1.8
|
|
2.4
|
|
4.7
|
|
|||||
|
Excess tax benefits from stock-based compensation
|
—
|
|
—
|
|
1.6
|
|
|||||
|
Purchase and retirement of common stock
|
(1.0
|
)
|
(1.3
|
)
|
(26.9
|
)
|
|||||
|
Dividends paid to common stockholders
|
(64.1
|
)
|
(48.6
|
)
|
(39.4
|
)
|
|||||
|
Net cash provided by (used in) financing activities
|
25.2
|
|
(47.1
|
)
|
26.6
|
|
|||||
|
Net increase (decrease) in cash and cash equivalents
|
63.1
|
|
(23.1
|
)
|
1.5
|
|
|||||
|
Cash and cash equivalents at beginning of period
|
758.9
|
|
782.0
|
|
780.5
|
|
|||||
|
Cash and cash equivalents at end of period
|
$
|
822.0
|
|
$
|
758.9
|
|
$
|
782.0
|
|
||
|
Supplemental disclosures of cash flow information:
|
|
|
|
||||||||
|
Cash paid during the period for income taxes
|
$
|
25.3
|
|
$
|
28.8
|
|
$
|
54.4
|
|
||
|
Cash paid during the period for interest expense
|
38.7
|
|
27.8
|
|
17.2
|
|
|||||
|
Supplemental disclosures of noncash investing and financing activities:
|
|||||||||||
|
Transfer from long-term debt to other borrowed funds
|
$
|
—
|
|
$
|
20.0
|
|
$
|
—
|
|
||
|
Transfer of loans to other real estate owned
|
12.1
|
|
5.2
|
|
7.6
|
|
|||||
|
Capitalization of internally originated mortgage servicing rights
|
6.1
|
|
5.6
|
|
5.8
|
|
|||||
|
Supplemental schedule of noncash investing activities from acquisitions:
|
|||||||||||
|
Investment securities available for sale
|
$
|
3.1
|
|
$
|
424.3
|
|
$
|
—
|
|
||
|
Investment securities held to maturity
|
—
|
|
57.3
|
|
—
|
|
|||||
|
Loans held for sale
|
—
|
|
10.3
|
|
—
|
|
|||||
|
Loans
|
713.1
|
|
2,079.3
|
|
—
|
|
|||||
|
Premises and equipment
|
14.0
|
|
47.7
|
|
—
|
|
|||||
|
Goodwill
|
101.1
|
|
231.9
|
|
—
|
|
|||||
|
Core deposit intangible
|
15.7
|
|
48.0
|
|
—
|
|
|||||
|
Mortgage servicing rights
|
—
|
|
3.5
|
|
—
|
|
|||||
|
Company-owned life insurance
|
9.5
|
|
57.0
|
|
—
|
|
|||||
|
Deferred tax assets
|
—
|
|
28.6
|
|
—
|
|
|||||
|
Interest receivable
|
3.6
|
|
7.6
|
|
—
|
|
|||||
|
Other real estate owned
|
0.6
|
|
1.2
|
|
—
|
|
|||||
|
Other assets
|
6.2
|
|
31.6
|
|
—
|
|
|||||
|
Total noncash assets acquired
|
$
|
866.9
|
|
$
|
3,028.3
|
|
$
|
—
|
|
||
|
Liabilities assumed:
|
|||||||||||
|
Deposits
|
$
|
696.3
|
|
$
|
2,669.0
|
|
$
|
—
|
|
||
|
Accounts payable and accrued expenses
|
7.7
|
|
64.2
|
|
—
|
|
|||||
|
Long-term debt
|
7.0
|
|
—
|
|
—
|
|
|||||
|
Other borrowed funds
|
6.1
|
|
—
|
|
—
|
|
|||||
|
Trust preferred securities
|
4.4
|
|
—
|
|
—
|
|
|||||
|
Deferred tax liability
|
0.3
|
|
—
|
|
—
|
|
|||||
|
Total liabilities assumed
|
$
|
721.8
|
|
$
|
2,733.2
|
|
$
|
—
|
|
||
73
FIRST INTERSTATE BANCSYSTEM, INC. AND SUBSIDIARIES
NOTES TO CONSOLIDATED FINANCIAL STATEMENTS
(Dollars in millions, except share and per share data)
|
(1)
|
SUMMARY OF SIGNIFICANT ACCOUNTING POLICIES
|
Business
. First Interstate BancSystem, Inc. (the “Parent Company” and collectively with its subsidiaries, the “Company”) is a financial and bank holding company that, through the branch offices of its bank subsidiary, provides a comprehensive range of banking products and services to individuals, businesses, municipalities and other entities throughout Idaho, Montana, Oregon, South Dakota, Washington, and Wyoming. In addition to its primary emphasis on commercial and consumer banking services, the Company also offers trust, employee benefit, investment and insurance services through its bank subsidiary. The Company is subject to competition from other financial institutions and nonbank financial companies, and is also subject to the regulations of various government agencies and undergoes periodic examinations by those regulatory authorities.
Basis of Presentation
. The Company’s consolidated financial statements include the accounts of the Parent Company and its operating subsidiaries. As of
December 31, 2018
, the Company had
one
significant subsidiary, First Interstate Bank (“FIB”). All significant intercompany balances and transactions have been eliminated in consolidation. Certain reclassifications, none of which were material, have been made in the consolidated financial statements for
2017
and
2016
to conform to the
2018
presentation. These reclassifications did not change previously reported net income or stockholders’ equity.
Equity Method Investments.
The Company has investments in real estate joint ventures that are not consolidated because the Company does not own a majority voting interest, control the operations or receive a majority of the losses or earnings of the joint venture. These joint ventures are accounted for using the equity method of accounting whereby the Company initially records its investment at cost (or fair value at the date of acquisition) and then subsequently adjusts the carrying value for the Company’s proportionate share of distributions and earnings or losses of the joint ventures.
Variable Interest Entities.
The Company’s wholly-owned business trusts, FI Statutory Trust I (“Trust I”), FI Capital Trust II (“Trust II”), FI Statutory Trust III (“Trust III”), FI Capital Trust IV (“Trust IV”), FI Statutory Trust V (“Trust V”), FI Statutory Trust VI (“Trust VI”), and Northwest Bancorporation Capital Trust I (“Trust VII”) are variable interest entities for which the Company is not a primary beneficiary. Accordingly, the accounts of Trust I, Trust II, Trust III, Trust IV, Trust V, Trust VI, and Trust VII are not included in the accompanying consolidated financial statements, and are instead accounted for using the equity method of accounting.
The Company has equity investments in variable interest Certified Development Entities (“CDEs”) which have received allocations under the New Markets Tax Credits Program. The underlying activities of the CDEs are community development projects designed primarily to promote community welfare, such as economic rehabilitation and development of low-income areas by providing housing, services, or jobs for residents. The maximum exposure to loss in the CDEs is the amount of equity invested and credit extended by the Company. The Company has credit protection in the form of indemnification agreements, guarantees, and collateral arrangements. As the primary beneficiary of these variable interest entities, the Company’s consolidated financial statements include the assets, liabilities, and results of operations of the CDEs. The primary activities of the CDEs are recognized in interest and fees on loans, other non-interest income and long-term debt interest expense on the Company’s statements of operations. Related cash flows are recognized in loans originated, principal collected on loans and advances or repayments of long-term debt.
Assets Held in Fiduciary or Agency Capacity.
The Company holds certain trust assets in a fiduciary or agency capacity. The Company also purchases and sells federal funds as an agent. These and other assets held in an agency or fiduciary capacity are not assets of the Company and, accordingly, are not included in the accompanying consolidated financial statements.
74
FIRST INTERSTATE BANCSYSTEM, INC. AND SUBSIDIARIES
NOTES TO CONSOLIDATED FINANCIAL STATEMENTS
(Dollars in millions, except share and per share data)
Use of Estimates.
The preparation of consolidated financial statements in conformity with accounting principles generally accepted in the United States of America requires management to make estimates and assumptions that affect the reported amounts of assets and liabilities and the disclosure of contingent assets and liabilities at the date of the financial statements and income and expenses during the reporting period. Actual results could differ from those estimates. Material estimates that are particularly susceptible to change relate to the determination of the allowance for loan losses, the valuation of goodwill, fair valuations of investment securities and other financial instruments and the status of loss contingencies.
Cash and Cash Equivalents
. For purposes of reporting cash flows, cash and cash equivalents include cash on hand, amounts due from banks, federal funds sold for one day periods and interest bearing deposits in banks with original maturities of less than three months. As of
December 31, 2018
and
2017
, the Company had cash of
$574.4 million
and
$552.0 million
, respectively, on deposit with the Federal Reserve Bank. In addition, the Company maintained compensating balances with the Federal Reserve Bank of approximately
$28.1 million
and
$16.1 million
as of
December 31, 2018
and
2017
, respectively, to reduce service charges for check clearing services.
Investment Securities
. Investments in debt securities that the Company has the positive intent and ability to hold to maturity are classified as held-to-maturity and carried at amortized cost. Investments in debt securities that may be sold in response to or in anticipation of changes in interest rates and resulting prepayment risk, or other factors, and marketable equity securities are classified as available-for-sale and carried at fair value. The unrealized gains and losses on these securities are reported, net of applicable income taxes, as a separate component of stockholders’ equity and comprehensive income. Management determines the appropriate classification of securities at the time of purchase and at each reporting date management reassesses the appropriateness of the classification.
The amortized cost of debt securities classified as held-to-maturity or available-for-sale is adjusted for accretion of discounts to maturity and amortization of premiums over the estimated average life of the security, or in the case of callable securities, through the first call date, using the effective yield method. Such amortization and accretion is included in interest income. Realized gains and losses are included in investment securities gains. Declines in the fair value of securities below their cost that are judged to be other-than-temporary are included in other expenses if the decline is related to credit losses. Other-than-temporary impairment losses related to other factors are recognized in other comprehensive income, net of income taxes. In estimating other-than-temporary impairment losses, the Company considers, among other things, the length of time and the extent to which the fair value has been less than cost, the financial condition and near-term prospects of the issuer and the intent and ability of the Company to retain its investment in the issuer for a period of time sufficient to allow for any anticipated recovery in fair value. The cost of securities sold is based on the specific identification method.
Loans
. Loans are reported at the principal amount outstanding. Interest income on loans is calculated using the simple interest method on the daily balance of the principal amount outstanding. Loan origination fees and certain direct origination costs are deferred, and the net amount is amortized as an adjustment of the related loan’s yield using a level yield method over the expected lives of the related loans.
The accrual of interest on loans is discontinued when, in management’s opinion, the borrower may be unable to meet payment obligations as they become due or when a loan becomes contractually past due ninety days or more with respect to interest or principal, unless such past due loan is well secured and in the process of collection. When interest accrual is discontinued, all unpaid accrued interest is reversed against current period interest income. Interest income is subsequently recognized only to the extent cash payments are received in excess of principal due. Loans are returned to accrual status when all principal and interest amounts contractually due are brought current and when, in the opinion of management, the loans are estimated to be fully collectible as to both principal and interest.
A loan is considered impaired when, based upon current information and events, it is probable that the Company will be unable to collect, on a timely basis, all amounts due according to the contractual terms of the loan’s original agreement. The amount of the impairment is measured using cash flows discounted at the loan’s effective interest rate, except when it is determined that the primary source of repayment for the loan is the operation or liquidation of the underlying collateral. In such cases, the current fair value of the collateral, reduced by anticipated selling costs, is used to measure impairment.
75
FIRST INTERSTATE BANCSYSTEM, INC. AND SUBSIDIARIES
NOTES TO CONSOLIDATED FINANCIAL STATEMENTS
(Dollars in millions, except share and per share data)
The Company considers impaired loans to include all loans, except consumer loans, that are risk rated as doubtful or on which interest accrual has been discontinued or that have been renegotiated in a troubled debt restructuring. Interest payments received on impaired loans are applied based on whether they are on accrual or non-accrual status. Interest income recognized by the Company on impaired loans primarily relates to loans modified in troubled debt restructurings that remain on accrual status. Interest payments received on non-accrual impaired loans are applied to principal. Interest income is subsequently recognized only to the extent cash payments are received in excess of principal due.
Loans acquired in a business combination are recorded and initially measured at their estimated fair value as of the acquisition date, with no carryover of the related allowance for credit losses. Credit risks are included in the determination of fair value. For loans with no significant evidence of credit deterioration since origination, the difference between the fair value and the unpaid principal balance of the loan at the acquisition date is amortized into interest income using the effective interest method over the remaining period to contractual maturity. The accounting for loans acquired with evidence of a deterioration of credit quality is described below.
Loans acquired through the completion of a transfer, including loans acquired in business combinations, that have evidence of deterioration of credit quality since origination and for which it is probable, at acquisition, that the Company will be unable to collect all contractually required payments receivable are initially recorded at fair value (as determined by the present value of expected future cash flows) with no valuation allowance. The difference between the undiscounted cash flows expected at acquisition and the recorded fair value of the loan, or the “accretable yield,” is recognized as interest income on a level-yield method over the life of the loan. Contractually required payments for interest and principal that exceed the undiscounted cash flows expected at acquisition, or the “nonaccretable difference,” are not recognized as a yield adjustment, a loss accrual or a valuation allowance. Increases in expected cash flows subsequent to the initial measurement are recognized prospectively through adjustment of the yield on the loan over its remaining life. Decreases in expected cash flows are recognized as impairment. Valuation allowances on these impaired loans reflect only losses incurred after the acquisition.
A loan is considered a troubled debt restructuring when a borrower is experiencing financial difficulties that leads to a restructuring of the loan and the Company grants concessions to the borrower in the restructuring that it would not otherwise consider. These concessions may include rate reductions, principal forgiveness, extension of maturity date and other actions to minimize potential losses. Certain troubled debt restructurings are on non-accrual status at the time of restructuring and are returned to accrual status only after considering the borrower’s sustained repayment performance in accordance with the restructuring agreement for a reasonable period of at least six months and management is reasonably assured of future performance. If the troubled debt restructuring meets these performance criteria and the interest rate granted at the modification is equal to or greater than the rate that the Company was willing to accept at the time of the restructuring for a new loan with comparable risk, then the loan will no longer be disclosed as a troubled debt restructuring although they continue to be individually evaluated for impairment and disclosed as impaired loans.
Loans held for sale include residential mortgage loans originated for immediate sale. The Company has elected to account for loans held for sale using the fair value option. Under the fair value option, net loan origination fees are recognized in non-interest income at the time of origination. Subsequent changes in the estimated fair values of loans held for sale are recorded as unrealized gains and losses in non-interest income. Estimated fair values of loans held for sale are determined based upon current secondary market prices for loans with similar coupons, maturities and credit quality, or in the case of committed loans, on current delivery prices. Gains and losses on loans held for sale are recognized based on the difference between the net sales proceeds, including the estimated value associated with servicing assets or liabilities, and the net carrying value of the loans sold. Adjustments to reflect unrealized gains and losses resulting from changes in fair value of loans held for sale, as well as realized gains and losses on the sale of loans, are included in non-interest income - mortgage banking revenues on the accompanying consolidated statements of income. Loans held for sale were
$33.3 million
and
$46.6 million
as of
December 31, 2018
and
2017
, respectively.
As of
December 31, 2018
, the Company had
$0.4 million
recorded investments in consumer mortgage loans secured by residential real estate for which formal foreclosure proceedings were in process.
76
FIRST INTERSTATE BANCSYSTEM, INC. AND SUBSIDIARIES
NOTES TO CONSOLIDATED FINANCIAL STATEMENTS
(Dollars in millions, except share and per share data)
Allowance for Loan Losses
. The allowance for loan losses is established through a provision for loan losses which is charged to expense. Loans, or portions thereof, are charged against the allowance for loan losses when management believes that the collectability of the principal is unlikely or, with respect to consumer installment and credit card loans, according to established delinquency schedules. The allowance balance is an amount that management believes will be adequate to absorb known and inherent losses in the loan portfolio based upon quarterly analysis of the current risk characteristics of the loan portfolio, an assessment of individual problem loans and actual loss experience, industry concentrations and current economic factors and the estimated impact of current economic and environmental conditions on historical loss rates.
Loans acquired in business combinations are recorded at their estimated fair values on the date of acquisition. Accordingly, no allowance for loan losses related to these loans is recorded at the date of transfer. An allowance for loan losses is recorded for credit deterioration occurring subsequent to the transfer date.
Goodwill
. The excess purchase price over the fair value of net assets from acquisitions, or goodwill, is evaluated for impairment at least annually and on an interim basis if an event or circumstance indicates that it is likely impairment has occurred. Goodwill impairment is determined by comparing the fair value of a reporting unit to its carrying amount. In any given year the Company may elect to perform a qualitative assessment to determine whether it is more likely than not that the fair value of a reporting unit is in excess of its carrying value. If it is not more likely than not that the fair value of the reporting unit is in excess of the carrying value, or if the Company elects to bypass the qualitative assessment, a quantitative impairment test is performed. In performing a quantitative test for impairment, the fair value of net assets is estimated based on analyses of the Company’s market value, discounted cash flows and peer values. The determination of goodwill impairment is sensitive to market-based economics and other key assumptions used in determining or allocating fair value. Variability in the market and changes in assumptions or subjective measurements used to allocate fair value are reasonably possible and may have a material impact on our consolidated financial statements or results of operations.
Core Deposit Intangibles.
Core deposit intangibles represent the intangible value of depositor relationships resulting from deposit liabilities assumed, as a result of acquisitions, and are amortized using an accelerated method based on the estimated weighted average useful lives of the related deposits.
Mortgage Servicing Rights
. The Company recognizes the rights to service mortgage loans for others, whether acquired or internally originated. Mortgage servicing rights are initially recorded at fair value based on comparable market data and are amortized in proportion to and over the period of estimated net servicing income. Mortgage servicing rights are evaluated quarterly for impairment by discounting the expected future cash flows, taking into consideration the estimated level of prepayments based on current industry expectations and the predominant risk characteristics of the underlying loans including loan type, note rate and loan term. Impairment adjustments, if any, are recorded through a valuation allowance.
Premises and Equipment
. Buildings, furniture and equipment are stated at cost less accumulated depreciation. Depreciation expense is computed using straight-line methods over estimated useful lives of
5
to
45
years for buildings and improvements and
4
to
15
years for furniture and equipment. Leasehold improvements and assets acquired under capital lease are amortized over the shorter of their estimated useful lives or the terms of the related leases. Land is recorded at cost. Costs incurred for maintenance and repairs are expensed as incurred.
Company-Owned Life Insurance
. Key executive and group life insurance policies are recorded at their cash surrender value. Separate account group life insurance policies are subject to a stable value contract that offsets the impact of interest rate fluctuations on the market value of the policies and are recorded at the stabilized investment value. Increases in the cash surrender or stabilized investment value of insurance policies, as well as insurance proceeds received, are recorded as other non-interest income, and are not subject to income taxes.
77
FIRST INTERSTATE BANCSYSTEM, INC. AND SUBSIDIARIES
NOTES TO CONSOLIDATED FINANCIAL STATEMENTS
(Dollars in millions, except share and per share data)
Deferred Compensation Plan.
The Company has a deferred compensation plan for the benefit of certain highly compensated officers and directors of the Company. The plan allows for discretionary employer contributions in excess of tax limits applicable to the Company’s 401(k) and profit sharing plans and the deferral of salary, short-term incentives or director fees subject to certain limitations. Deferred compensation plan assets and liabilities are included in the Company’s consolidated balance sheets at fair value.
As of
December 31, 2018
and
2017
, deferred compensation plan assets were
$12.1 million
and
$12.2 million
, respectively. Corresponding deferred compensation plan liabilities were
$12.1 million
and
$12.2 million
as of
December 31, 2018
and
2017
, respectively.
Impairment of Long-Lived Assets.
Long-lived assets, including premises and equipment and certain identifiable intangibles, are reviewed for impairment whenever events or changes in circumstances indicate the carrying amount of an asset may not be recoverable. The amount of the impairment loss, if any, is based on the asset’s fair value.
No
impairment losses were recognized in
2018
and
2017
, respectively. Impairment losses of
$0.2 million
were recognized in other non-interest expense in
2016
.
Other Real Estate Owned
. Real estate acquired in satisfaction of loans is initially carried at current fair value less estimated selling costs. Any excess of loan carrying value over the fair value of the real estate acquired is recorded as a charge to the allowance for loan losses. Subsequent declines in fair value less estimated selling costs are included in OREO expense. Subsequent increases in fair value less estimated selling costs are recorded as a reduction in OREO expense to the extent of recognized losses. Operating expenses, net of related income, and gains or losses on sales are included in OREO expense. Write-downs of
$0.1 million
,
$0.4 million
and
$0.6 million
were recorded in
2018
,
2017
and
2016
, respectively. The carrying value of foreclosed residential real estate properties included in other real estate owned was
$2.0 million
as of
December 31, 2018
, and
$2.7 million
as of
December 31, 2017
.
Restricted Equity Securities.
The Company, as a member of the Federal Reserve Bank and the Federal Home Loan Bank (“FHLB”), is required to maintain investments in each of the organization’s capital stock. As of
December 31, 2018
, restricted equity securities of the Federal Reserve Bank and the FHLB of
$37.5 million
and
$10.7 million
, respectively, were included in other assets at cost. As of
December 31, 2017
, restricted equity securities of the Federal Reserve Bank and the FHLB were
$31.8 million
and
$10.2 million
, respectively. No ready market exists for these restricted equity securities, and they have no quoted market values. Restricted equity securities are periodically reviewed for impairment based on ultimate recovery of par value. The determination of whether a decline affects the ultimate recovery of par value is influenced by the significance of the decline compared to the cost basis of the restricted equity securities, the length of time a decline has persisted, the impact of legislative and regulatory changes on the issuing organizations and the liquidity positions of the issuing organizations. Based on management’s assessment, no impairment losses were recorded on restricted equity securities during
2018
,
2017
or
2016
.
Derivatives and Hedging Activities.
For asset and liability management purposes, the Company enters into interest rate swap contracts to hedge against changes in forecasted cash flows due to interest rate exposures. Interest rate swaps are contracts in which a series of interest payments are exchanged over a prescribed period. The notional amount upon which the interest payments are based is not exchanged. The swap agreements are derivative instruments and convert a portion of the Company’s forecasted variable rate debt to a fixed rate (i.e., cash flow hedge) over the payment term of the interest rate swap. The effective portion of the gain or loss on cash flow hedging instruments is initially reported as a component of other comprehensive income and subsequently reclassified into earnings in the same period during which the transaction affects earnings. The ineffective portion of the gain or loss on derivative instruments, if any, is recognized in earnings. The Company does not enter into interest rate swap agreements for trading or speculative purposes. As of
December 31, 2018
, the Company does not have an existing agreement.
The Company also enters into certain interest rate swap contracts that are not designated as hedging instruments. These derivative contracts relate to transactions in which the Company enters into an interest rate swap with a customer while at the same time entering into an offsetting interest rate swap with a third party financial institution. Because the Company acts as an intermediary for the customer, changes in the fair value of the underlying derivative contracts for the most part offset each other and do not significantly impact the Company’s results of operations.
78
FIRST INTERSTATE BANCSYSTEM, INC. AND SUBSIDIARIES
NOTES TO CONSOLIDATED FINANCIAL STATEMENTS
(Dollars in millions, except share and per share data)
In the normal course of business, the Company enters into interest rate lock commitments to finance residential mortgage loans that are not designated as accounting hedges. These commitments, which contain fixed expiration dates, offer the borrower an interest rate guarantee provided the loan meets underwriting guidelines and closes within the timeframe established by the Company. Interest rate risk arises on these commitments and subsequently closed loans if interest rates change between the time of the interest rate lock and the delivery of the loan to the investor. Loan commitments related to residential mortgage loans intended to be sold are considered derivatives and are marked to market through earnings. In addition to the effects of the change in market interest rate, the fair value measurement of the derivative also contemplates the expected cash flows to be received from the counterparty from the future sale of the loan.
The Company sells residential mortgage loans on either a best efforts or mandatory delivery basis. The Company mitigates the effect of the interest rate risk inherent in providing interest rate lock commitments by entering into forward loan sales contracts. During the interest rate lock commitment period, these forward loan sales contracts are marked to market through earnings and are not designated as accounting hedges. Exclusive of the fair value component associated with the projected cash flows from the loan delivery to the investor, the changes in fair value related to movements in market rates of the interest rate lock commitments and the forward loan sales contracts generally move in opposite directions, and the net impact of changes in these valuations on net income during the loan commitment period is generally inconsequential. When the loan is funded to the borrower, the interest rate lock commitment derivative expires and the Company records a loan held for sale. The forward loan sales contract acts as a hedge against the variability in cash to be received from the loan sale.
The changes in measurement of the estimated fair values of the interest rate lock commitments and forward loan sales contracts are included in mortgage banking revenues in the accompanying consolidated statements of income.
Earnings Per Common Share
. Basic and diluted earnings per common share are calculated using a two-class method. Under the two-class method, basic earnings per common share is calculated by dividing net income available to common shareholders by the weighted average number of common shares outstanding during the period, excluding outstanding participating securities. Participating securities include non-vested performance restricted stock awards granted and all non-vested time restricted stock awards. Diluted earnings per common share is calculated by dividing net income available to common shareholders by the weighted average number of common shares outstanding determined for the basic earnings per share calculation plus the dilutive effect of stock compensation using the treasury stock method.
Income Taxes
. The Parent Company and its subsidiaries have elected to be included in a consolidated federal income tax return. For state income tax purposes, the combined taxable income of the Parent Company and its subsidiaries is apportioned among the states in which operations take place. Federal and state income taxes attributable to the subsidiaries, computed on a separate return basis, are paid to or received from the Parent Company.
The Company accounts for income taxes using the liability method. Under the liability method, deferred tax assets and liabilities are determined based on enacted income tax rates which will be in effect when the differences between the financial statement carrying values and tax bases of existing assets and liabilities are expected to be reported in taxable income.
Positions taken in the Company’s tax returns may be subject to challenge by the taxing authorities upon examination. Uncertain tax positions are initially recognized in the financial statements when it is more likely than not the position will be sustained upon examination by the tax authorities. Such tax positions are both initially and subsequently measured as the largest amount of tax benefit that is greater than 50% likely of being realized upon settlement with the tax authority, assuming full knowledge of the position and all relevant facts. The Company provides for interest and, in some cases, penalties on tax positions that may be challenged by the taxing authorities. Interest expense is recognized beginning in the first period that such interest would begin accruing. Penalties are recognized in the period that the Company claims the position in the tax return. Interest and penalties on income tax uncertainties are classified within income tax expense in the consolidated statements of income. With few exceptions, the Company is no longer subject to U.S. federal and state examinations by tax authorities for years before
2015
. The Company had
no
material penalties as of
December 31, 2018
,
2017
or
2016
.
79
FIRST INTERSTATE BANCSYSTEM, INC. AND SUBSIDIARIES
NOTES TO CONSOLIDATED FINANCIAL STATEMENTS
(Dollars in millions, except share and per share data)
Revenue Recognition.
The Company recognizes revenue as it is earned based on contractual terms, as transactions occur, or as services are provided and collectability is reasonably assured. The principal source of revenue is interest income from loans and investments. The Company also earns non-interest income from various banking and financial services offered to its customers. Certain specific policies related to non-interest income include the following:
Wealth management and trust fee income
Wealth management and trust fee income represents monthly fees due from wealth management customers as consideration for managing the customers’ assets. Wealth management and trust services include custody of assets, investment management, fees for trust services and similar fiduciary activities. Revenue is recognized when our performance obligation is completed. The Company does not earn performance-based incentives. Optional services such as settlement, court, and regulatory fees are also available to existing trust and asset management customers. The Company’s performance obligation for these transactional-based services is generally satisfied, and related revenue recognized, at a point in time (i.e., as incurred).
Service charges on deposit accounts
Service charges on deposit accounts represent general service fees for account maintenance and activity- or transaction-based fees and consist of transaction-based revenue, time-based revenue (service period), item-based revenue or some other individual attribute-based revenue. Revenue is recognized when our performance obligation is completed for account maintenance services or when a transaction has been completed (such as a wire transfer or check orders). Payment for such performance obligations are generally received at a point in time when the performance obligations are satisfied.
Interchange and other fees
Interchange and other fees primarily represent debit and credit card income comprised of interchange fees earned whenever the Company’s debit and credit cards are processed through card payment networks such as MasterCard. ATM fees are primarily generated when a Company cardholder uses a non-Company ATM or a non-Company cardholder uses a Company ATM. Merchant services income primarily represents fees charged to merchants to process their debit and credit card transactions, in addition to account management fees. Swap fee income primarily represents income associated with the execution of dealer bank swap agreements. Other service charges include revenue from processing wire transfers, bill pay service, cashier’s checks, and other services. The Company’s performance obligation for interchange and other service charges are largely satisfied, and related revenue recognized, when completion of the services are rendered at a point in time.
Annuity and insurance commissions
Annuity and insurance commissions primarily represent commissions received on annuity product sales. The Company acts as an intermediary between the Company’s customer and the insurance carrier. The Company’s performance obligation is generally satisfied upon the issuance of the annuity policy, the carrier then remits the commission payment to the Company, and the Company recognizes the revenue at a point in time.
Comprehensive Income.
Comprehensive income includes net income, as well as other changes in stockholders’ equity that result from transactions and economic events other than those with shareholders. In addition to net income, the Company’s comprehensive income includes the after tax effect of changes in unrealized gains and losses on available-for-sale investment securities and derivatives designated as cash flow hedges, changes in the unamortized gain or loss on available-for-sale investment securities transferred to held-to-maturity and changes in net actuarial gains and losses on defined benefit post-retirement benefits plans.
80
FIRST INTERSTATE BANCSYSTEM, INC. AND SUBSIDIARIES
NOTES TO CONSOLIDATED FINANCIAL STATEMENTS
(Dollars in millions, except share and per share data)
Segment Reporting.
An operating segment is defined as a component of a business for which separate financial information is available that is evaluated regularly by the chief operating decision maker in deciding how to allocate resources and evaluate performance. The "Segment Reporting" topic of the FASB ASC requires that public companies report certain information about operating segments. It also requires that public companies report certain information about their products and services, the geographic areas in which they operate, and their major customers. The Company is a holding company for a regional community bank, which offers a wide array of products and services to its customers. The Company has
one
reporting unit and one operating segment, community banking, which encompasses commercial and consumer banking services offered to individuals, businesses, municipalities and other entities.
For additional information concerning community banking, see “Business—Community Banking,” included in Part I, Item 1 of this report.
Advertising Costs.
Advertising costs are expensed as incurred. Advertising expense was
$3.2 million
,
$3.5 million
, and
$2.8 million
in
2018
,
2017
and
2016
, respectively.
Transfers of Financial Assets.
Transfers of financial assets are accounted for as sales when control over the assets has been surrendered. Control over transferred assets is deemed to be surrendered when the assets have been isolated from the Company; the transferee obtains the right, free of conditions that constrain it from taking advantage of that right, to pledge or exchange the transferred assets; and, the Company does not maintain effective control over the transferred assets through an agreement to repurchase them before their maturity.
Stock-Based Compensation
. Compensation cost for all stock-based awards is measured at fair value on the date of grant and is recognized over the requisite service period for awards expected to vest. The impact of forfeitures of stock-based payment awards on compensation expense is recognized as forfeitures occur. Stock-based compensation expense of
$5.6 million
,
$3.8 million
and
$4.4 million
for the years ended
December 31, 2018
,
2017
and
2016
, respectively, is included in benefits expense in the Company’s consolidated statements of income. Related income tax benefits recognized for the years ended
December 31, 2018
,
2017
and
2016
were
$1.1 million
,
$2.6 million
and
$2.2 million
, respectively.
Fair Value Measurements.
In general, fair value measurements are based upon quoted market prices, where available. If quoted market prices are not available, fair value measurements are estimated using relevant market information and other assumptions. Fair value estimates involve uncertainties and require some degree of judgment regarding interest rates, credit risk, prepayments and other factors. The use of different assumptions or estimation techniques may have a significant effect on the fair value amounts reported.
|
(2)
|
ACQUISITIONS
|
Idaho Independent Bank.
On
October 11, 2018
, the Company entered into a definitive agreement to acquire all of the outstanding stock of IIBK, a community bank headquartered in Coeur d' Alene, Idaho with
11
banking offices across Idaho, in an all-stock transaction valued at approximately
$181.3 million
in aggregate, or
$22.73
per share of IIBK stock, based on a per share price of First Interstate Class A common stock of
$45.45
per share as of October 5, 2018. IIBK shareholders will be entitled to receive
0.50
shares of First Interstate Class A common stock for each share of IIBK common stock they own. The transaction has been approved by the boards of directors of both companies and is expected to close and convert data processing systems in the second quarter of 2019, subject to customary conditions, including regulatory and shareholder approvals.
Community 1
st
Bank.
On
October 11, 2018
, the Company also entered into a definitive agreement to acquire all of the outstanding stock of CMYF, a community bank headquartered in Post Falls, Idaho with
three
banking offices in North Idaho, in an all-stock transaction valued at approximately
$21.5 million
in aggregate, or
$17.20
per share of CMYF stock, based on a per share price of First Interstate Class A common stock of
$45.45
per share as of October 5, 2018. CMYF stockholders will be entitled to receive
0.3784
shares of First Interstate Class A common stock for each share of CMYF common stock they own. The transaction has been approved by the boards of directors of both companies and is expected to close and convert data processing systems in the second quarter of 2019, subject to customary conditions, including regulatory and shareholder approvals.
81
FIRST INTERSTATE BANCSYSTEM, INC. AND SUBSIDIARIES
NOTES TO CONSOLIDATED FINANCIAL STATEMENTS
(Dollars in millions, except share and per share data)
Northwest Bancorporation, Inc.
On
April 25, 2018
, the Company entered into a definitive agreement to acquire all of the outstanding stock of Northwest Bancorporation, Inc. (“Northwest”), the parent company of Inland Northwest Bank (“INB”), a Spokane, Washington based community bank with
20
banking offices across Idaho, Oregon and Washington. The acquisition was completed on
August 16, 2018
, and the Company merged INB with its existing bank subsidiary, First Interstate Bank, on
November 9, 2018
.
Consideration for the acquisition was
$176.3 million
, consisting of the issuance of
3.84 million
shares of the Company's Class A common stock valued at
$45.15
per share, the closing price of the Company's Class A common stock as quoted on the NASDAQ stock exchange on the acquisition date. The Company paid approximately
$3.0 million
in cash related to Northwest warrants, which were included in the consideration paid. Holders of each share of Northwest common stock received
0.516
shares of First Interstate Class A common stock for each share of Northwest common stock. Additionally, all Northwest stock purchase warrants outstanding immediately prior to the close of the transaction were canceled in exchange for the right to receive a cash payment as provided in the Agreement. Previously unvested Northwest restricted stock awards outstanding immediately prior to the close of the transaction vested and were considered issued and outstanding at acquisition close.
The assets and liabilities of Northwest were provisionally recorded in the Company’s consolidated financial statements at their estimated fair values as of the acquisition date and will be finalized in the coming months. The excess value of the consideration paid over the fair value of assets acquired and liabilities assumed is recorded as provisional goodwill. The preliminary purchase price allocation resulted in provisional goodwill of
$101.1 million
, which is not deductible for income tax purposes. Goodwill resulting from the acquisition was allocated to the Company’s
one
operating segment, community banking, and consists largely of the synergies and economies of scale expected from combining the operations of Northwest and the Company.
82
FIRST INTERSTATE BANCSYSTEM, INC. AND SUBSIDIARIES
NOTES TO CONSOLIDATED FINANCIAL STATEMENTS
(Dollars in millions, except share and per share data)
The following table summarizes the consideration paid, fair values of the Northwest assets acquired and liabilities assumed, and the resulting goodwill. Due to the recent closing of the transaction, all amounts reported are provisional pending the review of valuations obtained from third parties.
|
As Recorded
|
Fair Value
|
As Recorded
|
||||||||
|
As of August 16, 2018
|
by Northwest
|
Adjustments
|
by the Company
|
|||||||
|
Assets acquired:
|
||||||||||
|
Cash and cash equivalents
|
$
|
31.2
|
|
$
|
—
|
|
$
|
31.2
|
|
|
|
Investment securities
|
3.1
|
|
—
|
|
3.1
|
|
||||
|
Loans held for investment
|
727.9
|
|
(14.8
|
)
|
(1)
|
713.1
|
|
|||
|
Allowance for loan loss
|
(8.0
|
)
|
8.0
|
|
(2)
|
—
|
|
|||
|
Premises and equipment
|
14.5
|
|
(0.5
|
)
|
(3)
|
14.0
|
|
|||
|
Other real estate owned (“OREO”)
|
0.3
|
|
0.3
|
|
0.6
|
|
||||
|
Core deposit intangible assets
|
2.4
|
|
13.3
|
|
(4)
|
15.7
|
|
|||
|
Other assets
|
29.3
|
|
(10.0
|
)
|
(5)
|
19.3
|
|
|||
|
Total assets acquired
|
800.7
|
|
(3.7
|
)
|
797.0
|
|
||||
|
Liabilities assumed:
|
||||||||||
|
Deposits
|
696.1
|
|
0.2
|
|
(6)
|
696.3
|
|
|||
|
Accounts payable and accrued expense
|
8.1
|
|
(0.4
|
)
|
(7)
|
7.7
|
|
|||
|
Long term debt
|
13.0
|
|
0.1
|
|
13.1
|
|
||||
|
Trust preferred securities
|
5.2
|
|
(0.8
|
)
|
(8)
|
4.4
|
|
|||
|
Deferred tax liability, net
|
(1.2
|
)
|
1.5
|
|
(9)
|
0.3
|
|
|||
|
Total liabilities assumed
|
721.2
|
|
0.6
|
|
721.8
|
|
||||
|
Net assets acquired
|
$
|
79.5
|
|
$
|
(4.3
|
)
|
$
|
75.2
|
|
|
|
Consideration paid:
|
||||||||||
|
Cash
|
$
|
3.0
|
|
|||||||
|
Class A common stock
|
173.3
|
|
||||||||
|
Total consideration paid
|
176.3
|
|
||||||||
|
Goodwill
|
$
|
101.1
|
|
|||||||
|
Explanation of fair value adjustments and the removal of previously recorded fair value marks recorded by Northwest. Note adjustments to the marks for deferred tax assets, other assets, and long term debt were made since the prior quarter, none of which were material. The adjustments had no impact on 2018 earnings and a net increase to goodwill of $0.3 million from the third quarter reported balances.
|
|
|
(1)
|
Write down of the book value of loans to their estimated fair values. The fair value of the loans was estimated using cash flow projections based on the remaining maturity and repricing terms, adjusted for estimated future credit losses and prepayments and discounted to present value using a risk-adjusted market rate for similar loans. The fair value of collateral dependent loans acquired with deteriorated credit quality was estimated based on the Company’s analysis of the fair value of each loan’s underlying collateral, discounted using market-derived rates of return with consideration given to the period of time and costs associated with foreclosure and disposition of the collateral.
|
|
(2)
|
Adjustment to remove the Northwest allowance for loan losses at acquisition date, as the credit risk is included in the fair value adjustment for loans receivable described in (1) above.
|
|
(3)
|
Write down of the book value of premises and equipment to their estimated fair values on the date of acquisition based upon broker’s opinion of value.
|
|
(4)
|
Adjustment represents the value of the core deposit base assumed in the acquisition based upon valuation from an independent accounting and advisory firm.
|
|
(5)
|
Adjustment consists of reductions to the fair value of other items, including the removal of Northwest previously recorded goodwill.
|
|
(6)
|
Increase in book value of time deposits to their estimated fair values based upon interest rates of similar time deposits with similar terms on the date of acquisition based upon valuation from an independent accounting and advisory firm.
|
83
FIRST INTERSTATE BANCSYSTEM, INC. AND SUBSIDIARIES
NOTES TO CONSOLIDATED FINANCIAL STATEMENTS
(Dollars in millions, except share and per share data)
|
(7)
|
Decrease due to the write-off of off balance sheet reserves.
|
|
(8)
|
Write down of the book value of debt to the estimated fair values on the date of acquisition based upon favorable interest rates in the market.
|
|
(9)
|
Adjustment consists of the write-off of pre-existing deferred tax assets and purchase accounting adjustments as a result of the acquisition.
|
Core deposit intangible assets of
$15.7 million
are being amortized using an accelerated method over the estimated useful lives of the related deposits of
10
years.
The Company acquired certain loans that are subject to Accounting Standards Codification ("ASC") Topic 310-30 "Loans and Debt Securities Acquired with Deteriorated Credit Quality." ASC Topic 310-30 provides recognition, measurement and disclosure guidance for acquired loans that have evidence of deterioration in credit quality since origination for which it is probable, at acquisition, the Company will be unable to collect all contractual amounts owed. For loans that meet the criteria stipulated in ASC Topic 310-30, the excess of all cash flows expected at acquisition over the initial fair value of the loans acquired ("accretable yield") is amortized to interest income over the expected remaining lives of the underlying loans using the effective interest method. The accretable yield will fluctuate due to changes in (i) estimated lives of underling credit-impaired loans, (ii) assumptions regarding future principal and interest amounts collected, and (iii) indices used to fair value variable rate loans.
Information regarding Northwest loans acquired deemed credit-impaired as of the
August 16, 2018
acquisition date are as follows:
|
Contractually required principal and interest payments
|
$
|
27.5
|
|
|
Contractual cash flows not expected to be collected (“non-accretable discount”)
|
4.4
|
|
|
|
Cash flows expected to be collected
|
23.1
|
|
|
|
Interest component of cash flows expected to be collected (“accretable discount”)
|
3.2
|
|
|
|
Fair value of acquired credit-impaired loans
|
$
|
19.9
|
|
Information regarding Northwest acquired loans not deemed credit-impaired at the
August 16, 2018
acquisition date are as follows:
|
Contractually required principal and interest payments
|
$
|
894.8
|
|
|
Contractual cash flows not expected to be collected
|
26.1
|
|
|
|
Fair value at acquisition
|
$
|
693.2
|
|
Unaudited pro forma consolidated revenues and net income as if the Northwest acquisition had occurred as of January 1, 2017, are not presented because the effect of this acquisition was not considered significant.
The accompanying consolidated statements of income include the results of operations of the acquired entity from the
August 16, 2018
acquisition date. For the period from
August 16, 2018
to September 30, 2018, Northwest reported revenues of
$5.9 million
and net income of
$2.1 million
. The acquired entity continued to operate as INB until
November 9, 2018
at which point INB’s operations were integrated with the Company’s operations, and INB merged with FIB. Standalone amounts for INB were no longer available after that date.
84
FIRST INTERSTATE BANCSYSTEM, INC. AND SUBSIDIARIES
NOTES TO CONSOLIDATED FINANCIAL STATEMENTS
(Dollars in millions, except share and per share data)
Cascade Bancorp.
On
November 17, 2016
, the Company entered into an agreement and plan of merger (the “Agreement”) to acquire all of the outstanding stock of Cascade Bancorp (“Cascade”), parent company of Bank of the Cascades, an Oregon-based community bank with
46
banking offices across Oregon, Idaho, and Washington. This transaction was strategic in allowing the Company to expand its community banking footprint in the Northwest corridor of the United States. The merger was completed on
May 30, 2017
. Holders of each share of Cascade common stock received
0.14864
shares of First Interstate Class A common stock and
$1.91
in cash, without interest, for each share of Cascade common stock. In connection with the merger, the Company issued approximately
11.3 million
shares of First Interstate Class A common stock, which was valued at
$34.30
per share, which was the closing price of First Interstate Class A common stock on the acquisition date. Cash paid by First Interstate was approximately
$155.0 million
, which included the cash portion of the merger consideration and the cash in lieu of fractional shares that Cascade Bancorp shareholders would have otherwise been entitled to receive. Total consideration exchanged in connection with the merger amounted to
$541.0 million
.
All “in-the-money” Cascade options and all Cascade restricted stock units outstanding immediately prior to the transaction close were canceled in exchange for the right to receive a cash payment as provided in the Agreement. The Company paid approximately
$9.3 million
in cash related to Cascade options and restricted stock units, which was included in the consideration paid.
Unvested Cascade restricted stock awards outstanding immediately prior to the transaction close were canceled in exchange for the right to receive a cash payment and Company shares as provided in the Agreement. The Company paid a total of approximately
$2.2 million
in cash and issued approximately
168 thousand
Company shares, valued at
$34.30
per share, related to Cascade unvested restricted stock awards. Of the cash paid and shares issued related to Cascade unvested restricted stock awards, approximately
$2.4 million
was allocated to expense and excluded from consideration paid due to the acceleration of award vesting at the Company’s discretion. The remaining balance of approximately
$5.5 million
related to unvested Cascade restricted stock awards is included in the consideration paid.
The assets and liabilities of Cascade were recorded in the Company’s consolidated financial statements at their estimated fair values as of the acquisition date. The excess value of the consideration paid over the fair value of assets acquired and liabilities assumed is recorded as goodwill. The purchase price allocation resulted in goodwill of
$232.8 million
, which is not deductible for income tax purposes. Goodwill resulting from the acquisition was allocated to the Company’s
one
operating segment, community banking, and consists largely of the synergies and economies of scale expected from combining the operations of Cascade and the Company.
85
FIRST INTERSTATE BANCSYSTEM, INC. AND SUBSIDIARIES
NOTES TO CONSOLIDATED FINANCIAL STATEMENTS
(Dollars in millions, except share and per share data)
The following table summarizes the consideration paid, fair values of the Cascade assets acquired and liabilities assumed, and the resulting goodwill. All amounts were finalized in the first quarter of 2018.
|
As Recorded
|
Fair Value
|
As Recorded
|
||||||||
|
As of May 30, 2017
|
by Cascade
|
Adjustments
|
by the Company
|
|||||||
|
Assets acquired:
|
||||||||||
|
Cash and cash equivalents
|
$
|
246.8
|
|
$
|
—
|
|
$
|
246.8
|
|
|
|
Investment securities
|
476.7
|
|
4.9
|
|
(1)
|
481.6
|
|
|||
|
Loans held for investment
|
2,111.0
|
|
(31.7
|
)
|
(2)
|
2,079.3
|
|
|||
|
Mortgage loans held for sale
|
10.3
|
|
—
|
|
10.3
|
|
||||
|
Allowance for loan losses
|
(24.0
|
)
|
24.0
|
|
(3)
|
—
|
|
|||
|
Premises and equipment
|
46.6
|
|
0.1
|
|
(4)
|
46.7
|
|
|||
|
Other real estate owned (“OREO”)
|
1.2
|
|
—
|
|
1.2
|
|
||||
|
Core deposit intangible assets
|
—
|
|
48.0
|
|
(5)
|
48.0
|
|
|||
|
Deferred tax assets, net
|
47.6
|
|
(20.9
|
)
|
(6)
|
26.7
|
|
|||
|
Other assets
|
98.6
|
|
2.1
|
|
(7)
|
100.7
|
|
|||
|
Total assets acquired
|
3,014.8
|
|
26.5
|
|
3,041.3
|
|
||||
|
Liabilities assumed:
|
||||||||||
|
Deposits
|
2,669.9
|
|
(0.9
|
)
|
(8)
|
2,669.0
|
|
|||
|
Accounts payable and accrued expense
|
62.2
|
|
1.9
|
|
(9)
|
64.1
|
|
|||
|
Total liabilities assumed
|
2,732.1
|
|
1.0
|
|
2,733.1
|
|
||||
|
Net assets acquired
|
$
|
282.7
|
|
$
|
25.5
|
|
$
|
308.2
|
|
|
|
Consideration paid:
|
||||||||||
|
Cash
|
$
|
155.0
|
|
|||||||
|
Class A common stock
|
386.0
|
|
||||||||
|
Total consideration paid
|
$
|
541.0
|
|
|||||||
|
Goodwill
|
$
|
232.8
|
|
|||||||
|
Explanation of fair value adjustments:
|
|
|
(1)
|
Write up of the book value of investments to their estimated fair values on the date of acquisition based upon quotes obtained from an independent third party pricing service.
|
|
(2)
|
Write down of the book value of loans to their estimated fair values. Shared National Credits (SNC) were recorded at quoted sales prices where available. The fair value of the remaining loans was estimated using cash flow projections based on the remaining maturity and repricing terms, adjusted for estimated future credit losses and prepayments and discounted to present value using a risk-adjusted market rate for similar loans. The fair value of collateral dependent loans acquired with deteriorated credit quality was estimated based on the Company’s analysis of the fair value of each loan’s underlying collateral, discounted using market-derived rates of return with consideration given to the period of time and costs associated with foreclosure and disposition of the collateral.
|
|
(3)
|
Adjustment to remove the Cascade allowance for loan losses at acquisition date, as the credit risk is included in the fair value adjustment for loans receivable described in (2) above.
|
|
(4)
|
Write up of the book value of premises and equipment to their estimated fair values on the date of acquisition based upon appraisals obtained from an independent third party appraiser or broker’s opinion of value.
|
|
(5)
|
Adjustment represents the value of the core deposit base assumed in the acquisition based upon valuation from an independent accounting and advisory firm.
|
|
(6)
|
Adjustment consists of the write-off of pre-existing deferred tax assets and purchase accounting adjustments as a result of the acquisition.
|
|
(7)
|
Adjustment consists of various other assets recorded as a result of the acquisition, including mortgage servicing rights, SBA servicing rights, and favorable leases offset by reductions to the fair value of other items.
|
|
(8)
|
Decrease in book value of time deposits to their estimated fair values based upon interest rates of similar time deposits with similar terms on the date of acquisition based upon valuation from an independent accounting and advisory firm.
|
86
FIRST INTERSTATE BANCSYSTEM, INC. AND SUBSIDIARIES
NOTES TO CONSOLIDATED FINANCIAL STATEMENTS
(Dollars in millions, except share and per share data)
|
(9)
|
Increase in fair value due to credit card incentive program, unfavorable leases, write-off of balance sheet reserve, and swap liability offset.
|
Core deposit intangible assets of
$48.0 million
are being amortized using an accelerated method over the estimated useful lives of the related deposits of
10
years.
The Company acquired certain loans that are subject to ASC Topic 310-30. For loans that meet the criteria stipulated in Topic 310-30, the excess of all cash flows expected at acquisition over the initial fair value of the loans acquired (“accretable yield”) is amortized to interest income over the expected remaining lives of the underlying loans using the effective interest method. The accretable yield will fluctuate due to changes in (i) estimated lives of underling credit-impaired loans, (ii) assumptions regarding future principal and interest amounts collected, and (iii) indices used to fair value variable rate loans.
Information regarding Cascade loans acquired deemed credit-impaired as of the
May 30, 2017
acquisition date is as follows:
|
Contractually required principal and interest payments
|
$
|
49.7
|
|
|
Contractual cash flows not expected to be collected (“non-accretable discount”)
|
24.7
|
|
|
|
Cash flows expected to be collected
|
25.0
|
|
|
|
Interest component of cash flows expected to be collected (“accretable discount”)
|
1.9
|
|
|
|
Fair value of acquired credit-impaired loans
|
$
|
23.1
|
|
Information regarding Cascade acquired loans not deemed credit-impaired at the
May 30, 2017
acquisition date is as follows:
|
Contractually required principal and interest payments
|
$
|
2,098.1
|
|
|
Contractual cash flows not expected to be collected
|
23.3
|
|
|
|
Fair value at acquisition
|
$
|
2,066.5
|
|
The accompanying consolidated statements of income include the results of operations of the acquired entity from the
May 30, 2017
acquisition date. For the period from
May 30, 2017
to June 30, 2017, Cascade reported revenues of
$12.9 million
and net income of
$3.0 million
. The acquired entities continued to operate as Bank of the Cascades until
August 11, 2017
at which point Cascade’s operations were integrated with the Company’s operations, and Bank of the Cascades merged with FIB. Standalone amounts for the Bank of the Cascades were no longer available after that date.
The following table presents unaudited pro forma consolidated revenues and net income as if the Cascade acquisition had occurred as of January 1, 2016.
|
Year ended December 31, (unaudited)
|
2018
|
2017
|
||||
|
Interest income
|
$
|
473.4
|
|
$
|
420.8
|
|
|
Non-interest income
|
143.3
|
|
153.3
|
|
||
|
Total revenues
|
$
|
616.7
|
|
$
|
574.1
|
|
|
Net income
|
$
|
162.5
|
|
$
|
126.4
|
|
|
EPS - basic
|
$
|
2.81
|
|
$
|
2.03
|
|
|
EPS - diluted
|
2.79
|
|
2.01
|
|
||
The unaudited pro forma net income presented in the table above for
2018
and
2017
was adjusted to exclude acquisition-related costs, including change in control expenses related to employee benefit plans and legal and professional expenses, of
$2.3 million
and
$21.8 million
, respectively, net of tax. The unaudited pro forma net income presented in the table above for
2018
and
2017
includes adjustments for scheduled amortization of core deposit intangible assets acquired in the acquisition. The unaudited supplemental pro forma net income presented in the table above for
2018
and
2017
does not capture operating costs savings and other business synergies expected as a result of the acquisition.
87
FIRST INTERSTATE BANCSYSTEM, INC. AND SUBSIDIARIES
NOTES TO CONSOLIDATED FINANCIAL STATEMENTS
(Dollars in millions, except share and per share data)
Acquisition related expenses
The Company recorded third party acquisition related costs of
$12.4 million
,
$27.2 million
and
$2.8 million
in
2018
,
2017
and
2016
, respectively. These costs are incorporated in non-interest expense in the Company’s consolidated statements of income and are summarized below.
|
Dec 31, 2018
|
Dec 31, 2017
|
Dec 31, 2016
|
|||||||
|
Legal and professional fees
|
$
|
4.0
|
|
$
|
9.6
|
|
$
|
2.1
|
|
|
Employee expenses
|
1.1
|
|
5.1
|
|
0.2
|
|
|||
|
Technology conversion and contract termination
|
6.6
|
|
10.2
|
|
0.2
|
|
|||
|
Other
|
0.7
|
|
2.3
|
|
0.3
|
|
|||
|
Total acquisition related expenses
|
$
|
12.4
|
|
$
|
27.2
|
|
$
|
2.8
|
|
|
(3)
|
GOODWILL AND CORE DEPOSIT INTANGIBLES
|
|
Goodwill
|
||||||||
|
Year Ended December 31,
|
||||||||
|
|
2018
|
2017
|
||||||
|
Net carrying value at beginning of period
|
$
|
444.7
|
|
$
|
212.8
|
|
||
|
Acquisitions and measurement period adjustments
|
102.0
|
|
231.9
|
|
||||
|
Net carrying value at end of period
|
$
|
546.7
|
|
$
|
444.7
|
|
||
The Company performed its annual goodwill impairment qualitative assessment as of July 1,
2018
,
2017
, and
2016
and determined the Company’s goodwill was
no
t considered impaired. In addition, there were no events or circumstances that occurred during the second half of
2018
that would more-likely-than-not reduce the fair value of a reporting unit below its carrying value, the Company did not perform interim testing as of
December 31, 2018
.
|
Core deposit intangibles (“CDI”)
The following table sets forth activity for identifiable core deposit intangibles subject to amortization:
|
||||||||
|
Year Ended December 31,
|
||||||||
|
|
2018
|
2017
|
||||||
|
Gross CDI, beginning of period
|
$
|
74.0
|
|
$
|
29.2
|
|
||
|
Established through acquisitions
|
15.7
|
|
48.0
|
|
||||
|
Reductions due to sale of accounts
|
—
|
|
(3.2
|
)
|
||||
|
Accumulated amortization
|
(32.8
|
)
|
(24.9
|
)
|
||||
|
Net CDI, end of period
|
$
|
56.9
|
|
$
|
49.1
|
|
||
Amortization expense of CDI assets was
$7.9 million
,
$5.5 million
and
$3.4 million
for the fiscal years ended
December 31, 2018
,
2017
and
2016
, respectively.
CDI are evaluated for impairment if events and circumstances indicate a possible impairment. The CDI are amortized using an accelerated method based on the estimated weighted average useful lives of the related deposits, which is generally
ten
years.
88
FIRST INTERSTATE BANCSYSTEM, INC. AND SUBSIDIARIES
NOTES TO CONSOLIDATED FINANCIAL STATEMENTS
(Dollars in millions, except share and per share data)
In 2017, the Company sold the custodial rights to our Health Savings Account (“HSA”) portfolio to HealthEquity, Inc. for
$6.2 million
, of which
$3.2 million
was attributable to BOTC acquired deposits which were sold at fair market value.
The following table provides estimated future CDI amortization expense:
|
Years ending December 31,
|
||||
|
2019
|
$
|
8.9
|
|
|
|
2020
|
8.1
|
|
||
|
2021
|
7.5
|
|
||
|
2022
|
6.9
|
|
||
|
2023
|
6.3
|
|
||
|
Thereafter
|
19.2
|
|
||
|
Total
|
$
|
56.9
|
|
|
|
(4)
|
INVESTMENT SECURITIES
|
The amortized cost and approximate fair values of investment securities are summarized as follows:
|
December 31, 2018
|
Amortized
Cost
|
Gross
Unrealized
Gains
|
Gross
Unrealized
Losses
|
Estimated
Fair
Value
|
||||||||
|
Available-for-Sale
|
||||||||||||
|
U.S. Treasury notes
|
$
|
2.6
|
|
$
|
—
|
|
$
|
—
|
|
$
|
2.6
|
|
|
Obligations of U.S. government agencies
|
569.3
|
|
0.1
|
|
(10.2
|
)
|
559.2
|
|
||||
|
U.S. agency residential mortgage-backed securities &
collateralized mortgage obligations
|
1,566.4
|
|
2.5
|
|
(24.1
|
)
|
1,544.8
|
|
||||
|
Private mortgage-backed securities
|
72.0
|
|
—
|
|
(1.8
|
)
|
70.2
|
|
||||
|
Corporate Securities
|
92.9
|
|
—
|
|
(1.0
|
)
|
91.9
|
|
||||
|
Other investments
|
2.0
|
|
—
|
|
—
|
|
2.0
|
|
||||
|
Total
|
$
|
2,305.2
|
|
$
|
2.6
|
|
$
|
(37.1
|
)
|
$
|
2,270.7
|
|
|
December 31, 2018
|
Amortized
Cost
|
Gross
Unrealized
Gains
|
Gross
Unrealized
Losses
|
Estimated
Fair
Value
|
||||||||
|
Held-to Maturity
|
||||||||||||
|
State, county and municipal securities
|
$
|
150.9
|
|
$
|
1.8
|
|
$
|
(0.9
|
)
|
$
|
151.8
|
|
|
U.S agency residential mortgage-backed securities &
collateralized mortgage obligations |
189.7
|
|
0.3
|
|
(6.5
|
)
|
183.5
|
|
||||
|
Corporate securities
|
46.3
|
|
0.1
|
|
(0.6
|
)
|
45.8
|
|
||||
|
Obligations of U.S. government agencies
|
19.8
|
|
—
|
|
(0.3
|
)
|
19.5
|
|
||||
|
Other investments
|
0.1
|
|
—
|
|
—
|
|
0.1
|
|
||||
|
Total
|
$
|
406.8
|
|
$
|
2.2
|
|
$
|
(8.3
|
)
|
$
|
400.7
|
|
89
FIRST INTERSTATE BANCSYSTEM, INC. AND SUBSIDIARIES
NOTES TO CONSOLIDATED FINANCIAL STATEMENTS
(Dollars in millions, except share and per share data)
|
December 31, 2017
|
Amortized
Cost
|
Gross
Unrealized
Gains
|
Gross
Unrealized
Losses
|
Estimated
Fair
Value
|
||||||||
|
Available-for-Sale
|
||||||||||||
|
U.S. Treasury notes
|
$
|
3.2
|
|
$
|
—
|
|
$
|
—
|
|
$
|
3.2
|
|
|
Obligations of U.S. government agencies
|
569.5
|
|
—
|
|
(8.0
|
)
|
561.5
|
|
||||
|
U.S. agency residential mortgage-backed securities &
collateralized mortgage obligations |
1,474.1
|
|
3.8
|
|
(15.4
|
)
|
1,462.5
|
|
||||
|
Private mortgage-backed securities
|
91.5
|
|
—
|
|
(0.8
|
)
|
90.7
|
|
||||
|
Corporate Securities
|
88.0
|
|
0.1
|
|
(0.3
|
)
|
87.8
|
|
||||
|
Other investments
|
3.0
|
|
—
|
|
—
|
|
3.0
|
|
||||
|
Total
|
$
|
2,229.3
|
|
$
|
3.9
|
|
$
|
(24.5
|
)
|
$
|
2,208.7
|
|
|
December 31, 2017
|
Amortized
Cost
|
Gross
Unrealized
Gains
|
Gross
Unrealized
Losses
|
Estimated
Fair
Value
|
||||||||
|
Held-to Maturity
|
||||||||||||
|
State, county and municipal securities
|
$
|
172.4
|
|
$
|
2.6
|
|
$
|
(0.6
|
)
|
$
|
174.4
|
|
|
Obligations of U.S. government agencies
|
19.8
|
|
—
|
|
(0.2
|
)
|
19.6
|
|
||||
|
U.S. agency residential mortgage-backed securities &
collateralized mortgage obligations
|
230.5
|
|
8.8
|
|
(11.6
|
)
|
227.7
|
|
||||
|
Corporate securities
|
61.6
|
|
0.1
|
|
(0.3
|
)
|
61.4
|
|
||||
|
Other investments
|
0.2
|
|
—
|
|
—
|
|
0.2
|
|
||||
|
Total
|
$
|
484.5
|
|
$
|
11.5
|
|
$
|
(12.7
|
)
|
$
|
483.3
|
|
There were
no
material gross gains and
$0.1 million
of gross losses realized on the disposition of available-for-sale securities in
2018
.
Gross gains of
$1.1 million
and
$0.4 million
were realized on the disposition of available-for-sale securities in
2017
and
2016
, respectively. Gross losses of
$0.4 million
and
$0.1 million
were realized on the disposition of available-for-sale securities in
2017
and
2016
, respectively.
As of
December 31, 2018
, the Company had general obligation securities with amortized costs of
$115.5 million
included in state, county and municipal securities, of which
$66.8 million
were issued by political subdivisions or agencies within the states of Idaho, Montana, Oregon, South Dakota, Washington, and Wyoming.
The following tables show the gross unrealized losses and fair values of investment securities, aggregated by investment category, and the length of time individual investment securities have been in a continuous unrealized loss position, as of
December 31, 2018
and
2017
.
|
|
Less than 12 Months
|
12 Months or More
|
Total
|
|||||||||||||||
|
December 31, 2018
|
Fair
Value
|
Gross
Unrealized
Losses
|
Fair
Value
|
Gross
Unrealized
Losses
|
Fair
Value
|
Gross
Unrealized
Losses
|
||||||||||||
|
Available-for-Sale
|
|
|
|
|
|
|
||||||||||||
|
Obligations of U.S. government agencies
|
$
|
363.1
|
|
$
|
(7.9
|
)
|
$
|
154.5
|
|
$
|
(2.3
|
)
|
$
|
517.6
|
|
$
|
(10.2
|
)
|
|
U.S. agency residential mortgage-backed
securities & collateralized mortgage
obligations
|
735.2
|
|
(14.5
|
)
|
503.7
|
|
(9.6
|
)
|
1,238.9
|
|
(24.1
|
)
|
||||||
|
Private mortgage-backed securities
|
—
|
|
—
|
|
69.4
|
|
(1.8
|
)
|
69.4
|
|
(1.8
|
)
|
||||||
|
Corporate securities
|
24.9
|
|
(0.2
|
)
|
51.4
|
|
(0.8
|
)
|
76.3
|
|
(1.0
|
)
|
||||||
|
Total
|
$
|
1,123.2
|
|
$
|
(22.6
|
)
|
$
|
779.0
|
|
$
|
(14.5
|
)
|
$
|
1,902.2
|
|
$
|
(37.1
|
)
|
90
FIRST INTERSTATE BANCSYSTEM, INC. AND SUBSIDIARIES
NOTES TO CONSOLIDATED FINANCIAL STATEMENTS
(Dollars in millions, except share and per share data)
|
|
Less than 12 Months
|
12 Months or More
|
Total
|
|||||||||||||||
|
December 31, 2018
|
Fair
Value
|
Gross
Unrealized
Losses
|
Fair
Value
|
Gross
Unrealized
Losses
|
Fair
Value
|
Gross
Unrealized
Losses
|
||||||||||||
|
Held-to-Maturity
|
|
|
|
|
|
|
||||||||||||
|
State, county and municipal securities
|
$
|
25.9
|
|
$
|
(0.3
|
)
|
$
|
57.1
|
|
$
|
(0.6
|
)
|
$
|
83.0
|
|
$
|
(0.9
|
)
|
|
U.S. agency residential mortgage-backed
securities & collateralized mortgage obligations |
45.0
|
|
(2.2
|
)
|
120.2
|
|
(4.3
|
)
|
165.2
|
|
(6.5
|
)
|
||||||
|
Corporate securities
|
—
|
|
—
|
|
39.6
|
|
(0.6
|
)
|
39.6
|
|
(0.6
|
)
|
||||||
|
Obligations of U.S. government agencies
|
19.5
|
|
(0.3
|
)
|
—
|
|
—
|
|
19.5
|
|
(0.3
|
)
|
||||||
|
Total
|
$
|
90.4
|
|
$
|
(2.8
|
)
|
$
|
216.9
|
|
$
|
(5.5
|
)
|
$
|
307.3
|
|
$
|
(8.3
|
)
|
|
|
Less than 12 Months
|
12 Months or More
|
Total
|
|||||||||||||||
|
December 31, 2017
|
Fair
Value
|
Gross
Unrealized
Losses
|
Fair
Value
|
Gross
Unrealized
Losses
|
Fair
Value
|
Gross
Unrealized
Losses
|
||||||||||||
|
Available-for-Sale
|
|
|
|
|
|
|
||||||||||||
|
Obligations of U.S. government agencies
|
284.9
|
|
(3.4
|
)
|
266.1
|
|
(4.6
|
)
|
551.0
|
|
(8.0
|
)
|
||||||
|
U.S. agency residential mortgage-backed
securities & collateralized mortgage
obligations
|
670.1
|
|
(6.2
|
)
|
439.2
|
|
(9.2
|
)
|
1,109.3
|
|
(15.4
|
)
|
||||||
|
Private mortgage-backed securities
|
74.0
|
|
(0.8
|
)
|
—
|
|
—
|
|
74.0
|
|
(0.8
|
)
|
||||||
|
Corporate securities
|
51.3
|
|
(0.3
|
)
|
—
|
|
—
|
|
51.3
|
|
(0.3
|
)
|
||||||
|
Total
|
$
|
1,080.3
|
|
$
|
(10.7
|
)
|
$
|
705.3
|
|
$
|
(13.8
|
)
|
$
|
1,785.6
|
|
$
|
(24.5
|
)
|
|
|
Less than 12 Months
|
12 Months or More
|
Total
|
|||||||||||||||
|
December 31, 2017
|
Fair
Value
|
Gross
Unrealized
Losses
|
Fair
Value
|
Gross
Unrealized
Losses
|
Fair
Value
|
Gross
Unrealized
Losses
|
||||||||||||
|
Held-to-Maturity
|
|
|
|
|
|
|
||||||||||||
|
State, county and municipal securities
|
$
|
53.3
|
|
$
|
(0.4
|
)
|
$
|
12.3
|
|
$
|
(0.2
|
)
|
$
|
65.6
|
|
$
|
(0.6
|
)
|
|
U.S. agency residential mortgage-backed
securities & collateralized mortgage obligations |
76.4
|
|
(9.1
|
)
|
60.5
|
|
(2.5
|
)
|
$
|
136.9
|
|
$
|
(11.6
|
)
|
||||
|
Corporate securities
|
$
|
41.2
|
|
$
|
(0.2
|
)
|
$
|
5.0
|
|
$
|
(0.1
|
)
|
$
|
46.2
|
|
$
|
(0.3
|
)
|
|
Obligations of U.S. government agencies
|
$
|
9.7
|
|
$
|
—
|
|
$
|
9.9
|
|
$
|
(0.2
|
)
|
$
|
19.6
|
|
$
|
(0.2
|
)
|
|
Total
|
$
|
180.6
|
|
$
|
(9.7
|
)
|
$
|
87.7
|
|
$
|
(3.0
|
)
|
$
|
268.3
|
|
$
|
(12.7
|
)
|
The investment portfolio is evaluated quarterly for other-than-temporary declines in the market value of each individual investment security. Consideration is given to the length of time and the extent to which the fair value has been less than cost; the financial condition and near term prospects of the issuer; and, the intent and ability of the Company to retain its investment in the issuer for a period of time sufficient to allow for any anticipated recovery in fair value. The Company had
760
and
581
individual investment securities that were in an unrealized loss position as of
December 31, 2018
and
2017
, respectively. Unrealized losses as of
December 31, 2018
and
2017
related primarily to fluctuations in the current interest rates. The fair value of these investment securities is expected to recover as the securities approach their maturity or repricing date or if market yields for such investments decline. As of
December 31, 2018
, the Company had the intent and ability to hold these investment securities for a period of time sufficient to allow for an anticipated recovery. Furthermore, the Company does not have the intent to sell any of the available-for-sale securities in the above table and it is more likely than not that the Company will not have to sell any securities before a recovery in cost.
No
impairment losses were recorded during
2018
,
2017
or
2016
.
91
FIRST INTERSTATE BANCSYSTEM, INC. AND SUBSIDIARIES
NOTES TO CONSOLIDATED FINANCIAL STATEMENTS
(Dollars in millions, except share and per share data)
Maturities of investment securities at
December 31, 2018
are shown below. Maturities of mortgage-backed securities have been adjusted to reflect shorter maturities based upon estimated prepayments of principal. All other investment securities maturities are shown at contractual maturity dates.
|
|
Available-for-Sale
|
Held-to-Maturity
|
|||||||||||
|
December 31, 2018
|
Amortized
Cost
|
Estimated
Fair Value
|
Amortized
Cost
|
Estimated
Fair Value
|
|||||||||
|
Within one year
|
$
|
477.8
|
|
$
|
472.3
|
|
$
|
64.1
|
|
$
|
63.0
|
|
|
|
After one year but within five years
|
1,519.2
|
|
1,495.0
|
|
221.6
|
|
216.7
|
|
|||||
|
After five years but within ten years
|
154.5
|
|
151.9
|
|
94.4
|
|
94.9
|
|
|||||
|
After ten years
|
153.7
|
|
151.5
|
|
26.7
|
|
26.1
|
|
|||||
|
Total
|
$
|
2,305.2
|
|
$
|
2,270.7
|
|
$
|
406.8
|
|
$
|
400.7
|
|
|
At
December 31, 2018
, the Company had investment securities callable within one year with amortized costs and estimated fair values of
$64.7 million
and
$64.8 million
, respectively. These investment securities are primarily classified as available-for-sale and included in the after one year but within five years category in the table above.
At
December 31, 2018
, the Company had callable structured notes with amortized costs and estimated fair values of
$2.0 million
and
$2.0 million
, respectively. These callable structured notes, which are classified as available-for-sale and included in the after one year but within five years category in the table above.
Maturities of securities do not reflect rate repricing opportunities present in adjustable rate mortgage-backed securities. At
December 31, 2018
and
2017
, the Company had variable rate mortgage-backed securities with amortized costs of
$219.5 million
and
$247.9 million
, respectively, classified as available-for-sale in the table above.
There are no significant concentrations of investments at
December 31, 2018
, (greater than 10 percent of stockholders’ equity) in any individual security issuer, except for U.S. government or agency-backed securities.
Investment securities with amortized cost of
$1,943.1 million
and
$2,087.7 million
at
December 31, 2018
and
2017
, respectively, were pledged to secure public deposits and securities sold under repurchase agreements. The approximate fair value of securities pledged at
December 31, 2018
and
2017
was
$1,908.4 million
and
$2,062.6 million
, respectively. All securities sold under repurchase agreements are with customers and mature on the next banking day. The Company retains possession of the underlying securities sold under repurchase agreements.
92
FIRST INTERSTATE BANCSYSTEM, INC. AND SUBSIDIARIES
NOTES TO CONSOLIDATED FINANCIAL STATEMENTS
(Dollars in millions, except share and per share data)
|
(5)
|
LOANS
|
The following table presents loans by class as of the dates indicated:
|
December 31,
|
2018
|
2017
|
|||||
|
Real estate loans:
|
|
|
|||||
|
Commercial
|
$
|
3,235.4
|
|
$
|
2,822.9
|
|
|
|
Construction:
|
|||||||
|
Land acquisition & development
|
321.6
|
|
348.7
|
|
|||
|
Residential
|
242.8
|
|
240.2
|
|
|||
|
Commercial
|
274.3
|
|
119.4
|
|
|||
|
Total construction loans
|
838.7
|
|
708.3
|
|
|||
|
Residential
|
1,542.0
|
|
1,487.4
|
|
|||
|
Agricultural
|
217.4
|
|
158.2
|
|
|||
|
Total real estate loans
|
5,833.5
|
|
5,176.8
|
|
|||
|
Consumer:
|
|||||||
|
Indirect consumer
|
787.8
|
|
784.7
|
|
|||
|
Other consumer
|
200.6
|
|
175.1
|
|
|||
|
Credit card
|
81.8
|
|
74.6
|
|
|||
|
Total consumer loans
|
1,070.2
|
|
1,034.4
|
|
|||
|
Commercial
|
1,310.3
|
|
1,215.4
|
|
|||
|
Agricultural
|
254.8
|
|
136.2
|
|
|||
|
Other, including overdrafts
|
1.6
|
|
4.9
|
|
|||
|
Loans held for investment
|
8,470.4
|
|
7,567.7
|
|
|||
|
Mortgage loans held for sale
|
33.3
|
|
46.6
|
|
|||
|
Total loans
|
$
|
8,503.7
|
|
$
|
7,614.3
|
|
|
The Company has lending policies and procedures in place that are designed to maximize loan income within an acceptable level of risk. Management reviews and approves these policies and procedures on a regular basis. A reporting system supplements the review process by providing management with frequent reports related to loan production, loan quality, concentrations of credit, loan delinquencies and internally risk-classified loans.
Real estate loans include construction and permanent financing for both single-family and multi-unit properties, term loans for commercial, agricultural and industrial property and/or buildings and home equity loans and lines of credit secured by real estate. Longer-term residential real estate loans are generally sold in the secondary market. Those residential real estate loans not sold are typically secured by first liens on the financed property and generally mature in less than
fifteen years
. Home equity loans and lines of credit are typically secured by first or second liens on residential real estate and generally do not exceed a loan to value ratio of
80%
. The Company had home equity loans and lines of credit of
$409.5 million
and
$397.0 million
as of
December 31, 2018
and
2017
, respectively, included in residential real estate loans. Commercial and agricultural real estate loans are generally secured by first liens on income-producing real estate and generally mature in less than
5 years
.
Construction loans are primarily to commercial builders for residential lot development and the construction of single-family residences and commercial real estate properties. Construction loans are generally underwritten pursuant to pre-approved permanent financing. During the construction phase the borrower pays interest only.
Consumer loans include direct personal loans, credit card loans, lines of credit and indirect dealer loans for the purchase of automobiles, recreational vehicles, boats and other consumer goods. Personal loans and indirect dealer loans are generally secured by automobiles, boats and other types of personal property and are made on an installment basis. Credit cards are offered to individuals in our market areas. Lines of credit are generally floating rate loans that are unsecured or secured by personal property.
93
FIRST INTERSTATE BANCSYSTEM, INC. AND SUBSIDIARIES
NOTES TO CONSOLIDATED FINANCIAL STATEMENTS
(Dollars in millions, except share and per share data)
Commercial loans include a mix of variable and fixed rate loans made to small and medium-sized manufacturing, wholesale, retail and service businesses for working capital needs and business expansions. Commercial loans generally include lines of credit, business credit cards and loans with maturities of five years or less. The loans are generally made with business operations as the primary source of repayment, but also include collateralization by inventory, accounts receivable, equipment and/or personal guarantees.
Agricultural loans generally consist of short and medium-term loans and lines of credit that are primarily used for crops, livestock, equipment and general operations. Agricultural loans are ordinarily secured by assets such as livestock or equipment and are repaid from the operations of the farm or ranch. Agricultural loans generally have maturities of five years or less, with operating lines for one production season.
Included in the loan table above, are loans acquired in business combinations including certain loans that had evidence of deterioration in credit quality since origination and for which it was probable, at acquisition, that all contractually required payments would not be collected. The following table displays the outstanding unpaid principal balance and accrual status of loans acquired with credit impairment as of
December 31, 2018
and
2017
.
|
December 31,
|
2018
|
2017
|
|||||
|
Outstanding principal
|
$
|
43.4
|
|
$
|
38.2
|
|
|
|
Carrying value:
|
|||||||
|
Loans on accrual status
|
30.2
|
|
24.9
|
|
|||
|
Total carrying value
|
$
|
30.2
|
|
$
|
24.9
|
|
|
The following table summarizes changes in the accretable yield for loans acquired credit impaired for the years ended
December 31, 2018
,
2017
, and
2016
:
|
Year Ended December 31,
|
2018
|
2017
|
2016
|
||||||||
|
Beginning balance
|
$
|
7.3
|
|
$
|
6.8
|
|
$
|
6.7
|
|
||
|
Acquisitions
|
3.2
|
|
1.9
|
|
1.1
|
|
|||||
|
Additions
|
0.6
|
|
0.1
|
|
—
|
|
|||||
|
Accretion income
|
(3.1
|
)
|
(2.9
|
)
|
(2.5
|
)
|
|||||
|
Reductions due to exit events
|
(1.1
|
)
|
(1.5
|
)
|
(1.1
|
)
|
|||||
|
Reclassifications from nonaccretable differences
|
2.0
|
|
2.9
|
|
2.6
|
|
|||||
|
Ending balance
|
$
|
8.9
|
|
$
|
7.3
|
|
$
|
6.8
|
|
||
94
FIRST INTERSTATE BANCSYSTEM, INC. AND SUBSIDIARIES
NOTES TO CONSOLIDATED FINANCIAL STATEMENTS
(Dollars in millions, except share and per share data)
Loans are considered past due if the required principal and interest payments have not been received as of the date such payments were due. The following tables present the contractual aging of the Company’s recorded investment in past due loans by class as of the period indicated:
|
Total Loans
|
|||||||||||||||||||||
|
30 - 59
|
60 - 89
|
> 90
|
30 or More
|
||||||||||||||||||
|
Days
|
Days
|
Days
|
Days
|
Current
|
Non-accrual
|
Total
|
|||||||||||||||
|
As of December 31, 2018
|
Past Due
|
Past Due
|
Past Due
|
Past Due
|
Loans
|
Loans
|
Loans
|
||||||||||||||
|
Real estate
|
|||||||||||||||||||||
|
Commercial
|
$
|
10.4
|
|
$
|
1.0
|
|
$
|
0.8
|
|
$
|
12.2
|
|
$
|
3,214.0
|
|
$
|
9.2
|
|
$
|
3,235.4
|
|
|
Construction:
|
|||||||||||||||||||||
|
Land acquisition & development
|
1.6
|
|
0.1
|
|
0.2
|
|
1.9
|
|
316.0
|
|
3.7
|
|
321.6
|
|
|||||||
|
Residential
|
1.0
|
|
0.4
|
|
—
|
|
1.4
|
|
240.4
|
|
1.0
|
|
242.8
|
|
|||||||
|
Commercial
|
0.4
|
|
—
|
|
—
|
|
0.4
|
|
273.7
|
|
0.2
|
|
274.3
|
|
|||||||
|
Total construction loans
|
3.0
|
|
0.5
|
|
0.2
|
|
3.7
|
|
830.1
|
|
4.9
|
|
838.7
|
|
|||||||
|
Residential
|
8.8
|
|
1.1
|
|
0.2
|
|
10.1
|
|
1,525.3
|
|
6.6
|
|
1,542.0
|
|
|||||||
|
Agricultural
|
2.2
|
|
—
|
|
—
|
|
2.2
|
|
202.6
|
|
12.6
|
|
217.4
|
|
|||||||
|
Total real estate loans
|
24.4
|
|
2.6
|
|
1.2
|
|
28.2
|
|
5,772.0
|
|
33.3
|
|
5,833.5
|
|
|||||||
|
Consumer:
|
|
|
|||||||||||||||||||
|
Indirect consumer
|
6.8
|
|
2.1
|
|
0.4
|
|
9.3
|
|
776.8
|
|
1.7
|
|
787.8
|
|
|||||||
|
Other consumer
|
1.4
|
|
0.5
|
|
0.1
|
|
2.0
|
|
198.1
|
|
0.5
|
|
200.6
|
|
|||||||
|
Credit card
|
0.9
|
|
0.4
|
|
0.8
|
|
2.1
|
|
79.7
|
|
—
|
|
81.8
|
|
|||||||
|
Total consumer loans
|
9.1
|
|
3.0
|
|
1.3
|
|
13.4
|
|
1,054.6
|
|
2.2
|
|
1,070.2
|
|
|||||||
|
Commercial
|
8.3
|
|
1.2
|
|
1.3
|
|
10.8
|
|
1,283.7
|
|
15.8
|
|
1,310.3
|
|
|||||||
|
Agricultural
|
2.1
|
|
0.3
|
|
—
|
|
2.4
|
|
249.4
|
|
3.0
|
|
254.8
|
|
|||||||
|
Other, including overdrafts
|
—
|
|
—
|
|
—
|
|
—
|
|
1.6
|
|
—
|
|
1.6
|
|
|||||||
|
Loans held for investment
|
43.9
|
|
7.1
|
|
3.8
|
|
54.8
|
|
8,361.3
|
|
54.3
|
|
8,470.4
|
|
|||||||
|
Mortgage loans originated for sale
|
—
|
|
—
|
|
—
|
|
—
|
|
33.3
|
|
—
|
|
33.3
|
|
|||||||
|
Total loans
|
$
|
43.9
|
|
$
|
7.1
|
|
$
|
3.8
|
|
$
|
54.8
|
|
$
|
8,394.6
|
|
$
|
54.3
|
|
$
|
8,503.7
|
|
95
FIRST INTERSTATE BANCSYSTEM, INC. AND SUBSIDIARIES
NOTES TO CONSOLIDATED FINANCIAL STATEMENTS
(Dollars in millions, except share and per share data)
|
Total Loans
|
|||||||||||||||||||||
|
30 - 59
|
60 - 89
|
> 90
|
30 or More
|
||||||||||||||||||
|
Days
|
Days
|
Days
|
Days
|
Current
|
Non-accrual
|
Total
|
|||||||||||||||
|
As of December 31, 2017
|
Past Due
|
Past Due
|
Past Due
|
Past Due
|
Loans
|
Loans
|
Loans
|
||||||||||||||
|
Real estate
|
|||||||||||||||||||||
|
Commercial
|
$
|
2.9
|
|
$
|
0.5
|
|
$
|
0.3
|
|
$
|
3.7
|
|
$
|
2,792.4
|
|
$
|
26.8
|
|
$
|
2,822.9
|
|
|
Construction:
|
|||||||||||||||||||||
|
Land acquisition & development
|
7.3
|
|
0.3
|
|
0.3
|
|
7.9
|
|
337.8
|
|
3.0
|
|
348.7
|
|
|||||||
|
Residential
|
2.1
|
|
—
|
|
—
|
|
2.1
|
|
236.4
|
|
1.7
|
|
240.2
|
|
|||||||
|
Commercial
|
—
|
|
—
|
|
—
|
|
—
|
|
115.6
|
|
3.8
|
|
119.4
|
|
|||||||
|
Total construction loans
|
9.4
|
|
0.3
|
|
0.3
|
|
10.0
|
|
689.8
|
|
8.5
|
|
708.3
|
|
|||||||
|
Residential
|
13.3
|
|
1.4
|
|
0.4
|
|
15.1
|
|
1,464.1
|
|
8.2
|
|
1,487.4
|
|
|||||||
|
Agricultural
|
0.3
|
|
—
|
|
0.2
|
|
0.5
|
|
154.3
|
|
3.4
|
|
158.2
|
|
|||||||
|
Total real estate loans
|
25.9
|
|
2.2
|
|
1.2
|
|
29.3
|
|
5,100.6
|
|
46.9
|
|
5,176.8
|
|
|||||||
|
Consumer:
|
|
|
|
|
|||||||||||||||||
|
Indirect consumer
|
7.8
|
|
2.1
|
|
0.4
|
|
10.3
|
|
772.6
|
|
1.8
|
|
784.7
|
|
|||||||
|
Other consumer
|
1.6
|
|
0.5
|
|
0.1
|
|
2.2
|
|
172.6
|
|
0.3
|
|
175.1
|
|
|||||||
|
Credit card
|
0.9
|
|
0.6
|
|
0.7
|
|
2.2
|
|
72.4
|
|
—
|
|
74.6
|
|
|||||||
|
Total consumer loans
|
10.3
|
|
3.2
|
|
1.2
|
|
14.7
|
|
1,017.6
|
|
2.1
|
|
1,034.4
|
|
|||||||
|
Commercial
|
3.9
|
|
1.7
|
|
0.7
|
|
6.3
|
|
1,189.5
|
|
19.6
|
|
1,215.4
|
|
|||||||
|
Agricultural
|
1.8
|
|
0.1
|
|
—
|
|
1.9
|
|
133.5
|
|
0.8
|
|
136.2
|
|
|||||||
|
Other, including overdrafts
|
—
|
|
—
|
|
—
|
|
—
|
|
4.9
|
|
—
|
|
4.9
|
|
|||||||
|
Loans held for investment
|
41.9
|
|
7.2
|
|
3.1
|
|
52.2
|
|
7,446.1
|
|
69.4
|
|
7,567.7
|
|
|||||||
|
Mortgage loans originated for sale
|
—
|
|
—
|
|
—
|
|
—
|
|
46.6
|
|
—
|
|
46.6
|
|
|||||||
|
Total loans
|
$
|
41.9
|
|
$
|
7.2
|
|
$
|
3.1
|
|
$
|
52.2
|
|
$
|
7,492.7
|
|
$
|
69.4
|
|
$
|
7,614.3
|
|
Acquired loans that meet the criteria for non-accrual of interest prior to the acquisition were considered performing upon acquisition. If interest on non-accrual loans had been accrued, such income would have approximated
$3.0 million
,
$3.5 million
and
$3.4 million
during the years ended
December 31, 2018
,
2017
, and
2016
, respectively.
96
FIRST INTERSTATE BANCSYSTEM, INC. AND SUBSIDIARIES
NOTES TO CONSOLIDATED FINANCIAL STATEMENTS
(Dollars in millions, except share and per share data)
The Company considers impaired loans to include all originated loans, except consumer loans, that are risk rated as doubtful, or have been placed on non-accrual status or renegotiated in troubled debt restructurings, and all loans acquired with evidence of deterioration in credit quality and for which it was probable, at the acquisition, that the Company would be unable to collect all contractual amounts owed. The following tables present information on the Company’s recorded investment in impaired loans as of dates indicated:
|
|
December 31, 2018
|
||||||||||||||
|
Unpaid
Total
Principal
Balance
|
Recorded
Investment
With No
Allowance
|
Recorded
Investment
With
Allowance
|
Total
Recorded
Investment
|
Related
Allowance
|
|||||||||||
|
Real estate:
|
|
|
|
|
|
||||||||||
|
Commercial
|
$
|
22.2
|
|
$
|
8.6
|
|
$
|
7.7
|
|
$
|
16.3
|
|
$
|
0.7
|
|
|
Construction:
|
|||||||||||||||
|
Land acquisition & development
|
10.0
|
|
0.4
|
|
3.5
|
|
3.9
|
|
0.2
|
|
|||||
|
Residential
|
1.1
|
|
0.6
|
|
0.4
|
|
1.0
|
|
0.1
|
|
|||||
|
Commercial
|
0.7
|
|
0.2
|
|
—
|
|
0.2
|
|
—
|
|
|||||
|
Total construction loans
|
11.8
|
|
1.2
|
|
3.9
|
|
5.1
|
|
0.3
|
|
|||||
|
Residential
|
8.8
|
|
5.7
|
|
2.0
|
|
7.7
|
|
0.3
|
|
|||||
|
Agricultural
|
12.9
|
|
12.5
|
|
0.2
|
|
12.7
|
|
—
|
|
|||||
|
Total real estate loans
|
55.7
|
|
28.0
|
|
13.8
|
|
41.8
|
|
1.3
|
|
|||||
|
Commercial
|
24.1
|
|
5.5
|
|
14.4
|
|
19.9
|
|
5.2
|
|
|||||
|
Agricultural
|
3.2
|
|
2.5
|
|
0.6
|
|
3.1
|
|
0.3
|
|
|||||
|
Total
|
$
|
83.0
|
|
$
|
36.0
|
|
$
|
28.8
|
|
$
|
64.8
|
|
$
|
6.8
|
|
|
|
December 31, 2017
|
||||||||||||||
|
Unpaid
Total
Principal
Balance
|
Recorded
Investment
With No
Allowance
|
Recorded
Investment
With
Allowance
|
Total
Recorded
Investment
|
Related
Allowance
|
|||||||||||
|
Real estate:
|
|
|
|
|
|
||||||||||
|
Commercial
|
$
|
45.6
|
|
$
|
20.9
|
|
$
|
14.1
|
|
$
|
35.0
|
|
$
|
3.9
|
|
|
Construction:
|
|||||||||||||||
|
Land acquisition & development
|
10.0
|
|
3.4
|
|
0.5
|
|
3.9
|
|
—
|
|
|||||
|
Residential
|
1.8
|
|
1.7
|
|
—
|
|
1.7
|
|
—
|
|
|||||
|
Commercial
|
4.7
|
|
0.4
|
|
3.5
|
|
3.9
|
|
2.2
|
|
|||||
|
Total construction loans
|
16.5
|
|
5.5
|
|
4.0
|
|
9.5
|
|
2.2
|
|
|||||
|
Residential
|
11.5
|
|
8.2
|
|
2.0
|
|
10.2
|
|
0.1
|
|
|||||
|
Agricultural
|
3.7
|
|
3.6
|
|
—
|
|
3.6
|
|
—
|
|
|||||
|
Total real estate loans
|
77.3
|
|
38.2
|
|
20.1
|
|
58.3
|
|
6.2
|
|
|||||
|
Commercial
|
29.5
|
|
12.4
|
|
11.4
|
|
23.8
|
|
4.4
|
|
|||||
|
Agricultural
|
1.1
|
|
0.8
|
|
0.3
|
|
1.1
|
|
0.2
|
|
|||||
|
Total
|
$
|
107.9
|
|
$
|
51.4
|
|
$
|
31.8
|
|
$
|
83.2
|
|
$
|
10.8
|
|
97
FIRST INTERSTATE BANCSYSTEM, INC. AND SUBSIDIARIES
NOTES TO CONSOLIDATED FINANCIAL STATEMENTS
(Dollars in millions, except share and per share data)
|
|
December 31, 2016
|
||||||||||||||
|
Unpaid
Total
Principal
Balance
|
Recorded
Investment
With No
Allowance
|
Recorded
Investment
With
Allowance
|
Total
Recorded
Investment
|
Related
Allowance
|
|||||||||||
|
Real estate:
|
|
|
|
|
|
||||||||||
|
Commercial
|
$
|
57.0
|
|
$
|
24.4
|
|
$
|
21.4
|
|
$
|
45.8
|
|
$
|
2.8
|
|
|
Construction:
|
|
|
|
|
|
||||||||||
|
Land acquisition & development
|
12.1
|
|
4.3
|
|
1.8
|
|
6.1
|
|
0.8
|
|
|||||
|
Residential
|
1.6
|
|
0.2
|
|
0.6
|
|
0.8
|
|
—
|
|
|||||
|
Commercial
|
4.8
|
|
3.9
|
|
0.7
|
|
4.6
|
|
0.7
|
|
|||||
|
Total construction loans
|
18.5
|
|
8.4
|
|
3.1
|
|
11.5
|
|
1.5
|
|
|||||
|
Residential
|
8.2
|
|
4.1
|
|
2.5
|
|
6.6
|
|
0.3
|
|
|||||
|
Agricultural
|
5.1
|
|
4.5
|
|
0.2
|
|
4.7
|
|
—
|
|
|||||
|
Total real estate loans
|
88.8
|
|
41.4
|
|
27.2
|
|
68.6
|
|
4.6
|
|
|||||
|
Commercial
|
40.3
|
|
13.2
|
|
19.2
|
|
32.4
|
|
9.3
|
|
|||||
|
Agricultural
|
3.7
|
|
3.3
|
|
0.4
|
|
3.7
|
|
0.1
|
|
|||||
|
Total
|
$
|
132.8
|
|
$
|
57.9
|
|
$
|
46.8
|
|
$
|
104.7
|
|
$
|
14.0
|
|
The following tables present the average recorded investment in and income recognized on impaired loans for the periods indicated:
|
Year Ended December 31,
|
||||||||||||||||||||
|
2018
|
2017
|
2016
|
||||||||||||||||||
|
Average Recorded Investment
|
Income Recognized
|
Average Recorded Investment
|
Income Recognized
|
Average Recorded Investment
|
Income Recognized
|
|||||||||||||||
|
Real estate
|
50.0
|
|
0.1
|
|
63.5
|
|
0.3
|
|
69.2
|
|
0.3
|
|
||||||||
|
Commercial
|
21.9
|
|
0.2
|
|
28.1
|
|
0.2
|
|
30.1
|
|
0.3
|
|
||||||||
|
Agricultural
|
2.1
|
|
—
|
|
2.4
|
|
—
|
|
1.8
|
|
—
|
|
||||||||
|
Total
|
$
|
74.0
|
|
$
|
0.3
|
|
$
|
94.0
|
|
$
|
0.5
|
|
$
|
101.1
|
|
$
|
0.6
|
|
||
The amount of interest income recognized by the Company within the period that the loans were impaired was primarily related to loans modified in troubled debt restructurings that remained on accrual status. Interest payments received on non-accrual impaired loans are applied to principal. Interest income is subsequently recognized only to the extent cash payments are received in excess of principal due. If interest on impaired loans had been accrued, interest income on impaired loans during
2018
,
2017
, and
2016
would have been approximately
$3.0 million
,
$3.5 million
and $
4.2 million
, respectively.
Collateral dependent impaired loans are recorded at the fair value less selling costs of the underlying collateral determined using discounted cash flows, independent appraisals and management estimates based upon current market conditions. For loans measured under the present value of cash flows method, the change in present value attributable to the passage of time, if applicable, is recognized in the provision for loan losses and thus no interest income is recognized.
98
FIRST INTERSTATE BANCSYSTEM, INC. AND SUBSIDIARIES
NOTES TO CONSOLIDATED FINANCIAL STATEMENTS
(Dollars in millions, except share and per share data)
Modifications of performing loans are made in the ordinary course of business and are completed on a case-by-case basis as negotiated with the borrower. Loan modifications typically include interest rate changes, interest only periods of less than twelve months, short-term payment deferrals and extension of amortization periods to provide payment relief. A loan modification is considered a troubled debt restructuring if the borrower is experiencing financial difficulties and the Company, for economic or legal reasons, grants a concession to the borrower that it would not otherwise consider. Certain troubled debt restructurings are on non-accrual status at the time of restructuring and may be returned to accrual status after considering the borrower’s sustained repayment performance in accordance with the restructuring agreement for a period of at least six months and management is reasonably assured of future performance. If the troubled debt restructuring meets these performance criteria and the interest rate granted at the modification is equal to or greater than the rate that the Company was willing to accept at the time of the restructuring for a new loan with comparable risk, then the loan will return to performing status and the accrual of interest will resume, although they continue to be individually evaluated for impairment and disclosed as impaired loans.
The Company had loans renegotiated in troubled debt restructurings of
$23.4 million
as of
December 31, 2018
, of which
$17.8 million
were included in non-accrual loans and
$5.6 million
were on accrual status. The Company had loans renegotiated in troubled debt restructurings of
$44.5 million
as of
December 31, 2017
, of which
$31.9 million
were included in non-accrual loans and
$12.6 million
were on accrual status.
The following table presents information on the Company’s troubled debt restructurings that occurred during the periods indicated:
|
Number of Notes
|
Type of Concession
|
Principal Balance at Restructure Date
|
|||||||||||||||||
|
Year Ended December 31, 2018
|
Interest only period
|
Extension of terms or maturity
|
Interest rate adjustment
|
Other
|
|||||||||||||||
|
Commercial real estate
|
3
|
|
$
|
3.6
|
|
$
|
—
|
|
$
|
—
|
|
$
|
—
|
|
$
|
3.6
|
|
||
|
Agriculture real estate
|
1
|
|
—
|
|
—
|
|
—
|
|
0.2
|
|
0.2
|
|
|||||||
|
Consumer
|
1
|
|
—
|
|
—
|
|
—
|
|
0.3
|
|
0.3
|
|
|||||||
|
Total loans restructured
|
5
|
|
$
|
3.6
|
|
$
|
—
|
|
$
|
—
|
|
$
|
0.5
|
|
$
|
4.1
|
|
||
|
Number of Notes
|
Type of Concession
|
Principal Balance at Restructure Date
|
|||||||||||||||||
|
Year Ended December 31, 2017
|
Interest only period
|
Extension of terms or maturity
|
Interest rate adjustment
|
Other
|
|||||||||||||||
|
Commercial real estate
|
5
|
|
$
|
1.5
|
|
$
|
0.4
|
|
$
|
—
|
|
$
|
0.9
|
|
$
|
2.8
|
|
||
|
Agriculture real estate
|
1
|
|
—
|
|
0.8
|
|
—
|
|
—
|
|
0.8
|
|
|||||||
|
Commercial
|
17
|
|
1.2
|
|
2.0
|
|
—
|
|
6.0
|
|
9.2
|
|
|||||||
|
Agriculture
|
1
|
|
—
|
|
0.1
|
|
—
|
|
—
|
|
0.1
|
|
|||||||
|
Total loans restructured
|
24
|
|
$
|
2.7
|
|
$
|
3.3
|
|
$
|
—
|
|
$
|
6.9
|
|
$
|
12.9
|
|
||
|
Number of Notes
|
Type of Concession
|
Principal Balance at Restructure Date
|
|||||||||||||||||
|
Year Ended December 31, 2016
|
Interest only period
|
Extension of terms or maturity
|
Interest rate adjustment
|
Other
|
|||||||||||||||
|
Commercial real estate
|
18
|
|
$
|
0.4
|
|
$
|
5.5
|
|
$
|
0.2
|
|
$
|
1.8
|
|
$
|
7.9
|
|
||
|
Commercial construction
|
1
|
|
—
|
|
3.7
|
|
—
|
|
—
|
|
3.7
|
|
|||||||
|
Residential real estate
|
1
|
|
—
|
|
0.1
|
|
—
|
|
—
|
|
0.1
|
|
|||||||
|
Commercial
|
13
|
|
4.4
|
|
0.4
|
|
—
|
|
3.3
|
|
8.1
|
|
|||||||
|
Agriculture
|
2
|
|
—
|
|
0.3
|
|
—
|
|
—
|
|
0.3
|
|
|||||||
|
Total loans restructured
|
35
|
|
$
|
4.8
|
|
$
|
10.0
|
|
$
|
0.2
|
|
$
|
5.1
|
|
$
|
20.1
|
|
||
99
FIRST INTERSTATE BANCSYSTEM, INC. AND SUBSIDIARIES
NOTES TO CONSOLIDATED FINANCIAL STATEMENTS
(Dollars in millions, except share and per share data)
Other concessions include payment reductions or deferrals for a specified period of time or the extension of amortization schedules. A specific reserve may have been previously recorded for loans modified in troubled debt restructurings that were on non-accrual status or otherwise deemed impaired before the modification. In periods subsequent to modification, the Company continues to evaluate all loans modified in troubled debt restructurings for possible impairment, which is recognized through the allowance for loan losses. Financial effects of modifications may include principal loan forgiveness or other charge-offs directly related to the restructuring. The Company had
no
charge-offs directly related to loans modified in troubled debt restructurings taken at the time of restructuring during
2018
,
2017
, and
2016
.
The Company considers a payment default to occur on loans modified in troubled debt restructurings when the loan is 90 days or more past due or was placed on non-accrual status after the modification. The Company’s loans modified in troubled debt restructurings within the previous 12 months for which there was a payment default during the period were
no
t significant as of
December 31, 2018
and
December 31, 2016
. As of
December 31, 2017
, the Company had one
$1.3 million
commercial loan modified in troubled debt restructurings within the previous 12 months for which there was a payment default during the period. As of
December 31, 2018
,
2017
, and
2016
all of the loans modified in troubled debt restructurings with payment defaults during the previous twelve months were on non-accrual status.
At
December 31, 2018
, there were
no
material commitments to lend additional funds to borrowers whose existing loans have been renegotiated or are classified as non-accrual.
As part of the on-going and continuous monitoring of the credit quality of the Company’s loan portfolio, management tracks internally assigned risk classifications of loans. The Company adheres to a Uniform Classification System developed jointly by the various bank regulatory agencies to internally risk rate loans. The Uniform Classification System defines three broad categories of criticized assets, which the Company uses as credit quality indicators:
Other Assets Especially Mentioned
— includes loans that exhibit weaknesses in financial condition, loan structure or documentation, which if not promptly corrected, may lead to the development of abnormal risk elements.
Substandard
— includes loans that are inadequately protected by the current sound worth and paying capacity of the borrower. Although the primary source of repayment for a Substandard is not currently sufficient, collateral or other sources of repayment are sufficient to satisfy the debt. Continuance of a Substandard loan is not warranted unless positive steps are taken to improve the worthiness of the credit.
Doubtful
— includes loans that exhibit pronounced weaknesses to a point where collection or liquidation in full, on the basis of currently existing facts, conditions and values, is highly questionable and improbable. Doubtful loans are required to be placed on non-accrual status and are assigned specific loss exposure.
100
FIRST INTERSTATE BANCSYSTEM, INC. AND SUBSIDIARIES
NOTES TO CONSOLIDATED FINANCIAL STATEMENTS
(Dollars in millions, except share and per share data)
The following tables present the Company’s recorded investment in criticized loans by class and credit quality indicator based on the most recent analysis performed as of the dates indicated:
|
As of December 31, 2018
|
Other Assets
Especially
Mentioned
|
Substandard
|
Doubtful
|
Total
Criticized
Loans
|
||||||||
|
Real estate:
|
|
|
|
|
||||||||
|
Commercial
|
$
|
102.5
|
|
$
|
87.4
|
|
$
|
2.9
|
|
$
|
192.8
|
|
|
Construction:
|
||||||||||||
|
Land acquisition & development
|
5.0
|
|
7.0
|
|
3.3
|
|
15.3
|
|
||||
|
Residential
|
2.8
|
|
2.0
|
|
0.4
|
|
5.2
|
|
||||
|
Commercial
|
1.7
|
|
3.9
|
|
—
|
|
5.6
|
|
||||
|
Total construction loans
|
9.5
|
|
12.9
|
|
3.7
|
|
26.1
|
|
||||
|
Residential
|
3.0
|
|
10.8
|
|
0.7
|
|
14.5
|
|
||||
|
Agricultural
|
9.0
|
|
24.0
|
|
0.1
|
|
33.1
|
|
||||
|
Total real estate loans
|
124.0
|
|
135.1
|
|
7.4
|
|
266.5
|
|
||||
|
Consumer:
|
||||||||||||
|
Indirect consumer
|
0.7
|
|
2.1
|
|
0.1
|
|
2.9
|
|
||||
|
Direct consumer
|
0.3
|
|
0.8
|
|
0.1
|
|
1.2
|
|
||||
|
Total consumer loans
|
1.0
|
|
2.9
|
|
0.2
|
|
4.1
|
|
||||
|
Commercial
|
39.4
|
|
45.8
|
|
11.8
|
|
97.0
|
|
||||
|
Agricultural
|
14.4
|
|
17.8
|
|
1.5
|
|
33.7
|
|
||||
|
Total
|
$
|
178.8
|
|
$
|
201.6
|
|
$
|
20.9
|
|
$
|
401.3
|
|
|
As of December 31, 2017
|
Other Assets
Especially
Mentioned
|
Substandard
|
Doubtful
|
Total
Criticized
Loans
|
||||||||
|
Real estate:
|
|
|
|
|
||||||||
|
Commercial
|
$
|
78.0
|
|
$
|
96.4
|
|
$
|
10.3
|
|
$
|
184.7
|
|
|
Construction:
|
||||||||||||
|
Land acquisition & development
|
3.2
|
|
16.4
|
|
—
|
|
19.6
|
|
||||
|
Residential
|
2.3
|
|
1.7
|
|
0.5
|
|
4.5
|
|
||||
|
Commercial
|
2.4
|
|
3.6
|
|
3.5
|
|
9.5
|
|
||||
|
Total construction loans
|
7.9
|
|
21.7
|
|
4.0
|
|
33.6
|
|
||||
|
Residential
|
3.9
|
|
12.5
|
|
1.9
|
|
18.3
|
|
||||
|
Agricultural
|
4.3
|
|
19.1
|
|
—
|
|
23.4
|
|
||||
|
Total real estate loans
|
94.1
|
|
149.7
|
|
16.2
|
|
260.0
|
|
||||
|
Consumer:
|
||||||||||||
|
Indirect consumer
|
0.8
|
|
2.2
|
|
0.3
|
|
3.3
|
|
||||
|
Direct consumer
|
0.4
|
|
0.7
|
|
0.2
|
|
1.3
|
|
||||
|
Total consumer loans
|
1.2
|
|
2.9
|
|
0.5
|
|
4.6
|
|
||||
|
Commercial
|
54.7
|
|
56.3
|
|
11.1
|
|
122.1
|
|
||||
|
Agricultural
|
5.1
|
|
8.3
|
|
0.4
|
|
13.8
|
|
||||
|
Total
|
$
|
155.1
|
|
$
|
217.2
|
|
$
|
28.2
|
|
$
|
400.5
|
|
The Company maintains a credit review function, which is independent of the credit approval process, to assess assigned internal risk classifications and monitor compliance with internal lending policies and procedures. Written action plans with firm target dates for resolution of identified problems are maintained and reviewed on a quarterly basis for all categories of criticized loans.
101
FIRST INTERSTATE BANCSYSTEM, INC. AND SUBSIDIARIES
NOTES TO CONSOLIDATED FINANCIAL STATEMENTS
(Dollars in millions, except share and per share data)
|
(6)
|
ALLOWANCE FOR LOAN LOSSES
|
The following tables present a summary of changes in the allowance for loan losses by portfolio segment:
|
Year Ended December 31, 2018
|
Real Estate
|
Consumer
|
Commercial
|
Agriculture
|
Other
|
Total
|
||||||||||||
|
Allowance for loan losses:
|
|
|
|
|
|
|
||||||||||||
|
Beginning balance
|
$
|
31.7
|
|
$
|
8.7
|
|
$
|
30.5
|
|
$
|
1.2
|
|
$
|
—
|
|
$
|
72.1
|
|
|
Provision charged (credited) to operating
expense
|
(0.7
|
)
|
6.8
|
|
1.9
|
|
0.6
|
|
—
|
|
8.6
|
|
||||||
|
Less loans charged-off
|
(3.7
|
)
|
(11.3
|
)
|
(4.7
|
)
|
—
|
|
—
|
|
(19.7
|
)
|
||||||
|
Add back recoveries of loans previously charged-off
|
3.7
|
|
4.5
|
|
3.6
|
|
0.2
|
|
—
|
|
12.0
|
|
||||||
|
Ending balance
|
$
|
31.0
|
|
$
|
8.7
|
|
$
|
31.3
|
|
$
|
2.0
|
|
$
|
—
|
|
$
|
73.0
|
|
|
Individually evaluated for impairment
|
$
|
1.3
|
|
$
|
—
|
|
$
|
5.2
|
|
$
|
0.3
|
|
$
|
—
|
|
$
|
6.8
|
|
|
Collectively evaluated for impairment
|
29.7
|
|
8.7
|
|
26.1
|
|
1.7
|
|
—
|
|
66.2
|
|
||||||
|
Ending balance
|
$
|
31.0
|
|
$
|
8.7
|
|
$
|
31.3
|
|
$
|
2.0
|
|
$
|
—
|
|
$
|
73.0
|
|
|
Total loans:
|
|
|
|
|
|
|
||||||||||||
|
Individually evaluated for impairment
|
$
|
41.8
|
|
$
|
—
|
|
$
|
19.9
|
|
$
|
3.1
|
|
$
|
—
|
|
$
|
64.8
|
|
|
Collectively evaluated for impairment
|
5,791.7
|
|
1,070.2
|
|
1,290.4
|
|
251.7
|
|
1.6
|
|
8,405.6
|
|
||||||
|
Total loans held for investment
|
$
|
5,833.5
|
|
$
|
1,070.2
|
|
$
|
1,310.3
|
|
$
|
254.8
|
|
$
|
1.6
|
|
$
|
8,470.4
|
|
|
Year Ended December 31, 2017
|
Real Estate
|
Consumer
|
Commercial
|
Agriculture
|
Other
|
Total
|
||||||||||||
|
Allowance for loan losses:
|
|
|
|
|
|
|
||||||||||||
|
Beginning balance
|
$
|
28.6
|
|
$
|
7.7
|
|
$
|
38.1
|
|
$
|
1.8
|
|
$
|
—
|
|
$
|
76.2
|
|
|
Provision charged (credited) to operating
expense
|
6.0
|
|
8.1
|
|
(2.9
|
)
|
(0.2
|
)
|
—
|
|
11.0
|
|
||||||
|
Less loans charged-off
|
(4.3
|
)
|
(11.3
|
)
|
(6.8
|
)
|
(0.4
|
)
|
—
|
|
(22.8
|
)
|
||||||
|
Add back recoveries of loans previously charged-off
|
1.4
|
|
4.2
|
|
2.1
|
|
—
|
|
—
|
|
7.7
|
|
||||||
|
Ending balance
|
$
|
31.7
|
|
$
|
8.7
|
|
$
|
30.5
|
|
$
|
1.2
|
|
$
|
—
|
|
$
|
72.1
|
|
|
Individually evaluated for impairment
|
$
|
6.2
|
|
$
|
—
|
|
$
|
4.4
|
|
$
|
0.2
|
|
$
|
—
|
|
$
|
10.8
|
|
|
Collectively evaluated for impairment
|
25.5
|
|
8.7
|
|
26.1
|
|
1.0
|
|
—
|
|
61.3
|
|
||||||
|
Ending balance
|
$
|
31.7
|
|
$
|
8.7
|
|
$
|
30.5
|
|
$
|
1.2
|
|
$
|
—
|
|
$
|
72.1
|
|
|
Total loans:
|
|
|
|
|
|
|
||||||||||||
|
Individually evaluated for impairment
|
$
|
58.3
|
|
$
|
—
|
|
$
|
23.8
|
|
$
|
1.1
|
|
$
|
—
|
|
$
|
83.2
|
|
|
Collectively evaluated for impairment
|
5,118.5
|
|
1,034.4
|
|
1,191.6
|
|
135.1
|
|
4.9
|
|
7,484.5
|
|
||||||
|
Total loans held for investment
|
$
|
5,176.8
|
|
$
|
1,034.4
|
|
$
|
1,215.4
|
|
$
|
136.2
|
|
$
|
4.9
|
|
$
|
7,567.7
|
|
102
FIRST INTERSTATE BANCSYSTEM, INC. AND SUBSIDIARIES
NOTES TO CONSOLIDATED FINANCIAL STATEMENTS
(Dollars in millions, except share and per share data)
|
Year Ended December 31, 2016
|
Real Estate
|
Consumer
|
Commercial
|
Agriculture
|
Other
|
Total
|
||||||||||||
|
Allowance for loan losses:
|
|
|
|
|
|
|
||||||||||||
|
Beginning balance
|
$
|
52.3
|
|
$
|
5.1
|
|
$
|
18.8
|
|
$
|
0.6
|
|
$
|
—
|
|
$
|
76.8
|
|
|
Provision charged (credited) to operating
expense
|
(21.7
|
)
|
8.4
|
|
21.9
|
|
1.4
|
|
—
|
|
10.0
|
|
||||||
|
Less loans charged-off
|
(5.2
|
)
|
(8.6
|
)
|
(5.8
|
)
|
(0.2
|
)
|
—
|
|
(19.8
|
)
|
||||||
|
Add back recoveries of loans previously charged-off
|
3.2
|
|
2.8
|
|
3.2
|
|
—
|
|
—
|
|
9.2
|
|
||||||
|
Ending balance
|
$
|
28.6
|
|
$
|
7.7
|
|
$
|
38.1
|
|
$
|
1.8
|
|
$
|
—
|
|
$
|
76.2
|
|
|
Individually evaluated for impairment
|
$
|
4.6
|
|
$
|
—
|
|
$
|
9.3
|
|
$
|
0.1
|
|
$
|
—
|
|
$
|
14.0
|
|
|
Collectively evaluated for impairment
|
24.0
|
|
7.7
|
|
28.8
|
|
1.7
|
|
—
|
|
62.2
|
|
||||||
|
Ending balance
|
$
|
28.6
|
|
$
|
7.7
|
|
$
|
38.1
|
|
$
|
1.8
|
|
$
|
—
|
|
$
|
76.2
|
|
|
Total loans:
|
|
|
|
|
|
|
||||||||||||
|
Individually evaluated for impairment
|
$
|
68.6
|
|
$
|
—
|
|
$
|
32.4
|
|
$
|
3.7
|
|
$
|
—
|
|
$
|
104.7
|
|
|
Collectively evaluated for impairment
|
3,445.4
|
|
970.3
|
|
765.5
|
|
129.2
|
|
1.6
|
|
5,312.0
|
|
||||||
|
Total loans held for investment
|
$
|
3,514.0
|
|
$
|
970.3
|
|
$
|
797.9
|
|
$
|
132.9
|
|
$
|
1.6
|
|
$
|
5,416.7
|
|
The Company performs a quarterly assessment of the adequacy of its allowance for loan losses in accordance with GAAP. The methodology used to assess the adequacy is consistently applied to the Company’s loan portfolio and consists of three elements: (1) specific valuation allowances based on probable losses on impaired loans; (2) historical valuation allowances based on loan loss experience for similar loans with similar characteristics and trends; and (3) general valuation allowances determined based on changes in the nature of the loan portfolio, overall portfolio quality, industry concentrations, delinquency trends, general economic conditions and other qualitative risk factors both internal and external to the Company.
Specific allowances are established for loans where management has determined that probability of a loss exists by analyzing the borrower’s ability to repay amounts owed, collateral deficiencies and any relevant qualitative or economic factors impacting the loan. Historical valuation allowances are determined by applying percentage loss factors to the credit exposures from outstanding loans. For commercial, agricultural and real estate loans, loss factors are applied based on the internal risk classifications of these loans. For consumer loans, loss factors are applied on a portfolio basis. For commercial, agriculture and real estate loans, loss factor percentages are based on a migration analysis of our historical loss experience, designed to account for credit deterioration. For consumer loans, the loss factor percentages are based on a three-year loss history for the 2018 period and on a one-year loss history for the comparable periods. The loan loss rates for 2018 also incorporate the available loss history data from BOTC prior to the merger date to represent a consolidated institutional loss rate for both originated and acquired portfolios. General valuation allowances are determined by evaluating, on a quarterly basis, changes in the nature and volume of the loan portfolio, overall portfolio quality, industry concentrations, current economic and regulatory conditions and the estimated impact of these factors on historical loss rates.
An allowance for loan losses is established for loans acquired deemed credit impaired and for which the Company projects a decrease in the expected cash flows in periods subsequent to the acquisition of such loans. As of
December 31, 2018
and
2017
, the Company’s allowance for loan losses included
$0.8 million
and
$1.0 million
, respectively, related to loans acquired credit impaired.
103
FIRST INTERSTATE BANCSYSTEM, INC. AND SUBSIDIARIES
NOTES TO CONSOLIDATED FINANCIAL STATEMENTS
(Dollars in millions, except share and per share data)
|
(7)
|
PREMISES AND EQUIPMENT
|
Premises and equipment and related accumulated depreciation are as follows:
|
December 31,
|
2018
|
2017
|
|||||
|
Land
|
$
|
49.9
|
|
$
|
49.4
|
|
|
|
Buildings and improvements
|
268.1
|
|
257.1
|
|
|||
|
Furniture and equipment
|
104.0
|
|
97.7
|
|
|||
|
Total premises and equipment
|
422.0
|
|
404.2
|
|
|||
|
Less accumulated depreciation
|
(176.8
|
)
|
(162.3
|
)
|
|||
|
Premises and equipment, net
|
$
|
245.2
|
|
$
|
241.9
|
|
|
The Parent Company and a FIB branch office lease premises from an affiliated entity. See Note 17—Commitments and Contingencies.
|
(8)
|
COMPANY-OWNED LIFE INSURANCE
|
Company-owned life insurance consists of the following:
|
December 31,
|
2018
|
2017
|
|||||
|
Key executive, principal shareholder
|
$
|
4.7
|
|
$
|
4.2
|
|
|
|
Key executive split dollar
|
9.4
|
|
4.9
|
|
|||
|
Group life
|
261.0
|
|
251.5
|
|
|||
|
Total
|
$
|
275.1
|
|
$
|
260.6
|
|
|
The Company maintains key executive life insurance policies on certain principal shareholders. Under these policies, the Company receives benefits payable upon the death of the insured. The net cash surrender value of key executive, principal shareholder insurance policies was
$4.7 million
and
$4.2 million
at
December 31, 2018
and
2017
, respectively.
The Company also has life insurance policies covering selected other key officers. The net cash surrender value of these policies was
$9.4 million
and
$4.9 million
at
December 31, 2018
and
2017
, respectively. Under these policies, the Company receives benefits payable upon death of the insured. An endorsement split dollar agreement has been executed with the selected key officers whereby a portion of the policy death benefit is payable to their designated beneficiaries. The endorsement split dollar agreement will provide post-retirement coverage for those selected key officers meeting specified retirement qualifications. The Company expenses the earned portion of the post-employment benefit through the vesting period.
The Company has group life insurance policies covering selected officers of FIB. The net cash surrender value of these policies was
$261.0 million
and
$251.5 million
at
December 31, 2018
and
2017
, respectively. Under these policies, the Company receives benefits payable upon death of the insured. The Company has entered into either an endorsement split dollar agreement or a survivor income benefit agreement with each insured officer. Under the endorsement split dollar agreements, a portion of the policy death benefit is payable to the insured’s designated beneficiary if the insured is employed by the Company at the time of death. Under the survivor income benefit agreements, the Company makes a lump-sum payment to the insured’s designated beneficiary if the insured is employed by the Company at the time of death.
104
FIRST INTERSTATE BANCSYSTEM, INC. AND SUBSIDIARIES
NOTES TO CONSOLIDATED FINANCIAL STATEMENTS
(Dollars in millions, except share and per share data)
|
(9)
|
OTHER REAL ESTATE OWNED
|
Information with respect to the Company’s other real estate owned follows:
|
Year Ended December 31,
|
2018
|
2017
|
2016
|
||||||||
|
Balance at beginning of year
|
$
|
10.1
|
|
$
|
10.0
|
|
$
|
6.3
|
|
||
|
Acquisitions
|
0.6
|
|
1.2
|
|
1.1
|
|
|||||
|
Additions
|
12.1
|
|
5.4
|
|
7.6
|
|
|||||
|
Valuation adjustments
|
(0.1
|
)
|
(0.4
|
)
|
(0.6
|
)
|
|||||
|
Dispositions
|
(8.3
|
)
|
(6.1
|
)
|
(4.4
|
)
|
|||||
|
Balance at end of year
|
$
|
14.4
|
|
$
|
10.1
|
|
$
|
10.0
|
|
||
Write-downs of
$0.1 million
during
2018
were adjustments based on other sources, including management estimates of the current fair value of properties. Write-downs of
$0.4 million
and
$0.6 million
during
2017
and
2016
, respectively, were adjustments based on other sources, including management estimates of the current fair value of properties and adjustments directly related to receipt of updated appraisals.
|
(10)
|
DERIVATIVES AND HEDGING ACTIVITIES
|
The notional amounts and estimated fair values of the Company’s derivatives are presented in the following table. Fair value estimates are obtained from third parties and are based on pricing models.
|
December 31, 2018
|
December 31, 2017
|
||||||||||||
|
Notional Amount
|
Estimated
Fair Value
|
Notional Amount
|
Estimated
Fair Value
|
||||||||||
|
Derivative Assets (included in other assets on the consolidated balance sheets)
|
|||||||||||||
|
Non-hedging interest rate derivatives:
|
|||||||||||||
|
Interest rate swap contracts
|
$
|
403.3
|
|
$
|
8.8
|
|
$
|
344.2
|
|
$
|
7.5
|
|
|
|
Interest rate lock commitments
|
51.0
|
|
1.3
|
|
60.7
|
|
1.3
|
|
|||||
|
Total derivative assets
|
$
|
454.3
|
|
$
|
10.1
|
|
$
|
404.9
|
|
$
|
8.8
|
|
|
|
Derivative Liabilities (included in accounts payable and accrued expenses on the consolidated balance sheets)
|
|||||||||||||
|
Non-hedging interest rate derivatives:
|
|||||||||||||
|
Interest rate swap contracts
|
$
|
403.3
|
|
$
|
8.8
|
|
$
|
344.2
|
|
$
|
7.8
|
|
|
|
Forward loan sales contracts
|
64.6
|
|
0.6
|
|
88.8
|
|
0.1
|
|
|||||
|
Total derivative liabilities
|
$
|
467.9
|
|
$
|
9.4
|
|
$
|
433.0
|
|
$
|
7.9
|
|
|
On September 6, 2017, the Company paid
$1.1 million
to terminate an existing interest rate swap contract designated as a cash flow hedge, originally entered into on September 22, 2015, with a notional amount of
$100 million
. Under the terms of the interest rate swap contract, the Company would have paid a fixed interest rate of
1.94%
and the counterparty would have paid to the Company a variable interest rate equal to the three-month LIBOR. As the contract was terminated prior to the effective date of September 15, 2017, no cash was exchanged outside of the termination payment.
The effective portion of changes in the fair value of derivatives designated and that qualify as cash flow hedges is recorded in Accumulated Other Comprehensive Income and is subsequently reclassified into earnings in the period that the hedged forecasted transaction affects earnings. The ineffective portion of the change in fair value of the derivatives is recognized directly in earnings. The Company did
not
record any hedge ineffectiveness at
December 31, 2018
and
2017
.
105
FIRST INTERSTATE BANCSYSTEM, INC. AND SUBSIDIARIES
NOTES TO CONSOLIDATED FINANCIAL STATEMENTS
(Dollars in millions, except share and per share data)
Derivative assets and liabilities are recorded at fair value on the balance sheet and do not take into account the effects of master netting arrangements. Master netting arrangements allow the Company to settle all contracts held with a single counterparty on a net basis and to offset net contract position with related collateral where applicable.
The following table illustrates the potential effect of the Company’s master netting arrangements, by type of financial instrument, on the Company’s consolidated balance sheets as of
December 31, 2018
and
December 31, 2017
:
|
December 31, 2018
|
|||||||||||||||||||||||
|
Gross Amounts Recognized
|
Gross Amounts Offset in the Balance Sheet
|
Net Amounts in the Balance Sheet
|
Financial Instruments
|
Fair Value of Financial Collateral in the Balance Sheet
|
Net Amount
|
||||||||||||||||||
|
Financial Assets
|
|||||||||||||||||||||||
|
Interest rate swap contracts
|
$
|
8.8
|
|
$
|
—
|
|
$
|
8.8
|
|
$
|
2.7
|
|
$
|
2.4
|
|
$
|
3.7
|
|
|||||
|
Mortgage related derivatives
|
1.3
|
|
—
|
|
1.3
|
|
—
|
|
—
|
|
1.3
|
|
|||||||||||
|
Total derivatives
|
10.1
|
|
—
|
|
10.1
|
|
2.7
|
|
2.4
|
|
5.0
|
|
|||||||||||
|
Total assets
|
$
|
10.1
|
|
$
|
—
|
|
$
|
10.1
|
|
$
|
2.7
|
|
$
|
2.4
|
|
$
|
5.0
|
|
|||||
|
Financial Liabilities
|
|||||||||||||||||||||||
|
Interest rate swap contracts
|
$
|
8.8
|
|
$
|
—
|
|
$
|
8.8
|
|
$
|
2.7
|
|
$
|
4.1
|
|
$
|
2.0
|
|
|||||
|
Mortgage related derivatives
|
0.6
|
|
—
|
|
0.6
|
|
—
|
|
—
|
|
0.6
|
|
|||||||||||
|
Total derivatives
|
9.4
|
|
—
|
|
9.4
|
|
2.7
|
|
4.1
|
|
2.6
|
|
|||||||||||
|
Repurchase agreements
|
712.4
|
|
—
|
|
712.4
|
|
—
|
|
712.4
|
|
—
|
|
|||||||||||
|
Total liabilities
|
$
|
721.8
|
|
$
|
—
|
|
$
|
721.8
|
|
$
|
2.7
|
|
$
|
716.5
|
|
$
|
2.6
|
|
|||||
|
December 31, 2017
|
|||||||||||||||||||||||
|
Gross Amounts Recognized
|
Gross Amounts Offset in the Balance Sheet
|
Net Amounts in the Balance Sheet
|
Financial Instruments
|
Fair Value of Financial Collateral in the Balance Sheet
|
Net Amount
|
||||||||||||||||||
|
Financial Assets
|
|||||||||||||||||||||||
|
Interest rate swap contracts
|
$
|
7.5
|
|
$
|
—
|
|
$
|
7.5
|
|
$
|
2.4
|
|
$
|
—
|
|
$
|
5.1
|
|
|||||
|
Mortgage related derivatives
|
1.3
|
|
—
|
|
1.3
|
|
—
|
|
—
|
|
1.3
|
|
|||||||||||
|
Total derivatives
|
8.8
|
|
—
|
|
8.8
|
|
2.4
|
|
—
|
|
6.4
|
|
|||||||||||
|
Total assets
|
$
|
8.8
|
|
$
|
—
|
|
$
|
8.8
|
|
$
|
2.4
|
|
$
|
—
|
|
$
|
6.4
|
|
|||||
|
Financial Liabilities
|
|||||||||||||||||||||||
|
Interest rate swap contracts
|
$
|
7.8
|
|
$
|
—
|
|
$
|
7.8
|
|
$
|
2.4
|
|
$
|
3.3
|
|
$
|
2.1
|
|
|||||
|
Mortgage related derivatives
|
0.1
|
|
—
|
|
0.1
|
|
—
|
|
—
|
|
0.1
|
|
|||||||||||
|
Total derivatives
|
7.9
|
|
—
|
|
7.9
|
|
2.4
|
|
3.3
|
|
2.2
|
|
|||||||||||
|
Repurchase agreements
|
643.0
|
|
—
|
|
643.0
|
|
—
|
|
643.0
|
|
—
|
|
|||||||||||
|
Total liabilities
|
$
|
650.9
|
|
$
|
—
|
|
$
|
650.9
|
|
$
|
2.4
|
|
$
|
646.3
|
|
$
|
2.2
|
|
|||||
106
FIRST INTERSTATE BANCSYSTEM, INC. AND SUBSIDIARIES
NOTES TO CONSOLIDATED FINANCIAL STATEMENTS
(Dollars in millions, except share and per share data)
The following table presents the pre-tax gains or losses related to derivative contracts that were recorded in accumulated other comprehensive income and other non-interest income in the Company’s statements of income:
|
As of or For The Year Ended December 31,
|
2018
|
2017
|
2016
|
||||||||
|
Derivatives designated as hedges:
|
|||||||||||
|
Amount of loss recognized in other comprehensive income (effective portion)
|
$
|
—
|
|
$
|
(1.1
|
)
|
$
|
(0.2
|
)
|
||
|
Reclassification adjustment for derivative net (gains) losses included in income
|
—
|
|
1.1
|
|
—
|
|
|||||
|
Non-hedging interest rate derivatives:
|
|||||||||||
|
Amount of gain (loss) recognized in other non-interest income
|
0.3
|
|
—
|
|
0.1
|
|
|||||
|
Amount of net fee income recognized in other non-interest income
|
1.3
|
|
0.8
|
|
0.9
|
|
|||||
|
Amount of net gains (losses) recognized in mortgage banking revenues
|
(0.5
|
)
|
(1.7
|
)
|
1.4
|
|
|||||
|
(11)
|
MORTGAGE SERVICING RIGHTS
|
Information with respect to the Company’s mortgage servicing rights follows:
|
Year Ended December 31,
|
2018
|
2017
|
2016
|
||||||||
|
Balance at beginning of year
|
$
|
24.8
|
|
$
|
18.7
|
|
$
|
15.9
|
|
||
|
Acquisitions of mortgage servicing rights
|
—
|
|
3.5
|
|
—
|
|
|||||
|
Originations of mortgage servicing rights
|
6.0
|
|
5.6
|
|
5.8
|
|
|||||
|
Amortization expense
|
(3.1
|
)
|
(3.0
|
)
|
(3.0
|
)
|
|||||
|
Balance at end of year
|
27.7
|
|
24.8
|
|
18.7
|
|
|||||
|
Less valuation reserve
|
—
|
|
—
|
|
(0.2
|
)
|
|||||
|
Balance at end of year, net of valuation reserve
|
$
|
27.7
|
|
$
|
24.8
|
|
$
|
18.5
|
|
||
|
Principal balance of serviced loans underlying mortgage servicing rights
|
$
|
3,698.2
|
|
$
|
3,636.7
|
|
$
|
3,127.5
|
|
||
|
Mortgage servicing rights as a percentage of serviced loans
|
0.75
|
%
|
0.68
|
%
|
0.59
|
%
|
|||||
At
December 31, 2018
, the estimated fair value and weighted average remaining life of the Company’s mortgage servicing rights were
$42.4 million
and
8.0
years, respectively. The fair value of mortgage servicing rights was determined using discount rates ranging from
10.4%
to
12.1%
and monthly prepayment speeds ranging from
0.4%
to
1.5%
depending upon the risk characteristics of the underlying loans. At
December 31, 2017
, the estimated fair value and weighted average remaining life of the Company’s mortgage servicing rights were
$40.1 million
and
7.3
years, respectively. The fair value of mortgage servicing rights was determined using discount rates ranging from
9.5%
to
11.3%
and monthly prepayment speeds ranging from
0.5%
to
1.8%
depending upon the risk characteristics of the underlying loans. There were
no
material impairments reversed in
2018
,
2017
and
2016
, respectively.
No
permanent impairment was recorded in
2018
,
2017
or
2016
.
107
FIRST INTERSTATE BANCSYSTEM, INC. AND SUBSIDIARIES
NOTES TO CONSOLIDATED FINANCIAL STATEMENTS
(Dollars in millions, except share and per share data)
|
(12)
|
DEPOSITS
|
Deposits are summarized as follows:
|
December 31,
|
2018
|
2017
|
|||||
|
Non-interest bearing demand
|
$
|
3,158.3
|
|
$
|
2,900.0
|
|
|
|
Interest bearing:
|
|||||||
|
Demand
|
2,957.5
|
|
2,787.5
|
|
|||
|
Savings
|
3,247.9
|
|
3,095.4
|
|
|||
|
Time, $100 and over
|
547.6
|
|
432.0
|
|
|||
|
Time, other
|
769.4
|
|
720.0
|
|
|||
|
Total interest bearing
|
7,522.4
|
|
7,034.9
|
|
|||
|
Total deposits
|
$
|
10,680.7
|
|
$
|
9,934.9
|
|
|
Other time deposits include
$24.1 million
and
zero
brokered deposits as of
December 31, 2018
and
2017
, respectively, and deposits obtained through the Company’s participation in the Certificate of Deposit Account Registry Service (“CDARS”). CDARS deposits totaled
$87.1 million
and
$94.2 million
as of
December 31, 2018
and
2017
, respectively.
As of
December 31, 2018
and
2017
, the Company had time deposits of
$221.0 million
and
$182.0 million
, respectively, that met or exceeded the FDIC insurance limit of
$250,000
.
Maturities of time deposits at
December 31, 2018
are as follows:
|
Time, $100
and Over
|
Total Time
|
||||||
|
Due within 3 months or less
|
$
|
45.0
|
|
$
|
253.8
|
|
|
|
Due after 3 months and within 6 months
|
49.0
|
|
149.2
|
|
|||
|
Due after 6 months and within 12 months
|
217.5
|
|
420.4
|
|
|||
|
Due within 2020
|
159.7
|
|
323.7
|
|
|||
|
Due within 2021
|
63.5
|
|
128.8
|
|
|||
|
Due within 2022
|
9.8
|
|
30.3
|
|
|||
|
Due within 2023 and thereafter
|
3.1
|
|
10.8
|
|
|||
|
Total
|
$
|
547.6
|
|
$
|
1,317.0
|
|
|
Interest expense on time deposits of $100 and over was
$7.0 million
,
$4.3 million
and
$3.7 million
for the years ended
December 31, 2018
,
2017
and
2016
, respectively.
108
FIRST INTERSTATE BANCSYSTEM, INC. AND SUBSIDIARIES
NOTES TO CONSOLIDATED FINANCIAL STATEMENTS
(Dollars in millions, except share and per share data)
|
(13)
|
LONG-TERM DEBT AND OTHER BORROWED FUNDS
|
A summary of long-term debt follows:
|
December 31,
|
2018
|
2017
|
|||||
|
Subsidiaries:
|
|
|
|||||
|
8.00% capital lease obligation with term ending October 25, 2029
|
1.3
|
|
1.4
|
|
|||
|
6.24% note payable maturing September 6, 2032, principal due at maturity, interest payable monthly
|
1.8
|
|
1.6
|
|
|||
|
2.28% note payable maturing July 29, 2022, principal due at maturity, interest payable monthly
|
5.0
|
|
5.0
|
|
|||
|
1.00% note payable maturing December 31, 2041, interest only payable quarterly until December 31, 2025 and then principal and interest until maturity
|
5.1
|
|
5.1
|
|
|||
|
Note payable maturing March 31, 2038, interest only payable at 1.30% monthly until March 31, 2025 and then principal and interest at 3.25% until maturity
|
2.0
|
|
—
|
|
|||
|
1.30% note payable maturing June 1, 2034, interest only payable monthly until March 31, 2025 and then principal and interest until maturity
|
0.6
|
|
—
|
|
|||
|
Total long-term debt
|
$
|
15.8
|
|
$
|
13.1
|
|
|
|
Maturities of long-term debt at December 31, 2018 are as follows:
|
|||||
|
2019
|
$
|
0.1
|
|
||
|
2020
|
0.1
|
|
|||
|
2021
|
0.1
|
|
|||
|
2022
|
5.1
|
|
|||
|
2023
|
0.1
|
|
|||
|
Thereafter
|
10.3
|
|
|||
|
Total
|
$
|
15.8
|
|
||
The Company has available lines of credit with the FHLB of approximately
$1,399.0 million
, subject to collateral availability. As of
December 31, 2018
and
2017
, there were
no
long or short-term advances outstanding with the FHLB.
The Company has a capital lease obligation on a banking office. Assets acquired under capital lease, consisting solely of a building and leasehold improvements, are included in premises and equipment and are subject to depreciation.
The Company borrowed or assumed through acquisitions
$14.4 million
and
$11.7 million
as of
December 31, 2018
and
2017
, respectively, related to New Market Tax Credits. The long-term debt obligations consists of fixed rate note payables with various interest rates from
1.00%
to
6.24%
and maturities from
July 29, 2022
through
March 31, 2038
, collateralized by the Company’s equity interest in various CDEs, which are
99.9%
owned by the Company.
The Company had
no
material other borrowed funds as of
December 31, 2018
. As of
December 31, 2017
, the Company had other borrowed funds of
$20.0 million
, primarily consisting of a fixed rate subordinated term loan which was redeemed during the first quarter of 2018.
The Company has federal funds lines of credit with third parties amounting to
$205.0 million
, subject to funds availability. These lines are subject to cancellation without notice. The Company also has a line of credit with the Federal Reserve Bank for borrowings up to
$461.7 million
secured by a blanket pledge of indirect consumer loans, and has an unused
$50.0 million
revolving line of credit with U.S. Bank National Association.
109
FIRST INTERSTATE BANCSYSTEM, INC. AND SUBSIDIARIES
NOTES TO CONSOLIDATED FINANCIAL STATEMENTS
(Dollars in millions, except share and per share data)
|
(14)
|
SUBORDINATED DEBENTURES HELD BY SUBSIDIARY TRUSTS
|
The Company sponsors
seven
wholly-owned business trusts, Trust I, Trust II, Trust III, Trust IV, Trust V, Trust VI, and Trust VII (collectively, the “Trusts”). The Trusts were formed for the exclusive purpose of issuing an aggregate of
$84.3 million
of
30
-year floating rate mandatorily redeemable capital trust preferred securities (“Trust Preferred Securities”) to third-party investors. The Trusts also issued, in aggregate,
$2.6 million
of common equity securities to the Parent Company. Proceeds from the issuance of the Trust Preferred Securities and common equity securities were invested in
30
-year junior subordinated deferrable interest debentures (“Subordinated Debentures”) issued by the Parent Company.
A summary of Subordinated Debenture issuances follows:
|
Principal Amount Outstanding
as of December 31,
|
||||||||||
|
Issuance
|
Maturity Date
|
2018
|
2017
|
|||||||
|
October 2007
|
January 1, 2038
|
$
|
10.3
|
|
$
|
10.3
|
|
|||
|
November 2007
|
December 15, 2037
|
15.5
|
|
15.5
|
|
|||||
|
December 2007
|
December 15, 2037
|
20.6
|
|
20.6
|
|
|||||
|
December 2007
|
April 1, 2038
|
15.5
|
|
15.5
|
|
|||||
|
January 2008
|
April 1, 2038
|
10.3
|
|
10.3
|
|
|||||
|
January 2008
|
April 1, 2038
|
10.3
|
|
10.3
|
|
|||||
|
June 2005
|
June 30, 2035
|
4.4
|
|
—
|
|
|||||
|
Total subordinated debentures held by subsidiary trusts
|
$
|
86.9
|
|
$
|
82.5
|
|
||||
In
October 2007
, the Company issued
$10.3 million
of Subordinated Debentures to Trust II. The Subordinated Debentures bear a cumulative floating interest rate equal to LIBOR plus
2.25%
per annum. As of
December 31, 2018
, the interest rate on the Subordinated Debentures was
5.05%
.
In
November 2007
, the Company issued
$15.5 million
of Subordinated Debentures to Trust I. The Subordinated Debentures bore interest at a fixed rate of
7.50%
for five years after issuance until December 16, 2012, and thereafter at a variable rate equal to LIBOR plus
2.75%
per annum. As of
December 31, 2018
, the interest rate on the Subordinated Debentures was
5.54%
.
In
December 2007
, the Company issued
$20.6 million
of Subordinated Debentures to Trust III. The Subordinated Debentures bore interest at a fixed rate of
6.88%
for five years after issuance until December 15, 2012, and thereafter at a variable rate equal to LIBOR plus
2.40%
per annum. As of
December 31, 2018
, the interest rate on the Subordinated Debentures was
5.19%
.
In
December 2007
, the Company issued
$15.5 million
of Subordinated Debentures to Trust IV. The Subordinated Debentures bear a cumulative floating interest rate equal to LIBOR plus
2.70%
per annum. As of
December 31, 2018
the interest rate on the Subordinated Debentures was
5.50%
.
In
January 2008
, the Company issued
$10.3 million
of Subordinated Debentures to Trust V. The Subordinated Debentures bore interest at a fixed rate of
6.78%
for five years after issuance until April 1, 2013, and thereafter at a variable rate equal to LIBOR plus
2.75%
per annum. As of
December 31, 2018
the interest rate on the Subordinated Debentures was
5.55%
.
In
January 2008
, the Company issued
$10.3 million
of Subordinated Debentures to Trust VI. The Subordinated Debentures bear a cumulative floating interest rate equal to LIBOR plus
2.75%
per annum. As of
December 31, 2018
, the interest rate on the Subordinated Debentures was
5.55%
.
110
FIRST INTERSTATE BANCSYSTEM, INC. AND SUBSIDIARIES
NOTES TO CONSOLIDATED FINANCIAL STATEMENTS
(Dollars in millions, except share and per share data)
In conjunction with the acquisition of Northwest in August 2018, the Company acquired Northwest Bancorporation Capital Trust I (“Trust VII”). The Northwest Trust was formed for the exclusive purpose of issuing an aggregate of
$5.0 million
of 30-year floating rate mandatorily redeemable capital trust preferred securities (“Northwest Trust Preferred Securities”) to third-party investors. The Trusts also issued, in aggregate,
$0.2 million
of common equity securities to Northwest. Proceeds from the issuance of the Trust Preferred Securities and common equity securities were invested in 30-year junior subordinated deferrable interest debentures (“Northwest Subordinated Debentures”) issued by Northwest. The Subordinated Debentures bore interest at a fixed rate of
5.95%
for five years after issuance until June 30, 2010, and thereafter at a variable rate equal to LIBOR plus
1.70%
per annum. As of
December 31, 2018
the interest rate on the Subordinated Debentures was
4.50%
.
The Subordinated Debentures are unsecured with interest distributions payable quarterly. The Company may defer the payment of interest at any time provided that the deferral period does not extend past the stated maturity. During any such deferral period, distributions on the Trust Preferred Securities will also be deferred and the Company’s ability to pay dividends on its common and preferred shares is restricted. The Subordinated Debentures may be redeemed, subject to approval by the Federal Reserve Bank, at the Company’s option on or after five years from the date of issue, or at any time in the event of unfavorable changes in laws or regulations. Debt issuance costs consisting primarily of underwriting discounts and professional fees were capitalized and are being amortized through maturity to interest expense using the straight-line method, which approximates level yield.
The terms of the Trust Preferred Securities are identical to those of the Subordinated Debentures. The Trust Preferred Securities are subject to mandatory redemption upon repayment of the Subordinated Debentures at their stated maturity dates or earlier redemption in an amount equal to their liquidation amount plus accumulated and unpaid distributions to the date of redemption. The Company guarantees the payment of distributions and payments for redemption or liquidation of the Trust Preferred Securities to the extent of funds held by the Trusts.
Subject to certain limitations, the Trust Preferred Securities qualify as tier 1 capital of the Parent Company under the Federal Reserve Board’s capital adequacy guidelines. Proceeds from the issuance of the Trust Preferred Securities were used to fund acquisitions.
|
(15)
|
CAPITAL STOCK AND DIVIDEND RESTRICTIONS
|
The Company’s authorized common stock consists of
200,000,000
shares, of which,
100,000,000
shares are designated as Class A common stock and
100,000,000
are designated as Class B common stock. The Class A common stock has
one
vote per share. The Class B common stock has
five
votes per share and is convertible to Class A common stock on a share-for-share basis at any time.
The Company had
38,169,575
shares of Class A common stock and
22,453,672
shares of Class B common stock outstanding as of
December 31, 2018
. The Company had
33,560,202
shares of Class A common stock and
22,905,357
shares of Class B common stock outstanding as of
December 31, 2017
.
During
2018
, the Company issued
11,389
shares of its Class A common stock with an aggregate value of
$0.5 million
to directors for their service on the Company’s board of directors during
2018
. During
2017
, the Company issued
14,926
shares of its Class A common stock with an aggregate value of
$0.5 million
to directors for their service on the Company’s board of directors during
2017
. The aggregate value of the shares issued to directors of is included in stock-based compensation expense in the accompanying consolidated statements of changes in stockholders’ equity.
During
2018
and
2017
, the Company did
no
t repurchase any shares of its Class A common stock other than stock repurchases which were redemptions of vested restricted shares tendered in lieu of cash for payment of income tax withholding amounts by participants in the Company’s equity compensation plans.
On November 28, 2018, we filed a registration statement on Form S-4, as amended on January 16, 2019, to register
492,069
shares of Class A common stock to be issued as consideration for our acquisition of CMYF.
On November 28, 2018, we filed a registration statement on Form S-4, as amended on January 16, 2019, to register
4,045,302
shares of Class A common stock to be issued as consideration for our acquisition of IIBK.
111
FIRST INTERSTATE BANCSYSTEM, INC. AND SUBSIDIARIES
NOTES TO CONSOLIDATED FINANCIAL STATEMENTS
(Dollars in millions, except share and per share data)
On June 8, 2018, we filed a registration statement on Form S-4, as amended on July 2, 2018 with registration statement on Form S-4/A, to register
3,982,842
shares of Class A common stock to be issued as consideration for our acquisition of Northwest.
On
August 16, 2018
, the Company issued
3,837,540
shares of its Class A common stock with an aggregate value of
$173.3 million
as consideration for the acquisition of Northwest.
On September 25, 2017, the Company filed a shelf registration statement on Form S-3, which was subsequently declared effective by the SEC. The registration statement permits us to offer and sell up to $
250.0
million of our Class A common shares in one or more future public offerings. At the present time, we have no specific plans to offer any of the securities covered by the registration statement.
The payment of dividends by subsidiary banks is subject to various federal and state regulatory limitations. In general, a bank is limited, without the prior consent of its regulators, to paying dividends that do not exceed current year net profits together with retained earnings from the two preceding calendar years. The Company’s debt instruments also include limitations on the payment of dividends.
|
(16)
|
EARNINGS PER COMMON SHARE
|
Basic earnings per common share is calculated by dividing net income by the weighted average number of common shares outstanding during the period presented, excluding unvested restricted stock. Diluted earnings per share is calculated by dividing net income by the weighted average number of common shares determined for the basic earnings per share computation plus the dilutive effects of stock-based compensation using the treasury stock method.
The following table sets forth the computation of basic and diluted earnings per common share:
|
Year Ended December 31,
|
2018
|
2017
|
2016
|
||||||||
|
Net income, basic and diluted
|
$
|
160.2
|
|
$
|
106.5
|
|
$
|
95.7
|
|
||
|
Weighted average common shares outstanding for basic earnings per share computation
|
57,778,857
|
|
51,429,366
|
|
44,511,774
|
|
|||||
|
Dilutive effects of stock-based compensation
|
438,266
|
|
473,843
|
|
398,622
|
|
|||||
|
Weighted average common shares outstanding for diluted earnings per common share computation
|
58,217,123
|
|
51,903,209
|
|
44,910,396
|
|
|||||
|
Basic earnings per common share
|
$
|
2.77
|
|
$
|
2.07
|
|
$
|
2.15
|
|
||
|
Diluted earnings per common share
|
2.75
|
|
2.05
|
|
2.13
|
|
|||||
The Company had
448
,
83,635
and
7,215
unvested time restricted stock outstanding as of
December 31, 2018
,
2017
, and
2016
respectively, that were not included in the computation of diluted earnings per common share because their effect would be anti-dilutive. The Company had
83,475
,
113,874
and
155,637
shares of unvested restricted stock as of
December 31, 2018
,
2017
, and
2016
, respectively, that were not included in the computation of diluted earnings per common share because performance conditions for vesting had not been met.
|
(17)
|
REGULATORY CAPITAL
|
The Company and the Bank are subject to various regulatory capital requirements administered by federal banking regulators and the Federal Reserve. Failure to meet minimum capital requirements can initiate certain mandatory and possibly additional discretionary actions by regulators that, if undertaken, could have a direct material effect on the Company’s and the Bank’s financial statements. Under capital adequacy guidelines and the regulatory framework for prompt corrective action, the Company and the Bank must meet specific capital guidelines that involve quantitative measures of the Company’s and Bank’s assets, liabilities and certain off-balance sheet items as calculated under regulatory accounting practices. The Parent Company, like all bank holding companies, is not subject to the prompt corrective action provisions. The Company’s and the Bank’s capital amounts and classification are also subject to qualitative judgments by the regulators about components, risk weightings and other factors.
112
FIRST INTERSTATE BANCSYSTEM, INC. AND SUBSIDIARIES
NOTES TO CONSOLIDATED FINANCIAL STATEMENTS
(Dollars in millions, except share and per share data)
Quantitative measures established by regulation to ensure capital adequacy require the Company to maintain minimum amounts and ratios of total and tier 1 capital to risk-weighted assets, and of tier 1 capital to average assets, as defined in the regulations. As of
December 31, 2018
, the Company exceeded all capital adequacy requirements to which it is subject.
As of
December 31, 2018
, the most recent notification from the regulatory agencies categorized the Bank as well capitalized under the regulatory framework for prompt corrective action. To be categorized as well-capitalized, the institution must maintain minimum total risk-based, Tier 1 risk-based, and Tier 1 leverage ratios as set forth in the following table. There are no conditions or events since the most recent notification that management believes have changed the Bank's categories.
As an approved mortgage seller, the Bank is required to maintain a minimum level of capital specified by the United States Department of Housing and Urban Development. At
December 31, 2018
and
2017
, the Bank met these requirements.
The Company’s actual capital amounts and ratios and selected minimum regulatory thresholds and prompt corrective action provisions as of
December 31, 2018
and
2017
are presented in the following tables:
|
|
Actual
|
Adequately Capitalized
Basel III
Phase-In Schedule
|
Adequately Capitalized
Basel III
Fully Phased-In
|
Well Capitalized (1)
|
|||||||||||||||||||
|
|
Amount
|
Ratio
|
Amount
|
Ratio
|
Amount
|
Ratio
|
Amount
|
Ratio
|
|||||||||||||||
|
December 31, 2018
|
|
|
|
|
|
|
|
|
|||||||||||||||
|
Total risk-based capital:
|
|
|
|
|
|
|
|
|
|||||||||||||||
|
Consolidated
|
$
|
1,285.0
|
|
12.99
|
%
|
$
|
976.6
|
|
9.875
|
%
|
$
|
1,038.4
|
|
10.50
|
%
|
$
|
989.0
|
|
10.00
|
%
|
|||
|
FIB
|
1,184.5
|
|
12.01
|
|
973.7
|
|
9.875
|
|
1,035.3
|
|
10.50
|
|
986.0
|
|
10.00
|
|
|||||||
|
Tier 1 risk-based capital:
|
|||||||||||||||||||||||
|
Consolidated
|
1,212.0
|
|
12.26
|
|
778.8
|
|
7.875
|
|
840.6
|
|
8.50
|
|
791.2
|
|
8.00
|
|
|||||||
|
FIB
|
1,111.6
|
|
11.27
|
|
776.5
|
|
7.875
|
|
838.1
|
|
8.50
|
|
788.8
|
|
8.00
|
|
|||||||
|
Common equity tier 1 risk-based capital:
|
|||||||||||||||||||||||
|
Consolidated
|
1,127.8
|
|
11.40
|
|
630.5
|
|
6.375
|
|
692.3
|
|
7.00
|
|
642.8
|
|
6.50
|
|
|||||||
|
FIB
|
1,111.6
|
|
11.27
|
|
628.6
|
|
6.375
|
|
690.2
|
|
7.00
|
|
640.9
|
|
6.50
|
|
|||||||
|
Leverage capital ratio:
|
|||||||||||||||||||||||
|
Consolidated
|
1,212.0
|
|
9.47
|
|
511.9
|
|
4.00
|
|
511.9
|
|
4.00
|
|
639.9
|
|
5.00
|
|
|||||||
|
FIB
|
1,111.6
|
|
8.97
|
|
495.9
|
|
4.00
|
|
495.9
|
|
4.00
|
|
619.8
|
|
5.00
|
|
|||||||
113
FIRST INTERSTATE BANCSYSTEM, INC. AND SUBSIDIARIES
NOTES TO CONSOLIDATED FINANCIAL STATEMENTS
(Dollars in millions, except share and per share data)
|
|
Actual
|
Adequately Capitalized
Basel III
Phase-In Schedule
|
Adequately Capitalized
Basel III
Fully Phased-In
|
Well Capitalized (1)
|
|||||||||||||||||||
|
|
Amount
|
Ratio
|
Amount
|
Ratio
|
Amount
|
Ratio
|
Amount
|
Ratio
|
|||||||||||||||
|
December 31, 2017
|
|
|
|
|
|
|
|
|
|||||||||||||||
|
Total risk-based capital:
|
|
|
|
|
|
|
|
|
|||||||||||||||
|
Consolidated
|
$
|
1,112.5
|
|
12.76
|
%
|
$
|
806.5
|
|
9.25
|
%
|
$
|
915.5
|
|
10.50
|
%
|
$
|
871.9
|
|
10.00
|
%
|
|||
|
FIB
|
1,066.6
|
|
12.29
|
|
802.7
|
|
9.25
|
|
911.2
|
|
10.50
|
|
867.8
|
|
10.00
|
|
|||||||
|
Tier 1 risk-based capital:
|
|||||||||||||||||||||||
|
Consolidated
|
1,040.3
|
|
11.93
|
|
632.1
|
|
7.25
|
|
741.1
|
|
8.50
|
|
697.5
|
|
8.00
|
|
|||||||
|
FIB
|
994.4
|
|
11.46
|
|
629.1
|
|
7.25
|
|
737.6
|
|
8.50
|
|
694.2
|
|
8.00
|
|
|||||||
|
Common equity tier 1 risk-based capital:
|
|||||||||||||||||||||||
|
Consolidated
|
962.4
|
|
11.04
|
|
501.3
|
|
5.75
|
|
610.3
|
|
7.00
|
|
566.7
|
|
6.50
|
|
|||||||
|
FIB
|
994.4
|
|
11.46
|
|
499.0
|
|
5.75
|
|
607.4
|
|
7.00
|
|
564.1
|
|
6.50
|
|
|||||||
|
Leverage capital ratio:
|
|||||||||||||||||||||||
|
Consolidated
|
1,040.3
|
|
8.86
|
|
469.9
|
|
4.00
|
|
469.9
|
|
4.00
|
|
587.4
|
|
5.00
|
|
|||||||
|
FIB
|
994.4
|
|
8.48
|
|
469.1
|
|
4.00
|
|
469.1
|
|
4.00
|
|
586.3
|
|
5.00
|
|
|||||||
(1) The ratios for the well capitalized requirement are only applicable to FIB. However, the Company manages its capital position as if the requirement applies to the consolidated entity and has presented the ratios as if they also applied on a consolidated basis.
On July 2, 2013, the Board of Governors of the Federal Reserve Bank issued a final rule implementing a revised regulatory capital framework for U.S. banks in accordance with the Basel III international accord and satisfying related mandates under the Dodd-Frank Wall Street Reform and Consumer Protection Act. The revised regulatory capital framework (the “Basel III Capital Rules”) substantially revised the risk-based capital requirements applicable to bank holding companies and depository institutions by defining the components of capital and addressing other issues affecting the numerator in banking institutions’ regulatory capital ratios, addressing risk weights and other issues affecting the denominator in banking institutions’ regulatory capital ratios and replacing the existing risk-weighting approach with a more risk-sensitive approach. The Basel III Capital Rules became effective for the Company on January 1, 2015, subject to a phase-in period for certain provisions.
When fully phased in on January 1, 2019, the Basel III Capital Rules will require the Company to maintain (i) a minimum ratio of common equity tier 1 capital to risk-weighted assets of at least
4.5%
, plus a
2.5%
“capital conservation buffer” (which is added to the
4.5%
tier 1 capital to risk-weighted assets of at least
7.0%
upon full implementation), (ii) a minimum ratio of tier 1 capital to risk-weighted assets of at least
6.0%
, plus the capital conservation buffer (which is added to the
6.0%
tier 1 capital ratio as that buffer is phased in, effectively resulting in a minimum tier 1 capital ratio of
8.5%
upon full implementation), (iii) a minimum ratio of total capital to risk-weighted assets of at least
8.0%
, plus the capital conservation buffer (which is added to the
8.0%
total capital ratio as that buffer is phased in, effectively resulting in a minimum total capital ratio of
10.5%
upon full implementation) and (iv) a minimum leverage ratio of
4.0%
, calculated as the ratio of tier 1 capital to average quarterly assets.
The implementation of the capital conservation buffer began on January 1, 2016 at the
0.625%
level and will be phased in over a four-year period (increasing by that amount on each subsequent January 1, until it reaches
2.5%
on January 1, 2019). The Basel III Capital Rules also provide for a “countercyclical capital buffer” that is applicable to only certain covered institutions and does not have any current applicability to us. The capital conservation buffer is designed to absorb losses during periods of economic stress and, as detailed above, effectively increases the minimum required risk-weighted capital ratios. Banking institutions with a ratio of common equity tier 1 capital to risk-weighted assets below the effective minimum (
4.5%
plus the capital conservation buffer and, if applicable, the countercyclical capital buffer) will face constraints on dividends, equity repurchases and compensation based on the amount of the shortfall. As of
December 31, 2018
, the Company’s capital conservation buffer was
4.99%
for the consolidated company and
4.01%
for FIB.
114
FIRST INTERSTATE BANCSYSTEM, INC. AND SUBSIDIARIES
NOTES TO CONSOLIDATED FINANCIAL STATEMENTS
(Dollars in millions, except share and per share data)
|
(18)
|
COMMITMENTS AND CONTINGENCIES
|
The Company had commitments under construction contracts of
$2.7 million
as of
December 31, 2018
.
The Parent Company and the Billings office of FIB are the anchor tenants in a building owned by an entity in which FIB has a
50.0%
ownership interest.
The Company leases certain premises and equipment from third parties under operating leases. Total rental expense to third parties was
$3.2 million
,
$2.5 million
, and
$1.9 million
, in
2018
,
2017
and
2016
, respectively.
The total future minimum rental commitments, exclusive of maintenance and operating costs, required under operating leases that have initial or remaining noncancelable lease terms in excess of one year at
December 31, 2018
, are as follows:
|
Third
Parties
|
Related
Entity
|
Total
|
|||||||||
|
For the year ending December 31:
|
|
|
|
||||||||
|
2019
|
$
|
4.4
|
|
$
|
1.6
|
|
$
|
6.0
|
|
||
|
2020
|
4.2
|
|
1.5
|
|
5.7
|
|
|||||
|
2021
|
4.1
|
|
1.4
|
|
5.5
|
|
|||||
|
2022
|
4.1
|
|
1.2
|
|
5.3
|
|
|||||
|
2023
|
3.9
|
|
1.2
|
|
5.1
|
|
|||||
|
Thereafter
|
15.3
|
|
2.8
|
|
18.1
|
|
|||||
|
Total
|
$
|
36.0
|
|
$
|
9.7
|
|
$
|
45.7
|
|
||
Residential mortgage loans sold to investors in the secondary market are sold with varying recourse provisions. Essentially all of the loan sales agreements require the repurchase of a mortgage loan by the seller in situations such as breach of representation, warranty or covenant; untimely document delivery; false or misleading statements; failure to obtain certain certificates or insurance; unmarketability; etc. Certain loan sales agreements contain repurchase requirements based on payment-related defects that are defined in terms of the number of days or months since the purchase, the sequence number of the payment, and/or the number of days of payment delinquency. Based on the specific terms stated in the agreements, the Company had
$1.5 million
and
$1.9 million
of sold residential mortgage loans with recourse provisions still in effect as of
December 31, 2018
and
2017
, respectively. The Company did not repurchase any significant amount of loans from secondary market investors under the terms of loan sales agreements during the years ended
December 31, 2018
,
2017
and
2016
. In the opinion of management, the risk of recourse and the subsequent requirement of loan repurchase to the Company is not significant, and accordingly no liabilities have been established related to such. In addition, the Company made various representations and warranties associated with the sale of loans. The Company has not incurred significant losses resulting from these provisions.
On
October 11, 2018
, the Company entered into a definitive agreement to acquire all of the outstanding stock of IIBK, a community bank headquartered in Coeur d' Alene, Idaho with
11
banking offices across Idaho, in an all-stock transaction valued at approximately
$181.3 million
in aggregate, or
$22.73
per share of IIBK stock, based on a per share price of First Interstate Class A common stock of
$45.45
per share as of October 5, 2018. IIBK shareholders will be entitled to receive
0.50
shares of First Interstate Class A common stock for each share of IIBK common stock they own. The transaction has been approved by the boards of directors of both companies and is expected to close and convert data processing systems in the second quarter of 2019, subject to customary conditions, including regulatory and shareholder approvals.
115
FIRST INTERSTATE BANCSYSTEM, INC. AND SUBSIDIARIES
NOTES TO CONSOLIDATED FINANCIAL STATEMENTS
(Dollars in millions, except share and per share data)
Also on
October 11, 2018
, the Company entered into a definitive agreement to acquire all of the outstanding stock of CMYF, a community bank headquartered in Post Falls, Idaho with
three
banking offices in North Idaho, in an all-stock transaction valued at approximately
$21.5
million in aggregate, or
$17.20
per share of CMYF stock, based on a per share price of First Interstate Class A common stock of
$45.45
per share as of October 5, 2018. CMYF stockholders will be entitled to receive
0.3784
shares of First Interstate Class A common stock for each share of CMYF common stock they own. The transaction has been approved by the boards of directors of both companies and is expected to close and convert data processing systems in the second quarter of 2019, subject to customary conditions, including regulatory and shareholder approvals.
A substantial portion of the Company’s customers’ ability to honor their contracts is dependent on the economy in Idaho, Montana, Oregon, South Dakota, Washington, and Wyoming. The Company’s loan portfolio is diversified and assigned to risk classifications by industry concentrations and the current economic conditions. These industry concentrations of credit are taken into consideration by management in determining the allowance for loan and lease losses.
In the normal course of business, the Company is involved in various other claims and litigation. In the opinion of management, following consultation with legal counsel, the ultimate liability or disposition thereof is not expected to have a material adverse effect on the consolidated financial condition, results of operations or liquidity of the Company.
|
(19)
|
FINANCIAL INSTRUMENTS WITH OFF-BALANCE SHEET RISK
|
The Company is a party to financial instruments with off-balance sheet risk in the normal course of business to meet the financing needs of its customers. These financial instruments include commitments to extend credit and standby letters of credit. These instruments involve, to varying degrees, elements of credit and interest rate risk in excess of amounts recorded in the consolidated balance sheets. The Company evaluates each customer’s creditworthiness on a case-by-case basis. The amount of collateral obtained is based on management’s credit evaluation of the customer. Collateral held varies but may include accounts receivable, inventory, premises and equipment, and income-producing commercial properties.
Commitments to extend credit are agreements to lend to a customer as long as there is no violation of any condition established in the commitment contract. Commitments generally have fixed expiration dates or other termination clauses and may require payment of a fee. Generally, commitments to extend credit are subject to annual renewal. Since many of the commitments are expected to expire without being drawn upon, the total commitment amounts do not necessarily represent future cash requirements. Commitments to extend credit to borrowers approximated
$2,620.4 million
at
December 31, 2018
, which included
$726.7 million
on unused credit card lines and
$1,058.5 million
with commitment maturities beyond one year. Commitments to extend credit to borrowers approximated
$2,179.5 million
at
December 31, 2017
, which included
$635.3 million
on unused credit card lines and
$775.0 million
with commitment maturities beyond one year.
Standby letters of credit are conditional commitments issued by the Company to guarantee the performance of a customer to a third party. Most commitments extend for no more than two years and are generally subject to annual renewal. The credit risk involved in issuing letters of credit is essentially the same as that involved in extending loan facilities to customers. The Company’s policy for obtaining collateral, and the nature of such collateral, is essentially the same as that involved in making commitments to extend credit. At
December 31, 2018
and
2017
, the Company had outstanding stand-by letters of credit of
$46.7 million
and
$50.5 million
, respectively. The estimated fair value of the obligation undertaken by the Company in issuing standby letters of credit is included in accounts payable and accrued expenses in the Company’s consolidated balance sheets.
116
FIRST INTERSTATE BANCSYSTEM, INC. AND SUBSIDIARIES
NOTES TO CONSOLIDATED FINANCIAL STATEMENTS
(Dollars in millions, except share and per share data)
|
(20)
|
INCOME TAXES
|
Income tax expense consists of the following:
|
Year ended December 31,
|
2018
|
2017
|
2016
|
||||||||
|
Current:
|
|
|
|
||||||||
|
Federal
|
$
|
23.1
|
|
$
|
24.3
|
|
$
|
40.3
|
|
||
|
State
|
7.2
|
|
5.0
|
|
5.9
|
|
|||||
|
Total current
|
30.3
|
|
29.3
|
|
46.2
|
|
|||||
|
Deferred:
|
|||||||||||
|
Federal
|
12.3
|
|
18.4
|
|
2.9
|
|
|||||
|
State
|
3.5
|
|
2.5
|
|
0.5
|
|
|||||
|
Total deferred
|
15.8
|
|
20.9
|
|
3.4
|
|
|||||
|
Total income tax expense
|
$
|
46.1
|
|
$
|
50.2
|
|
$
|
49.6
|
|
||
Total income tax provision differs from the amount of income tax determined by applying the statutory federal income tax rate of 21% for
2018
and
35%
for
2017
and
2016
, respectively, to income before income taxes due to the following:
|
Year ended December 31,
|
2018
|
2017
|
2016
|
||||||||
|
Tax expense at the statutory tax rate
|
$
|
43.3
|
|
$
|
54.9
|
|
$
|
50.8
|
|
||
|
Increase (decrease) in tax resulting from:
|
|||||||||||
|
Tax-exempt income
|
(2.8
|
)
|
(4.5
|
)
|
(4.4
|
)
|
|||||
|
State income tax, net of federal income tax benefit
|
8.5
|
|
4.9
|
|
4.3
|
|
|||||
|
Benefit of stock-based compensation plans
|
(1.1
|
)
|
(2.6
|
)
|
—
|
|
|||||
|
Federal tax credits
|
(2.6
|
)
|
(2.5
|
)
|
(2.1
|
)
|
|||||
|
Benefit due to enactment of federal tax reform
|
—
|
|
(2.2
|
)
|
—
|
|
|||||
|
Other, net
|
0.8
|
|
2.2
|
|
1.0
|
|
|||||
|
Tax expense at effective tax rate
|
$
|
46.1
|
|
$
|
50.2
|
|
$
|
49.6
|
|
||
117
FIRST INTERSTATE BANCSYSTEM, INC. AND SUBSIDIARIES
NOTES TO CONSOLIDATED FINANCIAL STATEMENTS
(Dollars in millions, except share and per share data)
The tax effects of temporary differences between the financial statement carrying amounts and tax bases of assets and liabilities that give rise to significant portions of the net deferred tax asset (liability) relate to the following:
|
December 31,
|
2018
|
2017
|
|||||
|
Deferred tax assets:
|
|
|
|||||
|
Loans, principally due to allowance for loan losses
|
$
|
18.4
|
|
$
|
18.0
|
|
|
|
Loan discount
|
8.3
|
|
6.7
|
|
|||
|
Investment securities, unrealized losses
|
8.9
|
|
5.6
|
|
|||
|
Deferred compensation
|
17.0
|
|
13.1
|
|
|||
|
Non-performing loan interest
|
1.2
|
|
1.1
|
|
|||
|
Other real estate owned write-downs and carrying costs
|
0.3
|
|
0.6
|
|
|||
|
Tax credit carryforwards
(1)
|
0.1
|
|
3.7
|
|
|||
|
Net operating loss carryforwards
(2)
|
3.9
|
|
8.7
|
|
|||
|
Other
|
0.1
|
|
3.1
|
|
|||
|
Deferred tax assets
|
58.2
|
|
60.6
|
|
|||
|
Deferred tax liabilities:
|
|
|
|||||
|
Fixed assets, principally differences in bases and depreciation
|
(6.9
|
)
|
(6.7
|
)
|
|||
|
Deferred loan costs
|
(2.6
|
)
|
(1.7
|
)
|
|||
|
Investment in joint venture partnership, principally due to differences in depreciation of partnership assets
|
(0.8
|
)
|
(0.8
|
)
|
|||
|
Prepaid amounts
|
(0.6
|
)
|
(0.6
|
)
|
|||
|
Government agency stock dividends
|
(1.5
|
)
|
(1.6
|
)
|
|||
|
Goodwill and core deposit intangibles
|
(44.2
|
)
|
(38.1
|
)
|
|||
|
Mortgage servicing rights
|
(6.4
|
)
|
(5.7
|
)
|
|||
|
Other
|
(3.8
|
)
|
(1.4
|
)
|
|||
|
Deferred tax liabilities
|
(66.8
|
)
|
(56.6
|
)
|
|||
|
Net deferred tax assets (liabilities)
|
$
|
(8.6
|
)
|
$
|
4.0
|
|
|
(1)
Based on filed tax returns and amounts expected to be reported in current year tax returns (
December 31, 2018
), we had remaining federal tax credit carryforwards of
$0.1 million
from acquired companies. The remaining federal tax credits were primarily generated from AMT tax credit carryforwards, and their use is subject to annual limitations.
(2)
As of
December 31, 2018
, we had remaining federal net operating loss carryforwards of
$5.4 million
from acquired companies, which is available to offset federal taxable income and state net operating loss carryforwards in amounts which vary by state. The federal net operating losses will expire beginning in 2029 and ending in 2037 and the state net operating losses will expire beginning in 2019 and ending in 2034. The use of these carryforwards is subject to annual limitations.
The Company had current net income tax receivables of
$2.0 million
and
$5.7 million
at
December 31, 2018
and
2017
, respectively.
|
(21)
|
STOCK-BASED COMPENSATION
|
The Company has equity awards outstanding under
two
stock-based compensation plans; the 2015 Equity Incentive Plan (the “2015 Plan”) and the 2006 Equity Compensation Plan, as amended and restated (the “2006 Plan”). These plans were primarily established to enhance the Company’s ability to attract, retain and motivate employees. The Company’s Board of Directors or, upon delegation, the Compensation Committee of the Board of Directors (“Compensation Committee”) has exclusive authority to select employees, advisors and others, including directors, to receive awards and to establish the terms and conditions of each award made pursuant to the Company’s stock-based compensation plans.
118
FIRST INTERSTATE BANCSYSTEM, INC. AND SUBSIDIARIES
NOTES TO CONSOLIDATED FINANCIAL STATEMENTS
(Dollars in millions, except share and per share data)
The 2015 Plan, approved by the Company’s shareholders in May 2015, was established to provide the Company with flexibility to select from various equity-based performance compensation methods, and to be able to address changing accounting and tax rules and corporate governance practices by optimally utilizing performance based compensation. The 2015 Plan did not increase the number of shares of common stock available for awards under the 2006 Plan.
The 2006 Plan, approved by the Company’s shareholders in May 2006 and May 2014, was established to consolidate into one plan the benefits available under all other than existing share-based award plans. The 2006 Plan continues with respect to awards made prior to June 2015. All shares of common stock available for future grant under the 2006 Plan were transferred into the 2015 Plan. At
December 31, 2018
, there were
1,727,765
common shares available for future grant under the 2015 Plan.
Stock Options.
All options granted have an exercise price equal to fair market value, which is currently defined as the closing sales price for the stock as quoted on the NASDAQ Stock Market for the last market trading day preceding the date that the Company’s Board of Directors awards the benefit. Options may be subject to vesting as determined by the Company’s Board of Directors or Compensation Committee, and can be exercised for periods of up to
ten years
from the date of grant.
No
stock option awards were granted in
2018
or
2017
. All outstanding stock option awards were fully vested as of December 31, 2016. As such, there was no compensation expense or related income tax benefits recognized related to stock option awards in
2018
or
2017
. Compensation expense related to stock option awards and the related income tax benefits for the year ended December 31, 2016 were not considered material.
The following table summarizes stock option activity under the Company’s active stock option plans:
|
Year Ended December 31, 2018
|
Number of
Shares
|
Weighted-Average
Exercise Price
|
Weighted-Average
Remaining
Contract Life
|
|||||
|
Outstanding options, beginning of year
|
642,255
|
|
$
|
16.13
|
|
|
||
|
Granted
|
—
|
|
—
|
|
|
|||
|
Exercised
|
(199,667
|
)
|
17.12
|
|
|
|||
|
Forfeited
|
(14,412
|
)
|
20.87
|
|
|
|||
|
Expired
|
—
|
|
—
|
|
|
|||
|
Outstanding options, end of year
|
428,176
|
|
$
|
15.61
|
|
1.56 years
|
||
|
Outstanding options exercisable, end of year
|
428,176
|
|
$
|
15.61
|
|
1.56 years
|
||
The total intrinsic value of fully-vested stock options outstanding as of
December 31, 2018
was
$9.0 million
. The total intrinsic value of options exercised was
$4.9 million
,
$6.3 million
and
$5.6 million
during the years ended
December 31, 2018
,
2017
and
2016
, respectively. The actual tax benefit realized for the tax deduction from option exercises totaled
$0.9 million
,
$2.0 million
and
$2.1 million
for the years ended
December 31, 2018
,
2017
and
2016
, respectively. The Company received cash of
$1.8 million
,
$2.4 million
and
$4.7 million
from stock option exercises during the years ended
December 31, 2018
,
2017
and
2016
, respectively. The Company redeemed common stock with aggregate values of
$1.6 million
,
$2.8 million
and
$3.1 million
tendered in payment for stock option exercises during the years ended
December 31, 2018
,
2017
and
2016
, respectively.
Restricted Stock Awards.
Common stock issued under the Company’s restricted stock plan may not be sold or otherwise transferred until restrictions have lapsed or performance objectives have been obtained. During the vesting periods, participants have voting rights and receive dividends on all time restricted shares and vesting performance restricted shares. Upon termination of employment, common shares upon which restrictions have not lapsed must be returned to the Company.
119
FIRST INTERSTATE BANCSYSTEM, INC. AND SUBSIDIARIES
NOTES TO CONSOLIDATED FINANCIAL STATEMENTS
(Dollars in millions, except share and per share data)
All restricted share awards are classified as equity awards. The fair value of equity-classified restricted stock awards is amortized as compensation expense on a straight-line basis over the period restrictions lapse or performance goals are met. Compensation expense related to restricted stock awards of
$5.6 million
,
$3.3 million
and
$3.9 million
was included in benefits on the Company’s consolidated statements of income for the years ended
December 31, 2018
,
2017
and
2016
, respectively. Related income tax benefits recognized for the years ended
December 31, 2018
,
2017
and
2016
were
$0.2 million
,
$0.6 million
and
$1.5 million
, respectively.
The following table presents information regarding the Company’s restricted stock:
|
As of December 31, 2018
|
Number of
Shares
|
Weighted-Average
Measurement Date
Fair Value
|
||||
|
Restricted stock, beginning of year
|
292,506
|
|
$
|
33.24
|
|
|
|
Granted
|
214,893
|
|
40.97
|
|
||
|
Vested
|
(83,736
|
)
|
32.42
|
|
||
|
Forfeited
|
(43,079
|
)
|
36.64
|
|
||
|
Canceled
|
—
|
|
—
|
|
||
|
Restricted stock, end of year
|
380,584
|
|
$
|
37.46
|
|
|
During
2018
, the Company issued
214,893
restricted common shares. The
2018
restricted share awards included
59,464
performance restricted shares, of which
29,732
vest in varying percentages upon achievement of defined return on equity performance goals, and
29,732
vest in varying percentages upon achievement of defined total return to shareholder goals. Vesting of the performance restricted shares is also contingent on employment as of
December 31, 2020
. Additionally,
155,429
time-restricted shares were issued during
2018
that vest one-third on each annual anniversary of the grant date through
February 15, 2021
, contingent on continued employment through the vesting date.
As of
December 31, 2018
, there was
$7.9 million
of unrecognized compensation cost related to non-vested, restricted stock awards expected to be recognized over a period of
1.91 years
.
|
(22)
|
EMPLOYEE BENEFIT PLANS
|
Profit Sharing Plan.
The Company has a noncontributory profit sharing plan. All employees, other than temporary employees, working
20 hours
or more per week are eligible to participate in the profit sharing plan. The Company’s Board of Directors authorizes all contributions to the profit sharing plan. Participants become 100% vested upon the completion of
two
years of vesting service. Accrued contribution expense for this plan of
$2.4 million
,
$1.6 million
and
$2.7 million
in
2018
,
2017
and
2016
, respectively, is included in employee benefits expense in the Company’s consolidated statements of income.
Savings Plan.
In addition, the Company has a contributory employee savings plan. Eligibility requirements for this plan are the same as those for the profit sharing plan discussed in the preceding paragraph. Employee participation in the plan is at the option of the employee. The Company contributes
$1.25
for each $1.00 of employee contributions up to
4%
of the participating employee’s compensation. Contribution expense for this plan of
$6.3 million
,
$5.5 million
and
$4.8 million
in
2018
,
2017
and
2016
, respectively, is included in employee benefits expense in the Company’s consolidated statements of income.
Post-Retirement Healthcare Plan.
The Company sponsors a contributory defined benefit healthcare plan (the “Plan”) for active employees and employees and directors retiring from the Company at the age of at least
55 years
and with at least
15 years
of continuous service. Retired Plan participants contribute the full cost of benefits based on the average per capita cost of benefit coverage for both active employees and retired Plan participants.
120
FIRST INTERSTATE BANCSYSTEM, INC. AND SUBSIDIARIES
NOTES TO CONSOLIDATED FINANCIAL STATEMENTS
(Dollars in millions, except share and per share data)
In 2016, the Company amended the Plan to discontinue offering healthcare benefits to future retirees beginning July 1, 2016, with current retirees as of July 1, 2016 continuing in the Plan. The Company recorded a
$2.8 million
gain in conjunction with the Plan amendment, which was recorded in other comprehensive income and is being amortized as a reduction in net periodic benefit cost over the weighted average remaining service period of active employees expected to receive post-retirement healthcare benefits under the Plan of approximately
four years
. The Plan amendment triggered a curtailment, which immediately reduced the Company’s accumulated post-retirement benefit obligation and net periodic benefit cost by
$2.8 million
and
$0.3 million
, respectively.
The Plan’s unfunded benefit obligation of
$0.5 million
and
$0.7 million
as of
December 31, 2018
and
2017
, respectively, is included in accounts payable and accrued expenses in the Company’s consolidated balance sheets. Net periodic benefit costs of
$0.8 million
,
$0.4 million
and
$0.2 million
for the years ended
December 31, 2018
,
2017
and
2016
, respectively, are included in employee benefits expense in the Company’s consolidated statements of income.
Weighted average actuarial assumptions used to determine the post-retirement benefit obligation at
December 31, 2018
, and the net periodic benefit costs for the year then ended, included a discount rate of
3.6%
and a
6.0%
annual increase in the per capita cost of covered healthcare benefits. Weighted average actuarial assumptions used to determine the post-retirement benefit obligation at
December 31, 2017
, and the net periodic benefit costs for the year then ended, included a discount rate of
2.4%
and a
6.0%
annual increase in the per capita cost of covered healthcare benefits. The estimated effect of a one percent increase or a one percent decrease in the assumed healthcare cost trend rate would not significantly impact the service and interest cost components of the net periodic benefit cost or the accumulated post-retirement benefit obligation. Future benefit payments are expected to be
$0.14 million
,
$0.12 million
,
$0.09 million
,
$0.06 million
,
$0.05 million
and
$0.10 million
for
2019
,
2020
,
2021
,
2022
,
2023
, and
2024
through
2028
, respectively.
At
December 31, 2018
, the Company had accumulated other comprehensive gain related to the plan of
$1.2 million
, or
$0.9 million
net of related income tax benefit, comprised primarily of an unamortized transition asset of
$0.7 million
.
|
(23)
|
OTHER COMPREHENSIVE INCOME
|
The gross amounts of each component of other comprehensive income and the related tax effects for the periods indicated are as follows:
|
Year Ended December 31, 2018
|
Before Tax Amount
|
Tax Expense (Benefit)
|
Net of Tax Amount
|
||||||
|
Investment securities available-for sale:
|
|||||||||
|
Change in net unrealized loss during period
|
$
|
(13.9
|
)
|
$
|
(3.6
|
)
|
$
|
(10.3
|
)
|
|
Reclassification adjustment for net loss included in net income
|
0.1
|
|
—
|
|
0.1
|
|
|||
|
Change in unamortized loss on available-for-sale securities transferred into held-to-maturity
|
1.6
|
|
0.4
|
|
1.2
|
|
|||
|
Defined benefits post-retirement benefit plan:
|
|||||||||
|
Change in net actuarial loss (gain)
|
(0.6
|
)
|
(0.1
|
)
|
(0.5
|
)
|
|||
|
Total other comprehensive loss
|
$
|
(12.8
|
)
|
$
|
(3.3
|
)
|
$
|
(9.5
|
)
|
121
FIRST INTERSTATE BANCSYSTEM, INC. AND SUBSIDIARIES
NOTES TO CONSOLIDATED FINANCIAL STATEMENTS
(Dollars in millions, except share and per share data)
|
Year Ended December 31, 2017
|
Before Tax Amount
|
Tax Expense (Benefit)
|
Net of Tax Amount
|
||||||
|
Investment securities available-for sale:
|
|||||||||
|
Change in net unrealized loss during period
|
$
|
(6.5
|
)
|
$
|
(2.7
|
)
|
$
|
(3.8
|
)
|
|
Reclassification adjustment for net gains included in net income
|
(0.7
|
)
|
(0.3
|
)
|
(0.4
|
)
|
|||
|
Change in unamortized loss on available-for-sale securities transferred into held-to-maturity
|
1.9
|
|
0.7
|
|
1.2
|
|
|||
|
Change in net unrealized loss on derivatives
|
(1.1
|
)
|
(0.4
|
)
|
(0.7
|
)
|
|||
|
Reclassification adjustment for derivative net (gains) losses included in net income
|
1.1
|
|
0.4
|
|
0.7
|
|
|||
|
Defined benefits post-retirement benefit plan:
|
|||||||||
|
Change in net actuarial loss (gain)
|
(1.3
|
)
|
(0.5
|
)
|
(0.8
|
)
|
|||
|
Total other comprehensive loss
|
$
|
(6.6
|
)
|
$
|
(2.8
|
)
|
$
|
(3.8
|
)
|
|
Year Ended December 31, 2016
|
Before Tax Amount
|
Tax Expense (Benefit)
|
Net of Tax Amount
|
||||||
|
Investment securities available-for sale:
|
|||||||||
|
Change in net unrealized loss during period
|
$
|
(19.4
|
)
|
$
|
(7.6
|
)
|
$
|
(11.8
|
)
|
|
Reclassification adjustment for net gains included in net income
|
(0.3
|
)
|
(0.1
|
)
|
(0.2
|
)
|
|||
|
Change in unamortized gain on available-for-sale securities transferred into held-to-maturity
|
1.9
|
|
0.7
|
|
1.2
|
|
|||
|
Change in net unrealized loss on derivatives
|
(0.2
|
)
|
(0.1
|
)
|
(0.1
|
)
|
|||
|
Defined benefits post-retirement benefit plan:
|
|||||||||
|
Change in net actuarial loss (gain)
|
3.9
|
|
1.6
|
|
2.3
|
|
|||
|
Total other comprehensive income
|
$
|
(14.1
|
)
|
$
|
(5.5
|
)
|
$
|
(8.6
|
)
|
The components of accumulated other comprehensive income (loss), net of income taxes, are as follows:
|
Year ended December 31,
|
2018
|
2017
|
|||||
|
Net unrealized gain (loss) on investment securities available-for-sale
|
$
|
(25.5
|
)
|
$
|
(13.3
|
)
|
|
|
Net actuarial gain (loss) on defined benefit post-retirement benefit plans
|
0.9
|
|
1.3
|
|
|||
|
Net accumulated other comprehensive income (loss)
|
$
|
(24.6
|
)
|
$
|
(12.0
|
)
|
|
122
FIRST INTERSTATE BANCSYSTEM, INC. AND SUBSIDIARIES
NOTES TO CONSOLIDATED FINANCIAL STATEMENTS
(Dollars in millions, except share and per share data)
|
(24)
|
CONDENSED FINANCIAL INFORMATION (PARENT COMPANY ONLY)
|
Following is condensed financial information of First Interstate BancSystem, Inc.
|
December 31,
|
2018
|
2017
|
|||||
|
Condensed balance sheets:
|
|
|
|||||
|
Cash and cash equivalents
|
$
|
72.9
|
|
$
|
42.3
|
|
|
|
Investment in bank subsidiary
|
1,648.9
|
|
1,432.3
|
|
|||
|
Advances to subsidiaries, net
|
46.0
|
|
25.7
|
|
|||
|
Other assets
|
59.0
|
|
61.7
|
|
|||
|
Total assets
|
$
|
1,826.8
|
|
$
|
1,562.0
|
|
|
|
Other liabilities
|
$
|
46.0
|
|
$
|
51.9
|
|
|
|
Subordinated debentures held by subsidiary trusts
|
86.9
|
|
82.5
|
|
|||
|
Total liabilities
|
132.9
|
|
134.4
|
|
|||
|
Stockholders’ equity
|
1,693.9
|
|
1,427.6
|
|
|||
|
Total liabilities and stockholders’ equity
|
$
|
1,826.8
|
|
$
|
1,562.0
|
|
|
|
Years Ended December 31,
|
2018
|
2017
|
2016
|
||||||||
|
Condensed statements of income:
|
|
|
|
||||||||
|
Dividends from subsidiaries
|
$
|
148.5
|
|
$
|
150.0
|
|
$
|
140.0
|
|
||
|
Other interest income
|
0.1
|
|
0.1
|
|
—
|
|
|||||
|
Other income, primarily management fees from subsidiaries
|
17.0
|
|
18.0
|
|
15.1
|
|
|||||
|
Total income
|
165.6
|
|
168.1
|
|
155.1
|
|
|||||
|
Salaries and benefits
|
25.3
|
|
21.8
|
|
18.8
|
|
|||||
|
Interest expense
|
4.5
|
|
4.7
|
|
4.1
|
|
|||||
|
Acquisition expenses
|
8.1
|
|
25.3
|
|
1.5
|
|
|||||
|
Other operating expenses, net
|
14.5
|
|
13.0
|
|
10.4
|
|
|||||
|
Total expenses
|
52.4
|
|
64.8
|
|
34.8
|
|
|||||
|
Earnings before income tax benefit
|
113.2
|
|
103.3
|
|
120.3
|
|
|||||
|
Income tax benefit
|
(9.3
|
)
|
(14.2
|
)
|
(7.7
|
)
|
|||||
|
Income before undistributed earnings of subsidiaries
|
122.5
|
|
117.5
|
|
128.0
|
|
|||||
|
Undistributed earnings of subsidiaries
|
37.7
|
|
(11.0
|
)
|
(32.4
|
)
|
|||||
|
Net income
|
$
|
160.2
|
|
$
|
106.5
|
|
$
|
95.6
|
|
||
123
FIRST INTERSTATE BANCSYSTEM, INC. AND SUBSIDIARIES
NOTES TO CONSOLIDATED FINANCIAL STATEMENTS
(Dollars in millions, except share and per share data)
|
Years Ended December 31,
|
2018
|
2017
|
2016
|
||||||||
|
Condensed statements of cash flows:
|
|
|
|
||||||||
|
Cash flows from operating activities:
|
|
|
|
||||||||
|
Net income
|
$
|
160.2
|
|
$
|
106.5
|
|
$
|
95.6
|
|
||
|
Adjustments to reconcile net income to cash provided by operating activities:
|
|||||||||||
|
Undistributed earnings of subsidiaries
|
(37.7
|
)
|
11.0
|
|
32.4
|
|
|||||
|
Stock-based compensation expense
|
5.6
|
|
3.9
|
|
4.4
|
|
|||||
|
Tax benefits from stock-based compensation
|
—
|
|
—
|
|
2.1
|
|
|||||
|
Excess tax benefits from stock-based compensation
|
—
|
|
—
|
|
(1.6
|
)
|
|||||
|
Other, net
|
16.4
|
|
14.7
|
|
(0.8
|
)
|
|||||
|
Net cash provided by operating activities
|
144.5
|
|
136.1
|
|
132.1
|
|
|||||
|
Cash flows from investing activities:
|
|||||||||||
|
Capital distributions from nonbank subsidiaries
|
—
|
|
18.0
|
|
2.0
|
|
|||||
|
Acquisition of intangible assets
|
—
|
|
(28.0
|
)
|
—
|
|
|||||
|
Acquisition of bank holding company, net of cash and cash equivalents received
|
(14.7
|
)
|
(128.3
|
)
|
—
|
|
|||||
|
Investment in subsidiary
|
—
|
|
(18.0
|
)
|
—
|
|
|||||
|
Net cash (used) provided in investing activities
|
(14.7
|
)
|
(156.3
|
)
|
2.0
|
|
|||||
|
Cash flows from financing activities:
|
|
|
|
||||||||
|
Net (decrease) increase in advances from subsidiaries
|
(9.9
|
)
|
(28.4
|
)
|
9.1
|
|
|||||
|
Repayment of long-term debt
|
(26.0
|
)
|
—
|
|
—
|
|
|||||
|
Proceeds from issuance of common stock, net of stock issuance costs
|
1.8
|
|
2.4
|
|
4.7
|
|
|||||
|
Excess tax benefits from stock-based compensation
|
—
|
|
—
|
|
1.6
|
|
|||||
|
Purchase and retirement of common stock
|
(1.0
|
)
|
(1.3
|
)
|
(26.9
|
)
|
|||||
|
Dividends paid to common stockholders
|
(64.1
|
)
|
(48.6
|
)
|
(39.4
|
)
|
|||||
|
Net cash used in financing activities
|
(99.2
|
)
|
(75.9
|
)
|
(50.9
|
)
|
|||||
|
Net change in cash and cash equivalents
|
30.6
|
|
(96.1
|
)
|
83.2
|
|
|||||
|
Cash and cash equivalents, beginning of year
|
42.3
|
|
138.4
|
|
55.2
|
|
|||||
|
Cash and cash equivalents, end of year
|
$
|
72.9
|
|
$
|
42.3
|
|
$
|
138.4
|
|
||
There was
$173.3 million
and
$386.0 million
in
2018
and
2017
, respectively, of noncash financing activities for the issuance of common stock related to the INB and BOTC acquisitions, respectively. There was no noncash investing or financing activities during
2016
.
|
(25)
|
FAIR VALUE MEASUREMENTS
|
Fair value is defined as the price that would be received to sell an asset or paid to transfer a liability in an orderly transaction between market participants at the measurement date. There is a fair value hierarchy which requires an entity to maximize the use of observable inputs and minimize the use of unobservable inputs when measuring fair value.
124
FIRST INTERSTATE BANCSYSTEM, INC. AND SUBSIDIARIES
NOTES TO CONSOLIDATED FINANCIAL STATEMENTS
(Dollars in millions, except share and per share data)
The three levels of inputs that may be used to measure fair value are as follows:
•
Level 1 - Quoted prices in active markets for identical assets or liabilities
•
Level 2 - Observable inputs other than Level 1 prices, such as quoted prices for similar assets or liabilities; quoted prices in markets that are not active; or other inputs that are observable or can be corroborated by observable market data for substantially the full term of the assets or liabilities
•
Level 3 - Unobservable inputs that are supported by little or no market activity and that are significant to the fair value of assets or liabilities
The methodologies used by the Company in determining the fair values of each class of financial instruments are based primarily on the use of independent, market-based data to reflect a value that would be reasonably expected in an orderly transaction between market participants at the measurement date, and therefore are classified within Level 2 of the valuation hierarchy. There have been no significant changes in the valuation techniques during the periods ended
December 31, 2018
and
2017
.
The Company’s policy is to recognize transfers between levels as of the end of the reporting period. Transfers in and out of Level 1, Level 2 and Level 3 are recognized on the actual transfer date. There were no transfers between fair value hierarchy levels during the years ended
December 31, 2018
and
2017
.
Further details on the methods used to estimate the fair value of each class of financial instruments above are discussed below:
Investment Debt Securities Available-for-Sale
. The Company obtains fair value measurements for investment securities from an independent pricing service. The fair value measurements consider observable data that may include dealer quotes, market spreads, cash flows, the U.S. Treasury yield curve, live trading levels, trade execution data, market consensus prepayment speeds, credit information and the investment’s terms and conditions, among other things. Vendors chosen by the Company are widely recognized vendors whose evaluations support the pricing functions of financial institutions, investment and mutual funds, and portfolio managers. If needed, a broker may be utilized to determine the reported fair value of investment securities. The Company has documented and evaluated the pricing methodologies used by the vendors and maintains internal processes that regularly test valuations. These internal processes include obtaining and reviewing available reports on internal controls, evaluating the prices for reasonableness given market changes, obtaining and evaluating the inputs used in the model for a sample of securities, investigating anomalies and confirming determinations through discussions with the vendor.
Loans Held for Sale.
Fair value measurements for loans held for sale are obtained from an independent pricing service. The fair value measurements consider observable data that may include binding contracts or quotes or bids from third party investors as well as loan level pricing adjustments.
Interest Rate Swap Contracts.
Fair values for derivative interest rate swap contracts are based upon the estimated amounts to settle the contracts considering current interest rates and are calculated using discounted cash flows that are observable or that can be corroborated by observable market data. The inputs used to determine fair value include the 3 month LIBOR forward curve to estimate variable rate cash inflows and the federal funds effective swap rate to estimate the discount rate. The estimated variable rate cash inflows are compared to the fixed rate outflows and such difference is discounted to a present value to estimate the fair value of the interest rate swaps. The change in the value of derivative assets attributable to basis risk, or the risk that offsetting investments in a hedging strategy will not experience price changes in entirely opposite directions from each other, was not significant in the reported periods. The Company also obtains and compares the reasonableness of the pricing from an independent third party.
125
FIRST INTERSTATE BANCSYSTEM, INC. AND SUBSIDIARIES
NOTES TO CONSOLIDATED FINANCIAL STATEMENTS
(Dollars in millions, except share and per share data)
For purposes of potential valuation adjustments to our derivative positions, we evaluate the credit risk of our counterparties as well as ours. Accordingly, we have considered factors such as the likelihood of our default and the default of our counterparties, our net exposures and remaining contractual life, among other things, in determining if any fair value adjustments related to credit risk are required. The change in value of derivative assets and derivative liabilities attributable to credit risk was not significant during the reported periods.
Interest Rate Lock Commitments.
Fair value measurements for interest rate lock commitments are obtained from an independent pricing service. The fair value measurements consider observable data that may include prices available from secondary market investors taking into consideration various characteristics of the loan, including the loan amount, interest rate, value of the servicing and loan to value ratio, among other things. Observable data is then adjusted to reflect changes in interest rates, the Company’s estimated pull-through rate and estimated direct costs necessary to complete the commitment into a closed loan net of origination and processing fees collected from the borrower.
Forward Loan Sales Contracts.
The fair value measurements for forward loan sales contracts are obtained from an independent pricing service. The fair value measurements consider observable data that includes sales of similar loans.
Deferred Compensation Plan Assets and Liabilities.
The fair values of deferred compensation plan assets and liabilities are based primarily on the use of independent, market-based data to reflect a value that would be reasonably expected in an orderly transaction between market participants at the measurement date. These investments are in the same funds and purchased in the same amounts as the participants’ selected investments, which represent the underlying liabilities to plan participants. Deferred compensation plan liabilities are recorded at amounts due to participants, based on the fair value of participants’ selected investments.
126
FIRST INTERSTATE BANCSYSTEM, INC. AND SUBSIDIARIES
NOTES TO CONSOLIDATED FINANCIAL STATEMENTS
(Dollars in millions, except share and per share data)
Financial assets and financial liabilities measured at fair value on a recurring basis are as follows:
|
|
Fair Value Measurements at Reporting Date Using
|
||||||||||||||
|
As of December 31, 2018
|
Balance
|
Quoted Prices in
Active Markets for
Identical Assets
(Level 1)
|
Significant Other
Observable
Inputs
(Level 2)
|
Significant
Unobservable
Inputs
(Level 3)
|
|||||||||||
|
Investment debt securities available-for-sale:
|
|
|
|
|
|||||||||||
|
U.S. Treasury Notes
|
$
|
2.6
|
|
$
|
—
|
|
$
|
2.6
|
|
$
|
—
|
|
|||
|
Obligations of U.S. government agencies
|
559.2
|
|
—
|
|
559.2
|
|
—
|
|
|||||||
|
U.S. agency mortgage-backed securities & collateralized mortgage obligations
|
1,544.8
|
|
—
|
|
1,544.8
|
|
—
|
|
|||||||
|
Private mortgage-backed securities
|
70.2
|
|
—
|
|
70.2
|
|
—
|
|
|||||||
|
Corporate securities
|
91.9
|
|
—
|
|
91.9
|
|
—
|
|
|||||||
|
Other investments
|
2.0
|
|
—
|
|
2.0
|
|
—
|
|
|||||||
|
Loans held for sale
|
33.3
|
|
—
|
|
33.3
|
|
—
|
|
|||||||
|
Derivative assets:
|
|||||||||||||||
|
Interest rate swap contracts
|
8.8
|
|
—
|
|
8.8
|
|
—
|
|
|||||||
|
Interest rate lock commitments
|
1.3
|
|
—
|
|
1.3
|
|
—
|
|
|||||||
|
Derivative liabilities:
|
|
|
|||||||||||||
|
Interest rate swap contracts
|
8.8
|
|
—
|
|
8.8
|
|
—
|
|
|||||||
|
Forward loan sales contracts
|
0.6
|
|
—
|
|
0.6
|
|
—
|
|
|||||||
|
Deferred compensation plan assets
|
12.1
|
|
—
|
|
12.1
|
|
—
|
|
|||||||
|
Deferred compensation plan liabilities
|
12.1
|
|
—
|
|
12.1
|
|
—
|
|
|||||||
|
|
Fair Value Measurements at Reporting Date Using
|
||||||||||||||
|
As of December 31, 2017
|
Balance
|
Quoted Prices in
Active Markets for
Identical Assets
(Level 1)
|
Significant Other
Observable
Inputs
(Level 2)
|
Significant
Unobservable
Inputs
(Level 3)
|
|||||||||||
|
Investment debt securities available-for-sale:
|
|
|
|
|
|||||||||||
|
U.S. Treasury Notes
|
$
|
3.2
|
|
$
|
—
|
|
$
|
3.2
|
|
$
|
—
|
|
|||
|
Obligations of U.S. government agencies
|
561.5
|
|
—
|
|
561.5
|
|
—
|
|
|||||||
|
U.S. agency mortgage-backed securities & collateralized mortgage obligations
|
1,462.5
|
|
—
|
|
1,462.5
|
|
—
|
|
|||||||
|
Private mortgage-backed securities
|
90.7
|
|
—
|
|
90.7
|
|
—
|
|
|||||||
|
Corporate securities
|
87.9
|
|
—
|
|
87.9
|
|
—
|
|
|||||||
|
Other investments
|
3.0
|
|
—
|
|
3.0
|
|
—
|
|
|||||||
|
Loans held for sale
|
46.6
|
|
—
|
|
46.6
|
|
—
|
|
|||||||
|
Derivative assets:
|
|||||||||||||||
|
Interest rate swap contracts
|
7.5
|
|
—
|
|
7.5
|
|
—
|
|
|||||||
|
Interest rate lock commitments
|
1.3
|
|
—
|
|
1.3
|
|
—
|
|
|||||||
|
Derivative liabilities:
|
|||||||||||||||
|
Interest rate swap contracts
|
7.8
|
|
—
|
|
7.8
|
|
—
|
|
|||||||
|
Forward loan sales contracts
|
0.1
|
|
—
|
|
0.1
|
|
—
|
|
|||||||
|
Deferred compensation plan assets
|
12.2
|
|
—
|
|
12.2
|
|
—
|
|
|||||||
|
Deferred compensation plan liabilities
|
12.2
|
|
—
|
|
12.2
|
|
—
|
|
|||||||
127
FIRST INTERSTATE BANCSYSTEM, INC. AND SUBSIDIARIES
NOTES TO CONSOLIDATED FINANCIAL STATEMENTS
(Dollars in millions, except share and per share data)
Additionally, from time to time, certain assets are measured at fair value on a non-recurring basis. Adjustments to fair value generally result from the application of lower-of-cost-or-market accounting or write-downs of individual assets due to impairment. The following table presents information about the Company’s assets and liabilities measured at fair value on a non-recurring basis:
|
|
|
Fair Value Measurements at Reporting Date Using
|
|||||||||||||
|
As of December 31, 2018
|
Total
|
Quoted Prices
in Active
Markets for
Identical Assets (Level 1)
|
Significant
Other
Observable
Inputs
(Level 2)
|
Significant
Unobservable
Inputs
(Level 3)
|
Total
Gains (Losses)
|
||||||||||
|
Impaired loans
|
$
|
24.1
|
|
$
|
—
|
|
$
|
—
|
|
$
|
24.1
|
|
$
|
(12.2
|
)
|
|
Other real estate owned
|
0.6
|
|
—
|
|
—
|
|
0.6
|
|
(0.6
|
)
|
|||||
|
Long-lived assets to be disposed of by sale
|
4.9
|
|
—
|
|
—
|
|
4.9
|
|
(0.5
|
)
|
|||||
|
|
|
Fair Value Measurements at Reporting Date Using
|
|||||||||||||
|
As of December 31, 2017
|
Total
|
Quoted Prices
in Active
Markets for
Identical Assets
(Level 1)
|
Significant
Other
Observable
Inputs
(Level 2)
|
Significant
Unobservable
Inputs
(Level 3)
|
Total
Gains (Losses)
|
||||||||||
|
Impaired loans
|
$
|
32.6
|
|
$
|
—
|
|
$
|
—
|
|
$
|
32.6
|
|
$
|
(22.2
|
)
|
|
Other real estate owned
|
1.3
|
|
—
|
|
—
|
|
1.3
|
|
(1.6
|
)
|
|||||
|
Long-lived assets to be disposed of by sale
|
0.8
|
|
—
|
|
—
|
|
0.8
|
|
—
|
|
|||||
Impaired Loans.
Collateralized impaired loans are reported at the fair value of the underlying collateral if repayment is expected solely from collateral. The impaired loans are reported at fair value through specific valuation allowance allocations. In addition, when it is determined that the fair value of an impaired loan is less than the recorded investment in the loan, the carrying value of the loan is adjusted to fair value through a charge to the allowance for loan losses. Collateral values are estimated using independent appraisals and management estimates of current market conditions. As of
December 31, 2018
, certain impaired loans with a carrying value of
$36.3 million
were reduced by specific valuation allowance allocations of
$6.8 million
and partial loan charge-offs of
$5.4 million
resulting in a reported fair value of
$24.1 million
. As of
December 31, 2017
, certain impaired loans with a carrying value of
$54.8 million
were reduced by specific valuation allowance allocations of
$10.8 million
and partial loan charge-offs of
$11.4 million
resulting in a reported fair value of
$32.6 million
.
OREO.
The fair values of OREO are estimated using independent appraisals and management estimates of current market conditions. Upon initial recognition, write-downs based on the foreclosed asset’s fair value at foreclosure are reported through charges to the allowance for loan losses. Periodically, the fair value of foreclosed assets is remeasured with any subsequent write-downs charged to OREO expense in the period in which they are identified.
Long-lived Assets to be Disposed of by Sale.
Long-lived assets to be disposed of by sale are carried at the lower of carrying value or fair value less estimated costs to sell. The fair values of long-lived assets to be disposed of by sale are based upon observable market data and management estimates of current market conditions. As of
December 31, 2018
, the Company had long-lived assets to be disposed of by sale with carrying values aggregating
$5.4 million
, which was reduced by write-downs of
$0.5 million
charged to other expense, resulting in a reported fair value of
$4.9 million
. As of
December 31, 2017
, the Company had long-lived assets to be disposed of by sale with carrying values of
$0.8 million
, had
zero
write-downs, resulting in a reported fair value of
$0.8 million
.
128
FIRST INTERSTATE BANCSYSTEM, INC. AND SUBSIDIARIES
NOTES TO CONSOLIDATED FINANCIAL STATEMENTS
(Dollars in millions, except share and per share data)
The following table presents additional quantitative information about assets measured at fair value on a non-recurring basis and for which the Company has utilized Level 3 inputs to determine fair values:
|
As of December 31, 2018
|
Fair
Value
|
Valuation
Technique
|
Unobservable
Inputs
|
Range
(Weighted Average)
|
|||||
|
Impaired loans
|
$
|
24.1
|
|
Appraisal
|
Appraisal adjustment
|
0%
|
-
|
26%
|
(13%)
|
|
Other real estate owned
|
0.6
|
|
Appraisal
|
Appraisal adjustment
|
8%
|
-
|
96%
|
(39%)
|
|
|
Long-lived assets to be disposed of by sale
|
4.9
|
|
Appraisal
|
Appraisal adjustment
|
0%
|
-
|
43%
|
(10%)
|
|
|
As of December 31, 2017
|
Fair
Value
|
Valuation
Technique
|
Unobservable
Inputs
|
Range
(Weighted Average)
|
|||||
|
Impaired loans
|
$
|
32.6
|
|
Appraisal
|
Appraisal adjustment
|
0%
|
-
|
78%
|
(26%)
|
|
Other real estate owned
|
1.3
|
|
Appraisal
|
Appraisal adjustment
|
8%
|
-
|
96%
|
(12%)
|
|
|
Long-lived assets to be disposed of by sale
|
0.8
|
|
Appraisal
|
Appraisal adjustment
|
0%
|
-
|
0%
|
0%
|
|
The Company is required to disclose the fair value of financial instruments for which it is practical to estimate fair value. The methodologies for estimating the fair value of financial instruments that are measured at fair value on a recurring or non-recurring basis are discussed above. The methodologies for estimating the fair value of other financial instruments are discussed below. For financial instruments bearing a variable interest rate where no credit risk exists, it is presumed that recorded book values are reasonable estimates of fair value.
Financial Assets.
Carrying values of cash, cash equivalents and accrued interest receivable approximate fair values due to the liquid and/or short-term nature of these instruments. Fair values for investment securities held-to-maturity are obtained from an independent pricing service, which considers observable data that may include dealer quotes, market spreads, cash flows, the U.S. Treasury yield curve, live trading levels, trade execution data, market consensus prepayment speeds, credit information and the investment’s terms and conditions, among other things. Fair values of fixed rate loans and variable rate loans that reprice on an infrequent basis are estimated by discounting future cash flows using current interest rates at which similar loans with similar terms would be made to borrowers of similar credit quality. Carrying values of variable rate loans that reprice frequently, and with no change in credit risk, approximate the fair values of these instruments.
Financial Liabilities.
The fair values of demand deposits, savings accounts, securities sold under repurchase agreements and accrued interest payable are the amounts payable on demand at the reporting date. The fair values of fixed-maturity certificates of deposit are estimated using external market rates currently offered for deposits with similar remaining maturities. The fair values of derivative liabilities are obtained from an independent pricing service, which considers observable data that may include the three-month LIBOR forward curve, the federal funds effective swap rate and cash flows, among other things. The carrying values of the interest bearing demand notes to the United States Treasury are deemed an approximation of fair values due to the frequent repayment and repricing at market rates. The fixed and floating rate subordinated debentures, floating rate subordinated term loan, notes payable to the FHLB, fixed rate subordinated term debt, and capital lease obligation are estimated by discounting future cash flows using current rates for advances with similar characteristics.
Commitments to Extend Credit and Standby Letters of Credit.
The fair value of commitments to extend credit and standby letters of credit, based on fees currently charged to enter into similar agreements, is not significant.
129
FIRST INTERSTATE BANCSYSTEM, INC. AND SUBSIDIARIES
NOTES TO CONSOLIDATED FINANCIAL STATEMENTS
(Dollars in millions, except share and per share data)
The estimated fair values of financial instruments that are reported in the Company’s consolidated balance sheets, segregated by the level of the valuation inputs within the fair value hierarchy utilized to measure fair value, are as follows:
|
`
|
Fair Value Measurements at Reporting Date Using
|
||||||||||||||
|
As of December 31, 2018
|
Carrying Amount
|
Estimated
Fair Value
|
Quoted Prices in
Active Markets for Identical Assets (Level 1) |
Significant Other
Observable Inputs (Level 2) |
Significant
Unobservable Inputs (Level 3) |
||||||||||
|
Financial assets:
|
|
|
|
|
|
|
|||||||||
|
Cash and cash equivalents
|
$
|
822.0
|
|
$
|
822.0
|
|
$
|
822.0
|
|
$
|
—
|
|
$
|
—
|
|
|
Investment debt securities available-for-sale
|
2,270.7
|
|
2,270.7
|
|
—
|
|
2,270.7
|
|
—
|
|
|||||
|
Investment debt securities held-to-maturity
|
406.8
|
|
400.7
|
|
—
|
|
400.7
|
|
—
|
|
|||||
|
Accrued interest receivable
|
44.9
|
|
44.9
|
|
—
|
|
44.9
|
|
—
|
|
|||||
|
Mortgage servicing rights, net
|
27.7
|
|
42.4
|
|
—
|
|
42.4
|
|
—
|
|
|||||
|
Loans held for sale
|
33.3
|
|
33.3
|
|
—
|
|
33.3
|
|
—
|
|
|||||
|
Net loans held for investment
|
8,397.4
|
|
8,439.7
|
|
—
|
|
8,415.6
|
|
24.1
|
|
|||||
|
Derivative assets
|
10.1
|
|
10.1
|
|
—
|
|
10.1
|
|
—
|
|
|||||
|
Deferred compensation plan assets
|
12.1
|
|
12.1
|
|
—
|
|
12.1
|
|
—
|
|
|||||
|
Total financial assets
|
$
|
12,025.0
|
|
$
|
12,075.9
|
|
$
|
822.0
|
|
$
|
11,229.8
|
|
$
|
24.1
|
|
|
|
|
|
|
||||||||||||
|
Financial liabilities:
|
|||||||||||||||
|
Total deposits, excluding time deposits
|
$
|
9,363.7
|
|
$
|
9,363.7
|
|
$
|
9,363.7
|
|
$
|
—
|
|
$
|
—
|
|
|
Time deposits
|
1,317.0
|
|
1,299.0
|
|
—
|
|
1,299.0
|
|
—
|
|
|||||
|
Securities sold under repurchase agreements
|
712.4
|
|
712.4
|
|
—
|
|
712.4
|
|
—
|
|
|||||
|
Accrued interest payable
|
7.8
|
|
7.8
|
|
—
|
|
7.8
|
|
—
|
|
|||||
|
Long-term debt
|
15.8
|
|
13.0
|
|
—
|
|
13.0
|
|
—
|
|
|||||
|
Subordinated debentures held by subsidiary trusts
|
86.9
|
|
84.9
|
|
—
|
|
84.9
|
|
—
|
|
|||||
|
Derivative liabilities
|
9.4
|
|
9.4
|
|
—
|
|
9.4
|
|
—
|
|
|||||
|
Deferred compensation plan liabilities
|
12.1
|
|
12.1
|
|
—
|
|
12.1
|
|
—
|
|
|||||
|
Total financial liabilities
|
$
|
11,525.1
|
|
$
|
11,502.3
|
|
$
|
9,363.7
|
|
$
|
2,138.6
|
|
$
|
—
|
|
130
FIRST INTERSTATE BANCSYSTEM, INC. AND SUBSIDIARIES
NOTES TO CONSOLIDATED FINANCIAL STATEMENTS
(Dollars in millions, except share and per share data)
|
Fair Value Measurements at Reporting Date Using
|
|||||||||||||||
|
As of December 31, 2017
|
Carrying Amount
|
Estimated
Fair Value
|
Quoted Prices in
Active Markets for Identical Assets (Level 1) |
Significant Other
Observable Inputs (Level 2) |
Significant
Unobservable Inputs (Level 3) |
||||||||||
|
Financial assets:
|
|
|
|
|
|
||||||||||
|
Cash and cash equivalents
|
$
|
759.0
|
|
$
|
759.0
|
|
$
|
759.0
|
|
$
|
—
|
|
$
|
—
|
|
|
Investment debt securities available-for-sale
|
2,208.7
|
|
2,208.7
|
|
—
|
|
2,208.7
|
|
—
|
|
|||||
|
Investment debt securities held-to-maturity
|
484.5
|
|
483.3
|
|
—
|
|
483.3
|
|
—
|
|
|||||
|
Accrued interest receivable
|
38.0
|
|
38.0
|
|
—
|
|
38.0
|
|
—
|
|
|||||
|
Mortgage servicing rights, net
|
24.8
|
|
40.1
|
|
—
|
|
40.1
|
|
—
|
|
|||||
|
Loans held for sale
|
46.6
|
|
46.6
|
|
—
|
|
46.6
|
|
—
|
|
|||||
|
Net loans held for investment
|
7,495.6
|
|
7,252.2
|
|
—
|
|
7,219.6
|
|
32.6
|
|
|||||
|
Derivative assets
|
8.8
|
|
8.8
|
|
—
|
|
8.8
|
|
—
|
|
|||||
|
Deferred compensation plan assets
|
12.2
|
|
12.2
|
|
—
|
|
12.2
|
|
—
|
|
|||||
|
Total financial assets
|
$
|
11,078.2
|
|
$
|
10,848.9
|
|
$
|
759.0
|
|
$
|
10,057.3
|
|
$
|
32.6
|
|
|
Financial liabilities:
|
|
|
|
|
|||||||||||
|
Total deposits, excluding time deposits
|
$
|
8,783.0
|
|
$
|
8,783.0
|
|
$
|
8,783.0
|
|
$
|
—
|
|
$
|
—
|
|
|
Time deposits
|
1,151.9
|
|
1,137.9
|
|
—
|
|
1,137.9
|
|
—
|
|
|||||
|
Securities sold under repurchase agreements
|
643.0
|
|
643.0
|
|
—
|
|
643.0
|
|
—
|
|
|||||
|
Other borrowed funds
|
20.0
|
|
20.0
|
|
—
|
|
20.0
|
|
—
|
|
|||||
|
Accrued interest payable
|
5.6
|
|
5.6
|
|
—
|
|
5.6
|
|
—
|
|
|||||
|
Long-term debt
|
13.1
|
|
11.3
|
|
—
|
|
11.3
|
|
—
|
|
|||||
|
Subordinated debentures held by subsidiary trusts
|
82.5
|
|
76.7
|
|
—
|
|
76.7
|
|
—
|
|
|||||
|
Derivative liabilities
|
7.9
|
|
7.9
|
|
—
|
|
7.9
|
|
—
|
|
|||||
|
Deferred compensation plan liabilities
|
12.2
|
|
12.2
|
|
—
|
|
12.2
|
|
—
|
|
|||||
|
Total financial liabilities
|
$
|
10,719.2
|
|
$
|
10,697.6
|
|
$
|
8,783.0
|
|
$
|
1,914.6
|
|
$
|
—
|
|
|
(26)
|
RELATED PARTY TRANSACTIONS
|
Certain executive officers, directors and greater than
5%
shareholders of the Company and certain entities and individuals related to such persons, incurred indebtedness in the form of loans, as customers, of
$43.2 million
and
$54.6 million
at
December 31, 2018
and
2017
, respectively. During
2018
, new loans and advances on existing loans of
$7.6 million
were funded and loan repayments totaled
$17.4 million
. In addition,
$1.6 million
of loans were removed due to changes in related parties during the year. These loans were made on substantially the same terms, including interest rates and collateral, as those prevailing at the time for comparable loans with persons not related to the Company and do not involve more than a normal risk of collectability or present other unfavorable features.
131
FIRST INTERSTATE BANCSYSTEM, INC. AND SUBSIDIARIES
NOTES TO CONSOLIDATED FINANCIAL STATEMENTS
(Dollars in millions, except share and per share data)
The Company leases an aircraft from an entity wholly-owned by the chairman of the Board of Directors of the Company. Under the terms of the lease, we pay a fee for each flight hour plus certain third party operating expenses related to the aircraft. During
2018
,
2017
and
2016
, the Company paid total fees and operating expenses of
$53 thousand
,
$45 thousand
and
$121 thousand
respectively, for its use of the aircraft. In addition, we lease a portion or our hanger and provide pilot services to the related entity. During
2018
,
2017
and
2016
, the Company received payments from the related entity of
$25 thousand
,
$17 thousand
and
$19 thousand
, respectively, for hangar use, pilot fees, and reimbursement of certain third party operating expenses related to the chairman’s personal use of the aircraft.
The Company purchases services from an entity which includes certain members of the Company’s control group. Services provided for the Company’s benefit include shareholder education and communication, strategic enterprise planning and corporate governance consultation. During
2018
,
2017
and
2016
, the Company paid
$80 thousand
,
$73 thousand
and
$100 thousand
, respectively, for these services.
|
(27)
|
RECENT AUTHORITATIVE ACCOUNTING GUIDANCE
|
ASU 2014-09, “Revenue from Contracts with Customers.”
In May 2014, the FASB issued ASU 2014-09, “Revenue from Contracts with Customers (Topic 606).” ASU 2014-09 introduced a new five-step revenue recognition model in which an entity should recognize revenue to depict the transfer of promised goods or services to customers in an amount that reflects the consideration to which the entity expects to be entitled in exchange for those goods or services. ASU 2014-09 also requires disclosures sufficient to enable users to understand the nature, amount, timing, and uncertainty of revenue and cash flows arising from contracts with customers, including qualitative and quantitative disclosures about contracts with customers, significant judgments and changes in judgments, and assets recognized from the costs to obtain or fulfill a contract.
ASU 2015-14, “Revenue from Contracts with Customers (Topic 606) – Deferral of the Effective Date” was released in August of 2015 deferring the effective date of ASU 2014-09 for all entities by one year until January 1, 2018.
ASU 2016-08, “Revenue from Contracts with Customers (Topic 606): Principal vs Agent Considerations (Reporting Revenue Gross versus Net)” was released in March of 2016 to clarify certain principal versus agent considerations within the implementation guidance of ASC Topic 606, “Revenue from Contracts with Customers.” The effective date and transition of ASU 2016-08 is the same as the effective date and transition of ASU 2014-09, Revenue from Contracts with Customers (Topic 606), as discussed above.
ASU 2016-10, “Revenue from Contracts with Customers (Topic 606): Identifying Performance Obligations and Licensing” was released in April 2016 to clarify ASC Topic 606, “Revenue from Contracts with Customers” related to (i) identifying performance obligations; and (ii) the licensing implementation guidance. The effective date and transition of ASU 2016-10 is the same as the effective date and transition of ASU 2014-09, “Revenue from Contracts with Customers (Topic 606),” as discussed above.
The new revenue recognition standards became effective for the Company on January 1, 2018, and did not have a material impact to our net income, or have a significant impact on the Company’s consolidated financial statements, results of operations or liquidity.
132
FIRST INTERSTATE BANCSYSTEM, INC. AND SUBSIDIARIES
NOTES TO CONSOLIDATED FINANCIAL STATEMENTS
(Dollars in millions, except share and per share data)
ASU 2016-01 “Financial Instruments – Overall : Recognition and Measurement of Financial Assets and Financial Liabilities.”
In January 2016, the FASB issued ASU 2016-01, “Financial Instruments - Overall (Subtopic 825-10): Recognition and Measurement of Financial Assets and Financial Liabilities.” The amendments in ASU 2016-01, among other things, (i) require equity investments, with certain exceptions, to be measured at fair value with changes in fair value recognized in net income, (ii) simplifies the impairment assessment of equity investments without readily determinable fair values by requiring a qualitative assessment to identify impairment, (iii) eliminates the requirement for public business entities to disclose the methods and significant assumptions used to estimate the fair value that is required to be disclosed for financial instruments measured at amortized cost on the balance sheet, (iv) requires public business entities to use the exit price notion when measuring the fair value of financial instruments for disclosure purposes, (v) requires an entity to present separately in other comprehensive income the portion of the total change in the fair value of a liability resulting from a change in the instrument-specific credit risk when the entity has elected to measure the liability at fair value in accordance with the fair value option for financial instruments, (vi) requires separate presentation of financial assets and financial liabilities by measurement category and form of financial asset on the balance sheet or the accompanying notes to the financial statements and (viii) clarifies that an entity should evaluate the need for a valuation allowance on a deferred tax asset related to available-for-sale investment securities. The amendments in ASU 2016-01 became effective for the Company on January 1, 2018, and did not have a significant impact on the Company’s consolidated financial statements, results of operations or liquidity.
ASU 2016-02 “Leases (Topic 842).”
In February 2016, the FASB issued ASU 2016-02, “Leases (Topic 842).” Under the new guidance, lessees will be required to recognize a lease liability and a right of use asset for all leases (with the exception of short-term leases) at the commencement date of the lease and disclose key information about leasing arrangements. Accounting by lessors is largely unchanged. ASU 2016-02 will be effective for the Company on January 1, 2019 and will be applied using a modified retrospective approach for leases existing at, or entered into after, the beginning of the earliest comparative period presented in the financial statements. Additionally, in July 2018, the FASB issued ASU 2018-11 to provide entities with an additional (and optional) transition method to adopt the new leases standard. Under this new transition method, an entity initially applies the new leases standard at the adoption date and recognizes a cumulative-effect adjustment to the opening balance of retained earnings in the period of adoption. In December 2018, the FASB also issued ASU 2018-20, “Leases (Topic 842) - Narrow-Scope Improvements for Lessors,” which provides for certain policy elections and changes lessor accounting for sales and similar taxes and certain lessor costs. Upon adoption of ASU 2016-02, ASU 2018-11 and ASU 2018-20 on January 1, 2019, we expect to recognize right-of-use assets and related lease liabilities totaling
$54.6 million
and
$54.6 million
, respectively. We expect to elect to apply certain practical expedients provided under ASU 2016-02 whereby we will not reassess (i) whether any expired or existing contracts are or contain leases, (ii) the lease classification for any expired or existing leases and (iii) initial direct costs for any existing leases. We also do not expect to apply the recognition requirements of ASU 2016-02 to any short-term leases (as defined by related accounting guidance). We expect to account for lease and non-lease components separately because such amounts are readily determinable under our lease contracts. The Company has determined the new guidance in ASU 2016-02 will have an immaterial impact on its consolidated results of operations and liquidity.
133
FIRST INTERSTATE BANCSYSTEM, INC. AND SUBSIDIARIES
NOTES TO CONSOLIDATED FINANCIAL STATEMENTS
(Dollars in millions, except share and per share data)
ASU No. 2016-13 “Financial Instruments – Credit Losses (Topic 326): Measurement of Credit Losses on Financial Instruments.”
The amendments in ASU 2016-13 require a financial asset or group of financial assets measured at amortized cost basis to be presented on a company’s financial statements at the net amount expected to be collected based on historical experience, current conditions and reasonable and supportable forecasts. ASU 2016-13 requires a company’s income statement to reflect the measurement of credit losses for newly recognized financial assets as well as the expected increases or decreases of expected credit losses that have taken place during the period. The amendments in ASU 2016-13 require that the allowance for credit losses for purchased financial assets with a more-than-insignificant amount of credit deterioration since origination be measured at amortized cost basis with the initial allowance for credit losses added to the purchase price rather than being reported as a credit loss expense. ASU 2016-13 also requires that credit losses relating to available-for-sale debt securities be recorded through an allowance for credit losses. The amendments in ASU 2016-13 are effective for the Company for fiscal years beginning after December 15, 2019, including interim periods within those fiscal years. The amendments will be applied through a cumulative-effect adjustment to retained earnings as of the beginning of the first reporting period. A prospective transition approach is required for debt securities for which other-than-temporary impairment was recognized before the effective date. Amounts previously recognized in accumulated other comprehensive income as of the date of adoption that relate to improvement in cash flows expected to be collected will continue to be accreted into income over the remaining life of the asset. Recoveries of amounts previously written off relating to improvements in cash flows after the date of adoption will be recorded in earnings when received. We are currently evaluating the potential impact of ASU 2016-13 on our financial statements, which will be effective on January 1, 2020. We have formed a cross-functional working group comprised of individuals from various functional areas including credit, risk management, finance and information technology, among others. We are currently working through our implementation plan which includes assessment and documentation of processes, internal controls and data sources; model development and documentation; and system configuration, among other things. We have selected and are in the process of implementing a third-party vendor solution. The adoption of ASU 2016-13 could result in an increase in the allowance for loan losses as a result of changing from an “incurred loss” model, which encompasses allowances for current known and inherent losses within the portfolio, to an “expected loss” model, which encompasses allowances for losses expected to be incurred over the life of the portfolio. The adoption will also necessitate that we establish an allowance for expected credit losses for certain debt securities and other financial assets. While we are currently unable to reasonably estimate the impact of adopting ASU 2016-13, we expect that the impact of adoption will be significantly influenced by the composition, characteristics and quality of our loan and securities portfolios as well as the prevailing economic conditions and forecasts as of the adoption date.
ASU No. 2016-15 “Statement of Cash Flows (Topic 230): Classification of Certain Cash Receipts and Cash Payments.”
The amendments in ASU 2016-15 are intended to reduce diversity in practice in how eight particular transactions are classified in the statement of cash flows. The amendments in ASU 2016-15 became effective for the Company on January 1, 2018, and did not have a significant impact on the Company’s consolidated financial statements, results of operations or liquidity.
ASU No. 2017-01, “Business Combinations (Topic 805): Clarifying the Definition of a Business.”
ASU 2017-01 clarifies the definition of a business with the objective of adding guidance to assist entities with evaluating whether transactions should be accounted for as acquisitions (or disposals) of assets or businesses. The amendments in this update provide a screen to determine when a set is not a business. The screen requires that when substantially all of the fair value of the gross assets acquired (or disposed of) is concentrated in a single identifiable asset or a group of similar identifiable assets, the set is not a business. This screen reduces the number of transactions that need to be further evaluated. If the screen is not met, the amendments in this update (1) require that to be considered a business, a set must include, at a minimum, an input and a substantive process that together significantly contribute to the ability to create output and (2) remove the evaluation of whether a market participant could replace missing elements. The amendments provide a framework to assist entities in evaluating whether both an input and a substantive process are present. The framework includes two sets of criteria to consider that depend on whether a set has outputs. ASU 2017-01 is effective for fiscal years beginning after December 15, 2017, including interim periods within those fiscal years. The amendments in ASU 2017-01 became effective for the Company on January 1, 2018, and did not have a significant impact on the Company’s consolidated financial statements, results of operations or liquidity.
134
FIRST INTERSTATE BANCSYSTEM, INC. AND SUBSIDIARIES
NOTES TO CONSOLIDATED FINANCIAL STATEMENTS
(Dollars in millions, except share and per share data)
ASU No. 2017-04, “Intangibles – Goodwill and Other (Topic 350): Simplifying the Test for Goodwill Impairment.”
The amendments in ASU 2017-04 remove Step 2 of the goodwill impairment test, which requires a hypothetical purchase price allocation. Goodwill impairment will now be the amount by which a reporting unit’s carrying value exceeds its fair value, not to exceed the carrying amount of goodwill. All other goodwill impairment guidance will remain largely unchanged. ASU No. 2017-04 is effective for interim and annual reporting periods beginning after December 15, 2019, applied prospectively. Early adoption is permitted for any impairment tests performed after January 1, 2017. The amendments in ASU 2017-04 were early adopted by the Company in the third quarter of 2018, in conjunction with its annual goodwill impairment test. The annual test did not result in any impairment.
ASU No. 2017-07, “Compensation – Retirement Benefits (Topic 750): Improving the Presentation of Net Periodic Pension Cost and Net Periodic Postretirement Benefit Cost.”
The amendments in ASU 2017-07 requires employers to present the service cost component of the net periodic benefit cost in the same income statement line item as other employee compensation costs arising from services rendered during the period. The other components of net benefit cost are required to be presented in the income separately from the service cost component and outside a subtotal of income from operations, if one is presented. The amendments in ASU 2017-07 also allow only the service cost component to be eligible for capitalization. The amendments in ASU 2017-07 are applied retrospectively for the presentation of the service cost and other components of net periodic benefit cost in the income statement and prospectively for the capitalization of the service cost in other assets. ASU 2017-07 allows the use of a practical expedient that permits an employer to use the amounts disclosed in its pension and other post-retirement benefits plan footnote for the prior comparative periods as the estimation basis for applying the retrospective presentation requirements. ASU 2017-07 is effective for the Company for interim and annual reporting periods beginning after December 15, 2017. The amendments in ASU 2017-07 became effective for the Company on January 1, 2018, and did not have a significant impact on the Company’s consolidated financial statements, results of operations or liquidity.
ASU No. 2017-08, “Receivables – Nonrefundable Fees and Other Costs (Subtopic 310-20): Premium Amortization on Purchased Callable Debt Securities.”
The amendments in ASU 2017-08 shorten the amortization period for the premium on certain purchased callable debt securities to the earliest call date. The new guidance does not change the accounting for purchased callable debt securities held at a discount; the discount continues to be amortized to maturity. ASU No. 2017-08 is effective for interim and annual reporting periods beginning after December 15, 2018, with early adoption permitted. The guidance calls for a modified retrospective transition approach under which a cumulative-effect adjustment will be made to retained earnings as of the beginning of the first reporting period in which the guidance is adopted. The Company currently amortizes premiums on callable debt securities to the earliest call date. As such, the amendments in ASU 2017-08 will not impact the Company’s consolidated financial statements, results of operations and liquidity.
ASU 2017-09, “Compensation - Stock Compensation (Topic 718): Scope of Modification Accounting.”
In May 2017, the FASB issued ASU 2017-09, which clarifies when a change to the terms or conditions of a share-based payment award must be accounted for as a modification. Under the new guidance, an entity will not apply modification accounting to a share-based payment award if there is no change to the award’s fair value, vesting conditions and classification as an equity or liability instrument. The guidance is effective prospectively for all companies for annual periods beginning after December 15, 2017. The amendments in ASU 2017-09 became effective for the Company on January 1, 2018, and did not have a significant impact on the Company’s consolidated financial statements, results of operations or liquidity.
ASU 2017-12, “Derivatives and Hedging (Topic 815): Targeted Improvements to Accounting for Hedging Activities.”
In August 2017, the FASB issued ASU 2017-12, Derivatives and Hedging: Targeted Improvements to Accounting for Hedging Activities (ASU 2017-12). The purpose of this updated guidance is to better align a company’s financial reporting for hedging activities with the economic objectives of those activities. ASU 2017-12 is effective for public business entities for fiscal years beginning after December 15, 2018, with early adoption, including adoption in an interim period, permitted. ASU 2017-12 requires a modified retrospective transition method in which the Company will recognize the cumulative effect of the change on the beginning balance of each affected component of equity in the statement of financial position as of the date of adoption. ASU 2017-12 will be effective for us on January 1, 2019 and is not expected to have a significant impact on our financial statements.
135
FIRST INTERSTATE BANCSYSTEM, INC. AND SUBSIDIARIES
NOTES TO CONSOLIDATED FINANCIAL STATEMENTS
(Dollars in millions, except share and per share data)
ASU 2018-02, “Income Statement – Reporting Comprehensive Income (Topic 220): Reclassification of Certain Tax Effects from Accumulated Other Comprehensive Income.”
In February 2018, the FASB issued ASU 2018-02, Income Statement - Reporting Comprehensive Income: Reclassification of Certain Tax Effects from Accumulated Other Comprehensive Income (ASU 2018-02). The purpose of this updated guidance is to allow a reclassification from accumulated other comprehensive income to retained earnings for stranded tax effects resulting from the Tax Cuts and Jobs Act. However, because the amendments only relate to the reclassification of the income tax effects of the Tax Cuts and Jobs Act, the underlying guidance that requires that the effect of a change in tax laws or rates be included in income from continuing operations is not affected. The updated amendments are effective for all entities for fiscal years beginning after December 15, 2018, and interim periods within those fiscal years. Early adoption is permitted and should be applied either in the period of adoption or retrospectively to each period (or periods) in which the effect of the change in the U.S. federal corporate income tax rate in the Tax Cuts and Jobs Act is recognized. The Company early adopted ASU 2018-02, which resulted in the reclassification from accumulated other comprehensive income to retained earnings totaling
$3.1 million
, reflected in the Consolidated Statements of Changes in Stockholders’ Equity.
ASU 2018-13, “Fair Value Measurement (Topic 820): Disclosure Framework – Changes to the Disclosure Requirements for Fair Value Measurement.”
In August 2018, the FASB issued ASU 2018-13, Fair Value Measurement: Disclosure Framework - Changes to the Disclosure Requirements for Fair Value Measurement (ASU 2018-13). The amendments in this Update removes, modifies, and adds to the disclosure requirements on fair value measurements in Topic 820, Fair Value Measurement, based on the concepts in the Concepts Statement, including the consideration of costs and benefits. The amendments in this Update are effective for all entities for fiscal years, and interim periods within those fiscal years, beginning after December 15, 2019. The amendments on changes in unrealized gains and losses, the range and weighted average of significant unobservable inputs used to develop Level 3 fair value measurements, and the narrative description of measurement uncertainty should be applied prospectively for only the most recent interim or annual period presented in the initial fiscal year of adoption. All other amendments should be applied retrospectively to all periods presented upon their effective date. Early adoption is permitted. An entity is permitted to early adopt any removed or modified disclosures upon issuance of this Update and delay adoption of the additional disclosures until their effective date. While the Company continues to assess all potential impacts of the standard, we currently expect adoption to have an immaterial impact on our consolidated financial statements disclosures.
ASU 2018-14, “Compensation – Retirement Benefits – Defined Benefit Plans – General (Subtopic 715-20): Disclosure Framework – Changes to the Disclosure Requirements for Defined Benefit Plans.”
In August 2018, the FASB issued ASU 2018-14, Compensation – Retirement Benefits – Defined Benefit Plans – General: Disclosure Framework - Changes to the Disclosure Requirements for Defined Benefit Plans (ASU 2018-14). The amendments in this Update remove disclosures that no longer are considered cost beneficial, clarify the specific requirements of disclosures, and add disclosure requirements identified as relevant. Although narrow in scope, the amendments are considered an important part of the Board’s efforts to improve the effectiveness of disclosures in the notes to financial statements by applying concepts in the Concepts Statement. The amendments in this Update are effective for fiscal years ending after December 15, 2020, for public business entities. Early adoption is permitted. While the Company continues to assess all potential impacts of the standard, we currently expect adoption to have an immaterial impact on our consolidated financial statements disclosures.
ASU 2018-15, “Intangibles - Goodwill and Other - Internal-Use Software (Subtopic 350-40) - Customer’s Accounting for Implementation Costs Incurred in a Cloud Computing Arrangement That Is a Service Contract.”
In August 2018, the FASB issued ASU 2018-15, Intangibles—Goodwill and Other— Internal-Use Software (Subtopic 350-40). The amendments in this Update clarifies certain aspects of ASU 2015-05, “Customer’s Accounting for Fees Paid in a Cloud Computing Arrangement,” which was issued in April 2015. ASU 2018-15 aligns the requirements for capitalizing implementation costs incurred in a hosting arrangement that is a service contract with the requirements for capitalizing implementation costs incurred to develop or obtain internal-use software (and hosting arrangements that include an internal-use software license). The accounting for the service element of a hosting arrangement that is a service contract is not affected by the Update. The amendments in this Update are effective for fiscal years beginning after December 15, 2019, for public business entities. Early adoption is permitted. While the Company continues to assess all potential impacts of the standard, we currently expect adoption to have an immaterial impact on our consolidated financial statements disclosures.
136
FIRST INTERSTATE BANCSYSTEM, INC. AND SUBSIDIARIES
NOTES TO CONSOLIDATED FINANCIAL STATEMENTS
(Dollars in millions, except share and per share data)
ASU 2018-16, “Derivatives and Hedging (Topic 815) - Inclusion of the Secured Overnight Financing Rate (SOFR) Overnight Index Swap (OIS) Rate as a Benchmark Interest Rate for Hedge Accounting Purposes.”
In October 2018, the FASB issued ASU 2018-16, Inclusion of the Secured Overnight Financing Rate (SOFR) Overnight Index Swap (OIS) Rate as a Benchmark Interest Rate for Hedge Accounting Purposes. The amendments in this Update permit use of the OIS rate based on SOFR as a U.S. benchmark interest rate for hedge accounting purposes under Topic 815 in addition to the interest rates on direct U.S. Treasury obligations, the LIBOR swap rate, the OIS rate based on the Fed Funds Effective Rate and the Securities Industry and Financial Markets Association (SIFMA) Municipal Swap Rate. The amendments in this Update are required to be adopted concurrently with the amendments in Update 2017-12 and will be effective for us on January 1, 2019. The adoption of the Update is not expected to have a significant impact on our financial statements.
|
(28)
|
SUBSEQUENT EVENTS
|
Subsequent events have been evaluated for potential recognition and disclosure through the date financial statements were filed with the Securities and Exchange Commission.
On
January 29, 2019
, the Company declared a quarterly dividend to common shareholders of
$0.31
per share, which was paid on
February 21, 2019
to shareholders of record as of
February 11, 2019
.
No other events requiring recognition or disclosure were identified.
137
|
(a)
|
2. Financial statement schedules
|
All other schedules to the consolidated financial statements of the Registrant are omitted since the required information is either not applicable, deemed immaterial, or is shown in the respective financial statements or in notes thereto.
(a)
3. Exhibits
|
Exhibit
Number
|
Description
|
|
|
|
|
|
|
Agreement and Plan of Merger between First Interstate BancSystem, Inc. and Northwest Bancorporation, Inc. dated April 25, 2018 (incorporated herein by reference to Exhibit 2.1 to the Company’s Current Report on Form 8-K, File No. 001-34653, filed on April 26, 2018)
|
||
|
Agreement and Plan of Merger between First Interstate BancSystem, Inc. and Idaho Independent Bank dated October 11, 2018 (incorporated herein by reference to Exhibit 2.1 to the Company’s Current Report on Form 8-K, File No. 001-34653, filed on October 11, 2018)
|
||
|
Agreement and Plan of Merger between First Interstate BancSystem, Inc. and Community 1
st
Bank dated October 11, 2018 (incorporated herein by reference to Exhibit 2.1 to the Company’s Current Report on Form 8-K, File No. 001-34653, filed on October 11, 2018)
|
||
|
Second Amended and Restated Articles of Incorporation dated May 30, 2017 (incorporated herein by reference to Exhibit 3.1 to the Company’s Quarterly Report on Form 10-Q, File No. 001-34653, filed for the quarter ended June 30, 2017)
|
||
|
|
|
|
|
Third Amended and Restated Bylaws dated May 24, 2017 (incorporated herein by reference to Exhibit 3.2 to the Company’s Quarterly Report on Form 10-Q, File No. 001-34653, filed for the quarter ended June 30, 2017)
|
||
|
|
|
|
|
10.1
*
|
Lease Agreement between Billings 401 Joint Venture and First Interstate Bank Montana dated September 20, 1985 and addendum thereto (incorporated herein by reference to Exhibit 10.1 to the Company’s Annual Report on Form 10-K, File No. 001-34653, filed for the year ended December 31, 2017)
|
|
|
|
|
|
|
10.2
†
|
First Interstate BancSystem’s Deferred Compensation Plan dated December 1, 2006 (incorporated herein by reference to Exhibit 10.9 to the Company’s Pre-Effective Amendment No. 3 to Registration Statement on Form S-1, File No. 333-164380, filed on March 23, 2010)
|
|
|
|
|
|
|
10.3
†
|
First Amendment to the First Interstate BancSystem’s Deferred Compensation Plan dated October 24, 2008 (incorporated herein by reference to Exhibit 10.10 to the Company’s Pre-Effective Amendment No. 3 to Registration Statement on Form S-1, No. 333-164380, filed on March 23, 2010)
|
|
|
|
|
|
|
10.4
†
|
2001 Stock Option Plan, as amended (incorporated herein by reference to Exhibit 4.12 to the Company’s Registration Statement on Form S-8, No. 333-106495, filed on June 25, 2003)
|
|
|
|
|
|
|
10.5
†
|
Second Amendment to 2001 Stock Option Plan (incorporated herein by reference to Exhibit 10.6 to the Company’s Quarterly Report on Form 10-Q, File No. 001-34653, filed for the quarter ended September 30, 2010)
|
|
|
|
|
|
|
10.6
†
|
First Interstate BancSystem, Inc. 2006 Equity Compensation Plan, amended and restated as of November 21, 2013 (incorporated herein by reference to Exhibit 4.3 to the Company’s Registration Statement on Form S-8, No. 333-193543, filed on January 24, 2014)
|
|
|
|
|
|
|
10.8
*†
|
First Interstate BancSystem, Inc. 2015 Equity and Incentive Plan , amended and restated as of January 1, 2019
|
|
|
10.9
*†
|
First Interstate BancSystem, Inc. 2015 Equity and Incentive Plan Performance Restricted Stock Grant Agreement
|
|
|
10.10
*†
|
First Interstate BancSystem, Inc. 2015 Equity and Incentive Plan Performance Time Vested Restricted Stock Grant Agreement
|
|
|
10.11
*†
|
First Interstate BancSystem, Inc. Director Compensation
|
|
138
|
10.12
*†
|
Executive Employment Agreement between First Interstate BancSystem, Inc. and Kevin P. Riley dated April 3, 2018 (incorporated herein by reference to Exhibit 10.1 to the Company’s Current Report on Form 8-K, File No. 001-34653, filed on April 5, 2018)
|
|
|
10.13
*†
|
Executive Employment Agreement between First Interstate BancSystem, Inc. and Marcy D. Mutch dated April 3, 2018 (incorporated herein by reference to Exhibit 10.2 to the Company’s Current Report on Form 8-K, File No. 001-34653, filed on April 5, 2018)
|
|
|
10.14
*†
|
Executive Employment Agreement between First Interstate BancSystem, Inc. and Renee L. Newman dated April 3, 2018.
|
|
|
10.15
*†
|
Executive Employment Agreement between First Interstate BancSystem, Inc. and Jodi Delahunt Hubbell dated April 3, 2018.
|
|
|
10.16
*†
|
Executive Employment Agreement between First Interstate BancSystem, Inc. and Philip G. Gaglia dated April 3, 2018.
|
|
|
Code of Ethics for Chief Executive Officer and Senior Financial Officers (incorporated herein by reference to Exhibit 14.1 to the Company’s Annual Report on Form 10-K, File No. 001-34653, filed for the fiscal year ended December 31, 2010)
|
||
|
|
|
|
|
21.1
*
|
Subsidiaries of First Interstate BancSystem, Inc.
|
|
|
23.1
*
|
Consent of RSM US LLP Independent Registered Public Accounting Firm
|
|
|
31.1
*
|
Certification by Chief Executive Officer pursuant to Rule 13a-14(a) and Rule 15d-14(a) under the Securities Exchange Act of 1934, as amended.
|
|
|
31.2
*
|
Certification by Chief Financial Officer pursuant to Rule 13a-14(a) and Rule 15d-14(a) under the Securities Exchange Act of 1934, as amended.
|
|
|
|
|
|
|
32
**
|
18 U.S.C.
Section 1350 Certifications.
|
|
|
101*
|
Interactive data file
|
|
|
|
|
|
† Management contract or compensatory plan or arrangement.
* Filed herewith.
** Furnished (not filed) herewith.
|
(b)
|
Exhibits
|
See Item 15(a)3 above.
|
(c)
|
Financial Statements Schedules
|
See Item 15(a)2 above.
139
SIGNATURES
Pursuant to the requirements of Section 13 or 15(d) of the Securities Exchange Act of 1934, the Registrant has duly caused this report to be signed on its behalf by the undersigned, thereunto duly authorized.
|
First Interstate BancSystem, Inc.
|
|
|
||
|
|
|
|
|
|
|
By:
|
|
/s/ KEVIN P. RILEY
|
|
February 27, 2019
|
|
|
|
Kevin P. Riley
|
|
Date
|
|
|
|
President and Chief Executive Officer
|
|
|
Pursuant to the requirements of the Securities Exchange Act of 1934, this report has been signed below by the following persons on behalf of the registrant and in the capacities and on the dates indicated.
|
By:
|
/s/ JAMES R. SCOTT
|
|
February 27, 2019
|
|
|
James R. Scott, Chairman of the Board
|
|
Date
|
|
|
|
|
|
|
By:
|
/s/ STEVEN. J. CORNING
|
|
February 27, 2019
|
|
|
Steven J. Corning, Director
|
|
Date
|
|
|
|
|
|
|
By:
|
/s/ DANA L. CRANDALL
|
|
February 27, 2019
|
|
|
Dana L. Crandall, Director
|
|
Date
|
|
|
|
|
|
|
By:
|
/s/ WILLIAM B. EBZERY
|
|
February 27, 2019
|
|
|
William B. Ebzery, Director
|
|
Date
|
|
|
|
|
|
|
By:
|
/s/ CHARLES E. HART, M.D., M.S.
|
|
February 27, 2019
|
|
|
Charles E. Hart, M.D., M.S., Director
|
|
Date
|
|
|
|
|
|
|
By:
|
/s/ JOHN M. HEYNEMAN, JR.
|
February 27, 2019
|
|
|
John M. Heyneman, Jr., Director
|
Date
|
||
|
By:
|
/s/ DAVID L. JAHNKE
|
February 27, 2019
|
|
|
David L. Jahnke, Director
|
Date
|
||
|
By:
|
/s/ DENNIS L. JOHNSON
|
February 27, 2019
|
|
|
Dennis L. Johnson, Director
|
Date
|
||
|
By:
|
/s/ ROSS E. LECKIE
|
February 27, 2019
|
|
|
Ross E. Leckie, Director
|
Date
|
||
|
By:
|
/s/ PATRICIA L. MOSS
|
February 27, 2019
|
|
|
Patricia L. Moss, Director
|
Date
|
||
|
By:
|
/s/ JAMES R. SCOTT, JR.
|
February 27, 2019
|
|
|
James R. Scott, Jr., Director
|
Date
|
||
|
By:
|
/s/ JONATHAN R. SCOTT
|
February 27, 2019
|
|
|
Jonathan R. Scott, Director
|
Date
|
||
|
By:
|
/s/ TERESA A. TAYLOR
|
|
February 27, 2019
|
|
Teresa A. Taylor, Director
|
|
Date
|
|
|
|
|
|
|
|
By:
|
/s/ PETER I. WOLD
|
February 27, 2019
|
|
|
|
Peter I. Wold, Director
|
Date
|
|
140
|
By:
|
/s/ KEVIN P. RILEY
|
February 27, 2019
|
|
|
|
Kevin P. Riley
President, Chief Executive Officer and Director
(Principal executive officer)
|
Date
|
|
|
|
|
||
|
By:
|
/s/ MARCY D. MUTCH
|
February 27, 2019
|
|
|
Marcy D. Mutch
Executive Vice President and Chief Financial Officer
(Principal financial and accounting officer)
|
Date
|
||
141
TABLE OF CONTENTS
Part IItem 1. BusinessItem 1A. Risk FactorsItem 1B. Unresolved Staff CommentsItem 2. PropertiesItem 3. Legal ProceedingsItem 4. Mine Safety DisclosuresPart IIItem 5. Market For Registrant S Common Equity, Related Stockholder Matters and Issuer Purchases Of Equity SecuritiesItem 6. Selected Consolidated Financial DataItem 7. Management S Discussion and Analysis Of Financial Condition and Results Of OperationsItem 7A. Quantitative and Qualitative Disclosures About Market RiskItem 8. Financial Statements and Supplementary DataItem 9. Changes in and Disagreements with Accountants on Accounting and Financial DisclosureItem 9A. Controls and ProceduresItem 9B. Other InformationPart IIIItem 10. Directors, Executive Officers and Corporate GovernanceItem 11. Executive CompensationItem 12. Security Ownership Of Certain Beneficial Owners and Management and Related Stockholder MattersItem 13. Certain Relationships and Related Transactions and Director IndependenceItem 14. Principal Accountant Fees and ServicesPart IVItem 15. Exhibits and Financial Statement Schedules