FIDELITY NATIONAL INFORMATION SERVICES, INC.
10-Ks and 10-Qs
|
|
|
|
|
|
|
|
|
|
|
|
|
|
|
|
|
|
|
|
|
|
|
|
|
|
|
|
|
|
|
|
|
|
|
|
|
|
|
|
|
|
|
|
|
|
|
|
|
|
|
|
|
UNITED STATES SECURITIES AND EXCHANGE COMMISSION
Washington, D.C. 20549
________________________________________________________
Form 10-K
________________________________________________________
|
x
|
ANNUAL REPORT PURSUANT TO SECTION 13 OR 15(d) OF THE SECURITIES EXCHANGE ACT OF 1934
|
|
|
|
For the fiscal year ended December 31, 2018
|
|
|
or
|
||
|
o
|
TRANSITION REPORT PURSUANT TO SECTION 13 OR 15(d) OF THE SECURITIES EXCHANGE ACT OF 1934
|
|
|
|
For the transition period from to
|
|
Commission File No. 001-16427
________________________________________________________
Fidelity National Information Services, Inc.
(Exact name of registrant as specified in its charter)
|
Georgia
(State or other jurisdiction of incorporation or organization)
|
|
37-1490331
(I.R.S. Employer Identification No.)
|
|
601 Riverside Avenue
Jacksonville, Florida
(Address of principal executive offices)
|
|
32204
(Zip Code)
|
(904) 438-6000
(Registrant’s telephone number, including area code)
Securities registered pursuant to Section 12(b) of the Act:
|
Title of Each Class:
|
|
Name of Each Exchange on Which Registered:
|
|
Common Stock, par value $0.01 per share
|
|
New York Stock Exchange
|
Securities registered pursuant to Section 12(g) of the Act: None
(Title of Class)
Indicate by check mark if the registrant is a well-known seasoned issuer, as defined in Rule 405 of the Securities Act. Yes
x
No
o
Indicate by check mark if the registrant is not required to file reports pursuant to Section 13 or Section 15(d) of the Act. Yes
o
No
x
Indicate by check mark whether the registrant (1) has filed all reports required to be filed by Section 13 or 15(d) of the Securities Exchange Act of 1934 during the preceding 12 months (or for such shorter period that the registrant was required to file such reports), and (2) has been subject to such filing requirements for the past 90 days. Yes
x
No
o
Indicate by check mark whether the registrant has submitted electronically and posted on its corporate Web site, if any, every Interactive Data File required to be submitted and posted pursuant to Rule 405 of Regulation S-T (§ 232.405 of this chapter) during the preceding 12 months (or for such shorter period that the registrant was required to submit and post such files). Yes
x
No
o
Indicate by check mark if disclosure of delinquent filers pursuant to Item 405 of Regulation S-K is not contained herein, and will not be contained, to the best of registrant’s knowledge, in definitive proxy or information statements incorporated by reference in Part III of this Form 10-K or any amendment to this Form 10-K.
o
Indicate by check mark whether the registrant is a large accelerated filer, an accelerated filer, a non-accelerated filer, a smaller reporting company, or an emerging growth company. See the definitions of “large accelerated filer,” “accelerated filer,” “smaller reporting company” and "emerging growth company" in Rule 12b-2 of the Exchange Act. (Check one):
|
Large accelerated filer
x
|
Accelerated filer
o
|
Non-accelerated filer
o
(Do not check if a smaller reporting company)
|
Smaller reporting company
o
|
Emerging growth company
o
|
If an emerging growth company, indicate by check mark if the registrant has elected not to use the extended transition period for complying with any new or revised financial accounting standards provided pursuant to Section 13(a) of the Exchange Act.
o
Indicate by check mark whether the registrant is a shell company (as defined in Rule 12b-2 of the Exchange Act) Yes
o
No
x
As of June 30, 2018, the last business day of the registrant’s most recently completed second fiscal quarter, the aggregate market value of the registrant’s common stock held by nonaffiliates was
$34,947,896,958
based on the closing sale price of
$106.03
on that date as reported by the New York Stock Exchange. For the purposes of the foregoing sentence only, all directors and executive officers of the registrant were assumed to be affiliates. The number of shares outstanding of the registrant’s common stock, $0.01 par value per share, was
322,920,584
as of February 19, 2019.
The information in Part III hereof is incorporated herein by reference to the registrant’s Proxy Statement on Schedule 14A for the fiscal year ended
December 31, 2018
, to be filed within 120 days after the close of the fiscal year that is the subject of this Report.
FIDELITY NATIONAL INFORMATION SERVICES, INC.
2018
FORM 10-K ANNUAL REPORT
TABLE OF CONTENTS
|
|
|
Page
|
|
Item 14
.
|
||
|
|
||
|
EX-10.14
|
||
|
EX-10.19
|
||
|
EX-10.46
|
||
|
EX-10.47
|
||
|
EX-10.48
|
||
|
EX-10.49
|
||
|
EX-10.50
|
||
|
EX-10.51
|
||
|
EX-10.52
|
||
|
EX-10.53
|
||
|
EX-21.1
|
||
|
EX-23.1
|
||
|
EX-31.1
|
||
|
EX-31.2
|
||
|
EX-32.1
|
||
|
EX-32.2
|
||
|
EX-101 INSTANCE DOCUMENT
|
||
|
EX-101 SCHEMA DOCUMENT
|
||
|
EX-101 CALCULATION LINKBASE DOCUMENT
|
||
|
EX-101 DEFINITION LINKBASE DOCUMENT
|
||
|
EX-101 LABELS LINKBASE DOCUMENT
|
||
|
EX-101 PRESENTATION LINKBASE DOCUMENT
|
||
1
Unless stated otherwise or the context otherwise requires, all references to "FIS," "we," the "Company" or the "registrant" are to Fidelity National Information Services, Inc., a Georgia corporation, and its subsidiaries.
PART I
Item 1.
Business
Overview
FIS is a global leader in financial services technology, providing solutions and services to clients in the retail and institutional banking, payments, capital markets, asset management and wealth and retirement markets. Through the depth and breadth of our solutions portfolio, global capabilities and domain expertise, FIS serves clients in over 130 countries. Headquartered in Jacksonville, Florida, FIS employs more than 47,000 people worldwide and holds leadership positions in payment processing, financial software and banking solutions. Providing software, services and outsourcing of the technology that empowers the financial world, FIS is a Fortune 500 company and is a member of the Standard & Poor’s 500
®
Index.
FIS is incorporated under the laws of the State of Georgia as Fidelity National Information Services, Inc. and our stock is traded on the New York Stock Exchange under the trading symbol "FIS."
We have grown organically, as well as through acquisitions, which have contributed critical applications and services that complement or enhance our existing offerings, diversifying our revenue by customer, geography and service offering. Our solutions include core processing solutions; digital solutions; fraud, risk management and compliance solutions; electronic funds transfer and network services; card and retail payment solutions; corporate liquidity solutions; wealth and retirement solutions; item processing and output services; government payments solutions; ePayment solutions; securities processing and finance solutions; global trading solutions; asset management and insurance solutions; and global commercial services for financial institutions and credit unions, as well as companies and governmental entities. We sell certain of these solutions to domestic companies, as well as to global organizations and companies domiciled both within and outside of North America, where our solutions are able to be deployed across multiple regions. Our strategic acquisitions have enabled us to broaden our available solution sets, scale our operations, expand and diversify our customer base and strengthen our competitive position.
Financial Information About Operating Segments and Geographic Areas
FIS reports its financial performance based on three segments: Integrated Financial Solutions ("IFS"), Global Financial Solutions ("GFS") and Corporate and Other. For information about our revenues and assets by geographic area see Notes 2(n), 3 and 19 of the Notes to Consolidated Financial Statements.
Competitive Strengths
We believe our competitive strengths include the following:
|
•
|
Brand
- FIS has built a global brand known for innovation and thought leadership in the financial services sector.
|
|
•
|
Global Distribution and Scale -
Our worldwide presence, array of solution offerings, customer breadth, established infrastructure and employee depth enable us to leverage our client relationships and global scale to drive revenue growth and operating efficiency. We are a global leader in the markets we serve, supported by a large, knowledgeable talent pool of employees around the world.
|
|
•
|
Extensive Domain Expertise and Extended Portfolio Depth
- FIS has a significant number and wide range of high-quality software applications and service offerings that have been developed over many years with substantial input from our customers. Our broad portfolio of solutions includes a wide range of flexible service arrangements for the deployment and support of our software, from managed processing arrangements, either at the customer's site or at an FIS location, including data centers or our private cloud, to traditional license and maintenance fee approaches. This broad solution set allows us to bundle tailored or integrated services to compete effectively. In addition, FIS is able to use the modular nature of our software applications and our ability to integrate many of our services with the services of others to provide customized solutions that respond to individualized customer needs. We understand the needs of our customers and have developed and acquired innovative solutions that can give them a competitive advantage and reduce their operating costs.
We have made significant investment in modernizing our platforms and solutions and
|
2
moving our server compute into our private cloud located in our strategic data centers to increase our competitiveness in the global marketplace.
|
•
|
Excellent and Long-Term Relationship with Customers
- A significant percentage of FIS’ business with our customers relates to applications and services provided under multi-year, recurring contracts. The nature of these relationships allows us to develop close partnerships with these customers, resulting in high client retention rates. As the breadth of FIS’ service offerings has expanded, we have found that our access to key customer personnel is increasing, presenting greater opportunities for cross-selling and providing integrated, total solutions to our customers.
|
Strategy
Our mission is to deliver superior solutions and services to our clients and to expand our client base, which will result in sustained revenue and earnings growth for our shareholders. Our strategy to achieve this goal has been and continues to be built on the following pillars:
|
•
|
Build, Buy, or Partner to Add Solutions to Cross-Sell Existing Clients and Win New Clients
- We continue to invest in growth through internal software development, as well as through acquisitions and equity investments that complement and extend our existing solutions and capabilities, providing us with additional solutions to cross-sell existing clients and capture the interest of new clients. We also partner from time to time with other entities to provide comprehensive offerings to our prospects and customers. By investing in solution innovation and integration, we continue to expand our value proposition to our prospects and clients.
|
|
•
|
Support Our Clients Through Innovation
- Changing market dynamics, particularly in the areas of information security, regulation and innovation, are transforming the way our clients operate, which is driving incremental demand for our integrated solutions and services around our intellectual property. As prospects and customers evaluate technology, business process changes and vendor risks, our depth of services capabilities enables us to become involved earlier in their planning and design process and assist them as they manage through these changes.
|
|
•
|
Continually Improve to Drive Margin Expansion
- We strive to optimize our performance through investments in infrastructure enhancements, our workforce and other measures that are designed to drive margin expansion.
|
|
•
|
Expand Client Relationships
- The overall market
we serve
continues to gravitate beyond single-application purchases to multi-solution partnerships. As the market dynamics shift, we expect our clients and prospects to rely more on our multidimensional service offerings. Our leveraged solutions and processing expertise can produce meaningful value and cost savings for our clients through more efficient operating processes, improved service quality and convenience for our clients' customers.
|
|
•
|
Build Global Diversification
- We continue to deploy resources in global markets where we expect to achieve meaningful scale.
|
Revenues by Segment
The table below summarizes our revenues by reporting segment (in millions):
|
|
2018
|
2017
|
2016
|
||||||||
|
IFS
|
$
|
4,401
|
|
$
|
4,260
|
|
$
|
4,178
|
|
||
|
GFS
|
3,718
|
|
4,050
|
|
4,183
|
|
|||||
|
Corporate and Other
|
304
|
|
358
|
|
470
|
|
|||||
|
Total Consolidated Revenues
|
$
|
8,423
|
|
$
|
8,668
|
|
$
|
8,831
|
|
||
Integrated Financial Solutions ("IFS")
The IFS segment is focused primarily on serving North American clients for transaction and account processing, payment solutions, channel solutions, digital channels, fraud, risk management and compliance solutions, lending and wealth and retirement solutions, and corporate liquidity, capitalizing on the continuing trend to outsource these solutions. Clients in this segment include regional and community banks, credit unions and commercial lenders, as well as government institutions,
3
merchants and other commercial organizations. These markets are primarily served through integrated solutions and characterized by multi-year processing contracts that generate highly recurring revenue. The predictable nature of cash flows generated from this segment provides opportunities for further investments in innovation, integration, information and security, and compliance in a cost effective manner.
Our solutions in this segment include the following:
|
•
|
Core Processing and Ancillary Applications.
Our core processing software applications are designed to run banking processes for our financial institution clients, including deposit and lending systems, customer management, and other central management systems, serving as the system of record for processed activity. Our diverse selection of market-focused core systems enables FIS to compete effectively in a wide range of markets. We continue to invest in our core modernization efforts to further differentiate our offerings for the long-term. We also offer a number of services that are ancillary to the primary applications listed above, including branch automation, back-office support systems and compliance support.
|
|
•
|
Digital Solutions, Including Internet, Mobile and eBanking.
Our comprehensive suite of retail delivery applications enables financial institutions to integrate and streamline customer-facing operations and back-office processes, thereby improving customer interaction across all channels (e.g., branch offices, Internet, ATM, Mobile, call centers). FIS' focus on consumer access has driven significant market innovation in this area, with multi-channel and multi-host solutions and a strategy that provides tight integration of services and a seamless customer
experience. We are now adding functionality and offering Digital One, an integrated digital banking platform, to our community bank clients to provide a consistent, omnichannel experience for consumers of banking services across self-service channels like mobile banking and online banking, as well as supporting channels for bank staff operating in bank branches and contact centers. The uniform customer experience will extend to support a broad range of financial services including opening new accounts; servicing of existing accounts; providing money movement services; personal financial management; as well as a broad range of other consumer, small business and commercial banking capabilities. Digital One will be integrated into and will extend the core banking platforms offered by FIS and will also be offered to customers of non-FIS core banking systems.
|
|
•
|
Fraud, Risk Management and Compliance Solutions.
Our decision solutions offer a spectrum of options that cover the account lifecycle from helping to identify qualified account applicants to managing existing customer accounts and fraud. Our applications include know-your-customer, new account decisioning and opening, account and transaction management, fraud management and collections. Our risk management services use our proprietary risk management models and data sources to assist in detecting fraud and assessing the risk of opening a new account. Our systems use a combination of advanced authentication procedures, predictive analytics, artificial intelligence modeling and proprietary and shared databases to assess and detect fraud risk for deposit transactions for financial institutions.
|
|
•
|
Electronic Funds Transfer and Network Services.
Our electronic funds transfer and debit card processing businesses offer settlement and card management solutions for financial institution card issuers. We provide traditional ATM-based debit network access through NYCE and emerging real-time payment alternatives. NYCE connects millions of cards and point-of-sale locations nationwide, providing consumers with secure, real-time access to their money. Also through NYCE, clients such as financial institutions, retailers and independent ATM operators can capitalize on the efficiency, consumer convenience and security of electronic real-time payments, real-time account-to-account transfers, and strategic alliances such as surcharge-free ATM network arrangements.
|
|
•
|
Card and Retail Payment Solutions.
Approximately 5,500 financial institutions use a combination of our technology and/or services to issue VISA
®
, MasterCard
®
or American Express
®
branded credit and debit cards or other electronic payment cards for use by both consumer and business accounts. Card transactions continue to increase as a percentage of total point-of-sale payments, which fuels continuing demand for card-related services. We offer Europay, MasterCard and VISA ("EMV") integrated circuit cards, often referred to as smart cards or chip cards, as well as a variety of stored-value card types and loyalty/reward programs. Our integrated services range from card production and activation to processing to an extensive range of fraud management services and value-added loyalty programs designed to increase card usage and fee-based revenues for financial institutions and merchants. The majority of our programs are full service, including most of the operations and support necessary for an issuer to operate a credit card program. We do not make credit decisions for our card issuing clients. We are also a leading provider of prepaid card services, which include gift cards and reloadable cards, with end-to-end solutions for development, processing and administration of stored-value programs. Our closed loop gift card solutions and loyalty programs provide merchants compelling solutions to drive consumer loyalty. In addition, our merchant processing service provides a merchant or
|
4
financial institution a comprehensive solution to manage its merchant card activities, including point-of-sale equipment, transaction authorization, draft capture, settlement, charge-back processing and reporting.
|
•
|
Corporate Liquidity.
Our corporate liquidity solutions help chief financial officers and treasurers manage working capital by increasing visibility to cash, reducing risk and improving communication and response time between a company’s buyers, suppliers, banks and other stakeholders. Our end-to-end collaborative financial management framework helps bring together receivables, treasury and payments for a single view of cash and risk, which helps our clients optimize business processes for enhanced liquidity management.
|
|
•
|
Wealth and Retirement.
We provide wealth and retirement solutions that help banks, trust companies, brokerage firms, insurance firms, retirement plan professionals, benefit administrators and independent advisors acquire, service and grow their client relationships. We provide solutions for client acquisition, transaction management, trust accounting and recordkeeping that can be deployed stand-alone or as part of an integrated wealth or retirement platform, or on an outsourced basis.
|
|
•
|
Item Processing and Output Services.
Our item processing services furnish financial institutions with the technology needed to capture data from checks, transaction tickets and other items; image and sort items; process exceptions through keying; and perform balancing, archiving and the production of statements. Our item processing services are performed at one of our multiple item processing centers located throughout the U.S. or on-site at client locations. Our extensive solutions include distributed (i.e., non-centralized) data capture, mobile deposit capture, check and remittance processing, fraud detection, and document and report management. Clients encompass banks and corporations of all sizes, from de novo banks to the largest financial institutions and corporations. We offer a number of output services that are ancillary to the primary solutions we provide, including print and mail capabilities, document composition software and solutions, and card personalization fulfillment services. Our print and mail services offer complete computer output solutions for the creation, management and delivery of print and fulfillment needs. We provide our card personalization fulfillment services for branded credit cards and branded and non-branded debit and prepaid cards.
|
|
•
|
Government Payments Solutions.
We provide comprehensive, customized electronic service applications for government agencies, including Internal Revenue Service ("IRS") payment services and government food stamp and nutrition programs known as Supplemental Nutrition Assistance Program ("SNAP") and Women, Infants and Children ("WIC"). We also facilitate the collection of state income taxes, real estate taxes, utility bills, vehicle registration fees, driver’s license renewal fees, parking tickets, traffic citations, tuition payments, court fees and fines, hunting and fishing license fees, as well as various business licenses.
|
|
•
|
ePayment Solutions.
We provide reliable and scalable bill publishing and bill consolidation technology for our clients, generating and facilitating the payment of millions of monthly bills, servicing both billers and financial institution clients. Online bill payment functionality includes credit and debit card-based expedited payments. Our end-to-end presentment and payment solution provides an all-in-one solution to meet billers’ needs for the distribution and collection of bills and other customer documents. FIS also provides Automated Clearing House ("ACH") processing.
|
Global Financial Solutions ("GFS")
The GFS segment is focused on serving the largest global financial institutions and/or international financial institutions with a broad array of capital markets (including asset managers, buy- and sell-side securities and trading firms), asset management and insurance solutions, as well as banking and payments solutions.
GFS clients include the largest global financial institutions, including those headquartered in the United States, as well as international financial institutions we serve as clients in more than 130 countries around the world, and asset managers, buy- and sell-side securities and trading firms, insurers and private equity firms. These institutions face unique business and regulatory challenges and account for the majority of financial institution information technology spend globally. The purchasing patterns of GFS clients vary from those of IFS clients who typically purchase solutions on an outsourced basis. GFS clients purchase our solutions and services in various ways including licensing and managing technology "in-house," using consulting and third-party service providers as well as fully outsourced end-to-end solutions. We have long-established relationships with many of these financial institutions that generate significant recurring revenue. This segment included the Company's consolidated Brazilian Venture until the joint venture with Banco Bradesco was unwound and the assets we continue to own were spun-off to a new wholly-owned FIS subsidiary on December 31, 2018 (see Note 16 of the Notes to Consolidated Financial Statements).
5
Our solutions in this segment include the following:
|
•
|
Securities Processing and Finance.
Our offerings help financial institutions to increase the efficiency, transparency and control of their back-office trading operations, post-trade processing and settlement including derivative solutions, risk management, securities lending, syndicated lending, tax processing, and regulatory compliance. The breadth of our offerings also facilitates advanced business intelligence and market data distribution based on our extensive market data access.
|
|
•
|
Global Trading
. Our trading solutions provide trade execution, data and network solutions to financial institutions, corporations and municipalities in North America, Europe and other global markets across a variety of asset classes. Our trade execution and network solutions help both buy- and sell-side firms improve execution quality, decrease overall execution costs and address today’s trade connectivity challenges.
|
|
•
|
Asset Management and Insurance
. We offer solutions that help institutional investors, insurance companies, hedge funds, private equity firms, fund administrators and securities transfer agents improve both investment decision-making and operational efficiency, while managing risk and increasing transparency. Our asset management solutions support every stage of the investment process, from research and portfolio management, to valuation, risk management, compliance, investment accounting, transfer agency and client reporting. Our insurance solutions help support front-office and back-office functions including actuarial risk calculations, policy administration and financial and investment accounting and reporting for a variety of insurance lines, including life and health, annuities and pensions, property and casualty, reinsurance, and asset management.
|
|
•
|
Retail Banking and Payments Services.
Our GFS operations leverage existing applications and provide services for the specific business needs of our customers in targeted global markets. Services are delivered from our operation centers around the world. Our banking solution services include fully outsourced core bank processing arrangements including an integrated digital banking platform, application management, software licensing and maintenance and facilities management. Our payment solution services include fully outsourced card-issuer services and customer support, payment processing (including real-time payments) and switching services, prepaid and debit card processing, software licensing and maintenance, outsourced ATM management and retail point-of-sale payment services.
|
|
•
|
Strategic Consulting Services.
We completed the sale of a majority stake in Capco, which comprised our Strategic Consulting Services, on July 31, 2017 (see Note 16 of the Notes to Consolidated Financial Statements).
|
Corporate and Other Segment
The Corporate and Other segment consists of corporate overhead expense, certain leveraged functions and miscellaneous expenses that are not included in the operating segments, as well as certain non-strategic businesses. The overhead and leveraged costs relate to marketing, corporate finance and accounting, human resources, legal, and amortization of acquisition-related intangibles and other costs that are not considered when management evaluates revenue generating segment performance, such as acquisition integration and other costs. At the end of 2018, the only business unit remaining in this segment is our Global Commercial Services business described below:
|
•
|
Global Commercial Services.
Our global commercial services include solutions, both onshore and offshore, designed to meet the technology challenges facing clients, large or small, including financial institutions and non-financial institutions. These solutions range in scope from operations support for a single application to full management of information technology infrastructures. We also provide outsourcing teams to manage costs, improve operational efficiency and transform our clients' back-office and customer service processes.
|
The non-strategic business solutions in this segment have been divested as described below:
|
•
|
Retail Check Processing.
Effective August 31, 2018, FIS sold substantially all the assets of the Certegy Check Services business unit in North America (see Note 5 of the Notes to Consolidated Financial Statements).
|
|
•
|
Public Sector and Education.
We completed the sale of our Public Sector and Education business to portfolio companies of Vista Equity Partners on February 1, 2017 (see Note 16 of the Notes to Consolidated Financial Statements).
|
6
Sales and Marketing
We have experienced sales personnel with expertise in particular services and markets, as well as in the needs of particular types of customers. We believe that focusing our expertise in specific markets (e.g., global financial institutions, North American financial institutions) and tailoring integrated solution sets of particular value to participants in those markets enables us to leverage opportunities to cross-sell and up-sell. We continue to realign our sales teams to better match our solution expertise with the market opportunity and customer demand. We target the majority of our potential customers via direct and/or indirect field sales, as well as inbound and outbound lead generation and telesales efforts.
Our global marketing strategy is to develop and lead the execution of the IFS and GFS strategic marketing plans in support of their revenue and profitability goals and the FIS brand. Key components include thought leadership, integrated programs with consistent message development, internal and external communications, client conference content management, web content creation and management, trade shows, demand generation campaigns and collateral development and management.
Patents, Copyrights, Trademarks and Other Intellectual Property
The Company owns intellectual property, including trademarks, trade names, copyrights and patents, which we believe is important to our future success. Although we acquired the trademarks and trade names used by SunGard through the acquisition by FIS and certain of its wholly owned subsidiaries of SunGard and SunGard Capital Corp. II (collectively, "SunGard") on November 30, 2015 (the "SunGard acquisition"), we note that following the split-off of the Availability Services ("AS") business by SunGard in 2014, AS has the right to use the Sungard Availability Services name, which does not include the right to use the SunGard name or its derivatives.
We rely on a combination of contractual restrictions, internal security practices, patents, copyrights and applicable law to establish and protect our software, technology and expertise worldwide. We rely on trademark law to protect our rights in our brands. We intend to continue taking appropriate measures to protect our intellectual property rights, including by legal action when necessary and appropriate. In general, we own the proprietary rights necessary for the conduct of our business, although we do license certain items from third parties under arms-length agreements for varying terms, including some "open source" licenses.
Competition
The markets for our solutions and services are intensely competitive. Depending on the business line, in both our IFS and GFS segments, our primary competitors include internal technology departments within financial institutions, retailers, data processing or software development departments of large companies or large computer manufacturers, companies that deliver software and integrated services to the financial services industry, third-party payment processors, securities exchanges, asset managers, card associations, clearing networks or associations, trust companies, independent computer services firms, companies that develop and deploy software applications, companies owned by global banks selling new competitive solutions, companies that provide customized development, implementation and support services, disruptive technology innovators, and business process outsourcing companies. Many of these companies compete with us across multiple solutions, markets and geographies. Some of these competitors possess greater financial, sales and marketing resources than we do. Competitive factors impacting the success of our services across our segments include the quality of the technology-based application or service, application features and functions, ease of delivery and integration, the ability to maintain, enhance and support the applications or services, price and overall relationship management. We believe we compete favorably in each of these categories. In addition, we believe our financial services industry expertise, combined with our ability to offer multiple applications, services and integrated solutions to individual clients, enhances our competitiveness against companies with more limited offerings.
Research and Development
Our research and development activities have related primarily to the modernization of our proprietary core systems, design and development of next generation digital and innovative solutions and development of processing systems and related software applications and risk management platforms. We expect to continue our practice of investing an appropriate level of resources to maintain, enhance and extend the functionality of our proprietary systems and existing software applications, to develop new and innovative software applications and systems to address emerging technology trends in response to the needs of our clients and to enhance the capabilities of our outsourcing infrastructure. In addition, we intend to offer services compatible with new and emerging delivery channels.
7
As part of our research and development process, we evaluate current and emerging technology for compatibility with our existing and future software platforms. To this end, we engage with various hardware and software vendors in evaluation of various infrastructure components. Where appropriate, we use third-party technology components in the development of our software applications and service offerings. In the case of nearly all of our third-party software, enterprise license agreements exist for the third-party component and either alternative suppliers exist or transfer rights exist to ensure the continuity of supply. As a result, we are not materially dependent upon any third-party technology components. Third-party software may be used for highly specialized business functions, which we may not be able to develop internally within time and budget constraints. Additionally, third-party software may be used for commodity-type functions within a technology platform environment. We work with our clients to determine the appropriate timing and approach to introducing technology or infrastructure changes to our applications and services. During the years ended
December 31, 2018
,
2017
and
2016
approximately 3% to 4% of revenues were non-capitalizable research and development expense.
Government Regulation
Our services are subject to a broad range of complex federal, state, and foreign regulation and requirements, as well as requirements under the rules of self-regulatory organizations, including federal truth-in-lending and truth-in-savings rules, Regulation AA (Unfair or Deceptive Acts or Practices), data protection and privacy laws, usury laws, laws governing state trust charters, the Equal Credit Opportunity Act, the Electronic Funds Transfer Act, the Fair Credit Reporting Act, the Fair Debt Collection Practices Act, the Bank Secrecy Act, the USA Patriot Act, the Internal Revenue Code, the Employee Retirement Income Security Act, the Health Insurance Portability and Accountability Act, the Community Reinvestment Act and the Dodd-Frank Wall Street Reform and Consumer Protection Act (the "Dodd-Frank Act"), the Securities Exchange Act of 1934 (the "1934 Act"), the Investment Advisors Act of 1940 (the "1940 Act"), anti-corruption laws including the U.S. Foreign Corrupt Practices Act and U.K. Bribery Act, the rules and regulations of the Financial Industry Regulatory Authority ("FINRA"), the Securities and Exchange Commission ("SEC") and the Financial Conduct Authority in the U.K. ("FCA"). The compliance of our services and applications with these and other applicable laws and regulations depends on a variety of factors, including the manner in which our clients use them. In some cases, we are directly subject to regulatory oversight and examination. In other cases, our clients are contractually responsible for determining what is required of them under applicable laws and regulations and utilize our products and services to achieve compliance with those laws and regulations. In either case, the failure of our services to comply with applicable laws and regulations may result in restrictions on our ability to provide those services and/or the imposition of civil fines and/or criminal penalties. The principal areas of regulation impacting our business are the following:
|
•
|
Oversight by Banking Regulators.
As a provider of electronic data processing and back-office services to financial institutions, FIS is subject to regulatory oversight and examination by the Federal Banking Agencies ("FBA"), including the Federal Deposit Insurance Corporation ("FDIC"), the Office of the Comptroller of the Currency ("OCC"), the Board of Governors of the Federal Reserve System ("FRB"), the National Credit Union Administration ("NCUA") and the Consumer Financial Protection Bureau ("CFPB") as part of the Multi-Regional Data Processing Servicer Program ("MDPS"). The MDPS program includes technology suppliers that provide mission critical applications for a large number of financial institutions that are regulated by multiple regulatory agencies. Periodic information technology examination assessments are performed using FBA Interagency guidelines to identify potential risks that could adversely affect serviced financial institutions, determine compliance with applicable laws and regulations that affect the services provided to financial institutions and ensure the services we provide to financial institutions do not create systemic risk to the banking system or impact the safe and sound operation of the financial institutions we process. In addition, independent auditors annually review several of our operations to provide reports on internal controls for our clients’ auditors and regulators. We are also subject to review and examination by state and international regulatory authorities under state and foreign laws and rules that regulate many of the same activities that are described above, including electronic data processing, payments and back-office services for financial institutions and the use of consumer information.
|
Our U.S.-based wealth and retirement businesses held charters in 2018 in the states of Georgia and Delaware, which made us subject to the regulatory compliance requirements of the Georgia Department of Banking and Finance and the State of Delaware Office of the State Bank Commissioner. As a result, we are also authorized to provide trust services in various additional states subject to additional applicable state regulations. We divested Reliance Trust Company of Delaware effective December 31, 2018, which was our only charter in Delaware.
|
•
|
Oversight by Securities Regulators.
Our subsidiary that conducts our broker-dealer business in the U.S. is registered as a broker-dealer with the SEC, is a member of FINRA, and is registered as a broker-dealer in numerous states. Our broker-dealer is subject to regulation and oversight by the SEC. In addition, FINRA, a self-regulatory organization
|
8
that is subject to oversight by the SEC, adopts and enforces rules governing the conduct, and examines the activities, of its member firms, including our broker-dealer. State securities regulators, the Municipal Securities Rulemaking Board, and various exchanges, including the New York Stock Exchange, also have regulatory or oversight authority over our broker-dealer. Broker-dealers are subject to regulations that cover all aspects of the securities business, including sales methods, trade practices among broker-dealers, public and private securities offerings, use and safekeeping of customers’ funds and securities, capital structure, record keeping, the financing of customers’ purchases and the conduct and qualifications of directors, officers and employees. In particular, as a registered broker-dealer and member of a self-regulatory organization, we are subject to the SEC’s uniform net capital rule, Rule 15c3-1. Rule 15c3-1 specifies the minimum level of net capital a broker-dealer must maintain and also requires that a significant part of a broker-dealer’s assets be kept in relatively liquid form. The SEC and various self-regulatory organizations impose rules that require notification when net capital falls below certain predefined criteria, limit the ratio of subordinated debt to equity in the regulatory capital composition of a broker-dealer and constrain the ability of a broker-dealer to expand its business under certain circumstances. Additionally, the SEC’s uniform net capital rule imposes certain requirements that may have the effect of prohibiting a broker-dealer from distributing or withdrawing capital and requiring prior notice to the SEC for certain withdrawals of capital.
Our subsidiaries also include an SEC-registered transfer agent. Our registered transfer agent is subject to the 1934 Act and the rules and regulations promulgated thereunder. These laws and regulations generally grant the SEC and other supervisory bodies broad administrative powers to address non-compliance with regulatory requirements. Sanctions that may be imposed for non-compliance with these requirements include the suspension of individual employees, limitations on engaging in certain activities for specified periods of time or for specified types of clients, the revocation of registrations, other censures and significant fines.
Subsidiaries engaged in activities outside the U.S. are regulated by various government agencies in the particular jurisdiction where they are chartered, incorporated and/or conduct their business activity. For example, pursuant to the U.K. Financial Services and Markets Act 2000 ("FSMA"), certain of our subsidiaries are subject to regulations promulgated and administered by the FCA. The FSMA and rules promulgated thereunder govern all aspects of the U.K. investment business, including sales, research and trading practices, provision of investment advice, use and safekeeping of client funds and securities, regulatory capital, record keeping, margin practices and procedures, approval standards for individuals, anti-money laundering, periodic reporting and settlement procedures.
|
•
|
Privacy and Data Protection.
The Company is subject to an increasing number of privacy and data protection laws, regulations and directives globally (referred to collectively as "Privacy Laws"), many of which place restrictions on the Company’s ability to efficiently transfer, access and use personal data across its business. The legislative and regulatory landscape for privacy and data protection continues to evolve.
|
Our financial institution clients operating in the United States are required to comply with privacy regulations imposed under the Gramm-Leach-Bliley Act (referred to as "GLBA") and numerous similar state laws. GLBA and those state laws place restrictions on the use of non-public personal information. All financial institutions must disclose detailed privacy policies to their customers and offer them the opportunity to direct the financial institution not to share information with third parties. The regulations under GLBA, however, permit financial institutions to share information with non-affiliated parties who perform services for the financial institutions. As a provider of services to financial institutions, we are required to comply with the privacy laws and are bound by the same limitations on disclosure of the information received from our clients as apply to the financial institutions themselves. A determination that there have been violations of privacy laws could expose us to significant damage awards, fines and other penalties that could, individually or in the aggregate, materially harm our business and reputation.
In July 2016, the European Commission formally approved and adopted the EU-US Privacy Shield, providing a compliance framework for organizations to transfer personal data regarding citizens of the European Union (the "EU") to the U.S. While we have certified certain lines of business under the Privacy Shield, we have chosen to adopt EU model clauses published by the European Commission as the primary basis for the export of data from the EU to the U.S.
New and proposed data protection legislation and regulations also significantly affect our business. The General Data Protection Regulation ("GDPR"), which became effective on May 25, 2018 imposes a strict data compliance regime and extends the scope of the EU data protection law to all foreign companies processing data of EU residents. We have amended thousands of client and vendor contracts and put into place a thorough compliance program to comply with this new comprehensive privacy law. Although the GDPR applies across the EU without a need for local
9
implementing legislation, as has been the case under the current data protection regime, local data protection authorities ("DPAs") will still have the ability to interpret the GDPR, which has the potential to create inconsistencies on a countr
y-by-country basis. The Company will also be subject to the California Consumer Privacy Act ("CCPA"), which comes into effect on January 1, 2020 and provides California residents additional data protection rights including the right to be informed about the personal information collected by third parties and the use of that personal data. Further, certain operations of the Company will be subject to the Brazil General Personal Data Protection Act, which is also scheduled to become effective in 2020. The
Company has adopted a comprehensive global privacy program to assess and manage these evolving risks.
|
•
|
Money Transfer.
Elements of our cash access and money transmission businesses are registered as a Money Services Business and are subject to the USA Patriot Act and reporting requirements of the Bank Secrecy Act and U.S. Treasury Regulations. These businesses may also be subject to certain state, local and licensing requirements. The Financial Crimes Enforcement Network, state attorneys general, and other agencies have enforcement responsibility over laws relating to money laundering, currency transmission, and licensing. In applicable states, we have obtained money transmitter licenses. However, changes to state money transmission laws and regulations, including changing interpretations and the implementation of new or varying regulatory requirements, may result in the need for additional money transmitter licenses or for the requirement that we change the way in which we deliver certain services.
|
We are also subject to certain economic and trade sanctions programs that are administered by the U.S. Treasury’s Office of Foreign Assets Control (referred to as "OFAC"), which prohibit or restrict transactions to or from or dealings with specified countries, their governments, and in certain circumstances, their nationals, and with individuals and entities that are specially-designated nationals of those countries, narcotics traffickers, and terrorists or terrorist organizations. Similar anti-money laundering laws apply to movements of currency and payments through electronic transactions and to dealings with persons specified in lists maintained by the country equivalents to OFAC in several other countries. We have implemented policies, procedures, and internal controls that are designed to comply with the regulations and economic sanctions programs administered by OFAC. Outside the U.S., applicable laws, rules and regulations similarly require designated types of financial institutions to implement anti-money laundering programs. We have implemented policies, procedures and internal controls that are designed to comply with all applicable anti-money laundering laws and regulations.
|
•
|
Consumer Reporting and Protection.
Our decision solutions subsidiary (ChexSystems) maintains a database of consumer information used to provide various account ope
ning services including credit scoring analysis and is subject to the Federal Fair Credit Reporting Act ("FCRA") and similar state laws. The FCRA regulates consumer reporting agencies ("CRAs"), including ChexSystems, and governs the accuracy, fairness, and privacy of information in the files of CRAs that engage in the practice of assembling or evaluating certain information relating to consumers for certain specified purposes. CRAs are required to follow reasonable procedures to assure maximum possible accuracy of information concerning the individual about whom the report relates and if a consumer disputes the accuracy of any information in the consumer’s file, to conduct a reasonable investigation within statutory timelines. The FCRA imposes many other requirements on CRAs and users of consumer report information. Regulatory enforcement of the FCRA is under the purview of the United States Federal Trade Commission
("FTC"), the CFPB, and state attorneys general, acting alone or in concert with one another. In furtherance of our objectives of data accuracy, fair treatment of consumers, protection of consumers’ personal information, and compliance with these laws, we strive to, and have made considerable investment to, maintain a high level of security for our computer systems in which consumer data resides, and we maintain consumer relations call centers to facilitate efficient handling of consumer requests for information and handling disputes. We also are focused on ensuring our operating environments safeguard and protect consumer's personal information in compliance with these laws.
|
Our consumer reporting and facing businesses are subject to CFPB Bulletin 2013-7 (an update to the former Regulation A - Unfair Deceptive Acts or Practices), which states the definition of Unfair, Deceptive or Abusive Acts or Practices ("UDAAP"). This specific bulletin states that UDAAPs can cause significant financial injury to consumers, erode consumer confidence, and undermine fair competition in the financial marketplace. Original creditors and other covered persons and service providers under the Dodd-Frank Act involved in collecting debt related to any consumer financial product or service are subject to the prohibition against UDAAPs in the Dodd-Frank Act.
|
•
|
Debt Collection.
Our collection services are subject to the Federal Fair Debt Collection Practices Act and various state collection laws and licensing requirements. The FTC, as well as state attorneys general and other agencies, have enforcement responsibility over the collection laws, as well as the various credit reporting laws.
|
10
|
•
|
Anti-Corruption.
FIS is subject to applicable anti-corruption laws, such as the U.S. Foreign Corrupt Practices Act and the U.K. Bribery Act, in the jurisdictions in which it operates. Anti-corruption laws generally prohibit offering, promising, giving, or authorizing others to give anything of value, either directly or indirectly, to a government official or private party in order to influence official action or otherwise gain an unfair business advantage, such as to obtain or retain business. FIS has implemented policies, procedures, and internal controls that are designed to comply with such laws, rules and regulations.
|
The foregoing list of laws and regulations to which our Company is subject is not exhaustive, and the regulatory framework governing our operations changes continuously. Enactment of new laws and regulations may increasingly affect the operations of our business, directly and indirectly, which could result in substantial regulatory compliance costs, litigation expense, adverse publicity, and/or loss of revenue.
Information Security
Globally, attacks on information technology systems continue to grow in frequency, complexity and sophistication. This is a trend we expect to continue. Such attacks have become a point of focus for individuals, businesses and governmental entities. The objectives of these attacks include, among other things, gaining unauthorized access to systems to facilitate financial fraud, disrupt operations, cause denial of service events, corrupt data, and steal non-public information. These circumstances present both a threat and an opportunity for FIS. As part of our business, we electronically receive, process, store and transmit a wide range of confidential information, including sensitive customer information and personal consumer data. We also operate payment, cash access and prepaid card systems.
FIS remains focused on making strategic investments in information security to protect our clients and our information systems. This includes both capital expenditures and operating expenses on hardware, software, personnel and consulting services. We also participate in industry and governmental initiatives to improve information security for our clients. Through the expertise we have gained with this ongoing focus and involvement, we have developed fraud, security, risk management and compliance solutions to target this growth opportunity in the financial services industry.
For more information on Information Security, see "Item 7.
Management's Discussion and Analysis of Financial Condition and Results of Operations
."
Employees
As of
December 31, 2018
, we had more than 47,000 employees, including approximately 29,000 employees principally employed outside of the U.S. None of our U.S. workforce currently is unionized. Approximately 6,000 of our employees, primarily in Brazil, Germany, Tunisia, France, Italy, Mexico and Chile, are represented by labor unions or works councils. We consider our relations with our employees to be good.
Available Information
Our internet website address is www.fisglobal.com. We make our Annual Reports on Form 10-K, Quarterly Reports on Form 10-Q, and Current Reports on Form 8-K, and any amendments to those reports, available, free of charge, on that website as soon as reasonably practicable after we file or furnish them to the Securities and Exchange Commission. Our Corporate Governance Policy and Code of Business Conduct and Ethics are also available on our website and are available in print, free of charge, to any shareholder who mails a request to the Corporate Secretary, Fidelity National Information Services, Inc., 601 Riverside Avenue, Jacksonville, FL 32204 USA. Other corporate governance-related documents can be found at our website as well. However, the information found on our website is not a part of this or any other report.
|
Item 1A.
|
Risk Factors
|
In addition to the normal risks of business, we are subject to significant risks and uncertainties, including those listed below and others described elsewhere in this Annual Report on Form 10-K. Any of the risks described herein could result in a significant adverse effect on our results of operations and financial condition.
11
Risks Related to Our Business and Operations
Security breaches or attacks, or our failure to comply with information security laws or regulations or industry security requirements, could harm our business by disrupting our delivery of services and damaging our reputation and could result in a breach of one or more client contracts.
We electronically receive, process, store and transmit sensitive business information of our clients. In addition, we collect personal consumer data, such as names and addresses, social security numbers, driver's license numbers, cardholder data and payment history records. Such information is necessary to support our clients’ transaction processing and to conduct our check authorization and collection businesses. The uninterrupted operation of our information systems, as well as the confidentiality of the customer/consumer information that resides on such systems, is critical to our successful operation. For that reason, cybersecurity is one of the principal operational risks we face as a provider of services to financial institutions. If we fail to maintain an adequate security infrastructure, adapt to emerging security threats, or implement sufficient security standards and technology to protect against security breaches, the confidentiality of the information we secure could be compromised. Unauthorized access to our computer systems or databases could result in the theft or publication of confidential information, the deletion or modification of records, damages from legal actions from clients and/or their customers, or otherwise cause interruptions in our operations and damage to our reputation. These risks are greater with increased information transmission over the Internet and the increasing level of sophistication posed by cyber criminals.
As a provider of services to financial institutions and a provider of card processing services, we are bound by the same limitations on disclosure of the information we receive from our clients as apply to the clients themselves. If we fail to comply with these regulations and industry security requirements, we could be exposed to damages from legal actions from clients and/or their customers, governmental proceedings, governmental notice requirements, and the imposition of fines or prohibitions on card processing services. In addition, if more restrictive privacy laws, rules or industry security requirements are adopted in the future on the Federal or State level, or by a specific industry body, they could have an adverse impact on us through increased costs or restrictions on business processes. Any inability to prevent security or privacy breaches, or the perception that such breaches may occur, could cause our existing clients to lose confidence in our systems and terminate their agreements with us, inhibit our ability to attract new clients, result in increasing regulation, or bring about other adverse consequences from the government agencies that regulate our business.
Entity mergers or consolidations and business failures in the banking and financial services industry could adversely affect our business by eliminating some of our existing and potential clients and making us more dependent on a more limited number of clients.
There has been and continues to be substantial consolidation activity in the banking and financial services industry. In addition, certain financial institutions that experienced negative operating results, including some of our clients, have failed. These consolidations and failures reduce our number of potential clients and may reduce our number of existing clients, which could adversely affect our revenues, even if the events do not reduce the aggregate activities of the consolidated entities. Further, if our clients fail and/or merge with or are acquired by other entities that are not our clients, or that use fewer of our services, they may discontinue or reduce use of our services. It is also possible that larger financial institutions resulting from consolidations would have greater leverage in negotiating terms or could decide to perform in-house some or all of the services we currently provide or could provide. Any of these developments could have an adverse effect on our business, results of operations and financial condition.
If we fail to innovate or adapt our services to changes in technology or in the marketplace, or if our ongoing efforts to upgrade our technology are not successful, we could lose clients or our clients could lose customers and we could have difficulty attracting new clients for our services.
The markets for our services are characterized by constant technological changes, frequent introductions of new services and evolving industry standards. Our future success will be significantly affected by our ability to enhance our current solutions and develop and introduce new solutions and services that address the increasingly sophisticated needs of our clients and their customers. In addition, as more of our revenue and market demand shifts to software as a service ("SaaS"), business process as a service ("BPaaS"), cloud, and new disruptive technologies, the need to keep pace with rapid technology changes becomes more acute. These initiatives carry the risks associated with any new solution development effort, including cost overruns, delays in delivery, and performance issues. There can be no assurance that we will be successful in developing, marketing and selling new solutions or enhancements that meet these changing demands, that we will not experience difficulties that could delay or prevent the successful development, introduction, and marketing of these solutions or enhancements, or that our new solutions and enhancements will adequately meet the demands of the marketplace and achieve market acceptance. Any of these developments could have an adverse impact on our future revenues and/or business prospects.
12
We operate in a competitive business environment and if we are unable to compete effectively our results of operations and financial condition may be adversely affected.
The market for our services is intensely competitive. Our competitors vary in size and in the scope and breadth of the solutions and services they offer. Some of our competitors have substantial resources. We face direct competition from third parties, and since many of our larger potential clients have historically developed their key applications in-house and therefore view their system requirements from a make-versus-buy perspective, we also often compete against our potential clients’ in-house capacities. In addition, the markets in which we compete have recently attracted increasing competition from smaller start-ups with disruptive technologies, which are receiving increasing investments, global banks (and businesses controlled by combinations of global banks) and global internet companies that are introducing competitive products and services into the marketplace, particularly in the payments area. Emerging technologies and increased competition may also have the effect of unbundling bank solutions and result in picking off solutions we are currently providing from our legacy systems. International competitors are also now targeting and entering the U.S. market with greater force. There can be no assurance that we will be able to compete successfully against current or future competitors or that the competitive pressures we face in the markets in which we operate will not materially adversely affect our business, financial condition, and results of operations. See "Item 1.
Business,
Competition."
Global economic, political and other conditions, including business cycles and consumer confidence, may adversely affect our clients or trends in consumer spending, which may adversely impact the demand for our services and our revenue and profitability.
A significant portion of our revenue is derived from transaction processing fees. The global transaction processing industries depend heavily upon the overall level of consumer, business and government spending. Any change in economic factors, including a sustained deterioration in general economic conditions or consumer confidence, particularly in the United States, or increases in interest rates in key countries in which we operate may adversely affect consumer spending, including related consumer debt, further reduce check writing and change credit and debit card usage, and as a result, adversely affect our financial performance by reducing the number or average purchase amount of transactions that we service.
When there is a slowdown or downturn in the economy, a drop in stock market levels or trading volumes, or an event that disrupts the financial markets, our business and financial results, particularly with respect to our capital markets businesses, may suffer for a number of reasons. Customers may react to worsening conditions by reducing their capital expenditures in general or by specifically reducing their information technology spending. In addition, customers may curtail or discontinue trading operations, delay or cancel information technology projects, or seek to lower their costs by renegotiating vendor contracts. Moreover, competitors may respond to market conditions by lowering prices and attempting to lure away our customers to lower cost solutions. Any more protective trade policies or actions taken by the U.S. may also result in other countries reducing or making more expensive services permitted to be provided by U.S. based companies. If any of these circumstances remain in effect for an extended period of time, there could be a material adverse effect on our financial results.
Constraints within global financial markets or international regulatory requirements could constrain our financial institution clients' ability to purchase our services, impacting our future growth and profitability.
A significant number of our clients and potential clients may hold sovereign debt of economically struggling nations or be subject to international banking regulatory requirements such as Basel III (and a set of further reforms known as Basel IV scheduled to be phased in commencing in January 2022), which may require changes in their capitalization and hence the amount of their working capital available to purchase our services. These potential constraints could alter the ability of clients or potential clients to purchase our services and thus could have a significant impact on our future growth and profitability.
The sales and implementation cycles for many of our software and service offerings can be lengthy and require significant investment from both our clients and FIS. If we fail to close sales or if a client chooses not to complete an installation after expending significant time and resources to do so, our business, financial condition, and results of operations may be adversely affected.
The sales and associated deployment of many of our software or service offerings often involve significant capital commitments by our clients and/or FIS. Potential clients generally commit significant resources to an evaluation of available software and services and require us to expend substantial time, effort, and money educating them prior to sales. Further, as part of the sale or deployment of our software and services, clients may also require FIS to perform significant related services to complete a proof of concept or custom development to meet their needs. All of the aforementioned activities may require the expenditure of significant funds and management resources and, ultimately, the client may determine not to close the sale or
13
complete the implementation. If we are unsuccessful in closing sales or if the client decides not to complete an implementation after we expend significant funds and management resources or we experience delays, it could have an adverse effect on our business, financial condition, and results of operations.
Our results may fluctuate from period to period because of the lengthy and unpredictable sales cycle for our software, changes in our mix of licenses and services, activity by competitors, and customer budgeting, operational requirements or renewal cycles.
Particularly with respect to our GFS segment, our operating results may fluctuate from period to period and be difficult to predict in a particular period due to the timing and magnitude of software license sales and other factors. We offer a number of our software solutions on a license basis, which means that the customer has the right to run the software on its own or a third party’s hardware. We generally recognize license revenue when the license contract is signed, the software is delivered, and the term has begun. The value of the license often depends on a number of customer-specific factors, such as the number of customer locations, users or accounts. The sales cycle for a software license may be lengthy and take unexpected turns. Thus, it is difficult to predict when software sales will occur or how much revenue they will generate. Because there are few incremental costs associated with software sales, our operating results may fluctuate from quarter to quarter and year to year due to the timing and magnitude of software sales. Our results may also vary as a result of pricing pressures, increased cost of equipment, the evolving and unpredictable markets in which our solutions and services are sold, changes in accounting principles, and competitors’ new solutions or services.
In addition, there are a number of other factors that could cause our sales and results of operation to fluctuate from period to period, including the following:
|
•
|
customers periodically renew or upgrade their installed base of our solutions, which trigger buying cycles for current or new versions of our solutions and our revenue generally fluctuates with these refresh cycles as a result;
|
|
•
|
the budgeting cycles and purchasing practices of customers, particularly large customers;
|
|
•
|
changes in customer, distributor or reseller requirements or market needs;
|
|
•
|
deferral of orders from customers in anticipation of new solutions or offerings announced by us or our competitors or otherwise anticipated by the market;
|
|
•
|
our ability to successfully expand our business domestically and internationally; and
|
|
•
|
insolvency or credit difficulties confronting our customers, which could adversely affect their ability to purchase or pay for our solutions.
|
Failure to obtain new clients or renew client contracts on favorable terms could adversely affect results of operations and financial condition.
We may face pricing pressure in obtaining and retaining our clients. Larger clients may be able to seek price reductions from us when they renew a contract, when a contract is extended, or when the client's business has significant volume changes. They may also reduce services if they decide to move services in-house. Further, our smaller and mid-size clients may also exert pricing pressure, particularly on renewal, due to pricing competition or other economic needs or pressures being experienced by the client. On some occasions, this pricing pressure results in lower revenue from a client than we had anticipated based on our previous agreement with that client. This reduction in revenue could result in an adverse effect on our business, operating results and financial condition.
Further, failure to renew client contracts on favorable terms could have an adverse effect on our business. Our contracts with clients generally run for several years and include liquidated damage provisions that provide for early termination fees. Terms are generally renegotiated prior to the end of a contract's term. If we are not successful in achieving a high rate of contract renewals on favorable terms, our results of operations and financial condition could be adversely affected.
Our business and operating results could be adversely affected if we experience business interruptions, errors or failure in connection with our or third-party information technology and communication systems and other software and hardware used in connection with our business, if we experience defects or design errors in the software solutions we offer, or more generally, if the third-party vendors we rely upon are unwilling or unable to provide the services we need to effectively operate our business.
Many of our services, including our transformation services, are based on sophisticated software and computing systems, and we may encounter delays when developing new technology solutions and services. Further, the technology solutions underlying our services have occasionally contained and may in the future contain undetected errors or defects when first introduced or when new versions are released. In addition, we may experience difficulties in installing or integrating our
14
technologies on platforms used by our clients or our clients may cancel a project after we have expended significant effort and resources to complete an installation. Finally, our systems and operations could be exposed to damage or interruption from fire, natural disaster, power loss, telecommunications failure, unauthorized entry and computer viruses. Defects in our technology solutions, errors or delays in the processing of electronic transactions, or other difficulties could result in (i) interruption of business operations; (ii) delay in market acceptance; (iii) additional development and remediation costs; (iv) diversion of technical and other resources; (v) loss of clients; (vi) negative publicity; or (vii) exposure to liability claims. Any one or more of the foregoing could have an adverse effect on our business, financial condition and results of operations. Although we attempt to limit our potential liability through controls, including system redundancies, security controls, application development and testing controls, and disclaimers and limitation-of-liability provisions in our license and client agreements, we cannot be certain that these measures will always be successful in preventing disruption or limiting our liability.
Further, most of the solutions we offer are very complex software systems that are regularly updated. No matter how careful the design and development, complex software often contains errors and defects when first introduced and when major new updates or enhancements are released. If errors or defects are discovered in current or future solutions, we may not be able to correct them in a timely manner, if at all. In our development of updates and enhancements to our software solutions, we may make a major design error that makes the solution operate incorrectly or less efficiently. The failure of software to properly perform could result in the Company and its clients being subjected to losses or liability, including censures, fines, or other sanctions by the applicable regulatory authorities, and we could be liable to parties who are financially harmed by those errors. In addition, such errors could cause the Company to lose revenues, lose clients or damage its reputation.
In addition, we generally depend on a number of third parties, both in the United States and internationally, to supply elements of our systems, computers, research and market data, connectivity, communication network infrastructure, other equipment and related support and maintenance. We cannot be certain that any of these third parties will be able to continue providing these services to effectively meet our evolving needs. If our vendors, or in certain cases vendors of our customers, fail to meet their obligations, provide poor or untimely service, or we are unable to make alternative arrangements for the provision of these services, we may in turn fail to provide our services or to meet our obligations to our customers, and our business, financial condition and operating results could be materially harmed.
The Dodd-Frank Act, the CFPB and state regulatory authorities, such as the New York State Department of Financial Services, may result in business changes for certain of our businesses and clients that have or could have an adverse effect on our financial condition, revenues, results of operations, or prospects for future growth and overall business.
The Dodd-Frank Act represented a comprehensive overhaul of the regulations governing the financial services industry within the United States. The Dodd-Frank Act established the CFPB and provided the CFPB with rulemaking authority with respect to certain federal consumer protection statutes as well as examination and supervisory authority over consumer reporting agencies, including ChexSystems.
The CFPB continues to establish rules and regulations for regulating financial and non-financial institutions and providers to those institutions to ensure adequate protection of consumer privacy and to ensure consumers are not impacted by deceptive business practices. These rules and regulations govern our clients or potential clients and also govern certain of our businesses. These regulations have resulted and may further result in the need for FIS to make capital investments to modify our solutions and services to facilitate our clients' and potential clients' compliance, as well as to deploy additional processes or reporting to comply with these regulations. In the future, we may be subject to additional expense to ensure continued compliance with applicable laws and regulations and to investigate, defend and/or remedy actual or alleged violations. Further, requirements of the regulations have resulted and could further result in changes in our business practices, our clients' business practices and those of other marketplace participants that may alter the delivery of services to consumers, which have impacted or could further impact the demand for our software and services as well as alter the type or volume of transactions that we process on behalf of our clients. As a result, these requirements, or proposed or future requirements, could have an adverse impact on our financial condition, revenues, results of operations, prospects for future growth and overall business.
The New York Department of Financial Services has enacted new rules that require covered financial institutions to establish and maintain cybersecurity programs. The impact of these rules and any future rules may require FIS to be subject to additional regulation and adopt additional business practices that could require additional capital expenditures or impact our operating results. Changes to state money transmission laws and regulations, including changing interpretations and the implementation of new or varying regulatory requirements, may result in the need for additional money transmitter licenses. These changes could result in increased costs of compliance, as well as fines or penalties.
15
Many of our clients are subject to a regulatory environment and to industry standards that may change in a manner that reduces the types or volume of solutions or services we provide, or may reduce the type or number of transactions in which our clients engage, and therefore, reduce our revenues.
Our clients are subject to a number of government regulations and industry standards with which our services must comply. Our clients must ensure that our services and related solutions work within the extensive and evolving regulatory and industry requirements applicable to them. Federal, state, foreign or industry authorities could adopt laws, rules or regulations affecting our clients' businesses that could lead to increased operating costs and could reduce the convenience and functionality of our services, possibly resulting in reduced market acceptance. In addition, action by regulatory authorities relating to credit availability, data usage, privacy, or other related regulatory developments could have an adverse effect on our clients and, therefore, could have a material adverse effect on our financial condition, revenues, results of operations, prospects for future growth and overall business. Elimination of regulatory requirements could also adversely affect the sales of our solutions designed to help clients comply with complex regulatory environments.
Our revenues from the sale of services to members of VISA, MasterCard, American Express, Discover and other similar organizations are dependent upon our continued certification and sponsorship, and the loss or suspension of certification or sponsorship could adversely affect our business.
In order to provide our card processing services, we must be certified (including applicable sponsorship) by VISA, MasterCard, American Express, Discover and other similar organizations. These certifications are dependent upon our continued adherence to the standards of the issuing bodies and sponsoring member banks. The member financial institutions, some of which are our competitors, set the standards with which we must comply. If we fail to comply with these standards we could be fined, our certifications could be suspended, or our registration could be terminated. The suspension or termination of our certifications, or any changes in the rules and regulations governing VISA, MasterCard, American Express, Discover, or other similar organizations, could result in a reduction in revenue or increased costs of operation, which in turn could have a material adverse effect on our business.
Changes in card association and debit network fees or products could increase costs or otherwise limit our operations.
From time to time, card associations and debit networks increase the interchange fees that they charge. It is possible that competitive pressures will result in our absorption of a portion of such increases in the future, which would increase our operating costs, reduce our profit margin and adversely affect our business, financial condition, and results of operations. Furthermore, the rules and regulations of the various card associations and networks prescribe certain capital requirements. Any increase in the capital level required would further limit our use of capital for other purposes.
Interchange fees and related practices have been receiving significant legal and regulatory scrutiny worldwide. The resulting regulatory changes that could occur from proposed regulations could alter the fees charged by card associations and debit networks worldwide. Such changes could have an adverse impact on our business or financial condition due to reductions or changes in types of transactions processed on behalf of our clients.
Our securities brokerage operations are highly regulated and subject to risks that are not encountered in our other businesses.
One of our subsidiaries is an SEC registered broker-dealer in the U.S. and others are authorized by the FCA to conduct certain regulated business in the U.K. Domestic and foreign regulatory and self-regulatory organizations, such as the SEC, FINRA, and the FCA, can, among other things, fine, censure, issue cease-and-desist orders against, and suspend or expel a broker-dealer or its officers or employees for failure to comply with the many laws and regulations that govern brokerage activities. Those laws and regulations derive from a variety of policy considerations and address a wide range of topics, including those designed to protect customers of broker-dealers, and the privacy of their information, and those designed to protect the integrity of the markets, such as laws and regulations requiring broker-dealers to report suspicious activity of customers. Sanctions for failure to comply with such laws and regulations may arise out of currently-conducted activities or those conducted in prior periods. Our ability to comply with these laws and regulations is largely dependent on our establishment, maintenance, and enforcement of an effective brokerage compliance program. Failure to establish, maintain, and enforce the required brokerage compliance procedures, even if unintentional, could subject us to significant losses, lead to disciplinary or other actions, and tarnish our reputation. Regulations affecting the brokerage industry may change, which could adversely affect our financial results.
We are exposed to certain risks relating to the execution services provided by our brokerage operations to our customers and counterparties, which include other broker-dealers, active traders, hedge funds, asset managers, and other institutional and
16
non-institutional clients. These risks include, but are not limited to, customers or counterparties failing to pay for or deliver securities, trading errors, the inability or failure to settle trades, and trade execution system failures. As trading in the U.S. securities markets has become more automated, the potential impact of a trading error or a rapid series of errors caused by a computer or human error, or a malicious act has become greater. In our other businesses, we generally can disclaim liability for trading losses that may be caused by our software, but in our brokerage operations, we may not be able to limit our liability for trading losses or failed trades even when we are not at fault. As a result, we may suffer losses that are disproportionately large compared to the relatively modest profit contributions of our brokerage operations.
Privacy laws and regulations, such as the GDPR, require FIS to adopt new business practices and contractual provisions in existing and new contracts which may require transitional and incremental expenses which may impact our future operating results.
New privacy laws, such as the GDPR in the EU, continue to develop in ways we cannot predict. Privacy laws may be interpreted and applied inconsistently from country to country and impose inconsistent or conflicting requirements. Complying with varying jurisdictional requirements could increase the costs and complexity of compliance and associated recordkeeping costs or require us to change our business practices in a manner adverse to our business. Violations of privacy laws can result in significant penalties and damage to our brand and business.
Implementation of the GDPR has required changes to certain of our business practices, thereby increasing our costs. We ha
ve put into place a thorough compliance program to comply with the known obligations under the GDPR and have performed data protection impact assessments for our businesses that are in scope and have executed data protection agreements with the clients and vendors of those businesses. If certain of our clients and vendors fail to recognize the importance and/or applicability of these requirements and do not respond to our request for such amendments, both parties may be subject to penalties and fines for non-compliance. Failure to comply with the requirements of the GDPR could result in significant penalties and loss of business, among other things.
New privacy laws in California and Brazil are expected to issue clarifying regulations prior to becoming effective in 2020 so we will continue to have uncertainties about what we will be expected to comply with these laws until they are issued, including the costs and efforts of compliance. There are also several additional privacy laws being considered by state legislatures, the federal legislature and countries around the world, so a more substantial compliance effort with varying regimes in different jurisdictions is considered probable in the future, which will increase the costs and complexities of our business.
If we fail to comply with applicable regulations or to meet regulatory expectations, our business, results of operations or financial condition could be adversely impacted.
The majority of our data processing services for financial institutions are not directly subject to federal or state regulations specifically applicable to financial institutions such as banks, thrifts and credit unions. However, as a provider of services to these financial institutions, our data processing operations are examined on a regular basis by various federal and state regulatory authorities and by international regulatory authorities, such as the FCA, in certain jurisdictions. If we fail to comply with any applicable regulations or guidelines for operations of a data services provider, we could be subject to regulatory actions or rating changes, may not meet contractual obligations, and may suffer harm to our client relationships or reputation. Failure to meet the aforementioned requirements or to adapt to new requirements at the federal, state or international level could inhibit our ability to retain existing clients or obtain new clients, which could have an adverse impact on our business, results of operations and financial condition.
In addition to our data processing services described above, we also have business operations that store, process or transmit consumer information or have direct relationships with consumers that are obligated to comply with regulations, including, but not limited to, the Federal Fair Credit Reporting Act, the Federal Fair Debt Collection Practices Act and applicable privacy requirements. Further, our international businesses must comply with applicable laws such as the U.S. Foreign Corrupt Practices Act. Failure to maintain compliance with or adapt to changes in any of the aforementioned requirements could result in fines, penalties or regulatory actions that could have an adverse impact on our business, results of operations and financial condition.
High profile payment card industry or digital banking security breaches could impact consumer payment behavior patterns in the future and reduce our card payment transaction volumes.
We are unable to predict whether or when high profile card payment or digital banking security breaches will occur and if they occur, whether consumers will transact less on their payment cards or reduce their digital banking service. If consumers
17
transact less on cards issued by our clients or reduce digital banking services and we are not able to adapt to offer our clients alternative technologies, it could have a significant adverse impact on our revenue and related earnings.
Misappropriation of our intellectual property and proprietary rights or a finding that our patents are invalid could impair our competitive position.
Our ability to compete depends in some part upon our proprietary solutions and technology. Despite our efforts to protect our proprietary rights, unauthorized parties may attempt to copy aspects of our services or to obtain and use information that we regard as proprietary or challenge the validity of our patents with governmental authorities. Policing unauthorized use of our proprietary rights is difficult. We cannot make any assurances that the steps we have taken will prevent misappropriation of technology or that the agreements entered into for that purpose will be enforceable. Effective patent, trademark, service mark, copyright, and trade secret protection may not be available in every country in which our applications and services are made available online. Misappropriation of our intellectual property or potential litigation concerning such matters could have an adverse effect on our results of operations or financial condition.
If our applications or services are found to infringe the proprietary rights of others, we may be required to change our business practices and may also become subject to significant costs and monetary penalties.
As our information technology applications and services develop, we are increasingly subject to infringement claims. Any claims, whether with or without merit, could (i) be expensive and time-consuming to defend; (ii) result in an injunction or other equitable relief which could cause us to cease making, licensing or using applications that incorporate the challenged intellectual property; (iii) require us to redesign our applications, if feasible; (iv) divert management’s attention and resources; and (v) require us to enter into royalty or licensing agreements in order to obtain the right to use necessary technologies or pay damages resulting from any infringing use.
Some of our solutions contain "open source" software, and any failure to comply with the terms of one or more of these open source licenses could negatively affect our business.
We use a limited amount of software licensed by its authors or other third parties under so-called "open source" licenses and may continue to use such software in the future. Some of these licenses contain requirements that we make available source code for modifications or derivative works we create based upon the open source software, and that we license such modifications or derivative works under the terms of a particular open source license or other license granting third parties certain rights of further use. By the terms of certain open source licenses, we could be required to release the source code of our proprietary software if we combine our proprietary software with open source software in a certain manner. Additionally, the terms of many open source licenses have not been interpreted by United States or other courts, and there is a risk that these licenses could be construed in a manner that could impose unanticipated conditions or restrictions on our ability to commercialize our solutions. In addition to risks related to license requirements, usage of open source software can lead to greater risks than use of third-party commercial software, as open source licensors generally do not provide warranties or controls on origin of the software. We have established processes to help alleviate these risks, including a review process for screening requests from our development organizations for the use of open source, but we cannot be sure that all open source is submitted for approval prior to use in our solutions. In addition, many of the risks associated with usage of open source cannot be eliminated, and could, if not properly addressed, negatively affect our business.
Lack of system integrity, fraudulent payments, credit quality, and undetected errors related to funds settlement or the availability of clearing services could result in a financial loss.
We settle funds on behalf of financial institutions, other businesses and consumers and receive funds from clients, card issuers, payment networks and consumers on a daily basis for a variety of transaction types. Transactions facilitated by us include debit card, credit card, electronic bill payment transactions, banking payments and check clearing that supports consumers, financial institutions and other businesses. These payment activities rely upon the technology infrastructure that facilitates the verification of activity with counterparties, the facilitation of the payment as well as the detection or prevention of fraudulent payments. If our continuity of operations, integrity of processing, or ability to detect or prevent fraudulent payments were compromised, this could result in a financial loss to us. In addition, we rely on various financial institutions to provide ACH services in support of funds settlement for certain of our solutions. If we are unable to obtain such ACH services in the future, that could have a material adverse effect on our business, financial position and results of operations. In addition, we may issue credit to consumers, financial institutions or other businesses as part of the funds settlement. A default on this credit by a counterparty could result in a financial loss to us. Furthermore, if one of our clients for which we facilitate settlement suffers a fraudulent event due to an error of their controls, we may suffer a financial loss if the client does not have sufficient capital to cover the loss.
18
The Referendum on the United Kingdom’s Membership in the European Union could cause disruption to and create uncertainty surrounding our business.
The referendum on the United Kingdom’s membership in the European Union (referred to as "Brexit"), approving the exit of the United Kingdom from the European Union could cause disruptions to and create uncertainty surrounding our business, including affecting our relationships with our existing and future clients, suppliers and employees, which could have an adverse effect on our business, financial results and operations. The effects of Brexit will depend on the agreements, if any, the U.K. makes with the EU to retain access to EU markets at the time Brexit takes effect (March 29, 2019, if not suspended/delayed), during a transitional period or more permanently. In addition, because the terms of trade between the U.K. and jurisdictions other than the EU may be currently governed by trade agreements between the EU and such other jurisdictions, the U.K. may be required to negotiate new terms of trade with such other jurisdictions. These potential measures could disrupt the markets we serve and the tax jurisdictions in which we operate and adversely change tax benefits or liabilities in these or other jurisdictions, and may cause us to lose clients, suppliers, and employees. In addition, Brexit could lead to legal uncertainty and potentially divergent national laws and regulations as the U.K. determines which EU laws to replace or replicate.
Actions to implement Brexit may also create global economic uncertainty, which may cause our clients to closely monitor their costs and reduce their spending on our solutions and services.
Any of these effects of Brexit, among others, could materially adversely affect our business, business opportunities, results of operations, financial condition and cash flows.
Failure to properly manage or mitigate risks in the operation of our wealth and retirement businesses in the U.S and the U.K could have adverse liability consequences.
We have wealth and retirement businesses in the U.S. and U.K. engaged in processing securities transactions on behalf of clients and serving as a custodian. Failure to properly manage or mitigate risks in those operations and increased volatility in the financial markets may increase the potential for and magnitude of resulting losses, including those that may arise from human errors or omissions, defects or interruptions in computer or communications systems or breakdowns in processes or in internal controls. Human errors or omissions may include failures to comply with applicable laws or corporate policies and procedures, theft, fraud or misappropriation of assets, whether arising from the intentional actions of internal personnel or external third parties.
In addition, the U.S.-based business holds charters in the states of Georgia and Delaware which exposes us to further regulatory compliance requirements of the Georgia Department of Banking and Finance and the Office of the Commissioner of Banking in the State of Delaware. The U.S. wealth and retirement business is required to hold certain levels of regulatory capital as defined by the state banking regulators in the states in which it holds a bank or trust charter (Delaware and Georgia). In the U.K., our Platform Securities and broker-dealer businesses are regulated by the FCA and are subject to further regulatory capital requireme
nts. One consequence of Brexit may be that the loss of the ability to “passport” regulated business from the U.K. to the EU may result in our having to add operations of the business in a country in the EU that may subject us to further regulatory requirements and costs in that country.
Our business is subject to the risks of international operations, including movements in foreign currency exchange rates.
The international operations of FIS represented approximately
26%
of our total 2018 revenues and are largely conducted in currencies other than the U.S. Dollar, including the British Pound, Brazilian Real, Euro and Indian Rupee. Our business and financial results could be adversely affected due to a variety of factors, including the following:
|
•
|
changes in a specific country or region’s political and cultural climate or economic condition, including change in governmental regime;
|
•
unexpected or unfavorable changes in foreign laws, regulatory requirements and related interpretations;
•
difficulty of effective enforcement of contractual provisions in local jurisdictions;
•
inadequate intellectual property protection in foreign countries;
|
•
|
trade-protection measures, import or export licensing requirements such as Export Administration Regulations promulgated by the U.S. Department of Commerce and fines, penalties or suspension or revocation of export privileges;
|
|
•
|
trade sanctions imposed by the U.S. or other governments with jurisdictional authority over our business operations;
|
|
•
|
the effects of applicable and potentially adverse foreign tax law changes;
|
|
•
|
significant adverse changes in foreign currency exchange rates;
|
|
•
|
longer accounts receivable cycles;
|
19
|
•
|
managing a geographically dispersed workforce;
|
|
•
|
trade treaties, tariffs or agreements that could adversely affect our ability to do business in affected countries; and
|
|
•
|
compliance with the U.S. Foreign Corrupt Practices Act, or FCPA, and the Office of Foreign Assets
|
Control regulations, particularly in emerging markets.
In foreign countries, particularly in those with developing economies, certain business practices may exist that are prohibited by laws and regulations applicable to us, such as the U.S. Foreign Corrupt Practices Act, the U.K. Bribery Act and other anti-corruption laws. Although our policies and procedures require compliance with these laws and are designed to facilitate compliance with these laws, our employees, contractors and agents may take actions in violation of applicable laws or our policies. Any such violation, even if prohibited by our policies, could have a material adverse effect on our business and
reputation.
As we expand our international operations, more of our clients may pay us in foreign currencies. Conducting business in currencies other than U.S. Dollars subjects us to fluctuations in currency exchange rates that can negatively impact our results, period to period, including relative to analyst estimates or guidance. Our primary exposure to movements in foreign currency exchange rates relates to foreign currencies in Brazil, Europe, including the United Kingdom, and parts of Asia. The U.S. Dollar value of our net investments in foreign operations, the periodic conversion of foreign-denominated earnings to the U.S. Dollar (our reporting currency), and our results of operations and, in some cases, cash flows, could be adversely affected in a material manner by movements in foreign currency exchange rates. These risks could cause an adverse effect on the business, financial position and results of operations of the Company.
We have businesses in emerging markets that may experience significant economic volatility.
We have operations in emerging markets, primarily in Brazil, India, Southeast Asia, the Middle East and Africa. These emerging market economies tend to be more volatile than the more established markets we serve in North America and Europe, which could add volatility to our future revenues and earnings.
Failure to attract and retain skilled technical employees or senior management personnel could harm our ability to grow.
Our future success depends upon our ability to attract and retain highly-skilled technical personnel. Because the development of our solutions and services requires knowledge of computer hardware, operating system software, system management software and application software, our technical personnel must be proficient in a number of disciplines. Competition for such technical personnel is intense, and our failure to hire and retain talented personnel could have a material adverse effect on our business, operating results and financial condition.
Our future growth will also require sales and marketing, financial and administrative personnel to develop and support new solutions and services, to enhance and support current solutions and services and to expand operational and financial systems. There can be no assurance that we will be able to attract and retain the necessary personnel to accomplish our growth strategies and we may experience constraints that could adversely affect our ability to satisfy client demand in a timely fashion.
Our ability to maintain compliance with applicable laws, rules and regulations and to manage and monitor the risks facing our business relies upon the ability to maintain skilled compliance, security, risk and audit professionals. Competition for such skillsets is intense, and our failure to hire and retain talented personnel could have an adverse effect on our internal control environment and impact our operating results.
Our senior management team has significant experience in the financial services industry and the loss of this leadership could have an adverse effect on our business, operating results and financial condition. Further, the loss of this leadership may have an adverse impact on senior management's ability to provide effective oversight and strategic direction for all key functions within the Company, which could impact our future business, operating results and financial condition.
We are the subject of various legal proceedings that could have a material adverse effect on our revenue and profitability.
We are involved in various litigation matters, including in some instances class-action cases and patent infringement litigation. If we are unsuccessful in our defense of litigation matters, we may be forced to pay damages and/or change our business practices, any of which could have a material adverse effect on our business and results of operations.
20
Unfavorable resolution of tax contingencies or unfavorable future tax law changes could adversely affect our tax expense.
Our tax returns and positions are subject to review and audit by federal, state, local and international taxing authorities. An unfavorable outcome to a tax audit could result in higher tax expense and could negatively impact our effective tax rate, financial position, results of operations and cash flows in the current and/or future periods. The U.S. enacted significant tax reform in 2017 and certain provisions of the new law could have an adverse impact to us. Unfavorable future tax law changes could also result in negative impacts. In addition, tax-law amendments in the United States and other jurisdictions could significantly impact how United States multinational corporations are taxed. Although we cannot predict whether or in what form such legislation will pass, if enacted it could have a material adverse effect on our business and financial results.
A material weakness in our internal controls could have a material adverse effect on us.
Effectiv
e
internal controls are necessary for us to provide reasonable assurance with respect to our financial reports and to adequately mitigate risk of fraud. If we cannot provide reasonable assurance with respect to our financial reports and adequately mitigate risk of fraud, our reputation and operating results could be harmed. Internal control over financial reporting may not prevent or detect misstatements because of its inherent limitations, including the possibility of human error, the circumvention or overriding of controls, or fraud. Therefore, even effective internal controls can provide only reasonable assurance with respect to the preparation and fair presentation of financial statements. In addition, projections of any evaluation of effectiveness of internal control over financial reporting to future periods are subject to the risk that the control may become inadequate because of changes in conditions, or that the degree of compliance with the policies or procedures may deteriorate.
A material weakness is a deficiency, or combination of deficiencies, in internal control over financial reporting, such that there is a reasonable possibility that a material misstatement of the Company’s annual or interim financial statements will not be prevented or detected on a timely basis. A material weakness in our internal control over financial reporting could adversely impact our ability to provide timely and accurate financial information. If we are unable to report financial information timely and accurately or to maintain effective disclosure controls and procedures, we could be subject to, among other things, regulatory or enforcement actions by the SEC, any one of which could adversely affect our business prospects.
Risks Related to Business Combinations and Ventures
Strategic transactions, including acquisitions and divestitures, involve significant risks and uncertainties that could adversely affect our business, financial condition, results of operations and cash flows.
Strategic acquisitions and divestitures we have made in the past and may make in the future present significant risks and uncertainties that could adversely affect our business, financial condition, results of operations and cash flows. These risks include the following:
|
•
|
Difficulty in evaluating potential acquisitions, including the risk that our due diligence does not identify or fully assess valuation issues, potential liabilities or other acquisition risks;
|
|
•
|
Difficulty and expense in integrating newly acquired businesses and operations, including combining product and service offerings, and in entering into new markets in which we are not experienced, in an efficient and cost-effective manner while maintaining adequate standards, controls and procedures, and the risk that we encounter significant unanticipated costs or other problems associated with integration;
|
|
•
|
Difficulty and expense in consolidating and rationalizing IT infrastructure and integrating acquired software;
|
|
•
|
Challenges in achieving strategic objectives, cost savings and other benefits expected from acquisitions;
|
|
•
|
Risk that our markets do not evolve as anticipated and that the strategic acquisitions and divestitures do not prove to be those needed to be successful in those markets;
|
|
•
|
Risk that acquired systems expose us to cybersecurity and other data security risks;
|
|
•
|
Costs to reach appropriate standards to protect against cybersecurity and other data security risks or timeline to achieve such standards may exceed those estimated in diligence;
|
|
•
|
Risk that acquired companies are subject to new regulatory regimes or oversight where we have limited experience that may result in additional compliance costs and potential regulatory penalties;
|
|
•
|
Risk that we assume or retain, or that companies we have acquired have assumed or retained or otherwise become subject to, significant liabilities that exceed the limitations of any applicable indemnification provisions or the financial resources of any indemnifying parties;
|
|
•
|
Risk that indemnification related to businesses divested or spun-off that we may be required to provide or otherwise bear may be significant and could negatively impact our business;
|
21
|
•
|
Risk of exposure to potential liabilities arising out of applicable state and Federal fraudulent conveyance laws and legal distribution requirements from spin-offs in which we or companies we have acquired were involved;
|
|
•
|
Risk that we may be responsible for U.S. Federal income tax liabilities related to acquisitions or divestitures;
|
|
•
|
Risk that we are not able to complete strategic divestitures on satisfactory terms and conditions, including non-competition arrangements applicable to certain of our business lines, or within expected time frames;
|
|
•
|
Potential loss of key employees or customers of the businesses acquired or to be divested; and
|
|
•
|
Risk of diverting the attention of senior management from our existing operations.
|
The future results of our Brazilian operations may not meet our financial goals following the unwinding of the Brazilian Venture.
On December 31, 2018, we closed a transaction with Banco Bradesco to unwind the Brazilian Venture. Under this agreement, the Brazilian Venture spun-off certain assets of the business that also provide services to non-Bradesco clients to a new wholly-owned FIS subsidiary. The subsidiary entered into a long-term commercial agreement to provide current and new services to Banco Bradesco effective January 1, 2019 that include software licensing, maintenance, application management, card portfolio migration, business process outsourcing, fraud management and professional services. As a result of the transaction, Banco Bradesco owns 100% of the entity that previously housed the Brazilian Venture and its remaining assets that relate to card processing for Banco Bradesco, which Banco Bradesco will perform internally. The transaction is expected to result in an annualized reduction in FIS’ reported revenue of approximately $225 million.
While FIS expects the net earnings from non-Bradesco customers and the current and new services provided to Bradesco by FIS to largely replace the net earnings lost from the unwinding of the Brazilian Venture, no assurance can be made in this regard, and FIS may fail to meet its financial goals to grow the business following the closing of the transaction. Further, it is possible that existing non-Bradesco clients may reduce the amount of services we perform for them following the unwinding of the Brazilian Venture. In addition, the costs of operating in Brazil on a stand-alone basis could be higher than we anticipate.
For further detail on our Brazilian Venture see Note 16 of the Notes to Consolidated Financial Statements.
There could be significant liability for us if all or part of the AS Split-Off were determined to be taxable for U.S. federal or state income tax purposes.
On March 31, 2014, SunGard completed the split-off of its Availability Services ("AS") business to its existing stockholders, including its private equity owners, on a tax-free and pro-rata basis (the “AS Split-Off”). At the time SunGard received opinions from outside tax counsel to the effect that the AS Split-Off should qualify for tax-free treatment as transactions described in Section 355 and related provisions of the Internal Revenue Code, as amended (the “Code”). In addition, actions taken following the AS Split-Off, including the SunGard acquisition and certain 50 percent or greater changes by vote or value of the stock ownership of the new entity conducting the AS business, may cause the AS Split-Off to be taxable to FIS. In connection with the SunGard acquisition, we and SunGard received opinions of outside tax counsel to the effect that the SunGard acquisition should not cause the AS Split-off to fail to so qualify.
Notwithstanding the receipt of tax opinions, the tax-free treatment of the AS Split-off is not free from doubt, and there is a risk that the Internal Revenue Service (the "IRS"), a state taxing authority or a court could conclude to the contrary that the separation of the AS business from SunGard may not qualify as tax-free transactions. An opinion of tax counsel is not binding on the IRS, state taxing authorities or any court and as a result there can be no assurance that a tax authority will not challenge the tax-free treatment of all or part of the AS Split-Off or that, if litigated, a court would not agree with the IRS or a state taxing authority. Further, these tax opinions rely on certain facts, assumptions, representations, warranties and covenants from SunGard, the new entity conducting the AS business and from some of SunGard’s stockholders regarding the past and future conduct of the companies’ respective businesses, share ownership and other matters. If any of the facts, assumptions, representations, warranties and covenants on which the opinions rely is inaccurate or incomplete or not satisfied, the opinions may no longer be valid. Moreover, the IRS or state taxing authority could determine on audit that the AS Split-Off is taxable if it determines that any of these facts, assumptions, representations, warranties or covenants are not correct or have been violated or if it disagrees with one or more conclusions in the opinions or for other reasons.
If the AS Split-Off is determined to be taxable, we and possibly our stockholders could incur significant income tax liabilities. These tax liabilities could have a material adverse effect on our business, financial condition, results of operations and cash flows.
22
Actions taken by Sungard Availability Services Capital, Inc. or its stockholders could cause the AS Split-Off to fail to qualify as a tax-free transaction, and Sungard Availability Services Capital, Inc. may be unable to fully indemnify SunGard for the resulting significant tax liabilities.
Pursuant to the Tax Sharing and Disaffiliation Agreement ("Tax Sharing Agreement") that SunGard entered into with Sungard Availability Services Capital, Inc. ("SpinCo"), SpinCo is required to indemnify SunGard for certain taxes relating to the AS Split-Off that result from (i) any breach of the representations or the covenants made by SpinCo regarding the preservation of the intended tax-free treatment of the AS Split-Off, (ii) any action or omission that is inconsistent with the representations, statements, warranties and covenants provided to tax counsel in connection with their delivery of tax opinions to SunGard with respect to the AS Split-Off, and (iii) any other action or omission that was likely to give rise to such taxes when taken, in each case, by SpinCo or any of its subsidiaries. Conversely, if any such taxes are the result of such a breach or certain other actions or omissions by SunGard, SunGard would be wholly responsible for such taxes. In addition, if any part of the AS Split-Off fails to qualify for the intended tax-free treatment for reasons other than those for which SunGard or SpinCo would be wholly responsible pursuant to the provisions described above, SpinCo will be obligated to indemnify SunGard for 23% of the liability for taxes imposed in respect of the AS Split-Off and SunGard would bear the remainder of such taxes. If SpinCo is required to indemnify SunGard for any of the foregoing reasons, SpinCo’s indemnification liabilities could potentially exceed its net asset value and SpinCo may be unable to fully reimburse or indemnify SunGard for its significant tax liabilities arising from the AS Split-Off as provided by the Tax Sharing Agreement.
We have substantial investments in recorded goodwill and other intangible assets as a result of prior acquisitions, and a severe or extended economic downturn could cause these investments to become impaired, requiring write-downs that would reduce our operating income.
As of
December 31, 2018
, goodwill aggregated to
$13.5 billion
, or
57.0%
of total assets, and other indefinite-lived intangible assets aggregated to
$43 million
, or
0.2%
of total assets. Current accounting rules require goodwill and other indefinite-lived intangible assets to be assessed for impairment at least annually or whenever changes in circumstances indicate potential impairment. Factors that may be considered a change in circumstance include significant underperformance relative to historical or projected future operating results, a significant decline in our stock price and market capitalization, and negative industry or economic trends. The results of our 2018 annual assessment of the recoverability of goodwill indicated that the fair values of the Company’s reporting units were in excess of the carrying values of those reporting units, and thus no goodwill impairment existed as of December 31, 2018. Likewise, the fair value of indefinite-lived intangible assets was also in excess of the carrying value of those assets as of December 31, 2018. However, if worldwide or United States economic conditions decline significantly with negative impacts to bank spending and consumer behavior
,
or if other business or market changes impact our outlook
,
the carrying amount of our goodwill and other indefinite-lived intangible assets may no longer be recoverable and we may be required to record an impairment charge, which would have a negative impact on our results of operations.
As of
December 31, 2018
, intangible assets with finite useful lives aggregated to
$3,089 million
, or
13.0%
of total assets. Current accounting rules require intangible assets with finite useful lives to be reviewed for impairment whenever events or changes in circumstances indicate that the carrying amount of an asset may not be recoverable. Factors that may be considered a change in circumstance include significant underperformance relative to historical or projected future operating results, a significant decline in our stock price and market capitalization, and negative industry or economic trends.
We will continue to monitor the fair value of our intangible assets as well as our market capitalization and the impact of any economic downturn on our business to determine if there is an impairment in future periods.
Risks Related to our Indebtedness
Our existing debt levels and future levels under existing facilities and debt service requirements may adversely affect our financial condition or operational flexibility and prevent us from fulfilling our obligations under our outstanding indebtedness.
As of
December 31, 2018
, we had total debt of approximately
$9.0 billion
. This level of debt or any increase in our debt level could have adverse consequences for our business, financial condition, operating results and operational flexibility, including the following: (i) the debt level may cause us to have difficulty borrowing money in the future for working capital, capital expenditures, acquisitions or other purposes; (ii) our debt level may limit operational flexibility and our ability to pursue business opportunities and implement certain business strategies; (iii) some of our debt has a variable rate of interest, which exposes us to the risk of increased interest rates; (iv) we have a higher level of debt than some of our competitors or potential
23
competitors, which may cause a competitive disadvantage and may reduce flexibility in responding to changing business and economic conditions, including increased competition and
vulnerability to general adverse economic and industry conditions
; (v) there are significant maturities on our debt that we may not be able to repay at maturity or that may be refinanced at higher rates; and (vi)
if we fail to satisfy our obligations under our outstanding debt or fail to comply with the financial or other restrictive covenants contained in the indenture governing our senior notes, or our credit facility, an event of default could result that could cause all of our debt to become due and payable.
We may be adversely affected by changes in LIBOR reporting practices or the method in which LIBOR is determined.
As of
December 31, 2018
, we had outstanding approximately
$208 million
of variable debt that was indexed to the London Interbank Offered Rate ("LIBOR"). On July 27, 2017, the Financial Conduct Authority (the “FCA”) announced its intention to stop persuading or compelling banks to submit rates for calibration of LIBOR to the administrator of LIBOR after 2021. It is not possible to predict the further effect of the rules or policies of the FCA, any changes in the methods by which LIBOR is determined, or any other reforms to LIBOR that may be enacted in the United Kingdom, the European Union or elsewhere. Any such developments may cause LIBOR to perform differently than in the past, or cease to exist. In addition, any other legal or regulatory changes made by the FCA, ICE Benchmark Administration Limited, the European Money Markets Institute (formerly Euribor-EBF), the European Commission or any other successor governance or oversight body, or future changes adopted by such body, in the method by which LIBOR is determined or the transition from LIBOR to a successor benchmark rate may result in, among other things, a sudden or prolonged increase or decrease in LIBOR, a delay in the publication of LIBOR, and changes in the rules or methodologies in LIBOR, which may discourage market participants from continuing to administer or to participate in LIBOR’s determination, and, in certain situations, could result in LIBOR no longer being determined and published. If a published U.S. dollar LIBOR rate is unavailable after 2021, the interest rates on our debt which is indexed to LIBOR will be determined using various alternative methods, any of which may result in interest obligations which are more than or do not otherwise correlate over time with the payments that would have been made on such debt if U.S. dollar LIBOR was available in its current form. Further, the same costs and risks that may lead to the discontinuation or unavailability of U.S. dollar LIBOR may make one or more of the alternative methods impossible or impracticable to determine. Any of these proposals or consequences could have a material adverse effect on our financing costs.
Rising interest rates could increase our borrowing costs
Our exposure to market risk for changes in interest rates relates to our short-term commercial paper borrowings, Revolving Credit Facility and interest rate derivatives. In the future we may have additional borrowings under existing or new variable-rate debt. Increases in interest rates on variable-rate debt would increase our interest expense. A rising interest rate environment could increase the cost of refinancing existing debt and incurring new debt, which could have an adverse effect on our financing costs.
Credit Ratings, if lowered below investment grade, could adversely affect our cost of funds and liquidity
The Company maintains investment grade credit ratings from the major U.S. rating agencies on its senior unsecured debt (S&P BBB, Moody's Baa2, Fitch BBB), as well as its commercial paper program (S&P A-2, Moody's P-2, Fitch F2). Failure to maintain investment grade rating levels could adversely affect the Company’s cost of funds and liquidity and access to certain capital markets, but would not have an adverse effect on the Company’s ability to access its existing Revolving Credit Facility.
Please note that a security rating is not a recommendation to buy, sell or hold securities, that it may be subject to revision or withdrawal at any time by the assigning rating organization, and that each rating should be evaluated independently of any other rating.
Statement Regarding Forward-Looking Information
The statements contained in this Form 10-K or in our other documents or in oral presentations or other statements made by our management that are not purely historical are forward-looking statements within the meaning of the U.S. federal securities laws. Statements that are not historical facts, including statements about anticipated financial outcomes, including any earnings guidance of the Company, business and market conditions, outlook, foreign currency exchange rates, expected dividends and share repurchases, the Company’s sales pipeline and anticipated profitability and growth, as well as other statements about our expectations, beliefs, intentions, or strategies regarding the future are forward-looking statements. These statements relate to future events and our future results and involve a number of risks and uncertainties. Forward-looking statements are based on management's beliefs, as well as assumptions made by, and information currently available to, management. Any statements that refer to beliefs, expectations, projections or other characterizations of future events or circumstances and other statements that are not historical facts are forward-looking statements. In many cases, you can identify forward-looking statements by
24
terminology such as “may,” “will,” “should,” “expect,” “plan,” “anticipate,” “believe,” “estimate,” “predict,” “potential,” or “continue,” or the negative of these terms and other comparable terminology. Actual results, performance or achievement could differ materially from those contained in these forward-looking statements. The risks and uncertainties that forward-looking statements are subject to include the following without limitation:
|
•
|
the risk that acquired businesses will not be integrated successfully, or that the integration will be more costly or more time-consuming and complex than anticipated;
|
|
•
|
the risk that cost savings and other synergies anticipated to be realized from acquisitions may not be fully realized or may take longer to realize than expected;
|
|
•
|
the risk of doing business internationally;
|
|
•
|
changes in general economic, business and political conditions, including the possibility of intensified international hostilities, acts of terrorism, changes in either or both the United States and international lending, capital and financial markets and currency fluctuations;
|
|
•
|
the effect of legislative initiatives or proposals, statutory changes, governmental or other applicable regulations and/or changes in industry requirements, including privacy and cybersecurity laws and regulations;
|
|
•
|
the risks of reduction in revenue from the elimination of existing and potential customers due to consolidation in, or new laws or regulations affecting, the banking, retail and financial services industries or due to financial failures or other setbacks suffered by firms in those industries;
|
|
•
|
changes in the growth rates of the markets for our solutions;
|
|
•
|
failures to adapt our solutions to changes in technology or in the marketplace;
|
|
•
|
internal or external security breaches of our systems, including those relating to unauthorized access, theft, corruption or loss of personal information and computer viruses and other malware affecting our software or platforms, and the reactions of customers, card associations, government regulators and others to any such events;
|
|
•
|
the risk that implementation of software (including software updates) for customers or at customer locations or employee error in monitoring our software and platforms may result in the corruption or loss of data or customer information, interruption of business operations, outages, exposure to liability claims or loss of customers;
|
|
•
|
the reaction of current and potential customers to communications from us or regulators regarding information security, risk management, internal audit or other matters;
|
|
•
|
competitive pressures on pricing related to the decreasing number of community banks in the U.S., the development of new disruptive technologies competing with one or more of our solutions, increasing presence of international competitors in the U.S. market and the entry into the market by global banks and global companies with respect to certain competitive solutions, each of which may have the impact of unbundling individual solutions from a comprehensive suite of solutions we provide to many of our customers;
|
|
•
|
the failure to innovate in order to keep up with new emerging technologies, which could impact our solutions and our ability to attract new, or retain existing, customers;
|
|
•
|
the failure to meet financial goals to grow the business in Brazil after the unwinding of the Brazilian Venture;
|
|
•
|
the risks of reduction in revenue from the loss of existing and/or potential customers in Brazil after the unwinding of the Brazilian Venture;
|
|
•
|
an operational or natural disaster at one of our major operations centers; and
|
|
•
|
other risks detailed elsewhere in this Risk Factors section and in our other filings with the Securities and Exchange Commission.
|
Other unknown or unpredictable factors also could have a material adverse effect on our business, financial condition, results of operations and prospects. Accordingly, readers should not place undue reliance on these forward-looking statements. These forward-looking statements are inherently subject to uncertainties, risks and changes in circumstances that are difficult to predict. Except as required by applicable law or regulation, we do not undertake (and expressly disclaim) any obligation and do not intend to publicly update or review any of these forward-looking statements, whether as a result of new information, future events or otherwise. You should carefully consider the possibility that actual results may differ materially from our forward-looking statements.
|
Item 1B.
|
Unresolved Staff Comments
|
None.
|
Item 2.
|
Properties
|
FIS’ corporate headquarters is located at 601 Riverside Avenue, Jacksonville, Florida. In addition, FIS owns or leases support centers, data processing facilities and other facilities at approximately 177 locations. We believe our facilities and
25
equipment are generally well maintained and are in good operating condition. We believe that the computer equipment that we own and our various facilities are adequate for our present and foreseeable business needs.
|
Item 3.
|
Legal Proceedings
|
In the ordinary course of business, the Company is involved in various pending and threatened litigation matters related to its business and operations, some of which include claims for punitive or exemplary damages. The Company believes no such currently pending or threatened actions are likely to have a material adverse effect on its consolidated financial position. With respect to litigation in which the Company is involved generally, please note the following:
|
•
|
These matters raise difficult and complicated factual and legal issues and are subject to many uncertainties and complexities.
|
|
•
|
The Company reviews all of its litigation on an on-going basis and follows the authoritative provision for accounting for contingencies when making accrual and disclosure decisions. A liability must be accrued if (a) it is probable that a liability has been incurred and (b) the amount of loss can be reasonably estimated. If one of these criteria has not been met, disclosure is required when there is at least a reasonable possibility that a material loss may be incurred. When assessing reasonably possible and probable outcomes, the Company bases decisions on the assessment of the ultimate outcome following all appeals. Legal fees associated with defending litigation matters are expensed as incurred.
|
Indemnifications and Warranties
The Company generally indemnifies its clients, subject to certain limitations and exceptions, against damages and costs resulting from claims of patent, copyright, or trademark infringement associated solely with its customers' use of the Company's software applications or services. Historically, the Company has not made any material payments under such indemnifications, but continues to monitor the conditions that are subject to the indemnifications to identify whether it is probable that a loss has occurred and would recognize any such losses when they are estimable. In addition, the Company warrants to customers that its software operates substantially in accordance with the software specifications. Historically, no material costs have been incurred related to software warranties and no accruals for warranty costs have been made.
|
Item 4.
|
Mine Safety Disclosures
|
Not applicable.
PART II
|
Item 5.
|
Market for Registrant’s Common Equity, Related Stockholder Matters and Issuer Purchases of Equity Securities
|
Our common stock trades on the New York Stock Exchange under the ticker symbol "FIS."
As of January 31, 2019, there were approximately 10,660 shareholders of record of our common stock.
We currently expect to continue to pay quarterly dividends. However, the amount, declaration and payment of future dividends is at the discretion of the Board of Directors and depends on, among other things, our investment opportunities, results of operations, financial condition, cash requirements, future prospects, and other factors that may be considered relevant by our Board of Directors, including legal and contractual restrictions. A regular quarterly dividend of $0.35 per common share is payable on March 29, 2019, to shareholders of record as of the close of business on March 15, 2019.
Item 12 of Part III contains information concerning securities authorized for issuance under our equity compensation plans.
Our Board of Directors has approved a series of plans authorizing repurchases of our common stock in the open market at prevailing market prices or in privately negotiated transactions, the most recent of which on July 20, 2017, authorized repurchases of up to
$4.0 billion
through December 31, 2020. This share repurchase authorization replaced any existing share repurchase authorization plan. Approximately
$2.7 billion
of plan capacity remained available for repurchases as of
December 31, 2018
.
26
The following table summarizes purchases of equity securities by the issuer during the three-month period ended December 31, 2018 (in millions, except per share amounts):
|
Approximate dollar
|
|||||||||||||||
|
value of shares that
|
|||||||||||||||
|
Total cost of shares
|
may yet be
|
||||||||||||||
|
purchased as part of
|
purchased under
|
||||||||||||||
|
Total number of
|
Average price
|
publicly announced
|
the plans or
|
||||||||||||
|
Month ended
|
shares purchased
|
paid per share
|
plans or programs
|
programs
|
|||||||||||
|
October 31, 2018
|
1.4
|
|
$
|
105.31
|
|
$
|
150
|
|
$
|
2,680
|
|
||||
There were no share repurchases in November and December 2018.
The graph below compares the cumulative 5-year total return of holders of Fidelity National Information Services, Inc.'s common stock with the cumulative total returns of the S&P 500 index and S&P Supercap Data Processing & Outsourced Services index. The graph assumes that the value of the investment in our common stock and in each index was $100 on December 31, 2013 and tracks it (including reinvestment of dividends) through December 31, 2018.
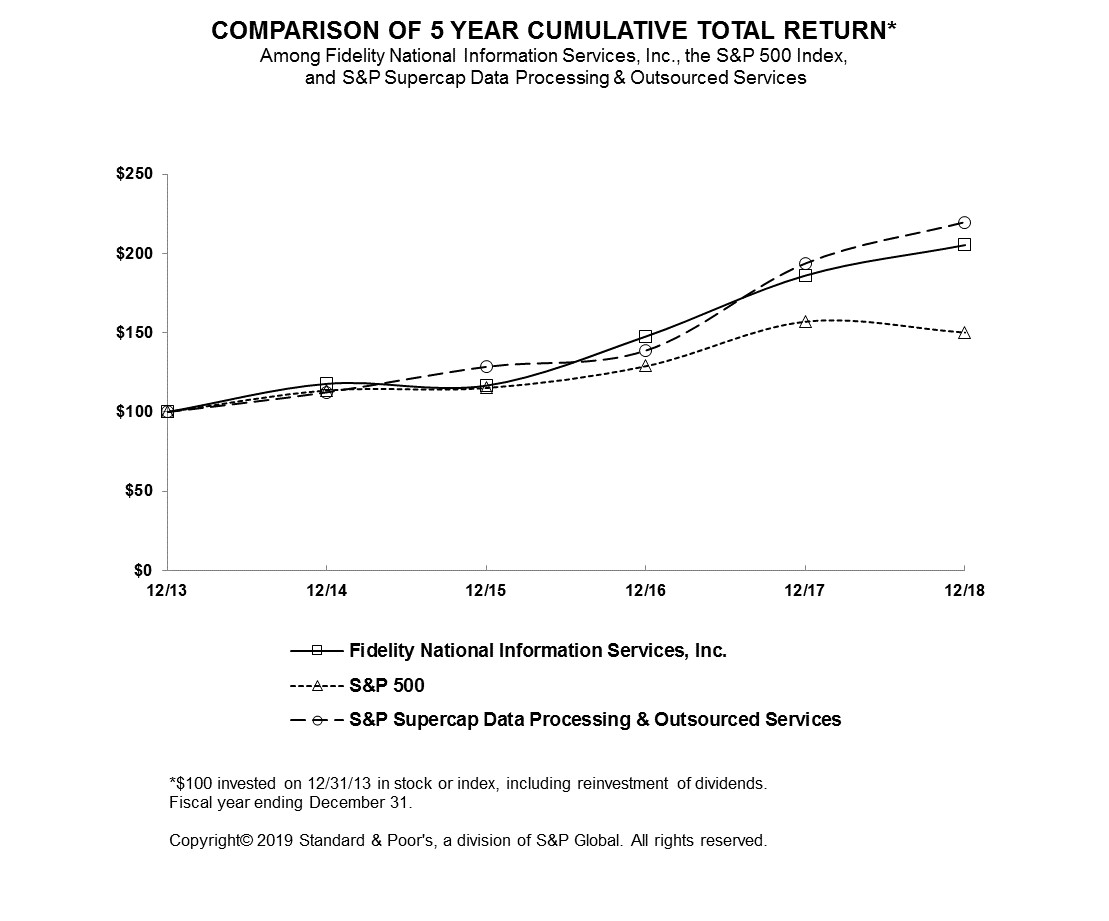
27
|
|
|
12/13
|
12/14
|
|
12/15
|
|
12/16
|
|
12/17
|
|
12/18
|
|
|
Fidelity National Information Services, Inc.
|
100.00
|
117.87
|
|
116.70
|
|
147.80
|
|
186.28
|
|
205.49
|
|
|
|
S&P 500
|
100.00
|
113.69
|
|
115.26
|
|
129.05
|
|
157.22
|
|
150.33
|
|
|
|
S&P Supercap Data Processing & Outsourced Services
|
100.00
|
112.46
|
|
128.51
|
|
138.77
|
|
193.67
|
|
219.65
|
|
|
The stock price performance included in this graph is not necessarily indicative of future stock price performance.
|
Item 6.
|
Selected Financial Data
|
The selected financial data set forth below constitutes historical financial data of FIS and should be read in conjunction with "Item 7.
Management’s Discussion and Analysis of Financial Condition and Results of Operations
"
and "Item 8.
Financial Statements and Supplementary Data
" included elsewhere in this report.
On September 28, 2018, FIS entered into an agreement with Banco Bradesco to unwind the Brazilian Venture. The transaction closed on December 31, 2018. As a result of the transaction, the Brazilian Venture spun-off certain assets of the business that also provide services to non-Bradesco clients to a new wholly-owned FIS subsidiary. Also as a result of the transaction, Banco Bradesco owns 100% of the entity that previously housed the Brazilian Venture and its remaining assets that relate to card processing for Banco Bradesco, which Banco Bradesco will perform internally. In the third quarter of 2018, FIS incurred impairment charges of
$95 million
related to the expected disposal, including impairments of its contract intangible asset, goodwill and its assets held for sale to fair value less cost to sell. Upon closing of the transaction, FIS recorded an additional pre-tax loss of $12 million related to the business divested, removed FIS' noncontrolling interest balance of $90 million, and recorded a $57 million increase to additional paid in capital for the business spun-off into the new wholly-owned FIS subsidiary. The impairment loss and pre-tax loss on disposal were recorded in the Corporate and Other segment. The Brazilian Venture business divested was included within the GFS segment as part of the consolidated Brazilian Venture results recorded by FIS through the transaction date. The transaction did not meet the standard necessary to be reported as discontinued operations; therefore, the impairment loss, pre-tax loss and related prior period earnings remain reported within earnings from continuing operations.
Effective August 31, 2018, FIS sold substantially all the assets of the Certegy Check Services business unit in North America, resulting in a pre-tax loss of
$54 million
, including goodwill distributed through the sale of business of
$43 million
.
Effective January 1, 2018, we adopted the new revenue recognition accounting standard, Topic 606, as described further in "Item 7.
Management’s Discussion and Analysis of Financial Condition and Results of Operations,
Recent Accounting Pronouncements." Amounts for the years ended December 31, 2017, 2016, and 2015 were recast to reflect our retrospective applications of the new standard.
On July 31, 2017, FIS closed on the sale of a majority ownership stake in its Capco consulting business and risk and compliance consulting business to Clayton, Dubilier & Rice L.P., by and through certain funds that it manages ("CD&R"), for cash proceeds of approximately $469 million, resulting in a pre-tax loss of $41 million. The divestiture is consistent with our strategy to focus on our IP-led businesses. CD&R acquired preferred units convertible into 60% of the common units of the venture, Cardinal Holdings, L.P. ("Cardinal") and FIS obtained common units representing the remaining 40%, in each case before equity is issued to management. The preferred units are entitled to a quarterly dividend at an annual rate of 12%, payable in cash (if available) or additional preferred units at FIS' option. The businesses sold were included within the GFS and IFS segments. The sale did not meet the standard necessary to be reported as discontinued operations; therefore, the pre-tax loss and related prior period earnings remain reported within earnings from continuing operations.
FIS' 40% ownership in Cardinal was initially valued at $172 million and was recorded as an equity method investment included within other noncurrent assets on the Consolidated Balance Sheet. After the sale on July 31, 2017, FIS began to recognize the earnings in after-tax equity method investment earnings outside of operating income and segment Adjusted EBITDA. For periods prior to July 31, 2017, the Capco consulting business and risk and compliance consulting business were included within operating income and segment Adjusted EBITDA.
On February 1, 2017, FIS completed the sale of the Public Sector and Education ("PS&E") business for
$850 million
, resulting in a pre-tax gain of $85 million. The transaction included all PS&E solutions, which provided a comprehensive set of technology solutions to address public safety and public administration needs of government entities as well as the needs of
28
K-12 school districts. The divestiture is consistent with our strategy to serve the financial services markets. Cash proceeds were used to reduce outstanding debt (see Note 10 of the Notes to Consolidated Financial Statements). Net cash proceeds, after payment of taxes and transaction-related expenses, were approximately
$500 million
. The PS&E business was included in the Corporate and Other segment. The sale did not meet the standard necessary to be reported as discontinued operations; therefore, the pre-tax gain and related prior period earnings remain reported within earnings from continuing operations.
On November 30, 2015, we completed the SunGard acquisition. The results of operations and financial position of SunGard are included in the Consolidated Financial Statements since the date of acquisition.
During the second quarter of 2015, we sold certain assets associated with our gaming industry check warranty business, resulting in a pre-tax gain of
$139 million
, which is included in Other income (expense), net. The sale did not meet the standard necessary to be reported as discontinued operations; therefore, the gain and related prior period earnings remain reported within earnings from continuing operations.
We have engaged in share repurchases in the periods presented. In
2018
,
2017
, 2015 and 2014, we repurchased a total of approximately
12.0 million
shares for
$1,215 million
,
1.1 million
shares for
$105 million
, 5 million shares for $300 million and 9 million shares for $476 million, respectively. There were no share repurchases in 2016.
The effective tax rate for the
2018
period included the impact of the reduction in the U.S. federal income tax rate from 35% to 21% due to tax reform enacted December 22, 2017. The effective tax rate for the
2017
period included a net benefit of $761 million related to tax reform items including $48 million of tax credits due to tax planning strategies implemented in the fourth quarter and a net detriment of $180 million due to the book basis in excess of the tax basis of certain businesses sold during the year. The effective tax rate for the 2015 period included a net detriment of $90 million due to the book basis in excess of the tax basis of a business sold during the year. The effective tax rate for the 2016 through 2014 periods did not include a net benefit for the recognition of excess tax benefit for stock compensation as the effective date of ASU 2016-09 was for reporting periods beginning after December 15, 2016.
29
|
|
Year Ended December 31,
|
||||||||||||||||||
|
|
2018
|
2017
|
2016
|
2015
|
2014
|
||||||||||||||
|
|
|
(In millions, except per share data)
|
|
||||||||||||||||
|
Statement of Earnings Data:
|
|
|
|
|
|
|
|
|
|
|
|||||||||
|
Revenue
|
$
|
8,423
|
|
$
|
8,668
|
|
$
|
8,831
|
|
$
|
6,260
|
|
$
|
6,413
|
|
||||
|
Cost of revenue
|
5,569
|
|
5,794
|
|
5,895
|
|
4,071
|
|
4,327
|
|
|||||||||
|
Gross profit
|
2,854
|
|
2,874
|
|
2,936
|
|
2,189
|
|
2,086
|
|
|||||||||
|
Selling, general and administrative expenses
|
1,301
|
|
1,442
|
|
1,707
|
|
1,102
|
|
815
|
|
|||||||||
|
Asset impairments
|
95
|
|
—
|
|
—
|
|
—
|
|
—
|
|
|||||||||
|
Operating income
|
1,458
|
|
1,432
|
|
1,229
|
|
1,087
|
|
1,271
|
|
|||||||||
|
Total other income (expense), net
|
(354
|
)
|
(456
|
)
|
(392
|
)
|
(62
|
)
|
(218
|
)
|
|||||||||
|
Earnings from continuing operations before income taxes and equity method investment earnings (loss)
|
1,104
|
|
976
|
|
837
|
|
1,025
|
|
1,053
|
|
|||||||||
|
Provision (benefit) for income taxes
|
208
|
|
(321
|
)
|
291
|
|
375
|
|
335
|
|
|||||||||
|
Equity method investment earnings (loss)
|
(15
|
)
|
(3
|
)
|
—
|
|
—
|
|
—
|
|
|||||||||
|
Earnings from continuing operations, net of tax
|
881
|
|
1,294
|
|
546
|
|
650
|
|
718
|
|
|||||||||
|
Earnings (loss) from discontinued operations, net of tax
|
—
|
|
—
|
|
1
|
|
(7
|
)
|
(11
|
)
|
|||||||||
|
Net earnings
|
881
|
|
1,294
|
|
547
|
|
643
|
|
707
|
|
|||||||||
|
Net (earnings) loss attributable to noncontrolling interest
|
(35
|
)
|
(33
|
)
|
(22
|
)
|
(19
|
)
|
(28
|
)
|
|||||||||
|
Net earnings attributable to FIS common stockholders
|
$
|
846
|
|
$
|
1,261
|
|
$
|
525
|
|
$
|
624
|
|
$
|
679
|
|
||||
|
Net earnings per share — basic from continuing operations attributable to FIS common stockholders
|
$
|
2.58
|
|
$
|
3.82
|
|
$
|
1.61
|
|
$
|
2.21
|
|
$
|
2.42
|
|
||||
|
Net earnings (loss) per share — basic from discontinued operations attributable to FIS common stockholders
|
—
|
|
—
|
|
—
|
|
(0.03
|
)
|
(0.04
|
)
|
|||||||||
|
Net earnings per share — basic attributable to FIS common stockholders *
|
$
|
2.58
|
|
$
|
3.82
|
|
$
|
1.61
|
|
$
|
2.19
|
|
$
|
2.38
|
|
||||
|
Weighted average shares — basic
|
328
|
|
330
|
|
326
|
|
285
|
|
285
|
|
|||||||||
|
Net earnings per share — diluted from continuing operations attributable to FIS common stockholders
|
$
|
2.55
|
|
$
|
3.75
|
|
$
|
1.59
|
|
$
|
2.18
|
|
$
|
2.39
|
|
||||
|
Net earnings (loss) per share — diluted from discontinued operations attributable to FIS common stockholders
|
—
|
|
—
|
|
—
|
|
(0.03
|
)
|
(0.04
|
)
|
|||||||||
|
Net earnings per share — diluted attributable to FIS common stockholders *
|
$
|
2.55
|
|
$
|
3.75
|
|
$
|
1.59
|
|
$
|
2.16
|
|
$
|
2.35
|
|
||||
|
Weighted average shares — diluted
|
332
|
|
336
|
|
330
|
|
289
|
|
289
|
|
|||||||||
|
Amounts attributable to FIS common stockholders:
|
|
|
|
|
|
|
|
|
|
|
|||||||||
|
Earnings from continuing operations, net of tax
|
$
|
846
|
|
$
|
1,261
|
|
$
|
524
|
|
$
|
631
|
|
$
|
690
|
|
||||
|
Earnings (loss) from discontinued operations, net of tax
|
—
|
|
—
|
|
1
|
|
(7
|
)
|
(11
|
)
|
|||||||||
|
Net earnings attributable to FIS common stockholders
|
$
|
846
|
|
$
|
1,261
|
|
$
|
525
|
|
$
|
624
|
|
$
|
679
|
|
||||
* Amounts may not sum due to rounding.
30
|
|
As of December 31,
|
||||||||||||||||||
|
|
2018
|
2017
|
2016
|
2015
|
2014
|
||||||||||||||
|
|
(In millions, except per share data)
|
||||||||||||||||||
|
Balance Sheet Data
:
|
|
|
|
|
|
|
|
|
|
|
|||||||||
|
Cash and cash equivalents
|
$
|
703
|
|
$
|
665
|
|
$
|
683
|
|
$
|
682
|
|
$
|
493
|
|
||||
|
Goodwill
|
13,545
|
|
13,730
|
|
14,178
|
|
14,745
|
|
8,878
|
|
|||||||||
|
Intangible assets, net
|
3,132
|
|
3,885
|
|
4,590
|
|
5,080
|
|
1,268
|
|
|||||||||
|
Total assets
|
23,770
|
|
24,526
|
|
26,026
|
|
26,185
|
|
14,521
|
|
|||||||||
|
Total debt
|
8,985
|
|
8,763
|
|
10,478
|
|
11,444
|
|
5,068
|
|
|||||||||
|
Total FIS stockholders’ equity
|
10,215
|
|
10,711
|
|
9,675
|
|
9,298
|
|
6,557
|
|
|||||||||
|
Noncontrolling interest
|
7
|
|
109
|
|
104
|
|
86
|
|
135
|
|
|||||||||
|
Total equity
|
10,222
|
|
10,820
|
|
9,779
|
|
9,384
|
|
6,692
|
|
|||||||||
|
Cash dividends declared per share
|
$
|
1.28
|
|
$
|
1.16
|
|
$
|
1.04
|
|
$
|
1.04
|
|
$
|
0.96
|
|
||||
Selected Quarterly Financial Data
Selected unaudited quarterly financial data is as follows:
|
|
Quarter Ended
|
||||||||||||||
|
|
March 31
|
June 30
|
September 30
|
December 31
|
|||||||||||
|
|
(In millions, except per share data)
|
||||||||||||||
|
2018
|
|
|
|
|
|
|
|
|
|||||||
|
Revenue
|
$
|
2,066
|
|
$
|
2,106
|
|
$
|
2,084
|
|
$
|
2,167
|
|
|||
|
Gross profit
|
652
|
|
692
|
|
720
|
|
790
|
|
|||||||
|
Earnings from continuing operations before income taxes and equity method investment earnings (loss)
|
225
|
|
276
|
|
204
|
|
400
|
|
|||||||
|
Net earnings attributable to FIS common stockholders
|
182
|
|
212
|
|
154
|
|
299
|
|
|||||||
|
Net earnings per share — basic attributable to FIS common stockholders
|
$
|
0.55
|
|
$
|
0.64
|
|
$
|
0.47
|
|
$
|
0.92
|
|
|||
|
Net earnings per share — diluted attributable to FIS common stockholders
|
$
|
0.54
|
|
$
|
0.64
|
|
$
|
0.47
|
|
$
|
0.91
|
|
|||
|
2017
|
|
|
|
|
|
|
|
|
|||||||
|
Revenue
|
$
|
2,148
|
|
$
|
2,258
|
|
$
|
2,096
|
|
$
|
2,166
|
|
|||
|
Gross profit
|
657
|
|
738
|
|
710
|
|
768
|
|
|||||||
|
Earnings from continuing operations before income taxes and equity method investment earnings (loss)
|
209
|
|
283
|
|
119
|
|
365
|
|
|||||||
|
Net earnings attributable to FIS common stockholders
|
129
|
|
139
|
|
59
|
|
934
|
|
|||||||
|
Net earnings per share — basic attributable to FIS common stockholders
|
$
|
0.39
|
|
$
|
0.42
|
|
$
|
0.18
|
|
$
|
2.81
|
|
|||
|
Net earnings per share — diluted attributable to FIS common stockholders
|
$
|
0.39
|
|
$
|
0.42
|
|
$
|
0.18
|
|
$
|
2.77
|
|
|||
31
|
Item 7.
|
Management’s Discussion and Analysis of Financial Condition and Results of Operations
|
The following section discusses management’s view of the financial condition and results of operations of FIS and its consolidated subsidiaries as of
December 31, 2018
and
2017
and for the years ended
December 31, 2018
,
2017
and
2016
.
This section should be read in conjunction with the audited Consolidated Financial Statements and related Notes of FIS included elsewhere in this Annual Report. Management’s Discussion and Analysis of Financial Condition and Results of Operations contains forward-looking statements. See "Forward-Looking Statements" and "Risk Factors" for a discussion of the uncertainties, risks and assumptions associated with these forward-looking statements that could cause future results to differ materially from those reflected in this section.
Overview
FIS is a global leader in financial services technology, providing solutions and services to clients in the retail and institutional banking, payments, capital markets, asset management, and wealth and retirement markets. Through the depth and breadth of our solutions portfolio, global capabilities and domain expertise, FIS serves clients in over 130 countries. Headquartered in Jacksonville, Florida, FIS employs more than 47,000 people worldwide and holds leadership positions in payment processing, financial software and banking solutions. Providing software, services and outsourcing of the technology that empowers the financial world, FIS is a Fortune 500 company and is a member of the Standard & Poor’s 500
®
Index.
We have grown organically, as well as through acquisitions, which have contributed critical applications and services that complement or enhance our existing offerings, diversifying our revenue by customer, geography and service offering. We evaluate possible acquisitions that might contribute to our growth or performance on an ongoing basis.
FIS reports its financial performance based on three segments: Integrated Financial Solutions ("IFS"), Global Financial Solutions ("GFS") and Corporate and Other. A description of these segments is included in Note 19 to the Notes to Consolidated Financial Statements. Revenue by segment and the adjusted EBITDA of our segments are discussed below in Segment Results of Operations.
Business Trends and Conditions
Our revenue is primarily derived from a combination of recurring technology and processing services, professional services and software license fees. The majority of our revenue has historically been recurring, and has been provided under multi-year contracts that contribute relative stability to our revenue stream. These services, in general, are considered critical to our clients' operations. A considerable portion of our recurring revenue is derived from transaction processing fees that fluctuate with the level of accounts and card transactions, among other variable measures, associated with consumer, commercial and capital markets activity. Professional services revenue is typically non-recurring, and sales of software licenses are less predictable, a portion of which can be regarded as discretionary spending by our clients.
We continue to assist financial institutions in migrating to outsourced integrated technology solutions to improve their profitability and address increasing and ongoing regulatory requirements. As a provider of outsourcing solutions, we benefit from multi-year recurring revenue streams, which help moderate the effects of broader year-to-year economic and market changes that otherwise might have a larger impact on our results of operations. We believe our integrated solutions and outsourced services are well positioned to address this outsourcing trend across the markets we serve.
Over the last three years, we have moved approximately 50% of our server compute to our FIS cloud located in our strategic data centers and our goal is to increase that percentage to 65% by the end of 2019 and 80% by the end of 2021. This allows us to further enhance security for our clients’ data and increases the flexibility and speed with which we can provide services and solutions to our clients, eventually at lesser cost. Concurrently, we have continued to consolidate our data centers, closing 10 additional data centers in 2018. Our consolidation has generated a savings for the Company as of year-end 2018 exceeding $100 million in run rate annual expense reduction since the program’s inception in mid-2016. We plan to close and consolidate approximately 20 more data centers by 2021, which should result in additional run rate annual expense reduction of about $150 million.
We continue to invest in modernization, innovation and integrated solutions and services in order to meet the demands of the markets we serve and compete with global banks, international providers, and disruptive technology innovators. We invest both organically and through investment opportunities in companies building complementary technologies in the financial services space. Our internal efforts in research and development activities have related primarily to the modernization of our proprietary core systems, design and development of next generation digital and innovative solutions and development of
32
processing systems and related software applications and risk management platforms. We have increased our investments in these areas in each of the last three years. We expect to continue our practice of investing an appropriate level of resources to maintain, enhance and extend the functionality of our proprietary systems and existing software applications, to develop new and innovative software applications and systems to address emerging technology trends in response to the needs of our clients and to enhance the capabilities of our outsourcing infrastructure.
Consumer preference continues to shift from traditional branch banking services to digital banking solutions, and our clients seek to provide a single integrated banking experience through their branch, mobile, internet and voice banking channels. We have been providing our large regional banking customers in the U.S. with Digital One, an integrated digital banking platform, and are now adding functionality and offering Digital One to our community bank clients to provide a consistent, omnichannel experience for consumers of banking services across self-service channels like mobile banking and online banking, as well as supporting channels for bank staff operating in bank branches and contact centers. The uniform customer experience will extend to support a broad range of financial services including opening new accounts; servicing of existing accounts; providing money movement services; personal financial management; as well as a broad range of other consumer, small business and commercial banking capabilities. Digital One will be integrated into and will extend the core banking platforms offered by FIS and will also be offered to customers of non-FIS core banking systems.
We co
ntinue to see demand for innovative solutions in the payments market that will deliver faster, more convenient payment solutions in mobile channels, internet applications and cards. We believe digital payments will grow and partially replace existing payment tender volumes over time as consumers and merchants embrace the convenience, incremental services and benefits. Additionally, new formidable non-traditional payments competitors and large merchants are investing in and innovating digital payment technologies to address the emerging market opportunity, and it is unclear the extent to which particular technologies or services will succeed. We believe the growth of digital payments continues to present both an opportunity and a risk to us as the market develops. Although we cannot predict which digital payment technologies or solutions will be successful, we cautiously believe our client relationships, payments infrastructure and experience, adapted solutions and emerging solutions are well positioned to maintain or grow our clients' existing payment volumes, which is our focus.
We anticipate consolidation within the banking industry will continue, primarily in the form of merger and acquisition activity among financial institutions, which we believe as a whole is detrimental to our business. However, consolidation resulting from specific merger and acquisition transactions may be beneficial to our business. When consolidations of financial institutions occur, merger partners often operate systems obtained from competing service providers. The newly formed entity generally makes a determination to migrate its core and payments systems to a single platform. When a financial institution processing client is involved in a consolidation, we may benefit by their expanding the use of our services if such services are chosen to survive the consolidation and support the newly combined entity. Conversely, we may lose revenue if we are providing services to both entities, or if a client of ours is involved in a consolidation and our services are not chosen to survive the consolidation and support the newly combined entity. It is also possible that larger financial institutions resulting from consolidation may have greater leverage in negotiating terms or could decide to perform in-house some or all of the services that we currently provide or could provide. We seek to mitigate the risks of consolidations by offering other competitive services to take advantage of specific opportunities at the surviving company.
In certain of the international markets in which we do business, we continue to experience growth on a constant currency basis. Demand for our solutions may also continue to be driven in developing countries by government-led financial inclusion policies aiming to reduce the unbanked population and by growth in the middle classes in these markets driving the need for more sophisticated banking solutions. The majority of our international revenue is generated by clients in Brazil, the United Kingdom, Germany, Canada and India. For the full year of 2019, we anticipate an approximate $45 million adverse impact to revenue due to foreign currency translation, although the actual amount of impact is uncertain due to the many factors that affect exchange rates.
On December 31, 2018, FIS closed the transaction we previously announced to unwind the Brazilian Venture with Banco Bradesco. Under this agreement, the Brazilian Venture spun-off certain assets of the business that also provide services to non-Bradesco clients to a new wholly-owned FIS subsidiary. This subsidiary entered into a long-term commercial agreement to provide current and new services to Banco Bradesco effective January 1, 2019 that include software licensing, maintenance, application management, card portfolio migration, business process outsourcing, fraud management and professional services. As a result of the transaction, Banco Bradesco owns 100% of the entity that previously housed the Brazilian Venture and its remaining assets that relate to card processing for Banco Bradesco, which Banco Bradesco will perform internally. The transaction is expected to result in an annualized reduction in FIS’ reported revenue of approximately $225 million. In addition, it resulted in impairment charges of $95 million in the third quarter of 2018. For further detail on our Brazilian
33
Venture see Note 16 of the Notes to Consolidated Financial Statements and "Item 1A.
Risk Factors"
included elsewhere in this report.
Globally, attacks on information technology systems continue to grow in frequency, complexity and sophistication. This is a trend we expect to continue. Such attacks have become a point of focus for individuals, businesses and governmental entities. The objectives of these attacks include, among other things, gaining unauthorized access to systems to facilitate financial fraud, disrupt operations, cause denial of service events, corrupt data, and steal non-public information. These circumstances present both a threat and an opportunity for FIS. As part of our business, we electronically receive, process, store and transmit a wide range of confidential information, including sensitive customer information and personal consumer data. We also operate payment, cash access and prepaid card systems.
FIS remains focused on making strategic investments in information security to protect our clients and our information systems. This includes both capital expenditures and operating expense on hardware, software, personnel and consulting services. We also participate in industry and governmental initiatives to improve information security for our clients. Through the expertise we have gained with this ongoing focus and involvement, we have developed fraud, security, risk management and compliance solutions to target this growth opportunity in the financial services industry.
As described in Note 16 of the Notes to Consolidated Financial Statements, on July 31, 2017, we sold a majority interest in certain of our consulting businesses to affiliates of CD&R. These businesses had lower margins than many of our other businesses. The consulting businesses sold were included within the GFS and IFS segments. Also, on February 1, 2017, we sold our PS&E business, which had been included in our Corporate and Other segment. These divestitures affect the comparability of our results of operations for the 2018, 2017 and 2016 periods presented.
Critical Accounting Policies
The accounting policies described below are those we consider critical in preparing our Consolidated Financial Statements. These policies require management to make estimates, judgments and assumptions that affect the reported amounts of assets and liabilities and disclosures with respect to contingent liabilities and assets at the date of the Consolidated Financial Statements and the reported amounts of revenues and expenses during the reporting periods. Actual amounts could differ from those estimates. See Note 2 of the Notes to Consolidated Financial Statements for a more detailed description of the significant accounting policies that have been followed in preparing our Consolidated Financial Statements.
Revenue Recognition
The Company generates revenue in a number of ways, including from the delivery of account- or transaction-based processing, SaaS, BPaaS, cloud offerings, software licensing, software-related services and professional services. We are frequently a party to multiple concurrent contracts with the same client. These situations require judgment to determine whether the individual contracts should be combined or evaluated separately for purposes of revenue recognition. In making this determination, we consider the timing of negotiating and executing the contracts, whether the different elements of the contracts are negotiated as a package with a single commercial objective, whether the solutions or services promised in the contracts are a single performance obligation, and whether any of the payment terms of the contracts are interrelated. Our individual contracts also frequently include multiple promised solutions or services. At contract inception, we assess the solutions and services promised in our contracts with customers and identify a performance obligation for each promise to transfer to the customer a solution or service (or bundle of solutions or services) that is distinct - i.e., if a solution or service is separately identifiable from other items in the bundled package and if a customer can benefit from it on its own or with other resources that are readily available to the customer. We must apply judgment in these circumstances in determining whether individual promised solutions or services can be considered distinct or should instead be combined with other promised solutions or services in the contract. We recognize revenue when or as we satisfy a performance obligation by transferring control of a solution or service to a customer. We must use judgment to determine the appropriate measure of progress for performance obligations satisfied over time and the timing of when the customer obtains control for performance obligations satisfied at a point in time. Judgment is also required in estimating and allocating variable consideration to one or more, but not all, performance obligations in a contract, determining the standalone selling prices of each performance obligation, and allocating the transaction price to each distinct performance obligation in a contract.
Due to the large number, broad nature and average size of individual contracts we are party to, the impact of judgments and assumptions that we apply in recognizing revenue for any single contract is not likely to have a material effect on our consolidated operations or financial position. However, the broader accounting policy assumptions that we apply across similar contracts or classes of clients could significantly influence the timing and amount of revenue recognized in our historical and
34
future results of operations or financial position. Additional information about our revenue recognition policies is included in Note 2 of the Notes to Consolidated Financial Statements.
Computer Software
Computer software includes the fair value of software acquired in business combinations, purchased software and capitalized software development costs. Purchased software is recorded at cost and amortized using the straight-line method over its estimated useful life, which is generally three to five years. Software acquired in business combinations is recorded at its fair value and amortized using straight-line or accelerated methods over its estimated useful life, which is three to 10 years (as discussed below in the Critical Accounting Policy section
Purchase Accounting
). As of
December 31, 2018
and
2017
, computer software, net of accumulated amortization, was
$1.8 billion
and
$1.7 billion
, respectively, and amortization of computer software was
$468 million
,
$436 million
, and
$396 million
for the years ended
December 31, 2018
,
2017
, and
2016
, respectively. Balances related to acquired software represent a significant portion of these balances, particularly for the periods after the acquisition of SunGard, which resulted in acquired software of $674 million.
The capitalization of software development costs is governed by FASB ASC Subtopic 985-20 if the software is to be sold, leased or otherwise marketed, or by FASB ASC Subtopic 350-40 if the software is for internal use. After the technological feasibility of the software has been established (for software to be marketed), or at the beginning of application development (for internal-use software), software development costs, which include primarily salaries and related payroll costs and costs of independent contractors incurred during development, are capitalized. Research and development costs incurred prior to the establishment of technological feasibility (for software to be marketed), or prior to application development (for internal-use software), are expensed as incurred. Evaluating whether technological feasibility has been achieved requires the use of management judgment.
Software development costs are amortized on a product-by-product basis commencing on the date of general release of the solutions (for software to be marketed) or the date placed in service (for internal-use software). Software development costs for software to be marketed are amortized using the greater of (1) the straight-line method over its estimated useful life, which ranges from three to 10 years, or (2) the ratio of current revenues to total anticipated revenues over its useful life.
In determining useful lives, management considers historical results and technological trends that may influence the estimate. Useful lives for all computer software range from three to 10 years.
We also assess the recorded value of computer software for impairment on a regular basis by comparing the carrying value to the estimated future cash flows to be generated by the underlying software asset (for software to be marketed). There are inherent uncertainties in determining the expected useful life or cash flows to be generated from computer software. For the years ended
December 31, 2018
,
2017
, and
2016
, respectively, we have not had more than minimal charges for impairments of software. While we have not historically experienced significant changes in these balances due to changes in estimates, our results of operations could be subject to such changes in the future.
Purchase Accounting
We are required to allocate the purchase price of acquired businesses to the assets acquired and liabilities assumed in the transaction at their estimated fair values. The estimates used to determine the fair value of long-lived assets, such as intangible assets or computer software, are complex and require a significant amount of management judgment. We generally engage independent valuation specialists to assist us in making fair value determinations.
If the initial accounting for a business combination is incomplete by the end of the reporting period in which the combination occurs, we are required to record provisional amounts in the financial statements for the items for which the accounting is incomplete. Adjustments to provisional amounts initially recorded that are identified during the measurement period are recognized in the reporting period in which the adjustment amounts are determined. This includes any effect on earnings of changes in depreciation, amortization, or other income effects as a result of the change to the provisional amounts, calculated as if the accounting had been completed at the acquisition date. During the measurement period, we are also required to recognize additional assets or liabilities if new information is obtained about facts and circumstances that existed as of the acquisition date that, if known, would have resulted in the recognition of those assets and liabilities as of that date. The measurement period ends the sooner of one year from the combination date or when we receive the information we were seeking about facts and circumstances that existed as of the acquisition date or we learn that more information is not obtainable.
We are also required to estimate the useful lives of intangible assets to determine the amount of acquisition-related intangible asset amortization expense to record in future periods. We periodically review the estimated useful lives assigned to
35
our finite-lived intangible assets to determine whether such estimated useful lives continue to be appropriate. Additionally, we review our indefinite-lived intangible assets to determine if there is any change in circumstances that may indicate the asset’s useful life is no longer indefinite.
We had no significant business combinations during the
2018
and
2017
periods.
Goodwill and Other Intangible Assets
Goodwill represents the excess of cost over the fair value of identifiable assets acquired and liabilities assumed in business combinations. Goodwill and other intangible assets with indefinite useful lives should not be amortized, but shall be tested for impairment annually, or more frequently if circumstances indicate potential impairment. FASB ASC Subtopic 350-20 allows an entity first to assess qualitatively whether it is more likely than not that a reporting unit's carrying amount exceeds its fair value, referred to in the guidance as "step zero." If an entity concludes that it is more likely than not that a reporting unit's fair value is less than its carrying amount (that is, a likelihood of more than 50 percent), the "step one" quantitative assessment must be performed for that reporting unit. FASB ASC Subtopic 350-20 provides examples of events and circumstances that should be considered in performing the step zero qualitative assessment, including macroeconomic conditions, industry and market considerations, cost factors, overall financial performance, events affecting a reporting unit or the entity as a whole and a sustained decrease in share price. Performance of a qualitative impairment assessment requires judgment.
In applying the quantitative analysis, we determine the fair value of our reporting units based on a weighted average of multiple valuation techniques, principally a combination of an income approach and a market approach. The income approach calculates a value based upon the present value of estimated future cash flows, while the market approach uses earnings multiples of similarly situated guideline public companies. If the fair value of a reporting unit exceeds the carrying value of the reporting unit’s net assets, goodwill is not impaired and further testing is not required.
We assess goodwill for impairment on an annual basis during the fourth quarter or more frequently if circumstances indicate potential impairment. For each of
2018
,
2017
, and 2016, we began our annual impairment test with the step zero qualitative assessment. In performing the step zero qualitative assessment for each year, examining those factors most likely to affect our valuations, we concluded that it remained more likely than not that the fair value of each of our reporting units continued to exceed their carrying amounts. Consequently, we did not perform a step one quantitative assessment specifically for the purpose of our annual impairment test for these years.
Similar to the FASB ASC Subtopic 350-20 guidance for goodwill, FASB ASC Subtopic 350-30 allows an organization to first perform a qualitative assessment of whether it is more likely than not that an indefinite-lived intangible asset has been impaired. We assess indefinite-lived intangible assets for impairment on an annual basis during the fourth quarter or more frequently if circumstances indicate potential impairment. For 2016, we engaged independent specialists to perform a valuation of our indefinite-lived intangible assets, using a form of income approach valuation known as the relief-from-royalty method. There was substantial excess of fair value over carrying value for our indefinite-lived intangible assets in the 2016 independent valuations. Based upon this quantitative assessment performed, there was no impairment for 2016. For each of
2018
and
2017
, we performed a qualitative assessment examining those factors most likely to affect our valuations and concluded that it remained more likely than not that our indefinite-lived intangible assets were not impaired. Consequently, we did not perform a quantitative impairment assessment specifically for the purpose of our annual impairment test for either of these years.
Determining the fair value of a reporting unit or acquired intangible assets with indefinite lives involves judgment and the use of significant estimates and assumptions, which include assumptions regarding forecasted revenue growth rates, operating margins, capital expenditures, tax rates, and other factors used to calculate estimated future cash flows. In addition, risk-adjusted discount rates and future economic and market conditions and other assumptions are applied. Goodwill was
$13.5 billion
and
$13.7 billion
as of
December 31, 2018
and
2017
, respectively, and indefinite-lived intangible assets were
$43 million
and
$48 million
as of
December 31, 2018
and
2017
, respectively. As a result, a meaningful change in one or more of the underlying forecasts, estimates, or assumptions used in testing these assets for impairment could result in a material impact on the Company's results of operations and financial position. However, because there was a substantial excess of fair value over carrying value in our previous independent valuations performed in 2015 for goodwill and 2016 for indefinite-lived intangible assets, we believe the likelihood of obtaining materially different results based on a change of assumptions is low.
Related Party Transactions
We are a party to certain historical related party agreements as discussed in Note 15 of the Notes to Consolidated Financial Statements.
36
Factors Affecting Comparability
For information regarding factors affecting comparability, see "Item 6.
Selected Financial Data."
As a result of the transactions noted in Item 6.
Selected Financial Data
, our financial position, results of operations, earnings per share and cash flows in the periods covered by the Consolidated Financial Statements may not be directly comparable.
37
Consolidated Results of Operations
(in millions, except per share amounts)
|
|
2018
|
2017
|
2016
|
||||||||
|
Revenue
|
$
|
8,423
|
|
$
|
8,668
|
|
$
|
8,831
|
|
||
|
Cost of revenue
|
5,569
|
|
5,794
|
|
5,895
|
|
|||||
|
Gross profit
|
2,854
|
|
2,874
|
|
2,936
|
|
|||||
|
Selling, general and administrative expenses
|
1,301
|
|
1,442
|
|
1,707
|
|
|||||
|
Asset impairments
|
95
|
|
—
|
|
—
|
|
|||||
|
Operating income
|
1,458
|
|
1,432
|
|
1,229
|
|
|||||
|
Other income (expense):
|
|
|
|
|
|
|
|||||
|
Interest income
|
17
|
|
22
|
|
20
|
|
|||||
|
Interest expense
|
(314
|
)
|
(359
|
)
|
(403
|
)
|
|||||
|
Other income (expense), net
|
(57
|
)
|
(119
|
)
|
(9
|
)
|
|||||
|
Total other income (expense), net
|
(354
|
)
|
(456
|
)
|
(392
|
)
|
|||||
|
Earnings from continuing operations before income taxes and equity method investment earnings (loss)
|
1,104
|
|
976
|
|
837
|
|
|||||
|
Provision (benefit) for income taxes
|
208
|
|
(321
|
)
|
291
|
|
|||||
|
Equity method investment earnings (loss)
|
(15
|
)
|
(3
|
)
|
—
|
|
|||||
|
Earnings from continuing operations, net of tax
|
881
|
|
1,294
|
|
546
|
|
|||||
|
Earnings (loss) from discontinued operations, net of tax
|
—
|
|
—
|
|
1
|
|
|||||
|
Net earnings
|
881
|
|
1,294
|
|
547
|
|
|||||
|
Net (earnings) loss attributable to noncontrolling interest
|
(35
|
)
|
(33
|
)
|
(22
|
)
|
|||||
|
Net earnings attributable to FIS common stockholders
|
$
|
846
|
|
$
|
1,261
|
|
$
|
525
|
|
||
|
Net earnings per share — basic from continuing operations attributable to FIS common stockholders
|
$
|
2.58
|
|
$
|
3.82
|
|
$
|
1.61
|
|
||
|
Net earnings (loss) per share — basic from discontinued operations attributable to FIS common stockholders
|
—
|
|
—
|
|
—
|
|
|||||
|
Net earnings per share — basic attributable to FIS common stockholders *
|
$
|
2.58
|
|
$
|
3.82
|
|
$
|
1.61
|
|
||
|
Weighted average shares outstanding — basic
|
328
|
|
330
|
|
326
|
|
|||||
|
Net earnings per share — diluted from continuing operations attributable to FIS common stockholders
|
$
|
2.55
|
|
$
|
3.75
|
|
$
|
1.59
|
|
||
|
Net earnings (loss) per share — diluted from discontinued operations attributable to FIS common stockholders
|
—
|
|
—
|
|
—
|
|
|||||
|
Net earnings per share — diluted attributable to FIS common stockholders *
|
$
|
2.55
|
|
$
|
3.75
|
|
$
|
1.59
|
|
||
|
Weighted average shares outstanding — diluted
|
332
|
|
336
|
|
330
|
|
|||||
|
Amounts attributable to FIS common stockholders:
|
|
|
|
|
|
|
|||||
|
Earnings from continuing operations, net of tax
|
$
|
846
|
|
$
|
1,261
|
|
$
|
524
|
|
||
|
Earnings (loss) from discontinued operations, net of tax
|
—
|
|
—
|
|
1
|
|
|||||
|
Net earnings attributable to FIS common stockholders
|
$
|
846
|
|
$
|
1,261
|
|
$
|
525
|
|
||
* Amounts may not sum due to rounding.
Revenue
Revenue for
2018
decreased
$245 million
, or
2.8%
from
2017
, due to (1) the reduction in revenue from the sale of the Capco consulting business and the risk and compliance consulting business during the third quarter of 2017; (2) the reduction in revenue from the sale of the PS&E business during the first quarter of 2017; and (3) the reduction in revenue from the sale of the Certegy Check Services business unit in North America during the third quarter of 2018. This decrease was partially offset by (1) increased volumes in banking and wealth solutions (excluding the effects of the sale of the risk and compliance consulting business); (2) increased sales for GFS banking and payments solutions; (3) growth in corporate and digital solutions;
38
(4) growth in retail payments; and (5) payments growth in Latin America. Additionally,
2018
was impacted by a $40 million unfavorable foreign currency impact primarily resulting from a stronger U.S. Dollar versus the Brazilian Real.
Revenue for
2017
decreased
$163 million
, or
1.8%
from
2016
, due to the reduction in revenue from the sale of the PS&E business during the first quarter of 2017 and the sale of the Capco consulting business and the risk and compliance consulting business during the third quarter of 2017. These decreases were partially offset by (1) increased volumes in banking and wealth solutions (excluding the effects of the sale of the risk and compliance consulting business); (2) volume growth in payment solutions in Brazil; (3) continued growth with our existing customers for our post-trade derivative solutions; and (4) growth in corporate and digital solutions. The 2017 period also benefited from a lower purchase accounting adjustment, as compared to the 2016 period, to reduce SunGard acquired deferred revenue to fair value and a $16 million favorable foreign currency impact primarily resulting from a stronger Brazilian Real versus the U.S. Dollar, partially offset by a weaker Pound Sterling. See "Segment Results of Operations" for more detailed explanation.
Cost of Revenue and Gross Profit
Cost of revenues totaled
$5,569 million
, $
5,794 million
and $
5,895 million
during
2018
,
2017
and
2016
, respectively, resulting in gross profit of
$2,854 million
,
$2,874 million
and
$2,936 million
, respectively. Gross profit as a percentage of revenues ("gross margin") was
33.9%
,
33.2%
and
33.2%
in
2018
,
2017
and
2016
, respectively. The decrease in gross profit for
2018
as compared to
2017
primarily resulted from the revenue variances noted above. The gross profit percentage for
2018
as compared to
2017
benefited from higher margin software licenses and the realization of ongoing expense synergies.
.
Selling, General and Administrative Expenses
Selling, general and administrative expenses for
2018
decreased
$141 million
, or
9.8%
from
2017
. The year-over-year decrease is primarily driven by the sale of PS&E during the first quarter of 2017, the sale of the Capco consulting business and risk and compliance consulting business during the third quarter of 2017, the sale of Certegy Check Services business unit in North America during the third quarter of 2018 and cost management initiatives.
Selling, general and administrative expenses for
2017
decreased
$265 million
, or
15.5%
from
2016
, primarily driven by the sale of PS&E during the first quarter of 2017, the sale of the Capco consulting business and risk and compliance consulting business during the third quarter of 2017 and integration and cost management initiatives.
Operating Income
Operating income totaled
$1,458 million
,
$1,432 million
and
$1,229 million
for
2018
,
2017
and
2016
, respectively. Operating income as a percentage of revenue ("operating margin") was
17.3%
,
16.5%
and
13.9%
for
2018
,
2017
and
2016
, respectively. The annual changes in operating income resulted from the revenue and cost variances addressed above. The change in operating margin during 2018 was negatively impacted by asset impairments of $95 million related to the unwinding of the Brazilian Venture. Notwithstanding the asset impairments, however, operating margins improved primarily from cost management initiatives and the Capco consulting business divestiture during 2017. The increase in operating margin from 2017 as compared to 2016 resulted primarily from integration and cost management initiatives.
Total Other Income (Expense), Net
Interest expense is typically the primary component of total other income (expense), net.
The decrease of
$45 million
in interest expense in
2018
as compared to
2017
is primarily due to a lower weighted-average interest rate on the outstanding debt and benefits realized from interest rate swaps executed in the fourth quarter of 2018, which are discussed in Note 11 of the Notes to Consolidated Financial Statements.
The decrease of
$44 million
in interest expense in
2017
as compared to
2016
is primarily due to lower outstanding debt and lower weighted-average interest rate on the outstanding debt.
Other income (expense), net for
2018
includes a pre-tax loss of $54 million on the sale of the Certegy Check Services business unit in North America and $12 million to unwind the Brazilian Venture, partially offset by a pre-tax gain of $19 million on the sale of Reliance Trust Company of Delaware.
Other income (expense), net for
2017
includes (1) a pre-tax charge of $171 million in tender premiums and the write-off of previously capitalized debt issuance costs on the repurchase of approximately $2,000 million in aggregate principal of debt
39
securities; (2) a net pre-tax loss of $29 million on the sale of the Capco consulting and risk and compliance business and other divestitures; (3) a pre-tax charge of approximately $25 million due to the redemption of the Senior Notes due March 2022 and the pay down of the 2018 Term Loans, consisting of the call premium on the Senior Notes due March 2022 and the write-off of previously capitalized debt issuance costs; partially offset by (4) a pre-tax gain of $85 million on the sale of the PS&E business, an $8 million pre-tax gain on an investment sale and a $12 million foreign currency gain.
During 2016, FIS paid down the 2017 Term Loans and partially paid down the 2018 Term Loans resulting in a pre-tax charge upon extinguishment of approximately
$2 million
due to the write-off associated with previously capitalized debt issue costs. Additionally in 2016 as a result of these debt pay downs, FIS terminated interest rate swaps with a notional amount totaling
$1,250 million
resulting in a pre-tax loss of
$2 million
due to the release of fair value changes from other comprehensive earnings.
Provision (Benefit) for Income Taxes
Provision (benefit) for income taxes from continuing operations totaled
$208 million
,
$(321) million
and
$291 million
for
2018
,
2017
and
2016
, respectively. This resulted in an effective tax rate on continuing operations of
18.8%
,
(32.9)%
and
34.8%
for
2018
,
2017
and
2016
, respectively. The effective tax rate for the
2018
period included the impact of the reduction in the U.S. federal income tax rate from 35% to 21% due to tax reform enacted December 22, 2017, and a net detriment of $33 million due to the book basis in excess of the tax basis of certain businesses sold during the year. The effective tax rate for the
2017
period included a net benefit of $761 million related to tax reform items including $48 million of tax credits due to tax planning strategies implemented in the fourth quarter and a net detriment of $180 million due to the book basis in excess of the tax basis of certain businesses sold during the year. The effective tax rate for the 2016 period did not include a net benefit for the recognition of excess tax benefit for stock compensation as the effective date of ASU 2016-09 was for reporting periods beginning after December 15, 2016.
Equity Method Investment Earnings (Loss)
On July 31, 2017, FIS obtained a
40%
equity interest in Cardinal as further described in Note 16 of the Notes to Consolidated Financial Statements. As a result, we recorded equity method investment losses of
$15 million
and
$3 million
during the years ended
December 31, 2018
and
2017
, respectively.
Earnings (Loss) from Discontinued Operations, Net of Tax
During
2018
,
2017
and
2016
, operations for Participacoes, our former item processing and remittance services business in Brazil are classified as discontinued operations. Reporting for discontinued operations classifies revenues and expenses as one line item, net of tax, in the Consolidated Statements of Earnings. The table below outlines discontinued operations for
2018
,
2017
and
2016
, net of tax (in millions):
|
Earnings (loss), net of tax
|
2018
|
2017
|
2016
|
||||||||
|
Participacoes operations
|
$
|
—
|
|
$
|
—
|
|
$
|
1
|
|
||
Participacoes had no revenue in
2018
,
2017
and
2016
. Participacoes' processing volume were transitioned to other vendors or back to its clients during the second quarter of 2011. Participacoes had earnings (losses) before taxes of
$(1) million
,
$0 million
and
$2 million
during the years ended
December 31, 2018
,
2017
and
2016
, respectively. The shut-down activities involved the transfer and termination of approximately
2,600
employees, which was completed in 2011. Former employees generally had up to
two years
from the date of terminations, extended through April 2013, to file labor claims and a number of them did file labor claims. As of
December 31, 2018
, there were approximately
346
active claims remaining. Consequently, we have continued exposure on these active claims, which were not transferred with other assets and liabilities in the disposal.
Net (Earnings) Loss Attributable to Noncontrolling Interest
Net (earnings) loss attributable to noncontrolling interest predominantly relates to the joint venture in Brazil (see Notes 15 and 16 of the Notes to Consolidated Financial Statements) and totaled
$(35) million
,
$(33) million
and
$(22) million
for
2018
,
2017
and
2016
, respectively.
40
Net Earnings Attributable to FIS Common Stockholders
Net earnings attributable to FIS common stockholders totaled
$846 million
,
$1,261 million
and
$524 million
for
2018
,
2017
and
2016
, respectively, or
$2.55
,
$3.75
and
$1.59
per diluted share, respectively, due to the factors described above coupled with the impact of our share repurchase initiatives.
Segmen
t Results of Ope
rations
Adjusted EBITDA is defined as EBITDA (defined as net earnings (loss) before net interest expense, income tax provision (benefit) and depreciation and amortization) plus certain non-operating items. This measure is reported to the chief operating decision maker for purposes of making decisions about allocating resources to the segments and assessing their performance. For this reason, Adjusted EBITDA, as it relates to our segments, is presented in conformity with FASB ASC Topic 280,
Segment Reporting
. The non-operating items affecting the segment profit measure generally include acquisition accounting adjustments; acquisition, integration and certain other costs, and asset impairment. For consolidated reporting purposes, these costs and adjustments are recorded in the Corporate and Other segment for the periods discussed below. Adjusted EBITDA for the respective segments excludes the foregoing costs and adjustments. Financial information, including details of our adjustments to EBITDA, for each of our segments is set forth in Note 19 of the Notes to Consolidated Financial Statements.
Integrated Financial Solutions
|
|
2018
|
2017
|
2016
|
||||||||
|
|
(In millions)
|
||||||||||
|
Revenue
|
$
|
4,401
|
|
$
|
4,260
|
|
$
|
4,178
|
|
||
|
Adjusted EBITDA
|
$
|
1,962
|
|
$
|
1,874
|
|
$
|
1,792
|
|
||
Year ended
December 31, 2018
:
Revenue increased
$141 million
, or
3.3%
, due to (1) increased volumes in banking and wealth solutions (excluding the effects of the sale of the risk and compliance consulting business) contributing 2.0%; (2) growth in retail payments contributing 1.2%; and (3) growth in corporate and digital solutions contributing 0.7%. These items were partially offset by the sale of the risk and compliance consulting business contributing (0.6)%.
Adjusted EBITDA increased
$88 million
, or
4.7%
, primarily resulting from the revenue variances noted above and continued cost management initiatives. Adjusted EBITDA margin increased
60
basis points to
44.6%
primarily driven by a revenue mix shift and operating efficiencies.
Year ended
December 31, 2017
:
Revenue increased
$82 million
, or
2.0%
, due to (1) increased demand in banking and wealth solutions (excluding the effects of the sale of the risk and compliance consulting business) contributing 2.9%; (2) growth in payment solutions excluding the card production business contributing 0.7%; (3) growth in corporate and digital solutions contributing 0.9%; partially offset by (4) the decline and sale of the risk and compliance consulting business contributing (1.4)%; and (5) the slow-down in card production activities associated with the roll-out of EMV contributing (1.2)%.
Adjusted EBITDA increased
$82 million
, or
4.6%
, primarily resulting from the revenue variances noted above. Adjusted EBITDA margin increased
110
basis points to
44.0%
primarily resulting from the favorable revenue mix shift and continued cost management.
Global Financial Solutions
|
|
2018
|
2017
|
2016
|
||||||||
|
|
(In millions)
|
||||||||||
|
Revenue
|
$
|
3,718
|
|
$
|
4,050
|
|
$
|
4,183
|
|
||
|
Adjusted EBITDA
|
$
|
1,391
|
|
$
|
1,323
|
|
$
|
1,211
|
|
||
41
Year ended
December 31, 2018
:
Revenue decreased
$332 million
, or
8.2%
, primarily due to (1) the sale of the Capco consulting business and other divestitures contributing (9.1)% and (2) unfavorable foreign currency impact contributing (1.0)% or approximately $42 million driven primarily by a stronger U.S. Dollar versus the Brazilian Real, partially offset by (1) growth in GFS banking and payments solutions in North America contributing 0.9%; and (2) payments growth in Latin America contributing 1.1%.
Adjusted EBITDA increased
$68 million
, or
5.1%
, primarily resulting from favorable revenue mix and continued cost management initiatives. Adjusted EBITDA margins increased
470
basis points to
37.4%
, resulting from the positive impact of the Capco consulting business divestiture during 2017, as well as continued cost management initiatives.
Year ended
December 31, 2017
:
Revenue decreased
$133 million
, or
3.2%
, primarily due to the sale of the Capco consulting business contributing (5.4)%, partially offset by continued growth in our post-trade derivatives utility contributing 0.6%, volume growth in payment solutions in Brazil contributing 0.9% and a favorable currency impact contributing 0.4% primarily resulting from a stronger Brazilian Real versus the U.S. Dollar, partially offset by a weaker Pound Sterling.
Adjusted EBITDA increased
$112 million
, or
9.2%
, primarily resulting from higher margin revenue and the realization of ongoing expense synergies. Adjusted EBITDA margins increased
370
basis points to
32.7%
primarily resulting from growth in higher margin licenses, the divestiture of the Capco consulting business, as well as realization of ongoing expense synergies.
Corporate and Other
|
|
2018
|
2017
|
2016
|
||||||||
|
|
(In millions)
|
||||||||||
|
Revenue
|
$
|
304
|
|
$
|
358
|
|
$
|
470
|
|
||
|
Adjusted EBITDA
|
$
|
(220
|
)
|
$
|
(213
|
)
|
$
|
(148
|
)
|
||
The Corporate and Other segment results consist of selling, general and administrative expenses and depreciation and intangible asset amortization not otherwise allocated to the reportable segments. Corporate and Other also includes operations from the Global Commercial Services business and non-strategic businesses, including the PS&E business (which was divested on February 1, 2017) and the Certegy Check Services business unit in North America (which was divested on August 31, 2018).
Year ended
December 31, 2018
:
Revenue decreased
$54 million
, or
15.1%
, and was primarily due to the sale of the PS&E business during the first quarter of 2017 and Certegy Check Services business unit in North America during the third quarter of 2018.
Adjusted EBITDA decreased
$7 million
, or
3.3%
, primarily resulting from the reduction in revenue from the sale of the PS&E business during the first quarter of 2017 and Certegy Check Services business unit in North America during the third quarter of 2018, partially offset by a reduction in infrastructure technology expenses and the early results of our data center consolidation program.
Year ended
December 31, 2017
:
Revenue decreased
$112 million
, or
23.8%
, primarily due to the sale of the PS&E business during the first quarter of 2017 and a decline in the Global Commercial Services business, partially offset by lower 2017 SunGard purchase accounting impact on deferred revenue (all of which was recorded as a contra-revenue item in the Corporate and Other segment).
Adjusted EBITDA decreased
$65 million
, or
43.9%
, primarily resulting from the reduction in revenue from the sale of the PS&E business during the first quarter of 2017, partially offset by integration and cost management initiatives.
42
Liquidity and Capital Resources
Cash Requirements
Our ongoing cash requirements include operating expenses, income taxes, mandatory debt service payments, capital expenditures, stockholder dividends, working capital and timing differences in settlement-related assets and liabilities, and may include discretionary debt repayments, share repurchases and business acquisitions. Our principal sources of funds are cash generated by operations and borrowings, including the capacity under our Revolving Credit Facility and the Commercial Paper Program described in Note 10 of the Notes to Consolidated Financial Statements.
As of
December 31, 2018
, we had cash and cash equivalents of
$703 million
and debt of
$8,985 million
, including the current portion, net of capitalized debt issuance costs. Of the
$703 million
cash and cash equivalents, approximately
$340 million
is held by our foreign entities. The majority of our domestic cash and cash equivalents represents net deposits-in-transit at the balance sheet dates and relates to daily settlement activity. We expect that cash and cash equivalents plus cash flows from operations over the next 12 months will be sufficient to fund our operating cash requirements, capital expenditures and mandatory debt service.
We currently expect to continue to pay quarterly dividends. However, the amount, declaration and payment of future dividends is at the discretion of our Board of Directors and depends on, among other things, our investment opportunities, results of operations, financial condition, cash requirements, future prospects, and other factors that may be considered relevant by our Board of Directors, including legal and contractual restrictions. Additionally, the payment of cash dividends may be limited by covenants in certain debt agreements. A regular quarterly dividend of $0.35 per common share is payable on March 29, 2019 to shareholders of record as of the close of business on March 15, 2019.
On July 20, 2017 our Board of Directors approved a plan authorizing repurchases of up to
$4.0 billion
of our outstanding common stock in the open market at prevailing market prices or in privately negotiated transactions through December 31, 2020. This share repurchase authorization replaced any existing share repurchase authorization.
Cash Flows from Operations
Cash flows from operations were
$1,993 million
,
$1,741 million
and
$1,925 million
in
2018
,
2017
and
2016
respectively. Our net cash provided by operating activities consists primarily of net earnings, adjusted to add back depreciation and amortization. Cash flows from operations increased
$252 million
in
2018
and decreased
$184 million
in
2017
. The
2018
increase in cash flows from operations is primarily due to lower trade receivables from increased collections resulting from a reduction in days sales outstanding. These increases were partially offset by U.S. federal estimated income tax payments normally due in the third and fourth quarters of 2017 that were paid during the first quarter of 2018 due to the Hurricane Irma Relief Program and timing of working capital. The
2017
decrease in cash flows from operations is primarily due to increased trade receivables resulting from timing differences in billing and collections and increased deferred contract costs.
Capital Expenditures and Other Investing Activities
Our principal capital expenditures are for computer software (purchased and internally developed) and additions to property and equipment. We invested approximately
$622 million
,
$613 million
and
$616 million
in capital expenditures (excluding capital leases and other financing obligations) during
2018
,
2017
and
2016
, respectively. We expect to invest approximately 7.5% of 2019 revenue in capital expenditures.
In 2017, cash flows from investing activities included proceeds from the sale of businesses and investments primarily relating to the sale of PS&E and the Capco consulting and risk and compliance businesses.
Financing
For more information regarding the Company's debt and financing activity, see Note 10 of the Notes to Consolidated Financial Statements.
Contractual Obligations
FIS’ long-term contractual obligations generally include its long-term debt, interest on long-term debt, lease payments on certain of its property and equipment and payments for data processing and maintenance. For information regarding the
43
Company's long-term debt, see Note 10 of the Notes to Consolidated Financial Statements. The following table summarizes FIS’ significant contractual obligations and commitments as of
December 31, 2018
(in millions):
|
Payments Due in
|
||||||||||||||||||||
|
Less than
|
1-3
|
3-5
|
More than
|
|||||||||||||||||
|
Type of Obligation
|
Total
|
1 Year
|
Years
|
Years
|
5 Years
|
|||||||||||||||
|
Long-term debt (1)
|
$
|
8,816
|
|
$
|
48
|
|
$
|
2,556
|
|
$
|
1,590
|
|
$
|
4,622
|
|
|||||
|
Interest (2)
|
2,882
|
|
293
|
|
574
|
|
460
|
|
1,555
|
|
||||||||||
|
Operating leases
|
480
|
|
121
|
|
184
|
|
89
|
|
86
|
|
||||||||||
|
Data processing and maintenance
|
372
|
|
169
|
|
169
|
|
34
|
|
—
|
|
||||||||||
|
Other contractual obligations (3)
|
7
|
|
2
|
|
3
|
|
2
|
|
—
|
|
||||||||||
|
Total
|
$
|
12,557
|
|
$
|
633
|
|
$
|
3,486
|
|
$
|
2,175
|
|
$
|
6,263
|
|
|||||
|
(1)
|
The principal amounts assume no changes in currency rates for our foreign notes relating to EUR and GBP.
|
|
(2)
|
The calculations above assume that (a) applicable margins and commitment fees remain constant; (b) all variable-rate debt is priced at the rates in effect as of December 31, 2018; (c) no refinancing occurs at debt maturity; (d) only mandatory debt repayments are made; (e) no new hedging transactions are effected; and (f) there are no currency effects.
|
|
(3)
|
Amount includes the estimated payment for labor claims related to FIS' former item processing and remittance operations in Brazil.
|
FIS believes that its existing cash balances and cash flows from operations will provide adequate sources of liquidity and capital resources to meet FIS’ expected liquidity needs for the operations of its business and expected capital spending for the next 12 months.
Off-Balance Sheet Arrangements
FIS does not have any off-balance sheet arrangements.
Recent Accounting Pronouncements
Recently Adopted Accounting Guidance
On March 30, 2016, the FASB issued ASU No. 2016-09 ("ASU 2016-09"),
Compensation - Stock Compensation (Topic 718): Improvements to Employee Share-Based Payment Accounting
. The amendments were intended to simplify and improve the accounting for employee share-based payments. Under the new guidance, all excess tax benefits and tax deficiencies over/under compensation expense recognized will be reflected in the income statement as they occur. This will replace the prior guidance, which required tax benefits that exceed compensation expense (windfalls) to be recognized in equity. It also eliminates the need to maintain a "windfall pool," and removes the requirement to delay recognizing a windfall until it reduces current taxes payable. The new guidance also changes the cash flow presentation of excess tax benefits, classifying them as operating inflows, consistent with other cash flows related to income taxes. Under prior guidance, windfalls were classified as financing activities. These changes may result in more volatile net earnings. Similarly, effective tax rates are subject to more variability since the new guidance reflects all tax benefit excesses and deficiencies in tax expense. Under prior practice, stock compensation generally did not impact the effective tax rate since any difference between compensation expense and the ultimate tax deduction was reflected in additional paid in capital. Also under the new guidance, excess tax benefits are no longer to be included in assumed proceeds from applying the treasury stock method when computing diluted earnings per share since they no longer are recognized in additional paid in capital. Consequently, the reduction to common stock equivalents for assumed purchases from proceeds are lower and the impact of common stock equivalents are more dilutive. For public companies, the amendments are effective for annual periods beginning after December 15, 2016, and interim periods within those annual periods. Thus, ASU 2016-09 was effective for FIS as of January 1, 2017. FIS applied prospectively the recording of excess tax benefits as income tax expense and the presentation of those benefits as an operating activity within the statement of cash flows and, therefore, prior periods have not been adjusted. During 2016, we recorded $32 million to consolidated equity as excess tax benefits from our stock plans.
In August 2016, the FASB issued ASU No. 2016-15 ("ASU 2016-15"),
Statement of Cash Flows (Topic 230): Classification of Certain Cash Receipts and Cash Payments
. The amendments are meant to reduce the diversity in how certain cash receipts and cash payments are presented in the statement of cash flows. ASU 2016-15 provides guidance as to the presentation on the statement of cash flows for eight specific cash flow issues, which are 1) debt prepayment for debt
44
extinguishment costs, 2) settlement of zero-coupon debt instruments or other debt instruments with coupon interest rates that are insignificant in relation to the effective interest rate of the borrowing, 3) contingent consideration payments made after a business combination, 4) proceeds for the settlement of insurance claims, 5) proceeds from the settlement of corporate-owned life insurance policies, including bank-owned life insurance policies, 6) distributions received from equity method investees, 7) beneficial interests in securitization transactions, and 8) separately identifiable cash flows and application of the predominance principle. For public companies, the amendments are effective for annual periods beginning after December 15, 2018, and interim periods within those annual periods beginning after December 15, 2019. Early adoption is permitted for any organization in any interim or annual period. FIS elected to adopt this standard in the third quarter of 2017. FIS has applied the presentation guidance above to its statements of cash flows and all adjustments have been reflected on a retrospective basis. The primary impact of adopting the new guidance is our 2017 presentation of debt prepayment and related costs being reflected in financing activities rather than operating activities.
In August 2017, the FASB issued ASU No. 2017-12 ("ASU 2017-12"),
Derivatives and Hedging (Topic 815) - Targeted Improvements to Accounting for Hedging Activities
. The amendments were meant to improve the financial reporting of hedging relationships to better portray the economic results of an entity’s risk management activities in its financial statements. The amendments in this update also make certain targeted improvements to simplify the application of the hedge accounting guidance in current GAAP. ASU 2017-12 is effective for fiscal years beginning after December 15, 2018, including interim periods within those fiscal years; the ASU allows for early adoption in any interim period after issuance of the update. FIS elected to adopt this standard as of January 1, 2018. The adoption of this ASU did not have an impact on the Company's Consolidated Financial Statements.
In March 2017, the FASB issued ASU No. 2017-07 ("ASU 2017-07"),
Compensation - Retirement Benefits
. The ASU improves the presentation of net periodic pension cost and net periodic postretirement benefit cost in the statements of operations. Under ASU 2017-07, the service cost component of the net periodic benefit cost is disclosed in the same income statement line item as other employee compensation costs arising from services rendered during the period, and the other components are reported separately from the line item that includes the service cost and outside of any subtotal of operating income. ASU 2017-07 is effective for annual periods beginning after December 15, 2017 and early adoption is permitted. FIS adopted the provisions of ASU 2017-07 as of January 1, 2018. As a result, there was no material effect on the Company's Consolidated Financial Statements.
In November 2016, the FASB issued ASU No. 2016-18 ("ASU 2016-18"),
Statement of Cash Flows (Topic 230): Restricted Cash
. ASU 2016-18
requires companies to include restricted amounts with Cash and cash equivalents when reconciling the beginning and end of period total amounts shown on the Statements of Cash Flows. FIS adopted the provisions of ASU 2016-18 as of January 1, 2018. As a result, there was no material effect on the Company’s Consolidated Financial Statements.
In January 2016, the FASB issued ASU No. 2016-01 ("ASU 2016-01"),
Recognition and Measurement of Financial Assets and Financial Liabilities
. ASU 2016-01 amends guidance on the classification and measurement of financial instruments, including significant revisions in accounting related to the classification and measurement of investments in equity securities and presentation of certain fair value changes for financial liabilities when the fair value option is elected. The amendment requires equity securities to be measured at fair value with changes in fair value recognized through net earnings and amends certain disclosure requirements associated with the fair value of financial instruments. In the period of adoption, the Company is required to reclassify the unrealized gains/losses on equity securities within accumulated other comprehensive income (loss) to retained earnings. In February 2018, the FASB issued ASU No. 2018-03,
Technical Corrections and Improvements to Financial Instruments - Overall (Subtopic 825-10)
,
which clarified certain aspects of the previously issued ASU. FIS adopted the provisions of ASU 2016-01 as of January 1, 2018. As a result, there was no material effect on the Company’s Consolidated Financial Statements.
In May 2014, the FASB issued ASU No. 2014-09 ("Topic 606"),
Revenue from Contracts with Customers (Topic 606)
. Topic 606 amends substantially all authoritative literature for revenue recognition, including industry-specific requirements, and converges the guidance under this topic with that of the International Financial Reporting Standards. It also includes guidance on accounting for the incremental costs of obtaining and costs incurred to fulfill a contract with a customer. Topic 606 implements a five-step process for customer contract revenue recognition that focuses on transfer of control, as opposed to transfer of risk and rewards. Topic 606 also requires enhanced disclosures regarding the nature, amount, timing and uncertainty of revenue and cash flows from contracts with customers. The FASB has issued several amendments to Topic 606, including further guidance on principal versus agent consideration, clarification on identifying performance obligations and accounting for licenses of intellectual property.
45
The effective date of Topic 606 was postponed to reporting periods beginning after December 15, 2017, with early adoption allowed for reporting periods beginning after December 15, 2016. We adopted the new standard effective January 1, 2018.
Entities can transition to the standard with retrospective application to the earliest years presented in their financial statements, retrospectively using certain practical expedients, or with a cumulative-effect adjustment as of the date of adoption. We adopted the new standard using the retrospective method with the application of certain practical expedient
s. On May 10, 2018, the Company filed a
Current Report on Form 8-K to recast its Consolidated Financial Statements for each of the years in the three-year period ended December 31, 2017 to reflect our retrospective application of ASU 2014-09.
The largest impacts from the adoption of Topic 606 on our revenue recognition are related to the following areas:
|
•
|
Certain revenues, particularly those related to interchange and third-party network fees associated with our payment processing business, previously recorded on a gross basis as a principal are now recorded on a net basis as an agent to the extent the Company does not control the good or service before it is transferred to the customer.
|
|
•
|
Recognition of certain term license early renewals are now deferred until the conclusion of the term in effect at the time of renewal. Previously, term license early renewals were generally recognized upon execution of the renewal agreement.
|
|
•
|
We now recognize the license portion of software rental fees in certain of our global trading, asset management, and securities processing businesses upon delivery. Previously, software license rental fees were recognized ratably over the rental period as the payments became due and payable.
|
Impacts related to other changes introduced by the standard were substantially less significant than those listed above.
Upon retrospective application of Topic 606, our revenue decreased by approximately $455 million and $410 million and net earnings decreased approximately $58 million and $43 million for the years ended December 31, 2017 and 2016, respectively. For the year ended December 31, 2017, the net earnings decrease included additional tax expense of approximately $21 million due to the re-measurement of deferred tax assets. The impact of Topic 606 on our 2017 and 2016 operating results may or may not be representative of the impact on subsequent years’ results. We have not calculated the impact of Topic 606 on our 2018 operating results as compared to not applying Topic 606.
Recent Accounting Guidance Not Yet Adopted
On February 25, 2016, the FASB issued ASU No. 2016-02,
Leases (Topic 842)
, which requires lessees to recognize leases on-balance sheet and disclose key information about leasing arrangements. Topic 842 was subsequently amended by ASU No. 2018-01,
Land Easement Practical Expedient for Transition to Topic 842
; ASU No. 2018-10,
Codification Improvements to Topic 842, Leases
; ASU No. 2018-11,
Targeted Improvements
; and ASU No. 2018-20,
Leases (Topic 842): Narrow-Scope Improvements for Lessors
(collectively, the "new standard"). The new standard establishes a right-of-use model (ROU) that requires a lessee to recognize a ROU asset and lease liability on the balance sheet for all leases with a term longer than 12 months. Leases will be classified as finance or operating, with classification affecting the pattern and classification of expense recognition in the income statement. Under the new standard, lessor accounting is largely unchanged.
The new standard is effective for public business entities on January 1, 2019, with early adoption permitted. A modified retrospective transition approach is required, applying the new standard to all leases existing at the date of initial application. An entity may choose to use either (1) its effective date or (2) the beginning of the earliest comparative period presented in the financial statements as its date of initial application. If an entity chooses the second option, the transition requirements for existing leases also apply to leases entered into between the date of initial application and the effective date. The entity must also recast its comparative period financial statements and provide the disclosures required by the new standard for the comparative periods. We will adopt the new standard effective January 1, 2019 and use the effective date as our date of initial application. Consequently, financial information will not be updated and the disclosures required under the new standard will not be provided for dates and periods before January 1, 2019.
The new standard provides a number of optional practical expedients in transition. We expect to elect the "package of practical expedients," which permits us not to reassess under the new standard our prior conclusions about lease identification, lease classification and initial direct costs. We do not expect to elect the use-of-hindsight or the practical expedient pertaining to land easements. The new standard also provides practical expedients for an entity’s ongoing accounting. We currently expect to elect the practical expedient to not separate lease and non-lease components for all of our leases. We do not currently expect to elect the short-term lease recognition exemption.
46
We expect that this standard will have an immaterial effect on results of operations. While we continue to assess all of the effects of adoption, we currently believe the most significant effects relate to the recognition of new ROU assets and lease liabilities on our balance sheet for our real estate operating leases and providing new disclosures about our leasing activities.
On adoption, we currently expect to recognize additional ROU assets and lease liabilities for operating leases ranging from
$400 million
to
$500 million
.
On June 16, 2016, the FASB issued ASU No. 2016-13 ("ASU 2016-13"),
Financial Instruments - Credit Losses (Topic 326): Measurements on Credit Losses of Financial Instruments
. This ASU was subsequently amended by ASU No. 2018-19,
Codification Improvements to Topic 326, Financial Instruments - Credit Losses
(collectively, "Topic 326"). The primary objectives of Topic 326 are to implement new methodology for calculating credit losses on financial instruments (e.g., trade receivables) based on expected credit losses and to broaden the types of information companies must use when calculating the estimated losses. Under current guidance, the credit losses are calculated based on multiple credit impairment objectives and recognition is delayed until the loss is probable to occur. Under the new guidance, financial assets measured at amortized cost basis must be shown as the net amount expected to be collected. The credit loss allowance is a contra-valuation account. Available-for-sale securities should continue to be recognized in a similar manner to current GAAP; however, the allowance should be presented as an allowance instead of a write-down of the basis of the asset. For public business entities, the amendments are effective for annual periods beginning after December 15, 2019, and interim periods within those annual periods. Early adoption is permitted for any organization in any interim or annual period beginning after December 15, 2018. We do not plan to early adopt and expect that the new guidance will not have a material impact on our financial statement presentation, financial position, or results of operations.
On August 29, 2018, the FASB issued ASU No. 2018-15 ("ASU 2018-15"),
Intangibles - Goodwill and Other - Internal-Use Software (Subtopic 350-40): Customer’s Accounting for Implementation Costs Incurred in a Cloud Computing Arrangement That Is a Service Contract
. This ASU clarifies that implementation costs incurred by customers in cloud computing arrangements should be deferred and recognized over the term of the arrangement, if those costs would be capitalized by the customer in a software licensing arrangement under the internal-use software guidance. The provisions in ASU 2018-15 should be applied either retrospectively or prospectively to all implementation costs incurred after the date of adoption. For public business entities, ASU 2018-15 is effective for annual periods beginning after December 15, 2019, and interim periods within those annual periods. Early adoption is permitted. We are currently assessing the impact the adoption of ASU 2018-15 will have on our financial position and results of operations.
|
Item 7A.
|
Quantitative and Qualitative Disclosure About Market Risks
|
Market Risk
We are exposed to market risks primarily from changes in interest rates and foreign currency exchange rates. We periodically use certain derivative financial instruments, including interest rate swaps and foreign currency forward contracts, to manage interest rate and foreign currency risk. We do not use derivatives for trading purposes, to generate income or to engage in speculative activity.
Interest Rate Risk
In addition to existing cash balances and cash provided by operating activities, we use fixed-rate and variable-rate debt to finance our operations. We are exposed to interest rate risk on these debt obligations and related interest rate swaps.
The senior notes (as described in Note 10 of the Notes to Consolidated Financial Statements) represent the majority of our fixed-rate long-term debt obligations as of
December 31, 2018
. The carrying value excluding unamortized discounts of the senior notes was
$8,476 million
as of
December 31, 2018
. The fair value of the senior notes was approximately
$8,336 million
as of
December 31, 2018
. The potential reduction in fair value of the senior notes from a hypothetical
10
percent increase in market interest rates would not be material to the overall fair value of the debt.
Our floating rate risk principally relates to borrowings under our Commercial Paper Program and Revolving Credit Facility (as defined in Note 10 of the Notes to Consolidated Financial Statements) and an interest swap on our fixed-rate long-term debt. At
December 31, 2018
, our weighted-average cost of debt was
3.3%
with a weighted-average maturity of
7.5
years;
89%
of our debt was fixed-rate and the remaining
11%
of our debt was floating rate. A 100 basis point increase in the weighted-average interest rate on our floating rate debt would have increased our
2018
interest expense by
$10 million
. We performed the foregoing sensitivity analysis based solely on the principal amount of our floating rate debt as of
December 31, 2018
. This
47
sensitivity analysis does not take into account any changes that occurred in the prior 12 months or that may take place in the next 12 months in the amount of our outstanding debt. Further, this sensitivity analysis assumes the change in interest rates is applicable for an entire year. For comparison purposes, based on principal amounts of floating rate debt outstanding as of
December 31, 2017
, and calculated in the same manner as set forth above, an increase of 100 basis points in the weighted-average interest rate would have increased our annual interest expense by approximately
$2 million
.
As of
December 31, 2018
, we entered into the following interest rate swap transaction converting the interest rate exposure on our Senior Euro Notes due July 2024 from fixed to variable (in millions):
|
Bank pays
|
FIS pays
|
|||||||||||
|
Effective Date
|
Maturity Date
|
Notional
|
fixed rate of
|
variable rate of
|
||||||||
|
December 21, 2018
|
July 15, 2024
|
€
|
500
|
|
1.100
|
%
|
3-month Euribor + .878%
|
(1)
|
||||
(1) 0.507% in effect as of
December 31, 2018
.
We designated the interest rate swap as a fair value hedge for accounting purposes as described in Note 11 of the Notes to Consolidated Financial Statements. A 100 basis point increase in the 3-month Euribor rate would increase our annual interest expense by approximately
$6 million
.
Foreign Currency Risk
We are exposed to foreign currency risks that arise from normal business operations. These risks include the translation of local currency balances of foreign subsidiaries, transaction gains and losses associated with intercompany loans with foreign subsidiaries and transactions denominated in currencies other than a location's functional currency. We manage the exposure to these risks through a combination of normal operating activities and the use of foreign currency forward contracts and non-derivative and derivative investment hedges. Contracts are denominated in currencies of major industrial countries.
Our exposure to foreign currency exchange risks generally arises from our non-U.S. operations, to the extent they are conducted in local currency. Changes in foreign currency exchange rates affect translations of revenue denominated in currencies other than the U.S. Dollar. During the years ended
December 31, 2018
,
2017
and
2016
, we generated approximately
$1,542 million
,
$1,821 million
and
$1,908 million
, respectively, in revenue denominated in currencies other than the U.S. Dollar. The major currencies to which our revenues are exposed are the Brazilian Real, the Euro, the British Pound Sterling and the Indian Rupee. A 10% move in average exchange rates for these currencies (assuming a simultaneous and immediate 10% change in all of such rates for the relevant period) would have resulted in the following increase or decrease in our reported revenue for the years ended
December 31, 2018
,
2017
and
2016
(in millions):
|
Currency
|
2018
|
2017
|
2016
|
|||||||||
|
Pound Sterling
|
$
|
34
|
|
$
|
41
|
|
$
|
44
|
|
|||
|
Euro
|
30
|
|
33
|
|
38
|
|
||||||
|
Real
|
38
|
|
39
|
|
34
|
|
||||||
|
Rupee
|
13
|
|
14
|
|
12
|
|
||||||
|
Total increase or decrease
|
$
|
115
|
|
$
|
127
|
|
$
|
128
|
|
|||
While our results of operations have been impacted by the effects of currency fluctuations, our international operations' revenue and expenses are generally denominated in local currency, which reduces our economic exposure to foreign exchange risk in those jurisdictions.
Revenue included
$40 million
of unfavorable and
$16 million
of favorable foreign currency impact during
2018
and
2017
, respectively, resulting from changes in the U.S. Dollar. Net earnings attributable to FIS common stockholders included
$12 million
of unfavorable and
$2 million
of favorable foreign currency impact during
2018
and
2017
, respectively, resulting from changes in the U.S. Dollar. For the full year of 2019, we anticipate an approximate $45 million adverse impact to revenue due to foreign currency translation, although the actual amount of impact is uncertain due to the many factors that affect exchange rates.
48
Our foreign exchange risk management policy permits the use of derivative instruments, such as forward contracts and options, to reduce volatility in our results of operations and/or cash flows resulting from foreign exchange rate fluctuations. We do not enter into foreign currency derivative instruments for trading purposes or to engage in speculative activity. We do periodically enter into foreign currency forward exchange contracts to hedge foreign currency exposure to intercompany loans and other balance sheet items. We did not have any significant forward contracts as of
December 31, 2018
or 2017. The Company also utilizes organic foreign currency denominated debt and cross-currency interest rate swaps designated as net investment hedges in order to reduce the volatility of the net investment value of certain of its Euro and Pound Sterling functional subsidiaries (see Note 11 of the Notes to Consolidated Financial Statements).
49
Item 8.
Financial Statements and Supplementary Data
FIDELITY NATIONAL INFORMATION SERVICES, INC.
AND SUBSIDIARIES
INDEX TO FINANCIAL INFORMATION
|
|
Page
Number
|
50
REPORT OF INDEPENDENT REGISTERED PUBLIC ACCOUNTING FIRM
To the stockholders and board of directors
Fidelity National Information Services, Inc.:
Opinion on Internal Control Over Financial Reporting
We have audited Fidelity National Information Services, Inc. and subsidiaries’ (the “Company”) internal control over financial reporting as of December 31, 2018, based on criteria established in
Internal Control - Integrated Framework (2013)
issued by the Committee of Sponsoring Organizations of the Treadway Commission. In our opinion, the Company maintained, in all material respects, effective internal control over financial reporting as of December 31, 2018, based on criteria established in
Internal Control - Integrated Framework (2013)
issued by the Committee of Sponsoring Organizations of the Treadway Commission.
We also have audited, in accordance with the standards of the Public Company Accounting Oversight Board (United States) (“PCAOB”), the consolidated balance sheets of the Company as of December 31, 2018 and 2017, the related consolidated statements of earnings, comprehensive earnings, equity, and cash flows for each of the years in the three-year period ended December 31, 2018, and the related notes (collectively, the “consolidated financial statements”), and our report dated February 21, 2019 expressed an unqualified opinion on those consolidated financial statements.
Basis for Opinion
The Company’s management is responsible for maintaining effective internal control over financial reporting and for its assessment of the effectiveness of internal control over financial reporting, included in the accompanying Management’s Report on Internal Control over Financial Reporting. Our responsibility is to express an opinion on the Company’s internal control over financial reporting based on our audit. We are a public accounting firm registered with the PCAOB and are required to be independent with respect to the Company in accordance with the U.S. federal securities laws and the applicable rules and regulations of the Securities and Exchange Commission and the PCAOB.
We conducted our audit in accordance with the standards of the PCAOB. Those standards require that we plan and perform the audit to obtain reasonable assurance about whether effective internal control over financial reporting was maintained in all material respects. Our audit of internal control over financial reporting included obtaining an understanding of internal control over financial reporting, assessing the risk that a material weakness exists, and testing and evaluating the design and operating effectiveness of internal control based on the assessed risk. Our audit also included performing such other procedures as we considered necessary in the circumstances. We believe that our audit provides a reasonable basis for our opinion.
Definition and Limitations of Internal Control Over Financial Reporting
A company’s internal control over financial reporting is a process designed to provide reasonable assurance regarding the reliability of financial reporting and the preparation of financial statements for external purposes in accordance with generally accepted accounting principles. A company’s internal control over financial reporting includes those policies and procedures that (1) pertain to the maintenance of records that, in reasonable detail, accurately and fairly reflect the transactions and dispositions of the assets of the company; (2) provide reasonable assurance that transactions are recorded as necessary to permit preparation of financial statements in accordance with generally accepted accounting principles, and that receipts and expenditures of the company are being made only in accordance with authorizations of management and directors of the company; and (3) provide reasonable assurance regarding prevention or timely detection of unauthorized acquisition, use, or disposition of the company’s assets that could have a material effect on the financial statements.
Because of its inherent limitations, internal control over financial reporting may not prevent or detect misstatements. Also, projections of any evaluation of effectiveness to future periods are subject to the risk that controls may become inadequate because of changes in conditions, or that the degree of compliance with the policies or procedures may deteriorate.
/s/ KPMG LLP
Jacksonville, Florida
February 21, 2019
51
REPORT OF INDEPENDENT REGISTERED PUBLIC ACCOUNTING FIRM
To the stockholders and board of directors
Fidelity National Information Services, Inc.:
Opinion on the Consolidated Financial Statements
We have audited the accompanying consolidated balance sheets of Fidelity National Information Services, Inc. and subsidiaries (the “Company”) as of December 31, 2018 and 2017, the related consolidated statements of earnings, comprehensive earnings, equity, and cash flows for each of the years in the three-year period ended December 31, 2018, and the related notes (collectively, “the consolidated financial statements”). In our opinion, the consolidated financial statements present fairly, in all material respects, the financial position of the Company as of December 31, 2018 and 2017, and the results of its operations and its cash flows for each of the years in the three-year period ended December 31, 2018, in conformity with U.S. generally accepted accounting principles.
We also have audited, in accordance with the standards of the Public Company Accounting Oversight Board (United States) (“PCAOB”), the Company’s internal control over financial reporting as of December 31, 2018, based on criteria established in
Internal Control - Integrated Framework (2013)
issued by the Committee of Sponsoring Organizations of the Treadway Commission, and our report dated February 21, 2019 expressed an unqualified opinion on the effectiveness of the Company’s internal control over financial reporting.
Basis for Opinion
These consolidated financial statements are the responsibility of the Company’s management. Our responsibility is to express an opinion on these consolidated financial statements based on our audits. We are a public accounting firm registered with the PCAOB and are required to be independent with respect to the Company in accordance with the U.S. federal securities laws and the applicable rules and regulations of the Securities and Exchange Commission and the PCAOB.
We conducted our audits in accordance with the standards of the PCAOB. Those standards require that we plan and perform the audit to obtain reasonable assurance about whether the consolidated financial statements are free of material misstatement, whether due to error or fraud. Our audits included performing procedures to assess the risks of material misstatement of the consolidated financial statements, whether due to error or fraud, and performing procedures that respond to those risks. Such procedures included examining, on a test basis, evidence regarding the amounts and disclosures in the consolidated financial statements. Our audits also included evaluating the accounting principles used and significant estimates made by management, as well as evaluating the overall presentation of the consolidated financial statements. We believe that our audits provide a reasonable basis for our opinion.
/s/ KPMG LLP
We have served as the Company’s auditor since 2004.
Jacksonville, Florida
February 21, 2019
52
FIDELITY NATIONAL INFORMATION SERVICES, INC.
AND SUBSIDIARIES
Consolidated Balance Sheets
December 31, 2018 and 2017
(In millions, except per share amounts)
|
2018
|
2017
|
||||||
|
ASSETS
|
|
|
|||||
|
Current assets:
|
|
|
|||||
|
Cash and cash equivalents
|
$
|
703
|
|
$
|
665
|
|
|
|
Settlement deposits
|
700
|
|
677
|
|
|||
|
Trade receivables, net
|
1,472
|
|
1,624
|
|
|||
|
Contract assets
|
123
|
|
108
|
|
|||
|
Settlement receivables
|
281
|
|
291
|
|
|||
|
Other receivables
|
166
|
|
70
|
|
|||
|
Prepaid expenses and other current assets
|
288
|
|
253
|
|
|||
|
Total current assets
|
3,733
|
|
3,688
|
|
|||
|
Property and equipment, net
|
587
|
|
610
|
|
|||
|
Goodwill
|
13,545
|
|
13,730
|
|
|||
|
Intangible assets, net
|
3,132
|
|
3,885
|
|
|||
|
Computer software, net
|
1,795
|
|
1,728
|
|
|||
|
Deferred contract costs, net
|
475
|
|
354
|
|
|||
|
Other noncurrent assets
|
503
|
|
531
|
|
|||
|
Total assets
|
$
|
23,770
|
|
$
|
24,526
|
|
|
|
LIABILITIES AND EQUITY
|
|
|
|||||
|
Current liabilities:
|
|
|
|||||
|
Accounts payable and accrued liabilities
|
$
|
1,099
|
|
$
|
1,241
|
|
|
|
Settlement payables
|
972
|
|
949
|
|
|||
|
Deferred revenue
|
739
|
|
776
|
|
|||
|
Short-term borrowings
|
267
|
|
—
|
|
|||
|
Current portion of long-term debt
|
48
|
|
1,045
|
|
|||
|
Total current liabilities
|
3,125
|
|
4,011
|
|
|||
|
Long-term debt, excluding current portion
|
8,670
|
|
7,718
|
|
|||
|
Deferred income taxes
|
1,360
|
|
1,468
|
|
|||
|
Deferred revenue
|
67
|
|
106
|
|
|||
|
Other long-term liabilities
|
326
|
|
403
|
|
|||
|
Total liabilities
|
13,548
|
|
13,706
|
|
|||
|
Equity:
|
|
|
|||||
|
FIS stockholders’ equity:
|
|
|
|||||
|
Preferred stock, $0.01 par value, 200 shares authorized, none issued and outstanding as of December 31, 2018 and 2017
|
—
|
|
—
|
|
|||
|
Common stock, $0.01 par value, 600 shares authorized, 433 and 432 shares issued as of
December 31, 2018 and 2017, respectively |
4
|
|
4
|
|
|||
|
Additional paid in capital
|
10,800
|
|
10,534
|
|
|||
|
Retained earnings
|
4,528
|
|
4,109
|
|
|||
|
Accumulated other comprehensive earnings (loss)
|
(430
|
)
|
(332
|
)
|
|||
|
Treasury stock, $0.01 par value, 106 and 99 common shares as of December 31, 2018 and 2017, respectively, at cost
|
(4,687
|
)
|
(3,604
|
)
|
|||
|
Total FIS stockholders’ equity
|
10,215
|
|
10,711
|
|
|||
|
Noncontrolling interest
|
7
|
|
109
|
|
|||
|
Total equity
|
10,222
|
|
10,820
|
|
|||
|
Total liabilities and equity
|
$
|
23,770
|
|
$
|
24,526
|
|
|
The accompanying notes are an integral part of these consolidated financial statements.
53
FIDELITY NATIONAL INFORMATION SERVICES, INC.
AND SUBSIDIARIES
Consolidated Statements of Earnings
Years Ended December 31, 2018, 2017 and 2016
(In millions, except per share amounts)
|
|
2018
|
2017
|
2016
|
||||||||
|
Revenue (for related party activity, see Note 15)
|
$
|
8,423
|
|
$
|
8,668
|
|
$
|
8,831
|
|
||
|
Cost of revenue (for related party activity, see Note 15)
|
5,569
|
|
5,794
|
|
5,895
|
|
|||||
|
Gross profit
|
2,854
|
|
2,874
|
|
2,936
|
|
|||||
|
Selling, general and administrative expenses (for related party activity, see Note 15)
|
1,301
|
|
1,442
|
|
1,707
|
|
|||||
|
Asset impairments
|
95
|
|
—
|
|
—
|
|
|||||
|
Operating income
|
1,458
|
|
1,432
|
|
1,229
|
|
|||||
|
Other income (expense):
|
|
|
|
||||||||
|
Interest income
|
17
|
|
22
|
|
20
|
|
|||||
|
Interest expense
|
(314
|
)
|
(359
|
)
|
(403
|
)
|
|||||
|
Other income (expense), net
|
(57
|
)
|
(119
|
)
|
(9
|
)
|
|||||
|
Total other income (expense), net
|
(354
|
)
|
(456
|
)
|
(392
|
)
|
|||||
|
Earnings from continuing operations before income taxes and equity method investment earnings (loss)
|
1,104
|
|
976
|
|
837
|
|
|||||
|
Provision (benefit) for income taxes
|
208
|
|
(321
|
)
|
291
|
|
|||||
|
Equity method investment earnings (loss)
|
(15
|
)
|
(3
|
)
|
—
|
|
|||||
|
Earnings from continuing operations, net of tax
|
881
|
|
1,294
|
|
546
|
|
|||||
|
Earnings (loss) from discontinued operations, net of tax
|
—
|
|
—
|
|
1
|
|
|||||
|
Net earnings
|
881
|
|
1,294
|
|
547
|
|
|||||
|
Net (earnings) loss attributable to noncontrolling interest
|
(35
|
)
|
(33
|
)
|
(22
|
)
|
|||||
|
Net earnings attributable to FIS common stockholders
|
$
|
846
|
|
$
|
1,261
|
|
$
|
525
|
|
||
|
Net earnings per share — basic from continuing operations attributable to FIS common stockholders
|
$
|
2.58
|
|
$
|
3.82
|
|
$
|
1.61
|
|
||
|
Net earnings (loss) per share — basic from discontinued operations attributable to FIS common stockholders
|
—
|
|
—
|
|
—
|
|
|||||
|
Net earnings per share — basic attributable to FIS common stockholders *
|
$
|
2.58
|
|
$
|
3.82
|
|
$
|
1.61
|
|
||
|
Weighted average shares outstanding — basic
|
328
|
|
330
|
|
326
|
|
|||||
|
Net earnings per share — diluted from continuing operations attributable to FIS common stockholders
|
$
|
2.55
|
|
$
|
3.75
|
|
$
|
1.59
|
|
||
|
Net earnings (loss) per share — diluted from discontinued operations attributable to FIS common stockholders
|
—
|
|
—
|
|
—
|
|
|||||
|
Net earnings per share — diluted attributable to FIS common stockholders *
|
$
|
2.55
|
|
$
|
3.75
|
|
$
|
1.59
|
|
||
|
Weighted average shares outstanding — diluted
|
332
|
|
336
|
|
330
|
|
|||||
|
Amounts attributable to FIS common stockholders:
|
|
|
|
||||||||
|
Earnings from continuing operations, net of tax
|
$
|
846
|
|
$
|
1,261
|
|
$
|
524
|
|
||
|
Earnings (loss) from discontinued operations, net of tax
|
—
|
|
—
|
|
1
|
|
|||||
|
Net earnings attributable to FIS common stockholders
|
$
|
846
|
|
$
|
1,261
|
|
$
|
525
|
|
||
* Amounts may not sum due to rounding.
The accompanying notes are an integral part of these consolidated financial statements.
54
FIDELITY NATIONAL INFORMATION SERVICES, INC.
AND SUBSIDIARIES
Consolidated Statements of Comprehensive Earnings
Years Ended December 31, 2018, 2017 and 2016
(In millions)
|
|
2018
|
2017
|
2016
|
||||||||||||||||||||
|
Net earnings
|
$
|
881
|
|
$
|
1,294
|
|
$
|
547
|
|
||||||||||||||
|
Other comprehensive earnings, before tax:
|
|||||||||||||||||||||||
|
Unrealized gain (loss) on investments and derivatives
|
$
|
—
|
|
$
|
(28
|
)
|
$
|
(4
|
)
|
||||||||||||||
|
Reclassification adjustment for gains (losses) included in net earnings
|
—
|
|
—
|
|
9
|
|
|||||||||||||||||
|
Unrealized gain (loss) on investments and derivatives, net
|
—
|
|
(28
|
)
|
5
|
|
|||||||||||||||||
|
Foreign currency translation adjustments
|
(120
|
)
|
23
|
|
(7
|
)
|
|||||||||||||||||
|
Minimum pension liability adjustments
|
5
|
|
(8
|
)
|
(1
|
)
|
|||||||||||||||||
|
Other comprehensive earnings (loss), before tax
|
(115
|
)
|
(13
|
)
|
(3
|
)
|
|||||||||||||||||
|
Provision for income tax expense (benefit) related to items of other comprehensive earnings
|
1
|
|
(11
|
)
|
31
|
|
|||||||||||||||||
|
Other comprehensive earnings (loss), net of tax
|
$
|
(116
|
)
|
(116
|
)
|
$
|
(2
|
)
|
(2
|
)
|
$
|
(34
|
)
|
(34
|
)
|
||||||||
|
Comprehensive earnings
|
765
|
|
1,292
|
|
513
|
|
|||||||||||||||||
|
Net (earnings) loss attributable to noncontrolling interest
|
(35
|
)
|
(33
|
)
|
(22
|
)
|
|||||||||||||||||
|
Other comprehensive (earnings) losses attributable to noncontrolling interest
|
18
|
|
1
|
|
(19
|
)
|
|||||||||||||||||
|
Comprehensive earnings attributable to FIS common stockholders
|
$
|
748
|
|
$
|
1,260
|
|
$
|
472
|
|
||||||||||||||
The accompanying notes are an integral part of these consolidated financial statements.
55
|
FIDELITY NATIONAL INFORMATION SERVICES, INC.
AND SUBSIDIARIES
Consolidated Statements of Equity
Years ended December 31, 2018, 2017 and 2016
(In millions, except per share amounts)
|
|||||||||||||||||||||||||||||||||
|
|
|
|
Amount
|
||||||||||||||||||||||||||||||
|
|
|
|
FIS Stockholders
|
|
|
||||||||||||||||||||||||||||
|
|
|
|
|
|
|
Accumulated
|
|
|
|
||||||||||||||||||||||||
|
|
Number of shares
|
|
Additional
|
|
other
|
|
|
|
|||||||||||||||||||||||||
|
|
Common
|
Treasury
|
Common
|
paid in
|
Retained
|
comprehensive
|
Treasury
|
Noncontrolling
|
Total
|
||||||||||||||||||||||||
|
|
shares
|
shares
|
stock
|
capital
|
earnings
|
earnings
|
stock
|
interest
|
equity
|
||||||||||||||||||||||||
|
Balances, December 31, 2015
|
430
|
|
(106
|
)
|
$
|
4
|
|
$
|
10,210
|
|
$
|
3,050
|
|
$
|
(279
|
)
|
$
|
(3,687
|
)
|
$
|
86
|
|
$
|
9,384
|
|
||||||||
|
Issuance of restricted stock
|
1
|
|
—
|
|
—
|
|
—
|
|
—
|
|
—
|
|
—
|
|
—
|
|
—
|
|
|||||||||||||||
|
Exercise of stock options
|
—
|
|
3
|
|
—
|
|
21
|
|
—
|
|
—
|
|
88
|
|
—
|
|
109
|
|
|||||||||||||||
|
Treasury shares held for taxes due upon exercise of stock options
|
—
|
|
—
|
|
—
|
|
(24
|
)
|
—
|
|
—
|
|
(16
|
)
|
—
|
|
(40
|
)
|
|||||||||||||||
|
Excess income tax benefit from exercise of stock options
|
—
|
|
—
|
|
—
|
|
32
|
|
—
|
|
—
|
|
—
|
|
—
|
|
32
|
|
|||||||||||||||
|
Stock-based compensation
|
—
|
|
—
|
|
—
|
|
137
|
|
—
|
|
—
|
|
—
|
|
—
|
|
137
|
|
|||||||||||||||
|
Cash dividends declared ($1.04 per share) and other distributions
|
—
|
|
—
|
|
—
|
|
—
|
|
(342
|
)
|
—
|
|
—
|
|
(23
|
)
|
(365
|
)
|
|||||||||||||||
|
Other
|
—
|
|
—
|
|
—
|
|
4
|
|
—
|
|
—
|
|
4
|
|
—
|
|
8
|
|
|||||||||||||||
|
Net earnings
|
—
|
|
—
|
|
—
|
|
—
|
|
525
|
|
—
|
|
—
|
|
22
|
|
547
|
|
|||||||||||||||
|
Other comprehensive earnings, net of tax
|
—
|
|
—
|
|
—
|
|
—
|
|
—
|
|
(52
|
)
|
—
|
|
19
|
|
(33
|
)
|
|||||||||||||||
|
Balances, December 31, 2016
|
431
|
|
(103
|
)
|
$
|
4
|
|
$
|
10,380
|
|
$
|
3,233
|
|
$
|
(331
|
)
|
$
|
(3,611
|
)
|
$
|
104
|
|
$
|
9,779
|
|
||||||||
|
Issuance of restricted stock
|
1
|
|
—
|
|
—
|
|
—
|
|
—
|
|
—
|
|
—
|
|
—
|
|
—
|
|
|||||||||||||||
|
Exercise of stock options
|
—
|
|
5
|
|
—
|
|
73
|
|
—
|
|
—
|
|
137
|
|
—
|
|
210
|
|
|||||||||||||||
|
Treasury shares held for taxes due upon exercise of stock options
|
—
|
|
—
|
|
—
|
|
(28
|
)
|
—
|
|
—
|
|
(25
|
)
|
—
|
|
(53
|
)
|
|||||||||||||||
|
Stock-based compensation
|
—
|
|
—
|
|
—
|
|
109
|
|
—
|
|
—
|
|
—
|
|
—
|
|
109
|
|
|||||||||||||||
|
Cash dividends declared ($1.16 per share) and other distributions
|
—
|
|
—
|
|
—
|
|
—
|
|
(385
|
)
|
—
|
|
—
|
|
(27
|
)
|
(412
|
)
|
|||||||||||||||
|
Purchases of treasury stock
|
—
|
|
(1
|
)
|
—
|
|
—
|
|
—
|
|
—
|
|
(105
|
)
|
—
|
|
(105
|
)
|
|||||||||||||||
|
Net earnings
|
—
|
|
—
|
|
—
|
|
—
|
|
1,261
|
|
—
|
|
—
|
|
33
|
|
1,294
|
|
|||||||||||||||
|
Other comprehensive earnings, net of tax
|
—
|
|
—
|
|
—
|
|
—
|
|
—
|
|
(1
|
)
|
—
|
|
(1
|
)
|
(2
|
)
|
|||||||||||||||
|
Balances, December 31, 2017
|
432
|
|
(99
|
)
|
$
|
4
|
|
$
|
10,534
|
|
$
|
4,109
|
|
$
|
(332
|
)
|
$
|
(3,604
|
)
|
$
|
109
|
|
$
|
10,820
|
|
||||||||
|
Issuance of restricted stock
|
1
|
|
—
|
|
—
|
|
—
|
|
—
|
|
—
|
|
—
|
|
—
|
|
—
|
|
|||||||||||||||
|
Exercise of stock options
|
—
|
|
4
|
|
—
|
|
135
|
|
—
|
|
—
|
|
155
|
|
—
|
|
290
|
|
|||||||||||||||
|
Treasury shares held for taxes due upon exercise of stock options
|
—
|
|
—
|
|
—
|
|
(10
|
)
|
—
|
|
—
|
|
(22
|
)
|
—
|
|
(32
|
)
|
|||||||||||||||
|
Stock-based compensation
|
—
|
|
—
|
|
—
|
|
84
|
|
—
|
|
—
|
|
—
|
|
—
|
|
84
|
|
|||||||||||||||
|
Cash dividends declared ($1.28 per share) and other distributions
|
—
|
|
—
|
|
—
|
|
—
|
|
(422
|
)
|
—
|
|
—
|
|
(29
|
)
|
(451
|
)
|
|||||||||||||||
|
Purchases of treasury stock
|
—
|
|
(11
|
)
|
—
|
|
—
|
|
—
|
|
—
|
|
(1,216
|
)
|
—
|
|
(1,216
|
)
|
|||||||||||||||
|
Brazilian Venture divestiture
|
—
|
|
—
|
|
—
|
|
57
|
|
—
|
|
—
|
|
—
|
|
(90
|
)
|
(33
|
)
|
|||||||||||||||
|
Other
|
—
|
|
—
|
|
—
|
|
—
|
|
(5
|
)
|
—
|
|
—
|
|
—
|
|
(5
|
)
|
|||||||||||||||
|
Net earnings
|
—
|
|
—
|
|
—
|
|
—
|
|
846
|
|
—
|
|
—
|
|
35
|
|
881
|
|
|||||||||||||||
|
Other comprehensive earnings, net of tax
|
—
|
|
—
|
|
—
|
|
—
|
|
—
|
|
(98
|
)
|
—
|
|
(18
|
)
|
(116
|
)
|
|||||||||||||||
|
Balances, December 31, 2018
|
433
|
|
(106
|
)
|
$
|
4
|
|
$
|
10,800
|
|
$
|
4,528
|
|
$
|
(430
|
)
|
$
|
(4,687
|
)
|
$
|
7
|
|
$
|
10,222
|
|
||||||||
The accompanying notes are an integral part of these consolidated financial statements.
56
FIDELITY NATIONAL INFORMATION SERVICES, INC.
AND SUBSIDIARIES
Consolidated Statements of Cash Flows
Years ended December 31, 2018, 2017 and 2016
(In millions)
|
|
2018
|
2017
|
2016
|
||||||||
|
Cash flows from operating activities:
|
|
|
|
||||||||
|
Net earnings
|
$
|
881
|
|
$
|
1,294
|
|
$
|
547
|
|
||
|
Adjustment to reconcile net earnings to net cash provided by operating activities:
|
|
|
|
||||||||
|
Depreciation and amortization
|
1,420
|
|
1,366
|
|
1,153
|
|
|||||
|
Amortization of debt issue costs
|
17
|
|
19
|
|
19
|
|
|||||
|
Asset impairments
|
95
|
|
—
|
|
—
|
|
|||||
|
Loss (gain) on sale of businesses and investments
|
50
|
|
(62
|
)
|
—
|
|
|||||
|
Loss on extinguishment of debt
|
1
|
|
196
|
|
—
|
|
|||||
|
Stock-based compensation
|
84
|
|
107
|
|
137
|
|
|||||
|
Deferred income taxes
|
(116
|
)
|
(985
|
)
|
(190
|
)
|
|||||
|
Excess income tax benefit from exercise of stock options
|
—
|
|
—
|
|
(32
|
)
|
|||||
|
Other operating activities, net
|
—
|
|
—
|
|
(2
|
)
|
|||||
|
Net changes in assets and liabilities, net of effects from acquisitions and foreign currency:
|
|
|
|
||||||||
|
Trade and other receivables
|
78
|
|
(232
|
)
|
42
|
|
|||||
|
Contract assets
|
(20
|
)
|
62
|
|
19
|
|
|||||
|
Settlement activity
|
9
|
|
(51
|
)
|
15
|
|
|||||
|
Prepaid expenses and other assets
|
4
|
|
(2
|
)
|
(8
|
)
|
|||||
|
Deferred contract costs
|
(248
|
)
|
(153
|
)
|
(121
|
)
|
|||||
|
Deferred revenue
|
(100
|
)
|
67
|
|
251
|
|
|||||
|
Accounts payable, accrued liabilities, and other liabilities
|
(162
|
)
|
115
|
|
95
|
|
|||||
|
Net cash provided by operating activities
|
1,993
|
|
1,741
|
|
1,925
|
|
|||||
|
Cash flows from investing activities:
|
|
|
|
||||||||
|
Additions to property and equipment
|
(127
|
)
|
(145
|
)
|
(145
|
)
|
|||||
|
Additions to computer software
|
(495
|
)
|
(468
|
)
|
(471
|
)
|
|||||
|
Net proceeds from sale of businesses and investments
|
(16
|
)
|
1,307
|
|
—
|
|
|||||
|
Other investing activities, net
|
(30
|
)
|
(4
|
)
|
(3
|
)
|
|||||
|
Net cash provided by (used in) investing activities
|
(668
|
)
|
690
|
|
(619
|
)
|
|||||
|
Cash flows from financing activities:
|
|
|
|
||||||||
|
Borrowings
|
26,371
|
|
9,615
|
|
7,745
|
|
|||||
|
Repayment of borrowings and capital lease obligations
|
(26,148
|
)
|
(11,689
|
)
|
(8,749
|
)
|
|||||
|
Debt issuance costs
|
(30
|
)
|
(13
|
)
|
(25
|
)
|
|||||
|
Excess income tax benefit from exercise of stock options
|
—
|
|
—
|
|
32
|
|
|||||
|
Proceeds from exercise of stock options
|
288
|
|
208
|
|
112
|
|
|||||
|
Treasury stock activity
|
(1,255
|
)
|
(153
|
)
|
(40
|
)
|
|||||
|
Dividends paid
|
(421
|
)
|
(385
|
)
|
(341
|
)
|
|||||
|
Distributions to Brazilian Venture partner
|
(26
|
)
|
(23
|
)
|
(20
|
)
|
|||||
|
Other financing activities, net
|
(15
|
)
|
(40
|
)
|
(23
|
)
|
|||||
|
Net cash provided by (used in) financing activities
|
(1,236
|
)
|
(2,480
|
)
|
(1,309
|
)
|
|||||
|
Effect of foreign currency exchange rate changes on cash
|
(51
|
)
|
31
|
|
4
|
|
|||||
|
Net increase (decrease) in cash and cash equivalents
|
38
|
|
(18
|
)
|
1
|
|
|||||
|
Cash and cash equivalents, beginning of year
|
665
|
|
683
|
|
682
|
|
|||||
|
Cash and cash equivalents, end of year
|
$
|
703
|
|
$
|
665
|
|
$
|
683
|
|
||
|
Supplemental cash flow information:
|
|
|
|
||||||||
|
Cash paid for interest
|
$
|
298
|
|
$
|
354
|
|
$
|
351
|
|
||
|
Cash paid for income taxes
|
$
|
503
|
|
$
|
545
|
|
$
|
341
|
|
||
The accompanying notes are an integral part of these consolidated financial statements.
57
FIDELITY NATIONAL INFORMATION SERVICES, INC.
AND SUBSIDIARIES
NOTES TO CONSOLIDATED FINANCIAL STATEMENTS
Unless stated otherwise or the context otherwise requires, all references to "FIS," "we," the "Company" or the "registrant" are to Fidelity National Information Services, Inc., a Georgia corporation, and its subsidiaries.
(1) Basis of Presentation
FIS is a global leader in financial services technology with a focus on retail and institutional banking, payments, asset and wealth management, risk and compliance, consulting and outsourcing solutions.
We report the results of our operations in
three
reporting segments: Integrated Financial Solutions ("IFS"), Global Financial Solutions ("GFS") and Corporate and Other (see Note 19).
(2)
Summary of Significant Accounting Policies
The following describes the significant accounting policies of the Company used in preparing the accompanying Consolidated Financial Statements.
(a)
Principles of Consolidation
The Consolidated Financial Statements include the accounts of FIS, its wholly-owned subsidiaries and subsidiaries that are majority-owned. All significant intercompany profits, transactions and balances have been eliminated in consolidation.
(b)
Cash and Cash Equivalents
The Company considers all cash on hand, money market funds and other highly liquid investments with original maturities of
three months
or less to be cash and cash equivalents. As part of the Company’s payment processing business, the Company provides cash settlement services to financial institutions and state and local governments. These services involve the movement of funds between the various parties associated with automated teller machines ("ATM"), point-of-sale or electronic benefit transactions ("EBT"), and this activity results in a balance due to the Company at the end of each business day that it recoups over the next few business days. The in-transit balances due to the Company are included in cash and cash equivalents. The carrying amounts reported in the Consolidated Balance Sheets for these instruments approximate their fair value. As of
December 31, 2018
, we had cash and cash equivalents of
$703 million
of which approximately
$340 million
is held by our foreign entities.
(c)
Fair Value Measurements
Fair Value of Assets Acquired and Liabilities Assumed in Business Combinations
FASB Accounting Standards Codification ("ASC") Topic 805,
Business Combinations,
requires an acquirer to recognize, separately from goodwill, the identifiable assets acquired, liabilities assumed, and any noncontrolling interest in the acquiree, and to measure these items generally at their acquisition date fair values. Goodwill is recorded as the residual amount by which the purchase price exceeds the fair value of the net assets acquired. Fair values are determined using the framework outlined below under
Fair Value Hierarchy
and the methodologies addressed in the individual subheadings. If the initial accounting for a business combination is incomplete by the end of the reporting period in which the combination occurs, we are required to report provisional amounts in the financial statements for the items for which the accounting is incomplete. Adjustments to provisional amounts initially recorded that are identified during the measurement period are recognized in the reporting period in which the adjustment amounts are determined. This includes any effect on earnings of changes in depreciation, amortization, or other income effects as a result of the change to the provisional amounts, calculated as if the accounting had been completed at the acquisition date. During the measurement period, we are also required to recognize additional assets or liabilities if new information is obtained about facts and circumstances that existed as of the acquisition date that, if known, would have resulted in the recognition of those assets and liabilities as of that date. The measurement period ends the sooner of one year from the combination date or when we receive the information we were seeking about facts and circumstances that existed as of the acquisition date or learn that more information is not obtainable.
58
FIDELITY NATIONAL INFORMATION SERVICES, INC.
AND SUBSIDIARIES
NOTES TO CONSOLIDATED FINANCIAL STATEMENTS - (Continued)
Fair Value of Financial Instruments
The carrying amounts reported in the Consolidated Balance Sheets for receivables, accounts payable, and short-term borrowings approximate their fair values because of their immediate or short-term maturities. The fair value of the Company’s long-term debt is estimated to be approximately
$140 million
lower and
$156 million
higher than the carrying value as of
December 31, 2018
and
2017
, respectively. These estimates are based on values of trades of our debt in close proximity to year end, which are considered Level 2-type measurements, as discussed below. These estimates are subjective in nature and involve uncertainties and significant judgment in the interpretation of current market data. Therefore, the values presented are not necessarily indicative of amounts the Company could realize or settle currently. The Company holds, or has held, certain derivative instruments, specifically interest rate swaps and foreign exchange forward contracts. Derivative instruments are valued using Level 2-type measurements.
Fair Value Hierarchy
The authoritative accounting literature defines fair value, establishes a framework for measuring fair value, and establishes a fair value hierarchy based on the quality of inputs used to measure fair value.
The fair value hierarchy includes three levels that are based on the priority of the inputs to the valuation technique. The fair value hierarchy gives the highest priority to quoted prices in active markets for identical assets or liabilities (Level 1 measurements) and the lowest priority to unobservable inputs (Level 3 measurements). If the inputs used to measure the fair value fall within different levels of the hierarchy, the categorization is based on the lowest level input that is significant to the fair value measurement of the asset or liability. The three levels of the fair value hierarchy are described below:
Level 1.
Inputs to the valuation methodology are unadjusted quoted prices for identical assets or liabilities in active markets.
Level 2.
Inputs to the valuation methodology include the following:
•
Quoted prices for similar assets or liabilities in active markets;
•
Quoted prices for identical or similar assets or liabilities in inactive markets;
•
Inputs other than quoted prices that are observable for the asset or liability;
|
•
|
Inputs that are derived principally from or corroborated by observable market data by correlation or other means.
|
If the asset or liability has a specified (contractual) term, the Level 2 input must be observable for substantially the full term of the asset or liability.
Level 3.
Inputs to the valuation methodology are unobservable and significant to the fair value measurement. Unobservable inputs are inputs that reflect the reporting entity’s own assumptions about the assumptions market participants would use in pricing the asset or liability developed based on the best information available in the circumstances.
Fair Value Measurements
Generally accepted accounting principles require that, subsequent to their initial recognition, certain assets be reviewed for impairment on a nonrecurring basis by comparison to their fair value. As more fully discussed in their respective subheadings below, this includes goodwill, long-lived assets, intangible assets, computer software and investments. During the third quarter of 2018, as a result of entering into an agreement to unwind the joint venture ("Brazilian Venture") that the Company operated with Banco Bradesco, S.A. ("Banco Bradesco"), the Company recorded pre-tax asset impairments totaling
$95 million
, including
$42 million
for the Brazilian Venture contract intangible asset,
$25 million
for goodwill, and
$28 million
for assets held for sale during the third quarter (see Notes 15 and 16). The impairment charges are included in the Corporate and Other segment results. There were
no
significant fair value measurement impairments for
2017
or
2016
.
Contingent consideration liabilities or receivables recorded in connection with business acquisitions must also be adjusted for changes in fair value until settled.
59
FIDELITY NATIONAL INFORMATION SERVICES, INC.
AND SUBSIDIARIES
NOTES TO CONSOLIDATED FINANCIAL STATEMENTS - (Continued)
(d)
Derivative Financial Instruments
The Company accounts for derivative financial instruments in accordance with FASB ASC Topic 815,
Derivatives and Hedging.
During 2018, the Company used interest rate swaps to engage in hedging activities relating to its investment in foreign denominated operations and to changes in fair value of its foreign currency denominated debt. The Company designated these interest rate swaps as net investment hedges and a fair value hedge, respectively. During
2017
and
2016
, the Company engaged in hedging activities relating to its variable-rate debt through the use of interest rate swaps. The Company designated these interest rate swaps as cash flow hedges. The estimated fair values of the derivative instruments are determined using Level 2-type measurements. They are recorded as an asset or liability of the Company and are included in the accompanying Consolidated Balance Sheets in prepaid expenses and other current assets, other non-current assets, accounts payable and accrued liabilities, or other long-term liabilities, as appropriate, and as a component of accumulated other comprehensive earnings, net of deferred taxes, for all derivative instruments except the fair value hedge, which is recorded as an adjustment to long-term debt. A portion of the amount included in accumulated other comprehensive earnings for the cash flow hedges is recorded in interest expense as a yield adjustment as interest payments are made on the Company’s Revolving Credit Facility (see Note 10).
The Company also utilizes non-derivative net investment hedges in order to reduce the volatility of the net investment value of its foreign currency denominated operations. The change in fair value of the net investment hedges due to remeasurement of the effective portion, net of tax, is recorded in other comprehensive income (loss). The ineffective portion of these hedging instruments impacts net income when the ineffectiveness occurs.
We also have used currency forward contracts to manage our exposure to fluctuations in costs caused by variations in Indian Rupee ("INR") exchange rates, however, we terminated those contracts in 2017. These INR forward contracts were designated as cash flow hedges. The fair value of these currency forward contracts was determined using currency exchange market rates, obtained from reliable, independent, third party banks, at the balance sheet date. The fair value of forward contracts was subject to changes in currency exchange rates. The Company had no ineffectiveness related to its use of currency forward contracts in connection with INR cash flow hedges.
In September 2015, the Company entered into treasury lock hedges with a total notional amount of
$1.0 billion
, reducing the risk of changes in the benchmark index component of the 10-year treasury yield. The Company designated these derivatives as cash flow hedges. On October 13, 2015, in conjunction with the pricing of the
$4.5 billion
senior notes, the Company terminated these treasury lock contracts for a cash settlement payment of
$16 million
, which was recorded as a component of Other Comprehensive Earnings and will be reclassified as an adjustment to interest expense over the
10
years during which the related interest payments that were hedged will be recognized in income.
(e)
Trade Receivables
A summary of trade receivables, net, as of
December 31, 2018
and
2017
is as follows (in millions):
|
|
2018
|
2017
|
|||||
|
Trade receivables
|
$
|
1,489
|
|
$
|
1,687
|
|
|
|
Allowance for doubtful accounts
|
(17
|
)
|
(63
|
)
|
|||
|
Total trade receivables, net
|
$
|
1,472
|
|
$
|
1,624
|
|
|
The company records allowance for doubtful accounts when it is probable that a trade receivable balance will not be collected. The Company writes-off a trade receivable balance when the likelihood of collection is considered remote.
60
FIDELITY NATIONAL INFORMATION SERVICES, INC.
AND SUBSIDIARIES
NOTES TO CONSOLIDATED FINANCIAL STATEMENTS - (Continued)
A summary roll forward of the allowance for doubtful accounts for
2018
,
2017
and
2016
is as follows (in millions):
|
Allowance for doubtful accounts as of December 31, 2015
|
$
|
(16
|
)
|
|
Bad debt expense
|
(29
|
)
|
|
|
Write-offs, net of recoveries
|
4
|
|
|
|
Allowance for doubtful accounts as of December 31, 2016
|
(41
|
)
|
|
|
Bad debt expense
|
(26
|
)
|
|
|
Write-offs, net of recoveries
|
4
|
|
|
|
Allowance for doubtful accounts as of December 31, 2017
|
(63
|
)
|
|
|
Bad debt expense
|
(13
|
)
|
|
|
Write-offs, net of recoveries
|
59
|
|
|
|
Allowance for doubtful accounts as of December 31, 2018
|
$
|
(17
|
)
|
(f)
Settlement Deposits, Receivables and Payables
We manage certain integrated electronic payment services and programs and wealth management processes for our clients that require us to hold and manage client cash balances used to fund their daily settlement activity. Settlement deposits represent funds we hold that were drawn from our clients to facilitate settlement activities. Settlement receivables represent amounts funded by us. Settlement payables consist of settlement deposits from clients, settlement payables to third parties and outstanding checks related to our settlement activities for which the right of offset does not exist or we do not intend to exercise our right of offset. Our accounting policy for such outstanding checks is to include them in settlement payables on the Consolidated Balance Sheets and operating cash flows on the Consolidated Statements of Cash Flows. The payment solution services that give rise to these settlement balances are separate and distinct from those settlement activities referred to under (b)
Cash and Cash Equivalents
, where the services we provide primarily facilitate the movement of funds.
(g)
Goodwill
Goodwill represents the excess of cost over the fair value of identifiable assets acquired and liabilities assumed in business combinations. FASB ASC Topic 350,
Intangibles
-
Goodwill and Other,
requires that goodwill and other intangible assets with indefinite useful lives not be amortized, but rather be tested for impairment annually, or more frequently if circumstances indicate potential impairment. The guidance allows an entity first to assess qualitatively whether it is more likely than not that a reporting unit's carrying amount exceeds its fair value, referred to as "step zero." If an entity concludes that it is more likely than not that a reporting unit's fair value is less than its carrying amount (that is, a likelihood of more than
50
percent), the "step one" quantitative assessment must be performed for that reporting unit. FASB ASC Topic 350 provides examples of events and circumstances that should be considered in performing the step zero qualitative assessment, including macroeconomic conditions, industry and market considerations, cost factors, overall financial performance, events affecting a reporting unit or the entity as a whole and a sustained decrease in share price.
In applying the quantitative analysis, we determine the fair value of our reporting units based on a weighted average of multiple valuation techniques, principally a combination of an income approach and a market approach, which are Level 3- and Level 2-type measurements. The income approach calculates a value based upon the present value of estimated future cash flows, while the market approach uses earnings multiples of similarly situated guideline public companies. If the fair value of a reporting unit exceeds the carrying value of the reporting unit’s net assets, goodwill is not impaired and further testing is not required.
The Company assesses goodwill for impairment on an annual basis during the
fourth
quarter or more frequently if circumstances indicate potential impairment. For each of
2018
,
2017
, and
2016
, we began our assessment with the step zero qualitative assessment. In performing the step zero qualitative assessment for each year, examining those factors most likely to affect our valuations, we concluded that it remained more likely than not that the fair value of each of our reporting units continued to exceed their carrying amounts. Consequently, we did not perform a step one quantitative assessment specifically for the purpose of our annual impairment test in any year presented in these financial statements.
61
FIDELITY NATIONAL INFORMATION SERVICES, INC.
AND SUBSIDIARIES
NOTES TO CONSOLIDATED FINANCIAL STATEMENTS - (Continued)
(h)
Long-Lived Assets
Long-lived assets and intangible assets with finite useful lives are reviewed for impairment whenever events or changes in circumstances indicate that the carrying amount of an asset may not be recoverable. Recoverability of assets to be held and used is measured by comparison of the carrying amount of an asset to estimated undiscounted future cash flows expected to be generated by the asset, which are Level 3-type measurements. If the carrying amount of an asset exceeds its estimated future cash flows, an impairment charge is recognized in the amount by which the carrying amount of the asset exceeds the fair value of the asset.
(i)
Intangible Assets
The Company has intangible assets that consist primarily of customer relationships and trademarks that are recorded in connection with acquisitions at their fair value based on the results of valuation analyses. Customer relationships are amortized over their estimated useful lives using an accelerated method that takes into consideration expected customer attrition rates up to a
10
-year period. Trademarks determined to have indefinite lives are not amortized. Trademarks with finite lives are amortized over periods ranging up to
5 years
. Intangible assets with finite lives (principally customer relationships and certain trademarks) are reviewed for impairment in accordance with FASB ASC Subtopic 360-10-35,
Impairment or Disposal of Long-Lived Assets
, while certain trademarks determined to have indefinite lives are reviewed for impairment at least annually in accordance with FASB ASC Topic 350. Similar to the guidance for goodwill, ASC Topic 350 allows an organization to first perform a qualitative assessment of whether it is more likely than not that an indefinite-lived intangible asset has been impaired.
The Company assesses indefinite-lived intangible assets for impairment on an annual basis during the fourth quarter or more frequently if circumstances indicate potential impairment. For 2016, we engaged independent specialists to perform a valuation of our indefinite-lived intangible assets, using a form of income approach valuation known as the relief-from-royalty method, which is a Level 3-type measurement. There was substantial excess of fair value over carrying value for our indefinite-lived intangible assets in the 2016 independent valuations. Based upon this quantitative assessment performed, there was no impairment for 2016. For each of
2018
and
2017
, we performed a qualitative assessment examining those factors most likely to affect our valuations and concluded that it remained more likely than not that our indefinite-lived intangible assets were not impaired. Consequently, we did not perform a quantitative impairment assessment specifically for the purpose of our annual impairment tests for 2018 and 2017.
(j)
Computer Software
Computer software includes software acquired in business combinations, purchased software and capitalized software development costs. Software acquired in business combinations is generally valued using the relief-from-royalty method, a Level 3-type measurement. Purchased software is recorded at cost and amortized using the straight-line method over its estimated useful life and software acquired in business combinations is recorded at its fair value and amortized using straight-line or accelerated methods over its estimated useful life, ranging from
three
to
10
years.
The capitalization of software development costs is governed by FASB ASC Subtopic 985-20 if the software is to be sold, leased or otherwise marketed, or by FASB ASC Subtopic 350-40 if the software is for internal use. After the technological feasibility of the software has been established (for software to be marketed) or at the beginning of application development (for internal-use software), software development costs, which primarily include salaries and related payroll costs and costs of independent contractors incurred during development, are capitalized. Research and development costs incurred prior to the establishment of technological feasibility (for software to be marketed) or prior to application development (for internal-use software), are expensed as incurred. Software development costs are amortized on a product-by-product basis commencing on the date of general release (for software to be marketed) or the date placed in service (for internal-use software). Software development costs for software to be marketed are amortized using the greater of (1) the straight-line method over its estimated useful life, which ranges from
three
to
10
years, or (2) the ratio of current revenues to total anticipated revenues over its useful life.
(k)
Deferred Contract Costs
The Company incurs costs as a result of both the origination and fulfillment of our contracts with customers. Origination costs relate primarily to the payment of sales commissions that are directly related to sales transactions. Fulfillment costs
62
FIDELITY NATIONAL INFORMATION SERVICES, INC.
AND SUBSIDIARIES
NOTES TO CONSOLIDATED FINANCIAL STATEMENTS - (Continued)
include the cost of implementation services related to software as a service ("SaaS") and other cloud-based arrangements when the implementation service is not distinct from the ongoing service. When origination costs and fulfillment costs that will be used to satisfy future performance obligations are directly related to the execution of our contracts with customers, and the costs are recoverable under the contract, the costs are capitalized as a deferred contract cost. Impairment losses are recognized if the carrying amounts of the deferred contract costs are not recoverable. There were no significant impairment losses recognized on deferred contract costs for 2018, 2017, or 2016.
Origination costs for contracts that contain a distinct software license recognized at a point in time are allocated between the license and all other performance obligations of the contract and amortized according to the pattern of performance for the respective obligations. Otherwise, origination costs are capitalized as a single asset for each contract and amortized using an appropriate single measure of performance considering all of the performance obligations in the contract. The Company amortizes origination costs over the expected benefit period to which the deferred contract cost relates. Origination costs related to initial contracts with a customer are amortized over the lesser of the useful life of the solution or the expected customer relationship period. Commissions paid on renewals are amortized over the renewal period. Capitalized fulfillment costs are amortized over the lesser of the useful life of the solution or the expected customer relationship period.
(l)
Property and Equipment
Property and equipment is recorded at cost, less accumulated depreciation and amortization. Depreciation and amortization are computed primarily using the straight-line method based on the estimated useful lives of the related assets as follows:
30
years for buildings and
three
to
seven
years for furniture, fixtures and computer equipment. Leasehold improvements are amortized using the straight-line method over the lesser of the initial term of the applicable lease or the estimated useful lives of such assets.
(m)
Income Taxes
The Company recognizes deferred income tax assets and liabilities for temporary differences between the financial reporting basis and the tax basis of the Company’s assets and liabilities and expected benefits of using net operating loss and credit carryforwards. Deferred income tax assets and liabilities are measured using enacted tax rates expected to apply to taxable income in the years in which those temporary differences are expected to be recovered or settled. The impact on deferred income taxes of changes in tax rates and laws, if any, is reflected in the Consolidated Financial Statements in the period enacted. A valuation allowance is established for any portion of a deferred income tax asset for which management believes it is more likely than not that the Company will not be able to realize the benefits of all or a portion of that deferred income tax asset.
(n)
Revenue Recognition
The Company generates revenue in a number of ways, including from the delivery of account- or transaction-based processing, SaaS, business process as a service ("BPaaS"), cloud offerings, software licensing, software-related services and professional services.
The Company enters into arrangements with customers to provide services, software and software-related services such as maintenance, implementation and training either individually or as part of an integrated offering of multiple services. At contract inception, the Company assesses the solutions and services promised in its contracts with customers and identifies a performance obligation for each promise to transfer to the customer a solution or service (or bundle of solutions or services) that is distinct - i.e., if a solution or service is separately identifiable from other items in the bundled package and if a customer can benefit from it on its own or with other resources that are readily available to the customer. To identify its performance obligations, the Company considers all of the solutions or services promised in the contract regardless of whether they are explicitly stated or are implied by customary business practices. The Company recognizes revenue when or as it satisfies a performance obligation by transferring control of a solution or service to a customer.
Revenue is measured based on the consideration that the Company expects to receive in a contract with a customer. The Company’s contracts with its customers frequently contain variable consideration. Variable consideration exists when the amount which the Company expects to receive in a contract is based on the occurrence or non-occurrence of future events, such as processing services performed under usage-based pricing arrangements or professional services billed on a time and materials basis. Variable consideration is also present in certain transactions in the form of discounts, credits, price
63
FIDELITY NATIONAL INFORMATION SERVICES, INC.
AND SUBSIDIARIES
NOTES TO CONSOLIDATED FINANCIAL STATEMENTS - (Continued)
concessions, penalties, and similar items. If the amount of a discount or rebate in a contract is fixed and not contingent, that discount or rebate is not variable consideration. The Company estimates variable consideration in its contracts primarily using the expected value method. In some contracts, the Company applies the most likely amount method by considering the single most likely amount in a limited range of possible consideration amounts. The Company develops estimates of variable consideration on the basis of both historical information and current trends. Variable consideration included in the transaction price is constrained such that a significant revenue reversal is not probable.
Taxes collected from customers and remitted to governmental authorities are not included in revenue. Postage costs associated with print and mail services are accounted for as a fulfillment cost and are included in cost of revenue.
Technology or service components from third parties are frequently embedded in or combined with our applications or service offerings. We are often responsible for billing the client in these arrangements and transmitting the applicable fees to the third party. The Company determines whether it is responsible for providing the actual solution or service as a principal, or for arranging for the solution or service to be provided by the third party as an agent. Judgment is applied to determine whether we are the principal or the agent by evaluating whether the Company has control of the solution or service prior to it being transferred to the customer. The principal versus agent assessment is performed at the performance obligation level. Indicators that the Company considers in determining if it has control include whether the Company is primarily responsible for fulfilling the promise to provide the specified solution or service to the customer, the Company has inventory risk and the Company has discretion in establishing the price the customer ultimately pays for the solution or service. Depending upon the level of our contractual responsibilities and obligations for delivering solutions to end customers, we have arrangements where we are the principal and recognize the gross amount billed to the customer and other arrangements where we are the agent and recognize the net amount retained.
Once the Company has determined the transaction price, the total transaction price is allocated to each performance obligation in a manner depicting the amount of consideration to which the Company expects to be entitled in exchange for transferring the solution(s) or service(s) to the customer (the "allocation objective"). If the allocation objective is met at contractual prices, no allocations are made. Otherwise, the Company allocates the transaction price to each performance obligation identified in the contract on a relative standalone selling price basis, except when the criteria are met for allocating variable consideration or a discount to one or more, but not all, performance obligations in the contract. The Company allocates variable consideration to one or more, but not all performance obligations when the terms of the variable payment relate specifically to the Company’s efforts to satisfy the performance obligation (or transfer the distinct solution or service) and when such allocation is consistent with the allocation objective when considering all performance obligations in the contract. Determining whether the criteria for allocating variable consideration to one or more, but not all, performance obligations in the contract requires significant judgment and may affect the timing and amount of revenue recognized. The Company does not typically meet the requirements to allocate discounts to one or more, but not all, performance obligations in a contract.
In order to determine the standalone selling price of its promised solutions or services, the Company conducts a regular analysis to determine whether various solutions or services have an observable standalone selling price. If the Company does not have an observable standalone selling price for a particular solution or service, then standalone selling price for that particular solution or service is estimated using all information that is reasonably available and maximizing observable inputs with approaches including historical pricing, cost plus a margin, adjusted market assessment, and residual approach.
The following describes the nature of the Company’s primary types of revenue and the revenue recognition policies and significant payment terms as they pertain to the types of transactions the Company enters into with its customers.
Processing Services Revenue
Processing services are primarily comprised of data processing and application management, including our SaaS, BPaaS and cloud offerings. Revenue from processing services are typically volume- or activity-based depending on factors such as the number of accounts processed, transactions or trades processed, users, number of hours of services or computer resources used. The payment terms may include tiered pricing structures with the base tier representing a minimum monthly usage fee. Pricing within the tiers typically resets on a monthly basis, and minimum monthly volumes are generally met or exceeded. Contract lengths for processing services typically span multiple years. Payment is generally due in advance or in arrears on a monthly or quarterly basis and may include fixed or variable payment amounts depending on the specific payment terms and activity in the period.
64
FIDELITY NATIONAL INFORMATION SERVICES, INC.
AND SUBSIDIARIES
NOTES TO CONSOLIDATED FINANCIAL STATEMENTS - (Continued)
For processing services revenue, the nature of the Company’s promise to the customer is to stand ready to provide continuous access to the Company’s processing platforms and perform an unspecified quantity of outsourced and transaction-processing services for a specified term or terms. Accordingly, processing services are generally viewed as a stand-ready performance obligation comprised of a series of distinct daily services. The Company typically satisfies its processing services performance obligations over time as the services are provided. A time-elapsed output method is used to measure progress because the Company’s efforts are expended evenly throughout the period given the nature of the promise is a stand-ready service. The Company has evaluated its variable payment terms related to its processing services revenue accounted for as a series of distinct days of service and concluded that they generally meet the criteria for allocating variable consideration entirely to one or more, but not all, performance obligations in a contract. Accordingly, when the criteria are met, variable amounts based on the number and type of services performed during a period are allocated to and recognized on the day in which the Company performs the related services. Fixed fees for processing services are generally recognized ratably over the contract period.
License and Software Related Revenue
The Company’s software licenses generally have significant stand-alone functionality to the customer upon delivery and are considered to be functional intellectual property ("IP"). Additionally, the nature of the Company’s promise in granting these software licenses to a customer is typically to provide the customer a right to use the Company’s intellectual property. The Company’s software licenses are generally considered distinct performance obligations, and revenue allocated to the software license is typically recognized at a point in time upon delivery of the license.
In conjunction with software licenses, the Company commonly provides the customer with additional services such as maintenance as well as associated implementation and other professional services related to the software license. Payments for maintenance are typically due annually, quarterly, or monthly in advance. Maintenance is typically comprised of technical support and unspecified updates and upgrades. The Company generally satisfies these performance obligations evenly using a time-elapsed output method over the contract term given there is no discernible pattern of performance. When a software license contract also includes professional services that provide significant modification or customization of the software license, the Company combines the software license and professional services into a single performance obligation, and revenue for the combined performance obligation is recognized as the professional services are provided consistent with the methods described below for professional services revenue.
The Company has contracts where the licensed software is offered in conjunction with hosting services. The licensed software may be considered a separate performance obligation from the hosting services if the customer can take possession of the software during the contractual term without incurring a significant penalty and if it is feasible for the customer to run the software on its own infrastructure or hire a third party to host the software. If the licensed software and hosting services are separately identifiable, license revenue is recognized when the hosting services commence and it is within the customer's control to obtain a copy of the software, and hosting revenue is recognized using the time-elapsed output method as the service is provided. If the software license is not separately identifiable from the hosting service, then the related revenue for the combined performance obligation is recognized ratably over the hosting period.
Occasionally, the Company offers extended payment terms on its license transactions and evaluates whether any potential significant financing components exist. For certain of its business units, the Company will provide a software license through a rental model for customers who would prefer a periodic fee instead of a larger upfront payment. Revenue recognition under these arrangements follows the same recognition pattern as the arrangements outlined above; however, the customer generally pays for the software license and maintenance in monthly or quarterly installments as opposed to an upfront software license fee. Judgment is required to determine whether these arrangements contain a significant financing component. The Company evaluates whether there is a significant difference between the amount of promised consideration over the rental term and the cash selling price of the software license, and the overall impact of the time value of money on the transaction. Rental software license arrangements that include a significant financing component are adjusted for the time value of money at the Company’s incremental borrowing rate by recording a contract asset and interest income. The Company does not adjust the promised amount of consideration for the effects of the time value of money if it is expected, at contract inception, that the period between when the Company transfers a promised solution or service to a customer and when the customer pays for that solution or service will be one year or less.
65
FIDELITY NATIONAL INFORMATION SERVICES, INC.
AND SUBSIDIARIES
NOTES TO CONSOLIDATED FINANCIAL STATEMENTS - (Continued)
Professional Services Revenue
Professional services revenue is comprised of implementation, conversion, and programming services associated with the Company’s data processing and application management agreements, implementation or installation services related to licensed software, and other consulting services. A significant portion of our professional services revenue is derived from contracts for dedicated personnel resources who are often working full-time at a client site and under the client's direction. This revenue generally re-occurs as contracts are renewed. Payment terms for professional services may be based on an upfront fixed fee, fixed upon the achievement of milestones, or on a time and materials basis.
In assessing whether implementation services provided on data processing, application management or software agreements are a distinct performance obligation, the Company considers whether the services are both capable of being distinct (i.e., can the customer benefit from the services alone or in combination with other resources that are readily available to the customer) and distinct within the context of the contract (i.e., separately identifiable from the other performance obligations in the contract). Implementation services and other professional services are typically considered distinct performance obligations. However, when these services involve significant customization or modification of an underlying solution or offering, or if the services are complex and not available from a third-party provider and must be completed prior to a customer having the ability to benefit from a solution or offering, then such services and the underlying solution or offering will be accounted for as a combined performance obligation.
The Company’s professional services that are accounted for as distinct performance obligations and that are billed on a fixed fee basis are typically satisfied as services are rendered; thus, the Company uses a cost-based input method, such as cost-to-cost or efforts expended (labor hours), to provide a faithful depiction of the transfer of those services. For professional services that are distinct and billed on a time and materials basis, revenue is generally recognized using an output method that corresponds with the time and materials billed and delivered, which is reflective of the transfer of the services to the customer. Professional services that are not distinct from an associated solution or offering are recognized over the common measure of progress for the overall performance obligation (typically a time-elapsed output measure that corresponds to the period over which the solution or offering is made available to the customer).
Hardware and Other Revenue
Hardware and other miscellaneous revenue is generally recognized at a point in time upon delivery. The Company typically does not stock in inventory the hardware solutions sold but arranges for delivery of hardware from third-party suppliers. The Company determines whether hardware delivered from third-party suppliers should be recognized on a gross or net basis by evaluating whether the Company has control of the solution or service prior to it being transferred to the customer.
Material Rights
Some of the Company’s contracts with customers include options for the customer to acquire additional solutions or services in the future, including options to renew existing services. Options may represent a material right to acquire solutions or services if the discount is incremental to the range of discounts typically given for those solutions or services to that class of customer in that geographical area or market, and the customer would not have obtained the option without entering into the contract. If deemed to be a material right, the Company will account for the material right as a separate performance obligation and determine the standalone selling price based on directly observable prices when available. If the standalone selling price is not directly observable, then the Company estimates the standalone selling price to be equal to the discount that the customer would obtain by exercising the option, as adjusted for any discount that the customer would receive without exercising the option and for the likelihood that the option will be exercised.
(o)
Cost of Revenue and Selling, General and Administrative Expenses
Cost of revenue includes payroll, employee benefits, occupancy costs and other costs associated with personnel employed in customer service and service delivery roles, including program design and development and professional services. Cost of revenue also includes data processing costs, amortization of software and customer relationship intangible assets, and depreciation on operating assets.
Selling, general and administrative expenses include payroll, employee benefits, occupancy and other costs associated with personnel employed in sales, marketing, human resources, finance, risk management and other administrative roles. Selling,
66
FIDELITY NATIONAL INFORMATION SERVICES, INC.
AND SUBSIDIARIES
NOTES TO CONSOLIDATED FINANCIAL STATEMENTS - (Continued)
general and administrative expenses also include depreciation on non-operating corporate assets, advertising costs and other marketing-related programs.
(p)
Stock-Based Compensation Plans
The Company accounts for stock-based compensation plans using the fair value method. Thus, compensation cost is measured based on the fair value of the award at the grant date and is recognized over the service period. Certain of our stock awards also contain performance conditions. In those circumstances, compensation cost is recognized over the service period when it is probable the outcome of that performance condition will be achieved. If the Company concludes at any point prior to completion of the requisite service period that it is not probable that the performance condition will be met, any previously recorded expense would be reversed. Certain of our stock awards contain market conditions. In those circumstances, compensation cost is recognized over the service period and is not reversed even if the award does not become exercisable because the market condition is not achieved.
(q)
Foreign Currency Translation
The functional currency for the foreign operations of the Company is either the U.S. Dollar or the local foreign currency. For foreign operations where the local currency is the functional currency, the translation into U.S. Dollars for consolidation is performed for balance sheet accounts using exchange rates in effect at the balance sheet date and for revenue and expense accounts using the average exchange rate during the period. The adjustments resulting from the translation are included in accumulated other comprehensive earnings (loss) in the Consolidated Statements of Equity and Consolidated Statements of Comprehensive Earnings and are excluded from net earnings.
Gains or losses resulting from foreign currency transactions are included in other income (expense).
(r)
Management Estimates
The preparation of these Consolidated Financial Statements in conformity with U.S. generally accepted accounting principles requires management to make estimates and assumptions that affect the reported amounts of assets and liabilities and disclosure of contingent assets and liabilities at the date of the Consolidated Financial Statements and the reported amounts of revenue and expenses during the reporting periods. Actual results could differ from those estimates.
(s)
Net Earnings per Share
The basic weighted average shares and common stock equivalents for the years ended
December 31, 2018
,
2017
and
2016
are computed using the treasury stock method.
67
FIDELITY NATIONAL INFORMATION SERVICES, INC.
AND SUBSIDIARIES
NOTES TO CONSOLIDATED FINANCIAL STATEMENTS - (Continued)
Net earnings and earnings per share for the years ended
December 31, 2018
,
2017
and
2016
are as follows (in millions, except per share data):
|
|
Year ended December 31,
|
||||||||||
|
|
2018
|
2017
|
2016
|
||||||||
|
Earnings from continuing operations attributable to FIS, net of tax
|
$
|
846
|
|
$
|
1,261
|
|
$
|
524
|
|
||
|
Earnings (loss) from discontinued operations attributable to FIS, net of tax
|
—
|
|
—
|
|
1
|
|
|||||
|
Net earnings attributable to FIS common stockholders
|
$
|
846
|
|
$
|
1,261
|
|
$
|
525
|
|
||
|
Weighted average shares outstanding — basic
|
328
|
|
330
|
|
326
|
|
|||||
|
Plus: Common stock equivalent shares
|
4
|
|
6
|
|
4
|
|
|||||
|
Weighted average shares outstanding — diluted
|
332
|
|
336
|
|
330
|
|
|||||
|
Net earnings per share — basic from continuing operations attributable to FIS common stockholders
|
$
|
2.58
|
|
$
|
3.82
|
|
$
|
1.61
|
|
||
|
Net earnings (loss) per share — basic from discontinued operations attributable to FIS common stockholders
|
—
|
|
—
|
|
—
|
|
|||||
|
Net earnings per share — basic attributable to FIS common stockholders *
|
$
|
2.58
|
|
$
|
3.82
|
|
$
|
1.61
|
|
||
|
Net earnings per share — diluted from continuing operations attributable to FIS common stockholders
|
$
|
2.55
|
|
$
|
3.75
|
|
$
|
1.59
|
|
||
|
Net earnings (loss) per share — diluted from discontinued operations attributable to FIS common stockholders
|
—
|
|
—
|
|
—
|
|
|||||
|
Net earnings per share — diluted attributable to FIS common stockholders *
|
$
|
2.55
|
|
$
|
3.75
|
|
$
|
1.59
|
|
||
|
* Amounts may not sum due to rounding.
|
|||||||||||
Options to purchase approximately
1 million
,
4 million
and
3 million
shares of our common stock for the years ended
December 31, 2018
,
2017
and
2016
, respectively, were not included in the computation of diluted earnings per share because they were anti-dilutive.
(t)
Certain Reclassifications
Certain reclassifications have been made in the
2017
and
2016
Consolidated Financial Statements to conform to the classifications used in
2018
.
(3) Revenue
Disaggregation of Revenue
In the following tables, revenue is disaggregated by primary geographical market, type of revenue, and recurring nature of revenue recognized. The tables also include a reconciliation of the disaggregated revenue with the Company’s reportable segments.
68
FIDELITY NATIONAL INFORMATION SERVICES, INC.
AND SUBSIDIARIES
NOTES TO CONSOLIDATED FINANCIAL STATEMENTS - (Continued)
For the year ended December 31, 2018 (in millions):
|
Reportable Segments
|
||||||||||||||||
|
Corporate
|
||||||||||||||||
|
IFS
|
GFS
|
and Other
|
Total
|
|||||||||||||
|
Primary Geographical Markets:
|
||||||||||||||||
|
North America
|
$
|
4,222
|
|
$
|
1,808
|
|
$
|
253
|
|
$
|
6,283
|
|
||||
|
All others
|
179
|
|
1,910
|
|
51
|
|
2,140
|
|
||||||||
|
Total
|
$
|
4,401
|
|
$
|
3,718
|
|
$
|
304
|
|
$
|
8,423
|
|
||||
|
Type of Revenue:
|
||||||||||||||||
|
Processing and services
|
$
|
3,582
|
|
$
|
2,095
|
|
$
|
276
|
|
$
|
5,953
|
|
||||
|
License and software related
|
375
|
|
1,001
|
|
1
|
|
1,377
|
|
||||||||
|
Professional services
|
170
|
|
603
|
|
9
|
|
782
|
|
||||||||
|
Hardware and other
|
274
|
|
19
|
|
18
|
|
311
|
|
||||||||
|
Total
|
$
|
4,401
|
|
$
|
3,718
|
|
$
|
304
|
|
$
|
8,423
|
|
||||
|
Recurring Nature of Revenue Recognized:
|
||||||||||||||||
|
Recurring fees
|
$
|
3,890
|
|
$
|
2,718
|
|
$
|
278
|
|
$
|
6,886
|
|
||||
|
Non-recurring fees
|
511
|
|
1,000
|
|
26
|
|
1,537
|
|
||||||||
|
Total
|
$
|
4,401
|
|
$
|
3,718
|
|
$
|
304
|
|
$
|
8,423
|
|
||||
69
FIDELITY NATIONAL INFORMATION SERVICES, INC.
AND SUBSIDIARIES
NOTES TO CONSOLIDATED FINANCIAL STATEMENTS - (Continued)
For the year ended December 31, 2017 (in millions):
|
Reportable Segments
|
||||||||||||||||
|
Corporate
|
||||||||||||||||
|
IFS
|
GFS
|
and Other
|
Total
|
|||||||||||||
|
Primary Geographical Markets:
|
||||||||||||||||
|
North America
|
$
|
4,091
|
|
$
|
1,899
|
|
$
|
306
|
|
$
|
6,296
|
|
||||
|
All others
|
169
|
|
2,151
|
|
52
|
|
2,372
|
|
||||||||
|
Total
|
$
|
4,260
|
|
$
|
4,050
|
|
$
|
358
|
|
$
|
8,668
|
|
||||
|
Type of Revenue:
|
||||||||||||||||
|
Processing and services
|
$
|
3,433
|
|
$
|
2,206
|
|
$
|
320
|
|
$
|
5,959
|
|
||||
|
License and software related
|
402
|
|
957
|
|
14
|
|
1,373
|
|
||||||||
|
Professional services
|
195
|
|
896
|
|
13
|
|
1,104
|
|
||||||||
|
Hardware and other
|
230
|
|
(9
|
)
|
11
|
|
232
|
|
||||||||
|
Total
|
$
|
4,260
|
|
$
|
4,050
|
|
$
|
358
|
|
$
|
8,668
|
|
||||
|
Recurring Nature of Revenue Recognized:
|
||||||||||||||||
|
Recurring fees
|
$
|
3,704
|
|
$
|
2,809
|
|
$
|
330
|
|
$
|
6,843
|
|
||||
|
Non-recurring fees
|
556
|
|
1,241
|
|
28
|
|
1,825
|
|
||||||||
|
Total
|
$
|
4,260
|
|
$
|
4,050
|
|
$
|
358
|
|
$
|
8,668
|
|
||||
70
FIDELITY NATIONAL INFORMATION SERVICES, INC.
AND SUBSIDIARIES
NOTES TO CONSOLIDATED FINANCIAL STATEMENTS - (Continued)
For the year ended December 31, 2016 (in millions):
|
Reportable Segments
|
||||||||||||||||
|
Corporate
|
||||||||||||||||
|
IFS
|
GFS
|
and Other
|
Total
|
|||||||||||||
|
Primary Geographical Markets:
|
||||||||||||||||
|
North America
|
$
|
4,022
|
|
$
|
1,889
|
|
$
|
370
|
|
$
|
6,281
|
|
||||
|
All others
|
156
|
|
2,294
|
|
100
|
|
2,550
|
|
||||||||
|
Total
|
$
|
4,178
|
|
$
|
4,183
|
|
$
|
470
|
|
$
|
8,831
|
|
||||
|
Type of Revenue:
|
||||||||||||||||
|
Processing and services
|
$
|
3,288
|
|
$
|
2,163
|
|
$
|
246
|
|
$
|
5,697
|
|
||||
|
License and software related
|
387
|
|
941
|
|
150
|
|
1,478
|
|
||||||||
|
Professional services
|
286
|
|
1,080
|
|
57
|
|
1,423
|
|
||||||||
|
Hardware and other
|
217
|
|
(1
|
)
|
17
|
|
233
|
|
||||||||
|
Total
|
$
|
4,178
|
|
$
|
4,183
|
|
$
|
470
|
|
$
|
8,831
|
|
||||
|
Recurring Nature of Revenue Recognized:
|
||||||||||||||||
|
Recurring fees
|
$
|
3,584
|
|
$
|
2,778
|
|
$
|
377
|
|
$
|
6,739
|
|
||||
|
Non-recurring fees
|
594
|
|
1,405
|
|
93
|
|
2,092
|
|
||||||||
|
Total
|
$
|
4,178
|
|
$
|
4,183
|
|
$
|
470
|
|
$
|
8,831
|
|
||||
Contract Balances
The following table provides information about trade receivables, contract assets, and deferred revenues from contracts with customers (in millions).
|
As of December 31,
|
||||||||||||
|
2018
|
2017
|
2016
|
||||||||||
|
Trade receivables, net
|
$
|
1,472
|
|
$
|
1,624
|
|
$
|
1,550
|
|
|||
|
Contract assets (current)
|
123
|
|
108
|
|
168
|
|
||||||
|
Contract assets (non-current), included in other noncurrent assets
|
91
|
|
118
|
|
135
|
|
||||||
|
Deferred revenue (current)
|
739
|
|
776
|
|
741
|
|
||||||
|
Deferred revenue (non-current)
|
67
|
|
106
|
|
58
|
|
||||||
The payment terms and conditions in our customer contracts may vary. In some cases, customers pay in advance of our delivery of solutions or services; in other cases, payment is due as services are performed or in arrears following the delivery of the solutions or services. Differences in timing between revenue recognition and invoicing result in accrued trade receivables, contract assets, or deferred revenue on our Consolidated Balance Sheets. Receivables are accrued when revenue is recognized prior to invoicing but the right to payment is unconditional (i.e., only the passage of time is required). This occurs most commonly when software term licenses recognized at a point in time are paid for periodically over the license term. Contract assets result when amounts allocated to distinct performance obligations are recognized when or as control of a solution or service is transferred to the customer but invoicing is contingent on performance of other performance obligations or on completion of contractual milestones. Contract assets are transferred to receivables when the rights become unconditional, typically upon invoicing of the related performance obligations in the contract or upon achieving the requisite project milestone. Deferred revenue results from customer payments in advance of our satisfaction of the associated performance obligation(s) and relates primarily to prepaid maintenance or other recurring services. Deferred revenue is relieved as revenue is recognized. Contract assets and deferred revenue are reported on a contract-by-contract basis at the end of each reporting
71
FIDELITY NATIONAL INFORMATION SERVICES, INC.
AND SUBSIDIARIES
NOTES TO CONSOLIDATED FINANCIAL STATEMENTS - (Continued)
period. Changes in the contract assets and deferred revenue balances for the years ended
December 31, 2018
and
2017
were not materially impacted by any factors other than those described above, aside from the disposition of the Public Sector and Education ("PS&E") business, which reduced the December 31, 2017 contract asset balance by
$2 million
and the deferred revenue balance by
$105 million
.
The Company recognized revenue of
$740 million
,
$741 million
and
$718 million
, during the years ended
December 31, 2018
,
2017
and
2016
, respectively, that was included in the corresponding deferred revenue balance at the beginning of the period.
During the years ended
December 31, 2018
,
2017
and
2016
, respectively, amounts recognized from performance obligations satisfied (or partially satisfied) in prior periods were insignificant.
Transaction Price Allocated to the Remaining Performance Obligations
As of
December 31, 2018
, approximately
$20.5 billion
of revenue is estimated to be recognized in the future from the Company’s remaining unfulfilled performance obligations, which are primarily comprised of recurring account- and volume-based processing services. This excludes the amount of anticipated recurring renewals not yet contractually obligated. The Company expects to recognize approximately
35%
of our remaining performance obligations over the next 12 months, approximately another
25%
over the next 13 to 24 months, and the balance thereafter.
(4)
Property and Equipment
Property and equipment as of
December 31, 2018
and
2017
consists of the following (in millions):
|
|
2018
|
2017
|
|||||
|
Land
|
$
|
31
|
|
$
|
31
|
|
|
|
Buildings
|
235
|
|
228
|
|
|||
|
Leasehold improvements
|
135
|
|
158
|
|
|||
|
Computer equipment
|
1,047
|
|
1,073
|
|
|||
|
Furniture, fixtures, and other equipment
|
197
|
|
167
|
|
|||
|
|
1,645
|
|
1,657
|
|
|||
|
Accumulated depreciation and amortization
|
(1,058
|
)
|
(1,047
|
)
|
|||
|
Total property and equipment, net
|
$
|
587
|
|
$
|
610
|
|
|
During the years ended
December 31, 2018
and
2017
, the Company entered into capital lease and other financing obligations of
$91 million
and
$84 million
, respectively, for certain computer hardware and software. The assets are included in property and equipment and computer software and the remaining capital lease and other financing obligations are classified as long-term debt on our Consolidated Balance Sheets. Periodic payments are included in repayment of borrowings on the Consolidated Statements of Cash Flows.
Depreciation and amortization expense on property and equipment, including that recorded under capital leases, amounted to
$184 million
,
$180 million
and
$185 million
for the years ended
December 31, 2018
,
2017
and
2016
, respectively.
72
FIDELITY NATIONAL INFORMATION SERVICES, INC.
AND SUBSIDIARIES
NOTES TO CONSOLIDATED FINANCIAL STATEMENTS - (Continued)
(5)
Goodwill
Changes in goodwill during the years ended
December 31, 2018
and
2017
are summarized as follows (in millions):
|
|
IFS
|
GFS
|
Corporate & Other
|
Total
|
|||||||||||
|
Balance, December 31, 2016
|
$
|
7,676
|
|
$
|
6,332
|
|
$
|
170
|
|
$
|
14,178
|
|
|||
|
Goodwill distributed through sale of businesses
|
(14
|
)
|
(473
|
)
|
—
|
|
(487
|
)
|
|||||||
|
Foreign currency adjustments
|
—
|
|
39
|
|
—
|
|
39
|
|
|||||||
|
Balance, December 31, 2017
|
7,662
|
|
5,898
|
|
170
|
|
13,730
|
|
|||||||
|
Goodwill distributed through sale of businesses
|
(14
|
)
|
(24
|
)
|
(43
|
)
|
(81
|
)
|
|||||||
|
Brazilian Venture impairment
|
—
|
|
(25
|
)
|
—
|
|
(25
|
)
|
|||||||
|
Foreign currency adjustments
|
—
|
|
(79
|
)
|
—
|
|
(79
|
)
|
|||||||
|
Balance, December 31, 2018
|
$
|
7,648
|
|
$
|
5,770
|
|
$
|
127
|
|
$
|
13,545
|
|
|||
During 2017, foreign currency adjustments includes an immaterial prior period adjustment related to the allocation of goodwill to the appropriate foreign currency at the time of multi-currency entity acquisitions, with the related offset to accumulated other comprehensive earnings (loss).
Effective August 31, 2018, FIS sold substantially all the assets of the Certegy Check Services business unit in North America, resulting in a pre-tax loss of
$54 million
, including goodwill distributed through the sale of business of
$43 million
.
(6)
Intangible Assets
Intangible assets as of
December 31, 2018
consist of the following (in millions):
|
|
Cost
|
Accumulated
Amortization
|
Net
|
||||||||
|
Customer relationships and other
|
$
|
6,011
|
|
$
|
(2,944
|
)
|
$
|
3,067
|
|
||
|
Finite-lived trademarks
|
68
|
|
(46
|
)
|
22
|
|
|||||
|
Indefinite-lived trademarks
|
43
|
|
—
|
|
43
|
|
|||||
|
Total intangible assets, net
|
$
|
6,122
|
|
$
|
(2,990
|
)
|
$
|
3,132
|
|
||
Intangible assets as of
December 31, 2017
consist of the following (in millions):
|
|
Cost
|
Accumulated
Amortization
|
Net
|
||||||||
|
Customer relationships and other
|
$
|
6,220
|
|
$
|
(2,427
|
)
|
$
|
3,793
|
|
||
|
Finite-lived trademarks
|
101
|
|
(57
|
)
|
44
|
|
|||||
|
Indefinite-lived trademarks
|
48
|
|
—
|
|
48
|
|
|||||
|
Total intangible assets, net
|
$
|
6,369
|
|
$
|
(2,484
|
)
|
$
|
3,885
|
|
||
Amortization expense for intangible assets with finite lives, including the contract intangible in our Brazilian Venture, which was amortized as a reduction of revenue until impaired (see Note 16), was
$659 million
,
$670 million
and
$518 million
for the years ended
December 31, 2018
,
2017
and
2016
, respectively.
73
FIDELITY NATIONAL INFORMATION SERVICES, INC.
AND SUBSIDIARIES
NOTES TO CONSOLIDATED FINANCIAL STATEMENTS - (Continued)
Estimated amortization of intangible assets for the next five years is as follows (in millions):
|
2019
|
$
|
626
|
|
|
2020
|
458
|
|
|
|
2021
|
443
|
|
|
|
2022
|
426
|
|
|
|
2023
|
405
|
|
|
|
(7)
|
Computer Software
|
Computer software as of
December 31, 2018
and
2017
consists of the following (in millions):
|
|
2018
|
2017
|
|||||
|
Software from business acquisitions
|
$
|
1,116
|
|
$
|
1,130
|
|
|
|
Capitalized software development costs
|
1,624
|
|
1,422
|
|
|||
|
Purchased software
|
363
|
|
310
|
|
|||
|
Computer software
|
3,103
|
|
2,862
|
|
|||
|
Accumulated amortization
|
(1,308
|
)
|
(1,134
|
)
|
|||
|
Total computer software, net
|
$
|
1,795
|
|
$
|
1,728
|
|
|
Amortization expense for computer software was
$468 million
,
$436 million
and
$396 million
for the years ended
December 31, 2018
,
2017
and
2016
, respectively.
(8)
Deferred Contract Costs
Origination and fulfillment costs from contracts with customers capitalized as of
December 31, 2018
and
2017
consists of the following (in millions):
|
|
2018
|
2017
|
|||||
|
Contract costs on implementations in progress
|
$
|
93
|
|
$
|
104
|
|
|
|
Incremental contract origination costs on completed implementations, net
|
219
|
|
127
|
|
|||
|
Contract fulfillment costs on completed implementations, net
|
163
|
|
123
|
|
|||
|
Total deferred contract costs, net
|
$
|
475
|
|
$
|
354
|
|
|
For the years ended
December 31, 2018
,
2017
and
2016
, amortization of deferred contract costs on completed amortizations was
$123 million
,
$102 million
and
$71 million
.
(9)
Accounts Payable and Accrued Liabilities
Accounts payable and accrued liabilities as of
December 31, 2018
and
2017
consists of the following (in millions):
|
|
2018
|
2017
|
|||||
|
Salaries and incentives
|
$
|
218
|
|
$
|
265
|
|
|
|
Accrued benefits and payroll taxes
|
66
|
|
71
|
|
|||
|
Trade accounts payable and other accrued liabilities
|
687
|
|
776
|
|
|||
|
Accrued interest payable
|
71
|
|
70
|
|
|||
|
Taxes other than income tax
|
57
|
|
59
|
|
|||
|
Total accounts payable and accrued liabilities
|
$
|
1,099
|
|
$
|
1,241
|
|
|
74
FIDELITY NATIONAL INFORMATION SERVICES, INC.
AND SUBSIDIARIES
NOTES TO CONSOLIDATED FINANCIAL STATEMENTS - (Continued)
(10)
Debt
Long-term debt as of
December 31, 2018
and
2017
consists of the following (in millions):
|
2018
|
2017
|
||||||
|
Senior Notes due April 2018, interest payable semi-annually at 2.000% (1)
|
$
|
—
|
|
$
|
250
|
|
|
|
Senior Notes due October 2018, interest payable semi-annually at 2.850%
|
—
|
|
750
|
|
|||
|
Senior Notes due October 2020, interest payable semi-annually at 3.625% ("2020 Notes")
|
1,150
|
|
1,150
|
|
|||
|
Senior Euro Notes due January 2021, interest payable annually at 0.400% ("2021 Euro Notes")
|
572
|
|
599
|
|
|||
|
Senior Notes due August 2021, interest payable semi-annually at 2.250% ("2021 Notes")
|
750
|
|
750
|
|
|||
|
Senior GBP Notes due June 2022, interest payable annually at 1.700% ("2022 GBP Notes")
|
382
|
|
405
|
|
|||
|
Senior Notes due October 2022, interest payable semi-annually at 4.500% ("2022 Notes")
|
300
|
|
300
|
|
|||
|
Senior Notes due April 2023, interest payable semi-annually at 3.500% ("2023 Notes")
|
700
|
|
700
|
|
|||
|
Senior Notes due June 2024, interest payable semi-annually at 3.875% ("2024 Notes")
|
400
|
|
400
|
|
|||
|
Senior Euro Notes due July 2024, interest payable annually at 1.100% ("2024 Euro Notes")
|
572
|
|
599
|
|
|||
|
Senior Notes due October 2025, interest payable semi-annually at 5.000% ("2025 Notes")
|
900
|
|
900
|
|
|||
|
Senior Notes due August 2026, interest payable semi-annually at 3.000% ("2026 Notes")
|
1,250
|
|
1,250
|
|
|||
|
Senior Notes due May 2028, interest payable semi-annually at 4.250% ("2028 Notes")
|
400
|
|
—
|
|
|||
|
Senior Notes due August 2046, interest payable semi-annually at 4.500% ("2046 Notes")
|
500
|
|
500
|
|
|||
|
Senior Notes due May 2048, interest payable semi-annually at 4.750% ("2048 Notes")
|
600
|
|
—
|
|
|||
|
Revolving Credit Facility (2)
|
208
|
|
195
|
|
|||
|
Other
|
34
|
|
15
|
|
|||
|
|
8,718
|
|
8,763
|
|
|||
|
Current portion of long-term debt
|
(48
|
)
|
(1,045
|
)
|
|||
|
Long-term debt, excluding current portion
|
$
|
8,670
|
|
$
|
7,718
|
|
|
__________________________________________
|
(1)
|
These Senior Notes were repaid on April 13, 2018 with borrowings on the Revolving Credit Facility.
|
|
(2)
|
Interest on the Revolving Credit Facility is generally payable at LIBOR plus an applicable margin of up to
1.625%
plus an unused commitment fee of up to
0.225%
, each based upon the Company's corporate credit ratings. As of
December 31, 2018
, the weighted-average interest rate on the Revolving Credit Facility, excluding fees, was
3.65%
.
|
On December 21, 2018, FIS entered into an interest rate swap that effectively converted the 2024 Euro Notes from a fixed-rate to a floating rate debt obligation. This derivative instrument was designated as a fair value hedge of the debt obligation. The fair value of the interest rate swap was
$1 million
at
December 31, 2018
, recorded as a decrease in the hedged debt balance.
On September 21, 2018, FIS established a U.S. commercial paper program (the "Commercial Paper Program") for the issuance and sale of senior, unsecured commercial paper notes (the “Notes”), up to a maximum aggregate amount outstanding at any time of
$4 billion
. The Notes have maturities of up to
397
days from the date of issue. The proceeds of the Notes are expected to be used for general corporate purposes. As of December 31, 2018, the outstanding principal balance of the Commercial Paper Program was
$250 million
with a weighted-average rate of
2.91%
recorded as short-term borrowings on the Consolidated Balance Sheet.
On September 21, 2018, FIS entered into a Seventh Amendment and Restatement Agreement ("Credit Facility Agreement"), which amends and restates FIS' existing credit agreement (as amended, the "Restated Credit Agreement"). The Credit Facility Agreement increases the revolving credit commitments outstanding under the Revolving Credit Facility ("Revolving Credit Facility") existing under the Restated Credit Agreement from
$3 billion
to
$4 billion
and extends the term of the Restated Credit Agreement to September 21, 2023. Borrowing under the Revolving Credit Facility will be used for general corporate purposes, including backstopping any Notes that FIS may issue under the Commercial Paper Program described above. As of
December 31, 2018
, the outstanding principal balance of the Revolving Credit Facility was
$208
75
FIDELITY NATIONAL INFORMATION SERVICES, INC.
AND SUBSIDIARIES
NOTES TO CONSOLIDATED FINANCIAL STATEMENTS - (Continued)
million
, with
$3,786 million
of borrowing capacity remaining thereunder (net of
$6 million
in outstanding letters of credit issued under the Revolving Credit Facility).
The obligations of FIS under the Revolving Credit Facility, Commercial Paper Program and under all of its outstanding senior notes rank equal in priority and are unsecured. The Revolving Credit Facility and the senior notes are subject to customary covenants, including, among others, limitations under the Revolving Credit Facility on the payment of dividends by FIS, and customary events of default.
On June 15, 2018, FIS redeemed
100%
of the outstanding aggregate principal amount of its
$750 million
2.850%
Senior Notes due October 2018. As a result of the redemption, FIS incurred a pre-tax charge of approximately
$1 million
consisting of the call premium and the write-off of previously capitalized debt issuance costs.
On May 16, 2018, FIS issued
$1,000 million
principal amount of new senior notes, including
$400 million
of Senior Notes due in 2028 that bear interest at
4.250%
and
$600 million
of Senior Notes due in 2048 that bear interest at
4.750%
. Net proceeds from the offering, after deducting discounts and underwriting fees, were
$979 million
. FIS used the proceeds to partially repay its Revolving Credit Facility.
On July 25, 2017, pursuant to cash tender offers ("Tender Offers"), FIS repurchased approximately
$2,000 million
in aggregate principal of amount of debt securities with a weighted average coupon of approximately
4.0%
. The following approximate amounts of FIS's debt securities were repurchased:
$600 million
of its
3.625%
notes due 2020,
$600 million
of its
5.000%
notes due 2025,
$200 million
of its
4.500%
notes due 2022,
$300 million
of its
3.875%
notes due 2024 and
$300 million
of its
3.500%
notes due 2023. The Company funded the Tender Offers with proceeds from the European bond offering and borrowings on its Revolving Credit Facility, approximately
$469 million
of which were almost immediately repaid with proceeds from the sale of a majority ownership stake in the Capco consulting business and risk and compliance consulting business, which was completed on July 31, 2017 (see Note 16). FIS paid approximately
$150 million
in tender premiums to par to purchase the notes in the Tender Offers and incurred a pre-tax charge upon extinguishment of approximately
$171 million
, in tender premiums, the write-off of previously capitalized debt issue costs and other direct costs.
On July 10, 2017, FIS issued
€1,000 million
and
£300 million
principal amount of senior notes in an inaugural European bond offering. The senior notes include
€500 million
of Senior Notes due in 2021 that bear interest at
0.400%
,
£300 million
of Senior Notes due in 2022 that bear interest at
1.700%
and
€500 million
of Senior Notes due in 2024 that bear interest at
1.100%
. Net proceeds from the offering, after deducting discounts and underwriting fees, were
$1,491 million
using a conversion rate of
1.12
EUR/USD and
1.27
GBP/USD.
On March 15, 2017, FIS redeemed
100%
of the outstanding aggregate principal amount of its
$700 million
5.000%
Senior Notes due March 2022 (the "March 2022 Notes"). On February 1, 2017, the Company also paid down the outstanding balance on the syndicated term loan agreement ("2018 Term Loans"). The redemption of the March 2022 Notes and the repayment of the 2018 Term Loans were funded by borrowings under the Revolving Credit Facility and cash proceeds from the sale of the PS&E business. As a result of the redemption of the March 2022 Notes and the repayment of the 2018 Term Loans, FIS incurred a pre-tax charge of approximately
$25 million
consisting of the call premium on the March 2022 Notes and the write-off of previously capitalized debt issuance costs.
The following summarizes the aggregate maturities of our long-term debt, capital leases, and other financing obligations based on stated contractual maturities, excluding net unamortized non-cash bond premiums and discounts of
$40 million
as of
December 31, 2018
(in millions):
76
FIDELITY NATIONAL INFORMATION SERVICES, INC.
AND SUBSIDIARIES
NOTES TO CONSOLIDATED FINANCIAL STATEMENTS - (Continued)
|
Total
|
|||
|
2019
|
$
|
48
|
|
|
2020
|
1,193
|
|
|
|
2021
|
1,363
|
|
|
|
2022
|
682
|
|
|
|
2023
|
908
|
|
|
|
Thereafter
|
4,622
|
|
|
|
Total principal payments
|
8,816
|
|
|
|
Debt issuance costs, net of accumulated amortization
|
(58
|
)
|
|
|
Total long-term debt
|
$
|
8,758
|
|
There are no mandatory principal payments on the Revolving Credit Facility and any balance outstanding on the Revolving Credit Facility will be due and payable at its scheduled maturity date, which occurs at September 21, 2023.
FIS may redeem the 2020 Notes, 2021 Euro Notes, 2021 Notes, 2022 GBP Notes, 2022 Notes, 2023 Notes, 2024 Notes, 2024 Euro Notes, 2025 Notes, 2026 Notes, 2028 Notes, 2046 Notes and 2048 Notes at its option in whole or in part, at any time and from time to time, at a redemption price equal to the greater of
100%
of the principal amount to be redeemed and a make-whole amount calculated as described in the related indenture in each case plus accrued and unpaid interest to, but excluding, the date of redemption, provided no make-whole amount will be paid for redemptions of the 2020 Notes, the 2021 Notes, the 2021 Euro Notes and the 2022 GBP Notes during the one month prior to their maturity, the 2022 Notes during the two months prior to their maturity, the 2023 Notes, the 2024 Notes, the 2024 Euro Notes, the 2025 Notes, the 2026 Notes and the 2028 Notes during the three months prior to their maturity, and the 2046 Notes and 2048 Notes during the six months prior to their maturity.
Debt issuance costs of
$58 million
, net of accumulated amortization, remain capitalized as of
December 31, 2018
, related to all of the above outstanding debt.
We monitor the financial stability of our counterparties on an ongoing basis. The lender commitments under the undrawn portions of the Revolving Credit Facility are comprised of a diversified set of financial institutions, both domestic and international. The failure of any single lender to perform its obligations under the Revolving Credit Facility would not adversely impact our ability to fund operations.
(11)
Financial Instruments
As of December 31, 2018 and 2017, we had no significant forward contracts.
Fair Value Hedge
During the fourth quarter of 2018, the Company entered into an interest rate swap with a
€500 million
notional value converting the interest rate exposure on the Company's 2024 Euro Notes from fixed to variable. We designated this interest rate swap as a fair value hedge for accounting purposes. The fair value of the interest rate swap was a
$1 million
liability at
December 31, 2018
, recorded as a decrease in the hedged debt balance (see Note 10).
Cash Flow Hedges
Interest rate swaps designated as cash flow hedges with aggregate notional amounts of
$500 million
and
$1,250 million
were terminated as of December 31, 2017 and 2016, respectively. As a result, FIS recognized approximately
$1 million
and
$2 million
before tax loss due to the release of fair value changes from other comprehensive earnings during the years ended December 31, 2017 and 2016, respectively. As of December 31, 2018 and 2017, we had no outstanding cash flow hedges.
The amount of gain (loss) recognized in accumulated other comprehensive earnings related to interest rate swap cash flow hedges was
$0 million
,
$0 million
and
$(7) million
during the years ended
December 31, 2018
,
2017
and
2016
, respectively.
77
FIDELITY NATIONAL INFORMATION SERVICES, INC.
AND SUBSIDIARIES
NOTES TO CONSOLIDATED FINANCIAL STATEMENTS - (Continued)
The amount of gain (loss) reclassified from accumulated other comprehensive earnings into income was
$(1) million
,
$(1) million
and
$(9) million
during the years ended
December 31, 2018
,
2017
and
2016
, respectively.
Net Investment Hedges
During the fourth quarter of 2018, the Company entered into cross-currency interest rate swaps with an aggregate notional amount of
$716 million
, which were designated as net investment hedges of its investment in Euro and GBP denominated operations. The fair value of the cross-currency interest rate swaps was a
$2 million
asset at
December 31, 2018
.
During the third quarter of 2017, the Company designated its Euro-denominated Senior Notes due 2021 (
€500 million
) and Senior Notes due 2024 (
€500 million
) and GBP-denominated Senior Notes due 2022 (
£300 million
) as net investment hedges of its investment in Euro and GBP denominated operations, respectively.
The purpose of the Company's net investment hedges is to reduce the volatility of FIS' net investment value in its Euro- and GBP-denominated operations due to changes in foreign currency exchange rates.
During the years ended
December 31, 2018
and
2017
, net investment hedge aggregate gain (loss) of
$59 million
and
$(63) million
, net of tax, respectively, for the change in fair value was recorded in other comprehensive income as a component of foreign currency translation adjustments. No ineffectiveness was recorded on the net investment hedges.
(12)
Income Taxes
Income tax expense (benefit) attributable to continuing operations for the years ended
December 31, 2018
,
2017
and
2016
consists of the following (in millions):
|
|
2018
|
2017
|
2016
|
||||||||
|
Current provision:
|
|
|
|
|
|
|
|||||
|
Federal
|
$
|
169
|
|
$
|
476
|
|
$
|
308
|
|
||
|
State
|
50
|
|
81
|
|
54
|
|
|||||
|
Foreign
|
105
|
|
127
|
|
131
|
|
|||||
|
Total current provision
|
$
|
324
|
|
$
|
684
|
|
$
|
493
|
|
||
|
Deferred provision (benefit):
|
|
|
|
|
|
|
|||||
|
Federal
|
$
|
(95
|
)
|
$
|
(979
|
)
|
$
|
(171
|
)
|
||
|
State
|
(11
|
)
|
(24
|
)
|
(14
|
)
|
|||||
|
Foreign
|
(10
|
)
|
(2
|
)
|
(17
|
)
|
|||||
|
Total deferred provision
|
(116
|
)
|
(1,005
|
)
|
(202
|
)
|
|||||
|
Total provision for income taxes
|
$
|
208
|
|
$
|
(321
|
)
|
$
|
291
|
|
||
The provision for income taxes is based on pre-tax income from continuing operations, which is as follows for the years ended
December 31, 2018
,
2017
and
2016
(in millions):
|
|
2018
|
2017
|
2016
|
||||||||
|
United States
|
$
|
744
|
|
$
|
530
|
|
$
|
503
|
|
||
|
Foreign
|
360
|
|
446
|
|
334
|
|
|||||
|
Total
|
$
|
1,104
|
|
$
|
976
|
|
$
|
837
|
|
||
78
FIDELITY NATIONAL INFORMATION SERVICES, INC.
AND SUBSIDIARIES
NOTES TO CONSOLIDATED FINANCIAL STATEMENTS - (Continued)
Total income tax expense for the years ended
December 31, 2018
,
2017
and
2016
is allocated as follows (in millions):
|
|
2018
|
2017
|
2016
|
||||||||
|
Tax expense (benefit) per statement of earnings
|
$
|
208
|
|
$
|
(321
|
)
|
$
|
291
|
|
||
|
Tax expense (benefit) attributable to discontinued operations
|
(1
|
)
|
—
|
|
1
|
|
|||||
|
Unrealized (loss) gain on foreign currency translation
|
—
|
|
—
|
|
30
|
|
|||||
|
Other components of other comprehensive income
|
1
|
|
(11
|
)
|
1
|
|
|||||
|
Total income tax expense (benefit) allocated to other comprehensive income
|
1
|
|
(11
|
)
|
31
|
|
|||||
|
Tax benefit from exercise of stock options
|
—
|
|
—
|
|
(32
|
)
|
|||||
|
Total income tax expense (benefit)
|
$
|
208
|
|
$
|
(332
|
)
|
$
|
291
|
|
||
A reconciliation of the federal statutory income tax rate to the Company’s effective income tax rate for the years ended
December 31, 2018
,
2017
and
2016
is as follows:
|
|
2018
|
2017
|
2016
|
|||||
|
Federal statutory income tax rate
|
21.0
|
%
|
35.0
|
%
|
35.0
|
%
|
||
|
State income taxes
|
3.0
|
|
2.4
|
|
2.9
|
|
||
|
Federal benefit of state taxes
|
(0.6
|
)
|
(0.8
|
)
|
(1.0
|
)
|
||
|
Foreign rate differential
|
—
|
|
(5.1
|
)
|
(3.1
|
)
|
||
|
Tax benefit from stock-based compensation
|
(5.2
|
)
|
(6.7
|
)
|
—
|
|
||
|
Book basis in excess of tax basis for dispositions
|
3.0
|
|
18.5
|
|
—
|
|
||
|
Tax Cuts and Jobs Act of 2017
|
—
|
|
(73.1
|
)
|
—
|
|
||
|
Foreign-derived intangible income deduction
|
(1.8
|
)
|
—
|
|
—
|
|
||
|
Other
|
(0.6
|
)
|
(3.1
|
)
|
1.0
|
|
||
|
Effective income tax rate
|
18.8
|
%
|
(32.9
|
)%
|
34.8
|
%
|
||
The significant components of deferred income tax assets and liabilities as of
December 31, 2018
and
2017
consist of the following (in millions):
|
|
2018
|
2017
|
|||||
|
Deferred income tax assets:
|
|
|
|
|
|||
|
Net operating loss carryforwards
|
$
|
108
|
|
$
|
130
|
|
|
|
Employee benefit accruals
|
58
|
|
69
|
|
|||
|
Other deferred tax assets
|
105
|
|
128
|
|
|||
|
Total gross deferred income tax assets
|
271
|
|
327
|
|
|||
|
Less valuation allowance
|
(116
|
)
|
(129
|
)
|
|||
|
Total deferred income tax assets
|
155
|
|
198
|
|
|||
|
Deferred income tax liabilities:
|
|
|
|
|
|||
|
Amortization of goodwill and intangible assets
|
1,291
|
|
1,452
|
|
|||
|
Deferred contract costs
|
109
|
|
94
|
|
|||
|
Other deferred tax liabilities
|
83
|
|
90
|
|
|||
|
Total deferred income tax liabilities
|
1,483
|
|
1,636
|
|
|||
|
Net deferred income tax liability
|
$
|
1,328
|
|
$
|
1,438
|
|
|
79
FIDELITY NATIONAL INFORMATION SERVICES, INC.
AND SUBSIDIARIES
NOTES TO CONSOLIDATED FINANCIAL STATEMENTS - (Continued)
Deferred income taxes are classified in the Consolidated Balance Sheets as of
December 31, 2018
and
2017
as follows (in millions):
|
|
2018
|
2017
|
|||||
|
Noncurrent assets (included in other noncurrent assets)
|
$
|
32
|
|
$
|
30
|
|
|
|
Total deferred income tax assets
|
32
|
|
30
|
|
|||
|
Noncurrent liabilities
|
(1,360
|
)
|
(1,468
|
)
|
|||
|
Total deferred income tax liabilities
|
(1,360
|
)
|
(1,468
|
)
|
|||
|
Net deferred income tax liability
|
$
|
(1,328
|
)
|
$
|
(1,438
|
)
|
|
We believe that based on our historical pattern of taxable income, projections of future income, tax planning strategies and other relevant evidence, the Company will produce sufficient income in the future to realize its deferred income tax assets. A valuation allowance is established for any portion of a deferred income tax asset for which we believe it is more likely than not that the Company will not be able to realize the benefits of all or a portion of that deferred income tax asset. We also receive periodic assessments from taxing authorities challenging our positions that must be taken into consideration in determining our tax accruals. Resolving these assessments, which may or may not result in additional taxes due, may require an extended period of time. Adjustments to the valuation allowance will be made if there is a change in our assessment of the amount of deferred income tax asset that is realizable.
As of
December 31, 2018
and
2017
, the Company had net income taxes receivable (payable) of
$30 million
and
$(141) million
, respectively. These amounts are included in other receivables and other long-term liabilities as of
December 31, 2018
and accounts payable and accrued liabilities and other long-term liabilities as of
December 31, 2017
, in the Consolidated Balance Sheets.
As of
December 31, 2018
and
2017
, the Company has federal, state and foreign net operating loss carryforwards resulting in deferred tax assets of
$108 million
and
$130 million
, respectively. The federal and state net operating losses result in deferred tax assets as of
December 31, 2018
and
2017
of
$42 million
and
$44 million
, respectively, which expire between 2020 and 2038. The Company has a valuation allowance related to these deferred tax assets for net operating loss carryforwards in the amounts of
$36 million
and
$37 million
as of
December 31, 2018
and
2017
. The Company has foreign net operating loss carryforwards resulting in deferred tax assets as of
December 31, 2018
and
2017
of
$66 million
and
$86 million
, respectively. The Company has a full valuation allowance against the net operating losses as of
December 31, 2018
and
December 31, 2017
. As of
December 31, 2018
and
2017
, the Company had foreign tax credit carryforwards of
$0 million
and
$3 million
, respectively.
The Company participates in the IRS' Compliance Assurance Process ("CAP"), which is a real-time continuous audit. The IRS has completed its review for years through 2016. Currently, we believe the ultimate resolution of the IRS examinations will not result in a material adverse effect to the Company's financial position or results of operations. Substantially all material foreign income tax return matters have been concluded through 2011. Substantially all state income tax returns have been concluded through 2011.
As of
December 31, 2018
and
2017
, the Company had gross unrecognized tax benefits of
$61 million
and
$75 million
of which
$52 million
and
$56 million
would favorably impact our income tax rate in the event that the unrecognized tax benefits are recognized.
80
FIDELITY NATIONAL INFORMATION SERVICES, INC.
AND SUBSIDIARIES
NOTES TO CONSOLIDATED FINANCIAL STATEMENTS - (Continued)
The following table reconciles the gross amounts of unrecognized tax benefits at the beginning and end of the period (in millions):
|
|
Gross Amount
|
||
|
Amounts of unrecognized tax benefits as of January 1, 2017
|
$
|
87
|
|
|
Amount of decreases due to lapse of the applicable statute of limitations
|
(12
|
)
|
|
|
Amount of decreases due to settlements
|
(19
|
)
|
|
|
Increases as a result of tax positions taken in the current period
|
5
|
|
|
|
Increases as a result of tax positions taken in a prior period
|
14
|
|
|
|
Amount of unrecognized tax benefit as of December 31, 2017
|
75
|
|
|
|
Amount of decreases due to lapse of the applicable statute of limitations
|
(4
|
)
|
|
|
Amount of decreases due to settlements
|
(12
|
)
|
|
|
Increases as a result of tax positions taken in the current period
|
1
|
|
|
|
Increases as a result of tax positions taken in a prior period
|
1
|
|
|
|
Amount of unrecognized tax benefit as of December 31, 2018
|
$
|
61
|
|
The total amount of interest expense recognized in the Consolidated Statements of Earnings for unpaid taxes is
$4 million
,
$5 million
and
$6 million
for the years ended
December 31, 2018
,
2017
and
2016
, respectively. The total amount of interest and penalties included in the Consolidated Balance Sheets is
$24 million
and
$22 million
as of
December 31, 2018
and
2017
, respectively. Interest and penalties are recorded as a component of income tax expense in the Consolidated Statements of Earnings.
Due to the expiration of various statutes of limitation in the next
12
months, an estimated
$15 million
of gross unrecognized tax benefits may be recognized during that
12
-month period.
On December 22, 2017, H.R. 1, originally known as the Tax Cuts and Jobs Act (the "Act") was signed into law. The Act included significant changes to the Internal Revenue Code. Changes impacting the Company were the decrease in the corporate Federal rate from
35%
to
21%
, the transition to a territorial system of taxation from a worldwide system, and a one-time tax on the deemed repatriation of cumulative foreign earnings and profits. In 2017, the Company recorded provisional amounts for certain enactment-date effects of the Act by applying the guidance in SEC Staff Accounting Bulletin No. 118 ("SAB 118"). At December 31, 2018, the Company has completed the accounting for all of the enactment-date income tax effects of the Act and has confirmed the accuracy of the provisional amounts initially determined.
Due to changes introduced by the Act, the Company provided for U.S. income tax on its deemed repatriation of accumulated foreign earnings in 2017. Those historic earnings are indefinitely reinvested offshore, however, those undistributed earnings could still be subject to additional income tax if repatriated. Due to changes introduced by the Act, and in the absence of final guidance, it is not practicable to determine the unrecognized deferred tax liability on a hypothetical distribution of those earnings.
The Act also includes provisions for Global Low-Taxed Income ("GILTI") that imposes a minimum tax liability on foreign earnings. The Company has made the policy election to account for GILTI as a component of income taxes in the period incurred (the period cost method).
(13)
Commitments and Contingencies
Reliance Trust Claims
Reliance Trust Company ("Reliance"), the Company’s subsidiary, is named as a defendant in a class action arising out of its provision of services as the discretionary trustee for a 401(k) Plan (the "Plan") for one of its customers. Plaintiffs in the action seek damages and attorneys’ fees, as well as equitable relief, on behalf of Plan participants for alleged breaches of fiduciary duty and prohibited transactions under the Employee Retirement Income Security Act of 1974. The action also makes claims against the Plan's sponsor and record-keeper. Reliance is vigorously defending the action and believes that it has meritorious defenses. Pre-trial discovery has now been completed. Reliance contends that no breaches of fiduciary duty or prohibited transactions occurred and that the Plan suffered no damages. Plaintiffs allege damages of approximately
$125 million
. While
81
FIDELITY NATIONAL INFORMATION SERVICES, INC.
AND SUBSIDIARIES
NOTES TO CONSOLIDATED FINANCIAL STATEMENTS - (Continued)
we are unable at this time to estimate more precisely the potential loss or range of loss because of unresolved questions of fact and law, we believe that the ultimate resolution of the matter will not have a material impact on our financial condition. We do not believe a liability for this action is probable and, therefore, have not recorded a liability for this action.
Brazilian Tax Authorities Claims
In 2004, Proservvi Empreendimentos e Servicos, Ltda., the predecessor to Fidelity National Servicos de Tratamento de Documentos e Informatica Ltda. ("Servicos"), a subsidiary of Fidelity National Participacoes Ltda., our former item processing and remittance services operation in Brazil, acquired certain assets and employees and leased certain facilities from the Transpev Group ("Transpev") in Brazil. Transpev’s remaining assets were later acquired by Prosegur, an unrelated third party. When Transpev discontinued its operations after the asset sale to Prosegur, it had unpaid federal taxes and social contributions owing to the Brazilian tax authorities. The Brazilian tax authorities brought a claim against Transpev and beginning in 2012 brought claims against Prosegur and Servicos on the grounds that Prosegur and Servicos were successors in interest to Transpev. To date, the Brazilian tax authorities filed
12
claims against Servicos asserting potential tax liabilities of approximately
$14 million
. There are potentially
25
additional claims against Transpev/Prosegur for which Servicos is named as a co-defendant or may be named, but for which Servicos has not yet been served. These additional claims amount to approximately
$50 million
making the total potential exposure for all
37
claims approximately
$64 million
. We do not believe a liability for these
37
total claims is probable and, therefore, have not recorded a liability for any of these claims.
Acquired Contingencies
FIS and certain of its wholly owned subsidiaries acquired SunGard and SunGard Capital Corp. II (collectively, "SunGard") on November 30, 2015 (the "SunGard acquisition"). As part of the SunGard acquisition, the Company became responsible for certain contingencies that were assumed. The Consolidated Balance Sheet as of December 31, 2018 includes a liability of
$64 million
largely related to tax compliance matters.
Indemnifications and Warranties
The Company generally indemnifies its clients, subject to certain limitations and exceptions, against damages and costs resulting from claims of patent, copyright, or trademark infringement associated solely with its customers' use of the Company's software applications or services. Historically, the Company has not made any material payments under such indemnifications, but continues to monitor the conditions that are subject to the indemnifications to identify whether it is probable that a loss has occurred, and would recognize any such losses when they are estimable. In addition, the Company warrants to customers that its software operates substantially in accordance with the software specifications. Historically, no material costs have been incurred related to software warranties and no accruals for warranty costs have been made.
Leases
The Company leases certain of its property under leases which expire at various dates. Several of these agreements include escalation clauses and provide for renewal options for periods generally ranging from
one
to
five
years.
Future minimum operating lease payments for each of the years in the five years ending December 31, 2023, and thereafter, in the aggregate, are as follows (in millions):
|
2019
|
$
|
121
|
|
|
2020
|
104
|
|
|
|
2021
|
80
|
|
|
|
2022
|
51
|
|
|
|
2023
|
38
|
|
|
|
Thereafter
|
86
|
|
|
|
Total
|
$
|
480
|
|
82
FIDELITY NATIONAL INFORMATION SERVICES, INC.
AND SUBSIDIARIES
NOTES TO CONSOLIDATED FINANCIAL STATEMENTS - (Continued)
Rent expense incurred under all operating leases during the years ended
December 31, 2018
,
2017
and
2016
, was
$147 million
,
$134 million
and
$143 million
, respectively.
See Note 4 for information on the Company's capital lease obligations.
Recent Accounting Guidance Not Yet Adopted
On February 25, 2016, the FASB issued ASU No. 2016-02,
Leases (Topic 842)
, which requires lessees to recognize leases on-balance sheet and disclose key information about leasing arrangements. Topic 842 was subsequently amended by ASU No. 2018-01,
Land Easement Practical Expedient for Transition to Topic 842
; ASU No. 2018-10,
Codification Improvements to Topic 842, Leases
; ASU No. 2018-11,
Targeted Improvements
; and ASU No. 2018-20,
Leases (Topic 842): Narrow-Scope Improvements for Lessors
(collectively, the "new standard"). The new standard establishes a right-of-use model (ROU) that requires a lessee to recognize a ROU asset and lease liability on the balance sheet for all leases with a term longer than 12 months. Leases will be classified as finance or operating, with classification affecting the pattern and classification of expense recognition in the income statement. Under the new standard, lessor accounting is largely unchanged.
The new standard is effective for public business entities on January 1, 2019, with early adoption permitted. A modified retrospective transition approach is required, applying the new standard to all leases existing at the date of initial application. An entity may choose to use either (1) its effective date or (2) the beginning of the earliest comparative period presented in the financial statements as its date of initial application. If an entity chooses the second option, the transition requirements for existing leases also apply to leases entered into between the date of initial application and the effective date. The entity must also recast its comparative period financial statements and provide the disclosures required by the new standard for the comparative periods. We will adopt the new standard on January 1, 2019 and use the effective date as our date of initial application. Consequently, financial information will not be updated and the disclosures required under the new standard will not be provided for dates and periods before January 1, 2019.
The new standard provides a number of optional practical expedients in transition. We expect to elect the "package of practical expedients," which permits us not to reassess under the new standard our prior conclusions about lease identification, lease classification and initial direct costs. We do not expect to elect the use-of-hindsight or the practical expedient pertaining to land easements. The new standard also provides practical expedients for an entity’s ongoing accounting. We currently expect to elect the practical expedient to not separate lease and non-lease components for all of our leases. We do not currently expect to elect the short-term lease recognition exemption.
We expect that this standard will have an immaterial effect on results of operations. While we continue to assess all of the effects of adoption, we currently believe the most significant effects relate to the recognition of new ROU assets and lease liabilities on our balance sheet for our real estate operating leases and providing new disclosures about our leasing activities.
On adoption, we currently expect to recognize additional ROU assets and lease liabilities for operating leases ranging from
$400 million
to
$500 million
.
Data Processing, Maintenance and Other Service Agreements
The Company has agreements with various vendors, which expire between 2019 and 2024, principally for portions of its computer data processing operations and related functions. The Company’s estimated aggregate contractual obligation remaining under these agreements is approximately
$372 million
as of
December 31, 2018
. However, this amount could be more or less depending on various factors such as the inflation rate, foreign exchange rates, the introduction of significant new technologies, or changes in the Company’s data processing needs.
(14)
Employee Benefit Plans
Stock Purchase Plan
FIS employees participate in an Employee Stock Purchase Plan ("ESPP"). Eligible employees may voluntarily purchase, at current market prices, shares of FIS’ common stock through payroll deductions. Pursuant to the ESPP, employees may contribute an amount between
3%
and
15%
of their base salary and certain commissions. Shares purchased are allocated to employees based upon their contributions. The Company contributes a matching amount as specified in the ESPP of
25%
of
83
FIDELITY NATIONAL INFORMATION SERVICES, INC.
AND SUBSIDIARIES
NOTES TO CONSOLIDATED FINANCIAL STATEMENTS - (Continued)
the employee's contribution. The Company recorded expense of
$14 million
,
$14 million
and
$19 million
, respectively, for the years ended
December 31, 2018
,
2017
and
2016
, relating to the participation of FIS employees in the ESPP.
401(k) Profit Sharing Plans
The Company’s U.S. employees are covered by a qualified 401(k) plan. Eligible employees may contribute up to
40%
of their pretax annual compensation, up to the amount allowed pursuant to the Internal Revenue Code. The Company generally matches
50%
of each dollar of employee contribution up to
6%
of the employee’s total eligible compensation. The Company recorded expense of
$82 million
,
$80 million
and
$80 million
, respectively, for the years ended
December 31, 2018
,
2017
and
2016
, relating to the participation of FIS employees in the 401(k) plan.
Stock Compensation Plans
In
2008
, the Company adopted the FIS
2008
Omnibus Incentive Plan ("FIS Plan"). In May 2013, the FIS Plan was combined with a plan assumed in conjunction with the 2009 Metavante acquisition ("FIS Restated Plan"). The restatement authorized an additional
6 million
shares for issuances, which was approved by stockholders in 2013. In May 2015, another
12 million
shares were authorized for issuance under the FIS Restated Plan and approved by stockholders. Restricted stock awards and options granted under the FIS Restated Plan for the year ended
2018
are subject to time-based vesting criteria as well as market conditions for certain grants. Restricted stock awards and options granted under the FIS Restated Plan for the years ended
2017
and
2016
are subject to time- and performance-based vesting criteria.
On November 30, 2015, in conjunction with the SunGard acquisition, the Company registered an additional
10 million
shares, representing the remaining shares available for issuance under the SunGard 2005 Management Incentive Plan, as amended ("the SG Plan"), immediately prior to the consummation of the SunGard acquisition. These shares are now available for grant under the FIS Restated Plan for legacy SunGard employees and new FIS employees.
Also on November 30, 2015, in conjunction with the SunGard acquisition, the Company registered up to approximately
2 million
shares of FIS common stock on a Post-Effective Amendment on Form S-8, reserved for issuance with respect to converted restricted stock units ("RSU's") under the SG Plan. This SG Plan will remain in existence until such time as these RSU's vest and the shares are exercised or the SG Plan is otherwise terminated.
A summary of the stock options granted (all of which vest over
three years
and, for the 2017 and 2016 grants, are also subject to performance-based vesting criteria), o
utstanding and shares available for grant under the FIS Restated Plan follows (in millions):
|
FIS Restated Plan
|
||
|
Available for grant as of December 31, 2016
|
21
|
|
|
Granted in 2017
|
4
|
|
|
Outstanding as of December 31, 2017
|
15
|
|
|
Available for grant as of December 31, 2017
|
17
|
|
|
Granted in 2018
|
1
|
|
|
Outstanding as of December 31, 2018
|
10
|
|
|
Available for grant as of December 31, 2018
|
15
|
|
84
FIDELITY NATIONAL INFORMATION SERVICES, INC.
AND SUBSIDIARIES
NOTES TO CONSOLIDATED FINANCIAL STATEMENTS - (Continued)
The following schedule summarizes the stock option activity for the years ended
December 31, 2018
,
2017
and
2016
(in millions except for per share amounts):
|
|
Shares
|
Weighted
Average
Exercise Price
|
||||
|
Balance, December 31, 2015
|
16
|
|
$
|
47.19
|
|
|
|
Granted
|
5
|
|
63.58
|
|
||
|
Exercised
|
(3
|
)
|
36.15
|
|
||
|
Cancelled
|
(1
|
)
|
62.25
|
|
||
|
Balance, December 31, 2016
|
17
|
|
53.21
|
|
||
|
Granted
|
4
|
|
80.05
|
|
||
|
Exercised
|
(5
|
)
|
44.75
|
|
||
|
Cancelled
|
(1
|
)
|
70.50
|
|
||
|
Balance, December 31, 2017
|
15
|
|
61.97
|
|
||
|
Granted
|
1
|
|
96.49
|
|
||
|
Exercised
|
(5
|
)
|
54.19
|
|
||
|
Cancelled
|
(1
|
)
|
74.76
|
|
||
|
Balance, December 31, 2018
|
10
|
|
70.03
|
|
||
The intrinsic value of options exercised during the years ended
December 31, 2018
,
2017
and
2016
was
$257 million
,
$196 million
and
$103 million
, respectively. The Company generally issues shares from treasury stock for stock options exercised.
The following table summarizes information related to stock options outstanding and exercisable as of
December 31, 2018
:
|
|
Outstanding Options
|
Exercisable Options
|
|||||||||||||||||||||||
|
Range of Exercise Price
|
Number
of
Options
|
Weighted
Average
Remaining
Contractual
Life
|
Weighted
Average
Exercise
Price
|
Intrinsic
Value as of
December 31,
2018 (a)
|
Number of Options
|
Weighted
Average
Remaining
Contractual
Life
|
Weighted
Average
Exercise
Price
|
Intrinsic
Value as of
December 31,
2018 (a)
|
|||||||||||||||||
|
|
(In millions)
|
|
|
(In millions)
|
(In millions)
|
|
|
(In millions)
|
|||||||||||||||||
|
$ 0.00 - $ 59.91
|
3
|
|
2.23
|
$
|
52.50
|
|
$
|
136
|
|
3
|
|
2.23
|
$
|
52.49
|
|
$
|
136
|
|
|||||||
|
$ 59.92 - $ 62.92
|
2
|
|
4.15
|
62.92
|
|
75
|
|
1
|
|
4.08
|
62.92
|
|
44
|
|
|||||||||||
|
$ 62.93 - $ 66.62
|
1
|
|
3.62
|
65.73
|
|
51
|
|
1
|
|
3.52
|
65.56
|
|
35
|
|
|||||||||||
|
$ 66.63 - $ 80.03
|
3
|
|
5.06
|
80.00
|
|
66
|
|
1
|
|
4.69
|
79.97
|
|
21
|
|
|||||||||||
|
$ 80.04 - $ 102.55
|
1
|
|
6.23
|
96.24
|
|
9
|
|
—
|
|
3.51
|
91.68
|
|
—
|
|
|||||||||||
|
$ 102.56 - $ 107.45
|
—
|
|
6.73
|
104.75
|
|
—
|
|
—
|
|
0.00
|
—
|
|
—
|
|
|||||||||||
|
$ 0.00 - $ 107.45
|
10
|
|
4.10
|
70.03
|
|
$
|
337
|
|
6
|
|
3.21
|
61.26
|
|
$
|
236
|
|
|||||||||
|
(a)
|
Intrinsic value is based on a closing stock price as of
December 31, 2018
of
$102.55
.
|
The weighted average fair value of options granted during the years ended
December 31, 2018
,
2017
and
2016
was estimated to be
$16.07
,
$12.78
and
$9.35
, respectively, using the Black-Scholes option pricing model with the assumptions below:
|
|
2018
|
2017
|
2016
|
|||||
|
Risk free interest rate
|
2.5
|
%
|
1.8
|
%
|
1.2
|
%
|
||
|
Volatility
|
19.2
|
%
|
20.1
|
%
|
20.4
|
%
|
||
|
Dividend yield
|
1.3
|
%
|
1.4
|
%
|
1.6
|
%
|
||
|
Weighted average expected life (years)
|
4.2
|
|
4.2
|
|
4.2
|
|
||
85
FIDELITY NATIONAL INFORMATION SERVICES, INC.
AND SUBSIDIARIES
NOTES TO CONSOLIDATED FINANCIAL STATEMENTS - (Continued)
The Company estimates future forfeitures at the time of grant and revises those estimates in subsequent periods if actual forfeitures differ from those estimates. The Company bases the risk-free interest rate that is used in the stock option valuation model on U.S. Treasury securities issued with maturities similar to the expected term of the options. The expected stock volatility factor is determined using historical daily price changes of the Company's common stock over the most recent period commensurate with the expected term of the option and the impact of any expected trends. The dividend yield assumption is based on the current dividend yield at the grant date or management's forecasted expectations. The expected life assumption is determined by calculating the average term from the Company's historical stock option activity and considering the impact of expected future trends.
The Company granted a total of
1 million
restricted stock shares at prices ranging from
$94.71
to
$110.12
on various dates in
2018
. The Company granted a total of
1 million
restricted stock shares at prices ranging from
$79.44
to
$93.36
on various dates in
2017
. The Company granted a total of
1 million
restricted stock shares at prices ranging from
$56.44
to
$79.41
on various dates in
2016
. The restricted stock shares were granted at the closing market price on the date of grant and vest annually over
three
years. The restricted stock shares granted in 2017 and 2016 are also subject to performance-based vesting criteria. Certain of the restricted stock shares granted in 2018 are also subject to market conditions. As of
December 31, 2018
and
2017
, we have approximately
1 million
and
2 million
unvested restricted shares remaining.
The Company has provided for total stock compensation expense of
$84 million
,
$107 million
and
$137 million
for the years ended
December 31, 2018
,
2017
and
2016
, respectively, which is included in selling, general, and administrative expense in the Consolidated Statements of Earnings, unless the expense is attributable to a discontinued operation.
As of
December 31, 2018
and
2017
, the total unrecognized compensation cost related to non-vested stock awards is
$106 million
and
$111 million
, respectively, which is expected to be recognized in pre-tax income over a weighted-average period of
1.5
years and
1.5
years, respectively.
German Pension Plans
Our German operations have unfunded, defined benefit plan obligations. These obligations relate to benefits to be paid to German employees upon retirement. The accumulated benefit obligation as of
December 31, 2018
and
2017
, was
$54 million
and
$57 million
, respectively, and the projected benefit obligation was
$54 million
and
$57 million
, respectively. The plan remains unfunded as of
December 31, 2018
.
(15)
Related Party Transactions
Cardinal Holdings
On July 31, 2017, FIS closed on the sale of a majority ownership stake in its Capco consulting business and risk and compliance consulting business to Clayton, Dubilier & Rice L.P., by and through certain funds that it manages ("CD&R"). CD&R acquired a
60%
interest in the entity, Cardinal, and FIS obtained the remaining
40%
interest, in each case before equity issued to management (see Note 16). Cardinal became a related party effective July 31, 2017.
Upon closing on the sale of the Capco consulting business and risk and compliance consulting business, FIS and Cardinal entered into a short-term Transition Services Agreement, whereby FIS provides various agreed upon services to Cardinal.
FIS also provides ongoing management consulting services and other services to Cardinal. Amounts transacted through these agreements were not significant to the 2018 and 2017 periods presented.
Capco provided Banco Bradesco with consulting services. Capco revenue and related party receivables from Banco Bradesco through the July 31, 2017 closing are included below under Brazilian Venture revenue and trade receivables from Banco Bradesco.
Brazilian Venture
The Company operated the Brazilian Venture with Banco Bradesco in which FIS owned a
51%
controlling interest through December 31, 2018, and provided comprehensive, fully outsourced transaction processing, call center, cardholder support and collection services to multiple card issuing clients in Brazil, including Banco Bradesco. The original accounting for the
86
FIDELITY NATIONAL INFORMATION SERVICES, INC.
AND SUBSIDIARIES
NOTES TO CONSOLIDATED FINANCIAL STATEMENTS - (Continued)
Brazilian Venture transaction resulted in the establishment of a contract intangible asset and a liability for amounts payable to the original partner banks upon final migration of their respective card portfolios and achieving targeted volumes.
FIS closed a transaction with Banco Bradesco on December 31, 2018 to unwind the Brazilian Venture pursuant to the agreement entered into September 28, 2018 (see Note 16). Banco Bradesco was a related party through December 31, 2018. During the third quarter of 2018, FIS incurred impairment charges of
$95 million
related to the disposal, including impairments of its contract intangible asset, goodwill and its assets held for sale to fair value less cost to sell (see Note 2 (c)). The carrying value of the noncontrolling interest as of
December 31, 2018
was
$0 million
as a result of the transaction.
The board of directors for the Brazilian Venture declared a dividend during the years ended
December 31, 2018
and
2017
, resulting in payments to Banco Bradesco of
$26 million
and
$23 million
respectively.
The Company recorded revenue of
$332 million
,
$329 million
and
$272 million
during the years ended
December 31, 2018
,
2017
and
2016
, respectively, from Banco Bradesco. Revenue from Banco Bradesco included
$46 million
of unfavorable and
$24 million
of favorable currency impact during the years ended
December 31, 2018
and
2017
, respectively, resulting from foreign currency exchange rate fluctuations between the U.S. Dollar and Brazilian Real in
2018
as compared to
2017
and
2017
as compared to
2016
.
A summary of the Company’s related party receivables and payables is as follows (in millions):
|
|
December 31,
|
|||||||||
|
Related Party
|
Balance Sheet Location
|
2018
|
2017
|
|||||||
|
Banco Bradesco
|
Trade receivables
|
$
|
—
|
|
$
|
47
|
|
|||
|
Banco Bradesco
|
Contract assets
|
—
|
|
5
|
|
|||||
|
Banco Bradesco
|
Accounts payable and accrued liabilities
|
—
|
|
10
|
|
|||||
|
Banco Bradesco
|
Other long-term liabilities
|
—
|
|
17
|
|
|||||
(16)
Divestitures
On September 28, 2018, FIS entered into an agreement with Banco Bradesco to unwind the Brazilian Venture. The transaction closed on December 31, 2018. As a result of the transaction, the Brazilian Venture spun-off certain assets of the business that also provide services to non-Bradesco clients to a new wholly-owned FIS subsidiary. The subsidiary entered into a long-term commercial agreement to provide current and new services to Banco Bradesco effective January 1, 2019 that include software licensing, maintenance, application management, card portfolio migration, business process outsourcing, fraud management and professional services. As a result of the transaction, Banco Bradesco owns
100%
of the entity that previously housed the Brazilian Venture and its remaining assets that relate to card processing for Banco Bradesco, which Banco Bradesco will perform internally. During the third quarter of 2018, FIS incurred impairment charges of
$95 million
related to the expected disposal, including impairments of its contract intangible asset, goodwill and its assets held for sale to fair value less cost to sell (see Note 2 (c)). Upon closing of the transaction, FIS recorded an additional pre-tax loss of
$12 million
related to the business divested, removed FIS' noncontrolling interest balance of
$90 million
, and recorded a
$57 million
increase to additional paid in capital for the business spun-off into the new wholly-owned FIS subsidiary. The impairment loss and pre-tax loss on disposal were recorded in the Corporate and Other segment. The Brazilian Venture business divested was included within the GFS segment as part of the consolidated Brazilian Venture results recorded by FIS through the transaction date. The transaction did not meet the standard necessary to be reported as discontinued operations; therefore, the impairment loss, pre-tax loss and related prior period earnings remain reported within earnings from continuing operations.
On July 31, 2017, FIS closed on the sale of a majority ownership stake in its Capco consulting business and risk and compliance consulting business to CD&R, for cash proceeds of approximately
$469 million
, resulting in a pre-tax loss of approximately
$41 million
. The divestiture is consistent with our strategy to focus on our IP-led businesses. CD&R acquired preferred units convertible into
60%
of the common units of the venture, Cardinal Holdings, L.P. ("Cardinal") and FIS obtained common units representing the remaining
40%
, in each case before equity is issued to management. The preferred units are entitled to a quarterly dividend at an annual rate of
12%
, payable in cash (if available) or additional preferred units at FIS' option. The businesses sold were included within the GFS and IFS segments. The sale did not meet the standard necessary to
87
FIDELITY NATIONAL INFORMATION SERVICES, INC.
AND SUBSIDIARIES
NOTES TO CONSOLIDATED FINANCIAL STATEMENTS - (Continued)
be reported as discontinued operations; therefore, the pre-tax loss and related prior period earnings remain reported within earnings from continuing operations. Prior to the sale, the Capco consulting business and risk and compliance consulting business' pre-tax earnings (loss), excluding certain unallocated corporate costs, for the periods ended December 31, 2017 and 2016 were
$14 million
, and
$55 million
, respectively.
FIS'
40%
ownership stake in Cardinal was initially valued at
$172 million
and is recorded as an equity method investment included within other noncurrent assets on the Consolidated Balance Sheet. After the sale on July 31, 2017, FIS began to recognize after-tax equity method investment earnings (loss) outside of operating income and segment Adjusted EBITDA. FIS' ownership stake in Cardinal at
December 31, 2018
and
2017
was
38%
and
40%
, respectively. The carrying value of this equity method investment as of
December 31, 2018
and
2017
was
$151 million
and
$171 million
, respectively. For periods prior to July 31, 2017, the Capco consulting business and risk and compliance consulting business were included within operating income and segment Adjusted EBITDA.
On February 1, 2017, the Company closed on the sale of the PS&E business for
$850 million
, resulting in a pre-tax gain of
$85 million
. The transaction included all PS&E solutions, which provided a comprehensive set of technology solutions to address public safety and public administration needs of government entities as well as the needs of K-12 school districts. The divestiture is consistent with our strategy to serve the financial services markets. Cash proceeds were used to reduce outstanding debt (see Note 10). Net cash proceeds after payment of taxes and transaction-related expenses were approximately
$500 million
. The PS&E business was included in the Corporate and Other segment. The sale did not meet the standard necessary to be reported as discontinued operations; therefore, the gain and related prior period earnings remain reported within earnings from continuing operations. Prior to the sale, PS&E's pre-tax earnings, excluding certain unallocated corporate costs, for the periods ended December 31, 2017 and 2016 were
$3 million
and
$42 million
, respectively.
(17)
Components of Other Comprehensive Earnings
The following table shows accumulated other comprehensive earnings attributable to FIS by component, net of tax, for the year ended
December 31, 2018
(in millions):
|
Foreign
|
||||||||||||
|
Currency
|
||||||||||||
|
Translation
|
||||||||||||
|
Adjustments
|
Other (1)
|
Total
|
||||||||||
|
Balances, December 31, 2017
|
$
|
(289
|
)
|
$
|
(43
|
)
|
$
|
(332
|
)
|
|||
|
Other comprehensive gain (loss) before reclassifications
|
(102
|
)
|
4
|
|
(98
|
)
|
||||||
|
Balances, December 31, 2018
|
$
|
(391
|
)
|
$
|
(39
|
)
|
$
|
(430
|
)
|
|||
|
(1)
|
Includes the minimum pension liability adjustment and the cash settlement payment on treasury lock contracts associated with bridge financing for the SunGard acquisition. This amount will be amortized as an adjustment to interest expense over the
10
years in which the related interest payments that were hedged are recognized in income.
|
See Note 12 for the tax provision associated with each component of other comprehensive income.
(18)
Concentration of Risk
The Company generates a significant amount of revenues from large clients, however,
no
individual client accounted for
10%
or more of total revenues in the years ended
December 31, 2018
,
2017
and
2016
.
Financial instruments that potentially subject the Company to concentrations of credit risk consist primarily of cash equivalents and trade receivables. The Company places its cash equivalents with high credit-quality financial institutions and, by policy, limits the amount of credit exposure with any one financial institution. Concentrations of credit risk with respect to trade receivables are limited because a large number of geographically diverse clients make up the Company’s client base, thus spreading the trade receivables credit risk. The Company controls credit risk through monitoring procedures.
88
FIDELITY NATIONAL INFORMATION SERVICES, INC.
AND SUBSIDIARIES
NOTES TO CONSOLIDATED FINANCIAL STATEMENTS - (Continued)
(19)
Segment Information
Integrated Financial Solutions ("IFS")
The IFS segment is focused primarily on serving North American clients for transaction and account processing, payment solutions, channel solutions, lending and wealth and retirement solutions, corporate liquidity, digital channels, risk and compliance solutions, and services, capitalizing on the continuing trend to outsource these solutions. Clients in this segment include regional and community banks, credit unions and commercial lenders, as well as government institutions, merchants and other commercial organizations. IFS’ primary software applications function as the underlying infrastructure of a financial institution's processing environment. These applications include core bank processing software, which banks use to maintain the primary records of their customer accounts, and complementary applications and services that interact directly with the core processing applications. These markets are primarily served through integrated solutions and characterized by multi-year processing contracts that generate highly recurring revenue. The predictable nature of cash flows generated from this segment provides opportunities for further investments in innovation, integration, information and security, and compliance in a cost effective manner. The business solutions in this segment included the risk and compliance consulting business through its divestiture on July 31, 2017 (see Note 16).
Global Financial Solutions ("GFS")
The GFS segment is focused on serving the largest global financial institutions and/or international financial institutions with a broad array of capital markets and asset management and insurance solutions, as well as banking and payments solutions.
GFS clients include the largest global financial institutions, including those headquartered in the United States, as well as all international financial institutions we serve as clients in more than
130
countries around the world, and asset managers, buy- and sell-side securities and trading firms, insurers and private equity firms. These institutions face unique business and regulatory challenges and account for the majority of financial institution information technology spend globally. The purchasing patterns of GFS clients vary from those of IFS clients who typically purchase solutions on an outsourced basis. GFS clients purchase our solutions and services in various ways including licensing and managing technology "in-house," using consulting and third-party service providers as well as fully outsourced end-to-end solutions. We have long-established relationships with many of these financial institutions that generate significant recurring revenue. The business solutions in this segment included the Capco consulting business through its divestiture on July 31, 2017 and the Company's Brazilian Venture business divested as part of the joint venture unwinding transaction through December 31, 2018 (see Note 16).
Corporate and Other
The Corporate and Other segment consists of corporate overhead expense, certain leveraged functions and miscellaneous expenses that are not included in the operating segments, as well as certain non-strategic businesses. At the end of 2018, the only business unit remaining in this segment is the Global Commercial Services business, as the non-strategic businesses were divested. In particular, the PS&E business was divested on February 1, 2017 (see Note 16) and the Certegy Check Services business unit in North America was divested on August 31, 2018 (see Note 5). The overhead and leveraged costs relate to marketing, corporate finance and accounting, human resources, legal, and amortization of acquisition-related intangibles and other costs that are not considered when management evaluates revenue generating segment performance, such as acquisition, integration and certain other costs. The Corporate and Other segment also includes the impact on revenue for 2018, 2017 and 2016 of adjusting deferred revenue from the SunGard acquisition to fair value.
During 2018 the Company recorded acquisition and integration costs primarily related to the SunGard acquisition and certain other costs including those associated with data center consolidation activities of
$156 million
. During 2017 and 2016 the Company recorded acquisition and integration costs primarily related to the SunGard acquisition of
$178 million
and
$281 million
, respectively.
Adjusted EBITDA
This measure is reported to the chief operating decision maker for purposes of making decisions about allocating resources to the segments and assessing their performance. For this reason, Adjusted EBITDA, as it relates to our segments, is presented in conformity with FASB ASC Topic 280,
Segment Reporting
. Adjusted EBITDA is defined as EBITDA (defined as net
89
FIDELITY NATIONAL INFORMATION SERVICES, INC.
AND SUBSIDIARIES
NOTES TO CONSOLIDATED FINANCIAL STATEMENTS - (Continued)
earnings (loss) before net interest expense, income tax provision (benefit) and depreciation and amortization) plus certain non-operating items. The non-operating items affecting the segment profit measure generally include acquisition accounting adjustments; acquisition, integration and certain other costs; and asset impairments. For consolidated reporting purposes, these costs and adjustments are recorded in the Corporate and Other segment for the periods discussed below. Adjusted EBITDA for the respective segments excludes the foregoing costs and adjustments.
Summarized financial information for the Company’s segments is shown in the following tables.
As of and for the year ended
December 31, 2018
(in millions):
|
IFS
|
GFS
|
Corporate
and Other
|
Total
|
||||||||||||
|
Revenue
|
$
|
4,401
|
|
$
|
3,718
|
|
$
|
304
|
|
$
|
8,423
|
|
|||
|
Operating expenses
|
2,788
|
|
2,611
|
|
1,566
|
|
6,965
|
|
|||||||
|
Depreciation and amortization
|
349
|
|
284
|
|
787
|
|
1,420
|
|
|||||||
|
EBITDA
|
1,962
|
|
1,391
|
|
(475
|
)
|
2,878
|
|
|||||||
|
Acquisition deferred revenue adjustment
|
—
|
|
—
|
|
4
|
|
4
|
|
|||||||
|
Acquisition, integration and other costs
|
—
|
|
—
|
|
156
|
|
156
|
|
|||||||
|
Asset impairments
|
—
|
|
—
|
|
95
|
|
95
|
|
|||||||
|
Adjusted EBITDA
|
$
|
1,962
|
|
$
|
1,391
|
|
$
|
(220
|
)
|
$
|
3,133
|
|
|||
|
EBITDA
|
$
|
2,878
|
|
||||||||||||
|
Interest expense, net
|
297
|
|
|||||||||||||
|
Depreciation and amortization
|
1,420
|
|
|||||||||||||
|
Other income (expense) unallocated
|
|
|
|
(72
|
)
|
||||||||||
|
Provision (benefit) for income taxes
|
208
|
|
|||||||||||||
|
Net earnings attributable to noncontrolling interest
|
35
|
|
|||||||||||||
|
Net earnings attributable to FIS common stockholders
|
$
|
846
|
|
||||||||||||
|
Capital expenditures (1)
|
$
|
385
|
|
$
|
306
|
|
$
|
22
|
|
$
|
713
|
|
|||
|
Total assets
|
$
|
10,940
|
|
$
|
8,123
|
|
$
|
4,707
|
|
$
|
23,770
|
|
|||
|
Goodwill
|
$
|
7,648
|
|
$
|
5,770
|
|
$
|
127
|
|
$
|
13,545
|
|
|||
(1) Capital expenditures include
$91 million
in capital leases and other financing obligations.
90
FIDELITY NATIONAL INFORMATION SERVICES, INC.
AND SUBSIDIARIES
NOTES TO CONSOLIDATED FINANCIAL STATEMENTS - (Continued)
As of and for the year ended
December 31, 2017
(in millions):
|
IFS
|
GFS
|
Corporate
and Other
|
Total
|
||||||||||||
|
Revenue
|
$
|
4,260
|
|
$
|
4,050
|
|
$
|
358
|
|
$
|
8,668
|
|
|||
|
Operating expenses
|
2,692
|
|
2,990
|
|
1,554
|
|
7,236
|
|
|||||||
|
Depreciation and amortization
|
306
|
|
263
|
|
798
|
|
1,367
|
|
|||||||
|
EBITDA
|
1,874
|
|
1,323
|
|
(398
|
)
|
2,799
|
|
|||||||
|
Acquisition deferred revenue adjustment
|
—
|
|
—
|
|
7
|
|
7
|
|
|||||||
|
Acquisition, integration and other costs
|
—
|
|
—
|
|
178
|
|
178
|
|
|||||||
|
Adjusted EBITDA
|
$
|
1,874
|
|
$
|
1,323
|
|
$
|
(213
|
)
|
$
|
2,984
|
|
|||
|
EBITDA
|
$
|
2,799
|
|
||||||||||||
|
Interest expense, net
|
337
|
|
|||||||||||||
|
Depreciation and amortization
|
1,367
|
|
|||||||||||||
|
Other income (expense) unallocated
|
|
|
|
(122
|
)
|
||||||||||
|
Provision (benefit) for income taxes
|
(321
|
)
|
|||||||||||||
|
Net earnings attributable to noncontrolling interest
|
33
|
|
|||||||||||||
|
Net earnings attributable to FIS common stockholders
|
$
|
1,261
|
|
||||||||||||
|
Capital expenditures (1)
|
$
|
374
|
|
$
|
301
|
|
$
|
22
|
|
$
|
697
|
|
|||
|
Total assets
|
$
|
10,663
|
|
$
|
8,437
|
|
$
|
5,424
|
|
$
|
24,524
|
|
|||
|
Goodwill
|
$
|
7,662
|
|
$
|
5,898
|
|
$
|
170
|
|
$
|
13,730
|
|
|||
(1) Capital expenditures include
$84 million
in capital leases and other financing obligations.
As of and for the year ended
December 31, 2016
(in millions):
|
IFS
|
GFS
|
Corporate
and Other
|
Total
|
||||||||||||
|
Revenue
|
$
|
4,178
|
|
$
|
4,183
|
|
$
|
470
|
|
$
|
8,831
|
|
|||
|
Operating expenses
|
2,649
|
|
3,219
|
|
1,734
|
|
7,602
|
|
|||||||
|
Depreciation and amortization
|
263
|
|
247
|
|
643
|
|
1,153
|
|
|||||||
|
EBITDA
|
1,792
|
|
1,211
|
|
(621
|
)
|
2,382
|
|
|||||||
|
Acquisition deferred revenue adjustment
|
—
|
|
—
|
|
192
|
|
192
|
|
|||||||
|
Acquisition, integration and other costs
|
—
|
|
—
|
|
281
|
|
281
|
|
|||||||
|
Adjusted EBITDA
|
$
|
1,792
|
|
$
|
1,211
|
|
$
|
(148
|
)
|
2,855
|
|
||||
|
EBITDA
|
$
|
2,382
|
|
||||||||||||
|
Interest expense, net
|
383
|
|
|||||||||||||
|
Depreciation and amortization
|
1,153
|
|
|||||||||||||
|
Other income (expense) unallocated
|
|
|
|
(9
|
)
|
||||||||||
|
Provision (benefit) for income taxes
|
291
|
|
|||||||||||||
|
Net earnings (loss) from discontinued operations
|
1
|
|
|||||||||||||
|
Net earnings attributable to noncontrolling interest
|
22
|
|
|||||||||||||
|
Net earnings attributable to FIS common stockholders
|
$
|
525
|
|
||||||||||||
|
Capital expenditures (1)
|
$
|
294
|
|
$
|
317
|
|
$
|
48
|
|
$
|
659
|
|
|||
|
Total assets
|
$
|
10,231
|
|
$
|
9,106
|
|
$
|
6,683
|
|
$
|
26,020
|
|
|||
|
Goodwill
|
$
|
7,676
|
|
$
|
6,332
|
|
$
|
170
|
|
$
|
14,178
|
|
|||
(1) Capital expenditures include
$43 million
in capital leases and other financing obligations.
Total assets as of
December 31, 2018
,
2017
and
2016
exclude
$0 million
,
$2 million
and
$6 million
, respectively, related to discontinued operations.
Clients in Brazil, the United Kingdom, Germany, India and Australia accounted for the majority of the revenue from clients based outside of North America for all periods presented. FIS conducts business in over
130
countries, with no individual
91
FIDELITY NATIONAL INFORMATION SERVICES, INC.
AND SUBSIDIARIES
NOTES TO CONSOLIDATED FINANCIAL STATEMENTS - (Continued)
country outside of North America accounting for more than
10%
of total revenue for the years ended
December 31, 2018
,
2017
and
2016
.
Long-term assets, excluding goodwill and other intangible assets, located outside of the United States totaled
$560 million
and
$559 million
as of
December 31, 2018
and
2017
, respectively. These assets are predominantly located in the United Kingdom, India, Belgium, Germany, France and Brazil.
92
|
Item 9.
|
Changes in and Disagreements with Accountants on Accounting and Financial Disclosure
|
None.
|
Item 9A.
|
Controls and Procedures
|
As of the end of the year covered by this report, we carried out an evaluation, under the supervision and with the participation of our principal executive officer and principal financial officer, of the effectiveness of the design and operation of our disclosure controls and procedures, as such term is defined in Rule 13a-15 (e) under the Securities Exchange Act of 1934, as amended (the "Exchange Act"). Based on this evaluation, our principal executive officer and principal financial officer concluded that our disclosure controls and procedures were effective to ensure that information required to be disclosed by us in the reports that we file or submit under the Exchange Act is (a) recorded, processed, summarized and reported within the time periods specified in the Commission’s rules and forms; and (b) accumulated and communicated to management, including our principal executive and principal financial officers, as appropriate to allow timely decisions regarding required disclosure.
There were no changes in our internal control over financial reporting that occurred during the most recent fiscal quarter that have materially affected, or are reasonably likely to materially affect, our internal control over financial reporting.
MANAGEMENT’S REPORT ON INTERNAL CONTROL OVER FINANCIAL REPORTING
Management is responsible for establishing and maintaining adequate internal control over financial reporting, as such term is defined in Exchange Act Rules 13a-15(f). Under the supervision and with the participation of our management, including our principal executive officer and principal financial officer, we conducted an evaluation of the effectiveness of our internal control over financial reporting. Management has adopted the framework in
Internal Control - Integrated Framework
issued by the Committee of Sponsoring Organizations of the Treadway Commission ("COSO"). Based on our evaluation under this framework, our management concluded that our internal control over financial reporting was effective as of
December 31, 2018
. KPMG LLP, an independent registered public accounting firm, has issued an attestation report on our internal control over financial reporting as set forth in Item 8.
|
Item 9B.
|
Other Information
|
None.
PART III
Items 10-14.
Within 120 days after the close of its fiscal year, the Company intends to file with the Securities and Exchange Commission a definitive proxy statement pursuant to Regulation 14A of the Securities Exchange Act of 1934, as amended, which will include the matters required by these items.
PART IV
|
Item 15.
|
Exhibits and Financial Statement Schedules
|
|
(1)
|
Financial Statement Schedules: All schedules have been omitted because they are not applicable or the required information is included in the Consolidated Financial Statements or Notes to Consolidated Financial Statements.
|
|
(2)
|
Exhibits: The following is a complete list of exhibits included as part of this report, including those incorporated by reference. A list of those documents filed with this report is set forth on the Exhibit Index appearing elsewhere in this report and is incorporated by reference.
|
93
|
Incorporated by Reference
|
|||||||
|
Exhibit
|
SEC File
|
Filed/ Furnished
|
|||||
|
No.
|
Exhibit Description
|
Form
|
Number
|
Exhibit
|
Filing Date
|
Herewith
|
|
|
2.1
|
|
8-K
|
001-16427
|
2.1
|
8/14/2015
|
||
|
3.1
|
|
8-K
|
001-16427
|
3.1
|
2/6/2006
|
||
|
3.2
|
|
10-K
|
001-16427
|
3.2
|
2/26/2013
|
||
|
3.3
|
|
10-Q
|
001-16427
|
3.1
|
8/7/2014
|
||
|
3.4
|
|
8-K
|
001-16427
|
3.1
|
1/27/2017
|
||
|
4.1
|
|
S-3ASR
|
333-131593
|
4.3
|
2/6/2006
|
|
|
|
4.2
|
|
8-K
|
001-16427
|
4.1
|
4/15/2013
|
|
|
|
4.3
|
|
8-K
|
001-16427
|
4.2
|
4/15/2013
|
|
|
|
4.4
|
|
8-K
|
001-16427
|
4.2
|
6/3/2014
|
|
|
|
4.5
|
|
8-K
|
001-16427
|
4.2
|
10/20/2015
|
||
|
4.6
|
|
8-K
|
001-16427
|
4.3
|
10/20/2015
|
||
|
4.7
|
|
8-K
|
001-16427
|
4.4
|
10/20/2015
|
||
|
4.8
|
|
8-K
|
001-16427
|
4.1
|
8/16/2016
|
||
94
|
Incorporated by Reference
|
||||||
|
Exhibit
|
SEC File
|
Filed/ Furnished
|
||||
|
No.
|
Exhibit Description
|
Form
|
Number
|
Exhibit
|
Filing Date
|
Herewith
|
|
4.9
|
8-K
|
001-16427
|
4.2
|
8/16/2016
|
||
|
4.10
|
8-K
|
001-16427
|
4.3
|
8/16/2016
|
||
|
4.11
|
8-K
|
001-16427
|
4.1
|
7/11/2017
|
||
|
4.12
|
8-K
|
001-16427
|
4.2
|
7/11/2017
|
||
|
4.13
|
8-K
|
001-16427
|
4.3
|
7/11/2017
|
||
|
4.14
|
8-K
|
001-16427
|
4.1
|
5/16/2018
|
||
|
4.15
|
8-K
|
001-16427
|
4.2
|
5/16/2018
|
||
|
10.1
|
10-K405
|
001-16427
|
10.25
|
3/25/2002
|
|
|
|
10.2
|
10-K
|
001-16427
|
10.40
|
2/17/2004
|
|
|
|
10.3
|
10-K405
|
001-16427
|
10.15
|
3/25/2002
|
|
|
|
10.4
|
10-K
|
001-16427
|
10.15(a)
|
2/17/2004
|
|
|
|
10.5
|
10-K
|
001-16427
|
10.50
|
2/27/2009
|
|
|
|
10.6
|
S-4/A
|
333-135845
|
Annex C
|
9/19/2006
|
|
|
95
|
Incorporated by Reference
|
||||||
|
Exhibit
|
SEC File
|
Filed/ Furnished
|
||||
|
No.
|
Exhibit Description
|
Form
|
Number
|
Exhibit
|
Filing Date
|
Herewith
|
|
10.7
|
S-8
|
333-158960
|
10.1
|
10/1/2009
|
|
|
|
10.8
|
Metavante Technologies, Inc.10-K
|
001-33747
|
10.10(b)
|
2/20/2009
|
|
|
|
10.9
|
S-4/A
|
333-135845
|
Annex D
|
9/19/2006
|
|
|
|
10.10
|
8-K
|
001-16427
|
10.1
|
12/29/2009
|
|
|
|
10.11
|
10-Q
|
001-16427
|
10.4
|
5/4/2012
|
|
|
|
10.12
|
10-K
|
001-16427
|
10.31
|
2/27/2015
|
||
|
10.13
|
10-K
|
001-16427
|
10.33
|
2/26/2016
|
||
|
10.14
|
*
|
|||||
|
10.15
|
8-K
|
001-16427
|
10.13
|
10/2/2009
|
|
|
|
10.16
|
10-K
|
001-16427
|
10.51
|
2/28/2014
|
|
|
|
10.17
|
10-K
|
001-16427
|
10.52
|
2/28/2014
|
|
|
|
10.18
|
10-K
|
001-16427
|
10.37
|
2/26/2016
|
||
|
10.19
|
*
|
|||||
|
10.20
|
10-K
|
001-16427
|
10.43
|
2/28/2014
|
|
|
96
|
Incorporated by Reference
|
|||||||
|
Exhibit
|
SEC File
|
Filed/ Furnished
|
|||||
|
No.
|
Exhibit Description
|
Form
|
Number
|
Exhibit
|
Filing Date
|
Herewith
|
|
|
10.21
|
|
10-K
|
001-16427
|
10.44
|
2/28/2014
|
|
|
|
10.22
|
|
10-K
|
001-16427
|
10.82
|
2/26/2013
|
|
|
|
10.23
|
|
10-K
|
001-16427
|
10.41
|
2/26/2016
|
||
|
10.24
|
|
10-K
|
001-16427
|
10.25
|
2/22/2018
|
||
|
10.25
|
|
10-K
|
001-16427
|
10.81
|
2/26/2013
|
|
|
|
10.26
|
|
10-K
|
001-16427
|
10.43
|
2/26/2016
|
||
|
10.27
|
|
10-K
|
001-16427
|
10.46
|
2/26/2016
|
||
|
10.28
|
|
10-K
|
001-16427
|
10.47
|
2/26/2016
|
||
|
10.29
|
|
10-K
|
001-16427
|
10.30
|
2/22/2018
|
||
|
10.30
|
|
10-K
|
001-16427
|
10.48
|
2/26/2016
|
||
|
10.31
|
|
10-Q
|
001-16427
|
10.1
|
11/1/2017
|
||
|
10.32
|
|
10-K
|
001-16427
|
10.44
|
2/23/2017
|
||
97
|
Incorporated by Reference
|
||||||
|
Exhibit
|
SEC File
|
Filed/ Furnished
|
||||
|
No.
|
Exhibit Description
|
Form
|
Number
|
Exhibit
|
Filing Date
|
Herewith
|
|
10.33
|
10-K
|
001-16427
|
10.34
|
2/22/2018
|
||
|
10.34
|
10-K
|
001-16427
|
10.35
|
2/22/2018
|
||
|
10.35
|
10-K
|
001-16427
|
10.36
|
2/22/2018
|
||
|
10.36
|
10-K
|
001-16427
|
10.53
|
2/28/2014
|
|
|
|
10.37
|
10-K
|
001-16427
|
10.54
|
2/28/2014
|
|
|
|
10.38
|
10-K
|
001-16427
|
10.55
|
2/28/2014
|
|
|
|
10.39
|
10-K
|
001-16427
|
10.60
|
2/26/2016
|
||
|
10.40
|
10-K
|
001-16427
|
10.61
|
2/26/2016
|
||
|
10.41
|
10-K
|
001-16427
|
10.62
|
2/26/2016
|
||
|
10.42
|
10-K
|
001-16427
|
10.63
|
2/26/2016
|
||
|
10.43
|
10-K
|
001-16427
|
10.60
|
2/23/2017
|
||
98
|
Incorporated by Reference
|
||||||
|
Exhibit
|
SEC File
|
Filed/ Furnished
|
||||
|
No.
|
Exhibit Description
|
Form
|
Number
|
Exhibit
|
Filing Date
|
Herewith
|
|
10.44
|
10-K
|
001-16427
|
10.61
|
2/23/2017
|
||
|
10.45
|
10-K
|
001-16427
|
10.62
|
2/23/2017
|
||
|
10.46
|
*
|
|||||
|
10.47
|
*
|
|||||
|
10.48
|
*
|
|||||
|
10.49
|
*
|
|||||
|
10.50
|
*
|
|||||
|
10.51
|
*
|
|||||
|
10.52
|
*
|
|||||
|
10.53
|
*
|
|||||
|
10.54
|
8-K
|
001-16427
|
10.1
|
9/24/2018
|
||
99
|
Incorporated by Reference
|
||||||
|
Exhibit
|
SEC File
|
Filed/ Furnished
|
||||
|
No.
|
Exhibit Description
|
Form
|
Number
|
Exhibit
|
Filing Date
|
Herewith
|
|
10.55
|
10-K
|
000-53653
|
10.36
|
3/20/2013
|
||
|
10.56
|
DEF 14A
|
001-16427
|
Annex A
|
4/20/2018
|
||
|
21.1
|
|
|
|
|
*
|
|
|
23.1
|
|
|
|
|
*
|
|
|
31.1
|
|
|
|
|
*
|
|
|
31.2
|
|
|
|
|
*
|
|
|
32.1
|
|
|
|
|
*
|
|
|
32.2
|
|
|
|
|
*
|
|
|
101.INS+
|
XBRL Instance Document
|
*
|
||||
|
101.SCH+
|
XBRL Taxonomy Extension Schema Document
|
*
|
||||
|
101.CAL+
|
XBRL Taxonomy Extension Calculation Linkbase Document
|
*
|
||||
|
101.DEF+
|
XBRL Taxonomy Extension Definition Linkbase Document
|
*
|
||||
|
101.LAB+
|
XBRL Taxonomy Extension Label Linkbase Document
|
*
|
||||
|
101.PRE+
|
XBRL Taxonomy Extension Presentation Linkbase Document
|
*
|
||||
(1) Management contract or compensatory plan or arrangement.
*Filed or furnished herewith
+ Pursuant to Rule 406T of Regulation S-T, the Interactive Data Files on Exhibit 101 hereto are deemed not filed or part of a registration statement or prospectus for purposes of Sections 11 or 12 of the Securities Act of 1933, as amended, are deemed not filed for purposes of Section 18 of the Securities Exchange Act of 1934, as amended, and otherwise are not subject to liability under those sections.
100
|
Item 16.
|
Form 10-K Summary
|
None.
101
SIGNATURES
Pursuant to the requirements of Section 13 or 15(d) of the Securities Exchange Act of 1934, the registrant has duly caused this report to be signed on its behalf by the undersigned, thereunto duly authorized.
|
FIDELITY NATIONAL INFORMATION SERVICES, INC.
|
|||
|
Date:
|
February 21, 2019
|
By:
|
/s/ GARY A. NORCROSS
|
|
|
|
Gary A. Norcross
|
|
|
|
|
President and Chief Executive Officer
|
|
102
Pursuant to the requirements of the Securities Exchange Act of 1934, this report has been signed below by the following persons on behalf of the registrant and in the capacities and on the dates indicated.
|
Date:
|
February 21, 2019
|
By:
|
/s/ JAMES W. WOODALL
|
|
James W. Woodall
|
|||
|
Corporate Executive Vice President and
|
|||
|
Chief Financial Officer (Principal Financial Officer)
|
|||
|
|
|
|
|
|
Date:
|
February 21, 2019
|
By:
|
/s/ KATY T. THOMPSON
|
|
Katy T. Thompson
|
|||
|
Chief Accounting Officer
|
|||
|
(Principal Accounting Officer)
|
|||
|
Date:
|
February 21, 2019
|
By:
|
/s/ GARY A. NORCROSS
|
|
|
|
Gary A. Norcross
|
|
|
|
|
President, Chief Executive Officer and Executive Chairman of the Board
|
|
|
Date:
|
February 21, 2019
|
By:
|
/s/ ELLEN R. ALEMANY
|
|
Ellen R. Alemany
|
|||
|
Director
|
|||
|
Date:
|
February 21, 2019
|
By:
|
/s/ KEITH W. HUGHES
|
|
Keith W. Hughes
|
|||
|
Director
|
|||
|
Date:
|
February 21, 2019
|
By:
|
/s/ DAVID K. HUNT
|
|
David K. Hunt
|
|||
|
Director
|
|||
|
Date:
|
February 21, 2019
|
By:
|
/s/ STEPHAN A. JAMES
|
|
Stephan A. James
|
|||
|
Director
|
|||
|
Date:
|
February 21, 2019
|
By:
|
/s/ LESLIE M. MUMA
|
|
Leslie M. Muma
|
|||
|
Director
|
|||
|
Date:
|
February 21, 2019
|
By:
|
/s/ ALEXANDER NAVAB
|
|
Alexander Navab
|
|||
|
Director
|
|||
|
Date:
|
February 21, 2019
|
By:
|
/s/ LOUISE M. PARENT
|
|
Louise M. Parent
|
|||
|
Director
|
|||
103
|
Date:
|
February 21, 2019
|
By:
|
/s/ BRIAN T. SHEA
|
|
Brian T. Shea
|
|||
|
Director
|
|||
|
Date:
|
February 21, 2019
|
By:
|
/s/ JAMES B. STALLINGS, JR.
|
|
James B. Stallings, Jr.
|
|||
|
Director
|
|||
104
TABLE OF CONTENTS
Part IItem 1. BusinessItem Processing and Output ServicesItem 1A. Risk FactorsItem 1B. Unresolved Staff CommentsItem 2. PropertiesItem 3. Legal ProceedingsItem 4. Mine Safety DisclosuresPart IIItem 5. Market For Registrant S Common Equity, Related Stockholder Matters and Issuer Purchases Of Equity SecuritiesItem 12 Of Part III Contains Information Concerning Securities Authorized For Issuance Under Our Equity Compensation PlansItem 6. Selected Financial DataItem 7. Management S Discussion and Analysis Of Financial Condition and Results Of OperationsItem 7A. Quantitative and Qualitative Disclosure About Market RisksItem 8. Financial Statements and Supplementary DataItem 9. Changes in and Disagreements with Accountants on Accounting and Financial DisclosureItem 9A. Controls and ProceduresItem 9B. Other InformationPart IIIPart IVItem 15. Exhibits and Financial Statement SchedulesItem 16. Form 10-k Summary