FIVE BELOW, INC
10-Ks and 10-Qs
|
|
|
|
|
|
|
|
|
|
|
|
|
|
|
|
|
|
|
|
|
|
|
|
|
|
|
|
|
|
|
|
|
|
|
|
|
|
|
|
|
|
|
|
|
|
|
UNITED STATES
SECURITIES AND EXCHANGE COMMISSION
Washington, D.C. 20549
Form 10-K
þ
ANNUAL REPORT PURSUANT TO SECTION 13 OR 15(d) OF THE SECURITIES EXCHANGE ACT OF 1934
For the fiscal year ended
February 2, 2013
OR
¨
TRANSITION REPORT PURSUANT TO SECTION 13 OR 15 (d) OF THE SECURITIES EXCHANGE ACT OF 1934
For the transition period from to
Commission file number: 001-35600
Five Below, Inc.
(Exact name of Registrant as specified in its charter)
|
Pennsylvania
|
75-3000378
|
|||
|
(State or other jurisdiction of
incorporation or organization)
|
(I.R.S. Employer
Identification Number)
|
|||
|
1818 Market Street
Suite 1900 Philadelphia, PA 19103 (Address of Principal Executive Office) |
19103
(Zip Code) |
|||
|
(215) 546-7909
(Registrant's Telephone Number, Including Area Code)
|
||||
|
Securities registered pursuant to Section 12(b) of the Exchange Act:
|
||||
|
Title of each class
|
Name of each exchange on which registered
|
|||
|
Common Stock, $0.01 par value per share
|
The NASDAQ Stock Market LLC
|
|||
|
Securities registered pursuant to Section 12(g) of the Exchange Act:
|
||||
|
Title of each class
|
Name of each exchange on which registered
|
|||
|
Not applicable
|
Not applicable
|
|||
Indicate by check mark if the registrant is a well-known seasoned issuer, as defined in Rule 405 of the securities act. Yes
¨
No
þ
Indicate by check mark if the registrant is not required to file reports pursuant to Section 13 or Section 15(d) of the Act. Yes
¨
No
þ
Indicate by check mark whether the registrant (1) has filed all reports required to be filed by Section 13 or 15(d) of the Securities Exchange Act of 1934 during the preceding 12 months (or for such shorter period that the registrant was required to file such reports), and (2) has been subject to such filing requirements for the past 90 days. Yes
þ
No
¨
Indicate by check mark whether the registrant has submitted electronically and posted on its corporate Web site, if any, every Interactive Data File required to be submitted and posted pursuant to Rule 405 of Regulation S-T (§232.405 of this chapter) during the preceding 12 months (or for such shorter period that the registrant was required to submit and post such files). Yes
þ
No
¨
Indicate by check mark if disclosure of delinquent filers pursuant to Item 405 of Regulation S-K (§ 229.405) is not contained herein, and will not be contained, to the best of registrant’s knowledge, in definitive proxy or information statements incorporated by reference in Part III of this
Form 10-K
or any amendment to this
Form 10-K
.
þ
Indicate by check mark whether the registrant is a large accelerated filer, an accelerated filer, a non-accelerated filer, or a smaller reporting company. See the definitions of “large accelerated filer,” “accelerated filer” and “smaller reporting company” in Rule 12b-2 of the Exchange Act. (Check one):
Large Accelerated Filer
¨
Accelerated Filer
¨
Non-Accelerated Filer
þ
Smaller Reporting Company
¨
Indicate by check mark whether the registrant is a shell company (as defined in Rule 12b-2 of the Exchange Act). Yes
¨
No
þ
As of July 27, 2012, the last business day of the registrant's most recently completed second fiscal quarter, the aggregate market value of common stock (based upon the last reported sales price on The NASDAQ Global Select Market) held by non-affiliates of the registrant was approximately
$522,226,200
.
The number of shares of the registrant’s common stock, $0.01 par value, outstanding as of March 27, 2013 was
53,981,282
.
DOCUMENTS INCORPORATED BY REFERENCE
Portions of the registrant's Proxy Statement for the 2013 Annual Meeting of Shareholders to be held on
May 30, 2013
(hereinafter referred to as the “Proxy Statement”) are incorporated by reference into Part III of this report.
SPECIAL NOTE REGARDING FORWARD-LOOKING STATEMENTS
This
Annual Report on Form 10-K
, or
Annual Report
, contains forward-looking statements pursuant to the “safe harbor” provisions of the Private Securities Litigation Reform Act of 1995. Forward-looking statements relate to expectations, beliefs, projections, future plans and strategies, anticipated events or trends and similar expressions concerning matters that are not historical facts or present facts or conditions, such as statements regarding our future financial condition or results of operations, our prospects and strategies for future growth, the introduction of new merchandise, and the implementation of our marketing and branding strategies. In many cases, you can identify forward-looking statements by terms such as “may,” “will,” “should,” “expects,” “plans,” “anticipates,” “believes,” “estimates,” “predicts,” “potential” or the negative of these terms or other comparable terminology.
The forward-looking statements contained in this
Annual Report
reflect our views as of the date of this report about future events and are subject to risks, uncertainties, assumptions and changes in circumstances that may cause events or our actual activities or results to differ significantly from those expressed in any forward-looking statement. Although we believe that the expectations reflected in the forward-looking statements are reasonable, we cannot guarantee future events, results, actions, levels of activity, performance or achievements. A number of important factors could cause actual results to differ materially from those indicated by the forward-looking statements, including, but not limited to, those factors described below, in Part I, Item 1A “Risk Factors,” and in Part II, Item 7 “Management’s Discussion and Analysis of Financial Condition and Results of Operations.” These factors include without limitation:
•
failure to successfully implement our growth strategy;
•
disruptions in our ability to select, obtain, distribute and market merchandise profitably;
•
our ability to successfully expand our distribution network capacity;
•
disruptions to our distribution network or the timely receipt of inventory;
•
inability to attract and retain qualified employees;
•
ability to increase sales and improve the efficiencies, costs and effectiveness of our operations;
|
•
|
our dependence on our executive officers and other key personnel or our inability to hire additional qualified personnel;
|
•
our ability to successfully manage our inventory balances and inventory shrinkage;
•
our lease obligations;
•
changes in our competitive environment, including increased competition from other retailers;
•
increasing costs due to inflation, increased operating costs or energy prices;
•
the seasonality of our business;
•
disruptions to our information technology systems in the ordinary course or as a result of system upgrades;
•
our failure to maintain adequate internal controls;
•
our ability to obtain additional financing;
|
•
|
failure to secure customers’ confidential or credit card information, or other private data relating to our employees or our company;
|
•
natural disasters, unusual weather conditions, pandemic outbreaks, global political events, war and terrorism;
•
current economic conditions and other economic factors;
•
the impact of governmental laws and regulations and the outcomes of legal proceedings;
•
our inability to protect our brand name, trademarks and other intellectual property rights;
•
increased costs as a result of being a public company; and
•
restrictions imposed by our indebtedness on our current and future operations.
Readers are urged to consider these factors carefully in evaluating the forward-looking statements and are cautioned not to place undue reliance on these forward-looking statements. All of the forward-looking statements we have included in this
Annual Report
are based on information available to us on the date of this report. We undertake no obligation to publicly update or revise any forward-looking statement, whether as a result of new information, future events or otherwise, except as otherwise required by law.
|
INDEX
|
|
|
Page
|
|
|
|
|
General
Five Below, Inc. was incorporated in Pennsylvania in January 2002. Our principal executive office is located at 1818 Market Street, Suite 1900, Philadelphia, PA 19103 and our telephone number is (215) 546-7909. Our corporate website address is
www.fivebelow.com
. The information contained on, or accessible through, our corporate website does not constitute part of this Annual Report. As used herein, “Five Below,” the “Company,” “we,” “us,” “our” or “our business” refers to Five Below, Inc., except as expressly indicated or unless the context otherwise requires.
We purchase products in reaction to existing marketplace trends and, hence, refer to our products as “trend-right.” We use the term “dynamic” merchandise to refer to the broad range and frequently changing nature of the products we display in our stores. We use the term “power” shopping center to refer to an unenclosed shopping center with 250,000 to 750,000 square feet of gross leasable area that contains three or more “big box” retailers (large retailers with floor space over 50,000 square feet) and various smaller retailers with a common parking area shared by the retailers. We use the term “lifestyle” shopping center to refer to a shopping center or commercial development that is often located in suburban areas and combines the traditional retail functions of a shopping mall with leisure amenities oriented towards upscale consumers. We use the term “community” shopping center to refer to a shopping area designed to serve a trade area of 40,000 to 150,000 people with a minimum of 430,500 square feet (10 acres) in area, where the lead tenant is a variety discount or junior department store. We use the term “trade area” to refer to the geographic area from which the majority of a given retailer's customers come from. Trade areas vary by market based on geographic size, population density, demographics and proximity to alternative shopping opportunities.
We operate on a fiscal calendar widely used by the retail industry that results in a given fiscal year consisting of a 52- or 53-week period ending on the Saturday closest to January 31 of the following year.
References to “fiscal year 2013” or “fiscal 2013” refer to the period from February 3, 2013 to February 1, 2014 and consists of a 52-week fiscal year.
References to “fiscal year 2012” or “fiscal 2012” refer to the period from January 29, 2012 to February 2, 2013 and consists of a 53-week fiscal year. References to “fiscal year 2011” or “fiscal 2011” refer to the period from January 30, 2011 to January 28, 2012 and consists of a 52-week fiscal year. References to “fiscal year 2010” or “fiscal 2010” refer to the period from January 31, 2010 to January 29, 2011 and consists of a 52-week fiscal year.
References to
2013
,
2012
,
2011
, and
2010
are to our fiscal years unless otherwise specified.
Our Company
Five Below is a rapidly growing specialty value retailer offering a broad range of trend-right, high-quality merchandise targeted at the teen and pre-teen customer. We offer a dynamic, edited assortment of exciting products, all priced at $5 and below, including select brands and licensed merchandise across a number of our category worlds:
Style
,
Room
,
Sports
,
Media
,
Crafts
,
Party, Candy
and
Now (also known as "Seasonal")
. We believe we are transforming the shopping experience of our target demographic with a unique merchandising strategy and high-energy retail concept that our customers consider fun and exciting. Based on management’s experience and industry knowledge, we believe our compelling value proposition and the dynamic nature of our merchandise offering has fostered universal appeal to teens and pre-teens, as well as customers across a variety of age groups beyond our target demographic.
We opened the first Five Below store in the greater Philadelphia area in 2002 and, since then, have been expanding contiguously across the eastern half of the United States of America. As of
February 2, 2013
, we operated a total of
244
locations across
18
states. Our stores average approximately
7,500
square feet and are typically located within power, community and lifestyle shopping centers across a variety of urban, suburban and semi-rural markets. We opened
52
stores in fiscal 2012 and plan to open approximately
60
net new stores in fiscal
2013
. We believe that we have the opportunity to grow our store base to more than
2,000 locations over time
.
We believe our business model has resulted in strong financial performance irrespective of the economic environment:
|
•
|
We have achieved positive comparable store sales during each of the last 27 fiscal quarters.
|
|
•
|
Our comparable store sales increased by
7.1%
in fiscal
2012
,
7.9%
in fiscal
2011
, and
15.6%
in fiscal
2010
with positive comparable store sales performance across all geographic regions and store-year classes.
|
|
•
|
We expanded our store base from
142
stores at the end of fiscal year
2010
to
244
stores at the end of fiscal year
2012
, representing a compound annual growth rate of
31.1%
.
|
|
•
|
Between fiscal
2010
and
2012
, our net sales increased from
$197.2 million
to
$418.8 million
, representing a compound annual growth rate of
45.7%
. Over the same period, our operating income increased from
$11.8 million
to
$37.7 million
, representing a compound annual growth rate of
78.7%
.
|
4
Our Competitive Strengths
We believe the following strengths differentiate Five Below from competitors and are the key drivers of our success:
|
•
|
Unique Focus on the Teen and Pre-Teen Customer.
We target an attractive customer segment of teens and pre-teens with trend-right merchandise at a differentiated price point of $5 and below. We have built our concept to appeal to this customer base, which we believe to be economically influential and resilient based on our industry knowledge and experience, as well as their parents and others who shop for them. Our brand concept, merchandising strategy and store ambience work in concert to create an upbeat and vibrant retail experience that is designed to appeal to our target audience, drive traffic to our stores and keep our customers engaged throughout their visits. We monitor trends in the ever-changing teen and pre-teen markets and are able to quickly identify and respond to trends that become mainstream. Our price points enable teens and pre-teens to shop independently, often using their own money to make frequent purchases of items geared primarily to them and to exercise self-expression through their independent retail purchases.
|
|
•
|
Broad Assortment of Trend-Right, High-Quality Merchandise with Universal Appeal.
We deliver an edited assortment of trend-right as well as everyday products within each of our category worlds that changes frequently to create a sense of anticipation and freshness, which we believe provides excitement for our customers. We have a broad range of vendors, most of which are domestically-based, which enables us to shorten response lead times, maximizes our speed to market and equips us to make more informed buying decisions. Our unique approach encourages frequent customer visits and limits the cyclical fluctuations experienced by many other specialty retailers. The breadth, depth and quality of our product mix and the diversity of our category worlds attract shoppers across a broad range of age and socio-economic demographics.
|
|
•
|
Exceptional Value Proposition for Customers.
We believe we offer a clear value proposition to our customers. Our price points of $5 and below resonate both with our target demographic and also with other value-oriented customers. We are able to deliver on this value proposition through sourcing products in a manner that is designed to achieve low cost, fast response and high item velocity and sell-through. We maintain a dynamic and collaborative relationship with our vendor partners that provides us with favorable access to quality merchandise at attractive prices. We also employ an opportunistic buying strategy, capitalizing on select excess inventory opportunities with our vendors. This unique and flexible sourcing strategy allows us to offer high-quality products at exceptional value across all of our category worlds.
|
|
•
|
Differentiated Shopping Experience.
We believe we have created a unique and engaging in-store atmosphere that customers find fun and exciting. While we refresh our products frequently, we maintain a consistent floor layout, designed with an easy-to-navigate racetrack flow and featuring sight-lines across the entire store enabling customers to easily identify our category worlds. All of our stores feature a sound system playing trend-right music throughout the shopping day. We employ novel and dynamic techniques to display our products, including distinctive merchandise fixtures and colorful and stimulating signage, which attract customers, encourage hands-on interaction with our products, and convey our value pricing. We have developed a unique culture that emanates from our employees, many of whom frequently shop at Five Below, to our customers, thereby driving a higher level of connectivity and engagement. Additionally, we believe our price points of $5 and below, coupled with our dynamic merchandising approach, create an element of discovery, driving repeat visits and customer engagement while insulating us against e-commerce cannibalization trends.
|
|
•
|
Powerful and Consistent Store Economics.
We have a proven store model that generates strong cash flow, consistent store-level financial results and high level return on investment. Our stores have been successful in varying geographic regions, population densities and real estate settings. Each of our stores was profitable on a four-wall basis in
fiscal 2012
and our new stores have achieved average payback periods of less than one year. We believe our robust store model, reinforced by our rigorous site selection process and in-store execution, drives the strength and consistency of our comparable store sales financial results across all geographic regions and store-year classes.
|
|
•
|
Highly Experienced and Passionate Senior Management Team with Proven Track Record.
Since our inception, our co-founders, David Schlessinger and Thomas Vellios, who have approximately
66
combined years of retail experience, have set the vision and strategic direction for Five Below. Messrs. Schlessinger and Vellios have assembled a talented senior management team averaging
25
years of retail experience across a broad range of disciplines, including merchandising, real estate, finance, store operations, supply chain
|
5
management and information technology. Our management team drives our operating philosophy, which is based on a relentless focus on providing high-quality merchandise at exceptional value and a superior shopping experience utilizing a disciplined, low-cost operating and sourcing structure. We believe our management team is integral to our success and has positioned us well for long-term growth.
Growth Strategy
We believe we can grow our net sales and earnings by executing on the following strategies:
|
•
|
Grow Our Store Base.
We believe there is significant opportunity to expand our store base in the U.S. from
244
locations as of
February 2, 2013
, to more than 2,000 locations within the U.S. over time. Based upon our strategy of store densification in existing markets and expanding into adjacent states and markets, we expect most of our near-term growth will occur within our existing markets as well as contiguous new markets. This strategy allows us to benefit from enhanced brand awareness and achieve operational efficiencies. We opened
50
net new stores in fiscal
2011
,
52
new stores in fiscal
2012
, and plan to open approximately
60
net new stores in fiscal 2013. Our stores average approximately
7,500
square feet and are primarily inline locations within power, community and lifestyle shopping centers across a variety of urban, suburban and semi-rural markets. We have a talented and disciplined real estate management team and a rigorous real estate site selection process. We analyze the demographics of the surrounding trade areas, the performance of adjacent retailers as well as traffic and specific site characteristics and other variables. As of
February 2, 2013
, we have executed lease agreements for the opening of
51
new stores in fiscal
2013
.
|
|
•
|
Drive Comparable Store Sales.
We expect to continue generating positive comparable store sales growth by continuing to hone and refine our dynamic merchandising offering and differentiated in-store shopping experience. We intend to increase our brand awareness through cost-effective marketing efforts and enthusiastic customer engagement. We believe that executing on these strategies will increase the size and frequency of purchases by our existing customers and attract new customers to our stores.
|
|
•
|
Increase Brand Awareness.
We have a cost-effective marketing strategy designed to drive store traffic and promote brand awareness. Our strategy includes the use of newspaper circulars, local media and grassroots marketing to support existing and new market entries. We believe we have an opportunity to leverage our growing social media presence to drive brand excitement and increased store visits within existing and new markets. We believe our online platform is an extension of our brand and retail stores, serving as a marketing and informational tool for us. This platform allows us to continue to build brand awareness and expand our customer base.
|
|
•
|
Enhance Operating Margins.
We believe we have further opportunities to drive margin improvement over time. A primary driver of our expected margin expansion will come from leveraging our cost structure as we continue to increase our store base and drive our average net sales per store. We intend to capitalize on opportunities across our supply chain as we grow our business and achieve further economies of scale.
|
Our History
Five Below, Inc. was founded in 2002 by our Executive Chairman, David Schlessinger, and our President and Chief Executive Officer, Thomas Vellios, who recognized a market need for a fun and affordable shopping destination aimed at our target customer. The Company was incorporated in Pennsylvania in January 2002 under the name of Cheap Holdings, Inc. We changed our name to Five Below, Inc. in August 2002. In October 2010, Advent International Corporation, or Advent, acquired a majority interest in Five Below, which we refer to as the 2010 Transaction, with the goal of supporting the management team in accelerating our growth.
On July 24, 2012, we completed our initial public offering, or IPO, of 11,057,692 shares of common stock at a price of $17.00 per share. Of the shares sold in the IPO, 4,807,692 shares were sold by the Company and 6,250,000 shares were sold by the selling shareholders. In February 2013, certain of our shareholders sold
13,012,250
shares of common stock in a secondary public offering. Our common stock is listed on The NASDAQ Global Select Market under the symbol “FIVE.” As of February 4, 2013, Advent owned approximately 32% of our outstanding common stock.
Our Market Opportunity
As a result of our unique merchandise offering and value proposition, we believe we have effectively tapped the teen and pre-teen markets. According to the U.S. Census Bureau, there were over 63 million people in the U.S. between the ages of 5 and 19, which represented over 20% of the U.S. population as of April 1, 2010. Based on management’s experience and
6
industry knowledge, we believe that this segment of the population has a significant amount of disposable income as the vast majority of this age group’s basic needs are already met.
Our Merchandise
Strategy
We offer a dynamic, edited assortment of trend-right, high-quality products, all priced at $5 or below, including select brands and licensed merchandise, targeted at the teen and pre-teen customer. We believe we are transforming the shopping experience of our target demographic with a unique merchandising strategy and high-energy retail concept that our customers consider fun and exciting. Based on management’s experience and industry knowledge, we believe our compelling value proposition and the dynamic nature of our merchandise offering has fostered universal appeal to customers across a variety of age groups beyond our target demographic.
Our typical store features in excess of 4,000 stock-keeping units, or SKUs, across a number of our category worlds including
Style
,
Room
,
Sports
,
Media
,
Crafts
,
Party, Candy
and
Now
. We focus our merchandising strategy on maintaining core categories within our stores, but aim to generate high item velocity and sell-through to keep our assortment fresh and drive repeat visits. We monitor trends in our target demographic market, historical sales trends of current and prior products and the success of new product launches to ensure that our merchandise is relevant for our customers. We have a highly planned merchandise strategy focused on trend-right and everyday products supplemented by selected opportunistic purchases from our vendors to drive traffic and therefore offer our customers a consistently exciting shopping experience.
We believe we offer a compelling value proposition to our customers across all of our core product categories. The common element of our dynamic merchandise selection is the consistent delivery of exceptional value to the consumer, with all products offered at or below the $5 price point. Pricing all items at $5 or below enables us to provide an extensive range of exciting products, while maintaining the attraction of a value retailer. Many of the products we sell can also be found in mall specialty stores, department stores, mass merchandisers and drug stores; however, we offer all of these products in an exciting and easy to shop retail environment at price points of $5 and below.
Product Mix
We organize the merchandise in our stores into the following category worlds:
|
•
|
Style
: Consists primarily of accessories such as novelty socks, sunglasses, jewelry, scarves, gloves, hair accessories and “attitude” t-shirts. Our beauty offering includes products such as nail polish, lip gloss, fragrance and branded cosmetics.
|
|
•
|
Room
: Consists of items used to complete and personalize our customer’s living space, including glitter lamps, posters, frames, fleece blankets, pillows, candles, incense and related items. We also offer storage options for the customer’s room and locker.
|
|
•
|
Sports
: Consists of an assortment of sport balls, team sports merchandise and fitness accessories, including hand weights, jump ropes and gym balls. We also offer a variety of games, including name brand board games, puzzles, toys and plush items. In the summer season, our sports offering also includes pool, beach and outdoor toys, games and accessories.
|
|
•
|
Media
: Consists of a selection of accessories for PCs, cell phones, MP3 players and tablet computers. The offering includes cases, chargers, headphones and other related items. We also carry a range of media products including books, video games and DVDs.
|
|
•
|
Crafts
: We offer an assortment of craft activity kits, as well as arts and crafts supplies such as crayons, markers and stickers. We also offer trend-right items for school such as backpacks, fashion notebooks and journals, novelty pens and pencils, as well as everyday name brand items.
|
|
•
|
Party
: Consists of party goods, decorations and greeting cards, as well as every day and special occasion merchandise.
|
|
•
|
Candy
: Consists of branded items that appeal to teens and pre-teens. This category includes an assortment of classic and novelty candy bars and movie-size box candy as well as gum and snack food. We also sell chilled drinks via coolers.
|
7
|
•
|
Now
: Consists of seasonally-specific items used to celebrate and decorate for events such as Christmas, Easter, Halloween and St. Patrick’s Day. These products are most often placed at the front of the store.
|
Set forth below is data for the following groups of products – leisure, fashion and home, and party and snack. During
fiscal 2012
, certain historical SKUs were re-assigned to reflect our current product grouping. The percentage of net sales represented by each product group for
fiscal 2011
and
fiscal 2010
give effect to these re-assignments. The percentage of net sales represented by each product group for each of the last three fiscal years was as follows:
|
Sales by Product Group
|
Percentage of Net Sales
|
|||||||
|
2012
|
2011
|
2010
|
||||||
|
Leisure
|
52.6
|
%
|
50.6
|
%
|
50.6
|
%
|
||
|
Fashion and home
|
30.3
|
%
|
31.7
|
%
|
32.2
|
%
|
||
|
Party and snack
|
17.1
|
%
|
17.7
|
%
|
17.2
|
%
|
||
|
Total
|
100.0
|
%
|
100.0
|
%
|
100.0
|
%
|
||
Leisure
includes items such as sporting goods, games, toys, media, books, electronic accessories, and arts and crafts.
Fashion and home
includes items such as personal accessories, “attitude” t-shirts, beauty offerings, home goods and storage options.
Party and snack
includes items such as party and seasonal goods, greeting cards, candy and other snacks, and beverages.
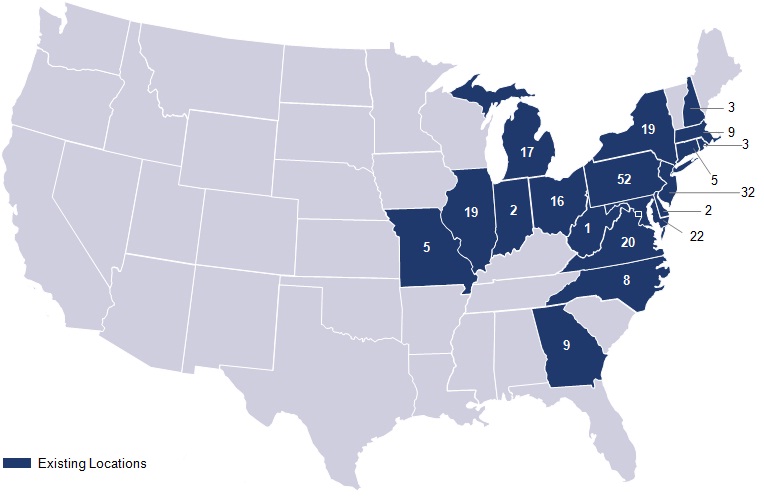
Our Stores
As of
February 2, 2013
, we operated
244
stores throughout the eastern half of the U.S. In fiscal
2012
, our average store size was approximately
7,500
square feet. Our stores are primarily located in power, community and lifestyle shopping centers; only approximately
4%
of our stores are located in malls. The following map shows the number of stores in each of the states in which we operated as of
February 2, 2013
.
Store Design and Layout
We present our products in a unique and engaging in-store atmosphere. We maintain a consistent floor layout designed with an easy-to-navigate racetrack flow and featuring sight-lines across the entire store enabling customers to easily identify our category worlds. All of our stores feature a sound system playing popular music throughout the shopping day. We employ novel and dynamic techniques to display our products, including distinctive merchandise fixtures and colorful and stimulating signage, which attract customers, encourage hands-on interaction with our products and convey our value pricing. In addition
8
to traditional perimeter and gondola shelving, racks and tables, we utilize innovative approaches such as wheelbarrows, barrels and bins strategically placed throughout our stores. These techniques foster customer interaction with products, supporting the strong relationship we strive to develop with our customers and enhance our upbeat and vibrant shopping environment.
Each of our category worlds is strategically located within our stores in an effort to enhance the customer’s shopping experience. For example, Now offerings are located in the front of the store with the goal of catching customers’ attention and being “top of mind,” and specially featured value “wow” items and other key items are positioned along the center aisle. Impulse items and “dollar value” tables surround the checkout areas to capture add-on purchases.
Expansion Opportunities and Site Selection
Our unique focus on the teen and pre-teen customer is supported by our real estate strategy to locate stores in high-visibility locations. We seek to operate stores in high-visibility, high-traffic retail venues, which reinforce our brand message, heighten brand awareness and drive customer traffic.
Our strategy is to saturate markets with clusters of stores because of the considerable benefit that stores derive from market concentration. Our store model is profitable across a variety of urban, suburban and semi-rural markets and in multiple real estate venues including power, community and lifestyle shopping centers. Our retail concept works well with a large and varied group of national co-tenants that drive customer traffic.
We select store sites for new store openings based upon certain criteria including minimum population density requirements, availability of attractive lease terms, sufficient space and strong positioning within a center. Members of our real estate team spend considerable time evaluating prospective sites before bringing a proposal to our real estate committee. Our real estate committee, which is composed of senior management including our executive officers, approves all of our locations before a lease is signed.
We believe there is a significant opportunity to expand our store base in the U.S. We opened
52
new stores in fiscal
2012
and we intend to open approximately
60
net new stores in fiscal
2013
through expansion in existing markets and by entering new markets. We maintain a pipeline of real estate sites that have been approved by our real estate committee and have executed
51
leases through
February 2, 2013
, for new stores in fiscal
2013
. Our recent store growth is summarized in the following table:
|
Period
|
Stores at
Start of
Period
|
Stores
Opened
|
Stores
Closed
|
Net
Store
Increase
|
Stores at
End of
Period
|
|||||||||
|
Fiscal 2010
|
102
|
|
40
|
|
—
|
|
40
|
|
142
|
|
||||
|
Fiscal 2011
|
142
|
|
51
|
|
1
|
|
50
|
|
192
|
|
||||
|
Fiscal 2012
|
192
|
|
52
|
|
—
|
|
52
|
|
244
|
|
||||
During the
twelve months ended
February 2, 2013
,
52
additional stores were opened and
zero
stores closed, bringing the total number of stores open as of
February 2, 2013
to
244
.
Opening stores within existing markets enables Five Below to benefit from enhanced brand awareness and to achieve advertising, operating and distribution efficiencies. Our targeted new store openings include additional locations in existing markets as well as expansion into adjacent states and markets. In existing markets, we use a store densification strategy that promotes brand awareness and leverages marketing, operating and distribution costs. When entering new markets we employ a store clustering strategy, opening multiple stores in a single market on the same day, enabling us to leverage marketing and pre-opening expenses.
Our store growth is supported by our new store economics, which we believe to be compelling. Our new store model assumes an average store size of approximately
7,500
square feet that achieves sales of approximately $1.5 million to $1.6 million in the first full year of operation, which is in line with the average net sales per store of our existing store base over the last two years, and an average new store cash investment of approximately
$0.3 million
, including our store build-out (net of tenant allowances), inventory and cash pre-opening expenses. Our new store model targets an average payback period of less than one year on our initial investment.
Store Management, Culture and Training
Each of our stores is managed by a general manager and one or two assistant managers who oversee full-time and part-time team members within each store. Each general manager is responsible for the day-to-day operations of his or her store,
9
including the unit’s operating results, maintaining a clean and appealing store environment and the hiring, training and development of personnel. We also employ district managers, who are responsible for overseeing the operations of 10 to 15 stores, on average.
We are guided by a philosophy that recognizes strong sales performance and customer service, allowing us to identify and reward team members who meet our high performance standards. Store managers and assistant managers participate in a rewarding bonus incentive program based on exceeding planned levels of sales and are paid on a monthly basis. We also recognize individual performance through internal promotions and provide extensive opportunities for advancement.
Our employees are critical to achieving our goals, and we strive to hire talented employees with high energy levels and motivation. We have well-established store operating policies and procedures and an in-store training program for new store managers, assistant managers and staff. In addition, we have a dedicated group of training and new store opening managers who are focused on ensuring a consistent new store opening process and who leverage their extensive experience and knowledge of the Five Below culture to train new store managers. Our customer service and store procedure training programs are designed to enable associates to assist customers in a friendly manner and to help to create a positive sales-driven environment and culture as well as teach successful operating practices and procedures.
Merchandise Sourcing and Distribution
We have developed a disciplined approach to buying and a dynamic inventory planning and allocation process to support our merchandising strategy.
Merchandising
Our merchandising team consists of an Executive Vice President, Merchandising, who reports directly to our Chief Executive Officer, supported by an approximate 30-member merchandising team. Our merchandising team works directly with our central planning and allocation group to ensure a consistent delivery of products across our store base. Our Executive Vice President, Merchandising has over 20 years of experience within the retail sector.
Sourcing
We believe we have strong sourcing capabilities developed through a dynamic and collaborative relationship with our vendor partners that provides us with favorable access to quality merchandise at attractive prices. We regularly purchase core merchandise in accordance with our key categories. We also employ an opportunistic buying strategy, capitalizing on selected excess inventory opportunities, to purchase complementary merchandise based on consumer trends, product availability and favorable economic terms.
We work with approximately
750
active vendors, with no single vendor representing more than
8%
of our purchases in
fiscal 2012
. We source approximately
85%
of our purchases from domestic vendors. We typically have no long-term supply agreements or exclusive arrangements with our vendors and our top 20 vendors represent approximately
35%
of total goods purchased in
fiscal 2012
.
Distribution
We distribute over 85% of our merchandise from our 421,000 square foot distribution center in New Castle, Delaware with the remaining merchandise shipped directly from the vendor to our stores. We realize cost savings by working with our vendors to streamline and reduce packaging to diminish shipping costs.
We generally ship merchandise from our distribution center to our stores between two and four times a week, depending on the season and the volume of a specific store. We use contract carriers to ship merchandise to our stores.
During fiscal 2012, we signed a lease for a second distribution center in Olive Branch, Mississippi, to support our growth, which we
expect to be fully operational during fiscal 2013
. From time to time, we augment our distribution facilities with third-party warehousing.
Marketing and Advertising
Our cost-effective marketing strategy is designed to drive store traffic and increase brand awareness with our target demographic, as well as other value-oriented customers. Our strategy includes the use of newspaper circulars focused during peak selling seasons that highlight our brand and exceptional value proposition as well as local media and grassroots marketing
10
to support existing and new market entries. Additionally, we rely on the strong visibility and the presence of our store locations, email messaging and community and school marketing to promote and further our brand image and drive traffic.
Our marketing team works with our merchandising team to develop novel and dynamic techniques to display our products, including distinctive merchandise fixtures and colorful and stimulating signage, which attract customers, encourage hands-on interaction with our products and convey our value pricing.
For new store openings, we seek to create community awareness and consumer excitement through a mix of print advertising, public relations and radio promoting the grand opening and by creating an on-site grand opening event that includes free drinks and signature “Five Cent” hot dogs. We also aim to target multiple store openings in a given new market on the same day in order to leverage marketing efforts to produce maximum impact.
In addition to our marketing and public relations efforts described above, we also maintain a website (
www.fivebelow.com
) and, over the last year, our online following has grown substantially. We use both our website and social networking sites to highlight our value proposition, store locations, employment opportunities, featured products and grand openings.
Competition
We compete with a broad range of retailers including discount, mass merchandise, grocery, drug, convenience, variety and other specialty stores. Many of these retail companies operate stores in many of the areas where we operate, and many of them engage in extensive advertising and marketing efforts.
The principal basis upon which we compete is by offering a dynamic, edited assortment of exciting products, all priced at $5 or below and including select brands and licensed merchandise, targeted at the teen and pre-teen customer. We believe we are transforming the shopping experience of our target demographic with a unique merchandising strategy and high-energy retail concept that our customers consider fun and exciting. Our success also depends in substantial part on our ability to respond quickly to trends so that we can meet the changing demands of our customers. We believe that we compare favorably relative to many of our competitors based on our merchandising strategy, edited product assortment targeted at teens and pre-teens, store environment, flexible real estate strategy and company culture. Nonetheless, certain of our competitors have greater financial, distribution, marketing and other resources than we do.
Trademarks and Other Intellectual Property
We own several trademarks that have been registered with the U.S. Patent and Trademark Office, including Five Below
®
and Five Below Hot Stuff. Cool Prices
®
. We also own domain names, including
www.fivebelow.com
, and unregistered copyrights in our website content. We attempt to obtain registration of our trademarks whenever practicable and pursue any infringement of those marks. Solely for convenience, trademarks and trade names referred to in this document may appear without the ® or ™ symbols, but such references are not intended to indicate, in any way, that we will not assert, to the fullest extent under applicable law, our rights or the rights of the applicable licensor to these trademarks and trade names. We also refer to product names, trademarks, trade names and service marks that are the property of other companies.
Management Information Systems
Our management information systems provide a full range of business process assistance and timely information to support our merchandising strategy, warehouse management, stores and operating and financial teams. We believe our current systems provide us with operational efficiencies, scalability, management control and timely reporting that allow us to identify and respond to merchandising and operating trends in our business. We use a combination of internal and external resources to support store point-of-sale, merchandise planning and buying, inventory management, financial reporting, real estate and administrative functions.
Government Regulation
We are subject to labor and employment laws, laws governing advertising, privacy laws, safety regulations and other laws, including consumer protection regulations that regulate retailers and/or govern the promotion and sale of merchandise and the operation of stores and warehouse facilities. We monitor changes in these laws and believe that we are in material compliance with applicable laws.
11
Insurance
We maintain third-party insurance for a number of risk management activities including workers’ compensation, general liability, property and employee-related health care benefits. We evaluate our insurance requirements on an ongoing basis to ensure we maintain adequate levels of coverage.
Employees
As of
February 2, 2013
, we employed approximately
750
full-time and
3,000
part-time personnel. Of our total employees, approximately
160
were based at our corporate headquarters in Philadelphia, Pennsylvania, approximately
140
were based at our distribution center in New Castle, Delaware and approximately
3,450
were store employees. The number of part-time associates fluctuates depending on seasonal needs. We consider our relationship with our employees to be very good. None of our employees belong to a union or are party to any collective bargaining or similar agreement.
Seasonality
Our business is seasonal in nature and demand is generally the highest in the fourth fiscal quarter due to the year-end holiday season. To prepare for the holiday season, we must order and keep in stock more merchandise than we carry during other parts of the year. We expect inventory levels, along with an increase in accounts payable and accrued expenses, generally to reach their highest levels in the third and fourth fiscal quarters in anticipation of the increased net sales during the year-end holiday season. As a result of this seasonality, and generally because of variation in consumer spending habits, we experience fluctuations in net sales and working capital requirements during the year.
You should consider carefully the following risks and uncertainties when reading this
Annual Report
. If any of the following risks actually occurs, our business, financial condition and results of operations could be materially and adversely affected. In that event, the trading price of our common stock could decline. Although we believe that we have identified and discussed below the key risk factors affecting our business, there may be additional risks and uncertainties that are not presently known or that are not currently believed to be significant that may adversely affect our performance or financial condition.
Risks Relating to Our Business and Industry
We may not be able to successfully implement our growth strategy on a timely basis or at all, which could harm our growth and results of operations.
Our growth is dependent on our ability to open profitable new stores. We believe we have an opportunity to continue to grow our store base from
244
stores in
18
states as of
February 2, 2013
, to more than
2,000 locations over time
.
Our ability to open profitable new stores depends on many factors, including our ability to:
|
•
|
identify suitable markets and sites for new stores;
|
|
•
|
negotiate leases with acceptable terms;
|
|
•
|
achieve brand awareness in the new markets;
|
|
•
|
efficiently source and distribute additional merchandise;
|
|
•
|
maintain adequate distribution capacity, information systems and other operational system capabilities;
|
|
•
|
hire, train and retain store management and other qualified personnel; and
|
|
•
|
achieve sufficient levels of cash flow and financing to support our expansion.
|
Unavailability of attractive store locations, delays in the acquisition or opening of new stores, delays or costs resulting from a decrease in commercial development due to capital constraints, difficulties in staffing and operating new store locations or lack of customer acceptance of stores in new market areas may negatively impact our new store growth and the costs or the profitability associated with new stores.
Additionally, some of our new stores may be located in areas where we have little experience or a lack of brand recognition. Those markets may have different competitive conditions, market conditions, consumer tastes and discretionary spending patterns than our existing markets, which may cause these new stores to be less successful than stores in our existing markets. Other new stores may be located in areas where we have existing stores. Although we have experience in these
12
markets, increasing the number of locations in these markets may result in inadvertent over-saturation of markets and temporarily or permanently divert customers and sales from our existing stores, thereby adversely affecting our overall financial performance.
Accordingly, we cannot assure you that we will achieve our planned growth or, even if we are able to grow our store base as planned, that any new stores will perform as planned. If we fail to successfully implement our growth strategy, we will not be able to sustain the rapid growth in sales and profits that we expect, which would likely have an adverse impact on the price of our common stock.
Any disruption in our ability to select, obtain, distribute and market merchandise attractive to customers at prices that allow us to profitably sell such merchandise could impact our business negatively.
We generally have been able to select and obtain sufficient quantities of attractive merchandise at prices that allow us to be profitable. If we are unable to continue to select products that are attractive to our customers, to obtain such products at costs that allow us to sell such products at a profit, or to market such products effectively to consumers, our sales or profitability could be affected adversely. In addition, the success of our business depends in part on our ability to anticipate, identify and respond promptly to evolving trends in demographics and consumer preferences, expectations and needs. If we are unable to quickly respond to developing trends or if the spending patterns or demographics of these markets change, and we do not timely and appropriately respond to such changes, then the demand for our products, which are discretionary, and our market share could be adversely affected. Failure to maintain attractive stores and to timely identify or effectively respond to changing consumer needs, preferences and spending patterns could adversely affect our relationship with customers, the demand for our products and our market share.
Any disruption in the supply or increase in pricing of our merchandise could negatively impact our ability to achieve anticipated operating results. The products we sell are sourced from a wide variety of domestic and international vendors. We have not experienced any difficulty in obtaining sufficient quantities of core merchandise and believe that, if one or more of our current sources of supply become unavailable, we would generally be able to obtain alternative sources without experiencing a substantial disruption of our business. However, such alternative sources could increase our merchandise costs and reduce the quality of our merchandise, and an inability to obtain alternative sources could affect our sales.
A significant majority of our merchandise is manufactured outside the United States, and changes in the prices and flow of these goods for any reason could have an adverse impact on our operations. The United States and other countries have occasionally proposed and enacted protectionist trade legislation, which may result in changes in tariff structures and trade policies and restrictions that could increase the cost or reduce the availability of certain merchandise. Any of these or other measures or events relating to vendors and the countries in which they are located or where our merchandise is manufactured, some or all of which are beyond our control, can negatively impact our operations, increase costs and lower our margins. Such events or circumstances include, but are not limited to:
|
•
|
political and economic instability;
|
|
•
|
the financial instability and labor problems of vendors;
|
|
•
|
the availability and cost of raw materials;
|
|
•
|
merchandise quality or safety issues;
|
|
•
|
changes in currency exchange rates;
|
|
•
|
inflation; and
|
|
•
|
transportation availability and cost.
|
These and other factors affecting our vendors and our access to products could affect our financial performance adversely.
Our new store growth is dependent upon our ability to successfully expand our distribution network capacity, and failure to achieve or sustain these plans could affect our performance adversely.
We maintain a distribution center in New Castle, Delaware and during fiscal 2012, we signed a lease for a new distribution center in Olive Branch, Mississippi to support our growth objectives. We expect the new distribution center to be fully operational during fiscal 2013. Delays in opening this new distribution center (or new distribution centers in the future) could adversely affect our future operations by slowing store growth, which could in turn reduce sales growth. In addition, any distribution-related construction or expansion projects entail risks which could cause delays and cost overruns, such as: shortages of materials; shortages of skilled labor or work stoppages; unforeseen construction, scheduling, engineering, environmental or geological problems; weather interference; fires or other casualty losses; and unanticipated cost increases.
13
The completion date and ultimate cost of future projects, including the distribution center planned for fiscal 2013, could differ significantly from initial expectations due to construction-related or other reasons. We cannot guarantee that any project will be completed on time or within established budgets.
A significant disruption to our distribution network or to the timely receipt of inventory could adversely impact sales or increase our transportation costs, which would decrease our profits.
We currently rely primarily on our distribution center in New Castle, Delaware to distribute our products. Because most of our products are distributed from this center, the loss of our distribution center, due to natural disaster or otherwise, would materially affect our operations. We also rely upon independent third-party transportation to provide goods to our stores in a timely and cost-effective manner, through deliveries to our distribution center from vendors and then from the distribution center or direct ship vendors to our stores. Our use of outside delivery services for shipments is subject to risks outside of our control and any disruption, unanticipated expense or operational failure related to this process could affect store operations negatively. For example, unexpected delivery delays or increases in transportation costs (including through increased fuel costs or a decrease in transportation capacity for overseas shipments) could significantly decrease our ability to generate sales and earn profits. In addition, labor shortages or work stoppages in the transportation industry or long-term disruptions to the national and international transportation infrastructure that lead to delays or interruptions of deliveries could negatively affect our business. If we change shipping companies, we could face logistical difficulties that could adversely impact deliveries and we would incur costs and expend resources in connection with such change. Moreover, we may not be able to obtain terms as favorable as those received from the independent third-party transportation providers we currently use, which would increase our costs.
Inability to attract and retain qualified employees, particularly senior management and district, store and distribution center managers, and to control labor costs, as well as other labor issues, could adversely affect our business.
Our growth could be adversely impacted by our inability to attract, retain and motivate qualified employees at the store operations level, in distribution facilities, and at the corporate level, at costs which allow us to profitably conduct our operations. Our ability to meet our labor needs, while controlling our labor costs, is subject to many external factors, including competition for and availability of qualified personnel in a given market, unemployment levels within those markets, prevailing wage rates, minimum wage laws, health and other insurance costs, and changes in employment and labor laws (including changes in the process for our employees to join a union) or other workplace regulation. To the extent a significant portion of our employee base unionizes, or attempts to unionize, our labor costs could increase. In addition, we believe the current pricing of our healthcare costs includes the potential future impact of recently enacted comprehensive healthcare reform legislation, but such legislation may further cause our healthcare costs to increase. While significant costs of the healthcare reform legislation may occur after 2013 due to provisions of the legislation being phased in over time, changes to our healthcare costs structure could have a significant negative effect on our business. In addition, our ability to pass along any increase in labor costs to our customers is constrained by our low price model.
Our growth from existing stores is dependent upon our ability to increase sales and improve the efficiencies, costs and effectiveness of our operations, and failure to achieve or sustain these plans could affect our performance adversely.
Increases in sales in existing stores are dependent on factors such as competition, merchandise selection, store operations and customer satisfaction. If we fail to realize our goals of successfully managing our store operations and increasing our customer retention and recruitment levels, our sales may not increase and our growth may be impacted adversely.
Our success depends on our executive officers and other key personnel. If we lose our executive officers or any other key personnel, or are unable to hire additional qualified personnel, our business could be harmed.
Our future success depends to a significant degree on the skills, experience and efforts of our executive officers and other key personnel, including Messrs. Schlessinger and Vellios, our founders. The loss of the services of any of our executive officers or other key personnel could have an adverse effect on our operations. Our future success will also depend on our ability to attract, retain and motivate qualified personnel, as a failure to attract these key personnel could have an adverse effect on our operations. We do not currently maintain key person life insurance policies with respect to our executive officers or key personnel.
Our cash flows from operations may be negatively affected if we are not successful in managing our inventory balances and inventory shrinkage.
Our inventory balance represented approximately
32%
of our total assets as of
February 2, 2013
. Efficient inventory management is a key component of our business success and profitability. To be successful, we must maintain sufficient
14
inventory levels to meet our customers’ demands without allowing those levels to increase to such an extent that the costs to store and hold the goods unduly impacts our financial results. If our buying decisions do not accurately predict customer trends or purchasing actions, we may have to take unanticipated markdowns to dispose of excess inventory, which also can adversely impact our financial results. We also experience inventory shrinkage, and we cannot assure you that incidences of inventory loss and theft will stay at acceptable levels or decrease in the future, or that the measures we are taking will effectively address the problem of inventory shrinkage. We continue to focus on ways to reduce these risks, but we cannot assure you that we will be successful in our inventory management. If we are not successful in managing our inventory balances, our cash flows from operations may be negatively affected.
Our business requires that we lease substantial amounts of space and there can be no assurance that we will be able to continue to lease space on terms as favorable as the leases negotiated in the past.
We do not own any real estate. Instead, we lease all of our store locations, as well as our corporate headquarters and distribution facilities in New Castle, Delaware and Olive Branch, Mississippi. Our stores are leased from third parties, with typical initial lease terms of five to ten years. Many of our lease agreements also have additional five-year renewal options. We believe that we have been able to negotiate favorable rental rates and tenant allowances over the last few years due in large part to the state of the economy and higher than usual vacancy rates in shopping centers and regional malls. These trends may not continue, and there is no guarantee that we will be able to continue to negotiate such favorable terms. Many of our lease agreements have defined escalating rent provisions over the initial term and any extensions. Increases in our occupancy costs and difficulty in identifying economically suitable new store locations could have significant negative consequences, which include:
|
•
|
requiring that a greater portion of our available cash be applied to pay our rental obligations, thus reducing cash available for other purposes and reducing our profitability;
|
|
•
|
increasing our vulnerability to general adverse economic and industry conditions; and
|
|
•
|
limiting our flexibility in planning for, or reacting to changes in, our business or in the industry in which we compete.
|
We depend on cash flow from operations to pay our lease expenses and to fulfill our other cash needs. If our business does not generate sufficient cash flow from operating activities to fund these expenses and needs and sufficient funds are not otherwise available to us, we may not be able to service our lease expenses, grow our business, respond to competitive challenges or fund our other liquidity and capital needs, which could harm our business. Additional sites that we lease may be subject to long-term non-cancelable leases if we are unable to negotiate our current standard lease terms. If an existing or future store is not profitable, and we decide to close it, we may nonetheless be committed to perform our obligations under the applicable lease including, among other things, paying the base rent for the balance of the lease term. Moreover, even if a lease has an early cancellation clause, we may not satisfy the contractual requirements for early cancellation under that lease. In addition, if we are not able to enter into new leases or renew existing leases on terms acceptable to us, this could have an adverse effect on our results of operations.
We operate in a competitive environment and, as a result, we may not be able to compete effectively or maintain or increase our sales, market shares or margins.
We operate in a highly competitive retail environment with numerous competitors, some of which have greater resources or better brand recognition than we do. We compete with respect to customers, price, store location, merchandise quality, assortment and presentation, in-stock consistency, customer service and employees. This competitive environment subjects us to various risks, including the ability to provide quality, trend-right merchandise to our customers at competitive prices that allow us to maintain our profitability. Because of our low price model, we may have limited ability to increase prices in response to increased costs without losing competitive position which may adversely affect our margins and financial performance. In addition, price reductions by our competitors may result in the reduction of our prices and a corresponding reduction in our profitability.
Consolidation among retailers, changes in pricing of merchandise or offerings of other services by competitors could have a negative impact on the relative attractiveness of our stores to consumers. We do not possess exclusive rights to many of the elements that comprise our in-store experience and product offerings. Our competitors may seek to copy our business strategy and in-store experience, which could result in a reduction of any competitive advantage or special appeal that we might possess. In addition, most of our products are sold to us on a non-exclusive basis. As a result, our current and future competitors may be able to duplicate or improve on some or all of our in-store experience or product offerings that we believe are important in differentiating our stores and our customers’ shopping experience. If our competitors were to duplicate or improve on some or all of our in-store experience or product offerings, our competitive position and our business could suffer.
15
Our ability to provide quality, trend-right products while offering attractive, competitively-priced products could be impacted by various actions of our competitors that are beyond our control.
Our profitability is vulnerable to inflation, cost increases and energy prices.
Future increases in costs such as the cost of merchandise, shipping rates, freight costs, fuel costs and store occupancy costs may reduce our profitability, particularly given our $5 and below pricing model. These cost increases may be the result of inflationary pressures that could further reduce our sales or profitability. Increases in other operating costs, including changes in energy prices, wage rates and lease and utility costs, may increase our cost of goods sold or operating expenses. Our low price model and competitive pressures in our industry may have the effect of inhibiting our ability to reflect these increased costs in the prices of our products and therefore reduce our profitability.
Our business is seasonal, and adverse events during the holiday season could impact our operating results negatively.
Our business is seasonal, with the highest percentage of sales (approximately
42%
of total annual sales over the last two fiscal years) occurring during the last fiscal quarter (November, December and January), which includes the holiday season. We purchase substantial amounts of inventory in the end of the third quarter (October) and beginning of the fourth quarter (November and December) and incur higher shipping costs and higher payroll costs in anticipation of the increased sales activity during these time periods. Adverse events, such as deteriorating economic conditions, higher unemployment, higher gas prices, public transportation disruptions or unusual weather could result in lower-than-planned sales during the holiday season which may lead to unanticipated markdowns. Since we rely on third parties for transportation and use third party warehouses when we build up inventory, a number of these factors are outside of our control. An unsuccessful fourth quarter, or holiday season, will have a substantial negative impact on our financial condition and results of operations for the entire fiscal year.
Material damage to, or interruptions to, our technology systems as a result of external factors, staffing shortages and difficulties in updating our existing technology or developing or implementing new technology could have a material adverse effect on our business or results of operations.
We depend on a variety of information technology systems for the efficient functioning of our business. Such systems are subject to damage or interruption from power outages, computer and telecommunications failures, computer viruses, security breaches and natural disasters. Damage or interruption to these systems may require a significant investment to fix or replace them, and we may suffer interruptions in our operations in the interim. Any material interruptions may have a material adverse effect on our business or results of operations.
We also rely heavily on our information technology staff. Failure to meet these staffing needs may negatively affect our ability to fulfill our technology initiatives while continuing to provide maintenance on existing systems. We rely on certain vendors to maintain and periodically upgrade many of these systems so that they can continue to support our business. The software programs supporting many of our systems were licensed to us by independent software developers. The inability of these developers or us to continue to maintain and upgrade these information systems and software programs would disrupt or reduce the efficiency of our operations if we are unable to convert to alternate systems in an efficient and timely manner. In addition, costs and potential problems and interruptions associated with the implementation of new or upgraded systems and technology, or with maintenance or adequate support of existing systems could also disrupt or reduce the efficiency of our operations.
Failure to maintain adequate financial and management processes and controls could lead to errors in our financial reporting, which could harm our business and cause a decline in our stock price.
Reporting obligations as a public company and our anticipated growth are likely to place a considerable strain on our financial and management systems, processes and controls, as well as on our personnel. In addition, as a public company, in the future we will be required to document and test our internal controls over financial reporting pursuant to Section 404 of the Sarbanes-Oxley Act of 2002 so that our management can certify the effectiveness of our internal controls and our independent registered public accounting firm can render an opinion on the effectiveness of our internal control over financial reporting. As a result, we may be required to incur substantial expenses to test our systems, to make any necessary improvements, and to hire additional personnel. If our management is unable to certify the effectiveness of our internal controls or if our independent registered public accounting firm cannot render an opinion on the effectiveness of our internal control over financial reporting, or if material weaknesses in our internal controls are identified, we could be subject to regulatory scrutiny and a loss of public confidence, which could harm our business and cause a decline in our stock price. In addition, if we do not maintain adequate financial and management personnel, processes and controls, we may not be able to accurately report our financial performance on a timely basis, which could cause a decline in our stock price and harm our ability to raise capital. Failure to accurately report our financial performance on a timely basis could also jeopardize our continued listing on The NASDAQ Global Select
16
Market or any other stock exchange on which our common stock may be listed. Delisting of our common stock on any exchange could reduce the liquidity of the market for our common stock, which could reduce the price of our stock and increase the volatility of our stock price.
Our ability to obtain additional financing on favorable terms, if needed, could be adversely affected by volatility in the capital markets.
We obtain and manage liquidity from the positive cash flow we generate from our operating activities, our access to capital markets and our revolving credit facility. There is no assurance that our ability to obtain additional financing from financial institutions or through the capital markets, if needed, will not be adversely impacted by economic conditions. Tightening in the credit markets, low liquidity and volatility in the capital markets could result in diminished availability of credit, higher cost of borrowing and lack of confidence in the equity market, making it more difficult to obtain additional financing on terms that are favorable to us.
If we are unable to secure our customers’ confidential or credit card information, or other private data relating to our employees or our Company, we could be subject to negative publicity, costly government enforcement actions or private litigation, which could damage our business reputation and adversely affect our financial results.
The protection of our customer, employee and company data is critical to us. We have procedures and technology in place to safeguard our customers’ debit and credit card, and other personal information, our employees’ private data and company records and intellectual property. However, if we experience a data security breach of any kind, we could be exposed to negative publicity, government enforcement actions, private litigation or costly response measures. In addition, our reputation within the business community and with our customers may be affected, which could result in our customers discontinuing the use of debit or credit cards in our stores, or not shopping in our stores altogether. This could cause us to lose market share to our competitors and could have an adverse effect on our financial results.
We are exposed to the risk of natural disasters, unusual weather conditions, pandemic outbreaks, global political events, war and terrorism that could disrupt business and result in lower sales, increased operating costs and capital expenditures.
Our headquarters, store locations and distribution centers, as well as certain of our vendors and customers, are located in areas which have been and could be subject to natural disasters such as floods, hurricanes, tornadoes, fires or earthquakes. Adverse weather conditions or other extreme changes in the weather, including resulting electrical and technological failures, may disrupt our business and may adversely affect our ability to sell and distribute products. For example, as a result of Superstorm Sandy in October 2012, we experienced closures in 122 of our stores. In addition, we operate in markets that may be susceptible to pandemic outbreaks, war, terrorist acts or disruptive global political events, such as civil unrest in countries from which our vendors are located or products are manufactured. Our business may be harmed if our ability to sell and distribute products is impacted by any such events, any of which could influence customer trends and purchases and may negatively impact our net sales, properties or operations. Such events could result in physical damage to one or more of our properties, the temporary closure of some or all of our stores or distribution center, the temporary lack of an adequate work force in a market, temporary or long-term disruption in the transport of goods, delay in the delivery of goods to our distribution center or stores, disruption of our technology support or information systems, or fuel shortages or dramatic increases in fuel prices, which increase the cost of doing business. These events also can have indirect consequences such as increases in the costs of insurance if they result in significant loss of property or other insurable damage. Any of these factors, or combination thereof, could adversely affect our operations.
Current economic conditions and other economic factors could adversely impact our financial performance and other aspects of our business in various respects.
A delayed recovery in the U.S. economy or other economic factors affecting disposable consumer income, such as employment levels, inflation, business conditions, fuel and energy costs, consumer debt levels, lack of available credit, interest rates, tax rates and further erosion in consumer confidence may affect our business adversely. Such factors could reduce overall consumer spending or cause customers to shift their spending to products other than those sold by us or to products sold by us that are less profitable than other product choices, all of which could result in lower net sales, decreases in inventory turnover or a reduction in profitability due to lower margins. We have limited or no ability to control many of these factors. The current global economic uncertainty, the impact of recessions and the potential for failures or realignments of financial institutions and the related impact on available credit may impact us, our vendors and other business partners, our landlords, our customers, our service providers and our operations in an adverse manner.
17
Changes in state or federal legislation or regulations, including the effects of legislation and regulations on product and food safety and quality, wage levels, employee rights, health care, social welfare and entitlement programs could increase our cost of doing business.
Our business is subject to numerous federal, state and local laws and regulations. We routinely incur costs in complying with these laws and regulations. We are exposed to the risk that federal, state or local legislation may negatively impact our operations. Changes in product and food safety and quality (including changes in labeling or disclosure requirements), federal or state wage requirements, employee rights (including changes in the process for our employees to join a union), health care, social welfare or entitlement programs such as health insurance, paid leave programs, or other changes in workplace regulation or tax laws could adversely impact our ability to achieve our financial targets. Changes in other regulatory areas, such as consumer credit, privacy and information security, or environmental regulation may result in significant added expenses or may require extensive system and operating changes that may be difficult to implement and/or could materially increase our costs of doing business. Untimely compliance or noncompliance with applicable laws and regulations may subject us to legal risk, including government enforcement action, significant fines and penalties and class action litigation, as well as reputational damage, which could adversely affect our results of operations.
Litigation may adversely affect our business, financial condition, results of operations or liquidity.
Our business is subject to the risk of litigation by employees, consumers, vendors, competitors, intellectual property rights holders, shareholders, government agencies and others through private actions, class actions, administrative proceedings, regulatory actions or other litigation. The outcome of litigation, particularly class action lawsuits, regulatory actions and intellectual property claims, is difficult to assess or quantify. Plaintiffs in these types of lawsuits may seek recovery of very large or indeterminate amounts, and the magnitude of the potential loss relating to these lawsuits may remain unknown for substantial periods of time. In addition, certain of these lawsuits, if decided adversely to us or settled by us, may result in liability material to our financial statements as a whole or may negatively affect our operating results if changes to our business operation are required. The cost to defend future litigation may be significant. There also may be adverse publicity associated with litigation that could negatively affect customer perception of our business, regardless of whether the allegations are valid or whether we are ultimately found liable. As a result, litigation may adversely affect our business, financial condition, results of operations or liquidity.
If we fail to protect our brand name, competitors may adopt trade names that dilute the value of our brand name.
We may be unable or unwilling to strictly enforce our trademarks in each jurisdiction in which we do business. Also, we may not always be able to successfully enforce our trademarks against competitors, or against challenges by others. Our failure to successfully protect our trademarks could diminish the value and efficacy of our brand recognition and could cause customer confusion, which could, in turn, adversely affect our sales and profitability.
Our management has limited experience managing a public company and our current resources may not be sufficient to fulfill our public company obligations.
We are subject to various regulatory requirements, including those of the Securities and Exchange Commission (SEC) and The NASDAQ Stock Market LLC. These requirements include record keeping, financial reporting and corporate governance rules and regulations. Our management team has limited experience in managing a public company and, historically, has not had the resources typically found in a public company. Our internal infrastructure may not be adequate to support our increased reporting obligations and we may be unable to hire, train or retain necessary staff and may be reliant on engaging outside consultants or professionals to overcome our lack of experience or employees. Our business could be adversely affected if our internal infrastructure is inadequate, we are unable to engage outside consultants or are otherwise unable to fulfill our public company obligations.
Product and food safety claims and the effects of legislation and regulations on product and food safety and quality could affect our sales and results of operations adversely.
We may be subject to product liability claims from customers or actions required or penalties assessed by government agencies relating to products, including food products that are recalled, defective or otherwise alleged to be harmful. Such claims may result from tampering by unauthorized third parties, product contamination or spoilage, including the presence of foreign objects, substances, chemicals, other agents, or residues introduced during the growing, storage, handling and transportation phases. All of our vendors and their products are contractually required to comply with applicable product and food safety laws. We generally seek contractual indemnification and insurance coverage from our vendors. However, if we do not have adequate contractual indemnification and/or insurance available, such claims could have a material adverse effect on our business, financial condition and results of operations. Our ability to obtain indemnification from foreign vendors may be hindered by the manufacturers’ lack of understanding of U.S. product liability or other laws, which may make it more likely
18
that we be required to respond to claims or complaints from customers as if we were the manufacturer of the products. Even with adequate insurance and indemnification, such claims could significantly damage our reputation and consumer confidence in our products. Our litigation expenses could increase as well, which also could have a materially negative impact on our results of operations even if a product liability claim is unsuccessful or is not fully pursued.
We purchase a portion of our products on a closeout basis. Some of these products are obtained through brokers or intermediaries rather than through manufacturers. The closeout nature of a portion of our products sometimes makes it more difficult for us to investigate all aspects of these products. We attempt to assure compliance and to test products when appropriate, and we seek to obtain indemnification through our vendors or to be listed as an additional insured, but there is no assurance that these efforts will be successful.
As a result of our recent IPO, we now incur significant expenses as a result of being a public company, which negatively impact our financial performance and could cause our results of operations and financial condition to suffer.
In July 2012 we completed our IPO. As a result, we are now required to incur significant legal, accounting, insurance, compliance and other expenses as a result of being a public company. We are obligated to file annual and quarterly information and other reports with the SEC. In addition, we also became subject to other reporting and corporate governance requirements which impose significant compliance obligations upon us. The Sarbanes-Oxley Act of 2002, together with related rules implemented by the SEC and by The NASDAQ Stock Market LLC, have imposed increased regulation and disclosure and have required enhanced corporate governance practices of public companies. Our efforts to comply with these laws, rules and regulations, including compliance with Section 404 of the Sarbanes-Oxley Act as discussed in “—Failure to maintain adequate financial and management processes and controls could lead to errors in our financial reporting, which could harm our business and cause a decline in our stock price” above, substantially increase our expenses, including our legal and accounting costs, and make some activities more time-consuming and costly. We also expect these laws, rules and regulations to make it more expensive for us to obtain director and officer liability insurance, and we may be required to accept reduced policy limits and coverage or incur substantially higher costs to obtain the same or similar coverage. As a result, it may be more difficult for us to attract and retain qualified persons to serve on our board of directors or as officers. As a result of the foregoing, we have begun to incur substantial increases in legal, accounting and insurance compliance and we expect to incur certain other expenses in the future, which will negatively impact our financial performance and could cause our results of operations and financial condition to suffer.
The terms of our term loan facility and our revolving credit facility may restrict our current and future operations, which could adversely affect our ability to respond to changes in our business and to manage our operations.
Our term loan facility and our revolving credit facility contain, and any additional debt financing we may incur would likely contain, covenants requiring us to maintain or adhere to certain financial ratios or limits and covenants that restrict our operations, which may include limitations on our ability to, among other things:
|
•
|
incur additional indebtedness;
|
|
•
|
pay dividends and make certain distributions, investments and other restricted payments;
|
|
•
|
create certain liens or encumbrances;
|
|
•
|
enter into transactions with our affiliates;
|
|
•
|
redeem our common stock; and
|
|
•
|
engage in certain merger, consolidation or asset sale transactions.
|
Complying with these covenants could adversely affect our ability to respond to changes in our business and manage our operations. In addition, these covenants could affect our ability to invest capital in our new stores and fund capital expenditures for existing stores, including the costs associated with the conversion of certain stores existing before the fiscal year ended January 30, 2010 to our current prototype size. Our ability to comply with these covenants and other provisions in the term loan facility, the revolving credit facility and any future debt instruments may be affected by changes in our operating and financial performance, changes in general business and economic conditions, adverse regulatory developments, or other events beyond our control. A failure by us to comply with the financial ratios and restrictive covenants contained in our term loan facility, revolving credit facility and any future debt instruments could result in an event of default. Upon the occurrence of an event of default, the lenders could elect to declare all amounts outstanding to be due and payable and exercise other remedies as set forth in our term loan facility, revolving credit facility and any future debt instruments. In addition, if we are in default, we may be unable to borrow additional amounts under any such facilities to the extent that they would otherwise be available and our ability to obtain future financing may also be impacted negatively. If the indebtedness under our term loan facility, revolving
19
credit facility and any future debt instruments were to be accelerated, our future financial condition could be materially adversely affected.
Risks Related to Ownership of Our Common Stock
Our stock price may be volatile or may decline regardless of our operating performance.
Shares of our common stock were sold in our IPO in July 2012 at a price of $17.00 per share, and our common stock has subsequently traded as high as
$40.00
and as low as
$25.00
during the period from our IPO to
February 2, 2013
.
An active, liquid and orderly market for our common stock may not be sustained, which could depress the trading price of our common stock. In addition, broad market and industry factors, most of which we cannot control, may harm the price of our common stock, regardless of our actual operating performance. Factors that could cause fluctuation in the price of our common stock may include, among other things:
|
•
|
actual or anticipated fluctuations in quarterly operating results or other operating metrics, such as comparable store sales, that may be used by the investment community;
|
|
•
|
changes in financial estimates by us or by any securities analysts who might cover our stock;
|
|
•
|
speculation about our business in the press or the investment community;
|
|
•
|
conditions or trends affecting our industry or the economy generally;
|
|
•
|
stock market price and volume fluctuations of other publicly traded companies and, in particular, those that are in the retail industry;
|
|
•
|
announcements by us or our competitors of new product offerings, significant acquisitions, strategic partnerships or divestitures;
|
|
•
|
our entry into new markets;
|
|
•
|
timing of new store openings;
|
|
•
|
percentage of sales from new stores versus established stores;
|
|
•
|
additions or departures of key personnel;
|
|
•
|
actual or anticipated sales of our common stock, including sales by our directors, officers or significant shareholders;
|
|
•
|
significant developments relating to our relationships with business partners, vendors and distributors;
|
|
•
|
customer purchases of new products from us and our competitors;
|
|
•
|
investor perceptions of the retail industry in general and our Company in particular;
|
|
•
|
major catastrophic events;
|
|
•
|
volatility in our stock price, which may lead to higher stock-based compensation expense under applicable accounting standards; and
|
|
•
|
changes in accounting standards, policies, guidance, interpretation or principles.
|
In the past, securities class action litigation has often been instituted against companies following periods of volatility in their stock price. This type of litigation, even if it does not result in liability for us, could result in substantial costs to us and divert management's attention and resources.
Future sales of our common stock, or the perception in the public markets that these sales may occur, may depress our stock price.
The market price of our common stock could decline significantly as a result of sales of a large number of shares of our common stock in the market. The sales, or the perception that these sales might occur, could depress the market price of our common stock. These sales, or the possibility that these sales may occur, also might make it more difficult for us to sell equity securities in the future at a time and at a price that we deem appropriate.
As of February 2, 2013, we had
53,980,797
shares of common stock outstanding, which are freely tradable without restriction under the Securities Act of 1933, as amended, or the Securities Act, except for any shares of common stock held or acquired by our directors, executive officers and other affiliates, as that term is defined in the Securities Act, which are restricted securities under the Securities Act. Restricted securities may not be sold in the public market unless the sale is registered under the Securities Act or an exemption from registration is available. In addition, pursuant to our amended and
20
restated investor rights agreement, certain of our investors have rights to require us to file registration statements registering additional sales of shares of common stock or to include sales of such shares of common stock in registration statements that we may file for ourselves or other shareholders. In order to exercise these registration rights, these shareholders must satisfy certain conditions. Subject to compliance with applicable lock-up restrictions, shares of common stock sold under these registration statements can be freely sold in the public market. In the event such registration rights are exercised and a large number of shares of common stock are sold in the public market, such sales could reduce the trading price of our common stock. These sales also could impede our ability to raise future capital. Additionally, we will bear all expenses in connection with any such registrations (other than stock transfer taxes and underwriting discounts or commissions).
In the future, we may also issue our securities in connection with investments or acquisitions. The number of shares of our common stock issued in connection with an investment or acquisition could constitute a material portion of our then-outstanding shares of our common stock. Any issuance of additional securities in connection with investments or acquisitions may result in additional dilution to you.
Insiders continue to have substantial control over us, which could limit your ability to influence the outcome of key transactions, including a change of control.
As of February 4, 2013, funds managed by Advent control an aggregate of approximately 32% of the voting power of our outstanding common stock. As a result, Advent is able to exert significant influence over matters requiring approval by our shareholders, including the election of directors and the approval of mergers, acquisitions and other extraordinary transactions. It may also have interests that differ from yours and may vote in a way with which you disagree and which may be adverse to your interests. This concentration of ownership may have the effect of delaying, preventing or deterring a change of control of Five Below, could deprive our shareholders of an opportunity to receive a premium for their common stock as part of a sale of Five Below and might ultimately affect the market price of our common stock.
Certain of our existing investors have interests and positions that could present potential conflicts with our and our shareholders' interests.
Advent makes investments in companies and may, from time to time, acquire and hold interests in businesses that compete directly or indirectly with us. Advent may also pursue, for its own accounts, acquisition opportunities that may be complementary to our business, and as a result, those acquisition opportunities may not be available to us. Our second amended and restated shareholders agreement, as amended, contains provisions renouncing any interest or expectancy held by our directors affiliated with Advent in certain corporate opportunities. Accordingly, the interests of Advent may supersede ours, causing them or their affiliates to compete against us or to pursue opportunities instead of us, for which we have no recourse. Such actions on the part of Advent and inaction on our part could have a material adverse effect on our business, financial condition and results of operations.
Your percentage ownership in us may be diluted by future equity issuances, which could reduce your influence over matters on which shareholders vote.
Our board of directors has the authority, without action or vote of our shareholders, to issue all or any part of our authorized but unissued shares of common stock, including shares issuable upon the exercise of options, shares that may be issued to satisfy our obligations under our equity incentive plan or shares of our authorized but unissued preferred stock. We have reserved 7,600,000 shares of common stock under our equity incentive plan for future issuances and, as of February 2, 2013,
1,187,817
shares of our common stock are issuable upon the exercise of options outstanding. We have also reserved 500,000 shares of common stock under our employee stock purchase plan for future issuances, which plan remains subject to shareholder approval. Exercises of these options or issuances of common stock or preferred stock could reduce your influence over matters on which our shareholders vote and, in the case of issuances of preferred stock, likely could result in your interest in us being subject to the prior rights of holders of that preferred stock.
We do not expect to pay any cash dividends for the foreseeable future.
For the foreseeable future, we intend to retain any earnings to finance the development and expansion of our business, and we do not anticipate paying any cash dividends on our common stock. Any determination to pay dividends in the future will be at the discretion of our board of directors and will depend upon results of operations, financial condition, contractual restrictions, including under agreements for indebtedness we may incur, restrictions imposed by applicable law and other factors our board of directors deems relevant. Accordingly, if you purchase shares, realization of a gain on your investment will depend on the appreciation of the price of our common stock, which may never occur. Investors seeking cash dividends in the foreseeable future should not purchase our common stock.
21
If securities or industry analysts do not publish research or continue to publish or publish inaccurate or unfavorable research about our business, our stock price and trading volume could decline.
The trading market for our common stock is influenced by the research and reports that industry or securities analysts publish about us or our business. If one or more of these analysts ceases coverage of our Company or fails to publish reports on us regularly, we could lose visibility in the financial markets, which in turn could cause our stock price or trading volume to decline. Moreover, if our operating results do not meet the expectations of the investor community, or one or more of the analysts who cover our Company downgrade our stock, our stock price could decline.
Anti-takeover provisions could delay and discourage takeover attempts that shareholders may consider to be favorable.
Certain provisions of our amended and restated articles of incorporation and amended bylaws and applicable provisions of Pennsylvania law may make it more difficult or impossible for a third party to acquire control of us or effect a change in our board of directors and management.
In particular, these provisions, among other things:
|
•
|
provide that only the chairman of the board of directors, the chief executive officer or a majority of the board of directors may call special meetings of the shareholders;
|
|
•
|
classify our board of directors into three separate classes with staggered terms;
|
|
•
|
provide for supermajority approval requirements for amending or repealing provisions in our amended and restated articles of incorporation and amended bylaws;
|
|
•
|
establish certain advance notice procedures for nominations of candidates for election as directors and for shareholder proposals to be considered at shareholders’ meetings; and
|
|
•
|
permit the board of directors, without further action of the shareholders, to issue and fix the terms of preferred stock, which may have rights senior to those of the common stock.
|
In addition, anti-takeover provisions in Pennsylvania law could make it more difficult for a third party to acquire control of us. These provisions could adversely affect the market price of our common stock and could reduce the amount that shareholders might receive if we are sold. For example, Pennsylvania law may restrict a third party's ability to obtain control of us and may prevent shareholders from receiving a premium for their shares of our common stock. Pennsylvania law also provides that our shareholders are not entitled by statute to propose amendments to our articles of incorporation.
These and other provisions of Pennsylvania law and our amended and restated articles of incorporation and amended bylaws could delay, defer or prevent us from experiencing a change of control or changes in our board of directors and management and may adversely affect our shareholders' voting and other rights. Any delay or prevention of a change of control transaction or changes in our board of directors and management could deter potential acquirors or prevent the completion of a transaction in which our shareholders could receive a substantial premium over the then current market price for their shares of our common stock.
Not applicable.
We do not own any real property. Our corporate headquarters are located in Philadelphia, Pennsylvania and are leased under a lease agreement expiring in 2022, with options to renew for two successive five-year periods. Our 421,000 square foot distribution center is located in New Castle, Delaware and is leased under a lease agreement expiring in 2016 with options to renew for two successive five-year periods. During fiscal 2012, we signed a lease for a second distribution center in Olive Branch, Mississippi, which we
expect to be fully operational during fiscal 2013
. This distribution center is approximately 600,000 square feet and is leased under a lease agreement expiring in 2022 with options to renew for three successive five-year periods. At the end of
fiscal 2012
,
there were
244
Five Below store locations in
18
states. All of our stores are leased from third parties and the leases typically have five to ten year terms with one or more five-year renewal options, and many provide us with the option to terminate early under specified conditions. In addition to future minimum lease payments, some of our store leases provide for additional rental payments based on a percentage of net sales if sales at the respective stores exceed specified levels, as well as the payment of common area maintenance charges, real property insurance and real estate taxes. Many of our lease agreements have defined escalating rent provisions over the initial term and any extensions.
22
We are subject to various proceedings, lawsuits, disputes, and claims arising in the ordinary course of our business. Many of these actions raise complex factual and legal issues and are subject to uncertainties. Actions filed against us from time to time include commercial, intellectual property, customer, and employment actions, including class action lawsuits. The plaintiffs in some actions seek unspecified damages or injunctive relief, or both. Actions are in various procedural stages, and some are covered in part by insurance. We cannot predict with assurance the outcome of actions brought against us. Accordingly, adverse developments, settlements, or resolutions may occur and negatively impact income in the quarter of such development, settlement, or resolution. If a potential loss arising from these lawsuits, claims and pending actions is probable and reasonably estimable, we record the estimated liability based on circumstances and assumptions existing at the time. Although the outcome of these and other claims cannot be predicted with certainty, management does not believe that the ultimate resolution of these matters will have a material adverse effect on our financial condition or results of operations.
Not applicable.
Our common stock has been listed on the NASDAQ Global Select Market under the symbol “FIVE” since our IPO, which had a price of $17.00 per share. Before then, there was no public market for our common stock. The following table sets forth, for the periods indicated, the high and low sales prices of our common stock as reported by the NASDAQ Global Select Market:
|
Fiscal 2012
|
High
|
Low
|
||||
|
Second Quarter (July 19, 2012 - July 28, 2012)
|
$
|
29.96
|
|
$
|
25.00
|
|
|
Third Quarter (July 29, 2012 - October 27, 2012)
|
$
|
40.00
|
|
$
|
28.70
|
|
|
Fourth Quarter (October 28, 2012 - February 2, 2013)
|
$
|
37.85
|
|
$
|
27.73
|
|
On
February 1, 2013
(the last trading day of
fiscal 2012
), the last reported sale price on the NASDAQ Global Select Market of our common stock was
$37.10
per share. As of March 15, 2013, we had approximately
9,420
holders of record of our common stock.
Performance Graph
This performance graph and related information shall not be deemed “soliciting material” or to be “filed” with the Securities and Exchange Commission for purposes of Section 18 of the Securities Exchange Act of 1934, as amended, or the Exchange Act, or otherwise subject to the liabilities under that Section, and shall not be deemed to be incorporated by reference into any future filing under the Securities Act of 1933, as amended, or the Exchange Act, except to the extent that we specifically incorporate it by reference into such filing.
The following graph compares the cumulative total shareholder return on our common stock from July 19, 2012 (the date our common stock commenced trading on the NASDAQ Global Select Market) through
February 2, 2013
, with the return on (i) the NASDAQ Global Market Composite Index and (ii) the NASDAQ US Benchmark Retail Index over the same period. This graph assumes an initial investment of $100 and assumes the reinvestment of dividends, if any. Such returns are based on historical results and are not intended to suggest future performance.
23

|
7/19/2012
|
7/28/2012
|
8/25/2012
|
9/29/2012
|
10/27/2012
|
11/24/2012
|
12/29/2012
|
2/2/2013
|
|
|
FIVE BELOW, INC.
|
$100.00
|
$111.90
|
$116.60
|
$147.50
|
$126.00
|
$108.20
|
$120.70
|
$140.00
|
|
NASDAQ GLOBAL MARKET COMPOSITE INDEX
|
$100.00
|
$99.70
|
$103.50
|
$105.10
|
$100.70
|
$100.00
|
$99.80
|
$107.20
|
|
NASDAQ US BENCHMARK RETAIL INDEX
|
$100.00
|
$101.30
|
$102.80
|
$105.20
|
$103.90
|
$104.60
|
$102.40
|
$111.00
|
Securities Authorized for Issuance Under Equity Compensation Plans
See Item 12. “Security Ownership of Certain Beneficial Owners and Management and Related Stockholder Matters” for information regarding securities authorized for issuance under our equity compensation plans.
Dividends
On May 15, 2012, we declared and subsequently paid on May 16, 2012 a special dividend of $2.02 per share on shares of our common stock and on an as-converted basis on shares of our then outstanding Series A 8% Convertible Preferred Stock totaling $99.5 million, which we refer to as the 2012 Dividend.
Other than the 2012 Dividend, during the past two fiscal years, we have not declared, and currently do not plan to declare in the foreseeable future, dividends on shares of our common stock. We currently intend to retain any future earnings for use in the operation and expansion of our business. Any further determination to pay dividends on our capital stock will be at the discretion of our board of directors, subject to applicable laws, and will depend on our financial condition, results of operations, capital requirements, general business conditions and other factors that our board of directors considers relevant. In addition, the terms of our term loan facility and revolving credit facility contain restrictions on our ability to pay dividends.
Recent Sales of Unregistered Securities
During fiscal
2012
, we issued unregistered securities in the following transactions. None of these transactions involved underwriters, underwriting discounts or commissions, or any public offering, and we believe that each transaction was exempt from the registration requirements of the Securities Act, as described below. The information set forth below gives effect to the 0.3460-for-1 reverse stock split that was effected on July 17, 2012.
(a) Issuances of Common Stock
|
•
|
On February 23, 2012, we issued 10,034 shares of common stock to a consultant in connection with the exercise of warrants issued to him as compensation for services he provided to the Company. The exercise price was $6.30 and resulted in aggregate cash proceeds to the Company equal to $63,220.
|
24
|
•
|
On March 22, 2012, we issued a total of 2,020,620 shares of restricted common stock to Messrs. Schlessinger and Vellios in exchange for the cancellation of each of their option agreements, on a one-for-one basis.
|
|
•
|
On March 29, 2012, we issued 2,595 shares of common stock to one of our consultants in connection with the exercise of warrants issued to him as compensation for services provided to the Company. The exercise price was $11.21 and resulted in aggregate cash proceeds to the Company equal to $29,100.
|
|
•
|
On April 9, 2012, we issued 6,920 shares of common stock to one of our consultants in connection with the exercise of warrants issued to him as compensation for services provided to the Company. The exercise price was $11.21 for the remaining shares and resulted in aggregate cash proceeds to the Company equal to $77,600.
|
|
•
|
On April 13, 2012, we issued 3,460 shares of common stock to one of our consultants in connection with the exercise of warrants issued to him as compensation for services provided to the Company. The exercise price was $6.30 for half of the shares and $11.21 for the remaining shares and resulted in aggregate cash proceeds to the Company equal to $30,300.
|
|
•
|
On July 18, 2012, we issued a total of 7,058 shares of restricted common stock to Messrs. Sargent and Ryan as compensation for their service on our board of directors.
|
(b) Issuances of Warrants to Purchase Common Stock
|
•
|
On March 1, 2012, we issued warrants to purchase 11,245 shares of common stock at an exercise price of $11.21 per share to three service providers to the Company.
|
(c) Stock Option Grants
|
•
|
On March 1, 2012, we granted stock options to purchase a total of 318,666 shares of common stock at an exercise price of $11.22 per share to 146 employees pursuant to our equity incentive plan.
|
|
•
|
On March 30, 2012, we granted stock options to purchase a total of 79,926 shares of common stock at an exercise price of $11.22 per share to 12 employees pursuant to our equity incentive plan.
|
|
•
|
On May 23, 2012, we granted stock options to purchase 1,730 shares at an exercise price dependent on the pricing of our IPO to a new employee pursuant to our equity incentive plan.
|
|
•
|
On June 4, 2012, we granted stock options to purchase a total of 173,000 shares at an exercise price dependent on the pricing of our IPO to our new chief operating officer pursuant to our equity incentive plan.
|
|
•
|
On June 12, 2012 we granted stock options to purchase 1,038 shares at an exercise price dependent on the pricing of our IPO to a new employee pursuant to our equity incentive plan.
|
The issuances of the securities described in paragraphs (a), (b) and (c) were exempt from registration under the Securities Act in reliance on Rule 701 promulgated under Section 3(b) of the Securities Act, as transactions by an issuer not involving a public offering or transactions pursuant to compensatory benefit plans and contracts relating to compensation. The recipients of such options were our employees or directors, who received the securities under our equity incentive plan and the recipients of such warrants were service providers to the Company. Each recipient of securities in these transactions had adequate access, through employment or business relationships, to information about us.
25
Issuer Purchase of Equity Securities
|
Period
|
(a)
Total
Number of
Shares (or
Units)
Purchased (1)
|
(
b)
Average
Price
Paid per
Share
(or Unit)
|
(c)
Total
Number of
Shares (or
Units)
Purchased
as Part of
Publicly
Announced
Plans or
Programs
|
(d)
Maximum
Number (or
Approximate
Dollar Value)
of Shares
(or Units)
that May Yet
Be
Purchased
Under the
Plans or
Programs
|
|||||
|
October 28, 2012 through November 24, 2012
|
75
|
$
|
11.59
|
|
—
|
|
$
|
—
|
|
|
November 25, 2012 through December 29, 2012
|
—
|
—
|
|
—
|
|
—
|
|
||
|
December 30, 2012 through February 2, 2013
|
—
|
—
|
|
—
|
|
—
|
|
||
|
Total
|
75
|
$
|
11.59
|
|
—
|
|
$
|
—
|
|
|
(1)
|
We repurchased exercised our right to repurchase 75 shares of unvested restricted stock during the month of November 2012 from a former employee who ceased employment with us.
|
26
The following table presents selected financial and other data as of and for the periods indicated. The selected financial data for fiscal 2012, 2011 and 2010 and selected balance sheet data as of
February 2, 2013
and
January 28, 2012
have been derived from our financial statements audited by KPMG LLP, our independent registered public accounting firm, included elsewhere in this
Annual Report
. The selected financial data for the fiscal years ended January 30, 2010, which we refer to as fiscal 2009, and January 31, 2009, which we refer to as fiscal 2008, and the selected balance sheet data as of January 29, 2011, January 30, 2010, and January 31, 2009, have been derived from our audited financial statements that have not been included in this
Annual Report
. The historical results presented below are not necessarily indicative of the results to be expected for any future period. You should read this selected financial data in conjunction with the financial statements and accompanying notes and the information under Item 7, “Management’s Discussion and Analysis of Financial Condition and Results of Operations” appearing elsewhere in this
Annual Report
.
We operate on a fiscal calendar that results in a given fiscal year consisting of a 52- or 53-week period ending on the Saturday closest to January 31
st
of the following year. The reporting periods contained in the following table consist of 53 weeks in
fiscal 2012
and 52 weeks of operations in fiscal
2011
,
2010
,
2009
, and
2008
, respectively.
|
|
Fiscal Year
|
||||||||||||||||||
|
2012
|
2011
|
2010
|
2009
|
2008
|
|||||||||||||||
|
(in millions, except share and per share data)
|
|||||||||||||||||||
|
Statement of Operations Data (1):
|
|||||||||||||||||||
|
Net sales
|
$
|
418.8
|
|
$
|
297.1
|
|
$
|
197.2
|
|
$
|
125.1
|
|
$
|
89.5
|
|
||||
|
Cost of goods sold
|
269.0
|
|
192.3
|
|
131.0
|
|
85.0
|
|
64.2
|
|
|||||||||
|
Gross profit
|
149.8
|
|
104.9
|
|
66.1
|
|
40.1
|
|
25.3
|
|
|||||||||
|
Selling, general and administrative expenses (2)
|
112.2
|
|
78.6
|
|
54.3
|
|
33.2
|
|
26.9
|
|
|||||||||
|
Operating income (loss)
|
37.7
|
|
26.2
|
|
11.8
|
|
6.9
|
|
(1.6
|
)
|
|||||||||
|
Interest expense, net
|
2.4
|
|
—
|
|
—
|
|
0.1
|
|
0.1
|
|
|||||||||
|
Loss on debt extinguishment
|
1.6
|
|
—
|
|
—
|
|
—
|
|
—
|
|
|||||||||
|
Other income
|
(0.4
|
)
|
—
|
|
—
|
|
—
|
|
—
|
|
|||||||||
|
Income (loss) before income taxes
|
34.1
|
|
26.2
|
|
11.8
|
|
6.8
|
|
(1.8
|
)
|
|||||||||
|
Income tax expense (benefit) (3)
|
14.1
|
|
10.2
|
|
4.8
|
|
(4.9
|
)
|
—
|
|
|||||||||
|
Net income (loss)
|
20.0
|
|
16.1
|
|
7.0
|
|
11.7
|
|
(1.8
|
)
|
|||||||||
|
Dividend paid to preferred and unvested restricted shareholders
|
(65.4
|
)
|
—
|
|
—
|
|
—
|
|
—
|
|
|||||||||
|
Series A 8% Convertible Preferred Stock cumulative dividends
|
—
|
|
(15.9
|
)
|
(4.5
|
)
|
—
|
|
—
|
|
|||||||||
|
Accretion of Redeemable Convertible Preferred Stock
|
—
|
|
—
|
|
(3.3
|
)
|
(4.3
|
)
|
(2.9
|
)
|
|||||||||
|
Net income attributable to participating securities
|
—
|
|
(0.1
|
)
|
—
|
|
(3.4
|
)
|
—
|
|
|||||||||
|
Net (loss) income attributable to common shareholders
|
$
|
(45.4
|
)
|
$
|
0.1
|
|
$
|
(0.8
|
)
|
$
|
4.0
|
|
$
|
(4.6
|
)
|
||||
|
Per Share Data:
|
|||||||||||||||||||
|
Basic (loss) income per common share (4)
|
$
|
(1.28
|
)
|
$
|
—
|
|
$
|
(0.08
|
)
|
$
|
0.54
|
|
$
|
(0.62
|
)
|
||||
|
Diluted (loss) income per common share (4)
|
(1.28
|
)
|
$
|
—
|
|
$
|
(0.08
|
)
|
$
|
0.54
|
|
$
|
(0.62
|
)
|
|||||
|
Dividends declared and paid per common share
|
2.02
|
|
$
|
—
|
|
$
|
13.24
|
|
$
|
—
|
|
$
|
—
|
|
|||||
|
Weighted average shares outstanding:
|
|||||||||||||||||||
|
Basic shares
|
35,444,200
|
|
15,903,599
|
|
9,672,195
|
|
7,452,811
|
|
7,417,727
|
|
|||||||||
|
Diluted shares
|
35,444,200
|
|
15,904,108
|
|
9,672,195
|
|
7,452,811
|
|
7,417,727
|
|
|||||||||
27
|
Fiscal Year
|
|||||||||||||||||||
|
2012
|
2011
|
2010
|
2009
|
2008
|
|||||||||||||||
|
(in millions, except total stores data)
|
|||||||||||||||||||
|
Statement of Cash Flows Data (1):
|
|||||||||||||||||||
|
Net cash provided by (used in):
|
|||||||||||||||||||
|
Operating activities
|
$
|
30.4
|
|
$
|
46.7
|
|
$
|
15.0
|
|
$
|
9.2
|
|
$
|
3.7
|
|
||||
|
Investing activities
|
$
|
(22.9
|
)
|
$
|
(18.6
|
)
|
$
|
(14.9
|
)
|
$
|
(7.3
|
)
|
$
|
(6.0
|
)
|
||||
|
Financing activities
|
$
|
7.3
|
|
$
|
1.0
|
|
$
|
(0.4
|
)
|
$
|
(0.1
|
)
|
$
|
10.9
|
|
||||
|
Other Operating and Financial Data (1):
|
|||||||||||||||||||
|
Total stores at end of period
|
244
|
|
192
|
|
142
|
|
102
|
|
82
|
|
|||||||||
|
Comparable store sales growth
|
7.1
|
%
|
7.9
|
%
|
15.6
|
%
|
12.1
|
%
|
5.8
|
%
|
|||||||||
|
Average net sales per store (5)
|
$
|
1.8
|
|
$
|
1.7
|
|
$
|
1.5
|
|
$
|
1.3
|
|
$
|
1.2
|
|
||||
|
Capital expenditures
|
$
|
22.9
|
|
$
|
18.6
|
|
$
|
14.9
|
|
$
|
7.3
|
|
$
|
6.0
|
|
||||
|
Balance Sheet Data (1):
|
|||||||||||||||||||
|
Cash and cash equivalents
|
$
|
56.1
|
|
$
|
41.3
|
|
$
|
12.2
|
|
$
|
12.4
|
|
$
|
10.6
|
|
||||
|
Total current assets
|
129.7
|
|
92.2
|
|
45.9
|
|
35.3
|
|
26.5
|
|
|||||||||
|
Total assets
|
189.7
|
|
134.5
|
|
76.6
|
|
56.3
|
|
42.5
|
|
|||||||||
|
Total current liabilities
|
68.8
|
|
49.9
|
|
18.2
|
|
11.0
|
|
10.5
|
|
|||||||||
|
Total long-term debt, excluding current portion (6)
|
19.5
|
|
0.3
|
|
0.3
|
|
—
|
|
0.1
|
|
|||||||||
|
Total liabilities
|
118.9
|
|
72.4
|
|
33.5
|
|
20.0
|
|
18.3
|
|
|||||||||
|
Series A 8% Convertible Preferred Stock
|
—
|
|
191.9
|
|
191.9
|
|
—
|
|
—
|
|
|||||||||
|
Series A Redeemable Convertible Preferred Stock
|
—
|
|
—
|
|
—
|
|
18.8
|
|
17.0
|
|
|||||||||
|
Series A-1 Redeemable Convertible Preferred Stock
|
—
|
|
—
|
|
—
|
|
18.5
|
|
16.0
|
|
|||||||||
|
Total shareholders’ equity (deficit)
|
$
|
70.7
|
|
$
|
(129.8
|
)
|
$
|
(148.8
|
)
|
$
|
(1.0
|
)
|
$
|
(8.9
|
)
|
||||
|
(1)
|
Components may not add to total due to rounding.
|
|
(2)
|
Fiscal 2012 includes $10.5 million of stock-based compensation expense that relates to the cancellation of certain stock options, in exchange for the grant of restricted shares and on-going expense recognition of the awards over the remaining vesting period. In addition, fiscal 2012 includes $1.0 million of expenses related to legal, accounting, and other fees in connection with our secondary public offering. Fiscal 2011 includes $6.1 million of non-contractual executive bonus expense, and fiscal 2010 includes $5.3 million of expense related to the 2010 Transaction.
|
|
(3)
|
We recognized an income tax benefit of $7.4 million related to the reduction of our income tax valuation allowance in fiscal 2009. Prior to that time, a full valuation allowance was established and no income tax expense or benefit was recorded on the statement of operations.
|
|
(4)
|
Please see Note 2 in our financial statements included elsewhere in this
Annual Report
, for an explanation of per share calculations.
|
|
(5)
|
Only includes stores open during full fiscal year.
|
|
(6)
|
We plan to repay approximately $15.0 million of principal on the term loan facility within the next 12 months, which is classified as a current liability and not included in the long-term balance as of the end of fiscal 2012.
|
28
You should read the following discussion together with “Selected Financial and Other Data,” and the financial statements and related notes included elsewhere in this
Annual Report
. The statements in this discussion regarding expectations of our future performance, liquidity and capital resources and other non-historical statements are forward-looking statements. These forward-looking statements are subject to numerous risks and uncertainties, including, but not limited to, the risks and uncertainties described in Part I, Item 1A “Risk Factors” and “Special Note Regarding Forward-Looking Statements.” Our actual results may differ materially from those contained in or implied by any forward-looking statements.
We operate on a fiscal calendar widely used by the retail industry that results in a given fiscal year consisting of a 52- or 53-week period ending on the Saturday closest to January 31 of the following year.
References to “fiscal year 2013” or “fiscal 2013” refer to the period from February 3, 2013 to February 1, 2014 and consists of a 52-week fiscal year.
References to “fiscal year 2012” or “fiscal 2012” refer to the period from January 29, 2012 to February 2, 2013 and consists of a 53-week fiscal year. References to “fiscal year 2011” or “fiscal 2011” refer to the period from January 30, 2011 to January 28, 2012 and consists of a 52-week fiscal year. References to “fiscal year 2010” or “fiscal 2010” refer to the period from January 31, 2010 to January 29, 2011 and consists of a 52-week fiscal year.
Historical results are not necessarily indicative of the results to be expected for any future period and results for any interim period may not necessarily be indicative of the results that may be expected for a full year.
Overview
Five Below is a rapidly growing specialty value retailer offering a broad range of trend-right, high-quality merchandise targeted at the teen and pre-teen customer. We offer a dynamic, edited assortment of exciting products, all priced at $5 and below, including select brands and licensed merchandise across our category worlds.
Five Below was founded in 2002 by our Executive Chairman, David Schlessinger, and our President and Chief Executive Officer, Thomas Vellios, who recognized a market need for a fun and affordable shopping destination aimed at teens and pre-teens aspiring to be young adults.
We believe that our business model has resulted in strong financial performance irrespective of the economic environment. Our comparable store sales increased by
7.1%
in fiscal
2012
,
7.9%
in fiscal
2011
and
15.6%
in fiscal
2010
with positive comparable store sales performance across all geographic regions and store-year classes. Between fiscal
2010
and fiscal
2012
, our net sales increased from
$197.2 million
to
$418.8 million
, representing a compound annual growth rate of
45.7%
. Over the same period, our operating income increased from
$11.8 million
to
$37.7 million
, representing a compound annual growth rate of
78.7%
. In addition, we expanded our store base from
142
stores at the end of fiscal
2010
to
244
stores at the end of fiscal
2012
. We plan to open approximately
60
net new stores in fiscal
2013
.
We expect to continue our strong growth in the future. By offering trend-right merchandise at a differentiated price point of $5 and below, our stores have been successful in varying geographic regions, population densities and real estate settings. We operate stores in 18 states in the Northeast, South and Midwest regions of the U.S. We are primarily present in power, community and lifestyle shopping centers across a variety of urban, suburban and semi-rural markets with trade areas including at least 100,000 people in the specified market. We believe we have the opportunity to expand our store base in the U.S. from
244
locations at
February 2, 2013
, to more than
2,000 locations over time
. Our ability to open profitable new stores depends on many factors, including our ability to identify suitable markets and sites; negotiate leases with acceptable terms; achieve brand awareness in the new markets; efficiently source and distribute additional merchandise; and achieve sufficient levels of cash flow and financing to support our expansion.
We have a proven and highly profitable store model that has produced consistent financial results and returns. All of our current stores were profitable on a four-wall basis in fiscal
2012
and our new stores have achieved average payback periods of less than one year. Our new store model anticipates a target store size of 7,500 square feet that achieves annual sales of $1.5 million to $1.6 million in the first full year of operation. Our new store model also assumes an average new store investment of approximately $0.3 million. Our new store investment includes our store build-out (net of tenant allowances), inventory and cash pre-opening expenses.
Our planned store expansion will place increased demands on our operational, managerial, administrative and other resources. Managing our growth effectively will require us to continue to maintain adequate distribution capacity, enhance our store management systems, financial and management controls, information systems and other operational system capabilities. In addition, we will be required to hire, train and retain store management and other qualified personnel. For further information see Part I, Item 1A “Risk Factors-Risk Relating to our Business and Industry.”
29
Over the past six years we have invested a significant amount of capital in infrastructure and systems necessary to support our future growth and we expect to incur additional capital expenditures related to expansion of our infrastructure and systems in future periods. In fiscal 2010, we expanded our New Castle, Delaware distribution center, in fiscal 2011, we relocated our corporate headquarters and upgraded our warehouse management and information systems, and in fiscal 2012, we signed a lease for a second distribution center in Olive Branch, Mississippi to support our growth, which we expect to be fully operational during fiscal 2013. In addition, the timing and amount of investments in our infrastructure and systems could affect the comparability of our results of operations in future periods. The completion date and ultimate cost of future projects, including the new distribution center could differ significantly from initial expectations due to construction-related or other reasons.
We believe our business strategy will continue to offer significant opportunity, but it also presents risks and challenges. These risks and challenges include, but are not limited to, that we may not be able to effectively identify and respond to changing trends and customer preferences, that we may not be able to find desirable locations for new stores and that we may not be able to effectively manage our future growth. In addition, our financial results can be expected to be directly impacted by substantial increases in product costs due to commodity cost increases or general inflation which could lead to a reduction in our sales as well as greater margin pressure as costs may not be able to be passed on to consumers. To date, changes in commodity prices and general inflation have not materially impacted our business. In response to increasing commodity prices or general inflation, we seek to minimize the impact of such events by sourcing our merchandise from different vendors and changing our product mix. See Part I, Item 1A “Risk Factors” for a description of these and other important factors that could adversely impact us and our results of operations.
How We Assess the Performance of Our Business
In assessing the performance of our business, we consider a variety of performance and financial measures. These key measures include net sales, comparable store sales, cost of goods sold and gross profit, selling, general and administrative expenses and operating income.
Net Sales
Net sales constitute gross sales net of merchandise returns for damaged or defective goods. Net sales consist of sales from comparable stores and non-comparable stores. Revenue from the sale of gift cards is deferred and not included in net sales until the gift cards are redeemed to purchase merchandise.
Our business is seasonal and as a result, our net sales fluctuate from quarter to quarter. Net sales are usually highest in the fourth fiscal quarter due to the year-end holiday season.
Comparable Store Sales
Comparable store sales include net sales from stores that have been open for at least 15 full months from their opening date. Comparable stores include the following:
|
•
|
Stores that have been remodeled while remaining open;
|
|
•
|
Stores that have been relocated within the same trade area, to a location that is not significantly different in size, in which the new store opens at about the same time as the old store closes; and
|
|
•
|
Stores that have expanded, but are not significantly different in size, within their current locations.
|
For stores that are relocated or expanded, the following periods are excluded when calculating comparable store sales:
|
•
|
The period of construction and pre-opening during which the store is closed through:
|
|
•
|
the last day of the fiscal year in which the store was relocated or expanded (for stores that increased significantly in size); or
|
|
•
|
the last day of the fiscal month in which the store re-opens (for all other stores); and
|
|
•
|
The period beginning on the first anniversary of the date the store closed for construction through the first anniversary of the date the store re-opened.
|
Comparable store sales exclude the 53rd week of sales for 53-week fiscal years. Fiscal 2012 comparable store sales were calculated using a 52-week comparable period through the week ending January 26, 2013.
There may be variations in the way in which some of our competitors and other retailers calculate comparable or “same store” sales. As a result, data in this
Annual Report
regarding our comparable store sales may not be comparable to similar data made available by other retailers. Non-comparable store sales are comprised of new store sales, sales for stores not open for a
30
full 15 months, and sales from existing store relocation and expansion projects that were temporarily closed and not included in comparable store sales.
Measuring the change in fiscal year-over-year comparable store sales allows us to evaluate how our store base is performing. Various factors affect comparable store sales, including:
|
•
|
consumer preferences, buying trends and overall economic trends;
|
|
•
|
our ability to identify and respond effectively to customer preferences and trends;
|
|
•
|
our ability to provide an assortment of high-quality, trend-right and everyday product offerings that generate new and repeat visits to our stores;
|
|
•
|
the customer experience we provide in our stores;
|
|
•
|
the level of traffic near our locations in the power, community and lifestyle centers in which we operate;
|
|
•
|
competition;
|
|
•
|
changes in our merchandise mix;
|
|
•
|
pricing;
|
|
•
|
our ability to source and distribute products efficiently;
|
|
•
|
the timing of promotional events and holidays;
|
|
•
|
the timing of introduction of new merchandise and customer acceptance of new merchandise;
|
|
•
|
our opening of new stores in the vicinity of existing stores; and
|
|
•
|
the number of items purchased per store visit.
|
Opening new stores is an important part of our growth strategy. As we continue to pursue our growth strategy, we expect that a significant percentage of our net sales will continue to come from new stores not included in comparable store sales. Accordingly, comparable store sales is only one measure we use to assess the success of our growth strategy.
Cost of Goods Sold and Gross Profit
Gross profit is equal to our net sales less our cost of goods sold. Gross margin is gross profit as a percentage of our net sales. Cost of goods sold reflects the direct costs of purchased merchandise and inbound freight, as well as store occupancy, distribution and buying expenses. Store occupancy costs include rent, common area maintenance, utilities and property taxes for all store locations. Distribution costs include costs for receiving, processing, warehousing and shipping of merchandise to or from our distribution center and between store locations. Buying costs include compensation expense and other costs for our internal buying organization.
These costs are significant and can be expected to continue to increase as our company grows. The components of our cost of goods sold may not be comparable to the components of cost of goods sold or similar measures of our competitors and other retailers. As a result, data in this
Annual Report
regarding our gross profit and gross margin may not be comparable to similar data made available by our competitors and other retailers.
The variable component of our cost of goods sold is higher in higher volume quarters because the variable component of our cost of goods sold generally increases as net sales increase. We regularly analyze the components of gross profit as well as gross margin. Any inability to obtain acceptable levels of initial markups, a significant increase in our use of markdowns, and a significant increase in inventory shrinkage or inability to generate sufficient sales leverage on the store occupancy, distribution and buying components of costs of goods sold could have an adverse impact on our gross profit and results of operations. Changes in the mix of our products may also impact our overall cost of goods sold.
Selling, General and Administrative Expenses
Selling, general and administrative, or SG&A, expenses are composed of payroll and other compensation, marketing and advertising expense, depreciation and amortization expense and other selling and administrative expenses. SG&A expenses as a percentage of net sales are usually higher in lower sales volume quarters and lower in higher sales volume quarters.
The components of our SG&A expenses may not be comparable to those of other retailers. We expect that our SG&A expenses will increase in future periods due to our continuing store growth and in part due to additional legal, accounting, insurance and other expenses we expect to incur as a result of being a public company. Among other things, we expect that compliance with the Sarbanes-Oxley Act of 2002 and related rules and regulations could result in significant incremental legal, accounting and other overhead costs. In addition, any increase in future stock option or other stock-based grants or modifications will increase our stock-based compensation expense included in SG&A.
31
Operating Income
Operating income equals gross profit less SG&A expenses. Operating income excludes interest expense or income and income tax expense or benefit. We use operating income as an indicator of the productivity of our business and our ability to manage SG&A expenses. Operating income percentage measures operating income as a percentage of our net sales.
Results of Operations
The following tables summarize key components of our results of operations for the periods indicated, both in dollars and as a percentage of our net sales.
|
|
Fiscal Year
|
||||||||||
|
2012
|
2011
|
2010
|
|||||||||
|
(in millions, except total stores)
|
|||||||||||
|
Statements of Operations Data (1):
|
|||||||||||
|
Net sales
|
$
|
418.8
|
|
$
|
297.1
|
|
$
|
197.2
|
|
||
|
Cost of goods sold
|
269.0
|
|
192.3
|
|
131.0
|
|
|||||
|
Gross profit
|
149.8
|
|
104.9
|
|
66.1
|
|
|||||
|
Selling, general and administrative expenses (2)
|
112.2
|
|
78.6
|
|
54.3
|
|
|||||
|
Operating income
|
37.7
|
|
26.2
|
|
11.8
|
|
|||||
|
Interest expense (income), net
|
2.4
|
|
—
|
|
—
|
|
|||||
|
Loss on debt extinguishment
|
1.6
|
|
—
|
|
—
|
|
|||||
|
Other (income)
|
(0.4
|
)
|
—
|
|
—
|
|
|||||
|
Income before income taxes
|
34.1
|
|
26.2
|
|
11.8
|
|
|||||
|
Income tax expense
|
14.1
|
|
10.2
|
|
4.8
|
|
|||||
|
Net income
|
$
|
20.0
|
|
$
|
16.1
|
|
$
|
7.0
|
|
||
|
Percentage of Net Sales (1):
|
|||||||||||
|
Net sales
|
100.0
|
%
|
100.0
|
%
|
100.0
|
%
|
|||||
|
Cost of goods sold
|
64.2
|
%
|
64.7
|
%
|
66.4
|
%
|
|||||
|
Gross profit
|
35.8
|
%
|
35.3
|
%
|
33.5
|
%
|
|||||
|
Selling, general and administrative expenses (2)
|
26.8
|
%
|
26.5
|
%
|
27.5
|
%
|
|||||
|
Operating income
|
9.0
|
%
|
8.8
|
%
|
6.0
|
%
|
|||||
|
Interest expense (income), net
|
0.6
|
%
|
—
|
%
|
—
|
%
|
|||||
|
Loss on debt extinguishment
|
0.4
|
%
|
—
|
%
|
—
|
%
|
|||||
|
Other (income)
|
(0.1
|
)%
|
—
|
%
|
—
|
%
|
|||||
|
Income before income taxes
|
8.1
|
%
|
8.8
|
%
|
6.0
|
%
|
|||||
|
Income tax expense
|
3.4
|
%
|
3.4
|
%
|
2.4
|
%
|
|||||
|
Net income
|
4.8
|
%
|
5.4
|
%
|
3.5
|
%
|
|||||
|
Operational Data:
|
|||||||||||
|
Total stores at end of period
|
244
|
|
192
|
|
142
|
|
|||||
|
Comparable stores sales growth
|
7.1
|
%
|
7.9
|
%
|
15.6
|
%
|
|||||
|
Average net sales per store (3)
|
$
|
1,822
|
|
$
|
1,658
|
|
$
|
1,542
|
|
||
|
(1)
|
Components may not add to total due to rounding.
|
|
(2)
|
Fiscal 2012 includes $10.5 million of stock-based compensation expense that relates to the cancellation of certain stock options, in exchange for the grant of restricted shares and on-going expense recognition of the awards over the remaining vesting period. In addition, fiscal 2012 includes $1.0 million of expenses related to legal, accounting, and other fees in connection with our secondary public offering. Fiscal 2011 includes $6.1 million of non-contractual executive bonus expense, and fiscal 2010 includes $5.3 million of expense related to the 2010 Transaction.
|
|
(3)
|
Only includes stores open during the full fiscal year.
|
32
Fiscal Year 2012 Compared to Fiscal Year 2011
Net Sales
Net sales
increased
to
$418.8 million
in
fiscal year 2012
from
$297.1 million
in
fiscal year 2011
, an
increase
of
$121.7 million
, or
41.0%
. The increase was the result of a comparable store sales increase of
$98.4 million
and a non-comparable store sales increase of
$23.3 million
. In
fiscal year 2012
, we opened
52
new stores compared to a net of
50
new stores in
fiscal year 2011
. The increase in non-comparable store sales was driven by the number of stores that opened in fiscal 2011 but have not been open for 15 full months and includes $5.0 million of sales contributed by the 53rd week in fiscal 2012.
Comparable store sales
increased
7.1%
for
fiscal year 2012
compared to
fiscal year 2011
. This
increase
resulted from an increase of approximately
6.9%
in the number of transactions in our stores and an increase in the average dollar value of transactions of approximately
0.2%
.
Cost of Goods Sold and Gross Profit
Cost of goods sold
increased
to
$269.0 million
in
fiscal year 2012
from
$192.3 million
in
fiscal year 2011
, an
increase
of
$76.7 million
, or
39.9%
. The
increase
in cost of goods sold was primarily the result of a $59.9 million increase in the merchandise costs of goods resulting from an increase in sales and a $11.1 million increase in store occupancy as a result of new store openings.
Gross profit
increased
to
$149.8 million
in
fiscal year 2012
from
$104.9 million
in
fiscal year 2011
, an
increase
of
$44.9 million
, or
42.8%
. Gross margin
increased
to
35.8%
for
fiscal year 2012
from
35.3%
in
fiscal year 2011
, an
increase
of
54
basis points. The
increase
in gross margin was primarily the result of a decrease of 53 basis points in store occupancy, which increased at a lower rate than the increase in net sales.
Selling, General and Administrative Expenses
Selling, general and administrative expenses
increased
to
$112.2 million
in
fiscal year 2012
from
$78.6 million
in
fiscal year 2011
, an
increase
of
$33.6 million
, or
42.7%
. As a percentage of net sales, selling, general and administrative expenses increased
30
basis points to
26.8%
in
fiscal year 2012
compared to
26.5%
in
fiscal year 2011
. The
increase
in selling, general and administrative expense was primarily the result of increases of $19.5 million in store-related expenses to support new store growth, $10.5 million of stock-based compensation expense recorded in
fiscal year 2012
associated with the cancellation of certain stock options in exchange for the grant of restricted shares in March 2012 and on-going expense recognition of the awards over the remaining vesting period and $9.1 million of corporate related expenses, partially offset by $6.1 million of a non-contractual bonus to certain executive officers for performance in fiscal 2011. Fiscal 2012 also included $1.0 million of fees in connection with the filing of the secondary public offering.
In connection with a $65.3 million repayment of our $100.0 million term loan facility, we expensed $1.6 million of deferred financing costs in fiscal 2012.
Interest Expense (Income), Net
Interest expense, net increased to
$2.4 million
in
fiscal year 2012
. The increase in interest expense resulted from interest on the outstanding balance of our term loan facility of
$1.9 million
, as well as amortization of deferred financing fees of
$0.5 million
.
Income Tax Expense
Income tax expense
increased
to
$14.1 million
in
fiscal year 2012
from
$10.2 million
in
fiscal year 2011
, an
increase
of
$3.9 million
, or
38.2%
. This
increase
in income tax expense was primarily the result of a
$7.9 million
increase in pre-tax net income. Our effective tax rate increased to
41.3%
in
fiscal year 2012
from
38.7%
in
fiscal year 2011
. Our
fiscal year 2012
effective tax rate is negatively impacted by permanent book to tax differences relating to fees paid for our secondary offering in fiscal 2012.
Net Income
As a result of the foregoing, net income
increased
to
$20.0 million
in
fiscal year 2012
from
$16.1 million
in
fiscal year 2011
an increase of
$3.9 million
, or
24.2%
. The 53rd week in fiscal 2012 had an immaterial impact to net income.
Fiscal Year 2011 Compared to Fiscal Year 2010
33
Net Sales
Net sales increased to $297.1 million in fiscal year 2011 from $197.2 million in fiscal year 2010, an increase of $99.9 million, or 50.7%. The increase was the result of a comparable store sales increase of $13.1 million and a non-comparable store sales increase of $86.8 million. In fiscal year 2011, we opened a net of 50 new stores compared to a net of 40 new stores in fiscal year 2010. New store openings are the primary driver for our increase in non-comparable store sales.
Comparable store sales increased 7.9% for fiscal year 2011 compared to fiscal year 2010. This increase resulted from an increase of approximately 6.1% in the number of transactions in our stores and an increase in the average dollar value of transactions of approximately 1.8%.
Cost of Goods Sold and Gross Profit
Cost of goods sold increased to $192.3 million in fiscal year 2011 from $131.0 million in fiscal year 2010, an increase of $61.2 million, or 46.7%. The increase in cost of goods sold was primarily the result of a $48.2 million increase in the merchandise costs of goods resulting from an increase in sales and a $9.7 million increase in store occupancy as a result of new store openings.
Gross profit increased to
$104.9 million
in fiscal year 2011 from $66.1 million in fiscal year 2010, an increase of $38.7 million, or 58.5%. Gross margin increased from 33.5% in fiscal year 2010 to 35.3% for fiscal year 2011, an increase of 180 basis points. The increase in gross margin was primarily the result of a 102 and 64 basis point increase from buying and store occupancy expense, respectively, as buying expense decreased from prior year and store occupancy expense increased at a lower rate than the increase in net sales.
Selling, General and Administrative Expenses
Selling, general and administrative expenses increased to $78.6 million in fiscal year 2011 from $54.3 million in fiscal year 2010, an increase of $24.3 million, or 44.7%. As a percentage of net sales, selling, general and administrative expenses decreased 110 basis points to 26.5% in fiscal year 2011 compared to 27.6% in fiscal year 2010. The increase in selling, general and administrative expense was primarily the result of increases of $17.4 million of store-related expenses to support new store growth and $6.0 million of a non-contractual bonus to certain executive officers for performance in fiscal 2011, which was partially offset by a decrease of $5.3 million in expense related to the 2010 Transaction, including compensation cost associated with the modification of certain stock options.
Income Tax Expense
Income tax expense increased to $10.2 million in fiscal year 2011 from $4.8 million in fiscal year 2010, an increase of $5.4 million, or 113.7%. This increase in income tax expense was primarily the result of a $14.5 million increase in pre-tax net income. Our effective tax rate decreased from 40.4% in fiscal year 2010 to 38.7% in fiscal year 2011.
Net Income
As a result of the foregoing, net income increased to $16.1 million in fiscal year 2011 from $7.0 million in fiscal year 2010, an increase of $9.1 million, or 128.9%.
Seasonality
Our business is seasonal in nature and demand is generally the highest in the fourth fiscal quarter due to the year-end holiday season. To prepare for the holiday season, we must order and keep in stock more merchandise than we carry during other parts of the year. We expect inventory levels, along with an increase in accounts payable and accrued expenses, generally to reach their highest levels in the third and fourth fiscal quarters in anticipation of the increased net sales during the year-end holiday season. As a result of this seasonality, and generally because of variation in consumer spending habits, we experience fluctuations in net sales and working capital requirements during the year.
Liquidity and Capital Resources
Overview
Our primary sources of liquidity are cash flows from operations, historical equity financings and borrowings under our Revolving Credit Facility (defined in “-
Line of Credit
”). Our primary cash needs are for capital expenditures and working capital. During
fiscal 2012
, we also entered into a Term Loan Facility (defined in “-
Financing Transactions
”) and used the proceeds to pay the 2012 Dividend in May 2012.
34
Capital expenditures typically vary depending on the timing of new store openings and infrastructure-related investments. We plan to make capital expenditures of approximately
$26.0 million
in fiscal
2013
, which we expect to fund from cash generated from operations. We expect to devote approximately
$15.4 million
of our capital expenditure budget in fiscal
2013
to construct and open
60
net new stores and a new distribution center, with the remainder projected to be spent on corporate infrastructure and store relocations and remodels.
Our primary working capital requirements are for the purchase of store inventory and payment of payroll, rent, other store operating costs and distribution costs. Our working capital requirements fluctuate during the year, rising in the third and fourth fiscal quarters as we take title to increasing quantities of inventory in anticipation of our peak, year-end holiday shopping season in the fourth fiscal quarter. Fluctuations in working capital are also driven by the timing of new store openings.
Historically, we have funded our capital expenditures and working capital requirements during the fiscal year with cash on hand and borrowings under our Revolving Credit Facility. We did not have any direct borrowings under our Revolving Credit Facility during
fiscal year 2012
. When we have used our Revolving Credit Facility, the amount of indebtedness outstanding under it has tended to be the highest in the beginning of the fourth quarter of each fiscal year. Over the past three fiscal years, to the extent that we have drawn on the facility, we have paid down the borrowings before the end of the fiscal year with cash generated during our peak selling season in the fourth quarter.
As of
February 2, 2013
, the balance outstanding under the Term Loan Facility was $34.5 million. Pursuant to the terms of the Term Loan Facility, due to the repayment of $65.3 million of principal under the Term Loan Facility in July 2012, we are no longer required to make minimum quarterly payments. We plan to repay approximately $15.0 million of principal on the Term Loan Facility within the next 12 months and have classified this amount as a current liability on our balance sheet as of
February 2, 2013
. The remaining unpaid balance will be due upon maturity.
Based on our growth plans, we believe that our cash position, net cash provided by operating activities and availability under our Revolving Credit Facility will be adequate to finance our planned capital expenditures, working capital requirements and debt service over the next 12 months and for the foreseeable future thereafter. If cash flows from operations and borrowings under our Revolving Credit Facility are not sufficient or available to meet our requirements, then we will be required to obtain additional equity or debt financing in the future. There can be no assurance that equity or debt financing will be available to us when we need it or, if available, that the terms will be satisfactory to us and not dilutive to our then-current shareholders.
Cash Flows
A summary of our cash flows from operating, investing and financing activities is presented in the following table (in millions):
|
|
Fiscal
|
||||||||||
|
2012
|
2011
|
2010
|
|||||||||
|
Net cash provided by operating activities
|
$
|
30.4
|
|
$
|
46.7
|
|
$
|
15.0
|
|
||
|
Net cash used in investing activities
|
(22.9
|
)
|
(18.6
|
)
|
(14.9
|
)
|
|||||
|
Net cash provided by (used in) financing activities
|
7.3
|
|
1.0
|
|
(0.4
|
)
|
|||||
|
Net increase (decrease) during period in cash and cash equivalents
|
$
|
14.8
|
|
$
|
29.1
|
|
$
|
(0.3
|
)
|
||
Cash Provided by Operating Activities
Net cash provided by operating activities for
fiscal 2012
was
$30.4 million
, a
decrease
of
$16.3 million
compared to
fiscal 2011
. The
decrease
in net cash provided by operating activities was primarily the result of the net change in income taxes paid of
$9.6 million
, the settlement of $6.8 million of book overdrafts that were outstanding at January 28, 2012, and the payment of $6.0 million of non-contractual bonuses to certain executive officers for performance which were accrued at January 28, 2012 and an increase in working capital needs to support our growth. Partially offsetting the decreases were increased operating cash flows from store performance. During
fiscal 2012
, we added
52
new stores and expect to add approximately
60
net new stores in fiscal
2013
.
Net cash provided by operating activities for
fiscal 2011
was
$46.7 million
, an
increase
of
$31.7 million
compared to
fiscal 2010
. The
increase
in net cash provided by operating activities was primarily driven by an increase in operating income and the reclassification of $6.8 million in book overdrafts as accounts payable, due to the timing of bank settlement. The primary driver of the
increase
in our operating income is the addition of our new stores. During
fiscal 2011
, we added
50
net new stores.
35
Net cash provided by operating activities for fiscal 2010 was $15.0 million, an increase of $5.8 million compared to fiscal 2009. The increase was primarily driven by an increase in operating income and a decrease in payments on accounts payable due to the timing of vendor payments at fiscal 2010 year-end. The increase in operating income was primarily driven by the addition of 40 new stores in fiscal 2010, with the majority of new stores opening prior to the beginning of the fourth quarter. Partially offsetting these increases were an increase in inventory purchases to support our growth.
Cash Used in Investing Activities
Net cash used in investing activities for
fiscal 2012
was
$22.9 million
, an
increase
of
$4.3 million
compared to
fiscal 2011
related solely to capital expenditures. The increase in capital expenditures was primarily for our new store construction, our new distribution center and corporate infrastructure.
Net cash used in investing activities for
fiscal 2011
was
$18.6 million
, an
increase
of
$3.7 million
compared to
fiscal 2010
and related solely to capital expenditures. The increase in capital expenditures was primarily for corporate infrastructure and our distribution facility.
Net cash used in investing activities for
fiscal 2010
was
$14.9 million
, an increase of
$7.6 million
compared to fiscal 2009 and related solely to capital expenditures. The increase in capital expenditures was primarily for our new store construction and distribution facility.
Cash Provided by (Used in) Financing Activities
Net cash provided by financing activities for
fiscal year 2012
was
$7.3 million
, an increase of
$6.3 million
compared to
fiscal year 2011
. The increase in net cash provided by financing activities was primarily the result of
$100.0 million
of proceeds from our term loan facility and
$73.2 million
of proceeds from the IPO, partially offset by
$99.5 million
of dividend payments,
$65.5 million
of repayments of the term loan facility,
$2.8 million
in debt financing costs and
$1.6 million
related to the excess tax benefit related to restricted shares and the exercise of stock options and warrants. Please see “—Financing Transactions” for a description of the term loan facility entered into on May 16, 2012.
Fiscal
2011
cash flows provided by financing activities were primarily the result of proceeds of $1.1 million from the issuance of common stock.
Fiscal
2010
cash flows used in financing activities were primarily the result of dividends paid to our common shareholders of $192.4 million and the redemption of warrants of $10.2 million, partially offset by net proceeds from the issuance of shares of our preferred stock of $191.9 million, proceeds from the exercise and prepayment of warrants and options to purchase common stock of $6.9 million, and the related excess tax benefit of $3.2 million.
Financing Transactions
On May 16, 2012, we entered into a
$100.0 million
term loan facility with Goldman Sachs Bank USA as administrative agent for a syndicate of lenders (the “Term Loan Facility”). We used the net proceeds from the Term Loan Facility and cash on hand to pay a dividend on all outstanding shares of our common stock and Series A 8% Convertible Preferred Stock totaling
$99.5 million
. On the same day, we amended and restated our existing senior secured Revolving Credit Facility with Wells Fargo Bank, National Association, which is defined below under “—Line of Credit.” We refer to the Term Loan Facility, the amendment and restatement of the Revolving Credit Facility and related transactions as the “Financing Transactions.”
The Term Loan Facility provides for a term loan of
$100.0 million
and matures on the earlier of (i) May 16, 2015 and (ii) the date on which such facility is accelerated following the occurrence of an event of default. The Term Loan Facility provides for interest on borrowings, at our option, at an alternate base rate which is the greater of (i) the administrative agent’s prime rate in effect on such day and (ii) the federal funds effective rate in effect on such day plus
0.50%
with a
2.00%
floor, plus a margin of
3.25%
,
or a London Interbank Offer Rate (“LIBOR”) based rate with a
1.00%
floor plus a margin of
4.25%
. The credit agreement for the Term Loan Facility includes a maximum consolidated net leverage ratio financial covenant, the calculation of which allows us to net up to
$10.0 million
of our cash and cash equivalents against our indebtedness. Our leverage ratio must not exceed
3.25x
for the testing periods in calendar year 2012,
2.75x to 2.50x
for the testing periods in calendar year 2013,
2.00x
for the testing periods in calendar year 2014 and
1.75x
thereafter.
The credit agreement for the Term Loan Facility also includes customary negative and affirmative covenants including, among others, limitations on our ability to: (i) incur additional debt; (ii) create liens; (iii) make certain investments, loans and advances; (iv) sell assets; (v) pay dividends or make distributions or other restricted payments; (vi) engage in mergers or consolidations; or (vii) change our business.
The Term Loan Facility is subject to repayment upon the receipt of certain proceeds, including those from the sale of certain assets, insurance proceeds and indebtedness not otherwise permitted. The Term Loan Facility was also subject to repayment of
$50.0 million
upon the receipt of proceeds from the IPO. We closed the IPO on July 24, 2012. On
July 27, 2012
, we repaid
$65.3 million
of principal on the Term Loan Facility and
$0.7 million
of interest. On October 26, 2012, we repaid
$0.3 million
of principal on the Term Loan Facility. As of
February 2, 2013
, the balance outstanding under the Term Loan
36
Facility was
$34.5 million
, bearing interest at a rate of
5.25%
. Pursuant to the terms of the Term Loan Facility, due to the repayment of
$65.3 million
of principal in July 2012, we are no longer required to make minimum quarterly payments. We plan to repay approximately $15.0 million of principal on the Term Loan Facility within the next 12 months and have classified the amount as a current liability on our
balance sheet as of
February 2, 2013
. The remaining unpaid balance will be due upon maturity.
In connection with the Term Loan Facility, we incurred deferred financing costs of
$2.7 million
which are being amortized over the term of the Term Loan Facility. The amortization is included in interest expense, net, in the statement of operations. In connection with the repayment in
July
2012
,
$1.6 million
of the deferred financing costs were written off and included in loss on debt extinguishment in the statement of operations. The remaining deferred financing costs, net of amortization, are included in other assets in the balance sheet at
February 2, 2013
. We had approximately
$0.8 million
and
$38,000
of remaining deferred financing fees as of
February 2, 2013
and
January 28, 2012
, respectively.
Amounts under the credit agreement for the Term Loan Facility may become due upon certain events of default including, among others, failure to comply with the credit agreement’s covenants, bankruptcy, default on certain other indebtedness or a change in control. The default rate under the Term Loan Facility is
2.00%
per annum.
All obligations under the Term Loan Facility are secured by substantially all of our assets.
As of
February 2, 2013
, we were in compliance with the financial covenant and other covenants applicable to us under the Term Loan Facility. During
fiscal 2012
, we recorded
$2.4 million
in interest expense, including amortization of deferred financing fees of
$0.5 million
.
Line of Credit
On August 18, 2006, we entered into a Loan and Security Agreement (the "Loan and Security Agreement") with Wachovia Bank National Association (predecessor in interest to Wells Fargo Bank, National Association) that included a revolving line of credit with advances tied to a borrowing base. The Loan and Security Agreement was amended and/or restated several times, the latest on May 16, 2012 (as amended and restated, the "Revolving Credit Facility"), generally to extend the maturity date, increase maximum borrowings, adjust the applicable interest rates and modify certain definitions.
The Revolving Credit Facility allows maximum borrowings of
$20.0 million
with advances tied to a borrowing base and expires on the earliest to occur of (i) May 16, 2017, (ii) the date which is 45 days prior to the maturity date of the Term Loan Facility if the Term Loan Facility remains outstanding or (iii) upon the occurrence of an event of default. The Revolving Credit Facility may be increased to
$30.0 million
upon certain conditions. The Revolving Credit Facility includes a
$5.0 million
sub-limit
for the issuance of letters of credit. The borrowing base is
90%
of eligible credit card receivables plus
90%
of the net recovery percentage of eligible inventory less established reserves. We incurred deferred financing costs of
$50,000
in May 2012 in connection with the Revolving Credit Facility and such costs are being amortized over the remaining term of the Revolving Credit Facility.
The Revolving Credit Facility provides for interest on borrowings, at our option, at (a) a prime rate plus a margin of (i)
0.75%
if excess availability is greater than or equal to
75%
, (ii)
1.0%
if excess availability is less than
75%
but greater than or equal to
33%
or (iii)
1.25%
if excess availability is less than
33%
or (b) a LIBOR-based rate plus a margin of (i)
1.75%
if excess availability is greater than or equal to
75%
, (ii)
2.00%
if excess availability is less than
75%
but greater than or equal to
33%
or (iii)
2.25%
if excess availability is less than
33%
. The Revolving Credit Facility further provides for a letter of credit fee equal to the LIBOR-based rate plus (i)
1.75%
if excess availability is greater than or equal to
75%
, (ii)
2.00%
if excess availability is less than 75% but greater than or equal to
33%
or (iii)
2.25%
if excess availability is less than
33%
. The Revolving Credit Facility also contains an unused credit facility fee of
0.375%
per annum and is subject to a servicing fee of
approximately $12,000
per year.
As of
February 2, 2013
, we
had approximately $0.3 million letter of credit outstanding that was undrawn.
The Revolving Credit Facility includes a covenant which requires us to maintain minimum excess collateral availability of no less than the greater of (i)
10%
of the then effective maximum credit and (ii)
$3.0 million
.
The Revolving Credit Facility also includes customary negative and affirmative covenants including, among others, limitations on our ability to (i) incur additional debt; (ii) create liens; (iii) make certain investments, loans and advances; (iv) sell assets; (v) pay dividends or make distributions or other restricted payments; (vi) engage in mergers or consolidations; or (vii) change our business.
Additionally, the Revolving Credit Facility is subject to payment upon our receipt of certain proceeds, including those from the sale of certain assets and is subject to an increase in the interest rate on borrowings and the letter of credit fee of
2.0%
upon an event of default. Amounts under the Revolving Credit Facility may become due upon certain events of default including, among others, failure to comply with the Revolving Credit Facility’s covenants, bankruptcy, default on certain other indebtedness or a change in control.
During fiscal 2012, the Comp
any had no borrowings or interest expense under the Revolving Credit Facility. At
February 2, 2013
, the Company had approximately $20.0 million available on the line of credit of which $19.7 million was
37
available and $0.3 million was issued but undrawn on an outstanding letter of credit obligation.
During fiscal 2011, we had no borrowings or interest expense under the Revolving Credit Facility and we had approximately $20.0 million available on the line of credit for borrowings at
January 28, 2012
, based on the borrowing base. During fiscal 2010, the maximum borrowings and weighted average interest rate under the Revolving Credit Facility were $8.2 million and 4.85%, respectively, and interest
expense was $53,000.
All obligations under the Revolving Credit Facility are secured by substantially all of our assets. As of
February 2, 2013
and
January 28, 2012
, we were in compliance with the covenants applicable to us under the Revolving Credit Facility.
2010 Transaction
On October 14, 2010, Advent and Sargent Family Investment, LLC, a limited liability company controlled by Ronald Sargent, one of our board members, invested $192.9 million and $1.1 million, respectively, in Five Below in consideration for 88,785,489 and 506,284 shares of our Series A 8% convertible preferred stock, respectively, and, as a result of such investment, Advent acquired a majority interest in us. In connection with this transaction, all of our outstanding shares of preferred stock on October 13, 2010 were converted into shares of our common stock and all of our then outstanding options and warrants were exercised or exchanged for restricted or unrestricted shares of our common stock or were exchanged for unrestricted shares and cash. We used the proceeds of this investment as well as cash on hand to pay a special dividend to the holders of our common stock on October 14, 2010. The aggregate amount of such dividend was approximately $196.7 million, or $13.24 per share.
Stock Split
On July 17, 2012, we amended our articles of incorporation to reflect a 0.3460-for-1 reverse stock split of our common stock. The amendment also changed the authorized shares of our common stock to 120,000,000 shares. Concurrent with the reverse stock split, we adjusted (i) the conversion price of our Series A 8% Convertible Preferred Stock, (ii) the number of shares subject to and the exercise price of our outstanding stock option awards under our equity incentive plan and (iii) the number of shares subject to and the exercise price of our outstanding warrants to equitably reflect the split. All common stock share and per-share data presented in this Annual Report gives effect to the reverse stock split and the change in authorized shares and have been adjusted retroactively for all periods presented.
Initial Public Offering
On July 24, 2012, we completed our IPO of 11,057,692 shares of common stock at a price of $17.00 per share. The common stock was listed on The NASDAQ Global Select Market under the symbol “FIVE.” The shares sold in the IPO were registered under the Securities Act of 1933, as amended, pursuant to our Registration Statement on Form S-1 (File No. 333-180780), which was declared effective by the Securities and Exchange Commission on July 18, 2012. Of the 11,057,692 shares sold in the IPO, we issued 4,807,692 shares, and 6,250,000 shares were sold by selling shareholders, including 1,442,308 shares sold pursuant to the exercise in full of the underwriters’ over-allotment option. We did not receive any proceeds from shares sold by the selling shareholders. We received proceeds of approximately $73.2 million, net of approximately $8.5 million in underwriting discounts and legal, accounting and other fees incurred in connection with the IPO. Of the $73.2 million net proceeds received from the IPO, approximately $65.3 million and $0.7 million, respectively, were used to repay principal and interest under our Term Loan Facility that existed as of the date of the IPO. The remaining net proceeds of the IPO were used for general corporate purposes, including working capital.
Secondary Public Offering
On February 4, 2013, we completed our secondary public offering of 13,012,250 shares of common stock at a price of $35.65. The shares sold in the secondary public offering were registered under the Securities Act of 1933, as amended, pursuant to our Registration Statements on Form S-1 (File No. 333-186043 and File No. 333-186275), which were declared effective by the Securities and Exchange Commission on January 29, 2013. All of the shares sold in the secondary public offering were sold by selling shareholders and the Company did not receive any proceeds. The Company did incur fees of approximately $1.0 million related to legal, accounting, and other fees in connection with the secondary public offering.
Critical Accounting Policies and Estimates
We have identified the policies below as critical to our business operations and understanding of our results of operations. The impact and any associated risks related to these policies on our business operations are discussed throughout “Management’s Discussion and Analysis of Financial Condition and Results of Operations” where such policies affect our reported and expected financial results. Our financial statements, which have been prepared in accordance with U.S. generally accepted accounting principles, require us to make estimates and judgments that affect the reported amounts of assets,
38
liabilities, revenues, expenses and related disclosures. We base our estimates on historical experience and various other assumptions that we believe to be reasonable under the circumstances. Actual results may differ from these estimates. For a detailed discussion on the application of these and other accounting policies, see Note 1 in our annual financial statements included elsewhere in this
Annual Report
.
Inventories
Inventories consist of finished goods purchased for resale, including freight, and are stated at the lower of cost or market value, at the individual product level. Cost is determined on a weighted average cost method which approximates a FIFO (first-in, first-out) basis. The market value used in the lower of cost or market analysis is subject to the effects of consumer demands, customer preferences and the broader economy. The effects of the previously listed criteria are not controllable by management. Our management reviews inventory levels in order to identify obsolete and slow-moving merchandise as these factors can indicate a decline in the market value of inventory on hand. Inventory cost is reduced when the selling price less costs of disposal is below cost. We accrue an estimate for inventory shrink for the period between the last physical count and the balance sheet date. The shrink estimate can be affected by changes in merchandise mix and changes in actual shrink trends. These estimates are derived using available data and our historical experience. Our estimates may be impacted by changes in certain underlying assumptions and may not be indicative of future activity.
Impairment of Long-Lived Assets
In accordance with Accounting Standards Codification ("ASC") Topic 360,
Property, Plant and Equipment
, long-lived assets, such as property and equipment, are reviewed for impairment whenever events or changes in circumstances indicate that the carrying amount of the asset may not be recoverable. Assets are grouped and evaluated for impairment at the lowest level of which there are identifiable cash flows, which is generally at a store level. Assets are reviewed for impairment using factors including, but not limited to, our future operating plans and projected cash flows. Recoverability of assets to be held and used is measured by a comparison of the carrying amount of an asset to estimated undiscounted future cash flows expected to be generated by the asset. If the carrying amount of the asset exceeds its estimated undiscounted future cash flows, then an impairment charge is recognized as the amount by which the carrying amount of the assets exceeds the fair value of the assets. Fair value is based on discounted future cash flows of the asset using a discount rate commensurate with the risk. In the event of a store closure, we will record an impairment charge, if appropriate, or accelerate depreciation over the revised useful life of the asset. Based on the analysis performed, our management believes that there was no impairment of long-lived assets for each of the
2012
,
2011
and
2010
fiscal years. The impairment loss analysis requires management to apply judgment and make estimates.
Income Taxes
Income taxes are accounted for under the asset-and-liability method in accordance with ASC Topic 740,
Income Taxes.
Deferred tax assets and liabilities are recognized for the future tax consequences attributable to differences between the financial statement carrying amounts of existing assets and liabilities and their respective tax bases and operating loss and tax credit carryforwards. Deferred tax assets and liabilities are measured using enacted tax rates expected to apply to taxable income in the years in which those temporary differences are expected to be recovered or settled. The effect on deferred tax assets and liabilities of a change in tax rates is recognized in income in the period that includes the enactment date. We recognize the effect of income tax positions only if those positions are more likely than not of being sustained. Recognized income tax positions are measured at the largest amount that is greater than 50% likely of being realized. Changes in recognition or measurement are reflected in the period in which the change in judgment occurs.
We record a valuation allowance to reduce our deferred tax assets when uncertainty regarding their realizability exists. In assessing the realizability of deferred tax assets, our management considers whether it is more likely than not that some portion or all of the deferred tax assets will not be realized. The ultimate realization of deferred tax assets is dependent upon the generation of future taxable income during periods in which those temporary differences become deductible. Our management considers the scheduled reversal of deferred tax liabilities, projected future taxable income, and tax planning strategies in making this assessment.
Stock-Based Compensation
We account for stock-based compensation in accordance with ASC Topic 718,
Compensation-Stock Compensation
, which establishes accounting for equity instruments exchanged for employee services. Under the provisions of this guidance, our stock-based compensation expense is measured at the grant date, based on the calculated fair value of the award, and is recognized as an expense on a straight-line basis over the employee's requisite service period (generally the vesting period of the equity grant). We recognize compensation expense based on the estimated grant date fair value of restricted stock awards and use the Black-Scholes option-pricing model for grants of stock options. The determination of the grant date fair value of options using an option-pricing model is affected by a number of assumptions, such as our estimated common stock fair value,
39
our expected stock price volatility over the expected term of the options, stock option exercise and cancellation behaviors, risk-free interest rates and expected dividends. As a result, if any of the inputs or assumptions used in the Black-Scholes model change significantly, stock-based compensation for future awards may differ materially compared with the awards granted previously.
We account for stock-based compensation for non-employee stock options by using the Black-Scholes option-pricing model and record expense as the options vest. Non-employee options subject to vesting are required to be periodically revalued over their service period, which is generally the same as the vesting period.
There are significant judgments and estimates inherent in the determination of fair value of stock-based awards. These judgments and estimates include determinations of an appropriate valuation method and the selection of appropriate inputs to be used in the valuation model. The use of alternative assumptions, including expected term, volatility, risk-free interest rate and dividend yield, could cause stock-based compensation to differ significantly from what has been recorded in the past. Future stock-based compensation cost will increase when we grant additional equity awards. Modifications, cancellations or repurchases of awards may require us to accelerate any remaining unearned stock-based compensation cost or incur additional cost.
Determination of the Fair Value of Common Stock on Grant Date.
Prior to our IPO, we were a private company with no active public market for our common stock. Therefore, prior to the IPO, in connection with each grant of restricted stock and stock options, the fair value of the common stock underlying the awards was determined by our board of directors, which intended all stock options granted to be exercisable at a price per share not less than the per share fair value of our common stock underlying those stock options on the date of grant. We determined the estimated per share fair value of our common stock using contemporaneous valuations consistent with the American Institute of Certified Public Accountants Practice Aid,
Valuation of Privately-Held Company Equity Securities Issued as Compensation
, or the Practice Aid. In conducting these valuations, we considered all objective and subjective factors that we believed to be relevant, including our best estimate of our business condition, prospects and operating performance at the valuation date. Management, with the assistance of a third-party valuation firm engaged by us, used a range of factors, assumptions and methodologies to perform the valuations. The significant factors included:
|
•
|
the fact that we were a private retail company with illiquid securities;
|
|
•
|
our historical operating results;
|
|
•
|
our discounted future cash flows, based on our projected operating results;
|
|
•
|
the likelihood of achieving a liquidity event for the shares of common stock underlying these stock options, such as an initial public offering or sale of our company, given prevailing market conditions;
|
|
•
|
valuation of comparable public companies at the time of grant;
|
|
•
|
the U.S. and global capital market conditions; and
|
|
•
|
outlook for our industry at the time of grant.
|
After review of the fair value analysis, our board of directors authorized the use of at least that fair value as the value for restricted shares granted and the exercise price for options granted on the date of that valuation report.
Valuation Methodologies Used in Determining Fair Value.
To determine the estimated fair value of our common stock in relation to stock grants prior to our IPO, we conducted valuation analyses with the assistance of a third-party valuation firm that has experience in the retail industry. We considered three enterprise value allocation methods outlined in the Practice Aid. The Practice Aid discusses three “top-down” methods that establish the fair value of the enterprise and then allocate this value among the various classes of equity. These methods are referred to as: (i) the current-value method, (ii) the option-pricing method and (iii) the probability-weighted expected return method, or PWERM. For our valuations, we used the PWERM for three discrete scenarios: continuation as a private company (i.e., no liquidity event), initial public offering, and strategic sale or merger. Management determined the likelihood of these various outcomes to further support the selection of this method.
Under the PWERM, the value of our common stock was estimated based upon an analysis of future enterprise values under the aforementioned scenarios. The future enterprise values were allocated among the various equity classes expected to be outstanding at the various liquidity events based on the rights and preferences of each class. The future value of the common stock under each liquidation event was then discounted back to the valuation date at an appropriate risk-adjusted discount rate and probability weighted to arrive at an indication of value for the common stock. For the continue as a private company scenario, discounts for lack of marketability and lack of control, to account for the illiquidity of the common stock and a minority holding, were applied to the indicated common stock value to determine the fair value of the common stock. As of each valuation date described below, the probability of an exit via an initial public offering or strategic sale or merger was considered significantly more likely than remaining a private company. As such, a lower probability was assigned to the continue as a private company scenario at each valuation date based on management's best estimate. Moreover, the exit via an initial public offering scenario was considered to be significantly more likely than an exit via a strategic sale or merger. Each of
40
the liquidity event dates determined by management was weighted based on the likelihood of the initial public offering timing at these dates.
After consideration of conventional valuation approaches, we concluded that the income and market approach were most appropriate to determine the fair value of our common stock under the continuation as a private company scenario. The income approach is a valuation technique that provides an estimation of the fair value of a business based upon the cash flows that it can be expected to generate over time. The market approach is a valuation technique that provides an estimation of fair value based on market prices of publicly traded companies. With regard to weighting the conclusions that were reached by applying the income and market approaches, we considered the quality and the reliability of the data underlying each indication of value at each valuation date. Based on management's analysis of the underlying data, the weighting of value between the income and market approaches was adjusted to provide the most reliable indication of value. It was our opinion that while both approaches provide reliable value indications, the income approach was considered to provide a slightly more reliable indication of value because it assumed that a hypothetical investor in our securities would place more importance on the projected operations and forecasted future financial performance given the above average growth trajectory. Therefore, primary emphasis and weighting was placed on the income approach under the continue as a private company scenario.
Under the initial public offering scenario, the fair value of our common shares was based upon transactions of publicly traded companies (“guideline companies”) engaged in a line (or lines) of business similar to us (the “public company method”). In conjunction with guidance from our Board of Directors and independent valuation firm, a search for guideline companies was made which revealed numerous publicly-traded companies in the “discount stores” and “teen brands” retail industry. Beginning with our November 2011 valuation, guideline companies in the “high growth” retail industry were included in our analysis to better compare the nature of our business with other comparable companies. Though the selected guideline companies differed in some respects from our business, they were generally influenced by similar business and economic conditions and were considered to offer alternative investment opportunities. The application of the public company method utilized market multiples based on current market prices together with historical and forecasted financial data of the publicly traded guideline companies. Selected market multiples derived in the analysis were then applied to our historical or projected financial results to arrive at indications of value.
Stock Option and Restricted Stock Grants.
On October 14, 2010, we granted stock options to purchase a total of 2,020,620 shares of common stock at an exercise
price of $6.31 per share to two employees, both of whom were also directors, pursuant to our equity incentive plan. We determined that the fair value of the common stock on the date of grant was $5.75 per share. To assess the reasonableness of the fair value of our common stock on this date, we considered a concurrent third-party transaction on October 14, 2010 whereby Advent International Corporation and Sargent Family Investment, LLC purchased 89,291,773 shares of Series A 8% Convertible Preferred Stock at $2.17 per share ($6.28 on an as-converted basis). The preferred shareholders had certain rights and privileges over common shareholders which resulted in a premium on the preferred stock over common stock, including:
|
•
|
an 8% dividend;
|
|
•
|
senior liquidation preferences;
|
|
•
|
right to appoint four members to a seven member Board of Directors; and
|
|
•
|
anti-dilution protection
|
In assessing the reasonableness of the fair value of our common stock, we also considered:
|
•
|
an independent valuation utilizing the above valuation methods that indicated a valuation price of $5.75 per common share as of December 1, 2010.
|
|
•
|
that there were no material changes in factors impacting common stock per share value from October 14, 2010 to December 1, 2010, including:
|
|
•
|
macroeconomic conditions;
|
|
•
|
retail sector performance;
|
|
•
|
stock market conditions;
|
|
•
|
interest rates; and
|
|
•
|
our operating performance and future projections.
|
On December 1, 2010, we granted stock options to purchase a total of 115,556 shares of common stock at an exercise price of $6.31 per share to 21 employees pursuant to our equity incentive plan. We determined that the fair value of the common stock on the date of grant was $5.75 per share. To assess the reasonableness of the fair value of our common stock on this date, we considered:
41
|
•
|
an independent valuation utilizing the above valuation methods that indicated a valuation price of $5.75 per common share as of December 1, 2010.
|
On February 22, 2011, we granted stock options to purchase a total of 25,950 shares of common stock at an exercise price of $6.31 per share to nine employees pursuant to our equity incentive plan. We determined that the fair value of the common stock on the date of grant was $5.75 per share. To assess the reasonableness of the fair value of our common stock on this date, we considered:
|
•
|
an independent valuation utilizing the above valuation methods that indicated a valuation price of $5.75 per common share as of December 1, 2010.
|
|
•
|
there were no material changes in factors impacting common stock per share value from December 1, 2010 to February 22, 2011, including:
|
|
•
|
macroeconomic conditions;
|
|
•
|
retail sector performance;
|
|
•
|
stock market conditions;
|
|
•
|
interest rates; and
|
|
•
|
our operating performance and future projections.
|
On May 25, 2011, we granted stock options to purchase a total of 150,250 shares of common stock at an exercise price of $6.31 per share to 81 employees pursuant to our equity incentive plan. We determined that the fair value of the common stock on the date of grant was $6.04 per share. To assess the reasonableness of the fair value of our common stock on this date, we considered:
|
•
|
an independent valuation utilizing the above valuation methods that indicated a valuation price of $6.04 per common share as of April 2, 2011.
|
|
•
|
changes in valuation which were primarily due to the following:
|
|
•
|
based on the passage of time from our previous determination of fair value, we was assumed to be closer to a liquidity event and therefore reduced the present value discounting, which increased our estimated value per share.
|
|
•
|
that there were no material changes in factors impacting common stock per share value from April 2, 2011 to May 25, 2011, including:
|
|
•
|
macroeconomic conditions;
|
|
•
|
retail sector performance;
|
|
•
|
stock market conditions;
|
|
•
|
interest rates; and
|
|
•
|
our operating performance and future projections.
|
On September 1, 2011, we granted stock options to purchase a total of 35,543 shares of common stock at an exercise price of $6.97 per share to 28 employees pursuant to our equity incentive plan. We determined that the fair value of the common stock on the date of grant was $6.97 per share. To assess the reasonableness of the fair value of our common stock on this date, we considered:
|
•
|
an independent valuation utilizing the above valuation methods that indicated a valuation price of $6.97 per common share as of September 1, 2011.
|
|
•
|
changes in valuation which were primarily due to the following:
|
|
•
|
based on the passage of time from our previous determination of fair value, we assumed to be closer to a liquidity event and therefore reduced the present value discounting, which increased our estimated value per share; and
|
|
•
|
management determined that the likelihood of an initial public offering or other liquidity event had increased from our previous estimate of fair value based on discussions with investors and advisors. Therefore management revised our probability assigned to either an initial public offering or other liquidity event from 70% to 80%, which increased our estimated value per share.
|
42
On October 18, 2011, we granted stock options to purchase a total of 270,500 shares of common stock at an exercise price of $6.97 per share to 120 employees pursuant to our equity incentive plan. We determined that the fair value of the common stock on the date of grant was $6.97 per share. To assess the reasonableness of the fair value of our common stock on this date, we considered:
|
•
|
an independent valuation utilizing the above valuation methods that indicated a valuation price of $6.97 per common share as of September 1, 2011.
|
|
•
|
that there were no material changes in factors impacting common stock per share value from September 1, 2011 to October 18, 2011, including:
|
|
•
|
macroeconomic conditions;
|
|
•
|
retail sector performance;
|
|
•
|
stock market conditions;
|
|
•
|
interest rates; and
|
|
•
|
our operating performance and future projections.
|
On November 22, 2011, we granted stock options to purchase a total of 129,058 shares of common stock at an exercise price of $8.16 per share to seven employees pursuant to our equity incentive plan. We determined that the fair value of the common stock on the date of grant was $8.15 per share. To assess the reasonableness of the fair value of our common stock on this date, we considered:
|
•
|
an independent valuation utilizing the above valuation methods that indicated a valuation price of $8.15 per common share as of November 22, 2011.
|
|
•
|
changes in valuation which were primarily due to the following:
|
|
•
|
multiples of the our guideline public company peer group were generally higher than at the time of the our previous valuation, which increased our estimated value per share;
|
|
•
|
based on the passage of time from our previous determination of fair value, we assumed to be closer to a liquidity event and therefore reduced the present value discounting, which increased our estimated value per share; and
|
|
•
|
following the completion of our third fiscal quarter, management revised the full year forecast upward, which resulted in an increased value per share.
|
On March 1, 2012, we granted stock options to purchase a total of 318,666 shares of common stock at an exercise price of $11.22 per share to 146 employees pursuant to our equity incentive plan. We determined that the fair value of the common stock on the date of grant was $11.21 per share. To assess the reasonableness of the fair value of our common stock on this date, we considered:
|
•
|
an independent valuation utilizing the above valuation methods that indicated a valuation price of $11.21 per common share as of February 21, 2012.
|
|
•
|
changes in valuation which were primarily due to the following:
|
|
•
|
multiples of our guideline public company peer group were generally higher than at the time of our previous valuation, which increased our value per share;
|
|
•
|
an upward revision in Management's estimate of terminal value, due to the revised projections of growth potential driven by new store openings in new markets, which increased our value per share; and
|
|
•
|
following the completion of our full fiscal year, which exceeded both budgeted revenues and earnings, management revised forecasted financial results upward, which resulted in an increased value per share.
|
|
•
|
there were no material changes in factors impacting common stock per share value from February 21, 2012 to March 1, 2012, including:
|
|
•
|
macroeconomic conditions;
|
|
•
|
retail sector performance;
|
|
•
|
stock market conditions;
|
|
•
|
interest rates; and
|
43
|
•
|
our operating performance and future projections.
|
On March 30, 2012, we granted stock options to purchase a total of 79,926 shares of common stock at an exercise price of $11.22 per share to 12 employees pursuant to our equity incentive plan. In addition, just previous to this grant, on March 22, 2012, we granted 2,020,620 shares of restricted stock in connection with the cancellation of previously granted options. We determined that the fair value of the common stock on the date of both grants was $11.01 per share. To assess the reasonableness of the fair value of our common stock on these dates, we considered:
|
•
|
an independent valuation utilizing the above valuation methods that indicated a valuation price of $11.01 per common share as of March 22, 2012
|
|
•
|
changes in valuation which were primarily due to the following:
|
|
•
|
multiples of our guideline public company peer group were generally lower than at the time of our previous valuation, which decreased our value per share; this decrease was offset by the planned leveraged dividend of approximately $100 million that provided shareholders with earlier liquidity, which increased our value per share.
|
|
•
|
there were no material changes in factors impacting common stock per share value from March 22, 2012 to March 30, 2012, including:
|
|
•
|
macroeconomic conditions;
|
|
•
|
retail sector performance;
|
|
•
|
stock market conditions;
|
|
•
|
interest rates; and
|
|
•
|
our operating performance and future projections.
|
For grant dates from March 31, 2012, through the date of our IPO, the fair value of restricted stock awards were based on the pricing of our IPO and the fair value of stock options were based on the Black-Scholes option-pricing model as discussed above utilizing the IPO price of our common stock as the fair value of common stock in the model. Subsequent to the date of our IPO, the fair value of restricted stock awards are based on the closing price of our common stock on the grant date and the fair value of stock options are based on the Black-Scholes option-pricing model as discussed above utilizing the closing price of our common stock on the grant date as the fair value of common stock in the model.
The Company uses the simplified method to estimate the expected term of the option. The expected volatility incorporates historical and implied volatility of similar entities whose share prices are publicly available. The risk-free rate for the expected term of the option was based on the U.S. Treasury yield curve in effect at the time of grant.
Contractual Obligations
The following table summarizes, as of
February 2, 2013
, our minimum rental commitments under operating lease agreements including assumed extensions, minimum payments for long-term debt and other obligations in future periods:
|
(In millions)
|
Payments Due By Period
|
||||||||||||||||||
|
Total (1)
|
Less than
1 year
|
1-3 years
|
3-5 years
|
More than
5 years
|
|||||||||||||||
|
Operating lease obligations (2)
|
$
|
373.5
|
|
$
|
41.1
|
|
$
|
91.3
|
|
$
|
84.7
|
|
$
|
156.4
|
|
||||
|
Purchase obligations (3)
|
2.3
|
|
2.3
|
|
—
|
|
—
|
|
—
|
|
|||||||||
|
Notes payable (4)
|
34.5
|
|
15.0
|
|
19.5
|
|
—
|
|
—
|
|
|||||||||
|
Total
|
$
|
410.3
|
|
$
|
58.4
|
|
$
|
110.8
|
|
$
|
84.7
|
|
$
|
156.4
|
|
||||
|
(1)
|
The amounts in this table exclude obligations under employment agreements. For a discussion of the compensation of our executive officers, see Part III, Item 11 “Executive Compensation”
|
|
(2)
|
Our store leases generally have initial lease terms of 5-10 years and include renewal options on substantially the same terms and conditions as the original lease. Also included in operating leases is our corporate office and distribution center leases.
|
|
(3)
|
Purchase obligations are primarily for materials that will be used in the construction of new stores and purchase commitments for infrastructure and systems that will be implemented in the construction of our second distribution center.
|
|
(4)
|
We plan to repay approximately $15.0 million of principal on the Term Loan Facility within the next 12 months, which is reflected in the less than 1 year column, although not due per the contractual terms.
|
44
Since
February 2, 2013
, we have entered into
10
new fully executed retail leases with an average term of 10 years that have future minimum lease payments totaling approximately
$14.9 million
.
Off Balance Sheet Arrangements
For the fiscal year ended
February 2, 2013
, except for operating leases entered into in the normal course of business, we were not party to any material off-balance sheet arrangements that are reasonably likely to have a current or future effect on our financial condition, net sales, expenses, results of operations, liquidity, capital expenditures or capital resources.
Recently Issued Accounting Pronouncements
In May 2011, the Financial Accounting Standards Board, or FASB, issued Accounting Standards Update, or ASU, No. 2011-04,
Fair Value Measurement
(
Topic 820
):
Amendments to Achieve Common Fair Value
Measurement and Disclosure Requirements in U.S. GAAP and IFRS
. The amendments in ASU No. 2011-04 result in common fair value measurement and disclosure requirements in U.S. generally accepted accounting principles, or U.S. GAAP, and international financial reporting standards, or IFRS, and change the wording used to describe many of the requirements in U.S. GAAP for measuring fair value and for disclosing information about fair value measurements. The amendments do not require additional fair value measurements and are not intended to establish valuation standards or affect valuation practices outside of financial reporting. ASU No. 2011-04 is effective during interim and annual periods beginning after December 15, 2011. The adoption of the new requirements of ASU No. 2011-04 did not have an impact on our financial position or results of operations.
JOBS Act
We qualify as an “emerging growth company” pursuant to the provisions of the JOBS Act, enacted on April 5, 2012. For as long as we are an “emerging growth company,” we may take advantage of certain exemptions from various reporting requirements that are applicable to other public companies that are not “emerging growth companies,” including, but not limited to, not being required to comply with the auditor attestation requirements of Section 404(b) of the Sarbanes-Oxley Act, reduced disclosure obligations regarding executive compensation in our periodic reports and proxy statements, and exemptions from the requirements of holding advisory “say-on-pay” votes on executive compensation and shareholder advisory votes on golden parachute compensation. However, we do not intend to take advantage of any the exemptions available to “emerging growth companies.”
Under the JOBS Act, we will remain an “emerging growth company” until the earliest of:
|
•
|
the last day of the fiscal year during which we have total annual gross revenues of $1 billion or more;
|
|
•
|
the last day of the fiscal year following the fifth anniversary of the completion of this offering;
|
|
•
|
the date on which we have, during the previous three-year period, issued more than $1 billion in non-convertible debt; and
|
|
•
|
the date on which we are deemed to be a “large accelerated filer” under the Securities Exchange Act of 1934, or the Exchange Act. We will qualify as a large accelerated filer as of the first day of the first fiscal year after we have (i) more than $700 million in outstanding common equity held by our non-affiliates as of the last day of our most recently completed second fiscal quarter, (ii) been a public company for at least 12 months and (iii) filed at least one Annual Report with the SEC. The value of our outstanding common equity will be measured each year on the last day of our second fiscal quarter.
|
The JOBS Act also provides that an “emerging growth company” can utilize the extended transition period provided in Section 7(a)(2)(B) of the Securities Act for complying with new or revised accounting standards. However, we chose to opt out of that extended transition period, and, as a result, we will comply with new or revised accounting standards on the relevant dates on which adoption of such standards is required for companies that are not “emerging growth companies.” Section 107 of the JOBS Act provides that our decision to opt out of the extended transition period for complying with new or revised accounting standards is irrevocable.
Interest Rate Risk
Our principal market risk relates to interest rate sensitivity, which is the risk that future changes in interest rates will reduce our net income or net assets. We have a Revolving Credit Facility which includes a revolving line of credit with advances tied to a borrowing base, and a Term Loan Facility, both of which bear interest at a variable rate. Because our
45
Revolving Credit Facility and Term Loan Facility bear interest at a variable rate, we will be exposed to market risks relating to changes in interest rates.
As of
February 2, 2013
, we had no outstanding direct borrowings under our Revolving Credit Facility, nor did we have any borrowings during
fiscal year 2012
. The Revolving Credit Facility provides for interest on borrowings, at the Company's option, at (a) a prime rate plus a margin of (i)
0.75%
if excess availability is greater than or equal to
75%
, (ii)
1.0%
if excess availability is less than
75%
but greater than or equal to
33%
or (iii)
1.25%
if excess availability is less than
33%
or (b) a LIBOR-based rate plus a margin of (i)
1.75%
if excess availability is greater than or equal to
75%
, (ii)
2.00%
if excess availability is less than
75%
but greater than or equal to
33%
or (iii)
2.25%
if excess availability is less than
33%
. The Revolving Credit Facility further provides for a letter of credit fee equal to the LIBOR-based rate plus (i)
1.75%
if excess availability is greater than or equal to
75%
, (ii)
2.00%
if excess availability is less than 75% but greater than or equal to
33%
or (iii)
2.25%
if excess availability is less than
33%
.
As of
February 2, 2013
, the principal amount of the term loan was
$34.5 million
. The Term Loan Facility provides for interest on borrowings, at our option, at an alternate base rate which is the greater of (i) the administrative agent's prime rate in effect on such day and (ii) the federal funds effective rate in effect on such day plus 0.50% with a 2.00% floor plus a margin of 3.25% or a LIBOR-based rate with a 1.00% floor plus a margin of 4.25%. Based on a sensitivity analysis at
February 2, 2013
, a 100 basis point increase or decrease in market interest rates would increase or decrease our annual interest expense on the Term Loan Facility by approximately
$0.3 million
. We do not use derivative financial instruments for speculative or trading purposes, but this does not preclude our adoption of specific hedging strategies in the future.
Impact of Inflation
Our results of operations and financial condition are presented based on historical cost. While it is difficult to accurately measure the impact of inflation due to the imprecise nature of the estimates required, we believe the effects of inflation, if any, on our historical results of operations and financial condition have been immaterial. We cannot assure you, however, that our results of operations and financial condition will not be materially impacted by inflation in the future.
46
FIVE BELOW, INC.
Index to Financial Statements
|
|
Page
|
|
Audited Financial Statements
|
|
47
Report of Independent Registered Public Accounting Firm
The Board of Directors and Shareholders
Five Below, Inc.:
We have audited the accompanying balance sheets of Five Below, Inc. (the Company) as of
February 2, 2013
and
January 28, 2012
, and the related statements of operations, changes in redeemable convertible preferred stock, convertible preferred stock and shareholders’ equity (deficit), and cash flows for each of the fiscal years in the three-year period ended
February 2, 2013
. These financial statements are the responsibility of the Company’s management. Our responsibility is to express an opinion on these financial statements based on our audits.
We conducted our audits in accordance with the standards of the Public Company Accounting Oversight Board (United States). Those standards require that we plan and perform the audit to obtain reasonable assurance about whether the financial statements are free of material misstatement. An audit includes examining, on a test basis, evidence supporting the amounts and disclosures in the financial statements. An audit also includes assessing the accounting principles used and significant estimates made by management, as well as evaluating the overall financial statement presentation. We believe that our audits provide a reasonable basis for our opinion.
In our opinion, the financial statements referred to above present fairly, in all material respects, the financial position of Five Below, Inc. as of
February 2, 2013
and
January 28, 2012
, and the results of its operations and its cash flows for each of the fiscal years in the three-year period ended
February 2, 2013
, in conformity with U.S. generally accepted accounting principles.
/s/ KPMG LLP
Philadelphia, Pennsylvania
March 28, 2013
48
FIVE BELOW, INC.
Balance Sheets
(in thousands, except share and per share data)
|
February 2, 2013
|
January 28, 2012
|
||||||
|
Assets
|
|||||||
|
Current assets:
|
|||||||
|
Cash and cash equivalents
|
$
|
56,081
|
|
$
|
41,293
|
|
|
|
Inventories
|
60,831
|
|
38,790
|
|
|||
|
Prepaid income taxes
|
36
|
|
—
|
|
|||
|
Deferred income taxes
|
1,295
|
|
4,863
|
|
|||
|
Prepaid expenses and other current assets
|
11,433
|
|
7,303
|
|
|||
|
Total current assets
|
129,676
|
|
92,249
|
|
|||
|
Property and equipment, net
|
59,040
|
|
42,040
|
|
|||
|
Other assets
|
944
|
|
238
|
|
|||
|
|
$
|
189,660
|
|
$
|
134,527
|
|
|
|
|
|||||||
|
Liabilities and Shareholders’ Equity (Deficit)
|
|||||||
|
Current liabilities:
|
|||||||
|
Line of credit
|
$
|
—
|
|
$
|
—
|
|
|
|
Current portion of notes payable
|
15,000
|
|
—
|
|
|||
|
Accounts payable
|
27,952
|
|
23,588
|
|
|||
|
Income taxes payable
|
7,083
|
|
9,139
|
|
|||
|
Accrued salaries and wages
|
4,204
|
|
9,254
|
|
|||
|
Other accrued expenses
|
14,545
|
|
7,961
|
|
|||
|
Total current liabilities
|
68,784
|
|
49,942
|
|
|||
|
Notes payable
|
19,500
|
|
250
|
|
|||
|
Deferred rent and other
|
29,082
|
|
20,933
|
|
|||
|
Deferred income taxes
|
1,550
|
|
1,306
|
|
|||
|
Total liabilities
|
118,916
|
|
72,431
|
|
|||
|
Commitments and contingencies (note 4)
|
|
|
|
|
|||
|
Preferred stock, $0.01 par value. Authorized 5,000,000 and 100,000,000 shares, respectively; 5,000,000 and 10,000,000 shares undesignated, respectively; zero and 90,000,000 shares designated as Series A 8% Convertible Preferred Stock, respectively. Issued and outstanding zero and 89,291,773 shares, respectively, with a liquidation preference of zero and $214,420, respectively.
|
—
|
|
191,855
|
|
|||
|
Shareholders’ equity (deficit):
|
|||||||
|
Common stock, $0.01 par value. Authorized 120,000,000 shares; issued and outstanding 53,980,797 and 16,248,797 shares, respectively.
|
540
|
|
162
|
|
|||
|
Additional paid-in capital
|
270,637
|
|
3,691
|
|
|||
|
Accumulated deficit
|
(200,433
|
)
|
(133,612
|
)
|
|||
|
Total shareholders’ equity (deficit)
|
70,744
|
|
(129,759
|
)
|
|||
|
$
|
189,660
|
|
$
|
134,527
|
|
||
See accompanying notes to financial statements.
49
FIVE BELOW, INC.
Statements of Operations
(in thousands, except share and per share data)
|
|
Fiscal Year
|
||||||||||
|
2012
|
2011
|
2010
|
|||||||||
|
Net sales
|
$
|
418,825
|
|
$
|
297,113
|
|
$
|
197,189
|
|
||
|
Cost of goods sold
|
268,989
|
|
192,252
|
|
131,046
|
|
|||||
|
Gross profit
|
149,836
|
|
104,861
|
|
66,143
|
|
|||||
|
Selling, general and administrative expenses
|
112,182
|
|
78,640
|
|
54,339
|
|
|||||
|
Operating income
|
37,654
|
|
26,221
|
|
11,804
|
|
|||||
|
Interest expense (income), net
|
2,374
|
|
(16
|
)
|
28
|
|
|||||
|
Loss on debt extinguishment
|
1,594
|
|
—
|
|
—
|
|
|||||
|
Other income
|
(408
|
)
|
—
|
|
—
|
|
|||||
|
Income before income taxes
|
34,094
|
|
26,237
|
|
11,776
|
|
|||||
|
Income tax expense
|
14,069
|
|
10,159
|
|
4,753
|
|
|||||
|
Net income
|
20,025
|
|
16,078
|
|
7,023
|
|
|||||
|
Dividend paid to preferred and unvested restricted shareholders
|
(65,403
|
)
|
—
|
|
—
|
|
|||||
|
Series A 8% Convertible Preferred Stock cumulative dividends
|
—
|
|
(15,913
|
)
|
(4,507
|
)
|
|||||
|
Accretion of Redeemable Convertible Preferred Stock
|
—
|
|
—
|
|
(3,329
|
)
|
|||||
|
Net income attributable to participating securities
|
—
|
|
(109
|
)
|
—
|
|
|||||
|
Net (loss) income attributable to common shareholders
|
$
|
(45,378
|
)
|
$
|
56
|
|
$
|
(813
|
)
|
||
|
Basic (loss) income per common share
|
$
|
(1.28
|
)
|
$
|
—
|
|
$
|
(0.08
|
)
|
||
|
Diluted (loss) income per common share
|
$
|
(1.28
|
)
|
$
|
—
|
|
$
|
(0.08
|
)
|
||
|
Dividends declared and paid per common share
|
$
|
2.02
|
|
$
|
—
|
|
$
|
13.24
|
|
||
|
Weighted average shares outstanding:
|
|
|
|
||||||||
|
Basic shares
|
35,444,200
|
|
15,903,599
|
|
9,672,195
|
|
|||||
|
Diluted shares
|
35,444,200
|
|
15,904,108
|
|
9,672,195
|
|
|||||
See accompanying notes to financial statements.
50
FIVE BELOW, INC.
Statements of Changes in Redeemable Convertible Preferred Stock, Convertible Preferred Stock and Shareholders’ Equity (Deficit)
(in thousands, except share and per share data)
|
|
Redeemable Convertible Preferred Stock
|
Series A 8%
Convertible
Preferred Stock
|
Shareholders’ Equity (Deficit)
|
||||||||||||||||||||||||||||||||||||
|
Common stock
|
Additional
paid-in capital
|
Accumulated
deficit
|
Total
shareholders’ equity (deficit)
|
||||||||||||||||||||||||||||||||||||
|
Series A
|
Series A-1
|
||||||||||||||||||||||||||||||||||||||
|
Shares
|
Amount
|
Shares
|
Amount
|
Shares
|
Amount
|
Shares
|
Amount
|
||||||||||||||||||||||||||||||||
|
Balance, January 30, 2010
|
6,173,030
|
|
$
|
18,778
|
|
8,006,984
|
|
$
|
18,510
|
|
—
|
|
$
|
—
|
|
7,469,974
|
|
$
|
75
|
|
$
|
9,240
|
|
$
|
(10,364
|
)
|
$
|
(1,049
|
)
|
||||||||||
|
Issuance of warrants to purchase common stock to professional service providers
|
—
|
|
—
|
|
—
|
|
—
|
|
—
|
|
—
|
|
—
|
|
—
|
|
203
|
|
—
|
|
203
|
|
|||||||||||||||||
|
Stock-based compensation expense
|
—
|
|
—
|
|
—
|
|
—
|
|
—
|
|
—
|
|
—
|
|
—
|
|
2,104
|
|
—
|
|
2,104
|
|
|||||||||||||||||
|
Exercise of options and warrants to purchase common stock
|
—
|
|
—
|
|
—
|
|
—
|
|
—
|
|
—
|
|
1,187,658
|
|
12
|
|
4,980
|
|
—
|
|
4,992
|
|
|||||||||||||||||
|
Redemption of warrants for common stock and cash
|
—
|
|
—
|
|
—
|
|
—
|
|
—
|
|
—
|
|
1,221,722
|
|
12
|
|
(10,180
|
)
|
—
|
|
(10,168
|
)
|
|||||||||||||||||
|
Accretion of Series A Redeemable Convertible Preferred Stock to redemption value
|
—
|
|
1,356
|
|
—
|
|
—
|
|
—
|
|
—
|
|
—
|
|
—
|
|
(1,356
|
)
|
—
|
|
(1,356
|
)
|
|||||||||||||||||
|
Accretion of Series A-1 Redeemable Convertible Preferred Stock to redemption value
|
—
|
|
—
|
|
—
|
|
1,973
|
|
—
|
|
—
|
|
—
|
|
—
|
|
(1,973
|
)
|
—
|
|
(1,973
|
)
|
|||||||||||||||||
|
Conversion of Series A and Series A-1 Redeemable Convertible Preferred Stock to common stock and redemption of fractional shares
|
(6,173,030
|
)
|
(20,134
|
)
|
(8,006,984
|
)
|
(20,483
|
)
|
—
|
|
—
|
|
6,205,004
|
|
62
|
|
40,556
|
|
—
|
|
40,618
|
|
|||||||||||||||||
|
Issuance of Series A 8% Convertible Preferred Stock, net of issuance costs of $2,145
|
—
|
|
—
|
|
—
|
|
—
|
|
89,291,773
|
|
191,855
|
|
—
|
|
—
|
|
—
|
|
—
|
|
—
|
|
|||||||||||||||||
|
Dividend paid to common shareholders
|
—
|
|
—
|
|
—
|
|
—
|
|
—
|
|
—
|
|
—
|
|
—
|
|
(46,068
|
)
|
(146,349
|
)
|
(192,417
|
)
|
|||||||||||||||||
|
Income tax benefit related to exercise of stock options and warrants
|
—
|
|
—
|
|
—
|
|
—
|
|
—
|
|
—
|
|
—
|
|
—
|
|
3,226
|
|
—
|
|
3,226
|
|
|||||||||||||||||
|
Net income
|
—
|
|
—
|
|
—
|
|
—
|
|
—
|
|
—
|
|
—
|
|
—
|
|
—
|
|
7,023
|
|
7,023
|
|
|||||||||||||||||
|
Balance, January 29, 2011
|
—
|
|
—
|
|
—
|
|
—
|
|
89,291,773
|
|
191,855
|
|
16,084,358
|
|
161
|
|
732
|
|
(149,690
|
)
|
(148,797
|
)
|
|||||||||||||||||
|
Issuance of warrants to purchase common stock to professional service providers
|
—
|
|
—
|
|
—
|
|
—
|
|
—
|
|
—
|
|
—
|
|
—
|
|
31
|
|
—
|
|
31
|
|
|||||||||||||||||
|
Stock-based compensation expense
|
—
|
|
—
|
|
—
|
|
—
|
|
—
|
|
—
|
|
—
|
|
—
|
|
1,197
|
|
—
|
|
1,197
|
|
|||||||||||||||||
|
Exercise of warrants to purchase common stock
|
—
|
|
—
|
|
—
|
|
—
|
|
—
|
|
—
|
|
5,191
|
|
—
|
|
33
|
|
—
|
|
33
|
|
|||||||||||||||||
|
Vesting of restricted shares related to stock option exercises
|
—
|
|
—
|
|
—
|
|
—
|
|
—
|
|
—
|
|
—
|
|
—
|
|
491
|
|
—
|
|
491
|
|
|||||||||||||||||
|
Repurchase of unvested restricted shares related to stock option exercises
|
—
|
|
—
|
|
—
|
|
—
|
|
—
|
|
—
|
|
—
|
|
—
|
|
98
|
|
—
|
|
98
|
|
|||||||||||||||||
|
Issuance of common stock
|
—
|
|
—
|
|
—
|
|
—
|
|
—
|
|
—
|
|
159,248
|
|
1
|
|
1,109
|
|
—
|
|
1,110
|
|
|||||||||||||||||
|
Net income
|
—
|
|
—
|
|
—
|
|
—
|
|
—
|
|
—
|
|
—
|
|
—
|
|
—
|
|
16,078
|
|
16,078
|
|
|||||||||||||||||
|
Balance, January 28, 2012
|
—
|
|
—
|
|
—
|
|
—
|
|
89,291,773
|
|
191,855
|
|
16,248,797
|
|
162
|
|
3,691
|
|
(133,612
|
)
|
(129,759
|
)
|
|||||||||||||||||
|
Issuance of warrants to purchase common stock to professional service providers
|
—
|
|
—
|
|
—
|
|
—
|
|
—
|
|
—
|
|
—
|
|
—
|
|
43
|
|
—
|
|
43
|
|
|||||||||||||||||
|
Stock-based compensation expense
|
—
|
|
—
|
|
—
|
|
—
|
|
—
|
|
—
|
|
2,027,678
|
|
20
|
|
12,122
|
|
—
|
|
12,142
|
|
|||||||||||||||||
|
Exercise of options and warrants to purchase common stock
|
—
|
|
—
|
|
—
|
|
—
|
|
—
|
|
—
|
|
31,898
|
|
1
|
|
238
|
|
—
|
|
239
|
|
|||||||||||||||||
|
Vesting of restricted shares related to stock option exercises
|
—
|
|
—
|
|
—
|
|
—
|
|
—
|
|
—
|
|
—
|
|
—
|
|
802
|
|
—
|
|
802
|
|
|||||||||||||||||
|
Repurchase of unvested restricted shares related to stock option exercises
|
—
|
|
—
|
|
—
|
|
—
|
|
—
|
|
—
|
|
(30,221
|
)
|
—
|
|
3
|
|
—
|
|
3
|
|
|||||||||||||||||
|
Conversion of Preferred Stock
|
—
|
|
—
|
|
—
|
|
—
|
|
(89,291,773
|
)
|
(191,855
|
)
|
30,894,953
|
|
309
|
|
191,546
|
|
—
|
|
191,855
|
|
|||||||||||||||||
|
Issuance of common stock, net of issuance costs of $8,533
|
—
|
|
—
|
|
—
|
|
—
|
|
—
|
|
—
|
|
4,807,692
|
|
48
|
|
73,150
|
|
—
|
|
73,198
|
|
|||||||||||||||||
|
Dividend paid to shareholders
|
—
|
|
—
|
|
—
|
|
—
|
|
—
|
|
—
|
|
—
|
|
—
|
|
(12,605
|
)
|
(86,846
|
)
|
(99,451
|
)
|
|||||||||||||||||
|
Excess tax benefit related to restricted shares and exercises of stock options and warrants
|
—
|
|
—
|
|
—
|
|
—
|
|
—
|
|
—
|
|
—
|
|
—
|
|
1,647
|
|
—
|
|
1,647
|
|
|||||||||||||||||
|
Net income
|
—
|
|
—
|
|
—
|
|
—
|
|
—
|
|
—
|
|
—
|
|
—
|
|
—
|
|
20,025
|
|
20,025
|
|
|||||||||||||||||
|
Balance, February 2, 2013
|
—
|
|
$
|
—
|
|
—
|
|
$
|
—
|
|
—
|
|
$
|
—
|
|
53,980,797
|
|
$
|
540
|
|
$
|
270,637
|
|
$
|
(200,433
|
)
|
$
|
70,744
|
|
||||||||||
See accompanying notes to financial statements.
51
FIVE BELOW, INC.
Statements of Cash Flows
(in thousands)
|
|
Fiscal Year
|
||||||||||
|
2012
|
2011
|
2010
|
|||||||||
|
Operating activities:
|
|||||||||||
|
Net income
|
$
|
20,025
|
|
$
|
16,078
|
|
$
|
7,023
|
|
||
|
Adjustments to reconcile net income to net cash provided by operating activities:
|
|
||||||||||
|
Depreciation and amortization
|
9,599
|
|
7,071
|
|
4,805
|
|
|||||
|
Gain on conversion of note payable
|
(200
|
)
|
—
|
|
—
|
|
|||||
|
Loss on debt extinguishment
|
1,594
|
|
—
|
|
—
|
|
|||||
|
Loss on disposal of property and equipment
|
58
|
|
273
|
|
288
|
|
|||||
|
Amortization of deferred financing costs
|
455
|
|
28
|
|
28
|
|
|||||
|
Warrant expense related to professional service providers for services rendered
|
43
|
|
49
|
|
228
|
|
|||||
|
Stock-based compensation expense
|
12,324
|
|
1,197
|
|
2,104
|
|
|||||
|
Deferred income tax expense (benefit)
|
3,812
|
|
56
|
|
(716
|
)
|
|||||
|
Changes in operating assets and liabilities:
|
|
|
|
||||||||
|
Prepaid income taxes
|
(36
|
)
|
—
|
|
—
|
|
|||||
|
Income taxes receivable
|
—
|
|
20
|
|
(20
|
)
|
|||||
|
Inventories
|
(22,041
|
)
|
(12,036
|
)
|
(10,711
|
)
|
|||||
|
Prepaid expenses and other assets
|
(4,133
|
)
|
(3,270
|
)
|
(756
|
)
|
|||||
|
Accounts payable
|
3,369
|
|
12,481
|
|
3,684
|
|
|||||
|
Income taxes payable
|
(2,056
|
)
|
8,998
|
|
2,144
|
|
|||||
|
Accrued salaries and wages
|
(5,050
|
)
|
7,211
|
|
544
|
|
|||||
|
Deferred rent
|
7,723
|
|
6,997
|
|
6,295
|
|
|||||
|
Other accrued expenses
|
4,877
|
|
1,542
|
|
105
|
|
|||||
|
Net cash provided by operating activities
|
30,363
|
|
46,695
|
|
15,045
|
|
|||||
|
Investing activities:
|
|
|
|||||||||
|
Capital expenditures
|
(22,890
|
)
|
(18,558
|
)
|
(14,883
|
)
|
|||||
|
Net cash used in investing activities
|
(22,890
|
)
|
(18,558
|
)
|
(14,883
|
)
|
|||||
|
Financing activities:
|
|
|
|||||||||
|
Borrowing under long term note payable
|
—
|
|
—
|
|
250
|
|
|||||
|
Borrowing under Term Loan Facility
|
100,000
|
|
—
|
|
—
|
|
|||||
|
Repayment of Term Loan Facility
|
(65,500
|
)
|
—
|
|
—
|
|
|||||
|
Cash paid for debt financing costs
|
(2,751
|
)
|
—
|
|
(43
|
)
|
|||||
|
Repayment of note payable
|
(50
|
)
|
—
|
|
|
|
|||||
|
Net proceeds from issuance of preferred stock
|
—
|
|
—
|
|
191,855
|
|
|||||
|
Net proceeds from issuance of common stock
|
73,198
|
|
1,110
|
|
—
|
|
|||||
|
Proceeds from exercise of and prepayment related to warrants and options to purchase common stock
|
239
|
|
33
|
|
6,852
|
|
|||||
|
Repurchase of unvested restricted shares related to stock option exercises
|
(17
|
)
|
(140
|
)
|
—
|
|
|||||
|
Dividends paid to shareholders
|
(99,451
|
)
|
—
|
|
(192,417
|
)
|
|||||
|
Redemption of warrants
|
—
|
|
—
|
|
(10,168
|
)
|
|||||
|
Excess tax benefit related to restricted shares and exercise of stock options and warrants
|
1,647
|
|
—
|
|
3,226
|
|
|||||
|
Net cash provided by (used in) financing activities
|
7,315
|
|
1,003
|
|
(445
|
)
|
|||||
|
Net increase (decrease) in cash and cash equivalents
|
14,788
|
|
29,140
|
|
(283
|
)
|
|||||
|
Cash and cash equivalents at beginning of year
|
41,293
|
|
12,153
|
|
12,436
|
|
|||||
|
Cash and cash equivalents at end of year
|
$
|
56,081
|
|
$
|
41,293
|
|
$
|
12,153
|
|
||
|
Supplemental disclosures of cash flow information:
|
|
|
|
||||||||
|
Interest paid
|
$
|
2,056
|
|
$
|
24
|
|
$
|
53
|
|
||
|
Income taxes paid
|
$
|
10,803
|
|
$
|
1,157
|
|
$
|
111
|
|
||
See accompanying notes to financial statements.
52
FIVE BELOW, INC.
Notes to Financial Statements
|
(1)
|
Summary of Significant Accounting Policies
|
|
(a)
|
Description of Business
|
Five Below, Inc. (the "Company") is a specialty value retailer offering merchandise targeted at the teen and pre-teen demographic. The Company offers an edited assortment of products, priced at
$5
and below. The Company’s edited assortment of products includes select brands and licensed merchandise. The Company believes its merchandise is readily available, and that there are a number of potential vendors that could be utilized, if necessary, under approximately the same terms the Company is currently receiving; thus, it is not dependent on a single vendor or a group of vendors.
The Company is incorporated in the Commonwealth of Pennsylvania and as of
February 2, 2013
, operated in Pennsylvania, New Jersey, Delaware, Maryland, Virginia, Massachusetts, New Hampshire, West Virginia, North Carolina, New York, Connecticut, Rhode Island, Ohio, Illinois, Indiana, Michigan, Missouri, and Georgia, each operating under the name “Five Below.” As of
February 2, 2013
and
January 28, 2012
the Company operated
244
stores and
192
stores, respectively.
Reverse Stock Split and Authorized Shares
On July 17, 2012, the Company amended its articles of incorporation to reflect a
0.3460
-for-
1
reverse stock split of its common stock. The amendment also changed the authorized shares of the Company’s common stock to
120,000,000
shares. Concurrent with the reverse stock split, the Company adjusted (i) the conversion price of its Series A
8%
Convertible Preferred Stock, (ii) the number of shares subject to and the exercise price of its outstanding stock option awards under its equity incentive plan and (iii) the number of shares subject to and the exercise price of its outstanding warrants to equitably reflect the split. All common stock share and per-share data included in these financial statements give effect to the reverse stock split and the change in authorized shares and have been adjusted retroactively for all periods presented.
Initial Public Offering
On July 24, 2012, the Company completed its initial public offering (the “IPO”) of
11,057,692
shares of common stock at a price of
$17.00
per share. The common stock was listed on The NASDAQ Global Select Market under the symbol “FIVE.” The shares sold in the IPO were registered under the Securities Act of 1933, as amended, pursuant to the Company's Registration Statement on Form S-1 (File No. 333-180780), which was declared effective by the Securities and Exchange Commission on July 18, 2012. Of the
11,057,692
shares sold in the IPO, the Company issued
4,807,692
shares, and
6,250,000
shares were sold by selling shareholders, including
1,442,308
shares sold pursuant to the exercise in full of the underwriters’ over-allotment option. The Company did not receive any proceeds from shares sold by the selling shareholders. The Company received proceeds of approximately
$73.2 million
, net of approximately
$8.5 million
in underwriting discounts and legal, accounting and other fees incurred in connection with the IPO. Of the
$73.2 million
net proceeds received from the IPO, approximately
$65.3 million
and
$0.7 million
, respectively, were used to repay principal and interest under the Company's Term Loan Facility (defined in note 3) that existed as of the date of the IPO. The remaining net proceeds of the IPO were used for general corporate purposes, including working capital.
Secondary Public Offering
On February 4, 2013, the Company completed its secondary public offering of
13,012,250
shares of common stock at a price of
$35.65
per share. The shares sold in the secondary public offering were registered under the Securities Act of 1933, as amended, pursuant to the Company's Registration Statements on Form S-1 (File No. 333-186043 and File No. 333-186275), which were declared effective by the Securities and Exchange Commission on January 29, 2013. All of the shares in the secondary public offering were sold by the selling shareholders and the Company did not receive any proceeds. The Company did incur fees of
$1.0 million
related to legal, accounting, and other fees in connection with the secondary public offering, which is included in selling, general and administrative expenses in the accompanying statement of operations for
fiscal 2012
.
|
(b)
|
Fiscal Year
|
The Company operates on a 52/53-week fiscal year ending on the Saturday closest to January 31.
References to “fiscal year 2012” or “fiscal 2012” refer to the period from January 29, 2012 to February 2, 2013 and consists of a 53-week fiscal year. References to “fiscal year 2011” or “fiscal 2011” refer to the period from January 30, 2011 to January 28, 2012 and consists of a 52-week fiscal year. References to “fiscal year 2010” or “fiscal 2010” refer to the period from January 31, 2010 to January 29, 2011 and consists of a 52-week fiscal year.
53
FIVE BELOW, INC.
Notes to Financial Statements
|
(c)
|
Cash and Cash Equivalents
|
The Company considers all highly liquid investments purchased with a maturity date of three months or less when purchased to be cash equivalents. The majority of payments due from banks for third-party credit card and debit card transactions resulting from customer purchases at the Company’s retail stores process within
24
to
48
hours, except for transactions occurring on a Friday, which are generally processed the following Monday. All credit card and debit card transactions are classified as cash and cash equivalents in the accompanying balance sheets. Amounts due from banks for these transactions classified as cash equivalents totaled
$1.6 million
and
$1.2 million
at
February 2, 2013
and
January 28, 2012
, respectively. Book overdrafts, which are outstanding checks in excess of funds on deposit, are recorded within accounts payable in the accompanying balance sheets and within operating activities in the accompanying statements of cash flows. At
February 2, 2013
and
January 28, 2012
, the Company held additional cash equivalents of
$34.1 million
and
$39.8 million
which consist of funds in money market accounts. The Company’s cash accounts are primarily maintained with one financial institution.
|
(d)
|
Fair Value of Financial Instruments
|
Fair value is defined as the price that would be received to sell an asset or paid to transfer a liability in an orderly transaction between market participants at the measurement date. Assets and liabilities measured at fair value are classified using the following hierarchy, which is based upon the transparency of inputs to the valuation at the measurement date:
Level 1: Quoted market prices in active markets for identical assets or liabilities.
Level 2: Inputs, other than Level 1, that are either directly or indirectly observable.
Level 3: Unobservable inputs developed using the Company’s estimates and assumptions which reflect those that market participants would use.
The classification of fair value measurements within the hierarchy is based upon the lowest level of input that is significant to the measurement.
The Company’s financial instruments consist primarily of cash equivalents, accounts payable, and borrowings under a line of credit and Term Loan Facility (as defined in note 3). The Company believes that: (1) the carrying value of cash equivalents and accounts payable are representative of their respective fair value due to the short-term nature of these instruments; (2) the carrying value of the borrowings under the line of credit and Term Loan Facility approximates their fair value because the line of credit’s and Term Loan Facility's interest rates vary with market interest rates. The Company considers the inputs utilized to determine the fair value of the borrowings under the Term Loan Facility to be Level 2 inputs. At
February 2, 2013
and
January 28, 2012
, the Company had cash equivalents of
$35.7 million
and
$41.0 million
, respectively. The Company’s cash equivalents consist of credit card receivables and a money market account for which fair value was determined based on Level 1 inputs.
|
(e)
|
Inventories
|
Inventories consist of finished goods purchased for resale, including freight, and are stated at the lower of cost or market value, at the individual product level. Cost is determined on a weighted average cost method which approximates a FIFO (first-in, first-out) basis due to the nature of
the Company's i
nventory. Management of the Company reviews inventory levels in order to identify slow-moving merchandise and uses markdowns to clear merchandise. Inventory cost is reduced when the selling price less costs of disposal is below cost. The Company accrues an estimate for inventory shrink for the period between the last physical count and the balance sheet date. The shrink estimate can be affected by changes in merchandise mix and changes in actual shrink trends.
|
(f)
|
Property and Equipment
|
Property and equipment are stated at cost. Additions and improvements are capitalized, while repairs and maintenance are charged to expense as incurred.
Depreciation and amortization is recorded using the straight-line method over the shorter of the estimated useful lives of the assets or the terms of the respective leases, if applicable. The estimated useful lives are
three
to
ten
years for furniture and fixtures and computers and equipment. Store leasehold improvements are amortized over the shorter of the useful life or the lease term plus assumed extensions, which is generally
10
years. Depreciation and amortization expense for property and equipment, which is included in selling, general and administrative expenses in the accompanying statements of operations, was
$9.6 million
,
$7.1 million
and
$4.8 million
in
fiscal 2012
,
fiscal 2011
and
fiscal 2010
, respectively.
54
FIVE BELOW, INC.
Notes to Financial Statements
Property and equipment, net, consists of the following (in thousands):
|
February 2, 2013
|
January 28, 2012
|
||||||
|
Furniture and fixtures
|
$
|
31,680
|
|
$
|
23,354
|
|
|
|
Leasehold improvements
|
41,671
|
|
32,275
|
|
|||
|
Computers and equipment
|
10,541
|
|
7,477
|
|
|||
|
Construction in process
|
6,678
|
|
1,638
|
|
|||
|
Property and equipment, gross
|
90,570
|
|
64,744
|
|
|||
|
Less: accumulated depreciation and amortization
|
(31,530
|
)
|
(22,704
|
)
|
|||
|
Property and equipment, net
|
$
|
59,040
|
|
$
|
42,040
|
|
|
|
(g)
|
Impairment of Long-Lived Assets
|
Long-lived assets, such as property and equipment, are reviewed for impairment whenever events or changes in circumstances indicate that the carrying amount of the asset may not be recoverable. Recoverability of assets to be held and used is measured by a comparison of the carrying amount of an asset to estimated undiscounted future cash flows expected to be generated by the asset. If the carrying amount of the asset exceeds its estimated future cash flows, then an impairment charge is recognized by the amount by which the carrying amount of the asset exceeds the fair value of the asset. Based on its most recent analysis, management believes that no impairment of long-lived assets exists as of
February 2, 2013
.
|
(h)
|
Deferred Financing Costs
|
Deferred financing costs (note 3) are amortized to interest expense over the term of the related credit agreement. Amortization expense in
fiscal 2012
,
fiscal 2011
and
fiscal 2010
was
$0.5 million
,
$28,000
and
$28,000
, respectively. In connection with our
$65.3 million
repayment of the
$100.0 million
term loan facility, we wrote-off
$1.6 million
of deferred financing costs in fiscal 2012.
|
(i)
|
Other Accrued Expenses
|
Other accrued expenses consist of the following (in thousands):
|
February 2, 2013
|
January 28, 2012
|
||||||
|
Deposit liability related to restricted shares (note 6)
|
$
|
308
|
|
$
|
1,131
|
|
|
|
Gift card liability
|
2,418
|
|
1,745
|
|
|||
|
Other
|
11,819
|
|
5,085
|
|
|||
|
$
|
14,545
|
|
$
|
7,961
|
|
||
|
(j)
|
Leases
|
The Company leases store locations, distribution centers, and equipment used in its operations. The Company accounts for its leases under the provisions of Accounting Standards Codification ("ASC") Topic 840,
Leases
(“ASC 840”), which require that leases be evaluated and classified as operating or capital leases for financial reporting purposes. Any assets held under capital lease are included in property and equipment, net. As of
February 2, 2013
and
January 28, 2012
, the Company had no material capital leases.
Operating lease expense is recorded on a straight-line basis over the lease term. At the inception of a lease, the Company determines the lease term which includes periods under the exercise of renewal options that are reasonably assured. Renewal options are exercised at the Company's sole discretion. Generally, the Company’s store and distribution center leases have expected lease terms of ten years which are comprised of an initial term of
ten
years or an initial term of
five
years and
one
assumed
five
-year extension, resulting in a
ten
-year life. The expected lease term is used to determine whether a lease is capital or operating and is used to calculate straight-line rent expense.
Substantially all of the Company's leases include options that allow the Company to renew or extend the lease term beyond the initial lease period, subject to terms and conditions agreed upon at the inception of the lease. Such terms and conditions include rental rates agreed upon at the inception of the lease that could represent below or above market rental rates
55
FIVE BELOW, INC.
Notes to Financial Statements
later in the life of the lease, depending upon market conditions at the time of such renewal or extension. In addition, the Company's leases may include early termination options.
|
(k)
|
Deferred Rent
|
Certain of the Company’s operating leases contain either rent holidays and/or predetermined fixed escalations of minimum rentals during the original and/or extended lease terms. For these leases, the Company recognizes the related rent expense on a straight-line basis over the life of the lease and records the difference between the amounts charged to operations and amounts paid as deferred rent. The life of the lease is the initial term plus assumed extensions. The Company also receives certain lease incentives in conjunction with entering into operating leases. These lease incentives are recorded as deferred rent at the beginning of the lease term and recognized as a reduction of rent expense over the lease term. In addition, certain of the Company’s leases contain future contingent increases in rents. Such increases in rent expense are recorded in the period in which such contingent increases to the rents take place.
The following table summarizes the Company's deferred rent and other long-term liabilities balances (in thousands):
|
February 2, 2013
|
January 28, 2012
|
||||||
|
Current:
|
|||||||
|
Deferred rent (1)
|
$
|
878
|
|
$
|
1,123
|
|
|
|
Total current liabilities
|
$
|
878
|
|
$
|
1,123
|
|
|
|
Long-term:
|
|||||||
|
Deferred rent
|
$
|
28,901
|
|
$
|
20,933
|
|
|
|
Other
|
181
|
|
—
|
|
|||
|
Total long-term liabilities
|
$
|
29,082
|
|
$
|
20,933
|
|
|
|
(1)
|
The current portion of deferred rent is included in the other accrued expenses line item in the accompanying balance sheets.
|
|
(l)
|
Stock-based Compensation
|
The Company measures the cost of employee services received in exchange for stock-based compensation based on the grant date fair value of the employee stock award. Incremental compensation costs arising from subsequent modifications of awards after the grant date must also be recognized. The Company recognizes compensation expense based on the estimated grant date fair value of restricted stock awards, and using the Black-Scholes option-pricing model for grants of stock options which are both recorded over the vesting period. Stock-based compensation cost recognized and included in expenses, excluding modifications, for
fiscal 2012
,
fiscal 2011
and
fiscal 2010
, was
$6.9 million
,
$1.2 million
and
$2.1 million
, respectively. In addition, during
fiscal 2012
and
fiscal 2010
, the Company recognized
$5.4 million
and
$4.3 million
of additional compensation expense related to certain modifications of outstanding options (note 6).
|
(m)
|
Revenue Recognition
|
Revenue is recognized at the point of sale. Returns are only permitted for damaged or defective goods. Returns subsequent to the period end are immaterial, accordingly no reserve has been recorded. Gift card sales to customers are initially recorded as liabilities and recognized as sales upon redemption for merchandise. Sales tax collected from customers and remitted to governmental authorities are accounted for on a net basis, and therefore, excluded from sales in the accompanying statements of operations.
|
(n)
|
Cost of Goods Sold
|
Cost of goods sold reflects the direct costs of purchased merchandise and inbound freight, as well as store occupancy, distribution and buying expenses. Store occupancy costs include rent, common area maintenance, utilities and property taxes for all store locations. Distribution costs include costs for receiving, processing, warehousing and shipping of merchandise to or from the Company's distribution center and between store locations. Buying costs include compensation expense for the Company's internal buying organization.
|
(o)
|
Selling, General and Administrative Expenses
|
Selling, general and administrative expenses include payroll and other compensation, marketing and advertising expense, depreciation and amortization expense, and other selling and administrative expenses.
56
FIVE BELOW, INC.
Notes to Financial Statements
|
(p)
|
Vendor Allowances
|
The Company receives various incentives in the form of allowances, free product and promotional funds from its vendors based on product purchases and advertising activities. The amounts received are subject to changes in market conditions, vendor marketing strategies and changes in the profitability or sell-through of the related merchandise for the Company. Merchandise allowances are recorded in cost of goods and recognized in the period the related merchandise is sold. Marketing allowances are recorded in selling, general and administrative expenses and are recognized in the period the related advertising occurs to the extent the allowance is a reimbursement that is specific and incremental, and identifiable costs have been incurred by the Company to sell the vendor’s products. To the extent these conditions are not met, these allowances are recorded as merchandise allowances.
|
(q)
|
Store Pre-Opening Costs
|
Costs incurred between completion of a new store location’s construction and its opening (pre-opening costs) are charged to expense as incurred. Pre-opening costs were
$3.5 million
,
$3.4 million
and
$2.3 million
in
fiscal 2012
,
fiscal 2011
, and
fiscal 2010
, respectively, and are recorded in the accompanying statements of operations based on the nature of the expense.
|
(r)
|
Advertising Costs
|
Advertising costs are charged to expense the first time the advertising takes place. Advertising expenses were
$12.0 million
,
$9.7 million
and
$6.4 million
in
fiscal 2012
,
fiscal 2011
and
fiscal 2010
, respectively.
|
(s)
|
Income Taxes
|
Income taxes are accounted for under the asset-and-liability method. Deferred tax assets and liabilities are recognized for the future tax consequences attributable to differences between the financial statement carrying amounts of existing assets and liabilities and their respective tax bases and operating loss and tax credit carryforwards. Deferred tax assets and liabilities are measured using enacted tax rates expected to apply to taxable income in the years in which those temporary differences are expected to be recovered or settled. The effect on deferred tax assets and liabilities of a change in tax rates is recognized in income in the period that includes the enactment date. The Company recognizes the effect of income tax positions only if those positions are more likely than not of being sustained. Recognized income tax positions are measured at the largest amount that is greater than 50% likely of being realized. Changes in recognition or measurement are reflected in the period in which the change in judgment occurs.
The Company records a valuation allowance to reduce its deferred tax assets when uncertainty regarding their realizability exists. In assessing the realizability of deferred tax assets, management considers whether it is more likely than not that some portion or all of the deferred tax assets will not be realized. The ultimate realization of deferred tax assets is dependent upon the generation of future taxable income during periods in which those temporary differences become deductible. Management considers the scheduled reversal of deferred tax liabilities, projected future taxable income, and tax planning strategies in making this assessment.
|
(t)
|
Commitments and Contingencies
|
Liabilities for loss contingencies arising from claims, assessments, litigation, fines and penalties, and other sources are recorded when it is probable that a liability has been incurred and the amount of the assessment can be reasonably estimated. Legal costs incurred in connection with loss contingencies are expensed as incurred.
|
(u)
|
Use of Estimates
|
The preparation of financial statements requires management of the Company to make estimates and assumptions that affect the reported amount of assets and liabilities and the disclosure of contingent assets and liabilities at the date of the financial statements and the reported amounts of revenues and expenses during the period. Actual results could differ from those estimates. Significant items subject to such estimates and assumptions include the carrying amount of property and equipment, valuation allowances for inventories, income taxes and stock-based compensation expense.
|
(v)
|
Recent Accounting Pronouncements
|
In May 2011, the Financial Accounting Standards Board ("FASB") issued Accounting Standards Update (ASU) No. 2011-04,
Fair Value Measurement
(
Topic 820
):
Amendments to Achieve Common Fair Value
Measurement and Disclosure Requirements in U.S. GAAP and IFRS.
The amendments in ASU No. 2011-04 result in common fair value measurement and disclosure requirements in U.S. generally accepted accounting principles ("GAAP") and international financial reporting standards ("IFRS") and change the wording used to describe many of the requirements in GAAP for measuring fair value and
57
FIVE BELOW, INC.
Notes to Financial Statements
for disclosing information about fair value measurements. The amendments do not require additional fair value measurements and are not intended to establish valuation standards or affect valuation practices outside of financial reporting. ASU No. 2011-04 is effective during interim and annual periods beginning after December 15, 2011. The adoption of the new requirements of ASU No. 2011-04 did not have an impact on the Company's financial position or results of operations.
|
(2)
|
Income (Loss) Per Common Share
|
Basic income (loss) per common share amounts are calculated using the weighted-average number of common shares outstanding for the period. Diluted income (loss) per common share amounts are calculated using the weighted-average number of common shares outstanding for the period and include the dilutive impact of preferred stock using the if-converted method and exercise of stock options and warrants as well as assumed lapse of restrictions on restricted stock awards and shares currently available for purchase under the Company's Employee Stock Purchase Plan, which is minor using the treasury stock method.
The two-class method is used to calculate basic and diluted income (loss) per common share since the Company's preferred and restricted stock are participating securities under ASC 260
Earnings per share
. The two-class method is an earnings allocation formula that determines income per share for each class of common stock and participating security according to dividends declared (or accumulated) and participation rights in undistributed earnings. Under the two-class method, basic income (loss) per common share is computed by dividing net income (loss) attributable to common shares after allocation of income to participating securities by the weighted-average number of common shares outstanding during the year. Diluted income (loss) per common share is computed using the more dilutive of the two-class method or the if-converted method. In periods of net loss, no effect is given to participating securities since they do not contractually participate in the losses of the Company. The two-class method is the more dilutive method for
fiscal 2012
,
fiscal 2011
and
fiscal 2010
.
The following table reconciles net income (loss) and the weighted average common shares used in the computations of basic and diluted income (loss) per common share (in thousands, except for share and per share data):
|
Fiscal Year
|
|||||||||||
|
|
2012
|
2011
|
2010
|
||||||||
|
Numerator:
|
|||||||||||
|
Net income
|
$
|
20,025
|
|
$
|
16,078
|
|
$
|
7,023
|
|
||
|
Dividend paid to preferred shareholders
|
(62,504
|
)
|
—
|
|
—
|
|
|||||
|
Dividend paid to unvested restricted shareholders
|
(2,899
|
)
|
—
|
|
—
|
|
|||||
|
Series A 8% Convertible Preferred Stock cumulative dividends
|
—
|
|
(15,913
|
)
|
(4,507
|
)
|
|||||
|
Accretion of Redeemable Convertible Preferred Stock
|
—
|
|
—
|
|
(3,329
|
)
|
|||||
|
Net income attributable to participating securities
|
—
|
|
(109
|
)
|
—
|
|
|||||
|
Net (loss) income attributable to common shareholders
|
$
|
(45,378
|
)
|
$
|
56
|
|
$
|
(813
|
)
|
||
|
Denominator:
|
|||||||||||
|
Weighted average common shares outstanding-basic
|
35,444,200
|
|
15,903,599
|
|
9,672,195
|
|
|||||
|
Dilutive impact of options and warrants
|
—
|
|
509
|
|
—
|
|
|||||
|
Weighted average common shares outstanding-diluted
|
35,444,200
|
|
15,904,108
|
|
9,672,195
|
|
|||||
|
Per common share:
|
|||||||||||
|
Basic (loss) income per common share
|
$
|
(1.28
|
)
|
$
|
—
|
|
$
|
(0.08
|
)
|
||
|
Diluted (loss) income per common share
|
$
|
(1.28
|
)
|
$
|
—
|
|
$
|
(0.08
|
)
|
||
As discussed above, the Company is required to use the two-class method to compute basic and diluted income (loss) per common share. In
fiscal 2012
and
fiscal 2010
the adjustment to record the increase in redemption value of preferred stock as well as dividends paid to preferred and unvested restricted shareholders (note 5) reduced undistributed earnings, to be allocated between common shares and participating securities, to
zero
, for purposes of calculating net income per share using the two-class method. As such, net losses were solely attributable to common shareholders.
For
fiscal 2011
and
fiscal 2010
, preferred stock that could be converted to
30,894,953
shares of common stock were not included in the computation of diluted earnings per share, as the effect of doing so would have been anti-dilutive. The preferred stock was converted to common stock on July 24, 2012 and was included in the computation of income (loss) per share during fiscal 2012 on a weighted average basis.
58
FIVE BELOW, INC.
Notes to Financial Statements
The effects of the assumed exercise of the combined stock options and warrants and vesting of restricted share awards of
2,573,490
and
2,440,586
for
fiscal 2012
and
fiscal 2010
, and the impact of shares to be issued under the Company's Employee Stock Purchase Plan, which is minor were excluded from the calculation of diluted net loss as the effect would be anti-dilutive due to a net loss to common shareholders. The effects of the assumed exercise of stock options and warrants for
2,781,138
shares of common stock for
fiscal 2011
were excluded from the calculation of diluted net income as the average stock market price of the related common stock for the periods exceeded the exercise price of the options or warrants or the assumed proceeds determined under the treasury stock method resulted in no incremental shares for stock options. The aforementioned excluded shares do not reflect the impact of any incremental repurchases under the treasury stock method. In addition, the assumed vesting of
135,657
restricted shares are not included in the calculation of diluted weighted average common shares outstanding as the two class method was more dilutive method during
fiscal 2011
.
|
(3)
|
Financing Transactions, Line of Credit and Note Payable
|
Financing Transactions
On May 16, 2012, the Company entered into a
$100.0 million
term loan facility with Goldman Sachs Bank USA as administrative agent for a syndicate of lenders (the “Term Loan Facility”). The Company used the net proceeds from the Term Loan Facility and cash on hand to pay a dividend on all outstanding shares of the Company's common stock and Preferred Stock totaling
$99.5 million
.
On the same day, the Company amended and restated its existing senior secured Revolving Credit Facility with Wells Fargo Bank, National Association, which is defined below under “—Line of Credit.” The Company refers to the Term Loan Facility, the amendment and restatement of the Revolving Credit Facility and related transactions as the “Financing Transactions.”
The Term Loan Facility provided for a term loan of
$100.0 million
and matures on the earlier of (i) May 16, 2015 and (ii) the date on which such facility is accelerated following the occurrence of an event of default. The Term Loan Facility provides for interest on borrowings, at the option of the Company, at an alternate base rate which is the greater of (i) the administrative agent’s prime rate in effect on such day and (ii) the federal funds effective rate in effect on such day plus
0.50%
with a
2.00%
floor, plus a margin of
3.25%
,
or a London Interbank Offer Rate (“LIBOR”) based rate with a
1.00%
floor plus a margin of
4.25%
. The credit agreement for the Term Loan Facility includes a maximum consolidated net leverage ratio financial covenant, the calculation of which allows the Company to net up to
$10.0 million
of its cash and cash equivalents against its indebtedness. The Company’s leverage ratio must not exceed
3.25x
for the testing periods in calendar year 2012,
2.75x to 2.50x
for the testing periods in calendar year 2013,
2.00x
for the testing periods in calendar year 2014 and
1.75x
thereafter.
The credit agreement for the Term Loan Facility also includes customary negative and affirmative covenants including, among others, limitations on the Company’s ability to: (i) incur additional debt; (ii) create liens; (iii) make certain investments, loans and advances; (iv) sell assets; (v) pay dividends or make distributions or other restricted payments; (vi) engage in mergers or consolidations; or (vii) change its business.
The Term Loan Facility is subject to repayment upon the receipt of certain proceeds, including those from the sale of certain assets, insurance proceeds and indebtedness not otherwise permitted. The Term Loan Facility was also subject to repayment of
$50.0 million
upon the receipt of proceeds from the Company’s IPO. The Company closed its IPO on July 24, 2012. On
July 27, 2012
, the Company repaid
$65.3 million
of principal on the Term Loan Facility and
$0.7 million
of interest. On October 26, 2012, the Company repaid
$0.3 million
of principal on the Term Loan Facility. As of
February 2, 2013
, the balance outstanding under the Term Loan Facility was
$34.5 million
, bearing interest at a rate of
5.25%
. Pursuant to the terms of the Term Loan Facility, due to the repayment of
$65.3 million
of principal in July 2012, the Company is no longer required to make minimum quarterly payments. The Company plans to repay approximately
$15.0 million
of principal on the Term Loan Facility within the next 12 months and has classified the amount as a current liability in the accompanying
balance sheet as of
February 2, 2013
.
The remaining unpaid balance will be due upon maturity.
In connection with the Term Loan Facility, the Company incurred deferred financing costs of
$2.7 million
which are being amortized over the term of the Term Loan Facility. The amortization is included in interest expense, net, in the statement of operations. In connection with the repayment in
July
2012
,
$1.6 million
of the deferred financing costs were written off and included in loss on debt extinguishment in the statement of operations. The remaining deferred financing costs, net of amortization, are included in other assets in the balance sheet at
February 2, 2013
.
The Company had approximately
$0.8 million
and
$38,000
of remaining deferred financing fees as of
February 2, 2013
and
January 28, 2012
, respectively.
Amounts under the credit agreement for the Term Loan Facility may become due upon certain events of default including, among others, failure to comply with the credit agreement’s covenants, bankruptcy, default on certain other indebtedness or a change in control. The default rate under the Term Loan Facility is
2.00%
per annum.
All obligations under the Term Loan Facility are secured by substantially all of the Company’s assets.
As of
February 2, 2013
, the Company was in compliance with the financial covenant and other covenants applicable to it under the Term Loan
59
FIVE BELOW, INC.
Notes to Financial Statements
Facility.
During
fiscal 2012
, the Company recorded
$2.4 million
in interest expense, including amortization of deferred financing fees of
$0.5 million
.
Line of Credit
On August 18, 2006, the Company entered into a Loan and Security Agreement (the "Loan and Security Agreement") with Wachovia Bank National Association (predecessor in interest to Wells Fargo Bank, National Association) that included a revolving line of credit with advances tied to a borrowing base. The Loan and Security Agreement was amended and/or restated several times, the latest on May 16, 2012 (as amended and restated, the "Revolving Credit Facility"), generally to extend the maturity date, increase maximum borrowings, adjust the applicable interest rates and modify certain definitions.
The Revolving Credit Facility allows maximum borrowings of
$20.0 million
with advances tied to a borrowing base and expires on the earliest to occur of (i) May 16, 2017, (ii) the date which is 45 days prior to the maturity date of the Term Loan Facility if the Term Loan Facility remains outstanding or (iii) upon the occurrence of an event of default. The Revolving Credit Facility may be increased to
$30.0 million
upon certain conditions. The Revolving Credit Facility includes a
$5.0 million
sub-limit
for the issuance of letters of credit. The borrowing base is
90%
of eligible credit card receivables plus
90%
of the net recovery percentage of eligible inventory less established reserves. The Company incurred deferred financing costs of
$50,000
in May 2012 in connection with the Revolving Credit Facility and such costs are being amortized over the remaining term of the Revolving Credit Facility.
The Revolving Credit Facility provides for interest on borrowings, at the Company's option, at (a) a prime rate plus a margin of (i)
0.75%
if excess availability is greater than or equal to
75%
, (ii)
1.0%
if excess availability is less than
75%
but greater than or equal to
33%
or (iii)
1.25%
if excess availability is less than
33%
or (b) a LIBOR-based rate plus a margin of (i)
1.75%
if excess availability is greater than or equal to
75%
, (ii)
2.00%
if excess availability is less than
75%
but greater than or equal to
33%
or (iii)
2.25%
if excess availability is less than
33%
. The Revolving Credit Facility further provides for a letter of credit fee equal to the LIBOR-based rate plus (i)
1.75%
if excess availability is greater than or equal to
75%
, (ii)
2.00%
if excess availability is less than 75% but greater than or equal to
33%
or (iii)
2.25%
if excess availability is less than
33%
. The Revolving Credit Facility also contains an unused credit facility fee of
0.375%
per annum and is subject to a servicing fee of
approximately $12,000
per year.
As of
February 2, 2013
, the Company
had approximately $0.3 million letter of credit outstanding that was undrawn.
The Revolving Credit Facility includes a covenant which requires the Company to maintain minimum excess collateral availability of no less than the greater of (i)
10%
of the then effective maximum credit and (ii)
$3.0 million
.
The Revolving Credit Facility also includes customary negative and affirmative covenants including, among others, limitations on our ability to (i) incur additional debt; (ii) create liens; (iii) make certain investments, loans and advances; (iv) sell assets; (v) pay dividends or make distributions or other restricted payments; (vi) engage in mergers or consolidations; or (vii) change the Company's business.
Additionally, the Revolving Credit Facility is subject to payment upon our receipt of certain proceeds, including those from the sale of certain assets and is subject to an increase in the interest rate on borrowings and the letter of credit fee of
2.0%
upon an event of default. Amounts under the Revolving Credit Facility may become due upon certain events of default including, among others, failure to comply with the Revolving Credit Facility’s covenants, bankruptcy, default on certain other indebtedness or a change in control.
During fiscal 2012, the Company had no borrowings or interest expense under the Revolving Credit Facility. At
February 2, 2013
, the Company had approximately
$20.0 million
available on the line of credit of which
$19.7 million
was available and
$0.3 million
was issued but undrawn on an outstanding letter of credit obligation. During fiscal 2011, the Company had no borrowings or interest expense under the Revolving Credit Facility and the Company had approximately
$20.0 million
available on the line of credit for borrowings at
January 28, 2012
, based on the borrowing base. During fiscal 2010, the maximum borrowings and weighted average interest rate under the Revolving Credit Facility were
$8.2 million
and
4.85%
, respectively, and interest expense was
$53,000
.
All obligations under the Revolving Credit Facility are secured by substantially all of the Company's assets. As of
February 2, 2013
and
January 28, 2012
, the Company was in compliance with the covenants applicable to it under the Revolving Credit Facility.
Note Payable
On
December 10, 2010
the Company entered into a loan and security agreement (the “Note”) for
$0.3 million
with a governmental authority. On
May 13, 2012
, a portion of the Note (
$0.2 million
) was converted to a grant upon the Company meeting certain non-financial conditions and the remainder of
$50,000
was paid back in full along with interest outstanding.
60
FIVE BELOW, INC.
Notes to Financial Statements
|
(4)
|
Commitments and Contingencies
|
The Company leases property and equipment under non-cancelable operating leases. Certain retail store lease agreements provide for contingent rental payments if the store’s net sales exceed stated levels (percentage rents) and/or contain escalation clauses, which provide for increases in base rental for increases in future operating costs. Many of the Company’s leases provide for one or more renewal options for periods ranging from
five
to
seven
years. The Company’s operating lease agreements, including assumed extensions, which are generally those that take the lease to a
ten
-year term, expire through
2023
.
The Company’s minimum rental commitments under operating lease agreements, including assumed extensions, as of
February 2, 2013
, are as follows (in thousands):
|
Retail stores
|
Corporate office and distribution centers
|
Total
|
|||||||||
|
Fiscal year:
|
|||||||||||
|
2013
|
$
|
38,278
|
|
$
|
2,858
|
|
$
|
41,136
|
|
||
|
2014
|
41,519
|
|
4,413
|
|
45,932
|
|
|||||
|
2015
|
40,670
|
|
4,678
|
|
45,348
|
|
|||||
|
2016
|
39,721
|
|
3,097
|
|
42,818
|
|
|||||
|
2017
|
39,290
|
|
2,610
|
|
41,900
|
|
|||||
|
Thereafter
|
143,394
|
|
13,011
|
|
156,405
|
|
|||||
|
$
|
342,872
|
|
$
|
30,667
|
|
$
|
373,539
|
|
|||
Rent expense, including base and contingent rent under operating leases, was
$32.8 million
,
$23.6 million
and
$16.9 million
in
fiscal 2012
,
fiscal 2011
and
fiscal 2010
, respectively. Contingent rents were
$0.5 million
,
$0.5 million
and
$0.3 million
in
fiscal 2012
,
fiscal 2011
and
fiscal 2010
, respectively.
The Company has employment agreements with certain key employees that provide for, among other things, salary, bonus, severance, and change-in-control provisions. The severance and change of control provisions under these agreements provide for additional payments upon employee separation of up to approximately
$3.8 million
.
From time to time, the Company is involved in certain legal actions arising in the ordinary course of business. In management’s opinion, the outcome of such actions will not have a material adverse effect on the Company’s financial condition or results of operations.
As of
February 2, 2013
, the Company has other purchase commitments of approximately
$2.3 million
consisting of purchase agreements for materials for approximately
$1.1 million
that will be used in the construction of new stores and approximately
$1.2 million
consisting of purchase commitments for infrastructure and systems that will be implemented in the construction of the Company's second distribution center.
|
(5)
|
Shareholders’ Equity (Deficit)
|
As of
February 2, 2013
, the Company is authorized to issue
120,000,000
shares of
$0.01
par value common stock and
5,000,000
shares of
$0.01
par value preferred stock. The holders of the common stock are entitled to
one
vote per share of common stock and are entitled to receive dividends if declared by the board of directors. The preferred stock may be issued from time to time in series as designated by the board of directors. The designations, powers, preferences, voting rights, privileges, options, conversion rights, and other special rights of the shares of each such series and the qualifications, limitations and restrictions thereof shall be designated by the board of directors.
Preferred Stock
On October 14, 2010, the Company issued
89,291,773
shares of Series A
8%
Convertible Preferred Stock for cash proceeds of
$191.9 million
, net of offering costs of
$2.1 million
. In connection with this transaction, all of the Company’s then outstanding shares of its Series A and Series A-1 Redeemable Convertible Preferred Stock were converted into shares of the Company's common stock and all of the Company’s then outstanding options and warrants were exercised or exchanged for restricted or unrestricted shares of the Company's common stock or were exchanged for unrestricted shares and cash. The Company used the proceeds of this investment as well as cash on hand to pay a special dividend to the holders of the Company's common stock on October 14, 2010 as noted below. Prior to the conversion, the Series A and Series A-1
61
FIVE BELOW, INC.
Notes to Financial Statements
Redeemable Convertible Preferred Stock, were being accreted to their redemption value using the effective interest rate method.
The shares of Series A
8%
Convertible Preferred Stock were entitled to receive cumulative dividends of 8% of their original issue price of
$2.17
per share per year compounded annually and payable in cash when and if declared by the Company’s board of directors; however, the Company could not pay, unless otherwise consented to by the holders of Series A
8%
Convertible Preferred Stock, any dividends on common stock unless an equal amount of dividends per share (on an as converted basis) was simultaneously paid to the holders of the Series A
8%
Convertible Preferred Stock. Effective immediately prior to the closing of the IPO on
July 24, 2012
, all outstanding shares of Series A
8%
Convertible Preferred Stock were converted into
30,894,953
shares of common stock and ceased to be entitled to the payment of any dividends that accrued on such shares as of the effective time of the conversion.
In the event of any liquidation, dissolution, or winding up of the Company, as defined, or deemed liquidation event, as defined, the holders of the Series A
8%
Convertible Preferred Stock were entitled to receive the greater of the original issue price of
$2.17
per share plus any accrued and unpaid dividends, or the amount that would have been paid if the Series A
8%
Convertible Preferred Stock was converted to common stock, before any payment was made to the common shareholders. The Series A
8%
Convertible Preferred Stock was presented outside of shareholders’ equity (deficit) since its redemption under certain circumstances was beyond the control of the Company’s management.
Common Stock
The Company and its shareholders have entered into an Amended and Restated Investors Rights Agreement and a Second
Amended and Restated Shareholders Agreement, which provide for, among others, certain registration, information, first refusal, co-sale, observer, bring along and board of director voting rights. The Second Amended and Restated Shareholders Agreement also provides for certain restrictions and obligations with respect to the stock of the Company held by the Company’s shareholders, including limits on the transfer of stock held by shareholders.
In
March 2012
, options to purchase
2,020,620
shares of common stock granted during
fiscal 2010
, including options to purchase
1,010,310
shares that were subject to time-based and performance-based vesting, were cancelled and an equal number of restricted shares were granted. One-third of the shares vested in
March 2012
and the remaining two-thirds vest in equal installments on the first and second anniversary of the grant.
In connection with the cancellation and grant, the Company will record total compensation expense of
$17.4 million
including
$5.3 million
which was recorded on the date of the modification and the remainder on a straight-line basis over the
two
-year vesting period.
In May 2010, the Company granted warrants to purchase
27,680
shares of common stock at an exercise price of
$11.45
per share to professional service providers that were exercised in October 2010. The fair value of the warrants of
$0.2 million
was recorded as expense in fiscal 2010.
In February 2011, the Company granted warrants to purchase
13,840
shares of common stock at an exercise price of
$6.30
per share to professional service providers, of which
5,191
were exercised in November 2011. The fair value of the warrants of
$25,000
was recorded as expense in fiscal 2010.
In May 2011, the Company granted warrants to purchase
3,114
shares of common stock at an exercise price of
$6.30
per share to a professional service provider. The fair value of the warrants of
$6,000
was recorded as expense in fiscal 2011.
In November 2011, the Company issued
159,248
shares of common stock for cash proceeds of
$1.1 million
to an incoming member of the Company's board of directors.
In
March 2012
, the Company granted warrants to purchase
11,245
shares of common stock at an exercise price of
$11.21
per share to professional service providers. The fair value of the warrants of
$43,000
was recorded as expense in Fiscal 2012.
During fiscal 2012,
23,012
warrants were exercised and, as of
February 2, 2013
, no warrants remained outstanding.
On
July 18, 2012
,
two
members of the board of directors were each issued
3,529
restricted shares of common stock. These shares vest and become free of forfeiture restrictions on the earlier of: (i) the one-year anniversary of the issuance date or (ii) the date of the Company’s next annual shareholder meeting following the issuance date.
On
July 24, 2012
, the Company completed the IPO of
11,057,692
shares of common stock at a price of
$17.00
per share. The common stock was listed on The NASDAQ Global Select Market under the symbol “FIVE.” The shares sold in the IPO were registered under the Securities Act of 1933, as amended, pursuant to the Company’s Registration Statement on Form S-1 (File No. 333-180780), which was declared effective by the SEC on
July 18, 2012
. Of the
11,057,692
shares sold in the IPO, the Company issued
4,807,692
shares, and
6,250,000
shares were sold by selling shareholders of the Company, including
1,442,308
shares sold pursuant to the exercise in full of the underwriters’ over-allotment option. The Company did not receive
62
FIVE BELOW, INC.
Notes to Financial Statements
any proceeds from shares sold by the selling shareholders. The Company received proceeds of
$73.2 million
, net of
$8.5 million
in underwriting discounts and legal, accounting and other fees incurred in connection with the IPO. Of the
$73.2 million
net proceeds received from the IPO,
$65.3 million
and
$0.7 million
, respectively, were used to repay principal and interest under the Term Loan Facility that existed as of the date of the IPO. The remaining net proceeds of the IPO were used for general corporate purposes, including working capital.
On
September 27, 2012
, the Company’s board of directors approved the Five Below, Inc. 2012 Employee Stock Purchase Plan (the “ESPP”), subject to shareholder approval at the next annual meeting. If the shareholder’s do not approve the ESPP, then the ESPP will be terminated and any contributions will be returned to the participants without interest and without the purchase of shares. Subject to shareholder approval, the ESPP became effective
January 1, 2013
and is intended to be qualified as an “employee stock purchase plan” within the meaning of Section 423 of the Internal Revenue Code of 1986. The ESPP allows eligible employees the opportunity to purchase shares of the Company’s common stock through payroll deductions at a discount of
10%
of the fair market value of such shares on the purchase date. Under the ESPP, the number of shares of common stock reserved for issuance, which is subject to other limitations, is
500,000
shares and the purchase of shares by any participant is limited to (i) the number of shares obtained by dividing
$10.0 million
by the fair market value in any offering period or (ii)
$10.0 million
worth of such stock in any calendar year.
On February 4, 2013, the Company completed its secondary public offering of
13,012,250
shares of common stock at a price of
$35.65
per share. The shares sold in the secondary public offering were registered under the Securities Act of 1933, as amended, pursuant to the Company’s Registration Statements on Form S-1 (File No. 333-186043 and File No. 333-186275), which were declared effective by the Securities and Exchange Commission on
January 29, 2013
. All of the shares sold in the secondary public offering were sold by selling shareholders and the Company did not receive any proceeds. The Company did incur fees of approximately
$1.0 million
related to legal, accounting, and other fees in connection with the secondary public offering which is included in selling, general and administrative expenses in the accompanying statement of operations for fiscal 2012.
Dividends
On
October 13, 2010
, the board of directors declared a cash dividend of
$13.24
per share, or
$196.7 million
in the aggregate, which was paid on
October 14, 2010
to shareholders of record on
October 13, 2010
. Of this amount,
$4.3 million
was recorded as additional compensation expense (note 6).
On
May 15, 2012
, the Company declared and subsequently paid on
May 16, 2012
a dividend of
$2.02
per share on shares of common stock (including restricted shares) and on an as-converted basis on shares of Series A 8% Convertible Preferred Stock totaling approximately
$99.5 million
. Refer to note 6 for additional information regarding changes to outstanding stock options resulting from the dividend payment.
|
(6)
|
Common Stock Options
|
2002 Equity Incentive Plan
Effective July 26, 2002, the Company adopted the 2002 Equity Incentive Plan (the “Plan”) pursuant to which the Company’s board of directors may grant stock options and restricted shares to officers, directors, key employees, and professional service providers. The Plan, as amended as of
July 24, 2012
, increased the number of shares authorized for issuance under the Plan to a total of
7,600,000
shares. All stock options have a term not greater than
10
years. Stock options vest and become exercisable in whole or in part, in accordance with vesting conditions set by the Company’s board of directors. Options granted to date generally vest over
four
years from the date of grant. As of
February 2, 2013
,
4,992,675
stock options or restricted shares were available for grant.
On August 25, 2010, the Company’s board of directors agreed to allow option holders, as of that date, to exercise, during a
twenty
day offer period, all options issued and outstanding under the Plan, regardless if those options were vested and exercisable (“Vested Options”) or were not currently vested and exercisable (“Unvested Options”). The Company recorded
$4.3 million
of additional compensation cost in fiscal 2010 to reflect the incremental value associated with the modification of the options, which was primarily related to the value of the dividends received by the exercisers before the original vesting date.
On October 13, 2010, the holders of the stock options exercised all of their outstanding Vested Options and Unvested Options to purchase shares of the Company’s common stock. The Unvested Options were exercised for restricted shares of common stock that have the same vesting schedule as the Unvested Options that were exercised for those shares. The restricted shares are subject to repurchase by the Company should the option holder’s employment be terminated prior to the vesting at a purchase price equal to the lesser of: (i) the exercise price paid for the restricted shares, and (ii) the fair market value of the restricted shares at the time of repurchase. For accounting purposes, as the shares remain subject to their original vesting
63
FIVE BELOW, INC.
Notes to Financial Statements
provisions, the early exercises are being recorded as if the original options remain outstanding until the respective shares vest. Exercise proceeds received prior to the shares vesting are recorded as a deposit liability in other accrued expenses on the balance sheets. As of
February 2, 2013
and
January 28, 2012
,
$0.3 million
and
$1.1 million
respectively, was recorded as a deposit liability.
On
May 23, 2012
, the Company’s board of directors, in accordance with the Plan’s documents, approved an equitable adjustment to all options outstanding on the date of the Company’s dividend declaration to reflect the dividend value received by the Company’s common and preferred shareholders. The exercise price of each outstanding option was reduced by
$2.02
. The adjustment did not result in additional compensation expense given the adjustment was required under the Plan’s documents and there was no increase in the fair value of the awards before and after payment of the dividend and adjustment of the awards.
Restricted Stock Activity
The following table summarizes the activity related to the restricted shares of common stock (in thousands except share data) :
|
Number of
shares |
Deposit
liability |
|||||
|
Unvested, issued upon option exercises on October 13, 2010
|
325,521
|
|
$
|
1,933
|
|
|
|
Vested
|
(21,121
|
)
|
(73
|
)
|
||
|
Unvested January 29, 2011
|
304,400
|
|
1,860
|
|
||
|
Vested
|
(135,657
|
)
|
(491
|
)
|
||
|
Repurchases upon employee termination
|
(26,816
|
)
|
(238
|
)
|
||
|
Unvested January 28, 2012
|
141,927
|
|
1,131
|
|
||
|
Vested
|
(106,980
|
)
|
(802
|
)
|
||
|
Repurchases upon employee termination
|
(3,405
|
)
|
(21
|
)
|
||
|
Unvested February 2, 2013
|
31,542
|
|
$
|
308
|
|
|
Stock option activity under the Plan was as follows:
|
Options
outstanding |
Weighted
average exercise price |
Weighted
average remaining contractual term |
||||||
|
Balance at January 30, 2010
|
840,860
|
|
$
|
3.41
|
|
6.9
|
||
|
Granted
|
2,427,690
|
|
6.93
|
|
||||
|
Forfeited
|
(6,736
|
)
|
3.88
|
|
||||
|
Exercised
|
(1,125,629
|
)
|
5.64
|
|
||||
|
Balance at January 29, 2011
|
2,136,185
|
|
6.31
|
|
9.7
|
|||
|
Granted
|
611,313
|
|
7.03
|
|
||||
|
Forfeited
|
(119,543
|
)
|
6.40
|
|
||||
|
Balance at January 28, 2012
|
2,627,955
|
|
6.47
|
|
9.0
|
|||
|
Granted
|
687,416
|
|
14.96
|
|
||||
|
Forfeited
|
(98,048
|
)
|
9.14
|
|
||||
|
Cancelled (see note 5)
|
(2,020,620
|
)
|
6.30
|
|
||||
|
Exercised
|
(8,886
|
)
|
4.12
|
|
||||
|
Balance at February 2, 2013 (1)
|
1,187,817
|
|
10.43
|
|
9.3
|
|||
|
Exercisable at February 2, 2013
|
25,240
|
|
$
|
11.73
|
|
7.1
|
||
(1) The weighted-average exercise price at
February 2, 2013
reflects the adjustment of
$2.02
per share resulting from the dividend declared
on
May 15, 2012
as described above.
Included in the options granted during fiscal 2010 and outstanding as of January 28, 2012 are options to purchase
1,010,310
shares of common stock, which vest incrementally only upon the achievement of certain performance targets
64
including achieving targeted internal rates of return for the Company’s preferred shareholders or the Company achieving certain market capitalization levels subsequent to an initial public offering. In March 2012, options to purchase
2,020,620
shares of common stock granted during fiscal 2010, including the options that were to vest upon the achievement of performance targets, were cancelled and an equal number of restricted shares were granted (see note 5). During fiscal 2011 and 2010, no compensation expense was recognized for the options that were to vest upon the achievement of performance targets prior to their cancellation since the Company's management determined that the performance targets were not probable of achievement.
Included in the options granted during fiscal 2012 are options to purchase shares of common stock to non-employees. We account for stock-based compensation for non-employee stock options by using the Black-Scholes option-pricing model and record expense as the options vest. Non-employee options subject to vesting are required to be periodically revalued over their service period, which is generally the same as the vesting period.
The fair value of each option award granted to employees and non-employees, including outside directors, is estimated on the date of grant using the Black-Scholes option-pricing model with the following weighted average assumptions:
|
|
Fiscal Year
|
|||||||
|
2012
|
2011
|
2010
|
||||||
|
Expected volatility
|
50.0
|
%
|
50.0
|
%
|
50.0
|
%
|
||
|
Risk-free interest rate
|
1.3
|
%
|
2.0
|
%
|
1.8
|
%
|
||
|
Expected life of options
|
6.3 years
|
|
7.0 years
|
|
7.0 years
|
|
||
|
Expected dividend yield
|
—
|
%
|
—
|
%
|
—
|
%
|
||
The Company uses the simplified method to estimate the expected term of the option. The expected volatility incorporates historical and implied volatility of similar entities whose share prices are publicly available. The risk-free rate for the expected term of the option was based on the U.S. Treasury yield curve in effect at the time of grant.
The per-share weighted average grant-date fair value of stock options granted to employees, including outside directors, in
fiscal 2012
,
fiscal 2011
and
fiscal 2010
was
$7.42
,
$3.58
and
$3.41
respectively. The total intrinsic value of stock options exercised during
fiscal 2012
,
fiscal 2011
and
fiscal 2010
was
$0.4 million
,
zero
and
$15.6 million
, respectively. In
fiscal 2012
, we recorded cash received from the exercise of options of
$36,000
and excess tax benefits from option exercises and restricted stock of
$1.6 million
. Upon option exercise, we issued new shares of stock.
As of
February 2, 2013
, there was
$13.2 million
of total unrecognized compensation costs related to nonvested share-based compensation arrangements granted under the Plan, excluding options that vest upon the achievement of performance targets. That cost is expected to be recognized over a weighted average vesting period of
1.9
years.
|
(7)
|
Income Taxes
|
Deferred income taxes reflect the net tax effects of temporary differences between carrying amounts of assets and liabilities for financial reporting purposes and the amounts used for income tax purposes. In assessing the realizability of deferred tax assets, management considers whether it is more likely than not that some portion or all of the deferred tax assets will not be realized. The ultimate realization of deferred tax assets is dependent upon generation of future taxable income during the periods in which temporary differences representing net future deductible amounts become deductible.
As of
February 2, 2013
, no valuation allowance has been provided for net deferred tax assets as management believes that it is more likely than not that the Company will realize all deferred tax assets at
February 2, 2013
.
The components of the income tax expense are as follows (in thousands):
65
FIVE BELOW, INC.
Notes to Financial Statements
|
|
Fiscal Year
|
||||||||||
|
2012
|
2011
|
2010
|
|||||||||
|
Current:
|
|||||||||||
|
Federal
|
$
|
8,127
|
|
$
|
6,979
|
|
$
|
4,080
|
|
||
|
State
|
2,130
|
|
3,124
|
|
1,389
|
|
|||||
|
10,257
|
|
10,103
|
|
5,469
|
|
||||||
|
Deferred:
|
|||||||||||
|
Federal
|
3,043
|
|
1,434
|
|
(673
|
)
|
|||||
|
State
|
769
|
|
(1,378
|
)
|
(43
|
)
|
|||||
|
3,812
|
|
56
|
|
(716
|
)
|
||||||
|
Income tax expense (benefit)
|
$
|
14,069
|
|
$
|
10,159
|
|
$
|
4,753
|
|
||
The reconciliation of the statutory federal income tax rate to the Company’s effective income tax rate is as follows:
|
|
Fiscal Year
|
|||||||
|
2012
|
2011
|
2010
|
||||||
|
Statutory federal tax rate
|
35.0
|
%
|
35.0
|
%
|
34.0
|
%
|
||
|
State taxes, net of federal benefit
|
5.5
|
|
5.6
|
|
5.7
|
|
||
|
Other
|
0.8
|
|
(1.9
|
)
|
0.7
|
|
||
|
41.3
|
%
|
38.7
|
%
|
40.4
|
%
|
|||
The effective tax rate for fiscal year
2012
was impacted by permanent book to tax differences related to fees paid for the secondary public offering.
The tax effects of temporary differences that give rise to deferred tax assets and liabilities are (in thousands):
|
February 2, 2013
|
January 28, 2012
|
||||||
|
Deferred tax assets:
|
|||||||
|
Inventories
|
$
|
2,990
|
|
$
|
1,920
|
|
|
|
Deferred revenue
|
95
|
|
71
|
|
|||
|
Accrued bonus
|
1,067
|
|
2,907
|
|
|||
|
Deferred rent
|
12,076
|
|
9,000
|
|
|||
|
Other
|
750
|
|
381
|
|
|||
|
Deferred tax assets
|
16,978
|
|
14,279
|
|
|||
|
Deferred tax liabilities:
|
|||||||
|
Property and equipment
|
(13,874
|
)
|
(10,404
|
)
|
|||
|
Other
|
(3,359
|
)
|
(318
|
)
|
|||
|
Deferred tax liabilities
|
(17,233
|
)
|
(10,722
|
)
|
|||
|
$
|
(255
|
)
|
$
|
3,557
|
|
||
Total income taxes paid during
fiscal 2012
,
fiscal 2011
, and
fiscal 2010
were
$10.8 million
,
$1.2 million
and
$0.1 million
, respectively.
The Company had no material accrual for uncertain tax positions or interest or penalties related to income taxes on the Company’s balance sheets at
February 2, 2013
and
January 28, 2012
, and has not recognized any material uncertain tax positions or interest and/or penalties related to income taxes in the statement of operations for
fiscal 2012
,
fiscal 2011
, and
fiscal 2010
.
The Company files a federal income tax return as well as state tax returns. The Company’s U.S. federal income tax returns for the fiscal years ended
January 30, 2010
and thereafter remain subject to examination by the U.S. Internal Revenue
66
FIVE BELOW, INC.
Notes to Financial Statements
Service (“IRS”). State returns are filed in various state jurisdictions, as appropriate, with varying statutes of limitation and remain subject to examination for varying periods up to
3
to
4
years depending on the state.
|
(8)
|
Related-Party Transactions
|
During fiscal
2012
, fiscal
2011
and fiscal
2010
, the Company incurred fees of
$3.8 million
,
$0.5 million
and
$1.8 million
, respectively, related to services provided by certain shareholders and professional service firms for which certain shareholders are partners. Fees related to fiscal
2012
were primarily IPO and secondary public offering related fees.
During fiscal 2009, the Company extended a loan of
$0.3 million
to an officer. The loan accrued interest at
4.11%
and was payable on an annual basis with the first interest payment due on March 1, 2011. The loan required mandatory prepayments of the full principal amount and unpaid accrued interest upon the occurrence of certain events as defined in the related agreement. The loan was collateralized by a pledge of common stock of the Company owned by the officer. On October 13, 2010, the principal of
$0.3 million
and interest was paid in full. Interest income recognized on this loan totaled
$8,000
.
|
(9)
|
Employee Benefit Plan
|
Effective February 1, 2007, the Company implemented the Five Below 401(k) Retirement Savings Plan for all employees who have at least
1 year
of service, worked at least
1,000
hours, and are
21 years
of age. Employees can contribute up to the maximum amount allowed under law. The Company may make discretionary matching and profit sharing contributions, which vest over a period of
5 years
from each employee’s commencement of employment with the Company. During
fiscal 2012
, the Company made
$52,000
of discretionary contributions. The Company made
no
discretionary contributions in
fiscal 2011
and
fiscal 2010
.
|
(10)
|
Segment Reporting
|
The Company evaluates performance internally and manages the business on the basis of
one
operating segment; therefore, it has only
one
reportable segment. All of the Company’s identifiable assets are located in the United States.
Set forth below is data for the following groups of products – leisure, fashion and home, and party and snack. During
fiscal 2012
, certain historical stock keeping units, or SKUs, were re-assigned to reflect the Company's current product grouping. The percentage of net sales represented by each product group for
fiscal 2011
and
fiscal 2010
give effect to these re-assignments. The percentage of net sales represented by each product group for each of the last three fiscal years was as follows:
|
Sales by Product Group
|
Percentage of Net Sales
|
|||||||
|
Fiscal Year
|
||||||||
|
2012
|
2011
|
2010
|
||||||
|
Leisure
|
52.6
|
%
|
50.6
|
%
|
50.6
|
%
|
||
|
Fashion and home
|
30.3
|
%
|
31.7
|
%
|
32.2
|
%
|
||
|
Party and snack
|
17.1
|
%
|
17.7
|
%
|
17.2
|
%
|
||
|
Total
|
100.0
|
%
|
100.0
|
%
|
100.0
|
%
|
||
Leisure
includes items such as sporting goods, games, toys, media, books, electronic accessories, and arts and crafts.
Fashion and home
includes items such as personal accessories, “attitude” t-shirts, beauty offerings, home goods and storage options.
Party and snack
includes items such as party and seasonal goods, greeting cards, candy and other snacks, and beverages.
67
(11) Quarterly Results of Operations and Seasonality (Unaudited)
Quarterly financial results for
fiscal 2012
and
fiscal 2011
were as follows: (in thousands except for per share data).
|
|
Fiscal Year 2012
|
Fiscal Year 2011
|
|||||||||||||||||||||||||||||
|
Fourth
Quarter (1) |
Third
Quarter |
Second
Quarter |
First
Quarter |
Fourth
Quarter |
Third
Quarter |
Second
Quarter |
First
Quarter |
||||||||||||||||||||||||
|
Net sales
|
$
|
173,589
|
|
$
|
86,587
|
|
$
|
86,820
|
|
$
|
71,829
|
|
$
|
125,825
|
|
$
|
61,895
|
|
$
|
61,966
|
|
$
|
47,427
|
|
|||||||
|
Gross profit
|
71,138
|
|
26,931
|
|
28,747
|
|
23,020
|
|
51,890
|
|
18,373
|
|
20,011
|
|
14,587
|
|
|||||||||||||||
|
Net income (loss)
|
$
|
19,206
|
|
$
|
729
|
|
$
|
1,247
|
|
$
|
(1,157
|
)
|
$
|
12,427
|
|
$
|
440
|
|
$
|
2,212
|
|
$
|
999
|
|
|||||||
|
Basic income (loss) income per common share
|
$
|
0.36
|
|
$
|
0.01
|
|
$
|
(3.41
|
)
|
$
|
(0.32
|
)
|
$
|
0.17
|
|
$
|
(0.22
|
)
|
$
|
(0.10
|
)
|
$
|
(0.18
|
)
|
|||||||
|
Diluted income (loss) income per common share
|
$
|
0.35
|
|
$
|
0.01
|
|
$
|
(3.41
|
)
|
$
|
(0.32
|
)
|
$
|
0.17
|
|
$
|
(0.22
|
)
|
$
|
(0.10
|
)
|
$
|
(0.18
|
)
|
|||||||
(1) The Company operates on a fiscal calendar widely used by the retail industry that results in a given fiscal year consisting of a 52- or 53-week period ending on the Saturday closest to January 31 of the following year. Fiscal 2012 consists of a 53-week fiscal year and the fourth quarter of fiscal 2012 included an extra week, representing the 53rd week.
The Company's business is seasonal in nature and demand is generally the highest in the fourth fiscal quarter due to the fourth quarter holiday season and therefore, operating results for any fiscal quarter are not necessarily indicative of results for the full fiscal year. To prepare for the holiday season, the Company must order and keep in stock more merchandise than it carries during other parts of the year. The Company expects inventory levels, along with an increase in accounts payable and accrued expenses, generally to reach their highest levels in the third and fourth fiscal quarters in anticipation of the increased net sales during the year-end holiday season. As a result of this seasonality, and generally because of variation in consumer spending habits, the Company experiences fluctuations in net sales and working capital requirements during the fiscal year.
|
(12)
|
Subsequent Events
|
From February 3, 2013 to
March 28, 2013
, the Company committed to
10
new store leases with terms of
10
years that have future minimum lease payments of approximately
$14.9 million
.
68
Not applicable.
Evaluation of Disclosure Controls and Procedures
Our management has evaluated, under the supervision and with the participation of our Chief Executive Officer and
Chief Financial Officer, the effectiveness of our disclosure controls and procedures, as defined in Rule 13(a)-15(e), as of the
end of the period covered by this
Annual Report on Form 10-K
pursuant to Rule 13a-15(b) of the Securities Exchange Act of 1934 (the “Exchange Act”). Based on that evaluation, our Chief Executive Officer and Chief Financial Officer have concluded that our disclosure controls and procedures as of the end of the period covered by this
Annual Report on Form 10-K
are effective at a reasonable assurance level in ensuring that information required to be disclosed in our Exchange Act reports is (1) recorded, processed, summarized and reported in a timely manner and (2) accumulated and communicated to our management, including our Chief Executive Officer and Chief Financial Officer, as appropriate to allow timely decisions regarding required disclosure. Our management, including our Chief Executive Officer and Chief Financial Officer, does not expect that our disclosure controls and procedures will prevent or detect all errors and all fraud. While our disclosure controls and procedures are designed to provide reasonable assurance of their effectiveness, because of the inherent limitations in all control systems, no evaluation of controls can provide absolute assurance that all control issues and instances of fraud, if any, within the Company have been detected.
Internal Control over Financial Reporting
This
Annual Report
does not include a report of management's assessment regarding internal control over financial reporting or an attestation report of the Company's registered public accounting firm due to a transition period established by the rules of the Securities and Exchange Commission for newly public companies.
There were no changes to our internal control over financial reporting during the fourteen weeks ended February 2, 2013 that have materially affected, or that are reasonably likely to materially affect, our internal control over financial reporting.
None.
69
The information required by this Item 10 is included in the “Board of Directors–Nominees for Election to the Board of Directors for a Three-Year Term Expiring at the 2016 Annual Meeting,” “Board of Directors–Members of the Board of Directors Continuing in Office for a Term Expiring at the 2014 Annual Meeting,” “Board of Directors–Members of the Board of Directors Continuing in Office for a Term Expiring at the 2015 Annual Meeting,” “Executive Officers,” “Section 16(a) Beneficial Ownership Reporting Compliance,” “Board of Directors–Code of Business Conduct and Ethics,” “Board of Directors–Committees of the Board of Directors,” and “Board of Directors–Director Nomination Process” sections of our proxy statement for the 2013 annual meeting of shareholders, which will be filed with the Securities and Exchange Commission no later than
May 30, 2013
, and is incorporated by reference herein.
The information required by this Item 11 is
included in the “Compensation Discussion and Analysis,” “Executive Compensation,” “Board of Directors–Director Compensation,” “Board of Directors–Board Leadership Structure and Board’s Role in Risk Oversight,” “Board of Directors–Compensation Committee Interlocks and Insider Participation” and “Compensation Committee Report” sections of
our proxy statement for the 2013 annual meeting of shareholders, which will be filed with the Securities and Exchange Commission no later than
May 30, 2013
, and is incorporated by reference herein.
The information required by this Item 12
is included in the “Security Ownership of Certain Beneficial Owners and Management” and “Equity Compensation Plan Information” sections of our proxy statement for the 2013 annual meeting of shareholders, which will be filed with the Securities and Exchange Commission no later than May 30, 2013, and is incorporated by reference herein.
The information required by this Item 13 i
s included in the “Certain Relationships and Related Party Transactions” and “Board of Directors–Director Independence” sections of our
proxy statement for the 2013 annual meeting of shareholders, which will be filed with the Securities and Exchange Commission no later than
May 30, 2013
,
and is incorporated by reference herein.
The information required by this Item 14 is included in the “Proposal 3, Ratification of Independent Registered Public Accounting Firm” section of our proxy statement for the 2013 annual meeting of shareholders, which will be filed with the Securities and Exchange Commission no later than
May 30, 2013
, and is incorporated by reference herein.
(a) 1. Financial Statements
The financial statements of the Company filed as part of this Annual Report on Form 10-K are included in Part II, Item 8 beginning on page 47:
2. Financial Statements Schedules
All schedules are omitted because they are not applicable or because the required information is either not material or is included in the Financial Statements or Notes thereto.
70
3. Exhibits
Exhibit
Number Description
|
3.1
|
Amended and Restated Articles of Incorporation of Five Below, Inc., as currently in effect (incorporated by reference to Exhibit 3.5 of Amendment No. 2 to the Registration Statement on Form S-1 (File No. 333-180780) filed with the Commission on June 12, 2012)
|
|
3.2
|
Amended Bylaws, as currently in effect (incorporated by reference to Exhibit 3.6 of Amendment No. 2 to the Registration Statement on Form S-1 (File No. 333-180780) filed with the Commission on June 12, 2012)
|
|
4.1
|
Form of Specimen Stock Certificate (incorporated by reference to Exhibit 4.1 of Amendment No. 3 to the Registration Statement on Form S-1 (File No. 333-180780) filed with the Commission on July 9, 2012)
|
|
10.1
|
Investment Agreement, dated September 1, 2010, by and among Five Below, Inc., the Founders signatory thereto, the Significant Common Shareholders signatory thereto and the Purchasers signatory thereto (incorporated by reference to Exhibit 10.1 of the Registration Statement on Form S-1 (File No. 333-180780) filed with the Commission on April 18, 2012)
|
|
10.2
|
Amendment No. 1 to the Investment Agreement, dated October 14, 2010, by and among Five Below, Inc., the Purchasers signatory to the Investment Agreement and Sargent Family Investment, LLC (incorporated by reference to Exhibit 10.2 of the Registration Statement on Form S-1 (File No. 333-180780) filed with the Commission on April 18, 2012)
|
|
10.3
|
Amended and Restated Investor Rights Agreement, dated September 1, 2010, by and among Five Below, Inc., the Significant Common Shareholders signatory thereto, the Series A Preferred Shareholders signatory thereto and the Other Holders party thereto and any other Persons signatory thereto from time to time (incorporated by reference to Exhibit 10.3 of the Registration Statement on Form S-1 (File No. 333-180780) filed with the Commission on April 18, 2012)
|
|
10.4
|
First Amendment to Amended and Restated Investor Rights Agreement, dated October 14, 2010, by Five Below, Inc. (incorporated by reference to Exhibit 10.4 of the Registration Statement on Form S-1 (File No. 333-180780) filed with the Commission on April 18, 2012)
|
|
10.5
|
Second Amendment to Amended and Restated Investor Rights Agreement, dated May 23, 2012, by and among Five Below, Inc., the Significant Common Shareholders signatory thereto and the Series A Preferred Shareholders signatory thereto (incorporated by reference to Exhibit 10.5 of Amendment No. 1 to the Registration Statement on Form S-1 (File No. 333-180780) filed with the Commission on May 24, 2012)
|
|
10.6
|
Second Amended and Restated Shareholders Agreement, dated September 1, 2010, by and among Five Below, Inc. and the Shareholders party thereto and any other Persons signatory thereto from time to time(incorporated by reference to Exhibit 10.5 of the Registration Statement on Form S-1 (File No. 333-180780) filed with the Commission on April 18, 2012)
|
|
10.7
|
First Amendment to Second Amended and Restated Shareholders Agreement, dated October 14, 2010, by Five Below, Inc. (incorporated by reference to Exhibit 10.6 of the Registration Statement on Form S-1 (File No. 333-180780) filed with the Commission on April 18, 2012)
|
|
10.8
|
Second Amendment to Second Amended and Restated Shareholders Agreement, dated November 22, 2011, by and among Five Below, Inc. and the Consenting Shareholders signatory thereto (incorporated by reference to Exhibit 10.7 of the Registration Statement on Form S-1 (File No. 333-180780) filed with the Commission on April 18, 2012)
|
|
10.9
|
Third Amendment to Second Amended and Restated Shareholders Agreement, dated May 23, 2012, by and among Five Below, Inc. and the Shareholders party thereto and any other Persons signatory thereto from time to time (incorporated by reference to Exhibit 10.9 of Amendment No. 1 to the Registration Statement on Form S-1 (File No. 333-180780) filed with the Commission on May 24, 2012)
|
71
|
10.10†
|
Form of Non-Qualified Stock Option Agreement (Employees) (incorporated by reference to Exhibit 10.10 of the Registration Statement on Form S-1 (File No. 333-180780) filed with the Commission on April 18, 2012)
|
|
10.11†
|
Form of Non-Qualified Stock Option Agreement (Executives) (incorporated by reference to Exhibit 10.11 of the Registration Statement on Form S-1 (File No. 333-180780) filed with the Commission on April 18, 2012)
|
|
10.12†
|
Form of Award Agreement for Restricted Shares under the Five Below, Inc. Equity Incentive Plan (Employees) (incorporated by reference to Exhibit 10.14 of Amendment No. 2 to the Registration Statement on Form S-1 (File No. 333-180780) filed with the Commission on June 12, 2012)
|
|
10.13†
|
Form of Award Agreement for Restricted Shares under the Five Below, Inc. Equity Incentive Plan (Directors) (incorporated by reference to Exhibit 10.2 of the Current Report on Form 8-K filed with the Commission on March 11, 2013)
|
|
10.14†
|
Five Below, Inc. Amended and Restated Equity Incentive Plan (incorporated by reference to Exhibit 10.15 of Amendment No. 2 to the Registration Statement on Form S-1 (File No. 333-180780) filed with the Commission on June 12, 2012)
|
|
10.15†
|
Five Below, Inc. Performance Bonus Plan (incorporated by reference to Exhibit 10.16 of Amendment No. 2 to the Registration Statement on Form S-1 (File No. 333-180780) filed with the Commission on June 12, 2012)
|
|
10.16†
|
Form of Director and Officer Indemnification Agreement(incorporated by reference to Exhibit 10.17 of Amendment No. 1 to the Registration Statement on Form S-1 (File No. 333-180780) filed with the Commission on May 24, 2012)
|
|
10.17†
|
Letter Employment Agreement, dated October 14, 2010, by and between David Schlessinger and Five Below, Inc. (incorporated by reference to Exhibit 10.17 of the Registration Statement on Form S-1 (File No. 333-180780) filed with the Commission on April 18, 2012)
|
|
10.18†
|
Amendment to Employment Agreement, dated September 28, 2011, by and between David Schlessinger and Five Below, Inc. (incorporated by reference to Exhibit 10.18 of the Registration Statement on Form S-1 (File No. 333-180780) filed with the Commission on April 18, 2012)
|
|
10.19†
|
Letter Employment Agreement, dated October 14, 2010, by and between Thomas Vellios and Five Below, Inc. (incorporated by reference to Exhibit 10.19 of the Registration Statement on Form S-1 (File No. 333-180780) filed with the Commission on April 18, 2012)
|
|
10.20†
|
Amendment to Employment Agreement, dated September 28, 2011, by and between Thomas Vellios and Five Below, Inc. (incorporated by reference to Exhibit 10.20 of the Registration Statement on Form S-1 (File No. 333-180780) filed with the Commission on April 18, 2012)
|
|
10.21†
|
Letter Employment Agreement, dated April 16, 2012, by and between Kenneth R. Bull and Five Below, Inc. (incorporated by reference to Exhibit 10.21 of the Registration Statement on Form S-1 (File No. 333-180780) filed with the Commission on April 18, 2012)
|
|
10.22†
|
Non-Qualified Stock Option Agreement, dated October 14, 2010, by and between David Schlessinger and Five Below, Inc. (incorporated by reference to Exhibit 10.22 of the Registration Statement on Form S-1 (File No. 333-180780) filed with the Commission on April 18, 2012)
|
|
10.23†
|
Non-Qualified Stock Option Agreement, dated October 14, 2010, by and between Thomas Vellios and Five Below, Inc. (incorporated by reference to Exhibit 10.23 of the Registration Statement on Form S-1 (File No. 333-180780) filed with the Commission on April 18, 2012)
|
|
10.24†
|
Option Cancellation Agreement, dated March 22, 2012, by and between David Schlessinger and Five Below, Inc. (incorporated by reference to Exhibit 10.24 of the Registration Statement on Form S-1 (File No. 333-180780) filed with the Commission on April 18, 2012)
|
72
|
10.25†
|
Option Cancellation Agreement, dated March 22, 2012, by and between Thomas Vellios and Five Below, Inc. (incorporated by reference to Exhibit 10.25 of the Registration Statement on Form S-1 (File No. 333-180780) filed with the Commission on April 18, 2012)
|
|
10.26
|
Lease Agreement, dated April 1, 2007, by and between Twin Spans Business Park, LLC and Five Below, Inc., as amended (incorporated by reference to Exhibit 10.27 of Amendment No. 1 to the Registration Statement on Form S-1 (File No. 333-180780) filed with the Commission on May 24, 2012)
|
|
10.27
|
Credit Agreement, dated as of May 16, 2012, among Five Below, Inc. and the Lenders Party thereto, and Goldman Sachs Bank USA, Barclays Bank PLC and Jefferies Finance, LLC, collectively as lead arrangers and lead bookrunners and, individually, as administrative agent and collateral agent, syndication agent, and documentation agent, respectively, and Credit Suisse AG, Cayman Islands Branch, Deutsche Bank Trust Company Americas, UBS Securities LLC and Wells Fargo Bank, National Association, as arrangers and bookrunners (incorporated by reference to Exhibit 10.28 of Amendment No. 1 to the Registration Statement on Form S-1 (File No. 333-180780) filed with the Commission on May 24, 2012)
|
|
10.28
|
Security Agreement, dated as of May 16, 2012, among Five Below, Inc. and Goldman Sachs Bank USA (incorporated by reference to Exhibit 10.29 of Amendment No. 1 to the Registration Statement on Form S-1 (File No. 333-180780) filed with the Commission on May 24, 2012)
|
|
10.29
|
Second Amended and Restated Loan and Security Agreement, dated May 16, 2012, by and between Five Below, Inc. and Wells Fargo Bank, National Association(incorporated by reference to Exhibit 10.30 of Amendment No. 1 to the Registration Statement on Form S-1 (File No. 333-180780) filed with the Commission on May 24, 2012)
|
|
10.30
|
Lien Subordination and Intercreditor Agreement, dated May 16, 2012, among Wells Fargo, National Association, Goldman Sachs Bank USA and Five Below, Inc. (incorporated by reference to Exhibit 10.31 of Amendment No. 1 to the Registration Statement on Form S-1 (File No. 333-180780) filed with the Commission on May 24, 2012)
|
|
10.31†
|
Five Below, Inc. Compensation Policy for Non-Employee Directors (incorporated by reference to Exhibit 10.2 of the Current Report on Form 8-K filed with the Commission on March 11, 2013)
|
|
10.32†
|
Letter Employment Agreement, dated May 16, 2012, by and between David Johnston and Five Below, Inc. (incorporated by reference to Exhibit 10.33 of Amendment No. 2 to the Registration Statement on Form S-1 (File No. 333-180780) filed with the Commission on June 12, 2012)
|
|
10.33†
|
Non-Qualified Stock Option Agreement, dated May 23, 2012, by and between David Johnston and Five Below, Inc. (incorporated by reference to Exhibit 10.34 of Amendment No. 2 to the Registration Statement on Form S-1 (File No. 333-180780) filed with the Commission on June 12, 2012)
|
|
10.34†
|
Five Below, Inc. 2012 Employee Stock Purchase Plan (incorporated by reference to Exhibit 10.1 of the Quarterly Report on Form 10-Q filed with the Commission on November 29, 2012)
|
|
23.1
|
Consent of KPMG LLP (filed herewith)
|
|
31.1
|
Certification of Chief Executive Officer required by Rule 13a-14(a) or Rule 15d-14(a) of the Securities Exchange Act of 1934, as adopted pursuant to Section 302 of the Sarbanes-Oxley Act of 2002 (filed herewith)
|
|
31.2
|
Certification of Chief Financial Officer required by Rule 13a-14(a) or Rule 15d-14(a) of the Securities Exchange Act of 1934, as adopted pursuant to Section 302 of the Sarbanes-Oxley Act of 2002 (filed herewith)
|
|
32.1
|
Certification of Chief Executive Officer pursuant to 18 U.S.C. 1350, as adopted pursuant to Section 906 of the Sarbanes-Oxley Act of 2002 (filed herewith)
|
|
32.2
|
Certification of Chief Financial Officer pursuant to 18 U.S.C. 1350, as adopted pursuant to Section 906 of the Sarbanes-Oxley Act of 2002 (filed herewith)
|
73
|
101*
|
The following financial information from this Annual Report on Form 10-K, formatted in XBRL (Extensible Business Reporting Language) and furnished electronically herewith: (1) (i) the Audited Balance Sheets as of February 2, 2013 and January 28, 2012; (ii) the Audited Statements of Operations for Fiscal Years 2012, 2011 and 2010; (iii) the Audited Statement of Changes in Redeemable Convertible Preferred Stock, Convertible Preferred Stock and Shareholders' Equity (Deficit) for Fiscal Years 2010, 2011 and 2012; (iv) Audited Statements of Cash Flows for Fiscal Years 2012, 2011 and 2010 and (v) the Notes to Audited Financial Statements, in each case, tagged as blocks of text
|
† Management contract or compensatory plan or arrangement.
* Pursuant to applicable securities laws and regulations, this interactive data file is deemed not filed or part of a registration statement or prospectus for purposes of sections 11 or 12 of the Securities Act of 1933, as amended, is deemed not filed for purposes of section 18 of the Exchange Act of 1934, as amended, and otherwise is not subject to liability under those sections.
74
SIGNATURES
Pursuant to the requirements of Section 13 or 15(d) of the Securities Exchange Act of 1934, the Registrant has duly caused this report to be signed on its behalf by the undersigned, thereunto duly authorized, in Philadelphia, Pennsylvania, on the 28th day of March, 2013.
FIVE BELOW, INC.
By: /s/ David Schlessinger
Name: David Schlessinger
Title: Executive Chairman
Pursuant to the requirements of the Securities Exchange Act of 1934, this report has been signed by the following persons on behalf of the Registrant and in the capacities and on the dates indicated.
|
Signature
|
Title
|
Date
|
||
|
/s/ David Schlessinger
David Schlessinger
|
Executive Chairman
|
March 28, 2013
|
||
|
/s/ Thomas G. Vellios
Thomas G. Vellios
|
President, Chief Executive Officer and Director (Principal Executive Officer)
|
March 28, 2013
|
||
|
/s/ Kenneth R. Bull
Kenneth R. Bull
|
Chief Financial Officer (Principal Financial Officer and Principal Accounting Officer)
|
March 28, 2013
|
||
|
/s/ Steven Collins
Steven Collins
|
Director
|
March 28, 2013
|
||
|
/s/ Andrew Crawford
Andrew Crawford
|
Director
|
March 28, 2013
|
||
|
/s/ David Mussafer
David Mussafer
|
Director
|
March 28, 2013
|
||
|
/s/ Thomas Ryan
Thomas Ryan
|
Director
|
March 28, 2013
|
||
|
/s/ Ronald Sargent
Ronald Sargent
|
Director
|
March 28, 2013
|
||
|
/s/ Michael Devine
Michael Devine
|
Director
|
March 28, 2013
|
||
75
Exhibit Index
No.
Description
|
23.1
|
Consent of KPMG LLP
|
|
31.1
|
Certification of Chief Executive Officer required by Rule 13a-14(a) or Rule 15d-14(a) of the Securities Exchange
|
Act of 1934, as adopted pursuant to Section 302 of the Sarbanes-Oxley Act of 2002.
|
31.2
|
Certification of Chief Financial Officer required by Rule 13a-14(a) or Rule 15d-14(a) of the Securities Exchange
|
Act of 1934, as adopted pursuant to Section 302 of the Sarbanes-Oxley Act of 2002.
|
32.1
|
Certification of Chief Executive Officer pursuant to 18 U.S.C. 1350, as adopted pursuant to Section 906 of the
|
Sarbanes-Oxley Act of 2002.
|
32.2
|
Certification of Chief Financial Officer pursuant to 18 U.S.C. 1350, as adopted pursuant to Section 906 of the
|
Sarbanes-Oxley Act of 2002.
|
101*
|
The following financial information from this Annual Report on Form 10-K, formatted in XBRL (Extensible Business Reporting Language) and furnished electronically herewith: (1) (i) the Audited Balance Sheets as of February 2, 2013 and January 28, 2012; (ii) the Audited Statements of Operations for Fiscal Years 2012, 2011 and 2010; (iii) the Audited Statement of Changes in Redeemable Convertible Preferred Stock, Convertible Preferred Stock and Shareholders’ Equity (Deficit) for Fiscal Years 2010, 2011 and 2012; (iv) Audited Statements of Cash Flows for Fiscal Years 2012, 2011 and 2010 and (v) the Notes to Audited Financial Statements, in each case, tagged as blocks of text.
|
* Pursuant to applicable securities laws and regulations, this interactive data file is deemed not filed or part of a registration statement or prospectus for purposes of sections 11 or 12 of the Securities Act of 1933, as amended, is deemed not filed for purposes of section 18 of the Exchange Act of 1934, as amended, and otherwise is not subject to liability under those sections.
76
TABLE OF CONTENTS
Part IItem 1. BusinessItem 1A. Risk FactorsItem 1B. Unresolved Staff CommentsItem 2. PropertiesItem 3. Legal ProceedingsItem 4. Mine Safety DisclosuresPart IIItem 5. Market For Registrant's Common Equity, Related Stockholder Matters and Issuer Purchases Of Equity SecuritiesItem 6. Selected Financial and Other DataItem 7. Management S Discussion and Analysis Of Financial Condition and Results Of OperationsItem 7A. Quantitative and Qualitative Disclosures About Market RiskItem 8. Financial Statements and Supplementary DataItem 9. Changes in and Disagreements with Accountants on Accounting and Financial DisclosureItem 9A. Controls and ProceduresItem 9B. Other InformationPart IIIItem 10. Directors, Executive Officers and Corporate GovernanceItem 11. Executive CompensationItem 12. Security Ownership Of Certain Beneficial Owners and Management and Related Shareholder MattersItem 13. Certain Relationships and Related Transactions, and Director IndependenceItem 14. Principal Accountant Fees and ServicesPart IVItem 15. Exhibits and Financial Statement Schedules