FLIR SYSTEMS INC
10-Ks and 10-Qs
|
|
|
|
|
|
|
|
|
|
|
|
|
|
|
|
|
|
|
|
|
|
|
|
|
|
|
|
|
UNITED STATES
SECURITIES AND EXCHANGE COMMISSION
Washington, D.C. 20549
___________________________________________________
FORM 10-K
(Mark one)
|
ý
|
ANNUAL REPORT PURSUANT TO SECTION 13 OR 15(d) OF THE SECURITIES EXCHANGE ACT OF 1934
|
|
|
For the fiscal year ended December 31, 2013.
|
OR
|
¨
|
TRANSITION REPORT PURSUANT TO SECTION 13 OR 15(d) OF THE SECURITIES EXCHANGE ACT OF 1934
|
|
|
For the transition period from to
|
Commission file number
:
0-21918
_________________________________________________________________
FLIR Systems, Inc.
(Exact name of registrant as specified in its charter)
|
Oregon
|
93-0708501
|
|
|
(State or other jurisdiction of incorporation or organization)
|
(I.R.S. Employer Identification No.)
|
|
|
27700 SW Parkway Avenue, Wilsonville, Oregon
|
97070
|
|
|
(Address of principal executive offices)
|
(Zip code)
|
|
Registrant’s telephone number, including area code: (503) 498-3547
Securities registered pursuant to Section 12(b) of the Act:
|
Title of Each Class
|
Name of Each Exchange
on Which Registered
|
|
|
Common Stock, $0.01 par value
|
NASDAQ Global Select Market
|
|
Securities registered pursuant to Section 12(g) of the Act: None
________________________________________________________________
Indicate by check mark if the registrant is a well-known seasoned issuer, as defined in Rule 405 of the Securities Act. Yes
x
No
¨
Indicate by check mark if the registrant is not required to file reports pursuant to Section 13 or Section 15(d) of the Act. Yes
¨
No
x
Indicate by check mark whether the registrant (1) has filed all reports required to be filed by Section 13 or 15(d) of the Securities Exchange Act of 1934 during the preceding 12 months (or for such shorter period that the registrant was required to file such reports), and (2) has been subject to such filing requirements for the past 90 days. Yes
x
No
¨
Indicate by check mark whether the registrant has submitted electronically and posted on its corporate Web site, if any, every Interactive Data File required to be submitted and posted pursuant to Rule 405 of Regulation S-T (§229.405 of this chapter) during the preceding 12 months (or for such shorter period that the registrant was required to submit and post such files). Yes
x
No
¨
Indicate by check mark if disclosure of delinquent filers pursuant to Item 405 of Regulation S-K is not contained herein, and will not be contained, to the best of registrant’s knowledge, in definitive proxy or information statements incorporated by reference in Part III of this Form 10-K or amendment to this Form 10-K.
x
Indicate by checkmark whether the registrant is a large accelerated filer, an accelerated filer, a non-accelerated filer or a smaller reporting company. See the definitions of “large accelerated filer,” “accelerated filer” and “smaller reporting company” in Rule 12b-2 of the Exchange Act. (Check one)
|
Large accelerated filer
x
|
Accelerated filer
¨
|
|
Non-accelerated filer
¨
|
Smaller reporting company
¨
|
Indicate by check mark whether the registrant is a shell company (as defined in Rule 12b-2 of the Act). Yes
¨
No
x
As of June 28,
2013
, the aggregate market value of the shares of voting and non-voting stock of the registrant held by non-affiliates was
$3,793,399,921
.
As of February 28,
2014
, there were
140,878,393
shares of the registrant’s common stock, $0.01 par value, outstanding.
DOCUMENTS INCORPORATED BY REFERENCE:
The registrant has incorporated by reference into Part III of this Form 10-K, portions of its Proxy Statement for its
2014
Annual Meeting of Shareholders.
FLIR Systems, Inc.
FORM 10-K
ANNUAL REPORT
TABLE OF CONTENTS
|
PART I
|
||
|
Item 1
|
||
|
Item 1A
|
||
|
Item 1B
|
||
|
Item 2
|
||
|
Item 3
|
||
|
Item 4
|
||
|
PART II
|
||
|
Item 5
|
||
|
Item 6
|
||
|
Item 7
|
||
|
Item 7A
|
||
|
Item 8
|
||
|
Item 9
|
||
|
Item 9A
|
||
|
Item 9B
|
||
|
PART III
|
||
|
Item 10
|
||
|
Item 11
|
||
|
Item 12
|
||
|
Item 13
|
||
|
Item 14
|
||
|
PART IV
|
||
|
Item 15
|
||
Forward-Looking Statements
This Annual Report on Form 10-K (the “Report”), including “Management’s Discussion and Analysis of Financial Condition and Results of Operations” in Item 7 contains forward-looking statements within the meaning of the Private Securities Litigation Reform Act of 1995 regarding future events and the future results of FLIR Systems, Inc. and its consolidated subsidiaries (“FLIR” or the “Company”) that are based on management’s current expectations, estimates, projections and assumptions about the Company’s business. Words such as “expects,” “anticipates,” “intends,” “plans,” “believes,” “sees,” “estimates” and variations of such words and similar expressions are intended to identify such forward-looking statements. These statements are not guarantees of future performance and involve risks, uncertainties and assumptions that are difficult to predict. Therefore, actual outcomes and results may differ materially from what is expressed or forecasted in such forward-looking statements due to numerous factors including, but not limited to, those discussed in “Risk Factors” in Item 1A, “Management’s Discussion and Analysis of Financial Condition and Results of Operations” in Item 7, and elsewhere in this Report as well as those discussed from time to time in the Company’s other Securities and Exchange Commission filings and reports. In addition, such statements could be affected by general industry, economic and market conditions. Such forward-looking statements speak only as of the date of this Report or, in the case of any document incorporated by reference, the date of that document, and we do not undertake any obligation to update any forward-looking statement to reflect events or circumstances after the date of this Report, or for changes made to this document by wire services or Internet service providers. If we update or correct one or more forward-looking statements, investors and others should not conclude that we will make additional updates or corrections with respect to other forward-looking statements.
|
ITEM 1.
|
BUSINESS
|
Overview
FLIR Systems, Inc. (“FLIR,” the “Company,” “we,” “us,” or “our”) is a world leader in sensor systems that enhance perception and awareness. We were founded in 1978 and have since become a premier designer, manufacturer, and marketer of thermal imaging and other sensing products and systems. Our advanced sensors and integrated sensor systems enable the gathering and analysis of critical information through a wide variety of applications in commercial, industrial, and government markets worldwide.
Our goal is to both enable our customers to benefit from the valuable information produced by advanced sensing technologies and to deliver sustained superior financial performance for our shareholders. We create value for our customers by improving personal and public safety and security, providing advanced surveillance and tactical defense capabilities, facilitating air, ground, and maritime navigation, enhancing enjoyment of the outdoors, providing infrastructure inefficiency information, conveying preemptive structural deficiency data, displaying process irregularities, and enabling commercial business opportunities through our continual support and development of new thermal imaging data and analytics applications. Our business model meets the needs of a multitude of customers - we sell off-the-shelf products to a wide variety of markets in an efficient, timely, and affordable manner as well as offer a variety of system configurations to suit specific customer requirements. Centered on the design of products for low cost manufacturing and high volume distribution, our commercial operating model has been developed over time and provides us with a unique ability to adapt to market changes and meet our customers’ needs.
Through December 31, 2013, our business was organized into two divisions: Commercial Systems and Government Systems. Within these divisions, we had five reporting segments: Thermal Vision & Measurement and Raymarine, which comprise the Commercial Systems division; and Surveillance, Detection, and Integrated Systems, which make up our Government Systems division. In February 2014, we announced a realignment of our business which results in the elimination of our division structure and the formation of six reporting segments effective January 1, 2014. For purposes of this Report, all business descriptions and financial results are based upon our reporting structure as of December 31, 2013.
Thermal Vision & Measurement (“TVM”) products are generally sold for applications where the customer need is to see at night or in adverse conditions or to image a scene while gathering valuable situational and temperature information. Due to continued reductions in the cost of infrared technology, demand in large untapped commercial markets such as commercial and residential security, transportation, marine, airborne, personal night vision, and first responder markets has grown rapidly. Our TVM products range from highly sensitive cameras with extensive analytic capabilities and sophisticated image processing to less expensive cameras offering a mix of performance and value for less demanding applications. Our infrared sensors business, which sells focal plane arrays and camera cores internally as well as to third parties on an original equipment manufacturer (“OEM”) basis, is also part of TVM. Revenue from TVM was
$727.9 million
, which represented
49 percent
of consolidated revenue in
2013
.
1
Raymarine designs, develops, and markets electronics for the maritime market and is a leading global provider of fully integrated “stem to stern” networked electronic systems for boats of many sizes. Products include multifunction displays used to control multiple on-board electronic components, radar systems, thermal imaging cameras, autopilot systems, sonar modules, connectivity software, and various other instruments used to monitor factors such as boat speed, direction, and location. The business distributes its products through a large network of independent distributors and retailers as well as through its relationships with boat builders, providing both first fitment and aftermarket solutions. During
2013
, Raymarine generated revenue of
$163.2 million
which represented
11 percent
of consolidated
2013
revenue.
Our Surveillance segment is focused on selling advanced imaging and sensor systems to government customers and non-government markets where high performance is required. Typical applications include intelligence, surveillance, and reconnaissance (“ISR”), force protection, drug interdiction, search and rescue, special operations, and target designation. Surveillance products are sold off-the-shelf or can be customized for specific applications and frequently incorporate additional sensors, including visible light cameras, radars, low light cameras, laser rangefinders, laser illuminators, laser pointers, and laser designators. Surveillance products range in price from under $10,000 for certain hand-held and weapon-mounted systems to over $1 million for our most advanced stabilized targeting systems. Surveillance segment revenue was
$456.5 million
in
2013
, or
31 percent
of consolidated revenue.
Detection primarily produces sensor systems that detect and identify chemical, biological, radiological, nuclear, and explosives (“CBRNE”) threats. Detection has unique strengths in understanding the nature of sophisticated security threats, the technological potential of advanced detection instruments and systems, and the complex procurement processes of United States and many international government customers. With a history of entering into government-funded design and development contracts, Detection has built relationships with key government customers and has experience in converting highly specialized technologies into commercial solutions that are marketable to a global customer base. Detection continues to expand into new markets that include environmental monitoring, food safety, and narcotics detection. During
2013
, the Detection segment generated
$53.2 million
of revenue, representing
4 percent
of consolidated revenue.
Integrated Systems develops platform solutions for combating sophisticated security threats and incorporates multiple sensor systems in order to deliver actionable intelligence for wide area surveillance, intrusion detection, border security, and facility security. Integrated Systems incorporates advanced sensors from both the FLIR product suite and external vendors in order to design and manufacture adaptive and effective force protection, homeland security, and commercial solutions that are designed to save lives and protect critical assets. Integrated Systems revenue in
2013
was
$95.6 million
, representing
6 percent
of consolidated revenue.
For additional information concerning the Company's segments, including revenues from external customers, earnings from operations, and total assets by segment presented in accordance with our segment structure, see Note 17 to the Consolidated Financial Statements in Item 8.
Infrared Technology Overview
Infrared is a portion of the electro-magnetic spectrum that is adjacent to the visible spectrum, but is invisible to the human eye due to its longer wavelengths. Unlike visible light, infrared radiation (or heat) is emitted directly by all objects above absolute zero in temperature. Thermal imaging systems detect this infrared radiation and convert it into an electronic signal, which is then processed into a video signal and displayed on a video screen. Thermal imaging systems are different than other types of “low light” vision systems, such as visible light intensification used in green or gray sighted night vision goggles. Infrared imaging systems are not adversely affected by the presence of visible light, so they can be used day or night, and they are not susceptible to rapid changes in visible light levels. Since infrared systems are detecting emitted infrared radiation, they are passive and thus more covert than certain “active” or “illuminated” infrared systems. Additionally, thermal imaging systems can measure very small temperature differences, a critical feature for a variety of commercial, industrial, and scientific applications.
An infrared detector, which collects or absorbs infrared radiation and converts it into an electronic signal, is the primary component of thermal imaging systems. The two types of infrared detectors we manufacture and use in our systems are often referred to as “cooled” and “uncooled.” Cooled detectors utilize a mechanical stirling cycle micro-cooler to reduce the operating temperature of the infrared sensor to approximately -200° C, and offer high sensitivity and resolution for long-range applications or those applications requiring high measurement precision. These detectors, while more sensitive and thus able to see farther, result in a product that is more expensive, heavier, more complex, and uses more power than those using uncooled detectors. Uncooled detectors operate at room temperature and thus do not require a micro-cooler, resulting in products that are lighter, use less power and are less expensive to produce than cooled detectors. While the performance of uncooled detectors is improving, uncooled detectors are still less sensitive than cooled detectors. The cost of both types of detectors is declining and we expect to continue reducing costs as volumes rise and the technology advances in the future. We currently expect demand for both types of detectors, or sensors, to increase.
2
Recent Acquisitions
Since the beginning of 2009, we have made a total of thirteen acquisitions. During 2013, we made two acquisitions for a total of $18.1 million.
We are selective and opportunistic in our acquisitions, seeking to purchase companies that are strategically significant and additive or complementary to our existing technologies, distribution network, or product portfolio. We are continuously evaluating opportunities for additional acquisitions, but cannot predict the timing, size, or nature of any future activity.
FLIR Systems, Inc. is an Oregon corporation. Our headquarters are located at 27700 SW Parkway Avenue, Wilsonville, Oregon 97070, and the telephone number at this location is (503) 498-3547. Information about the Company is available on our website at www.flir.com.
Competitive Strengths
With our decades of experience in developing and marketing infrared sensor products, we have built several unique competitive advantages that are core to our success. We look to leverage these strengths to continue to increase the availability of and uses for advanced sensing technologies and to grow our revenue and profitability:
Commercial Operating Model
A key differentiator of our business model is our commercial approach to investment and strategy. This is characterized by our focus on global deployment, superior customer service, rapid product development cycles, innovation of new technologies and unique products, ability to design for large-volume and low cost production, and control of multiple production inputs through our vertically integrated operations.
Vertically Integrated Manufacturing and Supply
We have built a vertically integrated manufacturing operation that provides control over certain key component technologies. Through acquisitions and internal development, we have created this internal supply network that allows for optimized manufacturing throughput, increased product design flexibility, enhanced product reliability, and independence in designing key components. Further, this integrated approach enables us to lower costs and to improve the functionality of critical components so that they work together efficiently within our products. In comparison to competitors that do not possess a similar level of integration, we can deliver products in a more timely and cost-effective manner as we rely less on third-party suppliers for critical components.
Industry-Leading Market Position
We are a leading developer of highly advanced, proprietary sensor systems that are highly reliable, accurate, and effective. We believe that none of our competitors have comparable penetration into as many markets as we do, including the government, industrial, commercial, and consumer sectors. Having a leading position in the markets we serve allows us to secure new and continuing business while also achieving manufacturing economies of scale. Increased unit volumes work to reduce costs throughout our business, which allows us to lower our prices. This creates a virtuous cycle whereby we are able to make advanced sensor technologies more affordable to a wide array of end-users while reducing costs. This established presence across multiple markets enhances our competitive position.
Broad Product Line
We offer a wide array of sensor products, including infrared imaging cameras and systems, detector cores, CBRNE threat detectors, test and measurement instruments, radars, maritime electronics, and related products and solutions. Our customers can buy these products off-the-shelf or request a customized sensor solution. This ability to serve a variety of customers with disparate needs and specifications allows us to be successful in facilitating the use of advanced sensors in a broad range of applications. We have the ability to rapidly conceive, design, prototype, and manufacture new products to meet the evolving landscapes of the markets we serve. Our development process incorporates significant customer satisfaction and field-use data, and results in the rapid creation of new features that are able to address the changing needs of the end-user. This continual evolution of our products has proven successful through our high level of customer retention and revenue and income growth.
3
Internally-Funded Innovation
We have expertise in developing sensing instruments that are both highly advanced from a technical standpoint and commercially viable and salable across multiple types of customers. Since the beginning of
2009
, we have invested approximately $640 million in internally-funded research and development (“R&D”) of new technologies and products. Utilizing our own funds for R&D provides us with full ownership of the development process and the end product, and also focuses our R&D teams on projects that will result in products that are commercially viable and can be marketed to multiple markets for multiple applications.
Diverse Customer Base
We sell our products to thousands of commercial and government customers for use in a variety of applications and markets worldwide. The buyers and users of our products include government agencies and militaries, aerospace and defense contractors, electricians and tradesmen, commercial ports, first responders, critical infrastructure operators, electrical generation and gas processing plants, heating and air conditioning technicians, building inspectors, food processors, automobile parts manufacturers, commercial and residential security providers, research and lab technicians, manufacturing companies, doctors and veterinarians, recreational boaters, and the general consumer market. We believe that the diversity of our customers, end-user markets, and applications helps to mitigate fluctuations in demand from any particular customer or market. The diversity of our customers and of the end-users of sensor technologies provides us with multiple long-term growth opportunities.
Global Distribution Capabilities
Our core infrared imaging products have evolved from a niche technology sold primarily to military customers and high-end research firms to become a valuable information gathering and assessment tool to a multitude of industrial, government, and commercial entities. With the widening adoption of these technologies, distribution has become a key advantage to our business globally. We believe our sales and distribution organization is among the largest in the industry and effectively covers the world with a combination of direct sales, third-party representatives and distributors, independent dealers, retail outlets, application engineers, and service and training centers. Internationally, we have invested heavily to build a strong presence to sell and service our products, a key advantage in penetrating certain markets, such as foreign governments. Our sales representatives, including third-party distributors, undergo a comprehensive training program on each product’s technical specifications, functions, and applications. We also continuously update our training programs to incorporate technological and competitive shifts and changes. We sell in many distinct markets and have established specific sales channels for each market.
We continue to expand this distribution platform through internal growth and outside acquisitions. For example, our 2012 acquisition of Lorex Technology, Inc. ("Lorex") provides us with established distribution channels to consumer retailers and complementary security systems integrators, and provides us with robust Internet sales and marketing capabilities.
Investment in Research and Development and Intellectual Property Platform
We have invested heavily in research and development, resulting in industry leading innovations and a robust and growing intellectual property portfolio that is focused on our core technologies as well as many of our emerging technologies and businesses. Through our strategic acquisitions and increased investment in intellectual property capture, we not only continue to bolster the strength of our patent portfolio, but we have also significantly expanded the breadth of our patent coverage. To complement our strong patent portfolio, we also continue to strengthen our key brands by unifying critical design features across product lines, enhancing our worldwide trademark coverage, and growing brand awareness through social media outlets. We intend to continue to protect our innovations through a variety of intellectual property mechanisms.
Consistent Generation and Distribution of Cash Flows
Our earnings, combined with our modest capital expenditure requirements, result in the generation of significant free cash flow. In the years ended December 31,
2013 and 2012
, our net cash provided by operating activities was
$355.0 million
and
$285.5 million
, respectively. Over the past 5 years, our operating cash flows have exceeded our net earnings every year. This ability to consistently convert revenues into net operating cash provides us significant flexibility in making growth and capital deployment decisions, such as executing strategic acquisitions, undertaking new product or technology development initiatives, building out our distribution and marketing presence, making capital investments, paying dividends, or repurchasing shares of our common stock in the open market. Since
2009
, we have utilized approximately $629 million of cash for acquisitions, $646 million for share repurchases, and $260 million for capital expenditures. In 2011, we initiated a quarterly common stock dividend, further augmenting our capital structure and shareholder return strategy, and have annually increased our dividends since inception.
4
Growth Strategies
Our clear and consistent strategy has enabled strong and steady performance in our business while allowing expansion into areas of growth. We look to build on our leading position in advanced sensor systems by leveraging our key competitive strengths through a focused corporate strategy that will yield growth in both revenue and profitability. Key elements of the FLIR growth strategy include:
Grow Existing and Enter New Markets
A key element of our success is our ability to deliver high-value sensor technologies with various specifications and price points to reach a rapidly expanding range of customers. While our commercial operating model and innovative development teams work to continually increase the availability, value, and effectiveness of our products, our sizable and growing end-user population often discover new uses for our technologies. We will continue to enable our existing markets, facilitate customer application innovation, and expand into new areas of opportunity by making investments in the development of advanced multi-use products, best-in-class field-located sales and service capabilities, proactive technical and application communication forums, integrated and expert sales and marketing organizations, comprehensive customer training, and capabilities to rapidly deploy new products and solutions.
Design and Develop Innovative Sensor Systems
We intend to continue to broaden our product lines by developing next-generation sensor technologies by leveraging our internally-funded innovation centers and, in limited situations that are strategically beneficial to our commercial model, by using customer funds. Creating a regular flow of new products that incorporate novel features and technologies while also reducing their size, weight, and power consumption is critical to our continued success in our existing and future markets. We allocate significant resources to business and product development, concentrating on tracking and analyzing industry and technology trends. By being aware of our changing customers' needs and the trends within our markets, we expect to bring to market the most cutting-edge and innovative products that provide critical information to secure, protect and improve lives, and conserve natural resources.
Continually Reduce Costs
Our ability to continue penetrating and expanding on our leading market position and into the markets for advanced sensor systems is predicated on our success at reducing our internal costs to manufacture systems. Through our commercial operating model, we have had great success designing and manufacturing products that benefit from economies of scale and thus reduce our cost to deliver a product to our customers. We expect to further leverage this model and accelerate the virtuous cycle our business has created where increased unit volume output reduces our costs, allowing us to lower selling prices, which increases demand and sales volume for our products. We intend to continue to reduce costs, through continuing to vertically integrate our operations, expanding our use of shared services, and rationalizing our supply chain and our manufacturing operations.
For example, in
2013
, we implemented an operational restructuring plan that will result in the closure of six manufacturing and R&D sites, the movement of those operations into other, larger FLIR locations, the consolidation of optics production capabilities and laser manufacturing operations into optics and laser centers of excellence.
Expand Global Reach
Expanding and strengthening our already substantial distribution network is vital to our ability to keep pace with demand and the growing adoption of advanced infrared and threat detection systems. Investing in our direct sales force and building relationships with independent distributors and partners globally is a key priority. Developing countries such as Brazil, India, Russia, and China are areas of focus, as they are emerging economies for our technologies. Additionally, as our sensor technologies become more affordable and prevalent in consumer markets, we have worked to strengthen our marketing and sales channels to better communicate with and serve the millions of potential customers that transact over the Internet, through catalogs, and at retail locations.
5
Build Application Awareness and Our Brands
Both thermal imaging and CBRNE detection technologies are still in the early stages of adoption in many of our markets. We believe that as people understand and recognize the extensive commercial, consumer, and industrial uses for the information our sensors provide, our business will continue to grow. As such, we strive to communicate the benefits of thermal and detection sensors to new market participants in order to drive demand for our products. We leverage our distribution channels to focus on marketing activities that incorporate Internet promotion, advertising, direct mail, press and demonstration tours, technical articles for publications, and sponsorship of and participation in most major trade shows. Additionally, we strive to support the advancement of new sensor uses, provide world-class service and support, and listen to customer feedback and incorporate the findings into our solutions to further build the awareness of our solutions and our brand. These activities give us the opportunity to educate potential customers about the key features and attributes of our products and how they may be used to address specific customer needs.
Complement Core Competencies with Strategic Acquisitions
Infrared imaging has been and remains our core business. Our unique position as a leading infrared imaging products company has enabled us to build an integrated sensors company, having added CBRNE detection, radar, maritime, visible light, and test and measurement products. We intend to continue investing in complementary technologies, product software, and distribution channels to grow our business and become an integrated, single-source provider of advanced sensor systems and solutions.
Focus on Financial Performance
We are focused on translating success in selling our products into high margins and increasing profits. We have been consistently successful in doing so through cost discipline, considering the impact of key business decisions on financial performance, and benchmarking our business against some of the best performing companies in the world. The cash flow that our business generates has allowed us to invest in growth initiatives as well as return value to our shareholders. Over the past five years, our revenue and operating cash flows have grown at annual rates of 7 percent and 10 percent, respectively, and we have returned $778 million to shareholders via share repurchases and dividends.
6
Business Segments
Thermal Vision & Measurement
Our Thermal Vision & Measurement ("TVM") segment addresses thermal imaging applications where a customer has a need to see at night or in adverse conditions, or to image a scene while also gathering valuable situational and temperature information. These markets have grown in size and breadth as prices have declined, volumes have increased, and new applications have emerged. While these markets are broad and growing rapidly, many still exhibit low penetration rates for infrared technology. Our strategies in this business are to continue to develop products for high-end applications while introducing new products at lower price points, and to capitalize on highly price-elastic demand in numerous emerging markets. These strategies focus our efforts on building distribution channel relationships, accelerating design cycles, reducing manufacturing costs, and providing excellent customer service. While we expect markets to continue to develop in the future, significant markets for our TVM products today include:
|
Thermal Vision Markets
|
|
|
Security and Surveillance
|
Thermal imaging systems have been used for surveillance and perimeter security of government, military and industrial facilities for many years. Over the past few years, we have introduced a series of lower priced, purpose built systems targeted at the commercial security market and are actively expanding distribution in this market. Our thermal and visible light security products are now being used to protect critical infrastructure, ports, borders, commercial sites, and residential homes. Demand for security systems utilizing thermal imaging technology is growing rapidly, especially in lower cost, higher volume market segments.
|
|
Automotive Night Vision
|
We offer a night vision system for passenger automobiles that provides drivers with the ability to see at night and through obscurants, such as fog, at distances much further and wider than can be seen with traditional headlights. We currently provide camera cores for certain Audi, BMW, Mercedes Benz, and Rolls Royce models through our partnership with Autoliv Electronics, a major supplier of automotive safety equipment. We expect to continue to expand this technology into new makes and models over the next several years.
|
|
Marine
|
In 2006, we introduced the first cost-effective infrared device specifically designed for recreational boating, cruise lines, commercial fishing and merchant marine vessels, ferries, and other maritime markets. Since then we have aggressively expanded distribution through a combination of direct sales and a network of dealers. Our 2010 acquisition of Raymarine Holdings Limited ("Raymarine") has greatly expanded our distribution capabilities as well as our product breadth. We now offer an integrated suite of maritime electronics that utilizes multifunction displays, infrared cameras, sonar devices, GPS, auto pilots, satellite TV, and advanced command and control software.
|
|
Personal Vision
|
We are pioneering the use of advanced thermal imaging technology for consumer applications. Our easy to use, affordable, and lightweight personal vision thermal cameras give people the ability to see at night and stay safe in various settings. We enhance people’s enjoyment of the outdoors by enabling them to keep track of their camping party, see and track animals, and navigate during deteriorated weather conditions. In the home, our cameras can be used for numerous household and security applications, such as locating heat leaks, evaluating insulation coverage, detecting water damage, identifying intruders, and locating pests.
|
|
Intelligent Traffic
|
Thermal imaging is a growing application for the monitoring and analyzing roadway traffic. Our cameras and imaging algorithms are used primarily to enable the efficient flow of traffic at roadway intersections and to monitor tunnels and road shoulders for stopped vehicles, wrong-way drivers and debris on the roadway. While road-embedded magnetic rings or visible light cameras have historically been used for analyzing intersections and roadways, thermal technology has shown to be a more effective solution. This is largely due to the valuable information that is provided by a thermal image, which is more useful than visible light solutions when analyzing scenes with imaging algorithms. Additionally, our thermal images are not impeded by darkness, colors, shadows, direct sunlight, or other weather effects while visible light and competing thermal cameras can be adversely affected by such conditions.
|
|
Law Enforcement
|
We are a leader in the supply of low cost, hand-held systems to the law enforcement market. These cameras provide a lightweight, cost-effective, high performance tool for police officers and other law enforcement professionals to conduct search and rescue, surveillance, or pursuit missions.
|
|
Firefighting
|
Thermal imaging technology is beneficial for first responders to assess conditions of a space prior to entry and providing them the ability to see through most forms of smoke. In 2013, we introduced the K-series line of highly-ruggedized thermal cameras designed and tested for the firefighting industry to operate under extreme heat and moisture situations, enhancing firefighters’ ability to find people and locate hot spots.
|
|
OEM Markets
|
We supply cooled and uncooled camera cores, sensors, optics, and readout integrated circuits on an OEM basis for a broad range of applications where customers require a product at a lower level of integration than a fully developed thermal imaging system. Examples of major applications in this segment are firefighting, unmanned aerial vehicles, cooled cores for military applications, readout integrated circuits for digital X-ray, and security.
|
7
|
Thermal Measurement Markets
|
|
|
Predictive Maintenance
|
Thermal imaging systems are used for monitoring the condition of mechanical and electrical equipment. Such monitoring assists our customers in identifying equipment faults (manifested as hot spots) so they can be repaired before they fail. This increases equipment productivity and avoids catastrophic failures or major damage, which reduces operating expenses by lowering repair costs and reducing downtime. Improved functionality of image analysis software, smaller size and weight, and simplicity of system operation are critical factors for this well established market segment.
|
|
Research & Development
|
Thermal imaging’s unique ability to detect very small differences in temperature while detailing complex thermal dynamics and patterns makes thermal imaging systems a useful tool in a wide variety of research and development applications. Our systems provide the ability to view thermal distribution in real time for products ranging in size from small hybrid integrated circuits to jet engines. Common applications include product development of microelectronics, cell phones, laptop computers, telecommunications equipment, consumer appliances, automotive components, and aircraft engines. Systems used in research and development applications typically require very high imaging performance and measurement precision, coupled with extensive analysis and reporting software. We have a complete line of both cooled and uncooled imagers specifically designed for high-end research and development applications.
|
|
Manufacturing Process Control
|
Thermal imaging applications for manufacturing process control include applications where temperature consistency is critical, including monitoring the quality of metal, plastic and glass cast parts, which are highly dependent upon the temperature distribution in the mold; monitoring the quality of paper, which is dependent upon proper and even moisture distribution during the drying process; and monitoring the quality of products such as rubber gloves, which can be thermally examined to locate abnormally warm or cool spots, indicating non-uniform thickness that may result in a quality defect.
|
|
Building Inspection
|
Thermal imagers can detect missing insulation, electrical faults, and pest infiltration, can gauge energy efficiency, and can help detect the presence of moisture and the source of intrusion. Market segments include building diagnostics, energy auditing and home inspection, property and facility management, HVAC and plumbing, and moisture detection and restoration. This market has grown rapidly as costs have declined and new uses for thermal imaging systems have emerged.
|
|
Gas Detection
|
Specially designed infrared systems can detect and image certain gas emissions or leaks. Using this technology, we have established a market focused on leak detection at gas production, transmission and storage locations, as well as compliance monitoring by environmental and other regulatory agencies. New applications are emerging for this technology. For example, we now have a system that detects sulfur hexafluoride, a dangerous pollutant and potential fire hazard used as an insulator in electrical transformers. The United States Environmental Protection Agency (“EPA”) has issued a requirement that large-scale extractors and distributors of greenhouse gases begin to annually self-report the amount of greenhouse gas that is emitted from their facilities. The EPA allows, and in certain situations requires, the use of optical gas imaging systems such as ours to be used to perform the emission analysis.
|
|
Test and Measurement
|
We supply trade professionals a wide range of test equipment to deliver high accuracy readings for the measurement of electricity, light, sound, temperature, humidity, airflow, rotation velocity, and water quality. Our fifteen product categories provide innovative tools that are used worldwide and are available through catalogs, distributors and retail stores.
|
|
Emerging Markets
|
We have successfully introduced progressively lower priced thermal imaging systems that have enabled us to expand traditional thermography markets and open new markets for our products. These products, the latest of which is the Ex-series, have met with strong market acceptance in the higher volume building and electrical inspection markets, and we expect additional market segments for thermal imaging to develop as prices continue to decline. These market segments may include healthcare and screening, food service and distribution, veterinary science, automotive care, aircraft inspection, and maritime vessel inspections.
|
|
Training
|
We offer fee-based training on the principles of thermography and the use of our products through ITC
®
, our Infrared Training Center, which provides comprehensive instruction, training, certification and applications engineering from several FLIR locations or at the customer’s site. We also license Infrared Training Centers to qualified third parties in certain countries.
|
8
Sales and Distribution
We sell our TVM products worldwide through a direct sales staff and a network of distributors and representatives as well as retail channels. Our TVM business continues to expand distribution by hiring additional direct sales personnel and expanding third-party distribution networks in specific markets, particularly in Asia, Latin America, and other emerging markets. In certain markets, TVM has chosen to supply camera cores on an OEM basis to companies with well established distribution networks. With our further expansion into the low cost segment of the commercial markets, we have developed greater competencies in market research, electronic marketing, marketing communications, and business development. Our ability to identify new markets, adapt our product solutions to meet unique market needs, quickly develop marketing communications that highlight our unique features, and leverage existing and new distribution channels to develop incremental business are important aspects of our marketing and communications efforts.
TVM carries backlog in certain markets, but the business is less backlog dependent than our Government Systems division’s segments. TVM order backlog, defined as orders received for products or services for which a sales agreement is in place and delivery is expected within twelve months, was
$189 million
as of
December 31, 2013
, compared with
$158 million
at the end of
2012
.
Customers
Typical TVM customers include OEMs, major integrators of security systems, security dealers, utility companies, electrical contractors, maritime dealers, law enforcement agencies, outdoor enthusiasts, building inspectors, damage restoration contractors, universities, numerous commercial enterprises, and increasingly, consumers. The emerging personal vision systems market is becoming increasingly accessible as we leverage our business model to reduce the price of advanced thermal imaging products. This consumer market is a key strategic area of focus given the vast size of the customer base and the opportunities it provides us to expand our volumes and brand name. Given the high-value nature of many of our thermography-related instruments, our thermography products’ revenues tend to be correlated with seasonal trends, in particular capital spending trends. In general, customers in markets like predictive maintenance and R&D are sensitive to the broad economy because our cameras are viewed as capital expenditure items. The sales of our high volume cameras and emerging thermal vision products are somewhat less sensitive to economic cycles due to their lower price points and the growing market awareness of thermal technology.
Our established distribution network, broad product portfolio, and product and technical development capabilities set a foundation for future success as we continue to leverage our operating model to increase our product volumes and reduce our costs in creating advanced imaging products. As we continue to make our products accessible to a larger population of end-users and build awareness of the advantages of thermal imaging applications, we anticipate our TVM segment will provide significant revenue and profitability for our business.
Competition
Many of the markets that TVM addresses are emerging from the early-adopter environments to broader-based demand, which has attracted competitors. While our market share in thermography products is significant, estimated to be approximately 60 percent based on independent industry research, we view the TVM market as highly competitive, with both large and niche providers of thermal camera equipment. We believe the key drivers of success in these markets are: technological proficiency in imaging sensors, product design and functionality, product quality, product cost, ability to deliver in a timely manner, trustworthy customer service, customer training, distribution reach, brand name, and scalability of operations. We are uniquely positioned to operate in this competitive environment given our demonstrated ability to innovate high-quality sensors at low cost due to our operating model, our advanced research and development capabilities, our established and reliable distribution and service network, our diversified manufacturing operations, and our broad product offering. Our competitors vary market by market, but include divisions of Danaher (Fluke), General Dynamics, L-3 Communications, Sofradir, Axis Communications, NEC, Testo, and numerous smaller companies.
Raymarine
Raymarine is a leading provider of marine electronics, and continues as a pioneer in the innovation of technologies that give boaters situational awareness on the water. The comprehensive suite of products that Raymarine develops and markets is intended to fulfill all of the marine electronic needs of recreational boaters and offer best-in-class integrated control solutions for all of their on-board instrumentation. The current product portfolio includes multifunction displays, autopilots, thermal imaging cameras, radars, sonar modules, satellite TV, engine monitoring gateways, and other instruments which interconnect through Raymarine’s proprietary networking solutions. This broad product range is differentiated by the reliability, usability, and interconnectivity of the instruments we provide. Raymarine’s core capability, providing a comprehensive and centralized control, navigation, and communication system that can be managed with a single integrated data output, is valuable to our customers, who increasingly look for quality, technologically advanced products from a single-source.
9
Our key strategies for Raymarine include continued investment in R&D to create truly new and innovative products and leveraging our global thermal imaging capabilities into the recreational marine industry, expanding into adjacent markets, and enhancing the integration capabilities of the business through investments in software and networking solutions. While the boating market that Raymarine serves is sizable, the industry has been in a cyclical trough. We believe that recent product developments and operational improvements have positioned the business to benefit significantly as global demand returns to historical levels.
|
Markets
|
|
|
Recreational Boating OEMs
|
A main focus of Raymarine has been to establish relationships with boat manufacturers in order to sell a fully integrated electronic “backbone” on new boats, with the intention of driving brand continuity with a large installed base of end-users. Medium sized (26 to 45 feet in length) and large boats (in excess of 45 feet in length) have a unique need for sophisticated electronics and multifunction control solutions. Additionally, in recent years, demand has grown for scaled-down instruments in the much larger segment for small boats (comprising inflatable, pontoon and rigid motor craft under 25 feet in length). Raymarine’s comprehensive product offering has evolved to serve well these evolving boat manufacturers’ needs.
|
|
Aftermarket
|
Due to the comparatively long life of a recreational boat, the growing importance and usefulness of marine electronic equipment and the pace of technological development, the aftermarket is large for electronics systems refits and upgrades. Raymarine has ensured that both our instruments and our networking software are capable of integrating with third party platforms and instruments, which has become a key driver of demand in the aftermarket.
|
Sales and Distribution
Raymarine’s products are sold through a combination of direct sales, third-party distributors, service partners, and retail outlets. Raymarine has strong relationships with a large number of key boat builder OEMs, most of which are supplied directly with the latest Raymarine systems.
Raymarine also supplies a global network of retailers, distributors and wholesalers. Many of these partnerships are on an exclusive basis, whereby Raymarine is the only electronic boating equipment stocked. Raymarine also has a global network of dealers and service centers which are able to sell, repair, and install Raymarine’s products. Additionally, the business has established a presence at retail locations and boat shows, which serves to build the Raymarine brand in both the new-build and aftermarket spaces. Having a strong consumer brand name and a large installed base of users created through our first fitments drives business in the aftermarket as boaters look to upgrade or replace instrumentation, often with the brand with which they are familiar.
Raymarine’s backlog as of
December 31, 2013
, was
$7 million
. Raymarine is not considered a backlog intensive business, as shipment of product typically occurs within a few weeks of receipt of orders.
Customers
Raymarine sells its products via diverse distribution channels to a wide variety of customers. Raymarine has established long-term relationships with more than 250 OEM boat builders, each of which have experience and knowledge of the product capabilities, quality, and reliability. These OEMs value the breadth of the Raymarine product line and our global dealership service network. We also sell discrete instruments to consumers who are looking to install new or upgrade existing marine electronics on their small, medium, or large boats.
Competition
The maritime electronics markets are intensely competitive with many established brands and companies. We compete with these companies through innovation, product capabilities and perceived value, relationships with OEMs and distributors, and product availability and service. We believe we compete successfully with our strength in distribution, established brand name, engineering capabilities, and renewed financial flexibility. Our principal competitors include Furuno, Garmin, Navico, Johnson Controls, as well as numerous smaller companies.
10
Surveillance
Our Surveillance segment focuses on providing enhanced vision and detection capabilities to a wide variety of military, paramilitary, law enforcement, public safety, and other government customers. Our systems typically provide the capability to see over long distances, day or night, through adverse weather conditions, through many obscurants, and from a wide variety of vehicle, man portable, and fixed installation platforms. Currently, the majority of our Surveillance infrared imaging systems use cooled detector technology to identify objects from long distances; however, uncooled thermal imaging systems are growing rapidly in certain markets such as weapon sights, hand-held monoculars/binoculars, military vehicles, and unmanned aerial vehicles. Many of our customers require systems that operate in demanding environments such as extreme climatic conditions, battlefield and military environments, or maritime conditions. Systems are often installed onto larger platforms and must be able to integrate with such other systems as aircraft avionics, radars, laser systems, command and control centers, and large, broad-based security networks.
Surveillance offers a very wide array of products across multiple applications. For airborne applications, we have developed highly stabilized platforms, known as gimbals, which typically contain multiple payloads in addition to the infrared imaging system, as well as sophisticated software and analytic capabilities. For land applications, we manufacture three types of products: hand-held products, platform mounted products, and targeting products. Platform mounted surveillance systems include imaging and radar solutions which are typically housed in a weather-tight enclosure and feature remote control capabilities and multi-sensor integration capability. Hand-held products are ruggedized and have optional lenses and target location capabilities. Ground-based targeting products are designed to attach to existing daylight sights to provide bore-sighted, nighttime capabilities. For maritime applications, we manufacture shipborne products which are similar to our airborne gimbals, but are inverted and customized for the marine environment.
We address our core markets through either a commercial, off-the-shelf (“COTS”) model or a commercially developed, military qualified (“CDMQ
®
”) model. The products we develop under the COTS model are applicable to a range of commercial and government customers and markets, including military applications. CDMQ products are specifically designed to meet military specifications. In both the COTS and CDMQ product development models, we use internally generated funds for research and development, and we generally own all rights to the products and their design.
|
Markets
|
|
|
Search and Rescue
|
Thermal imaging systems are used in airborne, shipborne, and land-based search and rescue missions to rescue individuals in danger, distress, wounded, or lost in adverse conditions. Such systems are in use today by organizations such as the United States Army, United States Coast Guard, the United States Marine Corps, the United States Air National Guard, and many international customers.
|
|
Force Protection
|
In instances where military or other personnel are deployed in hostile areas, thermal imaging systems mounted on towers or other platforms are deployed to identify and defeat potential threats at an early stage. Our systems are deployed for this purpose by the United States Army, United States Marine Corps, and others worldwide.
|
|
Border and Maritime Patrol
|
Our systems are used in airborne, shipborne, hand-held and fixed installation applications for border and maritime surveillance, particularly at night, to enforce borders and coastal waters, to monitor national fishing boundaries and to prevent smuggling. Our cameras are currently deployed along numerous borders worldwide, including in the United States, Europe and the Middle East.
|
|
Surveillance and Reconnaissance
|
Thermal imaging systems are used in surveillance and reconnaissance applications for the precise positioning of objects or people from substantial distances and for enhanced situational awareness, particularly at night or in conditions of reduced or obscured visibility. We also offer high-resolution frequency-modulated continuous wave radars that enable wide-area surveillance capable of detecting potential threats before they cross a perimeter. These systems can be installed on fixed platforms, manned mobile platforms, and unmanned aerial vehicles.
|
|
Airborne Law Enforcement
|
We are a leader in the supply of stabilized airborne thermal imaging systems for federal, state, and local law enforcement agencies. Agencies with this type of equipment have the ability to track suspects, locate lost persons, and provide situational awareness to officers on the ground.
|
|
Targeting
|
We offer several products that provide precise target location and designation capabilities in applications ranging from clip-on rifle scope devices to high-precision, stabilized, airborne laser designator systems.
|
|
Federal Drug Interdiction
|
Thermal imaging systems enable government agencies to expand their drug interdiction and support activities by allowing greater surveillance and detection capabilities. Our systems are in use by the United States Customs Service, the United States Drug Enforcement Agency and the United States Federal Bureau of Investigation, as well as by similar foreign government agencies.
|
Sales and Distribution
Our Surveillance business has a direct sales staff and a network of independent representatives and distributors covering major government markets worldwide. Included in this total are technical and customer support staff in the United States, Europe, the Middle East, and Asia Pacific who provide application development, technical training and operational assistance to direct and indirect sales personnel as well as to customers.
We enter into contracts and subcontracts which are subject to certain risks related to doing business with the United States government and may be subject to termination, reduction and/or amendment at the election of the United States government. For a discussion of these risks, see sections “We depend on the United States government for a material portion of our business and changes in government spending could adversely affect our business” and “As a United States government contractor, we are subject to a number of procurement rules and regulations” in Item 1A “Risk Factors.”
Surveillance typically has the highest backlog of our segments relative to revenue and in absolute terms. At
December 31, 2013
, Surveillance backlog totaled
$233 million
, compared with
$261 million
at
December 31, 2012
.
Customers
Surveillance customers generally consist of United States and foreign government agencies, including civilian, military, paramilitary, and police forces, as well as defense contractors and aircraft manufacturers. A substantial portion of our consolidated revenue is derived from sales to United States and foreign government agencies and our business will continue to be substantially dependent upon such sales. We expect revenue outside the United States to continue to account for a significant portion of our Surveillance revenue, but demand for our equipment is increasing rapidly outside the United States. The Surveillance segment is susceptible to some seasonality in its orders primarily based on the United States government budget year end. The result is that the third quarter tends to exhibit the largest amount of orders for our Surveillance segment. However, fiscal policy trends, budget delays, and general economic trends can overshadow this seasonality in any given year.
Competition
The Surveillance segment operates in highly competitive markets. Many of our competitors in the government sector are well established contractors for various governments and have more financial and other resources than we possess. The principal competitive factors in the government markets include technical innovation, agency relationships, product quality and reliability, price, and ability to deliver. We believe we compete successfully in these markets with our best-in-class technologies, our products’ abilities to outperform customer requirements and competitors’ products, our lower priced solutions that result from our commercial operating model, and our service and support functions that exist in the field and near the customer. Our current principal competitors in the Surveillance markets include divisions of BAE Systems, DRS (a Finmeccanica company), Elbit Systems, General Dynamics, L-3 Communications, Lockheed Martin, Raytheon, Sagem, Sofradir, and Thales.
Detection
Our Detection segment is a global supplier of field-ready products that accurately detect, classify and identify CBRNE threats. These products utilize mission-based user interfaces to expedite decision making for both field operators and advanced technicians. With advanced detection technologies that provide lab-quality confidence, the results are field-proven in third party tests and in real life missions. Customers around the world use our products for forensic analysis, military reconnaissance, force protection, public security, law enforcement, emergency response, environmental monitoring, building and event security, teaching and research.
Detection leverages an established technical research and development organization which enables the business to offer smart, simple and reliable products that meet the evolving needs of government and commercial security providers no matter where the mission may be. We design and manufacture the leading portable explosive detector, the smallest spectroscopic radiation detector and the first desktop trace detector to utilize next generation mass spectrometry technology. With significant experience in managing government-funded research and development projects, Detection has developed relationships with various government decision makers and has substantial knowledge of the governmental procurement process.
11
Markets
Government and private sectors continue to seek new ways to address increasingly sophisticated CBRNE terrorist threats and to respond to other security risks, natural disasters and unintentional incidents that threaten public safety. Our Detection segment designs, develops and manufactures multi-purpose products that meet the requirements for a broad range of end users and end uses. These products have allowed us to build a leadership position in the homeland security and defense market, while also positioning us to address new applications that include environmental monitoring, food safety, and narcotics detection.
Chemical threat detection instruments are used by various military, public and private organizations to quickly and accurately detect trace amounts of chemical warfare agents, illicit and synthetic drugs, volatile and semi-volatile organic compounds, toxic industrial chemicals and environmental pollutants. We offer both indoor and outdoor biological air monitors that are used by various governmental agencies for security at facilities and events. Our explosives detection products are used to identify military-grade explosives and homemade explosive devices in a wide array of military and public safety applications, such as screening high-risk individuals at checkpoints and identifying improvised explosive device (IED) makers, and our radiation products protect the public by warning of radionuclide exposure.
Sales and Distribution
Detection sells our products worldwide primarily through a combination of a direct sales force and certain distributors but also utilizes third-party sales representatives, value-added resellers, and systems integrators. With a centralized sales organization and specialized sales teams that serve specific markets, we have been successful at building and leveraging strong relationships with key decision makers at various government agencies and commercial entities. Some Detection products are designed as components or sub-systems that are incorporated into third party products or systems.
Detection derives a portion of its revenue, approximately 27 percent in
2013
, from funding received from agencies of the United States government pursuant to research projects. The revenue recognized under these contracts represents reimbursement by the customer for time periods ranging from several months to several years. Our participation in these and other development programs has culminated in the development of a number of commercial products. In general, our contracts with the United States government permit us to retain all rights to patents emerging from the funded research and development.
At
December 31, 2013
, Detection had a total backlog of
$19 million
. Backlog represents orders that have been received for products, contract research and development, or other services for which a contractual agreement is in place and delivery or performance is expected to occur within twelve months.
Customers
Detection sells its products, systems, and services to a broad base of federal, state and local government customers, to all branches of the United States military, foreign militaries, and to private sector businesses and commercial ports both in the United States and internationally. Utilizing a regionally-deployed sales force, the business sells to agencies of the United States government, such as the Departments of Homeland Security, Defense, and Energy, as well as the Transportation Security Administration, the Federal Bureau of Investigation, NASA, the Secret Service, the Coast Guard, and agencies of multiple state and local governments in the United States. Similar to Surveillance, the Detection segment experiences some seasonality in its orders due to the United Stated government budget year end.
Competition
The markets in which Detection competes are dynamic and highly competitive. Success in these markets depends on our ability to develop new technologies to meet rapidly evolving customer needs, reduce production and development costs, integrate with third-party devices and systems, establish and foster relationships with key government and commercial customers, and recruit highly technical personnel. Detection competes in various markets with companies such as Agilent Technologies, Canberra Industries, Idaho Technologies, NUCSAFE, Safran, SAIC, Smiths Detection, Thermo Fisher Scientific, and United Technologies.
12
Integrated Systems
Integrated Systems provides product and platform integration and software solutions that enable adaptive systems to protect and secure borders, perimeters, and critical infrastructure. Integrated Systems utilizes an array of sensor technologies, such as radars, thermal imaging and visible light cameras, chemical detectors, radiation detectors, and command and control systems, provided by our other segments as well as from external parties, to create high value solutions for customers across the world. Integrated Solutions has expertise in creating systems that incorporate numerous sensors and making them work together to meet the often demanding requirements of government and commercial security providers.
Integrated Systems manufactures and markets several highly accurate mobile and fixed solutions for perimeter security and surveillance. The
Cerberus
TM
mobile unmanned towers, the MSC/MVSS mobile surveillance vehicle, and manned
SkyWatch
TM
towers are utilized for protecting borders, securing facilities, protecting forces, and safeguarding the public. These systems can be deployed in almost any environment and are fully networkable platform solutions that integrate various sensor suites, including infrared thermal or visible light cameras, ground surveillance radar, video motion detection, and unattended ground sensors.
Markets
Integrated Systems develops and manufactures platforms for various force protection, border security, surveillance, assessment, and incident response markets. Important markets include global military and border patrol and critical infrastructure markets such as airports, power and gas utilities, and harbors.
Sales and Distribution
Integrated Systems markets its solutions to customers through a direct sales force and through system integrators and prime contractors. This sales organization has been successful at selling established solutions to various customers across the world and has secured funded research and development projects with the United States government. These projects are strategically sought out and bid on with the intention that the technologies and solutions that are developed will later be sold to other customers on a commercial basis. In
2013
, approximately 55 percent of Integrated Systems revenue was derived from these contracted research projects. At
December 31, 2013
, Integrated Systems had a total backlog of
$41 million
, compared with
$71 million
at
December 31, 2012
.
Customers
Integrated Systems sells solutions to United States and foreign government customers, and to private sector customers that manage energy and power production, oil and gas production, commercial ports, and critical infrastructure. Integrated Systems has provided solutions to many United States government agencies, including the Department of Homeland Security, the Department of Defense, the Customs and Border Protection, the National Guard, the Federal Bureau of Investigation, NASA, the Secret Service, the National Park Service, domestic and foreign airports, as well as various state and local governments.
Competition
The diverse portfolio of solutions Integrated Systems is able to provide places the business in competition with a wide variety of companies in the homeland security, defense, and industrial sectors. Integrated Systems competes with diversified defense integrators, commercial security system integrators, and divisions of large technology companies, such as: Boeing, Cobham, Honeywell, L-3 Communications, Lockheed Martin, Northrup Grumman, Raytheon, SAIC, Cassidian, Telephonics, and Thales.
13
Technology and Capabilities
We use our expertise in product design, infrared imaging sensors, mass spectronomy, sensing material, optics, lasers, image processing, systems integration, and other technologies, to develop and produce sophisticated thermal, multi-sensor imaging, and threat detection systems. We integrate the following capabilities and disciplines into our manufacturing processes:
|
System Design and Integration
|
We have developed extensive competencies in the design and integration of numerous capabilities and payloads into integrated systems or sub-systems. Competencies such as stabilization, packaging and systems integration allow us to effectively combine a wide variety of technologies and payloads to design and manufacture complex systems to suit our customers’ needs.
|
|
Radiometry
|
Our ability to produce thermal imaging systems that can accurately measure temperature is critical in many of our thermography markets. We have demonstrated know-how in designing and producing systems that can measure temperature to within very precise tolerances while maintaining accuracy and stability over time and over a wide range of ambient temperatures. We believe our skills in this area, known as radiometry, offer an important competitive advantage over many of our competitors.
|
|
Mechanical Engineering
|
Our design and production of thermal imaging systems involves highly sophisticated mechanical engineering techniques, particularly in the design and assembly of the supporting structures for system components such as detector arrays, coolers, and optics. We also have expertise in designing stabilized assemblies used in our gimbal mounted products utilizing high fidelity electro-mechanical control, gyroscopes and electronic stabilization, and specialized optical control mechanisms.
|
|
Infrared Detector Design
Manufacturing |
We design and manufacture both cooled and uncooled infrared detector arrays, in high volumes and at low costs. We believe our uncooled vanadium oxide microbolometers and cooled detectors using indium antimonide and indium gallium arsenide are among the highest performing infrared detectors of their type available in the world. Internal design and manufacturing of detectors provides significant cost and engineering advantages compared with the use of third-party detectors.
|
|
Integrated Circuits and
Electronic Design |
We have significant electronic design capabilities across several specialized areas, including readout integrated circuit design, signal processing, image processing, and electronics integration. Our design expertise lies in the areas of reliability, low power consumption and extreme environmental survivability.
|
|
Sensing Materials
|
Our sensors use new materials with novel characteristics, such as innovative semiconductors, crystals, polymers, reagents, and other recently developed materials. Some materials are extraordinarily sensitive, responding to trace exposures of chemical compounds such as explosives, nerve agents, or biological proteins. Other materials respond to low-intensity radioactive emissions of electromagnetic energy, such as specific bands of infrared light. Many of these materials did not exist a few years ago or could not be sufficiently purified or economically assembled into functional structures.
|
|
Software Development
|
Software is an increasingly important aspect of our overall engineering and design activity. We offer networking capability, video analytics and other software and middleware inside many of our camera systems, and such applications are growing in importance. Our systems are also able to interface with many standard external software protocols.
|
|
Optical Design, Fabrication
and Coating |
We design and manufacture sophisticated infrared optics using materials such as silicon and germanium that are required to produce a thermal imaging system. This capability allows us to rapidly develop optics optimized for use with our cameras and avoid costs and delays associated with reliance on third-party optics suppliers. In 2013, we added the capability to produce wafer-level micro-optics at high volumes. We also have the ability to apply custom vapor deposited coatings to improve the transmission of the unique lens materials that are used in infrared systems.
|
|
Micro-Coolers
|
We manufacture some of the industry’s smallest, lightest and lowest power micro-coolers for use in cooling infrared detectors. Our coolers are especially effective in hand-held applications, where light weight and long battery life are essential.
|
|
Lasers and Laser Components
|
Many of our more sophisticated systems are increasingly being offered with various types of laser payloads, including pointers, illuminators, rangefinders and designators. We design and manufacture purpose-built laser rangefinders and designators for inclusion in some of our gimbaled systems. We also manufacture certain laser-related components for customers. Our 2011 acquisition of Aerius Photonics enhanced our ability to provide advanced laser components and sub-systems.
|
14
|
Tactical Platforms
|
With our acquisition of ICx Technologies, Inc. ("ICx) in 2010, we added the capability to develop and manufacture comprehensive and integrated solutions for surveillance, assessment, and response. These platform solutions draw from our Surveillance and Detection products, as well as products sourced outside of the Company. These unmanned and manned networkable mobile and vehicle mounted tower systems, branded under
Cerberus
TM
and
SkyWatch
TM
names, can be deployed in nearly any environment and have provided security at borders, at theme parks, for police and military forces, at national monuments, and at high profile events, both in the United States and internationally.
|
Research & Development
Our success has been and will continue to be substantially affected by our ability to innovate new products and technologies that both augment our existing offerings and create new avenues for growth. We strive to differentiate ourselves from our competition with our R&D capabilities. Our internally funded research and development expenses were
$147.7 million
,
$137.4 million
and
$147.2 million
in
2013, 2012 and 2011
, respectively. We intend to continue to have significant internal research and development expenses in the future to provide a continuing flow of innovative and high quality products to maintain and enhance our competitive position in each of our business segments. In addition to these internally-funded amounts, we have spent a declining amount on research and development projects that were reimbursed by government agencies or prime contractors pursuant to development contracts we undertook.
Proprietary Rights
Given our focus on being the innovation leader in our key markets, we have numerous pending and issued patents and trademarks, commercial and technical trade secrets and other intellectual property that are important for our success. We rely on a combination of patent, trademark, copyright, and trade secret laws, a strong Internet domain presence, confidentiality agreements, joint development agreements, and robust contractual provisions to protect our proprietary rights. Over the past several years we have intensified our efforts to protect and police our intellectual property from improper use and misappropriation. We will continue to actively develop our intellectual property and intend to emphasize initiatives that will further promote innovation and leadership in marketable technology. We cannot, however, be certain or give any assurance that we can secure patent or trademark protection on all our innovations, maintain our competitive advantage or that competitors will not develop similar or superior capabilities.
Manufacturing
We manufacture many of the critical components for our products, including but not limited to infrared detectors, gimbals, pan-tilts, optics and coatings, laser sub-systems and micro-coolers, and develop much of the necessary software and middleware for our systems. This vertical integration minimizes lead times, facilitates prompt delivery of our products, controls costs and ensures that these components satisfy our quality standards. We purchase other parts pre-assembled, including certain detectors, certain coolers and optics, circuit boards, cables and wire harnesses. These purchased and manufactured components are then assembled into finished systems and tested at one of our primary production facilities located in the United States, Sweden, Estonia, and Canada. Certain components and finished goods, especially many of our Raymarine and visual security products, are produced by contract manufacturers.
Our manufacturing operations are, from time to time, audited by certain OEM customers, which include several major aircraft manufacturers, and have been certified as meeting their quality standards. Substantially all of our manufacturing locations are either ISO 9001:2000 or :2008 certified with certain locations having higher certifications.
Customer Service
We maintain service facilities at many locations worldwide. Each of our service facilities has the capability to perform the complex calibrations required to service thermal imaging systems. We also maintain field service capabilities under the direction of our independent representatives or distributors in locations outside the United States.
Employees
As of
December 31, 2013
, we had 2,839 employees of which 1,665 were located in the United States and 1,174 were located outside of the United States. We have generally been successful in attracting highly skilled technical, marketing and management personnel. None of our employees in the United States are represented by a union or other bargaining group. Certain employees in Europe are represented by unions and workers councils whose contracts are subject to periodic renegotiations. We believe our relationships with our employees, unions and workers councils are good.
15
Environmental Matters
Our operations are subject to a variety of federal, state, local and foreign environmental laws and regulations relating to the discharge, treatment, storage, disposal and remediation of certain materials, substances and wastes used in our operations. We continually assess our obligations and compliance with respect to these requirements. We have also assessed the risk for environmental contamination for our various manufacturing facilities, including our acquired businesses and facilities and, where appropriate, have obtained indemnification from the sellers of those businesses and facilities.
We believe that our current operations are in substantial compliance will all existing applicable environmental laws and permits. Operating and maintenance costs associated with environmental compliance are a normal, recurring part of our operations. Historically, these costs have not been material.
Available Information
Our Internet website address is www.flir.com. This Report, Quarterly Reports on Form 10-Q, Current Reports on Form 8-K and amendments to those reports filed or furnished pursuant to Section 13 or 15(d) of the Securities Exchange Act of 1934 and other required filings are available through our Internet website as soon as reasonably practicable after we electronically file such material with, or furnish it to, the Securities and Exchange Commission. Our Internet website and the information contained therein or connected thereto are not intended to be incorporated into this Report.
16
|
ITEM 1A.
|
RISK FACTORS
|
The following are important factors that could cause actual results or events to differ materially from those contained in any forward-looking statements made by or on behalf of the Company. If we are unable to adequately respond to these risks and uncertainties, our business, financial condition and results of operations could be materially adversely affected. Additionally, we cannot be certain or give any assurance that any actions taken to reduce known risks and uncertainties will be effective.
General economic conditions may adversely affect our business, operating results and financial condition
Our operations and performance depend significantly on worldwide economic conditions and their impact on levels of capital investment and consumer spending. Economic factors that could adversely influence demand for the Company’s products include uncertainty about global economic conditions leading to reduced levels of investment, changes in government spending levels and/or priorities, the size and availability of government budgets, customers’ and suppliers’ access to credit, consumer confidence and other macroeconomic factors affecting government, industrial or consumer spending behavior.
In recent years, our performance has been negatively impacted by reduced spending by United States government agencies, global economic weakness, and the Eurozone crisis. Continuation of the conditions that led to reduced spending and potential further reductions in spending globally by either consumers or government agencies could have a material adverse effect on our business, financial condition and results of operations.
Our primary markets are volatile and unpredictable
Our business depends on the demand for our products and solutions in a variety of commercial, industrial and government markets. In the past, the demand for our products in these markets has fluctuated due to a variety of factors, some of which are beyond our control, including:
|
•
|
the timing, number and size of orders from, and shipments to, our customers, as well as the relative mix of those orders;
|
|
•
|
variations in the volume of orders for a particular product or product line in a particular quarter;
|
|
•
|
the size and timing of new contract awards;
|
|
•
|
the timing of the release of government funds for procurement of our products; and
|
|
•
|
the timing of orders and shipments within a given fiscal quarter.
|
Seasonal fluctuations in our operating results result from:
|
•
|
the seasonal p
attern of contracting by the United States government and certain foreign governments;
|
|
•
|
the desire of customers to take delivery of equipment prior to fiscal year ends due to funding considerations; and
|
|
•
|
the tendency of com
mercial enterprises to fully utilize annual capital budgets prior to expiration.
|
We depend on the United States government for a material portion of our business and changes in government spending could adversely affect our business
We derive significant revenue from contracts or subcontracts funded by United States government agencies. A significant reduction in the purchase of our products by these agencies or contractors for these agencies would have an adverse effect on our business. For the fiscal years ended
December 31, 2013
,
2012
and
2011
, approximately
24 percent
,
27 percent
and
29 percent
, respectively, of our revenues were derived directly or indirectly from sales to the United States government and its agencies. The funding of contracts awarded to us depends on the overall United States government budget and appropriations process, which is beyond our control. In addition, at its discretion, the United States government may change its spending priorities and/or terminate, reduce or modify contracts.
Substantial uncertainty exists in the spending levels and priorities of the United States government, particularly with respect to military expenditures. Continued and further reductions in military spending could have a material adverse effect on our results from operations.
As a United States government supplier, we are subject to a number of procurement rules and regulations
Government contractors must comply with specific procurement regulations and other requirements and are subject to routine audits and investigations by United States government agencies. If we fail to comply with these rules and regulations, the results could include: reductions in the value of contracts; contract modifications or termination; the assessment of penalties and fines; and/or suspension or debarment from United States government contracting or subcontracting for a period of time or permanently.
17
Our future success will depend on our ability to respond to the rapid technological change in the markets in which we compete, our ability to introduce new or enhanced products and enter into new markets
The markets in which we compete are characterized by rapid technological developments and frequent new product introductions, enhancements and modifications. Our ability to develop new products and technologies that anticipate changing customer requirements, reduce costs and otherwise retain or enhance our competitive position in existing and new markets will be an important factor in our future results from operations. We will continue to make substantial capital expenditures and incur significant research and development costs to improve our manufacturing capability, reduce costs, and develop and introduce new products and enhancements. If we fail to develop and introduce new products and technologies in a timely manner, our business, financial condition and results of operations would be adversely affected. In addition, we cannot be certain that our new products and technologies will be successful or that customers will accept any of our new products.
We must successfully manage an increasingly complex global organization
As we have grown, the size and scope of our worldwide operations have also increased substantially. We currently design, manufacture and market numerous product lines in locations worldwide. Significant management time and effort is required to effectively manage the increased complexity of the business and our failure to successfully do so could have a material adverse effect on our business, financial condition and results of operations. Our inability to continue to manufacture our products at one or more of our facilities as a result of, for example, a prolonged power outage, earthquake, fire or other natural disaster, or labor or political unrest, could prevent us from supplying products to our customers and could have a material adverse effect on our business, financial condition and results of operations.
We face risks from international sales and business activities
We market and sell our products worldwide and international sales have accounted for, and are expected to continue to account for, a significant portion of our revenue. For the years ended
December 31, 2013
,
2012
and
2011
, international sales accounted for
50 percent
,
49 percent
and
48 percent
, respectively, of our total revenue. We also manufacture certain products and subassemblies in Europe and we have several contract manufacturing agreements with third parties in Europe and in Asia. Our international business activities are subject to a number of risks, including:
|
•
|
the impositi
on of and changes to governmental controls;
|
|
•
|
restrictions on the export of critical technology;
|
|
•
|
trade restrictions;
|
|
•
|
difficulty in collecting receivables;
|
|
•
|
inadequate protection of intellectual property;
|
|
•
|
labor union activities;
|
|
•
|
changes in tariffs and taxes;
|
|
•
|
restrictions on repatriation of earnings;
|
|
•
|
restriction on the importation and exportation of goods and services;
|
|
•
|
failure to comply with anti-bribery and anti-corruption laws;
|
|
•
|
difficulties in staffing and managing international operations; and
|
|
•
|
political and econ
omic instability.
|
No assurance can be given that these factors will not have a material adverse effect on our future international sales and operations and, consequently, on our business, financial condition and results of operations.
Operating margins may be negatively impacted by reduction in sales or by a change in the mix of products sold
Our expense levels are based, in part, on our expectations regarding future sales and these expenses are largely fixed in the short term. Some expenses, such as those related to research and development activities, would likely be maintained in the event of a sales downturn in order to maintain and enhance the long-term competitiveness of the Company. We maintain inventories of finished goods, components and raw materials at levels we believe are necessary to meet anticipated sales. Accordingly, we may not be able to reduce our costs in a timely manner to compensate for any unexpected shortfall between forecasted and actual sales. Any significant shortfall of sales may result in us carrying higher levels of inventories of finished goods, components and raw materials thereby increasing our risk of inventory obsolescence and corresponding inventory write-downs and write-offs. Our fixed costs, including facilities and information technology costs, compliance and public company costs, and depreciation and amortization related to previous acquisitions and capital expenditures, are significant and are difficult to reduce in the short term. Our operating margins vary by product and substantial changes in the mix of products sold could also have a negative impact on our operating margins.
18
Competition in our markets is intense and our failure to compete effectively could adversely affect our business
Competition in the markets for our products is intense. The speed with which companies can identify new applications for thermal imaging, develop products to meet those needs and supply commercial quantities at low prices to the market are important competitive factors. We believe the principal competitive factors in our markets are product performance, price, customer service and training, product reputation, and effective marketing and sales efforts. Many of our competitors have greater financial, technical, research and development, and marketing resources than we do. All of these factors, as well as the potential for increased competition from new market entrants, require us to continue to invest in, and focus on, research and development and new product innovation. No assurance can be given that we will be able to compete effectively in the future and a failure to do so could have a material adverse effect on our business, financial condition and results of operations.
Our future success depends in part on attracting and retaining key senior management and qualified technical, sales and other personnel
Our future success depends in part on the efforts and continued services of our key executives and our ability to attract and retain qualified technical, sales and other personnel. Significant competition exists for such personnel and we cannot assure the retention of our key executives, technical and sales personnel or our ability to attract, integrate and retain other such personnel that may be required in the future. We cannot assure that employees will not leave and subsequently compete against us. If we are unable to attract and retain key personnel, our business, financial condition and results of operations could be adversely affected.
We may be unable to successfully integrate recent or future acquisitions into our operations, thereby disrupting our business and harming our financial condition and results of operations
We have made thirteen acquisitions of various sizes in the past five years. The integration of businesses, personnel, product lines and technologies can be difficult, time consuming and subject to significant risks. For example, we could lose key personnel from companies that we acquire, incur unanticipated costs, lose major sources of revenue, fail to integrate critical technologies, suffer business disruptions, fail to capture anticipated synergies, fail to establish satisfactory internal controls, or incur unanticipated liabilities. Any of these difficulties could disrupt our ongoing business, distract our management and employees, increase our expenses and decrease our revenue.
We frequently evaluate strategic opportunities available to us and it is likely that we will make additional acquisitions in the future. Such acquisitions may vary in size and complexity. Any future acquisitions are subject to the risks described above. Furthermore, we might assume or incur additional debt or issue additional equity securities to pay for future acquisitions. Additional debt may negatively impact our results and increase our financial risk, and the issuance of any additional equity securities could dilute our then existing shareholders’ ownership. No assurance can be given that we will realize anticipated benefits of any future acquisitions, or that any such acquisition or investment will not have a material adverse effect on our business, financial condition and results of operations.
We may experience impairment in the value of our tangible and intangible assets
Our industry is subject to rapid changes in technology, which may result in unexpected obsolescence or impairment of our assets. As of
December 31, 2013
, our intangible assets, including goodwill, totaled
$729.9 million
and represented
31 percent
of our total assets. Most of these intangibles are the result of acquisitions in which the purchase price exceeded the value of the tangible assets acquired. We amortize certain of these intangibles over their anticipated useful life and review goodwill for impairment annually or more frequently if warranted by events. To date we have not experienced any impairment of our intangible assets, but there can be no assurance that we will not experience such impairment in the future. In addition, certain of our tangible assets such as inventory and machinery and equipment may experience impairment in their value as a result of such events as the introduction of new products, changes in technology or changes in customer demand patterns. We depreciate our machinery and equipment at levels we believe are adequate; however, there can be no assurance that there will not be a future impairment that may have a material impact on our business, financial condition and results of operations.
We face risks from currency fluctuations
Historically, currency fluctuations have affected our operating results. Changes in the value of foreign currencies in which our sales or costs incurred are denominated have in the past caused, and could in the future cause, fluctuations in our operating results. We seek to reduce our exposure to currency fluctuations by denominating, where possible, our international sales in United States dollars, by balancing expenses and revenues in various currencies and by undertaking limited hedging of forecasted currency exposures. With respect to international sales denominated in United States dollars, a decrease in the value of foreign currencies relative to the United States dollar could make our products less price competitive.
19
Our inability to protect our intellectual property and proprietary rights and avoid infringing the rights of others could harm our competitive position and our business
Our ability to compete successfully and achieve future revenue growth depends, in part, on our ability to protect our proprietary technology and operate without infringing the rights of others. To accomplish this, we rely on a combination of patent, trademark, copyright and trade secret laws, confidentiality agreements and contractual provisions to protect our proprietary rights. Many of our proprietary rights are held in confidence as trade secrets and are not covered by patents, making them more difficult to protect. Although we currently hold world-wide patents covering certain aspects of our technologies and products, and we are actively pursuing additional patents, we cannot be certain that we will obtain additional patents or trademarks on our technology, products and trade names. Furthermore, we cannot be certain that our patents or trademarks will not be challenged or circumvented by our competitors or that measures taken by us to protect our proprietary rights will adequately deter their misappropriation or disclosure. Any failure by us to meaningfully protect our intellectual property could have a material adverse effect on our business, financial condition and results of operations. Moreover, because intellectual property does not necessarily prevent our competitors from entering the markets we serve, there can be no assurance that we will be able to maintain our competitive advantage or that our competitors will not develop capabilities equal or superior to ours.
Litigation over patents and other intellectual property is common in our industry. We have been the subject of patent and other intellectual property litigation in the past and cannot be sure that we will not be subject to such litigation in the future. Similarly, there exists the possibility we will assert claims in litigation to protect our intellectual property. Lawsuits defending or prosecuting intellectual property claims and related legal and administrative proceedings could result in substantial expense to us and significant diversion of effort of our personnel. An adverse determination in a patent suit or in any other proceeding in which we are a party could subject us to significant liabilities, result in the loss of intellectual property rights we claim or impact our competitive position. Additionally, an adverse determination could require us to seek licenses from third parties. If such licenses are not available on commercially reasonable terms or at all, our business, financial condition and results of operations could be adversely affected.
We may not be successful in obtaining the necessary export licenses to conduct operations abroad and the United States government may prevent proposed sales to foreign governments and customers
Export licenses are required from United States government agencies under the Export Administration Act, the Trading with the Enemy Act of 1917 and the Arms Export Control Act of 1976 for export of many of our products. We can give no assurance that we will be successful in obtaining these licenses. In the aftermath of 9/11, heightened government scrutiny of export licenses for products in our markets has resulted in lengthened review periods for our license applications. Failure to obtain or delays in obtaining these licenses would prevent or delay us from selling our products outside the United States and could have a material adverse effect on our business, financial condition and results of operations.
We rely on information systems, electronic communication systems, internal and external data and application software in our operations. Systems failures, security breaches, and other disruptions, whether internal or external, could have an adverse effect on our business and results of operations
The efficient operation of our business is dependent on computer hardware, software, and communication systems. Even the most well protected information systems are vulnerable to systems failures. Such failures could be caused by internal or external events such as incursions by intruders or hackers, computer viruses, power outages or cyber terrorists. We are particularly mindful of these risks because we believe the technologies we have developed or acquired are attractive to third parties. The unavailability of the information systems, the failure of these systems to perform as anticipated for any reason, or any significant breach of security could disrupt our business and result in numerous effects, including reduced effectiveness and efficiency of our operations, increased overhead costs, and the loss or compromise of important information or data, causing our reputation, business, and results of operations to be adversely affected.
Our products may suffer from defects or errors leading to substantial product liability, damage or warranty claims
We include complex system designs and components in our products that may contain errors or defects, particularly when we incorporate new technology into our products or release new versions. If any of our products are defective, we might be required to redesign or recall those products or pay substantial damages or warranty claims. Such an event could result in significant expenses including expenses arising from product liability and warranty claims, disrupt sales and affect our reputation and that of our products, which could have a material adverse effect on our business, financial condition and results of operations. As we expand our presence into new markets, we may face increased exposure to product liability claims. We maintain product liability insurance but cannot be certain that it will be sufficient or will continue to be available on acceptable terms.
20
We have indebtedness as a result of the issuance of our 3.75 percent senior unsecured notes (the “Notes”) and borrowings against our $150 million term loan, and we are subject to certain restrictive covenants under our unsecured credit facility and the indenture governing the Notes which may limit our operational and financial flexibility
Our ability to meet our debt service obligations and comply with the financial covenants under our credit facility will be dependent upon our future performance, which will be subject to financial, business and other factors affecting our operations, many of which are beyond our control. Our inability to meet our debt service obligations or comply with the required covenants could result in a default under the credit facility or indenture. In the event of any such default, under the credit facility, the lenders thereunder could elect to declare all outstanding debt, accrued interest and fees under the facility to be due and immediately payable. In the event of any such default under our indenture, either the trustee or the holders of at least 25 percent of the outstanding principal amount of the Notes could declare the principal amount of all of the Notes to be due and payable immediately.
Changes in our effective income tax rate may have an adverse effect on our results of operations
Our future effective tax rate may be adversely affected by a number of factors including:
|
•
|
the jurisdictions
in which profits are determined to be earned and taxed;
|
|
•
|
the resolution of issues arising from tax audits with various tax authorities;
|
|
•
|
changes in the valuation of our deferred tax assets and liabilities;
|
|
•
|
adjustments to estimated taxes upon finalization of various tax returns;
|
|
•
|
increases in expenses not deductible for tax purposes;
|
|
•
|
changes in available tax credits;
|
|
•
|
changes in share-based compensation expense;
|
|
•
|
changes in tax laws or the interpretation of such tax laws and changes in generally accepted accounting principles;
|
|
•
|
changes in foreign tax rates or agreed upon foreign taxable base; and/or
|
|
•
|
the repatriation of
earnings from outside the United States for which we have not previously provided for United States taxes.
|
Any significant increase in our future effective tax rates could adversely impact net income for future periods. In addition, the United States Internal Revenue Service (“IRS”) and other tax authorities regularly examine our income tax returns. Our financial condition and results of operations could be adversely impacted if any assessments resulting from the examination of our income tax returns by the IRS or other taxing authorities are not resolved in our favor.
State of Oregon law and our charter documents contain provisions that could discourage or prevent a potential takeover, even if the transaction would benefit our shareholders
Other companies may seek to acquire or merge with us. An acquisition or merger of our Company could result in benefits to our shareholders, including an increase in the value of our common stock. Some provisions of our Articles of Incorporation and Bylaws, including our ability to issue preferred stock without further action by our shareholders, as well as provisions of the State of Oregon law, may discourage, delay or prevent a merger or acquisition that a shareholder may consider favorable.
None.
21
At
December 31, 2013
, we conducted manufacturing, research and development, and sales and administration in
80
facilities world-wide. Of these, we owned
7
facilities with approximately
683 thousand
square feet and leased
23
facilities with approximately
613 thousand
square feet in the United States, and we owned
7
facilities with approximately
375 thousand
square feet and leased
43
facilities with approximately
228 thousand
square feet outside the United States, primarily in Europe. Our headquarters is located in Wilsonville, Oregon.
Our major facilities include the following locations:
|
Location
|
Owned
|
Leased
|
|||
|
|
(Square feet in Thousands)
|
||||
|
Wilsonville (Portland), Oregon
|
154
|
|
—
|
|
|
|
Taby (Stockholm), Sweden
|
205
|
|
—
|
|
|
|
North Billerica (Boston), Massachusetts
|
133
|
|
—
|
|
|
|
Goleta (Santa Barbara), California
|
169
|
|
137
|
|
|
|
Nashua, New Hampshire
|
140
|
|
—
|
|
|
|
Elkridge (Baltimore), Maryland
|
—
|
|
155
|
|
|
|
Fareham (Portsmouth), United Kingdom
|
63
|
|
—
|
|
|
|
Other
|
194
|
|
549
|
|
|
|
Total
|
1,058
|
|
841
|
|
|
Our reportable segments operate out of facilities as follows:
Thermal Vision and Measurement: Taby, Sweden; Goleta, California; Nashua, New Hampshire; and 6 facilities in the United States and 30 facilities located outside the United States.
Raymarine: Fareham, UK and 3 facilities in the United States and 13 facilities located outside the United States.
Surveillance: Wilsonville, Oregon; North Billerica, Massachusetts; Taby, Sweden; and 9 facilities in the United States and 4 facilities located outside the United States.
Detection: 6 facilities in the United States.
Integrated Systems: Elkridge, Maryland and 2 facilities in the United States and 4 facilities located outside the United States.
We believe all of our properties are suitable for their intended use, adequate to meet our current and near-term business needs, and in good condition. We do not anticipate difficulty in renewing existing leases as they expire or in finding alternative facilities.
|
ITEM 3.
|
LEGAL PROCEEDINGS
|
The Company and its subsidiary, Indigo Systems Corporation (now known as FLIR Commercial Systems, Inc.) (together, the “FLIR Parties”), were named in a lawsuit filed by Raytheon Company (“Raytheon”) on March 2, 2007, in the United States District Court for the Eastern District of Texas. Raytheon's complaint, as amended, asserted claims for tortious interference, patent infringement, trade secret misappropriation, unfair competition, breach of contract and fraudulent concealment. The FLIR Parties filed an answer to the complaint on September 2, 2008, in which they denied all material allegations. On August 31, 2009, the court entered an order granting the FLIR Parties' motion for summary judgment on Raytheon's trade secret misappropriation claim based on the FLIR Parties' statute of limitations defense. Raytheon abandoned all of its other claims except its claims relating to four patents (the “Patent Claims”). On August 11, 2010, the FLIR Parties and Raytheon entered into an agreement in principle to resolve the remaining Patent Claims, which resulted in a payment of $3 million by the FLIR Parties to Raytheon and entitles the FLIR Parties to certain license rights in the patents that were the subject of the Patent Claims. The parties appealed certain rulings of the District Court to the United States Court of Appeals for the Federal Circuit which on August 1, 2012, reversed the judgment of the District Court and remanded the case for further proceedings consistent with the appellate court's opinion. The Company intends to vigorously defend itself in this matter and is unable to estimate the amount or range of potential loss, if any, which might result if the outcome in this matter is unfavorable.
We are also subject to other legal proceedings, claims and litigation arising in the ordinary course of business. We make a provision for a liability when it is both probable that a liability has been incurred and the amount of loss can be reasonably estimated. We believe we have recorded adequate provisions for any probable and estimable losses. While the outcome of such matters is currently not determinable, we do not expect that the ultimate costs to resolve these matters will have a material adverse effect on our financial position, results of operations or cash flows.
|
ITEM 4.
|
MINE SAFETY DISCLOSURES
|
Not Applicable.
22
|
ITEM 5.
|
MARKET FOR REGISTRANT’S COMMON EQUITY, RELATED STOCKHOLDER MATTERS AND ISSUER PURCHASES OF EQUITY SECURITIES
|
The common stock of the Company has been traded on the NASDAQ Global Market since June 22, 1993, under the symbol “FLIR.” The following table sets forth, for the quarters indicated, the high and low closing sales price for our common stock as reported on the NASDAQ Global Select Market, a segment of the NASDAQ Global Market.
|
|
2013
|
2012
|
|||||||||||||
|
|
High
|
Low
|
High
|
Low
|
|||||||||||
|
First Quarter
|
$
|
27.00
|
|
$
|
23.08
|
|
$
|
26.81
|
|
$
|
24.56
|
|
|||
|
Second Quarter
|
26.97
|
|
23.53
|
|
25.07
|
|
19.06
|
|
|||||||
|
Third Quarter
|
33.75
|
|
27.25
|
|
21.17
|
|
18.33
|
|
|||||||
|
Fourth Quarter
|
33.17
|
|
28.17
|
|
22.32
|
|
18.97
|
|
|||||||
At
December 31, 2013
, there were approximately
105
holders of record of our common stock and
140,782,206
shares outstanding. On February 9, 2011, we announced the adoption of a dividend policy under which we began to pay quarterly cash dividends for the first time in our history. During the year ended
December 31, 2012
, we paid dividends quarterly at the rate of
$0.07
per share for a total of
$42.5 million
. During the year ended
December 31, 2013
, we paid dividends quarterly at the rate of
$0.09
per share for a total of
$51.4 million
. On February 7, 2014, we announced an increase of our quarterly dividend to
$0.10
per share. We currently intend to continue to pay cash dividends to holders of our common stock for the foreseeable future, but such payment remains at the discretion of the Board of Directors and will depend upon many factors, including our financial condition, earnings, and other factors the Board of Directors deems relevant.
The graph below shows a comparison of the five-year cumulative total shareholder return for the Company’s common stock with the cumulative total returns on the Standard & Poor’s (“S&P”) 500 Index and the S&P 500 Electronic Equipment & Instruments Index for the same five-year period. The data used for this graph assumes that $100 was invested in the Company and in each index on December 31,
2008
, and that all dividends were reinvested.
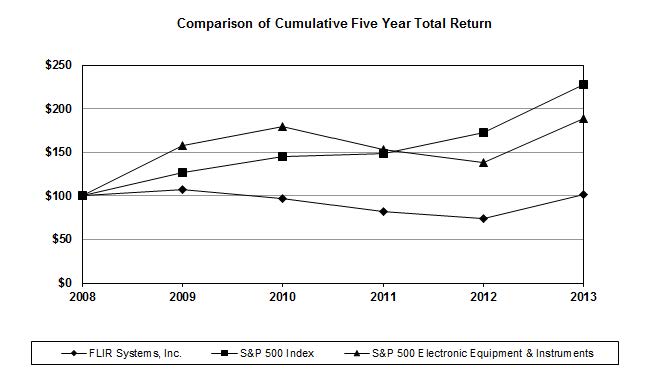
The stock performance graph was plotted using the following data:
|
Dec 08
|
Dec 09
|
Dec 10
|
Dec 11
|
Dec 12
|
Dec 13
|
||||||||||||||||||
|
FLIR Systems, Inc.
|
$
|
100.00
|
|
$
|
106.68
|
|
$
|
96.97
|
|
$
|
82.42
|
|
$
|
74.33
|
|
$
|
101.56
|
|
|||||
|
S&P 500 Index
|
100.00
|
|
126.46
|
|
145.51
|
|
148.59
|
|
172.37
|
|
228.19
|
|
|||||||||||
|
S&P 500 Electronic Equipment & Instruments Index
|
100.00
|
|
157.52
|
|
179.80
|
|
152.82
|
|
137.79
|
|
188.31
|
|
|||||||||||
23
During 2013, we repurchased approximately
6.0 million
shares for a total of approximately
$162.1 million
. The following table summarizes our
2013
common stock repurchase activities:
|
Period
|
Total Number of Shares Purchased
|
Average Price Paid per Share
|
Total Number of Shares Purchased as Part of Publicly Announced Plans or Programs
|
Maximum Number of Shares that May Yet Be Purchased at December 31, 2013 Under the Plans or Programs
|
||||||||
|
February 1 to February 28, 2013
|
1,250,000
|
|
$
|
26.69
|
|
1,250,000
|
|
|||||
|
March 1 to March 31, 2013
|
2,599,780
|
|
$
|
25.99
|
|
2,599,780
|
|
|||||
|
April 1 to April 30, 2013
|
285,741
|
|
$
|
25.99
|
|
285,741
|
|
|||||
|
June 1 to June 30, 2013
|
350,000
|
|
$
|
24.20
|
|
350,000
|
|
|||||
|
August 1 to August 31, 2013
|
500,000
|
|
$
|
32.44
|
|
500,000
|
|
|||||
|
November 1 to November 30, 2013
|
874,704
|
|
$
|
28.89
|
|
874,704
|
|
|||||
|
December 1 to December 31, 2013
|
127,996
|
|
$
|
29.40
|
|
127,996
|
|
|||||
|
Total
|
5,988,221
|
|
$
|
27.07
|
|
5,988,221
|
|
19,011,779
|
|
|||
All share repurchases are subject to applicable securities laws, and are at times and in amounts as management deems appropriate. All shares of our common stock repurchased in
2013
were repurchased under authorization by our Board of Directors, granted on February 6, 2013, pursuant to which we were authorized to repurchase up to 25.0 million shares of our outstanding common stock in the open market or through privately negotiated transactions. This authorization will expire on February 6, 2015.
24
The following selected financial data should be read in conjunction with Item 7 “Management’s Discussion and Analysis of Financial Condition and Results of Operations” and Item 8 “Financial Statements and Supplementary Data.”
|
|
Year Ended December 31,
|
|||||||||||||||||||
|
|
2013
|
2012
(as adjusted)
(1)
|
2011
(as adjusted)
(1)
|
2010
|
2009
|
|||||||||||||||
|
|
(in thousands, except per share amounts)
|
|||||||||||||||||||
|
Statement of Income Data:
|
||||||||||||||||||||
|
Revenue
|
$
|
1,496,372
|
|
$
|
1,405,358
|
|
$
|
1,544,062
|
|
$
|
1,388,437
|
|
$
|
1,147,087
|
|
|||||
|
Cost of goods sold
|
759,362
|
|
670,174
|
|
714,743
|
|
624,796
|
|
488,558
|
|
||||||||||
|
Gross profit
|
737,010
|
|
735,184
|
|
829,319
|
|
763,641
|
|
658,529
|
|
||||||||||
|
Operating expenses:
|
||||||||||||||||||||
|
Research and development
|
147,696
|
|
137,354
|
|
147,177
|
|
116,635
|
|
91,301
|
|
||||||||||
|
Selling, general and administrative
|
322,739
|
|
292,500
|
|
368,947
|
|
(2
|
)
|
286,695
|
|
219,941
|
|
||||||||
|
Restructuring expenses
|
25,832
|
|
2,000
|
|
—
|
|
—
|
|
—
|
|
||||||||||
|
Total operating expenses
|
496,267
|
|
431,854
|
|
516,124
|
|
403,330
|
|
311,242
|
|
||||||||||
|
Earnings from operations
|
240,743
|
|
303,330
|
|
313,195
|
|
360,311
|
|
347,287
|
|
||||||||||
|
Interest expense
|
14,091
|
|
11,659
|
|
5,487
|
|
2,884
|
|
6,882
|
|
||||||||||
|
Interest income
|
(1,058
|
)
|
(1,582
|
)
|
(1,273
|
)
|
(1,258
|
)
|
(1,749
|
)
|
||||||||||
|
Other expense (income), net
|
(1,276
|
)
|
1,341
|
|
(2,098
|
)
|
(4,015
|
)
|
1,761
|
|
||||||||||
|
Earnings from continuing operations before income taxes
|
228,986
|
|
291,912
|
|
311,079
|
|
362,700
|
|
340,393
|
|
||||||||||
|
Income tax provision
|
51,971
|
|
66,556
|
|
88,427
|
|
114,326
|
|
110,180
|
|
||||||||||
|
Earnings from continuing operations
|
177,015
|
|
225,356
|
|
222,652
|
|
248,374
|
|
230,213
|
|
||||||||||
|
Loss from discontinued operations, net of tax
|
—
|
|
(2,958
|
)
|
(1,178
|
)
|
(248
|
)
|
—
|
|
||||||||||
|
Net earnings
|
$
|
177,015
|
|
$
|
222,398
|
|
$
|
221,474
|
|
$
|
248,126
|
|
$
|
230,213
|
|
|||||
|
Basic earnings per share:
|
||||||||||||||||||||
|
Continuing operations
|
$
|
1.24
|
|
$
|
1.49
|
|
$
|
1.41
|
|
$
|
1.59
|
|
$
|
1.54
|
|
|||||
|
Discontinued operations
|
—
|
|
(0.02
|
)
|
(0.01
|
)
|
(0.00
|
)
|
—
|
|
||||||||||
|
Basic earnings per share
|
$
|
1.24
|
|
$
|
1.47
|
|
$
|
1.40
|
|
$
|
1.59
|
|
$
|
1.54
|
|
|||||
|
Diluted earnings per share:
|
||||||||||||||||||||
|
Continuing operations
|
$
|
1.22
|
|
$
|
1.47
|
|
$
|
1.38
|
|
$
|
1.54
|
|
$
|
1.45
|
|
|||||
|
Discontinued operations
|
—
|
|
(0.02
|
)
|
(0.01
|
)
|
(0.00
|
)
|
—
|
|
||||||||||
|
Diluted earnings per share
|
$
|
1.22
|
|
$
|
1.45
|
|
$
|
1.38
|
|
$
|
1.54
|
|
$
|
1.45
|
|
|||||
|
_______________
|
||||||||||||||||||||
|
(1) Certain expenses have been reclassified to conform to the presentation for the year ended December 31, 2013. See Note 1 to the Consolidated Financial Statements in Item 8 for additional information.
|
||||||||||||||||||||
|
(2) Selling, general and administrative expenses for 2011 include the payment of a $39.0 million litigation settlement. See Note 13 to the Consolidated Financial Statements in Item 8 for additional information.
|
||||||||||||||||||||
|
|
December 31,
|
|||||||||||||||||||
|
|
2013
|
2012
(as adjusted)
(3)
|
2011
|
2010
|
2009
|
|||||||||||||||
|
|
(in thousands)
|
|||||||||||||||||||
|
Balance Sheet Data:
|
||||||||||||||||||||
|
Working capital
|
$
|
1,033,216
|
|
$
|
923,679
|
|
$
|
1,000,339
|
|
$
|
703,100
|
|
$
|
793,142
|
|
|||||
|
Total assets
|
2,343,359
|
|
2,190,655
|
|
2,149,114
|
|
1,859,806
|
|
1,494,544
|
|
||||||||||
|
Short-term debt
|
15,064
|
|
374
|
|
136
|
|
131
|
|
19
|
|
||||||||||
|
Long-term debt, excluding current portion
|
372,528
|
|
248,319
|
|
247,861
|
|
—
|
|
57,992
|
|
||||||||||
|
Total shareholders’ equity
|
1,613,380
|
|
1,599,901
|
|
1,579,029
|
|
1,522,548
|
|
1,203,749
|
|
||||||||||
|
Other Financial Data:
|
||||||||||||||||||||
|
Cash dividends declared per common share
|
$
|
0.36
|
|
$
|
0.28
|
|
$
|
0.24
|
|
$
|
—
|
|
$
|
—
|
|
|||||
|
______________
|
||||||||||||||||||||
|
(3) Adjusted for purchase price allocations of the acquisitions of Lorex Technology Inc. and Traficon International NV. See Note 18 to the Consolidated Financial Statements in Item 8 for additional information.
|
||||||||||||||||||||
25
|
ITEM 7.
|
MANAGEMENT’S DISCUSSION AND ANALYSIS OF FINANCIAL CONDITION AND RESULTS OF OPERATIONS
|
Overview
FLIR Systems, Inc. (“FLIR,” the “Company,” “we,” “us,” or “our”) is a world leader in sensor systems that enhance perception and awareness. We were founded in 1978 and have since become a premier designer, manufacturer, and marketer of thermal imaging and other sensing products and systems. Our advanced sensors and integrated sensor systems enable the gathering and analysis of critical information through a wide variety of applications in commercial, industrial, and government markets worldwide.
Our goal is to both enable our customers to benefit from the valuable information produced by advanced sensing technologies and to deliver sustained superior financial performance for our shareholders. We create value for our customers by providing advanced surveillance and tactical defense capabilities, improving personal and public safety and security, facilitating air, ground, and maritime navigation, enhancing enjoyment of the outdoors, providing infrastructure inefficiency information, conveying pre-emptive structural deficiency data, displaying process irregularities, and enabling commercial business opportunities through our continual support and development of new thermal imaging data and analytics applications. Our business model meets the needs of a multitude of customers – we sell off-the-shelf products to a wide variety of markets in an efficient, timely, and affordable manner as well as offer a variety of system configurations to suit specific customer requirements. Centered on the design of products for low cost manufacturing and high volume distribution, our commercial operating model has been developed over time and provides us with a unique ability to adapt to market changes and meet our customers’ needs.
Through December 31, 2013, our business was organized into two divisions: Commercial Systems and Government Systems. Within these divisions, we had five reporting segments: Thermal Vision & Measurement and Raymarine, which comprise the Commercial Systems division; and Surveillance, Detection and Integrated Systems, which make up our Government Systems division. For a more detailed description of our segments, see “Business Segments” within Item 1.
Effective January 1, 2014, we are realigning our business operations which is resulting in the elimination of our division structure and formation of six operating segments. This Management's Discussion and Analysis of Financial Condition and Results of Operations is prepared and reported based on our reporting structure as of December 31, 2013.
International revenue accounted for approximately
50 percent
,
49 percent
and
48 percent
of our revenue in
2013, 2012 and 2011
, respectively. We anticipate that international sales will continue to account for a significant percentage of revenue in the future. We have exposure to foreign exchange fluctuations and changing dynamics of foreign competitiveness based on variations in the value of the United States dollar relative to other currencies. Factors contributing to this variability include significant manufacturing activity in Europe, significant sales denominated in currencies other than the United States dollar, and cross currency fluctuations between such currencies as the United States dollar, euro, Swedish kronor and British pound sterling. The impact of those fluctuations is reflected throughout our consolidated financial statements, but in the aggregate, did not have a material impact on our results of operations.
We experience fluctuations in orders and sales due to seasonal variations and customer sales cycles, such as the seasonal pattern of contracting by the United States and certain foreign governments, the desire of customers to take delivery of equipment prior to fiscal year ends due to funding considerations, and the tendency of commercial enterprises to fully utilize annual capital budgets prior to expiration. Such events have resulted and could continue to result in fluctuations in quarterly results in the future. As a result of such quarterly fluctuations in operating results, we believe that quarter-to-quarter comparisons of our results of operations are not necessarily meaningful and should not be relied upon as indicators of future performance.
We expect that certain exogenous macroeconomic factors, including reduced spending by United States government agencies and economic weaknesses in certain geographic markets, present challenges for us and render predictions regarding future performance difficult to make.
Critical Accounting Policies and Estimates
This discussion and analysis of our financial condition and results of operations is based upon our consolidated financial statements, which have been prepared in accordance with United States generally accepted accounting principles. The preparation of these financial statements requires us to make estimates and judgments that affect the reported amounts of assets, liabilities, revenues and expenses, and related disclosure of contingent assets and liabilities. We evaluate our estimates, including those related to revenue recognition, bad debts, inventories, goodwill, warranty obligations, contingencies and income taxes on an on-going basis. We base our estimates on historical experience and on various other assumptions that are believed to be reasonable under the circumstances, the results of which form the basis for making judgments about the carrying value of assets and liabilities that are not readily apparent from other sources. Actual results may differ from these estimates under different assumptions or conditions. Senior management has discussed the development, selection and disclosure of these estimates with the Audit Committee of our Board of Directors. We believe the following critical accounting policies and the related judgments and estimates affect the preparation of our consolidated financial statements.
26
Revenue recognition.
The majority of our revenue is recognized upon shipment of the product to the customer at a fixed or determinable price and with a reasonable assurance of collection, passage of title to the customer as indicated by the shipping terms and fulfillment of all significant obligations.
We design, market and sell our products primarily as commercial, off-the-shelf products. Certain customers request different system configurations, generally based on standard options or accessories that we offer. In general, our revenue arrangements do not involve acceptance provisions based upon customer specified acceptance criteria. In those circumstances when customer specified acceptance criteria exist, revenue is deferred until customer acceptance if we cannot demonstrate that the system meets those specifications prior to shipment. For any contracts with multiple elements (i.e., training, installation, additional parts, etc.) we allocate revenue among the deliverables primarily based upon objective and reliable evidence of fair value of each element in the arrangement. If objective and reliable evidence of fair value of any element is not available, we use an estimated selling price for purposes of allocating the total arrangement consideration among the elements. In addition, judgments are required in evaluating the credit worthiness of our customers. Credit is not extended to customers and revenue is not recognized until we have determined that collectability is reasonably assured.
Allowance for doubtful accounts.
Our policy is to maintain allowances for estimated losses resulting from the inability of our customers to make required payments. Credit limits are established through a process of reviewing the financial history and stability of each customer. Where appropriate, we obtain credit rating reports and financial statements of the customer when determining or modifying their credit limits. We regularly evaluate the collectability of our trade receivable balances based on a combination of factors. When a customer’s account balance becomes past due, we initiate dialogue with the customer to determine the cause. If it is determined that the customer will be unable to meet its financial obligation to us, such as in the case of a bankruptcy filing, deterioration in the customer’s operating results or financial position or other material events impacting their business, we record a specific allowance to reduce the related receivable to the amount we expect to recover given all information presently available. Actual write-offs during the past three years have not been material to our results of operations.
We also record an allowance for all other customers based on certain other factors including the length of time the receivables are past due and historical collection experience with individual customers. As of
December 31, 2013
, our accounts receivable balance of
$286.6 million
is reported net of allowances for doubtful accounts of
$7.7 million
. We believe our reported allowances at
December 31, 2013
, are adequate. If the financial conditions of those customers were to deteriorate, however, resulting in their inability to make payments, we may need to record additional allowances that would result in additional selling, general and administrative expenses being recorded for the period in which such determination is made.
Inventory.
Our policy is to record inventory write-downs when conditions exist that indicate that our inventories are likely to be in excess of anticipated demand or are obsolete based upon our assumptions about future demand for our products and market conditions. We regularly evaluate the ability to realize the value of our inventories based on a combination of factors including the following: historical usage rates, forecasted sales or usage, product end of life dates, estimated current and future market values and new product introductions. Purchasing requirements and alternative usages are evaluated within these processes to mitigate inventory exposure. When recorded, our write-downs are intended to reduce the carrying value of our inventories to their net realizable value and establish a new cost basis. As of
December 31, 2013
, our inventories of
$344.7 million
are stated net of inventory write-downs. If actual demand for our products deteriorates or market conditions are less favorable than those that we project, additional inventory write-downs may be required in the future.
Goodwill.
We have recorded goodwill in connection with our business acquisitions. We review goodwill during the third quarter of each year, or on an interim basis if warranted, for impairment to determine if events or changes in business conditions indicate that the carrying value of the goodwill may not be recoverable. Such reviews assess the fair value of the assets based upon our estimates of the future cash flows we expect the assets to generate within the boundaries of the applicable reporting units of the Company. Our review in the current year indicated that no adjustments were necessary for the goodwill assets, which have a carrying value of
$575.7 million
as of
December 31, 2013
.
Product warranties.
Our products are sold with warranty provisions that require us to remedy deficiencies in quality or performance of our products over a specified period of time, generally twelve to twenty-four months, at no cost to our customers. Our policy is to record warranty liabilities at levels that represent our estimate of the costs that will be incurred to fulfill those warranty requirements at the time that revenue is recognized. We believe that our recorded liability of
$17.7 million
at
December 31, 2013
is adequate to cover our future cost of materials, labor and overhead for the servicing of our products sold through that date. If actual product failures or material or service delivery costs differ from our estimates, our warranty liability would need to be revised accordingly.
27
Contingencies.
We are subject to the possibility of loss contingencies arising in the normal course of business. We consider the likelihood of loss or impairment of an asset or the incurrence of a liability, as well as our ability to reasonably estimate the amount of loss in determining loss contingencies. An estimated loss is accrued when it is probable that an asset has been impaired or a liability has been incurred and the amount can be reasonably estimated. We regularly evaluate current information available to us to determine whether such accruals should be adjusted.
Income taxes.
We account for income taxes using the asset and liability method, which requires the recognition of deferred tax assets and liabilities for the expected future tax consequences of temporary differences between the carrying amounts and the tax basis of the assets and liabilities measured using the enacted tax rates in effect in the years in which the differences are expected to reverse. Valuation allowances against deferred tax assets are recorded when a determination is made that the deferred tax assets are not more likely than not to be realized in the future. In making that determination, on a jurisdiction by jurisdiction basis, we estimate our future taxable income based upon historical operating results and external market data. Future levels of taxable income are dependent upon, but not limited to, general economic conditions, competitive pressures and other factors beyond our control. As of
December 31, 2013
, we have determined that a valuation allowance against our net deferred tax assets of
$13.5 million
is required. If we should determine that we may be unable to realize our deferred tax assets to the extent reported, an adjustment to the deferred tax assets would be recorded in the period such determination is made.
Consolidated Operating Results
The following table sets forth for the indicated periods certain items as a percentage of revenue:
|
|
Year Ended December 31,
(1)
|
|||||||
|
|
2013
|
2012
(as adjusted)
(2)
|
2011
(as adjusted)
(2)
|
|||||
|
Revenue
|
100.0
|
%
|
100.0
|
%
|
100.0
|
%
|
||
|
Cost of goods sold
|
50.7
|
|
47.7
|
|
46.3
|
|
||
|
Gross profit
|
49.3
|
|
52.3
|
|
53.7
|
|
||
|
Operating expenses:
|
||||||||
|
Research and development
|
9.9
|
|
9.8
|
|
9.5
|
|
||
|
Selling, general and administrative
|
21.6
|
|
20.8
|
|
23.9
|
|
||
|
Restructuring expenses
|
1.7
|
|
0.1
|
|
—
|
|
||
|
Total operating expenses
|
33.2
|
|
30.7
|
|
33.4
|
|
||
|
Earnings from operations
|
16.1
|
|
21.6
|
|
20.3
|
|
||
|
Interest expense
|
0.9
|
|
0.8
|
|
0.4
|
|
||
|
Interest income
|
(0.1
|
)
|
(0.1
|
)
|
(0.1
|
)
|
||
|
Other (income) expense, net
|
(0.1
|
)
|
0.1
|
|
(0.1
|
)
|
||
|
Earnings from continuing operations before income taxes
|
15.3
|
|
20.8
|
|
20.1
|
|
||
|
Income tax provision
|
3.5
|
|
4.7
|
|
5.7
|
|
||
|
Earnings from continuing operations
|
11.8
|
|
16.0
|
|
14.4
|
|
||
|
Loss from discontinued operations, net of tax
|
—
|
|
(0.2
|
)
|
(0.1
|
)
|
||
|
Net earnings
|
11.8
|
%
|
15.8
|
%
|
14.3
|
%
|
||
_______________
|
(1)
|
Totals may not recompute due to rounding.
|
|
(2)
|
Certain expenses have been reclassified to conform to the presentation for the year ended December 31, 2013. See Note 1 to the Consolidated Financial Statements in Item 8 for additional information.
|
The following discussion of operating results provides an overview of our operations by addressing key elements in our Consolidated Statements of Income. The “Segment Operating Results” section that follows describes the contributions of each of our business segments to our consolidated revenue and earnings from operations for
2013, 2012 and 2011
. Given the nature of our business, we believe revenue and earnings from operations (including operating margin percentage) are most relevant to an understanding of our performance at a segment level. Additionally, at the segment level we disclose backlog, which represents orders received for products or services for which a sales agreement is in place and delivery is expected within twelve months.
The operating results for 2012 do not include any amounts from either operations of Lorex Technology, Inc. ("Lorex) or Traficon International NV ("Traficon") which were each acquired in December 2012, as any such amounts were not significant.
28
Revenue
. Revenue for
2013
totaled
$1,496.4 million
,
an increase
of
6.5 percent
from
2012
revenue of
$1,405.4 million
. The increase was primarily due to increased revenue from our Thermal Vision and Measurement, Raymarine and Integrated Systems segments. Thermal Vision and Measurement's 2013 revenue included revenue from our acquisitions of Lorex and Traficon. Continued reductions in demand for certain products from United States government agencies resulted in decreased revenues in our Surveillance and Detection segments. Revenue from United States government customers declined by $18.6 million from 2012 to 2013.
Revenue for
2012
totaled
$1,405.4 million
,
a decrease
of
9.0 percent
over
2011
revenue of
$1,544.1 million
. Each of our operating segments, except Integrated Systems, reported decreases in year over year revenues due to reduced demand for our products from United States government and Middle East government agencies and weaker world-wide economic conditions resulting in lower demand for many of our commercial product lines. The decline of $138.7 million in year over year revenue included a decline of $71.3 million from United States government customers.
International revenue in
2013
totaled
$740.7 million
, representing
49.5 percent
of revenue. This compares with international revenue in
2012
which totaled
$687.5 million
, representing
48.9 percent
of revenue, and
$740.6 million
in
2011
, representing
48.0 percent
of revenue. While the sales mix between United States and international sales may fluctuate from year to year, we expect revenue from customers outside the United States to continue to comprise a significant portion of our total revenue on a long-term basis.
Cost of goods sold.
Cost of goods sold for the year ended December 31,
2013
and
2012
was
$759.4 million
and
$670.2 million
, respectively. The increase is primarily due to the increase in revenues year over year as discussed above and changes in product mix. In addition, for the year ended December 31, 2013, cost of goods sold included $1.7 million of inventory write downs related to our restructuring activities.
Cost of goods sold in
2012
was
$670.2 million
, compared to cost of goods sold of
$714.7 million
in
2011
. The year over year decrease in cost of goods sold primarily relates to the lower year over year revenues and changes in product mix. For the year ended December 31, 2011, costs of goods sold included charges of $7.3 million for the amortization of fair value adjustments on inventory acquired through the acquisition of ICx in 2010.
Cost of goods sold includes materials, labor and overhead costs incurred in the manufacturing of products and services sold in the period as well as warranty costs. Material costs include raw materials, purchased components and sub-assemblies, outside processing and inbound freight costs. Labor and overhead costs consist of direct and indirect manufacturing costs, including wages and fringe benefits, operating supplies, depreciation and amortization, occupancy costs, and purchasing, receiving and inspection costs.
Gross profit
. Gross profit for the year ended
December 31, 2013
was
$737.0 million
compared to
$735.2 million
in
2012
. Gross margin, defined as gross profit divided by revenue, decreased from
52.3 percent
in
2012
to
49.3 percent
in
2013
. The decrease in gross margin in
2013
was primarily due to unfavorable product mix in our Surveillance and Thermal Vision and Measurement segments, and the inclusion of lower gross margin revenues from our acquisition of Lorex, a portion of our Thermal Vision and Measurement segment.
Gross profit for the year ended
December 31, 2012
was
$735.2 million
compared to
$829.3 million
in
2011
. Gross margin decreased from
53.7 percent
in
2011
to
52.3 percent
in
2012
. The decrease in gross profit in 2012 was primarily due to the lower revenue year over year and a lower consolidated gross margin. Gross margin decreased in 2012 from 2011 primarily due to a shift in product mix in both our Thermal Vision and Measurement and Surveillance segments and reduced absorption of fixed costs due to lower revenues, partially offset by the elimination of 2011 amortization expenses related to fair value adjustments on inventory of ICx.
Research and development.
Research and development expenses were
$147.7 million
, or
9.9 percent
of revenue, in
2013
, compared to
$137.4 million
, or
9.8 percent
of revenue, in
2012
, and
$147.2 million
, or
9.5 percent
of revenue, in
2011
. The increase in research and development expenses in 2013 was partially due to the costs associated with the development of several new products primarily in our Thermal Vision and Measurement segment and the operations of Lorex and Traficon. The decrease in research and development expenses in 2012 from 2011 was primarily due to cost containment efforts in light of the decrease in revenue.
We believe that spending levels are sufficient to support the development of new products and the continued growth of the business. We expect research and development expenses to be approximately 8 to 10 percent of revenue on a long-term basis.
29
Selling, general and administrative expenses.
Selling, general and administrative expenses were
$322.7 million
, or
21.6 percent
of revenue, in
2013
compared to
$292.5 million
, or
20.8 percent
of revenue, in
2012
and
$368.9 million
, or
23.9 percent
of revenue, in
2011
. The increase in selling, general and administrative expenses in 2013 was primarily due to higher compensation expense and the inclusion of expenses of Lorex and Traficon. The decrease in selling, general and administrative expenses from 2011 to 2012 was primarily due to the payment of a $39.0 million litigation settlement in 2011, cost control efforts taken in 2012 in light of the revenue decline and lower annual incentive expenses. While selling, general and administrative expenses may be affected in the future by acquisitions with different cost structures, we anticipate selling, general and administrative expenses to increase at a slower rate than revenue in our existing businesses.
Restructuring expenses.
During the years ended December 31, 2013 and 2012, we recorded net pre-tax restructuring expenses totaling $27.5 million and $2.0 million, respectively. Of the restructuring expenses recorded in 2013, $25.8 million is recorded in operating expenses and $1.7 million is included in costs of goods sold. In the fourth quarter of 2013, we initiated a realignment plan that includes closing six not-to-scale sites in the United States and Europe and a transfer of those operations to larger facilities. We are also consolidating our optics and laser manufacturing businesses to better realize the benefits of vertical integration in these areas. The total costs expected to be incurred related to the realignment plan is approximately $38 million and we expect to complete the majority of the actions and recognize the remaining expenses of approximately $11 million during the year ending December 31, 2014. No specific plans for significant additional actions have been finalized at this time.
In 2012, we recorded restructuring expenses associated with the relocation of one of our manufacturing facilities in Europe to an existing facility in the United States.
Interest expense.
Interest expense totaled
$14.1 million
,
$11.7 million
and
$5.5 million
for the years ended December 31,
2013, 2012 and 2011
, respectively. Interest expense is primarily attributable to the $250 million aggregate principal amount of 3.75 percent senior unsecured notes due September 1, 2016 that were issued in August 2011 and the amortization of the costs related to the issuance of the notes and the $150 million term loan that was drawn on April 5, 2013.
Income taxes.
Our income tax provision was
$52.0 million
,
$66.6 million
and
$88.4 million
in
2013, 2012 and 2011
, respectively. The effective tax rates for
2013, 2012 and 2011
were
22.7 percent
,
22.8 percent
and
28.4 percent
, respectively. The mix in taxable income between our United States and international operations has a significant impact on our annual income tax provision and effective tax rates. Our effective tax rate is lower than the United States federal tax rate of 35 percent because of lower foreign tax rates, the effect of foreign, federal and state tax credits and other discrete items such as amended tax filings and business dispositions. The full year impact of a multi-year agreement, effective August 1, 2012, with a European jurisdiction was the primary reason for the effective tax rate in 2013 being comparable to that in 2012. The effective tax rate decrease from 2011 to 2012 was primarily due to the partial year impact of the multi-year agreement, the effect of amended state tax filings, and the impact of revaluations of deferred tax assets and liabilities due to changes in certain foreign statutory tax rates. We expect the effective tax rate for 2014 to be approximately 23 to 25 percent excluding discrete items.
At
December 31, 2013
, we had United States tax net operating loss carry-forwards totaling approximately
$39.8 million
which expire between
2018
and
2031
. In addition, we have various state net operating loss carry-forwards totaling approximately
$75.1 million
which expire between
2018
and
2033
. The federal and state net operating losses were primarily generated by ICx Technologies, Inc. prior to being acquired by us in 2010. Finally, we have various foreign net operating loss carry-forwards totaling approximately
$101.5 million
which expire between
2018
and
2033
.
Tax benefits as described above are recorded as assets when the benefits are more likely than not to be recognized. To the extent that we assess the realization of such assets to not be more likely than not, a valuation allowance is required to be recorded. We believe that the net deferred tax assets of
$44.0 million
reflected on the
December 31, 2013
Consolidated Balance Sheet are materially realizable based on future forecasts of taxable income over a relatively short time horizon, but we have determined that a valuation allowance against our net deferred tax assets of
$13.5 million
is required, primarily related to certain acquired net operating losses. A valuation allowance is required when it is more-likely-than-not that all or a portion of deferred tax assets may not be realized. A review of all available positive and negative evidence is considered, including past and future performance, the market environment in which we operate, utilization of tax attributes in the past, length of carryback and carryforward periods, and evaluation of potential tax planning strategies when evaluating whether the deferred tax assets will be realized.
Discontinued operations.
In 2010, in connection with the acquisition of ICx, we began to pursue the sale of certain business units of ICx and the results of operations for such business units were reported as discontinued operations until their respective dispositions. During the second quarter of 2012, we sold the remaining two business units reported as discontinued operations. The operating losses of those operations, including insignificant associated losses recognized subsequent to their disposal, and the net losses on the sales of the units, net of tax are reflected in the Consolidated Statements of Income for the year ended December 31, 2012.
30
Segment Operating Results
For the three year period ended December 31, 2013, we had five operating segments. The following discusses the operating results of each segment for that three year period.
Thermal Vision and Measurement
Thermal Vision and Measurement operating results are as follows (in millions):
|
|
Year Ended December 31,
|
||||||||||
|
|
2013
|
2012
|
2011
|
||||||||
|
Revenue
|
$
|
727.9
|
|
$
|
628.0
|
|
$
|
660.3
|
|
||
|
Earnings from operations
|
161.3
|
|
171.3
|
|
194.7
|
|
|||||
|
Operating margin
|
22.2
|
%
|
27.3
|
%
|
29.5
|
%
|
|||||
|
Backlog
|
189
|
|
158
|
|
136
|
|
|||||
Thermal Vision and Measurement revenue
increased
by
15.9 percent
in
2013
compared to
2012
, primarily due to the combined revenue of $123.2 million reported by Lorex and Traficon, offset by slightly lower revenues in several of our other product lines, a portion of which was due to lower demand from cores and components customers, including United States government funded customers. Earnings from operations
decreased
by
5.8 percent
primarily due to restructuring charges of $17.4 million recognized in 2013, offset by the inclusion of earnings from operations from the acquired businesses.
Revenue
decreased
by
4.9 percent
in
2012
compared to
2011
, primarily due to lower revenues in the cores and components product line and the premium thermography product lines. Revenue declined in all geographies due to world-wide economic weaknesses which were particularly significant in our Europe, Middle East and Africa regions. United States revenue was adversely impacted by lower revenue from cores and components customers. Earnings from operations
decreased
by
12.0 percent
due to the flow through of lower revenues and lower absorption of factory costs partially offset by a 5.5 percent reduction in operating expenses
Raymarine
Raymarine operating results are as follows (in millions):
|
|
Year Ended December 31,
|
||||||||||
|
2013
|
2012
|
2011
|
|||||||||
|
Revenue
|
$
|
163.2
|
|
$
|
158.2
|
|
$
|
171.5
|
|
||
|
Earnings from operations
|
14.2
|
|
11.2
|
|
11.9
|
|
|||||
|
Operating margin
|
8.7
|
%
|
7.1
|
%
|
6.9
|
%
|
|||||
|
Backlog
|
7
|
|
6
|
|
5
|
|
|||||
Raymarine segment revenue for the year ended December 31, 2013 increased by 3.2 percent compared to 2012. The year over year increase in revenue is primarily due to increased deliveries in the Americas and Europe, partially related to new product introductions. The increase in earnings from operations for the year ended December 31, 2013 compared to 2012 is primarily due to realizing the benefit in 2013 of cost containment efforts taken during 2012 and higher revenues in 2013.
Raymarine segment revenue for the year ended December 31, 2012 decreased by 7.8 percent, compared to 2011, primarily due to weak market conditions in Europe. Earnings from operations in 2012 decreased by 5.9 percent compared to 2011 primarily due to lower revenue resulting in lower gross profit, largely offset by a 9.9 percent reduction in operating expenses.
Surveillance
Surveillance operating results are as follows (in millions):
|
|
Year Ended December 31,
|
||||||||||
|
|
2013
|
2012
|
2011
|
||||||||
|
Revenue
|
$
|
456.5
|
|
$
|
486.4
|
|
$
|
577.6
|
|
||
|
Earnings from operations
|
126.0
|
|
160.2
|
|
208.5
|
|
|||||
|
Operating margin
|
27.6
|
%
|
32.9
|
%
|
36.1
|
%
|
|||||
|
Backlog
|
233
|
|
261
|
|
247
|
|
|||||
31
Surveillance segment revenue
decreased
by
6.1 percent
in
2013
compared to
2012
, primarily due to reduced procurement activity by United States government agencies. Earnings from operations declined by 21.3 percent due to lower revenues, lower gross margins resulting from a change in segment product mix and restructuring charges of $3.6 million. The backlog decline in 2013 was also a result of reduced United States government procurement activity.
Revenue
decreased
by
15.8 percent
in
2012
compared to
2011
, primarily due to a 26.6 percent decrease in revenue from United States government customers. Earnings from operations declined by 23.2 percent due to lower revenues, lower gross margins resulting from a change in segment product mix, partially offset by a 10.5 percent decrease in operating expenses.
Detection
Detection operating results are as follows (in millions):
|
Year Ended December 31,
|
|||||||||||
|
|
2013
|
2012
|
2011
|
||||||||
|
Revenue
|
$
|
53.2
|
|
$
|
63.3
|
|
$
|
79.9
|
|
||
|
(Loss) earnings from operations
|
(0.2
|
)
|
1.1
|
|
(5.6
|
)
|
|||||
|
Operating margin
|
(0.3
|
)%
|
1.7
|
%
|
(7.0
|
)%
|
|||||
|
Backlog
|
19
|
|
24
|
|
25
|
|
|||||
Detection segment revenue for the year ended December 31, 2013 decreased by 16.0 percent compared to 2012, which was primarily due to lower research and development contract revenues pursuant to the segment's strategy to reduce its customer-paid research and development activity which began in 2011. The (loss) earnings from operations in 2013 and 2012 included restructuring charges of $4.2 million and $2.0 million, respectively.
Detection segment revenue for the year ended December 31, 2012 decreased by 20.8 percent compared to the same period of 2011, primarily due to two significant program deliveries in 2011 and to lower research and development contract revenues. The loss from operations in 2011 included the amortization of fair value adjustments on inventory of $4.2 million. The elimination of the fair value inventory adjustment and a 27.9 percent reduction in operating expenses partially offset by lower revenues were the main factors contributing to the improvement in operating results for 2012 compared to 2011.
Integrated Systems
Integrated Systems operating results are as follows (in millions):
|
Year Ended December 31,
|
|||||||||||
|
|
2013
|
2012
|
2011
|
||||||||
|
Revenue
|
$
|
95.6
|
|
$
|
69.5
|
|
$
|
54.8
|
|
||
|
(Loss) earnings from operations
|
(1.9
|
)
|
5.2
|
|
1.7
|
|
|||||
|
Operating margin
|
(2.0
|
)%
|
7.4
|
%
|
3.0
|
%
|
|||||
|
Backlog
|
41
|
|
71
|
|
42
|
|
|||||
Integrated Systems segment revenue for the year ended December 31, 2013 increased by 37.5 percent. The increase was primarily due to the timing of large program deliveries to United States government programs that had been ordered in prior years. The decrease in earnings from operations in 2013 was primarily due to lower margins recognized on program deliveries in 2013, including a large program for which the segment recognized a loss. Earnings from operations in 2013 included restructuring charges of $1.8 million. The decline in backlog during 2013 is primarily due to the large program deliveries in 2013 and reduced United States government order activity.
Integrated Systems segment revenue for the year ended December 31, 2012 increased by 26.7 percent over 2011, primarily due to an increase in large program revenue recognized year over year. Backlog at December 31, 2012 reflects an increase due to several large program contracts booked during 2012.
32
Liquidity and Capital Resources
At
December 31, 2013
, we had a total of
$542.5 million
in cash and cash equivalents,
$221.0 million
of which was in the United States and
$321.5 million
at our foreign subsidiaries, compared to cash and cash equivalents at
December 31, 2012
of
$321.7 million
, of which
$150.3 million
was in the United States and
$171.4 million
at our foreign subsidiaries. We intend to indefinitely reinvest the cash at our foreign subsidiaries in operations and other activities outside the United States. The increase in cash and cash equivalents in 2013 was primarily due to $150 million borrowed against a term loan facility and cash from operations, partially offset by $162.1 million spent for the repurchase of shares of our common stock, $72.1 million spent on capital expenditures and business acquisitions, and dividends paid of $51.4 million during 2013.
Cash provided by operating activities in
2013
totaled
$355.0 million
compared to
$285.5 million
in
2012
and
$243.9 million
in
2011
. The increase in cash provided from operations in 2013 compared to 2012 was primarily due to higher net collections of accounts receivable and decrease in our inventories. The increase in cash provided from operating activities in 2012 compared to 2011 was primarily due to a year over year reduction in cash used for certain working capital components, particularly inventories and income tax related assets and liabilities.
Cash used for investing activities for the year ended
December 31, 2013
totaled
$72.1 million
, primarily consisting of capital expenditures of $52.1 million and the acquisition of Marine and Remote Sensing Solutions, Ltd. for $3.2 million and the acquisition of certain tangible assets and intellectual property related to the design and manufacturing of wafer-level optics from DigitalOptics Corporation East for $14.9 million. Capital expenditures in 2013 included equipment purchases in TVM in anticipation of the production a new generation detector. Capital expenditures of $58.1 million in 2012 included building improvements for our facilities in Nashua, New Hampshire, Taby, Sweden and Croissy-Beaubourg, France and equipment requirements for existing and future product lines. Cash used for investing activities for the year ended December 31, 2011 totaled $67.1 million, primarily consisting of the acquisition of Aerius Photonics, LLC for $27.0 million and capital expenditures of $41.9 million. Capital expenditures in 2011 included the purchase of a building in Fareham, United Kingdom and building improvements for our facilities in Nashua, New Hampshire and Taby, Sweden.
Cash used by financing activities for the year ended
December 31, 2013
totaled
$66.1 million
, primarily consisting of the repurchase of shares of our common stock and the payment of dividends, offset by net borrowings of $138.8 million against our new term loan facility. Cash used in financing activities for the year ended
December 31, 2012
totaled
$244.3 million
, primarily consisting of the payment of dividends and repurchases of our common stock. Cash provided from financing activities for the year ended
December 31, 2011
totaled
$75.4 million
, primarily consisting of the net proceeds of $247.7 million from the issuance of our 3.75 percent senior unsecured notes due September 1, 2016 (the "Notes") and cash provided from our stock-based compensation plans partially offset by the payment of dividends and repurchase of our common stock.
On February 8, 2011, we signed a Credit Agreement (“Credit Agreement”) with Bank of America, N.A., U.S. Bank National Association, JPMorgan Chase Bank N.A. and other Lenders. The Credit Agreement provides for a $200 million, five-year revolving line of credit. On April 5, 2013, the Credit Agreement was amended to extend the maturity of the revolving credit facility from February 8, 2016 to April 5, 2018 in addition to incorporating a $150 million term loan facility maturing April 5, 2019. We have the right, subject to certain conditions including approval of additional commitments by qualified lenders, to increase the revolving line of credit under the Credit Agreement by an additional $150 million at any time prior to April 5, 2018. The Credit Agreement allows us to borrow in United States dollars, euros, Swedish kronor, pound sterling, Japanese yen, Canadian dollars, Australian dollars and other agreed upon currencies. The Credit Agreement requires us to pay a commitment fee on the amount of unused credit at a rate, based on the Company’s total leverage ratio, which ranges from 0.25 percent to 0.40 percent. The Credit Agreement contains two financial covenants that require the maintenance of a total leverage ratio and an interest coverage ratio with which we were in compliance at
December 31, 2013
. The five-year revolving line of credit available under the Credit Agreement and the term loan facility thereunder are not secured by any of our assets.
As noted above, the Credit Agreement amendment of April 5, 2013 incorporated a $150 million term loan facility that matures on April 5, 2019. On April 5, 2013 we drew down $150 million under the term loan facility, electing one-month LIBOR as the basis for the interest rate. Interest is accrued at LIBOR plus the scheduled spread and is paid monthly. By entering into interest rate swap agreements, we have effectively fixed the basis for calculating the interest rate on the term loan. The effective interest rate paid is equal to the fixed rate in the swap agreements plus the credit spread then in effect. At
December 31, 2013
, the effective interest rate on the term loan was 2.49 percent. Principal payments of $3.75 million are made in quarterly installments which commenced on June 30, 2013 and will continue through December 31, 2018 with the final maturity payment including any accrued interest due on April 5, 2019.
At
December 31, 2013
, we had no revolving loans outstanding under the Credit Agreement and the commitment fee on the amount of unused revolving credit was
0.30 percent
. We had
$19.5 million
and
$10.6 million
of letters of credit outstanding under the Credit Agreement at December 31,
2013 and 2012
, respectively, which reduced the total available revolving credit under the Credit Agreement.
33
On August 19, 2011, the Company issued $250 million aggregate principal amount of the Notes. The net proceeds from the issuance of the Notes were approximately $247.7 million, after deducting underwriting discounts and offering expenses, which are being amortized over a period of five years. Interest is payable on the Notes semi-annually in arrears on March 1 and September 1. The proceeds from the Notes are being used for general corporate purposes, which may include working capital and capital expenditure needs, business acquisitions and repurchases of our common stock.
We believe that our existing cash combined with the cash we anticipate generating from operating activities, and our available credit facilities and financing available from other sources will be sufficient to meet our cash requirements for the next twelve months. We do not have any significant commitments nor are we aware of any significant events or conditions that are likely to have a material impact on our liquidity or capital resources.
Off-Balance Sheet Arrangements
As of
December 31, 2013
, we leased our non-owned facilities under operating lease agreements. We also leased certain operating machinery and equipment and office equipment under operating lease agreements. Except for these operating lease agreements, we do not have any off-balance sheet arrangements that have or are likely to have a material current or future effect on our financial condition, revenues or expenses, results of operations, liquidity, capital expenditures or capital resources.
Contractual Obligations
As of
December 31, 2013
, our contractual obligations were as follows (in thousands):
|
|
Payments Due by Period
|
||||||||||||||||||
|
Total
|
Less than
1 Year
|
1 – 3
Years
|
3 – 5
Years
|
More than
5 Years
|
|||||||||||||||
|
Long-term debt, including interest
|
$
|
427,786
|
|
$
|
27,689
|
|
$
|
301,921
|
|
$
|
34,013
|
|
$
|
64,163
|
|
||||
|
Operating leases
|
29,744
|
|
12,421
|
|
12,070
|
|
3,535
|
|
1,718
|
|
|||||||||
|
Licensing rights
|
2,750
|
|
550
|
|
1,100
|
|
1,100
|
|
—
|
|
|||||||||
|
Post-retirement obligations
|
17,165
|
|
508
|
|
1,040
|
|
1,017
|
|
14,600
|
|
|||||||||
|
Other obligations
|
928
|
|
470
|
|
458
|
|
—
|
|
—
|
|
|||||||||
|
$
|
478,373
|
|
$
|
41,638
|
|
$
|
316,589
|
|
$
|
39,665
|
|
$
|
80,481
|
|
|||||
Principal and interest on long-term debt, operating leases and licensing rights obligations are based upon contractual terms. Actual payments may differ in terms of both timing and amounts.
The Company cannot make a reasonably reliable estimate of the period of potential cash settlement of its unrecognized tax benefits of
$29.5 million
and, therefore has not included the unrecognized tax benefits in the table of significant contractual obligations as of
December 31, 2013
. For further detail on unrecognized tax benefits, see Note 14 to the Consolidated Financial Statements in Item 8. We did not include approximately
$19.5 million
of standby letters of credit and performance bonds due to the unlikely event of payment, if any, of amounts under those arrangements.
Recent Accounting Pronouncements
See Note 1 to the Consolidated Financial Statements in Item 8 for a discussion of recent accounting pronouncements.
34
|
ITEM 7A.
|
QUANTITATIVE AND QUALITATIVE DISCLOSURES ABOUT MARKET RISK
|
Foreign Currency Exchange Rate Risk
We have assets and liabilities outside the United States that are subject to fluctuations in foreign currency exchange rates. Similarly, certain revenues from products sold in countries outside the United States and costs associated with non-U.S. operations are denominated in foreign currencies. For more information on our foreign currency translation, see Note 1 to the Consolidated Financial Statements in Item 8. Assets and liabilities located outside the United States are primarily located in Europe. Our investments in subsidiaries outside the United States with functional currencies other than the United States dollar are considered long-term. We currently engage in forward currency exchange contracts and other similar hedging activities to reduce our economic exposure to changes in exchange rates. At
December 31, 2013
, exchange contracts with a notional amount of approximately
$121.9 million
were outstanding. Because we market, sell and license our products throughout the world, we could be adversely affected by weak economic conditions in international markets that could reduce demand for our products.
Our net investment in subsidiaries outside the United States, translated into United States dollars using the period-end exchange rates, was approximately
$1,079.6 million
and
$718.6 million
at
December 31, 2013
and
2012
, respectively. The potential loss in fair value resulting from a hypothetical 10 percent adverse change in foreign exchange rates would be approximately
$108.0 million
and
$71.9 million
at
December 31, 2013
and
2012
, respectively. The increase in the potential loss in fair value is primarily due to the increase in the net investment of subsidiaries outside the United States. We have no plans to liquidate any of our subsidiaries outside the United States, and therefore, foreign exchange rate gains or losses on our international investments are reflected as a cumulative translation adjustment and do not increase or reduce our reported net earnings.
Interest Rate Risk
Our exposure to changes in market interest rates relates primarily to interest paid on our floating rate long-term debt. Our floating rate long-term debt consists of the $150 million borrowed under our term loan facility that bears interest at the one-month LIBOR rate plus a scheduled spread. Fluctuations in market interest rates will cause interest expense increases or decreases on such long-term debt.
As our risk management objectives include mitigating the risk of changes in cash flows attributable to changes in the designated one-month LIBOR rate for the term loan facility, we entered into two interest rate swaps for the aggregate notional amount of $150 million and fixed interest rates of 1.016 percent and 0.97 percent effective at the time the term loan was drawn to hedge this exposure. Changes in the cash flows of the interest rate swaps are expected to exactly offset the changes in cash flows attributable to fluctuations in the one-month LIBOR based interest payments. The net effect of these swap agreements is to convert the floating interest rate basis to fixed rates of 1.016 percent and 0.97 percent.
See Item 7 and Note 3, Note 9, and Note 11 to the Consolidated Financial Statements in Item 8, for additional information on the Company's interest rate risk.
35
|
ITEM 8.
|
FINANCIAL STATEMENTS AND SUPPLEMENTARY DATA
|
This item includes the following financial information:
|
Statement
|
Page
|
36
Report of Independent Registered Public Accounting Firm
The Board of Directors and
Shareholders of FLIR Systems, Inc.:
We have audited the accompanying consolidated balance sheets of FLIR Systems, Inc. (an Oregon Corporation) and subsidiaries as of
December 31, 2013
and
2012
, and the related consolidated statements of income, comprehensive income, shareholders’ equity, and cash flows for each of the years in the three-year period ended
December 31, 2013
. These consolidated financial statements are the responsibility of the Company’s management. Our responsibility is to express an opinion on these consolidated financial statements based on our audits.
We conducted our audits in accordance with the standards of the Public Company Accounting Oversight Board (United States). Those standards require that we plan and perform the audit to obtain reasonable assurance about whether the financial statements are free of material misstatement. An audit includes examining, on a test basis, evidence supporting the amounts and disclosures in the financial statements. An audit also includes assessing the accounting principles used and significant estimates made by management, as well as evaluating the overall financial statement presentation. We believe that our audits provide a reasonable basis for our opinion.
In our opinion, the consolidated financial statements referred to above present fairly, in all material respects, the financial position of FLIR Systems, Inc. and subsidiaries as of
December 31, 2013
and
2012
, and the results of their operations and their cash flows for each of the years in the three-year period ended
December 31, 2013
, in conformity with U.S. generally accepted accounting principles.
We also have audited, in accordance with the standards of the Public Company Accounting Oversight Board (United States), FLIR Systems, Inc.’s internal control over financial reporting as of
December 31, 2013
, based on criteria established in
Internal Control—Integrated Framework (1992)
issued by the Committee of Sponsoring Organizations of the Treadway Commission (COSO), and our report dated
March 3, 2014
expressed an unqualified opinion on the effectiveness of the Company’s internal control over financial reporting.
/s/ KPMG LLP
Portland, Oregon
March 3, 2014
37
|
FLIR SYSTEMS, INC.
(in thousands, except per share amounts)
|
|||||||||||
|
|
Year Ended December 31,
|
||||||||||
|
|
2013
|
2012
(as adjusted)
|
2011
(as adjusted)
|
||||||||
|
Revenue
|
$
|
1,496,372
|
|
$
|
1,405,358
|
|
$
|
1,544,062
|
|
||
|
Cost of goods sold
|
759,362
|
|
670,174
|
|
714,743
|
|
|||||
|
Gross profit
|
737,010
|
|
735,184
|
|
829,319
|
|
|||||
|
Operating expenses:
|
|||||||||||
|
Research and development
|
147,696
|
|
137,354
|
|
147,177
|
|
|||||
|
Selling, general and administrative
|
322,739
|
|
292,500
|
|
368,947
|
|
|||||
|
Restructuring expenses
|
25,832
|
|
2,000
|
|
—
|
|
|||||
|
Total operating expenses
|
496,267
|
|
431,854
|
|
516,124
|
|
|||||
|
Earnings from operations
|
240,743
|
|
303,330
|
|
313,195
|
|
|||||
|
Interest expense
|
14,091
|
|
11,659
|
|
5,487
|
|
|||||
|
Interest income
|
(1,058
|
)
|
(1,582
|
)
|
(1,273
|
)
|
|||||
|
Other expense (income), net
|
(1,276
|
)
|
1,341
|
|
(2,098
|
)
|
|||||
|
Earnings from continuing operations before income taxes
|
228,986
|
|
291,912
|
|
311,079
|
|
|||||
|
Income tax provision
|
51,971
|
|
66,556
|
|
88,427
|
|
|||||
|
Earnings from continuing operations
|
177,015
|
|
225,356
|
|
222,652
|
|
|||||
|
Loss from discontinued operations, net of tax
|
—
|
|
(2,958
|
)
|
(1,178
|
)
|
|||||
|
Net earnings
|
$
|
177,015
|
|
$
|
222,398
|
|
$
|
221,474
|
|
||
|
Basic earnings per share:
|
|||||||||||
|
Continuing operations
|
$
|
1.24
|
|
$
|
1.49
|
|
$
|
1.41
|
|
||
|
Discontinued operations
|
—
|
|
(0.02
|
)
|
(0.01
|
)
|
|||||
|
Basic earnings per share
|
$
|
1.24
|
|
$
|
1.47
|
|
$
|
1.40
|
|
||
|
Diluted earnings per share:
|
|||||||||||
|
Continuing operations
|
$
|
1.22
|
|
$
|
1.47
|
|
$
|
1.38
|
|
||
|
Discontinued operations
|
—
|
|
(0.02
|
)
|
(0.01
|
)
|
|||||
|
Diluted earnings per share
|
$
|
1.22
|
|
$
|
1.45
|
|
$
|
1.38
|
|
||
The accompanying notes are an integral part of these consolidated financial statements.
38
|
FLIR SYSTEMS, INC.
CONSOLIDATED STATEMENTS OF COMPREHENSIVE INCOME
(In thousands)
|
|||||||||||
|
|
Year Ended December 31,
|
||||||||||
|
|
2013
|
2012
|
2011
|
||||||||
|
Net earnings
|
$
|
177,015
|
|
$
|
222,398
|
|
$
|
221,474
|
|
||
|
Other comprehensive income (loss), net of tax:
|
|||||||||||
|
Change in minimum liability for pension plans, net of tax effects of $1,682, $558 and $653, respectively
|
2,961
|
|
745
|
|
(1,113
|
)
|
|||||
|
Fair value adjustment on interest rate swap contracts
|
1,660
|
|
—
|
|
—
|
|
|||||
|
Foreign currency translation adjustments
|
11,838
|
|
20,790
|
|
(12,533
|
)
|
|||||
|
Total other comprehensive income (loss)
|
$
|
16,459
|
|
$
|
21,535
|
|
$
|
(13,646
|
)
|
||
|
Comprehensive income
|
$
|
193,474
|
|
$
|
243,933
|
|
$
|
207,828
|
|
||
The accompanying notes are an integral part of these consolidated financial statements.
39
|
FLIR SYSTEMS, INC.
(in thousands, except for par value)
|
|||||||
|
|
December 31,
|
||||||
|
|
2013
|
2012
(as adjusted)
|
|||||
|
ASSETS
|
|||||||
|
Current assets:
|
|||||||
|
Cash and cash equivalents
|
$
|
542,476
|
|
$
|
321,739
|
|
|
|
Accounts receivable, net
|
286,573
|
|
335,163
|
|
|||
|
Inventories
|
344,719
|
|
379,080
|
|
|||
|
Prepaid expenses and other current assets
|
97,574
|
|
98,304
|
|
|||
|
Deferred income taxes, net
|
38,389
|
|
30,960
|
|
|||
|
Total current assets
|
1,309,731
|
|
1,165,246
|
|
|||
|
Property and equipment, net
|
234,041
|
|
211,615
|
|
|||
|
Deferred income taxes, net
|
17,883
|
|
32,223
|
|
|||
|
Goodwill
|
575,701
|
|
564,306
|
|
|||
|
Intangible assets, net
|
154,195
|
|
175,823
|
|
|||
|
Other assets
|
51,808
|
|
41,442
|
|
|||
|
Total assets
|
$
|
2,343,359
|
|
$
|
2,190,655
|
|
|
|
LIABILITIES AND SHAREHOLDERS’ EQUITY
|
|||||||
|
Current liabilities:
|
|||||||
|
Accounts payable
|
$
|
85,730
|
|
$
|
94,156
|
|
|
|
Deferred revenue
|
28,844
|
|
29,465
|
|
|||
|
Accrued payroll and related liabilities
|
62,069
|
|
41,506
|
|
|||
|
Accrued product warranties
|
14,665
|
|
13,169
|
|
|||
|
Advance payments from customers
|
25,414
|
|
12,150
|
|
|||
|
Accrued expenses
|
39,316
|
|
32,772
|
|
|||
|
Accrued income taxes
|
663
|
|
11,943
|
|
|||
|
Other current liabilities
|
4,814
|
|
6,406
|
|
|||
|
Current portion, long-term debt
|
15,000
|
|
—
|
|
|||
|
Total current liabilities
|
276,515
|
|
241,567
|
|
|||
|
Long-term debt
|
372,528
|
|
248,319
|
|
|||
|
Deferred income taxes
|
12,255
|
|
19,071
|
|
|||
|
Accrued income taxes
|
19,996
|
|
22,812
|
|
|||
|
Pension and other long-term liabilities
|
48,685
|
|
58,985
|
|
|||
|
Commitments and contingencies (Notes 12 and 13)
|
|
|
|||||
|
Shareholders’ equity:
|
|||||||
|
Preferred stock, $0.01 par value, 10,000 shares authorized; no shares issued at December 31, 2013 or 2012
|
—
|
|
—
|
|
|||
|
Common stock, $0.01 par value, 500,000 shares authorized, 140,782 and 145,814 shares issued at December 31, 2013 and 2012, respectively, and additional paid-in capital
|
42,955
|
|
171,546
|
|
|||
|
Retained earnings
|
1,544,425
|
|
1,418,814
|
|
|||
|
Accumulated other comprehensive earnings
|
26,000
|
|
9,541
|
|
|||
|
Total shareholders’ equity
|
1,613,380
|
|
1,599,901
|
|
|||
|
Total liabilities and shareholders' equity
|
$
|
2,343,359
|
|
$
|
2,190,655
|
|
|
The accompanying notes are an integral part of these consolidated financial statements.
|
FLIR SYSTEMS, INC.
CONSOLIDATED STATEMENTS OF SHAREHOLDERS’ EQUITY
(in thousands)
|
|||||||||||||||||||
|
|
Common Stock and
Additional
Paid-in Capital
|
Retained
Earnings
|
Accumulated
Other
Comprehensive
Earnings
(Loss)
|
Total
Shareholder’s
Equity
|
|||||||||||||||
|
|
Shares
|
Amount
|
|||||||||||||||||
|
Balance, December 31, 2010
|
159,212
|
|
$
|
465,467
|
|
$
|
1,055,429
|
|
$
|
1,652
|
|
$
|
1,522,548
|
|
|||||
|
Net earnings for the year
|
—
|
|
—
|
|
221,474
|
|
—
|
|
221,474
|
|
|||||||||
|
Income tax benefit of common stock options exercised
|
—
|
|
5,545
|
|
—
|
|
—
|
|
5,545
|
|
|||||||||
|
Repurchase of common stock
|
(6,135
|
)
|
(160,669
|
)
|
—
|
|
—
|
|
(160,669
|
)
|
|||||||||
|
Common stock issued pursuant to stock-based compensation plans, net
|
1,892
|
|
16,751
|
|
—
|
|
—
|
|
16,751
|
|
|||||||||
|
Stock-based compensation
|
—
|
|
25,063
|
|
—
|
|
—
|
|
25,063
|
|
|||||||||
|
Dividends paid
|
—
|
|
—
|
|
(38,037
|
)
|
—
|
|
(38,037
|
)
|
|||||||||
|
Other comprehensive loss
|
—
|
|
—
|
|
—
|
|
(13,646
|
)
|
(13,646
|
)
|
|||||||||
|
Balance, December 31, 2011
|
154,969
|
|
352,157
|
|
1,238,866
|
|
(11,994
|
)
|
1,579,029
|
|
|||||||||
|
Net earnings for the year
|
—
|
|
—
|
|
222,398
|
|
—
|
|
222,398
|
|
|||||||||
|
Income tax benefit of common stock options exercised
|
—
|
|
39
|
|
—
|
|
—
|
|
39
|
|
|||||||||
|
Repurchase of common stock
|
(10,466
|
)
|
(214,195
|
)
|
—
|
|
—
|
|
(214,195
|
)
|
|||||||||
|
Common stock issued pursuant to stock-based compensation plans, net
|
1,311
|
|
7,644
|
|
—
|
|
—
|
|
7,644
|
|
|||||||||
|
Stock-based compensation
|
—
|
|
25,901
|
|
—
|
|
—
|
|
25,901
|
|
|||||||||
|
Dividends paid
|
—
|
|
—
|
|
(42,450
|
)
|
—
|
|
(42,450
|
)
|
|||||||||
|
Other comprehensive income
|
—
|
|
—
|
|
—
|
|
21,535
|
|
21,535
|
|
|||||||||
|
Balance, December 31, 2012
|
145,814
|
|
171,546
|
|
1,418,814
|
|
9,541
|
|
1,599,901
|
|
|||||||||
|
Net earnings for the year
|
—
|
|
—
|
|
177,015
|
|
—
|
|
177,015
|
|
|||||||||
|
Income tax benefit of common stock options exercised
|
—
|
|
551
|
|
—
|
|
—
|
|
551
|
|
|||||||||
|
Repurchase of common stock
|
(5,988
|
)
|
(162,078
|
)
|
—
|
|
—
|
|
(162,078
|
)
|
|||||||||
|
Common stock issued pursuant to stock-based compensation plans, net
|
956
|
|
4,849
|
|
—
|
|
—
|
|
4,849
|
|
|||||||||
|
Stock-based compensation
|
—
|
|
28,087
|
|
—
|
|
—
|
|
28,087
|
|
|||||||||
|
Dividends paid
|
—
|
|
—
|
|
(51,404
|
)
|
—
|
|
(51,404
|
)
|
|||||||||
|
Other comprehensive income
|
—
|
|
—
|
|
—
|
|
16,459
|
|
16,459
|
|
|||||||||
|
Balance, December 31, 2013
|
140,782
|
|
$
|
42,955
|
|
$
|
1,544,425
|
|
$
|
26,000
|
|
$
|
1,613,380
|
|
|||||
The accompanying notes are an integral part of these consolidated financial statements.
40
|
FLIR SYSTEMS, INC.
(in thousands)
|
|||||||||||
|
|
Year Ended December 31,
|
||||||||||
|
|
2013
|
2012
(as adjusted)
|
2011
|
||||||||
|
CASH PROVIDED BY OPERATING ACTIVITIES:
|
|||||||||||
|
Net earnings
|
$
|
177,015
|
|
$
|
222,398
|
|
$
|
221,474
|
|
||
|
Income items not affecting cash:
|
|||||||||||
|
Depreciation and amortization
|
62,796
|
|
59,715
|
|
77,498
|
|
|||||
|
Deferred income taxes
|
(2,709
|
)
|
(10,940
|
)
|
(12,195
|
)
|
|||||
|
Stock-based compensation arrangements
|
27,823
|
|
26,250
|
|
24,917
|
|
|||||
|
Other non-cash items
|
4,564
|
|
(1,810
|
)
|
12,654
|
|
|||||
|
Changes in operating assets and liabilities, net of acquisitions:
|
|||||||||||
|
Decrease in accounts receivable
|
48,640
|
|
10,693
|
|
17,992
|
|
|||||
|
Decrease (increase) in inventories
|
35,181
|
|
(23,733
|
)
|
(48,361
|
)
|
|||||
|
Decrease (increase) in prepaid expenses and other current assets
|
5,434
|
|
(1,004
|
)
|
(11,104
|
)
|
|||||
|
(Increase) decrease in other assets
|
(1,520
|
)
|
1,879
|
|
(5,589
|
)
|
|||||
|
Decrease in accounts payable
|
(8,617
|
)
|
(1,672
|
)
|
(5,565
|
)
|
|||||
|
(Decrease) increase in deferred revenue
|
(659
|
)
|
1,153
|
|
5,426
|
|
|||||
|
Increase (decrease) in accrued payroll and other liabilities
|
36,017
|
|
(25,415
|
)
|
(25,599
|
)
|
|||||
|
(Decrease) increase in accrued income taxes
|
(18,898
|
)
|
20,141
|
|
(9,865
|
)
|
|||||
|
(Decrease) increase in pension and other long-term liabilities
|
(10,102
|
)
|
7,890
|
|
2,208
|
|
|||||
|
Cash provided by operating activities
|
354,965
|
|
285,545
|
|
243,891
|
|
|||||
|
CASH USED BY INVESTING ACTIVITIES:
|
|||||||||||
|
Additions to property and equipment
|
(52,061
|
)
|
(58,089
|
)
|
(41,946
|
)
|
|||||
|
Business acquisitions, net of cash acquired
|
(20,073
|
)
|
(105,909
|
)
|
(27,182
|
)
|
|||||
|
Other investments
|
—
|
|
(3,002
|
)
|
1,991
|
|
|||||
|
Cash used by investing activities
|
(72,134
|
)
|
(167,000
|
)
|
(67,137
|
)
|
|||||
|
CASH (USED) PROVIDED BY FINANCING ACTIVITIES:
|
|||||||||||
|
Net proceeds of long-term debt, including current portion
|
150,000
|
|
—
|
|
247,708
|
|
|||||
|
Repayment of long-term debt
|
(11,250
|
)
|
—
|
|
—
|
|
|||||
|
Repurchase of common stock
|
(162,078
|
)
|
(214,195
|
)
|
(160,669
|
)
|
|||||
|
Dividends paid
|
(51,404
|
)
|
(42,450
|
)
|
(38,037
|
)
|
|||||
|
Proceeds from shares issued pursuant to stock-based compensation plans
|
8,650
|
|
11,198
|
|
21,706
|
|
|||||
|
Excess tax benefit of stock options exercised
|
1,069
|
|
1,284
|
|
5,195
|
|
|||||
|
Other financing activities
|
(1,100
|
)
|
(166
|
)
|
(458
|
)
|
|||||
|
Cash (used) provided by financing activities
|
(66,113
|
)
|
(244,329
|
)
|
75,445
|
|
|||||
|
Effect of exchange rate changes on cash
|
4,019
|
|
6,677
|
|
(4,490
|
)
|
|||||
|
Net increase (decrease) in cash and cash equivalents
|
220,737
|
|
(119,107
|
)
|
247,709
|
|
|||||
|
Cash and cash equivalents, beginning of year
|
321,739
|
|
440,846
|
|
193,137
|
|
|||||
|
Cash and cash equivalents, end of year
|
$
|
542,476
|
|
$
|
321,739
|
|
$
|
440,846
|
|
||
The accompanying notes are an integral part of these consolidated financial statements.
41
FLIR SYSTEMS, INC.
NOTES TO THE CONSOLIDATED FINANCIAL STATEMENTS
|
Note 1.
|
Nature of Business and Significant Accounting Policies
|
FLIR Systems, Inc. (the "Company") is a world leader in sensor systems that enhance perception and awareness. The Company was founded in 1978 and has since become a premier designer, manufacturer, and marketer of thermal imaging and other sensing products and systems. The Company’s advanced sensors and integrated sensor systems enable the gathering and analysis of critical information through a wide variety of applications in commercial, industrial, and government markets worldwide.
The Company’s goal is to both enable its customers to benefit from the valuable information produced by advanced sensing technologies and to deliver sustained superior financial performance for its shareholders. The Company creates value for its customers by providing advanced surveillance and tactical defense capabilities, improving personal and public safety and security, facilitating air, ground, and maritime navigation, enhancing enjoyment of the outdoors, providing infrastructure inefficiency information, conveying pre-emptive structural deficiency data, displaying process irregularities, and enabling commercial business opportunities through its continual support and development of new thermal imaging data and analytics applications. The Company’s business model meets the needs of a multitude of customers—it sells off-the-shelf products to a wide variety of markets in an efficient, timely, and affordable manner as well as offers a variety of system configurations to suit specific customer requirements. Centered on the design of products for low cost manufacturing and high volume distribution, the Company’s commercial operating model has been developed over time and provides it with a unique ability to adapt to market changes and meet its customers’ needs.
Principles of consolidation
The accompanying consolidated financial statements include the accounts of the Company and its wholly owned subsidiaries. All intercompany accounts and transactions were eliminated.
Reclassification
The Company made certain reclassifications to the prior years' financial statements to conform them to the presentation as of and for the year ended December 31, 2013. The reclassifications included certain severance expenses of
$3.8 million
and
$0.7 million
recognized during the years ended December 31, 2012 and 2011, respectively, that were originally reported in cost of goods sold and are now reported as operating expenses, and certain demonstration assets of
$2.3 million
that were originally reported as inventory at December 31, 2012 that are now reported in other current assets. In addition, the December 31, 2012 balance sheet has been adjusted for the purchase price accounting that was completed during 2013 associated with the acquisitions of Lorex Technology Inc. ("Lorex") and Traficon International NV ("Traficon"). See Note 7, "Goodwill," Note 8, "Intangible Assets," Note 14, "Income Taxes," and Note 18, "Business Acquisitions" for additional information. These reclassifications had no effect on consolidated financial position, shareholders' equity or net cash flows for any of the periods presented.
Foreign currency translation
The assets and liabilities of the Company’s subsidiaries outside the United States are translated into United States dollars at current exchange rates in effect at the balance sheet date. Revenues and expenses are translated at monthly average exchange rates. Resulting translation adjustments are reflected in accumulated other comprehensive earnings within shareholders’ equity. Transaction gains and losses that arise from exchange rate fluctuations on transactions denominated in currencies other than the functional currency are reflected as other income, net, in the Consolidated Statements of Income as incurred.
The cumulative translation adjustment included in accumulated other comprehensive earnings is a
gain
of
$26.5 million
and a
gain
of
$14.7 million
at December 31,
2013 and 2012
, respectively. Transaction gains and losses included in other income, net, are a net
loss
of
$0.3 million
, a net
loss
of
$3.0 million
, and a net
gain
of
$1.1 million
for the years ended December 31,
2013, 2012 and 2011
, respectively.
42
FLIR SYSTEMS, INC.
NOTES TO THE CONSOLIDATED FINANCIAL STATEMENTS—(Continued)
|
Note 1.
|
Nature of Business and Significant Accounting Policies—(Continued)
|
Revenue recognition
Revenue is primarily recognized when persuasive evidence of an arrangement exists, upon delivery of the product to the customer at a fixed or determinable price with a reasonable assurance of collection, passage of title and risk of loss to the customer as indicated by the shipping terms and fulfillment of all significant obligations.
The Company designs, markets and sells products primarily as commercial, off-the-shelf products. Certain customers request different system configurations, based on standard options or accessories that the Company offers. In general, revenue arrangements do not involve acceptance provisions based upon customer specified acceptance criteria. In those limited circumstances when customer specified acceptance criteria exist, revenue is deferred until customer acceptance if the Company cannot demonstrate the system meets those specifications prior to shipment. For any contracts with multiple elements (i.e., training, installation, additional parts, etc.) the Company allocates revenue among the deliverables primarily based upon objective and reliable evidence of fair value of each element in the arrangement. If objective and reliable evidence of fair value of any element is not available, we use an estimated selling price for purposes of allocating the total arrangement consideration among the elements. Credit is not extended to customers and revenue is not recognized until the Company has determined that the risk of uncollectability is minimal.
The Company’s products are sold with warranty provisions that require it to remedy deficiencies in quality or performance of the Company’s products over a specified period of time, generally twelve to twenty-four months, at no cost to its customers. Warranty liabilities are established at the time that revenue is recognized at levels that represent the Company’s estimate of the costs that will be incurred to fulfill those warranty requirements.
Provisions for estimated losses on sales or related receivables are recorded when identified. Revenue includes certain shipping and handling costs and is stated net of representative commissions and sales taxes. Service revenue is deferred and recognized over the contract period, as is the case for extended warranty contracts, or recognized as services are provided.
Cost of goods sold
Cost of goods sold includes materials, labor and overhead costs incurred in the manufacturing of products and services sold in the period as well as warranty costs. Material costs include raw materials, purchased components and sub-assemblies, outside processing and inbound freight costs. Labor and overhead costs consist of direct and indirect manufacturing costs, including wages and fringe benefits, operating supplies, depreciation, occupancy costs, and purchasing, receiving and inspection costs.
Research and development
Expenditures for research and development activities are expensed as incurred.
Cash equivalents
The Company considers short-term investments that are highly liquid, readily convertible into cash and have maturities of less than three months when purchased to be cash equivalents. Cash equivalents at December 31,
2013 and 2012
were
$28.5 million
and
$5.9 million
, respectively, which were primarily investments in money market funds.
Accounts receivable and allowance for doubtful accounts
Accounts receivable are stated at the amounts the Company expects to collect. Credit limits are established through a process of reviewing the financial history and stability of each customer. The Company regularly evaluates the collectability of its trade receivables balances based on a combination of factors. If it is determined that a customer will be unable to fully meet its financial obligation, the Company records a specific allowance to reduce the related receivable to the amount expected to be recovered. In addition, the Company also records an allowance for all other customers based on certain other factors including the length of time the receivables are past due and historical collection experience with individual customers.
43
FLIR SYSTEMS, INC.
NOTES TO THE CONSOLIDATED FINANCIAL STATEMENTS—(Continued)
|
Note 1.
|
Nature of Business and Significant Accounting Policies—(Continued)
|
Inventories
Inventories are generally stated at the lower of cost or market and include materials, labor, and manufacturing overhead. Cost is determined based on a currently adjusted standard cost basis that approximates actual manufacturing cost on a first-in, first-out basis.
Inventory write-downs are recorded when conditions exist to indicate that inventories are likely to be in excess of anticipated demand or are obsolete based upon the Company’s assumptions about future demand for its products and market conditions. The Company regularly evaluates its ability to realize the value of inventories based on a combination of factors including the following: historical usage rates, forecasted sales or usage, product end of life dates, estimated current and future market values and new product introductions. When recorded, write-downs reduce the carrying value of the Company’s inventories to their net realizable value and create a new cost-basis in the inventories. Write-downs are reflected in cost of goods sold in the Consolidated Statements of Income.
Demonstration units
The Company’s products which are being used as demonstration units are stated at the lower of cost or market and are included in prepaid expenses and other current assets in the Consolidated Balance Sheets. Demonstration units are available for sale and the Company periodically evaluates them as to marketability and realizable values. The carrying value of demonstration units was
$42.7 million
and
$35.8 million
at December 31,
2013 and 2012
, respectively.
Property and equipment
Property and equipment are stated at cost and are depreciated using a straight-line methodology over their estimated useful lives. Repairs and maintenance are charged to expense as incurred.
Goodwill
Goodwill is reviewed during the third quarter of each year, or more frequently if warranted, for impairment to determine if events or changes in business conditions indicate that the carrying value may not be recoverable. See Note 7, "Goodwill," for additional information.
Intangible assets
Intangible assets are amortized using a straight-line methodology over their estimated useful lives. Intangible assets with indefinite useful lives are evaluated annually for impairment, or more frequently if required. The Company did not recognize any impairment charges on intangible assets with indefinite lives during the years ended December 31,
2013, 2012 and 2011
.
Impairment of long-lived assets
Long-lived asset groups are reviewed for impairment when circumstances indicate that the carrying amounts may not be recoverable. Impairment exists when the carrying value is greater than the expected undiscounted future cash flows expected to be provided by the asset group. If impairment exists, the asset group is written down to its fair value. The Company did not recognize any impairment charges on long-lived assets during the years ended December 31,
2013, 2012 and 2011
.
Advertising costs
Advertising costs, which are included in selling, general and administrative expenses, are expensed as incurred. Advertising costs for the years ended December 31,
2013, 2012 and 2011
were
$10.7 million
,
$8.5 million
and
$11.1 million
, respectively.
Cost-basis investments
The Company has private company investments, which consist of investments for which the Company does not have the ability to exercise significant influence, and are accounted for under the cost method. The investments are carried at cost and adjusted only when the Company believes that events have occurred that are likely to have a significant other-than-temporary adverse effect on the estimated fair value of the investments. If no such events have occurred, the fair value of the investments is not calculated as it is not practicable to do so. The carrying value of those investments was
$13.5 million
at December 31,
2013 and 2012
. The investments are included in other assets in the Consolidated Balance Sheets.
44
FLIR SYSTEMS, INC.
NOTES TO THE CONSOLIDATED FINANCIAL STATEMENTS—(Continued)
|
Note 1.
|
Nature of Business and Significant Accounting Policies—(Continued)
|
Contingencies
The Company is subject to the possibility of loss contingencies arising in the normal course of business. An estimated loss is accrued when the Company determines that it is probable that an asset has been impaired or a liability has been incurred and the amount can be reasonably estimated. The Company regularly evaluates current available information to determine whether such accruals should be adjusted.
Earnings per share
Basic earnings per share is based on the weighted average number of shares of common stock outstanding during the period. Diluted earnings per share is computed similar to basic earnings per share except that the weighted shares outstanding are increased to include additional shares from the assumed exercise of stock options, if dilutive, assumed issuance of unvested restricted stock awards and from the assumed conversion of the convertible notes.
The following table sets forth the reconciliation of the numerator and denominator utilized in the computation of basic and diluted earnings per share (in thousands):
|
|
Year Ended December 31,
|
||||||||||
|
|
2013
|
2012
|
2011
|
||||||||
|
Numerator for earnings per share:
|
|||||||||||
|
Earnings from continuing operations
|
$
|
177,015
|
|
$
|
225,356
|
|
$
|
222,652
|
|
||
|
Loss from discontinued operations
|
—
|
|
(2,958
|
)
|
(1,178
|
)
|
|||||
|
Net earnings for basic and diluted earnings per share
|
$
|
177,015
|
|
$
|
222,398
|
|
$
|
221,474
|
|
||
|
Denominator for earnings per share:
|
|||||||||||
|
Weighted average number of common shares outstanding
|
142,446
|
|
151,634
|
|
158,323
|
|
|||||
|
Assumed exercise of stock options and vesting of restricted stock awards, net of shares assumed reacquired under the treasury stock method
|
2,149
|
|
1,960
|
|
2,528
|
|
|||||
|
Diluted shares outstanding
|
144,595
|
|
153,594
|
|
160,851
|
|
|||||
The effect of stock-based compensation awards for the years ended December 31,
2013, 2012 and 2011
that aggregated
549,000
,
1,198,000
and
352,000
shares have been excluded for purposes of diluted earnings per share since the effect would have been anti-dilutive.
Supplemental cash flow disclosure (in thousands)
|
|
Year Ended December 31,
|
||||||||||
|
|
2013
|
2012
|
2011
|
||||||||
|
Cash paid for:
|
|||||||||||
|
Interest
|
$
|
12,922
|
|
$
|
10,239
|
|
$
|
1,119
|
|
||
|
Taxes
|
$
|
88,277
|
|
$
|
74,333
|
|
$
|
106,215
|
|
||
45
FLIR SYSTEMS, INC.
NOTES TO THE CONSOLIDATED FINANCIAL STATEMENTS—(Continued)
|
Note 1.
|
Nature of Business and Significant Accounting Policies—(Continued)
|
Stock-based compensation
The Company uses the Black-Scholes option pricing model to estimate the fair value of stock option awards and shares expected to be issued under the Company's employee stock purchase plan. Nonvested stock awards (referred to as restricted stock unit awards) are valued at the fair market value of the Company's stock, discounted for dividends, on the date of grant, except for market-based restricted stock units for which the fair value is determined on the date of grant using a lattice-based option-pricing valuation model that incorporates a Monte-Carlo simulation. The Company recognizes the compensation expense for all stock-based compensation awards on a straight-line basis over the requisite service period of each award.
The following table sets forth the stock-based compensation expense and related tax benefit recognized in the Consolidated Statements of Income for the years ended December 31,
2013, 2012 and 2011
(in thousands):
|
|
Year Ended December 31,
|
||||||||||
|
|
2013
|
2012
|
2011
|
||||||||
|
Cost of goods sold
|
$
|
2,591
|
|
$
|
3,197
|
|
$
|
3,306
|
|
||
|
Research and development
|
4,938
|
|
5,001
|
|
5,195
|
|
|||||
|
Selling, general and administrative
|
20,294
|
|
18,052
|
|
16,416
|
|
|||||
|
Stock-based compensation expense before income taxes
|
27,823
|
|
26,250
|
|
24,917
|
|
|||||
|
Income tax benefit
|
(8,598
|
)
|
(7,737
|
)
|
(6,976
|
)
|
|||||
|
Total stock-based compensation expense after income taxes
|
$
|
19,225
|
|
$
|
18,513
|
|
$
|
17,941
|
|
||
Stock-based compensation expense capitalized in the Consolidated Balance Sheets as of December 31,
2013, 2012 and 2011
is as follows (in thousands):
|
|
December 31,
|
||||||||||
|
|
2013
|
2012
|
2011
|
||||||||
|
Capitalized in inventory
|
$
|
734
|
|
$
|
470
|
|
$
|
819
|
|
||
As of December 31,
2013
, the Company had approximately
$42.7 million
of total unrecognized stock-based compensation costs, net of estimated forfeitures, to be recognized over a weighted average period of
1.8
years.
The fair value of the stock-based awards granted in the years ended December 31,
2013, 2012 and 2011
was estimated with the following weighted-average assumptions:
|
2013
|
2012
|
2011
|
||||||
|
Stock option awards:
|
||||||||
|
Risk-free interest rate
|
0.3
|
%
|
0.4
|
%
|
1.0
|
%
|
||
|
Expected dividend yield
|
1.5
|
%
|
1.3
|
%
|
0.7
|
%
|
||
|
Expected term
|
4.3 years
|
|
4.2 years
|
|
4.3 years
|
|
||
|
Expected volatility
|
33.7
|
%
|
39.7
|
%
|
42.3
|
%
|
||
|
Market-based restricted stock awards:
|
||||||||
|
Risk-free interest rate
|
0.3
|
%
|
0.4
|
%
|
N/A
|
|
||
|
Expected dividend yield
|
0.0
|
%
|
0.0
|
%
|
N/A
|
|
||
|
Expected term
|
2.2 years
|
|
3.0 years
|
|
N/A
|
|
||
|
Expected volatility
|
28.8
|
%
|
30.7
|
%
|
N/A
|
|
||
|
Expected volatility of S&P 500
|
18.1
|
%
|
19.6
|
%
|
N/A
|
|
||
|
Employee stock purchase plan:
|
||||||||
|
Risk-free interest rate
|
0.1
|
%
|
0.2
|
%
|
0.1
|
%
|
||
|
Expected dividend yield
|
1.4
|
%
|
1.3
|
%
|
0.8
|
%
|
||
|
Expected term
|
6 months
|
|
6 months
|
|
6 months
|
|
||
|
Expected volatility
|
28.1
|
%
|
25.2
|
%
|
33.1
|
%
|
||
46
FLIR SYSTEMS, INC.
NOTES TO THE CONSOLIDATED FINANCIAL STATEMENTS—(Continued)
|
Note 1.
|
Nature of Business and Significant Accounting Policies—(Continued)
|
The Company uses the United States Treasury (constant maturity) interest rate on the date of grant as the risk-free interest rate and uses historical volatility as the expected volatility. The Company’s determination of expected term is based on an analysis of historical and expected exercise patterns. In
2013, 2012 and 2011
, all stock options granted were time-based options. The Company uses an estimated forfeiture rate of
5 percent
of the stock-compensation expense of non-executive employees based on an analysis of historical and expected forfeitures.
During the years ended December 31,
2013, 2012 and 2011
, the Company granted approximately
1,173,000
,
985,000
and
534,000
time-vested restricted stock units, respectively. In addition, during the year ended December 31, 2011, the Company granted approximately
101,000
performance-based restricted stock units. The fair value of time-vested and performance-based restricted stock units is fixed and determined on the date of grant based upon the Company's stock price on the date of grant. The weighted average fair values of the time-vested and performance-based restricted stock units granted during the years ended December 31,
2013, 2012 and 2011
were
$23.98
,
$21.66
and
$34.35
, respectively.
During the years ended December 31,
2013 and 2012
, the Company also granted approximately
7,000
and
795,000
market-based restricted stock units, respectively. These units may be earned based upon the Company's total shareholder return compared to the total shareholder return of the S&P 500 Index over a three year period. The fair value of the market-based restricted stock units granted during the years ended December 31,
2013 and 2012
was
$15.87
and
$11.73
, respectively. The total fair value of the restricted stock unit awards granted during the years ended December 31,
2013 and 2012
in the table below of
$28.2 million
and
$30.7 million
includes
$0.1 million
and
$9.3 million
, respectively, of grant date fair value associated with the market-based restricted stock units.
The weighted-average fair value of stock-based compensation awards granted and vested, and the intrinsic value of options exercised during the period were (in thousands, except per share amounts):
|
|
Years Ended December 31,
|
||||||||||
|
|
2013
|
2012
|
2011
|
||||||||
|
Stock option awards:
|
|||||||||||
|
Weighted average grant date fair value per share
|
$
|
5.92
|
|
$
|
6.43
|
|
$
|
11.61
|
|
||
|
Total fair value of awards granted
|
$
|
6,095
|
|
$
|
4,104
|
|
$
|
4,613
|
|
||
|
Total fair value of awards vested
|
$
|
5,059
|
|
$
|
6,023
|
|
$
|
8,492
|
|
||
|
Total intrinsic value of options exercised
|
$
|
4,642
|
|
$
|
5,928
|
|
$
|
21,234
|
|
||
|
Restricted stock unit awards:
|
|||||||||||
|
Weighted average grant date fair value per share
|
$
|
23.94
|
|
$
|
17.23
|
|
$
|
34.35
|
|
||
|
Total fair value of awards granted
|
$
|
28,239
|
|
$
|
30,660
|
|
$
|
21,822
|
|
||
|
Total fair value of awards vested
|
$
|
13,846
|
|
$
|
12,710
|
|
$
|
19,865
|
|
||
|
Employee stock purchase plan:
|
|||||||||||
|
Weighted average grant date fair value per share
|
$
|
5.94
|
|
$
|
4.66
|
|
$
|
6.99
|
|
||
|
Total fair value of shares estimated to be issued
|
$
|
1,169
|
|
$
|
1,694
|
|
$
|
2,359
|
|
||
The total amount of cash received from the exercise of stock options in the years ended December 31,
2013, 2012 and 2011
was
$4.6 million
,
$3.6 million
and
$13.8 million
, respectively, and the related tax benefit realized from the exercise of the stock options was
$0.6 million
,
$0.1 million
and
$5.5 million
, respectively.
The Company elected to adopt the “long-haul” method to calculate the historical pool of windfall tax benefits, which calculates on a grant by grant basis, the windfall or excess tax benefit that arose upon the exercise of each stock option, based on a comparison to the total tax deduction to the “as-if” deferred tax asset that would have been recorded had the Company followed the recognition provisions of Financial Accounting Standards Board Accounting Standards Codification (“FASB ASC”) Topic 718, “Compensation-Stock Compensation,” since its effective date of January 1, 2006. Additionally, the Company elected to adopt the “tax-law ordering” method of measuring the timing in which tax deductions on stock option exercises should be recognized in the consolidated financial statements.
47
FLIR SYSTEMS, INC.
NOTES TO THE CONSOLIDATED FINANCIAL STATEMENTS—(Continued)
|
Note 1.
|
Nature of Business and Significant Accounting Policies—(Continued)
|
Concentration of risk
Financial instruments that potentially subject the Company to concentration of credit risk consist primarily of trade receivables. Concentration of credit risk with respect to trade receivables is limited because a relatively large number of geographically diverse customers make up the Company’s customer base, thus diversifying the trade credit risk. The Company controls credit risk through credit approvals, credit limits and monitoring procedures. The Company performs credit evaluations for all new customers and requires letters of credit, bank guarantees and advanced payments, if deemed necessary.
A substantial portion of the Company’s revenue is derived from sales to United States and foreign government agencies (see Note 17, "Operating Segments and Related Information"). The Company also purchases certain key components from sole or limited source suppliers.
The Company maintains cash deposits with major banks that from time to time may exceed federally insured limits. The Company periodically assesses the financial condition of the institutions and instruments in which it invests, and adjusts its investment balances to mitigate the risk of principal loss.
Use of estimates
The preparation of financial statements in conformity with United States generally accepted accounting principles requires management to make estimates and judgments that affect the reported amounts of assets and liabilities and disclosure of contingent assets and liabilities at the date of the financial statements, and the reported amounts of revenue and expenses during the reporting period. Significant estimates and judgments made by management of the Company include matters such as collectability of accounts receivable, realizability of inventories, recoverability of deferred tax assets, impairment of goodwill and other long-lived assets, loss contingencies and adequacy of warranty accruals. Actual results could differ from those estimates. The Company believes that the estimates used are reasonable.
Accumulated other comprehensive earnings
Accumulated other comprehensive earnings includes cumulative translation adjustments, fair value adjustments on cash flow hedges and changes in minimum liability for pension plans. Foreign currency translation adjustments included in comprehensive income were not tax affected as investments in international affiliates are deemed to be indefinite in duration.
The following table sets forth the changes in the balances of each component of accumulated other comprehensive income for the year ended December 31. 2013:
|
|
|
Pension Plans
Items
|
|
Cash Flow
Hedge Items
|
|
Foreign
Currency
Items
|
|
Total
|
||||||||
|
Balance, December 31, 2012
|
|
$
|
(5,127
|
)
|
$
|
—
|
|
$
|
14,668
|
|
$
|
9,541
|
|
|||
|
Other comprehensive income before reclassifications, net of tax
|
|
184
|
|
1,105
|
|
11,838
|
|
13,127
|
|
|||||||
|
Amounts reclassified from accumulated other comprehensive earnings, net of tax
|
|
2,777
|
|
555
|
|
—
|
|
3,332
|
|
|||||||
|
Net current period other comprehensive income, net of tax
|
|
2,961
|
|
1,660
|
|
11,838
|
|
16,459
|
|
|||||||
|
Balance, December 31, 2013
|
|
$
|
(2,166
|
)
|
$
|
1,660
|
|
$
|
26,506
|
|
$
|
26,000
|
|
|||
The amounts reclassified from accumulated other comprehensive earnings for pension plan items have been recorded in selling, general and administrative expenses and amounts reclassified for cash flow hedge items have been recorded to interest expense in the Company's Consolidated Statement of Income for the year ended December 31, 2013.
48
FLIR SYSTEMS, INC.
NOTES TO THE CONSOLIDATED FINANCIAL STATEMENTS—(Continued)
|
Note 1.
|
Nature of Business and Significant Accounting Policies—(Continued)
|
Recent accounting pronouncements
In February 2013, the Financial Accounting Standards Board ("FASB") issued Accounting Standards Update No. 2013-02, "Reporting of Amounts Reclassified Out of Accumulated Other Comprehensive Income" ("ASU 2013-02") which establishes new requirements for disclosing reclassifications of items out of accumulated other comprehensive income and includes identification of the line items in net earnings affected by the reclassifications. ASU 2013-02 is effective for annual and interim periods for fiscal years beginning after December 15, 2012. Accordingly, the Company adopted ASU 2013-02 on January 1, 2013.
In March 2013, the FASB issued Accounting Standards Update No. 2013-05, "Parent's Accounting for the Cumulative Translation Adjustment upon Derecognition of Certain Subsidiaries or Groups of Assets within a Foreign Entity or of an Investment in a Foreign Entity" ("ASU 2013-05") which addresses the accounting for the cumulative translation adjustment when a parent either sells a part or all of its investment in a foreign entity or no longer holds a controlling financial interest in a subsidiary or group of assets that is a nonprofit activity or a business within a foreign entity. ASU 2013-05 is effective for annual and interim periods beginning after December 15, 2014. Accordingly, the Company currently intends to adopt ASU 2013-05 on January 1, 2015 and does not expect the adoption of ASU 2013-05 to have a material impact on its consolidated financial statements.
In July 2013, the FASB issued Accounting Standards Update No. 2013-11, "Presentation of an Unrecognized Tax Benefit When a Net Operating Loss Carryforward, a Similar Tax Loss, or a Tax Credit Carryforward Exists" ("ASU 2013-11"). ASU 2013-11 amends the guidance related to the presentation of unrecognized tax benefits and allows for the reduction of a deferred tax asset for a net operating loss ("NOL") carryforward whenever the NOL or tax credit carryforward would be available to reduce the additional taxable income or tax due if the tax position is disallowed. ASU 2013-11 is effective for annual and interim periods for fiscal years beginning after December 15, 2013, and early adoption is permitted. Since ASU 2013-11 relates only to the presentation of unrecognized tax benefits, we do not expect our adoption of ASU 2013-11 in January 2014 will have a material effect on our financial position, results of operations or cash flows.
|
Note 2.
|
Fair Value of Financial Instruments
|
The Company had
$28.5 million
and
$5.9 million
of cash equivalents at December 31,
2013 and 2012
, respectively, which were primarily investments in money market funds. The Company has categorized its cash equivalents as a Level 1 financial asset, measured at fair value based on quoted prices in active markets of identical assets, in accordance with FASB ASC Topic 820, “Fair Value Measurements and Disclosures.” All cash equivalents are in instruments that are convertible to cash daily. The fair value of the Company’s forward currency contracts and interest rate swap contracts as of December 31,
2013 and 2012
are disclosed in Note 3, "Derivative Financial Instruments," and based on Level 2 inputs. The fair value of the Company’s senior unsecured notes as described in Note 11, "Long-Term Debt," is approximately
$259.5 million
based upon Level 2 inputs at
December 31, 2013
. The fair value of the Company's term loan, also described in Note 11, approximates the carrying value due to the variable market rate used to calculate interest payments. The Company does not have any other significant financial assets or liabilities that are measured at fair value.
The carrying amount of accounts receivable, accounts payable and accrued payroll and related liabilities approximates the fair value of those instruments due to their short-term nature.
|
Note 3.
|
Derivative Financial Instruments
|
Foreign Currency Exchange Rate Risk
The Company’s foreign businesses enter into contracts with customers and vendors that are denominated in currencies other than their functional currencies. To protect the functional currency equivalent cash flows associated with certain of these contracts, the Company enters into foreign currency forward contracts. The Company’s activities involving foreign currency forward contracts are designed to hedge the changes in the functional currency equivalent cash flows due to movements in foreign exchange rates compared to the functional currency. The foreign currencies hedged are primarily the euro and the Swedish kroner. The Company manages exposure to counterparty non-performance credit risk by entering into foreign currency forward contracts only with major financial institutions that are expected to fully perform under the terms of such contracts. Gains and losses on foreign currency forward contracts are recognized in income at the end of each reporting period based on the difference between the contract rate and the spot rate. The net amount of the gains and losses related to derivative instruments recorded in other expense for the year ended December 31,
2013, 2012 and 2011
were a loss of
$4.6 million
, a gain of
$5.1 million
and a loss of
$2.3 million
, respectively.
In general, these losses are offset in the Consolidated Statement of Income by the reciprocal gains from the underlying assets or liabilities which originally gave rise to the exposure.
49
FLIR SYSTEMS, INC.
NOTES TO THE CONSOLIDATED FINANCIAL STATEMENTS—(Continued)
|
Note 3.
|
Derivative Financial Instruments - (Continued)
|
Notional amounts are used to measure the volume of foreign currency forward contracts and do not represent exposure to foreign currency gains or losses. The table below presents the net notional amounts of the Company’s outstanding foreign currency forward contracts by currency at December 31,
2013 and 2012
(in thousands):
|
Year Ended December 31,
|
|||||||
|
2013
|
2012
|
||||||
|
Swedish kronor
|
$
|
99,214
|
|
$
|
98,385
|
|
|
|
Euro
|
265
|
|
2,232
|
|
|||
|
British pound sterling
|
5,641
|
|
15,619
|
|
|||
|
Australian dollar
|
5,986
|
|
7,022
|
|
|||
|
Japanese yen
|
4,462
|
|
5,157
|
|
|||
|
Other
|
6,362
|
|
622
|
|
|||
|
$
|
121,930
|
|
$
|
129,037
|
|
||
At December 31,
2013
, the Company’s foreign currency forward contracts, in general, had maturities of
six months
or less.
The carrying amount of our derivative instruments included in the Consolidated Balance Sheets are as follows (in thousands):
|
December 31, 2013
|
December 31, 2012
|
||||||||||||||
|
Other Current Assets
|
Other Current Liabilities
|
Other Current Assets
|
Other Current Liabilities
|
||||||||||||
|
Foreign exchange contracts
|
$
|
392
|
|
$
|
613
|
|
$
|
2,106
|
|
$
|
229
|
|
|||
Interest Rates
The Company's outstanding long-term debt at
December 31, 2013
consists of fixed rate notes and a floating rate term loan. The Company maintains its floating rate revolver for flexibility to fund working capital needs and for other uses of cash. Interest expense on the Company's floating rate debt is typically calculated based on a fixed spread over a reference rate, such as LIBOR (also known as the Eurocurrency rate). Therefore, fluctuations in market interest rates will cause interest expense increases or decreases on a given amount of floating rate debt.
The Company is managing its interest rate risk related to floating rate debt by entering into interest rate swaps in which the Company receives floating rate payments and makes fixed rate payments. The impact of the interest rate swaps is to fix the floating rate basis for the calculation of interest on the term loan at the levels indicated in the table below. The effective interest rate paid is equal to the fixed rates shown below plus the credit spread then in effect. At
December 31, 2013
, the effective interest rate on the term loan was
2.49
percent. As of
December 31, 2013
, the following interest rate swaps were outstanding:
|
Contract Date
|
Notional Amount
(in millions)
|
Fixed Rate
|
Effective Date
|
Maturity Date
|
|||||||
|
March 15, 2013
|
$
|
69.4
|
|
1.0165
|
%
|
April 5, 2013
|
March 31, 2019
|
||||
|
March 29, 2013
|
$
|
69.4
|
|
0.97
|
%
|
April 5, 2013
|
March 31, 2019
|
||||
These interest rate swaps are cash flow hedges and are recorded as an asset or liability in the Company's Consolidated Balance Sheet at fair value. Fair value adjustments are recorded as an adjustment to accumulated other comprehensive (loss) earnings, except that any gains and losses on ineffectiveness of the interest rate swaps would be recorded as an adjustment to other expense (income). The net fair value carrying amount of the Company's interest rate swaps was
$2.5 million
, of which
$3.5 million
and
$1.0 million
have been recorded to other assets and other current liabilities, respectively, in the Consolidated Balance Sheet as of
December 31, 2013
. The amount recognized in other comprehensive income (loss) during the year ended December 31, 2013 was a gain of
$1.7 million
, which is net of tax effects.
50
FLIR SYSTEMS, INC.
NOTES TO THE CONSOLIDATED FINANCIAL STATEMENTS—(Continued)
|
Note 4.
|
Accounts Receivable
|
Accounts receivable are net of an allowance for doubtful accounts. The following table summarizes the Company’s allowance for doubtful accounts and the activity for
2013, 2012 and 2011
(in thousands):
|
|
Year Ended December 31,
|
||||||||||
|
|
2013
|
2012
|
2011
|
||||||||
|
Allowance for doubtful accounts, beginning of year
|
$
|
6,574
|
|
$
|
5,556
|
|
$
|
5,104
|
|
||
|
Charges to costs and expenses
|
1,571
|
|
2,383
|
|
1,699
|
|
|||||
|
Write-offs of uncollectible accounts, net of recoveries
|
(505
|
)
|
(1,055
|
)
|
(973
|
)
|
|||||
|
Business acquisitions and disposals
|
—
|
|
(351
|
)
|
(148
|
)
|
|||||
|
Currency translation adjustments
|
34
|
|
41
|
|
(126
|
)
|
|||||
|
Allowance for doubtful accounts, end of year
|
$
|
7,674
|
|
$
|
6,574
|
|
$
|
5,556
|
|
||
|
Note 5.
|
Inventories
|
Inventories consist of the following (in thousands):
|
|
December 31,
|
||||||
|
|
2013
|
2012
(as adjusted)
|
|||||
|
Raw material and subassemblies
|
$
|
204,542
|
|
$
|
231,273
|
|
|
|
Work-in-progress
|
45,060
|
|
50,644
|
|
|||
|
Finished goods
|
95,117
|
|
97,163
|
|
|||
|
$
|
344,719
|
|
$
|
379,080
|
|
||
Property and equipment are summarized as follows (in thousands):
|
|
Estimated
Useful Life
|
December 31,
|
|||||||
|
|
2013
|
2012
|
|||||||
|
Land
|
—
|
$
|
25,254
|
|
$
|
23,194
|
|
||
|
Buildings
|
30 years
|
115,206
|
|
109,587
|
|
||||
|
Machinery and equipment
|
3 to 7 years
|
237,179
|
|
186,303
|
|
||||
|
Office equipment and other
|
3 to 10 years
|
91,666
|
|
83,001
|
|
||||
|
469,305
|
|
402,085
|
|
||||||
|
Less accumulated depreciation
|
(235,264
|
)
|
(190,470
|
)
|
|||||
|
$
|
234,041
|
|
$
|
211,615
|
|
||||
Depreciation expense for the years ended December 31,
2013, 2012 and 2011
was
$35.9 million
,
$35.3 million
and
$43.8 million
, respectively.
51
FLIR SYSTEMS, INC.
NOTES TO THE CONSOLIDATED FINANCIAL STATEMENTS—(Continued)
|
Note 7.
|
Goodwill
|
During the year ended December 31, 2013, the Company completed the purchase price accounting associated with the 2012 acquisitions of Lorex and Traficon resulting in an increase of goodwill of
$61.2 million
which was retrospectively adjusted. Also during 2013, the Company recorded goodwill in connection with its acquisition of Marine and Remote Sensing Solutions, Ltd. ("MARSS") and the acquisition of certain tangible assets and intellectual property from DigitalOptics Corporation East ("DOC Charlotte"). See Note 18, "Business Acquisitions," for additional information.
The Company reviews its goodwill for impairment annually during the third quarter, or more frequently, if there is a triggering event. A two-step test is performed to assess goodwill for impairment. First, the fair value of the reporting unit is compared to its carrying value. If the fair value exceeds the carrying value, goodwill is not impaired and no further testing is required. The second step is performed if the carrying value exceeds the fair value. The implied fair value of the reporting unit’s goodwill must be determined and compared to the carrying value of the goodwill. If the carrying value of a reporting unit’s goodwill exceeds its implied fair value, an impairment loss equal to the difference will be recorded. In determining the fair value of the reporting units, the Company relied upon the Income Approach and the Market Approach. Under the Income Approach, the fair value of a business is based on the cash flows it can be expected to generate over its remaining life. The estimated cash flows are converted to their present value equivalent using an appropriate rate of return and are analyzed within the boundary of the overall market capitalization of the Company. Under the Market Approach, the fair value of the business is based on forecasted earnings multiplied by an average earnings multiplier of a group of the Company’s peers and compared to the net assets of each reporting unit.
During the third quarter of
2013
, the Company completed its annual review of goodwill and determined that no impairment of its recorded goodwill was necessary. As of December 31,
2013
, there had been no triggering events or indicators of impairment that would require an updated impairment review.
The carrying value of goodwill by reporting segment and the activity for the two year period ending December 31,
2013
is as follows (in thousands):
|
Thermal Vision and Measurement
|
Raymarine
|
Surveillance
|
Detection
|
Integrated Systems
|
Total
|
||||||||||||||||||
|
Balance, December 31, 2011
|
$
|
251,187
|
|
$
|
98,364
|
|
$
|
90,501
|
|
$
|
38,162
|
|
$
|
20,129
|
|
$
|
498,343
|
|
|||||
|
Currency translation adjustments
|
2,039
|
|
2,380
|
|
316
|
|
—
|
|
—
|
|
4,735
|
|
|||||||||||
|
Balance, December 31, 2012
(as originally reported) |
253,226
|
|
100,744
|
|
90,817
|
|
38,162
|
|
20,129
|
|
503,078
|
|
|||||||||||
|
Retrospective adjustments
|
61,228
|
|
—
|
|
—
|
|
—
|
|
—
|
|
61,228
|
|
|||||||||||
|
Balance, December 31, 2012
(as adjusted)
|
314,454
|
|
100,744
|
|
90,817
|
|
38,162
|
|
20,129
|
|
564,306
|
|
|||||||||||
|
Goodwill from acquisitions
|
2,401
|
|
—
|
|
—
|
|
—
|
|
2,463
|
|
4,864
|
|
|||||||||||
|
Currency translation adjustments
|
4,669
|
|
1,684
|
|
77
|
|
—
|
|
101
|
|
6,531
|
|
|||||||||||
|
Balance, December 31, 2013
|
$
|
321,524
|
|
$
|
102,428
|
|
$
|
90,894
|
|
$
|
38,162
|
|
$
|
22,693
|
|
$
|
575,701
|
|
|||||
52
FLIR SYSTEMS, INC.
NOTES TO THE CONSOLIDATED FINANCIAL STATEMENTS—(Continued)
Intangible assets are summarized as follows (in thousands):
|
|
Weighted
Average
Estimated
Useful Life
|
December 31,
|
|||||||
|
|
2013
|
2012
(as adjusted)
|
|||||||
|
Product technology
|
11 years
|
$
|
69,919
|
|
$
|
94,975
|
|
||
|
Customer relationships
|
11 years
|
83,899
|
|
84,681
|
|
||||
|
Trademarks and tradename portfolios
|
15 years
|
7,160
|
|
7,160
|
|
||||
|
Tradename portfolio not subject to amortization
|
Indefinite
|
39,166
|
|
38,875
|
|
||||
|
Other
|
5 years
|
21,996
|
|
24,319
|
|
||||
|
Acquired identifiable intangibles
|
222,140
|
|
250,010
|
|
|||||
|
Less accumulated amortization
|
(70,517
|
)
|
(78,328
|
)
|
|||||
|
Net acquired identifiable intangibles
|
151,623
|
|
171,682
|
|
|||||
|
Patents
|
17 years
|
4,471
|
|
4,464
|
|
||||
|
Less accumulated amortization
|
(3,989
|
)
|
(3,960
|
)
|
|||||
|
Net patents
|
482
|
|
504
|
|
|||||
|
Acquired in-place leases and other
|
6 years
|
9,333
|
|
9,150
|
|
||||
|
Less accumulated amortization
|
(7,243
|
)
|
(5,513
|
)
|
|||||
|
Net acquired in-place leases and other
|
2,090
|
|
3,637
|
|
|||||
|
$
|
154,195
|
|
$
|
175,823
|
|
||||
During the year ended December 31, 2013, the Company acquired
$0.4 million
of identifiable intangible assets as part of the acquisition of MARSS and
$2.5 million
of identifiable intangible assets as part of the acquisition of certain tangible assets and intellectual property from DOC Charlotte. During the year ended December 31, 2012, the Company acquired $
15.1 million
of identifiable intangible assets as part of the acquisition of Lorex and $
20.1 million
as part of the acquisition of Traficon. Intangible assets at December 31, 2012 have been retrospectively adjusted for the purchase price accounting completed during 2013 associated with the Lorex and Traficon acquisitions. See Note 18, "Business Acquisitions."
The aggregate amortization expense recorded in
2013, 2012 and 2011
was
$24.7 million
,
$24.4 million
and
$33.2 million
, respectively. For intangible assets recorded at
December 31, 2013
, the estimated future aggregate amortization expense for the years ending December 31,
2014
through
2018
is approximately (in thousands):
|
2014
|
$
|
21,450
|
|
|
2015
|
16,510
|
|
|
|
2016
|
12,025
|
|
|
|
2017
|
11,544
|
|
|
|
2018
|
9,391
|
|
|
53
FLIR SYSTEMS, INC.
NOTES TO THE CONSOLIDATED FINANCIAL STATEMENTS—(Continued)
|
Note 9.
|
Credit Agreement
|
On February 8, 2011, the Company entered into a Credit Agreement (“Credit Agreement”) with Bank of America, N.A., U.S. Bank National Association, JPMorgan Chase Bank N.A. and other Lenders. The Credit Agreement provides for a
$200 million
,
five
-year revolving line of credit. On April 5, 2013, the Credit Agreement was amended to extend the maturity of the revolving credit facility from April 8, 2016 to April 5, 2018 in addition to incorporating a
$150 million
term loan facility maturing April 5, 2019. The amendment also incorporated a revised schedule of fees and interest rate spreads. The Company has the right, subject to certain conditions including approval of additional commitments by qualified lenders, to increase the revolving line of credit under the Credit Agreement by an additional
$150 million
at any time prior to April 5, 2018. The Credit Agreement allows the Company and certain designated subsidiaries to borrow in United States dollars, euros, Swedish kronor, pound sterling, Japanese yen, Canadian dollars, Australian dollars and other agreed upon currencies. Borrowing rates under the Credit Agreement are determined at the Company’s option at the time of each borrowing and are generally based on either the prime lending rate of Bank of America, N.A. or the rate of interest paid for deposits in the relevant currency, plus a specified spread based on an established consolidated total leverage ratio pricing grid, which specified margins ranging from
0.25 percent
to
2.25 percent
based on the type of loan and the total leverage ratio of the Company. Including the respective spreads, the one-month LIBOR interest rate was
1.669 percent
and the prime lending rate was
3.75 percent
at December 31,
2013
. The Credit Agreement requires the Company to pay a commitment fee on the amount of unused revolving credit at a rate, based on the Company’s total leverage ratio, which commitment fee rate ranges from
0.25 percent
to
0.40 percent
of unused revolving commitments. At December 31,
2013
, the commitment fee rate was
0.30 percent
.
The Credit Agreement contains two financial covenants that require the maintenance of a total leverage ratio and an interest coverage ratio
, with which the Company was in compliance at
December 31, 2013
. The credit facilities available under the Credit Agreement are unsecured. At December 31,
2013
, the Company had no revolving loans outstanding under the Credit Agreement and had
$19.5 million
of letters of credit outstanding, which reduces the total available revolving credit under the Credit Agreement.
|
Note 10.
|
Accrued Product Warranties
|
The Company generally provides a
twelve
to
twenty-four
month warranty on its products. A provision for the estimated future costs of warranty, based upon historical cost and product performance experience, is recorded when revenue is recognized. The following table summarizes the Company’s warranty liability and activity for
2013, 2012 and 2011
(in thousands):
|
|
Year Ended December 31,
|
||||||||||
|
|
2013
|
2012
|
2011
|
||||||||
|
Accrued product warranties, beginning of year
|
$
|
16,152
|
|
$
|
16,046
|
|
$
|
18,686
|
|
||
|
Amounts paid for warranty services
|
(10,372
|
)
|
(12,317
|
)
|
(11,849
|
)
|
|||||
|
Warranty provisions for products sold
|
10,917
|
|
10,477
|
|
9,519
|
|
|||||
|
Business acquisitions and disposals
|
—
|
|
839
|
|
(20
|
)
|
|||||
|
Currency translation adjustments and other
|
1,035
|
|
1,107
|
|
(290
|
)
|
|||||
|
Accrued product warranties, end of year
|
$
|
17,732
|
|
$
|
16,152
|
|
$
|
16,046
|
|
||
|
Current accrued product warranties, end of year
|
$
|
14,665
|
|
$
|
13,169
|
|
$
|
13,370
|
|
||
|
Long-term accrued product warranties, end of year
|
$
|
3,067
|
|
$
|
2,983
|
|
$
|
2,676
|
|
||
54
FLIR SYSTEMS, INC.
NOTES TO THE CONSOLIDATED FINANCIAL STATEMENTS—(Continued)
Long-term debt consists of the following (in thousands):
|
|
December 31,
|
||||||
|
|
2013
|
2012
|
|||||
|
Unsecured notes
|
$
|
250,000
|
|
$
|
250,000
|
|
|
|
Term loan
|
138,750
|
|
—
|
|
|||
|
Unamortized discounts and issuance costs of unsecured notes
|
(1,222
|
)
|
(1,681
|
)
|
|||
|
$
|
387,528
|
|
$
|
248,319
|
|
||
|
Current portion, long-term debt
|
$
|
15,000
|
|
$
|
—
|
|
|
|
Long-term debt
|
$
|
372,528
|
|
$
|
248,319
|
|
|
In August 2011, the Company issued
$250 million
aggregate principal amount of its
3.75 percent
senior unsecured notes due
September 1, 2016
(the “Notes”). The net proceeds from the issuance of the Notes were approximately
$247.7 million
, after deducting underwriting fees and other offering expenses, which are being amortized over a period of
five
years. Interest is payable on the Notes
semiannually
in arrears on
March 1 and September 1
. The proceeds from the Notes are being used for general corporate purposes, which may include working capital and capital expenditure needs, business acquisitions and repurchases of the Company’s common stock.
On April 5, 2013, the Company borrowed
$150 million
under the term loan facility incorporated in the Credit Agreement. Principal payments of
$3.75 million
are made
quarterly
and commenced on June 30, 2013 and will continue through December 31, 2018 with final maturity payment, including any interest due, on
April 5, 2019
.
Interest is accrued at a one-month LIBOR rate
, plus the scheduled spread and paid monthly. See Note 3, "Derivative Financial Instruments -
Interest rates,
" for additional information on the effective interest rate on the term loan at December 31, 2013.
|
Note 12.
|
Commitments
|
The Company leases some of its primary facilities under various operating leases that expire in 2014 through 2023. The Company also leases certain operating machinery and equipment and office equipment under operating lease agreements. Total net rent expense for the years ended December 31,
2013, 2012 and 2011
amounted to
$18.3 million
,
$13.6 million
and
$10.1 million
, respectively.
The future minimum obligations under all non-cancelable leases, net of expected sublease income, and other contractual obligations are as follows (in thousands):
|
Net
Operating
Leases
|
Other
Contractual
Obligations
|
||||||
|
2014
|
$
|
11,680
|
|
$
|
1,020
|
|
|
|
2015
|
7,557
|
|
1,008
|
|
|||
|
2016
|
2,435
|
|
550
|
|
|||
|
2017
|
1,488
|
|
550
|
|
|||
|
2018
|
1,428
|
|
550
|
|
|||
|
Thereafter
|
1,718
|
|
—
|
|
|||
|
Total minimum payments
|
$
|
26,306
|
|
$
|
3,678
|
|
|
55
FLIR SYSTEMS, INC.
NOTES TO THE CONSOLIDATED FINANCIAL STATEMENTS—(Continued)
|
Note 13.
|
Contingencies
|
The Company and its subsidiary, Indigo Systems Corporation (now known as FLIR Commercial Systems, Inc.) (together, the “FLIR Parties”), were named in a lawsuit filed by Raytheon Company (“Raytheon”) on March 2, 2007 in the United States District Court for the Eastern District of Texas. Raytheon's complaint, as amended, asserted claims for tortious interference, patent infringement, trade secret misappropriation, unfair competition, breach of contract and fraudulent concealment. The FLIR Parties filed an answer to the complaint on September 2, 2008, in which they denied all material allegations. On August 31, 2009, the court entered an order granting the FLIR Parties' motion for summary judgment on Raytheon's trade secret misappropriation claim based on the FLIR Parties' statute of limitations defense. Raytheon abandoned all of its other claims except its claims relating to four patents (the “Patent Claims”). On August 11, 2010, the FLIR Parties and Raytheon entered into an agreement in principle to resolve the remaining Patent Claims, which resulted in a payment of
$3 million
by the FLIR Parties to Raytheon and entitles the FLIR Parties to certain license rights in the patents that were the subject of the Patent Claims. The parties appealed certain rulings of the District Court to the United States Court of Appeals for the Federal Circuit which on August 1, 2012 reversed the judgment of the District Court and remanded the case for further proceedings consistent with the appellate court's opinion. The Company intends to vigorously defend itself in this matter and is unable to estimate the amount or range of potential loss, if any, which might result if the outcome in this matter is unfavorable.
On May 20, 2011, the Company made a cash settlement payment of
$39.0 million
to resolve all pending claims in an action filed against the Company. In the settlement agreement, the Company also received a non-exclusive license to certain infrared technology.
The Company is also subject to other legal proceedings, claims and litigation arising in the ordinary course of business. The Company makes a provision for a liability when it is both probable that a liability has been incurred and the amount of loss can be reasonably estimated. The Company believes it has recorded adequate provisions for any probable and estimable losses. While the outcome of these matters is currently not determinable, the Company does not expect that the ultimate costs to resolve such matters will have a material adverse effect on the Company’s financial position, results of operations or cash flows.
56
FLIR SYSTEMS, INC.
NOTES TO THE CONSOLIDATED FINANCIAL STATEMENTS—(Continued)
|
Note 14.
|
Income Taxes
|
The Company recognizes deferred tax assets and liabilities for the expected future tax consequences of events and basis differences that have been recognized in the Company’s financial statements and tax returns. Under this method, deferred tax assets and liabilities are determined based on the difference between the financial statement carrying amount and the tax basis of assets and liabilities using the enacted tax rates in effect in the years in which the differences are expected to reverse.
Pre-tax earnings by significant geographical locations from continuing operations are as follows (in thousands):
|
|
Year Ended December 31,
|
||||||||||
|
|
2013
|
2012
|
2011
|
||||||||
|
United States
|
$
|
118,269
|
|
$
|
180,022
|
|
$
|
192,219
|
|
||
|
Foreign
|
110,717
|
|
111,890
|
|
118,860
|
|
|||||
|
$
|
228,986
|
|
$
|
291,912
|
|
$
|
311,079
|
|
|||
The provisions for income taxes from continuing operations are as follows (in thousands):
|
|
Year Ended December 31,
|
||||||||||
|
|
2013
|
2012
|
2011
|
||||||||
|
Current tax expense (benefit):
|
|||||||||||
|
Federal
|
$
|
38,249
|
|
$
|
53,187
|
|
$
|
62,858
|
|
||
|
State
|
4,413
|
|
(3,075
|
)
|
9,262
|
|
|||||
|
Foreign
|
13,483
|
|
21,138
|
|
24,452
|
|
|||||
|
56,145
|
|
71,250
|
|
96,572
|
|
||||||
|
Deferred tax expense (benefit):
|
|||||||||||
|
Federal
|
(252
|
)
|
3,194
|
|
(5,185
|
)
|
|||||
|
State
|
(335
|
)
|
1,887
|
|
(993
|
)
|
|||||
|
Foreign
|
(3,587
|
)
|
(9,775
|
)
|
(1,967
|
)
|
|||||
|
(4,174
|
)
|
(4,694
|
)
|
(8,145
|
)
|
||||||
|
Total provision
|
$
|
51,971
|
|
$
|
66,556
|
|
$
|
88,427
|
|
||
57
FLIR SYSTEMS, INC.
NOTES TO THE CONSOLIDATED FINANCIAL STATEMENTS—(Continued)
|
Note 14.
|
Income Taxes—(Continued)
|
Deferred tax assets (liabilities) are composed of the following components (in thousands):
|
|
December 31,
|
||||||
|
|
2013
|
2012
(as adjusted)
|
|||||
|
Allowance for doubtful accounts
|
$
|
1,295
|
|
$
|
1,123
|
|
|
|
Accrued product warranties
|
3,069
|
|
3,099
|
|
|||
|
Inventory basis differences
|
11,421
|
|
9,225
|
|
|||
|
Accrued liabilities
|
8,987
|
|
7,206
|
|
|||
|
Deferred revenue
|
1,775
|
|
2,205
|
|
|||
|
Current net operating loss
|
7,449
|
|
8,085
|
|
|||
|
Other
|
(1,024
|
)
|
(1,025
|
)
|
|||
|
Foreign accrued liabilities
|
4,504
|
|
—
|
|
|||
|
Foreign other
|
913
|
|
1,042
|
|
|||
|
Net current deferred tax assets
|
$
|
38,389
|
|
$
|
30,960
|
|
|
|
Net operating loss carry-forwards
|
$
|
6,143
|
|
$
|
11,588
|
|
|
|
Credit carry-forwards
|
6,391
|
|
7,034
|
|
|||
|
Domestic depreciation
|
(5,455
|
)
|
(7,222
|
)
|
|||
|
Supplemental Executive Retirement Plan
|
3,198
|
|
7,491
|
|
|||
|
Stock-based compensation
|
17,239
|
|
13,745
|
|
|||
|
Intangibles
|
(14,450
|
)
|
(15,999
|
)
|
|||
|
Accrued Liabilities
|
7,624
|
|
6,033
|
|
|||
|
Domestic other
|
1,416
|
|
4,018
|
|
|||
|
Foreign credit carry-forwards
|
—
|
|
3,590
|
|
|||
|
Foreign intangibles
|
—
|
|
(1,259
|
)
|
|||
|
Foreign net operating loss carry-forwards
|
760
|
|
8,119
|
|
|||
|
Foreign other
|
16
|
|
(78
|
)
|
|||
|
Valuation allowance
|
(4,999
|
)
|
(4,837
|
)
|
|||
|
Net long-term deferred tax assets
|
$
|
17,883
|
|
$
|
32,223
|
|
|
|
Foreign credit carry-forwards
|
$
|
2,922
|
|
$
|
—
|
|
|
|
Foreign depreciation
|
2,418
|
|
3,196
|
|
|||
|
Foreign intangibles
|
(18,528
|
)
|
(23,597
|
)
|
|||
|
Foreign net operating loss carry-forwards
|
8,930
|
|
5,336
|
|
|||
|
Foreign other
|
461
|
|
504
|
|
|||
|
Valuation allowance
|
(8,457
|
)
|
(4,510
|
)
|
|||
|
Net long-term deferred tax liabilities
|
$
|
(12,254
|
)
|
$
|
(19,071
|
)
|
|
The provision for income taxes differs from the amount of tax determined by applying the applicable United States statutory federal income tax rate to pretax income as a result of the following differences:
|
|
Year Ended December 31,
|
|||||||
|
|
2013
|
2012
|
2011
|
|||||
|
Statutory federal tax rate
|
35.0
|
%
|
35.0
|
%
|
35.0
|
%
|
||
|
Increase (decrease) in rates resulting from:
|
||||||||
|
Foreign rate differential
|
(11.6
|
)
|
(10.4
|
)
|
(3.8
|
)
|
||
|
Foreign, federal and state income tax credits
|
(2.2
|
)
|
(2.7
|
)
|
(2.9
|
)
|
||
|
State taxes
|
1.0
|
|
0.3
|
|
2.2
|
|
||
|
Non-deductible expenses
|
0.5
|
|
0.7
|
|
(1.2
|
)
|
||
|
Other
|
—
|
|
(0.1
|
)
|
(0.9
|
)
|
||
|
Effective tax rate
|
22.7
|
%
|
22.8
|
%
|
28.4
|
%
|
||
58
FLIR SYSTEMS, INC.
NOTES TO THE CONSOLIDATED FINANCIAL STATEMENTS—(Continued)
|
Note 14.
|
Income Taxes—(Continued)
|
The Company's foreign tax rate differential is primarily the result of a multi-year agreement, effective August 1, 2012, with a European jurisdiction as well as the impact of lower foreign statutory rates.
At December 31,
2013
, the Company had United States tax net operating loss carry-forwards totaling approximately
$39.8 million
which expire between
2018
and
2031
. In addition, the Company has various state net operating loss carry-forwards totaling approximately
$75.1 million
which expire between
2018
and
2033
. The federal and state net operating losses were primarily generated by ICx Technologies, prior to the acquisition by the Company in 2010. Finally, the Company has various foreign net operating loss carry-forwards totaling approximately
$101.5 million
which expire between
2018
and
2033
.
The tax benefits described above are accounted for using the asset and liability method, which requires the recognition of deferred tax assets and liabilities for the expected future tax consequences of temporary differences between the carrying amounts and the tax basis of the assets and liabilities. To the extent that management assesses the realization of such assets to not be more likely than not, a valuation allowance is required to be recorded. We believe that the net deferred tax assets of
$44.0 million
reflected on the December 31,
2013
Consolidated Balance Sheet are mostly realizable based on future forecasts of taxable income over a relatively short time horizon, but we have determined that a valuation allowance against our net deferred tax assets of
$13.5 million
is required, primarily related to certain acquired net operating losses. A valuation allowance is required when it is more-likely-than-not that all or a portion of deferred tax assets may not be realized. A review of all available positive and negative evidence is considered, including past and future performance, the market environment in which the Company operates, utilization of tax attributes in the past, length of carryback and carryforward periods, and evaluation of potential tax planning strategies when evaluating the realizability of deferred tax assets. The Company may be required to record additional valuation allowance against the deferred tax assets in future periods if its future forecasts of taxable income are not achieved.
United States income taxes have not been provided on accumulated undistributed earnings of certain subsidiaries outside the United States, as the Company intends to reinvest the earnings in operations outside the United States indefinitely. As of December 31,
2013
, the cumulative amount of earnings upon which United States income taxes have not been provided is approximately
$799 million
. Determination of the amount of unrecognized deferred tax liability related to these earnings is not practicable.
The following table summarizes the activity related to unrecognized tax benefits, including amounts accrued for potential interest and penalties (in thousands):
|
|
Year Ended December 31,
|
||||||||||
|
|
2013
|
2012
|
2011
|
||||||||
|
Balance, beginning of year
|
$
|
35,143
|
|
$
|
29,200
|
|
$
|
30,949
|
|
||
|
Increases related to current year tax positions
|
979
|
|
7,220
|
|
1,225
|
|
|||||
|
Increases related to prior year tax positions
|
714
|
|
1,559
|
|
4,192
|
|
|||||
|
Decreases related to prior year tax positions
|
(2,736
|
)
|
(343
|
)
|
(4,608
|
)
|
|||||
|
Lapse of statute of limitations
|
(2,012
|
)
|
(1,887
|
)
|
(2,558
|
)
|
|||||
|
Settlements
|
(2,555
|
)
|
(606
|
)
|
—
|
|
|||||
|
Balance, end of year
|
$
|
29,533
|
|
$
|
35,143
|
|
$
|
29,200
|
|
||
The unrecognized tax benefits at December 31,
2013
relate to the United States, United Kingdom and various foreign jurisdictions. As of December 31,
2013
, the Company had approximately
$29.5 million
of unrecognized tax benefits,
$29.5 million
of which would affect the Company’s effective tax rate if recognized. Over the next twelve months, the Company expects to have minimal changes to its unrecognized tax benefits.
The Company classifies interest and penalties related to uncertain tax positions in income tax expense. As of December 31,
2013
, the Company had
$2.6 million
of accrued interest and penalties (
$2.5 million
net of federal and state benefits) related to uncertain tax positions that are recorded as current and non-current accrued income taxes on the Consolidated Balance Sheet.
59
FLIR SYSTEMS, INC.
NOTES TO THE CONSOLIDATED FINANCIAL STATEMENTS—(Continued)
|
Note 14.
|
Income Taxes—(Continued)
|
The Company files United States, state and foreign income tax returns in jurisdictions with varying statutes of limitations. The Company currently has the following tax years open to examination by major taxing jurisdictions:
|
|
Tax Years:
|
|
United States Federal
|
2012
|
|
State of California
|
2008 – 2012
|
|
State of Massachusetts
|
2011 – 2012
|
|
State of Oregon
|
2012
|
|
Sweden
|
2008 – 2012
|
|
United Kingdom
|
2007 – 2012
|
|
Belgium
|
2011 - 2012
|
|
Note 15.
|
Stock-based Compensation
|
Stock Incentive Plans
The Company has a stock-based compensation program that provides equity incentives for employees, consultants and directors. This program includes incentive and non-statutory stock options and nonvested stock awards (referred to as restricted stock unit awards) granted under three plans: the FLIR Systems, Inc. 1993 Stock Option Plan for Non-Employee Directors (the “1993 Plan”), the FLIR Systems, Inc. 2002 Stock Incentive Plan (the “2002 Plan”) and the FLIR Systems, Inc. 2011 Stock Incentive Plan (the “2011 Plan”). The Company has discontinued issuing awards out of the 1993 Plan and the 2002 Plan but previously granted awards under the 1993 Plan and the 2002 Plan remain outstanding.
The Company has granted time-based options, performance-based options, time-based restricted stock unit awards, performance-based restricted stock unit awards and market-based restricted stock unit awards. The vesting of performance-based options and restricted stock unit awards are contingent upon meeting certain diluted earnings per share growth targets primarily in three independent tranches over a three year period. The vesting of each tranche is not dependent on the other tranches. Options generally expire ten years from the grant date. Time-based options and restricted stock unit awards generally vest over a three year period. Market-based restricted stock unit awards may be earned based upon the Company's total shareholder return compared to the total shareholder return of the S&P 500 Index over a three year period.
Shares issued as a result of stock option exercises and the distribution of vested restricted stock units are new shares.
The Company also has stock options that were issued as replacement options in connection with the acquisition of Indigo Systems Corporation in 2004 and stock options and restricted stock unit awards issued as replacement awards in connection with the acquisition of ICx in 2010.
Information with respect to stock option activity for
2013
is as follows:
|
Shares
(in thousands)
|
Weighted
Average
Exercise
Price
|
Weighted
Average
Remaining
Contractual
Term
|
Aggregate
Intrinsic
Value
(in thousands)
|
|||||||||
|
Outstanding at December 31, 2012
|
6,642
|
|
$
|
21.64
|
|
4.7
|
||||||
|
Granted
|
1,029
|
|
24.58
|
|
||||||||
|
Exercised
|
(325
|
)
|
14.22
|
|
||||||||
|
Forfeited
|
(8
|
)
|
21.40
|
|
||||||||
|
Outstanding at December 31, 2013
|
7,338
|
|
$
|
22.38
|
|
4.6
|
$
|
61,036
|
|
|||
|
Exercisable at December 31, 2013
|
5,973
|
|
$
|
21.82
|
|
3.6
|
$
|
53,284
|
|
|||
|
Vested and expected to vest at December 31, 2013
|
7,270
|
|
$
|
22.36
|
|
4.6
|
$
|
60,649
|
|
|||
60
FLIR SYSTEMS, INC.
NOTES TO THE CONSOLIDATED FINANCIAL STATEMENTS—(Continued)
|
Note 15.
|
Stock-based Compensation - (Continued)
|
Information with respect to restricted stock unit activity for
2013
is as follows:
|
Shares
(in thousands)
|
Weighted
Average Grant
Date Fair Value
|
|||||
|
Outstanding at December 31, 2012
|
2,372
|
|
$
|
24.59
|
|
|
|
Granted
|
1,180
|
|
23.93
|
|
||
|
Vested and distributed
|
(566
|
)
|
26.71
|
|
||
|
Forfeited
|
(198
|
)
|
24.03
|
|
||
|
Outstanding at December 31, 2013
|
2,788
|
|
$
|
21.16
|
|
|
As of December 31,
2013
, there are
12,080,000
shares of common stock reserved for future issuance under the 2011 Plan.
Employee Stock Purchase Plan
The Company has an Employee Stock Purchase Plan (the “ESPP”) which allows employees to purchase shares of the Company’s common stock at
85 percent
of the fair market value at the lower of either the date of enrollment or the purchase date. The Company has reserved
5,000,000
shares of common stock for issuance under the ESPP.
There were
223,000
shares issued during
2013
and
3,630,000
shares remain available under the ESPP at December 31,
2013
for future issuance. Shares issued for ESPP purchases are new shares.
|
Note 16.
|
Other Employee Benefit Plans
|
Employee 401(k) Plans
The Company has a 401(k) Savings and Retirement Plan (the “Plan”) to provide for voluntary salary deferral contributions on a pre-tax basis for employees within the United States in accordance with Section 401(k) of the Internal Revenue Code of 1986, as amended. The Plan allows for contributions by the Company. The Company made and expensed matching contributions of
$4.9 million
,
$5.8 million
and
$7.5 million
for the years ended December 31,
2013, 2012 and 2011
, respectively.
Pension Plans
The Company previously offered most of the employees outside the United States participation in a defined benefit pension plan that has been curtailed. In addition, the Company provides a Supplemental Executive Retirement Plan (the “SERP”) for certain officers of the Company based in the United States.
The Company has recorded the minimum pension liability to accumulated other comprehensive earnings and the estimated benefit to be paid in
2014
has been reported in other current liabilities. The measurement date used for the pension plans is December 31.
Amounts recognized in other comprehensive earnings during the years ended December 31,
2013, 2012 and 2011
, net of tax, are as follows (in thousands):
|
|
Year Ended December 31,
|
||||||||||
|
|
2013
|
2012
|
2011
|
||||||||
|
Net earnings (loss)
|
$
|
2,665
|
|
$
|
448
|
|
$
|
(1,410
|
)
|
||
|
Prior service cost
|
296
|
|
297
|
|
297
|
|
|||||
|
$
|
2,961
|
|
$
|
745
|
|
$
|
(1,113
|
)
|
|||
61
FLIR SYSTEMS, INC.
NOTES TO THE CONSOLIDATED FINANCIAL STATEMENTS—(Continued)
|
Note 16.
|
Other Employee Benefit Plans - (Continued)
|
Components of accumulated other comprehensive earnings related to the Company’s pension plans as of December 31,
2013 and 2012
are as follows (in thousands):
|
|
December 31,
|
||||||
|
|
2013
|
2012
|
|||||
|
Net loss
|
$
|
(1,836
|
)
|
$
|
(4,501
|
)
|
|
|
Prior service cost
|
(330
|
)
|
(626
|
)
|
|||
|
$
|
(2,166
|
)
|
$
|
(5,127
|
)
|
||
A summary of the components of the net periodic pension expense for the benefit obligation and fund assets of the plans is as follows (in thousands):
|
|
Year Ended December 31,
|
||||||
|
|
2013
|
2012
|
|||||
|
Change in benefit obligation:
|
|||||||
|
Benefit obligation at January 1
|
$
|
24,932
|
|
$
|
23,979
|
|
|
|
Service costs
|
254
|
|
267
|
|
|||
|
Interest costs
|
883
|
|
936
|
|
|||
|
Actuarial (gain) loss
|
(296
|
)
|
(158
|
)
|
|||
|
Benefits paid
|
(13,292
|
)
|
(417
|
)
|
|||
|
Foreign currency exchange changes
|
70
|
|
325
|
|
|||
|
Benefit obligation at December 31
|
$
|
12,551
|
|
$
|
24,932
|
|
|
|
Fair value of plan assets at December 31
|
$
|
—
|
|
$
|
—
|
|
|
|
Unfunded status at December 31
|
$
|
12,551
|
|
$
|
24,932
|
|
|
|
Amounts recognized in the Consolidated Balance Sheets:
|
|||||||
|
Current liabilities
|
$
|
383
|
|
$
|
409
|
|
|
|
Non-current liabilities
|
$
|
12,168
|
|
$
|
24,523
|
|
|
The weighted average assumptions used are as follows:
|
|
Year Ended December 31,
|
||||
|
|
2013
|
2012
|
|||
|
Net periodic benefit cost:
|
|||||
|
SERP:
|
|||||
|
Discount rate
|
3.75
|
%
|
4.00
|
%
|
|
|
Rate of increase in compensation levels
|
3.00
|
%
|
5.00
|
%
|
|
|
Defined benefit pension plan for employees outside the United States:
|
|||||
|
Discount rate
|
3.50
|
%
|
2.75
|
%
|
|
|
Funded status and projected benefit obligation:
|
|||||
|
SERP:
|
|||||
|
Discount rate
|
4.75
|
%
|
3.75
|
%
|
|
|
Rate of increase in compensation levels
|
3.00
|
%
|
3.00
|
%
|
|
|
Defined benefit pension plan for employees outside the United States:
|
|||||
|
Discount rate
|
3.50
|
%
|
2.75
|
%
|
|
The discount rates used are based upon publicly listed indices for instruments with average maturities estimated to be consistent with the respective obligations.
A pension liability of
$3.4 million
and
$8.1 million
as of December 31,
2013 and 2012
, respectively, have been recognized for the pension plans representing the excess of the unfunded accumulated benefit obligation over the accrued pension costs.
62
FLIR SYSTEMS, INC.
NOTES TO THE CONSOLIDATED FINANCIAL STATEMENTS—(Continued)
|
Note 16.
|
Other Employee Benefit Plans - (Continued)
|
Benefits expected to be paid under the plans are approximately (in thousands):
|
2014
|
$
|
382
|
|
|
2015
|
397
|
|
|
|
2016
|
393
|
|
|
|
2017
|
391
|
|
|
|
2018
|
376
|
|
|
|
Five years thereafter
|
13,881
|
|
|
|
$
|
15,820
|
|
|
Components of net periodic benefit cost are as follows (in thousands):
|
|
Year Ended December 31,
|
||||||||||
|
|
2013
|
2012
|
2011
|
||||||||
|
Service costs
|
$
|
254
|
|
$
|
267
|
|
$
|
205
|
|
||
|
Interest costs
|
883
|
|
936
|
|
1,047
|
|
|||||
|
Net amortization and deferral
|
1,111
|
|
1,205
|
|
903
|
|
|||||
|
Settlement loss
|
3,305
|
|
—
|
|
—
|
|
|||||
|
Net periodic pension costs
|
$
|
5,553
|
|
$
|
2,408
|
|
$
|
2,155
|
|
||
Components of net periodic benefit cost expected to be recognized from amounts in accumulated other comprehensive earnings during the year ending December 31,
2014
are as follows (in thousands):
|
|
Year Ending December 31, 2014
|
||
|
Net loss
|
$
|
107
|
|
|
Net prior service cost
|
160
|
|
|
|
$
|
267
|
|
|
|
Note 17.
|
Operating Segments and Related Information
|
Operating Segments
The Company has
two
business divisions: Commercial Systems and Government Systems.
Commercial Systems Division
The Commercial Systems division is focused on the design, manufacture, and marketing of instrument, sensor, and electronics solutions that facilitate improved situational awareness and environmental analytics for commercial customers. The division is comprised of
two
operating segments: Thermal Vision and Measurement and Raymarine. The Thermal Vision and Measurement segment provides advanced thermal imaging solutions where the customer need is to see at night or in adverse conditions or to image a scene gathering valuable temperature information. The Raymarine segment provides electronics for the maritime market and is a leading global provider of fully integrated “stem to stern” networked electronic systems for boats of all sizes.
Government Systems Division
The Government Systems division designs, manufactures, and markets advanced imaging and detection systems for government markets where high performance is required. The division is comprised of
three
operating segments: Surveillance, Detection, and Integrated Systems. The Surveillance segment provides enhanced imaging and recognition solutions to a wide variety of military, law enforcement, public safety, and other government customers around the world for the protection of borders, troops, and public welfare. The Detection segment produces sensor instruments that detect and identify chemical, biological, radiological, nuclear, and explosives (“CBRNE”) threats for military force protection, homeland security, and commercial applications. The Integrated Systems segment develops platform solutions for combating sophisticated security threats and incorporates multiple sensor systems in order to deliver actionable intelligence for wide area surveillance, intrusion detection, and facility security.
63
FLIR SYSTEMS, INC.
NOTES TO THE CONSOLIDATED FINANCIAL STATEMENTS—(Continued)
|
Note 17.
|
Operating Segments and Related Information—(Continued)
|
The accounting policies of each of the segments are the same. The Company’s President and Chief Executive Officer evaluates the performance of each segment based upon its revenue and earnings from operations. On a consolidated basis, these amounts represent revenue and earnings from operations as represented in the Consolidated Statements of Income. Other consists of corporate expenses and certain other operating expenses not allocated to the operating segments for management reporting purposes. Intersegment revenues are recorded at an estimated arm's length basis and are eliminated in consolidation.
Accounts receivable and inventories for operating segments are regularly reviewed by management and are reported below
as segment assets. All remaining assets, liabilities, capital expenditures and depreciation are managed on a Company-wide basis.
Operating segment information is as follows (in thousands):
|
|
Year Ended December 31,
|
||||||||||
|
|
2013
|
2012
|
2011
|
||||||||
|
Revenue—External Customers:
|
|||||||||||
|
Thermal Vision and Measurement
|
$
|
727,939
|
|
$
|
628,019
|
|
$
|
660,256
|
|
||
|
Raymarine
|
163,200
|
|
158,183
|
|
171,489
|
|
|||||
|
Surveillance
|
456,490
|
|
486,355
|
|
577,552
|
|
|||||
|
Detection
|
53,191
|
|
63,312
|
|
79,918
|
|
|||||
|
Integrated Systems
|
95,552
|
|
69,489
|
|
54,847
|
|
|||||
|
$
|
1,496,372
|
|
$
|
1,405,358
|
|
$
|
1,544,062
|
|
|||
|
Revenue—Intersegments:
|
|||||||||||
|
Thermal Vision and Measurement
|
$
|
16,449
|
|
$
|
15,204
|
|
$
|
18,553
|
|
||
|
Raymarine
|
5
|
|
7
|
|
7
|
|
|||||
|
Surveillance
|
25,420
|
|
23,013
|
|
32,266
|
|
|||||
|
Detection
|
7,763
|
|
4,233
|
|
3,394
|
|
|||||
|
Integrated Systems
|
1,217
|
|
1,537
|
|
6,639
|
|
|||||
|
Eliminations
|
(50,854
|
)
|
(43,994
|
)
|
(60,859
|
)
|
|||||
|
$
|
—
|
|
$
|
—
|
|
$
|
—
|
|
|||
|
Earnings (loss) from operations:
|
|||||||||||
|
Thermal Vision and Measurement
|
$
|
161,307
|
|
$
|
171,280
|
|
$
|
194,674
|
|
||
|
Raymarine
|
14,184
|
|
11,173
|
|
11,855
|
|
|||||
|
Surveillance
|
126,034
|
|
160,219
|
|
208,510
|
|
|||||
|
Detection
|
(184
|
)
|
1,089
|
|
(5,568
|
)
|
|||||
|
Integrated Systems
|
(1,907
|
)
|
5,168
|
|
1,659
|
|
|||||
|
Other
|
(58,691
|
)
|
(45,599
|
)
|
(97,935
|
)
|
|||||
|
$
|
240,743
|
|
$
|
303,330
|
|
$
|
313,195
|
|
|||
64
FLIR SYSTEMS, INC.
NOTES TO THE CONSOLIDATED FINANCIAL STATEMENTS—(Continued)
|
Note 17.
|
Operating Segments and Related Information—(Continued)
|
|
|
December 31,
|
||||||
|
|
2013
|
2012
(as adjusted)
|
|||||
|
Segment assets (accounts receivable, net and inventories):
|
|||||||
|
Thermal Vision and Measurement
|
$
|
261,204
|
|
$
|
265,132
|
|
|
|
Raymarine
|
63,628
|
|
73,564
|
|
|||
|
Surveillance
|
262,759
|
|
317,944
|
|
|||
|
Detection
|
21,754
|
|
31,861
|
|
|||
|
Integrated Systems
|
21,947
|
|
25,742
|
|
|||
|
$
|
631,292
|
|
$
|
714,243
|
|
||
Revenue and Long-Lived Assets by Geographic Area
Information related to revenue by significant geographical location, determined by the end customer, is as follows (in thousands):
|
|
Year Ended December 31,
|
||||||||||
|
|
2013
|
2012
|
2011
|
||||||||
|
United States
|
$
|
755,640
|
|
$
|
717,841
|
|
$
|
803,423
|
|
||
|
Europe
|
370,800
|
|
337,163
|
|
382,388
|
|
|||||
|
Other foreign
|
369,932
|
|
350,354
|
|
358,251
|
|
|||||
|
$
|
1,496,372
|
|
$
|
1,405,358
|
|
$
|
1,544,062
|
|
|||
Long-lived assets are comprised of net property and equipment, net identifiable intangible assets, goodwill and other long-term assets. Long-lived assets by significant geographic locations are as follows (in thousands):
|
|
December 31,
|
||||||
|
|
2013
|
2012
(as adjusted) |
|||||
|
United States
|
$
|
600,261
|
|
$
|
584,623
|
|
|
|
Europe
|
359,444
|
|
353,800
|
|
|||
|
Other foreign
|
56,040
|
|
54,763
|
|
|||
|
$
|
1,015,745
|
|
$
|
993,186
|
|
||
Major Customers
Revenue derived from major customers is as follows (in thousands):
|
|
Year Ended December 31,
|
||||||||||
|
|
2013
|
2012
|
2011
|
||||||||
|
United States government
|
$
|
354,902
|
|
$
|
373,540
|
|
$
|
444,882
|
|
||
65
FLIR SYSTEMS, INC.
NOTES TO THE CONSOLIDATED FINANCIAL STATEMENTS—(Continued)
|
Note 18.
|
Business Acquisitions
|
In December 2012, the Company acquired Lorex, a provider of consumer oriented and professional grade video surveillance systems, for approximately
$61.2 million
in cash. At December 31, 2012, the Company initially reported the net tangible assets of
$19.1 million
in the respective balance sheet accounts and the excess purchase price of
$42.1 million
in other assets.
The Company has since performed a purchase price allocation which resulted in an allocation of
$15.1 million
of identifiable intangible assets and
$31.1 million
of goodwill in conjunction with the Lorex acquisition, which has been recorded in the Company’s Thermal Vision and Measurement segment. This goodwill consists largely of the ability of Lorex to provide the Company domain knowledge and distribution channels in adjacent security markets. These purchase price adjustments have been applied retrospectively to the December 31, 2012 balance sheet.
The allocation of the purchase price is as follows (in thousands):
|
Cash acquired
|
$
|
1,170
|
|
|
Accounts receivable, net
|
10,183
|
|
|
|
Inventories
|
13,967
|
|
|
|
Property and equipment
|
1,049
|
|
|
|
Other assets
|
3,004
|
|
|
|
Liabilities
|
(10,252
|
)
|
|
|
Net tangible assets
|
19,121
|
|
|
|
Net deferred taxes
|
(4,171
|
)
|
|
|
Identifiable intangible assets
|
15,100
|
|
|
|
Goodwill
|
31,121
|
|
|
|
Purchase price
|
$
|
61,171
|
|
None
of the goodwill recognized is deductible for income tax purposes.
The identifiable intangible assets and the estimated useful life of each are as follows (in thousands):
|
|
Estimated
Useful Life
|
Amount
|
|||
|
Lorex Trade Name
|
indefinite
|
$
|
6,800
|
|
|
|
Customer Relationships
|
7 years
|
8,300
|
|
||
|
$
|
15,100
|
|
|||
Also in December 2012, the Company acquired Traficon, a provider of video image processing software and hardware for traffic analysis applications, for approximately
$46.3 million
in cash. At December 31, 2012, the Company initially reported the net tangible assets of
$5.1 million
in the respective balance sheet accounts and the excess purchase price of
$41.2 million
in other assets.
In April 2013, the Company made an additional payment of
$2.1 million
in cash as an adjustment to the purchase price for the purchase of Traficon. The Company has performed a purchase price allocation which resulted in an allocation of
$20.1 million
of identifiable intangible assets and
$30.1 million
of goodwill in conjunction with the Traficon acquisition, which has been recorded in the Company’s Thermal Vision and Measurement segment. This goodwill consists largely of the ability of Traficon to expand the Company's presence in the global traffic monitoring market through the provision of domain expertise and distribution channels. These purchase price adjustments have been applied retrospectively to the December 31, 2012 balance sheet.
66
FLIR SYSTEMS, INC.
NOTES TO THE CONSOLIDATED FINANCIAL STATEMENTS—(Continued)
|
Note 18.
|
Business Acquisitions - (Continued)
|
The allocation of the purchase price is as follows (in thousands):
|
Cash acquired
|
$
|
181
|
|
|
Accounts receivable, net
|
6,435
|
|
|
|
Inventories
|
2,853
|
|
|
|
Property and equipment
|
179
|
|
|
|
Other assets
|
657
|
|
|
|
Liabilities
|
(5,248
|
)
|
|
|
Net tangible assets
|
5,057
|
|
|
|
Net deferred taxes
|
(6,903
|
)
|
|
|
Identifiable intangible assets
|
20,102
|
|
|
|
Goodwill
|
30,107
|
|
|
|
Purchase price
|
$
|
48,363
|
|
None
of the goodwill recognized is deductible for income tax purposes.
The identifiable intangible assets and the estimated useful life of each are as follows (in thousands):
|
|
Estimated
Useful Life
|
Amount
|
|||
|
Patented/Proprietary Technology
|
10 years
|
$
|
5,951
|
|
|
|
Backlog
|
1.5 years
|
1,852
|
|
||
|
Customer Relationships
|
10 years
|
12,299
|
|
||
|
$
|
20,102
|
|
|||
In April 2013, the Company acquired MARSS, a developer of software and sensor control systems for use in maritime security applications, including above and below water port security and ship-based man overboard detection, for approximately
$3.2 million
in cash. The Company has recorded
$0.4 million
of identifiable intangible assets and
$2.5 million
of goodwill in the Company's Integrated Systems segment.
In August 2013, the Company acquired certain tangible assets and intellectual property related to the design and manufacturing of wafer-level optics of DOC Charlotte for approximately
$14.9 million
in cash. The Company has performed a purchase price allocation which resulted in an allocation of
$2.5 million
of identifiable intangible assets and
$2.4 million
of goodwill which has been recorded in the Company’s Thermal Vision and Measurement segment.
67
FLIR SYSTEMS, INC.
NOTES TO THE CONSOLIDATED FINANCIAL STATEMENTS—(Continued)
|
Note 18.
|
Business Acquisitions - (Continued)
|
The allocation of the purchase price for DOC Charlotte is as follows (in thousands):
|
Inventories
|
$
|
741
|
|
|
Property and equipment
|
9,246
|
|
|
|
Net tangible assets
|
9,987
|
|
|
|
Identifiable intangible assets
|
2,520
|
|
|
|
Goodwill
|
2,401
|
|
|
|
Purchase price
|
$
|
14,908
|
|
None
of the goodwill recognized is deductible for income tax purposes.
The identifiable intangible assets and the estimated useful life of each are as follows (in thousands):
|
|
Estimated
Useful Life
|
Amount
|
|||
|
Patented/Proprietary Technology
|
12 years
|
$
|
2,000
|
|
|
|
Backlog
|
2 years
|
150
|
|
||
|
Customer Relationships
|
2.5 years
|
370
|
|
||
|
$
|
2,520
|
|
|||
The operating results of MARSS and DOC Charlotte are included in the Company’s results of operations since their respective dates of acquisition. The operating results of each of Lorex and Traficon are not included in the Company's 2012 results of operations, as such results were not significant.
These acquisitions are not significant, either individually or in the aggregate, as defined in Regulation S-X of the Securities and Exchange Commission, compared to the Company’s overall financial position.
|
Note 19.
|
Discontinued Operations
|
In 2010, in connection with the acquisition of ICx Technologies, Inc. ("ICx"), the Company began to pursue the sale of certain business units of ICx and the results of operations for such business units were reported as discontinued operations for that year. During the second quarter of 2012, the Company sold the remaining
two
business units reported as discontinued operations. The operating losses of those operations, including insignificant associated losses recognized subsequent to their disposal, and the net losses on the sales of the units, net of tax are reflected in the Consolidated Statements of Income for the year ended December 31, 2012.
|
Note 20.
|
Shareholders’ Equity
|
In February 2011, the Company’s Board of Directors authorized the repurchase of up to
20.0 million
shares of the Company’s outstanding shares of common stock in the open market or through privately negotiated transactions. This authorization expired in February 2013. In February 2013, the Company’s Board of Directors authorized the repurchase of up to
25.0 million
shares of the Company’s outstanding shares of common stock in the open market or through privately negotiated transactions. This authorization will expire on February 6, 2015.
Under these authorizations, the Company has repurchased
5,988,000
shares for a total of
$162.1 million
,
10,466,000
shares for a total of
$214.2 million
and
6,135,000
shares for a total of
$160.7 million
during the years ended December 31,
2013, 2012 and 2011
, respectively. As of December 31, 2013, there were
19,012,000
shares remaining under the February 2013 authorization that may be repurchased.
On February 9, 2011, the Company’s Board of Directors adopted a dividend policy under which the Company intends to pay quarterly cash dividends on its common stock. During the year ended
December 31, 2013
, the Company paid dividends quarterly at the rate of
$0.09
per share for a total of
$51.4 million
. During the year ended
December 31, 2012
, the Company paid dividends quarterly at the rate of
$0.07
per share for a total of
$42.5 million
. During the year ended December 31, 2011, the Company paid dividends quarterly at the rate of
$0.06
per share for a total of
$38.0 million
.
68
FLIR SYSTEMS, INC.
NOTES TO THE CONSOLIDATED FINANCIAL STATEMENTS—(Continued)
|
Note 21.
|
Restructuring Costs
|
During the years ended December 31, 2013 and 2012, the Company recorded net pre-tax restructuring expenses totaling
$27.5 million
and
$2.0 million
, respectively. In 2013, the Company initiated a realignment plan that includes closing six not-to-scale sites in the United States and Europe and a transfer of those operations to the Company's larger facilities. The Company is also consolidating its optics and laser manufacturing businesses to better realize the benefits of vertical integration in these areas. In 2012, the Company recorded restructuring expenses associated with the relocation of one of the Company's manufacturing facilities in Europe to an existing facility in the United States.
The Company recorded the restructuring expenses in the segments as follows (in thousands):
|
|
Year Ended December 31,
|
||||||
|
|
2013
|
2012
|
|||||
|
Thermal Vision and Measurement
|
$
|
17,370
|
|
$
|
—
|
|
|
|
Raymarine
|
361
|
|
—
|
|
|||
|
Surveillance
|
3,598
|
|
—
|
|
|||
|
Detection
|
4,222
|
|
2,000
|
|
|||
|
Integrated Systems
|
1,761
|
|
—
|
|
|||
|
Other
|
209
|
|
—
|
|
|||
|
$
|
27,521
|
|
$
|
2,000
|
|
||
Restructuring expenses were recorded in the Consolidated Statements of Income as follows (in thousands):
|
|
Year Ended December 31,
|
||||||
|
|
2013
|
2012
|
|||||
|
Cost of goods sold
|
$
|
1,689
|
|
$
|
—
|
|
|
|
Restructuring expenses
|
25,832
|
|
2,000
|
|
|||
|
$
|
27,521
|
|
$
|
2,000
|
|
||
The following table summarizes the activity by cost type (in thousands):
|
|
Severance
|
Inventory
write downs |
Facilities Exit, Lease Terminations & Other
|
Total
|
|||||||||||
|
2013 restructuring expenses
|
$
|
19,866
|
|
$
|
1,689
|
|
$
|
5,966
|
|
$
|
27,521
|
|
|||
|
Utilization
|
(1,675
|
)
|
(1,689
|
)
|
(2,296
|
)
|
(5,660
|
)
|
|||||||
|
Balance, December 31, 2013
|
$
|
18,191
|
|
$
|
—
|
|
$
|
3,670
|
|
$
|
21,861
|
|
|||
At December 31, 2012, the Company had restructuring accruals of
$0.6 million
related to 2012 activities that were utilized during the year ended December 31, 2013.
|
Note 22.
|
Subsequent Events
|
On
February 7, 2014
, the Company’s Board of Directors declared a quarterly dividend of
$0.10
per share on its common stock, payable on
March 7, 2014
, to shareholders of record as of close of business on
February 19, 2014
. The total cash payment of this dividend will be approximately
$14.1 million
.
69
|
QUARTERLY FINANCIAL DATA (UNAUDITED)
FLIR SYSTEMS, INC.
(In thousands, except per share data)
|
|||||||||||||||
|
Q1
|
Q2
|
Q3
|
Q4
|
||||||||||||
|
2013
|
|||||||||||||||
|
Revenue
|
$
|
348,583
|
|
$
|
389,329
|
|
$
|
358,141
|
|
$
|
400,319
|
|
|||
|
Gross profit
|
183,987
|
|
190,041
|
|
172,890
|
|
190,092
|
|
|||||||
|
Net earnings
|
51,636
|
|
50,158
|
|
46,486
|
|
28,735
|
|
|||||||
|
Earnings per share:
|
|||||||||||||||
|
Basic earnings per share
|
$
|
0.36
|
|
$
|
0.35
|
|
$
|
0.33
|
|
$
|
0.20
|
|
|||
|
Diluted earnings per share
|
$
|
0.35
|
|
$
|
0.35
|
|
$
|
0.32
|
|
$
|
0.20
|
|
|||
|
2012
(as adjusted)
|
|||||||||||||||
|
Revenue
|
$
|
348,452
|
|
$
|
338,291
|
|
$
|
332,230
|
|
$
|
386,385
|
|
|||
|
Gross profit
(1)
|
182,727
|
|
173,417
|
|
173,665
|
|
205,375
|
|
|||||||
|
Earnings from continuing operations
|
48,825
|
|
42,405
|
|
55,949
|
|
78,177
|
|
|||||||
|
Loss from discontinued operations
|
(686
|
)
|
(1,312
|
)
|
(44
|
)
|
(916
|
)
|
|||||||
|
Net earnings
|
48,139
|
|
41,093
|
|
55,905
|
|
77,261
|
|
|||||||
|
Basic earnings per share:
|
|||||||||||||||
|
Continuing operations
|
$
|
0.32
|
|
$
|
0.28
|
|
$
|
0.37
|
|
$
|
0.53
|
|
|||
|
Discontinued operations
|
(0.00
|
)
|
(0.01
|
)
|
(0.00
|
)
|
(0.01
|
)
|
|||||||
|
Basic earnings per share
|
$
|
0.31
|
|
$
|
0.27
|
|
$
|
0.37
|
|
$
|
0.52
|
|
|||
|
Diluted earnings per share:
|
|||||||||||||||
|
Continuing operations
|
$
|
0.31
|
|
$
|
0.27
|
|
$
|
0.37
|
|
$
|
0.52
|
|
|||
|
Discontinued operations
|
(0.00
|
)
|
(0.01
|
)
|
(0.00
|
)
|
(0.01
|
)
|
|||||||
|
Diluted earnings per share
|
$
|
0.31
|
|
$
|
0.27
|
|
$
|
0.37
|
|
$
|
0.52
|
|
|||
_______________
(1) Certain expenses have been reclassified to conform to the presentation for the quarterly data of 2013.
The sum of the quarterly earnings per share does not always equal the annual earnings per share as a result of the computation of quarterly versus annual average shares outstanding.
70
|
ITEM 9.
|
CHANGES IN AND DISAGREEMENTS WITH ACCOUNTANTS ON ACCOUNTING AND FINANCIAL DISCLOSURE
|
None.
|
ITEM 9A.
|
CONTROLS AND PROCEDURES
|
Evaluation of Disclosure Controls and Procedures
As of
December 31, 2013
, the Company completed its annual evaluation, under the supervision and with the participation of the Company’s management, including the Company’s Chief Executive Officer and the Company’s Chief Financial Officer, of the effectiveness of the design and operation of the Company’s disclosure controls and procedures. Based on the evaluation, the Company’s Chief Executive Officer and Chief Financial Officer have concluded that the Company’s disclosure controls and procedures are effective to ensure that information required to be disclosed by the Company in the reports it files or submits under the Securities Exchange Act of 1934, as amended, is recorded, processed, summarized and reported within the time periods specified in Securities and Exchange Commission rules and forms. There were no changes in the Company’s internal control over financial reporting that occurred during the Company's fourth fiscal quarter that have materially affected, or are reasonably likely to materially affect, the Company’s internal control over financial reporting.
Management’s Report on Internal Control over Financial Reporting
Our management is responsible for establishing and maintaining adequate internal control over financial reporting, as such term is defined in Exchange Act Rule 13a-15(f). Our internal control over financial reporting is designed to provide reasonable assurance to our management and Board of Directors regarding the preparation and fair presentation of published financial statements.
Because of its inherent limitations, internal control over financial reporting may not prevent or detect misstatements. Therefore, even those systems determined to be effective can provide only reasonable assurance with respect to financial statement preparation and presentation.
Under the supervision and with the participation of our management, including our Chief Executive Officer and Chief Financial Officer, we conducted an evaluation of the effectiveness of our internal control over financial reporting based on the framework in the
Internal Control—Integrated Framework (1992)
issued by the Committee of Sponsoring Organizations of the Treadway Commission (“COSO”).
Based on our evaluation using the
Internal Control—Integrated Framework (1992)
, our management concluded that our internal control over financial reporting was effective as of
December 31, 2013
.
KPMG LLP, an independent registered public accounting firm, has issued an attestation report on the Company’s internal control over financial reporting as of
December 31, 2013
, which is included elsewhere in this Form 10-K.
71
REPORT OF INDEPENDENT REGISTERED PUBLIC ACCOUNTING FIRM
The Board of Directors and
Shareholders of FLIR Systems, Inc.:
We have audited FLIR Systems, Inc.’s internal control over financial reporting as of
December 31, 2013
, based on criteria established in
Internal Control—Integrated Framework (1992)
issued by the Committee of Sponsoring Organizations of the Treadway Commission (COSO)
.
FLIR Systems, Inc.’s management is responsible for maintaining effective internal control over financial reporting and for its assessment of the effectiveness of internal control over financial reporting, included in the accompanying Management’s Report on Internal Control over Financial Reporting. Our responsibility is to express an opinion on the Company’s internal control over financial reporting based on our audit.
We conducted our audit in accordance with the standards of the Public Company Accounting Oversight Board (United States). Those standards require that we plan and perform the audit to obtain reasonable assurance about whether effective internal control over financial reporting was maintained in all material respects. Our audit included obtaining an understanding of internal control over financial reporting, assessing the risk that a material weakness exists, and testing and evaluating the design and operating effectiveness of internal control based on the assessed risk. Our audit also included performing such other procedures as we considered necessary in the circumstances. We believe that our audit provides a reasonable basis for our opinion.
A company’s internal control over financial reporting is a process designed to provide reasonable assurance regarding the reliability of financial reporting and the preparation of financial statements for external purposes in accordance with generally accepted accounting principles. A company’s internal control over financial reporting includes those policies and procedures that (1) pertain to the maintenance of records that, in reasonable detail, accurately and fairly reflect the transactions and dispositions of the assets of the company; (2) provide reasonable assurance that transactions are recorded as necessary to permit preparation of financial statements in accordance with generally accepted accounting principles, and that receipts and expenditures of the company are being made only in accordance with authorizations of management and directors of the company; and (3) provide reasonable assurance regarding prevention or timely detection of unauthorized acquisition, use, or disposition of the company’s assets that could have a material effect on the financial statements.
Because of its inherent limitations, internal control over financial reporting may not prevent or detect misstatements. Also, projections of any evaluation of effectiveness to future periods are subject to the risk that controls may become inadequate because of changes in conditions, or that the degree of compliance with the policies or procedures may deteriorate.
In our opinion, FLIR Systems, Inc. maintained, in all material respects, effective internal control over financial reporting as of
December 31, 2013
, based on criteria established in
Internal Control—Integrated Framework (1992)
issued by the Committee of Sponsoring Organizations of the Treadway Commission
.
We also have audited, in accordance with the standards of the Public Company Accounting Oversight Board (United States), the consolidated balance sheets of FLIR Systems, Inc. and subsidiaries as of
December 31, 2013
and
2012
, and the related consolidated statements of income, comprehensive income, shareholders’ equity, and cash flows for each of the years in the three-year period ended
December 31, 2013
, and our report dated
March 3, 2014
expressed an unqualified opinion on those consolidated financial statements
.
/s/ KPMG LLP
Portland, Oregon
March 3, 2014
72
|
ITEM 9B.
|
OTHER INFORMATION
|
None.
|
ITEM 10.
|
DIRECTORS, EXECUTIVE OFFICERS AND CORPORATE GOVERNANCE
|
Information with respect to directors and executive officers of the Company is included under “Election of Directors,” “Management,” “Section 16(a) Beneficial Ownership Reporting Compliance,” “Corporate Governance and Related Matters” and “Ratification of Appointment of the Independent Registered Public Accounting Firm and Related Information—Audit Committee Report” in the Company’s definitive proxy statement for its
2014
Annual Meeting of Shareholders and is incorporated herein by reference.
The Company has adopted a Code of Ethics for Senior Financial Officers (the “Code of Ethics”) that applies to the Company’s Chief Executive Officer, Chief Financial Officer, Controller and persons performing similar duties. The Code of Ethics is publicly available on the Company’s website (www.flir.com) in the Governance area of the Investor Relations segment of the website. None of the material on the Company’s website is part of this Annual Report. If there is any waiver from any provision of the Code of Ethics for the Company’s Chief Executive Officer, Chief Financial Officer, Controller and persons performing similar duties, the Company will disclose the nature of such waiver on its website.
|
ITEM 11.
|
EXECUTIVE COMPENSATION
|
Information with respect to executive compensation is included under “Compensation Discussion and Analysis,” “Compensation Committee Report,” “Compensation of Executive Officers,” and “Director Compensation” in the Company’s definitive proxy statement for its
2014
Annual Meeting of Shareholders and is incorporated herein by reference.
|
ITEM 12.
|
SECURITY OWNERSHIP OF CERTAIN BENEFICIAL OWNERS AND MANAGEMENT AND RELATED STOCKHOLDER MATTERS
|
Information with respect to security ownership of certain beneficial owners and management is included under “Stock Owned by Management" and "Stock Owned by Principal Shareholders” in the Company’s definitive proxy statement for its
2014
Annual Meeting of Shareholders and is incorporated herein by reference. Information with respect to equity compensation plans is included under “Equity Compensation Plan Information” in the Company’s definitive proxy statement for its
2014
Annual Meeting of Shareholders and is incorporated herein by reference.
|
ITEM 13.
|
CERTAIN RELATIONSHIPS AND RELATED TRANSACTIONS, AND DIRECTOR INDEPENDENCE
|
Information with respect to certain relationships and related transactions is included under “Certain Relationships and Related Transactions” in the Company’s definitive proxy statement for its
2014
Annual Meeting of Shareholders and is incorporated herein by reference. Information with respect to Director independence is included under “Corporate Governance and Related Matters—Board of Directors Committees” in the Company’s definitive proxy statement for its
2014
Annual Meeting of Shareholders and is incorporated herein by reference.
|
ITEM 14.
|
PRINCIPAL ACCOUNTANT FEES AND SERVICES
|
Information with respect to principal accountant fees and services is included under “Ratification of Appointment of the Information Concerning the Independent Registered Public Accounting Firm and Related Information—Fees Paid to KPMG LLP” in the Company’s definitive proxy statement for its
2014
Annual Meeting of Shareholders and is incorporated herein by reference.
73
|
ITEM 15.
|
EXHIBITS AND FINANCIAL STATEMENT SCHEDULES
|
(a)(1)
Financial Statements
The financial statements are included in Item 8 above.
(a)(2)
Financial Statement Schedules
No schedules are included because the required information is inapplicable, not required or are presented in the financial statements or the related notes thereto.
(a)(3)
Exhibits
|
Number
|
Description
|
|
3.1
|
Second Restated Articles of Incorporation of FLIR Systems, Inc., as amended through May 12, 2008 (incorporated by reference to Exhibit 3.1 to the Annual Report on Form 10-K filed on February 27, 2009).
|
|
3.2
|
Fifth Amendment to Second Restated Articles of Incorporation of FLIR Systems, Inc. as amended on April 25, 2013 (incorporated by reference to Exhibit 3.1 to the Quarterly Report on Form 10-Q filed on August 8, 2013).
|
|
3.3
|
Second Restated Bylaws of FLIR Systems, Inc., as amended through October 23, 2013 (incorporated by reference to Exhibit 3.1 to the Current Report on Form 8-K filed on October 30, 2013).
|
|
4.1
|
Indenture, dated August 19, 2011, between FLIR Systems, Inc. and U.S. Bank National Association, as trustee (incorporated by reference to Exhibit 4.1 to the Current Report on Form 8-K filed on August 19, 2011).
|
|
4.2
|
First Supplemental Indenture, dated August 19, 2011, between FLIR Systems, Inc. and U.S. Bank National Association, as trustee (incorporated by reference to Exhibit 4.2 to the Current Report on Form 8-K filed on August 19, 2011).
|
|
4.3
|
Form of 3.750% Note due September 1, 2016 (incorporated by reference to Exhibit 4.3 to the Current Report on Form 8-K filed on August 19, 2011).
|
|
4.4
|
Second Supplemental Indenture, dated January 30, 2012, between FLIR Commercial Systems, Inc., FLIR Government Systems, Inc. and U.S. Bank National Association, as trustee (incorporated by reference to Exhibit 4.4 to the Annual Report on Form 10-K filed on February 29, 2012).
|
|
10.1
|
1993 Stock Option Plan for Non-employee Directors (incorporated by reference to Exhibit 10.4 to Registration Statement on Form S-1 (File No. 33-62582)).
(1)
|
|
10.2
|
FLIR Systems, Inc. 2002 Stock Incentive Plan, amended October 23, 2013 (incorporated by reference to Exhibit 10.1 to the Quarterly Report on Form 10-Q filed on November 8, 2013).
(1)
|
|
10.3
|
FLIR Systems, Inc. 2002 Stock Incentive Plan Stock Option Agreement (incorporated by reference to Exhibit 10.1 to the Current Report on Form 8-K filed on February 10, 2005).
(1)
|
|
10.4
|
FLIR Systems, Inc. 2007 Executive Bonus Plan (incorporated by reference to Exhibit 10.16 to the Annual Report on Form 10-K filed on March 16, 2007).
(1)
|
|
10.5
|
Form of 2007 Executive Bonus Plan Performance Award Agreement dated as of March 14, 2007 (incorporated by reference to Exhibit 10.18 to the Annual Report on Form 10-K filed on March 16, 2007).
(1)
|
|
10.6
|
Form of Stock Option Agreement for 2002 Stock Incentive Plan (incorporated by reference to Exhibit 10.1 on the Current Report on Form 8-K filed on May 4, 2007).
(1)
|
|
10.7
|
Form of Deferred Stock Agreement for 2002 Stock Incentive Plan (incorporated by reference to Exhibit 10.2 on the Current Report on Form 8-K filed on May 4, 2007).
(1)
|
|
10.8
|
Amended and Restated FLIR Systems, Inc. Supplemental Executive Retirement Plan, as amended and restated on October 22, 2009 (incorporated by reference to Exhibit 10.16 to the Annual Report on Form 10-K filed on February 26, 2010).
(1)
|
|
10.9
|
Credit Agreement by and among FLIR Systems, Inc. and certain subsidiaries of FLIR Systems, Inc., as borrowers, Bank of America, N.A., U.S. Bank National Association, JPMorgan Chase Bank N.A. and other Lenders identified therein as of February 8, 2011 (incorporated by reference to Exhibit 10.3 to the Annual Report on Form 10-K filed on March 1, 2011).
|
|
10.10
|
First Amendment to Credit Agreement by and among FLIR Systems, Inc. and certain subsidiaries of FLIR Systems, Inc., as borrowers, Bank of America, N.A., U.S. Bank National Association, JPMorgan Chase Bank N.A. and other Lenders dated August 9, 2011 (incorporated by reference to Exhibit 10.1 to the Current Report on Form 8-K filed on August 12, 2011).
|
|
10.11
|
Joinder Agreement to the Credit Agreement by and among FLIR Commercial Systems, Inc,, FLIR Government Systems, Inc and Bank of America, N.A. dated January 30, 2012 (incorporated by reference to Exhibit 10.13 to the Annual Report on Form 10-K filed on February 29, 2012).
|
|
10.12
|
FLIR Systems, Inc. 2011 Stock Incentive Plan (incorporated by reference to the Definitive Proxy Statement on Schedule 14A filed on March 18, 2011).
(1)
|
|
10.13
|
Form of Stock Option Agreement for the 2011 Stock Incentive Plan, amended October 23, 2013 (incorporated by reference to Exhibit 10.2 to the Quarterly Report on Form 10-Q filed on November 8, 2013).
(1)
|
|
10.14
|
Form of Restricted Stock Unit Agreement (Time-Based Vesting) for the 2011 Stock Incentive Plan (incorporated by reference to Exhibit 10.16 to the Annual Report on Form 10-K filed on February 29, 2012).
(1)
|
74
|
10.15
|
Form of Restricted Stock Unit Agreement (Performance-Based Vesting) for the 2011 Stock Incentive Plan (incorporated by reference to Exhibit 10.17 to the Annual Report on Form 10-K filed on February 29, 2012).
(1)
|
|
10.16
|
Form of Restricted Stock Unit Agreement (Market-Based Vesting) for the 2011 Stock Incentive Plan (incorporated by reference to Exhibit 10.18 to the Annual Report on Form 10-K filed on March 1, 2013).
(1)
|
|
10.17
|
Third Amendment to Credit Agreement by and among FLIR Systems, Inc. and certain subsidiaries of FLIR Systems, Inc., as borrowers, Bank of America, N.A., U.S. Bank National Association, JPMorgan Chase Bank N.A. and other Lenders dated April 5, 2013 (incorporated by reference to Exhibit 10.1 on the Quarterly Report on Form 10-Q filed on May 8, 2013).
|
|
10.18
|
Annex I to Third Amendment to Credit Agreement dated as of April 5, 2013 (incorporated by reference to Exhibit 10.2 on the Quarterly Report on Form 10-Q/A filed on August 29, 2013).
|
|
10.19
|
Letter Agreement, dated as of April 26, 2013, by and between FLIR Systems, Inc. and Earl R. Lewis (incorporated by reference to the Current Report on Form 8-K filed on May 1, 2013).
(1)
|
|
10.20
|
Executive Employment Agreement between FLIR Systems, Inc. and Andrew C. Teich dated as of May 2, 2013 (incorporated by reference to the Current Report on Form 8-K/A filed on May 3, 2013).
(1)
|
|
10.21
|
Executive Employment Agreement between FLIR Systems, Inc. and Anthony L. Trunzo dated as of May 6, 2013 (incorporated by reference to the Current Report on Form 8-K filed on May 7, 2013).
(1)
|
|
10.22
|
Executive Employment Agreement between FLIR Systems, Inc. and William A. Sundermeier dated as of May 6, 2013 (incorporated by reference to the Current Report on Form 8-K filed on May 7, 2013).
(1)
|
|
10.23
|
Amended and Restated Change of Control Agreement between FLIR Systems, Inc. and Andrew C. Teich dated as of November 6, 2013 (incorporated by reference to Exhibit 10.3 on the Quarterly Report on Form 10-Q filed on November 8, 2013).
(1)
|
|
10.24
|
Amended and Restated Change of Control Agreement between FLIR Systems, Inc. and Anthony L. Trunzo dated as of November 6, 2013 (incorporated by reference to Exhibit 10.4 on the Quarterly Report on Form 10-Q filed on November 8, 2013).
(1)
|
|
10.25
|
Amended and Restated Change of Control Agreement between FLIR Systems, Inc. and William A. Sundermeier dated as of November 6, 2013 (incorporated by reference to Exhibit 10.5 on the Quarterly Report on Form 10-Q filed on November 8, 2013).
(1)
|
|
10.26
|
Amended and Restated Change of Control Agreement between FLIR Systems, Inc. and William W. Davis dated as of November 6, 2013 (incorporated by reference to Exhibit 10.6 on the Quarterly Report on Form 10-Q filed on November 8, 2013).
(1)
|
|
21.0
|
Subsidiaries of FLIR Systems, Inc.
|
|
23.0
|
Consent of KPMG LLP.
|
|
31.1
|
Principal Executive Officer Certification Pursuant to Sarbanes-Oxley Act of 2002, Section 302.
|
|
31.2
|
Principal Financial Officer Certification Pursuant to Sarbanes-Oxley Act of 2002, Section 302.
|
|
32.1
|
Certification by the Chief Executive Officer pursuant to 18 U.S.C. Section 1350, as adopted pursuant to Section 906 of the Sarbanes-Oxley Act of 2002.
|
|
32.2
|
Certification by the Chief Financial Officer pursuant to 18 U.S.C. Section 1350, as adopted pursuant to Section 906 of the Sarbanes-Oxley Act of 2002.
|
|
101.INS
|
XBRL Instance Document
|
|
101.SCH
|
XBRL Taxonomy Extension Schema Document
|
|
101.CAL
|
XBRL Taxonomy Extension Calculation Linkbase Document
|
|
101.DEF
|
XBRL Taxonomy Extension Definition Linkbase Document
|
|
101.LAB
|
XBRL Taxonomy Extension Label Linkbase Document
|
|
101.PRE
|
XBRL Taxonomy Extension Presentation Linkbase Document
|
|
(1)
|
This exhibit constitutes a management contract or compensatory plan or arrangement.
|
75
SIGNATURES
Pursuant to the requirements of Section 13 or 15(d) of the Securities Exchange Act of 1934, the Registrant has duly caused this report to be signed on its behalf by the undersigned, thereunto duly authorized on the
3rd day of March 2014
.
|
FLIR SYSTEMS, INC.
|
|||
|
(Registrant)
|
|||
|
By:
|
/
S
/ A
NTHONY
L. T
RUNZO
|
||
|
Anthony L. Trunzo
Sr. Vice President, Finance and Chief Financial Officer
|
|||
Pursuant to the requirements of the Securities Exchange Act of 1934, this report has been signed below by the following persons on behalf of the Registrant and in the capacities indicated on
March 3, 2014
.
|
Signature
|
Title
|
|
|
/
S
/ A
NDREW
C. T
EICH
|
President and Chief Executive Officer
|
|
|
Andrew C. Teich
|
||
|
/
S
/ A
NTHONY
L. T
RUNZO
|
Sr. Vice President, Finance and Chief Financial Officer
|
|
|
Anthony L. Trunzo
|
(Principal Financial Officer)
|
|
|
/
S
/ D
AVID
A. M
UESSLE
|
Vice President and Corporate Controller
|
|
|
David A. Muessle
|
(Principal Accounting Officer)
|
|
|
/
S
/ E
ARL
R. L
EWIS
|
Chairman of the Board of Directors
|
|
|
Earl R. Lewis
|
||
|
/
S
/ J
OHN
D. C
ARTER
|
Director
|
|
|
John D. Carter
|
||
|
/
S
/ W
ILLIAM
W. C
ROUCH
|
Director
|
|
|
William W. Crouch
|
||
|
/
S
/ A
NGUS
L. M
ACDONALD
|
Director
|
|
|
Angus L. Macdonald
|
||
|
/
S
/ M
ICHAEL
T. S
MITH
|
Director
|
|
|
Michael T. Smith
|
||
|
/
S
/ J
OHN
W. W
OOD
, J
R
.
|
Director
|
|
|
John W. Wood, Jr.
|
||
|
/
S
/ S
TEVEN
E. W
YNNE
|
Director
|
|
|
Steven E. Wynne
|
||
76
TABLE OF CONTENTS
Part IItem 1. BusinessItem 1A. Risk FactorsItem 1B. Unresolved Staff CommentsItem 2. PropertiesItem 3. Legal ProceedingsItem 4. Mine Safety DisclosuresPart IIItem 5. Market For Registrant S Common Equity, Related Stockholder Matters and Issuer Purchases Of Equity SecuritiesItem 6. Selected Financial DataItem 7. Management S Discussion and Analysis Of Financial Condition and Results Of OperationsItem 7A. Quantitative and Qualitative Disclosures About Market RiskItem 8. Financial Statements and Supplementary DataNote 1. Nature Of Business and Significant Accounting PoliciesNote 1. Nature Of Business and Significant Accounting Policies (continued)Note 2. Fair Value Of Financial InstrumentsNote 3. Derivative Financial InstrumentsNote 3. Derivative Financial Instruments - (continued)Note 4. Accounts ReceivableNote 5. InventoriesNote 6. Property and EquipmentNote 7. GoodwillNote 8. Intangible AssetsNote 9. Credit AgreementNote 10. Accrued Product WarrantiesNote 11. Long-term DebtNote 12. CommitmentsNote 13. ContingenciesNote 14. Income TaxesNote 14. Income Taxes (continued)Note 15. Stock-based CompensationNote 15. Stock-based Compensation - (continued)Note 16. Other Employee Benefit PlansNote 16. Other Employee Benefit Plans - (continued)Note 17. Operating Segments and Related InformationNote 17. Operating Segments and Related Information (continued)Note 18. Business AcquisitionsNote 18. Business Acquisitions - (continued)Note 19. Discontinued OperationsNote 20. Shareholders EquityNote 21. Restructuring CostsNote 22. Subsequent EventsItem 9. Changes in and Disagreements with Accountants on Accounting and Financial DisclosureItem 9A. Controls and ProceduresItem 9B. Other InformationPart IIIItem 10. Directors, Executive Officers and Corporate GovernanceItem 11. Executive CompensationItem 12. Security Ownership Of Certain Beneficial Owners and Management and Related Stockholder MattersItem 13. Certain Relationships and Related Transactions, and Director IndependenceItem 14. Principal Accountant Fees and ServicesPart IVItem 15. Exhibits and Financial Statement Schedules