|
|
|
|
|
|
|
|
|
|
|
|
|
|
|
|
|
|
|
|
|
|
|
|
|
|
|
|
|
|
|
|
|
|
|
|
|
|
|
|
|
|
|
|
|
|
|
|
|
|
|
|
|
|
|
|
Table of Contents
SECURITIES AND EXCHANGE COMMISSION
Washington, D.C. 20549
| (Mark One) | ||
|
þ
|
ANNUAL REPORT PURSUANT TO SECTION 13 OR 15(d) OF THE SECURITIES EXCHANGE ACT OF 1934 | |
| For the fiscal year ended January 1, 2011 | ||
|
OR
|
||
|
o
|
TRANSITION REPORT PURSUANT TO SECTION 13 OR 15(d) OF THE SECURITIES EXCHANGE ACT OF 1934 | |
| For the transition period from to | ||
| Georgia | 58-2582379 | |
|
(State or other jurisdiction
of
incorporation or organization) |
(I.R.S. Employer
Identification No.) |
|
|
1919 Flowers Circle
Thomasville, Georgia (Address of principal executive offices) |
31757
(Zip Code) |
|
Name of Each Exchange
|
||||
| Title of Each Class | on Which Registered | |||
|
Common Stock, $0.01 par value, together
with Preferred Share Purchase Rights |
New York Stock Exchange | |||
|
Large accelerated
filer
þ
|
Accelerated filer o |
Non-accelerated
filer
o
(Do not check if a smaller reporting company) |
Smaller reporting company o |
i
Table of Contents
| • | unexpected changes in any of the following: (i) general economic and business conditions; (ii) the competitive setting in which we operate, including, advertising or promotional strategies by us or our competitors, as well as changes in consumer demand; (iii) interest rates and other terms available to us on our borrowings; (iv) energy and raw materials costs and availability and hedging counter-party risks; (v) relationships with our employees, independent distributors and third party service providers; and (vi) laws and regulations (including environmental and health-related issues), accounting standards or tax rates in the markets in which we operate; | |
| • | the loss or financial instability of any significant customer(s); | |
| • | our ability to execute our business strategy, which may involve integration of recent acquisitions or the acquisition or disposition of assets at presently targeted values; | |
| • | our ability to operate existing, and any new, manufacturing lines according to schedule; | |
| • | the level of success we achieve in developing and introducing new products and entering new markets; | |
| • | changes in consumer behavior, trends and preferences, including health and whole grain trends, and the movement toward more inexpensive store-branded products; | |
| • | our ability to implement new technology as required; | |
| • | the credit and business risks associated with our independent distributors and customers which operate in the highly competitive retail food and foodservice industries, including the amount of consolidation in these industries; | |
| • | changes in pricing, customer and consumer reaction to pricing actions, and the pricing environment among competitors within the industry; | |
| • | consolidation within the baking industry; | |
| • | any business disruptions due to political instability, armed hostilities, incidents of terrorism, natural disasters or the responses to or repercussions from any of these or similar events or conditions and our ability to insure against such events; and | |
| • | regulation and legislation related to climate change that could affect our ability to procure our commodity needs or that necessitate additional unplanned capital expenditures. |
ii
Table of Contents
| Item 1. | Business |
| DSD Brands | Regional Franchised Brands | Warehouse Delivery Brands | ||
|
Flowers Foods
|
Sunbeam | Mrs. Freshley’s | ||
|
Nature’s Own
|
Roman Meal | European Bakers | ||
|
Whitewheat
|
Bunny | Broad Street Bakery | ||
|
Cobblestone Mill
|
Holsum | Mi Casa | ||
|
Blue Bird
|
Aunt Hattie’s | Leo’s Foods | ||
|
ButterKrust
|
Juarez | |||
|
Dandee
|
||||
|
Mary Jane
|
||||
|
Evangeline Maid
|
||||
|
Ideal
|
||||
|
Captain John Derst
|
||||
|
Country Hearth
|
||||
|
Nature’s Grain
|
1
Table of Contents
2
Table of Contents
| • | Grow Sales. We grow sales by introducing new products, further penetrating core markets, expanding our DSD service to new geographic markets, serving new customers, and making bolt-on acquisitions. | |
| • | Invest Wisely. We invest to make our bakeries the most efficient in the U.S. We will continue investing in technology, efficiency improvements, and new bakeries to maintain our advantage as one of the country’s low-cost bakers. | |
| • | Bake Smart. We offer a broad line of fresh and frozen bakery products that meet our customers’ and our consumers’ needs. We will continue to develop and introduce innovative new products while maintaining the quality of our core products. | |
| • | Develop Brands. Our brands represent product quality, consistency, and delicious taste to consumers. We will maintain our brand strength and use the power of our brands to grow. | |
| • | Give Extraordinary Service. We offer extraordinary service — going beyond the call of duty to help meet customers’ needs. We will expand and refine our distribution and information systems to help us respond even more quickly and efficiently to changing customer service needs, consumer preferences, and seasonal demands in the channels we serve. | |
| • | Innovate. We constantly improve our business processes throughout the company to increase efficiencies, reduce costs, improve quality, and enhance customer service. | |
| • | Appreciate the Team. We embrace diversity, foster team spirit, and encourage professional growth. We build teams that understand the importance of working together to implement our strategies. Our work environment encourages recognition and respect for team and individual achievements. | |
| • | Manage Resources. We strive to conduct business in a manner that helps conserve natural resources and promotes a clean and healthy environment. |
| • | Nature’s Own Sandwich Rounds | |
| • | Nature’s Own Thin Sliced Bagels | |
| • | Nature’s Own Whole Grain White Bread |
3
Table of Contents
4
Table of Contents
5
Table of Contents
6
Table of Contents
7
Table of Contents
| • | Board Committees | |
| • | Code of Business Conduct and Ethics | |
| • | Flowers Foods Employee Code of Conduct | |
| • | Disclosure Policy | |
| • | Corporate Governance Guidelines | |
| • | Stock Ownership Guidelines | |
| • | Audit Committee Charter | |
| • | Compensation Committee Charter |
8
Table of Contents
| • | Finance Committee Charter | |
| • | Nominating/Corporate Governance Committee Charter |
| Item 1A. | Risk Factors |
9
Table of Contents
10
Table of Contents
| • | a classified Board of Directors; | |
| • | the requirement that our shareholders may only remove directors for cause; | |
| • | specified requirements for calling special meetings of shareholders; and |
11
Table of Contents
| • | the ability of the Board of Directors to consider the interests of various constituencies, including our employees, clients and creditors and the local community. |
| Item 1B. | Unresolved Staff Comments. |
| Name, age and Office | Business Experience | |
|
George E. Deese
Age 64 Chairman of the Board and Chief Executive Officer |
Mr. Deese has been Chairman of the Board and Chief Executive Officer of Flowers Foods since January 2010. Mr. Deese previously served as Chairman of the Board, President and Chief Executive Officer of Flowers Foods from January 2006 to January 2010. He previously served as President and Chief Executive Officer of Flowers Foods from January 2004 to January 2006. Prior to that he served as President and Chief Operating Officer of Flowers Foods from May 2002 until January 2004. Mr. Deese also served as President and Chief Operating Officer of Flowers Bakeries from January 1997 until May 2002, President and Chief Operating Officer, Baked Products Group of Flowers Industries from 1983 to January 1997, Regional Vice President, Baked Products Group of Flowers Industries from 1981 to 1983 and President of Atlanta Baking Company from 1980 to 1981. | |
|
Allen L. Shiver
Age 55 President |
Mr. Shiver has been President of Flowers Foods since January 2010. Mr. Shiver previously served as Executive Vice President and Chief Marketing Officer of Flowers Foods from May 2008 to January 2010. He previously served as President and Chief Operating Officer of the warehouse delivery segment from April 2003 until May 2008. Prior to that, he served as President and Chief Operating Officer of Flowers Snack from July 2002 until April 2003. Prior to that Mr. Shiver served as Executive Vice President of Flowers Bakeries from 1998 until 2002, as a Regional Vice President of Flowers Bakeries in 1998 and as President of Flowers Baking Company of Villa Rica from 1995 until 1998. Prior to that time, Mr. Shiver served in various sales and marketing positions at Flowers Bakeries. |
12
Table of Contents
|
R. Steve Kinsey
Age 50 Executive Vice President and Chief Financial Officer |
Mr. Kinsey has been Executive Vice President and Chief Financial Officer of Flowers Foods since May 2008. Mr. Kinsey previously served as Senior Vice President and Chief Financial Officer of Flowers Foods from September 2007 to May 2008. Prior to that he served as Vice President and Corporate Controller of Flowers Foods from 2002 to 2007. Prior to that he served as Director of Tax of Flowers Foods from 2001 to 2002 and Flowers Industries from 1998 to 2001. Mr. Kinsey served as Tax Manager of Flowers Industries from 1994 to 1998. Mr. Kinsey joined the company in 1989 as a Tax Associate. | |
|
Gene D. Lord
Age 63 Executive Vice President and Chief Operating Officer |
Mr. Lord has been Executive Vice President and Chief Operating Officer of Flowers Foods since May 2008. Mr. Lord previously served as President and Chief Operating Officer of the DSD segment from July 2002 to May 2008. Prior to that, he served as a Regional Vice President of Flowers Bakeries from January 1997 until July 2002. Prior to that, he served as Regional Vice President, Baked Products Group of Flowers Industries from May 1987 until January 1997 and as President of Atlanta Baking Company from February 1981 until May 1987. Prior to that time, Mr. Lord served in various sales positions at Flowers Bakeries. | |
|
Stephen R. Avera
Age 54 Executive Vice President, Secretary and General Counsel |
Mr. Avera has been Executive Vice President, Secretary and General Counsel of Flowers Foods since May 2008. Mr. Avera previously served as Senior Vice President, Secretary and General Counsel of Flowers Foods from September 2004 to May 2008. Prior to that, he served as Secretary and General Counsel from February 2002 until September 2004. He also served as Vice President and General Counsel of Flowers Bakeries from July 1998 to February 2002. Mr. Avera also previously served as an associate and Assistant General Counsel of Flowers Industries from February 1986 to July 1998. | |
|
Michael A. Beaty
Age 60 Executive Vice President of Supply Chain |
Mr. Beaty has been Executive Vice President of Supply Chain of Flowers Foods since May 2008. Mr. Beaty previously served as Senior Vice President-Supply Chain of Flowers Foods from September 2002 to May 2008. Prior to that, he served as Senior Vice President of Bakery Operations of Flowers Bakeries from September 1994 until September 2002. He also served as Vice President of Manufacturing of Flowers Bakeries from February 1987 until September 1994. Prior to that time, Mr. Beaty served in management positions at various Flowers Bakeries operations, including Vice President of Manufacturing, Executive Vice President and President of various Flowers operations from 1974 until 1987. | |
|
Marta Jones Turner
Age 57 Executive Vice President of Corporate Relations |
Ms. Turner has been Executive Vice President of Corporate Relations of Flowers Foods since May 2008. Ms. Turner previously served as Senior Vice President of Corporate Relations of Flowers Foods from July 2004 to May 2008. Prior to that, she served as Vice President of Communications and Investor Relations from November 2000 until July 2004. She also served as Vice President of Public Affairs of Flowers Industries from September 1997 until January 2000 and Director of Public Relations of Flowers Industries from 1985 until 1997. | |
|
Karyl H. Lauder
Age 54 Senior Vice President and Chief Accounting Officer |
Ms. Lauder has been Senior Vice President and Chief Accounting Officer of Flowers Foods since May 2008. Ms. Lauder previously served as Vice President and Chief Accounting Officer of Flowers Foods from September 2007 to May 2008. Ms. Lauder previously served as Vice President and Operations Controller of Flowers Foods from 2003 to 2007. Prior to that she served as Division Controller for Flowers Bakeries Group from 1997 to 2003. Prior to that, Ms. Lauder served as a Regional Controller for Flowers Bakeries after serving as Controller and in other accounting supervisory positions at various plant locations since 1978. |
13
Table of Contents
|
Bradley K. Alexander
Age 52 President, Flowers Bakeries |
Mr. Alexander has been President of Flowers Bakeries since May 2008. Mr. Alexander previously served as a Regional Vice President of Flowers Bakeries from 2003 until May 2008. Prior to that, he served in various sales, marketing and operational positions since joining the company in 1981, including bakery president and Senior Vice President of Sales and Marketing. | |
|
Donald A. Thriffiley, Jr.
Age 57 Senior Vice President of Human Resources |
Mr. Thriffiley has been Senior Vice President of Human Resources for Flowers Foods since May 2008. Mr. Thriffiley, previously served as Vice President of Human Resources from 2002 to 2008. Prior to that Mr. Thriffiley served as Director of Human Resources for Flowers Bakeries and in other human resources positions since joining the company in 1977. | |
|
Vyto F. Razminas
Age 53 Senior Vice President and Chief Information Officer |
Mr. Razminas has been Senior Vice President and Chief Information Officer for Flowers Foods since May 2008. Mr. Razminas, previously served as Vice President of Business and Information Systems from 2002 to 2008. Prior to that Mr. Razminas served as Chief Information Officer from 1998 to 2002. | |
|
H. Mark Courtney
Age 50 Senior Vice President of Sales and Marketing |
Mr. Courtney has been Senior Vice President of Sales and Marketing of Flowers Bakeries since January of 2010. He previously served as Senior Vice President of Sales from April 2008 until January 2010. Prior to that, Mr. Courtney served in various sales, marketing, and operations positions, including Executive Vice President of Flowers Snack Group. Mr. Courtney joined the company in 1983. |
14
Table of Contents
| Item 2. | Properties |
|
DSD
|
||
|
Birmingham, Alabama
|
Baton Rouge, Louisiana | |
|
Opelika, Alabama
|
Lafayette, Louisiana | |
|
Tuscaloosa, Alabama
|
New Orleans, Louisiana | |
|
Phoenix, Arizona
|
Goldsboro, North Carolina | |
|
Tolleson, Arizona
|
Jamestown, North Carolina | |
|
Batesville, Arkansas
|
Newton, North Carolina | |
|
Bradenton, Florida
|
Morristown, Tennessee | |
|
Jacksonville, Florida
|
Denton, Texas | |
|
Lakeland, Florida
|
El Paso, Texas | |
|
Miami, Florida
|
Houston, Texas(2) | |
|
Atlanta, Georgia
|
San Antonio, Texas | |
|
Savannah, Georgia
|
Tyler, Texas | |
|
Thomasville, Georgia
|
Lynchburg, Virginia | |
|
Villa Rica, Georgia
|
Norfolk, Virginia | |
|
Bardstown, Kentucky
|
Bluefield, West Virginia | |
|
Warehouse Delivery
|
||
|
Montgomery, Alabama
|
Sykesville, Maryland (Leased) | |
|
Texarkana, Arkansas
|
Winston-Salem, North Carolina | |
|
Suwanee, Georgia
|
Cleveland, Tennessee | |
|
Tucker, Georgia
|
Crossville, Tennessee | |
|
Cedar Rapids, Iowa
|
Ft. Worth, Texas | |
|
London, Kentucky
|
||
| Item 3. | Legal Proceedings |
15
Table of Contents
| Item 4. | [Removed and Reserved] |
| Item 5. | Market for the Registrant’s Common Equity, Related Stockholder Matters and Issuer Purchases of Equity Securities |
| FY 2010 | FY 2009 | |||||||||||||||||||||||
| Market Price | Dividend | Market Price | Dividend | |||||||||||||||||||||
| Quarter | High | Low | High | Low | ||||||||||||||||||||
|
First
|
$ | 26.67 | $ | 23.75 | $ | 0.175 | $ | 24.44 | $ | 20.40 | $ | 0.150 | ||||||||||||
|
Second
|
$ | 27.58 | $ | 23.68 | $ | 0.200 | $ | 24.27 | $ | 20.59 | $ | 0.175 | ||||||||||||
|
Third
|
$ | 26.15 | $ | 22.97 | $ | 0.200 | $ | 26.40 | $ | 22.41 | $ | 0.175 | ||||||||||||
|
Fourth
|
$ | 27.34 | $ | 24.25 | $ | 0.200 | $ | 24.72 | $ | 21.90 | $ | 0.175 | ||||||||||||
|
Number of Securities to
|
Number of Securities Remaining
|
|||||||||||
|
be Issued Upon
|
Weighted Average
|
Available for Future Issuance Under
|
||||||||||
|
Exercise of Outstanding
|
Exercise Price of
|
Equity Compensation Plans
|
||||||||||
|
Options, Warrants and
|
Outstanding Options,
|
(Excluding Securities Reflected in
|
||||||||||
| Plan Category | Rights | Warrants and Rights | Column(a)) | |||||||||
| (a) | (b) | (c) | ||||||||||
| (Amounts in thousands, except per share data) | ||||||||||||
|
Equity compensation plans approved by security holders
|
4,365 | $ | 22.00 | 3,923 | ||||||||
|
Equity compensation plans not approved by security holders
|
— | — | — | |||||||||
|
Total
|
4,365 | $ | 22.00 | 3,923 | ||||||||
16
Table of Contents
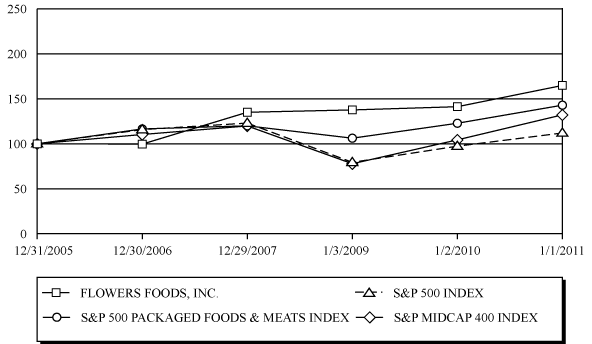
|
December 31,
|
December 30,
|
December 29,
|
January 3,
|
January 2,
|
January 1,
|
|||||||||||||||||||||||||
| 2005 | 2006 | 2007 | 2009 | 2010 | 2011 | |||||||||||||||||||||||||
|
FLOWERS FOODS INC
|
100.00 | 99.64 | 135.04 | 137.62 | 141.22 | 164.83 | ||||||||||||||||||||||||
|
S&P 500 INDEX
|
100.00 | 115.79 | 123.00 | 79.39 | 97.34 | 112.00 | ||||||||||||||||||||||||
|
S&P 500 PACKAGED FOODS & MEAT INDEX
|
100.00 | 116.5 | 119.97 | 106.21 | 122.81 | 142.91 | ||||||||||||||||||||||||
|
S&P MIDCAP 400 INDEX
|
100.00 | 110.32 | 119.81 | 77.81 | 104.36 | 132.17 | ||||||||||||||||||||||||
17
Table of Contents
|
Total
|
||||||||||||||||
|
Number of
|
Maximum
|
|||||||||||||||
|
Shares
|
Number of
|
|||||||||||||||
|
Purchased
|
Shares that
|
|||||||||||||||
|
as Part of
|
May Yet Be
|
|||||||||||||||
|
Total
|
Publicly
|
Purchased
|
||||||||||||||
|
Number of
|
Weighted
|
Announced
|
Under the
|
|||||||||||||
|
Shares
|
Average Price
|
Plan or
|
Plan or
|
|||||||||||||
| Period | Purchased | per Share | Programs | Programs | ||||||||||||
| (Amounts in thousands, except price data) | ||||||||||||||||
|
October 10, 2010 — November 6, 2010
|
45 | $ | 25.54 | 45 | 6,395 | |||||||||||
|
November 7, 2010 — December 4, 2010
|
130 | $ | 25.82 | 130 | 6,265 | |||||||||||
|
December 5, 2010 — January 1, 2011
|
464 | $ | 25.67 | 464 | 5,801 | |||||||||||
|
Total
|
639 | $ | 25.69 | 639 | ||||||||||||
| Item 6. | Selected Financial Data |
|
For the 53
|
||||||||||||||||||||
| For the 52 Weeks Ended | Weeks Ended | For the 52 Weeks Ended | ||||||||||||||||||
| January 1, 2011 | January 2, 2010 | January 3, 2009 | December 29, 2007 | December 30, 2006 | ||||||||||||||||
| (Amounts in thousands, except per share data) | ||||||||||||||||||||
|
Statement of Income Data:
|
||||||||||||||||||||
|
Sales
|
$ | 2,573,769 | $ | 2,600,849 | $ | 2,414,892 | $ | 2,036,674 | $ | 1,888,654 | ||||||||||
|
Income from continuing operations before cumulative effect of a
change in accounting principle
|
137,047 | 133,712 | 122,307 | 98,115 | 78,135 | |||||||||||||||
|
Income from discontinued operations, net of income tax
|
— | — | — | — | 6,731 | |||||||||||||||
|
Cumulative effect of a change in accounting principle, net of
income tax benefit
|
— | — | — | — | (568 | )(1) | ||||||||||||||
|
Net income
|
137,047 | 133,712 | 122,307 | 98,115 | 84,298 | |||||||||||||||
|
Net income attributable to noncontrolling interest
|
— | (3,415 | ) | (3,074 | ) | (3,500 | ) | (3,255 | ) | |||||||||||
|
Net income attributable to Flowers Foods, Inc.
|
$ | 137,047 | $ | 130,297 | $ | 119,233 | $ | 94,615 | $ | 81,043 | ||||||||||
|
Income from continuing operations before cumulative effect of a
change in accounting principle attributable to Flowers Foods,
Inc. common shareholders per diluted share
|
$ | 1.49 | $ | 1.41 | $ | 1.28 | $ | 1.02 | $ | 0.81 | ||||||||||
|
Cash dividends per common share
|
$ | 0.775 | $ | 0.675 | $ | 0.575 | $ | 0.458 | $ | 0.317 | ||||||||||
|
Balance Sheet Data:
|
||||||||||||||||||||
|
Total assets
|
$ | 1,325,489 | $ | 1,351,442 | $ | 1,353,244 | $ | 987,535 | $ | 906,590 | ||||||||||
|
Long-term debt
|
$ | 98,870 | $ | 225,905 | $ | 263,879 | $ | 22,508 | $ | 79,126 | ||||||||||
| (1) | Relates to the adoption on January 1, 2006 of guidance on accounting for share-based payments. |
18
Table of Contents
| Item 7. | Management’s Discussion and Analysis of Financial Condition and Results of Operations |
19
Table of Contents
| • | revenue recognition; | |
| • | derivative instruments; | |
| • | valuation of long-lived assets, goodwill and other intangibles; | |
| • | self-insurance reserves; | |
| • | income tax expense and accruals; and | |
| • | pension obligations. |
20
Table of Contents
21
Table of Contents
22
Table of Contents
23
Table of Contents
| Percentage of Sales | Increase (Decrease) | |||||||||||||||||||||||
|
For the Fifty-Two
|
For the Fifty-Two
|
For the Fifty-Two
|
For the Fifty-Two
|
|||||||||||||||||||||
| Weeks Ended | Weeks Ended | Weeks Ended | Weeks Ended | |||||||||||||||||||||
| January 1, 2011 | January 2, 2010 | January 1, 2011 | January 2, 2010 | Dollars | % | |||||||||||||||||||
| (Amounts in thousands) | (Amounts in thousands) | |||||||||||||||||||||||
|
Sales
|
||||||||||||||||||||||||
|
DSD
|
$ | 2,071,356 | $ | 2,135,128 | 80.5 | 82.1 | $ | (63,772 | ) | (3.0 | ) | |||||||||||||
|
Warehouse delivery
|
502,413 | 465,721 | 19.5 | 17.9 | 36,692 | 7.9 | ||||||||||||||||||
|
Total
|
$ | 2,573,769 | $ | 2,600,849 | 100.0 | 100.0 | $ | (27,080 | ) | (1.0 | ) | |||||||||||||
|
Materials, supplies, labor and other production costs
(exclusive of depreciation and amortization shown separately
below)
|
||||||||||||||||||||||||
|
DSD(1)
|
$ | 986,610 | $ | 1,060,398 | 47.6 | 49.7 | $ | (73,788 | ) | (7.0 | ) | |||||||||||||
|
Warehouse delivery(1)
|
360,180 | 329,785 | 71.7 | 70.8 | 30,395 | 9.2 | ||||||||||||||||||
|
Total
|
$ | 1,346,790 | $ | 1,390,183 | 52.3 | 53.5 | $ | (43,393 | ) | (3.1 | ) | |||||||||||||
|
Selling, distribution and administrative expenses
|
||||||||||||||||||||||||
|
DSD(1)
|
$ | 823,797 | $ | 817,613 | 39.8 | 38.3 | $ | 6,184 | 0.8 | |||||||||||||||
|
Warehouse delivery(1)
|
75,323 | 71,561 | 15.0 | 15.4 | 3,762 | 5.3 | ||||||||||||||||||
|
Corporate(2)
|
36,879 | 37,244 | — | — | (365 | ) | (1.0 | ) | ||||||||||||||||
|
Total
|
$ | 935,999 | $ | 926,418 | 36.4 | 35.6 | $ | 9,581 | 1.0 | |||||||||||||||
|
Depreciation and amortization
|
||||||||||||||||||||||||
|
DSD(1)
|
$ | 65,977 | $ | 64,578 | 3.2 | 3.0 | $ | 1,399 | 2.2 | |||||||||||||||
|
Warehouse delivery(1)
|
18,985 | 16,062 | 3.8 | 3.4 | 2,923 | 18.2 | ||||||||||||||||||
|
Corporate(2)
|
156 | 288 | — | — | (132 | ) | (45.8 | ) | ||||||||||||||||
|
Total
|
$ | 85,118 | $ | 80,928 | 3.3 | 3.1 | $ | 4,190 | 5.2 | |||||||||||||||
|
Gain on acquisition
|
||||||||||||||||||||||||
|
DSD(1)
|
$ | — | $ | — | — | — | $ | — | — | |||||||||||||||
|
Warehouse delivery(1)
|
— | (3,013 | ) | — | (0.6 | ) | (3,013 | ) | 100.0 | |||||||||||||||
|
Corporate(2)
|
— | — | — | — | — | — | ||||||||||||||||||
|
Total
|
$ | — | $ | (3,013 | ) | — | (0.1 | ) | $ | (3,013 | ) | — | ||||||||||||
|
Income from operations
|
||||||||||||||||||||||||
|
DSD(1)
|
$ | 194,972 | $ | 192,539 | 9.4 | 9.0 | $ | 2,433 | 1.3 | |||||||||||||||
|
Warehouse delivery(1)
|
47,925 | 51,326 | 9.5 | 11.0 | (3,401 | ) | (6.6 | ) | ||||||||||||||||
|
Corporate(2)
|
(37,035 | ) | (37,532 | ) | — | — | 497 | 1.3 | ||||||||||||||||
|
Total
|
$ | 205,862 | $ | 206,333 | 8.0 | 7.9 | $ | (471 | ) | (0.2 | ) | |||||||||||||
|
Interest income, net
|
$ | 4,518 | $ | 1,426 | 0.2 | 0.1 | $ | 3,092 | 216.8 | |||||||||||||||
|
Income taxes
|
$ | 73,333 | $ | 74,047 | 2.8 | 2.8 | $ | (714 | ) | (1.0 | ) | |||||||||||||
|
Net income
|
$ | 137,047 | $ | 133,712 | 5.3 | 5.1 | $ | 3,335 | 2.5 | |||||||||||||||
|
Net income attributable to noncontrolling interest
|
$ | — | $ | (3,415 | ) | — | (0.1 | ) | $ | 3,415 | 100.0 | |||||||||||||
|
Net income attributable to Flowers Foods, Inc.
|
$ | 137,047 | $ | 130,297 | 5.3 | 5.0 | $ | 6,750 | 5.2 | |||||||||||||||
| 1. | As a percentage of revenue within the reporting segment. | |
| 2. | The corporate segment has no revenues. |
24
Table of Contents
| Percentage of Sales | Increase (Decrease) | |||||||||||||||||||||||
|
For the Fifty-Two
|
For the Fifty-Three
|
For the Fifty-Two
|
For the Fifty-Three
|
|||||||||||||||||||||
| Weeks Ended | Weeks Ended | Weeks Ended | Weeks Ended | |||||||||||||||||||||
| January 2, 2010 | January 3, 2009 | January 2, 2010 | January 3, 2009 | Dollars | % | |||||||||||||||||||
| (Amounts in thousands) | (Amounts in thousands) | |||||||||||||||||||||||
|
Sales
|
||||||||||||||||||||||||
|
DSD
|
$ | 2,135,128 | $ | 1,999,293 | 82.1 | 82.8 | $ | 135,835 | 6.8 | |||||||||||||||
|
Warehouse delivery
|
465,721 | 415,599 | 17.9 | 17.2 | 50,122 | 12.1 | ||||||||||||||||||
|
Total
|
$ | 2,600,849 | $ | 2,414,892 | 100.0 | 100.0 | $ | 185,957 | 7.7 | |||||||||||||||
|
Materials, supplies, labor and other production costs
(exclusive of depreciation and amortization shown separately
below)
|
||||||||||||||||||||||||
|
DSD(1)
|
$ | 1,060,398 | $ | 961,697 | 49.7 | 48.1 | $ | 98,701 | 10.3 | |||||||||||||||
|
Warehouse delivery(1)
|
329,785 | 302,265 | 70.8 | 72.7 | 27,520 | 9.1 | ||||||||||||||||||
|
Total
|
$ | 1,390,183 | $ | 1,263,962 | 53.5 | 52.3 | $ | 126,221 | 10.0 | |||||||||||||||
|
Selling, distribution and administrative expenses
|
||||||||||||||||||||||||
|
DSD(1)
|
$ | 817,613 | $ | 792,435 | 38.3 | 39.6 | $ | 25,178 | 3.2 | |||||||||||||||
|
Warehouse delivery(1)
|
71,561 | 74,425 | 15.4 | 17.9 | (2,864 | ) | (3.8 | ) | ||||||||||||||||
|
Corporate(2)
|
37,244 | 27,940 | — | — | 9,304 | 33.3 | ||||||||||||||||||
|
Total
|
$ | 926,418 | $ | 894,800 | 35.6 | 37.1 | $ | 31,618 | 3.5 | |||||||||||||||
|
Depreciation and amortization
|
||||||||||||||||||||||||
|
DSD(1)
|
$ | 64,578 | $ | 57,447 | 3.0 | 2.9 | $ | 7,131 | 12.4 | |||||||||||||||
|
Warehouse delivery(1)
|
16,062 | 15,549 | 3.4 | 3.7 | 513 | 3.3 | ||||||||||||||||||
|
Corporate(2)
|
288 | 316 | — | — | (28 | ) | (8.9 | ) | ||||||||||||||||
|
Total
|
$ | 80,928 | $ | 73,312 | 3.1 | 3.0 | $ | 7,616 | 10.4 | |||||||||||||||
|
Gain on acquisition
|
||||||||||||||||||||||||
|
DSD(1)
|
$ | — | $ | — | — | — | $ | — | — | |||||||||||||||
|
Warehouse delivery(1)
|
(3,013 | ) | — | (0.6 | ) | — | (3,013 | ) | — | |||||||||||||||
|
Corporate(2)
|
— | — | — | — | — | — | ||||||||||||||||||
|
Total
|
$ | (3,013 | ) | $ | — | (0.1 | ) | — | $ | (3,013 | ) | — | ||||||||||||
|
Gain on sale of assets
|
||||||||||||||||||||||||
|
DSD(1)
|
$ | — | $ | — | — | — | $ | — | — | |||||||||||||||
|
Warehouse delivery(1)
|
— | (2,306 | ) | — | (0.6 | ) | 2,306 | — | ||||||||||||||||
|
Corporate(2)
|
— | — | — | — | — | — | ||||||||||||||||||
|
Total
|
$ | — | $ | (2,306 | ) | — | (0.1 | ) | $ | 2,306 | — | |||||||||||||
|
Asset impairment
|
||||||||||||||||||||||||
|
DSD(1)
|
$ | — | $ | 3,108 | — | 0.2 | $ | (3,108 | ) | — | ||||||||||||||
|
Warehouse delivery(1)
|
— | — | — | — | — | — | ||||||||||||||||||
|
Corporate(2)
|
— | — | — | — | — | — | ||||||||||||||||||
|
Total
|
$ | — | $ | 3,108 | — | 0.1 | $ | (3,108 | ) | — | ||||||||||||||
|
Gain on insurance recovery
|
||||||||||||||||||||||||
|
DSD(1)
|
$ | — | $ | (686 | ) | — | — | $ | 686 | — | ||||||||||||||
|
Warehouse delivery(1)
|
— | — | — | — | — | — | ||||||||||||||||||
|
Corporate(2)
|
— | — | — | — | — | — | ||||||||||||||||||
|
Total
|
$ | — | $ | (686 | ) | — | — | $ | 686 | — | ||||||||||||||
|
Income from operations
|
||||||||||||||||||||||||
|
DSD(1)
|
$ | 192,539 | $ | 185,292 | 9.0 | 9.3 | $ | 7,247 | 3.9 | |||||||||||||||
|
Warehouse delivery(1)
|
51,326 | 25,666 | 11.0 | 6.2 | 25,660 | 100.0 | ||||||||||||||||||
|
Corporate(2)
|
(37,532 | ) | (28,256 | ) | — | — | (9,276 | ) | (32.8 | ) | ||||||||||||||
|
Total
|
$ | 206,333 | $ | 182,702 | 7.9 | 7.6 | $ | 23,631 | 12.9 | |||||||||||||||
|
Interest income, net
|
$ | 1,426 | $ | 7,349 | 0.1 | 0.3 | $ | (5,923 | ) | (80.6 | ) | |||||||||||||
|
Income taxes
|
$ | 74,047 | $ | 67,744 | 2.8 | 2.8 | $ | 6,303 | 9.3 | |||||||||||||||
|
Net income
|
$ | 133,712 | $ | 122,307 | 5.1 | 5.1 | $ | 11,405 | 9.3 | |||||||||||||||
|
Net income attributable to noncontrolling interest
|
$ | (3,415 | ) | $ | (3,074 | ) | (0.1 | ) | (0.1 | ) | $ | (341 | ) | (11.2 | ) | |||||||||
|
Net income attributable to Flowers Foods, Inc.
|
$ | 130,297 | $ | 119,233 | 5.0 | 4.9 | $ | 11,064 | 9.3 | |||||||||||||||
| 1. | As a percentage of revenue within the reporting segment. | |
| 2. | The corporate segment has no revenues. |
25
Table of Contents
|
For the 52
|
For the 52
|
|||||||||||||||||||
| Weeks Ended | Weeks Ended | |||||||||||||||||||
| January 1, 2011 | January 2, 2010 |
% Increase
|
||||||||||||||||||
| $ | % | $ | % | (Decrease) | ||||||||||||||||
|
(Amounts in
|
(Amounts in
|
|||||||||||||||||||
| thousands) | thousands) | |||||||||||||||||||
|
Branded Retail
|
$ | 1,329,591 | 51.7 | % | $ | 1,347,578 | 51.8 | % | (1.3 | )% | ||||||||||
|
Store Branded Retail
|
438,062 | 17.0 | 418,026 | 16.1 | 4.8 | % | ||||||||||||||
|
Non-retail and Other
|
806,116 | 31.3 | 835,245 | 32.1 | (3.5 | )% | ||||||||||||||
|
Total
|
$ | 2,573,769 | 100.0 | % | $ | 2,600,849 | 100.0 | % | (1.0 | )% | ||||||||||
|
Favorable
|
||||
| Percentage Point Change in Sales Attributed to: | (Unfavorable) | |||
|
Pricing/Mix
|
(1.7 | )% | ||
|
Volume
|
0.2 | % | ||
|
VIE deconsolidation
|
(0.5 | )% | ||
|
Acquisitions
|
1.0 | % | ||
|
Total Percentage Change in Sales
|
(1.0 | )% | ||
|
For the 52
|
For the 52
|
|||||||||||||||||||
| Weeks Ended | Weeks Ended | |||||||||||||||||||
| January 1, 2011 | January 2, 2010 |
% Increase
|
||||||||||||||||||
| $ | % | $ | % | (Decrease) | ||||||||||||||||
|
(Amounts in
|
(Amounts in
|
|||||||||||||||||||
| thousands) | thousands) | |||||||||||||||||||
|
Branded Retail
|
$ | 1,221,074 | 59.0 | % | $ | 1,213,217 | 56.8 | % | 0.7 | % | ||||||||||
|
Store Branded Retail
|
332,109 | 16.0 | 358,700 | 16.8 | (7.4 | )% | ||||||||||||||
|
Non-retail and Other
|
518,173 | 25.0 | 563,211 | 26.4 | (8.0 | )% | ||||||||||||||
|
Total
|
$ | 2,071,356 | 100.0 | % | $ | 2,135,128 | 100.0 | % | (3.0 | )% | ||||||||||
26
Table of Contents
| Percentage Point Change in Sales Attributed to: | (Unfavorable) | |||
|
Pricing/Mix
|
(2.0 | )% | ||
|
Volume
|
(0.4 | )% | ||
|
VIE deconsolidation
|
(0.6 | )% | ||
|
Total Percentage Change in Sales
|
(3.0 | )% | ||
|
For the 52
|
For the 52
|
|||||||||||||||||||
| Weeks Ended | Weeks Ended | |||||||||||||||||||
| January 1, 2011 | January 2, 2010 |
% Increase
|
||||||||||||||||||
| $ | % | $ | % | (Decrease) | ||||||||||||||||
|
(Amounts in
|
(Amounts in
|
|||||||||||||||||||
| thousands) | thousands) | |||||||||||||||||||
|
Branded Retail
|
$ | 108,517 | 21.6 | % | $ | 134,361 | 28.9 | % | (19.2 | )% | ||||||||||
|
Store Branded Retail
|
105,953 | 21.1 | 59,326 | 12.7 | 78.6 | % | ||||||||||||||
|
Non-retail and Other
|
287,943 | 57.3 | 272,034 | 58.4 | 5.8 | % | ||||||||||||||
|
Total
|
$ | 502,413 | 100.0 | % | $ | 465,721 | 100.0 | % | 7.9 | % | ||||||||||
| Percentage Point Change in Sales Attributed to: | Favorable | |||
|
Pricing/Mix
|
0.9 | % | ||
|
Volume
|
1.2 | % | ||
|
Acquisitions
|
5.8 | % | ||
|
Total Percentage Change in Sales
|
7.9 | % | ||
27
Table of Contents
28
Table of Contents
|
For the 52
|
For the 53
|
|||||||||||||||||||
| Weeks Ended | Weeks Ended | |||||||||||||||||||
| January 2, 2010 | January 3, 2009 | |||||||||||||||||||
| $ | % | $ | % | % Increase | ||||||||||||||||
|
(Amounts in
|
(Amounts in
|
|||||||||||||||||||
| thousands) | thousands) | |||||||||||||||||||
|
Branded Retail
|
$ | 1,347,578 | 51.8 | % | $ | 1,274,298 | 52.8 | % | 5.8 | % | ||||||||||
|
Store Branded Retail
|
418,026 | 16.1 | 355,390 | 14.7 | 17.6 | % | ||||||||||||||
|
Non-retail and Other
|
835,245 | 32.1 | 785,204 | 32.5 | 6.4 | % | ||||||||||||||
|
Total
|
$ | 2,600,849 | 100.0 | % | $ | 2,414,892 | 100.0 | % | 7.7 | % | ||||||||||
|
Favorable
|
||||
| Percentage Point Change in Sales Attributed to: | (Unfavorable) | |||
|
Pricing/Mix
|
2.6 | % | ||
|
Volume
|
(0.2 | )% | ||
|
Absence of week fifty-three
|
(2.0 | )% | ||
|
Acquisitions
|
7.3 | % | ||
|
Total Percentage Change in Sales
|
7.7 | % | ||
29
Table of Contents
|
For the 52
|
For the 53
|
|||||||||||||||||||
| Weeks Ended | Weeks Ended | |||||||||||||||||||
| January 2, 2010 | January 3, 2009 | |||||||||||||||||||
| $ | % | $ | % | % Increase | ||||||||||||||||
|
(Amounts in
|
(Amounts in
|
|||||||||||||||||||
| thousands) | thousands) | |||||||||||||||||||
|
Branded Retail
|
$ | 1,213,217 | 56.8 | % | $ | 1,161,594 | 58.1 | % | 4.4 | % | ||||||||||
|
Store Branded Retail
|
358,700 | 16.8 | 303,193 | 15.2 | 18.3 | % | ||||||||||||||
|
Non-retail and Other
|
563,211 | 26.4 | 534,506 | 26.7 | 5.4 | % | ||||||||||||||
|
Total
|
$ | 2,135,128 | 100.0 | % | $ | 1,999,293 | 100.0 | % | 6.8 | % | ||||||||||
|
Favorable
|
||||
| Percentage Point Change in Sales Attributed to: | (Unfavorable) | |||
|
Pricing/Mix
|
1.6 | % | ||
|
Volume
|
(0.5 | )% | ||
|
Absence of week fifty-three
|
(2.0 | )% | ||
|
Acquisitions
|
7.7 | % | ||
|
Total Percentage Change in Sales
|
6.8 | % | ||
|
For the 52
|
For the 53
|
|||||||||||||||||||
| Weeks Ended | Weeks Ended | |||||||||||||||||||
| January 2, 2010 | January 3, 2009 | |||||||||||||||||||
| $ | % | $ | % | % Increase | ||||||||||||||||
|
(Amounts in
|
(Amounts in
|
|||||||||||||||||||
| thousands) | thousands) | |||||||||||||||||||
|
Branded Retail
|
$ | 134,361 | 28.9 | % | $ | 112,704 | 27.1 | % | 19.2 | % | ||||||||||
|
Store Branded Retail
|
59,326 | 12.7 | 52,197 | 12.6 | 13.7 | % | ||||||||||||||
|
Non-retail and Other
|
272,034 | 58.4 | 250,698 | 60.3 | 8.5 | % | ||||||||||||||
|
Total
|
$ | 465,721 | 100.0 | % | $ | 415,599 | 100.0 | % | 12.1 | % | ||||||||||
30
Table of Contents
|
Favorable
|
||||
| Percentage Point Change in Sales Attributed to: | (Unfavorable) | |||
|
Pricing/Mix
|
8.2 | % | ||
|
Volume
|
0.8 | % | ||
|
Absence of week fifty-three
|
(2.1 | )% | ||
|
Acquisitions
|
5.2 | % | ||
|
Total Percentage Change in Sales
|
12.1 | % | ||
31
Table of Contents
32
Table of Contents
|
Depreciation and amortization
|
$ | 85,118 | ||
|
Stock-based compensation
|
13,678 | |||
|
Loss reclassified from accumulated other comprehensive income to
net income
|
8,475 | |||
|
Deferred income taxes
|
3,888 | |||
|
Pension and postretirement expense
|
1,842 | |||
|
Provision for inventory obsolescence
|
1,047 | |||
|
Allowances for accounts receivable
|
547 | |||
|
Other
|
(285 | ) | ||
|
Total
|
$ | 114,310 | ||
33
Table of Contents
34
Table of Contents
35
Table of Contents
36
Table of Contents
| Payments Due by Fiscal Year | ||||||||||||||||||||
| (Amounts in thousands) | ||||||||||||||||||||
|
2015 and
|
||||||||||||||||||||
| 2011 | 2012 | 2013 | 2014 | Thereafter | ||||||||||||||||
|
Contractual Obligations:
|
||||||||||||||||||||
|
Long-term debt
|
$ | 24,858 | $ | 39,843 | $ | 51,838 | $ | 221 | $ | — | ||||||||||
|
Interest payments(1)
|
3,895 | 2,340 | 487 | 5 | — | |||||||||||||||
|
Capital leases
|
3,574 | 2,221 | 2,075 | 2,300 | 372 | |||||||||||||||
|
Interest on capital leases
|
374 | 250 | 158 | 73 | 6 | |||||||||||||||
|
Non-cancelable operating lease obligations(2)
|
41,861 | 37,864 | 33,292 | 27,951 | 171,860 | |||||||||||||||
|
Pension and postretirement contributions and payments(3)
|
3,670 | 1,021 | 1,081 | 1,141 | 7,196 | |||||||||||||||
|
Deferred compensation plan obligations(4)
|
192 | 124 | 117 | 101 | 8,060 | |||||||||||||||
|
Purchase obligations(5)
|
170,842 | — | — | — | — | |||||||||||||||
|
Total contractual cash obligations
|
$ | 249,266 | $ | 83,663 | $ | 89,048 | $ | 31,792 | $ | 187,494 | ||||||||||
| Amounts Expiring by Fiscal Year | ||||||||||||||||||||
| (Amounts in thousands) | ||||||||||||||||||||
|
2015 and
|
||||||||||||||||||||
| 2011 | 2012 | 2013 | 2014 | Thereafter | ||||||||||||||||
|
Commitments:
|
||||||||||||||||||||
|
Standby letters of credit(6)
|
$ | 4,798 | $ | — | $ | — | $ | — | $ | — | ||||||||||
|
Truck lease guarantees
|
56 | 276 | 44 | 37 | 193 | |||||||||||||||
|
Total commitments
|
$ | 4,854 | $ | 276 | $ | 44 | $ | 37 | $ | 193 | ||||||||||
| (1) | Interest payments represent expected fixed payments based on our interest rate swaps under our term loan. Interest payments on our credit facility are not included as these balances will fluctuate over time and the interest rates are variable. | |
| (2) | Does not include lease payments expected to be incurred in fiscal year 2011 related to distributor vehicles and other short-term operating leases. | |
| (3) | Includes the estimated company contributions to the pension plans during fiscal 2011 and the expected benefit payments for postretirement plans from fiscal 2011 through fiscal 2020. | |
| (4) | These are unsecured general obligations to pay the deferred compensation of, and our contributions to, participants in the EDCP. | |
| (5) | Represents the company’s various ingredient and packaging purchasing agreements, which meet the normal purchases exception for cash flow hedge accounting. | |
| (6) | These letters of credit are for the benefit of certain insurance companies related to workers’ compensation liabilities recorded by the company as of January 1, 2011. Such amounts are not recorded on the consolidated balance sheets, but reduce availability of funds under the credit facility. |
37
Table of Contents
38
Table of Contents
| Item 7A. | Quantitative and Qualitative Disclosures About Market Risk |
39
Table of Contents
| Item 8. | Financial Statements and Supplementary Data |
| Item 9. | Changes in and Disagreements with Accountants on Accounting and Financial Disclosure |
| Item 9A. | Controls and Procedures |
| Item 9B. | Other Information |
| Item 10. | Directors, Executive Officers and Corporate Governance |
40
Table of Contents
| Item 11. | Executive Compensation |
| Item 12. | Security Ownership of Certain Beneficial Owners and Management and Related Stockholder Matters |
| Item 13. | Certain Relationships and Related Transactions, and Director Independence |
| Item 14. | Principal Accounting Fees and Services |
41
Table of Contents
| Item 15. | Exhibits and Financial Statement Schedules |
|
Exhibit
|
||||||
| No | Name of Exhibit | |||||
| 2 | .1 | — | Distribution Agreement by and between Flowers Industries, Inc. and Flowers Foods, Inc., dated as of October 26, 2000 (Incorporated by reference to Flowers Foods’ Registration Statement on Form 10, dated December 1, 2000, File No. 1-16247). | |||
| 2 | .2 | — | Amendment No. 1 to Distribution Agreement, dated as of March 12, 2001, between Flowers Industries, Inc. and Flowers Foods, Inc. (Incorporated by reference to Flowers Foods’ Annual Report on Form 10-K, dated March 30, 2001, File No. 1-16247). | |||
| 3 | .1 | — | Restated Articles of Incorporation of Flowers Foods, Inc. as amended on May 30, 2008 (Incorporated by reference to Flowers Foods’ Quarterly Report on Form 10-Q, dated June 4, 2009, File No. 1-16247). | |||
| 3 | .2 | — | Amended and Restated Bylaws of Flowers Foods, Inc., as amended and restated on November 14, 2008 (incorporated by reference to Flowers Foods’ Current Report on Form 8-K dated November 18, 2008, File No. 1-16247). | |||
| 4 | .1 | — | Share Certificate of Common Stock of Flowers Foods, Inc. (Incorporated by reference to Flowers Foods’ Annual Report on Form 10-K, dated March 30, 2001, File No. 1-16247). | |||
| 4 | .2 | — | Rights Agreement between Flowers Foods, Inc. and First Union National Bank, as Rights Agent, dated March 23, 2001 (Incorporated by reference to Flowers Foods’ Annual Report on Form 10-K, dated March 30, 2001, File No. 1-16247). | |||
| 4 | .3 | — | Amendment No. 1, dated November 15, 2002, to Rights Agreement between Flowers Foods, Inc. and Wachovia Bank, N.A. (as successor in interest to First Union National Bank), as rights agent, dated March 23, 2001. (Incorporated by reference to Flowers Foods’ Registration Statement on Form 8-A, dated November 18, 2002, File No. 1-16247). | |||
| 4 | .6 | — | Form of Indenture (Incorporated by reference to Flowers Foods’ Registration Statement on Form S-3, dated February 8, 2011, File No. 1-16247). | |||
| 10 | .1 | — | Flowers Foods, Inc. Retirement Plan No. 1, as amended and restated effective March 26, 2001 (Incorporated by reference to Flowers Foods’ Annual Report on Form 10-K, dated March 30, 2001, File No. 1-16247). | |||
42
Table of Contents
|
Exhibit
|
||||||
| No | Name of Exhibit | |||||
| 10 | .2 | — | Flowers Foods, Inc. 2001 Equity and Performance Incentive Plan, as amended and restated as of April 1, 2009 (incorporated by reference to Flowers Foods’ Proxy Statement on Schedule 14A, dated April 24, 2009, File No. 1-16247). | |||
| 10 | .3 | — | Flowers Foods, Inc. Stock Appreciation Rights Plan (Incorporated by reference to Flowers Foods’ Annual Report on Form 10-K, dated March 29, 2002, File No. 1-16247). | |||
| 10 | .4 | — | Flowers Foods, Inc. Annual Executive Bonus Plan (Incorporated by reference to Flowers Foods’ Proxy Statement on Schedule 14A, dated April 24, 2009, File No. 1-16247). | |||
| 10 | .5 | — | Flowers Foods, Inc. Supplemental Executive Retirement Plan (Incorporated by reference to Flowers Foods’ Annual Report on Form 10-K, dated March 29, 2002, File No. 1-16247). | |||
| 10 | .6 | — | Form of Indemnification Agreement, by and between Flowers Foods, Inc., certain executive officers and the directors of Flowers Foods, Inc. (Incorporated by reference to Flowers Foods’ Annual Report on Form 10-K, dated March 28, 2003, File No. 1-16247). | |||
| 10 | .7 | — | Form of Continuation of Employment Agreement, by and between Flowers Foods, Inc. and certain executive officers of Flowers Foods, Inc. (Incorporated by reference to Flowers Foods’ Annual Report on Form 10-K dated March 4, 2009, File No. 1016247). | |||
| 10 | .8 | — | Ninth Amendment to the Flowers Foods, Inc. Retirement Plan No. 1, dated November 7, 2005, as amended and restated effective as of March 26, 2001 (Incorporated by reference to Flowers Foods’ Quarterly Report on Form 10-Q dated November 17, 2005, File No. 1-16247). | |||
| 10 | .9 | — | First Amendment and Waiver, dated October 5, 2007, among Flowers Foods, Inc., a Georgia corporation, the lenders party to the Credit Agreement and Deutsche Bank AG New York Branch, as Administrative Agent (Incorporated by reference to Flowers Foods’ Current Report on Form 8-K dated October 11, 2007, File No. 1-16247). | |||
| 10 | .10 | — | Agreement and Plan of Merger, dated June 23, 2008, by and among, Flowers Foods, Inc., Peachtree Acquisition Co., LLC, Holsum Bakery, Inc., Lloyd Edward Eisele, Jr. and The Lloyd Edward Eisele, Jr. Revocable Trust (Incorporated by reference to Flowers Foods’ Current Report on Form 8-K/A dated June 25, 2008, File No. 1-16247). | |||
| 10 | .11 | — | Credit Agreement, dated as of August 1, 2008, among Flowers Foods, Inc., the Lenders Party thereto from time to time, Bank of America N.A., Cooperative Centrale Raiffeisen-Boerenleen Bank, B.A., “Rabobank International”, New York Branch, and Branch Banking & Trust Company as co-documentation agents, SunTrust Bank, as syndication agent, and Deutsche Bank AG, New York Branch, as administrative agent (Incorporated by reference to Flowers Foods’ Current Report on Form 8-K dated August 6, 2008, File No. 1-16247). | |||
| 10 | .12 | — | Form of 2009 Nonqualified Stock Option Agreement, by and between Flowers Foods, Inc. and certain executive officers of Flowers Foods, Inc. (Incorporated by reference to Flowers Foods’ Annual Report on Form 10-K dated March 4, 2009, File No. 1-16247). | |||
| 10 | .13 | — | Form of 2010 Restricted Stock Agreement, by and between Flowers Foods, Inc. and certain executive officers of Flowers Foods, Inc. (Incorporated by reference to Flowers Foods’ Annual Report on Form 10-K dated March 3, 2010, File No. 1-16247). | |||
| 10 | .14 | — | Form of 2010 Nonqualified Stock Option Agreement, by and between Flowers Foods, Inc. and certain executive officers of Flowers Foods, Inc. (Incorporated by reference to Flowers Foods’ Annual Report on Form 10-K dated March 3, 2010, File No. 1-16247). | |||
| *10 | .15 | — | Form of 2010 Deferred Shares Agreement, by and between Flowers Foods, Inc. and certain members of the Board of Directors of Flowers Foods, Inc. | |||
| *10 | .16 | — | Form of 2011 Restricted Stock Agreement, by and between Flowers Foods, Inc. and certain executive officers of Flowers Foods, Inc.. | |||
| *10 | .17 | — | Form of 2011 Nonqualified Stock Option Agreement, by and between Flowers Foods, Inc. and certain executive officers of Flowers Foods, Inc.. | |||
| 21 | — | Subsidiaries of Flowers Foods, Inc. (Incorporated by reference to Flowers Foods’ Annual Report on Form 10-K dated March 3, 2010, File No. 1-16247). | ||||
| *23 | — | Consent of Independent Registered Public Accounting Firm, PricewaterhouseCoopers LLP. | ||||
| *31 | .1 | — | Certification of Chief Executive Officer pursuant to Section 302 of the Sarbanes-Oxley Act of 2002. | |||
| *31 | .2 | — | Certification of Chief Financial Officer pursuant to Section 302 of the Sarbanes-Oxley Act of 2002. | |||
43
Table of Contents
|
Exhibit
|
||||||
| No | Name of Exhibit | |||||
| *31 | .3 | — | Certification of Chief Accounting Officer pursuant to Section 302 of the Sarbanes-Oxley Act of 2002. | |||
| *32 | — | Certification Pursuant to 18 U.S.C. Section 1350, as Adopted Pursuant to Section 906 of the Sarbanes-Oxley Act of 2002, by George E. Deese, Chief Executive Officer, R. Steve Kinsey, Chief Financial Officer and Karyl H. Lauder, Chief Accounting Officer for the Fiscal Year Ended January 1, 2011. | ||||
| *101 | .CAL | — | XBRL Taxonomy Extension Calculation Linkbase. | |||
| *101 | .DEF | — | XBRL Taxonomy Extension Definition Linkbase. | |||
| *101 | .INS | — | XBRL Instance Document. | |||
| *101 | .LAB | — | XBRL Taxonomy Extension Label Linkbase. | |||
| *101 | .PRE | — | XBRL Taxonomy Extension Presentation Linkbase. | |||
| *101 | .SCH | — | XBRL Taxonomy Extension Schema Linkbase. | |||
| *101 | .CAL | — | XBRL Taxonomy Extension Calculation Linkbase. | |||
| * | Filed herewith |
44
Table of Contents
| Signature | Title | Date | ||||
|
/s/
GEORGE
E. DEESE
|
Chairman of the Board and Chief Executive Officer | February 23, 2011 | ||||
|
/s/
R.
STEVE KINSEY
|
Executive Vice President and Chief Financial Officer | February 23, 2011 | ||||
|
/s/
KARYL
H. LAUDER
|
Senior Vice President and Chief Accounting Officer | February 23, 2011 | ||||
|
/s/
JOE
E. BEVERLY
|
Director | February 23, 2011 | ||||
|
/s/
FRANKLIN
L. BURKE
|
Director | February 23, 2011 | ||||
|
/s/
MANUEL
A. FERNANDEZ
|
Director | February 23, 2011 | ||||
|
/s/
BENJAMIN
H. GRISWOLD, IV
|
Director | February 23, 2011 | ||||
|
/s/
JOSEPH
L. LANIER, Jr.
|
Director | February 23, 2011 | ||||
|
/s/
AMOS
R. MCMULLIAN
|
Director | February 23, 2011 | ||||
|
/s/
J.V.
SHIELDS, JR.
|
Director | February 23, 2011 | ||||
|
/s/
DAVID
V. SINGER
|
Director | February 23, 2011 | ||||
|
/s/
MELVIN
T. STITH, PH.D.
|
Director | February 23, 2011 | ||||
|
/s/
JACKIE
M. WARD
|
Director | February 23, 2011 | ||||
|
/s/
C.
MARTIN WOOD III
|
Director | February 23, 2011 | ||||
45
| Page | ||||
| F-2 | ||||
| F-3 | ||||
| F-4 | ||||
| F-5 | ||||
| F-6 | ||||
| F-7 | ||||
F-1
Table of Contents
F-2
Table of Contents
|
For the
|
||||||||||||
| For the 52 Weeks Ended | 53 Weeks Ended | |||||||||||
|
January 1,
|
January 2,
|
January 3,
|
||||||||||
| 2011 | 2010 | 2009 | ||||||||||
| (Amounts in thousands, except per share data) | ||||||||||||
|
Sales
|
$ | 2,573,769 | $ | 2,600,849 | $ | 2,414,892 | ||||||
|
Materials, supplies, labor and other production costs (exclusive
of depreciation and amortization shown separately below)
|
1,346,790 | 1,390,183 | 1,263,962 | |||||||||
|
Selling, distribution and administrative expenses
|
935,999 | 926,418 | 894,800 | |||||||||
|
Depreciation and amortization
|
85,118 | 80,928 | 73,312 | |||||||||
|
Gain on acquisition
|
— | (3,013 | ) | — | ||||||||
|
Gain on sale of assets
|
— | — | (2,306 | ) | ||||||||
|
Asset impairment
|
— | — | 3,108 | |||||||||
|
Gain on insurance recovery
|
— | — | (686 | ) | ||||||||
|
Income from operations
|
205,862 | 206,333 | 182,702 | |||||||||
|
Interest expense
|
8,164 | 11,587 | 6,137 | |||||||||
|
Interest income
|
(12,682 | ) | (13,013 | ) | (13,486 | ) | ||||||
|
Income before income taxes
|
210,380 | 207,759 | 190,051 | |||||||||
|
Income tax expense
|
73,333 | 74,047 | 67,744 | |||||||||
|
Net income
|
137,047 | 133,712 | 122,307 | |||||||||
|
Less: net income attributable to noncontrolling interest
|
— | (3,415 | ) | (3,074 | ) | |||||||
|
Net income attributable to Flowers Foods, Inc.
|
$ | 137,047 | $ | 130,297 | $ | 119,233 | ||||||
|
Net Income Per Common Share:
|
||||||||||||
|
Basic:
|
||||||||||||
|
Net income attributable to Flowers Foods, Inc. common
shareholders per share
|
$ | 1.50 | $ | 1.41 | $ | 1.29 | ||||||
|
Weighted average shares outstanding
|
91,420 | 92,200 | 92,432 | |||||||||
|
Diluted:
|
||||||||||||
|
Net income attributable to Flowers Foods, Inc. common
shareholders per share
|
$ | 1.49 | $ | 1.41 | $ | 1.28 | ||||||
|
Weighted average shares outstanding
|
92,108 | 92,733 | 93,157 | |||||||||
F-3
Table of Contents
| January 1, 2011 | January 2, 2010 | |||||||
|
(Amounts in thousands, except
|
||||||||
| share data) | ||||||||
|
ASSETS
|
||||||||
|
Current Assets:
|
||||||||
|
Cash and cash equivalents
|
$ | 6,755 | $ | 18,948 | ||||
|
Accounts and notes receivable, net (Note 2)
|
166,281 | 178,708 | ||||||
|
Inventories, net:
|
||||||||
|
Raw materials
|
20,879 | 20,952 | ||||||
|
Packaging materials
|
12,125 | 12,065 | ||||||
|
Finished goods
|
27,570 | 27,979 | ||||||
| 60,574 | 60,996 | |||||||
|
Spare parts and supplies
|
37,085 | 35,437 | ||||||
|
Deferred income taxes
|
1,095 | 20,714 | ||||||
|
Other
|
41,924 | 24,152 | ||||||
|
Total current assets
|
313,714 | 338,955 | ||||||
|
Property, Plant and Equipment:
|
||||||||
|
Land
|
67,036 | 64,816 | ||||||
|
Buildings
|
329,646 | 323,860 | ||||||
|
Machinery and equipment
|
795,869 | 737,150 | ||||||
|
Furniture, fixtures and transportation equipment
|
69,223 | 102,331 | ||||||
|
Construction in progress
|
22,480 | 27,006 | ||||||
| 1,284,254 | 1,255,163 | |||||||
|
Less: accumulated depreciation
|
(679,561 | ) | (652,587 | ) | ||||
| 604,693 | 602,576 | |||||||
|
Notes Receivable
|
92,860 | 94,457 | ||||||
|
Assets Held for Sale — Distributor Routes
|
11,924 | 6,535 | ||||||
|
Other Assets
|
5,113 | 4,157 | ||||||
|
Goodwill
|
200,153 | 201,682 | ||||||
|
Other Intangible Assets, net
|
97,032 | 103,080 | ||||||
| $ | 1,325,489 | $ | 1,351,442 | |||||
| LIABILITIES AND STOCKHOLDERS’ EQUITY | ||||||||
|
Current Liabilities:
|
||||||||
|
Current maturities of long-term debt and capital leases
|
$ | 28,432 | $ | 25,763 | ||||
|
Accounts payable
|
102,068 | 92,692 | ||||||
|
Other accrued liabilities
|
112,272 | 103,317 | ||||||
|
Total current liabilities
|
242,772 | 221,772 | ||||||
|
Long-Term Debt and Capital Leases
|
98,870 | 225,905 | ||||||
|
Other Liabilities:
|
||||||||
|
Post-retirement/post-employment obligations
|
76,086 | 68,140 | ||||||
|
Deferred income taxes
|
66,680 | 63,748 | ||||||
|
Other
|
45,291 | 43,851 | ||||||
|
Total other liabilities
|
188,057 | 175,739 | ||||||
|
Commitments and Contingencies (Note 22)
|
||||||||
|
Stockholders’ Equity:
|
||||||||
|
Preferred Stock — $100 par value, authorized
100,000 shares and none issued
|
— | — | ||||||
|
Preferred Stock — $.01 par value, authorized
900,000 shares and none issued
|
— | — | ||||||
|
Common Stock — $.01 par value, 500,000,000
authorized shares, 101,659,924 shares and
101,659,924 shares issued, respectively
|
1,017 | 1,017 | ||||||
|
Treasury stock 11,011,494 shares and
10,200,387 shares, respectively
|
(214,683 | ) | (189,250 | ) | ||||
|
Capital in excess of par value
|
539,476 | 531,326 | ||||||
|
Retained earnings
|
503,689 | 437,524 | ||||||
|
Accumulated other comprehensive loss
|
(33,709 | ) | (64,672 | ) | ||||
|
Total Flowers Foods, Inc. stockholders’ equity
|
795,790 | 715,945 | ||||||
|
Noncontrolling interest
|
— | 12,081 | ||||||
|
Total stockholders’ equity
|
795,790 | 728,026 | ||||||
|
Total liabilities and stockholders’ equity
|
$ | 1,325,489 | $ | 1,351,442 | ||||
F-4
Table of Contents
CONSOLIDATED STATEMENTS OF CHANGES IN STOCKHOLDERS’ EQUITY
AND COMPREHENSIVE INCOME (LOSS)
|
Accumulated
|
||||||||||||||||||||||||||||||||||||||||
| Common Stock |
Capital
|
Other
|
||||||||||||||||||||||||||||||||||||||
|
Comprehensive
|
Number of
|
in Excess
|
Comprehensive
|
Treasury Stock | ||||||||||||||||||||||||||||||||||||
|
Income
|
Shares
|
Par
|
of Par
|
Retained
|
Income
|
Number of
|
Noncontrolling
|
|||||||||||||||||||||||||||||||||
| (Loss) | Issued | Value | Value | Earnings | (Loss) | Shares | Cost | Interest | Total | |||||||||||||||||||||||||||||||
| (Amounts in thousands, except share data) | ||||||||||||||||||||||||||||||||||||||||
|
Balances at December 29, 2007
|
101,659,924 | $ | 1,017 | $ | 484,472 | $ | 303,386 | $ | 22,141 | (9,755,350 | ) | $ | (154,801 | ) | $ | 7,802 | $ | 664,017 | ||||||||||||||||||||||
|
Net income
|
$ | 122,307 | 119,233 | 3,074 | 122,307 | |||||||||||||||||||||||||||||||||||
|
Derivative instruments
|
(60,320 | ) | (60,320 | ) | (60,320 | ) | ||||||||||||||||||||||||||||||||||
|
Amortization of prior service costs
|
204 | 204 | ||||||||||||||||||||||||||||||||||||||
|
Increase in minimum pension liability
|
(64,304 | ) | (64,304 | ) | (64,304 | ) | ||||||||||||||||||||||||||||||||||
|
Comprehensive (loss)
|
(2,317 | ) | ||||||||||||||||||||||||||||||||||||||
|
Comprehensive income attributable to noncontrolling interest
|
(3,074 | ) | ||||||||||||||||||||||||||||||||||||||
|
Comprehensive (loss) attributable to Flowers Foods, Inc.
|
$ | (5,391 | ) | |||||||||||||||||||||||||||||||||||||
|
Stock repurchases
|
(1,720,148 | ) | (44,072 | ) | (44,072 | ) | ||||||||||||||||||||||||||||||||||
|
Exercise of stock options
|
(1,947 | ) | 289,775 | 4,626 | 2,679 | |||||||||||||||||||||||||||||||||||
|
Issuance of restricted stock awards
|
(3,984 | ) | 249,880 | 3,984 | — | |||||||||||||||||||||||||||||||||||
|
Issuance of deferred stock awards
|
(386 | ) | 24,045 | 386 | — | |||||||||||||||||||||||||||||||||||
|
Amortization of share-based compensation awards
|
10,566 | 10,566 | ||||||||||||||||||||||||||||||||||||||
|
Income tax benefits related to share-based payments
|
2,229 | 2,229 | ||||||||||||||||||||||||||||||||||||||
|
Conversion of deferred compensation (Note 13)
|
1,134 | 1,134 | ||||||||||||||||||||||||||||||||||||||
|
Distributions from noncontrolling interest to owners
|
(1,541 | ) | (1,541 | ) | ||||||||||||||||||||||||||||||||||||
|
Issuance for acquisitions
|
32,299 | 1,998,656 | 32,078 | 64,377 | ||||||||||||||||||||||||||||||||||||
|
Dividends paid — $0.575 per common share
|
(53,222 | ) | (53,222 | ) | ||||||||||||||||||||||||||||||||||||
|
Balances at January 3, 2009
|
101,659,924 | $ | 1,017 | $ | 524,383 | $ | 369,397 | $ | (102,279 | ) | (8,913,142 | ) | $ | (157,799 | ) | $ | 9,335 | $ | 644,054 | |||||||||||||||||||||
|
Net income
|
$ | 133,712 | 130,297 | 3,415 | 133,712 | |||||||||||||||||||||||||||||||||||
|
Derivative instruments
|
28,940 | 28,940 | 28,940 | |||||||||||||||||||||||||||||||||||||
|
Net prior service costs
|
964 | 964 | 964 | |||||||||||||||||||||||||||||||||||||
|
Amortization of actuarial loss
|
1,698 | 1,698 | 1,698 | |||||||||||||||||||||||||||||||||||||
|
Reduction in minimum pension liability
|
6,005 | 6,005 | 6,005 | |||||||||||||||||||||||||||||||||||||
|
Comprehensive income
|
171,319 | |||||||||||||||||||||||||||||||||||||||
|
Comprehensive income attributable to noncontrolling interest
|
(3,415 | ) | ||||||||||||||||||||||||||||||||||||||
|
Comprehensive income attributable to Flowers Foods, Inc.
|
$ | 167,904 | ||||||||||||||||||||||||||||||||||||||
|
Stock repurchases
|
(1,793,534 | ) | (40,531 | ) | (40,531 | ) | ||||||||||||||||||||||||||||||||||
|
Exercise of stock options
|
(1,552 | ) | 232,024 | 4,166 | 2,614 | |||||||||||||||||||||||||||||||||||
|
Issuance of restricted stock awards
|
(4,416 | ) | 248,680 | 4,416 | — | |||||||||||||||||||||||||||||||||||
|
Issuance of deferred stock awards
|
(352 | ) | 19,450 | 352 | — | |||||||||||||||||||||||||||||||||||
|
Amortization of share-based compensation awards
|
11,792 | 11,792 | ||||||||||||||||||||||||||||||||||||||
|
Income tax benefits related to share-based payments
|
1,522 | 1,522 | ||||||||||||||||||||||||||||||||||||||
|
Conversion of deferred compensation (Note 13)
|
95 | 95 | ||||||||||||||||||||||||||||||||||||||
|
Issuance of deferred compensation
|
(146 | ) | 6,135 | 146 | — | |||||||||||||||||||||||||||||||||||
|
Distributions from noncontrolling interest to owners
|
(669 | ) | (669 | ) | ||||||||||||||||||||||||||||||||||||
|
Dividends paid — $0.675 per common share
|
(62,170 | ) | (62,170 | ) | ||||||||||||||||||||||||||||||||||||
|
Balances at January 2, 2010
|
101,659,924 | $ | 1,017 | $ | 531,326 | $ | 437,524 | $ | (64,672 | ) | (10,200,387 | ) | $ | (189,250 | ) | $ | 12,081 | $ | 728,026 | |||||||||||||||||||||
|
Deconsolidation of Variable Interest Entity (Note 14)
|
(12,081 | ) | (12,081 | ) | ||||||||||||||||||||||||||||||||||||
|
Net income
|
$ | 137,047 | 137,047 | 137,047 | ||||||||||||||||||||||||||||||||||||
|
Derivative instruments
|
35,769 | 35,769 | 35,769 | |||||||||||||||||||||||||||||||||||||
|
Net prior service credits
|
(107 | ) | (107 | ) | (107 | ) | ||||||||||||||||||||||||||||||||||
|
Amortization of actuarial loss
|
1,303 | 1,303 | 1,303 | |||||||||||||||||||||||||||||||||||||
|
Increase in minimum pension liability
|
(6,002 | ) | (6,002 | ) | (6,002 | ) | ||||||||||||||||||||||||||||||||||
|
Comprehensive income
|
$ | 168,010 | ||||||||||||||||||||||||||||||||||||||
|
Stock repurchases
|
(1,548,771 | ) | (39,184 | ) | (39,184 | ) | ||||||||||||||||||||||||||||||||||
|
Exercise of stock options
|
(1,202 | ) | 486,887 | 9,086 | 7,884 | |||||||||||||||||||||||||||||||||||
|
Issuance of restricted stock awards
|
(4,102 | ) | 220,640 | 4,102 | — | |||||||||||||||||||||||||||||||||||
|
Issuance of deferred stock awards
|
(631 | ) | 33,920 | 631 | — | |||||||||||||||||||||||||||||||||||
|
Amortization of share-based compensation awards
|
12,995 | 12,995 | ||||||||||||||||||||||||||||||||||||||
|
Income tax benefits related to share-based payments
|
1,022 | 1,022 | ||||||||||||||||||||||||||||||||||||||
|
Share-based payment forfeitures
|
83 | (4,425 | ) | (83 | ) | — | ||||||||||||||||||||||||||||||||||
|
Issuance of deferred compensation
|
(15 | ) | 642 | 15 | — | |||||||||||||||||||||||||||||||||||
|
Dividends paid — $0.775 per common share
|
(70,882 | ) | (70,882 | ) | ||||||||||||||||||||||||||||||||||||
|
Balances at January 1, 2011
|
101,659,924 | $ | 1,017 | $ | 539,476 | $ | 503,689 | $ | (33,709 | ) | (11,011,494 | ) | $ | (214,683 | ) | $ | — | $ | 795,790 | |||||||||||||||||||||
F-5
Table of Contents
|
For the
|
For the
|
|||||||||||
| 52 Weeks Ended | 53 Weeks Ended | |||||||||||
|
January 1,
|
January 2,
|
January 3,
|
||||||||||
| 2011 | 2010 | 2009 | ||||||||||
| (Amounts in thousands) | ||||||||||||
|
Cash flows provided by (disbursed for) operating activities:
|
||||||||||||
|
Net income
|
$ | 137,047 | $ | 133,712 | $ | 122,307 | ||||||
|
Adjustments to reconcile net income to net cash provided by
operating activities:
|
||||||||||||
|
Depreciation and amortization
|
85,118 | 80,928 | 73,312 | |||||||||
|
Stock based compensation
|
13,678 | 11,855 | 10,594 | |||||||||
|
Loss reclassified from accumulated other comprehensive income to
net income
|
8,475 | 63,026 | 49 | |||||||||
|
Gain on sale of assets
|
— | — | (2,306 | ) | ||||||||
|
Gain on acquisition
|
— | (3,013 | ) | — | ||||||||
|
Asset impairment
|
— | — | 3,108 | |||||||||
|
Deferred income taxes
|
3,888 | 3,307 | 2,814 | |||||||||
|
Provision for inventory obsolescence
|
1,047 | 498 | 1,121 | |||||||||
|
Allowances for accounts receivable
|
547 | 2,077 | 640 | |||||||||
|
Pension and postretirement plans expense (benefit)
|
1,842 | 5,112 | (5,772 | ) | ||||||||
|
Other
|
(285 | ) | 39 | (2,472 | ) | |||||||
|
Pension contributions
|
(909 | ) | (450 | ) | — | |||||||
|
Changes in operating assets and liabilities, net of acquisitions
and disposals:
|
||||||||||||
|
Accounts receivable, net
|
11,482 | (476 | ) | (22,340 | ) | |||||||
|
Inventories, net
|
(936 | ) | (3,525 | ) | (4,242 | ) | ||||||
|
Other assets
|
14,595 | 24,623 | (52,058 | ) | ||||||||
|
Accounts payable and other accrued liabilities
|
30,461 | (81,704 | ) | (29,883 | ) | |||||||
|
Net cash provided by operating activities
|
306,050 | 236,009 | 94,872 | |||||||||
|
Cash flows provided by (disbursed for) investing activities:
|
||||||||||||
|
Purchase of property, plant and equipment
|
(98,404 | ) | (72,093 | ) | (86,861 | ) | ||||||
|
Issuance of notes receivable
|
(10,843 | ) | (12,436 | ) | (18,633 | ) | ||||||
|
Proceeds from notes receivable
|
12,514 | 12,126 | 11,354 | |||||||||
|
Acquisition of businesses, net of cash acquired
|
— | (24,565 | ) | (170,077 | ) | |||||||
|
Deconsolidation of variable interest entity (Note 14)
|
(8,804 | ) | — | — | ||||||||
|
Proceeds from sale of property, plant and equipment
|
1,075 | 6,919 | 4,899 | |||||||||
|
Other
|
165 | 440 | 62 | |||||||||
|
Net cash disbursed for investing activities
|
(104,297 | ) | (89,609 | ) | (259,256 | ) | ||||||
|
Cash flows provided by (disbursed for) financing activities:
|
||||||||||||
|
Dividends paid
|
(70,882 | ) | (62,170 | ) | (53,222 | ) | ||||||
|
Exercise of stock options
|
7,884 | 2,614 | 2,679 | |||||||||
|
Excess windfall tax benefit related to stock awards
|
977 | 1,386 | 1,976 | |||||||||
|
Payment of financing fees
|
— | — | (788 | ) | ||||||||
|
Stock repurchases
|
(39,184 | ) | (40,531 | ) | (44,072 | ) | ||||||
|
Change in book overdraft.
|
(1,432 | ) | (7,735 | ) | 6,702 | |||||||
|
Proceeds from debt borrowings
|
418,500 | 848,326 | 645,250 | |||||||||
|
Debt and capital lease obligation payments
|
(529,809 | ) | (888,637 | ) | (392,614 | ) | ||||||
|
Other
|
— | (669 | ) | (1,541 | ) | |||||||
|
Net cash (disbursed for) provided by financing activities
|
(213,946 | ) | (147,416 | ) | 164,370 | |||||||
|
Net decrease in cash and cash equivalents
|
(12,193 | ) | (1,016 | ) | (14 | ) | ||||||
|
Cash and cash equivalents at beginning of period
|
18,948 | 19,964 | 19,978 | |||||||||
|
Cash and cash equivalents at end of period
|
$ | 6,755 | $ | 18,948 | $ | 19,964 | ||||||
|
Schedule of non cash investing and financing activities:
|
||||||||||||
|
Stock issued for acquisitions
|
$ | — | $ | — | $ | 64,377 | ||||||
|
(Issuance) conversion of deferred compensation to common stock
equivalent units
|
$ | (15 | ) | $ | 95 | $ | 1,134 | |||||
|
Capital and
right-to-use
lease obligations
|
$ | 13,332 | $ | 4,362 | $ | 1,804 | ||||||
|
Deconsolidation of VIE capital leases
|
$ | (26,389 | ) | $ | — | $ | — | |||||
|
Supplemental disclosures of cash flow information:
|
||||||||||||
|
Cash paid during the period for:
|
||||||||||||
|
Interest, net of capitalized interest
|
$ | 7,470 | $ | 11,275 | $ | 6,029 | ||||||
|
Income taxes paid, net of refunds of $623, $1,167 and $252,
respectively
|
$ | 72,554 | $ | 75,310 | $ | 65,255 | ||||||
F-6
Table of Contents
| Note 1. | Basis of Presentation |
| Note 2. | Summary of Significant Accounting Policies |
F-7
Table of Contents
F-8
Table of Contents
|
Beginning
|
Charged to
|
Write-Offs
|
Ending
|
|||||||||||||
| Balance | Expense | and Other | Balance | |||||||||||||
|
Fiscal 2010
|
$ | 469 | $ | 547 | $ | 494 | $ | 522 | ||||||||
|
Fiscal 2009
|
$ | 378 | $ | 2,077 | $ | 1,986 | $ | 469 | ||||||||
|
Fiscal 2008
|
$ | 131 | $ | 640 | $ | 393 | $ | 378 | ||||||||
| Percent of Sales | ||||||||||||
|
Warehouse
|
||||||||||||
| DSD | Delivery | Total | ||||||||||
|
Fiscal 2010
|
18.2 | % | 3.6 | % | 21.8 | % | ||||||
|
Fiscal 2009
|
18.1 | % | 2.9 | % | 21.0 | % | ||||||
|
Fiscal 2008
|
18.0 | % | 2.5 | % | 20.5 | % | ||||||
F-9
Table of Contents
F-10
Table of Contents
F-11
Table of Contents
| Note 3. | New Accounting Pronouncements |
| Note 4. | Gain on Sale of Assets |
| Note 5. | Asset Impairment |
| Note 6. | Notes Receivable |
F-12
Table of Contents
| Note 7. | Assets Held for Sale — Distributor Routes |
| Note 8. | Goodwill and Other Intangible Assets |
| DSD | Warehouse delivery | Total | ||||||||||
|
Balance as of January 3, 2009
|
$ | 195,558 | $ | 4,477 | $ | 200,035 | ||||||
|
Goodwill adjustments during fiscal 2009
|
$ | (977 | ) | $ | — | $ | (977 | ) | ||||
|
Goodwill acquired during fiscal 2009
|
$ | — | $ | 2,624 | $ | 2,624 | ||||||
|
Balance as of January 2, 2010
|
$ | 194,581 | $ | 7,101 | $ | 201,682 | ||||||
|
Adjustment for deconsolidation of VIE (Note 14)
|
(1,529 | ) | — | (1,529 | ) | |||||||
|
Balance as of January 1, 2011
|
$ | 193,052 | $ | 7,101 | $ | 200,153 | ||||||
F-13
Table of Contents
| January 1, 2011 | January 2, 2010 | |||||||||||||||||||||||
|
Accumulated
|
Accumulated
|
|||||||||||||||||||||||
| Asset | Cost | Amortization | Net Value | Cost | Amortization | Net Value | ||||||||||||||||||
|
Trademarks
|
$ | 35,268 | $ | 4,687 | $ | 30,581 | $ | 35,268 | $ | 3,144 | $ | 32,124 | ||||||||||||
|
Customer relationships
|
75,434 | 13,675 | 61,759 | 75,434 | 9,738 | 65,696 | ||||||||||||||||||
|
Non-compete agreements
|
1,874 | 1,353 | 521 | 1,874 | 1,309 | 565 | ||||||||||||||||||
|
Distributor relationships
|
2,600 | 413 | 2,187 | 2,600 | 240 | 2,360 | ||||||||||||||||||
|
Supplier agreements
|
1,050 | 566 | 484 | 1,050 | 215 | 835 | ||||||||||||||||||
|
Total
|
$ | 116,226 | $ | 20,694 | $ | 95,532 | $ | 116,226 | $ | 14,646 | $ | 101,580 | ||||||||||||
| Fiscal 2010 | Fiscal 2009 | Fiscal 2008 | ||||||||||
|
Amortizable intangible assets expense
|
$ | 6,048 | $ | 5,923 | $ | 3,258 | ||||||
|
Amortizable intangible liabilities (income)
|
(44 | ) | (44 | ) | (240 | ) | ||||||
|
Total
|
$ | 6,004 | $ | 5,879 | $ | 3,018 | ||||||
|
Amortization of
|
||||
| Intangibles | ||||
|
2011
|
$ | 6,003 | ||
|
2012
|
$ | 5,677 | ||
|
2013
|
$ | 5,488 | ||
|
2014
|
$ | 5,389 | ||
|
2015
|
$ | 5,237 | ||
| Note 9. | Acquisitions |
F-14
Table of Contents
|
Purchase price:
|
||||||||
|
Cash, including acquisition costs
|
$ | 91,258 | ||||||
|
Total consideration
|
$ | 91,258 | ||||||
|
Allocation of purchase price:
|
||||||||
|
Current assets, including cash of $1.2 million and a
current deferred tax asset of $1.0 million
|
$ | 8,039 | ||||||
|
Property, plant, and equipment
|
36,920 | |||||||
|
Other assets
|
1,323 | |||||||
|
Intangible assets
|
22,600 | |||||||
|
Goodwill
|
57,566 | |||||||
|
Total assets acquired
|
$ | 126,448 | ||||||
|
Current liabilities
|
$ | 10,542 | ||||||
|
Long-term debt and other
|
5,161 | |||||||
|
Long-term pension and postretirement liabilities
|
9,081 | |||||||
|
Deferred tax liabilities
|
10,406 | |||||||
|
Total liabilities assumed
|
$ | 35,190 | ||||||
|
Net assets acquired
|
$ | 91,258 | ||||||
|
Weighted average
|
||||||||
| Amount | Amortization years | |||||||
|
Trademarks
|
$ | 2,200 | 22.0 | |||||
|
Customer relationships
|
18,900 | 25.0 | ||||||
|
Total intangible assets subject to amortization
|
$ | 21,100 | 24.7 | |||||
F-15
Table of Contents
|
Purchase price:
|
||||||||
|
Cash, including acquisition costs
|
$ | 80,026 | ||||||
|
Common stock
|
64,377 | |||||||
|
Working capital adjustment
|
(476 | ) | ||||||
|
Total consideration
|
$ | 143,927 | ||||||
|
Allocation of purchase price:
|
||||||||
|
Current assets, including a current deferred tax asset of
$0.3 million
|
$ | 18,626 | ||||||
|
Property, plant, and equipment
|
54,019 | |||||||
|
Other assets
|
1,202 | |||||||
|
Intangible assets
|
64,900 | |||||||
|
Goodwill
|
65,154 | |||||||
|
Total assets acquired
|
$ | 203,901 | ||||||
|
Current liabilities
|
$ | 17,972 | ||||||
|
Deferred tax liabilities
|
33,518 | |||||||
|
Long-term liabilities
|
8,484 | |||||||
|
Total liabilities assumed
|
$ | 59,974 | ||||||
|
Net assets acquired
|
$ | 143,927 | ||||||
F-16
Table of Contents
|
Weighted average
|
||||||||
| Amount | Amortization years | |||||||
|
Trademarks
|
$ | 19,200 | 20.0 | |||||
|
Customer relationships
|
43,100 | 20.0 | ||||||
|
Distributor relationships
|
2,600 | 15.0 | ||||||
|
Total intangible assets subject to amortization
|
$ | 64,900 | 19.8 | |||||
| Note 10. | Derivative Financial Instruments |
| Level 1 | Level 2 | Level 3 | Total | |||||||||||||
|
Assets:
|
||||||||||||||||
|
Other current
|
$ | 22.4 | $ | — | $ | — | $ | 22.4 | ||||||||
|
Total
|
22.4 | — | — | 22.4 | ||||||||||||
|
Liabilities:
|
||||||||||||||||
|
Other current
|
— | (2.0 | ) | — | (2.0 | ) | ||||||||||
|
Other long-term
|
— | (0.4 | ) | — | (0.4 | ) | ||||||||||
|
Total
|
— | (2.4 | ) | — | (2.4 | ) | ||||||||||
|
Net Fair Value
|
$ | 22.4 | $ | (2.4 | ) | $ | — | $ | 20.0 | |||||||
F-17
Table of Contents
| Level 1 | Level 2 | Level 3 | Total | |||||||||||||
|
Assets:
|
||||||||||||||||
|
Other current
|
$ | 2.5 | $ | — | $ | — | $ | 2.5 | ||||||||
|
Total
|
2.5 | — | — | 2.5 | ||||||||||||
|
Liabilities:
|
||||||||||||||||
|
Other current
|
(4.2 | ) | (1.9 | ) | — | (6.1 | ) | |||||||||
|
Other long-term
|
— | (0.1 | ) | — | (0.1 | ) | ||||||||||
|
Total
|
(4.2 | ) | (2.0 | ) | — | (6.2 | ) | |||||||||
|
Net Fair Value
|
$ | (1.7 | ) | $ | (2.0 | ) | $ | — | $ | (3.7 | ) | |||||
F-18
Table of Contents
| Level 1 | Level 2 | Level 3 | Total | |||||||||||||
|
Liabilities:
|
||||||||||||||||
|
Other current
|
$ | — | $ | (3.8 | ) | $ | — | $ | (3.8 | ) | ||||||
|
Other long-term
|
— | (2.7 | ) | — | (2.7 | ) | ||||||||||
|
Total
|
— | (6.5 | ) | — | (6.5 | ) | ||||||||||
|
Net Fair Value
|
$ | — | $ | (6.5 | ) | $ | — | $ | (6.5 | ) | ||||||
| Level 1 | Level 2 | Level 3 | Total | |||||||||||||
|
Liabilities:
|
||||||||||||||||
|
Other current
|
$ | — | $ | (4.3 | ) | $ | — | $ | (4.3 | ) | ||||||
|
Other long-term
|
— | (2.4 | ) | — | (2.4 | ) | ||||||||||
|
Total
|
— | (6.7 | ) | — | (6.7 | ) | ||||||||||
|
Net Fair Value
|
$ | — | $ | (6.7 | ) | $ | — | $ | (6.7 | ) | ||||||
F-19
Table of Contents
| Derivative Assets | Derivative Liabilities | |||||||||||||||||||||||||||||||
|
Derivatives
|
January 1, 2011 | January 2, 2010 | January 1, 2011 | January 2, 2010 | ||||||||||||||||||||||||||||
|
Designated as
|
Balance
|
Balance
|
Balance
|
Balance
|
||||||||||||||||||||||||||||
|
Hedging
|
Sheet
|
Fair
|
Sheet
|
Fair
|
Sheet
|
Fair
|
Sheet
|
Fair
|
||||||||||||||||||||||||
| Instruments | Location | Value | Location | Value | Location | Value | Location | Value | ||||||||||||||||||||||||
| Other current | Other current | |||||||||||||||||||||||||||||||
|
Interest rate contracts
|
— | $ | — | — | $ | — | liabilities | $ | 3,789 | liabilities | $ | 4,271 | ||||||||||||||||||||
| Other long term | Other long term | |||||||||||||||||||||||||||||||
|
Interest rate contracts
|
— | — | — | — | liabilities | 2,684 | liabilities | 2,459 | ||||||||||||||||||||||||
| Other current | Other current | |||||||||||||||||||||||||||||||
|
Commodity contracts
|
Other current assets | 22,380 | Other current assets | 2,501 | liabilities | 2,032 | liabilities | 6,143 | ||||||||||||||||||||||||
| Other long term | Other long term | |||||||||||||||||||||||||||||||
|
Commodity contracts
|
Other long term assets | — | Other long term assets | — | liabilities | 371 | liabilities | 78 | ||||||||||||||||||||||||
|
Total
|
$ | 22,380 | $ | 2,501 | $ | 8,876 | $ | 12,951 | ||||||||||||||||||||||||
|
Amount of Gain or (Loss)
|
||||||||||||
|
Recognized in OCI on
|
||||||||||||
| Derivative (Effective Portion)(Net of tax) | ||||||||||||
|
For the 52
|
For the 52
|
For the 53
|
||||||||||
|
Derivatives in
|
Weeks Ended
|
Weeks Ended
|
Weeks Ended
|
|||||||||
|
Cash Flow Hedging
|
January 1,
|
January 2,
|
January 3,
|
|||||||||
| Relationships | 2011 | 2010 | 2009 | |||||||||
|
Interest rate contracts
|
$ | (2,684 | ) | $ | (1,512 | ) | $ | (5,780 | ) | |||
|
Commodity contracts
|
30,384 | (11,491 | ) | (54,480 | ) | |||||||
|
Total
|
$ | 27,700 | $ | (13,003 | ) | $ | (60,260 | ) | ||||
|
Amount of (Gain) or Loss Reclassified
|
||||||||||||||
|
from Accumulated OCI into Income
|
||||||||||||||
| (Effective Portion)(Net of tax) | ||||||||||||||
|
For the 52
|
For the 52
|
For the 53
|
Location of (Gain) or Loss
|
|||||||||||
|
Derivatives in
|
Weeks Ended
|
Weeks Ended
|
Weeks Ended
|
Reclassified from AOCI
|
||||||||||
|
Cash Flow Hedging
|
January 1,
|
January 2,
|
January 3,
|
into Income
|
||||||||||
| Relationships | 2011 | 2010 | 2009 | (Effective Portion) | ||||||||||
|
Interest rate contracts
|
$ | 2,857 | $ | 3,182 | $ | (30 | ) | Interest expense (income) | ||||||
| Selling, distribution and | ||||||||||||||
|
Commodity contracts
|
— | (1,475 | ) | — | administrative expenses | |||||||||
|
Commodity contracts
|
5,212 | 40,236 | (30 | ) | Production costs(1) | |||||||||
|
Total
|
$ | 8,069 | $ | 41,943 | $ | (60 | ) | |||||||
| 1. | Included in Materials, supplies, labor and other production costs (exclusive of depreciation and amortization shown separately). |
F-20
Table of Contents
|
Amount of Gain or (Loss) Recognized in
|
||||||||||||||
|
Income on
|
||||||||||||||
|
Derivative (Ineffective Portion and Amount
|
||||||||||||||
|
Excluded from
|
Location of Gain or (Loss)
|
|||||||||||||
| Effectiveness Testing, Net of tax) |
Recognized in Income on
|
|||||||||||||
|
For the
|
Derivative (Ineffective
|
|||||||||||||
|
52 Weeks
|
For the 52
|
For the 53
|
Portion and Amount
|
|||||||||||
|
Ended
|
Weeks Ended
|
Weeks Ended
|
Excluded from
|
|||||||||||
|
Derivatives in Cash
|
January 1,
|
January 2,
|
January 3,
|
Effectiveness Testing,
|
||||||||||
| Flow Hedging Relationships | 2011 | 2010 | 2009 | Net of tax) | ||||||||||
|
Interest rate contracts
|
$ | — | $ | — | $ | — |
Selling, distribution and administrative
expenses |
|||||||
|
Commodity contracts
|
— | (698 | ) | 582 |
Selling, distribution and administrative
expenses |
|||||||||
|
Total
|
$ | — | $ | (698 | ) | $ | 582 | |||||||
| Derivatives in Cash Flow Hedging Relationships | Notional amount | |||
| (Millions) | ||||
|
Interest rate contracts
|
$ | 114.4 | ||
|
Wheat contracts
|
133.7 | |||
|
Soybean oil contracts
|
14.8 | |||
|
Natural gas contracts
|
14.2 | |||
|
Total
|
$ | 277.1 | ||
| Note 11. | Other Current Assets |
|
January 1,
|
January 2,
|
|||||||
| 2011 | 2010 | |||||||
| (Amounts in thousands) | ||||||||
|
Prepaid assets
|
$ | 11,139 | $ | 9,022 | ||||
|
Collateral to counterparties for derivative positions
|
— | 7,023 | ||||||
|
Fair value of derivative instruments
|
22,380 | 2,501 | ||||||
|
Income taxes receivable
|
7,622 | 3,616 | ||||||
|
Other
|
783 | 1,990 | ||||||
|
Total
|
$ | 41,924 | $ | 24,152 | ||||
F-21
Table of Contents
| Note 12. | Other Accrued Liabilities |
|
January 1,
|
January 2,
|
|||||||
| 2011 | 2010 | |||||||
| (Amounts in thousands) | ||||||||
|
Employee compensation
|
$ | 50,015 | $ | 47,780 | ||||
|
Fair value of derivative instruments
|
5,822 | 10,414 | ||||||
|
Insurance
|
20,036 | 17,521 | ||||||
|
Income taxes payable
|
— | 459 | ||||||
|
Collateral from counterparties for derivative positions
|
11,524 | 797 | ||||||
|
Other
|
24,875 | 26,346 | ||||||
|
Total
|
$ | 112,272 | $ | 103,317 | ||||
| Note 13. |
|
|
Interest Rate at
|
||||||||||||||||
|
January 1,
|
Final
|
January 1,
|
January 2,
|
|||||||||||||
| 2011 | Maturity | 2011 | 2010 | |||||||||||||
| (Amounts in thousands) | ||||||||||||||||
|
Unsecured credit facility
|
— | 2012 | $ | — | $ | 89,000 | ||||||||||
|
Unsecured term loan
|
5.00 | % | 2013 | 114,375 | 131,250 | |||||||||||
|
Capital lease obligations
|
4.82 | % | 2015 | 10,541 | 26,555 | |||||||||||
|
Other notes payable
|
5.60 | % | 2013 | 2,386 | 4,863 | |||||||||||
| 127,302 | 251,668 | |||||||||||||||
|
Due within one year
|
28,432 | 25,763 | ||||||||||||||
|
Due after one year
|
$ | 98,870 | $ | 225,905 | ||||||||||||
F-22
Table of Contents
F-23
Table of Contents
|
2011
|
$ | 28,432 | ||
|
2012
|
42,064 | |||
|
2013
|
53,913 | |||
|
2014
|
2,521 | |||
|
2015
|
372 | |||
|
2016 and thereafter
|
— | |||
|
Total
|
$ | 127,302 | ||
| Capital Leases | Operating Leases | |||||||
| (Amounts in thousands) | ||||||||
|
2011
|
$ | 3,948 | $ | 41,861 | ||||
|
2012
|
2,471 | 37,864 | ||||||
|
2013
|
2,233 | 33,292 | ||||||
|
2014
|
2,373 | 27,951 | ||||||
|
2015
|
378 | 22,567 | ||||||
|
2016 and thereafter
|
— | 149,293 | ||||||
|
Total minimum payments
|
11,403 | $ | 312,828 | |||||
|
Amount representing interest
|
862 | |||||||
|
Obligations under capital leases
|
10,541 | |||||||
|
Obligations due within one year
|
3,574 | |||||||
|
Long-term obligations under capital leases
|
$ | 6,967 | ||||||
F-24
Table of Contents
F-25
Table of Contents
| Note 14. | Variable Interest Entity |
| Fiscal 2009 | Fiscal 2008 | |||||||||||||||
| VIE | % of Total | VIE | % of Total | |||||||||||||
| (Dollars in thousands) | ||||||||||||||||
|
Assets as of respective fiscal year ends
|
$ | 39,606 | 2.9 | % | $ | 33,452 | 2.5 | % | ||||||||
|
Sales
|
$ | 12,370 | 0.5 | % | $ | 10,369 | 0.4 | % | ||||||||
|
Income before income taxes
|
$ | 3,415 | 1.6 | % | $ | 3,074 | 1.6 | % | ||||||||
| Note 15. | Fair Value of Financial Instruments |
F-26
Table of Contents
| January 1, 2011 | January 2, 2010 | |||||||
|
Distributor notes receivable
|
$ | 105,396 | $ | 107,067 | ||||
|
Current portion of distributor notes receivable recorded in
accounts and notes receivable, net
|
12,536 | 12,610 | ||||||
|
Long-term portion of distributor notes receivable
|
$ | 92,860 | $ | 94,457 | ||||
| Note 16. | Stockholders’ Equity |
F-27
Table of Contents
| Note 17. | Stock-Based Compensation |
F-28
Table of Contents
| Grant date | 2/9/2010 | 2/9/2009 | 2/4/2008 | |||||||||
|
Shares granted
|
1,136 | 993 | 850 | |||||||||
|
Exercise price($)
|
25.01 | 23.84 | 24.75 | |||||||||
|
Vesting date
|
2/9/2013 | 2/9/2012 | 2/4/2011 | |||||||||
|
Fair value per share($)
|
5.54 | 5.87 | 5.80 | |||||||||
|
Dividend yield(%)(1)
|
3.00 | 2.20 | 1.90 | |||||||||
|
Expected volatility(%)(2)
|
30.60 | 31.80 | 27.30 | |||||||||
|
Risk-free interest rate(%)(3)
|
2.35 | 2.00 | 2.79 | |||||||||
|
Expected option life (years)(4)
|
5.00 | 5.00 | 5.00 | |||||||||
|
Outstanding at January 1, 2011
|
1,128 | 988 | 843 | |||||||||
| 1. | Dividend yield — estimated yield based on the historical dividend payment for the four most recent dividend payments prior to the grant date. | |
| 2. | Expected volatility — based on historical volatility over the expected term using daily stock prices. | |
| 3. | Risk-free interest rate — United States Treasury Constant Maturity rates as of the grant date over the expected term. | |
| 4. | Expected option life — The 2010, 2009 and 2008 grant assumptions are based on the simplified formula determined in accordance with Staff Accounting Bulletin No. 110, as the company does not have sufficient historical exercise behavior data to reasonably estimate the expected option life. |
| Fiscal 2010 | Fiscal 2009 | Fiscal 2008 | ||||||||||||||||||||||
|
Weighted
|
Weighted
|
Weighted
|
||||||||||||||||||||||
|
Average
|
Average
|
Average
|
||||||||||||||||||||||
|
Exercise
|
Exercise
|
Exercise
|
||||||||||||||||||||||
| Options | Price | Options | Price | Options | Price | |||||||||||||||||||
| (Amounts in thousands, except price data) | ||||||||||||||||||||||||
|
Outstanding at beginning of year
|
3,734 | $ | 20.34 | 2,975 | $ | 18.46 | 2,417 | $ | 15.15 | |||||||||||||||
|
Granted
|
1,136 | $ | 25.01 | 993 | $ | 23.84 | 850 | $ | 24.75 | |||||||||||||||
|
Exercised
|
(487 | ) | $ | 16.19 | (232 | ) | $ | 11.04 | (288 | ) | $ | 9.25 | ||||||||||||
|
Forfeitures
|
(18 | ) | $ | 24.57 | (2 | ) | $ | 18.68 | (4 | ) | $ | 22.30 | ||||||||||||
|
Outstanding at end of year
|
4,365 | $ | 22.00 | 3,734 | $ | 20.34 | 2,975 | $ | 18.46 | |||||||||||||||
|
Exercisable at end of year
|
1,406 | 1,069 | 1,303 | |||||||||||||||||||||
|
Weighted average fair value of options granted during the year
|
$ | 5.54 | $ | 5.87 | $ | 5.80 | ||||||||||||||||||
F-29
Table of Contents
|
Fiscal
|
Fiscal
|
Fiscal
|
||||||||||
| 2010 | 2009 | 2008 | ||||||||||
|
Cash received from option exercises
|
$ | 7,884 | $ | 2,614 | $ | 2,679 | ||||||
|
Cash tax windfall benefit, net
|
$ | 683 | $ | 909 | $ | 1,543 | ||||||
|
Intrinsic value of stock options exercised
|
$ | 4,409 | $ | 2,948 | $ | 4,470 | ||||||
| • | If the ROI Target is satisfied, then the performance-contingent restricted stock grant may be adjusted based on the company’s total return to shareholders (“Company TSR”) percent rank as compared to the total return to shareholders of the S&P Packaged Food & Meat Index (“S&P TSR”) in the manner set forth below: |
| • | If the Company TSR rank is equal to the 50th percentile of the S&P TSR, then no adjustment; | |
| • | If the Company TSR rank is less than the 50th percentile of the S&P TSR, the grant shall be reduced by 1.3% for each percentile below the 50th percentile that the Company TSR is less than the 50th percentile of S&P TSR, but in no event shall such reduction exceed 20%; or | |
| • | If the Company TSR rank is greater than the 50th percentile of the S&P TSR, the grant shall be increased by 1.3% for each percentile above the 50th percentile that Company TSR is greater than the 50th percentile of S&P TSR, but in no event shall such increase exceed 20%. |
F-30
Table of Contents
| Grant date | 2/9/2010 | 2/9/2009 | 2/4/2008 | |||||||||
|
Shares granted
|
179 | 204 | 210 | |||||||||
|
Vesting date
|
2/9/2012 | 2/9/2011 | 2/4/2010 | |||||||||
|
Fair value per share
|
$ | 26.38 | $ | 24.96 | $ | 27.03 | ||||||
| Fiscal 2010 | Fiscal 2009 | Fiscal 2008 | ||||||||||||||||||||||
|
Weighted
|
Weighted
|
Weighted
|
||||||||||||||||||||||
|
Number of
|
Average Fair
|
Number of
|
Average Fair
|
Number of
|
Average Fair
|
|||||||||||||||||||
| Shares | Value | Shares | Value | Shares | Value | |||||||||||||||||||
| (Amounts in thousands, except price data) | ||||||||||||||||||||||||
|
Balance at beginning of year
|
414 | $ | 26.01 | 432 | $ | 23.92 | 536 | $ | 18.41 | |||||||||||||||
|
Granted*
|
221 | $ | 21.36 | 204 | $ | 24.96 | 210 | $ | 27.03 | |||||||||||||||
|
Vested*
|
(252 | ) | $ | 22.53 | (222 | ) | $ | 20.98 | (314 | ) | $ | 16.59 | ||||||||||||
|
Forfeitures
|
(4 | ) | $ | 25.87 | — | $ | — | — | $ | — | ||||||||||||||
|
Balance at end of year
|
379 | $ | 25.62 | 414 | $ | 26.01 | 432 | $ | 23.92 | |||||||||||||||
| * | Includes 41,990 additional shares for the 2008 grant that exceeded the S&P TSR by the maximum amount as discussed above. |
F-31
Table of Contents
|
Fiscal
|
Fiscal
|
Fiscal
|
||||||||||
| 2010 | 2009 | 2008 | ||||||||||
|
(Amounts in thousands,
|
||||||||||||
| except price data) | ||||||||||||
|
Balance at beginning of year
|
231 | 231 | 231 | |||||||||
|
Rights vested
|
— | — | — | |||||||||
|
Rights exercised
|
— | — | — | |||||||||
|
Forfeitures
|
— | — | — | |||||||||
|
Balance at end of year
|
231 | 231 | 231 | |||||||||
|
Weighted average — grant date fair value
|
$ | 11.14 | $ | 11.14 | $ | 11.14 | ||||||
| Fiscal 2010 | Fiscal 2009 | Fiscal 2008 | ||||||||||||||||||||||
|
Weighted
|
Weighted
|
Weighted
|
||||||||||||||||||||||
|
Number of
|
Average Fair
|
Number of
|
Average Fair
|
Number of
|
Average Fair
|
|||||||||||||||||||
| Shares | Value | Shares | Value | Shares | Value | |||||||||||||||||||
| (Amounts in thousands, except price data) | ||||||||||||||||||||||||
|
Balance at beginning of year
|
130 | $ | 21.90 | 101 | $ | 23.30 | 55 | $ | 21.03 | |||||||||||||||
|
Issued
|
64 | $ | 23.11 | 48 | $ | 20.08 | 70 | $ | 24.58 | |||||||||||||||
|
Exercised
|
(34 | ) | $ | 20.57 | (19 | ) | $ | 24.72 | (24 | ) | $ | 21.91 | ||||||||||||
|
Balance at end of year
|
160 | $ | 22.66 | 130 | $ | 21.90 | 101 | $ | 23.30 | |||||||||||||||
F-32
Table of Contents
|
Fiscal
|
Fiscal
|
Fiscal
|
||||||||||
| 2010 | 2009 | 2008 | ||||||||||
| (Amounts in thousands) | ||||||||||||
|
Stock options
|
$ | 6,931 | $ | 5,070 | $ | 4,408 | ||||||
|
Restricted stock
|
4,727 | 5,359 | 4,827 | |||||||||
|
Stock appreciation rights
|
683 | 63 | 28 | |||||||||
|
Deferred stock
|
1,337 | 1,363 | 1,331 | |||||||||
|
Total stock based compensation
|
$ | 13,678 | $ | 11,855 | $ | 10,594 | ||||||
| Note 18. | Comprehensive Income (Loss) |
|
Fiscal
|
Fiscal
|
Fiscal
|
||||||||||
| 2010 | 2009 | 2008 | ||||||||||
| (Amounts in thousands) | ||||||||||||
|
Accumulated other comprehensive (loss) income, beginning balance
|
$ | (64,672 | ) | $ | (102,279 | ) | $ | 22,141 | ||||
|
Derivative transactions:
|
||||||||||||
|
Net deferred (losses) gains on closed contracts, net of income
tax of $8,103, $(15,847) and $(17,579), respectively
|
12,968 | (25,314 | ) | (28,081 | ) | |||||||
|
Reclassified to earnings (materials, labor and other production
costs), net of income tax of $5,051, $26,257 and $(38),
respectively
|
8,069 | 41,943 | (60 | ) | ||||||||
|
Effective portion of change in fair value of hedging
instruments, net of income tax of $9,223, $7,707 and $(20,145)
respectively
|
14,732 | 12,311 | (32,179 | ) | ||||||||
|
Minimum pension liability, net of income tax of $(3,758), $3,759
and $(40,256), respectively
|
(6,002 | ) | 6,005 | (64,304 | ) | |||||||
|
Amortization of actuarial loss, net of income tax of $815 and
$1,063
|
1,303 | 1,698 | — | |||||||||
|
Amortization of prior service (credits) and costs, net of income
tax of $(67), $603 and $129
|
(107 | ) | 964 | 204 | ||||||||
|
Accumulated other comprehensive loss, ending balance
|
$ | (33,709 | ) | $ | (64,672 | ) | $ | (102,279 | ) | |||
|
January 1,
|
January 2,
|
|||||||
| 2011 | 2010 | |||||||
| (Amounts in thousands) | ||||||||
|
Derivative financial instruments
|
$ | 23,905 | $ | (11,864 | ) | |||
|
Pension and postretirement related
|
(57,614 | ) | (52,808 | ) | ||||
|
Total
|
$ | (33,709 | ) | $ | (64,672 | ) | ||
F-33
Table of Contents
| Note 19. | Earnings Per Share |
|
Fiscal
|
Fiscal
|
Fiscal
|
||||||||||
| 2010 | 2009 | 2008 | ||||||||||
|
Net income attributable to Flowers Foods, Inc.
|
$ | 137,047 | $ | 130,297 | $ | 119,233 | ||||||
|
Dividends on restricted shares not expected to vest*
|
— | — | — | |||||||||
|
Net income attributable to common and participating shareholders
|
$ | 137,047 | $ | 130,297 | $ | 119,233 | ||||||
|
Basic Earnings Per Common Share:
|
||||||||||||
|
Weighted average shares outstanding for common stock
|
91,197 | 91,787 | 92,016 | |||||||||
|
Weighted average shares outstanding for participating securities
|
223 | 413 | 416 | |||||||||
|
Basic weighted average shares outstanding per common share
|
91,420 | 92,200 | 92,432 | |||||||||
|
Basic earnings per common share attributable to Flowers Foods,
Inc. common shareholders
|
$ | 1.50 | $ | 1.41 | $ | 1.29 | ||||||
|
Diluted Earnings Per Common Share:
|
||||||||||||
|
Basic weighted average shares outstanding per common share
|
91,420 | 92,200 | 92,432 | |||||||||
|
Add: Shares of common stock assumed issued upon exercise of
stock options and vesting of restricted stock
|
688 | 533 | 725 | |||||||||
|
Diluted weighted average shares outstanding per common share
|
92,108 | 92,733 | 93,157 | |||||||||
|
Diluted earnings per common share attributable to Flowers Foods,
Inc. common shareholders
|
$ | 1.49 | $ | 1.41 | $ | 1.28 | ||||||
| * | The company expects all restricted share awards outstanding at January 1, 2011 and January 2, 2010 to vest. |
F-34
Table of Contents
| Note 20. | Postretirement Plans |
| As of | ||||||||
|
January 1,
|
January 2,
|
|||||||
| 2011 | 2010 | |||||||
| (Amounts in thousands) | ||||||||
|
Current benefit liability
|
$ | 1,011 | $ | 841 | ||||
|
Noncurrent benefit liability
|
$ | 76,086 | $ | 68,140 | ||||
|
Accumulated other comprehensive loss
|
$ | 57,614 | $ | 52,808 | ||||
|
Fiscal
|
Fiscal
|
Fiscal
|
||||||||||
| 2010 | 2009 | 2008 | ||||||||||
| (Amounts in thousands) | ||||||||||||
|
Service cost
|
$ | 388 | $ | 312 | $ | 293 | ||||||
|
Interest cost
|
18,666 | 18,667 | 17,623 | |||||||||
|
Expected return on plan assets
|
(20,663 | ) | (18,935 | ) | (25,196 | ) | ||||||
|
Amortization:
|
||||||||||||
|
Actuarial loss
|
2,177 | 2,727 | — | |||||||||
|
Net periodic pension cost (income)
|
568 | 2,771 | (7,280 | ) | ||||||||
|
Other changes in plan assets and benefit obligations recognized
in other comprehensive income:
|
||||||||||||
|
Current year actuarial loss (gain)
|
11,924 | (8,153 | ) | 103,002 | ||||||||
|
Amortization of actuarial gain (loss)
|
(2,177 | ) | (2,727 | ) | — | |||||||
|
Total recognized in other comprehensive (loss) income
|
9,747 | (10,880 | ) | 103,002 | ||||||||
|
Total recognized in net periodic benefit (income) cost and other
comprehensive income
|
$ | 10,315 | $ | (8,109 | ) | $ | 95,722 | |||||
F-35
Table of Contents
|
January 1,
|
January 2,
|
|||||||
| 2011 | 2010 | |||||||
| (Amounts in thousands) | ||||||||
|
Change in benefit obligation:
|
||||||||
|
Benefit obligation at beginning of year
|
$ | 320,040 | $ | 305,974 | ||||
|
Service cost
|
388 | 312 | ||||||
|
Interest cost
|
18,666 | 18,667 | ||||||
|
Actuarial loss
|
18,273 | 10,812 | ||||||
|
Benefits paid
|
(16,294 | ) | (15,725 | ) | ||||
|
Benefit obligation at end of year
|
$ | 341,073 | $ | 320,040 | ||||
|
Change in plan assets:
|
||||||||
|
Fair value of plan assets at beginning of year
|
$ | 266,173 | $ | 243,549 | ||||
|
Actual (loss) return on plan assets
|
27,012 | 37,899 | ||||||
|
Employer contribution
|
909 | 450 | ||||||
|
Benefits paid
|
(16,294 | ) | (15,725 | ) | ||||
|
Fair value of plan assets at end of year
|
$ | 277,800 | $ | 266,173 | ||||
|
Funded status, end of year:
|
||||||||
|
Fair value of plan assets
|
$ | 277,800 | $ | 266,173 | ||||
|
Benefit obligations
|
341,073 | 320,040 | ||||||
|
Funded status and amount recognized at end of year
|
$ | (63,273 | ) | $ | (53,867 | ) | ||
|
Amounts recognized in the balance sheet:
|
||||||||
|
Noncurrent liability
|
(63,273 | ) | (53,867 | ) | ||||
|
Amount recognized at end of year
|
$ | (63,273 | ) | $ | (53,867 | ) | ||
|
Amounts recognized in accumulated other comprehensive
income:
|
||||||||
|
Net actuarial loss before taxes
|
$ | 96,638 | $ | 86,891 | ||||
|
Accumulated benefit obligation at end of year
|
$ | 340,211 | $ | 319,279 | ||||
F-36
Table of Contents
|
Fiscal
|
Fiscal
|
Fiscal
|
||||||||||
| 2010 | 2009 | 2008 | ||||||||||
|
Weighted average assumptions used to determine benefit
obligations:
|
||||||||||||
|
Measurement date
|
12/31/2010 | 12/31/2009 | 12/31/2008 | |||||||||
|
Discount rate
|
5.48 | % | 5.98 | % | 6.25 | % | ||||||
|
Rate of compensation increase
|
3.50 | % | 3.50 | % | 3.50 | % | ||||||
|
Weighted average assumptions used to determine net (income) cost:
|
||||||||||||
|
Measurement date
|
1/1/2010 | 1/1/2009 | 1/1/2008 | |||||||||
|
Discount rate
|
5.98 | % | 6.25 | % | 6.25 | %(1) | ||||||
|
Expected return on plan assets
|
8.00 | % | 8.00 | % | 8.00 | % | ||||||
|
Rate of compensation increase
|
3.50 | % | 3.50 | % | 3.50 | % | ||||||
| (1) | The ButterKrust pension plans were acquired August 4, 2008. The discount rate used to determine net periodic benefit (income) cost for these plans was 6.75%. |
F-37
Table of Contents
| Fair value of Pension Plan Assets as of December 31, 2010 | ||||||||||||||||
|
Quoted prices in
|
||||||||||||||||
|
active markets
|
Significant
|
Significant
|
||||||||||||||
|
for identical
|
Observable Inputs
|
Unobservable
|
||||||||||||||
| Asset Class | assets (Level 1) | (Level 2) | Inputs (Level 3) | Total | ||||||||||||
|
Short term investments and cash
|
$ | 4,930 | $ | — | $ | — | $ | 4,930 | ||||||||
|
Equity securities:
|
||||||||||||||||
|
U.S. companies
|
111,098 | — | — | 111,098 | ||||||||||||
|
International companies
|
4,475 | — | — | 4,475 | ||||||||||||
|
International equity funds(a)
|
— | 35,498 | — | 35,498 | ||||||||||||
|
Fixed income securities:
|
||||||||||||||||
|
Domestic mutual funds(b)
|
17,679 | — | — | 17,679 | ||||||||||||
|
Private equity funds(c)
|
— | 12,502 | — | 12,502 | ||||||||||||
|
Real estate(d)
|
— | — | 8,881 | 8,881 | ||||||||||||
|
Other types of investments:
|
||||||||||||||||
|
Guaranteed insurance contracts(e)
|
— | — | 9,657 | 9,657 | ||||||||||||
|
Hedged equity funds(f)
|
— | — | 31,929 | 31,929 | ||||||||||||
|
Absolute return funds(c)
|
— | — | 40,110 | 40,110 | ||||||||||||
|
Other assets and (liabilities)(g)
|
— | — | 960 | 960 | ||||||||||||
|
Accrued income(g)
|
— | — | 81 | 81 | ||||||||||||
|
Total
|
$ | 138,182 | $ | 48,000 | $ | 91,618 | $ | 277,800 | ||||||||
| Fair value of Pension Plan Assets as of December 31, 2009 | ||||||||||||||||
|
Quoted prices in
|
||||||||||||||||
|
active markets
|
Significant
|
Significant
|
||||||||||||||
|
for identical
|
Observable Inputs
|
Unobservable
|
||||||||||||||
| Asset Class | assets (Level 1) | (Level 2) | Inputs (Level 3) | Total | ||||||||||||
|
Short term investments and cash
|
$ | 8,729 | $ | — | $ | — | $ | 8,729 | ||||||||
|
Equity securities:
|
||||||||||||||||
|
U.S. companies
|
98,899 | — | — | 98,899 | ||||||||||||
|
International companies
|
4,941 | — | — | 4,941 | ||||||||||||
|
International equity funds(a)
|
— | 33,946 | — | 33,946 | ||||||||||||
|
Fixed income securities:
|
||||||||||||||||
|
Domestic mutual funds(b)
|
20,870 | — | — | 20,870 | ||||||||||||
|
Convertible equity
|
398 | — | — | 398 | ||||||||||||
|
Private equity funds(c)
|
— | — | 13,235 | 13,235 | ||||||||||||
|
Real estate(d)
|
— | — | 7,762 | 7,762 | ||||||||||||
|
Other types of investments:
|
||||||||||||||||
|
Guaranteed insurance contracts(e)
|
— | — | 9,286 | 9,286 | ||||||||||||
|
Hedged equity funds(f)
|
— | — | 29,913 | 29,913 | ||||||||||||
|
Absolute return funds(c)
|
— | — | 38,038 | 38,038 | ||||||||||||
|
Other assets and liabilities(g)
|
— | — | 22 | 22 | ||||||||||||
|
Accrued income(g)
|
— | — | 134 | 134 | ||||||||||||
|
Total
|
$ | 133,837 | $ | 33,946 | $ | 98,390 | $ | 266,173 | ||||||||
F-38
Table of Contents
| (a) | This class includes funds with the principal strategy to invest primarily in long positions in international equity securities. | |
| (b) | This class invests primarily in U.S. government issued securities. | |
| (c) | This class invests primarily in absolute return strategy funds. | |
| (d) | This class includes funds that invest primarily in U.S. commercial real estate. | |
| (e) | This class invests primarily guaranteed insurance contracts through various U.S. insurance companies. | |
| (f) | This class invests primarily in hedged equity funds. | |
| (g) | This class includes accrued interest, dividends, and amounts receivable from asset sales and amounts payable for asset purchases. |
| 2010 Changes in Fair Value Measurements Using Significant Unobservable Inputs (Level 3) | ||||||||||||||||||||||||||||
|
Fixed income
|
Guaranteed
|
Absolute
|
Other assets and
|
|||||||||||||||||||||||||
|
securities -
|
Real Estate
|
Insurance
|
Hedged Equity
|
Return
|
liabilities and
|
|||||||||||||||||||||||
| Alternative | Funds | Contracts | Funds | Funds | accrued income | Totals | ||||||||||||||||||||||
|
Balance at December 31, 2009
|
$ | 13,235 | $ | 7,762 | $ | 9,286 | $ | 29,913 | $ | 38,038 | $ | 156 | $ | 98,390 | ||||||||||||||
|
Actual return on plan assets:
|
— | |||||||||||||||||||||||||||
|
Relating to assets still held at the measurement date
|
— | 1,274 | 282 | 2,016 | 3,072 | — | 6,644 | |||||||||||||||||||||
|
Relating to assets sold during the period
|
— | (106 | ) | — | — | — | — | (106 | ) | |||||||||||||||||||
|
Transfers out of Level 3*
|
(13,235 | ) | — | — | — | — | — | (13,235 | ) | |||||||||||||||||||
|
Purchases, sales, and settlements
|
— | (49 | ) | 89 | — | (1,000 | ) | 885 | (75 | ) | ||||||||||||||||||
|
Ending balance at December 31, 2010
|
$ | — | $ | 8,881 | $ | 9,657 | $ | 31,929 | $ | 40,110 | $ | 1,041 | $ | 91,618 | ||||||||||||||
| * | The alternative fixed income security was transferred out of a Level 3 classified security in Fiscal 2009 and into a Level 2 classified security for Fiscal 2010. The asset was transferred because the company received better information during Fiscal 2010 about the nature of the underlying assets and believes that at December 31, 2010 that appropriate classification of these securities is Level 2. |
|
Percentage of Plan
|
||||||||||||
|
Target
|
Assets at the
|
|||||||||||
|
Allocation
|
Measurement Date | |||||||||||
| Asset Category | 2011 | 2010 | 2009 | |||||||||
|
Equity securities
|
40-60 | % | 53.4 | 51.8 | ||||||||
|
Fixed income securities
|
10-40 | % | 9.4 | 13.0 | ||||||||
|
Real estate
|
0-25 | % | 3.5 | 2.9 | ||||||||
|
Other diversifying strategies(1)
|
0-40 | % | 31.8 | 29.0 | ||||||||
|
Short term investments and cash
|
0-25 | % | 1.9 | 3.3 | ||||||||
|
Other
|
0 | % | 0.0 | 0.0 | ||||||||
|
Total
|
100.0 | % | 100.0 | % | ||||||||
| (1) | Includes absolute return funds, hedged equity funds, and guaranteed insurance contracts. |
F-39
Table of Contents
| Year | Required | Discretionary | ||||||
| (Amounts in thousands) | ||||||||
|
2008
|
$ | — | $ | — | ||||
|
2009
|
$ | 450 | $ | — | ||||
|
2010
|
$ | 461 | $ | 448 | ||||
| Pension Benefits | ||||
| (Amounts in thousands) | ||||
|
2008
|
$ | 14,348 | ||
|
2009
|
$ | 15,725 | ||
|
2010
|
$ | 16,294 | ||
|
Estimated Future Payments:
|
||||
|
2011
|
$ | 17,215 | ||
|
2012
|
$ | 17,706 | ||
|
2013
|
$ | 18,225 | ||
|
2014
|
$ | 18,564 | ||
|
2015
|
$ | 18,925 | ||
|
2016 – 2020
|
$ | 104,390 | ||
F-40
Table of Contents
F-41
Table of Contents
|
Fiscal
|
Fiscal
|
Fiscal
|
||||||||||
| 2010 | 2009 | 2008 | ||||||||||
| (Amounts in thousands) | ||||||||||||
|
Service cost
|
$ | 632 | $ | 861 | $ | 514 | ||||||
|
Interest cost
|
875 | 1,113 | 661 | |||||||||
|
Amortization:
|
||||||||||||
|
Prior service cost
|
(59 | ) | 333 | 333 | ||||||||
|
Actuarial loss
|
(174 | ) | 34 | — | ||||||||
|
Total net periodic benefit cost
|
1,274 | 2,341 | 1,508 | |||||||||
|
Other changes in plan assets and benefit obligations recognized
in other comprehensive income:
|
||||||||||||
|
Current year actuarial (gain) loss*
|
(2,055 | ) | (1,612 | ) | 1,559 | |||||||
|
Current year prior service (credit) cost
|
— | (1,234 | ) | — | ||||||||
|
Mid-year accounting adjustment prior service (credit)
|
(109 | ) | — | — | ||||||||
|
Amortization of actuarial gain (loss)
|
59 | (34 | ) | — | ||||||||
|
Amortization of prior service (cost) credit
|
174 | (333 | ) | (333 | ) | |||||||
|
Total recognized in other comprehensive (loss) income
|
(1,931 | ) | (3,213 | ) | 1,226 | |||||||
|
Total recognized in net periodic benefit cost and other
comprehensive income
|
$ | (657 | ) | $ | (872 | ) | $ | 2,734 | ||||
| * | Includes gain related to higher than expected Part D subsidy receipts. |
F-42
Table of Contents
|
January 1,
|
January 2,
|
|||||||
| 2011 | 2010 | |||||||
| (Amounts in thousands) | ||||||||
|
Change in benefit obligation:
|
||||||||
|
Benefit obligation at beginning of year
|
$ | 15,114 | $ | 17,395 | ||||
|
Mid-year accounting adjustment
|
(109 | ) | — | |||||
|
Service cost
|
632 | 861 | ||||||
|
Interest cost
|
875 | 1,113 | ||||||
|
Participant contributions
|
392 | 412 | ||||||
|
Actuarial loss (gain)
|
(2,053 | ) | (1,612 | ) | ||||
|
Benefits paid
|
(1,085 | ) | (1,903 | ) | ||||
|
Less federal subsidy on benefits paid
|
58 | 82 | ||||||
|
Plan amendments
|
— | (1,234 | ) | |||||
|
Benefit obligation at end of year
|
$ | 13,824 | $ | 15,114 | ||||
|
Change in plan assets:
|
||||||||
|
Fair value of plan assets at beginning of year
|
$ | — | $ | — | ||||
|
Employer contributions
|
693 | 1,491 | ||||||
|
Participant contributions
|
392 | 412 | ||||||
|
Benefits paid
|
(1,085 | ) | (1,903 | ) | ||||
|
Fair value of plan assets at end of year
|
$ | — | $ | — | ||||
|
Funded status, end of year:
|
||||||||
|
Fair value of plan assets
|
$ | — | $ | — | ||||
|
Benefit obligations
|
13,824 | 15,114 | ||||||
|
Funded status and amount recognized at end of year
|
$ | (13,824 | ) | $ | (15,114 | ) | ||
|
Amounts recognized in the balance sheet:
|
||||||||
|
Current liability
|
$ | (1,011 | ) | $ | (841 | ) | ||
|
Noncurrent liability
|
(12,813 | ) | (14,273 | ) | ||||
|
Amount recognized at end of year
|
$ | (13,824 | ) | $ | (15,114 | ) | ||
|
Amounts recognized in accumulated other comprehensive (loss)
income:
|
||||||||
|
Net actuarial (gain) loss before taxes
|
$ | (1,870 | ) | $ | 126 | |||
|
Prior service (credit) cost before taxes
|
(1,085 | ) | (1,150 | ) | ||||
|
Amounts recognized in accumulated other comprehensive (loss)
income
|
$ | (2,955 | ) | $ | (1,024 | ) | ||
F-43
Table of Contents
|
Fiscal
|
Fiscal
|
Fiscal
|
||||||||||||||||||||||
| 2010 | 2009 | 2008 | ||||||||||||||||||||||
|
Weighted average assumptions used to determine benefit
obligations:
|
||||||||||||||||||||||||
|
Measurement date
|
12/31/2010 | 12/31/2009 | 12/31/2008 | |||||||||||||||||||||
|
Discount rate
|
5.00 | % | 5.75 | % | 6.25 | % | ||||||||||||||||||
|
Rate of compensation increase
|
N/A | N/A | N/A | |||||||||||||||||||||
|
Health care cost trend rate used to determine benefit
obligations:
|
||||||||||||||||||||||||
|
Initial rate
|
8.00 | % | 8.00 | % | 8.00 | % | ||||||||||||||||||
|
Ultimate rate
|
5.00 | % | 5.00 | % | 5.00 | % | ||||||||||||||||||
|
Year trend reaches the ultimate rate
|
2017 | 2016 | 2015 | |||||||||||||||||||||
|
Weighted average assumptions used to determine net periodic cost:
|
||||||||||||||||||||||||
|
Measurement date
|
1/1/2010 | 1/1/2009 | 1/1/2008 | |||||||||||||||||||||
|
Discount rate
|
5.75 | % | 6.25 | % | 6.00 | %(1) | ||||||||||||||||||
|
Expected return on plan assets
|
N/A | N/A | N/A | |||||||||||||||||||||
|
Rate of compensation increase
|
N/A | N/A | N/A | |||||||||||||||||||||
|
Health care cost trend rate used to determine net cost:
|
||||||||||||||||||||||||
|
Initial rate
|
8.00 | % | 8.00 | % | 8.50 | % | ||||||||||||||||||
|
Ultimate rate
|
5.00 | % | 5.00 | % | 5.00 | % | ||||||||||||||||||
|
Year trend reaches the ultimate rate
|
2016 | 2015 | 2015 | |||||||||||||||||||||
| (1) | The ButterKrust postretirement benefit plan was acquired August 4, 2008. The discount rate used to determine net periodic benefit cost for this plan was 6.75%. |
| One-Percentage Point Decrease | One-Percentage Point Increase | |||||||||||||||||||||||
| For the Year Ended | For the Year Ended | |||||||||||||||||||||||
|
Fiscal
|
Fiscal
|
Fiscal
|
Fiscal
|
Fiscal
|
Fiscal
|
|||||||||||||||||||
| 2010 | 2009 | 2008 | 2010 | 2009 | 2007 | |||||||||||||||||||
| (Amounts in thousands) | ||||||||||||||||||||||||
|
Effect on total of service and interest cost
|
$ | (150 | ) | $ | (187 | ) | $ | (109 | ) | $ | 171 | $ | 214 | $ | 125 | |||||||||
|
Effect on postretirement benefit obligation
|
$ | (867 | ) | $ | (1,134 | ) | $ | (1,254 | ) | $ | 955 | $ | 1,258 | $ | 1,417 | |||||||||
F-44
Table of Contents
|
Employer Net
|
||||
| Year | Contribution | |||
|
2008
|
$ | 719 | ||
|
2009
|
$ | 1,409 | ||
|
2010
|
$ | 635 | ||
|
2011 (Expected)
|
$ | 1,011 | ||
| Postretirement Benefits | ||||||||
| (Amounts in thousands) | ||||||||
|
Employer Gross
|
MMA Subsidy
|
|||||||
| Contribution | (Income) | |||||||
|
2008
|
$ | 750 | $ | (31 | ) | |||
|
2009
|
$ | 1,491 | $ | (82 | ) | |||
|
2010
|
$ | 693 | $ | (58 | ) | |||
|
Estimated Future Payments:
|
||||||||
|
2011
|
$ | 1,078 | $ | (67 | ) | |||
|
2012
|
$ | 1,092 | $ | (71 | ) | |||
|
2013
|
$ | 1,156 | $ | (75 | ) | |||
|
2014
|
$ | 1,220 | $ | (79 | ) | |||
|
2015
|
$ | 1,254 | $ | (83 | ) | |||
|
2016 – 2020
|
$ | 6,494 | $ | (469 | ) | |||
F-45
Table of Contents
| Note 21. | Income Taxes |
|
Fiscal
|
Fiscal
|
Fiscal
|
||||||||||
| 2010 | 2009 | 2008 | ||||||||||
| (Amounts in thousands) | ||||||||||||
|
Current Taxes:
|
||||||||||||
|
Federal
|
$ | 60,472 | $ | 63,280 | $ | 61,005 | ||||||
|
State
|
8,973 | 7,460 | 4,158 | |||||||||
| 69,445 | 70,740 | 65,163 | ||||||||||
|
Deferred Taxes:
|
||||||||||||
|
Federal
|
4,372 | 1,147 | 1,763 | |||||||||
|
State
|
(484 | ) | 2,160 | 818 | ||||||||
| 3,888 | 3,307 | 2,581 | ||||||||||
|
Income tax expense
|
$ | 73,333 | $ | 74,047 | $ | 67,744 | ||||||
F-46
Table of Contents
|
January 1,
|
January 2,
|
|||||||
| 2011 | 2010 | |||||||
| (Amounts in thousands) | ||||||||
|
Self-insurance
|
$ | 5,846 | $ | 5,194 | ||||
|
Compensation and employee benefits
|
10,909 | 10,499 | ||||||
|
Deferred income
|
6,542 | 7,417 | ||||||
|
Loss carryforwards
|
6,490 | 8,324 | ||||||
|
Equity-based compensation
|
10,764 | 9,130 | ||||||
|
Hedging
|
— | 7,894 | ||||||
|
Pension
|
23,259 | 20,360 | ||||||
|
Other
|
13,124 | 11,594 | ||||||
|
Deferred tax assets valuation allowance
|
(2,691 | ) | (3,647 | ) | ||||
|
Deferred tax assets
|
74,243 | 76,765 | ||||||
|
Depreciation
|
(83,378 | ) | (76,431 | ) | ||||
|
Hedging
|
(14,953 | ) | — | |||||
|
Intangible Assets
|
(39,802 | ) | (40,950 | ) | ||||
|
Other
|
(1,695 | ) | (2,418 | ) | ||||
|
Deferred tax liabilities
|
(139,828 | ) | (119,799 | ) | ||||
|
Net deferred tax liability
|
$ | (65,585 | ) | $ | (43,034 | ) | ||
|
Fiscal
|
Fiscal
|
Fiscal
|
||||||||||
| 2010 | 2009 | 2008 | ||||||||||
| (Amounts in thousands) | ||||||||||||
|
Tax at U.S. federal income tax rate
|
$ | 73,633 | $ | 72,716 | $ | 66,518 | ||||||
|
State income taxes, net of federal income tax benefit
|
5,795 | 7,170 | 4,165 | |||||||||
|
Decrease in valuation allowance
|
(279 | ) | (186 | ) | (129 | ) | ||||||
|
Section 199 qualifying production activities
|
(6,019 | ) | (3,999 | ) | (3,720 | ) | ||||||
|
Jobs tax credit
|
(228 | ) | (244 | ) | (133 | ) | ||||||
|
Other
|
431 | (1,410 | ) | 1,043 | ||||||||
|
Income tax expense
|
$ | 73,333 | $ | 74,047 | $ | 67,744 | ||||||
F-47
Table of Contents
|
Fiscal
|
Fiscal
|
Fiscal
|
||||||||||
| 2010 | 2009 | 2008 | ||||||||||
| (Amounts in thousands) | ||||||||||||
|
Unrecognized tax benefit at beginning of fiscal year
|
$ | 4,629 | $ | 4,547 | $ | 4,585 | ||||||
|
Gross increases — tax positions in a current period
|
553 | 658 | — | |||||||||
|
Gross increases — tax positions in a prior period
|
— | 831 | 3,103 | |||||||||
|
Settlements
|
— | — | (2,091 | ) | ||||||||
|
Lapses of statutes of limitations
|
(359 | ) | (1,407 | ) | (1,050 | ) | ||||||
|
Unrecognized tax benefit at end of fiscal year
|
$ | 4,823 | $ | 4,629 | $ | 4,547 | ||||||
| Note 22. | Commitments and Contingencies |
F-48
Table of Contents
| Note 23. | Segment Reporting |
|
Fiscal
|
Fiscal
|
Fiscal
|
||||||||||
| 2010 | 2009 | 2008 | ||||||||||
| (Amounts in thousands) | ||||||||||||
|
Sales:
|
||||||||||||
|
DSD
|
$ | 2,096,100 | $ | 2,159,065 | $ | 2,013,927 | ||||||
|
Warehouse delivery
|
613,627 | 577,614 | 512,970 | |||||||||
|
Eliminations:
|
||||||||||||
|
Sales from Warehouse delivery to DSD
|
(111,214 | ) | (111,893 | ) | (97,371 | ) | ||||||
|
Sales from DSD to Warehouse delivery
|
(24,744 | ) | (23,937 | ) | (14,634 | ) | ||||||
| $ | 2,573,769 | $ | 2,600,849 | $ | 2,414,892 | |||||||
|
Depreciation and amortization:
|
||||||||||||
|
DSD
|
$ | 65,977 | $ | 64,578 | $ | 57,447 | ||||||
|
Warehouse delivery
|
18,985 | 16,062 | 15,549 | |||||||||
|
Other(1)
|
156 | 288 | 316 | |||||||||
| $ | 85,118 | $ | 80,928 | $ | 73,312 | |||||||
|
Income from operations:
|
||||||||||||
|
DSD
|
$ | 194,972 | $ | 192,539 | $ | 185,292 | ||||||
|
Warehouse delivery
|
47,925 | 51,326 | 25,666 | |||||||||
|
Other(1)
|
(37,035 | ) | (37,532 | ) | (28,256 | ) | ||||||
| $ | 205,862 | $ | 206,333 | $ | 182,702 | |||||||
|
Net interest income
|
$ | 4,518 | $ | 1,426 | $ | 7,349 | ||||||
|
Income before income taxes
|
$ | 210,380 | $ | 207,759 | $ | 190,051 | ||||||
|
Capital expenditures:
|
||||||||||||
|
DSD
|
$ | 69,252 | $ | 54,586 | $ | 71,413 | ||||||
|
Warehouse delivery
|
24,693 | 14,670 | 12,212 | |||||||||
|
Other(1)
|
4,459 | 2,837 | 3,236 | |||||||||
| $ | 98,404 | $ | 72,093 | $ | 86,861 | |||||||
F-49
Table of Contents
| As of | ||||||||
|
January 1,
|
January 2,
|
|||||||
| 2011 | 2010 | |||||||
|
Assets:
|
||||||||
|
DSD
|
$ | 1,011,944 | $ | 1,050,398 | ||||
|
Warehouse delivery
|
232,481 | 226,515 | ||||||
|
Other(2)
|
81,064 | 74,529 | ||||||
| $ | 1,325,489 | $ | 1,351,442 | |||||
| (1) | Represents Flowers Foods’ corporate head office amounts. | |
| (2) | Represents Flowers Foods’ corporate head office assets including primarily cash and cash equivalents, deferred taxes and deferred financing costs. |
| Fiscal 2010 | Fiscal 2009 | Fiscal 2008 | ||||||||||||||||||||||||||||||||||
|
Warehouse
|
Warehouse
|
Warehouse
|
||||||||||||||||||||||||||||||||||
| DSD | delivery | Total | DSD | delivery | Total | DSD | delivery | Total | ||||||||||||||||||||||||||||
|
Branded Retail
|
$ | 1,221,074 | $ | 108,517 | $ | 1,329,591 | $ | 1,213,217 | $ | 134,361 | $ | 1,347,578 | $ | 1,161,594 | $ | 112,704 | $ | 1,274,298 | ||||||||||||||||||
|
Store Branded Retail
|
332,109 | 105,953 | 438,062 | 358,700 | 59,326 | 418,026 | 303,193 | 52,197 | 355,390 | |||||||||||||||||||||||||||
|
Non-retail and Other
|
518,173 | 287,943 | 806,116 | 563,211 | 272,034 | 835,245 | 534,506 | 250,698 | 785,204 | |||||||||||||||||||||||||||
|
Total
|
$ | 2,071,356 | $ | 502,413 | $ | 2,573,769 | $ | 2,135,128 | $ | 465,721 | $ | 2,600,849 | $ | 1,999,293 | $ | 415,599 | $ | 2,414,892 | ||||||||||||||||||
F-50
Table of Contents
| Note 24. | Unaudited Quarterly Financial Information |
| First Quarter | Second Quarter | Third Quarter | Fourth Quarter | |||||||||||||||||
| (Amounts in thousands, except per share data) | ||||||||||||||||||||
|
Sales
|
2010 | $ | 795,026 | $ | 607,716 | $ | 597,894 | $ | 573,133 | |||||||||||
| 2009 | $ | 807,007 | $ | 614,448 | $ | 602,570 | $ | 576,824 | ||||||||||||
|
Materials, supplies, labor and other production costs (exclusive
of depreciation and amortization shown separately)
|
2010 | $ | 414,798 | $ | 318,553 | $ | 316,141 | $ | 297,298 | |||||||||||
| 2009 | $ | 429,462 | $ | 333,339 | $ | 322,245 | $ | 305,137 | ||||||||||||
|
Net income attributable to Flowers Foods, Inc.
|
2010 | $ | 40,687 | $ | 33,756 | $ | 31,166 | $ | 31,438 | |||||||||||
| 2009 | $ | 37,381 | $ | 30,341 | $ | 31,926 | $ | 30,649 | ||||||||||||
|
Basic net income attributable to Flowers Foods, Inc. common
shareholders per share
|
2010 | $ | 0.44 | $ | 0.37 | $ | 0.34 | $ | 0.35 | |||||||||||
| 2009 | $ | 0.40 | $ | 0.33 | $ | 0.35 | $ | 0.33 | ||||||||||||
|
Diluted net income attributable to Flowers Foods, Inc. common
shareholders per share
|
2010 | $ | 0.44 | $ | 0.37 | $ | 0.34 | $ | 0.34 | |||||||||||
| 2009 | $ | 0.40 | $ | 0.33 | $ | 0.34 | $ | 0.33 | ||||||||||||
| Note 25. | Subsequent Events |
F-51
Table of Contents
|
Additions
|
||||||||||||||||
|
Beginning
|
(Reductions)
|
Ending
|
||||||||||||||
| Balance | to Expenses | Deductions | Balance | |||||||||||||
| (Amounts in thousands) | ||||||||||||||||
|
Classification:
|
||||||||||||||||
|
Fiscal Year Ended January 1, 2011
|
||||||||||||||||
|
Allowance for doubtful accounts
|
$ | 469 | 547 | 494 | $ | 522 | ||||||||||
|
Inventory reserves
|
$ | 82 | 1,047 | 898 | $ | 231 | ||||||||||
|
Deferred tax asset valuation allowance
|
$ | 3,647 | (279 | ) | (677 | ) | $ | 2,691 | ||||||||
|
Fiscal Year Ended January 2, 2010
|
||||||||||||||||
|
Allowance for doubtful accounts
|
$ | 378 | 2,077 | 1,986 | $ | 469 | ||||||||||
|
Inventory reserves
|
$ | 594 | 498 | 1,010 | $ | 82 | ||||||||||
|
Deferred tax asset valuation allowance
|
$ | 4,520 | (186 | ) | (687 | ) | $ | 3,647 | ||||||||
|
Fiscal Year Ended January 3, 2009
|
||||||||||||||||
|
Allowance for doubtful accounts
|
$ | 131 | 640 | 393 | $ | 378 | ||||||||||
|
Inventory reserves
|
$ | 134 | 1,121 | 661 | $ | 594 | ||||||||||
|
Deferred tax asset valuation allowance
|
$ | 4,649 | (129 | ) | — | $ | 4,520 | |||||||||
F-52