FMC CORP
10-Ks and 10-Qs
|
|
|
|
|
|
|
|
|
|
|
|
|
|
|
|
|
|
|
|
|
|
|
|
|
|
|
|
|
|
|
|
|
|
|
|
|
|
|
|
|
|
|
|
|
|
|
|
|
|
|
|
|
|
|
|
UNITED STATES
SECURITIES AND EXCHANGE COMMISSION
Washington, D.C. 20549
_______________________________________________________________________
FORM 10-K
_______________________________________________________________________
|
x
|
Annual Report Pursuant to Section 13 or 15(d) of the Securities Exchange Act of 1934
|
For the fiscal year ended
December 31, 2012
or
|
o
|
Transition Report Pursuant to Section 13 or 15(d) of the Securities Exchange Act of 1934
|
For the transition period from _______ to _______
Commission File Number 1-2376
__________________________________________________________________________
FMC CORPORATION
(Exact name of registrant as specified in its charter)
__________________________________________________________________________
|
Delaware
|
|
94-0479804
|
|
(State or other jurisdiction of
incorporation or organization)
|
|
(I.R.S. Employer
Identification No.)
|
|
1735 Market Street
Philadelphia, Pennsylvania
|
|
19103
|
|
(Address of principal executive offices)
|
|
(Zip Code)
|
Registrant’s telephone number, including area code: 215-299-6000
__________________________________________________________________________
Securities registered pursuant to Section 12(b) of the Act:
|
Title of each class
|
|
Name of each exchange on which registered
|
|
Common Stock, $0.10 par value
|
|
New York Stock Exchange
Chicago Stock Exchange
|
Securities registered pursuant to Section 12(g) of the Act:
None
INDICATE BY CHECK MARK IF THE REGISTRANT IS A WELL-KNOWN SEASONED ISSUER, AS DEFINED IN RULE 405 OF THE SECURITIES ACT. YES
ý
NO
¨
INDICATE BY CHECK MARK IF THE REGISTRANT IS NOT REQUIRED TO FILE REPORTS PURSUANT TO SECTION 13 AND SECTION 15(d) OF THE ACT. YES
¨
NO
ý
INDICATE BY CHECK MARK WHETHER THE REGISTRANT (1) HAS FILED ALL REPORTS REQUIRED TO BE FILED BY SECTION 13 OR 15(d) OF THE SECURITIES EXCHANGE ACT OF 1934 DURING THE PRECEDING 12 MONTHS (OR FOR SUCH SHORTER PERIOD THAT THE REGISTRANT WAS REQUIRED TO FILE SUCH REPORTS), AND (2) HAS BEEN SUBJECT TO SUCH FILING REQUIREMENTS FOR THE PAST 90 DAYS. YES
ý
NO
¨
INDICATE BY CHECK MARK WHETHER THE REGISTRANT HAS SUBMITTED ELECTRONICALLY AND POSTED ON ITS CORPORATE WEBSITE, IF ANY, EVERY INTERACTIVE DATA FILE REQUIRED TO BE SUBMITTED AND POSTED PURSUANT TO RULE 405 OF REGULATION S-T DURING THE PRECEDING 12 MONTHS (OR FOR SUCH SHORTER PERIOD THAT THE REGISTRANT WAS REQUIRED TO SUBMIT AND POST SUCH FILES) YES
ý
NO
¨
INDICATE BY CHECK MARK IF DISCLOSURE OF DELINQUENT FILERS PURSUANT TO ITEM 405 OF REGULATION S-K IS NOT CONTAINED HEREIN, AND WILL NOT BE CONTAINED, TO THE BEST OF REGISTRANT’S KNOWLEDGE, IN DEFINITIVE PROXY OR INFORMATION STATEMENTS INCORPORATED BY REFERENCE IN PART III OF THIS FORM 10-K OR ANY AMENDMENT TO THIS FORM 10-K
ý
INDICATE BY CHECK MARK WHETHER THE REGISTRANT IS A LARGE ACCELERATED FILER, AN ACCELERATED FILER, A NON-ACCELERATED FILER OR A SMALLER REPORTING COMPANY. SEE DEFINITIONS OF “LARGE ACCELERATED FILER,” “ACCELERATED FILER,” AND “SMALLER REPORTING COMPANY” IN RULE 12B-2 OF THE EXCHANGE ACT. (CHECK ONE):
|
LARGE ACCELERATED FILER
|
|
x
|
|
ACCELERATED FILER
|
|
o
|
|
NON-ACCELERATED FILER
|
|
o
|
|
SMALLER REPORTING COMPANY
|
|
o
|
INDICATE BY CHECK MARK WHETHER THE REGISTRANT IS A SHELL COMPANY (AS DEFINED IN RULE 12B-2 OF THE EXCHANGE ACT) YES
o
NO
x
THE AGGREGATE MARKET VALUE OF VOTING STOCK HELD BY NON-AFFILIATES OF THE REGISTRANT AS OF JUNE 30,
2012
, THE LAST DAY OF THE REGISTRANT’S SECOND FISCAL QUARTER WAS
$7,283,772,883
. THE MARKET VALUE OF VOTING STOCK HELD BY NON-AFFILIATES EXCLUDES THE VALUE OF THOSE SHARES HELD BY EXECUTIVE OFFICERS AND DIRECTORS OF THE REGISTRANT.
INDICATE THE NUMBER OF SHARES OUTSTANDING OF EACH OF THE ISSUER’S CLASSES OF COMMON STOCK, AS OF THE LATEST PRACTICABLE DATE
|
Class
|
|
December 31, 2012
|
|
Common Stock, par value $0.10 per share
|
|
137,670,378
|
DOCUMENTS INCORPORATED BY REFERENCE
|
DOCUMENT
|
|
FORM 10-K REFERENCE
|
|
Portions of Proxy Statement for
2013 Annual Meeting of Stockholders
|
|
Part III
|
FMC Corporation
2012
Form 10-K Annual Report
Table of Contents
|
|
|
Page
|
|
Part 1
|
||
|
Item 1
|
Business
|
|
|
Item 1A
|
Risk Factors
|
|
|
Item 1B
|
Unresolved Staff Comments
|
|
|
Item 2
|
Properties
|
|
|
Item 3
|
Legal Proceedings
|
|
|
Item 4
|
Mine Safety Disclosures
|
|
|
Part II
|
||
|
Item 5
|
Market for the Registrant’s Common Equity, Related Stockholders Matters and Issuer Purchases of Equity Securities
|
|
|
Item 6
|
Selected Financial Data
|
|
|
Item 7
|
Management’s Discussion and Analysis of Financial Condition and Results of Operations
|
|
|
Item 7A
|
Quantitative and Qualitative Disclosures about Market Risk
|
|
|
Item 8
|
Financial Statements and Supplementary Data
|
|
|
Item 9
|
Changes in and Disagreements with Accountants on Accounting and Financial Disclosure
|
|
|
Item 9A
|
Controls and Procedures
|
|
|
Item 9B
|
Other Information
|
|
|
Part III
|
||
|
Item 10
|
Directors, Executive Officers and Corporate Governance
|
|
|
Item 11
|
Executive Compensation
|
|
|
Item 12
|
Security Ownership of Certain Beneficial Owners and Management and Related Stockholder Matters
|
|
|
Item 13
|
Certain Relationships and Related Transactions, and Director Independence
|
|
|
Item 14
|
Principal Accountant Fees and Services
|
|
|
Part IV
|
||
|
Item 15
|
Exhibits and Financial Statement Schedules
|
|
|
Signatures
|
||
|
Index of Exhibits
|
||
3
FMC Corporation (FMC) was incorporated in 1928 under Delaware law and has its principal executive offices at 1735 Market Street, Philadelphia, Pennsylvania 19103. Throughout this Annual Report on Form 10-K, except where otherwise stated or indicated by the context, “FMC”, “We,” “Us,” or “Our” means FMC Corporation and its consolidated subsidiaries and their predecessors. Copies of the annual, quarterly and current reports we file with the Securities and Exchange Commission (“SEC”), and any amendments to those reports, are available on our website at
www.FMC.com
as soon as practicable after we furnish such materials to the SEC.
|
ITEM 1.
|
BUSINESS
|
General
We are a diversified chemical company serving agricultural, consumer and industrial markets globally with innovative solutions, applications and market-leading products. We operate in three distinct business segments: Agricultural Products, Specialty Chemicals and Industrial Chemicals. Our Agricultural Products segment develops, markets and sells all three major classes of crop protection chemicals – insecticides, herbicides and fungicides – with particular strength in insecticides and herbicides. These products are used in agriculture to enhance crop yield and quality by controlling a broad spectrum of insects, weeds and disease, as well as pest control in non-agricultural markets. Specialty Chemicals consists of our BioPolymer and lithium businesses. This segment focuses on food ingredients that are used to enhance texture, color, structure and physical stability, pharmaceutical additives for binding, encapsulation and disintegrant applications, ultrapure biopolymers for medical devices and lithium for energy storage, specialty polymers and pharmaceutical synthesis in industrial uses. Our Industrial Chemicals segment manufactures a wide range of inorganic materials, including soda ash, hydrogen peroxide, specialty peroxygens and silicates. This segment serves a diverse group of markets, from economically-sensitive industrial sectors to technology-intensive specialty markets. The products in this segment are sought by customers for their critical reactivity or specific functionality in markets such as glass, detergents, chemicals and pulp and paper.
The following table shows the principal products produced by our three business segments and their raw materials and uses:
|
Segment
|
Product
|
Raw Materials
|
Uses
|
|
Agricultural Products
|
Insecticides
|
Synthetic chemical intermediates
|
Protection of crops, including cotton, sugarcane, rice, corn, soybeans, cereals, fruits and vegetables from insects and for non-agricultural applications including pest control for home, garden and other specialty markets
|
|
Herbicides
|
Synthetic chemical intermediates
|
Protection of crops, including cotton, sugarcane, rice, corn, soybeans, cereals, fruits and vegetables from weed growth and for non-agricultural applications including turf and roadsides
|
|
|
Fungicides
|
Synthetic chemical intermediates
|
Protection of crops, including fruits and vegetables from fungal disease
|
|
|
Specialty Chemicals
|
Microcrystalline Cellulose
|
Specialty pulp
|
Drug dry tablet binder and disintegrant, food ingredient
|
|
Carrageenan
|
Refined seaweed
|
Food ingredient for thickening and stabilizing, encapsulants for pharmaceutical and nutraceutical
|
|
|
Alginates
|
Refined seaweed
|
Food ingredient, pharmaceutical excipient, healthcare and industrial uses
|
|
|
Natural Colorants
|
Plant sources, select insect species
|
Food, pharmaceutical and cosmetics
|
|
|
Pectin
|
Citrus fruit peels
|
Food ingredients for texture and stabilizing
|
|
|
Lithium
|
Extracted lithium
|
Batteries, polymers, pharmaceuticals, greases and lubricants, glass and ceramics and other industrial uses
|
|
|
Industrial Chemicals
|
Soda Ash
|
Mined trona ore
|
Glass, chemicals, detergents
|
|
Peroxygens
|
Hydrogen, caustic soda, sulfuric acid, acetic acid
|
Pulp & paper, chemical processing, detergents, antimicrobial disinfectants, environmental applications, electronics, and polymers
|
|
|
Silicates
|
Caustic Soda, Soda Ash
|
Tires, detergents and pulp & paper
|
|
4
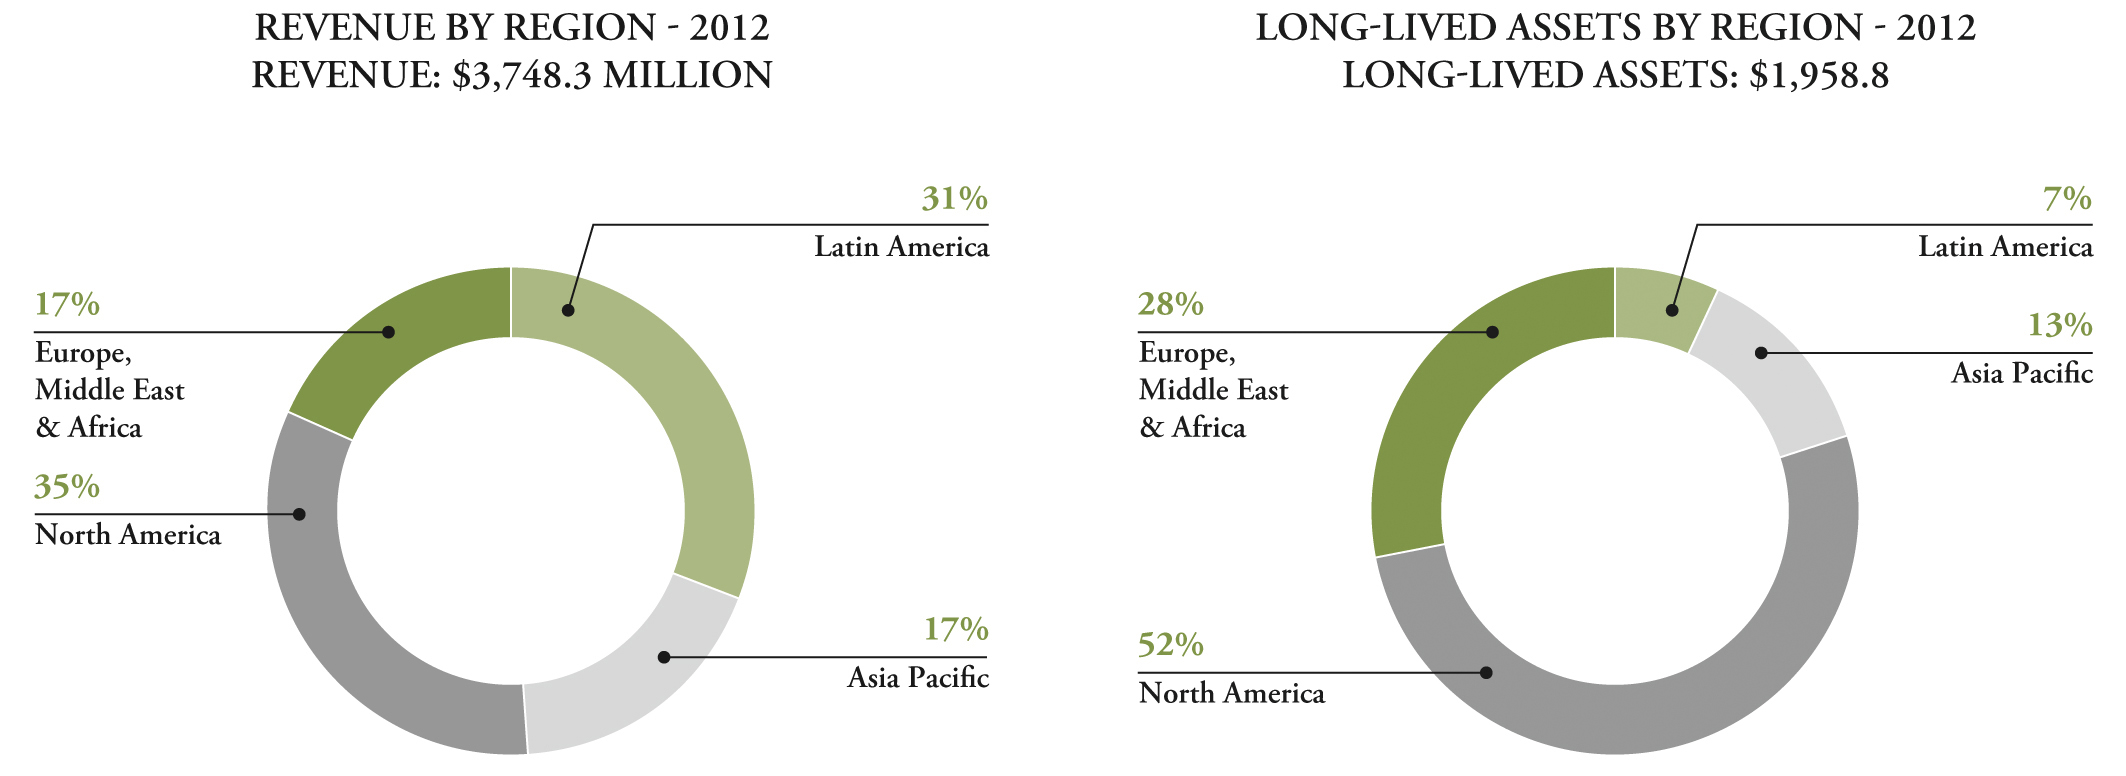
We have operations in many areas around the world. With a worldwide manufacturing and distribution infrastructure, we are able to respond rapidly to global customer needs, offset downward economic trends in one region with positive trends in another and match local revenues to local costs to mitigate the impact of currency volatility. The charts below detail our sales and long-lived assets by major geographic region.
Our Strategy
Since 2010, we have invested significant resources and managerial time in the development and implementation of a new strategic plan for the Company. This corporate strategy, which we refer to as Vision 2015, is focused on driving sales and earnings growth while sustaining a return on invested capital well above our cost of capital. This strategy's objective is to achieve a total shareholder return in the top quartile of a broad group of industry peers. Vision 2015 has five key elements:
Growing Leadership Positions
. We intend to continue to build and strengthen our market leading positions by executing a plan that relies primarily on organic growth, complemented by a focused external growth strategy. We benefit from a business portfolio that is exposed to faster growing end markets and geographic regions. Agricultural Products’ organic growth plan focuses on market and product innovations while strengthening market access. Specialty Chemicals’ organic focus is primarily on new products and new applications for existing products. Industrial Chemicals’ focus is on new applications for existing chemistries. To complement these organic growth initiatives, our external growth strategy employs a focused, disciplined approach to company, product and technology acquisitions. We believe this strategy reduces the risk normally inherent in external growth. Agricultural Products intends to complement its organic growth initiatives by acquiring new products and technologies, as well as making selective acquisitions to strengthen market access and enter adjacent spaces. In Specialty Chemicals, the food ingredients market is our top priority for acquisitions that will expand our product line offerings and positions in rapidly-developing economies. Industrial Chemicals will evaluate selective acquisitions focused in specialty applications. Across all businesses our strategy excludes making large scale, complex, or transformational acquisitions or adding another business platform to our portfolio through acquisition.
Increasing our Reach
. We intend to bias our growth initiatives toward further strengthening our positions in rapidly-developing economies (RDEs). Our growth in Latin America will be largely driven by leveraging Agricultural Products’ leadership positions. In Asia, our growth initiatives will be more broad-based, with targeted investments in human, scientific and technological resources across our businesses in the region. In Central and Eastern Europe, Turkey and Russia, we will focus on establishing strong footholds in key countries.
Capturing the Value of Common Ownership
. We are moving from a highly decentralized organizational model to one that has both centralized and decentralized qualities. We believe this shift will enable us to better leverage the size and scope of our company to realize cost savings and increase efficiencies yet maintain strong accountability in our business units. Our efforts to date have focused on such areas as procurement, strategic planning, mergers and acquisitions, communications, global supply chain and RDE infrastructure.
Proactively Managing our Portfolio
. We continually assess the performance of all of our business units, and will take actions as needed should a unit’s performance change. Within our businesses, we continue to evaluate the performance of specific product lines and have taken action where a product line has become non-strategic or economically unsustainable, such as the exit in 2011 of the sodium percarbonate product line and of the zeolites product line in 2012.
5
Disciplined Cash Deployment
. Under our Vision 2015 plan, we expect to fund our growth strategies and return a significant amount of cash to our shareholders through share repurchases and dividends.
Underlying our ambition to deliver our Vision 2015 plan is a continued commitment to enterprise sustainability, including responsible stewardship. As we grow, we will do so in a responsible way. Safety is and will remain of utmost importance. Meeting and exceeding our customers’ expectations will continue to be a primary focus. We will, as always, conduct our business in an ethical manner. In 2012, we published our inaugural Sustainability Report, which provides an overview of our sustainability effects and progress.
Financial Information about Our Business Segments
See Note 19 to our consolidated financial statements included in this Form 10-K. Also see below for selected financial information related to our segments.
Agricultural Products
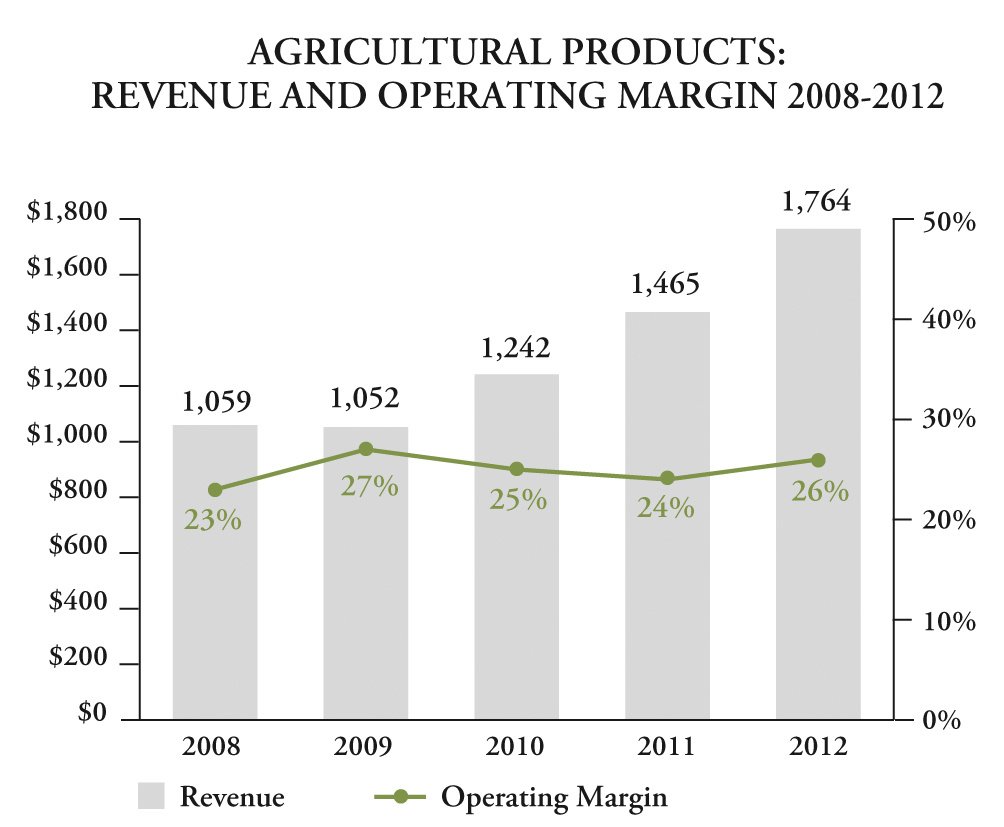
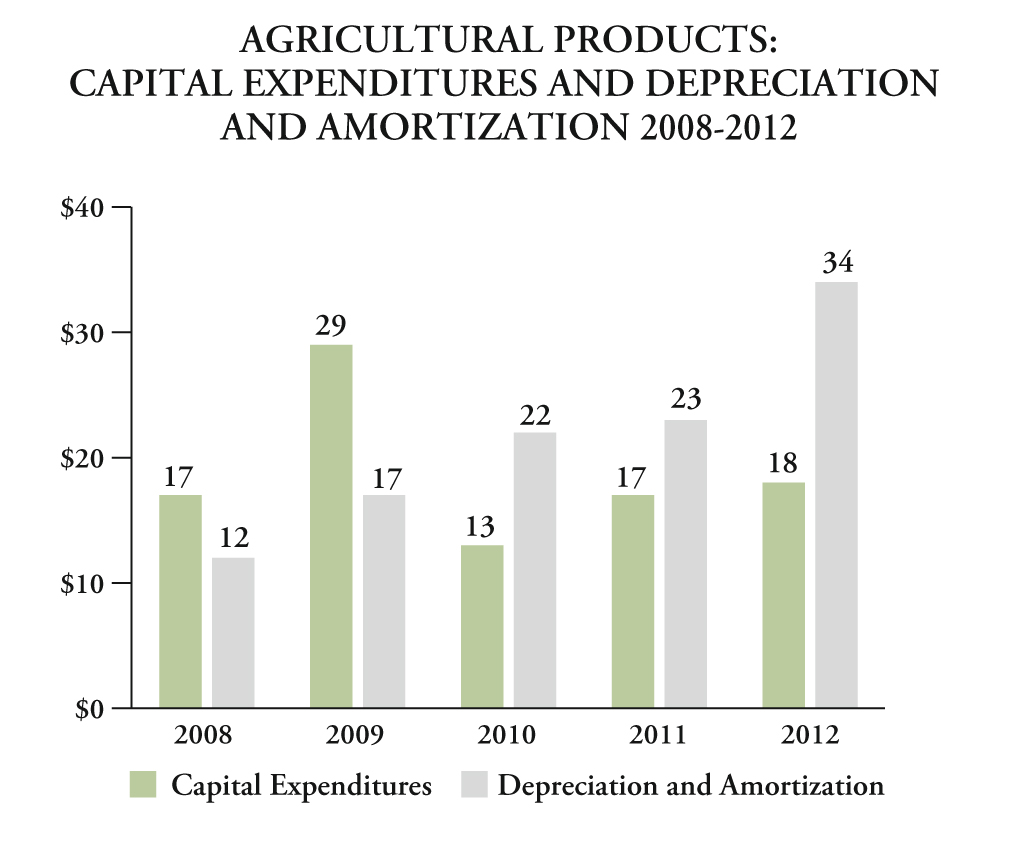
Financial Information (In Millions)
Overview
Our Agricultural Products segment, which represents approximately
47 percent
of our
2012
consolidated revenues, operates in the agrochemicals industry. This segment develops, manufactures and sells a portfolio of crop protection, professional pest control and lawn and garden products.
6
Products and Markets
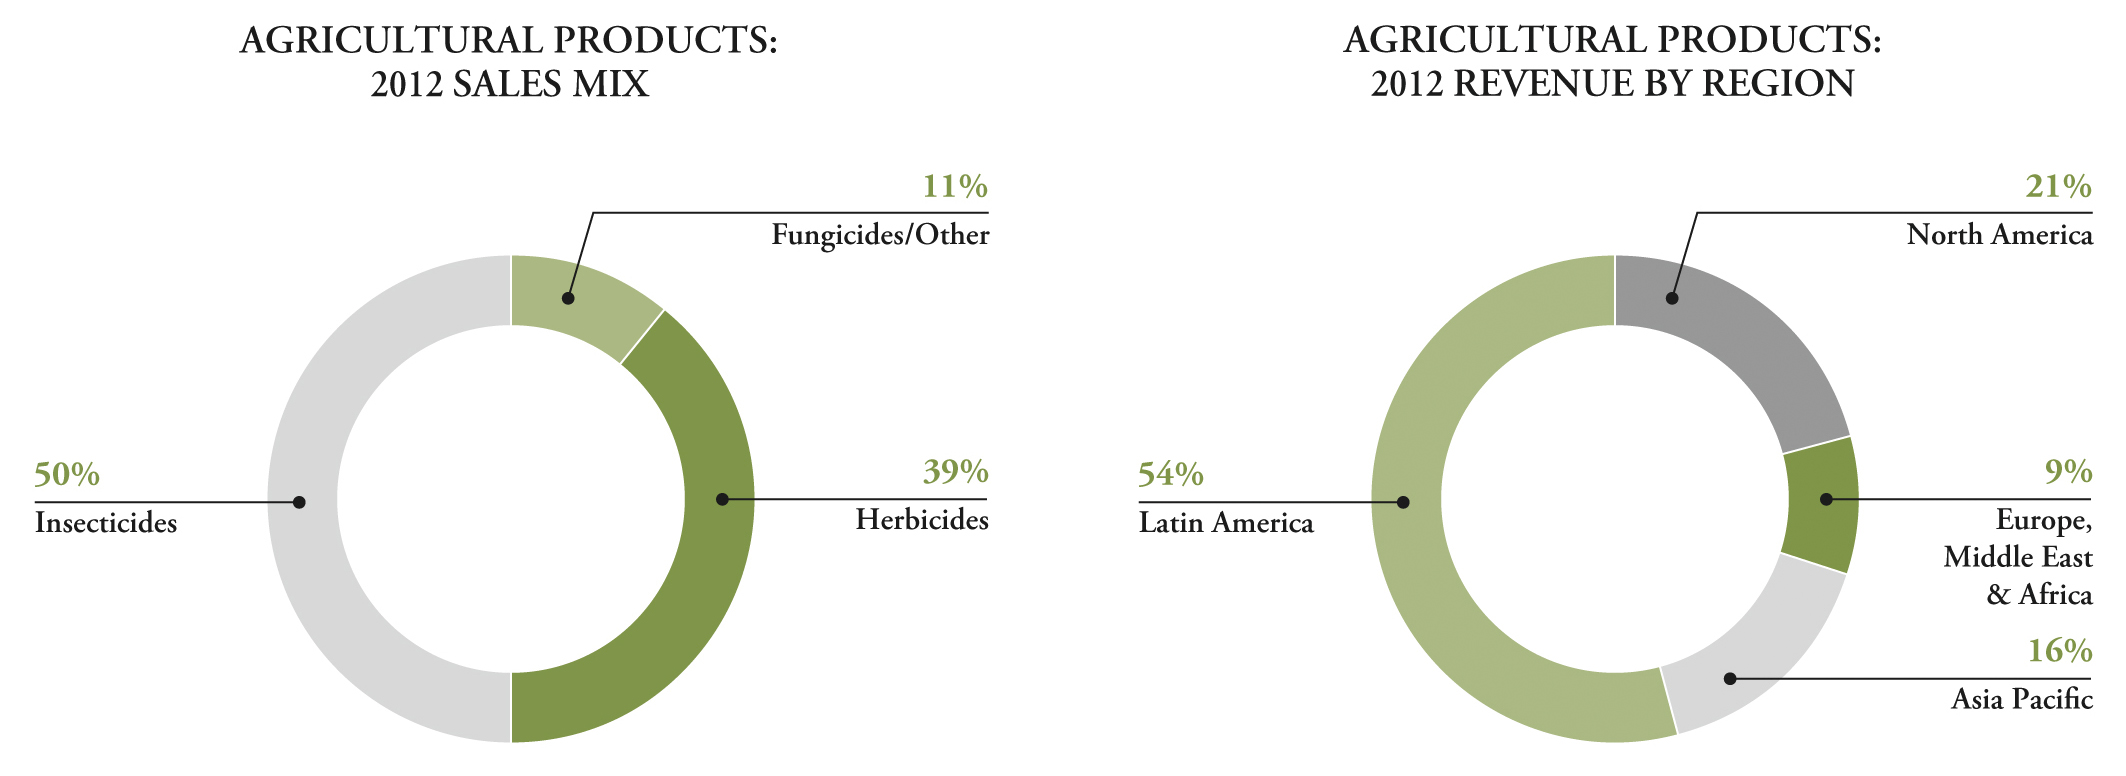
Agricultural Products' portfolio is comprised of three major pesticide categories: insecticides, herbicides and fungicides. Insecticides represent the largest product line in our Agricultural Products segment, which include our pyrethroid and carbamate chemistries, in which we maintain leading market positions based on revenues. Our herbicide portfolio primarily targets niche uses and controls a wide variety of difficult-to-control weeds. In 2011, we acquired iprodione and prochloraz fungicides for all agricultural uses outside of Europe. This acquisition strengthened our fungicide portfolio offerings as these two fungicides are highly effective, resistance management technologies that are used in more than 50 countries, primarily in the tree, fruit and vegetable markets.
We access key Western European markets through a Belgian-based pesticide distribution company, Belchim Crop Protection N.V., in which we have an ownership interest. We also have joint venture arrangements with Nufarm Limited in three countries in Eastern Europe, which allow us to capitalize on growth in this part of Europe. In North America, we access the market through several major national and regional distributors including our own sales and marketing organization in Canada. We access key Asian markets either through local independent distributors or our own sales and marketing organizations. In the large agricultural market of Brazil, we access the market in part through independent distributors and in part we sell directly to large growers through our own sales and marketing organization. We access other key South American markets through local independent distributors, our own sales and marketing organizations and our recently formed joint venture distributor in Argentina. Through these and other alliances, along with our own targeted marketing efforts, access to novel technologies and our innovation initiatives, we expect to maintain and enhance our access in key agricultural and non-crop markets and develop new products that will help us continue to compete effectively.
7
The following table summarizes the principal product chemistries in Agricultural Products and the principal uses of each chemistry:
|
|
Cotton
|
Corn
|
Rice
|
Cereals
|
Fruits,
Vegetables
|
Soybeans
|
Sugar
Cane
|
Tobacco
|
Oil
Seed
Rape
|
Professional
Pest
Control
Home &
Garden
|
||
|
Insecticides
|
Pyrethroids
|
permethrin
|
X
|
X
|
X
|
X
|
X
|
X
|
|
X
|
|
X
|
|
cypermethrin
|
X
|
X
|
X
|
X
|
X
|
X
|
|
|
X
|
|||
|
bifenthrin
|
X
|
X
|
X
|
X
|
X
|
X
|
X
|
X
|
X
|
X
|
||
|
zeta-cypermethrin
|
X
|
X
|
X
|
X
|
X
|
X
|
X
|
|
X
|
X
|
||
|
Carbamates
|
carbofuran
|
X
|
X
|
X
|
X
|
X
|
X
|
X
|
X
|
X
|
|
|
|
carbosulfan
|
X
|
X
|
X
|
X
|
X
|
X
|
X
|
|
|
|||
|
Other
|
cadusafos
|
|
|
|
|
X
|
|
X
|
X
|
|
|
|
|
Herbicides
|
carfentrazone-ethyl
|
X
|
X
|
X
|
X
|
X
|
X
|
X
|
X
|
X
|
X
|
|
|
clomazone
|
X
|
X
|
X
|
|
X
|
X
|
X
|
X
|
X
|
|
||
|
sulfentrazone
|
|
|
|
|
X
|
X
|
X
|
X
|
|
X
|
||
|
fluthiacet-methyl
|
X
|
|
|
|
X
|
|
|
|
|
|||
|
Fungicides
|
benalaxyl
|
|
|
|
|
X
|
|
|
|
|
||
|
iprodione
|
X
|
X
|
X
|
X
|
X
|
X
|
||||||
|
prochloraz
|
X
|
X
|
X
|
|||||||||
Industry Overview
The three principal categories of agricultural and non-crop chemicals are herbicides, representing approximately half of global industry revenue; insecticides, representing approximately a quarter of global industry revenue; and fungicides, representing most of the remaining portion of global industry revenue.
The agrochemicals industry is relatively consolidated. Leading crop protection companies, Syngenta AG, Bayer AG, Monsanto Company, BASF AG, The Dow Chemical Company and E. I. du Pont de Nemours and Company (DuPont), currently represent approximately 70 percent of the industry’s global sales. The next tier of agrochemical producers include FMC, Makhteshim-Agan Industries Ltd., Sumitomo Chemical Company Limited, Nufarm Limited, Arysta LifeScience Corporation, United Phosphorous Limited and Cheminova A/S. This tier employs various differentiated strategies and compete through unique technologies focusing on certain crops, markets and geographies, and competitive pricing based on low-cost manufacturing positions.
Growth
We plan to grow by obtaining new and approved uses for existing product lines and acquiring, accessing, developing, marketing, distributing and/or selling complementary chemistries and related technologies in order to enhance and expand our product portfolio and our capabilities to effectively service our target markets and customers.
Our growth efforts focus on developing environmentally compatible and sustainable solutions that can effectively increase farmers’ yields, provide cost-effective alternatives to older chemistries to which insects, weeds or disease may have developed resistance. We are committed to providing unique, differentiated products to our customers by acquiring and further developing technologies as well as by making selective investments in innovation to extend product life cycles. Our external growth efforts include product acquisitions, in-licensing of chemistries and technologies, and alliances to strengthen our market access or complement our existing product portfolio. In 2010, we successfully acquired the proprietary herbicide fluthiacet-methyl which has an excellent fit in our focus market segments and is particularly effective on many tough-to-control weeds that have developed resistance to glyphosate. In 2011, we entered into a joint venture in Argentina to accelerate growth and strengthen our market access in the second largest crop protection market in Latin America. Also in 2011 we acquired Rovral® iprodione and Sportak® prochloraz fungicides for agricultural use outside of Europe. In 2012, we signed a perpetual, global licensing agreement, along with distribution and services agreements with GAT Microencapsulation AG covering a range of advanced crop protection products and proprietary formulation technologies. We have continued to enter into a range of development and distribution agreements with other companies that provide us access to new technologies and products which we can subsequently commercialize.
8
Specialty Chemicals
Financial Information (In Millions)

Overview
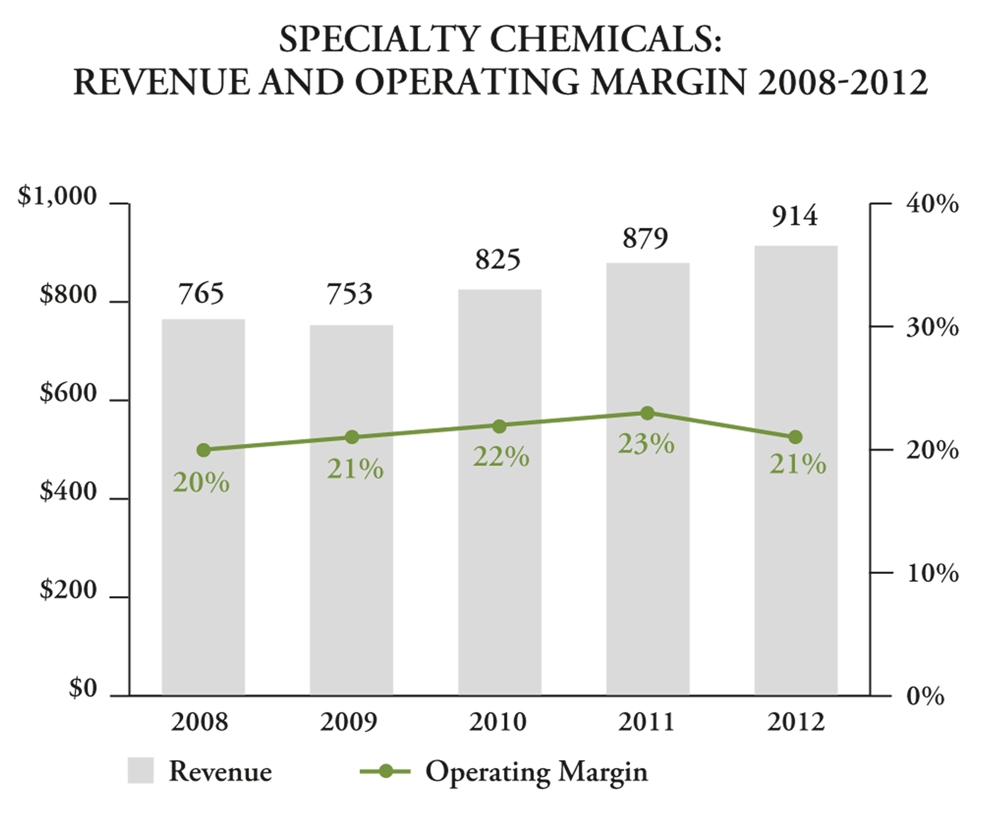
Our Specialty Chemicals segment, which represents
24 percent
of our
2012
consolidated revenues, is focused on high-performance food ingredients, pharmaceutical excipients, biomedical technologies and lithium products. The significant majority of Specialty Chemicals sales are to customers in non-cyclical end markets. We believe that our future growth in this segment will continue to be based on the value-added performance capabilities of these products and our research and development capabilities, as well as on the alliances and the close working relationships we have developed with key global customers. The food ingredients area in particular is a focus for external growth, and our intent is to broaden our product line and expand our participation in RDEs through acquisitions, joint ventures, and alliances.
Products and Markets
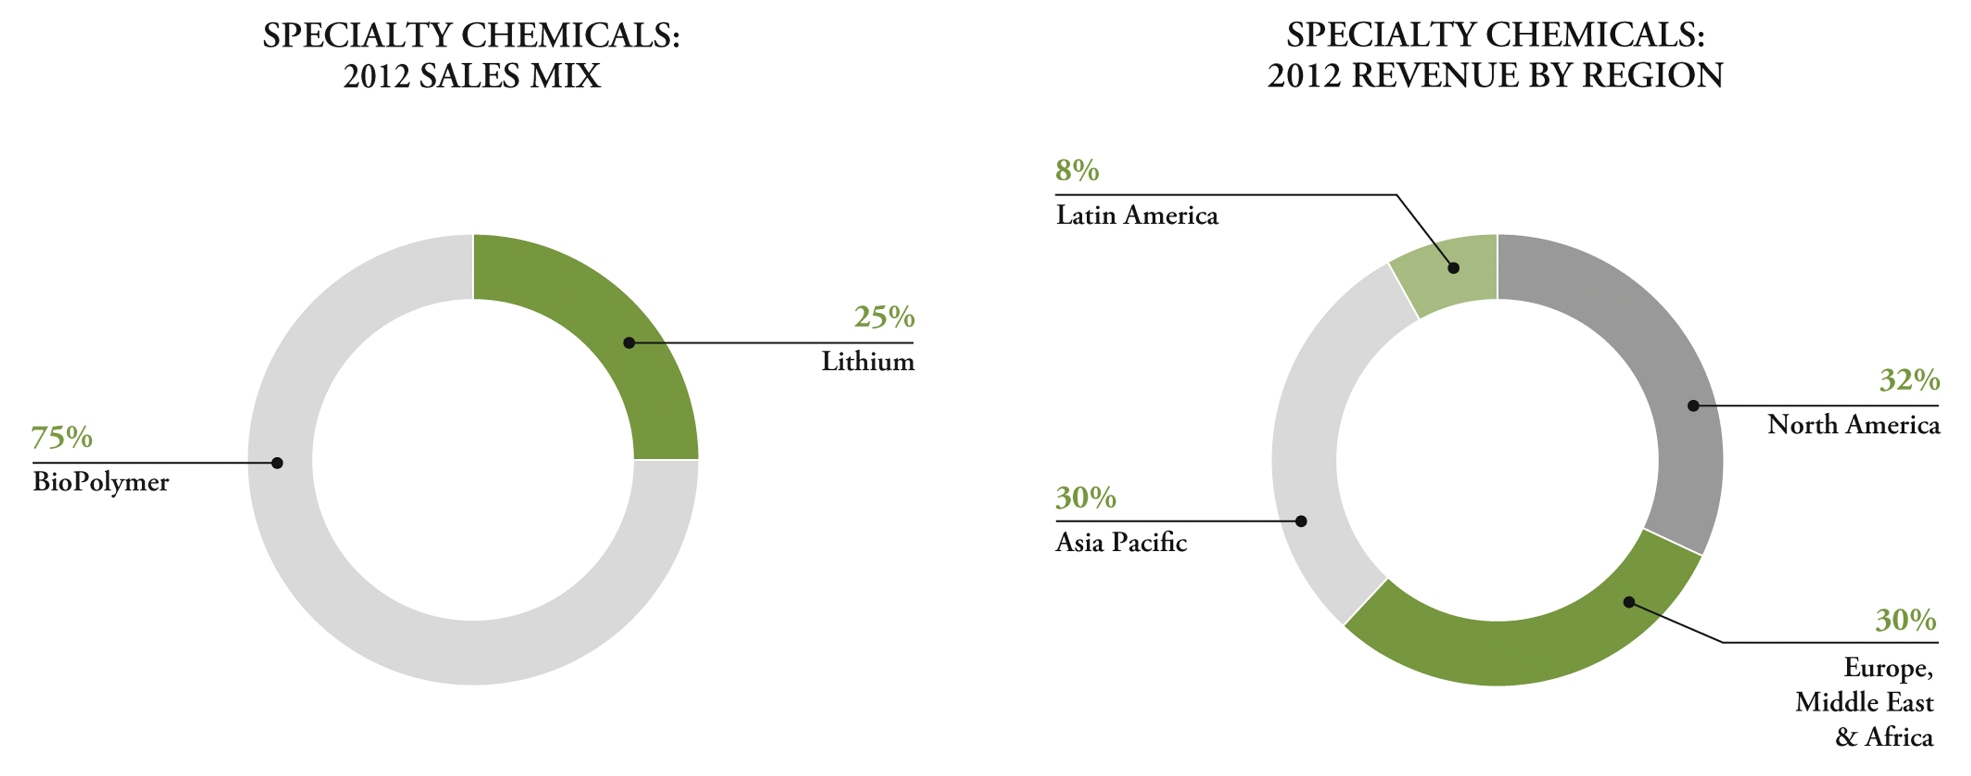
BioPolymer
BioPolymer is organized around the food and pharmaceutical markets. Our product offerings into the food markets principally provide texture, structure and physical stability ("TSPS") to thicken and stabilize certain food products. Our formulation ingredients serving the pharmaceutical industry function as binders, disintegrants, suspending agents, and control release compounds for the production of both solid and liquid pharmaceutical products.
9
BioPolymer is a supplier of microcrystalline cellulose ("MCC"), carrageenan, alginates, natural colorants and pectin — naturally-derived ingredients that have high value-added applications in the production of food, pharmaceutical and other specialty consumer and industrial products. MCC, processed from specialty grades of renewable hardwood and softwood pulp, provides binding and disintegrant properties for dry tablets and capsules and has unique functionality that improves the texture and stability of many food products. Carrageenan and alginates, both processed from natural seaweed, are used in a wide variety of food, pharmaceutical and oral care applications. In the fourth quarter of 2011 we acquired South Pole Biogroup Ltda., a Chilean-based natural color and specialty nutrition ingredients manufacturer and in the second quarter of 2012 we acquired Phytone Ltd., a natural colors producer based in the United Kingdom. With the completion of these acquisitions we have further expanded our portfolio of naturally sourced specialty products used in the food, beverage, personal care, nutrition and pharmaceutical markets. Also in the third quarter of 2012 we entered into the pectin market, through the acquisition of certain assets of Pectine Italia S.p.A, expanding our portfolio of hydrocolloid texturants and stabilizers. Additionally, we are developing technology platforms within biomedical markets to provide ultrapure biopolymers and application know-how for biomedical devices.
The following chart summarizes the markets for BioPolymer’s products and our chemistries in each market:
|
|
|
Microcrystalline
cellulose
|
Carrageenan
|
Alginates
|
Natural Colorants
|
Pectin
|
Other
|
|
Food
|
Beverage
|
X
|
X
|
X
|
X
|
X
|
|
|
Dairy
|
X
|
X
|
X
|
X
|
X
|
|
|
|
Convenience foods
|
X
|
X
|
X
|
X
|
X
|
X
|
|
|
Meat and poultry
|
|
X
|
X
|
|
|||
|
Pet food and other
|
X
|
X
|
X
|
|
|||
|
|
|||||||
|
Pharmaceutical
|
Tablet binding and coating
|
X
|
X
|
X
|
X
|
||
|
Anti-reflux
|
|
|
X
|
|
|||
|
Liquid suspension
|
X
|
X
|
|
|
|||
|
Oral care
|
|
X
|
|
|
|||
|
Cosmetic care
|
X
|
X
|
X
|
X
|
|||
|
Oral dose forms
|
X
|
X
|
X
|
X
|
|||
|
Biomedical
|
|
|
X
|
X
|
|||
Lithium
Lithium is a vertically-integrated business, based on both inorganic and organic lithium chemistries. While lithium is sold into a variety of end-markets, we have focused our strategy on energy storage, specialty polymers, grease and pharmaceuticals.
The electrochemical properties of lithium make it an ideal material for portable energy storage in high performance applications, including smart phones, tablets, laptop computers, military and aerospace devices and vehicles and other next-generation technologies. Lithium is also a critical element in advanced batteries for use in hybrid electric, plug-in hybrids and all-electric vehicles.
Organolithium products are highly valued in the specialty polymer markets as initiators in the production of synthetic rubbers and elastomers. Organolithiums are also sold to fine chemical and pharmaceutical customers who use lithium's unique chemical properties to synthesize high value-added products.
10
The following chart summarizes the major markets for various lithium products:
|
|
Primary
Inorganics
|
|
Specialty
Inorganics
|
|
Lithium
Metal/Ion Battery
Materials
|
|
Organometallics
|
|
Intermediates
|
|
Fine Chemicals
Pharmaceuticals, agricultural products
|
X
|
|
|
|
X
|
|
X
|
|
X
|
|
Polymers
Elastomers, synthetic rubbers, industrial coatings
|
|
|
|
|
|
|
X
|
|
X
|
|
Energy Storage
Non-rechargeable batteries, lithium ion
batteries (rechargeable)
|
X
|
|
X
|
|
X
|
|
|
|
|
|
Other
Glass & ceramics, construction, greases
& lubricants, air treatment, pool water treatment
|
X
|
|
X
|
|
|
|
|
|
|
Industry Overview
Food Ingredients
The industry is dispersed geographically, with the majority of our sales in Europe, North America and Asia. The food ingredients market is comprised of a large number of suppliers due to the broad spectrum of chemistries employed. Segment leadership, global position and investment in technology are key factors to sustaining profitability. The top suppliers of TSPS ingredients include FMC, DuPont, J.M. Huber Corporation, Kerry Group plc and Cargill Incorporated.
Pharmaceutical Ingredients
Competitors tend to be grouped by chemistry. Our principal MCC competitors include J. Rettenmaier & Sôhne GmbH, Ming Tai Chemical Co., Ltd., Asahi Kasei Corporation and Blanver Farmoquimica Ltda. While pricing pressure from low cost producers is a common competitive dynamic, companies like us offset that pressure by providing the most reliable and broadest range of products and services. Our customers are pharmaceutical firms who depend upon reliable therapeutic performance of their drug products.
Lithium
The markets for lithium chemicals are global with significant demand growth occurring outside the U.S. in Japan, China and South Korea. There are three key producers of lithium compounds: FMC, Rockwood Holdings, Inc., and Sociedad Química y Minera de Chile S.A. FMC and Rockwood are the primary producers of lithium specialties. We expect a few new producers may add primary inorganics capacity to the global lithium supply in the future.
11
Industrial Chemicals
Financial Information (In millions)

Overview
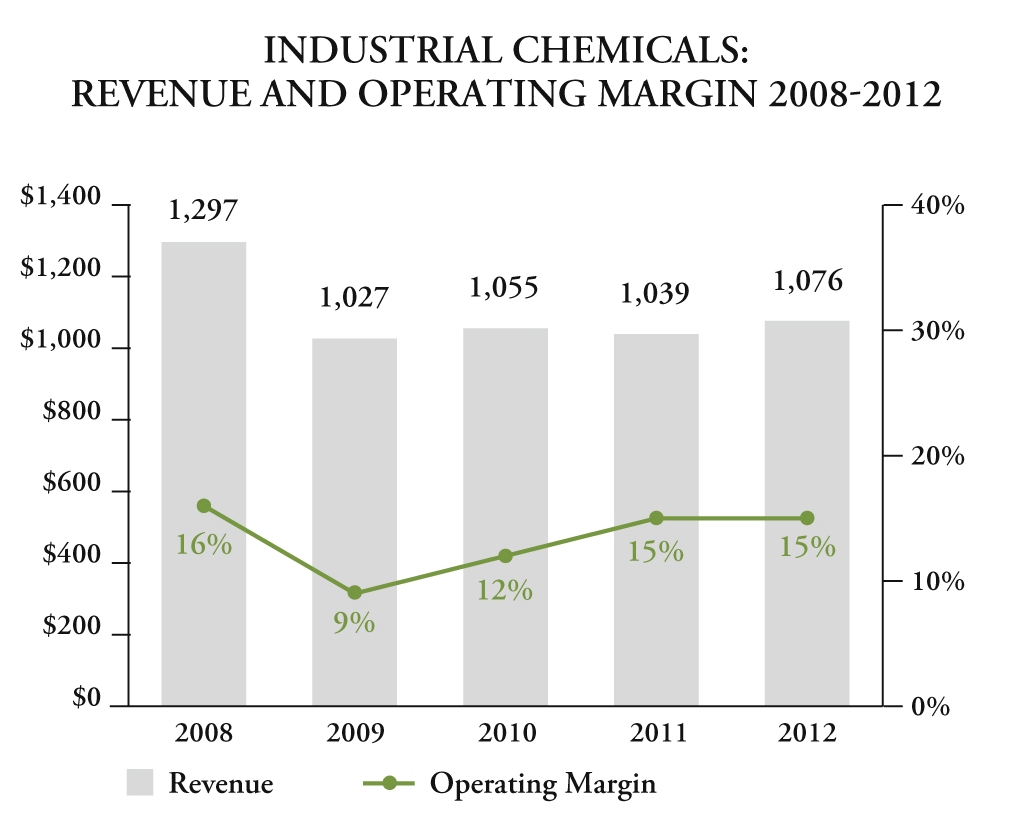
Our Industrial Chemicals segment, which represents
29 percent
of our
2012
consolidated revenues, primarily participates in the following markets: alkali, peroxygens and environmental solutions. We have low-cost positions in high volume inorganic chemicals including soda ash and hydrogen peroxide, complemented by high value, niche positions in specialty alkali and specialty peroxygens product lines. We process and sell refined inorganic products that are sought by customers for their critical reactivity or specific functionality in markets such as glass, detergents, chemicals and pulp and paper.
Products and Markets
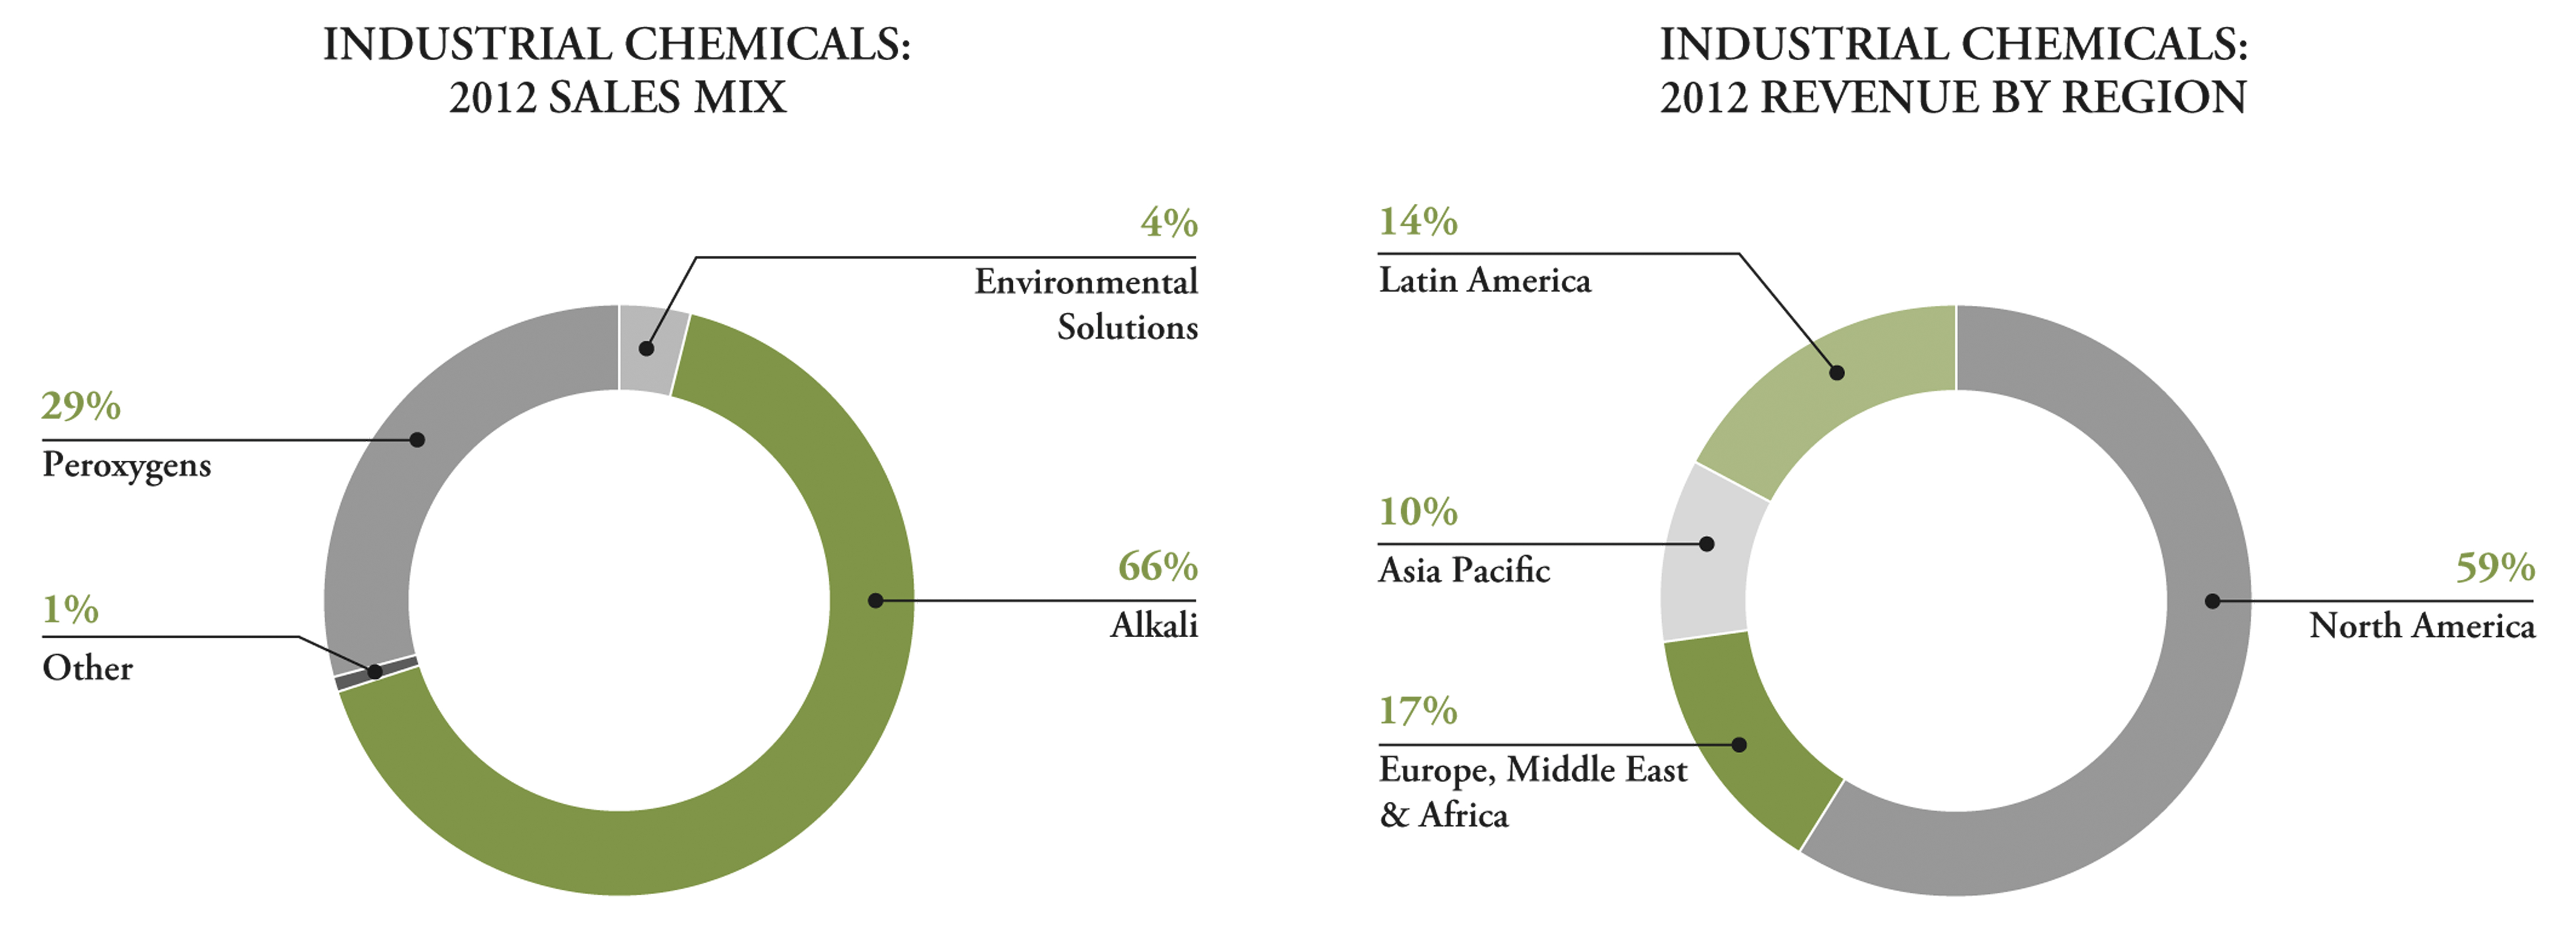
Alkali
Our Alkali Chemicals division produces natural soda ash. Soda ash is used by manufacturers in glass, chemical processing and detergent industries. To lesser degrees, we also produce sodium bicarbonate, caustic soda and sodium sesquicarbonate. The majority of our alkali sales are manufactured by and sold through FMC Wyoming Corporation, which we manage as an integral part of our alkali business and in which we own shares representing an 87.5 percent economic interest, with the remaining shares held by two Japanese companies.
12
Peroxygens
Our primary peroxygen product is hydrogen peroxide which comprises 60 percent of our peroxygen sales. Hydrogen peroxide is sold into the pulp and paper, chemical processing, environmental, electronics and food industries. We also produce specialty peroxygens which include persulfate salts and peracetic acid. Persulfates are primarily sold to polymer, energy recovery, printed circuit board, hair care and soil remediation markets. Peracetic acid is predominantly supplied to the food industry for biocidal applications.
Environmental Solutions
Our Environmental Solutions Division, which was created in 2012, provides proprietary products and specialty solutions that prevent or remediate contamination of air, soil and water. As a global leader, we combine best-in-class technologies with proven best practices to help clients better manage the issues of cost and compliance in the most challenging and complex environments. Our environmental solutions product portfolio integrates our existing proprietary products and specialty solutions which include chemistries that utilize hydrogen peroxide and soda ash.
Industry Overview
Industrial Chemicals serves a diverse group of markets, from economically-sensitive industrial sectors to technology-intensive specialty markets. Our product offerings are primarily inorganic and are generally commodities that, in many cases, have few cost-effective substitutes. Growth is typically a function of industrial production in developed economies and a function of the rate of industrialization in developing economies.
Alkali
Natural soda ash is typically produced from trona ore through mining and chemical processing. Soda ash may also be produced synthetically, but requires significantly more energy and produces large quantities of waste by-products, making it much less cost-effective than natural soda ash production. Due to the processing cost advantages of mining trona and the large natural reserves of trona ore in the U.S., particularly in the Green River Basin of Wyoming, all U.S. soda ash is naturally produced. By contrast, due to a lack of trona ore, the majority of the soda ash that is manufactured in the rest of the world is produced synthetically. Other U.S. producers are OCI Chemical Corporation, Church & Dwight, Solvay S.A., The General Chemical Group Inc. (in which a majority stake is owned by Tata Chemicals Limited), and Nirma Limited.
Peroxygens
The pulp and paper industry represents approximately 60 percent of demand for hydrogen peroxide in North America and Europe. In these markets, hydrogen peroxide is used as an environmentally friendly bleaching agent to brighten chemical, mechanical and recycled pulps as well as to treat a wide range of mill pollutants in the waste stream. The North American and European paper markets are mature, and new investment in pulp and paper capacity is largely focused in Asia and South America. The other North American and European hydrogen peroxide producers are EKA, a wholly owned subsidiary of Akzo Nobel N.V, Arkema Inc., Evonik Industries AG, Kemira Ovj, and Solvay S.A.
Environmental Solutions
This industry serves the growing pollution prevention and remediation market. We are focused on a $3 billion market space that is growing, driven by regulations, technology substitutions and rapidly developing economies.
Source and Availability of Raw Materials
Our raw material requirements vary by business segment and primarily include mineral-related natural resources (trona ore and lithium brines), processed chemicals, seaweed, specialty wood pulps and energy sources such as gas, coal, oil and electricity. During 2012 no individual raw material represented more than five percent of our total raw material purchases. Additionally, during 2012 no significant difficulties were encountered in obtaining adequate supplies of our raw materials.
We extract ores used in Industrial Chemicals’ manufacturing processes from mines (e.g. trona ore in North America). Raw materials used by Specialty Chemicals include lithium brines, various types of seaweed and natural colorant raw materials that are sourced on a global basis, and specialty pulps which are purchased from selected global producers. Raw materials used by Agricultural Products, primarily processed chemicals, are obtained from a variety of suppliers worldwide.
13
Patents
We own a number of U.S. and foreign patents, trademarks and licenses that are cumulatively important to our business. We do not believe that the loss of any individual or combination of related patents, trademarks or licenses would have a material adverse effect on the overall business of FMC. The duration of our patents depends on their respective jurisdictions. Their expiration dates range through 2032.
Seasonality
The seasonal nature of the crop protection market and the geographic spread of the Agricultural Products business can result in significant variations in quarterly earnings among geographic locations. Agricultural products sold into the northern hemisphere (North America, Europe and parts of Asia) serve seasonal agricultural markets from March through September, generally resulting in earnings in the first, second and third quarters. Markets in the southern hemisphere (Latin America and parts of the Asia Pacific region, including Australia) are served from July through February, generally resulting in earnings in the third, fourth and first quarters. The remainder of our business is generally not subject to significant seasonal fluctuations.
Competition
We have a number one or number two market position in many of our product lines, based on revenue, either globally or in North America, largely as a result of our product offerings, proprietary technologies and our position as a low-cost producer. The following product lines accounted for the majority of our
2012
consolidated revenue. Market positions are based on the most recently available revenue data.
|
Agricultural Products
|
|
Specialty Chemicals
|
|
Industrial Chemicals
|
||||||
|
Product Line
|
|
Market Position
|
|
Product Line
|
|
Market Position
|
|
Product Line
|
|
Market Position
|
|
Pyrethroids
|
|
#2 in North America
|
|
Microcrystalline cellulose
|
|
#1 globally
|
|
Soda ash
|
|
#1 in North America
|
|
Carbofuran
|
|
#1 globally
|
|
Carrageenan
|
|
#1 globally
|
|
Persulfates
|
|
#1 globally
|
|
|
|
Alginates
|
|
#1 globally
|
|
|
||||
|
|
|
Lithium
|
|
#2 globally
|
|
|
||||
We encounter substantial competition in each of our three business segments. We market our products through our own sales organization and through alliance partners, independent distributors and sales representatives. The number of our principal competitors varies from segment to segment. In general, we compete by operating in a cost-efficient manner and by leveraging our industry experience to provide advanced technology, high product quality and reliability, and quality customer and technical service.
Our Agricultural Products segment competes primarily in the global chemical crop protection market for insecticides, herbicides and fungicides. Industry products include crop protection chemicals and, for certain major competitors, genetically engineered (crop biotechnology) products. Competition from generic agrochemical producers is significant as a number of key product patents held industry-wide have expired in the last decade. In general, we compete as an innovator by focusing on product development, including novel formulations, proprietary mixes, and advanced delivery systems and by acquiring or licensing (mostly) proprietary chemistries or technologies that complement our product and geographic focus. We also differentiate ourselves by our global cost-competitiveness via our manufacturing strategies, establishing effective product stewardship programs and developing strategic alliances that strengthen market access in key countries and regions.
Our Specialty Chemicals segment has significant positions in markets that include alginate, carrageenan, microcrystalline cellulose and lithium-based products. We compete on the basis of product differentiation, market applications expertise, customer service and price. BioPolymer competes with both direct suppliers of cellulose and seaweed extract as well as suppliers of other hydrocolloids, which may provide similar functionality in specific applications. In microcrystalline cellulose, competitors are typically smaller than us, while in seaweed extracts (carrageenan and alginates), we compete with other broad-based chemical companies. We and each of our two most significant competitors in lithium extract the element from naturally occurring lithium-rich brines located in the Andes Mountains of Argentina and Chile, which are believed to be the world’s most significant and lowest cost sources of lithium.
Our Industrial Chemicals segment serves the soda ash markets worldwide, the peroxygens markets predominantly in North America and Europe and the site remediation market in the United States. In North America, our soda ash business competes with four domestic producers of natural soda ash, three of which operate in the vicinity of our mine and processing facilities
14
near Green River, Wyoming. Outside of the U.S., Canada, Europe and South Africa, we sell soda ash mainly through the American Natural Soda Ash Corporation ("ANSAC"). Internationally, our natural soda ash competes with synthetic soda ash manufactured by numerous producers, ranging from integrated multinational companies to smaller regional companies. We maintain a leading position in the North American market for hydrogen peroxide, particularly in specialty segments. There are currently four other firms competing in the hydrogen peroxide market in North America but most of them focus primarily on the commodity pulp and paper segment. The primary competitive factor affecting the sales of soda ash and hydrogen peroxide to commodity markets is price. We seek to maintain our competitive position by employing low cost processing technology. We possess strong cost and market positions in our European peroxygens business. In each of these markets, we face significant competition from a range of multinational and regional chemical producers. We are the only producer of persulfates in the Americas but face competition from imports from Germany, Japan, Taiwan and India. In the European persulfates market, we compete with two domestic firms as well as imports from China, Taiwan and India. In both regions, Chinese imports are constrained by the presence of anti-dumping duties.
Research and Development Expense
We perform research and development in all of our segments with the majority of our efforts focused in the Agricultural Products segment. The development efforts in the Agricultural Products segment focus on developing environmentally sound solutions and new product formulations that cost-effectively increase farmers’ yields and provide alternatives to existing and new chemistries. Our research and development expenses in the last three years are set forth below:
|
|
Year Ended December 31,
|
||||||||||
|
(in Millions)
|
2012
|
2011
|
2010
|
||||||||
|
Agricultural Products
|
$
|
95.4
|
|
$
|
84.3
|
|
$
|
80.9
|
|
||
|
Specialty Chemicals
|
14.9
|
|
14.2
|
|
13.4
|
|
|||||
|
Industrial Chemicals
|
7.5
|
|
6.7
|
|
6.2
|
|
|||||
|
Total
|
$
|
117.8
|
|
$
|
105.2
|
|
$
|
100.5
|
|
||
Environmental Laws and Regulations
A discussion of environmental related factors can be found in Item 7 “Management’s Discussion and Analysis of Financial Condition and Results of Operations” and in Note 10 “Environmental Obligations” in the notes to our consolidated financial statements included in this Form 10-K.
Employees
We employ approximately 5,700 people, with about 2,700 people in our domestic operations and 3,000 people in our foreign operations. Approximately 31 percent of our U.S.-based and 32 percent of our foreign-based employees, respectively, are represented by collective bargaining agreements. We have successfully concluded most of our recent contract negotiations without any material work stoppages. In those rare instances where a work stoppage has occurred, there has been no material effect on consolidated sales and earnings. We cannot predict, however, the outcome of future contract negotiations. In 2013, 10 collective-bargaining agreements will expire. These contracts affect about two percent of our U.S.-based employees and 24 percent of foreign-based employees.
Securities and Exchange Commission Filings
Securities and Exchange Commission (SEC) filings are available free of charge on our website, www.fmc.com. Our annual report on Form 10-K, quarterly reports on Form 10-Q, current reports on Form 8-K and amendments to those reports are posted as soon as practicable after we furnish such materials to the SEC.
In accordance with New York Stock Exchange (NYSE) rules, on May 11, 2012, we filed a certification signed by our Chief Executive Officer (CEO) that, as of the date of the certification, he was unaware of any violation by FMC of the NYSE’s corporate governance listing standards. We also file with each Form 10-Q and our Form 10-K certifications by the CEO and Chief Financial Officer under sections 302 and 906 of the Sarbanes-Oxley Act of 2002.
15
|
ITEM 1A.
|
RISK FACTORS
|
Among the factors that could have an impact on our ability to achieve operating results and meet our other goals are:
Industry Risks:
Pricing and volumes in our markets are sensitive to a number of industry specific and global issues and events including:
|
•
|
Capacity utilization- Our businesses are sensitive to industry capacity utilization. As a result, pricing tends to fluctuate when capacity utilization changes occur within our industry.
|
|
•
|
Competition- All of our segments face competition, which could affect our ability to maintain or raise prices, successfully enter certain markets or retain our market position. Our Industrial Chemicals - Alkali division from time to time experiences competitive pricing pressures from our Chinese competition who will price their products at or near their manufacturing costs in an attempt to gain control of or reacquire short-term market position. Additionally, in Agricultural Products, competition includes not only generic suppliers of the same pesticidal active ingredient, but also alternative proprietary pesticide chemistries, crop protection technologies that are bred into or applied onto seeds, and intellectual property regarding production or use of pesticides. Increased generic presence in agricultural chemical markets has been driven by the number of significant product patents and product data protections that have expired in the last decade, and this trend is expected to continue.
|
|
•
|
Changes in our customer base- Our customer base has the potential to change, especially when long-term supply contracts are renegotiated. Our Industrial Chemicals and Specialty Chemicals businesses are most sensitive to this risk.
|
|
•
|
Climatic conditions- Our Agricultural Products markets are affected by climatic conditions, which could adversely impact crop pricing and pest infestations. Adverse weather conditions can impact our ability to extract lithium efficiently from our lithium reserves in Argentina. The nature of these events makes them difficult to predict.
|
|
•
|
Changing regulatory environment- Changes in the regulatory environment, particularly in the United States, Brazil, China and the European Union, could adversely impact our ability to continue selling certain products in our domestic and foreign markets or could increase the cost of doing so. Our Agricultural Products business is most sensitive to this general regulatory risk given the need to obtain and maintain pesticide registrations in every country in which we sell our products. Compliance with changing laws and regulations may involve significant costs or capital expenditures or require changes in business practice that could result in reduced profitability. In the European Union, the regulatory risk specifically includes chemicals regulation known as REACH (Registration, Evaluation, and Authorization of Chemicals), which affects each of our business segments to varying degrees. The fundamental principle behind the REACH regulation is that manufacturers must verify that their chemicals can be marketed safely through a special registration system
.
|
|
•
|
FDA regulation - Some of our manufacturing processes and facilities, as well as some of our customers, are subjected to regulation by the FDA or similar foreign agencies. Regulatory requirements of the FDA are complex, and any failure to comply with them including as a result of contamination due to acts of sabotage could subject us and/or our customers to fines, injunctions, civil penalties, lawsuits, recall or seizure of products, total or partial suspension of production, denial of government approvals, withdrawal of marketing approvals and criminal prosecution. Any of these actions could adversely impact our net sales, undermine goodwill established with our customers, damage commercial prospects for our products and materially adversely affect our results of operations.
|
|
•
|
Climate change regulation- Changes in the regulation of greenhouse gases, depending on their nature and scope, could subject our manufacturing operations, particularly certain Industrial Chemicals operations in the United States, to significant additional costs or limits on operations.
|
|
•
|
Raw materials and energy costs- Our operating results are significantly affected by the cost of raw materials and energy, including natural gas. We may not be able to raise prices or improve productivity sufficiently to offset future increases in the costs of raw materials or energy.
|
|
•
|
Supply arrangements and production hazards- Certain raw materials are critical to our production process, especially in our Agricultural Products and Specialty Chemicals segments. While we have made supply arrangements to meet planned operating requirements, an inability to obtain the critical raw materials or execute under the contract manufacturing arrangements would adversely impact our ability to produce certain products. We increasingly source critical intermediates and finished products from a number of suppliers, especially in Agricultural Products. An inability to obtain these products or execute under the contract sourcing arrangements would adversely impact our ability to sell products. Our facilities and those of our key contract manufacturers are subject to operating hazards, which may disrupt our business and could also negatively impact the Company's reputation.
|
16
|
•
|
Economic and political change- Our business could be adversely affected by economic and political changes in the markets where we compete including: inflation rates, recessions, trade restrictions, foreign ownership restrictions and economic embargoes imposed by the United States or any of the foreign countries in which we do business; changes in laws, taxation, and regulations and the interpretation and application of these laws, taxes, and regulations; restrictions imposed by foreign governments through exchange controls or taxation policy; other governmental actions; and other external factors over which we have no control. In Argentina, continued tightening of foreign exchange controls along with deteriorating economic and financial conditions could adversely affect our business.
|
|
•
|
Foreign operations- The Company's foreign operations can be adversely impacted by nationalization or expropriation of property, undeveloped property rights, and legal systems or political instability. Economic and political conditions within foreign jurisdictions or strained relations between countries can cause fluctuations in demand, price volatility, supply disruptions, or loss of property. Inflation as a result of economic and political conditions especially in Argentina could adversely affect our operations and have unfavorable impact to our financial results.
|
|
•
|
Market access risk- Our results may be affected by changes in distribution channels, which could impact our ability to access the market. In certain Agricultural Products segments, we access the market through joint ventures in which we do not have majority control. Where we do not have a strong product portfolio or market access relationships, we may be vulnerable to changes in the distribution model or influence of competitors with stronger product portfolios.
|
|
•
|
Business disruptions- Our business could be adversely affected by information technology systems outages, disruption in our supply chain or manufacturing and distribution operations, or other sudden disruption in business operations beyond our control as a result of events such as acts of sabotage, terrorism or war, civil or political unrest, natural disasters, pandemic situations and large scale power outages.
|
|
•
|
Information technology security risks - As with all Enterprise Information systems, our information technology systems could be penetrated by outside parties intent on extracting information, corrupting information, or disrupting business processes. Our systems have in the past been, and likely will in the future be, subject to unauthorized access attempts. Unauthorized access could disrupt our business operations and could result in failures or interruptions in our computer systems and in the loss of assets and could have a material adverse effect on our business, financial condition or results of operations. In addition, breaches of our security measures or the accidental loss, inadvertent disclosure, or unapproved dissemination of proprietary information or sensitive or confidential information about us, our employees, our vendors, or our customers, could result in litigation and potential liability for us, damage our reputation, or otherwise harm our business, financial condition, or results of operations.
|
|
•
|
Operational Risks- The Company's manufacturing operations inherently entail hazards that require continuous oversight and control, such as leaks, ruptures, fire, explosions, toxic releases, mechanical failures, or vehicle accidents. If operational risks materialize, they could result in loss of life, damage to the environment, or loss of production, all of which could negatively impact the Company's ongoing operations, reputation, financial results, and cash flow.
|
|
•
|
Litigation and environmental risks- Current reserves relating to our ongoing litigation and environmental liabilities may ultimately prove to be inadequate.
|
|
•
|
Hazardous materials- We manufacture and transport certain materials that are inherently hazardous due to their toxic or volatile nature. While we take precautions to handle and transport these materials in a safe manner, if they are mishandled or released into the environment, they could cause property damage or personal injury claims against us.
|
|
•
|
Environmental Compliance- The Company is subject to extensive federal, state, local, and foreign environmental and safety laws and regulations concerning, among other things, emissions in the air, discharges to land and water, and the generation, handling, treatment, and disposal of hazardous waste and other materials. The Company takes its environmental responsibilities very seriously, but there is a risk of environmental impact inherent in its manufacturing operations and transportation of chemicals.
|
|
•
|
Inability to attract and retain key employees - The inability to recruit and retain key personnel or the unexpected loss of key personnel may adversely affect our operations. In addition, our future success depends in part on our ability to identify and develop talent to succeed senior management.
|
Technology Risks:
|
•
|
Our ability to compete successfully, particularly in Agricultural Products and Specialty Chemicals, depends in part upon our ability to maintain a superior technological capability and to continue to identify, develop and commercialize new and innovative, high value-added products for existing and future customers.
|
|
•
|
Failure to continue to make process improvements to reduce costs could impede our competitive position.
|
17
Financial Risks:
|
•
|
Further deterioration in the global economy and worldwide credit and foreign exchange markets could adversely affect our business. A worsening of global or regional economic conditions or financial markets could adversely affect our customers' ability to meet the terms of sale or our suppliers' ability to perform all their commitments to us. A slowdown in Brazilian economic growth or a deterioration of credit or foreign exchange markets could adversely affect customers, suppliers and our overall business there.
|
|
•
|
We are an international company and face foreign exchange rate risks in the normal course of our business. We are particularly sensitive to the euro, the Brazilian real and the Chinese yuan. To a lesser extent, we are sensitive to the Mexican peso, the Argentine peso, the British pound sterling and several Asian currencies, including the Japanese yen.
|
|
•
|
Our effective tax rate is favorably impacted by the fact that a portion of our earnings are taxed at more favorable rates in some jurisdictions outside the United States. Changes in tax laws or in their application with respect to matters such as transfer pricing, dividends from subsidiaries or restriction in tax relief allowed on intercompany debt could increase our effective tax rate and adversely affect our financial results.
|
|
•
|
We have significant investments in long-lived assets and continually review the carrying value of these assets for recoverability in light of changing market conditions and alternative product sourcing opportunities.
|
|
•
|
Obligations related to our pension and postretirement plans reflect certain assumptions. To the extent our plans' actual experience differs from these assumptions, our costs and funding obligations could increase or decrease significantly.
|
|
ITEM 1B.
|
UNRESOLVED STAFF COMMENTS
|
None.
|
ITEM 2.
|
PROPERTIES
|
FMC leases executive offices in Philadelphia, Pennsylvania and operates 33 manufacturing facilities and mines in 21 countries. Our major research and development facility is in Ewing, New Jersey.
Trona ore, used for soda ash production in Green River, Wyoming, is mined primarily from property held under long-term leases. We have long-term mineral rights to the Salar del Hombre Muerto lithium reserves in Argentina. A number of our chemical plants require the basic raw materials that are provided by these mines, without which other sources of raw materials would have to be obtained.
We believe our facilities are in good operating conditions. The number and location of our owned or leased production properties for continuing operations are:
|
United
States
|
Latin
America
&
Canada
|
Western
Europe
|
Asia-
Pacific
|
Total
|
|||||
|
Agricultural Products
|
2
|
1
|
—
|
3
|
6
|
||||
|
Specialty Chemicals
|
3
|
3
|
7
|
6
|
19
|
||||
|
Industrial Chemicals
|
3
|
1
|
4
|
—
|
8
|
||||
|
Total
|
8
|
5
|
11
|
9
|
33
|
||||
|
ITEM 3.
|
LEGAL PROCEEDINGS
|
Like hundreds of other industrial companies, we have been named as one of many defendants in asbestos-related personal injury litigation. Most of these cases allege personal injury or death resulting from exposure to asbestos in premises of FMC or to asbestos-containing components installed in machinery or equipment manufactured or sold by discontinued operations. The machinery and equipment businesses we owned or operated did not fabricate the asbestos-containing component parts at issue in the litigation, and to this day, neither the U.S. Occupational Safety and Health Administration nor the Environmental Protection Agency has banned the use of these components. Further, the asbestos-containing parts for this machinery and equipment were accessible only at the time of infrequent repair and maintenance. A few jurisdictions have permitted claims to proceed against equipment manufacturers relating to insulation installed by other companies on such machinery and equipment. We believe that, overall, the claims against FMC are without merit.
18
As of December 31, 2012, there were appr
oximately 12,100 premises and product asbestos claims pending against FMC in several jurisdictions. Since the 1980s, approximately 101,000 asbestos claims against FMC have been discharged, the overwhelming majority of which have been dismissed without any payment to the claimant. Settlements by us with claimants have totaled approximately $52 million.
We intend to continue managing these asbestos-related cases in accordance with our historical experience. We have established a reserve for this litigation within our discontinued operations and believe that any exposure of a loss in excess of the established reserve cannot be reasonably estimated. Our experience has been that the overall trends in terms of the rate of filing of asbestos-related claims with respect to all potential defendants has changed over time, and that filing rates as to us in particular have varied significantly over the last several years. We are a peripheral defendant - that is, we have never manufactured asbestos or asbestos-containing components. As a result, claim filing rates against us have yet to form a predictable pattern, and we are unable to project a reasonably accurate future filing rate and thus, we are presently unable to reasonably estimate our asbestos liability with respect to claims that may be filed in the future.
See Note 1 “Principal Accounting Policies and Related Financial Information—Environmental Obligations,” Note 10 “Environmental” and Note 18 “Commitments, Guarantees and Contingent Liabilities” in the notes to our consolidated financial statements included in this Form 10-K, the content of which are incorporated by reference to this Item 3.
|
ITEM 4.
|
MINE SAFETY DISCLOSURES
|
Information regarding mine safety and other regulatory actions at our mine in Green River, Wyoming is included in Exhibit 95 to this Form 10-K.
|
ITEM 5.
|
MARKET FOR THE REGISTRANT'S COMMON EQUITY, RELATED STOCKHOLDERS MATTERS AND ISSUER PURCHASES OF EQUITY SECURITIES
|
FMC common stock of $0.10 par value is traded on the New York Stock Exchange and the Chicago Stock Exchange (Symbol: FMC). There were 3,520 registered common stockholders as of
December 31, 2012
. Presented below are the
2012
and
2011
quarterly summaries of the high and low prices of the company’s common stock.
|
|
2012
|
2011
|
|||||||||||||||||||||||||||||
|
Common stock prices:
|
First
Quarter
|
Second
Quarter
|
Third
Quarter
|
Fourth
Quarter
|
First
Quarter
|
Second
Quarter
|
Third
Quarter
|
Fourth
Quarter
|
|||||||||||||||||||||||
|
High
|
$
|
53.14
|
|
$
|
56.45
|
|
$
|
59.41
|
|
$
|
59.08
|
|
$
|
42.81
|
|
$
|
44.64
|
|
$
|
46.50
|
|
$
|
44.00
|
|
|||||||
|
Low
|
$
|
42.93
|
|
$
|
48.00
|
|
$
|
50.45
|
|
$
|
50.76
|
|
$
|
36.29
|
|
$
|
38.40
|
|
$
|
33.29
|
|
$
|
31.91
|
|
|||||||
Our Board of Directors has declared regular quarterly dividends since 2006; however, any future payment of dividends will depend on our financial condition, results of operations, conditions in the financial markets and such other factors as are deemed relevant by our Board of Directors. Total cash dividends of
$47.8 million
,
$41.2 million
and
$36.4 million
were paid in
2012
,
2011
and
2010
, respectively.
FMC’s annual meeting of stockholders will be held at 2:00 p.m. on Tuesday, April 23, 2013, at the Chemical Heritage Foundation, 315 Chestnut Street, Ullyot Hall, Philadelphia, PA 19106. Notice of the meeting, together with proxy materials, will be mailed approximately 30 days prior to the meeting to stockholders of record as of February 28, 2013.
Transfer Agent and Registrar of Stock:
|
Wells Fargo Bank, N.A.
|
||
|
Shareowner Services
|
||
|
161 North Concord Exchange
|
or
|
P.O. Box 64854
|
|
South St. Paul, Minnesota 55075-1139
|
St. Paul, Minnesota 55164-0856
|
|
|
Phone: 1-800-468-9716
|
||
|
(651-450-4064 local and outside the U.S.)
|
||
|
www.wellsfargo.com/shareownerservices
|
||
19
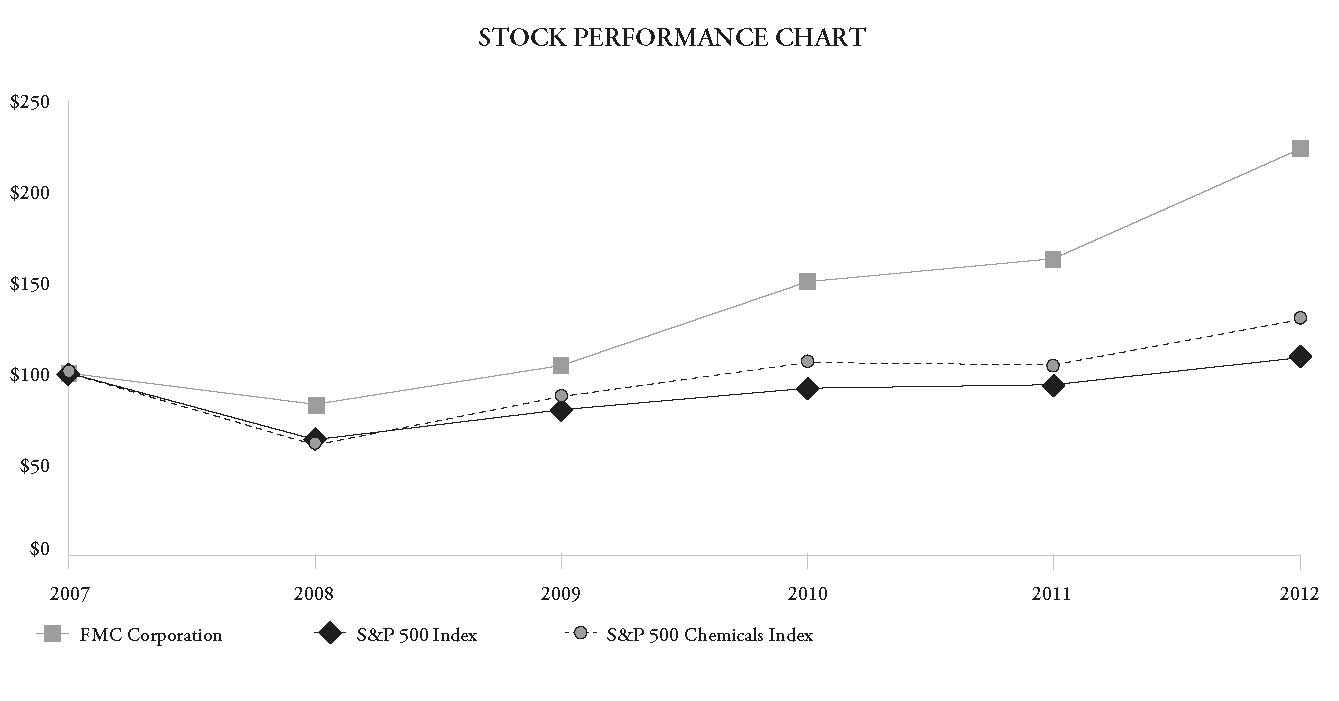
Stockholder Return Performance Presentation
The graph that follows shall not be deemed to be incorporated by reference into any filing made by FMC under the Securities Act of 1933 or the Securities Exchange Act of 1934.
The following Stockholder Performance Graph compares the five-year cumulative total return on FMC’s Common Stock for the period from January 1, 2008 to
December 31, 2012
with the S&P 500 Index and the S&P 500 Chemicals Index. The comparison assumes $100 was invested on December 31, 2007, in FMC’s Common Stock and in both of the indices, and the reinvestment of all dividends.
|
2007
|
2008
|
2009
|
2010
|
2011
|
2012
|
||||||||||||||||||
|
FMC Corporation
|
$
|
100.00
|
|
$
|
82.88
|
|
$
|
104.24
|
|
$
|
150.29
|
|
$
|
162.98
|
|
$
|
223.24
|
|
|||||
|
S&P 500 Index
|
$
|
100.00
|
|
$
|
63.45
|
|
$
|
79.90
|
|
$
|
91.74
|
|
$
|
93.67
|
|
$
|
108.55
|
|
|||||
|
S&P 500 Chemicals Index
|
$
|
100.00
|
|
$
|
60.49
|
|
$
|
87.16
|
|
$
|
105.85
|
|
$
|
104.56
|
|
$
|
129.42
|
|
|||||
For the three and twelve months ended
December 31, 2012
, we made the following share repurchases:
ISSUER PURCHASES OF EQUITY SECURITIES
|
|
|
|
Publicly Announced Program
|
||||||||||||||
|
Period
|
Total Number
of Shares
Purchased
|
Average
Price Paid
Per Share
|
Total Number of
Shares Purchased
|
Total Dollar
Amount
Purchased
|
Maximum Dollar Value of
Shares that May Yet be
Purchased
|
||||||||||||
|
Q1 2012
|
3,139,712
|
|
$
|
47.20
|
|
3,072,540
|
|
144,947,279
|
|
$
|
244,811,313
|
|
|||||
|
Q2 2012
|
80
|
|
$
|
53.16
|
|
—
|
|
—
|
|
244,811,313
|
|
||||||
|
Q3 2012
|
14,402
|
|
$
|
53.89
|
|
—
|
|
—
|
|
244,811,313
|
|
||||||
|
October 1-31, 2012
|
478
|
|
$
|
55.38
|
|
—
|
|
—
|
|
244,811,313
|
|
||||||
|
November 1-30, 2012
|
541
|
|
$
|
53.52
|
|
—
|
|
—
|
|
244,811,313
|
|
||||||
|
December 1-31, 2012
|
5,177
|
|
$
|
56.79
|
|
—
|
|
—
|
|
244,811,313
|
|
||||||
|
Q4 2012
|
6,196
|
|
$
|
56.40
|
|
—
|
|
—
|
|
244,811,313
|
|
||||||
|
Total 2012
|
3,160,390
|
|
3,072,540
|
|
$
|
144,947,279
|
|
$
|
244,811,313
|
|
|||||||
On February 17, 2012, the Board authorized the repurchase of up to $250 million of our common stock. At
December 31, 2012
,
$244.8 million
remained unused from the authorization. The repurchase program does not include a specific timetable or price targets and may be suspended or terminated at any time. Shares may be purchased through open market or privately negotiated transactions at the discretion of management based on its evaluation of market prevailing conditions and other factors. During the year ended
December 31, 2012
,
3,072,540
shares were repurchased under the publicly announced repurchase program for
$144.9 million
.
20
|
ITEM 6.
|
SELECTED FINANCIAL DATA
|
SELECTED CONSOLIDATED FINANCIAL DATA
The selected consolidated financial and other data presented below for, and as of the end of, each of the years in the five-year period ended December 31, 2012, are derived from our consolidated financial statements. The selected consolidated financial data should be read in conjunction with our consolidated financial statements for the year ended December 31, 2012.
|
|
Year Ended December 31,
|
||||||||||||||||||
|
(in Millions, except per share data and ratios)
|
2012
|
2011
|
2010
|
2009
|
2008
|
||||||||||||||
|
Income Statement Data:
|
|||||||||||||||||||
|
Revenue
|
$
|
3,748.3
|
|
$
|
3,377.9
|
|
$
|
3,116.3
|
|
$
|
2,826.2
|
|
$
|
3,115.3
|
|
||||
|
Income from continuing operations before equity in (earnings) loss of affiliates, interest income and expense and income taxes
|
658.2
|
|
587.3
|
|
387.1
|
|
334.7
|
|
500.7
|
|
|||||||||
|
Income from continuing operations before income taxes
|
612.6
|
|
550.5
|
|
350.5
|
|
310.0
|
|
471.9
|
|
|||||||||
|
Income from continuing operations
|
465.9
|
|
414.0
|
|
218.5
|
|
257.0
|
|
346.5
|
|
|||||||||
|
Discontinued operations, net of income taxes (1)
|
(30.2
|
)
|
(31.8
|
)
|
(33.6
|
)
|
(18.2
|
)
|
(24.9
|
)
|
|||||||||
|
Net income
|
435.7
|
|
382.2
|
|
184.9
|
|
238.8
|
|
321.6
|
|
|||||||||
|
Less: Net income attributable to noncontrolling interest
|
19.5
|
|
16.3
|
|
12.4
|
|
10.3
|
|
17.0
|
|
|||||||||
|
Net income attributable to FMC stockholders
|
$
|
416.2
|
|
$
|
365.9
|
|
$
|
172.5
|
|
$
|
228.5
|
|
$
|
304.6
|
|
||||
|
Amounts attributable to FMC stockholders:
|
|||||||||||||||||||
|
Continuing operations, net of income taxes
|
446.4
|
|
397.7
|
|
206.1
|
|
246.7
|
|
329.5
|
|
|||||||||
|
Discontinued operations, net of income taxes
|
(30.2
|
)
|
(31.8
|
)
|
(33.6
|
)
|
(18.2
|
)
|
(24.9
|
)
|
|||||||||
|
Net income
|
$
|
416.2
|
|
$
|
365.9
|
|
$
|
172.5
|
|
$
|
228.5
|
|
$
|
304.6
|
|
||||
|
Basic earnings (loss) per common share attributable to FMC stockholders:
|
|||||||||||||||||||
|
Continuing operations
|
$
|
3.23
|
|
$
|
2.79
|
|
$
|
1.42
|
|
$
|
1.70
|
|
$
|
2.22
|
|
||||
|
Discontinued operations
|
(0.22
|
)
|
(0.22
|
)
|
(0.23
|
)
|
(0.12
|
)
|
(0.17
|
)
|
|||||||||
|
Net income
|
$
|
3.01
|
|
$
|
2.57
|
|
$
|
1.19
|
|
$
|
1.58
|
|
$
|
2.05
|
|
||||
|
Diluted earnings (loss) per common share attributable to FMC stockholders:
|
|||||||||||||||||||
|
Continuing operations
|
$
|
3.22
|
|
$
|
2.77
|
|
$
|
1.41
|
|
$
|
1.68
|
|
$
|
2.17
|
|
||||
|
Discontinued operations
|
(0.22
|
)
|
(0.22
|
)
|
(0.23
|
)
|
(0.12
|
)
|
(0.16
|
)
|
|||||||||
|
Net income
|
$
|
3.00
|
|
$
|
2.55
|
|
$
|
1.18
|
|
$
|
1.56
|
|
$
|
2.01
|
|
||||
|
Balance Sheet Data:
|
|||||||||||||||||||
|
Total assets
|
$
|
4,373.9
|
|
$
|
3,743.5
|
|
$
|
3,319.9
|
|
$
|
3,136.2
|
|
$
|
2,993.9
|
|
||||
|
Long-term debt
|
$
|
914.5
|
|
$
|
798.6
|
|
$
|
619.4
|
|
$
|
610.5
|
|
$
|
595.0
|
|
||||
|
Other Data:
|
|||||||||||||||||||
|
Ratio of earnings to fixed charges (2)
|
11.6x
|
|
11.3x
|
|
7.5x
|
|
9.2x
|
|
11.6x
|
|
|||||||||
|
Cash dividends declared per share
|
$
|
0.405
|
|
$
|
0.300
|
|
$
|
0.250
|
|
$
|
0.250
|
|
$
|
0.240
|
|
||||
____________________
|
(1)
|
Discontinued operations, net of income taxes includes the following items related to our discontinued businesses: gains and losses related to adjustments to our estimates of our liabilities for environmental exposures, general liability, workers’ compensation, postretirement benefit obligations, legal defense, property maintenance and other costs, losses for the settlement of litigation and gains related to property sales.
|
|
(2)
|
In calculating this ratio, earnings consist of income (loss) from continuing operations before income taxes plus interest expense, amortization expense related to debt discounts, fees and expenses, amortization of capitalized interest, interest included in rental expenses (assumed to be one-third of rent) and equity in (earnings) loss of affiliates. Fixed charges consist of interest expense, amortization of debt discounts, fees and expenses, interest capitalized as part of fixed assets and interest included in rental expenses.
|
21
FORWARD-LOOKING INFORMATION
Statement under the Safe Harbor Provisions of the Private Securities Litigation Reform Act of 1995: We and our representatives may from time to time make written or oral statements that are “forward-looking” and provide other than historical information, including statements contained in Management’s Discussion and Analysis of Financial Condition and Results of Operations within, in our other filings with the SEC, or in reports to our stockholders.
In some cases, we have identified forward-looking statements by such words or phrases as “will likely result,” “is confident that,” “expect,” “expects,” “should,” “could,” “may,” “will continue to,” “believe,” “believes,” “anticipates,” “predicts,” “forecasts,” “estimates,” “projects,” “potential,” “intends” or similar expressions identifying “forward-looking statements” within the meaning of the Private Securities Litigation Reform Act of 1995, including the negative of those words and phrases. Such forward-looking statements are based on our current views and assumptions regarding future events, future business conditions and the outlook for the company based on currently available information. These statements involve known and unknown risks, uncertainties and other factors that may cause actual results to be materially different from any results, levels of activity, performance or achievements expressed or implied by any forward-looking statement. These factors include, among other things, the risk factors listed in Item 1A of this Form 10-K. We wish to caution readers not to place undue reliance on any such forward-looking statements, which speak only as of the date made.
|
ITEM 7.
|
MANAGEMENT'S DISCUSSION AND ANALYSIS OF FINANCIAL CONDITION AND RESULTS OF OPERATIONS
|
Overview
We are a diversified chemical company serving agricultural, consumer and industrial markets globally with innovative solutions, applications and market-leading products. We operate in three distinct business segments: Agricultural Products, Specialty Chemicals and Industrial Chemicals. Our Agricultural Products segment develops, markets and sells all three major classes of crop protection chemicals – insecticides, herbicides and fungicides – with particular strength in insecticides and herbicides. These products are used in agriculture to enhance crop yield and quality by controlling a broad spectrum of insects, weeds and disease, as well as pest control in non-agricultural markets. Specialty Chemicals consists of our BioPolymer and lithium businesses. This segment focuses on food ingredients that are used to enhance texture, color, structure and physical stability, pharmaceutical additives for binding, encapsulation and disintegrant applications, ultrapure biopolymers for medical devices and lithium for energy storage, specialty polymers and pharmaceutical synthesis. Our Industrial Chemicals segment manufactures a wide range of inorganic materials, including soda ash, hydrogen peroxide, specialty peroxygens and silicates. This segment serves a diverse group of markets, from economically-sensitive industrial sectors to technology-intensive specialty markets. The products in this segment are sought by customers for their critical reactivity or specific functionality in markets such as glass, detergents, chemicals and pulp and paper.
2012 Highlights
The following are the more significant developments in our businesses during the year ended December 31, 2012:
|
•
|
Revenue of
$3,748.3 million
in
2012
increased $370.4 million or 11 percent versus last year. Revenue increased in all businesses and mostly in all regions. A more detailed review of revenues by segment are included under the section entitled
“Results of Operations”
. On a regional basis, sales in Asia were up 13 percent, sales in Latin America grew 21 percent and sales in North America were up nine percent, while sales in Europe, Middle East and Africa decreased by three percent.
|
|
•
|
Our gross margin of
$1,341.2 million
increased $173.8 million or approximately 15 percent versus last year. Gross margin percent of approximately 36 percent increased slightly by one percentage point compared to last year, driven by higher selling prices and improved mix partially offset by higher costs.
|
|
•
|
Selling, general and administrative expenses, excluding non-operating pension and postretirement charges, of $492.2 million increased $64.2 million or approximately 15 percent, largely due to increased spending on targeted growth initiatives and to meet the growth in our business. The majority of these increases were experienced in our Agricultural Products segment. Non-operating pension and postretirement charges are presented in our Adjusted Earnings Non-GAAP financial measurement below under the section titled
“Results of Operations”
.
|
|
•
|
Research and Development expenses of $117.8 million increased $12.6 million or 12 percent, largely due to increased spending in Agricultural Products associated with various innovation projects.
|
|
•
|
Adjusted earnings after-tax from continuing operations attributable to FMC stockholders of approximately $483.3 million increased approximately $54.4 million or 13 percent primarily due to higher operating results in Agricultural
|
22
Products. See the disclosure of our Adjusted Earnings Non-GAAP financial measurement below under the section titled
“Results of Operations”
.
|
•
|
We made the decision to phase out our zeolite operations in Spain and exit the product line by fourth quarter 2012. The majority of the restructuring charges associated with this announcement were incurred in 2012 totaling approximately $6.4 million.
|
|
•
|
We also decided to write-down a substantial portion of our investment to develop potash extraction capability in Argentina. Given the changes in potash market conditions, this project is no longer economically attractive. As such, we are discontinuing all work on Potash in Argentina and will repurpose the assets developed for this project as much as possible for future use in producing Lithium. This decision resulted in a non-cash charge of $13.3 million during the year.
|
Additionally, in January 2013, we implemented a plan to restructure a portion of the operations in Lithium. The objective of the restructuring was to better align our business and costs to macroeconomic and market realities. The restructuring decision will result in workforce reductions at several of our Lithium facilities, primarily North Carolina and Argentina. We expect to incur charges between $10-15 million, mostly in the first quarter of 2013. These charges will primarily result in cash spending.
|
•
|
We also completed the following growth initiatives:
|
|
◦
|
In June 2012, we acquired Phytone Ltd (Phytone). Phytone is a natural colors producer based in the United Kingdom. Phytone's natural products and formulations are used by global customers in the food, beverage, personal care and nutrition sectors. Phytone has been consolidated into our existing BioPolymer division within our Specialty Chemicals segment.
|
|
◦
|
In July 2012, we made the decision to invest more than $100 million in a new world class microcrystalline cellulose (MCC) manufacturing facility in Rayong, Thailand. The new plant will ensure our long-term ability to supply the growing Asia market with our industry leading Avicel colloidal MCC which is part of our BioPolymer division within our Specialty Chemicals segment.
|
|
◦
|
In August 2012, we acquired the assets of Pectine Italia S.p.A. (PI). PI produces pectin, a stabilizer and thickening agent used widely in many foods and derived predominately from lemon peels. This acquisition will enable us to enter the pectin market which complements our portfolio of texturant product lines which is part of our BioPolymer division within our Specialty Chemicals segment.
|
|
◦
|
In September 2012, our Agricultural Products segment entered into a collaboration and license agreement with a third-party company for the purpose of obtaining certain technology and intellectual property rights relating to a new fungicide compound still under development. This new carboximide-class broad spectrum fungicide will expand our current fungicide portfolio.
|
|
◦
|
In December 2012, we signed a perpetual, global licensing agreement, along with distribution and services agreements with GAT Microencapsulation AG covering a range of advanced crop protection products and proprietary formulation technologies.
|
2013 Outlook
In 2013, we expect another year of record performance. We expect higher revenues in all three of our segments. Increased volumes in all regions due to strong market conditions, growth from new or recently introduced products as well as direct market access initiatives will drive higher revenues in Agricultural Products. Higher volumes in BioPolymer will drive increased Special Chemicals revenue and higher prices in soda ash, projected in the second half of 2013, are anticipated to drive higher Industrial Chemicals sales.
We expect an increase in earnings, mostly driven by higher sales as discussed above. Our projected increase in earnings is expected to be partially offset by higher spending on growth initiatives. We expect cash flow from our business segments to remain strong.
23
Results of Operations—2012, 2011 and 2010
Overview
The following presents a reconciliation of our segment results to net income attributable to FMC stockholders as seen through the eyes of management.
|
SEGMENT RESULTS RECONCILIATION
|
|||||||||||
|
(in Millions)
|
Year Ended December 31,
|
||||||||||
|
2012
|
2011
|
2010
|
|||||||||
|
Revenue
|
|||||||||||
|
Agricultural Products
|
$
|
1,763.8
|
|
$
|
1,464.5
|
|
$
|
1,241.8
|
|
||
|
Specialty Chemicals
|
913.8
|
|
879.1
|
|
824.5
|
|
|||||
|
Industrial Chemicals
|
1,076.1
|
|
1,038.5
|
|
1,054.8
|
|
|||||
|
Eliminations
|
(5.4
|
)
|
(4.2
|
)
|
(4.8
|
)
|
|||||
|
Total
|
$
|
3,748.3
|
|
$
|
3,377.9
|
|
$
|
3,116.3
|
|
||
|
Income (loss) from continuing operations before income taxes
|
|||||||||||
|
Agricultural Products
|
$
|
450.7
|
|
$
|
348.3
|
|
$
|
309.5
|
|
||
|
Specialty Chemicals
|
189.5
|
|
199.8
|
|
185.0
|
|
|||||
|
Industrial Chemicals
|
165.4
|
|
154.5
|
|
122.9
|
|
|||||
|
Eliminations
|
0.1
|
|
(0.1
|
)
|
0.2
|
|
|||||
|
Segment operating profit
|
$
|
805.7
|
|
$
|
702.5
|
|
$
|
617.6
|
|
||
|
Corporate expense
|
(63.6
|
)
|
(62.5
|
)
|
(63.0
|
)
|
|||||
|
Other income (expense), net (1)
|
(23.5
|
)
|
(18.7
|
)
|
(5.4
|
)
|
|||||
|
Operating profit before the items listed below (2)
|
718.6
|
|
621.3
|
|
549.2
|
|
|||||
|
Interest expense, net
|
(45.3
|
)
|
(39.4
|
)
|
(39.3
|
)
|
|||||
|
Corporate special (charges) income:
|
|||||||||||
|
Restructuring and other (charges) income
|
(38.1
|
)
|
(32.4
|
)
|
(151.9
|
)
|
|||||
|
Non-operating pension and postretirement charges (3)
|
(34.9
|
)
|
(14.5
|
)
|
(19.9
|
)
|
|||||
|
Acquisition-related charges (4)
|
(7.2
|
)
|
(0.8
|
)
|
—
|
|
|||||
|
Provision for income taxes
|
(146.7
|
)
|
(136.5
|
)
|
(132.0
|
)
|
|||||
|
Discontinued operations, net of income taxes
|
(30.2
|
)
|
(31.8
|
)
|
(33.6
|
)
|
|||||
|
Net income attributable to FMC stockholders
|
$
|
416.2
|
|
$
|
365.9
|
|
$
|
172.5
|
|
||
____________________
|
(1)
|
Other income (expense), net is comprised primarily of last-in first-out (“LIFO”) inventory adjustments, capitalized interest amortization and certain employee benefits, including incentive compensation. Our business segments account for their inventory utilizing a first-in first-out ("FIFO") basis of accounting. The LIFO inventory adjustments are not allocated to the business segments and therefore are recorded to "Other income (expense), net".
|
|
(2)
|
Results for all segments including corporate expense and other income (expense) are net of noncontrolling interests of
$19.5 million
,
$16.3 million
and
$12.4 million
for the years ended
December 31, 2012
,
2011
and
2010
, respectively. The majority of these noncontrolling interests pertain to our Industrial Chemicals segment.
|
|
(3)
|
Our non-operating pension and postretirement costs are defined as those costs related to interest, expected return on plan assets, amortized actuarial gains and losses and the impacts of any plan curtailments or settlements. These costs are primarily related to changes in pension plan assets and liabilities which are tied to financial market performance and we consider these costs to be outside our operational performance. We exclude these non-operating pension and postretirement costs as we believe that removing them provides a better understanding of the underlying profitability of our businesses, provides increased transparency and clarity in the performance of our retirement plans and enhances period-over-period comparability. We continue to include the service cost and amortization of prior service cost in our operating segments noted above. We believe these elements reflect the current year operating costs to our businesses for the employment benefits provided to active employees.
|
|
(4)
|
These charges were related to the expensing of the inventory fair value step-up resulting from the application of purchase accounting. The charges for the year ended December 31, 2012 and 2011 primary relate to a number of acquisitions completed in 2011. On the consolidated statements of income, the charges presented are included in “Costs of sales and services”. No such charges occurred for the year ended December 31, 2010.
|
24
The following chart, which is provided to assist the readers of our financial statements, depicts certain after-tax charges (gains). These items are excluded by us in the measures we use to evaluate business performance and determine certain performance-based compensation. These after-tax items are discussed in detail within the “Other results of operations” section that follows. Additionally, the chart below discloses our Non-GAAP financial measure “Adjusted after-tax earnings from continuing operations attributable to FMC stockholders” reconciled from the GAAP financial measure “Net income attributable to FMC stockholders”. We believe that this measure provides useful information about our operating results to investors and securities analysts. We also believe that excluding the effect of restructuring and other income and charges, non-operating pension and postretirement charges and certain tax adjustments from operating results allows management and investors to compare more easily the financial performance of our underlying businesses from period to period. This measure should not be considered as a substitute for net income (loss) or other measures of performance or liquidity reported in accordance with GAAP.
|
ADJUSTED EARNINGS RECONCILIATION
|
|||||||||||
|
(in Millions)
|
Years Ended December 31,
|
||||||||||
|
2012
|
2011
|
2010
|
|||||||||
|
Net income attributable to FMC stockholders (GAAP)
|
$
|
416.2
|
|
$
|
365.9
|
|
$
|
172.5
|
|
||
|
Corporate special charges (income), pre-tax
|
80.2
|
|
47.7
|
|
171.8
|
|
|||||
|
Income tax expense (benefit) on Corporate special charges (income)
|
(26.5
|
)
|
(15.6
|
)
|
(55.2
|
)
|
|||||
|
Corporate special charges (income), net of income taxes
|
53.7
|
|
32.1
|
|
116.6
|
|
|||||
|
Discontinued operations, net of income taxes
|
30.2
|
|
31.8
|
|
33.6
|
|
|||||
|
Tax adjustments
|
(16.8
|
)
|
(0.9
|
)
|
38.7
|
|
|||||
|
Adjusted after-tax earnings from continuing operations attributable to FMC stockholders (Non-GAAP)
|
$
|
483.3
|
|
$
|
428.9
|
|
$
|
361.4
|
|
||
In the discussion below, please refer to our chart titled
"Segment Results Reconciliation"
within the Results of Operations section. All comparisons are between the periods unless otherwise noted.
Segment Results
For management purposes, segment operating profit is defined as segment revenue less segment operating expenses (segment operating expenses consist of costs of sales and services, selling, general and administrative expenses and research and development expenses). We have excluded the following items from segment operating profit: corporate staff expense, interest income and expense associated with corporate debt facilities and investments, income taxes, gains (or losses) on divestitures of businesses, restructuring and other charges (income), non-operating pension and postretirement charges, investment gains and losses, loss on extinguishment of debt, asset impairments, Last-in, First-out (“LIFO”) inventory adjustments, acquisition related charges and other income and expense items.
Information about how each of these items relates to our businesses at the segment level and results by segment are discussed below and in Note 19 to our consolidated financial statements included in this Form 10-K.
Effective in fiscal year 2013, our segment presentations including allocation of certain corporate expenses were updated to reflect how we currently make financial decisions and allocate resources. The presentation change is also being made since we believe the changes provide a better understanding of the underlying profitability of each individual business segment. The changes were the following:
|
•
|
Allocation of certain long-term incentives, primarily stock-based compensation, from the category other income (expense), net to each business segment.
|
|
•
|
Allocation of the depreciation on capitalized interest associated with completed construction projects from the category other income (expense), net to each business segment.
|
|
•
|
The presentation of the impact of noncontrolling interest as its own line item. Noncontrolling interest impacts were previously netted within each individual segment. The majority of the noncontrolling interest pertains to our Industrial Chemicals segment.
|
|
•
|
We have combined other income (expense), net and corporate expense into one line item renamed “Corporate and other”.
|
This segment presentation change, effective January 1, 2013, is not incorporated into the Segment Results as discussed below. However, the 2013 outlook discussions for each segment below include revenue growth and operating profit projections which reflect this new segment presentation on a comparable basis.
25
Agricultural Products
|
(in Millions)
|
Year Ended December 31,
|
||||||||||
|
2012
|
2011
|
2010
|
|||||||||
|
Revenue
|
$
|
1,763.8
|
|
$
|
1,464.5
|
|
$
|
1,241.8
|
|
||
|
Operating Profit
|
450.7
|
|
348.3
|
|
309.5
|
|
|||||
2012 vs. 2011
Revenue of
$1,763.8 million
increased approximately 20 percent versus the prior year period due to strong sales across all regions. The increase in revenue for the year ended December 31, 2012 was also attributable to acquisitions that
closed in the second half of 2011 of approximately $60 million.
Sales in North America improved by 30 percent to $368.5 million reflecting favorable market conditions, strong demand for our proprietary herbicides and insecticides and growth from new or recently introduced products. Latin America revenue of $960.5 million increased 23 percent reflecting strong market conditions in Brazil driven by key crops such as sugarcane and soybeans, increased planted acres and sales from our new market access joint venture, Ruralco, in Argentina. Revenue in Asia of $275.7 million increased 12 percent as a result of growth in recently launched and acquired products, coupled with growth in China, Indonesia and the Philippines. EMEA revenues of $159.1 million increased five percent driven by higher herbicide sales in Europe and insecticide volume gains in Africa.
Agricultural Products' operating profit of
$450.7 million
increased approximately 29 percent compared to the prior year, reflecting the broad-based sales growth and targeted price increases. This increase was partially offset by a $51.7 million increase in selling, general and administrative costs mainly for focused growth initiatives and increased people-related costs to support the higher sales. Segment earnings were also impacted by higher research and development costs of $11.1 million due to increased spending associated with various innovation projects.
In 2013, we expect full-year revenue growth in the high teens percent reflecting increased volumes in all regions due to strong market conditions and growth from new and recently introduced products including new fungicide products as well as our direct market access initiatives in Asia and Latin America. We expect full-year segment operating profit growth in the mid-teens percent driven by the sales gains partially offset by higher spending on targeted growth initiatives.
Certain Regulatory Issues
In 2009, our bifenthrin product was excluded from the European Commission's official list of approved pesticides. We submitted for reconsideration of that decision and in 2012 bifenthrin was re-approved for use in the European Union. FMC is now in the process of re-submitting for registrations in EU Member States. We can resume selling bifenthrin in the European market once the registrations are approved by the Member States. With the exception of France, we expect that most registrations will be approved over the next 24 months; due to the continued inclusion of bifenthrin on the French “Grenelle” list of pesticides we cannot predict when we may regain a French registration. We believe that the Grenelle listing was unwarranted and contrary to French administrative law, and we are challenging the decision. During 2013, we will not sell any bifenthrin for agricultural use into the EU, similar to the prior year, and the absence of such sales will not have a material effect on the Company's financial condition or results of operations.
We intend to defend vigorously all our products in the U.S., EU and other countries as our pesticide products are reviewed in the ordinary course of regulatory programs during 2013 as part of the ongoing cycle of re-registration of our pesticide products around the world. In 2008, the Brazilian health surveillance agency informed us that they intend to review carbofuran along with 13 other major pesticides, but has yet to issue any required formal announcement that identifies their specific concerns or preliminary position on re-registration. We are cooperating and defending our product in this process. Under the Brazilian regulatory process, any recommendation would require public notice and comment as well as concurrence from the Brazilian environmental and agricultural ministries before any regulatory change is effective. Thus, we do not expect any material sales impact due to regulatory reviews in Brazil during 2013.
26
2011 vs. 2010
Revenue of
$1,464.5 million
increased approximately 18 percent versus the prior year period due to strong sales in North America, Latin America and Asia slightly offset by the expected decline in Europe, Middle East and Africa (EMEA). North America revenue of $284.4 million increased 12 percent due to increased volumes as a result of strong market demand for our pre-emergent herbicides partially offset by unfavorable weather conditions experienced in the second quarter of 2011. Latin America revenue of $782.5 million increased 25 percent driven by favorable market conditions, particularly in Brazil's sugarcane, cotton and soybean markets, and growth in planted acres for key crops. Revenue in Asia of $246.0 million increased 21 percent reflecting continued strong market conditions, particularly in Australia, China, Indonesia, Thailand, Pakistan and India. As expected, these increases were partially offset by a decline in EMEA revenues of four percent to $151.6 million. The decline was primarily driven by the absence of sales of our bifenthrin product in Europe due to the product, at the time, not being included on the European Union official list of approved pesticides for sale.
Agricultural Products' operating profit of
348.3 million
increased approximately 13 percent compared to prior year, reflecting the strong sales growth partially offset by increased raw material costs and a $24.5 million or 13 percent increase in selling and administrative expenses for focused growth initiatives, higher people-related costs and unfavorable exchange impacts.
Specialty Chemicals
|
(in Millions)
|
Year Ended December 31,
|
||||||||||
|
2012
|
2011
|
2010
|
|||||||||
|
Revenue
|
$
|
913.8
|
|
$
|
879.1
|
|
$
|
824.5
|
|
||
|
Operating Profit
|
189.5
|
|
199.8
|
|
185.0
|
|
|||||
2012 vs. 2011
Revenue in Specialty Chemicals was
$913.8 million
, an increase of approximately four percent versus the prior year. The increase was driven primarily by higher selling prices across the segment, particularly in food, pharmaceuticals and lithium primaries markets slightly offset by unfavorable currency impacts. Revenue for the year ended December 31, 2012 included approximately $14.3 million associated with recently completed acquisitions.
BioPolymer revenue of
$680.8 million
increased approximately four percent from the prior year. This increase was due to favorable pricing which impacted sales by six percent and revenue from acquisitions which increased sales by two percent. These increases were partially offset by decreased volumes of two percent and unfavorable currency impacts of two percent.
Lithium revenue of
$233.0 million
increased approximately four percent compared to the prior year. This increase was due to higher pricing which impacted sales by six percent partially offset by decreased volumes which decreased sales by two percent. Lithium sales growth was led by higher selling prices in lithium primaries. Lower volumes also resulted from production downtime in the first quarter of 2012 associated with our capacity expansion in Argentina, as well as the effect of related operational issues which primarily impacted the first half of 2012 and the extended planned outage in Lithium's Argentina facility in third quarter 2012.
Segment operating profit of
189.5 million
decreased five percent versus the prior year. Higher revenues in both BioPolymer and Lithium were negatively impacted by increased manufacturing costs primarily in Lithium and higher raw material costs throughout the segment. Selling, general and administrative expenses also increased by $9.0 million to support growth initiatives, primarily in BioPolymer.
In 2013, we expect full-year revenue growth in the high single digits percent driven by higher volumes in BioPolymer. Full-year operating profit growth is expected to be in the high single digit percent reflecting sales gains complemented by improving Lithium operating performance, partially offset by spending on targeted growth initiatives in BioPolymer.
2011 vs. 2010
Revenue in Specialty Chemicals was
$879.1 million
, an increase of approximately seven percent versus the prior year. The increase was driven primarily by volume increases and higher pricing in BioPolymer and favorable pricing in lithium specialties and favorable currency impacts.
BioPolymer revenue of $654.3 million increased approximately seven percent from the prior year. This increase was due to higher volumes which increased revenue by three percent, favorable pricing which impacted sales by two percent and the impact of a stronger euro which accounted for the remaining two percent. The volume gains and higher pricing were realized in both the food ingredients and pharmaceutical markets.
27
Lithium revenue of $224.8 million increased approximately six percent compared to the prior year. Currency impacts resulted in a one percent increase in revenue while pricing was up four percent and volumes were flat as compared to prior year.
Segment operating profit of
$199.8 million
increased eight percent versus the prior year. The increase was primarily driven by the volume gains, higher pricing and favorable mix in BioPolymer and favorable pricing in Lithium offset by adverse weather conditions in Argentina which impacted mining operations. Selling, general and administrative expenses increased by 14 percent or $9.8 million to support growth initiatives.
Industrial Chemicals
|
(in Millions)
|
Year Ended December 31,
|
||||||||||
|
2012
|
2011
|
2010
|
|||||||||
|
Revenue
|
$
|
1,076.1
|
|
$
|
1,038.5
|
|
$
|
1,054.8
|
|
||
|
Operating Profit
|
165.4
|
|
154.5
|
|
122.9
|
|
|||||
2012 vs. 2011
Revenue in Industrial Chemicals was
$1,076.1 million
, an increase of approximately four percent versus the prior year. Revenue increased three percent due to higher pricing across the segment and by one percent due to volume increases in Alkali. Revenue also increased one percent due to the impact of acquisitions completed in the fourth quarter of 2011. These increases were slightly offset by a one percent reduction in revenue due to unfavorable currency impacts.
Alkali revenues of
$715.0 million
increased six percent over the prior year due to higher average pricing in both the domestic and export markets and higher export volumes. Volume growth was partially related to full production at our Granger facility which came on line in the middle of last year. Export volumes were robust, especially in Asia and Latin America.
Peroxygens revenues of
$302.7 million
decreased three percent over the prior year due primarily to unfavorable currency impacts.
Environmental Solutions revenues of
$48.1 million
were
45 percent
higher year over year from
$33.2 million
in the prior year driven by higher volumes and the acquisition completed in the fourth quarter of 2011.
Segment operating profit of
$165.4 million
increased approximately seven percent versus the year ago period primarily as a result of higher pricing and volumes experienced in Alkali as well as the continued favorable mix shift in Peroxygens toward specialty applications. Partially offsetting the favorable pricing were higher royalty and energy costs associated with our
Wyoming Alkali operations. Additionally, segment operating profits were negatively impacted by the poor performance of the zeolites product line which we have exited as of December 31, 2012.
In 2013, we expect full-year revenue increases to be in the mid-single digits percent due to higher selling prices in soda ash in the second half of the year. We expect full-year operating profit to be flat.
2011 vs. 2010
Revenue in Industrial Chemicals was $1,038.5 million, a decrease of approximately two percent versus the prior year. The decrease is primarily attributable to the exit of our phosphate and sulfur derivative businesses in Spain during 2010. The absence of phosphate and sulfur derivatives revenue in 2011 resulted in overall revenue declines in the segment of approximately 12 percent. The decline in these revenues were partially offset by higher pricing across the segment, particularly in soda ash, which impacted revenues by approximately six percent. Higher freight billing and favorable currency impacts increased revenue by approximately three percent.
Alkali revenues of $677.5 million increased 10 percent over the prior year due to higher pricing particularly in the export market, higher freight billings and slightly higher volumes. Export demand continues to be robust, especially in Asia and Latin America. In our domestic market, we experienced higher pricing due to constrained supply while volume growth continues to be in line with the demand recovery being experienced in flat glass, detergents and chemicals.
Peroxygens revenues of $311.8 million increased 10 percent over the prior year driven primarily by higher pricing and favorable currency impacts offset by slightly reduced volumes. The increased pricing was primarily in our hydrogen peroxide and specialty persulfates product lines.
Environmental Solutions revenues of $33.2 million were 58 percent higher year over year from $21.0 million in the prior year.
28
Segment operating profit of $154.5 million increased approximately 26 percent versus the year ago period primarily as a result of the higher pricing documented above. The exited phosphate and sulfur derivative businesses had a loss of $1.3 million for the year ended December 31, 2010. Additionally, the startup costs associated with our Granger soda ash facility were offset by favorable production efficiencies in Alkali. Selling, general and administrative costs increased seven percent or $3.5 million primarily for targeted growth initiatives.
Other Results of Operations
Corporate expenses
Corporate expenses are included as a component of the line item “Selling, general and administrative expenses” on our consolidated statements of income.
2012 vs. 2011
Corporate expenses of
$63.6 million
in 2012 increased slightly by $1.1 million from
$62.5 million
in 2011. The year-over-year increase is due to our global growth initiatives.
2011 vs. 2010
We recorded expenses of
$62.5 million
in 2011 compared to $63.0 million in 2010. The slight decrease was a result of reduced consulting expenses of approximately $3 million during 2011 compared to the same period in 2010 due to the implementation of our global procurement initiative. The decrease in consulting expenses were partially offset by increased costs of approximately $2 million to support our global growth initiatives.
Other income (expense), net
Other income (expense), net is included as a component of the line item “Costs of sales and services” on our consolidated statements of income.
2012 vs. 2011
Other expense increased to
$23.5 million
in 2012 from
$18.7 million
in 2011. The increase was primarily due to higher LIFO inventory charges that exceeded prior year by $5.0 million.
2011 vs. 2010
Other expense increased to
$18.7 million
in 2011 from $5.4 million in 2010. The increase was primarily due to expense related to an increase in our LIFO inventory reserves in 2011 of $2.6 million versus 2010 where we had a reduction in the LIFO reserve of $10.4 million.
Interest expense, net
2012 vs. 2011
Interest expense, net for 2012 of
$45.3 million
increased approximately 15 percent compared to the same period in 2011 of
$39.4 million
. The increase was primarily due to higher debt levels associated with the issuance of our 3.95% senior notes
during the 4th quarter of 2011. The interest expense on these notes was approximately $12 million in 2012. The higher interest associated with our senior notes was slightly offset by a decrease in our foreign debt interest expense during 2012 as compared to 2011 of approximately $5.3 million.
2011 vs. 2010
Interest expense, net for 2011 of
$39.4 million
was relatively flat compared to the same period in 2010 of $39.3 million.
29
Corporate special income (charges)
Restructuring and other (charges) income
Our restructuring and other (charges) income are compromised of restructuring, assets disposals and other charges (income) as described below:
|
|
Year Ended December 31,
|
||||||||||
|
(in Millions)
|
2012
|
2011
|
2010
|
||||||||
|
Restructuring Charges and Asset Disposals
|
$
|
28.3
|
|
$
|
28.0
|
|
$
|
127.2
|
|
||
|
Other Charges (Income), Net
|
9.8
|
|
4.4
|
|
24.7
|
|
|||||
|
Total Restructuring and Other Charges
|
$
|
38.1
|
|
$
|
32.4
|
|
$
|
151.9
|
|
||
Restructuring and asset disposal charges in 2012 primarily included charges of $13.3 million associated with the Lithium restructuring and $6.4 million associated with the Zeolites shutdown announced during 2012. Other charges (income) net in 2012 were primarily due to charges of $5.8 million for environmental remediation at operating sites and a $4.4 million charge related to our Agricultural Products segment for the purpose of acquiring certain rights to a fungicide still under development.
Restructuring and asset disposal charges in 2011 were primarily associated with the Sodium Percarbonate phase-out charges of $21.0 million as well as continuing charges related to facility restructurings and shutdowns which were announced in years prior to 2011. Other charges (income) net in 2011 were primarily associated with charges of $3.1 million for environmental remediation at operating sites.
Restructuring and asset disposal charges in 2010 were primarily associated with the Huelva, Spain facility shutdown charges of $110.4 million as well as continuing charges related to facility restructuring and shutdowns which were announced in years prior to 2010. Other charges (income) net in 2010 primarily included charges of $14.2 million for environmental remediation at operating sites and a $5.7 million charge related to our Agricultural Products segment acquiring certain rights to a herbicide still under development.
The activity of the restructuring charges listed above are also included within Note 7 to our consolidated financial statements included in this Form 10-K. We believe the restructuring plans implemented are on schedule and the benefits and savings either have been or will be achieved.
Non-operating pension and postretirement (charges) income
Non-operating pension and postretirement (charges) income are included in “Selling, general and administrative expenses” on our consolidated statements of income.
2012 vs. 2011
The charge for 2012 was
$34.9 million
compared to
$14.5 million
for 2011. The increased charge was primarily the result of higher amortization impacts of actuarial losses of $14.9 million.
2011 vs. 2010
The charge for 2011 was
$14.5 million
compared to $19.9 million for 2010. The decrease in charges is primarily the result of a settlement charge of $7.3 million recorded in 2010 associated with the acceleration of previously deferred pension actuarial losses. The acceleration was triggered by a lump-sum payout to our former Chairman and CEO in 2010. No such event occurred for the year ended December 31, 2011.
Acquisition-related charges
Acquisition-related charges are included in “Costs of sales and services” on our consolidated statements of income.
2012 vs. 2011
The charge in 2012 of $7.2 million, related to the expensing of the inventory fair value step-up resulting from the application of purchase accounting associated with acquisitions completed in 2012 and 2011. The charges for year ended December 31, 2011 relate to a number of acquisitions completed in late 2011. See Note 3 to our consolidated financial statements included in this Form 10-K for more information on our acquisitions.
30
2011 vs. 2010
The charge in 2011 of $0.8 million, related to the expensing of the inventory fair value step-up resulting from the application of purchase accounting related to a number of acquisitions completed in late 2011. No such charges occurred for the year ended December 31, 2010.
Provision for income taxes
2012 vs. 2011
Provision for income taxes is
$146.7 million
for 2012 compared to a provision of
$136.5 million
for the prior year period resulting in effective tax rates of
23.9 percent
and
24.8 percent
, respectively. Excluding the impact of tax adjustments, which were primarily driven by a reduction in our valuation allowance related to state net operating losses expected to be recoverable in future years, our effective rate in 2012 was 26.7 percent versus 25.0 percent in 2011. This increase was driven by slightly higher domestic profits in 2012 versus 2011. Domestic profits are taxed at higher rates as compared to foreign profits.
2011 vs. 2010
Provision for income taxes was
$136.5 million
for 2011 compared to a provision of $132.0 million for the prior year period resulting in effective tax rates of
24.8 percent
and 37.7 percent, respectively. The decrease in the effective tax rate was primarily the result of recording a $40 million valuation allowance in 2010 within our Spanish legal entity, predominantly due to the Huelva facility shutdown, for tax losses that are not expected to be fully recoverable in future years from the earnings of the remaining businesses in that entity. Excluding the impact of the tax adjustments, principally the $40 million valuation allowance, our effective tax rate in 2011 was 25.0 percent versus 26.6 percent in 2010. This decrease in the effective tax rate is primarily due to increased foreign income compared to income earned inside the U.S.. Foreign profits are generally taxed at lower rates as compared to domestic income.
Discontinued operations, net of income taxes
Our discontinued operations represent adjustments to retained liabilities primarily related to operations discontinued between 1976 and 2001. The primary liabilities retained include environmental liabilities, other post-retirement benefit liabilities, self-insurance and long-term obligations related to legal proceedings.
2012 vs. 2011
Discontinued operations, net of income taxes totaled a charge of
$30.2 million
for 2012, compared to a charge of
$31.8 million
2011. The charges for both periods were primarily related to charges for legal reserves and expenses related to discontinued operations and an increase in our reserves for operating and maintenance activities for a number of environmental sites.
2011 vs. 2010
Discontinued operations, net of income taxes totaled a charge of
$31.8 million
for 2011, compared to a charge of $33.6 million 2010. The charges for 2011 and 2010 were primarily related to an increase in reserves associated with our Front Royal site and Middleport site, respectively. The charges for both periods also included an increase in our reserves for operating and maintenance activities for a number of environmental sites and charges for legal reserves and expenses related to discontinued operations.
Net income attributable to FMC stockholders
2012 vs. 2011
Net income attributable to FMC stockholders increased to
$416.2 million
in 2012, from
$365.9 million
in 2011. The increase was primarily due to higher operating profits in our Agricultural Products segment and a lower effective tax rate. These items were partially offset by higher non-operating pension and postretirement charges and slightly reduced Specialty Chemicals results.
2011 vs. 2010
Net income attributable to FMC stockholders increased to $365.9 million for 2011, from $172.5 million for 2010. The increase was primarily due to higher operating profits in all three of our segments, a lower effective tax rate and significantly lower restructuring and other charges (income). These items were partially offset by the increase in LIFO inventory adjustments.
Liquidity and Capital Resources
Cash and cash equivalents at
December 31, 2012
and
2011
, were
$77.1 million
and
$158.9 million
, respectively. Of the cash and cash equivalents balance at
December 31, 2012
, $69.5 million were held by our foreign subsidiaries. Our intent is to reinvest permanently the earnings of our foreign subsidiaries and therefore we have not recorded additional taxes that would be
31
payable if we repatriated these earnings. In the event that funds from our foreign subsidiaries are repatriated to the U.S., we would be required to accrue and pay U.S. taxes on those amounts.
At
December 31, 2012
, we had total debt of
$965.1 million
as compared to
$825.6 million
at
December 31, 2011
. This included
$908.8 million
and
$779.1 million
of long-term debt (excluding current portions of
$5.7 million
and
$19.5 million
) at
December 31, 2012
and
2011
, respectively. Other short-term debt, which consists solely of foreign borrowings, increased to
$50.6 million
at
December 31, 2012
, compared to
$27.0 million
at
December 31, 2011
.
Cash provided by operating activities was
$409.9 million
,
$425.6 million
and
$399.7 million
for
2012
,
2011
and
2010
, respectively.
The table below presents the components of net cash provided by operating activities.
|
Twelve months ended December 31,
|
||||||||
|
2012
|
2011
|
2010
|
||||||
|
Income from continuing operations before equity in (earnings) loss of affiliates, interest income and expense and income taxes
|
658.2
|
|
587.3
|
|
387.1
|
|
||
|
Significant non-cash expenses (1)
|
230.2
|
|
198.4
|
|
268.8
|
|
||
|
Operating income before non-cash expenses (Non-GAAP)
|
888.4
|
|
785.7
|
|
655.9
|
|
||
|
Change in trade receivables (2)
|
(193.7
|
)
|
(77.9
|
)
|
(109.9
|
)
|
||
|
Change in inventories (3)
|
(198.0
|
)
|
(110.5
|
)
|
(7.9
|
)
|
||
|
Change in accounts payable (4)
|
41.2
|
|
24.9
|
|
91.1
|
|
||
|
Change in accrued rebates (5)
|
27.4
|
|
15.3
|
|
33.2
|
|
||
|
Change in advance payments from customers (6)
|
64.1
|
|
44.4
|
|
15.5
|
|
||
|
Change in all other operating assets and liabilities (7)
|
(17.0
|
)
|
1.6
|
|
25.5
|
|
||
|
Restructuring and other spending (8)
|
(13.0
|
)
|
(87.3
|
)
|
(53.4
|
)
|
||
|
Environmental spending, continuing, net of recoveries (9)
|
(7.1
|
)
|
(12.0
|
)
|
(8.9
|
)
|
||
|
Pension and other postretirement benefit contributions (10)
|
(77.5
|
)
|
(67.0
|
)
|
(105.2
|
)
|
||
|
Cash basis operating income (Non-GAAP)
|
514.8
|
|
517.2
|
|
535.9
|
|
||
|
Interest payments
|
(36.2
|
)
|
(36.3
|
)
|
(38.4
|
)
|
||
|
Tax payments
|
(59.0
|
)
|
(47.9
|
)
|
(41.5
|
)
|
||
|
Excess tax benefits from share-based compensation (11)
|
(9.7
|
)
|
(7.4
|
)
|
(56.3
|
)
|
||
|
Cash provided by operating activities
|
409.9
|
|
425.6
|
|
399.7
|
|
||
____________________
|
(1)
|
Represents the sum of depreciation, amortization, non-cash asset write down, share-based compensation, and pension charges.
|
|
(2)
|
Overall, the use of cash for trade receivables in each year is primarily due to revenue increases, particularly for Agricultural Products sales in Brazil where terms are significantly longer than the rest of our businesses.
|
|
(3)
|
The change in inventory from 2011 to 2012 was primarily due to an inventory build to fulfill strong projected 2013 season demand in Agricultural Products and to support continued growth in the business. The change in inventory from 2010 to 2011 resulted in a use of cash primarily due to an inventory build to fulfill 2012 first quarter demand in Agricultural Products, particularly in North America and Latin America.
|
|
(4)
|
The source of cash in 2012 was due to the increased inventory build at the end of 2012 to satisfy projected 2013 demand. The source of cash in 2011 was driven by continued focus on vendor terms and trade practices as well as the increased inventory build at the end of 2011 to satisfy demand. In 2010 accounts payable increased as a result of higher focus on payables management.
|
32
|
(5)
|
These rebates are associated with our Agricultural Products segment and are primarily in North America and Brazil and generally settle in the fourth quarter of each year. The changes year over year are primarily associated with timing of payments and increased sales.
|
|
(6)
|
The advance payments from customers represent advances from our Agricultural Products segment customers. The source for each year presented are consistent with our sales increases year over each year and our projected demand in early 2013.
|
|
(7)
|
Changes in all periods presented primarily represent timing of payments associated with all other operating assets and liabilities.
|
|
(8)
|
See Note 7 in our consolidated financial statements included in this Form 10-K for further details.
|
|
(9)
|
Included in our income for each of the years presented are environmental charges of $5.8 million, $3.1 million, and $14.2 million for environmental and remediation at our operating sites. The amounts in 2012 will be spent in future years. The amounts represent environmental remediation spending at our operating sites which were recorded against pre-existing reserves, net of recoveries.
|
|
(10)
|
Amounts include voluntary contributions to our U.S. defined benefit plan of $65 million, $55 million and $80 million, respectively. In 2010 the amount also includes a lump-sum payout of approximately $15 million from our nonqualified pension plan.
|
|
(11)
|
Amounts are presented as a financing activity in the statement of cash flows, from share-based compensation. The 2010 amount was due to the use of our U.S. Federal net operating losses generated in year 2006-2010. The excess tax benefits for 2012 and 2011 were generated solely in those years. See Note 14 to our consolidated financial statements included in this Form 10-K for further discussion on these excess tax benefits.
|
Cash required by operating activities of discontinued operations was
$50.2 million
,
$44.3 million
and
$45.2 million
for
2012
,
2011
and
2010
, respectively.
The increase from 2011 to 2012 is a result of increased spending against reserves for legal proceedings associated with discontinued operations. Discontinued environmental spending was $23.3 million in 2012 compared to $21.1 million in 2011 and $17.1 million in 2010.
Cash required by investing activities was
$393.6 million
,
$358.0 million
and
$154.0 million
for
2012
,
2011
and
2010
, respectively.
Increased spending from 2011 to 2012 is primarily due to higher capital spending associated with capital expansions, primarily in our Alkali, BioPolmer and Lithium divisions, and as well as increased expenditures related to our Agricultural Products segment contract manufacturers. The change from 2010 to 2011 was primarily due to the acquisitions completed during 2011 and higher capital spending associated with capacity expansions as compared to 2010. See Note 3 to the consolidated financial statements included within this Form 10-K for more information on the 2012 and 2011 acquisitions.
Cash required by financing activities was
$48.2 million
,
$25.3 million
and
$116.6 million
in
2012
,
2011
and
2010
, respectively.
The use of cash in 2012 as compared to 2011 was primarily due to lower proceeds from long term debt borrowings, slightly offset by higher borrowings under our credit facility and lower repayments of scheduled long term debt maturities. The change in 2011 compared to 2010 was primarily due to the issuance of our senior debt notes during 2011 which resulted in a cash inflow of approximately $300 million. This inflow was partially offset by repayments of other long term debt during the year and increased capital stock repurchases as compared to 2010.
Other potential liquidity needs
Our cash needs for 2013 include operating cash requirements, capital expenditures, scheduled mandatory payments of long-term debt, dividend payments, share repurchases, contributions to our pension plans, environmental and asset retirement obligation spending and restructuring. We plan to meet our liquidity needs through available cash, cash generated from operations and borrowings under our committed revolving credit facility.
Projected 2013 capital expenditures as well as expenditures related to contract manufacturers are expected to be approximately 30 percent higher than 2012 levels, primarily to increase capacity in BioPolymer, lithium and soda ash.
Projected 2013 spending includes approximately $40 million of net environmental remediation spending. This spending does not include expected spending of approximately $10 million in 2013 on capital projects relating to environmental control facilities. Also, we expect to spend approximately $30 million in 2013 for environmental compliance costs, which we will include as a component of costs of sales and services in our consolidated statements of income since these amounts are not covered by established reserves. Capital spending to expand, maintain or replace equipment at our production facilities may trigger requirements for upgrading our environmental controls, which may increase our spending for environmental controls over the foregoing projections.
33
Our U.S. Pension Plan assets increased slightly from $853.9 million at December 31, 2011 to $984.0 million at December 31, 2012. Our U.S. Pension Plan assets comprise approximately 93 percent of our total plan assets with the difference representing plan assets related to foreign pension plans. See Note 13 to the consolidated financial statements included within this Form 10-K for details on how we develop our long-term rate of return assumptions. We made contributions of $65 million and $55 million in 2012 and 2011, respectively and intend to contribute $40 million in 2013. Our contributions in 2011, 2012 and our intended contribution in 2013 are all in excess of the minimum requirements. Our contributions in excess of the minimum requirement are done with the objective of reducing future funding volatility. We do not believe that this additional contribution in 2013 will have a material impact on our current and future liquidity needs. However, a continuation of the volatility of interest rates and negative equity returns under current market conditions may require greater contributions to the Plan in the future.
On February 17, 2012, the Board authorized the repurchase of up to an additional $250 million of our common stock. At
December 31, 2012
,
$244.8 million
remained unused under the Board-authorized repurchase program. The repurchase program does not include a specific timetable or price targets and may be suspended or terminated at any time. Shares may be purchased through open market or privately negotiated transactions at the discretion of management based on its evaluation of market conditions and other factors. During the year ended
December 31, 2012
,
3,072,540
shares were repurchased under the publicly announced repurchase program for
$144.9 million
.
The Dodd-Frank Wall Street Reform and Consumer Protection Act (the "Dodd-Frank Act") was signed into law and Title VII of the Act contains significant changes in the ways derivatives are regulated. Several U.S. government regulatory agencies and departments are charged with developing the many regulations required under the new law. While the exact effects on FMC cannot be known until final regulations are promulgated, we believe they will not adversely affect our liquidity in a material way.
Commitments
We provide guarantees to financial institutions on behalf of certain Agricultural Products customers, principally Brazilian customers, for their seasonal borrowing. The total of these guarantees was
$31.4 million
and
$18.5 million
at
December 31, 2012
, and
2011
, respectively, and are recorded on the consolidated balance sheets for each date as “Guarantees of vendor financing”.
Short-term debt consisted of foreign credit lines at
December 31, 2012
, and
2011
. We provide parent-company guarantees to lending institutions providing credit to our foreign subsidiaries.
We continually evaluate our options for divesting real estate holdings and property, plant and equipment that are no longer integral to our operating businesses. In connection with our property and asset sales and divestitures, we have agreed to indemnify the buyer for certain liabilities, including environmental contamination and taxes that occurred prior to the date of sale. Our indemnification obligations with respect to these liabilities may be indefinite as to duration and may or may not be subject to a deductible, minimum claim amount or cap. As such, it is not possible for us to predict the likelihood that a claim will be made or to make a reasonable estimate of the maximum potential loss or range of loss. If triggered, we may be able to recover certain of the indemnity payments from third parties. We have not recorded any specific liabilities for these guarantees.
Our total significant committed contracts that we believe will affect cash over the next four years and beyond are as follows:
|
Contractual Commitments
|
Expected Cash Payments by Year
|
||||||||||||||||||||||
|
(in Millions)
|
2013
|
2014
|
2015
|
2016
|
2017 &
beyond
|
Total
|
|||||||||||||||||
|
Debt maturities (1)
|
$
|
56.3
|
|
$
|
33.3
|
|
$
|
0.9
|
|
$
|
131.0
|
|
$
|
745.6
|
|
$
|
967.1
|
|
|||||
|
Contractual interest (2)
|
41.4
|
|
40.9
|
|
40.2
|
|
38.4
|
|
252.4
|
|
413.3
|
|
|||||||||||
|
Lease obligations (3)
|
29.0
|
|
30.8
|
|
30.6
|
|
21.3
|
|
38.7
|
|
150.4
|
|
|||||||||||
|
Certain long-term liabilities (4)
|
5.7
|
|
6.2
|
|
6.3
|
|
6.3
|
|
51.7
|
|
76.2
|
|
|||||||||||
|
Derivative contracts
|
2.2
|
|
—
|
|
—
|
|
—
|
|
—
|
|
2.2
|
|
|||||||||||
|
Purchase obligations (5)
|
41.9
|
|
13.3
|
|
4.7
|
|
1.2
|
|
20.1
|
|
81.2
|
|
|||||||||||
|
Total (6)
|
$
|
176.5
|
|
$
|
124.5
|
|
$
|
82.7
|
|
$
|
198.2
|
|
$
|
1,108.5
|
|
$
|
1,690.4
|
|
|||||
____________________
|
(1)
|
Excluding discounts.
|
|
(2)
|
Contractual interest is the interest we are contracted to pay on our long-term debt obligations. We had $147.7 million of long-term debt subject to variable interest rates at
December 31, 2012
. The rate assumed for the variable interest component of the contractual interest obligation was the rate in effect at
December 31, 2012
. Variable rates are determined by the market and will fluctuate over time.
|
34
|
(3)
|
Before sub-lease rental income.
|
|
(4)
|
Obligations associated with our Ewing research and development facility and our Shanghai innovation center.
|
|
(5)
|
Purchase obligations consist of agreements to purchase goods and services that are enforceable and legally binding on us and specify all significant terms, including fixed or minimum quantities to be purchased, price provisions and timing of the transaction. We have entered into a number of purchase obligations for the sourcing of materials and energy where take-or-pay arrangements apply. Since the majority of the minimum obligations under these contracts are take-or-pay commitments over the life of the contract as opposed to a year by year take-or-pay, the obligations in the table related to these types of contacts are presented in the earliest period in which the minimum obligation could be payable under these types of contracts.
|
|
(6)
|
As of December 31, 2012, the liability for uncertain tax positions was
$23.3 million
and this liability is excluded from the table above. Additionally, accrued pension and other postretirement benefits and our environmental liabilities as recorded on our consolidated balance sheets are excluded from the table above. Due to the high degree of uncertainty regarding the timing of potential future cash flows associated with these liabilities, we are unable to make a reasonably reliable estimate of the amount and periods in which these liabilities might be paid.
|
Contingencies
See Note 18 to our consolidated financial statements included in this Form 10-K.
Climate Change
We have been following legislative and regulatory developments regarding climate change because the regulation of greenhouse gases, depending on their nature and scope, could subject some of our manufacturing operations to additional costs or limits on operations. Our Alkali Chemicals Division mines and refines trona ore into soda ash and related products at our Westvaco and Granger facilities near Green River, Wyoming. This activity constitutes most of FMC's greenhouse gas emissions globally. In 2012, we reported approximately 2.0 million metric tons of direct emissions from the Green River operations for 2011.
In the absence of federal climate change legislation in the United States, EPA has moved forward with a finding of “endangerment” and a promulgated “tailoring rule” to apply the Prevention of Significant Deterioration (PSD) provisions of the Clean Air Act to greenhouse gas emissions. We have previously announced engineering of a major process optimization involving secondary recovery solution mining to return Granger to nameplate capacity. The innovative project will reduce our energy and carbon intensity. FMC has submitted to EPA a PSD permit application for greenhouse gas emissions associated with the Granger optimization project. We have incorporated the scheduling impact of this PSD permitting into our project time line.
A significant source of greenhouse gas emissions at the Green River operations are emissions from the beneficiation of trona ore. That is, a significant portion of the greenhouse gases released during the mining and refining of soda ash occurs naturally in the trona ore feedstock. Unlike the situation with energy efficiency, where efficiencies may result in a reduction of greenhouse gases, the amount of greenhouse gases present in the trona ore cannot be reduced. All of the companies producing natural soda ash have such refining emissions. Yet, the lower energy intensity of natural soda ash provides a favorable carbon intensity compared with synthetic soda ash produced throughout the rest of the world. Even with the additional emissions from the operation of the Granger facility, our carbon emission intensity is expected to remain favorable compared to our synthetic soda ash competition.
Soda ash is an essential raw material in the production of glass of all kinds. Climate change, energy intensity and alternative forms of energy will drive increased production of new forms of glass (lower emissivity glass, solar panel glass, etc.) and will increase the need for this essential raw material from FMC. The soda ash industry has an interest in assuring that climate change legislation or regulation recognizes the benefits of soda ash (particularly natural soda ash) and the challenges facing this industry in controlling its greenhouse gas emissions.
Because of the many variables, it is premature to make any estimate of the costs of complying with possible future federal climate change legislation in the United States. However, we are aware of the potential impacts that could result from emissions regulations in the U.S. that are more stringent than those experienced by our global competitors. These could make it more difficult for us to competitively produce natural soda ash at Green River. A reduction in natural soda ash production as a result of more stringent regulations in the U.S. would lead to more greenhouse gas emissions globally because the lost supply of natural soda ash would be replaced by the more costly and more greenhouse gas intensive synthetic soda ash.
In 2012, two US plants in our BioPolymer business also reported emissions above the EPA's reporting threshold, but each plant's emissions are substantially less than at our Green River operations, in total less than 0.1 million metric tons.
35
At this point our U.S. facilities are not subject to any state or regional greenhouse gas regulation that limits or imposes fees on current emissions, and our foreign operations outside of Europe and Canada are not subject to national or local greenhouse gas regulation. Although some of our European and Canadian operations may be subject to greenhouse gas regulation, the cost to these facilities has not been and is not expected to be material to FMC.
We have considered the potential physical risks to FMC facilities and operations and the indirect consequences of regulation or business trends as a result of potential future climate change. Because of the many variables with respect to the nature and effect of future global climate change regulation, it is impossible to predict in any meaningful way what type of property damage or disruptions to our operations or indirect consequences might result from future climate change.
Recently Adopted and Issued Accounting Pronouncements and Regulatory Items
See Note 2 to our consolidated financial statements included in this Form 10-K.
Critical Accounting Policies
Our consolidated financial statements are prepared in conformity with U.S. generally accepted accounting principles (U.S. GAAP) . The preparation of these financial statements requires us to make estimates and judgments that affect the reported amounts of assets, liabilities, revenues and expenses. We have described our accounting policies in Note 1 to our consolidated financial statements included in this Form 10-K. We have reviewed these accounting policies, identifying those that we believe to be critical to the preparation and understanding of our consolidated financial statements. We have reviewed these critical accounting policies with the Audit Committee of the Board of Directors. Critical accounting policies are central to our presentation of results of operations and financial condition in accordance with U.S. GAAP and require management to make estimates and judgments on certain matters. We base our estimates and judgments on historical experience, current conditions and other reasonable factors.
Environmental obligations and related recoveries
We provide for environmental-related obligations when they are probable and amounts can be reasonably estimated. Where the available information is sufficient to estimate the amount of liability, that estimate has been used. Where the information is only sufficient to establish a range of probable liability and no point within the range is more likely than any other, the lower end of the range has been used.
Estimated obligations to remediate sites that involve oversight by the United States Environmental Protection Agency (“EPA”), or similar government agencies, are generally accrued no later than when a Record of Decision (“ROD”), or equivalent, is issued, or upon completion of a Remedial Investigation/Feasibility Study (“RI/FS”), or equivalent, that is submitted by us to the appropriate government agency or agencies. Estimates are reviewed quarterly by our environmental remediation management, as well as by financial and legal management and, if necessary, adjusted as additional information becomes available. The estimates can change substantially as additional information becomes available regarding the nature or extent of site contamination, required remediation methods, and other actions by or against governmental agencies or private parties.
Our environmental liabilities for continuing and discontinued operations are principally for costs associated with the remediation and/or study of sites at which we are alleged to have released hazardous substances into the environment. Such costs principally include, among other items, RI/FS, site remediation, costs of operation and maintenance of the remediation plan, management costs, fees to outside law firms and consultants for work related to the environmental effort, and future monitoring costs. Estimated site liabilities are determined based upon existing remediation laws and technologies, specific site consultants’ engineering studies or by extrapolating experience with environmental issues at comparable sites.
Included in our environmental liabilities are costs for the operation, maintenance and monitoring of site remediation plans (OM&M). Such reserves are based on our best estimates for these OM&M plans. Over time we may incur OM&M costs in excess of these reserves. However, we are unable to reasonably estimate an amount in excess of our recorded reserves because we cannot reasonably estimate the period for which such OM&M plans will need to be in place or the future annual cost of such remediation, as conditions at these environmental sites change over time. Such additional OM&M costs could be significant in total but would be incurred over an extended period of years.
Included in the environmental reserve balance, other assets balance and disclosure of reasonably possible loss contingencies are amounts from third party insurance policies, which we believe are probable of recovery.
Provisions for environmental costs are reflected in income, net of probable and estimable recoveries from named Potentially Responsible Parties (“PRPs”) or other third parties. Such provisions incorporate inflation and are not discounted to their present values.
36
In calculating and evaluating the adequacy of our environmental reserves, we have taken into account the joint and several liability imposed by Comprehensive Environmental Response, Compensation and Liability Act (“CERCLA”) and the analogous state laws on all PRPs and have considered the identity and financial condition of the other PRPs at each site to the extent possible. We have also considered the identity and financial condition of other third parties from whom recovery is anticipated, as well as the status of our claims against such parties. Although we are unable to forecast the ultimate contributions of PRPs and other third parties with absolute certainty, the degree of uncertainty with respect to each party is taken into account when determining the environmental reserve by adjusting the reserve to reflect the facts and circumstances on a site-by-site basis. Our liability includes our best estimate of the costs expected to be paid before the consideration of any potential recoveries from third parties. We believe that any recorded recoveries related to PRPs are realizable in all material respects. Recoveries are recorded as either an offset in “Environmental liabilities, continuing and discontinued” or as “Other Assets” in our consolidated balance sheets in accordance with U.S. accounting literature.
See Note 10 to our consolidated financial statements included in this Form 10-K for changes in estimates associated with our environmental obligations.
Impairments and valuation of long-lived assets
Our long-lived assets primarily include property, plant and equipment, goodwill and intangible assets. The assets and liabilities of acquired businesses are measured at their estimated fair values at the dates of acquisition. The excess of the purchase price over the estimated fair value of the net assets acquired, including identified intangibles, is recorded as goodwill. The determination and allocation of fair value to the assets acquired and liabilities assumed is based on various assumptions and valuation methodologies requiring considerable management judgment, including estimates based on historical information, current market data and future expectations. The principal assumptions utilized in our valuation methodologies include revenue growth rates, operating margin estimates and discount rates. Although the estimates were deemed reasonable by management based on information available at the dates of acquisition, those estimates are inherently uncertain.
We test for impairment whenever events or circumstances indicate that the net book value of our property, plant and equipment may not be recoverable from the estimated undiscounted expected future cash flows expected to result from their use and eventual disposition. In cases where the estimated undiscounted expected future cash flows are less than net book value, an impairment loss is recognized equal to the amount by which the net book value exceeds the estimated fair value of assets, which is based on discounted cash flows at the lowest level determinable. The estimated cash flows reflect our assumptions about selling prices, volumes, costs and market conditions over a reasonable period of time.
We perform an annual impairment test of goodwill and indefinite-lived intangible assets in the third quarter of each year, or more frequently whenever an event or change in circumstances occur that would require reassessment of the recoverability of those assets. In 2012, we adopted new accounting guidance issued by the Financial Accounting Standards Board related to the testing of goodwill and indefinite-lived intangible assets for impairment. This new guidance allows us the option to first assess qualitative factors to determine whether it is more likely than not that the fair value of a reporting unit is less than its carrying amount. If after assessing qualitative factors it is determined that it is more likely than not that the fair value of the reporting unit is less than its carrying amount, we would need to perform a more detailed impairment test. The more detailed impairment test is used to identify potential goodwill and indefinite-lived intangible asset impairments and to measure the amount of impairment losses to be recognized, if any.
We performed this test utilizing the new guidance in 2012. We assessed qualitative factors such as overall financial performance of our reporting units, anticipated changes in industry and market structure, competitive environments, planned capacity and cost factors such as raw material prices. Based on our assessment we determined that no impairment charge was required. See Note 2 to our consolidated financial statements included in this Form 10-K for accounting guidance adopted in 2012 associated with the annual impairment test.
See Note 7 to our consolidated financial statements included in this Form 10-K for charges associated with long-lived asset disposal costs and the activity associated with the restructuring reserves.
Pension and other postretirement benefits
We provide qualified and nonqualified defined benefit and defined contribution pension plans, as well as postretirement health care and life insurance benefit plans to our employees and retirees. The costs (benefits) and obligations related to these benefits reflect key assumptions related to general economic conditions, including interest (discount) rates, healthcare cost trend rates, expected rates of return on plan assets and the rates of compensation increase for employees. The costs (benefits) and obligations for these benefit programs are also affected by other assumptions, such as average retirement age, mortality, employee turnover, and plan participation. To the extent our plans’ actual experience, as influenced by changing economic and financial market conditions or by changes to our own plans’ demographics, differs from these assumptions, the costs and
37
obligations for providing these benefits, as well as the plans’ funding requirements, could increase or decrease. When actual results differ from our assumptions, the difference is typically recognized over future periods. In addition, the unrealized gains and losses related to our pension and postretirement benefit obligations may also affect periodic benefit costs (benefits) in future periods.
We use several assumptions and statistical methods to determine the asset values used to calculate both the expected rate of return on assets component of pension cost and to calculate our plans’ funding requirements. The expected rate of return on plan assets is based on a market-related value of assets that recognizes investment gains and losses over a five-year period. We use an actuarial value of assets to determine our plans’ funding requirements. The actuarial value of assets must be within a certain range, high or low, of the actual market value of assets, and is adjusted accordingly.
We select the discount rate used to calculate pension and other postretirement obligations based on a review of available yields on high-quality corporate bonds as of the measurement date. In selecting a discount rate as of December 31, 2012, we placed particular emphasis on a discount rate yield-curve provided by our actuary. This yield-curve when populated with projected cash flows that represented the expected timing and amount of our plans' benefit payments, produced a single effective interest discount rate of 4.15 percent, which was used to measure the plan's liabilities.
The discount rates used at our December 31, 2012 and 2011 measurement dates were 4.15 percent and 4.95 percent, respectively. The effect of the change in the discount rate from 4.95 percent to 4.15 percent at December 31, 2012 resulted in a $121.3 million increase to our pension and other postretirement benefit obligations. The effect of the change in the discount rate from 5.40 percent at December 31, 2010 to 4.95 percent at December 31, 2011 resulted in a $6.7 million increase to 2012 pension and other postretirement benefit expense.
The change in discount rate from 4.95 percent at December 31, 2011 to 4.15 percent at December 31, 2012 was attributable to a decrease in yields on high quality corporate bonds with cash flows matching the timing and amount of our expected future benefit payments between the 2011 and 2012 measurement dates. Using the December 31, 2011 yield curve, our plan cash flows produced a single weighted-average discount rate of approximately 4.95 percent. Matching our plan cash flows to a similarly constructed curve reflecting high-yielding bonds available as of December 31, 2012, resulted in a single weighted-average discount rate of approximately 4.15 percent.
In developing the assumption for the long-term rate of return on assets for our U.S. Plan, we take into consideration the technical analysis performed by our outside actuaries, including historical market returns, information on the assumption for long-term real returns by asset class, inflation assumptions, and expectations for standard deviation related to these best estimates. We also consider the historical performance of our own plan’s trust, which has earned a compound annual rate of return of approximately 9.6 percent over the last 20 years (which is in excess of comparable market indices for the same period) as well as other factors which are discussed in Note 13 to our consolidated financial statements in this Form 10-K. Our long-term rate of return for 2011 and 2010 was 8.5 percent which we adjusted downward to 7.75 percent for 2012. The effect of the change in the long-term rate of return from 8.5 percent during 2011 to 7.75 percent during 2012 resulted in a $6.4 million increase to 2012 pension and other postretirement benefit expense.
For the sensitivity of our pension costs to incremental changes in assumptions see our discussion below.
Sensitivity analysis related to key pension and postretirement benefit assumptions.
A one-half percent increase in the assumed discount rate would have decreased pension and other postretirement benefit obligations by $77.8 million and $66.9 million at December 31, 2012 and 2011, respectively, and decreased pension and other postretirement benefit costs by $8.2 million, $6.5 million and $6.4 million for 2012, 2011 and 2010, respectively. A one-half percent decrease in the assumed discount rate would have increased pension and other postretirement benefit
obligations by $85.7 million and $73.7 million at December 31, 2012 and 2011, respectively, and increased pension and other postretirement benefit net periodic benefit cost by $8.4 million, $6.6 million and $6.5 million for 2012, 2011 and 2010, respectively.
A one-half percent increase in the assumed expected long-term rate of return on plan assets would have decreased pension costs by $4.7 million, $4.6 million and $4.5 million for 2012, 2011 and 2010, respectively. A one-half percent decrease in the assumed long-term rate of return on plan assets would have increased pension costs by $4.7 million, $4.6 million and $4.5 million for 2012, 2011 and 2010, respectively.
Further details on our pension and other postretirement benefit obligations and net periodic benefit costs (benefits) are found in Note 13 to our consolidated financial statements in this Form 10-K.
38
Income taxes
We have recorded a valuation allowance to reduce deferred tax assets to the amount that we believe is more likely than not to be realized. In assessing the need for this allowance, we have considered a number of factors including future taxable income, the jurisdictions in which such income is earned and our ongoing tax planning strategies. In the event that we determine that we would not be able to realize all or part of our net deferred tax assets in the future, an adjustment to the deferred tax assets would be charged to income in the period such determination was made. Similarly, should we conclude that we would be able to realize certain deferred tax assets in the future in excess of the net recorded amount, an adjustment to the deferred tax assets would increase income in the period such determination was made.
Additionally, we file income tax returns in the U.S. federal jurisdiction and various state and foreign jurisdictions. The income tax returns for FMC entities taxable in the U.S. and significant foreign jurisdictions are open for examination and adjustment. We assess our income tax positions and record a liability for all years open to examination based upon our evaluation of the facts, circumstances and information available at the reporting date. For those tax positions where it is more likely than not that a tax benefit will be sustained, we have recorded the largest amount of tax benefit with a greater than 50% likelihood of being realized upon ultimate settlement with a taxing authority that has full knowledge of all relevant information. We adjust these liabilities, if necessary, upon the completion of tax audits or changes in tax law.
See Note 11 to our consolidated financial statements included in this Form 10-K for additional discussion surrounding income taxes.
Off-Balance Sheet Arrangements
We do not have any off-balance sheet arrangements that have or are reasonably likely to have a current or future effect on our financial condition, revenues or expenses, results of operations, liquidity, capital expenditures or capital resources that is material to investors.
Dividends
On
January 17, 2013
, we paid dividends aggregating
$18.7 million
to our shareholders of record as of
December 31, 2012
. This amount is included in “Accrued and other liabilities” on the consolidated balance sheets as of
December 31, 2012
. For the years ended
December 31, 2012
,
2011
and
2010
, we paid
$47.8 million
,
$41.2 million
and
$36.4 million
in dividends, respectively.
Fair Value Measurements
See Note 17 to our consolidated financial statements included in this Form 10-K for additional discussion surrounding our fair value measurements.
|
ITEM 7A.
|
QUANTITATIVE AND QUALITATIVE DISCLOSURES ABOUT MARKET RISK
|
Our earnings, cash flows, and financial position are exposed to market risks relating to fluctuations in commodity prices, interest rates and foreign currency exchange rates. Our policy is to minimize exposure to our cash flow over time caused by changes in commodity, interest and currency exchange rates. To accomplish this, we have implemented a controlled program of risk management consisting of appropriate derivative contracts entered into with major financial institutions.
The analysis below presents the sensitivity of the market value of our financial instruments to selected changes in market rates and prices. The range of changes chosen reflects our view of changes that are reasonably possible over a one-year period. Market-value estimates are based on the present value of projected future cash flows considering the market rates and prices chosen.
At
December 31, 2012
, our net financial instrument position was a net liability of
$2.2 million
compared to a net liability of
$5.9 million
at
December 31, 2011
. The change in the net financial instrument position was primarily due to lower unrealized losses in our commodity and foreign exchange portfolios.
Since our risk management programs are generally highly effective, the potential loss in value for each risk management portfolio described below would be largely offset by changes in the value of the underlying exposure.
Commodity Price Risk
Energy costs are approximately seven percent of our cost of sales and services and are diversified among coal, electricity, and natural gas. We attempt to mitigate our exposure to increasing energy costs by hedging the cost of future deliveries of natural gas and by entering into fixed-price contracts for the purchase of coal and fuel oil. To analyze the effect of changing energy prices, we have performed a sensitivity analysis in which we assume an instantaneous 10 percent change in energy market prices from their levels at
December 31, 2012
and
2011
, with all other variables (including interest rates) held constant. A 10
39
percent increase in energy market prices would result in a decrease in the net liability position of $4.6 million at
December 31, 2012
, compared to a $2.5 million decrease of the net liability position at
December 31, 2011
. As a result, at December 31, 2012, the net liability position would have become a net asset. A 10 percent decrease in energy market prices would result in an increase of $4.1 million in the net liability position at
December 31, 2012
, compared to an increase of $2.5 million of the net liability position at
December 31, 2011
.
Our Agricultural Products segment enters into contracts with certain customers in Brazil to exchange our products for future physical delivery of soybeans. To mitigate the price risk associated with these barter contracts, we enter into offsetting derivatives to hedge our exposure. As of
December 31, 2012
and
2011
our net financial instrument position was immaterial.
Foreign Currency Exchange Rate Risk
The primary currencies for which we have exchange rate exposure are the U.S. dollar versus the euro, the U.S. dollar versus the Chinese yuan and the U.S. dollar versus the Brazilian real. Foreign currency debt and foreign exchange forward contracts are used in countries where we do business, thereby reducing our net asset exposure. Foreign exchange forward contracts are also used to hedge firm and highly anticipated foreign currency cash flows.
To analyze the effects of changing foreign currency rates, we have performed a sensitivity analysis in which we assume an instantaneous 10 percent change in the foreign currency exchange rates from their levels at
December 31, 2012
and
2011
, with all other variables (including interest rates) held constant. A 10 percent strengthening of hedged currencies versus our functional currencies would have resulted in a decrease of $5.5 million in the net liability position at December 31, 2012, compared to an increase of $2.4 million in the net asset position at
December 31, 2011
. As a result, at December 31, 2012, the net liability position would have become a net asset. A 10 percent weakening of hedged currencies versus our functional currencies would have resulted in an increase of $4.3 million in the net liability position at
December 31, 2012
, compared to a decrease of $2.1 million in the net asset position at
December 31, 2011
.
Interest Rate Risk
One of the strategies that we can use to manage interest rate exposure is to enter into interest rate swap agreements. In these agreements, we agree to exchange, at specified intervals, the difference between fixed and variable interest amounts calculated on an agreed-upon notional principal amount. As of
December 31, 2012
and
2011
, we had no interest rate swap agreements.
Our debt portfolio, at
December 31, 2012
, is composed of 83 percent fixed-rate debt and 17 percent variable-rate debt. The variable-rate component of our debt portfolio principally consists of borrowings under our 2011 credit agreement, variable-rate industrial and pollution control revenue bonds, and amounts outstanding under foreign subsidiary credit lines. Changes in interest rates affect different portions of our variable-rate debt portfolio in different ways.
Based on the variable-rate debt in our debt portfolio at
December 31, 2012
, a one percentage point increase in interest rates would have increased gross interest expense by $1.6 million and a one percentage point decrease in interest rates would have decreased gross interest expense by $1.5 million for the year ended
December 31, 2012
.
The following are included herein:
|
(1)
|
Consolidated Statements of Income for the years ended
December 31, 2012
,
2011
and
2010
|
|
(2)
|
Consolidated Statements of Comprehensive Income for the year ended
December 31, 2012
,
2011
and
2010
|
|
(3)
|
Consolidated Balance Sheets as of
December 31, 2012
and
2011
|
|
(4)
|
Consolidated Statements of Cash Flows for the years ended
December 31, 2012
,
2011
and
2010
|
|
(5)
|
Consolidated Statements of Changes in Equity for the years ended
December 31, 2012
,
2011
and
2010
|
|
(6)
|
N
otes to Consolidated Financial Statements
|
|
(7)
|
Report of Independent Registered Public Accounting Firm
|
|
(8)
|
Management’s Report on Internal Control over Financial Reporting
|
|
(9)
|
Report of Independent Registered Public Accounting Firm
|
40
FMC CORPORATION
|
(in Millions, Except Per Share Data)
|
Year Ended December 31,
|
||||||||||
|
2012
|
2011
|
2010
|
|||||||||
|
Revenue
|
$
|
3,748.3
|
|
$
|
3,377.9
|
|
$
|
3,116.3
|
|
||
|
Costs and Expenses
|
|||||||||||
|
Costs of sales and services
|
2,407.1
|
|
2,210.5
|
|
2,065.6
|
|
|||||
|
Gross Margin
|
1,341.2
|
|
1,167.4
|
|
1,050.7
|
|
|||||
|
Selling, general and administrative expenses
|
527.1
|
|
442.5
|
|
411.2
|
|
|||||
|
Research and development expenses
|
117.8
|
|
105.2
|
|
100.5
|
|
|||||
|
Restructuring and other charges (income)
|
38.1
|
|
32.4
|
|
151.9
|
|
|||||
|
Total costs and expenses
|
3,090.1
|
|
2,790.6
|
|
2,729.2
|
|
|||||
|
Income from continuing operations before equity in (earnings) loss of affiliates, interest income and expense and income taxes
|
658.2
|
|
587.3
|
|
387.1
|
|
|||||
|
Equity in (earnings) loss of affiliates
|
0.3
|
|
(2.6
|
)
|
(2.7
|
)
|
|||||
|
Interest income
|
(0.1
|
)
|
(0.1
|
)
|
(0.2
|
)
|
|||||
|
Interest expense
|
45.4
|
|
39.5
|
|
39.5
|
|
|||||
|
Income from continuing operations before income taxes
|
612.6
|
|
550.5
|
|
350.5
|
|
|||||
|
Provision for income taxes
|
146.7
|
|
136.5
|
|
132.0
|
|
|||||
|
Income from continuing operations
|
465.9
|
|
414.0
|
|
218.5
|
|
|||||
|
Discontinued operations, net of income taxes
|
(30.2
|
)
|
(31.8
|
)
|
(33.6
|
)
|
|||||
|
Net income
|
435.7
|
|
382.2
|
|
184.9
|
|
|||||
|
Less: Net income attributable to noncontrolling interests
|
19.5
|
|
16.3
|
|
12.4
|
|
|||||
|
Net income attributable to FMC stockholders
|
$
|
416.2
|
|
$
|
365.9
|
|
$
|
172.5
|
|
||
|
Amounts attributable to FMC stockholders:
|
|||||||||||
|
Continuing operations, net of income taxes
|
$
|
446.4
|
|
$
|
397.7
|
|
$
|
206.1
|
|
||
|
Discontinued operations, net of income taxes
|
(30.2
|
)
|
(31.8
|
)
|
(33.6
|
)
|
|||||
|
Net income
|
$
|
416.2
|
|
$
|
365.9
|
|
$
|
172.5
|
|
||
|
Basic earnings (loss) per common share attributable to FMC stockholders:
|
|||||||||||
|
Continuing operations
|
$
|
3.23
|
|
$
|
2.79
|
|
$
|
1.42
|
|
||
|
Discontinued operations
|
(0.22
|
)
|
(0.22
|
)
|
(0.23
|
)
|
|||||
|
Net income
|
$
|
3.01
|
|
$
|
2.57
|
|
$
|
1.19
|
|
||
|
Diluted earnings (loss) per common share attributable to FMC stockholders:
|
|||||||||||
|
Continuing operations
|
$
|
3.22
|
|
$
|
2.77
|
|
$
|
1.41
|
|
||
|
Discontinued operations
|
(0.22
|
)
|
(0.22
|
)
|
(0.23
|
)
|
|||||
|
Net income
|
$
|
3.00
|
|
$
|
2.55
|
|
$
|
1.18
|
|
||
The accompanying notes are an integral part of these consolidated financial statements.
41
FMC CORPORATION AND CONSOLIDATED SUBSIDIARIES
CONSOLIDATED STATEMENTS OF COMPREHENSIVE INCOME
|
(in Millions)
|
Year Ended December 31,
|
||||||||||
|
2012
|
2011
|
2010
|
|||||||||
|
Net Income
|
$
|
435.7
|
|
$
|
382.2
|
|
$
|
184.9
|
|
||
|
Other comprehensive income (loss), net of tax:
|
|||||||||||
|
Foreign currency translation adjustments (1)
|
2.5
|
|
(15.0
|
)
|
(26.0
|
)
|
|||||
|
Derivative instruments:
|
|||||||||||
|
Unrealized hedging gains (losses) and other, net of tax of ($0.1), ($5.3), ($3.2)
|
(0.2
|
)
|
(10.3
|
)
|
(5.9
|
)
|
|||||
|
Reclassification of deferred hedging (gains) losses and other, included in net income, net of tax of $3.0, $3.4 and $1.4
|
5.9
|
|
6.6
|
|
2.5
|
|
|||||
|
Total derivative instruments, net of tax of $2.9, ($1.9) and ($1.8)
|
5.7
|
|
(3.7
|
)
|
(3.4
|
)
|
|||||
|
Pension and other postretirement benefits:
|
|||||||||||
|
Unrealized actuarial gains (losses) and prior service (costs) credits, net of tax of ($30.8), ($47.1) and ($16.8)
|
(57.3
|
)
|
(80.3
|
)
|
(23.4
|
)
|
|||||
|
Reclassification of net actuarial and other (gain) loss and amortization of prior service costs, included in net income, net of tax of $18.4, $13.3 and $12.4
|
30.4
|
|
20.1
|
|
19.9
|
|
|||||
|
Total pension and other postretirement benefits, net of tax of ($12.4), ($33.8) and ($4.4)
|
(26.9
|
)
|
(60.2
|
)
|
(3.5
|
)
|
|||||
|
Other comprehensive income (loss), net of tax
|
(18.7
|
)
|
(78.9
|
)
|
(32.9
|
)
|
|||||
|
Comprehensive income
|
$
|
417.0
|
|
$
|
303.3
|
|
$
|
152.0
|
|
||
|
Less: Comprehensive income attributable to the noncontrolling interest
|
19.7
|
|
15.7
|
|
12.0
|
|
|||||
|
Comprehensive income attributable to FMC stockholders
|
$
|
397.3
|
|
$
|
287.6
|
|
$
|
140.0
|
|
||
____________________
|
(1)
|
Income taxes are not provided on the equity in undistributed earnings of our foreign subsidiaries or affiliates since it is our intention that such earnings will remain invested in those affiliates permanently.
|
The accompanying notes are an integral part of these consolidated financial statements.
42
FMC CORPORATION
|
December 31,
|
|||||||
|
(in Millions, Except Share and Par Value Data)
|
2012
|
2011
|
|||||
|
ASSETS
|
|||||||
|
Current assets
|
|||||||
|
Cash and cash equivalents
|
$
|
77.1
|
|
$
|
158.9
|
|
|
|
Trade receivables, net of allowance of $27.2 in 2012 and $21.5 in 2011
|
1,124.5
|
|
931.3
|
|
|||
|
Inventories
|
675.7
|
|
470.3
|
|
|||
|
Prepaid and other current assets
|
181.1
|
|
173.4
|
|
|||
|
Deferred income taxes
|
123.4
|
|
135.5
|
|
|||
|
Total current assets
|
2,181.8
|
|
1,869.4
|
|
|||
|
Investments
|
40.2
|
|
28.3
|
|
|||
|
Property, plant and equipment, net
|
1,136.2
|
|
986.8
|
|
|||
|
Goodwill
|
294.4
|
|
225.9
|
|
|||
|
Other intangibles, net
|
215.7
|
|
187.3
|
|
|||
|
Other assets
|
272.3
|
|
198.9
|
|
|||
|
Deferred income taxes
|
233.3
|
|
246.9
|
|
|||
|
Total assets
|
$
|
4,373.9
|
|
$
|
3,743.5
|
|
|
|
LIABILITIES AND EQUITY
|
|||||||
|
Current liabilities
|
|||||||
|
Short-term debt
|
$
|
50.6
|
|
$
|
27.0
|
|
|
|
Current portion of long-term debt
|
5.7
|
|
19.5
|
|
|||
|
Accounts payable, trade and other
|
443.2
|
|
382.1
|
|
|||
|
Advance payments from customers
|
140.3
|
|
76.2
|
|
|||
|
Accrued and other liabilities
|
192.0
|
|
186.2
|
|
|||
|
Accrued payroll
|
75.1
|
|
70.6
|
|
|||
|
Accrued customer rebates
|
142.9
|
|
115.1
|
|
|||
|
Guarantees of vendor financing
|
31.4
|
|
18.5
|
|
|||
|
Accrued pension and other postretirement benefits, current
|
21.3
|
|
9.2
|
|
|||
|
Income taxes
|
32.9
|
|
15.5
|
|
|||
|
Total current liabilities
|
1,135.4
|
|
919.9
|
|
|||
|
Long-term debt, less current portion
|
908.8
|
|
779.1
|
|
|||
|
Accrued pension and other postretirement benefits, long-term
|
375.8
|
|
368.7
|
|
|||
|
Environmental liabilities, continuing and discontinued
|
200.2
|
|
213.3
|
|
|||
|
Reserve for discontinued operations
|
44.4
|
|
41.6
|
|
|||
|
Other long-term liabilities
|
154.5
|
|
116.8
|
|
|||
|
Commitments and contingent liabilities (Note 18)
|
|
|
|||||
|
Equity
|
|||||||
|
Preferred stock, no par value, authorized 5,000,000 shares; no shares issued in 2012 or 2011
|
—
|
|
—
|
|
|||
|
Common stock, $0.10 par value, authorized 260,000,000 shares in 2012 and 2011; 185,983,792 issued shares in 2012 and 2011
|
18.6
|
|
18.6
|
|
|||
|
Capital in excess of par value of common stock
|
481.9
|
|
454.5
|
|
|||
|
Retained earnings
|
2,536.5
|
|
2,176.2
|
|
|||
|
Accumulated other comprehensive income (loss)
|
(408.9
|
)
|
(390.0
|
)
|
|||
|
Treasury stock, common, at cost: 48,313,414 shares in 2012 and 46,309,476 shares in 2011
|
(1,147.8
|
)
|
(1,018.7
|
)
|
|||
|
Total FMC stockholders’ equity
|
1,480.3
|
|
1,240.6
|
|
|||
|
Noncontrolling interests
|
74.5
|
|
63.5
|
|
|||
|
Total equity
|
1,554.8
|
|
1,304.1
|
|
|||
|
Total liabilities and equity
|
$
|
4,373.9
|
|
$
|
3,743.5
|
|
|
The accompanying notes are an integral part of these consolidated financial statements.
43
FMC CORPORATION
CONSOLIDATED STATEMENTS OF CASH FLOWS
|
(in Millions)
|
Year Ended December 31,
|
||||||||||
|
2012
|
2011
|
2010
|
|||||||||
|
Cash provided (required) by operating activities of continuing operations:
|
|||||||||||
|
Net income
|
$
|
435.7
|
|
$
|
382.2
|
|
$
|
184.9
|
|
||
|
Discontinued operations
|
30.2
|
|
31.8
|
|
33.6
|
|
|||||
|
Income from continuing operations
|
$
|
465.9
|
|
$
|
414.0
|
|
$
|
218.5
|
|
||
|
Adjustments from income from continuing operations to cash provided (required) by operating activities of continuing operations:
|
|||||||||||
|
Depreciation and amortization
|
137.8
|
|
126.6
|
|
133.6
|
|
|||||
|
Equity in (earnings) loss of affiliates
|
0.3
|
|
(2.6
|
)
|
(2.7
|
)
|
|||||
|
Restructuring and other charges (income)
|
38.1
|
|
32.4
|
|
151.9
|
|
|||||
|
Deferred income taxes
|
57.3
|
|
89.8
|
|
32.1
|
|
|||||
|
Pension and other postretirement benefits
|
57.1
|
|
35.1
|
|
39.4
|
|
|||||
|
Share-based compensation
|
17.4
|
|
15.8
|
|
14.7
|
|
|||||
|
Excess tax benefits from share-based compensation
|
(9.7
|
)
|
(7.4
|
)
|
(56.3
|
)
|
|||||
|
Changes in operating assets and liabilities, net of effect of acquisitions and divestitures:
|
|||||||||||
|
Trade receivables, net
|
(193.7
|
)
|
(77.9
|
)
|
(109.9
|
)
|
|||||
|
Guarantees of vendor financing
|
12.9
|
|
(5.6
|
)
|
(25.4
|
)
|
|||||
|
Inventories
|
(198.0
|
)
|
(110.5
|
)
|
(7.9
|
)
|
|||||
|
Other current assets and other assets
|
(60.2
|
)
|
(11.5
|
)
|
(31.6
|
)
|
|||||
|
Accounts payable
|
41.2
|
|
24.9
|
|
91.1
|
|
|||||
|
Accrued and other current liabilities and other liabilities
|
13.7
|
|
2.1
|
|
(2.6
|
)
|
|||||
|
Advance payments from customers
|
64.1
|
|
44.4
|
|
15.5
|
|
|||||
|
Accrued payroll
|
4.6
|
|
4.2
|
|
14.2
|
|
|||||
|
Accrued customer rebates
|
27.4
|
|
15.3
|
|
33.2
|
|
|||||
|
Income taxes
|
31.3
|
|
2.8
|
|
59.4
|
|
|||||
|
Pension and other postretirement benefit contributions
|
(77.5
|
)
|
(67.0
|
)
|
(105.2
|
)
|
|||||
|
Environmental spending, continuing, net of recoveries
|
(7.1
|
)
|
(12.0
|
)
|
(8.9
|
)
|
|||||
|
Restructuring and other spending
|
(13.0
|
)
|
(87.3
|
)
|
(53.4
|
)
|
|||||
|
Cash provided (required) by operating activities
|
409.9
|
|
425.6
|
|
399.7
|
|
|||||
|
Cash provided (required) by operating activities of discontinued operations:
|
|||||||||||
|
Environmental spending, discontinued, net of recoveries
|
(23.3
|
)
|
(21.1
|
)
|
(17.1
|
)
|
|||||
|
Payments of other discontinued reserves
|
(26.9
|
)
|
(23.2
|
)
|
(28.1
|
)
|
|||||
|
Cash provided (required) by operating activities of discontinued operations
|
(50.2
|
)
|
(44.3
|
)
|
(45.2
|
)
|
|||||
The accompanying notes are an integral part of these consolidated financial statements.
44
FMC CORPORATION
CONSOLIDATED STATEMENTS OF CASH FLOWS (CONTINUED)
|
(in Millions)
|
Year Ended December 31,
|
||||||||||
|
2012
|
2011
|
2010
|
|||||||||
|
Cash provided (required) by investing activities:
|
|||||||||||
|
Capital expenditures
|
$
|
(206.6
|
)
|
$
|
(189.5
|
)
|
$
|
(142.3
|
)
|
||
|
Proceeds from disposal of property, plant and equipment
|
2.8
|
|
1.2
|
|
2.6
|
|
|||||
|
Acquisitions, net of cash acquired
|
(143.2
|
)
|
(148.1
|
)
|
(7.5
|
)
|
|||||
|
Investments in nonconsolidated affiliates
|
(14.2
|
)
|
(3.2
|
)
|
—
|
|
|||||
|
Other investing activities
|
(32.4
|
)
|
(18.4
|
)
|
(6.8
|
)
|
|||||
|
Cash provided (required) by investing activities
|
(393.6
|
)
|
(358.0
|
)
|
(154.0
|
)
|
|||||
|
Cash provided (required) by financing activities:
|
|||||||||||
|
Net borrowings (repayments) under committed credit facility
|
130.0
|
|
—
|
|
—
|
|
|||||
|
Increase (decrease) in short-term debt
|
22.6
|
|
9.0
|
|
(14.9
|
)
|
|||||
|
Proceeds from borrowing of long-term debt
|
5.9
|
|
300.2
|
|
35.0
|
|
|||||
|
Financing fees
|
—
|
|
(8.5
|
)
|
—
|
|
|||||
|
Repayments of long-term debt
|
(20.4
|
)
|
(121.3
|
)
|
(26.0
|
)
|
|||||
|
Distributions to noncontrolling interests
|
(15.4
|
)
|
(12.9
|
)
|
(11.0
|
)
|
|||||
|
Dividends paid
|
(47.8
|
)
|
(41.2
|
)
|
(36.4
|
)
|
|||||
|
Issuances of common stock, net
|
18.7
|
|
11.3
|
|
18.1
|
|
|||||
|
Excess tax benefits from share-based compensation
|
9.7
|
|
7.4
|
|
56.3
|
|
|||||
|
Contingent consideration paid
|
(2.5
|
)
|
—
|
|
—
|
|
|||||
|
Repurchases of common stock under publicly announced program
|
(144.9
|
)
|
(165.1
|
)
|
(135.0
|
)
|
|||||
|
Other repurchases of common stock
|
(4.1
|
)
|
(4.2
|
)
|
(2.7
|
)
|
|||||
|
Cash provided (required) by financing activities
|
(48.2
|
)
|
(25.3
|
)
|
(116.6
|
)
|
|||||
|
Effect of exchange rate changes on cash and cash equivalents
|
0.3
|
|
(0.6
|
)
|
1.0
|
|
|||||
|
Increase (decrease) in cash and cash equivalents
|
(81.8
|
)
|
(2.6
|
)
|
84.9
|
|
|||||
|
Cash and cash equivalents, beginning of period
|
158.9
|
|
161.5
|
|
76.6
|
|
|||||
|
Cash and cash equivalents, end of period
|
$
|
77.1
|
|
$
|
158.9
|
|
$
|
161.5
|
|
||
Cash paid for interest, net of capitalized interest was
$36.2 million
,
$36.3 million
and
$38.4 million
, and income taxes paid, net of refunds was
$59.0 million
,
$47.9 million
and
$41.5 million
in December 31, 2012, 2011 and 2010, respectively. Non-cash additions to property, plant and equipment were
$31.6 million
and
$12.8 million
for December 31, 2012 and 2011.
See Note 15 regarding quarterly cash dividend.
The accompanying notes are an integral part of these consolidated financial statements.
45
FMC CORPORATION
CONSOLIDATED STATEMENTS OF CHANGES IN EQUITY
|
|
FMC Stockholders’
|
|
|
||||||||||||||||||||||||
|
(in Millions, Except Per Share Data)
|
Common
Stock,
$0.10 Par
Value
|
Capital
In Excess
of Par
|
Retained
Earnings
|
Accumulated Other Comprehensive Income (Loss)
|
Treasury
Stock
|
Non-controlling
Interest
|
Total
Equity
|
||||||||||||||||||||
|
Balance December 31, 2009
|
$
|
18.6
|
|
$
|
379.3
|
|
$
|
1,716.9
|
|
$
|
(279.2
|
)
|
$
|
(759.2
|
)
|
$
|
56.7
|
|
$
|
1,133.1
|
|
||||||
|
Net income
|
172.5
|
|
12.4
|
|
184.9
|
|
|||||||||||||||||||||
|
Stock compensation plans
|
(1.3
|
)
|
34.1
|
|
32.8
|
|
|||||||||||||||||||||
|
Excess tax benefits from share-based compensation
|
56.3
|
|
56.3
|
|
|||||||||||||||||||||||
|
Shares for benefit plan trust
|
0.1
|
|
0.1
|
|
|||||||||||||||||||||||
|
Net pension and other benefit actuarial gains/(losses) and prior service costs, net of income tax
|
(3.5
|
)
|
(3.5
|
)
|
|||||||||||||||||||||||
|
Net hedging gains (losses) and other, net of income tax
|
(3.4
|
)
|
(3.4
|
)
|
|||||||||||||||||||||||
|
Foreign currency translation adjustments
|
(25.6
|
)
|
(0.4
|
)
|
(26.0
|
)
|
|||||||||||||||||||||
|
Dividends ($0.25 per share)
|
(36.4
|
)
|
(36.4
|
)
|
|||||||||||||||||||||||
|
Repurchases of common stock
|
(137.7
|
)
|
(137.7
|
)
|
|||||||||||||||||||||||
|
Distributions to noncontrolling interests
|
(11.0
|
)
|
(11.0
|
)
|
|||||||||||||||||||||||
|
Balance December 31, 2010
|
$
|
18.6
|
|
$
|
434.3
|
|
$
|
1,853.0
|
|
$
|
(311.7
|
)
|
$
|
(862.7
|
)
|
$
|
57.7
|
|
$
|
1,189.2
|
|
||||||
|
Net income
|
365.9
|
|
16.3
|
|
382.2
|
|
|||||||||||||||||||||
|
Stock compensation plans
|
12.8
|
|
14.1
|
|
26.9
|
|
|||||||||||||||||||||
|
Excess tax benefits from share-based compensation
|
7.4
|
|
7.4
|
|
|||||||||||||||||||||||
|
Shares for benefit plan trust
|
(0.8
|
)
|
(0.8
|
)
|
|||||||||||||||||||||||
|
Net pension and other benefit actuarial gains/(losses) and prior service costs, net of income tax
|
(60.2
|
)
|
(60.2
|
)
|
|||||||||||||||||||||||
|
Net hedging gains (losses) and other, net of income tax
|
(3.7
|
)
|
(3.7
|
)
|
|||||||||||||||||||||||
|
Foreign currency translation adjustments
|
(14.4
|
)
|
(0.6
|
)
|
(15.0
|
)
|
|||||||||||||||||||||
|
Dividends ($0.30 per share)
|
(42.7
|
)
|
(42.7
|
)
|
|||||||||||||||||||||||
|
Repurchases of common stock
|
(169.3
|
)
|
(169.3
|
)
|
|||||||||||||||||||||||
|
Noncontrolling interests associated with an acquisition
|
3.0
|
|
3.0
|
|
|||||||||||||||||||||||
|
Distributions to noncontrolling interests
|
(12.9
|
)
|
(12.9
|
)
|
|||||||||||||||||||||||
|
Balance December 31, 2011
|
$
|
18.6
|
|
$
|
454.5
|
|
$
|
2,176.2
|
|
$
|
(390.0
|
)
|
$
|
(1,018.7
|
)
|
$
|
63.5
|
|
$
|
1,304.1
|
|
||||||
|
Net income
|
416.2
|
|
19.5
|
|
435.7
|
|
|||||||||||||||||||||
|
Stock compensation plans
|
17.7
|
|
17.6
|
|
35.3
|
|
|||||||||||||||||||||
|
Excess tax benefits from share-based compensation
|
9.7
|
|
9.7
|
|
|||||||||||||||||||||||
|
Shares for benefit plan trust
|
2.3
|
|
2.3
|
|
|||||||||||||||||||||||
|
Net pension and other benefit actuarial gains/(losses) and prior service costs, net of income tax
|
(26.9
|
)
|
(26.9
|
)
|
|||||||||||||||||||||||
|
Net hedging gains (losses) and other, net of income tax
|
5.7
|
|
5.7
|
|
|||||||||||||||||||||||
|
Foreign currency translation adjustments
|
2.3
|
|
0.2
|
|
2.5
|
|
|||||||||||||||||||||
|
Dividends ($0.405 per share)
|
(55.9
|
)
|
(55.9
|
)
|
|||||||||||||||||||||||
|
Repurchases of common stock
|
(149.0
|
)
|
(149.0
|
)
|
|||||||||||||||||||||||
|
Noncontrolling interests associated with an acquisition
|
6.7
|
|
6.7
|
|
|||||||||||||||||||||||
|
Distributions to noncontrolling interests
|
(15.4
|
)
|
(15.4
|
)
|
|||||||||||||||||||||||
|
Balance December 31, 2012
|
$
|
18.6
|
|
$
|
481.9
|
|
$
|
2,536.5
|
|
$
|
(408.9
|
)
|
$
|
(1,147.8
|
)
|
$
|
74.5
|
|
$
|
1,554.8
|
|
||||||
The accompanying notes are an integral part of these consolidated financial statements.
46
FMC CORPORATION
Notes to Consolidated Financial Statements
Nature of operations
. We are a diversified chemical company serving agricultural, consumer and industrial markets globally with innovative solutions, applications and market-leading products. We operate in
three
distinct business segments: Agricultural Products, Specialty Chemicals and Industrial Chemicals. Our Agricultural Products segment develops, markets and sells all
three
major classes of crop protection chemicals – insecticides, herbicides, and fungicides – with particular strength in insecticides and herbicides. These products are used in agriculture to enhance crop yield and quality by controlling a broad spectrum of insects, weeds and disease, as well as pest control in non-agricultural markets. Specialty Chemicals consists of our BioPolymer and Lithium businesses. This segment focuses on food ingredients that are used to enhance texture, color, structure and physical stability, pharmaceutical additives for binding, encapsulation and disintegrant applications, ultrapure biopolymers for medical devices and lithium for energy storage, specialty polymers and pharmaceutical synthesis. Our Industrial Chemicals segment manufactures a wide range of inorganic materials, including soda ash, hydrogen peroxide, specialty peroxygens and silicates.
Basis of consolidation and basis of presentation
. The accompanying consolidated financial statements of FMC Corporation and its subsidiaries were prepared in accordance with accounting principles generally accepted in the United States of America. Our consolidated financial statements include the accounts of FMC and all entities that we directly or indirectly control. All significant intercompany accounts and transactions are eliminated in consolidation.
Estimates and assumptions
. In preparing the financial statements in conformity with U.S. generally accepted accounting principles (“GAAP”) we are required to make estimates and assumptions that affect the reported amounts of assets and liabilities and disclosures of contingent assets and liabilities at the date of the financial statements and the reported amounts of revenue and expenses during the reporting period. Actual results are likely to differ from those estimates, but we do not believe such differences will materially affect our financial position, results of operations or cash flows.
Cash equivalents
. We consider investments in all liquid debt instruments with original maturities of
three
months or less to be cash equivalents.
Trade receivables, net of allowance
. Trade receivables consist of amounts owed to us from customer sales and are recorded when revenue is recognized. The allowance for trade receivables represents our best estimate of the probable losses associated with potential customer defaults. In developing our allowance for trade receivables, we utilize a two stage process which includes calculating a general formula to develop an allowance to appropriately address the uncertainty surrounding collection risk of our entire portfolio and specific allowances for customers where the risk of collection has been reasonably identified either due to liquidity constraints or disputes over contractual terms and conditions.
Our method of calculating the general formula consists of estimating the recoverability of trade receivables based on historical experience, current collection trends, and external business factors such as economic factors, including regional bankruptcy rates, and political factors. Our analysis of trade receivable collection risk is performed quarterly, and the allowance is adjusted accordingly. The allowance for trade receivable is
$27.2 million
and
$21.5 million
as of
December 31, 2012
and
2011
, respectively. The provision to the allowance for trade receivables charged against operations was
$8.7 million
,
$3.8 million
and
$4.3 million
for the years ended
December 31, 2012
,
2011
and
2010
, respectively.
Investments
. Investments in companies in which our ownership interest is
50 percent
or less and in which we exercise significant influence over operating and financial policies are accounted for using the equity method. Under the equity method, original investments are recorded at cost and adjusted by our share of undistributed earnings and losses of these investments. Majority owned investments in which our control is restricted are also accounted for using the equity method. All other investments are carried at their fair values or at cost, as appropriate. We are party to several joint venture investments throughout the world, which individually and in the aggregate are not significant to our financial results.
Inventories
. Inventories are stated at the lower of cost or market value. Inventory costs include those costs directly attributable to products before sale, including all manufacturing overhead but excluding distribution costs. All domestic inventories, excluding materials and supplies, are determined on a last-in, first-out (“LIFO”) basis and our remaining inventories are recorded on a first-in, first-out (“FIFO”) basis. See Note 5.
Property, plant and equipment
. We record property, plant and equipment, including capitalized interest, at cost. Depreciation is provided principally on the straight-line basis over the estimated useful lives of the assets (land improvements—
20 years
, buildings—
20
to
40 years
, and machinery and equipment—
three
to
18 years
). Gains and losses are reflected in
47
FMC CORPORATION AND CONSOLIDATED SUBSIDIARIES
Notes to Consolidated Financial Statements — (Continued)
income upon sale or retirement of assets. Expenditures that extend the useful lives of property, plant and equipment or increase productivity are capitalized. Ordinary repairs and maintenance are expensed as incurred through operating expense.
Capitalized interest
. We capitalized interest costs of
$7.8 million
in
2012
,
$6.9 million
in
2011
and
$7.5 million
in 2010. These costs were associated with the construction of certain long-lived assets and have been capitalized as part of the cost of those assets. We amortize capitalized interest over the assets’ estimated useful lives.
Impairments of long-lived assets
. We review the recovery of the net book value of long-lived assets whenever events and circumstances indicate that the net book value of an asset may not be recoverable from the estimated undiscounted future cash flows expected to result from its use and eventual disposition. In cases where undiscounted expected future cash flows are less than the net book value, we recognize an impairment loss equal to an amount by which the net book value exceeds the fair value of the asset. Long-lived assets to be disposed of are reported at the lower of carrying amount or fair value less cost to sell.
Asset retirement obligations
. We record asset retirement obligations at fair value at the time the liability is incurred if we can reasonably estimate the settlement date. The associated asset retirement obligations (“AROs”) are capitalized as part of the carrying amount of related long-lived assets. In future periods, the liability is accreted to its present value and the capitalized cost is depreciated over the useful life of the related asset. We also adjust the liability for changes resulting from the passage of time and/or revisions to the timing or the amount of the original estimate. Upon retirement of the long-lived asset, we either settle the obligation for its recorded amount or incur a gain or loss. See Note 8 for further discussion on our AROs.
Restructuring and other charges
. We continually perform strategic reviews and assess the return on our businesses. This sometimes results in a plan to restructure the operations of a business. We record an accrual for severance and other exit costs under the provisions of the relevant accounting guidance.
Additionally, as part of these restructuring plans, write-downs of long-lived assets may occur. Two types of assets are impacted: assets to be disposed of by sale and assets to be abandoned. Assets to be disposed of by sale are measured at the lower of carrying amount or estimated net proceeds from the sale. Assets to be abandoned with no remaining future service potential are written down to amounts expected to be recovered. The useful life of assets to be abandoned that have a remaining future service potential are adjusted and depreciation is recorded over the adjusted useful life.
Capitalized software.
We capitalize the costs of internal use software in accordance with accounting literature which generally requires the capitalization of certain costs incurred to develop or obtain internal use software. We assess the recoverability of capitalized software costs on an ongoing basis and record write-downs to fair value as necessary. We amortize capitalized software costs over expected useful lives ranging from
three
to
10 years
. See Note 20 for the unamortized computer software balances.
Goodwill and intangible assets
. Goodwill and other indefinite life intangible assets (“intangibles”) are not subject to amortization. Instead, they are subject to at least an annual assessment for impairment by applying a fair value-based test.
We test goodwill and indefinite life intangibles for impairment annually using the criteria prescribed by U.S. GAAP accounting guidance for goodwill and other intangible assets. We did not record any goodwill or indefinite life intangible impairments in
2012
,
2011
and 2010. Based upon our annual impairment test, conducted in
2012
, we believe that the fair value of our reporting units with goodwill substantially exceeds their carrying value.
Finite-lived intangible assets consist primarily of patents, access rights, customer relationships, trade names, registration rights, industry licenses, developed formulations and other intangibles and are being amortized over periods of
five
to
25 years
. See Note 4 for additional information on goodwill and intangible assets.
Revenue recognition
. We recognize revenue when the earnings process is complete, which is generally upon transfer of title. This transfer typically occurs either upon shipment to the customer or upon receipt by the customer. In all cases, we apply the following criteria in recognizing revenue: persuasive evidence of an arrangement exists, delivery has occurred, the selling price is fixed or determinable and collection is reasonably assured. Rebates due to customers are accrued as a reduction of revenue in the same period that the related sales are recorded based on the contract terms.
48
FMC CORPORATION AND CONSOLIDATED SUBSIDIARIES
Notes to Consolidated Financial Statements — (Continued)
We periodically enter into prepayment arrangements with customers, primarily in our Agricultural Products segment, and receive advance payments for product to be delivered in future periods. These advance payments are recorded as deferred revenue and classified as “Advance payments from customers” on the consolidated balance sheet. Revenue associated with advance payments is recognized as shipments are made and title, ownership and risk of loss pass to the customer.
We record amounts billed for shipping and handling fees as revenue. Costs incurred for shipping and handling are recorded as costs of sales and services.
Research and Development.
Research and development costs are expensed as incurred. In-process research and development acquired as part of asset acquisitions, which include license and development agreements, are expensed as incurred and included as a component of “Restructuring and other charges (income)”.
Income and other taxes
. We provide current income taxes on income reported for financial statement purposes adjusted for transactions that do not enter into the computation of income taxes payable and recognize deferred tax liabilities and assets for the expected future tax consequences of temporary differences between the carrying amounts and the tax basis of assets and liabilities. We do not provide income taxes on the equity in undistributed earnings of foreign subsidiaries or affiliates as it is our intention that such earnings will remain invested in those companies. Investment tax credits or grants, which were immaterial to us in all years presented, are accounted for in the period earned (the flow-through method).
We record on a net basis all taxes collected from customers to be remitted to governmental authorities in our consolidated statements of income.
Foreign currency
. We translate the assets and liabilities of our foreign operations at exchange rates in effect at the balance sheet date. For foreign operations for which the functional currency is not the US dollar we record translation gains and losses as a component of accumulated other comprehensive income in equity. The foreign operations' income statements are translated at the monthly exchange rates for the period.
We record remeasurement gain and losses on monetary assets and liabilities, such as accounts receivables and payables, which are not in the functional currency of the operation. These remeasurement gains and losses are recorded in the income statement as they occur. We generally enter into foreign currency contracts to mitigate the financial risk associated with these transactions. See “Derivative financial instruments” below and Note 17.
Derivative financial instruments
. We mitigate certain financial exposures, including currency risk, interest rate risk, and commodity price exposures, through a controlled program of risk management that includes the use of derivative financial instruments. We enter into foreign exchange contracts, including forward and purchased option contracts, to reduce the effects of fluctuating foreign currency exchange rates.
We recognize all derivatives on the balance sheet at fair value. On the date the derivative instrument is entered into, we generally designate the derivative as either a hedge of the variability of cash flows to be received or paid related to a forecasted transaction (cash flow hedge) or a hedge of the fair value of a recognized asset or liability or of an unrecognized firm commitment (fair value hedge). We record in accumulated other comprehensive income or loss changes in the fair value of derivatives that are designated as, and meet all the required criteria for, a cash flow hedge. We then reclassify these amounts into earnings as the underlying hedged item affects earnings. We record immediately in earnings changes in the fair value of derivatives that are not designated as cash flow hedges.
We formally document all relationships between hedging instruments and hedged items, as well as the risk management objective and strategy for undertaking various hedge transactions. This process includes relating derivatives that are designated as fair value or cash flow hedges to specific assets and liabilities on the balance sheet or to specific firm commitments or forecasted transactions. We also formally assess, both at the inception of the hedge and throughout its term, whether each derivative is highly effective in offsetting changes in fair value or cash flows of the hedged item. If we determine that a derivative is not highly effective as a hedge, or if a derivative ceases to be a highly effective hedge, we discontinue hedge accounting with respect to that derivative prospectively.
Treasury stock
. We record shares of common stock repurchased at cost as treasury stock, resulting in a reduction of stockholders’ equity in the Consolidated Balance Sheets. When the treasury shares are contributed under our employee benefit plans, we use a first-in, first-out (“FIFO”) method for determining cost. The difference between the cost of the shares and the market price at the time of contribution to an employee benefit plan is added to or deducted from capital in excess of par value of common stock.
49
FMC CORPORATION AND CONSOLIDATED SUBSIDIARIES
Notes to Consolidated Financial Statements — (Continued)
Segment information
. We determined our reportable segments based on our strategic business units, the commonalities among the products and services within each segment and the manner in which we review and evaluate operating performance.
We have identified Agricultural Products, Specialty Chemicals and Industrial Chemicals as our reportable segments. Segment disclosures are included in Note 19. Segment operating profit is defined as segment revenue less segment operating expenses (segment operating expenses consist of costs of sales and services, selling, general and administrative expenses and research and development expenses). We have excluded the following items from segment operating profit: corporate staff expense, interest income and expense associated with corporate debt facilities and investments, income taxes, gains (or losses) on divestitures of businesses, restructuring and other charges (income), investment gains and losses, loss on extinguishment of debt, asset impairments, LIFO inventory adjustments, acquisition related costs, non-operating pension and postretirement charges, and other income and expense items. Information about how restructuring and other charges (income) relate to our businesses at the segment level is discussed in Note 7.
Segment assets and liabilities are those assets and liabilities that are recorded and reported by segment operations. Segment operating capital employed represents segment assets less segment liabilities. Segment assets exclude corporate and other assets, which are principally cash equivalents, the LIFO reserve on inventory, deferred income taxes, eliminations of intercompany receivables and property and equipment not attributable to a specific segment. Segment liabilities exclude substantially all debt, income taxes, pension and other postretirement benefit liabilities, environmental reserves and related recoveries, restructuring reserves, deferred gains on sale and leaseback of equipment, fair value of currency contracts, intercompany eliminations, and reserves for discontinued operations.
Geographic segment revenue is based on the location of our customers. Geographic segment long-lived assets include investments, net property, plant and equipment, and other non-current assets. Geographic segment data is included in Note 19.
Stock compensation plans
. We recognize compensation expense in the financial statements for all share options and other equity-based arrangements. Share-based compensation cost is measured at the date of grant, based on the fair value of the award, and is recognized over the employee’s requisite service period. See Note 14 for further discussion on our share-based compensation.
Environmental obligations
. We provide for environmental-related obligations when they are probable and amounts can be reasonably estimated. Where the available information is sufficient to estimate the amount of liability, that estimate has been used. Where the information is only sufficient to establish a range of probable liability and no point within the range is more likely than any other, the lower end of the range has been used.
Estimated obligations to remediate sites that involve oversight by the United States Environmental Protection Agency (“EPA”), or similar government agencies, are generally accrued no later than when a Record of Decision (“ROD”), or equivalent, is issued, or upon completion of a Remedial Investigation/Feasibility Study (“RI/FS”), or equivalent, that is submitted by us and the appropriate government agency or agencies. Estimates are reviewed quarterly and, if necessary, adjusted as additional information becomes available. The estimates can change substantially as additional information becomes available regarding the nature or extent of site contamination, required remediation methods, and other actions by or against governmental agencies or private parties.
Our environmental liabilities for continuing and discontinued operations are principally for costs associated with the remediation and/or study of sites at which we are alleged to have released hazardous substances into the environment. Such costs principally include, among other items, RI/FS, site remediation, costs of operation and maintenance of the remediation plan, management costs, fees to outside law firms and consultants for work related to the environmental effort, and future monitoring costs. Estimated site liabilities are determined based upon existing remediation laws and technologies, specific site consultants’ engineering studies or by extrapolating experience with environmental issues at comparable sites.
Included in our environmental liabilities are costs for the operation, maintenance and monitoring of site remediation plans (OM&M). Such reserves are based on our best estimates for these OM&M plans. Over time we may incur OM&M costs in excess of these reserves. However, we are unable to reasonably estimate an amount in excess of our recorded reserves because we cannot reasonably estimate the period for which such OM&M plans will need to be in place or the future annual cost of such remediation, as conditions at these environmental sites change over time. Such additional OM&M costs could be significant in total but would be incurred over an extended period of years.
Included in the environmental reserve balance, other assets balance and disclosure of reasonably possible loss contingencies are amounts from third party insurance policies which we believe are probable of recovery.
50
FMC CORPORATION AND CONSOLIDATED SUBSIDIARIES
Notes to Consolidated Financial Statements — (Continued)
Provisions for environmental costs are reflected in income, net of probable and estimable recoveries from named Potentially Responsible Parties (“PRPs”) or other third parties. Such provisions incorporate inflation and are not discounted to their present values.
In calculating and evaluating the adequacy of our environmental reserves, we have taken into account the joint and several liability imposed by Comprehensive Environmental Remediation, Compensation and Liability Act (“CERCLA”) and the analogous state laws on all PRPs and have considered the identity and financial condition of the other PRPs at each site to the extent possible. We have also considered the identity and financial condition of other third parties from whom recovery is anticipated, as well as the status of our claims against such parties. Although we are unable to forecast the ultimate contributions of PRPs and other third parties with absolute certainty, the degree of uncertainty with respect to each party is taken into account when determining the environmental reserve on a site-by-site basis. Our liability includes our best estimate of the costs expected to be paid before the consideration of any potential recoveries from third parties. We believe that any recorded recoveries related to PRPs are realizable in all material respects. Recoveries are recorded as either an offset in “Environmental liabilities, continuing and discontinued” or as “Other Assets” in our consolidated balance sheets in accordance with U.S. accounting literature.
Pension and other postretirement benefits.
We provide qualified and nonqualified defined benefit and defined contribution pension plans, as well as postretirement health care and life insurance benefit plans to our employees and retirees. Effective July 1, 2007, all of our newly hired and rehired salaried and nonunion hourly employees are no longer eligible for our defined benefit pension plans. The costs (or benefits) and obligations related to these benefits reflect key assumptions related to general economic conditions, including interest (discount) rates, healthcare cost trend rates, expected rates of return on plan assets and the rates of compensation increase for employees. The costs (or benefits) and obligations for these benefit programs are also affected by other assumptions, such as average retirement age, mortality, employee turnover, and plan participation. To the extent our plans’ actual experience, as influenced by changing economic and financial market conditions or by changes to our own plans’ demographics, differs from these assumptions, the costs and obligations for providing these benefits, as well as the plans’ funding requirements, could increase or decrease. When actual results differ from our assumptions, the difference is typically recognized over future periods. In addition, the unrealized gains and losses related to our pension and postretirement benefit obligations may also affect periodic benefit costs (or benefits) in future periods. See Note 13 for additional information relating to pension and other postretirement benefits.
Stock Split.
On April 24, 2012, the Board of Directors of FMC declared a two-for-one split of our common stock (the “Stock Split”) to be effected in the form of a distribution of one newly issued share payable on May 24, 2012 for each share held as of the close of business on May 11, 2012. Trading in the common stock on a post-split adjusted basis began on May 25, 2012.
The number of shares outstanding and related prices, per share amounts, share conversions and share-based data throughout this Form 10-K have been adjusted to reflect the Stock Split for all prior periods presented.
Reclassifications.
Certain prior year amounts have been reclassified to conform to the current year's presentation.
New accounting guidance and regulatory items
Balance Sheet - Offsetting
In December 2011, the Financial Accounting Standards Board ("FASB") issued its updated guidance on balance sheet offsetting. This new standard provides guidance to determine when offsetting in the balance sheet is appropriate. The guidance is designed to enhance disclosures by requiring improved information about financial instruments and derivative instruments. The goal is to provide users of the financial statements the ability to evaluate the effect or potential effect of netting arrangements on an entity's statement of financial position. This guidance will only impact the disclosures within an entity's financial statements and notes to the financial statements and does not result in a change to the accounting treatment of financial instruments and derivative instruments. We are required to adopt this guidance on January 1, 2013.
51
FMC CORPORATION AND CONSOLIDATED SUBSIDIARIES
Notes to Consolidated Financial Statements — (Continued)
Reclassification from Accumulated Other Comprehensive Income
In February 2013, the FASB issued its guidance requiring new disclosures for the reclassification from accumulated other comprehensive income (AOCI) to net income. This new guidance requires that we present either in a single note or parenthetically on the face of the financial statements, the effect of significant amounts reclassified from each component of accumulated other comprehensive income based on its source and the income statement line items affected by the reclassification. This guidance only impacts disclosures within our consolidated financial statements and notes to the consolidated financial statements and does not result in a change to the accounting treatment of AOCI. We are required to adopt this guidance beginning with our March 31, 2013 interim reporting on Form 10-Q.
Accounting guidance and regulatory items adopted in 2012
Testing Goodwill for Impairment
In September 2011, the FASB issued its updated guidance for the testing of goodwill for impairment. The update allows us the option to first assess qualitative factors to determine whether it is more likely than not that the fair value of a reporting unit is less than its carrying amount. If after assessing qualitative factors it is determined that it is more likely than not the fair value of the reporting unit is less than its carrying amount, we will need to perform a more detailed goodwill impairment test which is used to identify potential goodwill impairments and to measure the amount of goodwill impairment losses to be recognized, if any. The objective of this new approach is to simplify how entities test goodwill for impairment. We adopted this new guidance on January 1, 2012.
In July 2012, the FASB issued its updated guidance for the testing of indefinite life intangible assets for impairment. The updated guidance complemented the goodwill guidance issued in September of 2011, noted in the preceding paragraph, by allowing us to test for impairment utilizing a qualitative approach instead of the previous quantitative assessment. We adopted this guidance during the third quarter.
There was no impact to our financial statements upon adoption of either standard.
Presentation of Comprehensive Income
In June 2011, the FASB issued its guidance regarding the presentation of comprehensive income, which was subsequently updated in December 2011. This guidance requires us to present total comprehensive income and its components and the components of net income in either a single continuous statement or two separate but consecutive statements. This guidance impacts the location of the disclosure of comprehensive income within our consolidated financial statements and does not result in a change to the accounting treatment of comprehensive income. Upon adoption of this guidance we have decided to present comprehensive income in a separate but consecutive statement. See the Consolidated Statements of Comprehensive Income as part of our financial statements for the new presentation.
Fair Value Measurements
In May 2011, the FASB amended its guidance about fair value measurement and disclosure. The new guidance was issued in conjunction with a new International Financial Reporting Standards ("IFRS") fair value measurement standard aimed at updating IFRS to conform with U.S. GAAP. We adopted this guidance on January 1, 2012. The adoption of this guidance did not result in modifications to our fair value measurements; however, it resulted in some additional disclosures which are included within Note 17 to this Form 10-K.
2012 Acquisitions
GAT Microencapsulation AG:
In December 2012, we signed a perpetual, global licensing agreement, along with distribution and services agreements with GAT Microencapsulation AG covering a range of advanced crop protection products and proprietary formulation technologies. T
he acquired assets have been integrated into our Agricultural Products segment.
52
FMC CORPORATION AND CONSOLIDATED SUBSIDIARIES
Notes to Consolidated Financial Statements — (Continued)
Pectine Italia S.p.A.:
In August 2012, we acquired the assets of Pectine Italia S.p.A. (PI). PI produces pectin, a well known stabilizer and thickening agent used widely in many foods and derived predominately from lemon peels. The company has production facilities in Milazzo, on the island of Sicily. The acquired assets of PI are reported as part of our BioPolymer division within our Specialty Chemicals segment.
Phytone Ltd.:
In June 2012, we acquired
100 percent
of the stock of Phytone Ltd. (Phytone). Phytone is a natural colors producer based in the United Kingdom. Phytone's natural products and formulations are used by global customers in the food, beverage, personal care and nutrition sectors. Phytone has been consolidated into our existing BioPolymer division within our Specialty Chemicals segment.
The results of operations related to the above acquisitions have been included in our results since their respective acquisition dates. The above acquisitions were all considered businesses under the U.S. GAAP business combinations accounting guidance, and therefore we applied acquisition accounting. Acquisition accounting requires, among other things, that most assets and liabilities assumed be recognized at their fair values as of the acquisition date. The net assets of the combined acquisitions were recorded at the estimated fair values using primarily Level 2 and Level 3 inputs (see Note 17 for an explanation of fair value inputs). In valuing acquired assets and liabilities, valuation inputs include an estimate of future cash flows and discount rates based on the internal rate of return and the weighted average rate of return. Transaction related costs of the acquisitions were expensed as incurred.
The purchase price and related allocation is not considered final primarily due to working capital adjustments expected to occur in the first quarter of 2013. This may result in additional adjustments to the preliminary purchase price allocation. We will finalize the amounts recognized as soon as possible once we obtain the information necessary to complete the analysis, but no later than one year from the acquisition date.
|
Preliminary Purchase Price Allocation
|
|||
|
(in Millions)
|
|||
|
Current assets (primarily inventory and trade receivables) (1)
|
$
|
17.9
|
|
|
Property, plant & equipment
|
29.8
|
|
|
|
Finite-lived intangible assets (2)
|
38.8
|
|
|
|
Goodwill (3)
|
62.4
|
|
|
|
Total fair value of assets acquired
|
148.9
|
|
|
|
Current liabilities
|
10.4
|
|
|
|
Deferred tax liabilities
|
7.5
|
|
|
|
Other liabilities
|
6.9
|
|
|
|
Acquisition of noncontrolling interest
|
6.7
|
|
|
|
Total fair value of liabilities assumed
|
31.5
|
|
|
|
Total Cash Paid
|
$
|
117.4
|
|
|
(1)
|
Fair value of finished good inventories acquired included a step-up in the value of approximately
$0.6 million
, which has been expensed to cost of sales and services in 2012.
|
|
(2)
|
See Note 4 for the major classes of intangible assets acquired, which primarily represent customer relationships. The weighted average useful life of the acquired finite-lived intangibles is approximately
25 years
.
|
|
(3)
|
Goodwill largely consisted of expected revenue synergies resulting from the business combinations. None of the acquired goodwill will be deductible for income tax purposes.
|
2011 Acquisitions
During third and fourth quarters of 2011 we completed five acquisitions, descriptions of which are included below.
53
FMC CORPORATION AND CONSOLIDATED SUBSIDIARIES
Notes to Consolidated Financial Statements — (Continued)
Rovral and Sportak:
In December 2011, we acquired the intellectual property associated with the fungicide chemistries: iprodione and prochloraz from Bayer CropScience, which included the trade names Rovral and Sportak. The acquired assets have been integrated into our Agricultural Products segment.
Adventus Intellectual Property Inc.:
In November 2011, we acquired the assets of Adventus Intellectual Property Inc. (Adventus) from Covington Capital Corporation and VentureLink Innovation Fund Inc. Adventus has a portfolio of specialty remediation technologies used in soil and ground water. The acquired assets of Adventus have been integrated into our Environmental Solutions division within our Industrial Chemicals segment.
South Pole Biogroup Ltda:
In November 2011, we acquired, via a stock purchase,
100 percent
of South Pole Biogroup Ltda (SPB). SPB is a South American natural color and health ingredient producer that operates the BioColor and BioNutrition businesses. SPB has been consolidated into our existing BioPolymer division within our Specialty Chemicals segment.
RheinPerChemie GmbH:
In October 2011, we acquired, via a stock purchase,
100 percent
of RheinPerChemie GmbH (RPC) from Unionchimica SpA. RPC is a European persulfates manufacturer and has been consolidated into our existing Peroxygens division within our Industrial Chemicals segment.
Ruralco Soluciones SA:
In July 2011, we acquired a
50 percent
controlling ownership interest in a new Argentine agrochemical distribution company named Ruralco Soluciones SA (Ruralco). Ruralco has been integrated into our Agricultural Products segment.
The results of operations related to the above acquisitions have been included in our results since the respective acquisition dates.
The total purchase price for the
five
2011 acquisitions was
$173.9 million
of which
$148.1 million
was paid in 2011 and
$25.8 million
of additional purchase price was paid in 2012. The amount paid in 2012 was accrued for as “non-contingent consideration payable” on our December 31, 2011 consolidated balance sheet and included in our purchase price allocation. During 2012 we paid
$2.5 million
in contingent consideration associated with the 2011 acquisitions for which we had accrued
$3.5 million
at December 31, 2011. The remaining amount of contingent consideration payable at December 31, 2012 was
$1.0 million
.
During the year ended December 31, 2012 we finalized the purchase price allocation of the 2011 acquisitions which resulted in a decrease of
$0.8 million
to the goodwill allocated during the preliminary purchase price allocation. These adjustments were made primarily as a result of working capital adjustments that were finalized. The final purchase price for the 2011 acquisitions was primarily allocated to goodwill of
$33.9 million
and identifiable intangible assets of
$134.8 million
. See Note 4 for a reconciliation of the carrying amount of goodwill and intangibles assets at December 31, 2012 and 2011.
Unaudited pro forma revenue and net income related to all of the acquisitions discussed above for the years 2012 and 2011 are not presented because the pro forma impact is not material.
54
FMC CORPORATION AND CONSOLIDATED SUBSIDIARIES
Notes to Consolidated Financial Statements — (Continued)
The changes in the carrying amount of goodwill by business segment for the years ended
December 31, 2012
and
2011
, are presented in the table below:
|
(in Millions)
|
Agricultural
Products
|
Specialty
Chemicals
|
Industrial
Chemicals
|
Total
|
|||||||||||
|
Balance, December 31, 2010
|
$
|
2.8
|
|
$
|
191.0
|
|
$
|
0.6
|
|
$
|
194.4
|
|
|||
|
Acquisitions
|
9.6
|
|
8.9
|
|
16.2
|
|
34.7
|
|
|||||||
|
Foreign currency adjustments
|
—
|
|
(2.9
|
)
|
(0.3
|
)
|
(3.2
|
)
|
|||||||
|
Balance, December 31, 2011
|
$
|
12.4
|
|
$
|
197.0
|
|
$
|
16.5
|
|
$
|
225.9
|
|
|||
|
Acquisitions
|
19.5
|
|
42.9
|
|
—
|
|
62.4
|
|
|||||||
|
Foreign currency adjustments
|
0.2
|
|
6.3
|
|
0.4
|
|
6.9
|
|
|||||||
|
Purchase price allocation adjustments (See Note 3)
|
(1.1
|
)
|
0.4
|
|
(0.1
|
)
|
(0.8
|
)
|
|||||||
|
Balance, December 31, 2012
|
$
|
31.0
|
|
$
|
246.6
|
|
$
|
16.8
|
|
$
|
294.4
|
|
|||
Our intangible assets, other than goodwill, consist of the following:
|
December 31, 2012
|
December 31, 2011
|
|||||||||||||||||||||||
|
(in Millions)
|
Weighted avg. useful life at December 31, 2012
|
Gross
|
Accumulated Amortization
|
Net
|
Gross
|
Accumulated Amortization
|
Net
|
|||||||||||||||||
|
Intangible assets subject to amortization (finite-lived)
|
||||||||||||||||||||||||
|
Customer relationships
|
19 years
|
$
|
131.4
|
|
$
|
(8.6
|
)
|
$
|
122.8
|
|
$
|
102.0
|
|
$
|
(2.2
|
)
|
$
|
99.8
|
|
|||||
|
Patents
|
13 years
|
0.6
|
|
(0.2
|
)
|
0.4
|
|
0.6
|
|
(0.1
|
)
|
0.5
|
|
|||||||||||
|
Trademarks and trade names
|
4 years
|
1.5
|
|
(0.2
|
)
|
1.3
|
|
0.2
|
|
—
|
|
0.2
|
|
|||||||||||
|
Purchased and licensed technologies
|
12 years
|
63.6
|
|
(14.4
|
)
|
49.2
|
|
54.6
|
|
(9.9
|
)
|
44.7
|
|
|||||||||||
|
Other intangibles
|
13 years
|
4.9
|
|
(1.9
|
)
|
3.0
|
|
4.1
|
|
(1.0
|
)
|
3.1
|
|
|||||||||||
|
$
|
202.0
|
|
$
|
(25.3
|
)
|
$
|
176.7
|
|
$
|
161.5
|
|
$
|
(13.2
|
)
|
$
|
148.3
|
|
|||||||
|
Intangible assets not subject to amortization (indefinite life)
|
||||||||||||||||||||||||
|
Trademarks and trade names
|
$
|
36.3
|
|
$
|
36.3
|
|
$
|
36.3
|
|
$
|
36.3
|
|
||||||||||||
|
In-process research & development
|
2.7
|
|
2.7
|
|
2.7
|
|
2.7
|
|
||||||||||||||||
|
$
|
39.0
|
|
$
|
39.0
|
|
$
|
39.0
|
|
$
|
39.0
|
|
|||||||||||||
|
Total intangible assets
|
$
|
241.0
|
|
$
|
(25.3
|
)
|
$
|
215.7
|
|
$
|
200.5
|
|
$
|
(13.2
|
)
|
$
|
187.3
|
|
||||||
The increase in both finite-lived and indefinite life intangible assets during the year ended
December 31, 2012
was primarily due to the acquisitions completed during 2012 as further described in Note 3.
At
December 31, 2012
, the finite-lived and indefinite life intangibles were allocated among our business segments as follows:
|
(in Millions)
|
Finite-lived
|
Indefinite life
|
|||||
|
Agricultural Products
|
$
|
112.2
|
|
$
|
35.2
|
|
|
|
Specialty Chemicals
|
55.1
|
|
3.2
|
|
|||
|
Industrial Chemicals
|
9.4
|
|
0.6
|
|
|||
|
Total
|
$
|
176.7
|
|
$
|
39.0
|
|
|
Amortization related to intangible assets was not significant in the periods presented. The estimated pre-tax amortization expense for each of the five years ended December 31, 2013 to 2017 is
$12.8 million
,
$12.0 million
,
$11.8 million
,
$10.4 million
and
$9.9 million
, respectively.
55
FMC CORPORATION AND CONSOLIDATED SUBSIDIARIES
Notes to Consolidated Financial Statements — (Continued)
The current replacement cost of inventories exceeded their recorded values by
$165.1 million
at
December 31, 2012
and
$157.5 million
at
December 31, 2011
. App
roximately
40 percent
of inventories in
2012
and
2011
are recorded on the LIFO basis. In 2012 and 2011, approximately
60 percent
of inventories are determined on a FIFO basis.
Inventories consisted of the following:
|
(in Millions)
|
December 31, 2012
|
December 31, 2011
|
|||||
|
Finished goods and work in process
|
$
|
416.0
|
|
$
|
298.6
|
|
|
|
Raw materials
|
259.7
|
|
171.7
|
|
|||
|
Net inventory
|
$
|
675.7
|
|
$
|
470.3
|
|
|
Property, plant and equipment consisted of the following:
|
(in Millions)
|
December 31, 2012
|
December 31, 2011
|
|||||
|
Land and land improvements
|
160.8
|
|
143.1
|
|
|||
|
Mineral rights
|
31.4
|
|
31.4
|
|
|||
|
Buildings
|
377.1
|
|
363.9
|
|
|||
|
Machinery and equipment
|
2,250.3
|
|
2,150.3
|
|
|||
|
Construction in progress
|
217.8
|
|
161.3
|
|
|||
|
Total cost
|
3,037.4
|
|
2,850.0
|
|
|||
|
Accumulated depreciation
|
1,901.2
|
|
1,863.2
|
|
|||
|
Property, plant and equipment, net
|
$
|
1,136.2
|
|
$
|
986.8
|
|
|
Depreciation expense was
$99.1 million
,
$101.1 million
, and
$109.4 million
in
2012
,
2011
and
2010
, respectively.
Our restructuring and other charges (income) are comprised of restructuring, asset disposals and other charges (income) as noted below:
|
|
Year Ended December 31,
|
||||||||||
|
(in Millions)
|
2012
|
2011
|
2010
|
||||||||
|
Restructuring Charges and Asset Disposals
|
$
|
28.3
|
|
$
|
28.0
|
|
$
|
127.2
|
|
||
|
Other Charges (Income), Net
|
9.8
|
|
4.4
|
|
24.7
|
|
|||||
|
Total Restructuring and Other Charges
|
$
|
38.1
|
|
$
|
32.4
|
|
$
|
151.9
|
|
||
56
FMC CORPORATION AND CONSOLIDATED SUBSIDIARIES
Notes to Consolidated Financial Statements — (Continued)
RESTRUCTURING CHARGES AND ASSET DISPOSALS
|
Restructuring Charges
|
|||||||||||||||
|
(in Millions)
|
Severance and Employee Benefits (1)
|
Other Charges (Income) (2)
|
Asset Disposal Charges (3)
|
Total
|
|||||||||||
|
Lithium Restructuring
|
$
|
—
|
|
$
|
—
|
|
$
|
13.3
|
|
$
|
13.3
|
|
|||
|
Zeolites Shutdown
|
5.7
|
|
(0.1
|
)
|
0.8
|
|
6.4
|
|
|||||||
|
Huelva Shutdown
|
—
|
|
1.3
|
|
—
|
|
1.3
|
|
|||||||
|
Other Items (4)
|
2.5
|
|
1.0
|
|
3.8
|
|
7.3
|
|
|||||||
|
Year ended December 31, 2012
|
$
|
8.2
|
|
$
|
2.2
|
|
$
|
17.9
|
|
$
|
28.3
|
|
|||
|
Sodium Percarbonate Phase-out
|
5.5
|
|
0.7
|
|
14.8
|
|
21.0
|
|
|||||||
|
Huelva Shutdown
|
(0.6
|
)
|
1.3
|
|
0.6
|
|
1.3
|
|
|||||||
|
Other Items (4)
|
0.7
|
|
(0.5
|
)
|
5.5
|
|
5.7
|
|
|||||||
|
Year ended December 31, 2011
|
$
|
5.6
|
|
$
|
1.5
|
|
$
|
20.9
|
|
$
|
28.0
|
|
|||
|
Alginates Restructuring
|
(0.6
|
)
|
6.2
|
|
1.6
|
|
7.2
|
|
|||||||
|
Huelva Shutdown
|
37.0
|
|
4.0
|
|
69.4
|
|
110.4
|
|
|||||||
|
Barcelona Facility Shutdown
|
(0.2
|
)
|
(3.0
|
)
|
10.1
|
|
6.9
|
|
|||||||
|
Other Items (4)
|
5.3
|
|
(2.6
|
)
|
—
|
|
2.7
|
|
|||||||
|
Year ended December 31, 2010
|
$
|
41.5
|
|
$
|
4.6
|
|
$
|
81.1
|
|
$
|
127.2
|
|
|||
____________________
|
(1)
|
Represents severance and employee benefit charges. Income represents adjustments to previously recorded severance and employee benefits.
|
|
(2)
|
Primarily represents costs associated with accrued lease payments, contract terminations, and other miscellaneous exit costs. Other Income primarily represents favorable developments on previously recorded exit costs as well as recoveries associated with restructuring.
|
|
(3)
|
Primarily represents accelerated depreciation and impairment charges on plant and equipment, which were or are to be abandoned. Asset disposal charges also included the acceleration effect of re-estimating settlement dates and revised cost estimates associated with asset retirement obligations due to facility shutdowns, see Note 8.
|
|
(4)
|
Represents charges associated with other restructuring activities, which have resulted in severance and asset disposal costs.
|
The restructuring charges and asset disposals noted above were the result of the following:
Industrial Chemicals
Zeolites Restructuring
We made the decision to phase out our zeolite operations in Spain and exit the product line by fourth quarter 2012. The zeolites product line in our Peroxygens division within our Industrial Chemicals segment is a regional business, principally serving the powder detergent market in Spain. Competitive disadvantages and underperforming results have made it uneconomical for FMC to continue zeolite operations. We ceased production at this facility as of December 31, 2012.
Sodium Percarbonate Phase-out
In June 2011, we made the decision to phase out operations of our Sodium Percarbonate plant assets in La Zaida, Spain and exit the sodium percarbonate business by December 2011. The facility is part of our Spanish subsidiary FMC Foret, S.A. ("Foret") and is included in our Industrial Chemicals segment. Competitive disadvantages and underperforming results since the start-up of operations in 2001 have made it uneconomical for FMC to continue sodium percarbonate operations. We ceased production at this facility as of October 31, 2011.
57
FMC CORPORATION AND CONSOLIDATED SUBSIDIARIES
Notes to Consolidated Financial Statements — (Continued)
Huelva Shutdown
In November 2010, we made the decision to cease operations at our Huelva, Spain facility and exit the phosphate business in Europe. The facility was a part of Foret, which is included in our Industrial Chemicals segment. The closure of the facility was initiated as a consequence of the Spanish judicial ruling which, effective January 1, 2011, prohibited us from storing phosphogypsum on a site adjacent to our production facility. The phosphogypsum is a byproduct of the process of manufacturing phosphoric acid, which is used in the manufacturing of our phosphate products. After receipt of the unfavorable Spanish judicial ruling, we attempted to pursue strategic alternatives for our Foret phosphorus business. With no reasonable economic alternatives, the judicial ruling inhibited our ability to cost effectively produce our phosphate product and therefore rendered it uneconomical for FMC to continue operations at the facility. We ceased production at this facility as of December 31, 2010.
Barcelona Facility Shutdown
In June 2009, we made the decision to phase out operations of our facility in Barcelona, Spain, which was completed in 2010. The facility is part of Foret. High costs at the Barcelona facility coupled with reduced demand for product manufactured at that site had made it uneconomical for FMC to continue operations at the Barcelona facility.
Specialty Chemicals
Lithium Restructuring
We committed to the abandonment of various fixed assets, primarily equipment, associated with a Potash project that we have decided not to complete. Potash, commonly used in fertilizers, is a manufactured by-product of our Lithium extraction process in Argentina. Given the changes in Potash market conditions, this project was no longer economically viable. We recorded a non-cash charge of
$13.3 million
associated with the abandonment of these assets.
Additionally, in January 2013, we implemented a plan to restructure a portion of the operations in Lithium. The objective of the restructuring was to better align our business and costs to macroeconomic and market realities. The restructuring decision will result in workforce reductions at several of our Lithium facilities, primarily North Carolina and Argentina. We expect to incur charges between
$10
-
$15 million
, mostly in the first quarter of 2013. These charges will primarily result in cash spending.
Alginates Restructuring
In January 2009, we announced plans to realign our BioPolymer alginates manufacturing operations in Norway and the United Kingdom.
Other Items
In addition to the restructurings described above, we have engaged in certain other restructuring activities, which have resulted in severance and asset disposal costs. We expect these restructuring activities to improve our global competitiveness through improved cost efficiencies.
Roll forward of Restructuring Reserves
The following table shows a roll forward of restructuring reserves that will result in cash spending. These amounts exclude asset retirement obligations, which are discussed in Note 8.
|
(in Millions)
|
Balance at
12/31/10 (3)
|
Change in
reserves (2)
|
Cash
payments
|
Other (4)
|
Balance at
12/31/11 (3)
|
|
Change in
reserves (2)
|
Cash
payments
|
Other (4)
|
Balance at
12/31/12 (3)
|
|
||||||||||||||||||||||||
|
Zeolites Shutdown
|
$
|
—
|
|
$
|
—
|
|
$
|
—
|
|
$
|
—
|
|
$
|
—
|
|
$
|
5.6
|
|
$
|
(4.5
|
)
|
$
|
0.4
|
|
$
|
1.5
|
|
||||||||
|
Sodium Percarbonate Phase-out
|
—
|
|
6.2
|
|
(4.9
|
)
|
(0.2
|
)
|
1.1
|
|
0.2
|
|
(1.3
|
)
|
—
|
|
—
|
|
|||||||||||||||||
|
Huelva Restructuring
|
40.0
|
|
0.7
|
|
(34.4
|
)
|
1.0
|
|
7.3
|
|
1.3
|
|
(5.7
|
)
|
0.1
|
|
3.0
|
|
|||||||||||||||||
|
Other Workforce Related and Facility Shutdowns (1)
|
6.8
|
|
0.2
|
|
(4.2
|
)
|
1.2
|
|
4.0
|
|
3.3
|
|
(1.5
|
)
|
0.2
|
|
6.0
|
|
|||||||||||||||||
|
Total
|
$
|
46.8
|
|
$
|
7.1
|
|
$
|
(43.5
|
)
|
$
|
2.0
|
|
$
|
12.4
|
|
$
|
10.4
|
|
$
|
(13.0
|
)
|
$
|
0.7
|
|
$
|
10.5
|
|
||||||||
____________________
|
(1)
|
Primarily severance costs related to workforce reductions and facility shutdowns described in the “Other Items” sections above.
|
58
FMC CORPORATION AND CONSOLIDATED SUBSIDIARIES
Notes to Consolidated Financial Statements — (Continued)
|
(2)
|
Primarily severance, exited lease, contract termination and other miscellaneous exit costs. The accelerated depreciation and impairment charges noted above impacted our property, plant and equipment balances and are not included in the above tables.
|
|
(3)
|
Included in “Accrued and other liabilities” on the consolidated balance sheets.
|
|
(4)
|
Primarily foreign currency translation adjustments and cash proceeds associated with recoveries.
|
OTHER CHARGES (INCOME), NET
|
|
Year Ended December 31,
|
||||||||||
|
(in Millions)
|
2012
|
2011
|
2010
|
||||||||
|
Environmental charges, net
|
$
|
5.8
|
|
$
|
3.1
|
|
$
|
14.2
|
|
||
|
Other, net
|
4.0
|
|
1.3
|
|
10.5
|
|
|||||
|
Other Charges (Income), Net
|
$
|
9.8
|
|
$
|
4.4
|
|
$
|
24.7
|
|
||
Environmental charges, net
Environmental charges represent the net charges associated with environmental remediation at continuing operating sites, see Note 10 for additional details.
Other, net
During 2012, our Agricultural Products segment entered into a collaboration and license agreement with a third-party company for the purpose of obtaining certain technology and intellectual property rights relating to a new fungicide compound still under development. We recorded
$4.4 million
for these rights as a charge for the year ended
December 31, 2012
.
In 2010, our Agricultural Products segment acquired certain rights relating to an herbicide compound still under development. We recorded
$5.7 million
for these rights as a charge for the year ended December 31, 2010.
We have mining operations in Green River, Wyoming for our soda ash business as well as mining operations in our lithium operations. We have legal reclamation obligations related to these facilities upon closure of the mines. Additionally, we have obligations at the majority of our manufacturing facilities in the event of a permanent plant shutdown. Certain of these obligations are recorded in our environmental reserves described in Note 10. For certain AROs not already accrued, we have calculated the fair value of these AROs and concluded that the present value of these obligations was immaterial at
December 31, 2012
and
2011
. We have also determined that the liability for certain other AROs cannot currently be calculated as the settlement dates are not reasonably estimable. We will recognize the liability for these AROs when sufficient information exists to estimate a range of potential settlement dates.
59
FMC CORPORATION AND CONSOLIDATED SUBSIDIARIES
Notes to Consolidated Financial Statements — (Continued)
The changes in the carrying amounts of AROs for the years ended
December 31, 2012
and
2011
are as follows:
|
(in Millions)
|
|
||
|
Balance at December 31, 2010
|
$
|
34.6
|
|
|
Increase (decrease) to previously recorded ARO liability
|
5.5
|
|
|
|
Accretion expense
|
0.3
|
|
|
|
Payments
|
(12.1
|
)
|
|
|
Foreign currency translation adjustments
|
(1.3
|
)
|
|
|
Balance at December 31, 2011
|
$
|
27.0
|
|
|
Acceleration due to facility shutdowns
|
2.0
|
|
|
|
Increase (decrease) to previously recorded ARO liability
|
(0.7
|
)
|
|
|
Accretion expense
|
0.1
|
|
|
|
Payments
|
(3.2
|
)
|
|
|
Foreign currency translation adjustments
|
0.3
|
|
|
|
Balance at December 31, 2012
|
$
|
25.5
|
|
Our discontinued operations represent adjustments to retained liabilities primarily related to operations discontinued between 1976 and 2001. The primary liabilities retained include environmental liabilities, other postretirement benefit liabilities, self-insurance and long-term obligations related to legal proceedings.
Our discontinued operations comprised the following:
|
(in Millions)
|
Year Ended December 31,
|
||||||||||
|
2012
|
2011
|
2010
|
|||||||||
|
Adjustment for workers’ compensation, product liability, and other postretirement benefits, net of income tax benefit (expense) of $0.2, ($0.3) and ($0.4)
|
$
|
(0.3
|
)
|
$
|
0.7
|
|
$
|
0.8
|
|
||
|
Provision for environmental liabilities, net of recoveries, net of income tax benefit of $7.8, $9.6 and $14.5 (1)
|
(12.6
|
)
|
(15.8
|
)
|
(23.6
|
)
|
|||||
|
Provision for legal reserves and expenses, net of recoveries, net of income tax benefit of $10.6, $10.3 and $9.7
|
(17.3
|
)
|
(16.7
|
)
|
(15.9
|
)
|
|||||
|
Income from a tax matter related to a previously discontinued operation
|
—
|
|
—
|
|
5.1
|
|
|||||
|
Discontinued operations, net of income taxes
|
$
|
(30.2
|
)
|
$
|
(31.8
|
)
|
$
|
(33.6
|
)
|
||
____________________
|
(1)
|
See a roll forward of our environmental reserves as well as discussion on significant environmental issues that occurred during the year in Note 10.
|
Reserve for Discontinued Operations at
December 31, 2012
and
2011
|
(in Millions)
|
December 31,
|
||||||
|
2012
|
2011
|
||||||
|
Workers’ compensation and product liability reserve
|
$
|
4.9
|
|
$
|
5.1
|
|
|
|
Postretirement medical and life insurance benefits reserve
|
8.3
|
|
8.6
|
|
|||
|
Reserves for legal proceedings
|
31.2
|
|
27.9
|
|
|||
|
Reserve for Discontinued Operations
|
$
|
44.4
|
|
$
|
41.6
|
|
|
The discontinued postretirement medical and life insurance benefits liability equals the accumulated postretirement benefit obligation. Associated with this liability is a net pretax actuarial gain and prior service credit of
$11.3 million
(
$7.1 million
after-tax) and
$13.3 million
(
$8.7 million
after-tax) at
December 31, 2012
and
2011
, respectively. The estimated net actuarial gain and prior service credit that will be amortized from accumulated other comprehensive income into discontinued operations during 2013 are
$1.5 million
and
$0.1 million
, respectively.
60
FMC CORPORATION AND CONSOLIDATED SUBSIDIARIES
Notes to Consolidated Financial Statements — (Continued)
Spending in
2012
,
2011
and
2010
was
$1.0 million
,
$1.3 million
and
$0.7 million
, respectively, for workers’ compensation, product liability and other claims;
$0.7 million
,
$1.0 million
and
$1.6 million
, respectively, for other postretirement benefits; and
$24.6 million
,
$20.9 million
and
$25.8 million
, respectively, related to reserves for legal proceedings associated with discontinued operations.
We are subject to various federal, state, local and foreign environmental laws and regulations that govern emissions of air pollutants, discharges of water pollutants, and the manufacture, storage, handling and disposal of hazardous substances, hazardous wastes and other toxic materials and remediation of contaminated sites. We are also subject to liabilities arising under the Comprehensive Environmental Response, Compensation and Liability Act (“CERCLA”) and similar state laws that impose responsibility on persons who arranged for the disposal of hazardous substances, and on current and previous owners and operators of a facility for the clean-up of hazardous substances released from the facility into the environment. We are also subject to liabilities under the Resource Conservation and Recovery Act (“RCRA”) and analogous state laws that require owners and operators of facilities that have treated, stored or disposed of hazardous waste pursuant to a RCRA permit to follow certain waste management practices and to clean up releases of hazardous substances into the environment associated with past or present practices. In addition, when deemed appropriate, we enter certain sites with potential liability into voluntary remediation compliance programs, which are also subject to guidelines that require owners and operators, current and previous, to clean up releases of hazardous substances into the environment associated with past or present practices.
We have been named a Potentially Responsible Party (“PRP”) at
29
sites on the federal government’s National Priorities List (“NPL”), at which our potential liability has not yet been settled. In addition, we received notice from the EPA or other regulatory agencies that we may be a PRP, or PRP equivalent, at other sites, including
38
sites at which we have determined that it is reasonably possible that we have an environmental liability. In cooperation with appropriate government agencies, we are currently participating in, or have participated in, a Remedial Investigation/Feasibility Study (“RI/FS”), or equivalent, at most of the identified sites, with the status of each investigation varying from site to site. At certain sites, a RI/FS has only recently begun, providing limited information, if any, relating to cost estimates, timing, or the involvement of other PRPs; whereas, at other sites, the studies are complete, remedial action plans have been chosen, or a Record of Decision (“ROD”) has been issued.
Environmental liabilities consist of obligations relating to waste handling and the remediation and/or study of sites at which we are alleged to have released or disposed of hazardous substances. These sites include current operations, previously operated sites, and sites associated with discontinued operations. We have provided reserves for potential environmental obligations that we consider probable and for which a reasonable estimate of the obligation can be made. Accordingly, total reserves of
$236.5 million
and
$251.2 million
, respectively, before recoveries, existed at
December 31, 2012
and
2011
.
The estimated reasonably possible environmental loss contingencies, net of expected recoveries, exceed amounts accrued by approximately
$160 million
at
December 31, 2012
. This reasonably possible estimate is based upon information available as of the date of the filing and the actual future losses may be higher given the uncertainties regarding the status of laws, regulations, enforcement policies, the impact of potentially responsible parties, technology and information related to individual sites.
Additionally, although potential environmental remediation expenditures in excess of the reserves and estimated loss contingencies could be significant, the impact on our future consolidated financial results is not subject to reasonable estimation due to numerous uncertainties concerning the nature and scope of possible contamination at many sites, identification of remediation alternatives under constantly changing requirements, selection of new and diverse clean-up technologies to meet compliance standards, the timing of potential expenditures and the allocation of costs among PRPs as well as other third parties. The liabilities arising from potential environmental obligations that have not been reserved for at this time may be material to any one quarter's or year's results of operations in the future. However, we believe any liability arising from such potential environmental obligations is not likely to have a material adverse effect on our liquidity or financial condition as it may be satisfied over many years.
The table below is a roll forward of our total environmental reserves, continuing and discontinued, from December 31, 2009 to
December 31, 2012
.
61
FMC CORPORATION AND CONSOLIDATED SUBSIDIARIES
Notes to Consolidated Financial Statements — (Continued)
|
(in Millions)
|
Operating
and
Discontinued
Sites Total
|
||
|
Total environmental reserves, net of recoveries at December 31, 2009
|
$
|
184.1
|
|
|
2010
|
|||
|
Provision
|
76.1
|
|
|
|
Spending, net of recoveries
|
(35.3
|
)
|
|
|
Net Change
|
40.8
|
|
|
|
Total environmental reserves, net of recoveries at December 31, 2010
|
$
|
224.9
|
|
|
|
|||
|
2011
|
|||
|
Provision
|
45.2
|
|
|
|
Spending, net of recoveries
|
(43.2
|
)
|
|
|
Net Change
|
2.0
|
|
|
|
Total environmental reserves, net of recoveries at December 31, 2011
|
$
|
226.9
|
|
|
|
|||
|
2012
|
|||
|
Provision
|
31.2
|
|
|
|
Spending, net of recoveries
|
(42.1
|
)
|
|
|
Net Change
|
(10.9
|
)
|
|
|
Total environmental reserves, net of recoveries at December 31, 2012
|
$
|
216.0
|
|
To ensure we are held responsible only for our equitable share of site remediation costs, we have initiated, and will continue to initiate, legal proceedings for contributions from other PRPs. At
December 31, 2012
and
2011
, we have recorded recoveries representing probable realization of claims against U.S. government agencies, insurance carriers and other third parties. Recoveries are recorded as either an offset to the “Environmental liabilities, continuing and discontinued” or as “Other assets” in the consolidated balance sheets. The table below is a roll forward of our total recorded recoveries from
December 31, 2011
to
December 31, 2012
:
|
(in Millions)
|
12/31/2011
|
Increase in Recoveries
|
Cash Received
|
12/31/2012
|
|||||||||||
|
Environmental liabilities, continuing and discontinued
|
$
|
24.3
|
|
$
|
2.2
|
|
$
|
6.0
|
|
$
|
20.5
|
|
|||
|
Other assets
|
58.3
|
|
5.0
|
|
11.7
|
|
51.6
|
|
|||||||
|
Total
|
$
|
82.6
|
|
$
|
7.2
|
|
$
|
17.7
|
|
$
|
72.1
|
|
|||
The table below provides detail of current and long-term environmental reserves, continuing and discontinued.
|
December 31,
|
|||||||
|
(in Millions)
|
2012
|
2011
|
|||||
|
Environmental reserves, current, net of recoveries (1)
|
$
|
15.8
|
|
$
|
13.6
|
|
|
|
Environmental reserves, long-term continuing and discontinued, net of recoveries (2)
|
200.2
|
|
213.3
|
|
|||
|
Total environmental reserves, net of recoveries
|
$
|
216.0
|
|
$
|
226.9
|
|
|
______________
|
(1)
|
“Current” includes only those reserves related to continuing operations. These amounts are included within “Accrued and other liabilities” on the consolidated balance sheets.
|
|
(2)
|
These amounts are included in "Environmental liabilities, continuing and discontinued" on the consolidated balance sheets.
|
Our net environmental provisions relate to costs for the continued cleanup of both operating sites and for certain discontinued manufacturing operations from previous years. The net provisions are comprised as follows:
62
FMC CORPORATION AND CONSOLIDATED SUBSIDIARIES
Notes to Consolidated Financial Statements — (Continued)
|
Year ended December 31,
|
|||||||||||
|
(in Millions)
|
2012
|
2011
|
2010
|
||||||||
|
Continuing operations (1)
|
$
|
5.8
|
|
$
|
3.1
|
|
$
|
14.2
|
|
||
|
Discontinued operations (2)
|
20.4
|
|
25.4
|
|
38.1
|
|
|||||
|
Net environmental provision
|
$
|
26.2
|
|
$
|
28.5
|
|
$
|
52.3
|
|
||
______________
|
(1)
|
Recorded as a component of “Restructuring and other charges (income)” on our consolidated statements of income. See Note 7.
|
|
(2)
|
Recorded as a component of “Discontinued operations, net" on our consolidated statements of income. See Note 9.
|
On our consolidated balance sheets, the net environmental provisions affect assets and liabilities as follows:
|
Year ended December 31,
|
|||||||||||
|
(in Millions)
|
2012
|
2011
|
2010
|
||||||||
|
Environmental reserves (1)
|
$
|
31.2
|
|
$
|
45.2
|
|
$
|
76.1
|
|
||
|
Other assets (2)
|
(5.0
|
)
|
(16.7
|
)
|
(23.8
|
)
|
|||||
|
Net environmental provision
|
$
|
26.2
|
|
$
|
28.5
|
|
$
|
52.3
|
|
||
______________
|
(1)
|
See above roll forward of our total environmental reserves as presented on our consolidated balance sheets.
|
|
(2)
|
Represents certain environmental recoveries. See Note 20 for details of Other assets as presented on our consolidated balance sheets.
|
Significant Environmental Sites
Front Royal
This discontinued manufacturing site, built in 1940 by American Viscose, was once one of the world's largest producers of rayon, an instrumental product for NASA's space shuttle program. The facility also made tire cord, parachutes and jump suits for the Department of War during World War II. We purchased the plant in 1963 and sold it in 1976 to Avtex Fibers Corporation. In 1989, this Avtex site was cited for violations of Virginia environmental laws, associated primarily with wastewater discharges into the Shenandoah River and was subsequently shut down. We, as the sole surviving owner of the plant, became the mandated “potentially responsible party” for cleanup purposes.
On October 21, 1999, the Federal District Court for the Western District of Virginia approved a Consent Decree signed by FMC, the EPA (Region III) and the Department of Justice ("DOJ") regarding past response costs and future clean-up work at this site. In January 2010, the EPA issued a Record of Decision (ROD) for Operable Unit 7 (OU-7) primarily addressing waste basins and ground water, which should be the last operable unit to be remediated at the site. Included in our reserves for this site is the cost associated with a groundwater treatment plant which is an integral component of the remedy required to address the OU-7 ROD. This groundwater treatment plant is currently under construction. As part of a prior settlement, government agencies have reimbursed us for approximately one-third of the clean-up costs due to the government's role at the site, and we expect reimbursement to continue in the future. The amount of the reserve for this site was
$41.2 million
and
$36.4 million
at
December 31, 2012
and
2011
, respectively.
Pocatello
From 1949 until 2001, we operated the world's largest elemental phosphorus plant in Power County, Idaho, just outside the city of Pocatello. Since the plant's closure, FMC has worked with the EPA, the State of Idaho, and the Shoshone-Bannock Tribes to develop a proposed cleanup plan for the property. In September of 2012 the EPA issued an interim record of decision (IROD) that is environmentally protective and that ensures the health and safety of both workers and the general public. Since the plant's closure,
we have successfully decommissioned our Pocatello plant, completed closure of the RCRA ponds and formally requested that the EPA acknowledge completion of work under a June 1999 RCRA Consent Decree. Future remediation costs include completion of the IROD that addresses groundwater contamination and existing waste disposal areas on the Pocatello plant portion of the Eastern Michaud Flats Superfund Site. Our current reserves factor in the estimated costs associated with
63
FMC CORPORATION AND CONSOLIDATED SUBSIDIARIES
Notes to Consolidated Financial Statements — (Continued)
implementing the IROD. In addition to implementing the IROD, we continue to conduct work pursuant to CERCLA unilaterial administrative orders to address air emissions from beneath the cap of several of the closed RCRA ponds.
The amount of the reserve for this site was
$61.7 million
and
$63.6 million
at
December 31, 2012
and
2011
, respectively.
Pocatello Tribal Litigation
For a number of years, we engaged in disputes with the Tribes concerning their attempts to regulate our activities on the reservation. On March 6, 2006, a U.S. District Court Judge found that the Tribes were a third-party beneficiary of a 1998 RCRA Consent Decree and ordered us to apply for any applicable Tribal permits relating to the nearly-complete RCRA Consent Decree work. The third-party beneficiary ruling was later reversed by the Ninth Circuit Court of Appeals, but the permitting process continued in the tribal legal system. We applied for the tribal permits, but preserved objections to the Tribes' jurisdiction.
In addition, in 1998, the Tribes and we entered into an agreement (“1998 Agreement”) that required us to pay the Tribes
$1.5 million
per year for waste generated from operating our Pocatello plant and stored on site. We paid
$1.5 million
per year until December 2001 when the plant closed. In our view the agreement was terminated, as the plant was no longer generating waste. The Tribes claim that the 1998 Agreement has no end date.
On April 25, 2006 the Tribes' Land Use Policy Commission issued us a Special Use Permit for the “disposal and storage of waste” at the Pocatello plant and imposed a
$1.5 million
per annum permit fee. The permit and fee were affirmed by the Tribal Business Council on July 21, 2006. We sought review of the permit and fee in Tribal Court, in which the Tribes also brought a claim for breach of the 1998 Agreement. On May 21, 2008, the Tribal Court reversed the permit and fee, finding that they were not authorized under tribal law, and dismissed the Tribes' breach of contract claim. The Tribes appealed to the Tribal Court of Appeals.
On May 8, 2012, the Tribal Court of Appeals reversed the May 21, 2008 Tribal Court decision and issued a decision finding the permit and fee validly authorized and ordering us to pay waste permit fees in the amount of
$1.5 million
per annum for the years 2002-2007 (
$9.0 million
in total), the Tribes' demand as set forth in the lawsuit. It also reinstated the breach of contract claim. To date, the Tribes have not demanded fees for any years subsequent to 2007.
Following the issuance of the Tribal Appellate Court's decision, the Tribes filed a motion to correct errors in the Court's decision and to seek fees and costs on appeal. We opposed that motion and filed our own motion to strike certain portions of the decision and supplement the record. The Tribal Appellate Court granted the Tribes' motion for fees but scheduled a further hearing on that motion, and also ordered an evidentiary hearing in the Tribal Appellate Court on the Tribes' breach of contract claim and additional issues related to Tribal jurisdiction. The Tribal Court of Appeals has also indicated that further proceedings are suspended pending receipt of federal funding.
After we exhaust the Tribal administrative and judicial process, we intend to file an action in the United States District Court seeking declaratory and injunctive relief on the grounds that the Tribes lacked jurisdiction over us. We will argue that in accordance with a U.S. Supreme Court decision, we neither consented to jurisdiction, nor engaged in conduct that threatened the political integrity, economic security or health and welfare of tribal members; therefore, the exceptions under which Tribes may assert jurisdiction over non-Indian owners of fee land within a reservation have not been met. Should we prevail on that theory and the Tribes subsequently try to enforce the 1998 Agreement in federal court, we have a number of defenses, including the termination of the agreement.
We have estimated a reasonably possible loss for this matter and it has been reflected in our total reasonably possible loss estimate previously discussed within this note.
Middleport
Our Middleport, NY facility is currently an Agricultural Products formulation and packaging plant that formerly manufactured arsenic-based and other products. As a result of past manufacturing operations and waste disposal practices at this facility, releases of hazardous substances have occurred at the the site that have affected soil, sediment, surface water and groundwater at the facility's property and also in adjacent off-site areas. The impact of our discontinued operations was the subject of an Administrative Order on Consent (“AOC”) entered into with the EPA and New York State Department of Environmental Conservation. (the “Agencies”). The AOC requires us to (1) define the nature and extent of contamination caused by our historical plant operations, (2) take interim corrective measures and (3) evaluate Corrective Action Management Alternatives (“CMA”) for discrete contaminated areas.
64
FMC CORPORATION AND CONSOLIDATED SUBSIDIARIES
Notes to Consolidated Financial Statements — (Continued)
We have defined the nature and extent of the contamination and have constructed an engineered cover, closed the RCRA regulated surface water impoundments and are collecting and treating both surface water runoff and ground water, which has satisfied the first two requirements of the AOC.
On June 15, 2012, the Agencies issued a Preliminary Statement of Basis (PSOB) that proposes a CMA in two off-site areas that would require us to remediate contamination in approximately
180
residential properties in Middleport to a standard of
20
ppm on a point-to-point basis. We believe that this proposed CMA for these areas is overly conservative and not supported under New York State law. The Middleport community has expressed objections to the Agencies' PSOB on the grounds that it is not supported by site-specific risk assessment and would be disruptive to the community. The Agencies are in the process of reviewing comments received during the public comment period, which closed on August 13, 2012.
The amount of the reserve for this site is
$42.4 million
and
$47.0 million
at
December 31, 2012
and
2011
, respectively. Our reserve continues to include the estimated liability for clean-up to reflect the costs associated with our recommended CMA. Our estimated reasonably possible environmental loss contingencies exposure reflects the additional cost of the CMA proposed in the PSOB.
Domestic and foreign components of income from continuing operations before income taxes are shown below:
|
|
Year Ended December 31,
|
||||||||||
|
(in Millions)
|
2012
|
2011
|
2010
|
||||||||
|
Domestic
|
$
|
391.0
|
|
$
|
325.7
|
|
$
|
303.2
|
|
||
|
Foreign
|
221.6
|
|
224.8
|
|
47.3
|
|
|||||
|
Total
|
$
|
612.6
|
|
$
|
550.5
|
|
$
|
350.5
|
|
||
The provision (benefit) for income taxes attributable to income from continuing operations consisted of:
|
|
Year Ended December 31,
|
||||||||||
|
(in Millions)
|
2012
|
2011
|
2010
|
||||||||
|
Current:
|
|||||||||||
|
Federal
|
$
|
32.9
|
|
$
|
16.5
|
|
$
|
73.4
|
|
||
|
Foreign
|
55.0
|
|
30.2
|
|
26.0
|
|
|||||
|
State
|
1.5
|
|
—
|
|
0.5
|
|
|||||
|
Total current
|
89.4
|
|
46.7
|
|
99.9
|
|
|||||
|
Deferred:
|
|||||||||||
|
Federal
|
74.6
|
|
64.8
|
|
20.2
|
|
|||||
|
Foreign
|
(11.5
|
)
|
18.9
|
|
4.3
|
|
|||||
|
State
|
(5.8
|
)
|
6.1
|
|
7.6
|
|
|||||
|
Total deferred
|
57.3
|
|
89.8
|
|
32.1
|
|
|||||
|
Total
|
$
|
146.7
|
|
$
|
136.5
|
|
$
|
132.0
|
|
||
Total income tax provisions (benefits) were allocated as follows:
|
|
Year Ended December 31,
|
||||||||||
|
(in Millions)
|
2012
|
2011
|
2010
|
||||||||
|
Continuing operations
|
$
|
146.7
|
|
$
|
136.5
|
|
$
|
132.0
|
|
||
|
Discontinued operations
|
(18.6
|
)
|
(19.6
|
)
|
(28.9
|
)
|
|||||
|
Items charged directly to equity
|
(19.2
|
)
|
(43.1
|
)
|
(62.5
|
)
|
|||||
|
Total
|
$
|
108.9
|
|
$
|
73.8
|
|
$
|
40.6
|
|
||
Significant components of the deferred income tax provision (benefit) attributable to income from continuing operations before income taxes are as follows:
65
FMC CORPORATION AND CONSOLIDATED SUBSIDIARIES
Notes to Consolidated Financial Statements — (Continued)
|
|
Year Ended December 31,
|
||||||||||
|
(in Millions)
|
2012
|
2011
|
2010
|
||||||||
|
Deferred tax (exclusive of valuation allowance)
|
$
|
65.4
|
|
$
|
73.5
|
|
$
|
(7.1
|
)
|
||
|
Net increase (decrease) in the valuation allowance for deferred tax assets
|
(8.1
|
)
|
16.3
|
|
39.2
|
|
|||||
|
Deferred income tax provision
|
$
|
57.3
|
|
$
|
89.8
|
|
$
|
32.1
|
|
||
We have recognized that it is more likely than not that certain future tax benefits may not be realized through future taxable
income. During the year ended
December 31, 2012
, the valuation allowance decreased primarily due to
$14.9 million
of U.S. state net operating losses now expected to be recoverable. This was partially offset by a
$6.8 million
provision primarily due to tax losses of foreign operations that are not expected to be fully recoverable in future years. During the year ended
December 31, 2011
, we increased the valuation allowance primarily due to our foreign operations for tax loss
es that are not expected to be fully recoverable in future years. During the year ended December 31, 2010, we increased the valuation allowance related to our Spanish legal entity predominantly due to the Huelva facility shutdown, for tax losses that are not expected to be fully recoverable in future years from the earnings of the remaining businesses in that entity.
Significant components of our deferred tax assets and liabilities were attributable to:
|
|
December 31,
|
||||||
|
(in Millions)
|
2012
|
2011
|
|||||
|
Reserves for discontinued operations, environmental and restructuring
|
$
|
104.8
|
|
$
|
104.4
|
|
|
|
Accrued pension and other postretirement benefits
|
113.8
|
|
109.8
|
|
|||
|
Other reserves
|
54.1
|
|
51.5
|
|
|||
|
Alternative minimum, foreign tax and other credit carryforwards
|
11.8
|
|
70.9
|
|
|||
|
Net operating loss carryforwards
|
86.7
|
|
83.7
|
|
|||
|
Deferred expenditures capitalized for tax
|
54.3
|
|
63.2
|
|
|||
|
Other
|
109.8
|
|
77.4
|
|
|||
|
Deferred tax assets
|
$
|
535.3
|
|
$
|
560.9
|
|
|
|
Valuation allowance, net
|
(84.5
|
)
|
(92.6
|
)
|
|||
|
Deferred tax assets, net of valuation allowance
|
$
|
450.8
|
|
$
|
468.3
|
|
|
|
Property, plant and equipment, net
|
94.1
|
|
85.9
|
|
|||
|
Deferred tax liabilities
|
$
|
94.1
|
|
$
|
85.9
|
|
|
|
Net deferred tax assets
|
$
|
356.7
|
|
$
|
382.4
|
|
|
We have recorded a valuation allowance to reduce deferred tax assets to the amount that we believe it is more likely than not to be realized. In assessing the need for this allowance, we have considered a number of factors including future earnings, the jurisdictions in which such income is earned and our ongoing tax planning stategies. In the event that we determine that we would not be able to realize all or part of our net deferred tax assets in the future, an adjustment to the deferred tax assets would be charged to income in the period such determination was made. Similarly, should we conclude that we would be able to realize certain deferred tax assets in the future in excess of the net recorded amount, an adjustment to the deferred tax assets would increase income in the period such determination was made.
At
December 31, 2012
, we had net operating loss and tax credit carryforwards as follows: U.S. state net operating loss carryforwards of
$602.7 million
expiring in various amounts and years through 2029, foreign net operating loss carryforwards of
$277.9 million
expiring in various years, U.S. foreign tax credit carryforwards of
$1.4 million
expiring in various amounts and years through 2019.
66
FMC CORPORATION AND CONSOLIDATED SUBSIDIARIES
Notes to Consolidated Financial Statements — (Continued)
The effective income tax rate applicable to income from continuing operations before income taxes was different from the statutory U.S. federal income tax rate due to the factors listed in the following table:
|
|
Year Ended December 31,
|
|||||||
|
|
2012
|
2011
|
2010
|
|||||
|
Statutory U.S. tax rate
|
35.0
|
%
|
35.0
|
%
|
35.0
|
%
|
||
|
Net difference:
|
||||||||
|
Percentage depletion
|
(3.5
|
)
|
(3.7
|
)
|
(5.1
|
)
|
||
|
State and local income taxes, less federal income tax benefit
|
1.1
|
|
1.1
|
|
1.2
|
|
||
|
Foreign earnings subject to different tax rates
|
(6.7
|
)
|
(9.0
|
)
|
(6.2
|
)
|
||
|
Manufacturer’s production deduction and miscellaneous tax credits
|
(1.3
|
)
|
(0.8
|
)
|
(0.8
|
)
|
||
|
Tax on intercompany dividends and deemed dividend for tax purposes
|
0.4
|
|
1.0
|
|
0.8
|
|
||
|
Nondeductible expenses
|
0.4
|
|
1.0
|
|
0.9
|
|
||
|
Changes to unrecognized tax benefits
|
(0.2
|
)
|
(1.9
|
)
|
1.1
|
|
||
|
Change in valuation allowance
|
(0.7
|
)
|
3.2
|
|
11.5
|
|
||
|
Other
|
(0.6
|
)
|
(1.1
|
)
|
(0.7
|
)
|
||
|
Total difference
|
(11.1
|
)
|
(10.2
|
)
|
2.7
|
|
||
|
Effective tax rate
|
23.9
|
%
|
24.8
|
%
|
37.7
|
%
|
||
At December 31, 2012, unremitted earnings of subsidiaries outside the United States totaling
$1,194.5 million
were deemed to be permanently reinvested. No deferred tax liability has been recognized with regards to the remittance of such earnings. It is not practical to estimate the income tax liability that might be incurred if such earnings were remitted to the United States.
Uncertain Income Tax Positions
U.S. GAAP accounting guidance for uncertainty in income taxes prescribes a model for the recognition and measurement of a tax position taken or expected to be taken in a tax return, and provides guidance on derecognition, classification, interest and penalties, disclosure and transition.
We file income tax returns in the U.S. federal jurisdiction, and various states and foreign jurisdictions. The income tax returns for FMC entities taxable in the U.S and significant foreign jurisdictions are open for examination and adjustment. As of
December 31, 2012
, the United States Federal and State income tax returns are open for examination and adjustment for the years 2009-2012 and 2003-2012, respectively. Our significant foreign jurisdictions, which total
16
, are open for examination and adjustment during varying periods from 2003-2012.
The total amount of unrecognized tax benefits as of
December 31, 2012
that, if recognized, would impact the effective tax rate is
$6.6 million
. We recognize accrued interest and penalties related to unrecognized tax benefits as a component of income tax expense in the consolidated financial statements. As of and for the year ended December 31, 2012, the amount of current and accumulated interest and penalties recognized in both the consolidated statements of income and consolidated balance sheets was
$0.1 million
. No interest or penalties were recognized in either 2011 or 2010.
We do not expect any reductions in the liability for unrecognized tax benefits within the next 12 months on account of settlements and the expirations of statutes of limitations. A reconciliation of the beginning and ending amount of unrecognized tax benefits is as follows:
|
(in Millions)
|
2012
|
2011
|
2010
|
|||||
|
Balance at beginning of year
|
8.1
|
|
17.3
|
|
14.4
|
|
||
|
Additions for the current year
|
5.5
|
|
4.9
|
|
6.1
|
|
||
|
Additions for tax positions on acquisitions
|
—
|
|
1.4
|
|
—
|
|
||
|
Adjustments for tax positions of prior years for:
|
||||||||
|
Adjustments
|
9.7
|
|
—
|
|
(0.6
|
)
|
||
|
Settlements during the period
|
—
|
|
(15.5
|
)
|
(2.6
|
)
|
||
|
Balance at end of year (1)
|
23.3
|
|
8.1
|
|
17.3
|
|
||
____________________
67
FMC CORPORATION AND CONSOLIDATED SUBSIDIARIES
Notes to Consolidated Financial Statements — (Continued)
|
(1)
|
As of December 31, 2012, we have recognized an offsetting non-current deferred tax asset of
$16.7 million
relating to specific uncertain tax positions presented above.
|
Debt maturing within one year:
Debt maturing within one year consists of the following:
|
December 31,
|
|||||||
|
(in Millions)
|
2012
|
2011
|
|||||
|
Short-term debt
|
$
|
50.6
|
|
$
|
27.0
|
|
|
|
Current portion of long-term debt
|
5.7
|
|
19.5
|
|
|||
|
Total debt maturing within one year
|
$
|
56.3
|
|
$
|
46.5
|
|
|
|
Weighted average interest rates for short-term debt outstanding at year-end
|
6.5
|
%
|
9.7
|
%
|
|||
Short-term debt consisted of foreign credit lines at
December 31, 2012
and
December 31, 2011
. We often provide parent-company guarantees to lending institutions providing credit to our foreign subsidiaries.
Long-term debt consists of the following:
|
(in Millions)
|
December 31, 2012
|
|
|
||||||||
|
Interest Rate
Percentage
|
Maturity
Date
|
12/31/2012
|
12/31/2011
|
||||||||
|
Pollution control and industrial revenue bonds (less unamortized discounts of $0.2 and $0.2, respectively)
|
0.2-6.5%
|
2013-2035
|
|
$
|
176.7
|
|
|
$
|
176.7
|
|
|
|
Senior notes (less unamortized discount of $1.8 and $2.1, respectively)
|
3.95-5.2%
|
2019-2022
|
|
598.2
|
|
|
597.9
|
|
|||
|
2011 credit agreement (1)
|
2.4%
|
2016
|
130.0
|
|
—
|
|
|||||
|
Foreign debt
|
0-8.9%
|
2013-2023
|
|
9.6
|
|
|
24.0
|
|
|||
|
Total long-term debt
|
|
|
|
914.5
|
|
|
798.6
|
|
|||
|
Less: debt maturing within one year
|
|
|
|
5.7
|
|
|
19.5
|
|
|||
|
Total long-term debt, less current portion
|
|
|
|
$
|
908.8
|
|
|
$
|
779.1
|
|
|
____________________
|
(1)
|
Letters of credit outstanding under the 2011 credit agreement totaled
$74.0 million
. Available funds under this facility were
$1,296.0 million
at
December 31, 2012
.
|
Maturities of long-term debt
Maturities of long-term debt outstanding, excluding discounts, at
December 31, 2012
, are
$5.7 million
in 2013,
$33.3 million
in 2014,
$0.9 million
in 2015,
$131.0 million
in 2016,
$0.7 million
in 2017 and
$744.9 million
thereafter.
Covenants
Among other restrictions, the 2011 Credit Agreement contains financial covenants applicable to FMC and its consolidated subsidiaries related to leverage (measured as the ratio of debt to adjusted earnings) and interest coverage (measured as the ratio of adjusted earnings to interest expense). Our actual leverage for the four consecutive quarters ended
December 31, 2012
was
1.4
which is below the maximum leverage of
3.5
. Our actual interest coverage for the four consecutive quarters ended
December 31, 2012
was
17.3
which is above the minimum interest coverage of
3.5
. We were in compliance with all covenants at
December 31, 2012
.
Compensating Balance Agreements
We maintain informal credit arrangements in many foreign countries. Foreign lines of credit, which include overdraft facilities, typically do not require the maintenance of compensating balances, as credit extension is not guaranteed but is subject to the availability of funds.
68
FMC CORPORATION AND CONSOLIDATED SUBSIDIARIES
Notes to Consolidated Financial Statements — (Continued)
The funded status of our U.S. qualified and nonqualified defined benefit pension plans, our United Kingdom, Ireland, Belgium and Norway defined benefit pension plans, plus our U.S. other postretirement healthcare and life insurance benefit plans for continuing operations, together with the associated balances and net periodic benefit cost recognized in our consolidated financial statements as of December 31, are shown in the tables below.
We are required to recognize in our consolidated balance sheets the overfunded and underfunded status of our defined benefit postretirement plans. The overfunded or underfunded status is defined as the difference between the fair value of plan assets and the projected benefit obligation. We are also required to recognize as a component of other comprehensive income the actuarial gains and losses and the prior service costs and credits that arise during the period.
The following table summarizes the weighted-average assumptions used and components of our defined benefit postretirement plans. The following tables also reflect a measurement date of December 31:
|
|
Pensions
|
Other Benefits (1)
|
|||||||||||||
|
|
December 31,
|
||||||||||||||
|
(in Millions, except for percentages)
|
2012
|
2011
|
2012
|
2011
|
|||||||||||
|
Following are the weighted average assumptions used to determine the benefit obligations at December 31:
|
|||||||||||||||
|
Discount rate
|
4.15
|
%
|
4.95
|
%
|
4.15
|
%
|
4.95
|
%
|
|||||||
|
Rate of compensation increase
|
3.40
|
%
|
3.40
|
%
|
—
|
%
|
—
|
%
|
|||||||
|
Accumulated benefit obligation:
|
|||||||||||||||
|
Plans with unfunded accumulated benefit obligation
|
$
|
1,367.3
|
|
$
|
1,213.9
|
|
$
|
—
|
|
$
|
—
|
|
|||
|
Change in projected benefit obligation
|
|||||||||||||||
|
Projected benefit obligation at January 1
|
$
|
1,268.3
|
|
$
|
1,175.5
|
|
$
|
28.4
|
|
$
|
45.4
|
|
|||
|
Service cost
|
20.2
|
|
18.8
|
|
0.1
|
|
0.1
|
|
|||||||
|
Interest cost
|
61.3
|
|
61.6
|
|
1.4
|
|
1.5
|
|
|||||||
|
Actuarial loss (gain)
|
140.7
|
|
69.4
|
|
3.0
|
|
(15.5
|
)
|
|||||||
|
Amendments
|
—
|
|
2.2
|
|
—
|
|
—
|
|
|||||||
|
Foreign currency exchange rate changes
|
3.4
|
|
(0.9
|
)
|
(0.1
|
)
|
—
|
|
|||||||
|
Plan participants’ contributions
|
0.2
|
|
0.2
|
|
6.1
|
|
6.0
|
|
|||||||
|
Other
|
—
|
|
0.5
|
|
—
|
|
(0.1
|
)
|
|||||||
|
Curtailments
|
(3.0
|
)
|
—
|
|
—
|
|
—
|
|
|||||||
|
Benefits paid
|
(63.0
|
)
|
(59.0
|
)
|
(9.7
|
)
|
(9.0
|
)
|
|||||||
|
Projected benefit obligation at December 31
|
1,428.1
|
|
1,268.3
|
|
29.2
|
|
28.4
|
|
|||||||
|
Change in fair value of plan assets:
|
|||||||||||||||
|
Fair value of plan assets at January 1
|
918.8
|
|
905.8
|
|
—
|
|
—
|
|
|||||||
|
Actual return on plan assets
|
127.2
|
|
8.4
|
|
—
|
|
—
|
|
|||||||
|
Foreign currency exchange rate changes
|
3.1
|
|
(0.6
|
)
|
—
|
|
—
|
|
|||||||
|
Company contributions
|
73.9
|
|
64.0
|
|
3.6
|
|
3.0
|
|
|||||||
|
Plan participants’ contributions
|
0.2
|
|
0.2
|
|
6.1
|
|
6.0
|
|
|||||||
|
Benefits paid
|
(63.0
|
)
|
(59.0
|
)
|
(9.7
|
)
|
(9.0
|
)
|
|||||||
|
Fair value of plan assets at December 31
|
1,060.2
|
|
918.8
|
|
—
|
|
—
|
|
|||||||
|
Funded status of the plan (liability)
|
$
|
(367.9
|
)
|
$
|
(349.5
|
)
|
$
|
(29.2
|
)
|
$
|
(28.4
|
)
|
|||
|
Amount recognized in the consolidated balance sheets:
|
|||||||||||||||
|
Accrued benefit liability
|
(367.9
|
)
|
(349.5
|
)
|
(29.2
|
)
|
(28.4
|
)
|
|||||||
|
Total
|
$
|
(367.9
|
)
|
$
|
(349.5
|
)
|
$
|
(29.2
|
)
|
$
|
(28.4
|
)
|
|||
69
FMC CORPORATION AND CONSOLIDATED SUBSIDIARIES
Notes to Consolidated Financial Statements — (Continued)
|
|
Pensions
|
Other Benefits (1)
|
|||||||||||||
|
|
December 31,
|
||||||||||||||
|
(in Millions)
|
2012
|
2011
|
2012
|
2011
|
|||||||||||
|
The amounts in accumulated other comprehensive income (loss) that have not yet been recognized as components of net periodic benefit cost at December 31, 2012 and 2011 are as follows:
|
|||||||||||||||
|
Prior service (cost) credit
|
(7.7
|
)
|
(9.8
|
)
|
—
|
|
0.2
|
|
|||||||
|
Net actuarial (loss) gain
|
(620.3
|
)
|
(586.3
|
)
|
10.7
|
|
16.1
|
|
|||||||
|
Accumulated other comprehensive income (loss) – pretax
|
$
|
(628.0
|
)
|
$
|
(596.1
|
)
|
$
|
10.7
|
|
$
|
16.3
|
|
|||
|
Accumulated other comprehensive income (loss) – net of tax
|
$
|
(394.2
|
)
|
$
|
(373.5
|
)
|
$
|
6.7
|
|
$
|
11.3
|
|
|||
____________________
|
(1)
|
Refer to Note 9 for information on our discontinued postretirement benefit plans.
|
Other changes in plan assets and benefit obligations for continuing operations recognized in other comprehensive loss (income) are as follows:
|
|
Pensions
|
Other Benefits (1)
|
|||||||||||||
|
|
Year ended December 31
|
||||||||||||||
|
(in Millions)
|
2012
|
2011
|
2012
|
2011
|
|||||||||||
|
Current year net actuarial loss (gain)
|
$
|
84.3
|
|
$
|
143.9
|
|
$
|
3.0
|
|
$
|
(15.5
|
)
|
|||
|
Current year prior service cost (credit)
|
—
|
|
2.2
|
|
—
|
|
—
|
|
|||||||
|
Amortization of net actuarial (loss) gain
|
(51.2
|
)
|
(36.3
|
)
|
2.4
|
|
2.4
|
|
|||||||
|
Amortization of prior service (cost) credit
|
(2.1
|
)
|
(1.9
|
)
|
0.2
|
|
0.2
|
|
|||||||
|
Foreign currency exchange rate changes on the above line items
|
0.9
|
|
(1.2
|
)
|
—
|
|
—
|
|
|||||||
|
Total recognized in other comprehensive (income) loss, before taxes
|
$
|
31.9
|
|
$
|
106.7
|
|
$
|
5.6
|
|
$
|
(12.9
|
)
|
|||
|
Total recognized in other comprehensive (income) loss, after taxes
|
$
|
20.7
|
|
$
|
67.0
|
|
$
|
4.6
|
|
$
|
(7.2
|
)
|
|||
____________________
|
(1)
|
Refer to Note 9 for information on our discontinued postretirement benefit plans.
|
The estimated net actuarial loss and prior service cost for our pension plans that will be amortized from accumulated other comprehensive income (loss) into our net annual benefit cost (income) during 2013 are
$70.3 million
and
$2.0 million
, respectively. The estimated net actuarial gain for our other benefits that will be amortized from accumulated other comprehensive income (loss) into net annual benefit cost (income) during 2013 will be
$1.8 million
.
The following table summarizes the weighted-average assumptions used for and the components of net annual benefit cost (income):
70
FMC CORPORATION AND CONSOLIDATED SUBSIDIARIES
Notes to Consolidated Financial Statements — (Continued)
|
|
Year Ended December 31,
|
||||||||||||||||||||||
|
|
Pensions
|
Other Benefits
|
|||||||||||||||||||||
|
(in Millions, except for percentages)
|
2012
|
2011
|
2010
|
2012
|
2011
|
2010
|
|||||||||||||||||
|
Discount rate
|
4.95
|
%
|
5.40
|
%
|
5.90
|
%
|
4.95
|
%
|
5.40
|
%
|
5.90
|
%
|
|||||||||||
|
Expected return on plan assets
|
7.75
|
%
|
8.50
|
%
|
8.50
|
%
|
—
|
|
—
|
|
—
|
|
|||||||||||
|
Rate of compensation increase
|
3.40
|
%
|
4.20
|
%
|
4.20
|
%
|
—
|
|
—
|
|
—
|
|
|||||||||||
|
Components of net annual benefit cost (in millions):
|
|||||||||||||||||||||||
|
Service cost
|
$
|
20.2
|
|
$
|
18.8
|
|
$
|
18.2
|
|
$
|
0.1
|
|
$
|
0.1
|
|
$
|
0.2
|
|
|||||
|
Interest cost
|
61.3
|
|
61.6
|
|
63.2
|
|
1.4
|
|
1.5
|
|
2.5
|
|
|||||||||||
|
Expected return on plan assets
|
(76.6
|
)
|
(82.5
|
)
|
(79.0
|
)
|
—
|
|
—
|
|
—
|
|
|||||||||||
|
Amortization of transition asset
|
—
|
|
—
|
|
—
|
|
—
|
|
—
|
|
—
|
|
|||||||||||
|
Amortization of prior service cost
|
2.1
|
|
1.9
|
|
1.2
|
|
(0.2
|
)
|
(0.2
|
)
|
(0.1
|
)
|
|||||||||||
|
Amortization of net actuarial and other (gain) loss
|
51.2
|
|
36.3
|
|
26.5
|
|
(2.4
|
)
|
(2.4
|
)
|
(0.4
|
)
|
|||||||||||
|
Recognized (gain) loss due to settlement and curtailments
|
—
|
|
—
|
|
7.1
|
|
—
|
|
—
|
|
—
|
|
|||||||||||
|
Net annual benefit cost from continuing operations
|
$
|
58.2
|
|
$
|
36.1
|
|
$
|
37.2
|
|
$
|
(1.1
|
)
|
$
|
(1.0
|
)
|
$
|
2.2
|
|
|||||
Our U.S. qualified defined benefit pension plan (“U.S. Plan”) holds the majority of our pension plan assets. The expected long-term rate of return on these plan assets was
7.75 percent
for 2012, and
8.5 percent
for 2011 and 2010. In developing the assumption for the long-term rate of return on assets for our U.S. Plan, we take into consideration the technical analysis performed by our outside actuaries, including historical market returns, information on the assumption for long-term real returns by asset class, inflation assumptions, and expectations for standard deviation related to these best estimates. We also consider the historical performance of our own plan’s trust, which has earned a compound annual rate of return of approximately
9.6 percent
over the last 20 years (which is in excess of comparable market indices for the same period) as well as other factors. Given an actively managed investment portfolio, the expected annual rates of return by asset class for our portfolio, assuming an estimated inflation rate of approximately
2.3 percent
, is between
7.4 percent
and
9.9 percent
for equities, and between
3.3 percent
and
4.8 percent
for fixed-income investments, which generates a total expected portfolio return that is in line with our assumption for the rate of return on assets. The target asset allocation for 2012, by asset category, is
75
to
85 percent
equity securities,
15
to
25 percent
fixed income investments and
zero
to
five percent
cash and other short-term investments.
Our U.S. qualified pension plan’s investment strategy consists of a total return investment management approach using a portfolio mix of equities and fixed income investments to maximize the long-term return of plan assets for an appropriate level of risk. The goal of this strategy is to minimize plan expenses by matching asset growth to the plan’s liabilities over the long run. Furthermore, equity investments are weighted towards value equities and diversified across U.S and non-U.S. stocks. Derivatives and hedging instruments may be used effectively to manage and balance risks associated with the plan’s investments. Investment performance and related risks are measured and monitored on an ongoing basis through annual liability measurements, periodic asset and liability studies, and quarterly investment portfolio reviews.
71
FMC CORPORATION AND CONSOLIDATED SUBSIDIARIES
Notes to Consolidated Financial Statements — (Continued)
The following tables present our fair value hierarchy for our major categories of pension plan assets by asset class. See Note 17 for the definition of fair value and the descriptions of Level 1, 2 and 3 in the fair value hierarchy.
|
(in Millions)
|
12/31/2012
|
Quoted Prices
in Active
Markets for
Identical
Assets
(Level 1)
|
Significant
Other
Observable
Inputs
(Level 2)
|
Significant
Unobservable
Inputs
(Level 3)
|
|||||||||||
|
Cash and short-term investments
|
$
|
50.3
|
|
$
|
50.3
|
|
$
|
—
|
|
$
|
—
|
|
|||
|
Equity securities:
|
|||||||||||||||
|
Common stock
|
556.3
|
|
556.3
|
|
—
|
|
—
|
|
|||||||
|
Preferred stock
|
6.3
|
|
6.3
|
|
—
|
|
—
|
|
|||||||
|
Mutual funds and other investments (1)
|
232.7
|
|
158.2
|
|
74.5
|
|
—
|
|
|||||||
|
Fixed income investments:
|
|||||||||||||||
|
Investment contracts
|
200.8
|
|
—
|
|
200.8
|
|
—
|
|
|||||||
|
Mutual funds
|
9.4
|
|
9.4
|
|
—
|
|
—
|
|
|||||||
|
Corporate debt instruments
|
1.0
|
|
1.0
|
|
—
|
|
—
|
|
|||||||
|
Government debt
|
2.7
|
|
2.7
|
|
—
|
|
—
|
|
|||||||
|
Other investments
|
|||||||||||||||
|
Real estate/property
|
0.6
|
|
—
|
|
—
|
|
0.6
|
|
|||||||
|
Other
|
0.1
|
|
—
|
|
—
|
|
0.1
|
|
|||||||
|
Total assets
|
$
|
1,060.2
|
|
$
|
784.2
|
|
$
|
275.3
|
|
$
|
0.7
|
|
|||
|
(in Millions)
|
12/31/2011
|
Quoted Prices
in Active
Markets for
Identical
Assets
(Level 1)
|
Significant
Other
Observable
Inputs
(Level 2)
|
Significant
Unobservable
Inputs
(Level 3)
|
|||||||||||
|
Cash and short-term investments
|
$
|
39.5
|
|
$
|
39.5
|
|
$
|
—
|
|
$
|
—
|
|
|||
|
Equity securities:
|
|||||||||||||||
|
Common stock
|
474.2
|
|
474.2
|
|
—
|
|
—
|
|
|||||||
|
Preferred stock
|
2.6
|
|
2.6
|
|
—
|
|
—
|
|
|||||||
|
Mutual funds and other investments (1)
|
191.9
|
|
128.8
|
|
63.1
|
|
—
|
|
|||||||
|
Fixed income investments:
|
|||||||||||||||
|
Investment contracts
|
199.6
|
|
—
|
|
199.6
|
|
—
|
|
|||||||
|
Mutual funds
|
7.4
|
|
7.4
|
|
—
|
|
—
|
|
|||||||
|
Corporate debt instruments
|
0.5
|
|
0.5
|
|
—
|
|
—
|
|
|||||||
|
Government debt
|
2.4
|
|
2.4
|
|
—
|
|
—
|
|
|||||||
|
Other investments
|
|||||||||||||||
|
Real estate/property
|
0.6
|
|
—
|
|
—
|
|
0.6
|
|
|||||||
|
Other
|
0.1
|
|
—
|
|
—
|
|
0.1
|
|
|||||||
|
Total assets
|
$
|
918.8
|
|
$
|
655.4
|
|
$
|
262.7
|
|
$
|
0.7
|
|
|||
____________________
|
(1)
|
As of
December 31, 2012
and
2011
we have
$74.5 million
and
$63.1 million
, respectively, of investments in certain funds where the net asset value reported by the underlying funds approximates the fair value. These investments are redeemable with the fund at net asset value under the original terms of the partnership agreements and/or subscription agreements and operations of the underlying funds. However, it is possible that these redemption rights may be restricted or eliminated by the funds in the future in accordance with the underlying fund agreements. Due to the nature of the investments held by the funds, changes in market conditions and the economic environment may significantly impact the net asset value of the funds and, consequently, the fair value of the interests in the funds. Furthermore, changes to the liquidity provisions of the funds may significantly impact the fair value of the interest in the funds.
|
72
FMC CORPORATION AND CONSOLIDATED SUBSIDIARIES
Notes to Consolidated Financial Statements — (Continued)
The change in the value of plan assets using significant unobservable inputs (Level 3) from
December 31, 2011
to
December 31, 2012
was not material for the period presented. There were no changes to the Level 3 investments during 2011.
We made the following contributions to our pension and other postretirement benefit plans:
|
|
Year Ended December 31,
|
||||||
|
(in Millions)
|
2012
|
2011
|
|||||
|
U.S. qualified pension plan
|
$
|
65.0
|
|
$
|
55.0
|
|
|
|
U.S. nonqualified pension plan
|
5.0
|
|
3.1
|
|
|||
|
Non-U.S. plans
|
3.9
|
|
5.9
|
|
|||
|
Other postretirement benefits, net of participant contributions
|
3.6
|
|
3.0
|
|
|||
|
Total
|
$
|
77.5
|
|
$
|
67.0
|
|
|
We expect our voluntary cash contributions to our U.S. qualified pension plan to be
$40 million
in 2013.
The following table reflects the estimated future benefit payments for our pension and other postretirement benefit plans. These estimates take into consideration expected future service, as appropriate:
|
Estimated Net Future Benefit Payments
|
|
|
(in Millions)
|
|
|
2013
|
$85.4
|
|
2014
|
75.1
|
|
2015
|
78.1
|
|
2016
|
81.9
|
|
2017
|
84.9
|
|
2018-2022
|
$453.2
|
Assumed health care cost trend rates have an effect on the other postretirement benefit obligations and net periodic other postretirement benefit costs reported for the health care portion of the other postretirement plan. A one-percentage point change in the assumed health care cost trend rates would be immaterial to our net periodic other postretirement benefit costs for the year ended
December 31, 2012
, and our other postretirement benefit obligation at
December 31, 2012
.
FMC Corporation Savings and Investment Plan
. The FMC Corporation Savings and Investment Plan is a qualified salary-reduction plan under Section 401(k) of the Internal Revenue Code in which substantially all of our U.S. employees may participate by contributing a portion of their compensation. For eligible employees participating in the Plan, except for those employees covered by certain collective bargaining agreements, the Company makes matching contributions of
80 percent
of the portion of those contributions up to
five percent
of the employee’s compensation. Additionally, effective July 1, 2007, all newly hired and rehired salaried and nonunion employees receive an employer contribution of
five percent
of the employee’s eligible compensation. This change was instituted for these employees effective July 1, 2007 since newly hired and rehired salaried and nonunion hourly employees are no longer eligible for our defined benefit plan. Charges against income for both of these contributions were
$10.2 million
in
2012
,
$10.6 million
in
2011
, and
$7.8 million
in
2010
.
Stock Compensation Plans
We have a share-based compensation plan, which has been approved by the stockholders, for certain employees, officers and directors. This plan is described below.
FMC Corporation Incentive Compensation and Stock Plan
The FMC Corporation Incentive Compensation and Stock Plan (the “Plan”) provides for the grant of a variety of cash and equity awards to officers, directors, employees and consultants, including stock options, restricted stock, performance units (including restricted stock units), stock appreciation rights, and multi-year management incentive awards payable partly in cash and partly in common stock. The Compensation and Organization Committee of the Board of Directors (the “Committee”),
73
FMC CORPORATION AND CONSOLIDATED SUBSIDIARIES
Notes to Consolidated Financial Statements — (Continued)
subject to the provisions of the Plan, approves financial targets, award grants, and the times and conditions for payment of awards to employees. The FMC Corporation Non-Employee Directors’ Compensation Policy (formerly the FMC Corporation Compensation Plan for Non-Employee Directors), administered by the Nominating and Corporate Governance Committee of the Board of Directors, sets forth the compensation to be paid to the directors, including awards (currently restricted stock units only) to be made to directors under the Plan.
Stock options granted under the Plan may be incentive or nonqualified stock options. The exercise price for stock options may not be less than the fair market value of the stock at the date of grant. Awards granted under the Plan vest or become exercisable or payable at the time designated by the Committee, which has generally been three years from the date of grant. Incentive and nonqualified options granted under the Plan expire not later than
10 years
from the grant date.
Under the Plan, awards of restricted stock and restricted stock units may be made to selected employees. The awards vest over periods designated by the Committee, which has generally been
3 years
, with payment conditional upon continued employment. Compensation cost is recognized over the vesting periods based on the market value of the stock on the date of the award. Restricted stock units granted to directors under the Plan vest immediately if granted as part of, or in lieu of, the annual retainer; other restricted stock units granted to directors vest at the Annual Meeting of Shareholders in the calendar year following the May 1 annual grant date.
The total number of shares of common stock authorized for issuance under the Plan is
28.8 million
, which is in addition to the shares available from predecessor plans. Cancellations (through expiration, forfeiture or otherwise) of outstanding awards increase the shares available for future awards or grants. At
December 31, 2012
,
8.9 million
shares of FMC common stock were reserved for share based awards which represents the sum of available future grants of share based awards of
5.8 million
and unvested share-based awards of
3.1 million
.
At
December 31, 2012
and
2011
, there were restricted stock units representing an aggregate of
119,482
shares and
103,698
shares of common stock, respectively, credited to the directors’ accounts.
Stock Compensation
We recognized the following stock compensation expense:
|
Year Ended December 31,
|
|||||||||||
|
(in Millions)
|
2012
|
2011
|
2010
|
||||||||
|
Stock Option Expense, net of taxes of $2.7, $2.3 and $2.0 (1)
|
$
|
4.4
|
|
$
|
3.7
|
|
$
|
3.3
|
|
||
|
Restricted Stock Expense, net of taxes of $3.8, $3.7 and $3.6 (2)
|
6.4
|
|
6.1
|
|
5.8
|
|
|||||
|
Total Stock Compensation Expense, net of taxes of $6.5, $6.0 and $5.6 (3)
|
$
|
10.8
|
|
$
|
9.8
|
|
$
|
9.1
|
|
||
____________________
(1) We applied an estimated forfeiture rate of
four percent
per stock option grant in the calculation of the expense.
(2) We applied an estimated forfeiture rate of
two percent
of outstanding grants in the calculation of the expense.
(3) This expense is classified as selling, general and administrative expense in our consolidated statements of income.
We received
$18.8 million
,
$11.3 million
and
$18.1 million
in cash related to stock option exercises for the years ended
December 31, 2012
,
2011
and
2010
, respectively. The shares used for the exercise of stock options occurring during the years ended
December 31, 2012
,
2011
and
2010
came from treasury shares.
For tax purposes, share-based compensation expense is deductible in the year of exercise or vesting based on the intrinsic value of the award on the date of exercise or vesting. For financial reporting purposes, share-based compensation expense is based upon grant-date fair value and amortized over the vesting period. Excess tax benefits represent the difference between the share-based compensation expense for financial reporting purposes and the deduction taken for tax purposes. From the adoption of share-based compensation accounting in 2006 through March 31, 2010, we did not recognize any excess tax benefits in our consolidated balance sheets from the exercise of stock options and the vesting of restricted awards, due to our U.S. net operating loss carryforward position.
74
FMC CORPORATION AND CONSOLIDATED SUBSIDIARIES
Notes to Consolidated Financial Statements — (Continued)
During the second and third quarter of 2010, we utilized our remaining U.S. financial net operating losses as we generated U.S. income during 2010 sufficient to absorb the remaining unrecognized excess tax benefits. As a result, we recognized all of the excess tax benefits from the exercise of stock options and the vesting of restricted stock awards from 2006 through 2009 as well as the excess tax benefits generated during the period from January 1, 2010 through December 31, 2010. As of December 31, 2010, we recognized
$56.3 million
of excess tax benefits, of which
$44.0 million
related to years 2006 through 2009, on our consolidated balance sheet as a component of equity. This amount is also included as a financing activity in our consolidated statements of cash flows for the year ended December 31, 2010. The excess tax benefits for the year ended
December 31, 2012
and 2011 totaled
$9.7 million
and
$7.4 million
, respectively.
Stock Options
The grant-date fair values of the stock options we granted in the years ended
December 31, 2012
,
2011
and
2010
were estimated using the Black-Scholes option valuation model, the key assumptions for which are listed in the table below. The expected volatility assumption is based on the actual historical experience of our common stock. The expected life represents the period of time that options granted are expected to be outstanding. The risk-free interest rate is based on U.S. Treasury securities with terms equal to the expected timing of stock option exercises as of the grant date. The dividend yield assumption reflects anticipated dividends on our common stock.
Black Scholes valuation assumptions for stock option grants:
|
2012
|
2011
|
2010
|
|||
|
Expected dividend yield
|
0.63%
|
0.61%
|
0.87%
|
||
|
Expected volatility
|
42.09%
|
41.61%
|
42.17%
|
||
|
Expected life (in years)
|
6.5
|
6.5
|
6.5
|
||
|
Risk-free interest rate
|
1.30%
|
2.84%
|
3.13%
|
||
The weighted-average grant-date fair value of options granted during the years ended
December 31, 2012
,
2011
and
2010
was
$19.26
,
$17.59
and
$12.25
per share, respectively.
75
FMC CORPORATION AND CONSOLIDATED SUBSIDIARIES
Notes to Consolidated Financial Statements — (Continued)
The following summary shows stock option activity for employees under the Plan for the three years ended
December 31, 2012
:
|
Number of Options Granted
But Not Exercised
|
Weighted-Average
Remaining
Contractual Life
(in Years)
|
Weighted-Average
Exercise Price Per Share
|
Aggregate Intrinsic
Value
|
|||||||||
|
|
Number of Shares in Thousands
|
|
(In Millions)
|
|||||||||
|
December 31, 2009 (2,630 shares exercisable)
|
4,350
|
|
5.4 years
|
$
|
15.47
|
|
$
|
54.0
|
|
|||
|
Granted
|
542
|
|
28.67
|
|
||||||||
|
Exercised
|
(1,690
|
)
|
10.68
|
|
37.3
|
|
||||||
|
Forfeited
|
(32
|
)
|
25.97
|
|
||||||||
|
December 31, 2010 (1,554 shares exercisable)
|
3,170
|
|
6.4 years
|
$
|
20.17
|
|
$
|
62.8
|
|
|||
|
Granted
|
432
|
|
40.89
|
|
||||||||
|
Exercised
|
(750
|
)
|
15.05
|
|
19.7
|
|
||||||
|
Forfeited
|
(42
|
)
|
23.08
|
|
||||||||
|
December 31, 2011 (1,340 shares exercisable)
|
2,810
|
|
6.4 years
|
$
|
24.67
|
|
$
|
51.6
|
|
|||
|
Granted
|
422
|
|
47.58
|
|
||||||||
|
Exercised
|
(943
|
)
|
19.86
|
|
30.7
|
|
||||||
|
Forfeited
|
(50
|
)
|
39.24
|
|
||||||||
|
December 31, 2012 (932 shares exercisable and 2,187 shares expected to vest or be exercised)
|
2,239
|
|
6.5 years
|
$
|
30.69
|
|
$
|
62.3
|
|
|||
The number of stock options indicated in the above table as being exercisable as of
December 31, 2012
, had an intrinsic value of
$36.0 million
, a weighted-average remaining contractual term of
4.3 years
, and a weighted-average exercise price of
$19.86
.
As of
December 31, 2012
, we had total remaining unrecognized compensation cost related to unvested stock options of
$7.2 million
which will be amortized over the weighted-average remaining requisite service period of approximately
1.8 years
.
Restricted Equity Awards
The grant-date fair value of restricted stock awards and stock units under the Plan is based on the market price per share of our common stock on the date of grant, and the related compensation cost is amortized to expense on a straight-line basis over the vesting period during which the employees perform related services, which is typically
three years
except for those eligible for retirement prior to the stated vesting period.
76
FMC CORPORATION AND CONSOLIDATED SUBSIDIARIES
Notes to Consolidated Financial Statements — (Continued)
The following table shows our employee restricted award activity for the three years ended
December 31, 2012
:
|
Number of Awards in Thousands
|
Number of
awards
|
Weighted-
Average
Grant Date
Fair Value
|
|||
|
Nonvested at December 31, 2009
|
760
|
$
|
22.35
|
|
|
|
Granted
|
416
|
30.79
|
|
||
|
Vested
|
(262)
|
20.01
|
|
||
|
Forfeited
|
(2)
|
26.39
|
|
||
|
Nonvested at December 31, 2010
|
912
|
$
|
26.86
|
|
|
|
Granted
|
182
|
40.76
|
|
||
|
Vested
|
(320)
|
24.25
|
|
||
|
Forfeited
|
(16)
|
25.58
|
|
||
|
Nonvested at December 31, 2011
|
758
|
$
|
31.33
|
|
|
|
Granted
|
221
|
49.88
|
|
||
|
Vested
|
(257)
|
27.60
|
|
||
|
Forfeited
|
(18)
|
39.21
|
|
||
|
Nonvested at December 31, 2012
|
704
|
$
|
38.29
|
|
|
As of
December 31, 2012
, we had total remaining unrecognized compensation cost related to unvested restricted awards of
$11.9 million
which will be amortized over the weighted-average remaining requisite service period of approximately
2.1 years
.
The following is a summary of our capital stock activity over the past three years:
|
Common
Stock Shares
|
Treasury
Stock Shares
|
||||
|
December 31, 2009
|
185,983,792
|
|
40,946,032
|
|
|
|
Stock options and awards
|
—
|
|
(1,767,712
|
)
|
|
|
Repurchases of common stock, net
|
—
|
|
3,833,784
|
|
|
|
December 31, 2010
|
185,983,792
|
|
43,012,104
|
|
|
|
Stock options and awards
|
—
|
|
(918,946
|
)
|
|
|
Repurchases of common stock, net
|
—
|
|
4,216,318
|
|
|
|
December 31, 2011
|
185,983,792
|
|
46,309,476
|
|
|
|
Stock options and awards
|
—
|
|
(1,156,452
|
)
|
|
|
Repurchases of common stock, net
|
—
|
|
3,160,390
|
|
|
|
December 31, 2012
|
185,983,792
|
|
48,313,414
|
|
|
Accumulated other comprehensive gain (loss) consisted of the following:
|
|
December 31,
|
||||||
|
(in Millions)
|
2012
|
2011
|
|||||
|
Deferred (loss) gain on derivative contracts
|
$
|
(1.5
|
)
|
$
|
(7.2
|
)
|
|
|
Pension and other postretirement liability adjustment
|
(380.4
|
)
|
(353.5
|
)
|
|||
|
Foreign currency translation adjustments
|
(27.0
|
)
|
(29.3
|
)
|
|||
|
Accumulated other comprehensive gain (loss)
|
$
|
(408.9
|
)
|
$
|
(390.0
|
)
|
|
See Note 1 regarding the stock split.
77
FMC CORPORATION AND CONSOLIDATED SUBSIDIARIES
Notes to Consolidated Financial Statements — (Continued)
Dividends and Share Repurchases
On
January 17, 2013
, we paid dividends totaling
$18.7 million
to our shareholders of record as of
December 31, 2012
. This amount is included in “Accrued and other liabilities” on the consolidated balance sheets as of
December 31, 2012
. For the years ended
December 31, 2012
,
2011
and
2010
, we paid
$47.8 million
,
$41.2 million
, and
$36.4 million
in dividends, respectively.
On February 17, 2012, the Board of Directors authorized the repurchase of up to
$250 million
of our common stock. At
December 31, 2012
,
$244.8 million
remained unused from the authorization. The repurchase program does not include a specific timetable or price targets and may be suspended or terminated at any time. Shares may be purchased through open market or privately negotiated transactions at the discretion of management based on its evaluation of market prevailing conditions and other factors. During the year ended
December 31, 2012
,
3,072,540
shares were repurchased under the publicly announced repurchase program for
$144.9 million
.
Earnings per common share ("EPS") is computed by dividing net income by the weighted average number of common shares outstanding during the period on a basic and diluted basis.
Our potentially dilutive securities include potential common shares related to our stock options, restricted stock and restricted stock units. Diluted earnings per share (“Diluted EPS”) considers the impact of potentially dilutive securities except in periods in which there is a loss because the inclusion of the potential common shares would have an antidilutive effect. Diluted EPS excludes the impact of potential common shares related to our stock options in periods in which the option exercise price is greater than the average market price of our common stock for the period. For the years ended
December 31, 2012
and
2010
there were
no
potential common shares excluded from Diluted EPS. For the year ended
December 31, 2011
there were
430,812
potential common shares excluded from Diluted EPS.
Our non-vested restricted stock awards contain rights to receive non-forfeitable dividends, and thus, are participating securities requiring the two-class method of computing EPS. The two-class method determines EPS by dividing the sum of distributed earnings to common stockholders and undistributed earnings allocated to common stockholders by the weighted average number of shares of common stock outstanding for the period. In calculating the two-class method, undistributed earnings are allocated to both common shares and participating securities based on the weighted average shares outstanding during the period.
78
FMC CORPORATION AND CONSOLIDATED SUBSIDIARIES
Notes to Consolidated Financial Statements — (Continued)
Earnings applicable to common stock and common stock shares used in the calculation of basic and diluted earnings per share are as follows:
|
(in Millions, Except Share and Per Share Data)
|
Year Ended December 31,
|
||||||||||
|
2012
|
2011
|
2010
|
|||||||||
|
Earnings (loss) attributable to FMC stockholders:
|
|||||||||||
|
Continuing operations, net of income taxes
|
$
|
446.4
|
|
$
|
397.7
|
|
$
|
206.1
|
|
||
|
Discontinued operations, net of income taxes
|
(30.2
|
)
|
(31.8
|
)
|
(33.6
|
)
|
|||||
|
Net income
|
$
|
416.2
|
|
$
|
365.9
|
|
$
|
172.5
|
|
||
|
Less: Distributed and undistributed earnings allocable to restricted award holders
|
(2.0
|
)
|
(1.7
|
)
|
(1.0
|
)
|
|||||
|
Net income allocable to common stockholders
|
$
|
414.2
|
|
$
|
364.2
|
|
$
|
171.5
|
|
||
|
Basic earnings (loss) per common share attributable to FMC stockholders:
|
|||||||||||
|
Continuing operations
|
$
|
3.23
|
|
$
|
2.79
|
|
$
|
1.42
|
|
||
|
Discontinued operations
|
(0.22
|
)
|
(0.22
|
)
|
(0.23
|
)
|
|||||
|
Net income
|
$
|
3.01
|
|
$
|
2.57
|
|
$
|
1.19
|
|
||
|
Diluted earnings (loss) per common share attributable to FMC stockholders:
|
|||||||||||
|
Continuing operations
|
$
|
3.22
|
|
$
|
2.77
|
|
$
|
1.41
|
|
||
|
Discontinued operations
|
(0.22
|
)
|
(0.22
|
)
|
(0.23
|
)
|
|||||
|
Net income
|
$
|
3.00
|
|
$
|
2.55
|
|
$
|
1.18
|
|
||
|
Shares (in thousands):
|
|||||||||||
|
Weighted average number of shares of common stock outstanding - Basic
|
137,701
|
|
142,056
|
|
144,420
|
|
|||||
|
Weighted average additional shares assuming conversion of potential common shares
|
1,112
|
|
1,252
|
|
1,740
|
|
|||||
|
Shares – diluted basis
|
138,813
|
|
143,308
|
|
146,160
|
|
|||||
Our financial instruments include cash and cash equivalents, trade receivables, other current assets, certain receivables classified as other long-term assets, accounts payable, and amounts included in investments and accruals meeting the definition of financial instruments. The carrying value of these financial instruments approximates their fair value. Our other financial instruments include the following:
|
Financial Instrument
|
|
Valuation Method
|
|
Foreign Exchange Forward Contracts
|
|
Estimated amounts that would be received or paid to terminate the contracts at the reporting date based on current market prices for applicable currencies.
|
|
Commodity Forward and Option Contracts
|
|
Estimated amounts that would be received or paid to terminate the contracts at the reporting date based on quoted market prices for applicable commodities.
|
|
Debt
|
|
Our estimates and information obtained from independent third parties using market data, such as bid/ask spreads for the last business day of the reporting period.
|
The estimated fair value of the financial instruments in the above table have been determined using standard pricing models which take into account the present value of expected future cash flows discounted to the balance sheet date. These standard pricing models utilize inputs derived from, or corroborated by, observable market data such as interest rate yield curves and currency and commodity spot and forward rates. In addition, we test a subset of our valuations against valuations received from the transaction's counterparty to validate the accuracy of our standard pricing models. Accordingly, the estimates presented may not be indicative of the amounts that we would realize in a market exchange at settlement date and do not represent potential gains or losses on these agreements. The estimated fair values of foreign exchange forward contracts and commodity forward and option contracts are included in the tables within this Note. The estimated fair value of debt is
$1,057.0 million
and
$866.8
79
FMC CORPORATION AND CONSOLIDATED SUBSIDIARIES
Notes to Consolidated Financial Statements — (Continued)
million
and the carrying amount is
$965.1 million
and
$825.6 million
as of
December 31, 2012
and
December 31, 2011
, respectively.
Use of Derivative Financial Instruments to Manage Risk
We mitigate certain financial exposures, including currency risk, interest rate risk, and commodity purchase exposures, through a program of risk management that includes the use of derivative financial instruments. We enter into foreign exchange contracts, including forward and purchased option contracts, to reduce the effects of fluctuating foreign currency exchange rates.
We formally document all relationships between hedging instruments and hedged items, as well as the risk management objective and strategy for undertaking various hedge transactions. This process includes relating derivatives that are designated as fair value or cash flow hedges to specific assets and liabilities on the balance sheet or to specific firm commitments or forecasted transactions. We also formally assess at the inception of the hedge and on an ongoing basis, whether each derivative is highly effective in offsetting changes in fair values or cash flows of the hedged item. If we determine that a derivative is not highly effective as a hedge, or if a derivative ceases to be a highly effective hedge, we discontinue hedge accounting with respect to that derivative prospectively.
Foreign Currency Exchange Risk Management
We conduct business in many foreign countries, exposing earnings, cash flows, and our financial position to foreign currency risks. The majority of these risks arise as a result of foreign currency transactions. Our policy is to minimize exposure to adverse changes in currency exchange rates. This is accomplished through a controlled program of risk management that includes the use of foreign currency debt and forward foreign exchange contracts. We also use forward foreign exchange contracts to hedge firm and highly anticipated foreign currency cash flows, with an objective of balancing currency risk to provide adequate protection from significant fluctuations in the currency markets.
The primary currency movements for which we have exchange-rate exposure are the U.S. dollar versus the euro, the U.S. dollar versus the Chinese yuan and the U.S. dollar versus the Brazilian real.
Commodity Price Risk
We are exposed to risks in energy costs due to fluctuations in energy prices, particularly natural gas. We attempt to mitigate our exposure to increasing energy costs by hedging the cost of future deliveries of natural gas and entering into fixed-price contracts for the purchase of coal and fuel oil.
Our Agricultural Products segment enters into contracts with certain customers in Brazil whereby we exchange our products for physical delivery of soybeans from the customer. In order to mitigate the price risk associated with these barter contracts, we have entered into offsetting derivatives to hedge our exposure.
Interest Rate Risk
We use various strategies to manage our interest rate exposure, including entering into interest rate swap agreements to achieve a targeted mix of fixed and variable-rate debt. In the agreements we exchange, at specified intervals, the difference between fixed and variable-interest amounts calculated on an agreed-upon notional principal amount. As of
December 31, 2012
and
December 31, 2011
, we had no such swap agreements in place.
Concentration of Credit Risk
Our counterparties to derivative contracts are primarily major financial institutions. We limit the dollar amount of contracts entered into with any one financial institution and monitor counterparties’ credit ratings. We also enter into master netting agreements with each financial institution, where possible, which helps mitigate the credit risk associated with our financial instruments. While we may be exposed to credit losses due to the nonperformance of counterparties, we consider this risk remote.
Financial Guarantees and Letter-of-Credit Commitments
We enter into various financial instruments with off-balance-sheet risk as part of the normal course of business. These off-balance-sheet instruments include financial guarantees and contractual commitments to extend financial guarantees under
80
FMC CORPORATION AND CONSOLIDATED SUBSIDIARIES
Notes to Consolidated Financial Statements — (Continued)
letters of credit and other assistance to customers (Notes 1 and 18). Decisions to extend financial guarantees to customers, and the amount of collateral required under these guarantees, is based on our evaluation of creditworthiness on a case-by-case basis.
Accounting for Derivative Instruments and Hedging Activities
Cash Flow Hedges
We recognize all derivatives on the balance sheet at fair value. On the date the derivative instrument is entered into, we designate the derivative as a hedge of the variability of cash flows to be received or paid related to a forecasted transaction (cash flow hedge). We record in accumulated other comprehensive income or loss (“AOCI”) changes in the fair value of derivatives that are designated as and meet all the required criteria for, a cash flow hedge. We then reclassify these amounts into earnings as the underlying hedged item affects earnings. We record immediately in earnings changes in the fair value of derivatives that are not designated as cash flow hedges.
As of
December 31, 2012
, we had open foreign currency forward contracts in AOCI in a net gain position of
$0.7 million
designated as cash flow hedges of underlying forecasted sales and purchases. Current open contracts hedge forecasted transactions until December 31, 2013. At
December 31, 2012
, we had open forward contracts with various expiration dates to buy, sell or exchange foreign currencies with a U.S. dollar equivalent of approximately
$435 million
.
As of
December 31, 2012
, we had current open commodity contracts in AOCI in a net loss position of
$1.0 million
designated as cash flow hedges of underlying forecasted purchases, primarily natural gas. Current open commodity contracts hedge forecasted transactions until December 31, 2014. At
December 31, 2012
, we had
8.3 million
mmBTUs (millions of British Thermal Units) in aggregate notional volume of outstanding natural gas commodity forward contracts to hedge forecasted purchases.
Of the
$0.3 million
of net losses after-tax, representing both open foreign currency exchange contracts and open commodity contracts, approximately
$0.2 million
of these losses would be realized in earnings during the twelve months ending December 31, 2013, if spot rates in the future are consistent with forward rates as of
December 31, 2012
. The actual effect on earnings will be dependent on actual spot rates when the forecasted transactions occur. We recognize derivative gains and losses in the “Costs of sales and services” line in the consolidated statements of income.
Derivatives Not Designated As Hedging Instruments
We hold certain forward contracts that have not been designated as cash flow hedging instruments for accounting purposes. Contracts used to hedge the exposure to foreign currency fluctuations associated with certain monetary assets and liabilities are not designated as cash flow hedging instruments, and changes in the fair value of these items are recorded in earnings. We hold call options that are effective as economic hedges of a portion of our natural gas exposure and the change in fair value of this instrument is also recorded in earnings. We periodically hold soybean barter contracts which qualify as derivatives and we have entered into offsetting commodity contracts to hedge our exposure. Both the change in fair value of the soybean barter contracts and the offsetting commodity contracts are recorded in earnings.
We had open forward contracts not designated as cash flow hedging instruments for accounting purposes with various expiration dates to buy, sell or exchange foreign currencies with a U.S. dollar equivalent of approximately
$500 million
at
December 31, 2012
. We held an immaterial amount of bushels, in aggregate notional volume of outstanding soybean contracts, to hedge outstanding barter contracts at
December 31, 2012
.
81
FMC CORPORATION AND CONSOLIDATED SUBSIDIARIES
Notes to Consolidated Financial Statements — (Continued)
The following table provides the fair value and balance sheet presentation of our derivative instruments as of
December 31, 2012
and
2011
.
|
(in Millions)
|
|
December 31, 2012
|
December 31, 2011
|
|||||||
|
|
Balance Sheet Location
|
Fair Value
|
||||||||
|
Derivatives Designated as Cash Flow Hedges
|
||||||||||
|
Foreign exchange contracts
|
Prepaid and other current assets
|
$
|
1.5
|
|
|
$
|
8.4
|
|
||
|
Commodity contracts:
|
||||||||||
|
Energy contracts
|
Prepaid and other current assets
|
—
|
|
0.5
|
|
|||||
|
Other contracts
|
Prepaid and other current assets
|
0.2
|
|
—
|
|
|||||
|
Total Derivative Assets
|
$
|
1.7
|
|
$
|
8.9
|
|
||||
|
Foreign exchange contracts
|
Accrued and other liabilities
|
(0.5
|
)
|
|
(10.3
|
)
|
||||
|
Commodity contracts:
|
||||||||||
|
Energy contracts
|
Accrued and other liabilities
|
(1.5
|
)
|
(8.0
|
)
|
|||||
|
Total Derivative Liabilities
|
$
|
(2.0
|
)
|
$
|
(18.3
|
)
|
||||
|
Net Derivative Assets/(Liabilities)
|
$
|
(0.3
|
)
|
$
|
(9.4
|
)
|
||||
|
Derivatives Not Designated as Hedging Instruments
|
||||||||||
|
Foreign exchange contracts
|
Prepaid and other current assets
|
$
|
—
|
|
|
$
|
3.5
|
|
||
|
Total Derivative Assets
|
$
|
—
|
|
$
|
3.5
|
|
||||
|
Foreign exchange contracts
|
Accrued and other liabilities
|
(1.9
|
)
|
|
—
|
|
||||
|
Total Derivative Liabilities
|
$
|
(1.9
|
)
|
$
|
—
|
|
||||
|
Net Derivative Assets/(Liabilities)
|
$
|
(1.9
|
)
|
$
|
3.5
|
|
||||
The information included in the above chart is also presented in our fair value table included within this footnote.
The following tables provide the impact of derivative instruments and related hedged items on the consolidated statements of income for the years ended
December 31, 2012
and
2011
.
82
FMC CORPORATION AND CONSOLIDATED SUBSIDIARIES
Notes to Consolidated Financial Statements — (Continued)
Derivatives in Cash Flow Hedging Relationships
|
Contracts
|
|||||||||||||
|
(in Millions)
|
Foreign exchange
|
Energy
|
Other
|
Total
|
|||||||||
|
Accumulated other comprehensive income (loss), net of tax at December 31, 2009
|
$
|
(0.7
|
)
|
$
|
0.6
|
|
$
|
—
|
|
$
|
(0.1
|
)
|
|
|
2010 Activity
|
|||||||||||||
|
Unrealized hedging gains (losses) and other, net of tax
|
2.4
|
|
(8.3
|
)
|
—
|
|
(5.9
|
)
|
|||||
|
Reclassification of deferred hedging (gains) losses, net of tax
|
|||||||||||||
|
Effective Portion (1)
|
(1.2
|
)
|
3.8
|
|
—
|
|
2.6
|
|
|||||
|
Ineffective Portion (1)
|
(0.1
|
)
|
—
|
|
—
|
|
(0.1
|
)
|
|||||
|
1.1
|
|
(4.5
|
)
|
—
|
|
(3.4
|
)
|
||||||
|
Accumulated other comprehensive income (loss), net of tax at December 31, 2010
|
$
|
0.4
|
|
$
|
(3.9
|
)
|
$
|
—
|
|
$
|
(3.5
|
)
|
|
|
2011 Activity
|
|||||||||||||
|
Unrealized hedging gains (losses) and other, net of tax
|
(3.1
|
)
|
(5.9
|
)
|
(1.3
|
)
|
(10.3
|
)
|
|||||
|
Reclassification of deferred hedging (gains) losses, net of tax
|
|||||||||||||
|
Effective Portion (1)
|
1.3
|
|
5.0
|
|
—
|
|
6.3
|
|
|||||
|
Ineffective Portion (1)
|
0.3
|
|
—
|
|
—
|
|
0.3
|
|
|||||
|
(1.5
|
)
|
(0.9
|
)
|
(1.3
|
)
|
(3.7
|
)
|
||||||
|
Accumulated other comprehensive income (loss), net of tax at December 31, 2011
|
$
|
(1.1
|
)
|
$
|
(4.8
|
)
|
$
|
(1.3
|
)
|
$
|
(7.2
|
)
|
|
|
2012 Activity
|
|||||||||||||
|
Unrealized hedging gains (losses) and other, net of tax
|
2.1
|
|
(2.3
|
)
|
—
|
|
(0.2
|
)
|
|||||
|
Reclassification of deferred hedging (gains) losses, net of tax
|
|||||||||||||
|
Effective Portion (1)
|
(0.2
|
)
|
6.1
|
|
0.1
|
|
6.0
|
|
|||||
|
Ineffective Portion (1)
|
(0.1
|
)
|
—
|
|
—
|
|
(0.1
|
)
|
|||||
|
1.8
|
|
3.8
|
|
0.1
|
|
5.7
|
|
||||||
|
Accumulated other comprehensive income (loss), net of tax at December 31, 2012
|
$
|
0.7
|
|
$
|
(1.0
|
)
|
$
|
(1.2
|
)
|
$
|
(1.5
|
)
|
|
____________________
|
(1)
|
Amounts are included in “Cost of sales and services” and "Interest expense" on the consolidated statements of income.
|
Derivatives Not Designated as Hedging Instruments
|
Location of Gain or (Loss)
Recognized in Income on Derivatives
|
Amount of Pre-tax Gain or (Loss)
Recognized in Income on Derivatives
|
|||||||||||
|
Year Ended December 31,
|
||||||||||||
|
(in Millions)
|
|
2012
|
2011
|
2010
|
||||||||
|
Foreign Exchange contracts
|
Cost of Sales and Services
|
$
|
6.7
|
|
$
|
3.3
|
|
$
|
(3.0
|
)
|
||
|
Commodity contracts:
|
||||||||||||
|
Energy contracts
|
Cost of Sales and Services
|
—
|
|
(0.2
|
)
|
(0.8
|
)
|
|||||
|
Total
|
$
|
6.7
|
|
$
|
3.1
|
|
$
|
(3.8
|
)
|
|||
Fair-Value Measurements
Fair value is the price that would be received to sell an asset or paid to transfer a liability in an orderly transaction between market participants at the measurement date. Market participants are defined as buyers or sellers in the principle or most advantageous market for the asset or liability that are independent of the reporting entity, knowledgeable and able and willing to transact for the asset or liability.
83
FMC CORPORATION AND CONSOLIDATED SUBSIDIARIES
Notes to Consolidated Financial Statements — (Continued)
Fair-Value Hierarchy
We have categorized our assets and liabilities that are recorded at fair value, based on the priority of the inputs to the valuation technique, into a three-level fair-value hierarchy. The fair-value hierarchy gives the highest priority to quoted prices in active markets for identical assets or liabilities (Level 1) and the lowest priority to unobservable inputs (Level 3). If the inputs used to measure the assets and liabilities fall within different levels of the hierarchy, the categorization is based on the lowest level input that is significant to the fair-value measurement of the instrument.
The following tables present our fair-value hierarchy for those assets and liabilities measured at fair-value on a recurring basis in our consolidated balance sheets as of
December 31, 2012
and
December 31, 2011
.
|
(in Millions)
|
December 31, 2012
|
Quoted
Prices
in Active
Markets for
Identical
Assets
(Level 1)
|
Significant
Other
Observable
Inputs
(Level 2)
|
Significant
Unobservable
Inputs
(Level 3)
|
|||||||||||
|
Assets
|
|||||||||||||||
|
Derivatives – Commodities: (2)
|
|||||||||||||||
|
Other contracts
|
0.2
|
|
—
|
|
0.2
|
|
—
|
|
|||||||
|
Derivatives – Foreign Exchange (2)
|
1.5
|
|
—
|
|
1.5
|
|
—
|
|
|||||||
|
Other (3)
|
33.0
|
|
33.0
|
|
—
|
|
—
|
|
|||||||
|
Total Assets
|
$
|
34.7
|
|
$
|
33.0
|
|
$
|
1.7
|
|
$
|
—
|
|
|||
|
Liabilities
|
|||||||||||||||
|
Derivatives – Commodities: (4)
|
|||||||||||||||
|
Energy contracts
|
$
|
1.5
|
|
$
|
—
|
|
$
|
1.5
|
|
$
|
—
|
|
|||
|
Derivatives – Foreign Exchange (4)
|
2.4
|
|
—
|
|
2.4
|
|
—
|
|
|||||||
|
Acquisition (5)
|
1.0
|
|
—
|
|
—
|
|
1.0
|
|
|||||||
|
Other (6)
|
39.8
|
|
39.8
|
|
—
|
|
—
|
|
|||||||
|
Total Liabilities
|
$
|
44.7
|
|
$
|
39.8
|
|
$
|
3.9
|
|
$
|
1.0
|
|
|||
|
(in Millions)
|
December 31, 2011
|
Quoted
Prices
in Active
Markets for
Identical
Assets
(Level 1)
|
Significant
Other
Observable
Inputs
(Level 2)
|
Significant
Unobservable
Inputs
(Level 3)
|
|||||||||||
|
Assets
|
|||||||||||||||
|
Available-for-sale securities:
|
|||||||||||||||
|
Common Stock (1)
|
$
|
0.1
|
|
$
|
0.1
|
|
$
|
—
|
|
$
|
—
|
|
|||
|
Derivatives – Commodities: (2)
|
|||||||||||||||
|
Energy contracts
|
0.5
|
|
—
|
|
0.5
|
|
—
|
|
|||||||
|
Derivatives – Foreign Exchange (2)
|
11.9
|
|
—
|
|
11.9
|
|
—
|
|
|||||||
|
Other (3)
|
20.9
|
|
20.9
|
|
—
|
|
—
|
|
|||||||
|
Total Assets
|
$
|
33.4
|
|
$
|
21.0
|
|
$
|
12.4
|
|
$
|
—
|
|
|||
|
Liabilities
|
|||||||||||||||
|
Derivatives – Commodities: (4)
|
|||||||||||||||
|
Energy contracts
|
$
|
8.0
|
|
$
|
—
|
|
$
|
8.0
|
|
$
|
—
|
|
|||
|
Derivatives – Foreign Exchange (4)
|
10.3
|
|
—
|
|
10.3
|
|
—
|
|
|||||||
|
Acquisition (5)
|
3.5
|
|
—
|
|
—
|
|
3.5
|
|
|||||||
|
Other (6)
|
31.8
|
|
31.8
|
|
—
|
|
—
|
|
|||||||
|
Total Liabilities
|
$
|
53.6
|
|
$
|
31.8
|
|
$
|
18.3
|
|
$
|
3.5
|
|
|||
____________________
84
FMC CORPORATION AND CONSOLIDATED SUBSIDIARIES
Notes to Consolidated Financial Statements — (Continued)
|
(1)
|
Amounts included in “Investments” in the consolidated balance sheets.
|
|
(2)
|
Amounts included in “Prepaid and other current assets” in the consolidated balance sheets.
|
|
(3)
|
Consists of a deferred compensation arrangement, through which we hold various investment securities, recognized on our balance sheet. Both the asset and liability are recorded at fair value. Asset amounts included in “Other assets” in the consolidated balance sheets.
|
|
(4)
|
Amounts included in “Accrued and other liabilities” in the consolidated balance sheets.
|
|
(5)
|
Represents contingent consideration associated with the acquisitions during
2011
. See Note 3 for more information. The changes in this Level 3 liability were not material for the period presented.
|
|
(6)
|
Consists of a deferred compensation arrangement recognized on our balance sheet. Both the asset and liability are recorded at fair value. Liability amounts included in “Other long-term liabilities” in the consolidated balance sheets.
|
The following tables present our fair value hierarchy for those assets and liabilities measured at fair value on a non-recurring basis in our consolidated balance sheets during the year ended
December 31, 2012
and
2011
. See Note 3 for the assets and liabilities measured on a non-recurring basis at fair value associated with our acquisitions.
|
(in Millions)
|
Year ended December 31, 2012
|
Quoted
Prices
in Active
Markets for
Identical
Assets
(Level 1)
|
Significant
Other
Observable
Inputs
(Level 2)
|
Significant
Unobservable
Inputs
(Level 3)
|
Total Gains (Losses) (Year Ended December 31, 2012)
|
||||||||||||||
|
Assets
|
|||||||||||||||||||
|
Long-lived assets to be abandoned (1)
|
$
|
3.1
|
|
$
|
—
|
|
$
|
—
|
|
$
|
3.1
|
|
$
|
(15.9
|
)
|
||||
|
Total Assets
|
$
|
3.1
|
|
$
|
—
|
|
$
|
—
|
|
$
|
3.1
|
|
$
|
(15.9
|
)
|
||||
|
Liabilities
|
|||||||||||||||||||
|
Liabilities associated with exit activities (2)
|
$
|
5.6
|
|
$
|
—
|
|
$
|
5.6
|
|
$
|
—
|
|
$
|
(5.6
|
)
|
||||
|
Total Liabilities
|
$
|
5.6
|
|
$
|
—
|
|
$
|
5.6
|
|
$
|
—
|
|
$
|
(5.6
|
)
|
||||
____________________
|
(1)
|
We recorded charges to write down the value of certain long-lived assets to be abandoned within our Agricultural Products and Specialty Chemicals segments to
zero
and in our Industrial Chemicals segments to their salvage value of
$3.1 million
, respectively. These long-lived assets have no future use and are anticipated to be demolished. The loss noted in the above table represents the accelerated depreciation of these assets recorded during the period.
|
|
(2)
|
This amount represents severance liabilities associated with the Zeolites shutdown as further described in Note 7.
|
|
(in Millions)
|
Year ended December 31, 2011
|
Quoted
Prices
in Active
Markets for
Identical
Assets
(Level 1)
|
Significant
Other
Observable
Inputs
(Level 2)
|
Significant
Unobservable
Inputs
(Level 3)
|
Total Gains
(Losses)
(Year Ended
December 31,
2011)
|
||||||||||||||
|
Assets
|
|||||||||||||||||||
|
Long-lived assets to be abandoned (1)
|
$
|
2.3
|
|
$
|
—
|
|
$
|
—
|
|
$
|
2.3
|
|
$
|
(16.4
|
)
|
||||
|
Total Assets
|
$
|
2.3
|
|
$
|
—
|
|
$
|
—
|
|
$
|
2.3
|
|
$
|
(16.4
|
)
|
||||
|
Liabilities
|
|||||||||||||||||||
|
Liabilities associated with exit activities (2)
|
5.5
|
|
—
|
|
5.5
|
|
—
|
|
(5.5
|
)
|
|||||||||
|
Total Liabilities
|
$
|
5.5
|
|
$
|
—
|
|
$
|
5.5
|
|
$
|
—
|
|
$
|
(5.5
|
)
|
||||
____________________
|
(1)
|
In connection with the Sodium Percarbonate phase-out, we recorded charges to write down the value of the related long-lived assets to be abandoned to their salvage value of
$0.7 million
. The majority of the long-lived assets have a fair value of
zero
as they have no future use and are anticipated to be demolished. We also recognized a
$1.6 million
charge to write-down certain other assets to fair value in our Industrial Chemicals segment during the year ended December 31, 2011. The loss noted in the above table represents the accelerated depreciation and write-down of these assets recorded during the period.
|
|
(2)
|
This amount represents severance liabilities associated with the Sodium Percarbonate phase-out as further described in Note 7.
|
85
FMC CORPORATION AND CONSOLIDATED SUBSIDIARIES
Notes to Consolidated Financial Statements — (Continued)
We lease office space, plants and facilities, and various types of manufacturing, data processing and transportation equipment. Leases of real estate generally provide for our payment of property taxes, insurance and repairs. Capital leases are not significant. Rent expense under operating leases amounted to
$12.3 million
,
$19.5 million
and
$18.8 million
in
2012
,
2011
and
2010
, respectively. Rent expense is net of credits (received for the use of leased transportation assets) of
$25.4 million
,
$23.1 million
and
$21.9 million
in
2012
,
2011
and
2010
, respectively.
Minimum future rentals under noncancelable leases are estimated to be payable as follows:
$29.0 million
in 2013,
$30.8 million
in 2014,
$30.6 million
in 2015,
$21.3 million
in 2016,
$13.2 million
in 2017 and
$25.5 million
thereafter. Minimum future rentals for transportation assets included above aggregated approximately
$88.0 million
, against which we expect to continue to receive credits to substantially defray our rental expense.
Our minimum commitments under our take-or-pay purchase obligations associated with the sourcing of materials and energy total approximately
$81.2 million
. Since the majority of our minimum obligations under these contracts are over the life of the contract as opposed to a year-by-year basis, we are unable to determine the periods in which these obligations could be payable under these contracts. However, we intend to fulfill the obligations associated with these contracts through our purchases associated with the normal course of business.
The following table provides the estimated undiscounted amount of potential future payments for each major group of guarantees at
December 31, 2012
:
|
(in Millions)
|
|||
|
Guarantees:
|
|||
|
Guarantees of vendor financing
|
$
|
31.4
|
|
|
Foreign equity method investment debt guarantees
|
6.7
|
|
|
|
Other debt guarantees
|
16.9
|
|
|
|
Total
|
$
|
55.0
|
|
We provide guarantees to financial institutions on behalf of certain Agricultural Products customers, principally in Brazil and Mexico, for their seasonal borrowing. The total of these guarantees was
$31.4 million
and
$18.5 million
at
December 31, 2012
and
2011
, respectively, and is recorded on the consolidated balance sheets for each date as “Guarantees of vendor financing”. The change in the guarantees is generally due to the seasonality of the Agricultural Products business.
Excluded from the chart above, in connection with our property and asset sales and divestitures, we have agreed to indemnify the buyer for certain liabilities, including environmental contamination and taxes that occurred prior to the date of sale. Our indemnification obligations with respect to these liabilities may be indefinite as to duration and may or may not be subject to a deductible, minimum claim amount or cap. As such, it is not possible for us to predict the likelihood that a claim will be made or to make a reasonable estimate of the maximum potential loss or range of loss. If triggered, we may be able to recover some of the indemnity payments from third parties. We have not recorded any specific liabilities for these guarantees.
Contingencies
Hydrogen Peroxide competition / antitrust litigation
. We are subject to actions brought by private plaintiffs relating to alleged violations of European and Canadian competition and antitrust laws, as further described below.
European competition action
. Multiple European purchasers of hydrogen peroxide who claim to have been harmed as a result of alleged violations of European competition law by hydrogen peroxide producers assigned their legal claims to a single entity formed by a law firm. The single entity then filed a lawsuit in Germany in March 2009 against European producers, including our wholly-owned Spanish subsidiary, Foret. Initial defense briefs were filed in April 2010, and an initial hearing was held during the first quarter of 2011, at which time case management issues were discussed. At a subsequent hearing in October 2011, the Court indicated that it was considering seeking guidance from the European Court of Justice (“ECJ”) as to whether the German courts have jurisdiction over these claims. After submission of written comments on this issue by the parties, on March 1, 2012, the judge announced that she would refer the jurisdictional issues to the ECJ. Such a reference to the ECJ normally takes 12-18 months for completion. Since the case is in the preliminary stages and is based on a novel procedure - namely the attempt to create a cross-border “class action” which is not a recognized proceeding under EU or German law - we are unable to develop a reasonable estimate of our potential exposure of loss at this time. We intend to vigorously defend this matter.
86
FMC CORPORATION AND CONSOLIDATED SUBSIDIARIES
Notes to Consolidated Financial Statements — (Continued)
Canadian antitrust actions
. In 2005, after public disclosures of the U.S. federal grand jury investigation into the hydrogen peroxide industry (which resulted in no charges brought against us) and the filing of various class actions in U.S. federal and state courts, which have all been settled, putative class actions against us and
five
other major hydrogen peroxide producers were filed in provincial courts in Ontario, Quebec and British Columbia under the laws of Canada. The other
five
defendants have settled these claims for a total of approximately
$20.6 million
. On September 28, 2009, the Ontario Superior Court of Justice certified a class of direct and indirect purchasers of hydrogen peroxide from 1994 to 2005. Our motion for leave to appeal the class certification decision was denied in June 2010. Since then, the case has been largely dormant. In early 2012 the parties began a more detailed dialogue on discovery and at a hearing on April 5, 2012, they requested the judge to issue more specific guidance on document production. The court instead stayed the litigation pending resolution by the Canadian Supreme Court of the viability of indirect purchaser claims. The Canadian Supreme Court heard argument on that issue in October 2012. Since the proceedings are in the preliminary stages with respect to the merits, we are unable to develop a reasonable estimate of our potential exposure of loss at this time. We intend to vigorously defend these matters.
Asbestos claims
. Like hundreds of other industrial companies, we have been named as one of many defendants in asbestos-related personal injury litigation. Most of these cases allege personal injury or death resulting from exposure to asbestos in premises of FMC or to asbestos-containing components installed in machinery or equipment manufactured or sold by businesses classified as discontinued operations. We intend to continue managing these cases in accordance with our historical experience. We have established a reserve for this litigation within our discontinued operations and are unable to develop a reasonable estimate of any exposure of a loss in excess of the established reserve. Our experience has been that the overall trends in terms of the rate of filing of asbestos-related claims with respect to all potential defendants has changed over time, and that filing rates as to us in particular have varied significantly over the last several years. We are a peripheral defendant - that is, we have never manufactured asbestos or asbestos-containing components. As a result, claim filing rates against us have yet to form a predictable pattern, and we are unable to project a reasonably accurate future filing rate and thus, we are presently unable to reasonably estimate our asbestos liability with respect to claims that may be filed in the future.
Other contingent liabilities
. In addition to the matters disclosed above, we have certain other contingent liabilities arising from litigation, claims, products we have sold, guarantees or warranties we have made, contracts we have entered into, indemnities we have provided, and other commitments incident to the ordinary course of business. Some of these contingencies are known - for example pending product liability litigation or claims - but are so preliminary that the merits cannot be determined, or if more advanced, are not deemed material based on current knowledge; and some are unknown - for example, claims with respect to which we have no notice or claims which may arise in the future, resulting from products we have sold, guarantees or warranties we have made, or indemnities we have provided. Therefore, we are unable to develop a reasonable estimate of our potential exposure of loss for these contingencies, either individually or in the aggregate, at this time. Based on information currently available and established reserves, we have no reason to believe that the ultimate resolution of our known contingencies, including the matters described in this Note, will have a material adverse effect on our consolidated financial position, liquidity or results of operations. However, there can be no assurance that the outcome of these contingencies will be favorable, and adverse results in certain of these contingencies could have a material adverse effect on our consolidated financial position, results of operations in any one reporting period, or liquidity.
See Note 10 for the Pocatello tribal litigation for a legal proceeding associated with our environmental contingencies.
Business segment results below are presented net of noncontrolling interests, reflecting only FMC’s share of earnings. The corporate line primarily includes staff expenses, while other income and expense, net consists of all other corporate items, including LIFO inventory adjustments.
87
FMC CORPORATION AND CONSOLIDATED SUBSIDIARIES
Notes to Consolidated Financial Statements — (Continued)
|
(in Millions)
|
Year Ended December 31,
|
||||||||||
|
2012
|
2011
|
2010
|
|||||||||
|
Revenue
|
|||||||||||
|
Agricultural Products
|
$
|
1,763.8
|
|
$
|
1,464.5
|
|
$
|
1,241.8
|
|
||
|
Specialty Chemicals
|
913.8
|
|
879.1
|
|
824.5
|
|
|||||
|
Industrial Chemicals
|
1,076.1
|
|
1,038.5
|
|
1,054.8
|
|
|||||
|
Eliminations
|
(5.4
|
)
|
(4.2
|
)
|
(4.8
|
)
|
|||||
|
Total
|
$
|
3,748.3
|
|
$
|
3,377.9
|
|
$
|
3,116.3
|
|
||
|
Income (loss) from continuing operations before income taxes
|
|||||||||||
|
Agricultural Products
|
$
|
450.7
|
|
$
|
348.3
|
|
$
|
309.5
|
|
||
|
Specialty Chemicals
|
189.5
|
|
199.8
|
|
185.0
|
|
|||||
|
Industrial Chemicals
|
165.4
|
|
154.5
|
|
122.9
|
|
|||||
|
Eliminations
|
0.1
|
|
(0.1
|
)
|
0.2
|
|
|||||
|
Segment operating profit
|
805.7
|
|
702.5
|
|
617.6
|
|
|||||
|
Corporate expense
|
(63.6
|
)
|
(62.5
|
)
|
(63.0
|
)
|
|||||
|
Other income (expense), net
|
(23.5
|
)
|
(18.7
|
)
|
(5.4
|
)
|
|||||
|
Operating profit before the items listed below (1)
|
718.6
|
|
621.3
|
|
549.2
|
|
|||||
|
Interest expense, net
|
(45.3
|
)
|
(39.4
|
)
|
(39.3
|
)
|
|||||
|
Restructuring and other income (charges) (2)
|
(38.1
|
)
|
(32.4
|
)
|
(151.9
|
)
|
|||||
|
Non-operating pension and postretirement (charges) income (3)
|
(34.9
|
)
|
(14.5
|
)
|
(19.9
|
)
|
|||||
|
Acquisition-related charges (4)
|
(7.2
|
)
|
(0.8
|
)
|
—
|
|
|||||
|
Provision for income taxes
|
(146.7
|
)
|
(136.5
|
)
|
(132.0
|
)
|
|||||
|
Discontinued operations, net of income taxes
|
(30.2
|
)
|
(31.8
|
)
|
(33.6
|
)
|
|||||
|
Net income attributable to FMC stockholders
|
$
|
416.2
|
|
$
|
365.9
|
|
$
|
172.5
|
|
||
____________________
|
(1)
|
Results for all segments including corporate expense and other income (expense) are net of noncontrolling interests in
2012
,
2011
and
2010
of
$19.5 million
,
$16.3 million
and
$12.4 million
, respectively. The majority of the noncontrolling interests pertain to our Industrial Chemicals segment.
|
|
(2)
|
See Note 7 for details of restructuring and other charges (income). Amounts for the years ended
2012
,
2011
and
2010
relate to Agricultural Products of
$8.5 million
,
$1.2 million
and
$7.3 million
; Specialty Chemicals of
$13.7 million
,
$2.2 million
and
$6.7 million
; Industrial Chemicals of
$10.6 million
,
$26.1 million
and
$124.6 million
; and Corporate of
$5.3 million
,
$2.9 million
and
$13.3 million
, respectively.
|
|
(3)
|
Our non-operating pension and postretirement costs are defined as those costs related to interest, expected return on plan assets, amortized actuarial gains and losses and the impacts of any plan curtailments or settlements. These costs are primarily related to changes in pension plan assets and liabilities which are tied to financial market performance and we consider these costs to be outside our operational performance. We exclude these non-operating pension and postretirement costs as we believe that removing them provides a better understanding of the underlying profitability of our businesses, provides increased transparency and clarity in the performance of our retirement plans and enhances period-over-period comparability. We continue to include the service cost and amortization of prior service cost in our operating segments noted above. We believe these elements reflect the current year operating costs to our businesses for the employment benefits provided to active employees.
|
|
(4)
|
These charges were related to the expensing of the inventory fair value step-up resulting from the application of purchase accounting. The charges for the year ended December 31, 2012 and 2011 primarily relate to a number of acquisitions completed in 2011, further described in Note 3. On the consolidated statements of income, the charges presented are included in “Costs of sales and services”. No such charges occurred for the year ended December 31, 2010.
|
Net sales to external customers for each of our product line groups is presented below. Our Agricultural Products segment has one product line group, and therefore net sales to external customers within the Agricultural Products segment is included in the table above.
88
FMC CORPORATION AND CONSOLIDATED SUBSIDIARIES
Notes to Consolidated Financial Statements — (Continued)
|
(in Millions)
|
Year Ended December 31,
|
||||||||||
|
2012
|
2011
|
2010
|
|||||||||
|
Net Sales
|
|||||||||||
|
BioPolymer
|
$
|
680.8
|
|
$
|
654.3
|
|
$
|
611.5
|
|
||
|
Lithium
|
233.0
|
|
224.8
|
|
213.0
|
|
|||||
|
Total Specialty Chemicals Segment
|
$
|
913.8
|
|
$
|
879.1
|
|
$
|
824.5
|
|
||
|
(in Millions)
|
Year Ended December 31,
|
||||||||||
|
2012
|
2011
|
2010
|
|||||||||
|
Net Sales
|
|||||||||||
|
Alkali
|
$
|
715.0
|
|
$
|
677.5
|
|
$
|
615.6
|
|
||
|
Peroxygens
|
302.7
|
|
311.8
|
|
284.4
|
|
|||||
|
Environmental Solutions (1)
|
48.1
|
|
33.2
|
|
21.0
|
|
|||||
|
Zeolites, Phosphates and Sulfur Derivative
|
10.3
|
|
16.0
|
|
133.8
|
|
|||||
|
Total Industrial Chemicals Segment
|
$
|
1,076.1
|
|
$
|
1,038.5
|
|
$
|
1,054.8
|
|
||
____________________
|
(1)
|
Our Environmental Solutions division was created in 2012. Prior to its creation sales of our environmental solutions products were included within our Alkali and Peroxygens divisions. These sales have been appropriately reclassifed from those divisions and presented within our Environmental Solutions division to conform to the current year's presentation.
|
|
(in Millions)
|
December 31,
|
||||||||||
|
2012
|
2011
|
2010
|
|||||||||
|
Operating capital employed (1)
|
|||||||||||
|
Agricultural Products
|
$
|
1,165.6
|
|
$
|
888.1
|
|
$
|
751.3
|
|
||
|
Specialty Chemicals
|
1,122.4
|
|
906.1
|
|
806.2
|
|
|||||
|
Industrial Chemicals
|
673.8
|
|
594.1
|
|
488.8
|
|
|||||
|
Elimination
|
—
|
|
(0.3
|
)
|
(0.2
|
)
|
|||||
|
Total operating capital employed
|
2,961.8
|
|
2,388.0
|
|
2,046.1
|
|
|||||
|
Segment liabilities included in total operating capital employed
|
977.6
|
|
824.9
|
|
717.9
|
|
|||||
|
Corporate items
|
434.5
|
|
530.6
|
|
555.9
|
|
|||||
|
Total assets
|
$
|
4,373.9
|
|
$
|
3,743.5
|
|
$
|
3,319.9
|
|
||
|
Segment assets (2)
|
|||||||||||
|
Agricultural Products
|
$
|
1,793.7
|
|
$
|
1,382.8
|
|
$
|
1,090.9
|
|
||
|
Specialty Chemicals
|
1,239.2
|
|
1,001.1
|
|
892.5
|
|
|||||
|
Industrial Chemicals
|
906.5
|
|
829.3
|
|
780.8
|
|
|||||
|
Elimination
|
—
|
|
(0.3
|
)
|
(0.2
|
)
|
|||||
|
Total segment assets
|
3,939.4
|
|
3,212.9
|
|
2,764.0
|
|
|||||
|
Corporate items
|
434.5
|
|
530.6
|
|
555.9
|
|
|||||
|
Total assets
|
$
|
4,373.9
|
|
$
|
3,743.5
|
|
$
|
3,319.9
|
|
||
____________________
|
(1)
|
We view operating capital employed, which consists of assets, net of liabilities, reported by our operations and excluding corporate items such as cash equivalents, debt, pension liabilities, income taxes and LIFO reserves, as our primary measure of segment capital.
|
|
(2)
|
Segment assets are assets recorded and reported by the segments and are equal to segment operating capital employed plus segment liabilities. See Note 1.
|
89
FMC CORPORATION AND CONSOLIDATED SUBSIDIARIES
Notes to Consolidated Financial Statements — (Continued)
|
|
Year Ended December 31,
|
||||||||||||||||||||||||||||||||||
|
(in Millions)
|
Capital Expenditures
|
Depreciation and
Amortization
|
Research and
Development Expense
|
||||||||||||||||||||||||||||||||
|
2012
|
2011
|
2010
|
2012
|
2011
|
2010
|
2012
|
2011
|
2010
|
|||||||||||||||||||||||||||
|
Agricultural Products
|
$
|
18.4
|
|
$
|
17.4
|
|
$
|
12.9
|
|
$
|
34.0
|
|
$
|
23.1
|
|
$
|
21.7
|
|
$
|
95.4
|
|
$
|
84.3
|
|
$
|
80.9
|
|
||||||||
|
Specialty Chemicals
|
90.0
|
|
76.1
|
|
51.9
|
|
38.2
|
|
35.3
|
|
32.6
|
|
14.9
|
|
14.2
|
|
13.4
|
|
|||||||||||||||||
|
Industrial Chemicals
|
88.7
|
|
84.3
|
|
68.4
|
|
58.1
|
|
61.2
|
|
73.3
|
|
7.5
|
|
6.7
|
|
6.2
|
|
|||||||||||||||||
|
Corporate
|
9.5
|
|
11.7
|
|
9.1
|
|
7.5
|
|
7.0
|
|
6.0
|
|
—
|
|
—
|
|
—
|
|
|||||||||||||||||
|
Total
|
$
|
206.6
|
|
$
|
189.5
|
|
$
|
142.3
|
|
$
|
137.8
|
|
$
|
126.6
|
|
$
|
133.6
|
|
$
|
117.8
|
|
$
|
105.2
|
|
$
|
100.5
|
|
||||||||
Geographic Segment Information
|
(in Millions)
|
Year Ended December 31,
|
||||||||||
|
2012
|
2011
|
2010
|
|||||||||
|
Revenue (by location of customer):
|
|||||||||||
|
North America (1)
|
$
|
1,298.9
|
|
$
|
1,188.8
|
|
$
|
1,125.4
|
|
||
|
Europe/Middle East/Africa
|
618.7
|
|
635.7
|
|
677.6
|
|
|||||
|
Latin America (1)
|
1,179.2
|
|
976.3
|
|
821.8
|
|
|||||
|
Asia Pacific
|
651.5
|
|
577.1
|
|
491.5
|
|
|||||
|
Total
|
$
|
3,748.3
|
|
$
|
3,377.9
|
|
$
|
3,116.3
|
|
||
____________________
|
(1)
|
In 2012, countries with sales in excess of
ten percent
of consolidated revenue consisted of the U.S. and Brazil. Sales for the years ended December
2012
,
2011
and
2010
for the U.S. totaled
$1,217.8 million
,
$1,109.6 million
and
$1,056.1 million
and for Brazil totaled
$846.6 million
,
$695.2 million
and
$564.7 million
, respectively.
|
|
(in Millions)
|
December 31,
|
||||||
|
2012
|
2011
|
||||||
|
Long-lived assets (1):
|
|||||||
|
North America (2)
|
$
|
1,011.6
|
|
$
|
860.9
|
|
|
|
Europe/Middle East/Africa (2)
|
558.1
|
|
467.2
|
|
|||
|
Latin America
|
143.1
|
|
106.5
|
|
|||
|
Asia Pacific
|
246.0
|
|
192.6
|
|
|||
|
Total
|
$
|
1,958.8
|
|
$
|
1,627.2
|
|
|
____________________
|
(1)
|
Geographic segment long-lived assets exclude long-term deferred income taxes on the consolidated balance sheets.
|
|
(2)
|
The countries with long-lived assets in excess of
ten percent
of consolidated long-lived assets at
December 31, 2012
and
2011
are the U.S. and Norway. Long lived assets at
December 31, 2012
and
2011
for the U.S. totaled
$967.7 million
and
$819.0 million
and for Norway totaled
$245.8 million
and
$234.3 million
, respectively. Norway assets included goodwill of
$162.3 million
and
$165.7 million
at
December 31, 2012
and
2011
, respectively.
|
90
FMC CORPORATION AND CONSOLIDATED SUBSIDIARIES
Notes to Consolidated Financial Statements — (Continued)
The following tables present details of prepaid and other current assets, other assets, accrued and other liabilities and other long-term liabilities as presented on the consolidated balance sheets:
|
Prepaid and other current assets
|
December 31,
|
||||||
|
(in Millions)
|
2012
|
2011
|
|||||
|
Prepaid insurance
|
$
|
7.1
|
|
$
|
7.6
|
|
|
|
Income and value added tax receivables
|
59.7
|
|
57.6
|
|
|||
|
Environmental obligation recoveries (Note 10)
|
13.3
|
|
9.4
|
|
|||
|
Other prepaid and current assets
|
101.0
|
|
98.8
|
|
|||
|
Total
|
$
|
181.1
|
|
$
|
173.4
|
|
|
|
Other assets
|
December 31,
|
||||||
|
(in Millions)
|
2012
|
2011
|
|||||
|
Debt financing fees, net
|
$
|
7.7
|
|
$
|
9.1
|
|
|
|
Contract manufacturers expenditures
|
55.9
|
|
38.7
|
|
|||
|
Capitalized software, net
|
32.8
|
|
21.8
|
|
|||
|
Environmental obligation recoveries (Note 10)
|
38.3
|
|
48.9
|
|
|||
|
Export tax receivable
|
23.5
|
|
—
|
|
|||
|
Deferred compensation arrangements
|
33.0
|
|
20.9
|
|
|||
|
Other long-term assets
|
81.1
|
|
59.5
|
|
|||
|
Total
|
$
|
272.3
|
|
$
|
198.9
|
|
|
|
Accrued and other liabilities
|
December 31,
|
||||||
|
(in Millions)
|
2012
|
2011
|
|||||
|
Asset retirement obligations, current (Note 8)
|
$
|
14.9
|
|
$
|
9.8
|
|
|
|
Restructuring reserves (Note 7)
|
10.5
|
|
12.4
|
|
|||
|
Dividend Payable (Note 15)
|
18.7
|
|
10.5
|
|
|||
|
Environmental reserves, current, net of recoveries (Note 10)
|
15.8
|
|
13.6
|
|
|||
|
Other accrued and other liabilities
|
132.1
|
|
139.9
|
|
|||
|
Total
|
$
|
192.0
|
|
$
|
186.2
|
|
|
|
Other long-term liabilities
|
December 31,
|
||||||
|
(in Millions)
|
2012
|
2011
|
|||||
|
Asset retirement obligations, long-term (Note 8)
|
$
|
10.6
|
|
$
|
17.2
|
|
|
|
Contingencies related to uncertain tax positions (Note 11)
|
23.3
|
|
8.1
|
|
|||
|
Deferred compensation arrangements
|
39.8
|
|
31.8
|
|
|||
|
Self insurance reserves (primarily workers' compensation)
|
19.6
|
|
19.7
|
|
|||
|
Lease obligations
|
31.8
|
|
11.3
|
|
|||
|
Other long-term liabilities
|
29.4
|
|
28.7
|
|
|||
|
Total
|
$
|
154.5
|
|
$
|
116.8
|
|
|
91
FMC CORPORATION AND CONSOLIDATED SUBSIDIARIES
Notes to Consolidated Financial Statements — (Continued)
|
(in Millions, Except Share and Per Share Data)
|
2012
|
2011
|
|||||||||||||||||||||||||||||
|
1Q
|
2Q
|
3Q
|
4Q
|
1Q
|
2Q
|
3Q
|
4Q
|
||||||||||||||||||||||||
|
Revenue
|
$
|
940.7
|
|
$
|
905.2
|
|
$
|
902.4
|
|
$
|
1,000.0
|
|
$
|
795.0
|
|
$
|
812.2
|
|
$
|
862.1
|
|
$
|
908.6
|
|
|||||||
|
Gross Profit
|
347.3
|
|
337.8
|
|
315.5
|
|
340.6
|
|
288.1
|
|
298.8
|
|
287.4
|
|
293.1
|
|
|||||||||||||||
|
Income (loss) from continuing operations before equity in (earnings) loss of affiliates, net interest income and expense and income taxes
|
188.0
|
|
175.5
|
|
146.8
|
|
147.9
|
|
155.0
|
|
155.6
|
|
135.6
|
|
141.1
|
|
|||||||||||||||
|
Income (loss) from continuing operations (2)
|
132.0
|
|
118.4
|
|
100.9
|
|
114.6
|
|
105.4
|
|
121.1
|
|
97.2
|
|
90.3
|
|
|||||||||||||||
|
Discontinued operations, net of income taxes
|
(7.4
|
)
|
(8.1
|
)
|
(6.3
|
)
|
(8.4
|
)
|
(8.0
|
)
|
(8.9
|
)
|
(6.3
|
)
|
(8.6
|
)
|
|||||||||||||||
|
Net income (loss) (3)
|
124.6
|
|
110.3
|
|
94.6
|
|
106.2
|
|
97.4
|
|
112.2
|
|
90.9
|
|
81.7
|
|
|||||||||||||||
|
Less: Net income attributable to noncontrolling interests
|
5.5
|
|
5.4
|
|
4.6
|
|
4.0
|
|
3.4
|
|
5.0
|
|
4.1
|
|
3.8
|
|
|||||||||||||||
|
Net income (loss) attributable to FMC stockholders
|
$
|
119.1
|
|
$
|
104.9
|
|
$
|
90.0
|
|
$
|
102.2
|
|
$
|
94.0
|
|
$
|
107.2
|
|
$
|
86.8
|
|
$
|
77.9
|
|
|||||||
|
Amounts attributable to FMC stockholders:
|
|||||||||||||||||||||||||||||||
|
Continuing operations, net of income taxes
|
$
|
126.5
|
|
$
|
113.0
|
|
$
|
96.3
|
|
$
|
110.6
|
|
$
|
102.0
|
|
$
|
116.1
|
|
$
|
93.1
|
|
$
|
86.5
|
|
|||||||
|
Discontinued operations, net of income taxes
|
(7.4
|
)
|
(8.1
|
)
|
(6.3
|
)
|
(8.4
|
)
|
(8.0
|
)
|
(8.9
|
)
|
(6.3
|
)
|
(8.6
|
)
|
|||||||||||||||
|
Net income (loss)
|
$
|
119.1
|
|
$
|
104.9
|
|
$
|
90.0
|
|
$
|
102.2
|
|
$
|
94.0
|
|
$
|
107.2
|
|
$
|
86.8
|
|
$
|
77.9
|
|
|||||||
|
Basic earnings (loss) per common share attributable to FMC stockholders:
|
|||||||||||||||||||||||||||||||
|
Continuing operations
|
$
|
0.91
|
|
$
|
0.82
|
|
$
|
0.70
|
|
$
|
0.80
|
|
$
|
0.71
|
|
$
|
0.81
|
|
$
|
0.65
|
|
$
|
0.61
|
|
|||||||
|
Discontinued operations
|
(0.05
|
)
|
(0.06
|
)
|
(0.05
|
)
|
(0.06
|
)
|
(0.06
|
)
|
(0.06
|
)
|
(0.04
|
)
|
(0.06
|
)
|
|||||||||||||||
|
Basic net income (loss) per common share (1)
|
$
|
0.86
|
|
$
|
0.76
|
|
$
|
0.65
|
|
$
|
0.74
|
|
$
|
0.65
|
|
$
|
0.75
|
|
$
|
0.61
|
|
$
|
0.55
|
|
|||||||
|
Diluted earnings (loss) per common share attributable to FMC stockholders:
|
|||||||||||||||||||||||||||||||
|
Continuing operations
|
$
|
0.90
|
|
$
|
0.82
|
|
$
|
0.70
|
|
$
|
0.80
|
|
$
|
0.71
|
|
$
|
0.80
|
|
$
|
0.65
|
|
$
|
0.61
|
|
|||||||
|
Discontinued operations
|
(0.05
|
)
|
(0.06
|
)
|
(0.05
|
)
|
(0.06
|
)
|
(0.06
|
)
|
(0.06
|
)
|
(0.04
|
)
|
(0.06
|
)
|
|||||||||||||||
|
Diluted net income (loss) per common share (1)
|
$
|
0.85
|
|
$
|
0.76
|
|
$
|
0.65
|
|
$
|
0.74
|
|
$
|
0.65
|
|
$
|
0.74
|
|
$
|
0.61
|
|
$
|
0.55
|
|
|||||||
|
Weighted average shares outstanding:
|
|||||||||||||||||||||||||||||||
|
Basic
|
138.3
|
|
137.2
|
|
137.4
|
|
137.6
|
|
143.0
|
|
143.2
|
|
141.9
|
|
140.4
|
|
|||||||||||||||
|
Diluted
|
139.5
|
|
138.3
|
|
138.4
|
|
138.6
|
|
144.2
|
|
144.4
|
|
143.1
|
|
141.4
|
|
|||||||||||||||
____________________
|
(1)
|
The sum of quarterly earnings per common share may differ from the full-year amount.
|
|
(2)
|
In the fourth quarter of 2012, our results were unfavorably impacted by
$13.3 million
(
$9.3 million
after-tax) of restructuring and other charges (income), which arose from the Lithium restructuring. (See Note 7).
|
|
(3)
|
In the fourth quarter of 2012, our results were favorably impacted due to a valuation allowance decrease of
$14.9 million
related to U.S. state net operating losses now expected to be recoverable (See Note 11).
|
92
Report of Independent Registered Public Accounting Firm
The Board of Directors and Stockholders
FMC Corporation:
We have audited the accompanying consolidated balance sheets of FMC Corporation and subsidiaries as of
December 31, 2012
and
2011
, and the related consolidated statements of income, comprehensive income, cash flows, and changes in equity for each of the years in the three-year period ended
December 31, 2012
. In connection with our audits of the consolidated financial statements, we also have audited the related financial statement schedule. These consolidated financial statements and financial statement schedule are the responsibility of the Company’s management. Our responsibility is to express an opinion on these consolidated financial statements and financial statement schedule based on our audits.
We conducted our audits in accordance with the standards of the Public Company Accounting Oversight Board (United States). Those standards require that we plan and perform the audit to obtain reasonable assurance about whether the financial statements are free of material misstatement. An audit includes examining, on a test basis, evidence supporting the amounts and disclosures in the financial statements. An audit also includes assessing the accounting principles used and significant estimates made by management, as well as evaluating the overall financial statement presentation. We believe that our audits provide a reasonable basis for our opinion.
In our opinion, the consolidated financial statements referred to above present fairly, in all material respects, the financial position of FMC Corporation and subsidiaries as of
December 31, 2012
and
2011
, and the results of their operations and their cash flows for each of the years in the three-year period ended
December 31, 2012
, in conformity with U.S. generally accepted accounting principles. Also in our opinion, the related financial statement schedule, when considered in relation to the basic consolidated financial statements taken as a whole, presents fairly, in all material respects, the information set forth therein.
We also have audited, in accordance with the standards of the Public Company Accounting Oversight Board (United States), FMC Corporation’s internal control over financial reporting as of
December 31, 2012
, based on criteria established in
Internal Control – Integrated Framework
issued by the Committee of Sponsoring Organizations of the Treadway Commission (COSO), and our report dated
February 19, 2013
expressed an unqualified opinion on the effectiveness of the Company’s internal control over financial reporting.
/s/ KPMG LLP
Philadelphia, Pennsylvania
February 19, 2013
93
MANAGEMENT’S ANNUAL REPORT ON INTERNAL CONTROL OVER FINANCIAL REPORTING
Management is responsible for establishing and maintaining adequate internal control over financial reporting as defined in Exchange Act Rule 13a-15(f). FMC’s internal control over financial reporting is a process designed to provide reasonable assurance regarding the reliability of financial reporting and the preparation of financial statements for external purposes in accordance with U.S. generally accepted accounting principles. Internal control over financial reporting includes those written policies and procedures that:
|
•
|
pertain to the maintenance of records that, in reasonable detail, accurately and fairly reflect the transactions and dispositions of the assets of FMC;
|
|
•
|
provide reasonable assurance that transactions are recorded as necessary to permit preparation of financial statements in accordance with U.S. generally accepted accounting principles;
|
|
•
|
provide reasonable assurance that receipts and expenditures of FMC are being made only in accordance with authorization of management and directors of FMC; and
|
|
•
|
provide reasonable assurance regarding prevention or timely detection of unauthorized acquisition, use or disposition of assets that could have a material effect on the consolidated financial statements.
|
Internal control over financial reporting includes the controls themselves, monitoring and internal auditing practices and actions taken to correct deficiencies as identified.
Because of its inherent limitations, internal control over financial reporting may not prevent or detect misstatements. Also, projections of any evaluation of effectiveness to future periods are subject to the risk that controls may become inadequate because of changes in conditions, or that the degree of compliance with the policies or procedures may deteriorate.
We assessed the effectiveness of our internal control over financial reporting as of
December 31, 2012
. We based this assessment on criteria for effective internal control over financial reporting described in “Internal Control—Integrated Framework” issued by the Committee of Sponsoring Organizations of the Treadway Commission. Management’s assessment included an evaluation of the design of our internal control over financial reporting and testing of the operational effectiveness of our internal control over financial reporting. We reviewed the results of our assessment with the Audit Committee of our Board of Directors.
Based on this assessment, we determined that, as of
December 31, 2012
, FMC has effective internal control over financial reporting.
KPMG LLP, our independent registered public accounting firm, has issued an attestation report on the effectiveness of internal control over financial reporting as of
December 31, 2012
, which appears on the following page.
94
Report of Independent Registered Public Accounting Firm
The Board of Directors and Stockholders
FMC Corporation:
We have audited FMC Corporation’s internal control over financial reporting as of
December 31, 2012
, based on criteria established in
Internal Control – Integrated Framework
issued by the Committee of Sponsoring Organizations of the Treadway Commission (COSO). FMC Corporation’s management is responsible for maintaining effective internal control over financial reporting and for its assessment of the effectiveness of internal control over financial reporting, included in the accompanying report titled “Management’s Annual Report on Internal Control Over Financial Reporting.” Our responsibility is to express an opinion on the Company’s internal control over financial reporting based on our audit.
We conducted our audit in accordance with the standards of the Public Company Accounting Oversight Board (United States). Those standards require that we plan and perform the audit to obtain reasonable assurance about whether effective internal control over financial reporting was maintained in all material respects. Our audit included obtaining an understanding of internal control over financial reporting, assessing the risk that a material weakness exists, and testing and evaluating the design and operating effectiveness of internal control based on the assessed risk. Our audit also included performing such other procedures as we considered necessary in the circumstances. We believe that our audit provides a reasonable basis for our opinion.
A company’s internal control over financial reporting is a process designed to provide reasonable assurance regarding the reliability of financial reporting and the preparation of financial statements for external purposes in accordance with generally accepted accounting principles. A company’s internal control over financial reporting includes those policies and procedures that (1) pertain to the maintenance of records that, in reasonable detail, accurately and fairly reflect the transactions and dispositions of the assets of the company; (2) provide reasonable assurance that transactions are recorded as necessary to permit preparation of financial statements in accordance with generally accepted accounting principles, and that receipts and expenditures of the company are being made only in accordance with authorizations of management and directors of the company; and (3) provide reasonable assurance regarding prevention or timely detection of unauthorized acquisition, use, or disposition of the company’s assets that could have a material effect on the financial statements.
Because of its inherent limitations, internal control over financial reporting may not prevent or detect misstatements. Also, projections of any evaluation of effectiveness to future periods are subject to the risk that controls may become inadequate because of changes in conditions, or that the degree of compliance with the policies or procedures may deteriorate.
In our opinion, FMC Corporation maintained, in all material respects, effective internal control over financial reporting as of
December 31, 2012
, based on criteria established in
Internal Control – Integrated Framework
issued by the Committee of Sponsoring Organizations of the Treadway Commission.
We also have audited, in accordance with the standards of the Public Company Accounting Oversight Board (United States), the consolidated balance sheets of FMC Corporation and subsidiaries as of
December 31, 2012
and
2011
, and the related consolidated statements of income, comprehensive income, cash flows, and changes in equity for each of the years in the three-year period ended
December 31, 2012
, and our report dated
February 19, 2013
expressed an unqualified opinion on those consolidated financial statements
.
/s/ KPMG LLP
Philadelphia, Pennsylvania
February 19, 2013
95
FMC CORPORATION
SCHEDULE II - VALUATION AND QUALIFYING ACCOUNTS AND RESERVES
FOR YEARS ENDED DECEMBER 31,
2012
,
2011
and
2010
|
(in Millions)
|
Balance,
Beginning
of Year
|
Provision
/(benefit)
|
Write-
offs (1)
|
Balance,
End of
Year
|
|||||||||
|
December 31, 2012
|
|||||||||||||
|
Reserve for doubtful accounts
|
$
|
21.5
|
|
8.7
|
|
(3.0
|
)
|
$
|
27.2
|
|
|||
|
Deferred tax valuation allowance
|
$
|
92.6
|
|
(8.1
|
)
|
—
|
|
$
|
84.5
|
|
|||
|
December 31, 2011
|
|||||||||||||
|
Reserve for doubtful accounts
|
$
|
21.7
|
|
3.8
|
|
(4.0
|
)
|
$
|
21.5
|
|
|||
|
Deferred tax valuation allowance
|
$
|
76.3
|
|
16.3
|
|
—
|
|
$
|
92.6
|
|
|||
|
December 31, 2010
|
|||||||||||||
|
Reserve for doubtful accounts
|
$
|
18.2
|
|
4.3
|
|
(0.8
|
)
|
$
|
21.7
|
|
|||
|
Deferred tax valuation allowance
|
$
|
37.1
|
|
39.2
|
|
—
|
|
$
|
76.3
|
|
|||
____________________
|
(1)
|
Write-offs are net of recoveries.
|
|
ITEM 9.
|
CHANGES IN AND DISAGREEMENTS WITH ACCOUNTANTS ON ACCOUNTING AND FINANCIAL DISCLOSURE
|
None.
(a) Evaluation of disclosure controls and procedures. Based on management’s evaluation (with the participation of the Company’s Chief Executive Officer and Chief Financial Officer), the Chief Executive Officer and Chief Financial Officer have concluded that, as of the end of the period covered by this report, the Company’s disclosure controls and procedures (as defined in Rules 13a-15(e) and 15d-15(e) under the Securities Exchange Act of 1934) are effective to provide reasonable assurance that information required to be disclosed by the Company in reports filed or submitted under the Securities Exchange Act of 1934 is recorded, processed, summarized and reported within the time periods specified in the SEC’S rules and forms and is accumulated and communicated to management, including our principal executive officer and principal financial officer, as appropriate to allow timely decisions regarding required disclosure.
Management’s annual report on internal control over financial reporting. Refer to
Management’s Report on Internal Control Over Financial Reporting
which is included in Item 8 of Part II of this Annual Report on Form 10-K and is incorporated by reference to this Item 9A.
Audit report of the independent registered public accounting firm. Refer to
Report of Independent Registered Public Accounting Firm
which is included in Item 8 of Part II of this Annual Report on Form 10-K and is incorporated by reference to this Item 9A.
(b) Change in Internal Controls. There have been no changes in internal control over financial reporting that occurred during the quarter ended
December 31, 2012
, that materially affected or are reasonably likely to materially affect our internal control over financial reporting.
None.
96
Information concerning directors, appearing under the caption "III. Board of Directors" in our Proxy Statement to be filed with the SEC in connection with the Annual Meeting of Stockholders scheduled to be held on April 23, 2013 (the "Proxy Statement"), information concerning the Audit Committee, appearing under the caption "IV. Information About the Board of Directors and Corporate Governance-Committees and Independence of Directors-Audit Committee" in the Proxy Statement, information concerning the Code of Ethics, appearing under the caption "IV. Information About the Board of Directors and Corporate Governance—Corporate Governance-Code of Ethics and Business Conduct Policy" in the Proxy Statement, and information about compliance with Section 16(a) of the Securities Exchange Act of 1934 appearing under the caption "VII. Other Matters—Section 16(a) Beneficial Ownership Reporting Compliance" in the Proxy Statement, is incorporated herein by reference in response to this Item 10.
The executive officers of FMC Corporation, the offices they currently hold, their business experience since at least January 1, 2008 and their ages as of
December 31, 2012
, are as follows:
|
Name
|
Age on
12/31/2012
|
Office, year of election and other
information
|
||
|
Pierre R. Brondeau
|
55
|
President, Chief Executive Officer and Chairman of the Board (10-present); President and Chief Executive Officer of Dow Advanced Materials, a specialty materials company (08-09); President and Chief Operating Officer of Rohm and Haas Company, a predecessor of Dow Advanced Materials (07-08); Executive Vice President and Business Group Executive, Electronic Materials and Specialty Materials (03-07); Vice President and Business Group Executive, Electronic Materials, (03); President and Chief Executive Officer, Rohm and Haas Electronic Materials LLC and Regional Director, Europe, (03
);
Board Member, T.E. Connectivity Electronics (07 – Present), Marathon Oil Company (10-present)
|
||
|
Paul W. Graves
|
41
|
Executive Vice President and Chief Financial Officer (12-present); Managing Director, Goldman Sachs Group (06-12)
|
||
|
Andrea E. Utecht
|
64
|
Executive Vice President, General Counsel and Secretary (01-present); Senior Vice President, Secretary and General Counsel, Atofina Chemicals, Inc. (96-01)
|
||
|
D. Michael Wilson
|
50
|
President, Specialty Chemicals Group (11-present); Vice President and General Manager - Industrial Chemicals Group (03-10); General Manager Lithium Division (97-03); Vice President and General Manager, Technical Specialty Papers Division, Wausau Paper Corporation (96-97); Vice President Sales and Marketing, Rexam, Inc. (93-96)
|
||
|
Edward T. Flynn
|
54
|
President, Industrial Chemicals Group (12-present); General Manager Alkali Chemicals Division, President FMC Wyoming Corp. (02-12); Chief Information Officer (00-02)
|
||
|
Mark A. Douglas
|
50
|
President, Agricultural Products Group (12-present); President, Industrial Chemicals Group (11-12); Vice President, Global Operations and International Development (10-11); Vice President, President Asia, Dow Advanced Materials (09-10); Corporate Vice President, President Asia, Rohm and Haas Company (07-09); Board Member, Quaker Chemical (13-present)
|
||
|
Thomas C. Deas, Jr.
|
62
|
Vice President and Treasurer (01-present); Vice President, Treasurer and CFO, Applied Tech Products Corp. (98-01); Vice President, Treasurer and CFO, Airgas, Inc. (97-98); Vice President, Treasurer and CFO, Maritrans, Inc. (96-97); Vice President—Treasury and Assistant Treasurer, Scott Paper Company (88-96)
|
||
|
Graham R. Wood
|
59
|
Vice President, Controller (01-Present); Group Controller—Agricultural Products Group (99-01); Chief Financial Officer—European Region (97-99); Group Controller—FMC Foodtech (93-97)
|
||
All officers are elected to hold office for one year or until their successors are elected and qualified. No family relationships exist among any of the above-listed officers, and there are no arrangements or understandings between any of the above-listed officers and any other person pursuant to which they serve as an officer. The above-listed officers have not been involved in any legal proceedings during the past ten years of a nature for which the SEC requires disclosure that are material to an evaluation of the ability or integrity of any such officer.
The information contained in the Proxy Statement in the section titled “VI. Executive Compensation” with respect to executive compensation, in the section titled “IV. Information About the Board of Directors and Corporate Governance—Director Compensation” and “—Corporate Governance—Compensation Committee Interlocks and Insider Participation” is incorporated herein by reference in response to this Item 11.
97
|
ITEM 12.
|
SECURITY OWNERSHIP OF CERTAIN BENEFICIAL OWNERS AND MANAGEMENT AND RELATED STOCKHOLDER MATTERS
|
The information contained in the section titled “V. Security Ownership of FMC Corporation” in the Proxy Statement, with respect to security ownership of certain beneficial owners and management, is incorporated herein by reference in response to this Item 12.
Equity Compensation Plan Information
The table below sets forth information with respect to compensation plans under which equity securities of FMC are authorized for issuance as of
December 31, 2012
. All of the equity compensation plans pursuant to which we are currently granting equity awards have been approved by stockholders.
|
Plan Category
|
Number of Securities to
be issued upon exercise of
outstanding options and
restricted stock awards
(A) (2)
|
Weighted-
average
exercise price of
outstanding
options and
restricted stock
awards
(B) (1)
|
Number of Securities
remaining available for
future issuance under
equity compensation
plans (excluding securities
reflected in column (A))
(C)
|
|||||||
|
Equity Compensation Plans approved by stockholders
|
3,062,831
|
|
$
|
22.44
|
|
5,834,887
|
|
|||
|
(1)
|
Taking into account all outstanding awards included in this table, the weighted-average exercise price of such stock options is $22.44 and the weighted-average term-to-expiration is 4.61 years.
|
|
(2)
|
Includes 2,239,398 stock options and 703,951 restricted stock awards granted to employees and 119,482 Restricted Stock Units (RSUs) held by directors.
|
|
ITEM 13.
|
CERTAIN RELATIONSHIPS AND RELATED TRANSACTIONS, AND DIRECTOR INDEPENDENCE
|
The information contained in the Proxy Statement concerning our independent directors under the caption “IV. Information About the Board of Directors and Corporate Governance,” and the information contained in the Proxy Statement concerning our related party transactions policy, appearing under the caption “IV. Information About the Board of Directors and Corporate Governance—Corporate Governance—Related Party Transactions Policy,” is incorporated herein by reference in response to this Item 13.
98
|
ITEM 14.
|
PRINCIPAL ACCOUNTANT FEES AND SERVICES
|
The information contained in the Proxy Statement in the section titled “II. The Proposals to be Voted On—Ratification of Appointment of Independent Registered Public Accounting Firm” is incorporated herein by reference in response to this Item 14.
|
ITEM 15.
|
EXHIBITS AND FINANCIAL STATEMENT SCHEDULES
|
|
(a)
|
Documents filed with this Report
|
1. Consolidated financial statements of FMC Corporation and its subsidiaries are incorporated under Item 8 of this Form 10-K.
2. The following supplementary financial information is filed in this Form 10-K:
|
|
Page
|
|
Financial Statements Schedule II – Valuation and qualifying accounts and reserves for the years ended December 31, 2012, 2011 and 2010
|
|
The schedules not included herein are omitted because they are not applicable or the required information is presented in the financial statements or related notes.
3. Exhibits: See attached Index of Exhibits
|
(b)
|
Exhibits
|
|
Exhibit No.
|
Exhibit Description
|
|
|
(3
|
)
|
Articles of Incorporation and By-Laws
|
|
*3.1
|
|
Restated Certificate of Incorporation, as amended through April 24, 2012 (Exhibit 3.1 to FMC Corporation’s Form 10-Q filed on May 1, 2012)
|
|
*3.2
|
|
Restated By-Laws of FMC Corporation as of February 20, 2009 (Exhibit 3.2 to FMC Corporation’s Annual Report on Form 10-K filed on February 23, 2009)
|
|
(4
|
)
|
Instruments defining the rights of security holders, including indentures.
FMC Corporation undertakes to furnish to the SEC upon request, a copy of any instrument defining the rights of holders of long-term debt of FMC Corporation and its consolidated subsidiaries and for any of its unconsolidated subsidiaries for which financial statements are required to be filed.
|
|
*4.1
|
|
Indenture, dated as of November 15, 2009, by and between FMC Corporation and U.S. Bank National Association, as trustee (Exhibit 4.1 to the Current Report on Form 8-K filed on November 30, 2009).
|
|
*4.2
|
|
First Supplemental Indenture, dated as of November 30, 2009, by and between FMC Corporation and U.S. Bank National Association, as trustee (including the form of the Note) (Exhibit 4.2 to the Current Report on Form 8-K filed on November 30, 2009).
|
|
*4.3
|
|
Second Supplemental Indenture, dated as of November 17, 2011, by and between the Company and U.S. Bank National Association, as trustee (including the form of the Note) (Exhibit 4.2 to the Current Report on Form 8-K filed on November 17, 2011).
|
|
(10
|
)
|
Material contracts
|
|
*10.1
|
|
Credit Agreement, dated as of August 5, 2011, among FMC Corporation and certain Foreign Subsidiaries, the Lenders and Issuing Banks Parties Thereto, Citibank, N.A., as Administrative Agent, Citigroup Global Markets Inc. and Merrill Lynch, Pierce, Fenner & Smith Incorporated, as Joint Lead Arrangers, Bank of America, N.A., as Syndication Agent, DNB NOR Bank ASA, The Bank of Tokyo-Mitsubishi UFJ, Ltd., and Sumitomo Mitsui Banking Corp., as Co-Documentation Agents, and DNB NOR Bank ASA, The Bank of Tokyo-Mitsubishi UFJ, Ltd., Sumitomo Mitsui Banking Corp., BNP Paribas, HSBC Bank USA, National Association, and U.S. Bank, National Association, as Co-Senior Managing Agents (Exhibit 10.1 to FMC Corporation's Current Report on Form 8-K filed on August 8, 2011)
|
|
*10.2
|
|
Asset Purchase Agreement among FMC Corporation, Solutia Inc., Astaris LLC, Israel Chemicals Limited and ICL Performance Products Holding Inc., dated as of September 1, 2005 (Exhibit 10 to FMC Corporation’s Quarterly Report on Form 10-Q/A filed on November 8, 2005)
|
99
|
Exhibit No.
|
Exhibit Description
|
|
†*10.3
|
FMC Corporation Compensation Plan for Non-Employee Directors As Amended and Restated Effective February 20, 2009 (Exhibit 10.4 to FMC Corporation’s Annual Report on Form 10-K filed on February 23, 2009)
|
|
†*10.3.a
|
Non-Employee Director Restricted Stock Unit Award Agreement (Exhibit 10.4.a to FMC Corporation’s Annual Report on Form 10-K filed on February 23, 2009)
|
|
†*10.3.b
|
Non-Employee Director Restricted Stock Unit Award Agreement (Exhibit 10.4.b to FMC Corporation’s Annual Report on Form 10-K filed on February 23, 2009)
|
|
†*10.4
|
FMC Corporation Salaried Employees’ Equivalent Retirement Plan, as amended and restated effective as of January 1, 2009 (Exhibit 10.5 to FMC Corporation’s Annual Report on Form 10-K filed on February 23, 2009)
|
|
†*10.5
|
FMC Corporation Salaried Employees’ Equivalent Retirement Plan Grantor Trust, as amended and restated effective as July 31, 2001 (Exhibit 10.6.a to FMC Corporation’s Quarterly Report on Form 10-Q filed on November 7, 2001)
|
|
†*10.6
|
FMC Corporation Non-Qualified Savings and Investment Plan, as adopted by the Company on December 17, 2008 (Exhibit 10.7 to FMC Corporation’s Annual Report on Form 10-K filed on February 23, 2009)
|
|
†*10.7
|
FMC Corporation Non-Qualified Savings and Investment Plan Trust, as amended and restated effective as of September 28, 2001 (Exhibit 10.7.a to FMC Corporation’s Quarterly Report on Form 10-Q filed on November 7, 2001)
|
|
†* 10.7.a
|
First Amendment to FMC Corporation Non-Qualified Savings and Investment Plan Trust between Fidelity Management Trust Company and FMC Corporation, effective as of October 1, 2003 (Exhibit 10.15a to FMC Corporation’s Annual Report on Form 10-K filed on March 11, 2004)
|
|
†* 10.7.b
|
Second Amendment to FMC Corporation Non-Qualified Savings and Investment Plan Trust, effective as of January 1, 2004 (Exhibit 10.12b to FMC Corporation’s Annual Report on Form 10-K filed on March 14, 2005)
|
|
†*10.7.c
|
Third Amendment to FMC Corporation Non-Qualified Savings and Investment Plan Trust between Fidelity Management Trust Company and FMC Corporation, effective as of February 14, 2005 (Exhibit 10.8.c to FMC Corporation’s Annual Report on Form 10-K filed on February 23, 2009)
|
|
†*10.7.d
|
Fourth Amendment to FMC Corporation Non-Qualified Savings and Investment Plan Trust between Fidelity Management Trust Company and FMC Corporation, effective as of July 1, 2005 (Exhibit 10.8.d to FMC Corporation’s Annual Report on Form 10-K filed on February 23, 2009)
|
|
†*10.7.e
|
Fifth Amendment to FMC Corporation Non-Qualified Savings and Investment Plan Trust between Fidelity Management Trust Company and FMC Corporation, effective as of April 23, 2008 (Exhibit 10.8.e to FMC Corporation’s Annual Report on Form 10-K filed on February 23, 2009)
|
|
†10.8
|
FMC Corporation Incentive Compensation and Stock Plan as amended and restated through February 18, 2013
|
|
†10.8a
|
Form of Employee Restricted Stock Unit Agreement Pursuant to the FMC Corporation Incentive Compensation and Stock Plan
|
|
†10.8b
|
Form of Nonqualified Stock Option Agreement Pursuant to the FMC Corporation Incentive Compensation and Stock Plan
|
|
†10.8c
|
Form of Key Manager Restricted Stock Agreement Pursuant to the FMC Corporation Incentive Compensation and Stock Plan
|
|
†*10.9
|
FMC Corporation Executive Severance Plan, as amended and restated effective as of January 1, 2009 (Exhibit 10.10 to FMC Corporation’s Annual Report on Form 10-K filed on February 23, 2009)
|
|
†*10.10
|
FMC Corporation Executive Severance Grantor Trust Agreement, dated July 31, 2001 (Exhibit 10.10.a to FMC Corporation’s Quarterly Report on Form 10-Q filed on November 7, 2001)
|
100
|
Exhibit No.
|
Exhibit Description
|
|
†*10.11
|
Amended and Restated Executive Severance Agreement, dated November 6, 2012, between FMC Corporation and Pierre Brondeau. (Exhibit 10.2 to FMC Corporation's Current Report on Form 8-K filed on November 9, 2012) Pursuant to Instruction 2 to Item 601 of Regulation S-K, an Amended and Restated Executive Severance Agreement that is substantially identical in all material respects, except as to the parties thereto, between the Company and Mark A. Douglas was not filed.
|
|
†*10.12
|
Amended and Restated Executive Severance Agreement, dated November 6, 2012, between FMC Corporation and D. Michael Wilson. (Exhibit 10.4 to FMC Corporation's Current Report on Form 8-K filed on November 9, 2012) Pursuant to Instruction 2 to Item 601 of Regulation S-K, an Amended and Restated Executive Severance Agreement that is substantially identical in all material respects, except as to the parties thereto, between the Company and Andrea Utecht, was not filed.
|
|
†10.13
|
Amended and Restated Executive Severance Agreement, entered into as of November 6, 2012, by and between FMC Corporation and Graham R. Wood. Pursuant to Instruction 2 to Item 601 of Regulation S-K, an Amended and Restated Executive Severance Agreement that is substantially identical in all material respects, except as to the parties thereto, between the Company and Thomas C. Deas, Jr. was not filed.
|
|
†10.14
|
Amended and Restated Executive Severance Agreement, entered into as of November 6, 2012, by and between FMC Corporation and Edward T. Flynn.
|
|
*10.15
|
Joint Venture Agreement between FMC Corporation and Solutia Inc., made as of April 29, 1999 (Exhibit 2.I to Solutia’s Current Report on Form 8-K filed on April 27, 2000)
|
|
*10.15.a
|
First Amendment to Joint Venture Agreement between FMC Corporation and Solutia Inc., effective as of December 29, 1999 (Exhibit 2.II to Solutia’s Current Report on Form 8-K filed on April 27, 2000)
|
|
*10.15.b
|
Second Amendment to Joint Venture Agreement between FMC Corporation and Solutia Inc., effective as of February 2, 2000 (Exhibit 2.III to Solutia’s Current Report on Form 8-K filed on April 27, 2000)
|
|
*10.15.c
|
Third Amendment to Joint Venture Agreement between FMC Corporation and Solutia Inc., effective as of March 31, 2000 (Exhibit 2.IV to Solutia’s Current Report on Form 8-K filed on April 27, 2000)
|
|
*10.15.d
|
Fourth Amendment to Joint Venture Agreement between FMC Corporation and Solutia Inc., dated November 4, 2005 (Exhibit 10 to FMC Corporation’s Current Report on Form 8-K filed on November 9, 2005)
|
|
*10.16
|
Separation and Distribution Agreement by and between FMC Corporation and FMC Technologies, Inc., dated as of May 31, 2001 (Exhibit 2.1 to Form S-1/A for FMC Technologies, Inc. (Registration No. 333-55920) filed on June 6, 2001)
|
|
†*10.17
|
Letter Agreement dated October 23, 2009 between FMC Corporation and Pierre Brondeau (Exhibit 10.18 to FMC Corporation’s Annual Report on Form 10-K filed on February 22, 2010)
|
|
†*10.17.a
|
Amendment to October 23, 2009 Letter Agreement, dated November 6, 2012, between FMC Corporation and Pierre Brondeau. (Exhibit 10.1 to FMC Corporation’s Current Report on Form 8-K filed on November 9, 2012)
|
|
†*10.18
|
Offer Letter dated July 24, 2012 between FMC Corporation and Paul W. Graves (Exhibit 10 to FMC Corporation’s Quarterly Report on Form 10-Q filed on October 31, 2012)
|
|
†*10.19
|
Executive Severance Agreement, dated November 6, 2012, between FMC Corporation and Paul W. Graves. (Exhibit 10.3 to FMC Corporation’s Current Report on Form 8-K filed on November 9, 2012)
|
101
|
Exhibit No.
|
Exhibit Description
|
|
|
12
|
|
Computation of Ratios of Earnings to Fixed Charges
|
|
21
|
|
FMC Corporation List of Significant Subsidiaries
|
|
23.1
|
|
Consent of KPMG LLP
|
|
31.1
|
|
Chief Executive Officer Certification
|
|
31.2
|
|
Chief Financial Officer Certification
|
|
32.1
|
|
Chief Executive Officer Certification of Annual Report
|
|
32.2
|
|
Chief Financial Officer Certification of Annual Report
|
|
95
|
|
Mine Safety Disclosures
|
|
101
|
|
Interactive Data File
|
* Incorporated by reference
† Management contract or compensatory plan or arrangement
102
SIGNATURES
Pursuant to the requirements of Section 13 or 15(d) of the Securities Exchange Act of 1934, the Registrant has duly caused this report to be signed on its behalf by the undersigned, thereunto duly authorized.
FMC CORPORATION
(Registrant)
|
By:
|
/S/ P
AUL
W. G
RAVES
|
|
Paul W. Graves
Executive Vice President and
Chief Financial Officer
|
|
Date:
February 19, 2013
Pursuant to the requirements of the Securities Exchange Act of 1934, this report has been signed below by the following persons on behalf of the Registrant and in the capacities and on the date indicated.
|
Signature
|
Title
|
Date
|
|
/S/ P
AUL
W. G
RAVES
Paul W. Graves
|
Executive Vice President and
Chief Financial Officer
|
February 19, 2013
|
|
/S/ G
RAHAM
R. W
OOD
Graham R. Wood
|
Vice President, Controller
(Principal Accounting Officer)
|
February 19, 2013
|
|
/S/ P
IERRE
R. B
RONDEAU
Pierre R. Brondeau
|
President, Chief Executive
Officer and Chairman of the Board
|
February 19, 2013
|
|
/S/ G. P
ETER
D’A
LOIA
G. Peter D’Aloia
|
Director
|
February 19, 2013
|
|
/S/ E
DUARDO
E. C
ORDEIRO
Eduardo E. Cordeiro
|
Director
|
February 19, 2013
|
|
/S/ C. S
COTT
G
REER
C. Scott Greer
|
Director
|
February 19, 2013
|
|
/S/ D
IRK
A. K
EMPTHORNE
Dirk A. Kempthorne
|
Director
|
February 19, 2013
|
|
/S/ E
DWARD
J. M
OONEY
Edward J. Mooney
|
Director
|
February 19, 2013
|
|
/S/ P
AUL
J. N
ORRIS
Paul J. Norris
|
Director
|
February 19, 2013
|
|
/S/ R
OBERT
C. P
ALLASH
Robert C. Pallash
|
Director
|
February 19, 2013
|
|
/S/ V
INCENT
R. V
OLPE
, J
R
.
Vincent R. Volpe, Jr.
|
Director
|
February 19, 2013
|
|
/S/
W
ILLIAM
H. P
OWELL
William H. Powell
|
Director
|
February 19, 2013
|
103
INDEX OF EXHIBITS FILED WITH THE
FORM 10-K OF FMC CORPORATION
FOR THE YEAR ENDED
DECEMBER 31, 2012
|
Exhibit No.
|
Exhibit Description
|
|
10.8
|
FMC Corporation Incentive Compensation and Stock Plan as amended and restated through February 18, 2013
|
|
10.8a
|
Form of Employee Restricted Stock Unit Agreement Pursuant to the FMC Corporation Incentive Compensation and Stock Plan
|
|
10.8b
|
Form of Nonqualified Stock Option Agreement Pursuant to the FMC Corporation Incentive Compensation and Stock Plan
|
|
10.8c
|
Form of Key Manager Restricted Stock Agreement Pursuant to the FMC Corporation Incentive Compensation and Stock Plan
|
|
10.13
|
Amended and Restated Executive Severance Agreement, entered into as of November 6, 2012, by and between FMC Corporation and Graham R. Wood. Pursuant to Instruction 2 to Item 601 of Regulation S-K, an Amended and Restated Executive Severance Agreement that is substantially identical in all material respects, except as to the parties thereto, between the Company and Thomas C. Deas, Jr. was not filed.
|
|
10.14
|
Amended and Restated Executive Severance Agreement, entered into as of November 6, 2012, by and between FMC Corporation and Edward T. Flynn
|
|
12
|
Computation of Ratios of Earnings to Fixed Charges
|
|
21
|
FMC Corporation List of Significant Subsidiaries
|
|
23.1
|
Consent of KPMG LLP
|
|
31.1
|
Chief Executive Officer Certification
|
|
31.2
|
Chief Financial Officer Certification
|
|
32.1
|
Chief Executive Officer Certification of Annual Report
|
|
32.2
|
Chief Financial Officer Certification of Annual Report
|
|
95
|
Mine Safety Disclosures
|
|
101
|
Interactive Data File
|
104
TABLE OF CONTENTS
Part IItem 1. BusinessItem 1A. Risk FactorsItem 1B. Unresolved Staff CommentsItem 2. PropertiesItem 3. Legal ProceedingsItem 4. Mine Safety DisclosuresPart IIItem 5. Market For The Registrant's Common Equity, Related Stockholders Matters and Issuer Purchases Of Equity SecuritiesItem 6. Selected Financial DataItem 7. Management's Discussion and Analysis Of Financial Condition and Results Of OperationsItem 7A. Quantitative and Qualitative Disclosures About Market RiskItem 8. Financial Statements and Supplementary DataNote 1: Principal Accounting Policies and Related Financial InformationNote 2: Recently Issued and Adopted Accounting Pronouncements and Regulatory ItemsNote 3: AcquisitionsNote 4: Goodwill and Intangible AssetsNote 5: InventoriesNote 6: Property, Plant and EquipmentNote 7: Restructuring and Other Charges (income)Note 8: Asset Retirement ObligationsNote 9: Discontinued OperationsNote 10: Environmental ObligationsNote 11: Income TaxesNote 12: DebtNote 13: Pension and Other Postretirement BenefitsNote 14: Share-based CompensationNote 15: EquityNote 16: Earnings Per ShareNote 17: Financial Instruments, Risk Management and Fair Value MeasurementsNote 18: Guarantees, Commitments, and ContingenciesNote 19: Segment InformationNote 20: Supplemental InformationNote 21: Quarterly Financial Information (unaudited)Item 9. Changes in and Disagreements with Accountants on Accounting and Financial DisclosureItem 9A. Controls and ProceduresItem 9B. Other InformationPart IIIItem 10. Directors, Executive Officers and Corporate GovernanceItem 11. Executive CompensationItem 12. Security Ownership Of Certain Beneficial Owners and Management and Related Stockholder MattersItem 13. Certain Relationships and Related Transactions, and Director IndependenceItem 14. Principal Accountant Fees and ServicesPart IVItem 15. Exhibits and Financial Statement Schedules