FMC CORP
10-Ks and 10-Qs
|
|
|
|
|
|
|
|
|
|
|
|
|
|
|
|
|
|
|
|
|
|
|
|
|
|
|
|
|
|
|
|
|
|
|
|
|
|
|
|
|
|
|
|
|
|
|
|
|
|
|
|
|
|
|
|
UNITED STATES
SECURITIES AND EXCHANGE COMMISSION
Washington, D.C. 20549
_______________________________________________________________________
FORM 10-K
_______________________________________________________________________
|
X
|
Annual Report Pursuant to Section 13 or 15(d) of the Securities Exchange Act of 1934
|
For the fiscal year ended
December 31, 2018
or
|
Transition Report Pursuant to Section 13 or 15(d) of the Securities Exchange Act of 1934
|
|
For the transition period from _______ to _______
Commission File Number 1-2376
__________________________________________________________________________
FMC CORPORATION
(Exact name of registrant as specified in its charter)
__________________________________________________________________________
|
Delaware
|
|
94-0479804
|
|
(State or other jurisdiction of
incorporation or organization)
|
|
(I.R.S. Employer
Identification No.)
|
|
2929 Walnut Street
Philadelphia, Pennsylvania
|
|
19104
|
|
(Address of principal executive offices)
|
|
(Zip Code)
|
Registrant’s telephone number, including area code: 215-299-6000
__________________________________________________________________________
Securities registered pursuant to Section 12(b) of the Act:
|
Title of each class
|
|
Name of each exchange on which registered
|
|
Common Stock, $0.10 par value
|
|
New York Stock Exchange
|
Securities registered pursuant to Section 12(g) of the Act:
None
Indicate by check mark if the registrant is a well-known seasoned issuer, as defined in Rule 405 of the Securities Act.
YES
x
NO
¨
Indicate by check mark if the registrant is not required to file reports pursuant to Section 13 or Section 15(d) of the Act.
YES
¨
NO
x
Indicate by check mark whether the registrant (1) has filed all reports required to be filed by Section 13 or 15(d) of the Securities Exchange Act of 1934 during the preceding 12 months (or for such shorter period that the registrant was required to file such reports), and (2) has been subject to such filing requirements for the past 90 days.
YES
x
NO
¨
Indicate by check mark whether the registrant has submitted electronically every Interactive Data File required to be submitted pursuant to Rule 405 of Regulation S-T (§ 232.405 of this chapter) during the preceding 12 months (or for such shorter period that the registrant was required to submit such files).
YES
x
NO
¨
Indicate by check mark if disclosure of delinquent filers pursuant to Item 405 of Regulation S-K (§ 229.405 of this chapter) is not contained herein, and will not be contained, to the best of registrant’s knowledge, in definitive proxy or information statements incorporated by reference in Part III of this Form 10-K or any amendment to this Form 10-K.
¨
Indicate by check mark whether the registrant is a large accelerated filer, an accelerated filer, a non-accelerated filer, a smaller reporting company, or an emerging growth company. See the definitions of "large accelerated filer," "accelerated filer," "smaller reporting company," and "emerging growth company" in Rule 12b-2 of the Exchange Act.
|
Large accelerated filer
|
|
X
|
|
Accelerated filer
|
|
|
|
Non-accelerated filer
|
|
|
Smaller reporting company
|
|
||
|
Emerging growth company
|
|
|||||
|
If an emerging growth company, indicate by check mark if the registrant has elected not to use the extended transition period for complying with any new or revised financial accounting standards provided pursuant to Section 13(a) of the Exchange Act.
|
||||||
|
o
|
||||||
Indicate by check mark whether the registrant is a shell company (as defined in Rule 12b-2 of the Exchange Act) YES
¨
NO
x
The aggregate market value of voting stock held by non-affiliates of the registrant as of June 30,
2018
, the last day of the registrant’s second fiscal quarter was
$11,914,150,346
. The market value of voting stock held by non-affiliates excludes the value of those shares held by executive officers and directors of the registrant.
Indicate the number of shares outstanding of each of the issuer’s classes of common stock, as of the latest practicable date:
|
Class
|
|
December 31, 2018
|
|
Common Stock, par value $0.10 per share
|
|
132,281,614
|
DOCUMENTS INCORPORATED BY REFERENCE
|
DOCUMENT
|
|
FORM 10-K REFERENCE
|
|
Portions of Proxy Statement for 2019 Annual Meeting of Stockholders
|
|
Part III
|
FMC Corporation
2018
Form 10-K
Table of Contents
|
|
Page
|
3
PART I
FMC Corporation was incorporated in 1928 under Delaware law and has its principal executive offices at 2929 Walnut Street, Philadelphia, Pennsylvania 19104. Throughout this annual report on Form 10-K, except where otherwise stated or indicated by the context, “FMC”, the "Company", “We,” “Us,” or “Our” means FMC Corporation and its consolidated subsidiaries and their predecessors. Copies of the annual, quarterly and current reports we file with the Securities and Exchange Commission (“SEC”), and any amendments to those reports, are available on our website at
www.fmc.com
as soon as practicable after we furnish such materials to the SEC.
|
ITEM 1.
|
BUSINESS
|
General
We are a diversified chemical company serving agricultural, consumer and industrial markets globally with innovative solutions, applications and market-leading products. We operate in two distinct business segments: FMC Agricultural Solutions and FMC Lithium. Our FMC Agricultural Solutions segment develops, markets and sells all three major classes of crop protection chemicals: insecticides, herbicides and fungicides. These products are used in agriculture to enhance crop yield and quality by controlling a broad spectrum of insects, weeds and disease, as well as in non-agricultural markets for pest control. Our FMC Lithium segment manufactures lithium for use in a wide range of lithium products, which are used primarily in energy storage, specialty polymers and chemical synthesis application.
FMC Lithium (Livent Corporation)
In March 2017, we announced our intention to separate our FMC Lithium segment (subsequently renamed Livent Corporation, or "Livent") into a publicly traded company. The initial step of the separation, the initial public offering ("IPO") of Livent, closed on October 15, 2018. In connection with the IPO, Livent had granted the underwriters an option to purchase additional shares of common stock to cover over-allotments at the IPO price, less the underwriting discount. On November 8, 2018, the underwriters exercised in full their option to purchase additional shares. After completion of the IPO and the underwriters' exercise to purchase additional shares of common stock, FMC owned 123 million shares of Livent's common stock, representing approximately 84 percent of the total outstanding shares of Livent's common stock. FMC presently intends to distribute the remaining Livent shares to FMC stockholders (the "Distribution") on March 1, 2019. We will continue to consolidate and present Livent as the FMC Lithium segment until the full separation date. At that time, results of FMC Lithium will be presented as a discontinued operation.
DuPont Crop Protection Business
On March 31, 2017, we entered into a definitive Transaction Agreement (the “Transaction Agreement”) with E. I. du Pont de Nemours and Company (“DuPont"). On November 1, 2017, pursuant to the terms and conditions set forth in the Transaction Agreement, we completed the acquisition of certain assets relating to DuPont's Crop Protection business and research and development organization ("DuPont Crop Protection Business") (collectively, the "DuPont Crop Protection Business Acquisition"). In connection with this transaction, we sold to DuPont our FMC Health and Nutrition segment and paid DuPont $1.2 billion in cash. Our FMC Health and Nutrition business and its results have been presented as a discontinued operation for all periods presented throughout this document.
FMC Strategy
FMC has streamlined its portfolio over the past eight years to focus on technology-driven end markets with attractive long-term demand trends. The actions we have taken over the past year have better positioned each of our businesses to capitalize on future growth opportunities.
2018 was another pivotal year for FMC, as we made substantial progress toward integrating the recently acquired DuPont Crop Protection Business into FMC Agricultural Solutions and toward separating our Lithium business into a standalone public company, Livent Corporation. Our Agricultural Solutions segment grew revenue by 11 percent, on a pro forma basis, due to robust demand for our acquired insecticides, Rynaxypr® and Cyazypyr ® insect control, and broad cross-selling opportunities for all our products around the world. Rynaxypr® is now the second largest active ingredient in the crop protection market. We also launched 30 new formulated products in 2018, which is key to life cycle management of our products. We far outperformed the crop protection market, which we estimate grew by just 2 to 3 percent in 2018. FMC will begin launching its technology pipeline of six new active ingredients, starting with our bixafen fungicide launch - under the Lucento brand - in North America in the first quarter of 2019.
The November 2017 acquisition of a significant portion of the DuPont Crop Protection Business transformed FMC into a tier-one leader and the fifth largest global provider in the agricultural chemicals market. The acquisition included DuPont’s industry-leading insecticides and herbicides (the majority of which are patented technologies), exceptional discovery research capabilities and a global manufacturing network. The acquisition also added 16 discovery leads to our pipeline, and we expect to spend approximately
4
7 percent of FMC Agricultural Solutions sales on research and development annually. FMC acquired 14 manufacturing plants from DuPont, and with 26 total plants today, we have the scale to operate this business with greater resources and global reach to address changing market conditions.
Livent Corporation, which is approximately 84 percent owned by FMC, is one of the leading global producers of specialty lithium products, and 2018 was another year of significant growth for the company's lithium products. As an independent company, Livent will have a focused investor base and strong balance sheet, ensuring it has the financial capacity to pursue its growth plans and be a leading force in this critical industry. We made several strategic decisions during the last few years to focus FMC Lithium on downstream, higher-value products. We convert most of our lithium carbonate and chloride production into high-purity materials, including lithium hydroxide used in electric vehicle ("EV") batteries, and butyllithium and lithium metals for specialty applications. In 2018, we had a full year of sales from our lithium hydroxide plant that we opened in China in the second half of 2017. That plant can produce 10,000 metric tons per year, in addition to the 10,000 metric tons of annual production capacity at our Bessemer City, NC plant, to meet accelerating demand for FMC’s hydroxide products.
We maintain our commitment to enterprise sustainability, including responsible stewardship. As we grow, we will do so in a responsible way. Safety and business ethics will remain of utmost importance. Meeting and exceeding our customers’ expectations will continue to be a primary focus.
Financial Information About Our Business Segments
(
Financial Information in Millions)
See Note 20 "Segment Information" to our consolidated financial statements included in this Form 10-K. Also see below for selected financial information related to our segments.
The following table shows the principal products produced by our two business segments, their raw materials and uses:
|
Segment
|
Product
|
Raw Materials
|
Uses
|
|
FMC Agricultural Solutions
|
Insecticides
|
Synthetic chemical intermediates
|
Protection of crops, including soybean, corn, fruits and vegetables, cotton, sugarcane, rice, and cereals, from insects and for non-agricultural applications including pest control for home, garden and other specialty markets
|
|
Herbicides
|
Synthetic chemical intermediates
|
Protection of crops, including cotton, sugarcane, rice, corn, soybeans, cereals, fruits and vegetables from weed growth and for non-agricultural applications including turf and roadsides
|
|
|
Fungicides
|
Synthetic and biological chemical intermediates
|
Protection of crops, including fruits and vegetables from fungal disease
|
|
|
FMC Lithium
|
Lithium
|
Various lithium products
|
Batteries, polymers, pharmaceuticals, greases and lubricants, glass and ceramics and other industrial uses
|
With a worldwide manufacturing and distribution infrastructure, we are better able to respond rapidly to global customer needs, offset downward economic trends in one region with positive trends in another and match local revenues to local costs to reduce the impact of currency volatility. The charts below detail our sales and long-lived assets by major geographic region.

5
FMC Agricultural Solutions

Overview
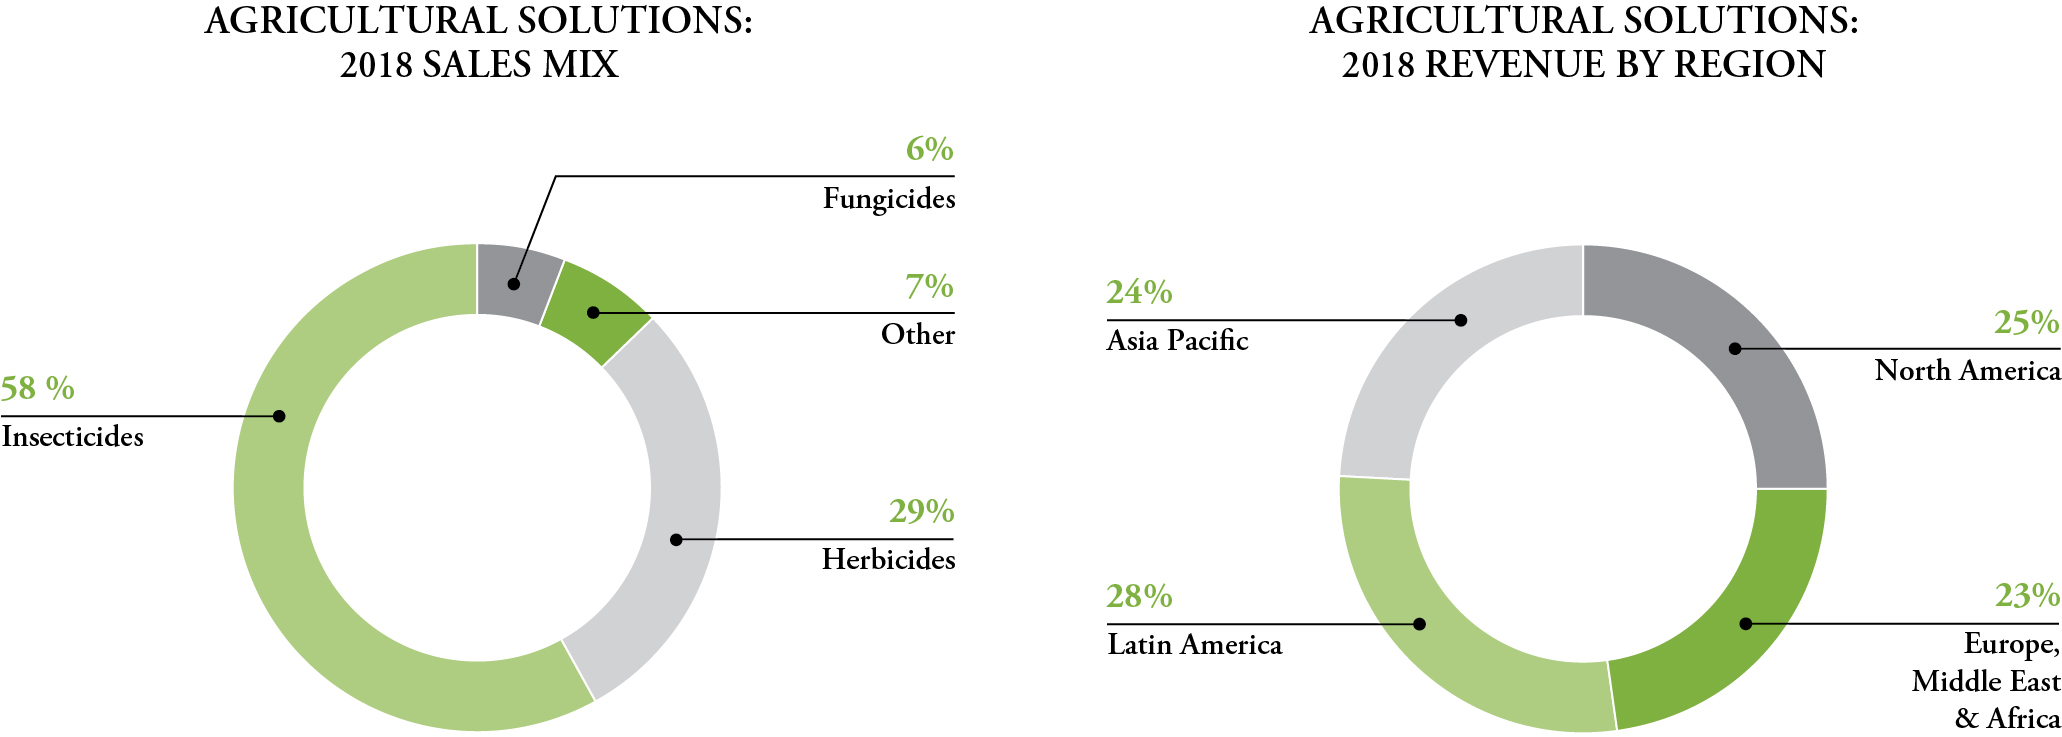
Our FMC Agricultural Solutions segment, which represents approximately
91 percent
of our
2018
consolidated revenues, operates in the agrochemicals industry. This segment develops, manufactures and sells a portfolio of crop protection, professional pest control and lawn and garden products.
Products and Markets
FMC Agricultural Solutions' portfolio is comprised of three major pesticide categories: insecticides, herbicides and fungicides. The majority of our product lines consist of insecticides and herbicides, and we have a small but fast-growing portfolio of fungicides mainly used in high value crop segments. Our insecticides are used to control a wide spectrum of pests, while our herbicide portfolio primarily targets a large variety of difficult-to-control weeds. We are also investing substantially in a plant health program that includes biological crop protection products, seed treatments and micro-nutrients.
In the Latin American region, which includes the large agricultural market of Brazil, we sell directly to large growers through our own sales and marketing organization, and we access the market through independent distributors and co-ops. In North America,
6
we access the market through several major national and regional distributors and have our own sales and marketing organization in Canada. We access the European markets through our own sales and marketing organizations. With the 2017 acquisition of the DuPont Crop Protection Business, we now access key Asian markets through large distributors, in addition to either local independent distributors or our own sales and marketing organizations. Through these and other alliances, along with our own targeted marketing efforts, access to novel technologies and our innovation initiatives, we expect to maintain and enhance our access in key agricultural and non-crop markets and develop new products that will help us continue to compete effectively.
Industry Overview
The three principal categories of agricultural and non-crop chemicals are: herbicides, insecticides and fungicides, representing approximately 43 percent, 25 percent and 29 percent of global industry revenue, respectively.
The agrochemicals industry is more consolidated following several recent mergers of the leading crop protection companies, which now include FMC, ChemChina (owners of Syngenta and Adama), Bayer AG (acquired Monsanto in 2018), BASF AG and DowDuPont (Corteva Agriscience, the agricultural division of DowDuPont, is expected to be spun out in June 2019). These five companies currently represent approximately 74 percent of the crop protection industry’s global sales. The next tier of agrochemical producers include Sumitomo Chemical Company Ltd., Nufarm Ltd. and United Phosphorous Ltd. (UPL also acquired Arysta on February 1, 2019). FMC employs various differentiated strategies and competes with unique technologies focusing on certain crops, markets and geographies, while also being supported by a low-cost manufacturing model.
Growth
The 2017 acquisition of a significant portion of the DuPont Crop Protection Business positions FMC among leading agrochemical producers in the world. The acquired insecticides are predominantly based on patent-protected active ingredients and are growing well above market patterns. Our complementary technologies combine improved formulation capabilities and a broader innovation pipeline, resulting in new and differentiated products. We will take advantage of enhanced market access positions and an expanded portfolio to deliver near-term growth.
We will continue to grow by obtaining new and approved uses for existing product lines and acquiring, accessing, developing, marketing, distributing and/or selling complementary chemistries and related technologies in order to strengthen our product portfolio and our capabilities to effectively service our target markets and customers.
Our growth efforts focus on developing environmentally compatible and sustainable solutions that can effectively increase farmers’ yields and provide cost-effective alternatives to chemistries which may be prone to resistance. We are committed to providing unique, differentiated products to our customers by acquiring and further developing technologies as well as investing in innovation to extend product life cycles. Our external growth efforts include product acquisitions, in-licensing of chemistries and technologies and alliances that bolster our market access, complement our existing product portfolio or provide entry into adjacent spaces. We have entered into a range of development and distribution agreements with other companies that provide access to new technologies and products which we can subsequently commercialize.
FMC Lithium
7
Overview

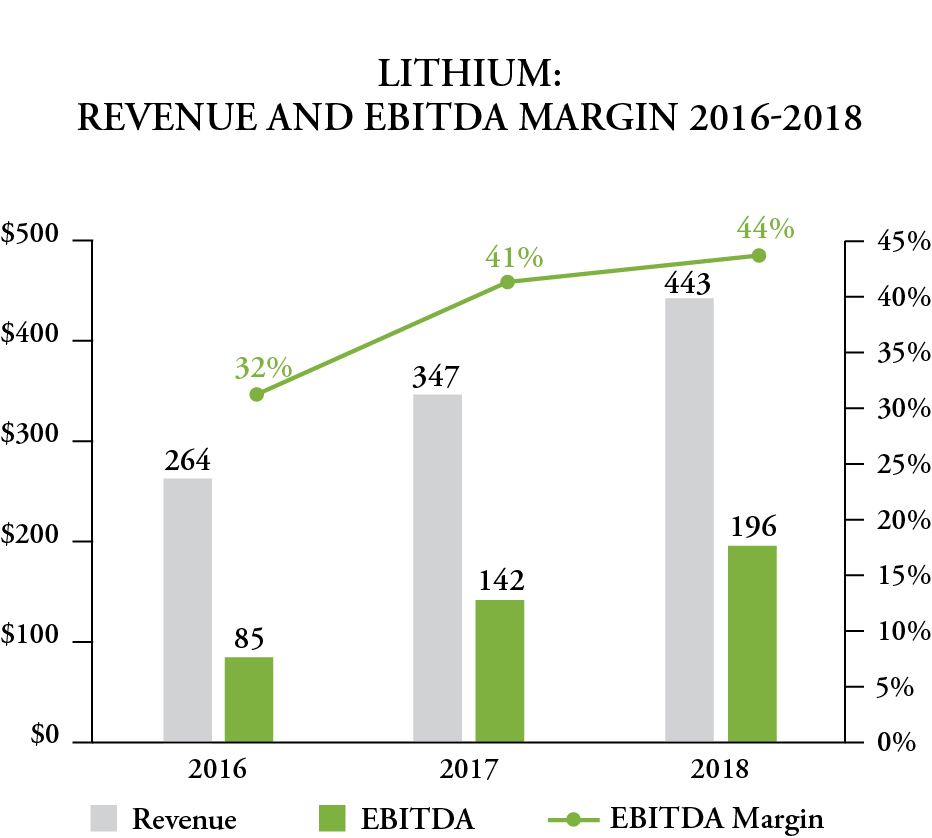
Our FMC Lithium segment represents
9 percent
of our
2018
consolidated revenues.
FMC Lithium is a pure-play, fully integrated lithium company, with a long, proven history of producing performance lithium compounds. Our primary products, namely battery-grade lithium hydroxide, butyllithium and high purity lithium metal are critical inputs used in various performance applications. Our strategy is to focus on supplying high performance lithium compounds to the fast growing EV battery market, while continuing to maintain our position as a leading global producer of butyllithium and high purity lithium metal. With extensive global capabilities, over 60 years of continuous production experience, applications and technical expertise and deep customer relationships, we believe we are well positioned to capitalize on the accelerating trend of vehicle electrification.
FMC Lithium produces lithium compounds for use in applications that have specific performance requirements, including battery-grade lithium hydroxide for use in high performance lithium-ion batteries. We believe the demand for our compounds will continue to grow as the electrification of transportation accelerates, and as the use of high nickel content cathode materials increases in the next generation of battery technology products. We also supply butyllithium, which is used as a synthesizer in the production of polymers and pharmaceutical products, as well as a range of specialty lithium compounds including high purity lithium metal, which is used in the production of lightweight materials for aerospace applications and non-rechargeable batteries. It is in these applications that we have established a differentiated position in the market through our ability to consistently produce and deliver performance lithium compounds.
Industry Overview
Lithium is a soft, naturally occurring, silvery-white metal that is widely used in a range of energy storage and industrial applications. Lithium is the lightest of all metals and has the highest specific heat capacity among all elements, a high charge density and low thermal expansion properties, enabling high-performance characteristics in end use applications that could not otherwise be achieved. These unique chemical and physical properties make it ideally suited for use in a variety of commercial applications.
Prior to 2000, lithium was primarily used in a wide range of industrial market applications, including air treatment, ceramics, glass, greases, metallurgy, non-rechargeable batteries, pharmaceuticals and polymers.
Lithium’s use in energy storage applications accelerated in the 1990’s with the introduction of a commercially viable, rechargeable, lithium-ion battery. Lithium-ion battery technology provided a more efficient, longer-lasting and lighter alternative to incumbent battery technologies. The introduction and adoption of portable electronic devices over the past two decades fueled the initial growth in demand for lithium compounds in energy storage applications. In recent years, advancements in lithium-ion battery technology have resulted in increased adoption of lithium-ion batteries for use in powering EVs.
Source and Availability of Raw Materials
Raw materials used by FMC Agricultural Solutions, primarily processed chemicals, are obtained from a variety of suppliers worldwide. Our primary raw material used by FMC Lithium is lithium, which we extract through solar evaporation and a proprietary process from naturally occurring lithium-rich brines located in the Andes Mountains of Argentina.
8
Patents
We own and license a significant number of U.S. and foreign patents, trademarks, trade secrets and other intellectual property that are cumulatively important to our business. The FMC intellectual property estate provides us with an important competitive advantage. Our patents cover many of our products, processes and product uses as well as many aspects of our research and development activities supporting the FMC new product pipeline. Patents are granted by individual jurisdictions and the duration of our patents depends on their respective jurisdictions and payment of annuities. We also own many trademarks that are well recognized by customers or product end-users. Unlike patents, ownership rights in trademarks can be continued indefinitely so long as the trademarks are properly used and renewal fees are paid. We actively monitor and manage our patents and trademarks to maintain our rights in these assets. We believe that the invalidity or loss of any particular patent, trademark or license would be a remote possibility and/or would not likely have a material adverse effect on the overall business of FMC.
Seasonality
The seasonal nature of the crop protection market and the geographic spread of the FMC Agricultural Solutions business can result in significant variations in quarterly earnings among geographic locations. FMC Agricultural Solutions' products sold in the northern hemisphere (North America, Europe and parts of Asia) serve seasonal agricultural markets from March through September, generally resulting in significant earnings in the first and second quarters, and to a lesser extent in the fourth quarter. Markets in the southern hemisphere (Latin America and parts of the Asia Pacific region, including Australia) are served from July through February, generally resulting in earnings in the third, fourth and first quarters. The remainder of our business is generally not subject to significant seasonal fluctuations.
Competition
We encounter substantial competition in each of our two business segments. We market our products through our own sales organization and through alliance partners, independent distributors and sales representatives. The number of our principal competitors varies from segment to segment. In general, we compete by providing advanced technology, high product quality, reliability, quality customer and technical service, and by operating in a cost-efficient manner.
Our FMC Agricultural Solutions segment competes primarily in the global chemical crop protection market for insecticides, herbicides and fungicides. Industry products include crop protection chemicals and, for certain major competitors, genetically engineered (crop biotechnology) products. Competition from generic agrochemical producers is significant as a number of key product patents have expired in the last decade. In general, we compete as an innovator by focusing on product development, including novel formulations, proprietary mixes, and advanced delivery systems and by acquiring or licensing (mostly) proprietary chemistries or technologies that complement our product and geographic focus. We also differentiate ourselves by our global cost-competitiveness through our manufacturing strategies, establishing effective product stewardship programs and developing strategic alliances that strengthen market access in key countries and regions.
FMC Lithium sells its performance lithium compounds worldwide. Most markets for lithium compounds are global, with significant growth occurring in Asia, driven primarily by the development and manufacture of lithium-ion batteries. The market for lithium compounds also faces some barriers to entry, including access to an adequate and stable supply of lithium, technical expertise and development lead time. We compete by providing advanced technology, high product quality, reliability, quality customer and technical service, and by operating in a cost-efficient manner. We believe we are a leading provider of battery-grade lithium hydroxide in EV battery applications and of performance greases and benefit from low production costs and a history of efficient capital deployment. We also believe we are one of only a few global suppliers of butyllithium. Our primary competitor for performance lithium compounds is Albemarle Corporation. We are the only producer of high purity lithium metal in the Western Hemisphere and enjoy competitive advantages from our vertically integrated manufacturing approach and low production costs. Our primary competitors within the lithium metal product category include Jiangxi Ganfeng Lithium and other Chinese producers.
Research and Development Expense
We perform research and development in both of our segments with the majority of our efforts focused in the FMC Agricultural Solutions segment. The development efforts in the FMC Agricultural Solutions segment focus on developing environmentally sound solutions — both new active ingredients and new product formulations — that cost-effectively increase farmers’ yields and provide alternatives to existing and new chemistries.
Environmental Laws and Regulations
A discussion of environmental related factors can be found in Item 7 “Management’s Discussion and Analysis of Financial Condition and Results of Operations” and in Note 11 “Environmental Obligations” in the notes to our consolidated financial statements included in this Form 10-K.
9
Employees
We employ approximately 7,300 people with about 1,900 people in our domestic operations and 5,400 people in our foreign operations. Approximately 800 of these employees are with Livent Corporation.
Approximately 2 percent of our U.S.-based and 30 percent of our foreign-based employees, respectively, are represented by collective bargaining agreements. We have successfully concluded most of our recent contract negotiations without any material work stoppages. In those rare instances where a work stoppage has occurred, there has been no material effect on consolidated sales and earnings. We cannot predict, however, the outcome of future contract negotiations. In
2019
, eight foreign collective-bargaining agreements will be expiring. These contracts affect approximately 20 percent of our foreign-based employees. There will be no U.S. collective-bargaining agreements expiring in
2019
.
SEC Filings
SEC filings are available free of charge on our website, www.fmc.com. Our annual report on Form 10-K, quarterly reports on Form 10-Q, current reports on Form 8-K and amendments to those reports are posted as soon as practicable after we furnish such materials to the SEC.
|
ITEM 1A.
|
RISK FACTORS
|
Below lists our risk factors updated for these events.
Among the factors that could have an impact on our ability to achieve operating results and meet our other goals are:
Industry Risks:
Pricing and volumes in our markets are sensitive to a number of industry specific and global issues and events including:
|
•
|
Capacity utilization - Our FMC Lithium segment is sensitive to industry capacity utilization. As a result, pricing tends to fluctuate when capacity utilization changes occur within the industry.
|
|
•
|
Competition - All of our segments face competition, which could affect our ability to maintain or raise prices, successfully enter certain markets or retain our market position. Competition for our FMC Agricultural Solutions segment includes not only generic suppliers of the same pesticidal active ingredients but also alternative proprietary pesticide chemistries and crop protection technologies that are bred into or applied onto seeds. Increased generic presence in agricultural chemical markets has been driven by the number of significant product patents and product data protections that have expired in the last decade, and this trend is expected to continue. Also, there are changing competitive dynamics in the agrochemical industry as some of our competitors have consolidated, resulting in them having greater scale and diversity. These competitive differences may not be overcome and may erode our business.
|
|
•
|
Changes in our customer base - Our customer base has the potential to change, especially when long-term supply contracts are renegotiated. Our FMC Lithium segment is most sensitive to this risk.
|
|
•
|
Climatic conditions - Our FMC Agricultural Solutions markets are affected by climatic conditions, which could adversely impact crop pricing and pest infestations. For example, drought may reduce the need for fungicides, which could result in fewer sales and greater unsold inventories in the market, whereas excessive rain could lead to increased plant disease or weed growth requiring growers to purchase and use more pesticides. Adverse weather conditions can impact our ability to extract lithium efficiently from our lithium reserves in Argentina. Natural disasters can impact production at our facilities in various parts of the world. The nature of these events makes them difficult to predict.
|
|
•
|
Changing regulatory environment - Changes in the regulatory environment, particularly in the United States, Brazil, China, Argentina and the European Union, could adversely impact our ability to continue producing and/or selling certain products in our domestic and foreign markets or could increase the cost of doing so. Our FMC Agricultural Solutions segment is most sensitive to this general regulatory risk given the need to obtain and maintain pesticide registrations in every country in which we sell our products. Many countries require re-registration of pesticides to meet new and more challenging requirements; while we defend our products vigorously, these re-registration processes may result in significant additional data costs, reduced number of permitted product uses, or potential product cancellation. Compliance with changing laws and regulations may involve significant costs or capital expenditures or require changes in business practice that could result in reduced profitability. In the European Union, the regulatory risk specifically includes the chemicals regulation known as REACH (Registration, Evaluation, and Authorization of Chemicals), which affects each of our business segments to varying degrees. The fundamental principle behind the REACH regulation is that manufacturers must verify through a special registration system that their chemicals can be marketed safely.
|
|
•
|
Geographic presence outside of United States - With the acquisition of the DuPont Crop Protection Business, FMC Agricultural Solutions has a strong presence in Latin America, Europe and Asia, as well as in the United States. Growth of our geographic footprint particularly in Europe and key Asian countries such as India means that developments outside the United States will generally have a more significant effect on our operations than in the past. Our operations outside the United States are subject to special risks and restrictions, including: fluctuations in currency values; exchange control
|
10
regulations; changes in local political or economic conditions; governmental pricing directives; import and trade restrictions; import or export licensing requirements and trade policy; restrictions on the ability to repatriate funds; and other potentially detrimental domestic and foreign governmental practices or policies affecting U.S. companies doing business abroad.
|
•
|
Pharmaceutical regulation - Our FMC Lithium facility in Bessemer City, North Carolina, and some of our manufacturing processes at that facility, as well as some of our customers, are subject to regulation by the U.S. Food and Drug Administration (FDA) and U.S. Department of Agriculture (USDA) or similar foreign agencies. Regulatory requirements of the FDA and USDA are complex, and any failure to comply with them including as a result of contamination due to acts of sabotage could subject us and/or our customers to fines, injunctions, civil penalties, lawsuits, recall or seizure of products, total or partial suspension of production, denial of government approvals, withdrawal of marketing approvals and criminal prosecution. Any of these actions could adversely impact our net sales, undermine goodwill established with our customers, damage commercial prospects for our products and materially adversely affect our results of operations.
|
|
•
|
Climate change regulation - Changes in the regulation of greenhouse gases, depending on their nature and scope, could subject our manufacturing operations to significant additional costs or limits on operations.
|
|
•
|
Fluctuations in commodity prices - Our operating results could be significantly affected by the cost of commodities. We may not be able to raise prices or improve productivity sufficiently to offset future increases in chemical raw material commodity pricing. Accordingly, increases in such commodity prices may negatively affect our financial results. We use hedging strategies to address material commodity price risks, where hedge strategies are available on reasonable terms. However, we are unable to avoid the risk of medium- and long-term increases. Additionally, fluctuations in harvested crop commodity prices could negatively impact our customers' ability to sell their products at previously forecasted prices resulting in reduced customer liquidity. Inadequate customer liquidity could affect our customers’ abilities to pay for our products and, therefore, affect existing and future sales or our ability to collect on customer receivables.
|
|
•
|
Supply arrangements - Certain raw materials are critical to our production processes and our purchasing strategy and supply chain design are complex. While we have made supply arrangements to meet planned operating requirements, an inability to obtain the critical raw materials or operate under contract manufacturing arrangements would adversely impact our ability to produce certain products and could lead to operational disruption and increase uncertainties around business performance. We increasingly source critical intermediates and finished products from a number of suppliers, largely outside of the U.S. and principally in China. An inability to obtain these products or execute under contract sourcing arrangements would adversely impact our ability to sell products.
|
|
•
|
Economic and political change - Our business has been and could continue to be adversely affected by economic and political changes in the markets where we compete including: inflation rates, recessions, trade restrictions, tariff increases or potential new tariffs, foreign ownership restrictions and economic embargoes imposed by the United States or any of the foreign countries in which we do business; changes in laws, taxation, and regulations and the interpretation and application of these laws, taxes, and regulations; restrictions imposed by the United States government or foreign governments through exchange controls or taxation policy; nationalization or expropriation of property, undeveloped property rights, and legal systems or political instability; other governmental actions; and other external factors over which we have no control. Economic and political conditions within the United States and foreign jurisdictions or strained relations between countries can cause fluctuations in demand, price volatility, supply disruptions, or loss of property. In Argentina, continued inflation and foreign exchange controls could adversely affect our business. Realignment of change in regional economic arrangements could have an operational impact on our businesses. In China, unpredictable enforcement of environmental regulations could result in unanticipated shutdowns in broad geographic areas, impacting our contract manufacturers and raw material suppliers.
|
Operational Risks:
|
•
|
Market access risk - Our results may be affected by changes in distribution channels, which could impact our ability to access the market.
|
|
•
|
Business disruptions - We produce product through a combination of owned facilities and contract manufacturers. As a result of the DuPont Crop Protection Acquisition we now own and operate large-scale manufacturing facilities in the United States (Mobile), Puerto Rico (Manati) and China (Pudong and Jinshan) in addition to our legacy active ingredient plants in Denmark (Ronland) and India (Panoli). This presents us with additional operating risks as our operating results will be dependent in part on the continued operation of the acquired production facilities. Interruptions at these facilities may materially reduce the productivity of a particular manufacturing facility, or the profitability of our business as a whole. Although we take precautions to enhance the safety of our operations and minimize the risk of disruptions, our operations and those of our contract manufacturers are subject to hazards inherent in chemical manufacturing and the related storage and transportation of raw materials, products and wastes. These potential hazards include explosions, fires, severe weather and natural disasters, mechanical failure, unscheduled downtimes, supplier disruptions, labor shortages or other labor difficulties, information technology systems outages, disruption in our supply chain or manufacturing and distribution operations, transportation interruptions, chemical spills, discharges or releases of toxic
|
11
or hazardous substances or gases, shipment of contaminated or off-specification product to customers, storage tank leaks, other environmental risks, or other sudden disruption in business operations beyond our control as a result of events such as acts of sabotage, terrorism or war, civil or political unrest, natural disasters, pandemic situations and large scale power outages. Some of these hazards may cause severe damage to or destruction of property and equipment or personal injury and loss of life and may result in suspension of operations or the shutdown of affected facilities.
|
•
|
Information technology security risks - As with all enterprise information systems, our information technology systems could be penetrated by outside parties’ intent on extracting information, corrupting information, or disrupting business processes. Our systems have in the past been, and likely will in the future be, subject to unauthorized access attempts. Unauthorized access could disrupt our business operations and could result in failures or interruptions in our computer systems and in the loss of assets and could have a material adverse effect on our business, financial condition or results of operations. In addition, breaches of our security measures or the accidental loss, inadvertent disclosure, or unapproved dissemination of proprietary information or sensitive or confidential information about the Company, our employees, our vendors, or our customers, could result in litigation, violations of various data privacy regulations in some jurisdictions, and also potentially result in liability to us. While we have taken measures to assess the requirements of, and to comply with the European Union's General Data Protection Regulation and other data privacy regulations, these measures may be challenged by authorities that regulate data-related compliance. We could incur significant expense in facilitating and responding to investigations and if the measures we have taken prove to be inadequate, we could face fines or penalties. This could damage our reputation, or otherwise harm our business, financial condition, or results of operations.
|
|
•
|
Litigation and environmental risks - Current reserves relating to our ongoing litigation and environmental liabilities may ultimately prove to be inadequate.
|
|
•
|
Hazardous materials - We manufacture and transport certain materials that are inherently hazardous due to their toxic or volatile nature. While we take precautions to handle and transport these materials in a safe manner, if they are mishandled or released into the environment, they could cause property damage or result in personal injury claims against us.
|
|
•
|
Environmental compliance - We are subject to extensive federal, state, local, and foreign environmental and safety laws, regulations, directives, rules and ordinances concerning, among other things, emissions in the air, discharges to land and water, and the generation, handling, treatment, disposal and remediation of hazardous waste and other materials. We may face liability arising out of the normal course of business, including alleged personal injury or property damage due to exposure to chemicals or other hazardous substances at our current or former facilities or chemicals that we manufacture, handle or own. We take our environmental responsibilities very seriously, but there is a risk of environmental impact inherent in our manufacturing operations and transportation of chemicals. Any substantial liability for environmental damage could have a material adverse effect on our financial condition, results of operations and cash flows.
|
|
•
|
Compliance with Laws and Regulations: The global regulatory environment is becoming increasingly complex and requires more resources to effectively manage, which may increase the potential for misunderstanding or misapplication of regulatory standards.
|
|
•
|
Workforce - The inability to recruit and retain key personnel or the unexpected loss of key personnel may adversely affect our operations. In addition, our future success depends in part on our ability to identify and develop talent to succeed senior management and other key members of the organization.
|
Technology Risks:
|
•
|
Technological change - Our ability to compete successfully depends in part upon our ability to maintain a superior technological capability and to continue to identify, develop and commercialize new and innovative, high value-added products for existing and future customers. Our investment in the discovery and development of new pesticidal active ingredients for FMC Agricultural Solutions relies on discovery of new chemical molecules. Such discovery processes depend on our scientists being able to find new molecules, which are novel and outside of patents held by others, and such molecules being efficacious against target pests without creating an undue risk to human health and the environment, and then meeting applicable regulatory criteria.
|
|
•
|
Failure to make process improvements - Failure to continue to make process improvements to reduce costs could impede our competitive position.
|
|
•
|
Patents of competitors - Some of our competitors may secure patents on production methods or uses of products that may limit our ability to compete cost-effectively.
|
Portfolio Management and Integration Risks:
|
•
|
Portfolio management risks - We continuously review our portfolio which includes the evaluation of potential business acquisitions that may strategically fit our business and strategic growth initiatives. If we are unable to successfully integrate and develop our acquired businesses, we could fail to achieve anticipated synergies which would include expected cost savings and revenue growth. Failure to achieve these anticipated synergies, could materially and adversely affect our financial results. In addition to strategic acquisitions we evaluate the diversity of our portfolio in light of our objectives and alignment with our growth strategy. In implementing this strategy we may not be successful in separating underperforming or non-strategic assets. The gains or losses on the divestiture of, or lost operating income from, such
|
12
assets (e.g., divesting) may affect the Company’s earnings. Moreover, we may incur asset impairment charges related to acquisitions or divestitures that reduce earnings. Significant effort will likely be required to ensure that the right mix of resources are trained, engaged and focused on achieving business objectives while adhering to our core values of safety, ethics and compliance.
|
•
|
Intellectual property - Our patents cover many of our products, manufacturing processes, and product uses, as well as many aspects of our research and development activities supporting our new product pipeline. Patents are granted by individual jurisdictions and the duration of our patents depends on their respective jurisdictions and payment of annuities. Our future performance will depend on our ability to address patent expirations through effective portfolio life cycle management for our high value assets.
|
|
◦
|
System implementation and integration risks - Failure to successfully integrate the acquired DuPont Crop Protection Business and transition the management information systems of the DuPont Crop Protection Business from the ERP system provided under Transition Services Agreement by DuPont to a management information system integrated with FMC’s legacy processes could result in interruption of operations or failure to achieve synergies we expect. This could cause our future results of operations to be materially worse than expected.
|
|
•
|
Major enterprise initiatives - We are working to spin off our FMC Lithium segment in parallel to the continued integration of the DuPont Crop Protection Business assets into FMC Agricultural Solutions as well as implement other major initiatives such as the migration to a single global instance of SAP S4 HANA. These three projects will place significant demands on certain functions who are heavily involved in all three projects, particularly finance and information technology. Failure to successfully execute such projects could materially and adversely affect our expected performance in FMC Agricultural Solutions and/or FMC Lithium.
|
|
•
|
Potential tax implications of FMC Lithium separation - We have received an opinion from outside counsel to the effect that the spin-off of FMC Lithium as a distribution to our stockholders qualifies as a non-taxable transaction for U.S. federal income tax purposes. The opinion is based on certain assumptions and representations as to factual matters from both FMC and FMC Lithium, as well as certain covenants by those parties. The opinion cannot be relied upon if any of the assumptions, representations or covenants is incorrect, incomplete or inaccurate or is violated in any material respect. The opinion of counsel is not binding upon the IRS or the courts and there is no assurance that the IRS or a court will not take a contrary position. It is possible that the IRS or a state or local taxing authority could take the position that aforementioned transaction results in the recognition of significant taxable gain by FMC, in which case FMC may be subject to material tax liabilities.
|
Financial Risks:
|
•
|
Cyclicality - We may experience seasonal variations in the demand for our products given the nature of the crop protection market and the geographic regions in which we operate.
|
|
•
|
Access to debt and capital markets - We rely on cash generated from operations and external financing to fund our growth and working capital needs. Limitations on access to external financing could adversely affect our operating results. Moreover, interest payments, dividends and the expansion of our business or other business opportunities may require significant amounts of capital. We believe that our cash from operations and available borrowings under our revolving credit facility will be sufficient to meet these needs in the foreseeable future. However, if we need external financing, our access to credit markets and pricing of our capital will be dependent upon maintaining sufficient credit ratings from credit rating agencies and the state of the capital markets generally. There can be no assurances that we would be able to obtain equity or debt financing on terms we deem acceptable, and it is possible that the cost of any financings could increase significantly, thereby increasing our expenses and decreasing our net income. If we are unable to generate sufficient cash flow or raise adequate external financing, including as a result of significant disruptions in the global credit markets, we could be forced to restrict our operations and growth opportunities, which could adversely affect our operating results.
|
|
•
|
Credit default risks - We may use our existing revolving credit facility to meet our cash needs, to the extent available. In the event of a default in this credit facility or any of our senior notes, we could be required to immediately repay all outstanding borrowings and make cash deposits as collateral for all obligations the facility supports, which we may not be able to do. Any default under any of our credit arrangements could cause a default under many of our other credit agreements and debt instruments. Without waivers from lenders party to those agreements, any such default could have a material adverse effect on our ability to continue to operate.
|
|
•
|
Exposure to global economic conditions - Deterioration in the global economy and worldwide credit and foreign exchange markets could adversely affect our business. A worsening of global or regional economic conditions or financial markets could adversely affect both our own and our customers' ability to meet the terms of sale or our suppliers' ability to perform all their commitments to us. A slowdown in economic growth in our international markets, or a deterioration of credit or foreign exchange markets could adversely affect customers, suppliers and our overall business there. Customers in weakened economies may be unable to purchase our products, or it could become more expensive for them to purchase imported products in their local currency, or sell their commodities at prevailing international prices, and we may be unable to collect receivables from such customers.
|
13
|
•
|
Foreign exchange rate risks - We are an international company and face foreign exchange rate risks in the normal course of our business. We are particularly sensitive to the Brazilian real, the euro, the Indian rupee, the Chinese yuan, the Mexican peso, and the Argentine peso. Our acquisition of the DuPont Crop Protection Business has significantly expanded our operations and sales in certain foreign countries and correspondingly may increase our exposure to foreign exchange risks.
|
|
•
|
Uncertain tax rates - Our future effective tax rates may be materially impacted by numerous items including: a future change in the composition of earnings from foreign and domestic tax jurisdictions, as earnings in foreign jurisdictions are typically taxed at different rates than the United States federal statutory rate; accounting for uncertain tax positions; business combinations; expiration of statute of limitations or settlement of tax audits; changes in valuation allowance; changes in tax law; currency gains and losses; and the potential decision to repatriate certain future foreign earnings on which United States or foreign withholding taxes have not been previously accrued.
|
|
•
|
Uncertain recoverability of investments in long-lived assets - We have significant investments in long-lived assets and continually review the carrying value of these assets for recoverability in light of changing market conditions and alternative product sourcing opportunities.
|
|
•
|
Pension and postretirement plans - Obligations related to our pension and postretirement plans reflect certain assumptions. To the extent our plans' actual experience differs from these assumptions, our costs and funding obligations could increase or decrease significantly.
|
|
ITEM 1B.
|
UNRESOLVED STAFF COMMENTS
|
None.
|
ITEM 2.
|
PROPERTIES
|
FMC leases executive offices in Philadelphia, Pennsylvania and operates
32
manufacturing facilities in
20
countries as well as one mine in Argentina. Our major research and development facilities are in Newark, Delaware; Shanghai, China and Copenhagen, Denmark.
We have long-term mineral rights to the Salar del Hombre Muerto lithium reserves in Argentina. Our FMC Lithium segment requires the lithium brine that is mined from these reserves, without which other sources of raw materials would have to be obtained.
We believe our facilities are in good operating conditions. The number and location of our owned or leased production properties for continuing operations are as follows:
|
North America
|
Latin
America
|
Europe, Middle East and Africa
|
Asia-
Pacific
|
Total
|
|||||
|
FMC Agricultural Solutions
|
5
|
2
|
6
|
13
|
26
|
||||
|
FMC Lithium
|
1
|
2
|
1
|
2
|
6
|
||||
|
Total
|
6
|
4
|
7
|
15
|
32
|
||||
|
ITEM 3.
|
LEGAL PROCEEDINGS
|
Like hundreds of other industrial companies, we have been named as one of many defendants in asbestos-related personal injury litigation. Most of these cases allege personal injury or death resulting from exposure to asbestos in premises of FMC or to asbestos-containing components installed in machinery or equipment manufactured or sold by discontinued operations. The machinery and equipment businesses we owned or operated did not fabricate the asbestos-containing component parts at issue in the litigation, and to this day, neither the U.S. Occupational Safety and Health Administration nor the Environmental Protection Agency has banned the use of these components. Further, the asbestos-containing parts for this machinery and equipment were accessible only at the time of infrequent repair and maintenance. A few jurisdictions have permitted claims to proceed against equipment manufacturers relating to insulation installed by other companies on such machinery and equipment. We believe that, overall, the claims against FMC are without merit.
As of
December 31, 2018
, there were approximately 9,400 premises and product asbestos claims pending against FMC in several jurisdictions. Since the 1980s, approximately 115,000 asbestos claims against FMC have been discharged, the overwhelming majority of which have been dismissed without any payment to the claimant. Since the 1980s, settlements with claimants have totaled approximately $99 million.
We intend to continue managing these asbestos-related cases in accordance with our historical experience. We have established a reserve for this litigation within our discontinued operations and believe that any exposure of a loss in excess of the established reserve cannot be reasonably estimated. Our experience has been that the overall trends in asbestos litigation have changed over
14
time. Over the last several years, we have seen changes in the jurisdictions where claims against FMC are being filed and changes in the mix of products named in the various claims. Because these claim trends have yet to form a predictable pattern, we are presently unable to reasonably estimate our asbestos liability with respect to claims that may be filed in the future.
Please see Note 1 “Principal Accounting Policies and Related Financial Information" - Environmental obligations, Note 11 “Environmental Obligations” and Note 19 “Guarantees, Commitments and Contingencies” in the notes to our consolidated financial statements included in this Form 10-K, the content of which are incorporated by reference to this Item 3.
|
ITEM 4.
|
MINE SAFETY DISCLOSURES
|
Not Applicable.
|
ITEM 4A.
|
EXECUTIVE OFFICERS OF THE REGISTRANT
|
The executive officers of FMC Corporation, the offices they currently hold, their business experience since at least January 1, 2010 and their ages as of
December 31, 2018
, are as follows:
|
Name
|
Age on
12/31/2018
|
Office, year of election and other
information
|
||
|
Pierre R. Brondeau
|
61
|
Chief Executive Officer and Chairman of the Board (10-present); President (10-18), President and Chief Executive Officer of Dow Advanced Materials, a specialty materials company (08-09); President and Chief Operating Officer of Rohm and Haas Company, a predecessor of Dow Advanced Materials (07-08); Board Member, T.E. Connectivity Electronics (07-present); Board Member, American Chemistry Council (17-present); Board Trustee, Franklin Institute (17-present), Board Member, Livent Corporation (18-present)
|
||
|
Andrew D. Sandifer
|
49
|
Executive Vice President and Chief Financial Officer (18-present); Vice President and Treasurer (16-18); Vice President, Corporate Transformation (14-16); Vice President, Strategic Development (10-14); Vice President, Strategic Initiatives of ARAMARK (10); Board Member, Philabundance (14-present); Board Trustee, Germantown Academy (17-present)
|
||
|
Andrea E. Utecht
|
70
|
Executive Vice President, General Counsel and Secretary (01-present); Board Member, Livent Corporation (18-present)
|
||
|
Mark A. Douglas
|
56
|
President and Chief Operating Officer (18-present), President, FMC Agricultural Solutions (12-18); President, Industrial Chemicals Group (11-12); Vice President, Global Operations and International Development (10-11); Vice President, President Asia, Dow Advanced Materials (09-10); Board Member, Quaker Chemical (13-present); Board Member CropLife International (17-present); Board Member Pennsylvania Academy of the Fine Arts (16-present)
|
||
All officers are elected to hold office for one year or until their successors are elected and qualified. No family relationships exist among any of the above-listed officers, and there are no arrangements or understandings between any of the above-listed officers and any other person pursuant to which they serve as an officer. The above-listed officers have not been involved in any legal proceedings during the past ten years of a nature for which the SEC requires disclosure that are material to an evaluation of the ability or integrity of any such officer.
15
PART II
|
ITEM 5.
|
MARKET FOR THE REGISTRANT'S COMMON EQUITY, RELATED STOCKHOLDERS MATTERS AND ISSUER PURCHASES OF EQUITY SECURITIES
|
FMC common stock of
$0.10
par value is traded on the New York Stock Exchange (Symbol: FMC). There were
2,570
registered common stockholders as of
December 31, 2018
.
FMC’s annual meeting of stockholders will be held at 2:00 p.m. on
Tuesday, April 30, 2019
, at FMC Tower, 2929 Walnut Street Philadelphia, Pennsylvania. Notice of the meeting, together with proxy materials, will be mailed approximately five weeks prior to the meeting to stockholders of record as of
March 6, 2019
.
Transfer Agent and Registrar of Stock:
|
EQ Shareowner Services
|
||
|
1110 Centre Pointe Curve, Suite 101
|
or
|
P.O. Box 64874
|
|
Mendota Heights, MN 55120-4100
|
St. Paul, MN 55164-0854
|
|
|
Phone: 1-800-468-9716
|
||
|
(651-450-4064 local and outside the U.S.)
|
||
|
https://equiniti.com/us/
|
||
Stockholder Return Performance Presentation
The graph that follows shall not be deemed to be incorporated by reference into any filing made by FMC under the Securities Act of 1933 or the Securities Exchange Act of 1934.
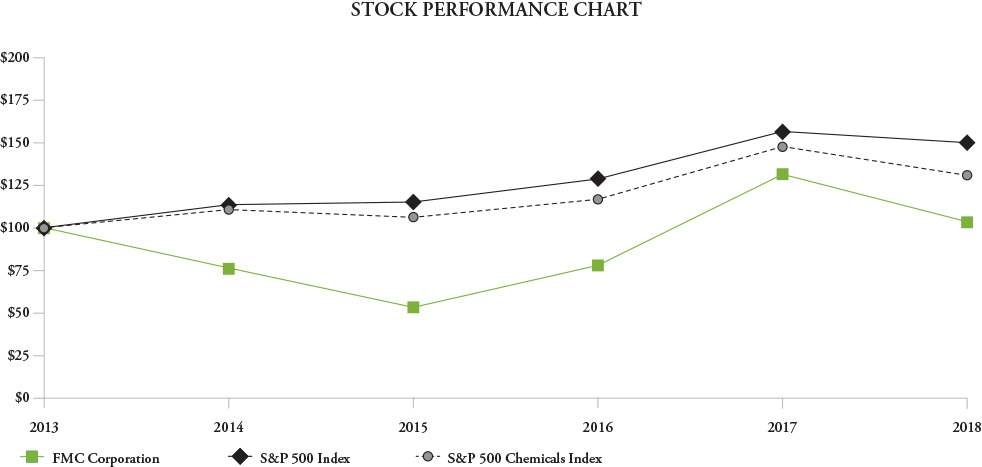
The following Stockholder Performance Graph compares the five-year cumulative total return on FMC’s Common Stock with the S&P 500 Index and the S&P 500 Chemicals Index. The comparison assumes $100 was invested on
December 31, 2013
, in FMC’s Common Stock and in both of the indices, and the reinvestment of all dividends.
|
2013
|
2014
|
2015
|
2016
|
2017
|
2018
|
||||||||||||||||||
|
FMC Corporation
|
$
|
100.00
|
|
$
|
76.37
|
|
$
|
53.28
|
|
$
|
77.92
|
|
$
|
131.32
|
|
$
|
103.52
|
|
|||||
|
S&P 500 Index
|
100.00
|
|
113.52
|
|
115.07
|
|
128.61
|
|
156.48
|
|
149.88
|
|
|||||||||||
|
S&P 500 Chemicals Index
|
100.00
|
|
110.64
|
|
106.08
|
|
116.67
|
|
147.62
|
|
130.72
|
|
|||||||||||
16
The following table summarizes information with respect to the purchase of our common stock during the three months ended
December 31, 2018
:
ISSUER PURCHASES OF EQUITY SECURITIES
|
|
|
|
Publicly Announced Program
(1)
|
||||||||||||||
|
Period
|
Total Number of Shares Purchased
(2)
|
Average Price Paid Per Share
|
Total Number of Shares Purchased
|
Total Dollar Amount Purchased
|
Maximum Dollar Value of Shares that May Yet be Purchased
|
||||||||||||
|
October 1-31, 2018
|
—
|
|
$
|
—
|
|
—
|
|
$
|
—
|
|
$
|
238,779,078
|
|
||||
|
November 1-30, 2018
|
4,216
|
|
81.69
|
|
2,250,000
|
|
183,793,605
|
|
54,985,473
|
|
|||||||
|
December 1-31, 2018
|
13,236
|
|
85.07
|
|
189,495
|
|
16,206,368
|
|
1,000,000,000
|
|
|||||||
|
Total
|
17,452
|
|
$
|
81.97
|
|
2,439,495
|
|
$
|
199,999,973
|
|
$
|
1,000,000,000
|
|
||||
____________________
|
(1)
|
This repurchase program does not include a specific timetable or price targets and may be suspended or terminated at any time. Shares may be purchased through open market or privately negotiated transactions at the discretion of management based on its evaluation of market conditions and other factors.
|
|
(2)
|
We also reacquire shares from time to time from employees in connections with vesting, exercise, and forfeiture of awards under our equity compensation plans.
|
On December 3, 2018, our Board authorized the repurchase of up to $1 billion of our common shares. This repurchase program does not include a specific timetable or price targets and may be suspended or terminated at any time. Shares may be repurchased through open market or privately negotiated transactions at the discretion of management based on its evaluation of market conditions and other factors.
On November 5, 2018, we announced a plan to repurchase $200 million in shares by the end of 2018 under our previous share repurchase authorization that was approved in 2013. We completed the announced repurchase in its entirety and the remaining authority expired at the completion of the $200 million repurchase. In
2018
,
2.4 million
shares were repurchased under the publicly announced repurchase program. At
December 31, 2018
,
$1.0 billion
remained unused under our Board-authorized repurchase program. This repurchase program does not include a specific timetable or price targets and may be suspended or terminated at any time. Shares may be purchased through open market or privately negotiated transactions at the discretion of management based on its evaluation of market conditions and other factors. We also reacquire shares from time to time from employees in connection with the vesting, exercise and forfeiture of awards under our equity compensation plans.
17
|
ITEM 6.
|
SELECTED FINANCIAL DATA
|
SELECTED CONSOLIDATED FINANCIAL DATA
The selected consolidated financial and other data presented below for, and as of the end of, each of the years in the five-year period ended
December 31, 2018
, are derived from our consolidated financial statements. The selected consolidated financial data should be read in conjunction with our consolidated financial statements for the year ended
December 31, 2018
.
|
|
Year Ended December 31,
|
||||||||||||||||||
|
(in Millions, except per share data)
|
2018
|
2017
|
2016
|
2015
|
2014
|
||||||||||||||
|
Income Statement Data:
|
|||||||||||||||||||
|
Revenue
|
$
|
4,727.8
|
|
|
$
|
2,878.6
|
|
$
|
2,538.9
|
|
$
|
2,491.0
|
|
$
|
2,430.5
|
|
|||
|
Income from continuing operations before equity in (earnings) loss of affiliates, non-operating pension and postretirement charges (income), interest expense, net and income taxes
|
880.5
|
|
|
278.0
|
|
266.6
|
|
(116.7
|
)
|
256.8
|
|
||||||||
|
Income (loss) from continuing operations before income taxes
|
743.7
|
|
|
180.8
|
|
180.8
|
|
(207.4
|
)
|
206.8
|
|
||||||||
|
Income (loss) from continuing operations
|
$
|
654.9
|
|
|
$
|
(83.3
|
)
|
$
|
130.7
|
|
$
|
(212.6
|
)
|
$
|
190.4
|
|
|||
|
Discontinued operations, net of income taxes
(1)
|
(143.4
|
)
|
|
621.7
|
|
81.0
|
|
711.1
|
|
131.7
|
|
||||||||
|
Net income (loss)
|
$
|
511.5
|
|
$
|
538.4
|
|
$
|
211.7
|
|
$
|
498.5
|
|
$
|
322.1
|
|
||||
|
Less: Net income (loss) attributable to noncontrolling interest
|
9.4
|
|
2.6
|
|
2.6
|
|
9.5
|
|
14.6
|
|
|||||||||
|
Net income (loss) attributable to FMC stockholders
|
$
|
502.1
|
|
$
|
535.8
|
|
$
|
209.1
|
|
$
|
489.0
|
|
$
|
307.5
|
|
||||
|
Amounts attributable to FMC stockholders:
|
|||||||||||||||||||
|
Continuing operations, net of income taxes
|
$
|
645.5
|
|
|
$
|
(85.9
|
)
|
$
|
128.4
|
|
$
|
(222.0
|
)
|
$
|
180.6
|
|
|||
|
Discontinued operations, net of income taxes
|
(143.4
|
)
|
|
621.7
|
|
80.7
|
|
711.0
|
|
126.9
|
|
||||||||
|
Net income (loss)
|
$
|
502.1
|
|
$
|
535.8
|
|
$
|
209.1
|
|
$
|
489.0
|
|
$
|
307.5
|
|
||||
|
Basic earnings (loss) per common share attributable to FMC stockholders:
|
|||||||||||||||||||
|
Continuing operations
|
$
|
4.78
|
|
|
$
|
(0.64
|
)
|
$
|
0.96
|
|
$
|
(1.66
|
)
|
$
|
1.35
|
|
|||
|
Discontinued operations
|
(1.06
|
)
|
|
4.63
|
|
0.60
|
|
5.32
|
|
0.95
|
|
||||||||
|
Net income (loss)
|
$
|
3.72
|
|
$
|
3.99
|
|
$
|
1.56
|
|
$
|
3.66
|
|
$
|
2.30
|
|
||||
|
Diluted earnings (loss) per common share attributable to FMC stockholders:
|
|||||||||||||||||||
|
Continuing operations
|
$
|
4.75
|
|
|
$
|
(0.64
|
)
|
$
|
0.96
|
|
$
|
(1.66
|
)
|
$
|
1.34
|
|
|||
|
Discontinued operations
|
(1.06
|
)
|
|
4.63
|
|
0.60
|
|
5.32
|
|
0.95
|
|
||||||||
|
Net income (loss)
|
$
|
3.69
|
|
$
|
3.99
|
|
$
|
1.56
|
|
$
|
3.66
|
|
$
|
2.29
|
|
||||
|
Balance Sheet Data:
|
|||||||||||||||||||
|
Total assets
|
$
|
9,974.3
|
|
|
$
|
9,206.3
|
|
$
|
6,139.3
|
|
$
|
6,325.9
|
|
$
|
5,326.0
|
|
|||
|
Long-term debt
|
2,565.0
|
|
|
3,094.2
|
|
1,801.2
|
|
2,037.8
|
|
1,140.9
|
|
||||||||
|
Other Data:
|
|||||||||||||||||||
|
Cash dividends declared per share
|
$
|
0.900
|
|
$
|
0.660
|
|
$
|
0.660
|
|
$
|
0.660
|
|
$
|
0.600
|
|
||||
____________________
|
(1)
|
Discontinued operations, net of income taxes includes, in periods up to their respective sales, our discontinued FMC Health and Nutrition, FMC Peroxygens and FMC Alkali Chemicals division. It also includes other historical discontinued gains and losses related to adjustments to our estimates of our retained liabilities for environmental exposures, general liability, workers’ compensation, postretirement benefit obligations, legal defense, property maintenance and other costs, losses for the settlement of litigation and gains related to property sales. Amount in 2017 includes the divestiture gain associated with FMC Health and Nutrition. Amount in 2015 includes the divestiture gain associated with the FMC Alkali Chemicals division sale while 2014 includes charges associated with the sale of the FMC Peroxygens business.
|
18
FORWARD-LOOKING INFORMATION
Statement under the Safe Harbor Provisions of the Private Securities Litigation Reform Act of 1995: We and our representatives may from time to time make written or oral statements that are “forward-looking” and provide other than historical information, including statements contained in Management’s Discussion and Analysis of Financial Condition and Results of Operations within, in our other filings with the SEC, and in reports or letters to our stockholders.
In some cases, we have identified forward-looking statements by such words or phrases as “will likely result,” “is confident that,” “expect,” “expects,” “should,” “could,” “may,” “will continue to,” “believe,” “believes,” “anticipates,” “predicts,” “forecasts,” “estimates,” “projects,” “potential,” “intends” or similar expressions identifying “forward-looking statements” within the meaning of the Private Securities Litigation Reform Act of 1995, including the negative of those words and phrases. Such forward-looking statements are based on our current views and assumptions regarding future events, future business conditions and the outlook for the company based on currently available information. These statements involve known and unknown risks, uncertainties and other factors that may cause actual results to be materially different from any results, levels of activity, performance or achievements expressed or implied by any forward-looking statement. These factors include, among other things, the risk factors listed in Item 1A of this Form 10-K. We wish to caution readers not to place undue reliance on any such forward-looking statements, which speak only as of the date made.
19
|
ITEM 7.
|
MANAGEMENT'S DISCUSSION AND ANALYSIS OF FINANCIAL CONDITION AND RESULTS OF OPERATIONS
|
Overview
We are a diversified chemical company serving agricultural, consumer and industrial markets globally with innovative solutions, applications and market-leading products. We operate in two distinct business segments: FMC Agricultural Solutions and FMC Lithium. Our FMC Agricultural Solutions segment develops, markets and sells all three major classes of crop protection chemicals: insecticides, herbicides and fungicides. These products are used in agriculture to enhance crop yield and quality by controlling a broad spectrum of insects, weeds and disease, as well as in non-agricultural markets for pest control. Our FMC Lithium segment manufactures lithium for use in a wide range of lithium products, which are used primarily in energy storage, specialty polymers and chemical synthesis application.
2018
Highlights
The following are the more significant developments in our businesses during the year ended
December 31, 2018
:
|
•
|
Revenue of
$4,727.8 million
in
2018
increased
$1,849.2 million
or approximately
64 percent
versus last year. A more detailed review of revenues by segment is included under the section entitled
“Results of Operations”
. On a regional basis, sales in North America
increased
66 percent
, sales in Asia
increased
81 percent
and sales in Europe, Middle East and Africa (EMEA)
increased
by
78 percent
and sales in Latin America
increased
by
40 percent
.
|
|
•
|
Our gross margin, excluding transaction-related charges, of
$2,156.5 million
increased
$1,035.0 million
or approximately
92 percent
versus last year. Gross margin, excluding transaction-related charges, as a percent of revenue is approximately
46 percent
versus
39 percent
in
2017
. The increase in gross margin was primarily driven by higher margin products in FMC Agricultural Solutions as well as a full year of earnings from the acquired DuPont Crop Protection Business.
|
|
•
|
Selling, general and administrative expenses
increased
42 percent
from
$600.4 million
to
$851.2 million
primarily due to the acquisition of the DuPont Crop Protection Business which is being integrated into our FMC Agricultural Solutions segment. Selling, general and administrative expenses, excluding transaction-related charges, of
$728.7 million
increased
$258.5 million
or approximately
55 percent
primarily due to a full year of operations of the acquired DuPont Crop Protection Business. Transaction-related charges are presented in our Adjusted Earnings Non-GAAP financial measurement below under the section titled
“Results of Operations”
.
|
|
•
|
Research and development expenses of
$291.5 million
increased
$150.0 million
or
106 percent
. The increase was primarily due to investments in discovery and product development from the newly acquired state of the art facilities from the DuPont Crop Protection Business Acquisition.
|
|
•
|
Net income (loss) attributable to FMC stockholders of
$502.1 million
decreased
approximately
$33.7 million
from
$535.8 million
in the prior year period. Net income in 2017 included the gain on sale of our discontinued FMC Health and Nutrition of approximately
$727 million
, net of tax which was partially offset by a provisional income tax charge of approximately $316 million related to the Tax Cuts and Jobs Act ("the Act"). Additionally, in 2018, we recorded a charge of
$106.3 million
related to active negotiations for a settlement agreement primarily to address discontinued operations at our environmental site in Middleport, New York. These were partially offset by higher income from continuing operations in the current year driven by a full year of results from the DuPont Crop Protection Business. Adjusted after-tax earnings from continuing operations attributable to FMC stockholders of
$854.7 million
increased
approximately
$486.4 million
or
132 percent
primarily due to higher results in FMC Agricultural Solutions. See the disclosure of our Adjusted Earnings Non-GAAP financial measurement below under the section titled
“Results of Operations”
.
|
Other
2018
Highlights
On
October 15, 2018
, Livent closed on its IPO. After completion of the IPO and the underwriters' exercise to purchase additional shares of common stock, FMC owned
123 million
shares of Livent's common stock, representing approximately
84 percent
of the total outstanding shares of Livent's common stock. FMC presently intends to distribute the remaining Livent shares on March 1, 2019. We will continue to consolidate Livent as the FMC Lithium reporting segment until the full separation date. At that time, results of Livent will move to discontinued operations.
We began and advanced the implementation of the SAP S/4 HANA platform during 2018 as part of our transformation process.
2019
Outlook
20
Our 2019 expectation for the overall global crop protection market growth is that it will be flat to up low-single digits in U.S. dollars. We expect that FMC’s above-market growth in 2019 will be driven by the continued strength in global demand for our diamides, pre-emergent herbicide growth, sales expansions in Brazil, sulfonylurea herbicide growth in key European countries as well as new product introductions. We expect North America, EMEA and Asia will also be flat to up low-single digits - driven by a variety of factors - and Latin America will grow in the low- to mid-single digits. In North America, growth will come from an increase in corn acreage and normalized pest pressures.
We expect 2019 revenue for FMC will be in the range of approximately $4.45 billion to $4.55 billion, up approximately 5 percent at the midpoint year over year versus 2018 sales, excluding FMC Lithium. We also expect total company adjusted EBITDA
(1)
of $1.165 billion to $1.205 billion, which represents 7 percent growth at the midpoint versus 2018 recast results, excluding FMC Lithium
(2)
. 2019 adjusted earnings are expected to be in the range of $5.55 to $5.75 per diluted share
(1)
, up 8 percent at the midpoint versus recast 2018, excluding any impact from share repurchases in 2019
(2)
.
|
(1)
|
Although we provide forecasts for adjusted earnings per share and total company adjusted EBITDA (non-GAAP financial measures), we are not able to forecast the most directly comparable measures calculated and presented in accordance with GAAP. Certain elements of the composition of the GAAP amounts are not predictable, making it impractical for us to forecast. Such elements include, but are not limited to, restructuring, acquisition charges, and discontinued operations. As a result, no GAAP outlook is provided.
|
|
(2)
|
Recast calculations for 2018 exclude the Lithium segment entirely, as we intend to show a true year-over-year comparable metric for the 2019 periods. The recast represents our best estimate at this time. Due to complexities including U.S. Tax Reform, the full recasting is not yet completed. The completed recast results will be filed on a Form 8-K in March 2019.
|
21
Results of Operations —
2018
,
2017
and
2016
Overview
The following presents a reconciliation of our segment EBITDA to net income (loss) attributable to FMC stockholders as seen through the eyes of our management. For management purposes, we report the operating performance of each of our business segments based on earnings before interest, income taxes and depreciation and amortization excluding corporate expenses, other income (expense), net and corporate special income (charges).
|
SEGMENT RESULTS RECONCILIATION
|
|||||||||||
|
(in Millions)
|
Year Ended December 31,
|
||||||||||
|
2018
|
2017
|
2016
|
|||||||||
|
Revenue
|
|||||||||||
|
FMC Agricultural Solutions
|
$
|
4,285.3
|
|
$
|
2,531.2
|
|
$
|
2,274.8
|
|
||
|
FMC Lithium
|
442.5
|
|
347.4
|
|
264.1
|
|
|||||
|
Total
|
$
|
4,727.8
|
|
$
|
2,878.6
|
|
$
|
2,538.9
|
|
||
|
Earnings before interest, taxes and depreciation and amortization (EBITDA)
|
|||||||||||
|
FMC Agricultural Solutions
|
$
|
1,217.8
|
|
$
|
576.1
|
|
$
|
480.7
|
|
||
|
FMC Lithium
|
195.7
|
|
141.9
|
|
85.0
|
|
|||||
|
Corporate and other
|
(108.9
|
)
|
(95.1
|
)
|
(79.6
|
)
|
|||||
|
Operating profit before the items listed below
|
$
|
1,304.6
|
|
$
|
622.9
|
|
$
|
486.1
|
|
||
|
Depreciation and amortization
|
(168.2
|
)
|
(113.0
|
)
|
(100.6
|
)
|
|||||
|
Interest expense, net
|
(133.1
|
)
|
(79.1
|
)
|
(62.9
|
)
|
|||||
|
Restructuring and other (charges) income
(1)
|
(63.7
|
)
|
(81.4
|
)
|
(95.0
|
)
|
|||||
|
Non-operating pension and postretirement (charges) income
(2)
|
(3.8
|
)
|
(18.2
|
)
|
(23.4
|
)
|
|||||
|
Transaction-related charges
(3)
|
(192.1
|
)
|
(150.4
|
)
|
(23.4
|
)
|
|||||
|
(Provision) benefit for income taxes
|
(88.8
|
)
|
(264.1
|
)
|
(50.1
|
)
|
|||||
|
Discontinued operations, net of income taxes
|
(143.4
|
)
|
621.7
|
|
81.0
|
|
|||||
|
Net (income) loss attributable to noncontrolling interests
|
(9.4
|
)
|
(2.6
|
)
|
(2.6
|
)
|
|||||
|
Net income (loss) attributable to FMC stockholders
|
$
|
502.1
|
|
$
|
535.8
|
|
$
|
209.1
|
|
||
____________________
|
(1)
|
See Note 8 to the consolidated financial statements included within this Form 10-K for details of restructuring and other (charges) income by segment:
|
|
Year Ended December 31,
|
|||||||||||
|
(in Millions)
|
2018
|
2017
|
2016
|
||||||||
|
FMC Agricultural Solutions
|
$
|
(33.3
|
)
|
$
|
(49.9
|
)
|
$
|
(62.4
|
)
|
||
|
FMC Lithium
|
(2.3
|
)
|
(7.8
|
)
|
(0.6
|
)
|
|||||
|
Corporate
|
(28.1
|
)
|
(23.7
|
)
|
(32.0
|
)
|
|||||
|
Restructuring and other (charges) income
|
$
|
(63.7
|
)
|
$
|
(81.4
|
)
|
$
|
(95.0
|
)
|
||
|
(2)
|
Our non-operating pension and postretirement charges (income) are defined as those costs (benefits) related to interest, expected return on plan assets, amortized actuarial gains and losses and the impacts of any plan curtailments or settlements. These are excluded from our segments results and are primarily related to changes in pension plan assets and liabilities which are tied to financial market performance and we consider these costs to be outside our operational performance. We continue to include the service cost and amortization of prior service cost in our segments results noted above. These elements reflect the current year operating costs to our businesses for the employment benefits provided to active employees.
|
|
(3)
|
Charges relate to the expensing of the inventory fair value step-up resulting from the application of purchase accounting, transaction costs, costs for transitional employees, other acquired employee related costs, integration related legal and professional third-party fees. Amounts represent the following:
|
22
|
Year Ended December 31,
|
|||||||||||
|
(in Millions)
|
2018
|
2017
|
2016
|
||||||||
|
Acquisition-related charges -
DuPont Crop
|
|||||||||||
|
Legal and professional fees
(1)
|
$
|
86.9
|
|
$
|
130.2
|
|
$
|
—
|
|
||
|
Inventory fair value amortization
(2)
|
69.6
|
|
20.2
|
|
—
|
|
|||||
|
Acquisition-related charges -
Cheminova
(3)
|
|||||||||||
|
Legal and professional fees
(1)
|
—
|
|
—
|
|
23.4
|
|
|||||
|
Separation-related charges -
FMC Lithium
|
|||||||||||
|
Legal and professional fees
(1)
|
35.6
|
|
—
|
|
—
|
|
|||||
|
Total transaction-related charges
|
$
|
192.1
|
|
$
|
150.4
|
|
$
|
23.4
|
|
||
____________________
|
(1)
|
Represents transaction costs, costs for transitional employees, other acquired employees related costs, and transactional-related costs such as legal and professional third-party fees. These charges are recorded as a component of “Selling, general and administrative expense" on the consolidated statements of income (loss).
|
|
(2)
|
These charges are included in “Costs of sales and services” on the consolidated statements of income (loss).
|
|
(3)
|
Acquisition-related charges and restructuring charges to integrate Cheminova with FMC Agricultural Solutions were completed at the end of 2016.
|
ADJUSTED EARNINGS RECONCILIATION
The following chart, which is provided to assist the readers of our financial statements, depicts certain after-tax charges (gains). These items are excluded from the measures we use to evaluate business performance and determine certain performance-based compensation. These after-tax items are discussed in detail within the “Other results of operations” section that follows. Additionally, the chart below discloses our Non-GAAP financial measure “Adjusted after-tax earnings from continuing operations attributable to FMC stockholders” reconciled from the GAAP financial measure “Net income (loss) attributable to FMC stockholders.” We believe that this measure provides useful information about our operating results to investors. We also believe that excluding the effect of restructuring and other income and charges, non-operating pension and postretirement charges, certain Non-GAAP tax adjustments from operating results and discontinued operations allows management and investors to compare more easily the financial performance of our underlying businesses from period to period. This measure should not be considered as a substitute for net income (loss) or other measures of performance or liquidity reported in accordance with U.S. GAAP.
|
(in Millions)
|
Year Ended December 31,
|
||||||||||
|
2018
|
2017
|
2016
|
|||||||||
|
Net income (loss) attributable to FMC stockholders (GAAP)
|
$
|
502.1
|
|
$
|
535.8
|
|
$
|
209.1
|
|
||
|
Corporate special charges (income), pre-tax
|
259.6
|
|
250.0
|
|
141.8
|
|
|||||
|
Income tax expense (benefit) on Corporate special charges (income)
(1)
|
(59.4
|
)
|
(67.5
|
)
|
(44.9
|
)
|
|||||
|
Corporate special charges (income), net of income taxes
|
$
|
200.2
|
|
$
|
182.5
|
|
$
|
96.9
|
|
||
|
Adjustment for noncontrolling interest, net of tax on Corporate special charges (income)
|
(1.5
|
)
|
—
|
|
—
|
|
|||||
|
Discontinued operations attributable to FMC Stockholders, net of income taxes
|
143.4
|
|
(621.7
|
)
|
(80.7
|
)
|
|||||
|
Non-GAAP tax adjustments
(2)
|
10.5
|
|
271.7
|
|
32.4
|
|
|||||
|
Adjusted after-tax earnings from continuing operations attributable to FMC stockholders (Non-GAAP)
|
$
|
854.7
|
|
$
|
368.3
|
|
$
|
257.7
|
|
||
____________________
|
(1)
|
The income tax expense (benefit) on Corporate special charges (income) is determined using the applicable rates in the taxing jurisdictions in which the Corporate special charge or income occurred and includes both current and deferred income tax expense (benefit) based on the nature of the non-GAAP performance measure.
|
|
(2)
|
We exclude the GAAP tax provision, including discrete items, from the Non-GAAP measure of income, and instead include a Non-GAAP tax provision based upon the annual Non-GAAP effective tax rate. The GAAP tax provision includes certain discrete tax items including, but not limited to: income tax expenses or benefits that are not related to current year ongoing business operations; tax adjustments associated with fluctuations in foreign currency remeasurement of certain foreign operations; certain changes in estimates of tax matters related to prior fiscal years; certain changes in the realizability of deferred tax assets; and changes in tax law which includes the impact of the Act enacted on December 22, 2017. Management believes excluding these discrete tax items assists investors
|
23
and securities analysts in understanding the tax provision and the effective tax rate related to ongoing operations thereby providing investors with useful supplemental information about FMC's operational performance.
In the discussion below, please refer to our chart titled
"Segment Results Reconciliation"
within the Results of Operations section. All comparisons are between the periods unless otherwise noted.
Segment Results
For management purposes, segment EBITDA is defined as segment revenue less operating expenses (segment operating expenses consist of costs of sales and services, selling, general and administrative expenses, research and development expenses), excluding depreciation and amortization. We have excluded the following items from segment EBITDA: corporate staff expense, interest income and expense associated with corporate debt facilities and investments, income taxes, gains (or losses) on divestitures of businesses, restructuring and other charges (income), non-operating pension and postretirement charges, investment gains and losses, loss on extinguishment of debt, asset impairments, Last-in, First-out ("LIFO") inventory adjustments, transaction-related charges, and other income and expense items.
Information about how each of these items relates to our businesses at the segment level and results by segment are discussed below and in Note 20 to our consolidated financial statements included in this Form 10-K.
FMC Agricultural Solutions
|
(in Millions)
|
Year Ended December 31,
|
||||||||||
|
2018
|
|
2017
|
2016
|
||||||||
|
Segment Revenue
|
$
|
4,285.3
|
|
|
$
|
2,531.2
|
|
|
$
|
2,274.8
|
|
|
Segment EBITDA
|
1,217.8
|
|
|
576.1
|
|
|
480.7
|
|
|||
2018
vs.
2017
Revenue of
$4,285.3 million
increased
$1,754.1 million
, or approximately
69 percent
versus the prior year period. The increase was primarily due to the revenue from the DuPont Crop Protection Acquisition, which was completed on November 1, 2017, and contributed approximately $1,742 million to the increase.
Segment EBITDA of
$1,217.8 million
increased
by
$641.7 million
, or approximately
111 percent
, compared to the prior year period. The increase was primarily driven by the addition of the results from the acquired DuPont Crop Protection Business.
Refer to the
FMC Agricultural Solutions Pro Forma Financial Results with the DuPont Crop Protection Business
section below for further discussion.
2017
vs.
2016
Revenue of $2,531.2 million increased approximately 11 percent versus the prior year period. Higher volumes contributed 12 percent to the increase while favorable foreign currency had an impact of 1 percent. The acquired DuPont Crop Protection Business contributed 8 percent to these higher volumes, or approximately $193 million. These increases were partially offset by lower pricing which impacted revenue by 2 percent.
Segment EBITDA of
$576.1 million
increased approximately
20 percent
compared to the year-ago period. The higher volumes discussed above impacted the change in EBITDA by approximately 43 percent and favorable foreign currency impacted the change in EBITDA by approximately 5 percent. The acquired business represented a majority of these higher volumes. Offsetting these increases were lower pricing which had an unfavorable impact of approximately 11 percent as well as higher costs which unfavorably impacted the segment by approximately 17 percent to the increase. The higher costs were also due to the recently acquired business.
FMC Agricultural Solutions Pro Forma Financial Results with the DuPont Crop Protection Business
We began to present pro forma combined results for the FMC Agricultural Solutions segment in the first quarter of 2018. We believe that reviewing our operating results by combining actual and pro forma results for the FMC Agricultural Solutions segment is more useful in identifying trends in, or reaching conclusions regarding, the overall operating performance of this segment. Our pro forma segment information includes adjustments as if the DuPont Crop Protection Business Acquisition had occurred on January 1, 2016. Our pro forma data is also adjusted for the effects of acquisition accounting but does not include adjustments for
24
costs related to integration activities, cost savings or synergies that might be achieved by the combined businesses. Pro forma amounts presented are not necessarily indicative of what our results would have been had we operated the DuPont Crop Protection Business since January 1, 2016, nor our future results.
|
FMC Agricultural Solutions Pro Forma Financial Results
|
|||||||||||
|
Year Ended December 31,
|
|||||||||||
|
(in Millions)
|
2018
|
2017
|
2016
|
||||||||
|
Revenue
|
|||||||||||
|
Revenue, FMC Agricultural Solutions, as reported
(1)
|
$
|
4,285.3
|
|
$
|
2,531.2
|
|
$
|
2,274.8
|
|
||
|
Revenue, DuPont Crop Protection Business, pro forma
(2)
|
—
|
|
1,325.4
|
|
1,439.3
|
|
|||||
|
Pro Forma Combined, Revenue
(3) (4)
|
$
|
4,285.3
|
|
$
|
3,856.6
|
|
$
|
3,714.1
|
|
||
|
EBITDA
|
|||||||||||
|
EBITDA, FMC Agricultural Solutions, as reported
(1)
|
$
|
1,217.8
|
|
$
|
576.1
|
|
$
|
480.7
|
|
||
|
EBITDA, DuPont Crop Protection Business, pro forma
(2)
|
—
|
|
486.5
|
|
562.3
|
|
|||||
|
Pro Forma Combined, EBITDA
(3) (4)
|
$
|
1,217.8
|
|
$
|
1,062.6
|
|
$
|
1,043.0
|
|
||
___________________
|
(1)
|
As reported amounts are the results of operations of FMC Agricultural Solutions, including the results of the DuPont Crop Protection Acquisition from November 1, 2017 onward.
|
|
(2)
|
DuPont Crop Protection Business pro forma amounts include the historical results of the DuPont Crop Protection Business, prior to November 1, 2017. These amounts also include adjustments as if the DuPont Crop Protection Business Acquisition had occurred on January 1, 2016, including the effects of acquisition accounting. The pro forma amounts do not include adjustments for expenses related to integration activities, cost savings or synergies that may have been or may be achieved by the combined segment.
|
|
(3)
|
The pro forma combined amounts are not necessarily indicative of what the results would have been had we acquired the DuPont Crop Protection Business on January 1, 2016 or indicative of future results.
|
|
(4)
|
For the year ended
December 31, 2018
, pro forma results and actual results are the same.
|
|
FMC Agricultural Solutions Pro Forma Combined Revenue by Region
(1) (2)
|
|||||||||||
|
Year Ended December 31,
|
|||||||||||
|
(in Millions)
|
2018
|
2017
|
2016
|
||||||||
|
Europe, Middle East and Africa (EMEA)
(3)
|
$
|
966.0
|
|
$
|
920.8
|
|
$
|
902.8
|
|
||
|
North America
(4)
|
1,090.8
|
|
941.3
|
|
859.1
|
|
|||||
|
Latin America
(5)
|
1,210.1
|
|
1,021.1
|
|
1,023.1
|
|
|||||
|
Asia
(6)
|
1,018.4
|
|
973.4
|
|
929.1
|
|
|||||
|
Total
|
$
|
4,285.3
|
|
$
|
3,856.6
|
|
$
|
3,714.1
|
|
||
|
(1)
|
For the year ended December 31, 2018, pro forma results and actual results are the same.
|
|
(2)
|
Pro forma combined revenue by region for the years ended December 31, 2017 and 2016 includes the results of the DuPont Crop Protection Business of
$1,325.4 million
and
$1,439.3 million
, respectively, assuming the acquisition occurred on January 1, 2016. These amounts include adjustments as if the DuPont Crop Protection Business Acquisition had occurred on January 1, 2016. The pro forma combined revenue by region amounts are not necessarily indicative of what the results would have been had we acquired the DuPont Crop Protection Business on January 1, 2016 or indicative of future results.
|
|
(3)
|
Increase in the year ended December 31, 2018 was due primarily to strong growth of the acquired insecticides and herbicides, the move to direct market access in France, as well as sales synergies of legacy FMC products. These were partially offset by a forced divestiture (anti-trust remedy), unfavorable weather conditions that led to a shorter growing season and lower demand in Northern and Central Europe.
|
|
(4)
|
Increase in the year ended December 31, 2018 was due to very strong demand for the acquired insecticides, growth in U.S. soy acreage in 2018, and strong demand across niche crops. These were partially offset by unfavorable impacts from the delayed start to the Spring season.
|
|
(5)
|
Increase in the year ended December 31, 2018 was due to strong growth for the acquired insecticides in soybean and other crops, strong acreage growth in cotton and higher prices in Brazil as well as higher wheat acreage in Argentina. Partially offsetting these increases were unfavorable foreign currency impacts and severe drought in Argentina.
|
|
(6)
|
Increase in the year ended December 31, 2018 was due to strong performance in rice and soy insecticides in India and growth in rice herbicides in China which was partially offset by a forced divestiture in India (anti-trust remedy), the rationalization of the legacy portfolio in India and extreme drought conditions in Australia.
|
25
Pro Forma Combined Results -
2018
vs.
2017
Pro forma combined revenue of
$4,285.3 million
increased by approximately 11 percent versus the prior year period. Refer to the
FMC Agricultural Solutions Pro Forma Combined Revenue by Region
chart above for further discussion.
Pro forma combined segment EBITDA of
$1,217.8 million
increased approximately 15 percent compared to the prior year. The increase was primarily driven by revenue growth discussed above as our sales organization leveraged valuable cross-selling opportunities due to minimal customer overlap with DuPont. Additionally, we reduced expected operating costs for the acquired DuPont Crop Protection Business through accelerated functional integration, leveraging our back office infrastructure and reducing manufacturing costs at the acquired plants. These were partially offset by higher raw material costs which have had a negative impact on results year over year. This is impacting the chemical industry broadly as the Chinese government has been shutting down industrial parks as part of their environmental program. We have been able to mitigate and manage the impact on our ability to supply our customer due to our diversified supply chain network.
For
2019
, full-year segment revenue is expected to be approximately
$4.45 billion
to
$4.55 billion
.
FMC Lithium
|
(in Millions)
|
Year Ended December 31,
|
||||||||||
|
2018
|
2017
|
2016
|
|||||||||
|
Segment Revenue
|
$
|
442.5
|
|
$
|
347.4
|
|
$
|
264.1
|
|
||
|
Segment EBITDA
|
195.7
|
|
141.9
|
|
85.0
|
|
|||||
2018
vs.
2017
Revenue of
$442.5 million
increased
by approximately
27 percent
versus the prior-year period primarily driven by
higher
volumes which impacted revenue by approximately
21 percent
. Additionally,
improved
pricing and mix added approximately
8 percent
to the change in revenue. Foreign currency had an unfavorable impact on the change in revenue of approximately 2 percent.
Segment EBITDA of
$195.7 million
increased
approximately
$54 million
versus the year ago period. The
higher
volumes noted above impacted EBITDA by
$46 million
while
improved
pricing and mix had an approximately
$27 million
impact. These increases were offset by approximately
$20 million
in costs due to
higher
raw material prices as well as standalone costs related to the separation of Livent. Foreign currency had a slightly unfavorable impact on the change in EBITDA.
We announced that we will distribute the remaining Livent shares on March 1, 2019. At that time, results of FMC Lithium will move to discontinued operations.
2017
vs.
2016
Revenue of $347.4 million increased by approximately 32 percent versus the prior-year period driven by improved pricing and mix, which accounted for a 23 percent increase. Additionally, higher volumes impacted revenue by 9 percent. Foreign currency had a minimal impact on the change in revenue.
Segment EBITDA of
$141.9 million
increased approximately $57 million versus the year ago period. The improved pricing and mix noted above impacted EBITDA by approximately $60 million while volume contributed to the change by approximately $11 million. These increases were offset by higher raw material prices and energy prices as well as expansion related costs by approximately $13 million. Foreign currency had a negative impact of less than $1 million on the change in EBITDA.
Corporate and other
Corporate expenses are included as a component of the line item “Selling, general and administrative expenses” except for last in, first-out (LIFO) related charges that are included as a component of "Cost of sales and other services" on our consolidated statements of income (loss).
2018
vs.
2017
Corporate and other expenses of
$108.9 million
increased
by
$13.8 million
from
$95.1 million
in
2017
. The increase was primarily driven by higher LIFO expense of approximately $5 million compared to the prior year. Additionally, the increase was due to negative foreign currency impacts of approximately $3 million, which was mainly due to the foreign exchange impacts on intercompany fund movements in 2018.
2017
vs.
2016
26
Corporate and other expenses of
$95.1 million
increased by $15.5 million from
$79.6 million
in 2016. The increase was driven by approximately $6 million of corporate incentives due to higher business results and share-based compensation. Additionally, the prior period included approximately $7 million of LIFO income that did not recur in 2017. The remaining increase was due to other corporate items including corporate facility costs, foreign exchange losses and other shared corporate costs.
Depreciation and amortization
2018
vs.
2017
Depreciation and amortization of
$168.2 million
increased
$55.2 million
as compared to
2017
of
$113.0 million
. Approximately $56 million of the increase was due to the increase in intangible assets and property, plant and equipment acquired as a result of the DuPont Crop Protection Business.
2017
vs.
2016
Depreciation and amortization of
$113.0 million
increased
$12.4 million
as compared to the prior year of
$100.6 million
. Approximately $14 million of the increase was due to the increase in intangible assets and property, plant and equipment acquired as a result of the DuPont Crop Protection Business partially offset by decreased depreciation and amortization expense in the legacy FMC Agricultural Solutions segment.
Interest expense, net
2018
vs.
2017
Interest expense, net of
$133.1 million
increased
by approximately
68 percent
compared to
$79.1 million
in
2017
. The increase was driven by the addition of the 2017 Term Loan Facility which increased interest expense by approximately $30 million, and higher interest rates which increased interest expense by approximately $6 million. The remaining increase of approximately $17 million was due to zero interest allocated to discontinued operations in 2018 as compared to 2017, due to the divestment of the FMC Health and Nutrition business to DuPont in 2017. Interest was previously allocated in accordance with relevant discontinued operations accounting guidance.
2017
vs.
2016
Interest expense, net of $79.1 million increased by approximately 26 percent compared to $62.9 million in 2016. The increase was driven by the impacts of higher foreign debt balances of approximately $6 million, the addition of the 2017 Term Loan Facility of $6 million, and increases in interest rates of approximately $4 million.
Corporate special charges (income)
Restructuring and other charges (income)
Our restructuring and other charges (income) are comprised of restructuring, assets disposals and other charges (income) as described below:
|
|
Year Ended December 31,
|
||||||||||
|
(in Millions)
|
2018
|
2017
|
2016
|
||||||||
|
Restructuring charges
|
$
|
126.4
|
|
$
|
16.3
|
|
$
|
43.4
|
|
||
|
Other charges (income), net
|
(62.7
|
)
|
65.1
|
|
51.6
|
|
|||||
|
Total restructuring and other charges (income)
(1)
|
$
|
63.7
|
|
$
|
81.4
|
|
$
|
95.0
|
|
||
_______________
(1) See Note 8 to the consolidated financial statements included in this Form 10-K for more information.
2018
Restructuring and asset disposal charges in
2018
were primarily associated with restructuring charges within FMC Agricultural Solutions associated with the integration of the DuPont Crop Protection Business. These charges primarily consisted of approximately
$59 million
of charges related to the change in our market access model in India and approximately
$28 million
of charges due to our decision to exit the Ewing R&D center as discussed above. Refer to Note 8 for more information. Other restructuring charges within FMC Agricultural Solutions as we continue to integrate the acquired DuPont Crop Protection Business totaled approximately
$22 million
.
27
Other charges (income), net in
2018
primarily consists of income from the gain on sales of
$87.2 million
from the divestment of a portion of FMC's European herbicide portfolio to Nufarm Limited and certain products of our India portfolio to Crystal Crop Protection Limited. These divestitures satisfied FMC's commitment to the European Commission and the Competition Commission of India, respectively, for regulatory requirements in order to complete the DuPont Crop Protection Acquisition. Additionally, there were environmental related charges of
$21.9 million
for remediation activities and $2.6 million of other charges.
2017
Restructuring and asset disposal charges in 2017 were primarily associated with charges in our FMC Lithium segment of $7.8 million related to miscellaneous restructuring. There were also impairment charges of intangible assets within FMC Agricultural Solutions of $2.2 million. In Corporate, there were asset write-downs of approximately $5.5 million. Amounts also include miscellaneous restructuring charges of $0.8 million.
Other charges (income), net in 2017 consisted of a $42.1 million impairment on certain indefinite-lived intangible assets from the acquired DuPont Crop Protection Business Acquisition as a result of a triggering event due to the Act. Other charges (income) also includes $16.6 million for continuing environmental sites treated as Corporate charges. Additionally, we incurred exit costs of $4.8 million resulting from the termination and de-consolidation of our interest in a variable interest entity that was previously consolidated and was part of our FMC Agricultural Solutions segment. We had other miscellaneous charges, net of approximately $1.6 million.
2016
Restructuring and asset disposal charges in 2016 totaled $43.4 million. Included in this were final charges totaling $42.3 million associated with the integration of Cheminova into our existing FMC Agricultural Solutions segment. This amount included final adjustments to severances, long lived asset write offs, contract termination costs and other miscellaneous items. There were miscellaneous restructuring charges of $1.1 million.
Other charges (income), net in 2016 consisted of $36.8 million for continuing environmental sites treated as Corporate charges, $13.2 million associated with a license agreement to obtain certain technology and intellectual property rights for new compounds still under development and $4.2 million as a result of the Argentina government's action to devalue its currency. These charges were partially offset by other miscellaneous income of $2.6 million.
Non-operating pension and postretirement (charges) income
Non-operating pension and postretirement (charges) income are included in “Selling, general and administrative expenses” on our consolidated statements of income (loss).
2018
vs.
2017
The charge for
2018
was
$3.8 million
compared to
$18.2 million
in
2017
. 2017 included $35.7 million of settlement charges primarily related to the termination of our U.K. Plan. The decrease in settlements was partially offset by lower expected return on plan assets due to the shift to a primarily fixed income investment portfolio of
$15.5 million
versus 2017. See Note 14 for more information.
2017
vs.
2016
The charge for 2017 was $18.2 million compared to $23.4 million in 2016. The decrease was the result of $22.8 million lower amortization of net actuarial losses as a result of a change in estimate in fiscal 2017 to amortize the gains and losses over the expected life time of the inactive population rather than the average remaining service period of the active participants which was partially offset by an increase of $15.4 million for recognized losses due to plan settlements. See Note 14 for more information.
Transaction-related charges
A detailed description of the transaction related charges is included in Note 20 to the consolidated financial statements included within this Form 10-K and in the Segment Results Reconciliation above within the "
Results of Operations
" section of the Management's Discussion and Analysis.
Provision for income taxes
A significant amount of our earnings is generated by our foreign subsidiaries (e.g., Singapore and Hong Kong), which tax earnings at lower rates than the United States federal statutory rate. Our future effective tax rates may be materially impacted by numerous items including: a future change in the composition of earnings from foreign and domestic tax jurisdictions, as earnings in foreign jurisdictions are typically taxed at more favorable rates than the United States federal statutory rate; accounting for uncertain tax positions; business combinations; expiration of statute of limitations or settlement of tax audits; changes in valuation allowance;
28
changes in tax law; and the potential decision to repatriate certain future foreign earnings on which United States or foreign withholding taxes have not been previously accrued.
Provision for income taxes for 2018 was expense of
$88.8 million
resulting in an effective tax rate of
11.9 percent
. Provision for income taxes for 2017 was expense of
$264.1 million
resulting in an effective tax rate of
146.1 percent
primarily attributable to the $315.9 million of provisional tax expense associated with the Act. Provision for income taxes for 2016 was
$50.1 million
resulting in an effective tax rate of
27.7 percent
. Note 12 to the consolidated financial statements included in this Form 10-K includes more details on the drivers of the GAAP effective rate and year-over-year changes. We believe showing the reconciliation below of our GAAP to Non-GAAP effective tax rate provides investors with useful supplemental information about our tax rate on the core underlying business.
|
|
Twelve Months Ended December 31,
|
|||||||||||||||||||||||||
|
2018
|
2017
|
2016
|
||||||||||||||||||||||||
|
(in Millions)
|
Income (Expense)
|
Tax Provision (Benefit)
|
Effective Tax Rate
|
Income (Expense)
|
Tax Provision (Benefit)
|
Effective Tax Rate
|
Income (Expense)
|
Tax Provision (Benefit)
|
Effective Tax Rate
|
|||||||||||||||||
|
GAAP - Continuing operations
|
$
|
743.7
|
|
$
|
88.8
|
|
11.9
|
%
|
$
|
180.8
|
|
$
|
264.1
|
|
146.1
|
%
|
$
|
180.8
|
|
$
|
50.1
|
|
27.7
|
%
|
||
|
Corporate special charges
|
259.6
|
|
59.4
|
|
250.0
|
|
67.5
|
|
141.8
|
|
44.9
|
|
||||||||||||||
|
Tax adjustments
(1)
|
(10.5
|
)
|
(271.7
|
)
|
(32.4
|
)
|
||||||||||||||||||||
|
$
|
1,003.3
|
|
$
|
137.7
|
|
13.7
|
%
|
$
|
430.8
|
|
$
|
59.9
|
|
13.9
|
%
|
$
|
322.6
|
|
$
|
62.6
|
|
19.4
|
%
|
|||
|
(1)
|
Tax adjustments in 2018 and 2017 are materially attributable to the effects of the Act and primarily relate to the one-time transition tax, the decrease in the U.S. federal tax rate, and the realizability of certain U.S. state deferred tax assets. Tax adjustments in 2017 were primarily associated with the provisional income tax expense recorded as a result of the enactment of the Act in December 2017. See Note 12 to the consolidated financial statements included within this Form 10-K for additional discussion. Tax adjustments in 2016 were primarily associated with valuation allowance adjustments to U.S. state deferred tax balances.
|
The primary drivers for the decrease in the year-to-date effective tax rate for 2018 compared to 2017 and 2017 compared to 2016 are shown in the table above. The remaining change for 2017 compared to 2016 was due to reduced domestic earnings in our FMC Agricultural Solutions business and the impact of the full integration of Cheminova into our global supply chain.
Discontinued operations, net of income taxes
Our discontinued operations, in periods up to its sale, represent our discontinued FMC Health and Nutrition and FMC Alkali Chemicals business results as well as adjustments to retained liabilities from other previously discontinued operations. The primary liabilities retained include environmental liabilities, other postretirement benefit liabilities, self-insurance, long-term obligations related to legal proceedings and historical restructuring activities. See Note 10 to the consolidated financial statements for additional details on our discontinued operations.
2018
vs.
2017
Discontinued operations, net of income taxes represented
a loss
of
$143.4 million
in
2018
compared to
income
of
$621.7 million
in
2017
. The decrease was primarily driven by the divestiture of FMC Health and Nutrition to DuPont in the fourth quarter of 2017 which resulted in an after-tax gain of approximately
$727 million
, which did not recur in 2018. Discontinued operations, net of income taxes, in 2017 also includes the impairment charge of approximately
$148 million
, net of tax, to reflect the write down of our Omega-3 business to its sales price. During 2018, we recorded a charge of approximately $106 million as a result of active negotiations for a settlement agreement primarily to address discontinued operations at our Middleport, New York plant which was the subject of an Administrative Order on Consent entered into with the EPA and NYSDEC in 1991. The charge consists of incremental estimated costs of remediation for certain offsite operable units associated with historic site operations as we engage in settlement discussions with NYSDEC to resolve the path forward regarding remediation. Refer to Note 11 for further details.
2017
vs.
2016
Discontinued operations, net of income taxes represented income of $621.7 million in 2017 compared to income of $81.0 million in 2016. The increase was primarily driven by the divestiture of FMC Health and Nutrition to DuPont which resulted in an after-tax gain of approximately $727 million. Amount also includes the impairment charge of approximately $148 million, net of tax, to reflect the write down our Omega-3 business to its sales price.
29
Net income (loss) attributable to FMC stockholders
2018
vs.
2017
Net income attributable to FMC stockholders
decreased
to
$502.1 million
from
$535.8 million
. The
decrease
was primarily due to the gain on sale recorded in discontinued operations, net of income taxes in the prior year as well as charges related to the Middleport environmental settlement as discussed above. These were offset by higher income from continuing operations driven by a full year of results from the Dupont Crop Protection Business, which was completed on November 1, 2017.
2017
vs.
2016
Net income attributable to FMC stockholders increased to $535.8 million from $209.1 million. The increase was primarily due to the gain on sale recorded in discontinued operations, net of income taxes as discussed above, offset by the impacts of U.S. Tax Reform and increases in acquisition-related charges. Refer to Note 12 to the consolidated financial statements included within this Form 10-K.
30
Liquidity and Capital Resources
Cash and cash equivalents at
December 31, 2018
and
2017
, were
$161.7 million
and
$283.0 million
, respectively. Of the cash and cash equivalents balance at
December 31, 2018
,
$107.2 million
was held by our foreign subsidiaries. As a result of the Act, in 2017 we recognized a one-time transition tax on the deemed repatriation of foreign earnings and the remeasurement of the Company’s U.S. net deferred tax asset. See Note 12 to the consolidated financial statements included within this Form 10-K for more information. The cash held by foreign subsidiaries for permanent reinvestment is generally used to finance the subsidiaries’ operating activities and future foreign investments. We have not provided income taxes for any additional outside basis differences inherent in our investments in subsidiaries because the investments and related unremitted earnings are essentially permanent in duration or we have concluded that no additional tax liability will arise upon disposal. See Note 12 to the consolidated financial statements included within this Form 10-K for more information.
Pursuant to the terms of the separation and distribution agreement, on October 18, 2018, we received a net distribution of approximately $317 million from Livent representing the proceeds from the sale of its common stock as part of the IPO, net of underwriting discounts and commissions and other offering related expenses. On October 31, 2018, we used $150 million of those proceeds to further pay down term loan debt. This increased our cumulative debt reduction in 2018 to approximately $550 million. On November 15, 2018, we received an additional net distribution of approximately $48 million from Livent representing the proceeds from the exercise by the underwriters of their option to purchase additional shares.
At
December 31, 2018
, we had total debt of
$2,726.7 million
as compared to
$3,185.6 million
at
December 31, 2017
. Total debt included
$2,179.0 million
and
$2,993.0 million
of long-term debt (excluding current portions of
$386.0 million
and
$101.2 million
) at
December 31, 2018
and
2017
, respectively. As of
December 31, 2018
, we were in compliance with all of our debt covenants. See Note 13 in the consolidated financial statements included in this Form 10-K for further details.
The
decrease
in long-term debt was due to the repayment of the 2014 Term Loan Facility. At
December 31, 2018
,
$1,400.0 million
remained outstanding under the 2017 Term Loan Facility, which is scheduled to mature on November 1, 2022. The borrowings under the 2017 Term Loan Facility will bear interest at a floating rate, which will be a base rate or a Eurocurrency rate equal to the London interbank offered rate for the relevant interest period, plus in each case an applicable margin, as determined in accordance with the provisions of the 2017 Term Loan Facility.
Our short-term debt consists of foreign borrowings and our commercial paper program. Foreign borrowings
increased
from
$91.4 million
at
December 31, 2017
to
$106.5 million
at
December 31, 2018
while outstanding commercial paper
increased
$
55.2 million
from
zero
at
December 31, 2017
.
Our commercial paper program allows us to borrow at rates generally more favorable than those available under our credit facility. At
December 31, 2018
, we had
$55.2 million
outstanding under the commercial paper program and the average effective interest rate on these borrowings during the period was
3.1 percent
.
Revolving Credit Agreement Amendment
On September 28, 2018, we entered into Amendment No. 1 (“Revolving Credit Amendment”) to that certain Second Amended and Restated Credit Agreement, dated as of May 2, 2017. The Revolving Credit Amendment amends the Revolving Credit Agreement in order to permit the previously disclosed separation and spin-off of FMC Lithium, as set forth in the Revolving Credit Amendment.
2017 Term Loan Agreement Amendment
On September 28, 2018, we entered into Amendment No. 1 (“2017 Term Loan Amendment”) to that certain Term Loan Agreement, dated as of May 2, 2017. The 2017 Term Loan Amendment amends the 2017 Term Loan Agreement in order to permit our previously disclosed separation and spin-off of the FMC Lithium segment, as set forth in the 2017 Term Loan Amendment.
2014 Term Loan Agreement Amendment
On September 28, 2018, we entered into Amendment No. 4 (“2014 Term Loan Amendment”) to that certain Term Loan Agreement, dated as of October 10, 2014. The 2014 Term Loan Amendment amends the 2014 Term Loan Agreement in order to permit our previously disclosed separation and spin-off of the FMC Lithium business, as set forth in the 2014 Term Loan Amendment.
31
FMC Lithium Revolving Credit Facility
On September 28, 2018, our Lithium segment entered into a credit agreement among its subsidiary, FMC Lithium USA Corp., as borrowers (the “Borrowers”), certain of FMC Lithium's wholly owned subsidiaries as guarantors, the lenders party thereto (the “Lenders”), Citibank, N.A., as administrative agent, and certain other financial institutions party thereto, as joint lead arrangers (the “Credit Agreement”). The Credit Agreement provides for a $400 million senior secured revolving credit facility, $50 million of which is available for the issuance of letters of credit for the account of the Borrowers, with an option, subject to certain conditions and limitations, to increase the aggregate amount of the revolving credit commitments to $600 million (the “Revolving Credit Facility”). The issuance of letters of credit and the proceeds of revolving credit loans made pursuant to the Revolving Credit Facility are available, and will be used, for general corporate purposes, including capital expenditures and permitted acquisitions, of the Borrowers and their subsidiaries.
Amounts under the Revolving Credit Facility may be borrowed, repaid and re-borrowed from time to time until the final maturity date of the Revolving Credit Facility, which will be the fifth anniversary of the Revolving Credit Facility’s effective date. Voluntary prepayments and commitment reductions under the Revolving Credit Facility are permitted at any time without any prepayment premium upon proper notice and subject to minimum dollar amounts.
Revolving loans under the Credit Agreement will bear interest at a floating rate, which will be a base rate or a Eurodollar rate equal to the London interbank offered rate for the relevant interest period, plus, in each case, an applicable margin based on the Lithium segment's leverage ratio, as determined in accordance with the provisions of the Credit Agreement. The base rate will be the greatest of: the rate of interest announced publicly by Citibank, N.A. in New York City from time to time as its “base rate”; the federal funds effective rate plus 0.5%; and a Eurodollar rate for a one-month interest period plus 1%. Each borrower on a joint and several basis is required to pay a commitment fee quarterly in arrears on the average daily unused amount of each Lender’s revolving credit commitment at a rate equal to an applicable percentage based on the Lithium segment’s leverage ratio, as determined in accordance with the provisions of the Credit Agreement. The applicable margin and the commitment fee are subject to adjustment as provided in the Credit Agreement.
The Borrowers’ present and future domestic material subsidiaries (the “Guarantors”) will guarantee the obligations of the Borrowers under the Revolving Credit Facility. The obligations of the Borrowers and the Guarantors are secured by all of the present and future assets of the Borrowers and the Guarantors, including the Borrowers’ facility and real estate in Bessemer City, North Carolina, subject to certain exceptions and exclusions as set forth in the Credit Agreement and other security and collateral documents.
The Credit Agreement contains certain affirmative and negative covenants that are binding on the Borrowers and their subsidiaries, including, among others, restrictions (subject to exceptions and qualifications) on the ability of the Borrowers and their subsidiaries to create liens, to undertake fundamental changes, to incur debt, to sell or dispose of assets, to make investments, to make restricted payments such as dividends, distributions or equity repurchases, to change the nature of their businesses, to enter into transactions with affiliates and to enter into certain burdensome agreements.
32
Statement of Cash Flows
Cash provided (required) by operating activities was
$446.0 million
,
$314.5 million
and
$368.9 million
for
2018
,
2017
and
2016
, respectively.
The table below presents the components of net cash provided (required) by operating activities.
|
(in Millions)
|
Twelve months ended December 31,
|
||||||||||
|
2018
|
2017
|
2016
|
|||||||||
|
Income (loss) from continuing operations before equity in (earnings) loss of affiliates, non-operating pension expense and postretirement charges, interest expense, net and income taxes
|
$
|
880.5
|
|
$
|
278.0
|
|
$
|
266.6
|
|
||
|
Restructuring and other charges (income), transaction-related charges and depreciation and amortization
|
424.0
|
|
344.8
|
|
219.5
|
|
|||||
|
Operating income before depreciation and amortization (Non-GAAP)
|
$
|
1,304.5
|
|
$
|
622.8
|
|
$
|
486.1
|
|
||
|
Change in trade receivables, net
(1)
|
(302.2
|
)
|
(262.4
|
)
|
11.8
|
|
|||||
|
Change in inventories
(2)
|
(224.2
|
)
|
(96.8
|
)
|
79.0
|
|
|||||
|
Change in accounts payable
(3)
|
182.3
|
|
331.7
|
|
(29.7
|
)
|
|||||
|
Change in accrued customer rebates
(4)
|
104.1
|
|
16.9
|
|
(5.2
|
)
|
|||||
|
Change in advance payments from customers
(5)
|
78.4
|
|
140.5
|
|
(10.0
|
)
|
|||||
|
Change in all other operating assets and liabilities
(6)
|
(213.7
|
)
|
(166.9
|
)
|
84.8
|
|
|||||
|
Operating cash flows (Non-GAAP)
|
$
|
929.2
|
|
$
|
585.8
|
|
$
|
616.8
|
|
||
|
Restructuring and other spending
(7)
|
(26.5
|
)
|
(8.2
|
)
|
(18.0
|
)
|
|||||
|
Environmental spending, continuing, net of recoveries
(8)
|
(20.5
|
)
|
(20.5
|
)
|
(28.1
|
)
|
|||||
|
Pension and other postretirement benefit contributions
(9)
|
(37.5
|
)
|
(56.5
|
)
|
(65.8
|
)
|
|||||
|
Net interest payments
(10)
|
(133.4
|
)
|
(82.2
|
)
|
(62.0
|
)
|
|||||
|
Tax payments, net of refunds
(11)
|
(135.3
|
)
|
(25.0
|
)
|
(50.2
|
)
|
|||||
|
Excess tax benefits from share-based compensation
(12)
|
—
|
|
—
|
|
(0.4
|
)
|
|||||
|
Transaction-related legal and professional fees
(13)
|
(130.0
|
)
|
(78.9
|
)
|
(23.4
|
)
|
|||||
|
Cash provided (required) by operating activities of continuing operations
|
$
|
446.0
|
|
$
|
314.5
|
|
$
|
368.9
|
|
||
|
(1)
|
The changes in cash flows related to trade receivables in
2018
and
2017
were primarily driven by timing of collections largely due to seasonality. Additionally, the change in 2018 was related to receivable build from the acquired DuPont Crop Protection Business as we did not acquire any receivables as part of the transaction. Collection timing is more pronounced in our FMC Agricultural Solutions business where sales, particularly in Brazil, can have a longer collection period. Additionally, timing of collection is impacted as amounts for both periods include carry-over balances remaining to be collected in Latin America, where collection periods are measured in months rather than weeks. During
2018
, we collected approximately $900 million of receivables in Brazil. A significant proportion of the collections in Brazil are coming from those accounts that were past due at the start of the year, improving the quality of the remaining receivable balance.
|
|
(2)
|
Changes in inventory are a result of inventory levels being adjusted to take into consideration the change in market conditions primarily in FMC Agricultural Solutions. The increase was also driven by higher sales and recovering inventory levels due to a faster return to full production from our China toll manufacturing partners.
|
|
(3)
|
Accounts payable in both 2018 and 2017 was primarily impacted by the payable build from the acquired DuPont Crop Protection Business as we did not acquire any payables as part of the transaction, as well as the timing of payments made to suppliers and vendors.
|
|
(4)
|
These rebates are associated with our FMC Agricultural Solutions segment in North America and Brazil and generally settled in the fourth quarter of each year. The changes year over year are primarily associated with the mix in sales eligible for rebates and incentives in
2018
compared to
2017
and timing of rebate payments, and we did not acquire the rebates of the DuPont Crop Protection Business.
|
|
(5)
|
The advance payments from customers represent advances from our FMC Agricultural Solutions segment customers. Revenue associated with advance payments is recognized, generally in the first quarter of each year, as shipments are made and title, ownership and risk of loss pass to the customer.
|
|
(6)
|
Changes in all periods presented primarily represent timing of payments associated with all other operating assets and liabilities, including guarantees issued to vendors under our vendor finance program. Additionally, the 2018 period includes the effects of the unfavorable contracts amortization of approximately
$103 million
.
|
|
(7)
|
See Note 8 to the consolidated financial statements included in this Form 10-K for further details.
|
|
(8)
|
Included in our results for each of the years presented are environmental charges for environmental remediation at our operating sites of $
21.9 million
, $
16.6 million
and $
36.8 million
, respectively. The amounts in
2018
will be spent in future years. The amounts represent environmental remediation spending at our operating sites which were recorded against pre-existing reserves, net of recoveries.
|
33
Environmental obligations for continuing operations primarily represent obligations at shut down or abandoned facilities within businesses that do not meet the criteria for presentation as discontinued operations.
|
(9)
|
Amounts include voluntary contributions to our U.S. qualified defined benefit plan of
$30.0 million
,
$44.0 million
and
$35.0 million
, respectively.
|
|
(10)
|
The increase in interest payments is primarily due to higher foreign debt balances, the addition of the 2017 Term Loan Facility, and increases in interest rates.
|
|
(11)
|
Tax payments in 2018 primarily represent the payments of tax attributable to the FMC Health and Nutrition segment disposition, transition tax and tax payments related to the integration of the DuPont Crop Protection Business.
|
|
(12)
|
Amounts are presented as a financing activity in the consolidated statement of cash flows in 2016 from share-based compensation.
|
|
(13)
|
2018 and 2017 activity primarily represents payments for legal and professional fees associated with the DuPont Crop Protection Business Acquisition in addition to costs related to integrating the DuPont Crop Protection Business as well as spending for separation related activities. 2016 activity represents payments for legal and professional fees associated with the Cheminova acquisition. See Note 4 to the consolidated financial statements for more information.
|
Cash provided (required) by operating activities of discontinued operations was
$(77.6) million
,
$21.0 million
and
$128.9 million
for
2018
,
2017
and
2016
, respectively.
Cash required by operating activities of discontinued operations is directly related to environmental, other postretirement benefit liabilities, self-insurance, long-term obligations related to legal proceedings and historical restructuring activities.
Amounts in 2017 and 2016 included the operating activities of our discontinued FMC Health and Nutrition segment. Amounts in 2017 were partially offset by divestiture costs associated with the sale of FMC Health and Nutrition, which was completed on November 1, 2017.
Cash provided (required) by investing activities of continuing operations was
$(115.9) million
,
$(1,349.5) million
and
$(100.8) million
for
2018
,
2017
and
2016
, respectively.
Cash required in 2018 is primarily due to the sale of product portfolios of approximately
$88.0 million
that were required to complete the DuPont Crop Protection Business Acquisition, fully offset by higher capital expenditure spending in 2018 as well as incremental capitalizable corporate level spending associated with the implementation of a new SAP system.
The change in cash required by investing activities in 2017 is primarily due to the acquisition of the DuPont Crop Protection Business.
Cash provided (required) by investing activities of discontinued operations was
$(15.0) million
,
$15.7 million
and
$(34.4) million
for
2018
,
2017
and
2016
, respectively.
Cash required by investing activities of discontinued operations in 2018 represents the working capital payment associated with the divestiture of FMC Health and Nutrition.
Cash provided by investing activities of discontinued operations in 2017 includes the cash proceeds from the sale of the Omega-3 business for $38.0 million.
Cash provided (required) by financing activities was
$(363.3) million
,
$1,213.1 million
and
$(377.0) million
in
2018
,
2017
and
2016
, respectively.
The change in cash required by financing activities in 2018 is due to higher repayments of long-term debt of approximately $200 million as compared to 2017 and $200 million in repurchases of common stock in the current year as part of the publicly announced repurchase program. Additionally, there were borrowings of long-term debt in the prior year. The cash required in the current period was partially offset by the proceeds received from the IPO of FMC Lithium of
$363.6 million
.
The change in cash provided by financing activities in 2017 primarily related to the increase in proceeds from borrowings of long-term debt mostly to fund the DuPont Crop Protection Business Acquisition, partially offset by higher repayments of long-term debt during the year.
2019
outlook and other potential liquidity needs
In
2019
, we expect a continued improvement in cash generation. In aggregate, we expect operating cash flow (Non-GAAP) to increase driven by higher earnings, including the continued benefits from the integration of the DuPont Crop Protection Business, partially offset by higher working capital requirements in
2019
.
Our cash needs for
2019
outside of costs to separate FMC Lithium include operating cash requirements, capital expenditures, scheduled mandatory payments of long-term debt, dividend payments, share repurchases, contributions to our pension plans, environmental and asset retirement obligation spending and restructuring. Additionally, we expect to continue to incur costs associated with integrating the DuPont Crop Protection Business due to its significance and complexity. The majority of these costs are expected to completed by the first quarter of 2020. We plan to meet our liquidity needs through available cash, cash
34
generated from operations, commercial paper issuances and borrowings under our committed revolving credit facility. At
December 31, 2018
our remaining borrowing capacity under our credit facility was
$1,245.8 million
.
Projected
2019
capital expenditures and expenditures related to contract manufacturers are expected to increase, excluding FMC Lithium, to approximately $150 million. The increase is primarily driven by capacity expansion. Additionally, we will continue to incur spending associated with the two-year implementation of a new SAP system.
Projected
2019
spending includes approximately $75 million to $80 million of net environmental remediation spending at both our continuing and discontinued sites. This projected spending for 2019 includes spending as a result of active negotiations for a settlement agreement primarily to address discontinued operations at our Middleport, New York site. We expect the settlement will result in spending of approximately $20 million to $30 million per year for years 2019 - 2021, due to front loading of reimbursement in installments of past costs, and a $10 million maximum per year, on average, until the remediation is complete. This projected spending does not include expected spending on capital projects relating to environmental control facilities or expected spending for environmental compliance costs, which we will include as a component of "Costs of sales and services" in our consolidated statements of income (loss) since these amounts are not covered by established reserves. Capital spending to expand, maintain or replace equipment at our production facilities may trigger requirements for upgrading our environmental controls, which may increase our spending for environmental controls over the foregoing projections.
As a result of the Act, we will continue to pay the remaining
$161.3 million
of transition tax over the next seven years.
Our U.S. Pension Plan assets decreased from $
1,334.9 million
at
December 31, 2017
to $
1,265.0 million
at
December 31, 2018
. Our U.S. Pension Plan assets comprise approximately all of our total plan assets with the difference representing plan assets related to foreign pension plans. See Note 14 to the consolidated financial statements included within this Form 10-K for details on how we develop our long-term rate of return assumptions. We made contributions of $
30.0 million
and $
44.0 million
in
2018
and
2017
, respectively, and intend to contribute
$7 million
in
2019
. Our contributions in
2017
,
2018
and our intended contribution in
2019
are all in excess of the minimum requirements. Our contributions in excess of minimums are done with the objective of avoiding variable rate Pension Benefit Guaranty Corporation ("PBGC") premiums as well as potentially reducing future funding volatility. In 2017, we changed our U.S. qualified pension plan’s investment strategy to a liability hedging approach with an objective of minimizing funded status volatility. As a result, we expect lower contributions in future periods. The portfolio is comprised of
100 percent
fixed income securities and cash. Investment performance and related risks are measured and monitored on an ongoing basis through monthly liability measurements, periodic asset liability studies, and quarterly investment portfolio reviews.
During the year ended
December 31, 2018
,
2.4 million
shares were repurchased under the prior publicly announced repurchase program adopted in 2013. At
December 31, 2018
,
$1.0 billion
remained unused under our Board-authorized repurchase program. We intend to purchase a total of up to $500 million of our common shares in 2019. This repurchase program does not include a specific timetable or price targets and may be suspended or terminated at any time. Shares may be purchased through open market or privately negotiated transactions at the discretion of management based on its evaluation of market conditions and other factors. We also reacquire shares from time to time from employees in connections with vesting, exercise and forfeiture of awards under our equity compensation plans.
Dividends
On
January 17, 2019
, we paid dividends aggregating
$53.2 million
to our shareholders of record as of
December 31, 2018
. This amount is included in “Accrued and other liabilities” on the consolidated balance sheet as of
December 31, 2018
. For the years ended
December 31, 2018
,
2017
and
2016
, we paid
$89.2 million
,
$88.8 million
and
$88.6 million
in dividends, respectively.
Commitments
We provide guarantees to financial institutions on behalf of certain FMC Agricultural Solutions customers, principally Brazilian customers, for their seasonal borrowing. The total of these guarantees was
$71.3 million
at
December 31, 2018
. These guarantees arise during the ordinary course of business from relationships with customers and nonconsolidated affiliates. Non-performance by the guaranteed party triggers the obligation requiring us to make payments to the beneficiary of the guarantee. Based on our experience these types of guarantees have not had a material effect on our consolidated financial position or on our liquidity. Our expectation is that future payment or performance related to the non-performance of others is considered unlikely.
Short-term debt consisted of foreign credit lines and commercial paper at
December 31, 2018
and foreign credit lines at
December 31, 2017
. We provide parent-company guarantees to lending institutions providing credit to our foreign subsidiaries.
In connection with our property and asset sales and divestitures, we have agreed to indemnify the buyer for certain liabilities, including environmental contamination and taxes that occurred prior to the date of sale. Our indemnification obligations with respect to these liabilities may be indefinite as to duration and may or may not be subject to a deductible, minimum claim amount or cap. In cases where it is not possible for us to predict the likelihood that a claim will be made or to make a reasonable estimate of the maximum potential loss or range of loss, no specific liability has been recorded. If triggered, we may be able to recover
35
certain of the indemnity payments from third parties. In cases where it is possible, we have recorded a specific liability within our Reserve for Discontinued Operations. Refer to Note 10 for further details.
Our total significant committed contracts that we believe will affect cash over the next four years and beyond are as follows:
|
Contractual Commitments
|
Expected Cash Payments by Year
|
||||||||||||||||||||||
|
(in Millions)
|
2019
|
2020
|
2021
|
2022
|
2023 & beyond
|
Total
|
|||||||||||||||||
|
Debt maturities
(1)
|
$
|
547.7
|
|
$
|
2.2
|
|
$
|
200.7
|
|
$
|
1,501.8
|
|
$
|
484.2
|
|
$
|
2,736.6
|
|
|||||
|
Contractual interest
(2)
|
100.3
|
|
85.9
|
|
82.7
|
|
71.7
|
|
60.6
|
|
401.2
|
|
|||||||||||
|
Lease obligations
(3)
|
36.7
|
|
31.7
|
|
21.0
|
|
17.5
|
|
121.0
|
|
227.9
|
|
|||||||||||
|
Certain long-term liabilities
(4)
|
2.9
|
|
2.9
|
|
3.1
|
|
3.1
|
|
7.4
|
|
19.4
|
|
|||||||||||
|
Derivative contracts
(5)
|
—
|
|
—
|
|
—
|
|
—
|
|
—
|
|
—
|
|
|||||||||||
|
Purchase obligations
(6)
|
380.3
|
|
355.0
|
|
358.0
|
|
88.7
|
|
72.2
|
|
1,254.2
|
|
|||||||||||
|
Total
(7)
|
$
|
1,067.9
|
|
$
|
477.7
|
|
$
|
665.5
|
|
$
|
1,682.8
|
|
$
|
745.4
|
|
$
|
4,639.3
|
|
|||||
____________________
|
(1)
|
Excluding discounts.
|
|
(2)
|
Contractual interest is the interest we are contracted to pay on our long-term debt obligations. We had
$1,200 million
of long-term debt subject to variable interest rates at
December 31, 2018
. The rate assumed for the variable interest component of the contractual interest obligation was the rate in effect at
December 31, 2018
. Variable rates are determined by the market and will fluctuate over time.
|
|
(3)
|
Obligations associated with operating leases, before sub-lease rental income.
|
|
(4)
|
Obligations associated with our Shanghai, China research and technology center.
|
|
(5)
|
Derivative contracts were in a net asset position as of
December 31, 2018
. See Note 18 to the consolidated financial statements included within this Form 10-K. As a result, they are excluded from the table above.
|
|
(6)
|
Purchase obligations consist of agreements to purchase goods and services that are enforceable and legally binding and specify all significant terms, including fixed or minimum quantities to be purchased, price provisions and timing of the transaction. We have entered into a number of purchase obligations for the sourcing of materials and energy where take-or-pay arrangements apply. Since the majority of the minimum obligations under these contracts are take-or-pay commitments over the life of the contract and not a year by year take-or-pay, the obligations in the table related to these types of contacts are presented in the earliest period in which the minimum obligation could be payable under these types of contracts.
|
|
(7)
|
As of
December 31, 2018
, the liability for uncertain tax positions was
$82.4 million
. This liability is excluded from the table above. Additionally, accrued pension and other postretirement benefits and our environmental liabilities as recorded on our consolidated balance sheets are excluded from the table above. Due to the high degree of uncertainty regarding the timing of potential future cash flows associated with these liabilities, we are unable to make a reasonably reliable estimate of the amount and periods in which these liabilities might be paid. Also excluded from the table above is the liability attributable to the transition tax on deemed repatriated foreign earnings incurred as a result of the Act of
$161.3 million
.
|
Contingencies
See Note 19 to our consolidated financial statements included in this Form 10-K.
Climate Change
As a global corporate citizen, we are concerned about the consequences of climate change and will take prudent and cost effective actions that reduce Green House Gas (GHG) emissions to the atmosphere.
FMC is committed to doing its part to address climate change and its impacts. We have set 2025 goals that we will reduce both energy intensity and GHG intensity for our operations by 15 percent from our 2013 baseline year. To date, our FMC Agricultural Solutions and FMC Lithium segments have reduced energy use by 18 percent and 13 percent and GHG intensity by 12 percent and 18 percent, respectively. FMC has been reporting its GHG emissions and mitigation strategy to CDP (formerly Carbon Disclosure Project) since 2016. FMC detailed the business risks and opportunities we have due to climate change and its impacts in our CDP climate change reports.
Even as we take action to control the release of GHGs, additional warming is anticipated. Long-term, higher average global temperatures could result in induced changes in natural resources, growing seasons, precipitation patterns, weather patterns, species distributions, water availability, sea levels, and biodiversity. These impacts could cause changes in supplies of raw materials used to maintain FMC’s production capacity and could lead to possible increased sourcing costs. Depending on how pervasive the climate impacts are in the different geographic locations experiencing changes in natural resources, FMC’s customers could be impacted. Demand for FMC’s products could increase if our products meet our customers’ needs to adapt to climate change impacts or decrease if our products do not meet their needs. Within our own operations, we continually assess our manufacturing sites worldwide for risks and opportunities to increase our preparedness for climate change. We are continuing to evaluate sea level
36
rise and storm surge at our plants located within 4 meters of sea level to understand timing of potential impacts and response actions that may need to be taken. To lessen FMC’s overall environmental footprint, we have taken actions to increase the energy efficiency in our manufacturing sites. We have also committed to 2025 goals to reduce our water use in high-risk areas by 20 percent and our waste intensities by 15 percent. To date, FMC Agricultural Solutions and FMC Lithium have reduced our water use in high risk areas by 25 percent and 14 percent and our waste disposal intensity by 28 percent and 18 percent, respectively.
Recently FMC has undergone significant changes with the acquisition of the DuPont Crop Protection Business, the divestiture of FMC Health and Nutrition, and the anticipated separation of FMC Lithium. Therefore, we are revising our goals to reflect these changes and they will be published in our 2018 Sustainability Report.
In our product portfolio, we see market opportunities for our products to address climate change and its impacts. For example, FMC's agricultural products can help customers increase yield, energy and water efficiency, and decrease greenhouse gas emissions. Our products can also help growers adapt to more unpredictable growing conditions and the effects these types of threats have on crops.
We are improving existing products and developing new platforms and technologies that help mitigate impacts of climate change. FMC Agricultural Solutions is developing products with a lighter environmental footprint in its biologicals products. These opportunities could lead to new products and services for our existing and potential customers. Beyond our products and operations, FMC recognizes that energy consumption throughout our supply chain can impact climate change and product costs. Therefore, we will actively work with our entire value chain - suppliers, contractors, and customers - to improve their energy efficiencies and to reduce their GHG emissions.
We continue to follow legislative and regulatory developments regarding climate change because the regulation of greenhouse gases, depending on their nature and scope, could subject some of our manufacturing operations to additional costs or limits on operations. In December 2015, 195 countries at the United Nations Climate Change Conference in Paris reached an agreement to reduce GHGs. It remains to be seen how and when each of these countries will implement this agreement. The United States is a signatory to the Paris Agreement, but on June 1, 2017, President Trump announced that the United States would withdraw from the Paris Agreement and on August 4, 2017, the United States delivered notice of its intention to withdraw to United Nations. On October 16, 2017, the United States Environmental Protection Agency ("EPA") Filed notice of a rulemaking to repeal the lean Power Plan. EPA followed this action with the issuance of an advance notice of proposed rulemaking seeking comment on the proper roles of the state and federal government in regulating emissions from electric power plants, and also seeking information on technologies and strategies for reducing emissions from existing plants.
Notwithstanding the United States’ withdrawal from the Paris Agreement, will actively manage climate risks and incorporate them in our decision making as indicated in our responses to the CDP Climate Change Module. The United States Climate Alliance, a coalition of 21 states and unincorporated self-governing territories in the United States have expressed their commitment to upholding the objectives of the 2015 Paris Agreement on climate change within their borders. Several of our manufacturing and R&D sites fall within this alliance territory. FMC remains deeply committed to reducing our GHG emissions and energy consumption at all of our facilities around the world.
Some of our foreign operations are subject to national or local energy management or climate change regulation, such as our plant in Denmark that is subject to the EU Emissions Trading Scheme. At present, that plant’s emissions are below its designated cap.
Future GHG regulatory requirements may result in increased costs of energy, additional capital costs for emissions control or new equipment, and/or costs associated with cap and trade or carbon taxes. We are currently monitoring regulatory developments. The costs of complying with possible future climate change requirements are difficult to estimate at this time.
Recently Adopted and Issued Accounting Pronouncements and Regulatory Items
See Note 2 "Recently Issued and Adopted Accounting Pronouncements and Regulatory Items" to our consolidated financial statements included in this Form 10-K.
Off-Balance Sheet Arrangements
See Note 19 to our consolidated financial statements included in this Form 10-K and Part I, Item 3 - Legal Proceedings for further information regarding any off-balance sheet arrangements.
Fair Value Measurements
See Note 18 to our consolidated financial statements included in this Form 10-K for additional discussion surrounding our fair value measurements.
37
Critical Accounting Policies
Our consolidated financial statements are prepared in conformity with U.S. generally accepted accounting principles ("U.S. GAAP"). The preparation of these financial statements requires us to make estimates and judgments that affect the reported amounts of assets, liabilities, revenues and expenses. We have described our accounting policies in Note 1 "Principal Accounting Policies and Related Financial Information" to our consolidated financial statements included in this Form 10-K. We have reviewed these accounting policies, identifying those that we believe to be critical to the preparation and understanding of our consolidated financial statements. We have reviewed these critical accounting policies with the Audit Committee of the Board of Directors. Critical accounting policies are central to our presentation of results of operations and financial condition in accordance with U.S. GAAP and require management to make estimates and judgments on certain matters. We base our estimates and judgments on historical experience, current conditions and other reasonable factors.
Revenue recognition and trade receivables
We recognize revenue when (or as) we satisfy our performance obligation which is when the customer obtains control of the good or service. Rebates due to customers are accrued as a reduction of revenue in the same period that the related sales are recorded based on the contract terms. Refer to Note 3 to our consolidated financial statements included in this Form 10-K for more information.
We record amounts billed for shipping and handling fees as revenue. Costs incurred for shipping and handling are recorded as costs of sales and services. Amounts billed for sales and use taxes, value-added taxes, and certain excise and other specific transactional taxes imposed on revenue-producing transactions are presented on a net basis and excluded from sales in the consolidated income statements. We record a liability until remitted to the respective taxing authority.
We periodically enter into prepayment arrangements with customers, primarily in our FMC Agricultural Solutions segment, and receive advance payments for product to be delivered in future periods. These advance payments are recorded as deferred revenue and classified as “Advance payments from customers” on the consolidated balance sheet. Revenue associated with advance payments is recognized as shipments are made and transfer of control to the customer takes place.
Trade receivables consist of amounts owed to us from customer sales and are recorded when revenue is recognized. The allowance for trade receivables represents our best estimate of the probable losses associated with potential customer defaults. In developing our allowance for trade receivables, we use a two stage process which includes calculating a general formula to develop an allowance to appropriately address the uncertainty surrounding collection risk of our entire portfolio and specific allowances for customers where the risk of collection has been reasonably identified either due to liquidity constraints or disputes over contractual terms and conditions.
Our method of calculating the general formula consists of estimating the recoverability of trade receivables based on historical experience, current collection trends, and external business factors such as economic factors, including regional bankruptcy rates, and political factors. Our analysis of trade receivable collection risk is performed quarterly, and the allowance is adjusted accordingly.
We also hold long-term receivables that represent long-term customer receivable balances related to past-due accounts which are not expected to be collected within the current year. Our policy for the review of the allowance for these receivables is consistent with the discussion in the preceding paragraph above on trade receivables. Therefore on an ongoing basis, we continue to evaluate the credit quality of our long-term receivables utilizing aging of receivables, collection experience and write-offs, as well as existing economic conditions, to determine if an additional allowance is necessary.
On January 1, 2018, Accounting Standards Update 2014-09,
Revenue from Contracts with Customers,
became effective. See Note 2 to these consolidated financial statements for more information.
Environmental obligations and related recoveries
We provide for environmental-related obligations when they are probable and amounts can be reasonably estimated. Where the available information is sufficient to estimate the amount of liability, that estimate has been used. Where the information is only sufficient to establish a range of probable liability and no point within the range is more likely than any other, the lower end of the range has been used.
Estimated obligations to remediate sites that involve oversight by the United States Environmental Protection Agency (“EPA”), or similar government agencies, are generally accrued no later than when a Record of Decision (“ROD”), or equivalent, is issued, or upon completion of a Remedial Investigation/Feasibility Study (“RI/FS”), or equivalent, that is submitted by us to the appropriate government agency or agencies. Estimates are reviewed quarterly by our environmental remediation management, as well as by
38
financial and legal management and, if necessary, adjusted as additional information becomes available. The estimates can change substantially as additional information becomes available regarding the nature or extent of site contamination, required remediation methods, and other actions by or against governmental agencies or private parties.
Our environmental liabilities for continuing and discontinued operations are principally for costs associated with the remediation and/or study of sites at which we are alleged to have released hazardous substances into the environment. Such costs principally include, among other items, RI/FS, site remediation, costs of operation and maintenance of the remediation plan, management costs, fees to outside law firms and consultants for work related to the environmental effort, and future monitoring costs. Estimated site liabilities are determined based upon existing remediation laws and technologies, specific site consultants’ engineering studies or by extrapolating experience with environmental issues at comparable sites.
Included in our environmental liabilities are costs for the operation, maintenance and monitoring of site remediation plans (OM&M). Such reserves are based on our best estimates for these OM&M plans. Over time we may incur OM&M costs in excess of these reserves. However, we are unable to reasonably estimate an amount in excess of our recorded reserves because we cannot reasonably estimate the period for which such OM&M plans will need to be in place or the future annual cost of such remediation, as conditions at these environmental sites change over time. Such additional OM&M costs could be significant in total but would be incurred over an extended period of years.
Included in the environmental reserve balance, other assets balance and disclosure of reasonably possible loss contingencies are amounts from third party insurance policies, which we believe are probable of recovery.
Provisions for environmental costs are reflected in income, net of probable and estimable recoveries from named Potentially Responsible Parties (“PRPs”) or other third parties. Such provisions incorporate inflation and are not discounted to their present values.
In calculating and evaluating the adequacy of our environmental reserves, we have taken into account the joint and several liability imposed by Comprehensive Environmental Response, Compensation and Liability Act (“CERCLA”) and the analogous state laws on all PRPs and have considered the identity and financial condition of the other PRPs at each site to the extent possible. We have also considered the identity and financial condition of other third parties from whom recovery is anticipated, as well as the status of our claims against such parties. Although we are unable to forecast the ultimate contributions of PRPs and other third parties with absolute certainty, the degree of uncertainty with respect to each party is taken into account when determining the environmental reserve by adjusting the reserve to reflect the facts and circumstances on a site-by-site basis. Our liability includes our best estimate of the costs expected to be paid before the consideration of any potential recoveries from third parties. We believe that any recorded recoveries related to PRPs are realizable in all material respects. Recoveries are recorded as either an offset in “Environmental liabilities, continuing and discontinued” or as “Other assets” in our consolidated balance sheets in accordance with U.S. accounting literature.
See Note 11 to our consolidated financial statements included in this Form 10-K for changes in estimates associated with our environmental obligations.
Impairments and valuation of long-lived and indefinite-lived assets
Our long-lived assets primarily include property, plant and equipment, goodwill and intangible assets. The assets and liabilities of acquired businesses are measured at their estimated fair values at the dates of acquisition. The excess of the purchase price over the estimated fair value of the net assets acquired, including identified intangibles, is recorded as goodwill. The determination and allocation of fair value to the assets acquired and liabilities assumed is based on various assumptions and valuation methodologies requiring considerable management judgment, including estimates based on historical information, current market data and future expectations. The principal assumptions utilized in our valuation methodologies include revenue growth rates, operating margin estimates and discount rates. Although the estimates were deemed reasonable by management based on information available at the dates of acquisition, those estimates are inherently uncertain.
We test for impairment whenever events or circumstances indicate that the net book value of our property, plant and equipment may not be recoverable from the estimated undiscounted expected future cash flows expected to result from their use and eventual disposition. In cases where the estimated undiscounted expected future cash flows are less than net book value, an impairment loss is recognized equal to the amount by which the net book value exceeds the estimated fair value of assets, which is based on discounted cash flows at the lowest level determinable. The estimated cash flows reflect our assumptions about selling prices, volumes, costs and market conditions over a reasonable period of time.
We perform an annual impairment test of goodwill and indefinite-lived intangible assets in the third quarter of each year, or more frequently whenever an event or change in circumstances occurs that would require reassessment of the recoverability of those assets. In performing our evaluation we assess qualitative factors such as overall financial performance of our reporting units,
39
anticipated changes in industry and market structure, competitive environments, planned capacity and cost factors such as raw material prices. Based on our assessment for
2018
, we determined that no goodwill impairment charge to our continuing operations was required. The majority of the Brands intangible asset relates to our proprietary brand portfolio for which the fair value was substantially in excess of the carrying value. During the third quarter of 2018, we recorded an impairment charge of approximately
$2 million
in our generic brand portfolio which is part of the FMC Agricultural Solutions segment. The carrying value of the generic portfolio subsequent to the charge is approximately
$3 million
.
See Note 8 to our consolidated financial statements included in this Form 10-K for charges associated with long-lived asset disposal costs and the activity associated with the restructuring reserves.
Pension and other postretirement benefits
We provide qualified and nonqualified defined benefit and defined contribution pension plans, as well as postretirement health care and life insurance benefit plans to our employees and retirees. The costs (benefits) and obligations related to these benefits reflect key assumptions related to general economic conditions, including interest (discount) rates, healthcare cost trend rates, expected rates of return on plan assets and the rates of compensation increase for employees. The costs (benefits) and obligations for these benefit programs are also affected by other assumptions, such as average retirement age, mortality, employee turnover, and plan participation. To the extent our plans’ actual experience, as influenced by changing economic and financial market conditions or by changes to our own plans’ demographics, differs from these assumptions, the costs and obligations for providing these benefits, as well as the plans’ funding requirements, could increase or decrease. When actual results differ from our assumptions, the difference is typically recognized over future periods. In addition, the unrealized gains and losses related to our pension and postretirement benefit obligations may also affect periodic benefit costs (benefits) in future periods.
We use several assumptions and statistical methods to determine the asset values used to calculate both the expected rate of return on assets component of pension cost and to calculate our plans’ funding requirements. The expected rate of return on plan assets is based on a market-related value of assets that recognizes investment gains and losses over a five-year period. We use an actuarial value of assets to determine our plans’ funding requirements. The actuarial value of assets must be within a certain range, high or low, of the actual market value of assets, and is adjusted accordingly.
We select the discount rate used to calculate pension and other postretirement obligations based on a review of available yields on high-quality corporate bonds as of the measurement date. In selecting a discount rate as of
December 31, 2018
, we placed particular emphasis on a discount rate yield-curve provided by our actuary. This yield-curve, when populated with projected cash flows that represent the expected timing and amount of our plans' benefit payments, produced an effective discount rate of
4.35 percent
for our U.S. qualified plan,
3.97 percent
for our U.S. nonqualified, and
4.08 percent
for our U.S. other postretirement benefit plans.
The discount rates used at our
December 31, 2018
and
2017
measurement dates for the U.S. qualified plan were
4.35 percent
and
3.68 percent
, respectively. The effect of the change in the discount rate from
3.68 percent
to
4.35 percent
at
December 31, 2018
resulted in a
$91.3 million
decrease
to our U.S. qualified pension benefit obligations. The effect of the change in the discount rate from
4.22 percent
at December 31,
2016
to
3.68 percent
at December 31,
2017
resulted in a
$0.1 million
increase
to the
2018
U.S. qualified pension expense.
The change in discount rate from
3.68 percent
at December 31,
2017
to
4.35 percent
at December 31,
2018
was attributable to an increase in yields on high quality corporate bonds with cash flows matching the timing and amount of our expected future benefit payments between the
2017
and
2018
measurement dates. Using the December 31,
2018
and
2017
yield curves, our U.S. qualified plan cash flows produced a single weighted-average discount rate of approximately
4.35 percent
and
3.68 percent
, respectively.
In developing the assumption for the long-term rate of return on assets for our U.S. Plan, we take into consideration the technical analysis performed by our outside actuaries, including historical market returns, information on the assumption for long-term real returns by asset class, inflation assumptions, and expectations for standard deviation related to these best estimates. We also consider the historical performance of our own plan’s trust, which has earned a compound annual rate of return of approximately
6.9 percent
over the last 20 years (which is in excess of comparable market indices for the same period) as well as other factors which are discussed in Note 14 to our consolidated financial statements in this Form 10-K. Our long-term rate of return for the fiscal year ended
December 31, 2018
,
2017
and
2016
was
5.00 percent
,
6.50 percent
and
7.00 percent
, respectively.
For the sensitivity of our pension costs to incremental changes in assumptions see our discussion below.
40
Sensitivity analysis related to key pension and postretirement benefit assumptions.
A one-half percent increase in the assumed discount rate would have decreased pension and other postretirement benefit obligations by
$62.4 million
and
$73.6 million
at
December 31, 2018
and
2017
, respectively, and decreased pension and other postretirement benefit costs by
$0.4 million
,
$0.4 million
and
$5.2 million
for
2018
,
2017
and
2016
, respectively. A one-half percent decrease in the assumed discount rate would have increased pension and other postretirement benefit obligations by
$68.3 million
and
$81.3 million
at
December 31, 2018
and
2017
, respectively, and increased pension and other postretirement benefit cost by
$0.1 million
,
$0.4 million
and
$5.7 million
for
2018
,
2017
and
2016
, respectively.
A one-half percent increase in the assumed expected long-term rate of return on plan assets would have decreased pension costs by
$6.4 million
,
$6.0 million
and
$6.0 million
for
2018
,
2017
and
2016
, respectively. A one-half percent decrease in the assumed long-term rate of return on plan assets would have increased pension costs by
$6.4 million
,
$6.0 million
and
$6.0 million
for
2018
,
2017
and
2016
, respectively.
Further details on our pension and other postretirement benefit obligations and net periodic benefit costs (benefits) are found in Note 14 to our consolidated financial statements in this Form 10-K.
Income taxes
We have recorded a valuation allowance to reduce deferred tax assets in certain jurisdictions to the amount that we believe is more likely than not to be realized. In assessing the need for this allowance, we have considered a number of factors including future taxable income, the jurisdictions in which such income is earned and our ongoing tax planning strategies. In the event that we determine that we would not be able to realize all or part of our net deferred tax assets in the future, an adjustment to the deferred tax assets would be charged to income in the period such determination was made. Similarly, should we conclude that we would be able to realize certain deferred tax assets in the future in excess of the net recorded amount, an adjustment to the deferred tax assets would increase income in the period such determination was made.
Additionally, we file income tax returns in the U.S. federal jurisdiction and various state and foreign jurisdictions. Certain income tax returns for FMC entities taxable in the U.S. and significant foreign jurisdictions are open for examination and adjustment. We assess our income tax positions and record a liability for all years open to examination based upon our evaluation of the facts, circumstances and information available at the reporting date. For those tax positions where it is more likely than not that a tax benefit will be sustained, we have recorded the largest amount of tax benefit with a greater than 50 percent likelihood of being realized upon ultimate settlement with a taxing authority that has full knowledge of all relevant information. We adjust these liabilities, if necessary, upon the completion of tax audits or changes in tax law.
On December 22, 2017, the Act was enacted in the United States. The Act reduced the U.S. federal corporate tax rate from 35 percent to 21 percent, required companies to pay a one-time transition tax on earnings of certain foreign subsidiaries that were previously tax deferred and created new taxes on certain foreign sourced earnings. At December 31, 2018, the Company had completed its accounting for the impacts of the enactment of the Act.
See Note 12 to our consolidated financial statements included in this Form 10-K for additional discussion surrounding income taxes.
41
|
ITEM 7A.
|
QUANTITATIVE AND QUALITATIVE DISCLOSURES ABOUT MARKET RISK
|
Our earnings, cash flows and financial position are exposed to market risks relating to fluctuations in commodity prices, interest rates and foreign currency exchange rates. Our policy is to minimize exposure to our cash flow over time caused by changes in commodity, interest and currency exchange rates. To accomplish this, we have implemented a controlled program of risk management consisting of appropriate derivative contracts entered into with major financial institutions.
The analysis below presents the sensitivity of the market value of our financial instruments to selected changes in market rates and prices. The range of changes chosen reflects our view of changes that are reasonably possible over a one-year period. Market value estimates are based on the present value of projected future cash flows considering the market rates and prices chosen.
At
December 31, 2018
, our net financial instrument position was a net
asset
of
$10.2 million
compared to a net
asset
of
$4.4 million
at
December 31, 2017
. The change in the net financial instrument position was primarily due to exchange rate fluctuations in our foreign exchange portfolio.
Since our risk management programs are generally highly effective, the potential loss in value for each risk management portfolio described below would be largely offset by changes in the value of the underlying exposure.
Commodity Price Risk
Energy costs are diversified among coal, electricity and natural gas. We attempt to mitigate our exposure to increasing energy costs by hedging the cost of future deliveries of natural gas and by entering into fixed-price contracts for the purchase of coal and fuel oil. To analyze the effect of changing energy prices, we perform a sensitivity analysis in which we assume an instantaneous 10 percent change in energy market prices from their levels at
December 31, 2018
and
2017
, with all other variables (including interest rates) held constant. Note, as of
December 31, 2018
and
December 31, 2017
, we had no open commodity contracts. As a result, there was no sensitivity analysis performed over commodity price risk for the periods presented.
Foreign Currency Exchange Rate Risk
The primary currencies for which we have exchange rate exposure are the U.S. dollar versus the euro, the Chinese yuan, the Brazilian real and the Argentine peso. Foreign currency debt and foreign exchange forward contracts are used in countries where we do business, thereby reducing our net asset exposure. Foreign exchange forward contracts are also used to hedge firm and highly anticipated foreign currency cash flows.
To analyze the effects of changing foreign currency rates, we have performed a sensitivity analysis in which we assume an instantaneous 10 percent change in the foreign currency exchange rates from their levels at
December 31, 2018
and
2017
, with all other variables (including interest rates) held constant.
|
Hedged Currency vs. Functional Currency
|
|||||||||||
|
(in Millions)
|
Net Asset / (Liability) Position on Consolidated Balance Sheets
|
Net Asset / (Liability) Position with 10% Strengthening
|
Net Asset / (Liability) Position with 10% Weakening
|
||||||||
|
Net asset/(liability) position at December 31, 2018
|
$
|
10.4
|
|
$
|
28.4
|
|
$
|
(31.0
|
)
|
||
|
Net asset/(liability) position at December 31, 2017
|
$
|
4.4
|
|
$
|
10.8
|
|
$
|
(3.2
|
)
|
||
Interest Rate Risk
One of the strategies that we can use to manage interest rate exposure is to enter into interest rate swap agreements. In these agreements, we agree to exchange, at specified intervals, the difference between fixed and variable interest amounts calculated on an agreed-upon notional principal amount. In the quarter ended
December 31, 2018
, we had outstanding contracts in place to swap portions of our variable-rate debt to fixed-rate debt with an aggregate notional value of
$200.0 million
. There were no interest rate swap agreements as of December 31, 2017.
To analyze the effects of changing interest rates, we have performed a sensitivity analysis in which we assume an instantaneous one percent change in the interest rates from their levels at
December 31, 2018
, with all other variables held constant.
|
(in Millions)
|
Net Asset / (Liability) Position on Condensed Consolidated Balance Sheets
|
1% Increase
|
1% Decrease
|
||||||||
|
Net asset (liability) position at December 31, 2018
|
$
|
(0.2
|
)
|
$
|
2.2
|
|
$
|
(2.7
|
)
|
||
Our debt portfolio at
December 31, 2018
is composed of
52 percent
fixed-rate debt and
48 percent
variable-rate debt. The variable-rate component of our debt portfolio principally consists of borrowings under our 2017 Term Loan Facility, commercial paper
42
program, Credit Facility, variable-rate industrial and pollution control revenue bonds, and amounts outstanding under foreign subsidiary credit lines. Changes in interest rates affect different portions of our variable-rate debt portfolio in different ways.
Based on the variable-rate debt in our debt portfolio at
December 31, 2018
, a one percentage point increase in interest rates would have increased gross interest expense by
$13.2 million
and a one percentage point decrease in interest rates would have decreased gross interest expense by
$13.2 million
for the year ended
December 31, 2018
.
ITEM 8. FINANCIAL STATEMENTS AND SUPPLEMENTARY DATA
|
Page
|
|
43
FMC CORPORATION
CONSOLIDATED STATEMENTS OF INCOME (LOSS)
|
(in Millions, Except Per Share Data)
|
Year Ended December 31,
|
||||||||||
|
2018
|
2017
|
2016
|
|||||||||
|
Revenue
|
$
|
4,727.8
|
|
$
|
2,878.6
|
|
$
|
2,538.9
|
|
||
|
Costs and Expenses
|
|||||||||||
|
Costs of sales and services
|
2,640.9
|
|
1,777.3
|
|
1,607.7
|
|
|||||
|
Gross Margin
|
$
|
2,086.9
|
|
$
|
1,101.3
|
|
$
|
931.2
|
|
||
|
Selling, general and administrative expenses
|
851.2
|
|
600.4
|
|
435.1
|
|
|||||
|
Research and development expenses
|
291.5
|
|
141.5
|
|
134.5
|
|
|||||
|
Restructuring and other charges (income)
|
63.7
|
|
81.4
|
|
95.0
|
|
|||||
|
Total costs and expenses
|
$
|
3,847.3
|
|
$
|
2,600.6
|
|
$
|
2,272.3
|
|
||
|
Income from continuing operations before equity in (earnings) loss of affiliates, non-operating pension and postretirement charges (income), interest expense, net and income taxes
|
$
|
880.5
|
|
$
|
278.0
|
|
$
|
266.6
|
|
||
|
Equity in (earnings) loss of affiliates
|
(0.1
|
)
|
(0.1
|
)
|
(0.5
|
)
|
|||||
|
Non-operating pension and postretirement charges (income)
|
3.8
|
|
18.2
|
|
23.4
|
|
|||||
|
Interest income
|
(1.4
|
)
|
(0.9
|
)
|
(0.6
|
)
|
|||||
|
Interest expense
|
134.5
|
|
80.0
|
|
63.5
|
|
|||||
|
Income (loss) from continuing operations before income taxes
|
$
|
743.7
|
|
$
|
180.8
|
|
$
|
180.8
|
|
||
|
Provision (benefit) for income taxes
|
88.8
|
|
264.1
|
|
50.1
|
|
|||||
|
Income (loss) from continuing operations
|
$
|
654.9
|
|
$
|
(83.3
|
)
|
$
|
130.7
|
|
||
|
Discontinued operations, net of income taxes
|
(143.4
|
)
|
621.7
|
|
81.0
|
|
|||||
|
Net income (loss)
|
$
|
511.5
|
|
$
|
538.4
|
|
$
|
211.7
|
|
||
|
Less: Net income (loss) attributable to noncontrolling interests
|
9.4
|
|
2.6
|
|
2.6
|
|
|||||
|
Net income (loss) attributable to FMC stockholders
|
$
|
502.1
|
|
$
|
535.8
|
|
$
|
209.1
|
|
||
|
Amounts attributable to FMC stockholders:
|
|||||||||||
|
Continuing operations, net of income taxes
|
$
|
645.5
|
|
$
|
(85.9
|
)
|
$
|
128.4
|
|
||
|
Discontinued operations, net of income taxes
|
(143.4
|
)
|
621.7
|
|
80.7
|
|
|||||
|
Net income (loss) attributable to FMC stockholders
|
$
|
502.1
|
|
$
|
535.8
|
|
$
|
209.1
|
|
||
|
Basic earnings (loss) per common share attributable to FMC stockholders:
|
|||||||||||
|
Continuing operations
|
$
|
4.78
|
|
$
|
(0.64
|
)
|
$
|
0.96
|
|
||
|
Discontinued operations
|
(1.06
|
)
|
4.63
|
|
0.60
|
|
|||||
|
Net income (loss) attributable to FMC stockholders
|
$
|
3.72
|
|
$
|
3.99
|
|
$
|
1.56
|
|
||
|
Diluted earnings (loss) per common share attributable to FMC stockholders:
|
|||||||||||
|
Continuing operations
|
$
|
4.75
|
|
$
|
(0.64
|
)
|
$
|
0.96
|
|
||
|
Discontinued operations
|
(1.06
|
)
|
4.63
|
|
0.60
|
|
|||||
|
Net income (loss) attributable to FMC stockholders
|
$
|
3.69
|
|
$
|
3.99
|
|
$
|
1.56
|
|
||
The accompanying notes are an integral part of these consolidated financial statements.
44
FMC CORPORATION
CONSOLIDATED STATEMENTS OF COMPREHENSIVE INCOME (LOSS)
|
(in Millions)
|
Year Ended December 31,
|
||||||||||
|
2018
|
2017
|
2016
|
|||||||||
|
Net income (loss)
|
$
|
511.5
|
|
$
|
538.4
|
|
$
|
211.7
|
|
||
|
Other comprehensive income (loss), net of tax:
|
|||||||||||
|
Foreign currency adjustments:
|
|||||||||||
|
Foreign currency translation gain (loss) arising during the period
|
$
|
(100.8
|
)
|
$
|
172.7
|
|
$
|
(48.7
|
)
|
||
|
Reclassification of foreign currency translations losses
|
—
|
|
13.9
|
|
—
|
|
|||||
|
Total foreign currency adjustments
(1)
|
$
|
(100.8
|
)
|
$
|
186.6
|
|
$
|
(48.7
|
)
|
||
|
Derivative instruments:
|
|||||||||||
|
Unrealized hedging gains (losses) and other, net of tax of $2.6, $0.5 and ($0.2)
|
$
|
13.7
|
|
$
|
(1.2
|
)
|
$
|
7.3
|
|
||
|
Reclassification of deferred hedging (gains) losses and other, included in net income, net of tax of ($3.1), ($0.1) and $3.3
(3)
|
(7.7
|
)
|
(0.7
|
)
|
6.0
|
|
|||||
|
Total derivative instruments, net of tax of ($0.5), $0.4 and $3.1
|
$
|
6.0
|
|
$
|
(1.9
|
)
|
$
|
13.3
|
|
||
|
Pension and other postretirement benefits:
|
|||||||||||
|
Unrealized actuarial gains (losses) and prior service (costs) credits, net of tax of $1.3, $1.9 and ($7.7)
(2)
|
$
|
4.2
|
|
$
|
0.6
|
|
$
|
(26.9
|
)
|
||
|
Reclassification of net actuarial and other (gain) loss, amortization of prior service costs and settlement charges, included in net income, net of tax of $4.3, $14.5 and $20.6
(3)
|
16.5
|
|
51.6
|
|
39.2
|
|
|||||
|
Total pension and other postretirement benefits, net of tax of $5.6, $16.4 and $12.9
|
$
|
20.7
|
|
$
|
52.2
|
|
$
|
12.3
|
|
||
|
Other comprehensive income (loss), net of tax
|
$
|
(74.1
|
)
|
$
|
236.9
|
|
$
|
(23.1
|
)
|
||
|
Comprehensive income (loss)
|
$
|
437.4
|
|
$
|
775.3
|
|
$
|
188.6
|
|
||
|
Less: Comprehensive income (loss) attributable to the noncontrolling interest
|
3.9
|
|
1.4
|
|
0.6
|
|
|||||
|
Comprehensive income (loss) attributable to FMC stockholders
|
$
|
433.5
|
|
$
|
773.9
|
|
$
|
188.0
|
|
||
____________________
|
(1)
|
Income taxes are not provided for any additional outside basis differences inherent in our investments in subsidiaries because the investments and related unremitted earnings are essentially permanent in duration or we have concluded that no additional tax liability will arise upon disposal. Note, in the first quarter of 2017, we changed our assertion on unremitted earnings for certain foreign subsidiaries as a result of the sale of our FMC Health and Nutrition segment.
|
|
(2)
|
At December 31 of each year, we remeasure our pension and postretirement plan obligations at which time we record any actuarial gains (losses) and prior service (costs) credits to other comprehensive income. During the years ended December 31, 2018 and 2017, due to the announced plans to separate FMC Lithium and divest FMC Health and Nutrition, respectively, we triggered a curtailment of our U.S. pension plans. As a result, we revalued our pension plans as of October 31, 2018 and March 31, 2017, respectively, in addition to the normal December 31st remeasurement, which resulted in adjustments to comprehensive income. See Note 14 for more information.
|
|
(3)
|
For more detail on the components of these reclassifications and the affected line item in the consolidated statements of income (loss) see Note 16 within these consolidated financial statements.
|
The accompanying notes are an integral part of these consolidated financial statements.
45
FMC CORPORATION
CONSOLIDATED BALANCE SHEETS
|
December 31,
|
|||||||
|
(in Millions, Except Share and Par Value Data)
|
2018
|
2017
|
|||||
|
ASSETS
|
|||||||
|
Current assets
|
|||||||
|
Cash and cash equivalents
|
$
|
161.7
|
|
$
|
283.0
|
|
|
|
Trade receivables, net of allowance of $22.4 in 2018 and $38.7 in 2017
|
2,285.2
|
|
2,043.5
|
|
|||
|
Inventories
|
1,097.3
|
|
992.5
|
|
|||
|
Prepaid and other current assets
|
486.0
|
|
326.4
|
|
|||
|
Current assets of discontinued operations
|
—
|
|
7.3
|
|
|||
|
Total current assets
|
$
|
4,030.2
|
|
$
|
3,652.7
|
|
|
|
Investments
|
0.7
|
|
1.4
|
|
|||
|
Property, plant and equipment, net
|
1,032.6
|
|
1,025.2
|
|
|||
|
Goodwill
|
1,468.1
|
|
1,198.9
|
|
|||
|
Other intangibles, net
|
2,704.3
|
|
2,631.8
|
|
|||
|
Other assets including long-term receivables, net
|
465.2
|
|
443.6
|
|
|||
|
Deferred income taxes
|
273.2
|
|
252.7
|
|
|||
|
Total assets
|
$
|
9,974.3
|
|
$
|
9,206.3
|
|
|
|
LIABILITIES AND EQUITY
|
|||||||
|
Current liabilities
|
|||||||
|
Short-term debt and current portion of long-term debt
|
$
|
547.7
|
|
$
|
192.6
|
|
|
|
Accounts payable, trade and other
|
867.5
|
|
714.2
|
|
|||
|
Advance payments from customers
|
458.4
|
|
380.6
|
|
|||
|
Accrued and other liabilities
|
594.4
|
|
497.7
|
|
|||
|
Accrued customer rebates
|
365.3
|
|
266.6
|
|
|||
|
Guarantees of vendor financing
|
67.1
|
|
51.5
|
|
|||
|
Accrued pension and other postretirement benefits, current
|
6.2
|
|
5.7
|
|
|||
|
Income taxes
|
86.8
|
|
99.2
|
|
|||
|
Current liabilities of discontinued operations
|
—
|
|
1.3
|
|
|||
|
Total current liabilities
|
$
|
2,993.4
|
|
$
|
2,209.4
|
|
|
|
Long-term debt, less current portion
|
2,179.0
|
|
2,993.0
|
|
|||
|
Accrued pension and other postretirement benefits, long-term
|
47.2
|
|
59.3
|
|
|||
|
Environmental liabilities, continuing and discontinued
|
464.4
|
|
346.2
|
|
|||
|
Deferred income taxes
|
330.8
|
|
173.2
|
|
|||
|
Other long-term liabilities
|
749.1
|
|
718.1
|
|
|||
|
Commitments and contingent liabilities (Note 19)
|
|
|
|||||
|
Equity
|
|||||||
|
Preferred stock, no par value, authorized 5,000,000 shares; no shares issued in 2018 or 2017
|
$
|
—
|
|
$
|
—
|
|
|
|
Common stock, $0.10 par value, authorized 260,000,000 shares in 2018 and 2017; 185,983,792 shares issued in 2018 and 2017
|
18.6
|
|
18.6
|
|
|||
|
Capital in excess of par value of common stock
|
776.2
|
|
450.7
|
|
|||
|
Retained earnings
|
4,334.3
|
|
3,952.4
|
|
|||
|
Accumulated other comprehensive income (loss)
|
(308.9
|
)
|
(240.3
|
)
|
|||
|
Treasury stock, common, at cost - 2018: 53,702,178 shares, 2017: 51,653,236 shares
|
(1,699.1
|
)
|
(1,499.6
|
)
|
|||
|
Total FMC stockholders’ equity
|
$
|
3,121.1
|
|
$
|
2,681.8
|
|
|
|
Noncontrolling interests
|
89.3
|
|
25.3
|
|
|||
|
Total equity
|
$
|
3,210.4
|
|
$
|
2,707.1
|
|
|
|
Total liabilities and equity
|
$
|
9,974.3
|
|
$
|
9,206.3
|
|
|
The accompanying notes are an integral part of these consolidated financial statements.
46
FMC CORPORATION
CONSOLIDATED STATEMENTS OF CASH FLOWS
|
(in Millions)
|
Year Ended December 31,
|
||||||||||
|
2018
|
2017
|
2016
|
|||||||||
|
Cash provided (required) by operating activities of continuing operations:
|
|||||||||||
|
Net income (loss)
|
$
|
511.5
|
|
$
|
538.4
|
|
$
|
211.7
|
|
||
|
Discontinued operations, net of income taxes
|
143.4
|
|
(621.7
|
)
|
(81.0
|
)
|
|||||
|
Income (loss) from continuing operations
|
$
|
654.9
|
|
$
|
(83.3
|
)
|
$
|
130.7
|
|
||
|
Adjustments from income (loss) from continuing operations to cash provided (required) by operating activities of continuing operations:
|
|||||||||||
|
Depreciation and amortization
|
$
|
168.2
|
|
$
|
113.0
|
|
$
|
100.6
|
|
||
|
Equity in (earnings) loss of affiliates
|
(0.1
|
)
|
(0.1
|
)
|
(0.5
|
)
|
|||||
|
Restructuring and other charges (income)
|
63.7
|
|
81.4
|
|
95.0
|
|
|||||
|
Deferred income taxes
|
(47.4
|
)
|
104.2
|
|
53.3
|
|
|||||
|
Pension and other postretirement benefits
|
10.4
|
|
25.9
|
|
32.5
|
|
|||||
|
Share-based compensation
|
23.0
|
|
21.1
|
|
20.2
|
|
|||||
|
Excess tax benefits from share-based compensation
|
—
|
|
—
|
|
(0.4
|
)
|
|||||
|
Changes in operating assets and liabilities, net of effect of acquisitions and divestitures:
|
|||||||||||
|
Trade receivables, net
|
$
|
(302.2
|
)
|
$
|
(262.4
|
)
|
$
|
11.8
|
|
||
|
Guarantees of vendor financing
|
15.4
|
|
(54.7
|
)
|
55.0
|
|
|||||
|
Inventories
|
(224.2
|
)
|
(96.8
|
)
|
79.0
|
|
|||||
|
Accounts payable, trade and other
|
182.3
|
|
331.7
|
|
(29.7
|
)
|
|||||
|
Advance payments from customers
|
78.4
|
|
140.5
|
|
(10.0
|
)
|
|||||
|
Accrued customer rebates
|
104.1
|
|
16.9
|
|
(5.2
|
)
|
|||||
|
Income taxes
|
(94.9
|
)
|
122.1
|
|
(31.9
|
)
|
|||||
|
Pension and other postretirement benefit contributions
|
(37.5
|
)
|
(56.5
|
)
|
(65.8
|
)
|
|||||
|
Environmental spending, continuing, net of recoveries
|
(20.5
|
)
|
(20.5
|
)
|
(28.1
|
)
|
|||||
|
Restructuring and other spending
|
(26.5
|
)
|
(8.2
|
)
|
(18.0
|
)
|
|||||
|
Transaction-related spending
|
(130.0
|
)
|
(78.9
|
)
|
(23.4
|
)
|
|||||
|
Change in other operating assets and liabilities, net
(1)
|
28.9
|
|
19.1
|
|
3.8
|
|
|||||
|
Cash provided (required) by operating activities of continuing operations
|
$
|
446.0
|
|
$
|
314.5
|
|
$
|
368.9
|
|
||
|
Cash provided (required) by operating activities of discontinued operations:
|
|||||||||||
|
Environmental spending, discontinued, net of recoveries
|
$
|
(41.0
|
)
|
$
|
(32.3
|
)
|
$
|
(21.8
|
)
|
||
|
Operating activities of discontinued operations, net of divestiture costs
|
(8.8
|
)
|
86.1
|
|
176.3
|
|
|||||
|
Other discontinued spending
|
(27.8
|
)
|
(32.8
|
)
|
(25.6
|
)
|
|||||
|
Cash provided (required) by operating activities of discontinued operations
|
$
|
(77.6
|
)
|
$
|
21.0
|
|
$
|
128.9
|
|
||
____________________
|
(1)
|
Changes in all periods represent timing of payments associated with all other operating assets and liabilities.
|
The accompanying notes are an integral part of these consolidated financial statements.
47
FMC CORPORATION
CONSOLIDATED STATEMENTS OF CASH FLOWS (CONTINUED)
|
(in Millions)
|
Year Ended December 31,
|
||||||||||
|
2018
|
2017
|
2016
|
|||||||||
|
Cash provided (required) by investing activities of continuing operations:
|
|||||||||||
|
Capital expenditures
|
$
|
(156.6
|
)
|
$
|
(85.7
|
)
|
$
|
(91.2
|
)
|
||
|
Proceeds from disposal of property, plant and equipment
|
3.0
|
|
2.2
|
|
1.9
|
|
|||||
|
Acquisitions, net
(2)
|
19.6
|
|
(1,225.6
|
)
|
—
|
|
|||||
|
Proceeds from sale of product portfolios
|
88.0
|
|
—
|
|
—
|
|
|||||
|
Investment in Enterprise Resource Planning system
|
(48.5
|
)
|
—
|
|
—
|
|
|||||
|
Other investing activities
|
(21.4
|
)
|
(40.4
|
)
|
(11.5
|
)
|
|||||
|
Cash provided (required) by investing activities of continuing operations
|
$
|
(115.9
|
)
|
$
|
(1,349.5
|
)
|
$
|
(100.8
|
)
|
||
|
Cash provided (required) by investing activities of discontinued operations:
|
|||||||||||
|
Proceeds from divestiture
|
$
|
—
|
|
$
|
38.0
|
|
$
|
—
|
|
||
|
Other discontinued investing activities
|
(15.0
|
)
|
(22.3
|
)
|
(34.4
|
)
|
|||||
|
Cash provided (required) by investing activities of discontinued operations
|
$
|
(15.0
|
)
|
$
|
15.7
|
|
$
|
(34.4
|
)
|
||
|
Cash provided (required) by financing activities of continuing operations:
|
|||||||||||
|
Increase (decrease) in short-term debt
|
$
|
79.5
|
|
$
|
(3.1
|
)
|
$
|
(19.4
|
)
|
||
|
Proceeds from borrowing of long-term debt
|
34.0
|
|
1,598.9
|
|
2.8
|
|
|||||
|
Financing fees
|
(3.1
|
)
|
(11.0
|
)
|
(0.7
|
)
|
|||||
|
Repayments of long-term debt
|
(552.0
|
)
|
(302.3
|
)
|
(242.6
|
)
|
|||||
|
Acquisitions of noncontrolling interests
|
—
|
|
—
|
|
(20.0
|
)
|
|||||
|
Transactions with noncontrolling interests
|
—
|
|
|
(0.5
|
)
|
—
|
|
||||
|
Net proceeds received from initial public offering of FMC Lithium
(3)
|
363.6
|
|
|
—
|
|
—
|
|
||||
|
Dividends paid
(4)
|
(89.2
|
)
|
(88.8
|
)
|
(88.6
|
)
|
|||||
|
Issuances of common stock, net
|
10.7
|
|
22.5
|
|
4.1
|
|
|||||
|
Excess tax benefits from share-based compensation
|
—
|
|
—
|
|
0.4
|
|
|||||
|
Repurchases of common stock under publicly announced program
|
(200.0
|
)
|
—
|
|
(11.2
|
)
|
|||||
|
Other repurchases of common stock
|
(6.8
|
)
|
(2.6
|
)
|
(1.8
|
)
|
|||||
|
Cash provided (required) by financing activities
|
$
|
(363.3
|
)
|
$
|
1,213.1
|
|
$
|
(377.0
|
)
|
||
|
Effect of exchange rate changes on cash and cash equivalents
|
4.5
|
|
4.0
|
|
—
|
|
|||||
|
Increase (decrease) in cash and cash equivalents
|
$
|
(121.3
|
)
|
$
|
218.8
|
|
$
|
(14.4
|
)
|
||
|
Cash and cash equivalents, beginning of period
|
283.0
|
|
64.2
|
|
78.6
|
|
|||||
|
Cash and cash equivalents, end of period
|
$
|
161.7
|
|
$
|
283.0
|
|
$
|
64.2
|
|
||
____________________
|
(2)
|
Represents the cash portion of the total purchase consideration paid for the DuPont Crop Protection Business Acquisition. See Note 4 for more information on the non-cash consideration transferred to DuPont.
|
|
(3)
|
Pursuant to the terms of the separation and distribution agreement, we received a net distribution of approximately
$364 million
from the public offering of Livent representing the proceeds from the sale of its common stock and the underwriters' exercise to purchase additional shares as part of the initial public offering ("IPO"), net of underwriting discounts and commissions, financing fees and other offering related expenses.
|
|
(4)
|
See Note 16 regarding our quarterly cash dividend.
|
Cash paid for interest, net of capitalized interest was
$133.4 million
,
$98.8 million
and
$81.6 million
, and income taxes paid, net of refunds was
$135.3 million
,
$33.3 million
and
$62.8 million
in
December 31, 2018
,
2017
and
2016
, respectively. Net interest payments of
zero
,
$16.6 million
, and
$19.6 million
and tax payments, net of refunds of
zero
,
$8.3 million
, and
$12.6 million
were allocated to discontinued operations for the years ended
December 31, 2018
,
2017
and
2016
, respectively. Accrued additions to property, plant and equipment at
December 31, 2018
,
2017
and
2016
were
$6.8 million
,
$11.6 million
and
$3.4 million
, respectively.
The accompanying notes are an integral part of these consolidated financial statements.
48
FMC CORPORATION
CONSOLIDATED STATEMENTS OF CHANGES IN EQUITY
|
|
FMC Stockholders’ Equity
|
|
|
||||||||||||||||||||||||
|
(in Millions, Except Per Share Data)
|
Common
Stock,
$0.10 Par
Value
|
Capital In Excess of Par
|
Retained
Earnings
|
Accumulated Other Comprehensive Income (Loss)
|
Treasury
Stock
|
Non-controlling
Interest
|
Total
Equity
|
||||||||||||||||||||
|
Balance December 31, 2015
|
$
|
18.6
|
|
$
|
417.7
|
|
$
|
3,385.0
|
|
$
|
(457.3
|
)
|
$
|
(1,498.3
|
)
|
$
|
42.6
|
|
$
|
1,908.3
|
|
||||||
|
Net income (loss)
|
209.1
|
|
2.6
|
|
211.7
|
|
|||||||||||||||||||||
|
Stock compensation plans
|
19.9
|
|
4.3
|
|
24.2
|
|
|||||||||||||||||||||
|
Excess tax benefits from share-based compensation
|
(0.4
|
)
|
(0.4
|
)
|
|||||||||||||||||||||||
|
Shares for benefit plan trust
|
0.4
|
|
0.4
|
|
|||||||||||||||||||||||
|
Net pension and other benefit actuarial gains (losses) and prior service cost, net of income tax
|
12.3
|
|
12.3
|
|
|||||||||||||||||||||||
|
Net hedging gains (losses) and other, net of income tax
|
13.3
|
|
13.3
|
|
|||||||||||||||||||||||
|
Foreign currency translation adjustments
|
(46.7
|
)
|
(2.0
|
)
|
(48.7
|
)
|
|||||||||||||||||||||
|
Dividends ($0.66 per share)
|
(88.6
|
)
|
(88.6
|
)
|
|||||||||||||||||||||||
|
Repurchases of common stock
|
(13.0
|
)
|
(13.0
|
)
|
|||||||||||||||||||||||
|
Transactions with noncontrolling interests
(1)
|
(18.6
|
)
|
(7.9
|
)
|
(26.5
|
)
|
|||||||||||||||||||||
|
Balance December 31, 2016
|
$
|
18.6
|
|
$
|
418.6
|
|
$
|
3,505.5
|
|
$
|
(478.4
|
)
|
$
|
(1,506.6
|
)
|
$
|
35.3
|
|
$
|
1,993.0
|
|
||||||
|
Net income (loss)
|
535.8
|
|
2.6
|
|
538.4
|
|
|||||||||||||||||||||
|
Stock compensation plans
|
33.0
|
|
9.6
|
|
42.6
|
|
|||||||||||||||||||||
|
Shares for benefit plan trust
|
(0.2
|
)
|
(0.2
|
)
|
|||||||||||||||||||||||
|
Net pension and other benefit actuarial gains (losses) and prior service cost, net of income tax
|
52.2
|
|
52.2
|
|
|||||||||||||||||||||||
|
Net hedging gains (losses) and other, net of income tax
|
(1.9
|
)
|
(1.9
|
)
|
|||||||||||||||||||||||
|
Foreign currency translation adjustments
|
187.8
|
|
(1.2
|
)
|
186.6
|
|
|||||||||||||||||||||
|
Dividends ($0.66 per share)
|
(88.9
|
)
|
(88.9
|
)
|
|||||||||||||||||||||||
|
Repurchases of common stock
|
(2.4
|
)
|
(2.4
|
)
|
|||||||||||||||||||||||
|
Noncontrolling interests associated with an acquisition
(1)
|
12.7
|
|
12.7
|
|
|||||||||||||||||||||||
|
Transactions with noncontrolling interests
(1)
|
(0.9
|
)
|
(24.1
|
)
|
(25.0
|
)
|
|||||||||||||||||||||
|
Balance December 31, 2017
|
$
|
18.6
|
|
$
|
450.7
|
|
$
|
3,952.4
|
|
$
|
(240.3
|
)
|
$
|
(1,499.6
|
)
|
$
|
25.3
|
|
$
|
2,707.1
|
|
||||||
|
Net income (loss)
|
502.1
|
|
9.4
|
|
511.5
|
|
|||||||||||||||||||||
|
Stock compensation plans
|
26.5
|
|
7.2
|
|
33.7
|
|
|||||||||||||||||||||
|
Shares for benefit plan trust
|
0.1
|
|
0.1
|
|
|||||||||||||||||||||||
|
Net pension and other benefit actuarial gains (losses) and prior service cost, net of income tax
|
20.7
|
|
20.7
|
|
|||||||||||||||||||||||
|
Net hedging gains (losses) and other, net of income tax
|
6.0
|
|
6.0
|
|
|||||||||||||||||||||||
|
Foreign currency translation adjustments
|
(95.3
|
)
|
(5.5
|
)
|
(100.8
|
)
|
|||||||||||||||||||||
|
Dividends ($0.90 per share)
|
(120.2
|
)
|
(120.2
|
)
|
|||||||||||||||||||||||
|
Repurchases of common stock
|
(206.8
|
)
|
(206.8
|
)
|
|||||||||||||||||||||||
|
Transactions with noncontrolling interests
(1)(2)
|
299.0
|
|
60.1
|
|
359.1
|
|
|||||||||||||||||||||
|
Balance December 31, 2018
|
$
|
18.6
|
|
$
|
776.2
|
|
$
|
4,334.3
|
|
$
|
(308.9
|
)
|
$
|
(1,699.1
|
)
|
$
|
89.3
|
|
$
|
3,210.4
|
|
||||||
____________________
|
(1)
|
See Notes 4 and 16 for more detail on the acquisitions of noncontrolling interest and transactions with noncontrolling interest, respectively.
|
|
(2)
|
Primarily represents the noncontrolling interest of our FMC Lithium as a result of the IPO. Refer to Note 1 for further information.
|
The accompanying notes are an integral part of these consolidated financial statements.
49
FMC CORPORATION
Notes to Consolidated Financial Statements
Note 1: Principal Accounting Policies and Related Financial Information
Nature of operations
. We are a diversified chemical company serving agricultural, consumer and industrial markets globally with innovative solutions, applications and market-leading products. We operate in
two
distinct business segments: FMC Agricultural Solutions and FMC Lithium. Our FMC Agricultural Solutions segment develops, markets and sells all
three
major classes of crop protection chemicals – insecticides, herbicides, and fungicides. These products are used in agriculture to enhance crop yield and quality by controlling a broad spectrum of insects, weeds and disease, as well as in non-agricultural markets for pest control. Our FMC Lithium segment manufactures lithium for use in a wide range of products, which are used primarily in portable energy storage, specialty polymers and chemical synthesis applications.
In March 2017, we announced our intention to separate our FMC Lithium segment (subsequently renamed Livent Corporation, or "Livent") into a publicly traded company. The initial step of the separation, the initial public offering ("IPO") of Livent, closed on October 15, 2018. In connection with the IPO, Livent had granted the underwriters an option to purchase additional shares of common stock to cover over-allotments at the IPO price, less the underwriting discount. On November 8, 2018, the underwriters exercised in full their option to purchase additional shares. After completion of the IPO and the underwriters' exercise to purchase additional shares of common stock, FMC owned
123 million
shares of Livent's common stock, representing approximately
84 percent
of the total outstanding shares of Livent's common stock. We have announced that we will distribute the remaining Livent shares (the "Distribution") on March 1, 2019. We will continue to consolidate and present Livent as the FMC Lithium segment until March 1, 2019. At that time, results of FMC Lithium will be presented as a discontinued operation.
In connection with the IPO, we have entered into certain agreements with Livent that govern various interim and ongoing relationships between the parties. These agreements include a separation and distribution agreement, a transition services agreement, a shareholders’ agreement, a tax matters agreement, a registration rights agreement, an employee matters agreement and a trademark license agreement. The tax matters agreement allocates responsibility between the parties with respect to taxes incurred as a result of any failure of the Distribution to qualify as tax-free for U.S. federal income tax purposes. Furthermore, we have received an opinion from outside counsel to the effect that the Distribution, together with certain related transactions, will qualify as a "reorganization" within the meaning of Section 368(a)(1)(D) of the Internal Revenue Code of 1986, amended (the "Code") and a tax-free distribution pursuant to Section 355 of the Code.
Basis of consolidation and basis of presentation
. The accompanying consolidated financial statements of FMC Corporation and its subsidiaries were prepared in accordance with accounting principles generally accepted in the United States of America ("U.S. GAAP"). Our consolidated financial statements include the accounts of FMC and all entities that we directly or indirectly control. All significant intercompany accounts and transactions are eliminated in consolidation.
Certain prior year amounts have been reclassified to conform to current year's presentation. Refer to the discussion within Note 2 for the impact of adopting guidance related to the presentation of net benefit cost.
Estimates and assumptions
. In preparing the financial statements in conformity with U.S. GAAP we are required to make estimates and assumptions that affect the reported amounts of assets and liabilities and disclosures of contingent assets and liabilities at the date of the financial statements and the reported amounts of revenue and expenses during the reporting period. Actual results are likely to differ from those estimates, but we do not believe such differences will materially affect our financial position, results of operations or cash flows.
Cash equivalents
. We consider investments in all liquid debt instruments with original maturities of
3 months
or less to be cash equivalents.
Trade receivables, net of allowance
. Trade receivables consist of amounts owed to us from customer sales and are recorded when revenue is recognized. The allowance for trade receivables represents our best estimate of the probable losses associated with potential customer defaults. In developing our allowance for trade receivables, we use a two stage process which includes calculating a general formula to develop an allowance to appropriately address the uncertainty surrounding collection risk of our entire portfolio and specific allowances for customers where the risk of collection has been reasonably identified either due to liquidity constraints or disputes over contractual terms and conditions.
Our method of calculating the general formula consists of estimating the recoverability of trade receivables based on historical experience, current collection trends, and external business factors such as economic factors, including regional bankruptcy rates, and political factors. Our analysis of trade receivable collection risk is performed quarterly, and the allowance is adjusted accordingly.
50
We also hold long-term receivables that represent long-term customer receivable balances related to past-due accounts which are not expected to be collected within the current year. Our policy for the review of the allowance for these receivables is consistent with the discussion in the preceding paragraph above on trade receivables. Therefore on an ongoing basis, we continue to evaluate the credit quality of our long-term receivables utilizing aging of receivables, collection experience and write-offs, as well as existing economic conditions, to determine if an additional allowance is necessary.
The allowance for trade receivable was
$22.4 million
and
$38.7 million
as of
December 31, 2018
and
2017
, respectively. The allowance for long-term receivables was
$60.5 million
and
$47.1 million
at
December 31, 2018
and
2017
. The provision to the allowance for receivables charged against operations was
$71.3 million
,
$22.1 million
and
$21.9 million
for the years ended
December 31, 2018
,
2017
and
2016
, respectively. See Note 9 for more information. The provision in 2018 includes the effects of the stranded accounts receivables written off as part of the restructuring in India. See Note 8 for more information.
Investments
. Investments in companies in which our ownership interest is
50 percent
or less and in which we exercise significant influence over operating and financial policies are accounted for using the equity method. Under the equity method, original investments are recorded at cost and adjusted by our share of undistributed earnings and losses of these investments. Majority owned investments in which our control is restricted are also accounted for using the equity method. All other investments are carried at their fair values or at cost, as appropriate. We are party to several joint venture investments throughout the world, which individually and in the aggregate are not significant to our financial results.
Inventories
. Inventories are stated at the lower of cost or market value. Inventory costs include those costs directly attributable to products before sale, including all manufacturing overhead but excluding distribution costs. All domestic inventories, excluding materials and supplies, are determined on a last-in, first-out (“LIFO”) basis and our remaining inventories are recorded on either a first-in, first-out (“FIFO”) basis or average cost. The method for the acquired DuPont Crop Protection Business includes LIFO and average cost. See Note 6 for more information.
Property, plant and equipment
. We record property, plant and equipment, including capitalized interest, at cost. We recognize acquired property, plant and equipment, from acquisitions at its estimated fair value. Depreciation is provided principally on the straight-line basis over the estimated useful lives of the assets (land improvements —
20 years
, buildings —
20
to
40 years
, and machinery and equipment —
three
to
18 years
). Gains and losses are reflected in income upon sale or retirement of assets. Expenditures that extend the useful lives of property, plant and equipment or increase productivity are capitalized. Ordinary repairs and maintenance are expensed as incurred through operating expense.
Capitalized interest
. We capitalized interest costs of
$5.0 million
in
2018
,
$3.1 million
in
2017
and
$3.2 million
in
2016
. These costs were primarily associated with the construction of certain long-lived assets and have been capitalized as part of the cost of those assets. We amortize capitalized interest over the assets’ estimated useful lives.
Impairments of long-lived assets
. We review the recovery of the net book value of long-lived assets whenever events and circumstances indicate that the net book value of an asset may not be recoverable from the estimated undiscounted future cash flows expected to result from its use and eventual disposition. In cases where undiscounted expected future cash flows are less than the net book value, we recognize an impairment loss equal to an amount by which the net book value exceeds the fair value of the asset. Long-lived assets to be disposed of are reported at the lower of carrying amount or fair value less cost to sell.
Asset retirement obligations
. We record asset retirement obligations (“AROs”) at fair value at the time the liability is incurred if we can reasonably estimate the settlement date. The associated AROs are capitalized as part of the carrying amount of related long-lived assets. In future periods, the liability is accreted to its present value and the capitalized cost is depreciated over the useful life of the related asset. We also adjust the liability for changes resulting from the passage of time and/or revisions to the timing or the amount of the original estimate. Upon retirement of the long-lived asset, we either settle the obligation for its recorded amount or incur a gain or loss.
In our FMC Lithium segment, we have mining operations and legal reclamation obligations related to these facilities upon closure of the mines. Also, we have obligations at the majority of our manufacturing facilities in the event of permanent plant shutdown. Certain of these obligations are recorded in our environmental reserves described in Note 11. For certain AROs not already accrued, we have calculated the fair value of these AROs and concluded that the present value of these obligations was inconsequential at
December 31, 2018
and
2017
.
The carrying amounts for the AROs for the years ended
December 31, 2018
and
2017
are
$2.7 million
and
$1.9 million
, respectively. These amounts are included in "Other long-term liabilities" on the consolidated balance sheet.
51
Restructuring and other charges
. We continually perform strategic reviews and assess the return on our businesses. This sometimes results in a plan to restructure the operations of a business. We record an accrual for severance and other exit costs under the provisions of the relevant accounting guidance.
Additionally, as part of these restructuring plans, write-downs of long-lived assets may occur. Two types of assets are impacted: assets to be disposed of by sale and assets to be abandoned. Assets to be disposed of by sale are measured at the lower of carrying amount or estimated net proceeds from the sale. Assets to be abandoned with no remaining future service potential are written down to amounts expected to be recovered. The useful life of assets to be abandoned that have a remaining future service potential are adjusted and depreciation is recorded over the adjusted useful life.
Capitalized software.
We capitalize the costs of internal use software in accordance with accounting literature which generally requires the capitalization of certain costs incurred to develop or obtain internal use software. We assess the recoverability of capitalized software costs on an ongoing basis and record write-downs to fair value as necessary. We amortize capitalized software costs over expected useful lives ranging from
three
to
10 years
. See Note 21 for the net unamortized computer software balances.
Goodwill and intangible assets
. Goodwill and other indefinite life intangible assets are not subject to amortization. Instead, they are subject to at least an annual assessment for impairment by applying a fair value-based test.
We test goodwill and indefinite life intangibles for impairment annually using the criteria prescribed by U.S. GAAP accounting guidance for goodwill and other intangible assets. Based upon our annual impairment assessments conducted in
2018
and
2017
, we did not record any goodwill impairments. See Note 5 for more information on indefinite life intangibles. In 2017, we recorded a
$42.1 million
impairment charge to write down certain indefinite-lived intangible assets of the acquired DuPont Crop Protection Business as a result of the Tax Cuts and Jobs Act (“the Act”) passed in the fourth quarter of 2017. See Note 12 for more details. In
2016
, we recorded indefinite life intangible impairments of
$9.3 million
. These amounts were associated with Cheminova integration and restructuring activities within FMC Agricultural Solutions.
Finite-lived intangible assets consist of primarily customer relationships and patents, brands, registration rights, industry licenses, and other intangibles and are generally being amortized over periods of approximately
three
to
20
years. See Note 5 for additional information on goodwill and intangible assets.
Revenue recognition
. We recognize revenue when (or as) we satisfy our performance obligation which is when the customer obtains control of the good or service. Rebates due to customers are accrued as a reduction of revenue in the same period that the related sales are recorded based on the contract terms. Refer to Note 3.
We record amounts billed for shipping and handling fees as revenue. Costs incurred for shipping and handling are recorded as costs of sales and services. Amounts billed for sales and use taxes, value-added taxes, and certain excise and other specific transactional taxes imposed on revenue-producing transactions are presented on a net basis and excluded from sales in the consolidated income statements. We record a liability until remitted to the respective taxing authority.
We periodically enter into prepayment arrangements with customers, primarily in our FMC Agricultural Solutions segment, and receive advance payments for product to be delivered in future periods. These advance payments are recorded as deferred revenue and classified as “Advance payments from customers” on the consolidated balance sheet. Revenue associated with advance payments is recognized as shipments are made and transfer of control to the customer takes place.
On January 1, 2018, Accounting Standards Update 2014-09, Revenue from Contracts with Customers, became effective. See Note 2 to these consolidated financial statements for more information.
Research and development
.
Research and development costs are expensed as incurred. In-process research and development acquired as part of asset acquisitions, which include license and development agreements, are expensed as incurred and included as a component of “Restructuring and other charges (income)" on the consolidated statements of income (loss).
Income and other taxes
. We provide current income taxes on income reported for financial statement purposes adjusted for transactions that do not enter into the computation of income taxes payable. We recognize deferred tax liabilities and assets for the expected future tax consequences of temporary differences between the carrying amounts and the tax basis of assets and liabilities. We have not provided income taxes for any additional outside basis differences inherent in our investments in subsidiaries because the investments and related unremitted earnings are essentially permanent in duration or we have concluded that no additional tax liability will arise upon disposal.
52
Foreign currency
. We translate the assets and liabilities of our foreign operations at exchange rates in effect at the balance sheet date. For foreign operations for which the functional currency is not the U.S. dollar we record translation gains and losses as a component of accumulated other comprehensive income (loss) in equity. The foreign operations' income statements are translated at the monthly exchange rates for the period.
We record remeasurement gains and losses on monetary assets and liabilities, such as accounts receivables and payables, which are not in the functional currency of the operation. These remeasurement gains and losses are recorded in income as they occur. We generally enter into foreign currency contracts to mitigate the financial risk associated with these transactions. See “Derivative financial instruments” below and Note 18.
Derivative financial instruments
. We mitigate certain financial exposures, including currency risk, interest rate risk and commodity price exposures, through a controlled program of risk management that includes the use of derivative financial instruments. We enter into foreign exchange contracts, including forward and purchased option contracts, to reduce the effects of fluctuating foreign currency exchange rates.
We recognize all derivatives on the balance sheet at fair value. On the date the derivative instrument is entered into, we generally designate the derivative as either a hedge of the variability of cash flows to be received or paid related to a forecasted transaction (cash flow hedge) or a hedge of the fair value of a recognized asset or liability or of an unrecognized firm commitment (fair value hedge). We record in accumulated other comprehensive income (loss) changes in the fair value of derivatives that are designated as, and meet all the required criteria for, a cash flow hedge. We then reclassify these amounts into earnings as the underlying hedged item affects earnings. We record immediately in earnings changes in the fair value of derivatives that are not designated as cash flow hedges.
We formally document all relationships between hedging instruments and hedged items, as well as the risk management objective and strategy for undertaking various hedge transactions. This process includes relating derivatives that are designated as fair value or cash flow hedges to specific assets and liabilities on the balance sheet or to specific firm commitments or forecasted transactions. We also formally assess, both at the inception of the hedge and throughout its term, whether each derivative is highly effective in offsetting changes in fair value or cash flows of the hedged item. If we determine that a derivative is not highly effective as a hedge, or if a derivative ceases to be a highly effective hedge, we discontinue hedge accounting with respect to that derivative prospectively.
Treasury stock
. We record shares of common stock repurchased at cost as treasury stock, resulting in a reduction of stockholders’ equity in the consolidated balance sheets. When the treasury shares are contributed under our employee benefit plans or issued for option exercises, we use a FIFO method for determining cost. The difference between the cost of the shares and the market price at the time of contribution to an employee benefit plan is added to or deducted from the related capital in excess of par value of common stock.
Segment information
. We determined our reportable segments based on our strategic business units, the commonalities among the products and services within each segment and the manner in which we review and evaluate operating performance.
We have identified FMC Agricultural Solutions and FMC Lithium as our reportable segments. Segment disclosures are included in Note 20. Segment EBITDA is defined as segment revenue less operating expenses (segment operating expenses consist of costs of sales and services, selling, general and administrative expenses, research and development expenses), excluding depreciation and amortization. We have excluded the following items from segment EBITDA: corporate staff expense, interest income and expense associated with corporate debt facilities and investments, income taxes, gains (or losses) on divestitures of businesses, restructuring and other charges (income), non-operating pension and postretirement charges (income), investment gains and losses, loss on extinguishment of debt, asset impairments, LIFO inventory adjustments, transaction-related charges, and other income and expense items. Information about how restructuring and other charges (income) relate to our businesses at the segment level is discussed in Note 8.
Segment assets and liabilities are those assets and liabilities that are recorded and reported by segment operations. Segment operating capital employed represents segment assets less segment liabilities. Segment assets exclude corporate and other assets, which are principally cash equivalents, the LIFO reserve on inventory, deferred income taxes, eliminations of intercompany receivables and property and equipment not attributable to a specific segment, such as capitalized interest. Segment liabilities exclude substantially all debt, income taxes, pension and other postretirement benefit liabilities, environmental reserves and related recoveries, restructuring reserves, fair value of currency contracts, intercompany eliminations, and reserves for discontinued operations.
53
Geographic segment revenue is based on the location of our customers. Geographic segment long-lived assets include goodwill and other intangibles, net, property, plant and equipment, net and other non-current assets. Geographic segment data is included in Note 20.
Stock compensation plans
. We recognize compensation expense in the financial statements for all share options and other equity-based arrangements. Share-based compensation cost is measured at the date of grant, based on the fair value of the award, and is recognized over the employee’s requisite service period. See Note 15 for further discussion on our share-based compensation.
Environmental obligations
. We provide for environmental-related obligations when they are probable and amounts can be reasonably estimated. Where the available information is sufficient to estimate the amount of liability, that estimate has been used. Where the information is only sufficient to establish a range of probable liability and no point within the range is more likely than any other, the lower end of the range has been used.
Estimated obligations to remediate sites that involve oversight by the United States Environmental Protection Agency (“EPA”), or similar government agencies, are generally accrued no later than when a Record of Decision (“ROD”), or equivalent, is issued, or upon completion of a Remedial Investigation/Feasibility Study (“RI/FS”), or equivalent, that is submitted by us and the appropriate government agency or agencies. Estimates are reviewed quarterly and, if necessary, adjusted as additional information becomes available. The estimates can change substantially as additional information becomes available regarding the nature or extent of site contamination, required remediation methods, and other actions by or against governmental agencies or private parties.
Our environmental liabilities for continuing and discontinued operations are principally for costs associated with the remediation and/or study of sites at which we are alleged to have released hazardous substances into the environment. Such costs principally include, among other items, RI/FS, site remediation, costs of operation and maintenance of the remediation plan, management costs, fees to outside law firms and consultants for work related to the environmental effort, and future monitoring costs. Estimated site liabilities are determined based upon existing remediation laws and technologies, specific site consultants’ engineering studies or by extrapolating experience with environmental issues at comparable sites.
Included in our environmental liabilities are costs for the operation, maintenance and monitoring of site remediation plans ("OM&M"). Such reserves are based on our best estimates for these OM&M plans. Over time we may incur OM&M costs in excess of these reserves. However, we are unable to reasonably estimate an amount in excess of our recorded reserves because we cannot reasonably estimate the period for which such OM&M plans will need to be in place or the future annual cost of such remediation, as conditions at these environmental sites change over time. Such additional OM&M costs could be significant in total but would be incurred over an extended period of years.
Included in the environmental reserve balance, other assets balance and disclosure of reasonably possible loss contingencies are amounts from third party insurance policies which we believe are probable of recovery.
Provisions for environmental costs are reflected in income, net of probable and estimable recoveries from named Potentially Responsible Parties (“PRPs”) or other third parties. Such provisions incorporate inflation and are not discounted to their present values.
In calculating and evaluating the adequacy of our environmental reserves, we have taken into account the joint and several liability imposed by Comprehensive Environmental Remediation, Compensation and Liability Act (“CERCLA”) and the analogous state laws on all PRPs and have considered the identity and financial condition of the other PRPs at each site to the extent possible. We have also considered the identity and financial condition of other third parties from whom recovery is anticipated, as well as the status of our claims against such parties. Although we are unable to forecast the ultimate contributions of PRPs and other third parties with absolute certainty, the degree of uncertainty with respect to each party is taken into account when determining the environmental reserve on a site-by-site basis. Our liability includes our best estimate of the costs expected to be paid before the consideration of any potential recoveries from third parties. We believe that any recorded recoveries related to PRPs are realizable in all material respects. Recoveries are recorded as either an offset in “Environmental liabilities, continuing and discontinued” or as “Other assets including long-term receivables, net” in our consolidated balance sheets in accordance with U.S. accounting literature.
Pension and other postretirement benefits.
We provide qualified and nonqualified defined benefit and defined contribution pension plans, as well as postretirement health care and life insurance benefit plans to our employees and retirees. The costs (or benefits) and obligations related to these benefits reflect key assumptions related to general economic conditions, including interest (discount) rates, healthcare cost trend rates, expected rates of return on plan assets and the rates of compensation increase for
54
employees. The costs (or benefits) and obligations for these benefit programs are also affected by other assumptions, such as average retirement age, mortality, employee turnover, and plan participation. To the extent our plans’ actual experience, as influenced by changing economic and financial market conditions or by changes to our own plans’ demographics, differs from these assumptions, the costs and obligations for providing these benefits, as well as the plans’ funding requirements, could increase or decrease. When actual results differ from our assumptions, the difference is typically recognized over future periods. In addition, the unrealized gains and losses related to our pension and postretirement benefit obligations may also affect periodic benefit costs (or benefits) in future periods. See Note 14 for additional information relating to pension and other postretirement benefits.
Note 2: Recently Issued and Adopted Accounting Pronouncements and Regulatory Items
New accounting guidance and regulatory items
In August 2018, the Financial Accounting Standards Board (“FASB”) issued Accounting Standards Update (“ASU”) No. 2018-15,
Internal-Use Software (Subtopic 350-40): Customer’s Accounting for Implementation Costs Incurred in a Cloud Computing Arrangement That Is a Service Contract.
The amendments in this ASU align the requirements for capitalizing implementation costs incurred in a hosting arrangement that is a service contract with the requirements for capitalizing implementation costs incurred to develop or obtain internal-use software. The new standard is effective for fiscal years beginning after December 15, 2019 (i.e. a January 1, 2020 effective date). We are evaluating the effect the guidance will have on our consolidated financial statements.
In February 2018, the FASB issued ASU No. 2018-02,
Reclassification of Certain Tax Effects from Accumulated Other Comprehensive Income
. This new standard permits a company to reclassify the income tax effects of the change in the U.S federal corporate income tax rate on the gross deferred tax amounts and related valuation allowances as well as other income tax effects related to the application of the Act within Accumulated other comprehensive income ("AOCI") to retained earnings. There are also new required disclosures such as a description of the accounting policy for releasing income tax effects from AOCI as well as certain disclosures in the period of adoption if a company elects to reclassify the income tax effects. The new standard is effective for fiscal years beginning after December 15, 2018 (i.e. a January 1, 2019 effective date), and interim periods within those fiscal years, with early adoption permitted. The impacts of this standard is limited to a reclassification of certain income tax effects from AOCI to retained earnings.
In August 2017, the FASB issued ASU No. 2017-12,
Derivatives and Hedging (Topic 815)
. This ASU amends and simplifies existing hedge accounting guidance and allows for more hedging strategies to be eligible for hedge accounting. In addition, the ASU amends disclosure requirements and how hedge effectiveness is assessed. The new standard is effective for fiscal years beginning after December 15, 2018 (i.e. a January 1, 2019 effective date), with early adoption permitted in any interim period after issuance of this ASU. We believe the adoption will not have a material impact on our consolidated financial statements.
In January 2017, the FASB issued ASU No. 2017-04,
Intangibles - Goodwill and Other (Topic 350): Simplifying the Test for Goodwill Impairment
. This ASU changes the subsequent measurement of goodwill impairment by eliminating Step 2 from the impairment test. Under the new guidance, an entity will measure impairment using the difference between the carrying amount and the fair value of the reporting unit. The new standard is effective for fiscal years beginning after December 15, 2019 (i.e. a January 1, 2020 effective date), with early adoption permitted for goodwill impairment tests with measurement dates after January 1, 2017. We believe the adoption will not have a material impact on our consolidated financial statements.
In June 2016, the FASB issued ASU No. 2016-13,
Financial Instruments – Credit Losses (Topic 326), Measurement of Credit Losses on Financial Instruments”
("ASU 2016-13")
.
ASU 2016-13 replaces the incurred loss impairment methodology with a methodology that reflects expected credit losses. The update is intended to provide financial statement users with more decision-useful information about the expected credit losses on financial instruments and other commitments to extend credit held by a reporting entity at each reporting date. The new standard is effective for fiscal years beginning after December 15, 2019 (i.e. a January 1, 2020 effective date), with early adoption permitted for fiscal years beginning after December 15, 2018. We are evaluating the effect the guidance will have on our consolidated financial statements.
In February 2016, the FASB issued its new lease accounting guidance in ASU No. 2016-02,
Leases (Topic 842)
("ASU 2016-02"). Under the new guidance, lessees are required to recognize for all leases (with the exception of short-term leases) a lease liability, which is a lessee's obligation to make lease payments arising from a lease, measured on a discounted basis and a right-of-use asset, which is an asset that represents the lessee's right to use, or control the use of, a specified asset for the lease term. We have adopted this standard as of January 1, 2019 utilizing
a
modified retrospective approach and have elected the optional transition practical expedient. Under this transition practical expedient, only contracts that exist as of, or are entered into on or
55
after, January 1, 2019 are transitioned, with a cumulative effect adjustment as of January 1, 2019. All comparative periods prior to January 1, 2019 will retain the financial reporting and disclosure requirements of ASC 840.
While we are still finalizing the effect that ASU 2016-02 will have on our consolidated financial statements and related disclosures, we have performed various assessment, lease abstraction, and operational activities as part of our established project plan to support the implementation of the new lease standard. As part of our impact assessment, we have performed scoping exercises and also verified our lease population, which is approximately
1,400
leases as of February 2019. This population includes leases identified in our embedded lease assessment process. Information from these leases have been abstracted into our lease accounting software, which will assist us in the quantification of the expected impact on the consolidated balance sheets and facilitate the calculations of the related accounting entries and disclosures. We continue to update this population in our software as new leases are entered or modified and reassess the impact, accordingly. We have also assessed any potential impacts on our internal controls, business processes, and accounting policies related to both the implementation and ongoing compliance of the new guidance. We have made updates and/or created new controls and processes to address the significant changes as a result of the adoption of ASU 2016-02. Additionally, we are in the process of developing drafts of our new footnote disclosures required under the new standard that will be disclosed in our first quarter Form 10-Q, but will continue to work on finalizing them during the first quarter of 2019. As previously noted, although we are still finalizing the quantitative effects of ASU 2016-02, we expect total assets and total liabilities will increase between
$180 million
and
$220 million
in the period of adoption (this range represents the discounted impact). A large majority of that increase relates to a few key real estate leases including our Corporate headquarters, regional innovation centers, and centers of excellence.
Recently adopted accounting guidance
In March 2018, the FASB issued ASU No. 2018-05,
Amendments to SEC Paragraphs Pursuant to SEC Staff Accounting Bulletin No. 118
related to the Tax Cuts and Jobs Act. This update amends several paragraphs in ASC 740,
Income Taxes
, that contain SEC guidance related to SAB 118, which was previously issued in December 2017 by the SEC. In accordance with SAB 118, income tax effects of the Act were refined upon obtaining, preparing, or analyzing additional information during the measurement period. During the year ended December 31, 2018, we recorded an adjustment to our provisional expense of
$8.5 million
. Our analysis under SAB 118 is complete. Refer to Note 12 for more information.
In May 2017, the FASB issued ASU No. 2017-09,
Stock
Compensation - Scope of Modification Accounting
. This ASU provides guidance on which changes to the terms or conditions of a share-based payment award require an entity to apply modification accounting in Topic 718. The new standard was effective for fiscal years beginning after December 15, 2017 (i.e. a January 1, 2018 effective date). We adopted this standard beginning in 2018. We will apply the new guidance for any non-substantive changes in our share-based awards in future periods. There was no impact to our consolidated financial statements upon adoption.
In March 2017, the FASB issued ASU No. 2017-07,
Compensation - Retirement Benefits (Topic 715): Improving the Presentation of Net Periodic Pension Cost and Net Periodic Postretirement Benefit Cost
. This ASU provides requirements for the presentation and disclosure of net benefit cost on the financial statements. The service cost component of net benefit cost is required to be presented in the income statement line item where the associated compensation cost is reported, while the other components of net benefit cost are required to be presented outside of operating income. The new standard was effective for fiscal years beginning after December 15, 2017 (i.e. a January 1, 2018 effective date). We adopted this standard on a retrospective basis. As a result, we have reclassified non-operating pension and postretirement charges (income) from "Selling, general and administrative expenses" to "Non-operating pension and postretirement charges (income)" within the consolidated statements of income (loss). For the years ended
December 31, 2017
and
2016
, we reclassified
$18.2 million
and
$23.4 million
of non-operating pension and postretirement charges. There was no impact to our net income. Refer to the table below.
|
Year ended December 31, 2017
|
|||||||||||
|
(in Millions)
|
As Reported
|
Reclassification
|
As adjusted
|
||||||||
|
Selling, general and administrative expenses
|
$
|
618.6
|
|
$
|
(18.2
|
)
|
$
|
600.4
|
|
||
|
Non-operating pension and postretirement charges (income)
|
—
|
|
18.2
|
|
18.2
|
|
|||||
|
Year ended December 31, 2016
|
|||||||||||
|
(in Millions)
|
As Reported
|
Reclassification
|
As adjusted
|
||||||||
|
Selling, general and administrative expenses
|
$
|
458.5
|
|
$
|
(23.4
|
)
|
$
|
435.1
|
|
||
|
Non-operating pension and postretirement charges (income)
|
—
|
|
23.4
|
|
23.4
|
|
|||||
56
In January 2017, the FASB issued ASU No. 2017-01,
Business Combinations
. This new ASU clarified the definition of a business with the objective of adding guidance to assist entities with evaluating whether transactions should be accounted for as acquisitions (or disposals) of assets or businesses. The new standard was effective for fiscal years beginning after December 15, 2017 (i.e. a January 1, 2018 effective date) and will be applied prospectively. We adopted this standard beginning in 2018. We expect these provisions to impact future transactions of acquisitions or disposals. However, there was no impact to our consolidated financial statements upon adoption.
In October 2016, the FASB issued ASU No. 2016-16,
Income Taxes (Topic 740), Intra-Entity Transfers of Assets Other Than Inventory
. Under the new guidance, an entity will recognize the income tax consequences of an intra-entity transfer of an asset other than inventory when the transfer occurs. The new standard was effective for fiscal years beginning after December 15, 2017 (i.e. a January 1, 2018 effective date), with early adoption permitted only in the first quarter of a fiscal year. We adopted this standard beginning in 2018. There was no material impact to our consolidated financial statements upon adoption.
In August 2016, the FASB issued ASU No. 2016-15,
Statements of Cash Flows (Topic 230), Classification of Certain Cash Receipts and Cash Payments
. This ASU addresses eight specific cash flow issues with the goal of reducing the existing diversity in practice in how certain cash receipts and cash payments are both presented and classified in the statement of cash flows. The new standard was effective for fiscal years beginning after December 15, 2017, and interim periods within those fiscal years (i.e. a January 1, 2018 effective date), with early adoption permitted. We adopted this standard beginning in 2018. Based on our review of the eight cash flow issues, there were no significant changes to our presentation of certain cash receipts and payments within our consolidated cash flow statement.
In January 2016, the FASB issued ASU No. 2016-01,
Financial Instruments – Overall (Subtopic 825-10): Recognition and Measurement of Financial Assets and Financial Liabilities
, which amends the guidance in U.S. GAAP on the classification and measurement of financial instruments. Changes to the current guidance primarily affect the accounting for equity investments, financial liabilities under the fair value option, and the presentation and disclosure requirements for financial instruments. The new standard was effective for fiscal years and interim periods beginning after December 15, 2017 (i.e. a January 1, 2018 effective date), and upon adoption, an entity should apply the amendments by means of a cumulative-effect adjustment to the balance sheet at the beginning of the first reporting period in which the guidance is effective. We adopted this standard beginning in 2018. There was no material impact on our consolidated financial statements upon adoption.
In May 2014, the FASB issued ASU No. 2014-09,
Revenue from Contracts with Customers
(
Topic 606)
. This standard requires an entity to recognize the amount of revenue to which it expects to be entitled for the transfer of promised goods or services to customers. This guidance replaced most existing revenue recognition guidance in U.S. GAAP. On January 1, 2018, we adopted ASU 2014-09 and its related amendments (collectively known as ASC 606) using the modified retrospective adoption method.
In order to adopt this standard, we performed an impact assessment by analyzing revenue transactions and arrangements that are representative of our business segments and their revenue streams. Additionally, we assessed any potential impacts on our internal controls and processes related to both the implementation and ongoing compliance of the new guidance. Our assessment procedures included the DuPont Crop Protection Business, which was acquired on November 1, 2017.
The standard impacted our disclosures including disclosures presenting further disaggregation of revenue. Refer to Note 3 for further information. Based on our assessment, there was no cumulative catchup effect of initially applying ASC 606 that required an adjustment to our retained earnings; however, we have recognized balance sheet adjustments related to the presentation of sales returns liabilities and corresponding refund assets. The comparative information has not been adjusted and continues to be reported under ASC 605.
Utilizing the practical expedients and exemptions allowed under the modified retrospective method, ASC 606 was only applied to existing contracts (i.e. those for which FMC has remaining performance obligations) as of January 1, 2018, and new contracts entered into after January 1, 2018. ASC 606 was not applied to contracts that were completed prior to December 31, 2017. The impacts of the adoption of ASC 606 are set out below.
The cumulative effect of the changes made to our consolidated January 1, 2018 balance sheet for the adoption of ASC 606,
Revenue from Contracts with Customers,
was as follows:
57
|
Balance at December 31, 2017
|
Adjustments due to ASC 606
|
Balance at January 1, 2018
|
|||||||||
|
(in Millions)
|
Amounts as originally reported
|
Adjustment
|
Amounts as adjusted
|
||||||||
|
Assets
|
|||||||||||
|
Prepaid and other current assets
|
$
|
326.4
|
|
$
|
84.8
|
|
$
|
411.2
|
|
||
|
Liabilities and Equity
|
|||||||||||
|
Accrued and other liabilities
|
$
|
497.7
|
|
$
|
84.8
|
|
$
|
582.5
|
|
||
In accordance with the new revenue standard requirements, the disclosure of the impact of adoption on our consolidated balance sheet was as follows:
|
December 31, 2018
|
|||||||||||
|
(in Millions)
|
Amounts as reported
|
Adjustment due to ASC 606
|
Amounts without ASC 606 adjustment
|
||||||||
|
Balance Sheet
|
|||||||||||
|
Assets
|
|||||||||||
|
Prepaid and other current assets
|
$
|
486.0
|
|
$
|
(49.7
|
)
|
$
|
436.3
|
|
||
|
Liabilities and Equity
|
|||||||||||
|
Accrued and other liabilities
|
$
|
594.4
|
|
$
|
(49.7
|
)
|
$
|
544.7
|
|
||
The adoption of ASC 606 requires FMC to record its estimated product returns gross on the balance sheet. Therefore, a refund liability is recognized for the consideration paid by a customer to which FMC does not expect to be entitled, together with a corresponding asset to recover the product from the customer. Presenting estimated product returns gross on the balance sheet resulted in impacts to the above asset and liability line items.
Note 3: Revenue Recognition
Disaggregation of revenue
FMC disaggregates revenue from contracts with customers by business segment and by geographical areas. Our FMC Agricultural Solutions segment is further disaggregated into
three
major pesticide product categories - Insecticides, Herbicides, and Fungicides - and our FMC Lithium segment is disaggregated into
four
product categories - Lithium Hydroxide, Butyllithium, High Purity Lithium Metal and Other Specialty Compounds, and Lithium Carbonate and Lithium Chloride. The disaggregated revenue tables below are reconciled to FMC’s reportable segments, as defined in Note 20, for the year ended
December 31, 2018
.
The following table provides information about disaggregated revenue by major geographical region:
58
|
(in Millions)
|
Year ended December 31, 2018
|
||
|
FMC Agricultural Solutions
|
|||
|
North America
|
$
|
1,090.8
|
|
|
Latin America
|
1,210.1
|
|
|
|
Europe, Middle East & Africa
|
966.0
|
|
|
|
Asia Pacific
|
1,018.4
|
|
|
|
Total FMC Agricultural Solutions Revenue
|
$
|
4,285.3
|
|
|
FMC Lithium
|
|||
|
North America
|
$
|
84.4
|
|
|
Latin America
|
2.0
|
|
|
|
Europe, Middle East & Africa
|
74.5
|
|
|
|
Asia Pacific
|
281.6
|
|
|
|
Total FMC Lithium Revenue
|
$
|
442.5
|
|
|
Total FMC Revenue
|
$
|
4,727.8
|
|
The following table provides information about disaggregated revenue by major product category:
|
(in Millions)
|
Year ended December 31, 2018
|
||
|
FMC Agricultural Solutions
|
|||
|
Insecticides
|
$
|
2,476.5
|
|
|
Herbicides
|
1,251.2
|
|
|
|
Fungicides
|
268.7
|
|
|
|
Other
|
288.9
|
|
|
|
Total FMC Agricultural Solutions Revenue
|
$
|
4,285.3
|
|
|
FMC Lithium
|
|||
|
Lithium Hydroxide
|
$
|
222.7
|
|
|
Butyllithium
|
99.0
|
|
|
|
High Purity Lithium Metal and Other Specialty Compounds
|
62.5
|
|
|
|
Lithium Carbonate and Lithium Chloride
|
58.3
|
|
|
|
Total FMC Lithium Revenue
|
$
|
442.5
|
|
|
Total FMC Revenue
|
$
|
4,727.8
|
|
FMC Agricultural Solutions
We earn revenue from the sale of a wide range of products to a diversified base of customers around the world. FMC Agricultural Solutions' portfolio is comprised of three major pesticide categories: insecticides, herbicides and fungicides. These products are used in agriculture to enhance crop yield and quality by controlling a broad spectrum of insects, weeds and disease, as well as in non-agricultural markets for pest control. The majority of our product lines consist of insecticides and herbicides, and we have a small but fast-growing portfolio of fungicides mainly used in high value crop segments. Our insecticides are used to control a wide spectrum of pests, while our herbicide portfolio primarily targets a large variety of difficult-to-control weeds. Products in the other category include various agricultural products such as smaller classes of pesticides, growth promoters, and soil enhancements.
FMC Lithium
59
The FMC Lithium segment manufactures lithium for use in a wide range of products, which are used primarily in portable energy storage, specialty polymers and chemical synthesis applications. The FMC Lithium segment focuses on producing specialty products - Lithium hydroxide and Butyllithium. These products are developed and sold to global and regional customers in the electronic vehicle, polymer and specialty alloy metals market. Lithium hydroxide products are used in advanced batteries for hybrid electric, plug-in hybrid, and all-electric vehicles as well as other products that require portable energy storage such as smart phones, tablets, laptop computers, and military devices. Butyllithium products are primarily used as polymer initiators and in the synthesis of pharmaceuticals. High purity lithium metal and other specialty products include lithium phosphate, pharmaceutical-grade lithium carbonate, high purity lithium chloride and specialty organics. Additionally, FMC sells whatever Lithium carbonate and Lithium chloride it does not use internally to its customers for various applications.
Sale of Goods
Revenue from product sales is recognized when (or as) FMC satisfies a performance obligation by transferring the promised goods to a customer, that is, when control of the good transfers to the customer. The customer is then invoiced at the agreed-upon price with payment terms generally ranging from
30
to
90
days, with some regions providing terms longer than 90 days. We do not typically give payment terms that exceed
360
days; however, in certain geographical regions such as Latin America, these extended terms may be given in limited circumstances. Additionally, a timing difference of over
one
year can exist between when products are delivered to the customer and when payment is received from the customer in these regions; however, the effect of these sales is not material to the financial statements as a whole. Furthermore, we have assessed the circumstances and arrangements in these regions and determined that the contracts with these customers do not contain a significant financing component.
In determining when the control of goods is transferred, we typically assess, among other things, the transfer of risk and title and the shipping terms of the contract. The transfer of title and risk typically occurs either upon shipment to the customer or upon receipt by the customer. As such, FMC typically recognizes revenue when goods are shipped based on the relevant Incoterm for the product order, or in some regions, when delivery to the customer’s requested destination has occurred. When we perform shipping and handling activities after the transfer of control to the customer (e.g., when control transfers prior to delivery), they are considered as fulfillment activities, and accordingly, the costs are accrued for when the related revenue is recognized. For FOB shipping point terms, revenue is recognized at the time of shipment since the customer gains control at this point in time.
We record amounts billed for shipping and handling fees as revenue. Costs incurred for shipping and handling are recorded as costs of sales and services. Amounts billed for sales and use taxes, value-added taxes, and certain excise and other specific transactional taxes imposed on revenue-producing transactions are presented on a net basis and excluded from sales in the consolidated income statements. We record a liability until remitted to the respective taxing authority.
Sales Incentives and Other Variable Considerations
As a part of our customary business practice, we offer a number of sales incentives to our customers including volume discounts, retailer incentives, and prepayment options. The variable considerations given can differ by products, support levels and other eligibility criteria. For all such contracts that include any variable consideration, we estimate the amount of variable consideration that should be included in the transaction price utilizing either the expected value method or the most likely amount method depending on the nature of the variable consideration. Variable consideration is included in the transaction price if, in our judgment, it is probable that a significant future reversal of cumulative revenue under the contract will not occur. Although determining the transaction price for these considerations requires significant judgment, we have significant historical experience with incentives provided to customers and estimate the expected consideration considering historical patterns of incentive payouts. These estimates are reassessed each reporting period as required.
In addition to the variable considerations describe above, in certain instances, we may require our customers to meet certain volume thresholds within their contract term. We estimate what amount of variable consideration should be included in the transaction price at contract inception and continually reassess this estimation each reporting period to determine situations when the minimum volume thresholds will not be met. Variable consideration is included in the transaction price if, in our judgment, it is probable that a significant future reversal of cumulative revenue under the contract will not occur.
Right of Return
FMC extends an assurance warranty offering customers a right of refund or exchange in case delivered product does not conform to specifications. Additionally, in certain regions and arrangements, we may offer a right of return for a specified period. Both instances are accounted for as a right of return and transaction price is adjusted for an estimate of expected returns. Replacement products are accounted for under the warranty guidance if the customer exchanges one product for another of the same kind,
60
quality, and price. We have significant experience with historical return patterns and use this experience to include returns in the estimate of transaction price.
Contract asset and contract liability balances
FMC satisfies its obligations by transferring goods and services in exchange for consideration from customers. The timing of performance sometimes differs from the timing the associated consideration is received from the customer, thus resulting in the recognition of a contract asset or contract liability. FMC recognizes a contract liability if the customer's payment of consideration is received prior to completion of FMC's related performance obligation.
The following table presents the opening and closing balances of FMC's receivables (net of allowances) and contract liabilities from contracts with customers.
|
(in Millions)
|
Balance as of December 31, 2017
|
Balance as of December 31, 2018
|
Increase (Decrease)
|
||||||||
|
Receivables from contracts with customers, net of allowances
|
$
|
2,150.2
|
|
$
|
2,369.7
|
|
$
|
219.5
|
|
||
|
Contract liabilities: Advance payments from customers
|
380.6
|
|
458.4
|
|
77.8
|
|
|||||
The amount of revenue recognized in the year ended
December 31, 2018
that was included in the opening contract liability balance is
$380.6 million
, which primarily relates to revenue from prepayment contracts with customers in the FMC Agricultural Solutions segment.
The balance of receivables from contracts with customers listed in the table above include both current trade receivables and long-term receivables, net of allowance for doubtful accounts. The allowance for receivables represents our best estimate of the probable losses associated with potential customer defaults. We determine the allowance based on historical experience, current collection trends, and external business factors such as economic factors, including regional bankruptcy rates, and political factors. The change in allowance for doubtful accounts for both current trade receivables and long-term receivables is representative of the impairment of receivables as of
December 31, 2018
. Refer to Note 9 for further information.
FMC periodically enters into prepayment arrangements with customers and receives advance payments for product to be delivered in future periods. Prepayment terms are extended to customers/distributors in order to capitalize on surplus cash with growers. Growers receive bulk payments for their produce, which they leverage to buy FMC products from distributors through prepayment options. This in turn creates opportunity for distributors to make large prepayments to FMC for securing the future supply of products to be sold to growers. Prepayments are typically received in the fourth quarter of the fiscal year and are for the following marketing year indicating that the time difference between prepayment and performance of corresponding performance obligations does not exceed
one
year. FMC recognizes these prepayments as a liability under “Advance Payments from customers” on the consolidated balance sheets when they are received. Revenue associated with advance payments is recognized as shipments are made and transfer of control to the customer takes place. Advance payments from customers was
$380.6 million
as of
December 31, 2017
and
$458.4 million
as of
December 31, 2018
.
Performance obligations
At contract inception, FMC assesses the goods and services promised in its contracts with customers and identifies a performance obligation for each promise to transfer a good or service (or bundle of goods or services) that is distinct. To identify the performance obligations, we consider all the goods or services promised in the contract, whether explicitly stated or implied based on customary business practices. Based on our evaluation, we have determined that our current contracts do not contain more than one performance obligation. Revenue is recognized when (or as) the performance obligation is satisfied, which is when the customer obtains control of the good or service.
Periodically, in both FMC Agricultural Solutions and FMC Lithium, FMC may enter into contracts with customers which require them to submit a forecast of non-binding purchase obligations to us. These forecasts are typically provided by the customer to FMC in good faith, and there are no penalties or obligations if the forecasts are not met. Accordingly, we have determined that these are optional purchases and do not represent material rights and are not considered as unsatisfied (or partially satisfied) performance obligations for the purposes of this disclosure.
In separate and less common circumstances, FMC may have contracts with customers which have binding purchase requirements for just one quarter of their annual forecasts. Additionally, as noted in the Contract Liabilities section above, FMC periodically enters into agricultural prepayment arrangements with customers, and receives advance payments for product to be delivered in
61
future periods within one year. We have elected not to disclose the aggregate amount of the transaction price allocated to remaining performance obligations for these two types of contracts as they have an expected duration of
one
year or less and the revenue is expected to be recognized within the next year.
Occasionally, our FMC Lithium business may enter into multi-year take-or-pay supply agreements with customers. The aggregate amount of revenue expected to be recognized related to these contracts’ performance obligations that are unsatisfied or partially satisfied is approximately
$66 million
in 2019 and
$49 million
in 2020. These approximate revenues do not include amounts of variable consideration attributable to contract renewals or contract contingencies. Based on our past experience with the customers under these arrangements, we expect to continue recognizing revenue in accordance with the contracts as we transfer control of the product to the customer (refer to the sales of goods section for our determination of transfer of control). However, in the case a shortfall of volume purchases occurs, we will recognize the amount payable by the customer ratably over the contract term.
Other arrangements
Data Licensing
FMC sometimes grants to third parties a license and right to rely upon pesticide regulatory data filed with government agencies. Such licenses allow a licensee to cite and rely upon FMC’s data in connection with the licensee’s application for pesticide registrations as required by law; these licenses can be granted through contract or through a mandatory statutory license, depending on circumstances. In the most common occurrence, when a license is embedded in a contract for supply of pesticide active ingredient from FMC to the licensee, the license grant is not considered as distinct from other promised goods or services. Accordingly, all promises are treated as a single performance obligation and revenue is recognized at a point when the control of the pesticide products is transferred to the licensee-customer. In the less frequent occurrence, when the license and right to use data is granted without a supply contract, FMC accounts for the revenue attributable to the data license as a performance obligation satisfied at a single point in time and recognizes revenue on the effective date of such contract. Finally, in those circumstance of mandatory data licensing by statute, such as under U.S. pesticide law, FMC recognizes the data compensation upon the effective date of the data compensation settlement agreement. Payment terms for these arrangements may vary by contract.
Service Arrangements
In limited cases, FMC engages in providing certain tolling services, such as filling and packing services using raw and packing materials supplied by the customer. However, as a result of the DuPont Crop Protection Business Acquisition, on November 1, 2017 DuPont and FMC entered into an agreement to provide tolling services to one another for up to
five
years from the acquisition date. Depending on the nature of the tolling services, FMC determines the appropriate method of satisfaction of the performance obligation, which may be the input or output method. Compared to other goods and services provided by FMC, service arrangements do not represent a significant portion of sales each year. Payment terms for service arrangements may vary by contract; however, payment is typically due within
30
days of the invoice date.
Practical Expedients and Exemptions
FMC has elected the following practical expedients following the adoption of ASC 606:
|
a.
|
Costs of obtaining a contract:
FMC incurs certain costs such as sales commissions which are incremental to obtaining the contract. We have taken the practical expedient of expensing such costs to obtain a contract, as and when they are incurred, as their expected amortization period is
one
year or less.
|
|
b.
|
Significant financing component:
We elected not to adjust the promised amount of consideration for the effects of a significant financing component if FMC expects, at contract inception, that the period between the transfer of a promised good or service to a customer and when the customer pays for that good or service will be
one
year or less.
|
|
c.
|
Remaining performance obligations:
We elected not to disclose the aggregate amount of the transaction price allocated to remaining performance obligations for its contracts that are one year or less, as the revenue is expected to be recognized within
one
year. Additionally, we have elected not to disclose information about variable considerations for remaining, wholly unsatisfied performance obligations for which the criteria in paragraph 606-10-32-40 have been met.
|
|
d.
|
Shipping and handling costs
:
We elected to account for shipping and handling activities that occur after the customer has obtained control of a good as fulfillment activities (i.e., an expense) rather than as a promised service.
|
|
e.
|
Measurement of transaction price:
We have elected to exclude from the measurement of transaction price all taxes assessed by a governmental authority that are both imposed on and concurrent with a specific revenue-producing transaction and collected by us from a customer.
|
Note 4: Acquisitions
62
2017 Acquisition
DuPont Crop Protection Business
On November 1, 2017, pursuant to the terms and conditions set forth in the Transaction Agreement entered into with E. I. du Pont de Nemours and Company (“DuPont"), we completed the acquisition of certain assets relating to DuPont's Crop Protection business and research and development ("R&D") organization (the "DuPont Crop Protection Business") (collectively, the "DuPont Crop Protection Business Acquisition"). In connection with this transaction, we sold to DuPont our FMC Health and Nutrition segment and paid DuPont
$1.2 billion
in cash which was funded with the 2017 Term Loan Facility which was secured for the purposes of the Acquisition. See Note 13 for more details. The following table illustrates each component of the consideration paid as part of the DuPont Crop Protection Business Acquisition:
|
(in Millions)
|
Amount
|
||
|
Cash purchase price, net
|
$
|
1,225.6
|
|
|
Cash proceeds from working capital and other adjustments
|
(21.5
|
)
|
|
|
Fair value of FMC Health and Nutrition sold to DuPont
|
1,968.6
|
|
|
|
Total purchase consideration
|
$
|
3,172.7
|
|
The Transaction Agreement also contained a provision for working capital adjustments. The DuPont Crop Protection Business is being integrated into our FMC Agricultural Solutions segment and has been included within our results of operations since the date of acquisition. Revenue and U.S. GAAP Income (loss) from continuing operations before income taxes attributable to the DuPont Crop Protection Business, since the date of acquisition, and for the twelve months ended December 31, 2017 was approximately
$193.5 million
and
$27.6 million
, respectively. The Income (loss) from continuing operations before income taxes attributable to the DuPont Crop Protection Business includes the inventory fair value step-up amortization recorded in "Cost of sales and services" on the consolidated statements of income (loss).
In connection with the DuPont Crop Protection Business Acquisition, we entered into a customary transitional services agreement with DuPont to provide for the orderly separation and transition of various functions and processes. These services will be provided by DuPont to us for up to
24
months after closing, with an optional
six
months extension. These services include information technology services, accounting, human resource and facility services among other services, while we assume the operations of the DuPont Crop Protection Business.
As part of the DuPont Crop Protection Business Acquisition, we acquired various manufacturing contracts. The manufacturing contracts have been recognized as an asset or liability to the extent the terms of the contract are favorable or unfavorable compared with market terms of the same or similar items at the date of the acquisition.
We also entered into supply agreements with DuPont, with terms of up to
five
years, to supply technical insecticide products required for their retained seed treatment business at cost. The unfavorable liability is recorded within both "Accrued and other liabilities" and "Other long-term liabilities" on the consolidated balance sheets and is reduced and recognized to revenues within earnings as sales are made. The amount recognized in revenue for the years ended
December 31, 2018
and
2017
was approximately
$92 million
and
$2 million
, respectively.
Certain manufacturing sites and R&D sites will be transferred to us at a later date due to various local timing constraints; however, we will still obtain the economic benefit from these sites during the period from November 1, 2017 to when the sites legally transfer. No additional consideration will be paid at the date of transfer. All sites except for portions of one that did not transfer on November 1, 2017 legally transferred to us on July 1, 2018 and October 1, 2018. The remaining portions of this one site are expected to transfer in the third quarter of 2019.
In the third quarter of 2017, both the European Commission and Competition Commission of India had conditionally approved our acquisition of certain assets of DuPont’s Crop Protection business. The DuPont Crop Protection Business Acquisition was conditioned upon us divesting the portfolio of products required by the respective regulatory bodies. These divestitures impacted FMC Agricultural Solutions’ annual 2018 operating profit by approximately
$20 million
. On February 1, 2018, we sold a portion of FMC's European herbicide Portfolio to Nufarm Limited and received proceeds of approximately
$85 million
plus
$2 million
of working capital. We recorded a gain on sale of approximately
$85 million
. This divestiture satisfied FMC's commitments to the European Commission related to the DuPont Crop Protection Business Acquisition. In December 2017, the Competition Commission of India issued its final order describing the required Indian remedy. We received anti-trust approval from the Competition Commission of India on August 1, 2018 to complete the sale of the products to Crystal Crop Protection Limited in
63
compliance with that final order. The sale closed on August 16, 2018 and satisfied our commitments to the Competition Commission of India related to the DuPont Crop Protection Business Acquisition. We recorded a gain of approximately
$3 million
.
Purchase Price Allocation
We applied acquisition accounting under the U.S. GAAP business combinations guidance. Acquisition accounting requires, among other things, that assets acquired and liabilities assumed be recognized at their fair values as of the acquisition date. The net assets of the DuPont Crop Protection Business Acquisition will be recorded at the estimated fair values using primarily Level 2 and Level 3 inputs (see Note 18 for an explanation of Level 2 and Level 3 inputs). In valuing acquired assets and assumed liabilities, valuation inputs include an estimate of future cash flows and discount rates based on the internal rate of return and the weighted average rate of return.
The purchase price allocation is considered complete. The allocation was subject to change within the measurement period (up to one year from the acquisition date) as additional information concerning final asset and liability valuations was obtained. Any changes to the initial allocation are referred to as measurement-period adjustments. Measurement-period adjustments since our initial preliminary estimates reported in our 2017 10-K were primarily related to increases in the estimated fair values of intangible assets, deferred tax liabilities, and the unfavorable supply contract. The cumulative effect of all measurement-period adjustments resulted in an increase to recognized goodwill of approximately
$283 million
.
The following table summarizes the consideration paid for the DuPont Crop Protection Business and the amounts of the assets acquired and liabilities assumed as of the acquisition date.
|
Purchase Price Allocation
|
|||
|
(in Millions)
|
|||
|
Trade receivables
(1)
|
$
|
45.8
|
|
|
Inventories
(2)
|
379.7
|
|
|
|
Other current assets
|
51.3
|
|
|
|
Property, plant & equipment
|
424.7
|
|
|
|
Intangible assets:
|
|||
|
Indefinite-lived brands
|
1,301.2
|
|
|
|
Customer relationships
(3)
|
763.7
|
|
|
|
Goodwill
(4)
|
974.7
|
|
|
|
Deferred tax assets
|
79.7
|
|
|
|
Other noncurrent assets
|
14.2
|
|
|
|
Total fair value of assets acquired
|
$
|
4,035.0
|
|
|
Accounts payable, trade and other
(1)
|
$
|
32.9
|
|
|
Accrued and other current liabilities
(5)
|
156.2
|
|
|
|
Accrued pension and other postretirement benefits, long-term
|
9.1
|
|
|
|
Environmental liabilities
(6)
|
2.6
|
|
|
|
Deferred tax liabilities
|
196.0
|
|
|
|
Other long-term liabilities
(5)
|
452.3
|
|
|
|
Total fair value of liabilities assumed
|
$
|
849.1
|
|
|
Total consideration paid
|
$
|
3,185.9
|
|
|
Less: Noncontrolling interest
|
(13.2
|
)
|
|
|
Total consideration paid less noncontrolling interest
|
$
|
3,172.7
|
|
____________________
|
(1)
|
Represents the accounts receivable and accounts payable of the legal entity stock sales as part of the DuPont Crop Protection Acquisition. As part of the Transaction Agreement, these balances will be settled subsequent to the closing date through reimbursement between FMC and DuPont. The offsetting amounts due from and due to DuPont were recorded within Other current assets and Accrued and other current liabilities, respectively, as of December 31, 2017.
|
|
(2)
|
Fair value of finished goods inventory acquired included a step-up in the value of approximately
$89.8 million
, of which
$69.6 million
and
$20.2 million
was amortized during 2018 and 2017, respectively, and included in "Cost of sales and services" on the consolidated
|
64
statements of income (loss).
|
(3)
|
The weighted average useful life of the acquired customer relationships is approximately
20 years
.
|
|
(4)
|
Goodwill largely consists of expected cost synergies and economies of scale resulting from the business combination.
|
|
(5)
|
Includes the short-term and long-term portions of the unfavorable supply contract with Dupont recorded in Accrued and other current liabilities and Other long-term liabilities, respectively.
|
|
(6)
|
Represents both the short-term and long-term portion of the environmental obligations at certain sites of the acquired DuPont Crop Protection Business that is indemnified by DuPont as part of the Transaction Agreement. The indemnification asset was recorded within Other current assets and Other noncurrent assets.
|
2015 Acquisition
Cheminova A/S
On April 21, 2015, pursuant to the terms and conditions set forth in the Purchase Agreement, we completed the acquisition of
100
percent of the outstanding equity of Cheminova A/S, a Denmark
Aktieselskab
("Cheminova") from Auriga Industries A/S, a Denmark
Aktieselskab
for an aggregate purchase price of
$1.2 billion
, excluding assumed net debt and hedge-related costs totaling
$0.6 billion
(the “Cheminova Acquisition”). The Cheminova Acquisition was funded with the October 10, 2014 term loan which was secured for the purposes of the Cheminova Acquisition. See Note 13 for more information.
Cheminova has been integrated into our FMC Agricultural Solutions segment and has been included within our results of operations since the date of acquisition. The acquisition of Cheminova broadened our supply capabilities and strengthened our geographic footprint, particularly in Europe.
Unaudited Pro Forma Financial Information
The following unaudited pro forma results of operations assume that the DuPont Crop Protection Business Acquisition occurred at the beginning of the periods presented. The pro forma amounts include certain adjustments, including interest expense on the borrowings used to complete the acquisition, depreciation and amortization expense and income taxes. The pro forma amounts below for the years ended December 31, 2017 and 2016 exclude acquisition-related charges. The pro forma results do not include adjustments related to cost savings or other synergies that are anticipated as a result of the acquisition. Accordingly, these unaudited pro forma results are presented for informational purposes only and are not necessarily indicative of what the actual results of operations would have been if the acquisitions had occurred as of January 1, 2016, nor are they indicative of future results of operations.
|
|
Year Ended December 31,
|
||||||||||
|
(in Millions)
|
2018
|
2017
|
2016
|
||||||||
|
Pro forma Revenue
(1)
|
$
|
4,727.8
|
|
$
|
4,204.0
|
|
$
|
3,978.2
|
|
||
|
Pro forma Diluted earnings per share from continuing operations
|
4.75
|
|
2.62
|
|
4.00
|
|
|||||
____________________
|
(1)
|
For the year ended December 31, 2018, pro forma results and actual results are the same.
|
Transaction-related charges
Pursuant to U.S. GAAP, costs incurred associated with acquisition and separation activities are expensed as incurred. Historically, these costs have primarily consisted of legal, accounting, consulting, and other professional advisory fees associated with the preparation and execution of these activities. Given the significance and complexity around the integration of the DuPont Crop Protection Business, we have incurred to date, and expect to incur, costs associated with integrating the DuPont Crop Protection Business, planning for the exit of the transitional service agreement as well as implementation of a new worldwide Enterprise Resource Planning system as a result of the transitional service agreement exit, the majority of which will be capitalized in accordance with the relevant accounting literature. These costs have been, and are expected to be, significant and we anticipate the majority of these charges will be completed by the first quarter of 2020. Additionally, we expect to continue to incur costs associated with the previously announced separation of FMC Lithium up through the date of separation. Costs incurred to date are primarily comprised of advisory and other professional fees. The following table summarizes the costs incurred associated with these activities.
65
|
|
Year Ended December 31,
|
||||||||||
|
(in Millions)
|
2018
|
|
2017
|
|
2016
|
||||||
|
Transaction-related charges
|
|||||||||||
|
Acquisition-related charges -
DuPont Crop
|
|
|
|
|
|
|
|
|
|||
|
Legal and professional fees
(1)
|
$
|
86.9
|
|
|
$
|
130.2
|
|
|
$
|
—
|
|
|
Inventory fair value amortization
(2)
|
69.6
|
|
|
20.2
|
|
|
—
|
|
|||
|
Acquisition-related charges -
Cheminova
(3)
|
|
|
|
|
|
|
|
|
|||
|
Legal and professional fees
(1)
|
—
|
|
|
—
|
|
|
23.4
|
|
|||
|
Separation-related charges -
FMC Lithium
|
|||||||||||
|
Legal and professional fees
(1)
|
35.6
|
|
|
—
|
|
—
|
|
||||
|
Total transaction-related charges
|
$
|
192.1
|
|
|
$
|
150.4
|
|
|
$
|
23.4
|
|
|
Restructuring charges
|
|
|
|
|
|
||||||
|
DuPont Crop restructuring
|
$
|
108.3
|
|
|
$
|
—
|
|
$
|
—
|
|
|
|
Cheminova restructuring
(3)
|
—
|
|
|
—
|
|
|
42.3
|
|
|||
|
Total restructuring charges
(4)
|
$
|
108.3
|
|
|
$
|
—
|
|
|
$
|
42.3
|
|
____________________
|
(1)
|
Represents transaction costs, costs for transitional employees, other acquired employees related costs, and transactional-related costs such as legal and professional third-party fees. These charges are recorded as a component of “Selling, general and administrative expense" on the consolidated statements of income (loss).
|
|
(2)
|
These charges are included in “Costs of sales and services” on the consolidated statements of income (loss).
|
|
(3)
|
Acquisition-related charges and restructuring charges to integrate Cheminova with FMC Agricultural Solutions were completed at the end of 2016.
|
|
(4)
|
See Note 8 for more information. These charges are recorded as a component of “Restructuring and other charges (income)” on the consolidated statements of income (loss).
|
Note 5: Goodwill and Intangible Assets
The changes in the carrying amount of goodwill by business segment for the years ended
December 31, 2018
and
2017
are presented in the table below:
|
(in Millions)
|
FMC Agricultural
Solutions
|
FMC Lithium
|
Total
|
||||||||
|
Balance, December 31, 2016
|
$
|
498.7
|
|
$
|
—
|
|
$
|
498.7
|
|
||
|
Acquisitions
(1)
|
691.8
|
|
—
|
|
691.8
|
|
|||||
|
Foreign currency adjustments
|
8.4
|
|
—
|
|
8.4
|
|
|||||
|
Balance, December 31, 2017
|
$
|
1,198.9
|
|
$
|
—
|
|
$
|
1,198.9
|
|
||
|
Purchase price allocation adjustments (See Note 4)
|
282.9
|
|
—
|
|
282.9
|
|
|||||
|
Foreign currency and other adjustments
|
(13.7
|
)
|
—
|
|
(13.7
|
)
|
|||||
|
Balance, December 31, 2018
|
$
|
1,468.1
|
|
$
|
—
|
|
$
|
1,468.1
|
|
||
____________________
|
(1)
|
Represents goodwill recorded as a result of the DuPont Crop Protection Business Acquisition. See Note 4 for more details.
|
Our fiscal year
2018
annual goodwill and indefinite life impairment test was performed during the third quarter ended September 30,
2018
. We determined no goodwill impairment existed and that the fair value was substantially in excess of the carrying value for each of our goodwill reporting units. There were no events or circumstances indicating that goodwill might be impaired as of
December 31, 2018
. However, we recorded an immaterial impairment charge in our generic brand portfolio which is part of our FMC Agricultural Solutions segment. Refer to Note 18 for further details.
Our intangible assets, other than goodwill, consist of the following:
66
|
December 31, 2018
|
December 31, 2017
|
|||||||||||||||||||||||
|
(in Millions)
|
Weighted avg. useful life at December 31, 2018
|
Gross
|
Accumulated Amortization
|
Net
|
Gross
|
Accumulated Amortization
|
Net
|
|||||||||||||||||
|
Intangible assets subject to amortization (finite life)
|
||||||||||||||||||||||||
|
Customer relationships
|
18 years
|
$
|
1,146.2
|
|
$
|
(128.7
|
)
|
$
|
1,017.5
|
|
$
|
1,122.5
|
|
$
|
(73.3
|
)
|
$
|
1,049.2
|
|
|||||
|
Patents
|
7 years
|
2.0
|
|
(0.9
|
)
|
1.1
|
|
2.0
|
|
(0.6
|
)
|
1.4
|
|
|||||||||||
|
Brands
(1)
|
10 years
|
17.0
|
|
(5.9
|
)
|
11.1
|
|
15.7
|
|
(6.2
|
)
|
9.5
|
|
|||||||||||
|
Purchased and licensed technologies
|
10 years
|
61.3
|
|
(32.1
|
)
|
29.2
|
|
57.3
|
|
(28.9
|
)
|
28.4
|
|
|||||||||||
|
Other intangibles
|
45 years
|
2.9
|
|
(2.1
|
)
|
0.8
|
|
2.9
|
|
(2.0
|
)
|
0.9
|
|
|||||||||||
|
$
|
1,229.4
|
|
$
|
(169.7
|
)
|
$
|
1,059.7
|
|
$
|
1,200.4
|
|
$
|
(111.0
|
)
|
$
|
1,089.4
|
|
|||||||
|
Intangible assets not subject to amortization (indefinite life)
|
||||||||||||||||||||||||
|
Crop Protection Brands
(2)
|
$
|
1,259.1
|
|
$
|
1,259.1
|
|
$
|
1,136.1
|
|
$
|
1,136.1
|
|
||||||||||||
|
Brands
(1) (3)
|
384.8
|
|
384.8
|
|
405.6
|
|
405.6
|
|
||||||||||||||||
|
In-process research and development
|
0.7
|
|
0.7
|
|
0.7
|
|
0.7
|
|
||||||||||||||||
|
$
|
1,644.6
|
|
$
|
1,644.6
|
|
$
|
1,542.4
|
|
$
|
1,542.4
|
|
|||||||||||||
|
Total intangible assets
|
$
|
2,874.0
|
|
$
|
(169.7
|
)
|
$
|
2,704.3
|
|
$
|
2,742.8
|
|
$
|
(111.0
|
)
|
$
|
2,631.8
|
|
||||||
|
(1)
|
Represents trademarks, trade names and know-how.
|
|
(2)
|
Represents the proprietary brand portfolios, consisting of trademarks, trade names and know-how, acquired from the DuPont Crop Protection Business Acquisition. In the fourth quarter of 2017, the Act was enacted and was identified to be a triggering event. As a result we performed an impairment assessment on the recently acquired brand portfolio and we recorded an impairment charge of approximately
$42 million
solely due to the new tax legislation. See Note 12 for more details.
|
|
(3)
|
The majority of the Brands relate to our proprietary brand portfolios acquired from the Cheminova acquisition.
|
At
December 31, 2018
, the finite life and indefinite life intangibles were allocated among our business segments as follows:
|
(in Millions)
|
Finite life
|
Indefinite life
|
|||||
|
FMC Agricultural Solutions
|
$
|
1,058.8
|
|
$
|
1,644.6
|
|
|
|
FMC Lithium
|
0.9
|
|
—
|
|
|||
|
Total
|
$
|
1,059.7
|
|
$
|
1,644.6
|
|
|
|
Year Ended December 31,
|
|||||||||||
|
(in Millions)
|
2018
|
2017
|
2016
|
||||||||
|
Amortization Expense
|
$
|
62.9
|
|
$
|
27.4
|
|
$
|
23.6
|
|
||
The estimated pre-tax amortization expense for each of the five years ending December 31,
2019
to
2023
is
$62.4 million
,
$62.2 million
,
$62.0 million
,
$61.9 million
, and
$61.8 million
, respectively.
67
Note 6: Inventories
Inventories consisted of the following:
|
December 31,
|
|||||||
|
(in Millions)
|
2018
|
2017
|
|||||
|
Finished goods
|
$
|
452.6
|
|
$
|
353.7
|
|
|
|
Work in process
|
555.4
|
|
542.4
|
|
|||
|
Raw materials, supplies and other
|
221.4
|
|
224.1
|
|
|||
|
FIFO inventory
|
$
|
1,229.4
|
|
$
|
1,120.2
|
|
|
|
Less: Excess of FIFO cost over LIFO cost
|
(132.1
|
)
|
(127.7
|
)
|
|||
|
Net inventories
|
$
|
1,097.3
|
|
$
|
992.5
|
|
|
Approximately
23%
and
22%
of our inventories in
2018
and
2017
, respectively were recorded on the LIFO basis.
Note 7: Property, Plant and Equipment
Property, plant and equipment consisted of the following:
|
December 31,
|
|||||||
|
(in Millions)
|
2018
|
2017
|
|||||
|
Land and land improvements
|
$
|
178.1
|
|
$
|
166.9
|
|
|
|
Buildings
|
451.8
|
|
462.6
|
|
|||
|
Machinery and equipment
|
747.9
|
|
753.1
|
|
|||
|
Construction in progress
|
136.0
|
|
78.5
|
|
|||
|
Total cost
|
$
|
1,513.8
|
|
$
|
1,461.1
|
|
|
|
Accumulated depreciation
|
(481.2
|
)
|
(435.9
|
)
|
|||
|
Property, plant and equipment, net
|
$
|
1,032.6
|
|
$
|
1,025.2
|
|
|
Depreciation expense was
$88.9 million
,
$65.7 million
, and
$55.5 million
in
2018
,
2017
and
2016
, respectively.
Note 8: Restructuring and Other Charges (Income)
The following table shows total restructuring and other charges included in the respective line items of the consolidated statements of income (loss):
|
|
Year Ended December 31,
|
||||||||||
|
(in Millions)
|
2018
|
2017
|
2016
|
||||||||
|
Restructuring charges
|
$
|
126.4
|
|
$
|
16.3
|
|
$
|
43.4
|
|
||
|
Other charges (income), net
|
(62.7
|
)
|
65.1
|
|
51.6
|
|
|||||
|
Total restructuring and other charges (income)
|
$
|
63.7
|
|
$
|
81.4
|
|
$
|
95.0
|
|
||
68
Restructuring Charges
|
Restructuring Charges
|
|||||||||||||||
|
(in Millions)
|
Severance and Employee Benefits
(1)
|
Other Charges (Income)
(2)
|
Asset Disposal Charges
(3)
|
Total
|
|||||||||||
|
DuPont Crop restructuring
|
$
|
16.3
|
|
$
|
16.9
|
|
$
|
75.1
|
|
$
|
108.3
|
|
|||
|
FMC Lithium restructuring
|
—
|
|
1.9
|
|
0.5
|
|
2.4
|
|
|||||||
|
Other items
|
5.7
|
|
3.1
|
|
6.9
|
|
15.7
|
|
|||||||
|
Year ended December 31, 2018
|
$
|
22.0
|
|
$
|
21.9
|
|
$
|
82.5
|
|
$
|
126.4
|
|
|||
|
Other items
|
0.1
|
|
4.6
|
|
11.6
|
|
16.3
|
|
|||||||
|
Year ended December 31, 2017
|
$
|
0.1
|
|
$
|
4.6
|
|
$
|
11.6
|
|
$
|
16.3
|
|
|||
|
Cheminova restructuring
|
$
|
18.6
|
|
$
|
6.0
|
|
$
|
17.7
|
|
$
|
42.3
|
|
|||
|
Other items
|
—
|
|
1.1
|
|
—
|
|
1.1
|
|
|||||||
|
Year ended December 31, 2016
|
$
|
18.6
|
|
$
|
7.1
|
|
$
|
17.7
|
|
$
|
43.4
|
|
|||
____________________
|
(1)
|
Represents severance and employee benefit charges.
|
|
(2)
|
Primarily represents costs associated with lease payments, contract terminations, and other miscellaneous exit costs. Other income primarily represents favorable developments on previously recorded exit costs and recoveries associated with restructuring.
|
|
(3)
|
Primarily represents asset write-offs, accelerated depreciation and impairment charges on long-lived assets, which were or are to be abandoned. To the extent incurred, the acceleration effect of re-estimating settlement dates and revised cost estimates associated with asset retirement obligations due to facility shutdowns, are also included within the asset disposal charges.
|
DuPont Crop Restructuring
On November 1, 2017, we completed the acquisition of the DuPont Crop Protection Business. See Note 4 for more details. As we continue to integrate the DuPont Crop Protection Business into our existing FMC Agricultural Solutions segment, we have started to, and continue to expect to, engage in various restructuring activities. These restructuring activities may include workforce reductions, relocation of current operating locations, lease and other contract termination costs and fixed asset accelerated depreciation as well as other asset disposal charges at several of our FMC Agricultural Solutions' operations. We anticipate these restructuring activities will be substantially complete by the first quarter of 2020 as the majority of the integration will be completed. Details of key activities to date are as follows.
Subsequent to the acquisition, we conducted an in-depth analysis of key competitive capabilities of the combined business in India which resulted in a significant change to how we operate in the market and therefore a restructuring of our business in India. On July 3, 2018, we announced the adoption of an innovation-focused product strategy that uses a unique market access model anchored by our key, large scale distributors rather than the vast customer base we served prior to the DuPont Crop Protection Acquisition. Additionally, we rationalized our product portfolio and decisively exited a vast majority of the low margin product range. As a result of the change to our market access, we incurred charges of approximately
$59 million
for the year ended
December 31, 2018
, which primarily included the write-off of stranded accounts receivables and inventory. We also had workforce reductions which resulted in severance and other employee benefit charges of approximately
$4 million
for the year ended
December 31, 2018
.
As part of the acquisition, we acquired the Stine R&D facilities ("Stine") from DuPont. Due to its proximity to our previously existing Ewing R&D center ("Ewing"), in March 2018, we decided to migrate our Ewing R&D activities and employees into the newly acquired Stine facilities. As a result of this decision we incurred charges of approximately
$28 million
. We accelerated the depreciation of certain fixed assets that will no longer be used when we exit the facility and incurred charges of
$17.4 million
of accelerated depreciation charges for the year ended
December 31, 2018
. The cease use criteria was met as of September 30, 2018 as all employees had exited the Ewing facility and the facility became available for use. We recorded the estimated future liability associated with the rental obligation on the cease use date which resulted in a charge of
$11.2 million
for the year ended
December 31, 2018
. This charge was offset by the reduction of the capital lease liability previously recorded in "Other long-term liabilities" of
$6.0 million
. In addition to lease termination costs, we incurred severance, relocation and other employee related charges of
$5.2 million
for the year ended
December 31, 2018
.
FMC Lithium Restructuring
69
In 2018, we implemented a formal plan to restructure our operations at the FMC Lithium manufacturing site located in Bessemer City, North Carolina. The objective of this restructuring plan was to optimize both the assets and cost structure by reducing certain production lines at the plant. The restructuring decision resulted primarily in shutdown costs which are reflected in the table above.
Cheminova Restructuring
In 2015, we completed the acquisition of Cheminova; see Note 4 for more details. As part of the integration of Cheminova into our existing FMC Agricultural Solutions segment we engaged in various restructuring activities. These restructuring activities included workforce reductions, relocation of current operating locations, lease and other contract termination costs and fixed asset accelerated depreciation as well as other long-term asset disposal charges at several of our FMC Agricultural Solutions' facilities. In 2016, these restructuring activities continued; however, the restructuring charges were completed at the end of 2016.
Roll forward of restructuring reserves
The following table shows a roll forward of restructuring reserves that will result in cash spending. These amounts exclude asset retirement obligations.
|
(in Millions)
|
Balance at 12/31/16
|
Change in
reserves
(4)
|
Cash
payments
|
Other
(5)
|
Balance at 12/31/17
(6)
|
Change in
reserves
(4)
|
Cash
payments
|
Other
(5)
|
Balance at 12/31/18
(6)
|
||||||||||||||||||||||||||
|
DuPont Crop restructuring
(1)
|
$
|
—
|
|
$
|
—
|
|
$
|
—
|
|
$
|
—
|
|
$
|
—
|
|
$
|
33.2
|
|
$
|
(15.8
|
)
|
$
|
(1.2
|
)
|
$
|
16.2
|
|
||||||||
|
FMC Lithium restructuring
|
0.3
|
|
3.8
|
|
(0.9
|
)
|
(0.2
|
)
|
3.0
|
|
1.9
|
|
(1.3
|
)
|
—
|
|
3.6
|
|
|||||||||||||||||
|
Cheminova restructuring
|
11.1
|
|
—
|
|
(6.5
|
)
|
(3.4
|
)
|
1.2
|
|
—
|
|
(1.2
|
)
|
—
|
|
—
|
|
|||||||||||||||||
|
Other workforce related and facility shutdowns
(2)
|
1.1
|
|
0.9
|
|
(0.8
|
)
|
1.1
|
|
2.3
|
|
8.8
|
|
(8.2
|
)
|
(1.9
|
)
|
1.0
|
|
|||||||||||||||||
|
Restructuring activities related to discontinued operations
(3)
|
3.4
|
|
8.1
|
|
(10.5
|
)
|
(1.0
|
)
|
—
|
|
—
|
|
—
|
|
—
|
|
—
|
|
|||||||||||||||||
|
Total
|
$
|
15.9
|
|
$
|
12.8
|
|
$
|
(18.7
|
)
|
$
|
(3.5
|
)
|
$
|
6.5
|
|
$
|
43.9
|
|
$
|
(26.5
|
)
|
$
|
(3.1
|
)
|
$
|
20.8
|
|
||||||||
____________________
|
(1)
|
Primarily consists of real estate exit costs associated with DuPont Crop restructuring activities.
|
|
(2)
|
Primarily severance costs related to workforce reductions and facility shutdowns described in the Other Items sections above.
|
|
(3)
|
Cash spending associated with restructuring activities of discontinued operations is reported within "Other discontinued spending" on the consolidated statements of cash flows.
|
|
(4)
|
Primarily severance, exited lease, contract termination and other miscellaneous exit costs. The accelerated depreciation and impairment charges noted above impacted our property, plant and equipment or intangible balances and are not included in the above tables.
|
|
(5)
|
Primarily foreign currency translation adjustments.
|
|
(6)
|
Included in “Accrued and other liabilities” on the consolidated balance sheets.
|
Other charges (income), net
|
|
Year Ended December 31,
|
||||||||||
|
(in Millions)
|
2018
|
2017
|
2016
|
||||||||
|
Environmental charges, net
|
$
|
21.9
|
|
$
|
16.6
|
|
$
|
36.8
|
|
||
|
Product portfolio sales
|
(87.2
|
)
|
—
|
|
—
|
|
|||||
|
Impairment of intangibles
|
—
|
|
42.1
|
|
—
|
|
|||||
|
Argentina devaluation
|
—
|
|
—
|
|
4.2
|
|
|||||
|
Other items, net
|
2.6
|
|
6.4
|
|
10.6
|
|
|||||
|
Other charges (income), net
|
$
|
(62.7
|
)
|
$
|
65.1
|
|
$
|
51.6
|
|
||
Environmental charges, net
Environmental charges represent the net charges associated with environmental remediation at continuing operating sites. Environmental obligations for continuing operations primarily represent obligations at shut down or abandoned facilities within businesses that do not meet the criteria for presentation as discontinued operations.
Product Portfolio Sales
On February 1, 2018, we sold a portion of our European herbicide portfolio to Nufarm Limited. Additionally, on August 16, 2018, we completed the sale of certain products of our India portfolio to Crystal Crop Protection Limited. Both sales were required by
70
regulatory authorities as part of closing conditions for the DuPont Crop Protection Business Acquisition. Refer to Note 4 for more information. The gain on these sales are recorded within "Restructuring and other charges (income)" on the consolidated statements of income (loss). Proceeds from these sales are included in investing activities on the consolidated statements of cash flows.
Impairment of intangibles
In 2017, we recorded an impairment charge on certain acquired indefinite-lived intangible assets from the DuPont Crop Protection Business Acquisition solely as a result of the United States' enactment of the Act. See Note 12 for more details.
Argentina Devaluation
On December 17, 2015, the Argentina government initiated actions to significantly devalue its currency. These actions continued into a portion of first quarter of 2016. These actions created an immediate loss associated with the impacts of the remeasurement of our local balance sheet. The loss was attributable to our Lithium and Agricultural Solutions operations. Because of the severity of the event and its immediate impact to our operations in the country, the charge associated with the remeasurement was included within restructuring and other charges in our condensed consolidated income statement during the period. We believe these actions have ended and do not expect further charges for remeasurement to be included within restructuring and other charges.
Other items, net
In 2018, other items, net primarily represents a milestone payment on an agreement related to our in-process research and development. Other items, net also includes the loss associated with the divestment of a joint venture within FMC Agricultural Solutions.
In 2017, other items, net primarily relates to exit costs resulting from the termination and de-consolidation of our interest in a variable interest entity that was previously consolidated and was part of our FMC Agricultural Solutions segment.
In 2016, we sold our remaining ownership interest in several joint ventures. The aggregate loss on the sale of the various interests of
$2.9 million
was recorded as "Restructuring and other charges (income)" on the consolidated statements of income (loss). Additionally, we had a gain of
$2.1 million
from the sale of certain Corporate fixed assets. The cash proceeds from this sale of
$6.8 million
is included within "Other investing activities" on the consolidated statements of cash flows.
During 2016, our FMC Agricultural Solutions segment entered into collaboration and license agreements with various third parties for the purposes of obtaining certain technology and intellectual property rights relating to compounds still under development. The rights and technology obtained is referred to as in-process research and development and in accordance with U.S. GAAP, the amounts paid were expensed as incurred since they were acquired outside of a business combination. The charges related to these arrangements were
$13.2 million
.
Note 9: Receivables
The following table displays a roll forward of the allowance for doubtful trade receivables for fiscal years
2017
and
2018
.
|
(in Millions)
|
|||
|
Balance, December 31, 2016
|
$
|
17.6
|
|
|
Additions — charged to expense
|
8.4
|
|
|
|
Transfer from (to) allowance for credit losses (see below)
|
9.5
|
|
|
|
Net recoveries, write-offs and other
|
3.2
|
|
|
|
Balance, December 31, 2017
|
$
|
38.7
|
|
|
Additions — charged to expense
(1)
|
57.9
|
|
|
|
Transfer from (to) allowance for credit losses (see below)
|
(17.3
|
)
|
|
|
Net recoveries, write-offs and other
(1)
|
(56.9
|
)
|
|
|
Balance, December 31, 2018
|
$
|
22.4
|
|
____________________
|
(1)
|
Includes the charge and write-off of approximately
$42 million
associated with the stranded accounts receivables written off as part of the restructuring in India. The charge was recorded as a component of "Restructuring and other charges (income)" on the consolidated statements of income (loss). Refer to Note 8 for further information.
|
71
We have non-current receivables that represent long-term customer receivable balances related to past due accounts which are not expected to be collected within the current year. The net long-term customer receivables were
$84.5 million
as of
December 31, 2018
. These long-term customer receivable balances and the corresponding allowance are included in "Other assets including long-term receivables, net" on the consolidated balance sheets.
A portion of these long-term receivables have payment contracts. We have no reason to believe payments will not be made based upon the credit quality of these customers. Additionally, we also hold significant collateral against these customers including rights to property or other assets as a form of credit guarantee. If the customer does not pay or gives indication that they will not pay, these guarantees allow us to start legal action to block the sale of the customer’s harvest. On an ongoing basis, we continue to evaluate the credit quality of our non-current receivables using aging of receivables, collection experience and write-offs, as well as evaluating existing economic conditions, to determine if an additional allowance is necessary.
The following table displays a roll forward of the allowance for credit losses related to long-term customer receivables for fiscal years
2017
and
2018
.
|
(
in Millions
)
|
|||
|
Balance, December 31, 2016
|
$
|
49.1
|
|
|
Additions — charged to expense
|
13.7
|
|
|
|
Transfer from (to) allowance for doubtful accounts (see above)
|
(9.5
|
)
|
|
|
Net recoveries, write-offs and other
|
(6.2
|
)
|
|
|
Balance, December 31, 2017
|
$
|
47.1
|
|
|
Additions — charged to expense
|
13.4
|
|
|
|
Transfer from (to) allowance for doubtful accounts (see above)
|
17.3
|
|
|
|
Foreign currency adjustments
|
(4.1
|
)
|
|
|
Net recoveries, write-offs and other
|
(13.2
|
)
|
|
|
Balance, December 31, 2018
|
$
|
60.5
|
|
Note 10: Discontinued Operations
FMC Health and Nutrition:
On August 1, 2017, we completed the sale of the Omega-3 business to Pelagia AS for
$38 million
.
On November 1, 2017, we completed the previously disclosed sale of our FMC Health and Nutrition business to DuPont. The sale resulted in a gain of approximately
$918 million
(
$727 million
, net of tax). In connection with the sale, we entered into a customary transitional services agreement with DuPont to provide for the orderly separation and transition of various functions and processes. These services will be provided by us to DuPont for up to
24 months
after closing, with an additional
six months
extension. These services include information technology services, accounting, human resource and facility services among other services, while DuPont assumes the operations of FMC Health and Nutrition.
Certain sites were to transfer at a later date due to various local timing constraints. In May 2018, the last site transferred to DuPont. The results of our discontinued FMC Health and Nutrition operations are summarized below, including the results of these delayed sites included in the year ended
December 31, 2018
.
72
|
(in Millions)
|
Year Ended December 31,
|
||||||||||
|
2018
|
2017
|
2016
|
|||||||||
|
Revenue
|
$
|
3.8
|
|
$
|
562.9
|
|
$
|
743.5
|
|
||
|
Costs of sales and services
|
4.0
|
|
370.5
|
|
474.9
|
|
|||||
|
Income (loss) from discontinued operations before income taxes
(1)
|
$
|
2.0
|
|
$
|
113.7
|
|
$
|
158.5
|
|
||
|
Provision for income taxes
|
3.8
|
|
9.7
|
|
43.8
|
|
|||||
|
Total discontinued operations of FMC Health and Nutrition, net of income taxes, before divestiture related costs and adjustments
(2)
|
$
|
(1.8
|
)
|
$
|
104.0
|
|
$
|
114.7
|
|
||
|
Gain on sale of FMC Health and Nutrition, net of income taxes
(3)
|
—
|
|
727.1
|
|
—
|
|
|||||
|
Adjustment to gain on sale of FMC Health and Nutrition, net of income taxes
(4)
|
7.8
|
|
—
|
|
—
|
|
|||||
|
Adjustment to FMC Health and Nutrition Omega-3 net assets held for sale, net of income taxes
(5)
|
—
|
|
(147.8
|
)
|
—
|
|
|||||
|
Discontinued operations of FMC Health and Nutrition, net of income taxes, attributable to FMC Stockholders
|
$
|
6.0
|
|
$
|
683.3
|
|
$
|
114.7
|
|
||
____________________
|
(1)
|
Results for the year ended
December 31, 2018
include an adjustment to retained liabilities of the disposed FMC Health and Nutrition business. For the years ended December 31, 2017 and 2016, amounts include
$16.6 million
and
$19.8 million
of allocated interest expense and
$8.1 million
and
$12.3 million
of restructuring and other charges (income), respectively. For the year ended December 31, 2017 amount includes
$3.9 million
of a pension curtailment charge. See Note 14 for more information of the pension curtailment charge. Interest was allocated in accordance with relevant discontinued operations accounting guidance.
|
|
(2)
|
In accordance with U.S. GAAP, effective March 2017 we stopped amortizing and depreciating all assets classified as held for sale. Assets held for sale under U.S. GAAP are required to be reported at the lower of carrying value or fair value, less costs to sell. However, the fair value of the Omega-3 business, which was previously part of the broader FMC Health and Nutrition reporting unit, was significantly less than its carrying value, which included accumulated foreign currency translation adjustments that were subsequently reclassified to earnings after completion of the sale.
|
|
(3)
|
Includes
$27.9 million
of divestiture related costs, net of tax as well as incremental tax cost of
$14.7 million
related to certain legal entity restructuring executed during the third quarter of 2017 to facilitate the FMC Health and Nutrition divestiture.
|
|
(4)
|
Amount represents the settlement of working capital adjustments subsequent to the sale.
|
|
(5)
|
Represents the impairment charge for the year ended December 31, 2017 of approximately
$168 million
(
$148 million
, net of tax) associated with the disposal activities of the Omega-3 business to write down the carrying value to its fair value.
|
The following table presents the major classes of assets and liabilities of FMC Health and Nutrition:
____________________
|
December 31,
|
|||||||
|
(in Millions)
|
2018
|
2017
|
|||||
|
Assets
|
|||||||
|
Current assets of discontinued operations held for sale
(1)
|
$
|
—
|
|
$
|
7.2
|
|
|
|
Property, plant and equipment
|
—
|
|
0.1
|
|
|||
|
Total assets of discontinued operations held for sale
(2)
|
$
|
—
|
|
$
|
7.3
|
|
|
|
Liabilities
|
|||||||
|
Current liabilities of discontinued operations held for sale
|
—
|
|
(1.3
|
)
|
|||
|
Total liabilities of discontinued operations held for sale
(3)
|
$
|
—
|
|
$
|
(1.3
|
)
|
|
|
Total net assets
(4)
|
$
|
—
|
|
$
|
6.0
|
|
|
|
(1)
|
Primarily consists of trade receivables and inventories.
|
|
(2)
|
Presented as "Current assets of discontinued operations held for sale" on the consolidated balance sheet as of December 31, 2017.
|
|
(3)
|
Presented as "Current liabilities of discontinued operations held for sale" on the consolidated balance sheet as of December 31, 2017.
|
|
(4)
|
In connection with the divestiture of FMC Health and Nutrition, certain sites transferred to DuPont subsequent to November 1, 2017 due to various local timing constraints. Amounts at December 31, 2017 represent the net assets of FMC Health and Nutrition ultimately transferred to DuPont, subsequent to the closing date, in 2018.
|
In addition to our discontinued FMC Health and Nutrition, our discontinued operations in our financial statements includes adjustments to retained liabilities from previous discontinued operations. The primary liabilities retained include environmental
73
liabilities, other postretirement benefit liabilities, self-insurance, long-term obligations related to legal proceedings and historical restructuring activities.
Our discontinued operations comprised the following:
|
(in Millions)
|
Year Ended December 31,
|
||||||||||
|
2018
|
2017
|
2016
|
|||||||||
|
Adjustment for workers’ compensation, product liability, and other postretirement benefits and other, net of income tax benefit (expense) of ($5.2), ($0.1) and ($0.5), respectively
|
$
|
(1.7
|
)
|
$
|
3.0
|
|
$
|
2.5
|
|
||
|
Provision for environmental liabilities, net of recoveries, net of income tax benefit (expense) of $32.5, $24.9 and $12.9, respectively
(1)
|
(121.4
|
)
|
(51.2
|
)
|
(24.0
|
)
|
|||||
|
Provision for legal reserves and expenses, net of recoveries, net of income tax benefit (expense) of $6.9, $7.2 and $6.6, respectively
|
(26.3
|
)
|
(13.4
|
)
|
(12.2
|
)
|
|||||
|
Discontinued operations of FMC Health and Nutrition, net of income tax benefit (expense) of ($7.1), ($180.1) and ($43.8), respectively
|
6.0
|
|
683.3
|
|
114.7
|
|
|||||
|
Discontinued operations, net of income taxes
|
$
|
(143.4
|
)
|
$
|
621.7
|
|
$
|
81.0
|
|
||
____________________
|
(1)
|
See a roll forward of our environmental reserves as well as discussion on significant environmental issues that occurred during the year in Note 11.
|
Reserves for Discontinued Operations, other than Environmental at
December 31, 2018
and
2017
|
(in Millions)
|
December 31,
|
||||||
|
2018
|
|
2017
|
|||||
|
Workers’ compensation, product liability, and indemnification reserves
|
$
|
23.6
|
|
$
|
22.6
|
|
|
|
Postretirement medical and life insurance benefits reserve, net
|
7.0
|
|
7.6
|
|
|||
|
Reserves for legal proceedings
|
41.6
|
|
33.0
|
|
|||
|
Reserve for discontinued operations
(1)
|
$
|
72.2
|
|
$
|
63.2
|
|
|
____________________
|
(1)
|
Included in “Other long-term liabilities” on the consolidated balance sheets. Refer to Note 8 for discontinued restructuring reserves and Note 11 for discontinued environmental reserves.
|
The discontinued postretirement medical and life insurance benefits liability equals the accumulated postretirement benefit obligation. Associated with this liability is a net pre-tax actuarial gain and prior service credit of
$5.4 million
(
$4.9 million
after-tax) and
$8.4 million
(
$5.6 million
after-tax) at
December 31, 2018
and
2017
, respectively. The estimated net pre-tax actuarial gain and prior service credit that will be amortized from accumulated other comprehensive income into discontinued operations during
2019
are
$1.0 million
and
zero
, respectively.
Net spending in
2018
,
2017
and
2016
was
$5.4 million
,
$2.4 million
and
$1.3 million
, respectively, for workers’ compensation, product liability and other claims;
$1.1 million
,
$1.0 million
and
$1.1 million
, respectively, for other postretirement benefits; and
$21.3 million
,
$18.9 million
and
$15.3 million
, respectively, related to reserves for legal proceedings associated with discontinued operations.
Note 11: Environmental Obligations
We are subject to various federal, state, local and foreign environmental laws and regulations that govern emissions of air pollutants, discharges of water pollutants, and the manufacture, storage, handling and disposal of hazardous substances, hazardous wastes and other toxic materials and remediation of contaminated sites. We are also subject to liabilities arising under the Comprehensive Environmental Response, Compensation and Liability Act (“CERCLA”) and similar state laws that impose responsibility on persons who arranged for the disposal of hazardous substances, and on current and previous owners and operators of a facility for the clean-up of hazardous substances released from the facility into the environment. We are also subject to liabilities under the Resource Conservation and Recovery Act (“RCRA”) and analogous state laws that require owners and operators of facilities that have treated, stored or disposed of hazardous waste pursuant to a RCRA permit to follow certain waste management practices and to clean up releases of hazardous substances into the environment associated with past or present practices. In addition, when deemed appropriate, we enter certain sites with potential liability into voluntary remediation compliance programs, which are also
74
subject to guidelines that require owners and operators, current and previous, to clean up releases of hazardous substances into the environment associated with past or present practices.
Environmental liabilities consist of obligations relating to waste handling and the remediation and/or study of sites at which we are alleged to have released or disposed of hazardous substances. These sites include current operations, previously operated sites, and sites associated with discontinued operations. We have provided reserves for potential environmental obligations that we consider probable and for which a reasonable estimate of the obligation can be made. Accordingly, total reserves of
$535.8 million
and
$432.1 million
, respectively, before recoveries, existed at
December 31, 2018
and
2017
.
The estimated reasonably possible environmental loss contingencies, net of expected recoveries, exceed amounts accrued by approximately
$190 million
at
December 31, 2018
. This reasonably possible estimate is based upon information available as of the date of the filing and the actual future losses may be higher given the uncertainties regarding the status of laws, regulations, enforcement policies, the impact of potentially responsible parties, technology and information related to individual sites.
Additionally, although potential environmental remediation expenditures in excess of the reserves and estimated loss contingencies could be significant, the impact on our future consolidated financial results is not subject to reasonable estimation due to numerous uncertainties concerning the nature and scope of possible contamination at many sites, identification of remediation alternatives under constantly changing requirements, selection of new and diverse clean-up technologies to meet compliance standards, the timing of potential expenditures and the allocation of costs among Potentially Responsible Parties ("PRPs") as well as other third parties. The liabilities arising from potential environmental obligations that have not been reserved for at this time may be material to any one quarter's or year's results of operations in the future. However, we believe any liability arising from such potential environmental obligations is not likely to have a material adverse effect on our liquidity or financial condition as it may be satisfied over many years.
The table below is a roll forward of our total environmental reserves, continuing and discontinued, from
December 31, 2015
to
December 31, 2018
.
|
(in Millions)
|
Operating and Discontinued Sites Total
|
||
|
Total environmental reserves, net of recoveries at December 31, 2015
|
$
|
340.9
|
|
|
2016
|
|||
|
Provision
|
81.0
|
|
|
|
Spending, net of recoveries
|
(52.6
|
)
|
|
|
Foreign currency translation adjustments
|
(2.6
|
)
|
|
|
Net Change
|
$
|
25.8
|
|
|
Total environmental reserves, net of recoveries at December 31, 2016
|
$
|
366.7
|
|
|
|
|||
|
2017
|
|||
|
Provision
|
106.0
|
|
|
|
Spending, net of recoveries
|
(63.6
|
)
|
|
|
Acquisitions
(1)
|
2.6
|
|
|
|
Foreign currency translation adjustments
|
6.5
|
|
|
|
Net Change
|
$
|
51.5
|
|
|
Total environmental reserves, net of recoveries at December 31, 2017
|
$
|
418.2
|
|
|
|
|||
|
2018
|
|||
|
Provision
|
178.4
|
|
|
|
Spending, net of recoveries
|
(65.9
|
)
|
|
|
Foreign currency translation adjustments
|
(2.8
|
)
|
|
|
Net Change
|
$
|
109.7
|
|
|
Total environmental reserves, net of recoveries at December 31, 2018
|
$
|
527.9
|
|
|
(1)
|
See Note 4 for more details. Amount relates to environmental obligations at certain sites of the acquired DuPont Crop Protection Business.
|
75
To ensure we are held responsible only for our equitable share of site remediation costs, we have initiated, and will continue to initiate, legal proceedings for contributions from other PRPs. At
December 31, 2018
and
2017
, we have recorded recoveries representing probable realization of claims against U.S. government agencies, insurance carriers and other third parties. Recoveries are recorded as either an offset to the “Environmental liabilities, continuing and discontinued” or as “Other assets including long-term receivables, net” on the consolidated balance sheets.
The table below is a roll forward of our total recorded recoveries from
December 31, 2016
to
December 31, 2018
:
______________
|
(in Millions)
|
December 31, 2016
|
Increase (Decrease) in Recoveries
|
Cash Received
|
December 31, 2017
|
Increase (Decrease) in Recoveries
|
Cash Received
|
December 31, 2018
|
||||||||||||||||||||
|
Environmental liabilities, continuing and discontinued
|
$
|
11.4
|
|
$
|
2.5
|
|
$
|
—
|
|
$
|
13.9
|
|
$
|
(5.5
|
)
|
$
|
(0.5
|
)
|
$
|
7.9
|
|
||||||
|
Other assets
(1)
|
27.2
|
|
15.9
|
|
(10.8
|
)
|
32.3
|
|
2.6
|
|
(4.4
|
)
|
30.5
|
|
|||||||||||||
|
Total
|
$
|
38.6
|
|
$
|
18.4
|
|
$
|
(10.8
|
)
|
$
|
46.2
|
|
$
|
(2.9
|
)
|
$
|
(4.9
|
)
|
$
|
38.4
|
|
||||||
|
(1)
|
The amounts are included within “Prepaid and other current assets" and "Other assets including long-term receivables, net" on the consolidated balance sheets. See Note 21 for more details. Increase in recoveries in 2017 includes
$2.6 million
related to indemnification for the acquired environmental liability from the DuPont Crop Protection Business Acquisition that existed prior to the closing of the transaction.
|
The table below provides detail of current and long-term environmental reserves, continuing and discontinued.
|
December 31,
|
|||||||
|
(in Millions)
|
2018
|
2017
|
|||||
|
Environmental reserves, current, net of recoveries
(1)
|
$
|
63.5
|
|
$
|
72.0
|
|
|
|
Environmental reserves, long-term continuing and discontinued, net of recoveries
(2)
|
464.4
|
|
346.2
|
|
|||
|
Total environmental reserves, net of recoveries
|
$
|
527.9
|
|
$
|
418.2
|
|
|
______________
|
(1)
|
These amounts are included within “Accrued and other liabilities” on the consolidated balance sheets.
|
|
(2)
|
These amounts are included in "Environmental liabilities, continuing and discontinued" on the consolidated balance sheets.
|
Our net environmental provisions relate to costs for the continued remediation of both operating sites and for certain discontinued manufacturing operations from previous years. The net provisions are comprised as follows:
|
Year Ended December 31,
|
|||||||||||
|
(in Millions)
|
2018
|
2017
|
2016
|
||||||||
|
Continuing operations
(1)
|
$
|
21.9
|
|
$
|
16.6
|
|
$
|
36.8
|
|
||
|
Discontinued operations
(2)
|
153.9
|
|
76.1
|
|
36.9
|
|
|||||
|
Net environmental provision
|
$
|
175.8
|
|
$
|
92.7
|
|
$
|
73.7
|
|
||
______________
|
(1)
|
Recorded as a component of “Restructuring and other charges (income)” on our consolidated statements of income. See Note 8. Environmental obligations for continuing operations primarily represent obligations at shut down or abandoned facilities within businesses that do not meet the criteria for presentation as discontinued operations.
|
|
(2)
|
Recorded as a component of “Discontinued operations, net of income taxes" on our consolidated statements of income (loss). See Note 10.
|
On our consolidated balance sheets, the net environmental provisions affect assets and liabilities as follows:
|
Year Ended December 31,
|
|||||||||||
|
(in Millions)
|
2018
|
2017
|
2016
|
||||||||
|
Environmental reserves
(1)
|
$
|
178.4
|
|
$
|
106.0
|
|
$
|
81.0
|
|
||
|
Other assets
(2)
|
(2.6
|
)
|
(13.3
|
)
|
(7.3
|
)
|
|||||
|
Net environmental provision
|
$
|
175.8
|
|
$
|
92.7
|
|
$
|
73.7
|
|
||
______________
76
|
(1)
|
See above roll forward of our total environmental reserves as presented on our consolidated balance sheets.
|
|
(2)
|
Represents certain environmental recoveries. See Note 21 for details of "Other assets including long-term receivables, net" as presented on our consolidated balance sheets.
|
Significant Environmental Sites
Pocatello
From 1949 until 2001, we operated the world's largest elemental phosphorus plant in Power County, Idaho, just outside the city of Pocatello. Since the plant's closure, FMC has worked with the EPA, the State of Idaho, and the Shoshone-Bannock Tribes ("Tribes") to develop a proposed cleanup plan for the property. In September 2012, the EPA issued an Interim Record of Decision ("IROD") that is environmentally protective and that ensures the health and safety of both workers and the general public. Since the plant's closure,
we have successfully decommissioned our Pocatello plant, completed closure of the RCRA ponds and formally requested that the EPA acknowledge completion of work under a June 1999 RCRA Consent Decree. Future remediation costs include completion of the IROD that addresses groundwater contamination and existing waste disposal areas on the Pocatello plant portion of the Eastern Michaud Flats Superfund Site. In June 2013, the EPA issued a Unilateral Administrative Order to us under which we will implement the IROD remedy. Our current reserves factor in the estimated costs associated with implementing the IROD. In addition to implementing the IROD, we continue to conduct work pursuant to CERCLA unilateral administrative orders to address air emissions from beneath the cap of several of the closed RCRA ponds.
The amount of the reserve for this site was
$33.1 million
and
$35.2 million
at
December 31, 2018
and
2017
, respectively.
Pocatello Tribal Litigation
For a number of years, we engaged in disputes with the Tribes concerning their attempts to regulate our activities on the reservation. On March 6, 2006, a U.S. District Court Judge found that the Tribes were a third-party beneficiary of a 1998 RCRA Consent Decree and ordered us to apply for any applicable Tribal permits relating to the nearly-complete RCRA Consent Decree work. The third-party beneficiary ruling was later reversed by the Ninth Circuit Court of Appeals, but the permitting process continued in the tribal legal system. We applied for the tribal permits, but preserved objections to the Tribes' jurisdiction.
In addition, in 1998, we entered into an agreement (“1998 Agreement”) that required us to pay the Tribes
$1.5 million
per year for waste generated from operating our Pocatello plant and stored on site. We paid
$1.5 million
per year until December 2001 when the plant closed. In our view the agreement was terminated, as the plant was no longer generating waste. The Tribes claimed that the 1998 Agreement has no end date.
On April 25, 2006, the Tribes' Land Use Policy Commission issued us a Special Use Permit for the “disposal and storage of waste” at the Pocatello plant and imposed a
$1.5 million
per annum permit fee. The permit and fee were affirmed by the Tribal Business Council on July 21, 2006. We sought review of the permit and fee in Tribal Court, in which the Tribes also brought a claim for breach of the 1998 Agreement. On May 21, 2008, the Tribal Court reversed the permit and fee, finding that they were not authorized under tribal law, and dismissed the Tribes' breach of contract claim. The Tribes appealed to the Tribal Court of Appeals.
On May 8, 2012, the Tribal Court of Appeals reversed the May 21, 2008 Tribal Court decision and issued a decision finding the permit and fee validly authorized and ordering us to pay waste permit fees in the amount of
$1.5 million
per annum for the years 2002-2007 (
$9.0 million
in total), the Tribes' demand as set forth in the lawsuit. It also reinstated the breach of contract claim. The Tribes have filed additional litigation to recover the permit fees for the years since 2007, but that litigation has been stayed pending the outcome of the appeal in the Tribal Court of Appeals.
Following a trial on certain jurisdictional issues which occurred during April 2014, the Shoshone-Bannock Tribal Appellate Court issued a Statement of Decision finding in favor of the Tribes’ jurisdiction over FMC and awarding costs on appeal to the Tribes. The Tribal Appellate Court conducted further post-trial proceedings and on May 6, 2014 issued Finding and Conclusions and a Final Judgment consistent with its earlier Statement of Decision.
On September 28, 2017, the District Court issued a decision finding that the Tribal Court has jurisdiction over FMC to require FMC to pay a
$1.5 million
per year fee to the Tribes for hazardous wastes “stored” on the Reservation. We do not believe it is probable that we will incur a loss for this matter due to legal principles established by the United States Supreme Court and the United States Court of Appeals for the Ninth Circuit that we believe were not followed by the District Court. Our reasonably possible estimate continues to include the estimated costs of an adverse decision and does not need to be adjusted as a result of the District Court's decision. On October 12, 2017, we filed a notice of appeal to the Ninth Circuit. The District Court Judgment has been stayed pending the outcome of the appeal to the Ninth Circuit.
We have estimated a reasonably possible loss for this matter and it has been reflected in our total reasonably possible loss estimate previously discussed within this note.
77
Middleport
Our Middleport, NY facility is currently an Agricultural Solutions formulation and packaging plant that formerly manufactured arsenic-based and other products. As a result of past manufacturing operations and waste disposal practices at this facility, releases of hazardous substances have occurred at the site that have affected soil, sediment, surface water and groundwater at the facility's property and also in adjacent off-site areas. The impact of our discontinued operations was the subject of an Administrative Order on Consent (“1991 AOC”) entered into with the EPA and New York State Department of Environmental Conservation (“NYSDEC”, and collectively with EPA, the “Agencies”) in 1991. The AOC requires us to (1) define the nature and extent of contamination caused by our historical plant operations, (2) take interim corrective measures and (3) evaluate Corrective Action Management Alternatives (“CMA”) for discrete contaminated areas, known as “operable units” of which there are
eleven
.
We have defined the nature and extent of the contamination in certain areas, have constructed an engineered cover, taken certain closure actions regarding RCRA regulated surface water impoundments and are collecting and treating both surface water runoff and ground water, which has satisfied the first two requirements of the 1991 AOC. To date, we have evaluated and proposed CMAs for
five
of the
eleven
identified operable units.
Middleport Litigation
In the fourth quarter of 2018, FMC and NYSDEC began engaging in settlement discussions and have reached agreement in principle on the terms of a global resolution with the intent of agreeing to a document to replace the 1991 AOC (upon EPA concurrence), that would, among other things, settle past costs, govern onsite and off-site remediation of historic contamination attributed to FMC Middleport operations within a defined area, as well as resolve the necessity for a Hazardous Waste Management Permit (“Part 373 permit”). In the interim, the Part 373 Permit Administrative Proceeding and the federal appeal are being temporarily held in abeyance pending completion of the settlement. The paragraphs below provide the litigation history for Middleport, which began in 2013.
In 2013, we received from the NYSDEC, a Final Statement of Basis ("FSOB") with NYSDEC’s selected CMA for
three
of the operable units that had been combined for evaluative purposes (“OUs 2, 4 and 5”), which we continue to believe is overly conservative and is not consistent with the 1991 AOC. After unsuccessful negotiations with NYSDEC regarding the FSOB, on May 1, 2014, we submitted a Notice of Dispute to the EPA pursuant to the terms of the 1991 AOC seeking review of the remedy chosen by the NYSDEC. EPA refused to act on the Notice of Dispute via letter correspondence.
NY State Litigation
On May 30, 2014, we filed an action in the Supreme Court of New York formally challenging the NYSDEC's FSOB as a breach of the 1991 AOC. On August 20, 2015, the Supreme Court of New York dismissed our state action on procedural grounds. We appealed that dismissal to the New York Supreme Court Appellate Division, Third Department. On October 20, 2016, the New York Supreme Court Appellate Division, Third Department, issued a decision on our appeal holding that NYSDEC does not have the authority to implement a remedy unilaterally using state funds prior to issuing an order and remanded the case to NYSDEC for further proceedings not inconsistent with the Court’s decision. On February 2, 2017, the Third Department granted NYSDEC's motion for leave to appeal the decision to the New York Court of Appeals. Certiorari was granted by the New York Court of Appeals (the “Court”), and oral arguments were held on March 21, 2018. On May 1, 2018, the Court issued its opinion reversing the Appellate Division’s decision and holding that NYSDEC has the authority to unilaterally spend state superfund money to cleanup sites and then seek reimbursement from FMC in a separate proceeding. In June 2017, in parallel with the ongoing state litigation over the 1991 AOC and the FSOB, NYSDEC started the formal process of issuing to FMC a Part 373 Permit. A draft permit was issued, which, as written, would supersede the 1991 AOC, and ultimately result in its termination. FMC proceeded to challenge the Part 373 Permit through the administrative process, which is still pending.
Federal Litigation
On June 20, 2014, we separately filed an action against EPA in the United States District Court for the Western District of New York seeking a declaratory judgment that the EPA is obligated under the 1991 AOC to review our Notice of Dispute. On January 31, 2017, the District Court dismissed FMC's complaint, ruling that EPA's letter was not a final agency action subject to review. FMC responded to the Court’s dismissal of FMC’s action by filing a Motion to Vacate Judgment and For Leave to Amend Complaint on March 2, 2017. On June 7, 2018, the District Court denied FMC’s motion. On August 6, 2018, FMC filed a notice of appeal in the Second Circuit, appealing both the underlying dismissal and the denial of the motion, which is still pending.
78
Middleport Reserves
In the fourth quarter of 2018, we increased the reserve by
$106.3 million
, which includes our best estimate for remediation costs for OUs 2,4 and 5 in line with the drafted settlement terms between FMC and NYSDEC. Of the
$106.3 million
reserve increase,
$60.6 million
relates to our best estimate for remediation costs associated with the operable unit that comprises the southern portion of the tributary (“OU 6”) plus the impact of inflation. The
$60.6 million
increase is in addition to a previously established reserve of
$29.1 million
related to this operable unit.
The remaining
$45.7 million
reserve increase relates to costs associated with the implementation and completion of NYSDEC’s selected remedy for OUs 2,4, and 5. Prior to settlement discussions, our reserve balance for OUs 2,4, and 5 of
$31.1 million
included the estimated liability for clean-up to reflect the costs associated with our recommended CMAs. Our total reserve for all of Middleport is
$180.8 million
and
$73.9 million
at December 31, 2018 and 2017, respectively. FMC is in various stages of evaluating the remaining operable units.
The Middleport settlement will result in cash outflows of approximately
$20 million
to
$30 million
per year for years 2019 - 2021 due to front loading of reimbursement in installments of past costs, and thereafter an amount not to exceed an average of
$10 million
per year until the remediation is complete.
Other Potentially Responsible Party (“PRP”) Sites
We have been named a PRP at
32
sites on the federal government’s National Priorities List (“NPL”), at which our potential liability has not yet been settled. We have received notice from the EPA or other regulatory agencies that we may be a PRP, or PRP equivalent, at other sites, including
53
sites at which we have determined that it is probable that we have an environmental liability for which we have recorded an estimate of our potential liability in the consolidated financial statements. In cooperation with appropriate government agencies, we are currently participating in, or have participated in, a Remedial Investigation/Feasibility Study (“RI/FS”), or equivalent, at most of the identified sites, with the status of each investigation varying from site to site. At certain sites, a RI/FS has only recently begun, providing limited information, if any, relating to cost estimates, timing, or the involvement of other PRPs; whereas, at other sites, the studies are complete, remedial action plans have been chosen, or a ROD has been issued.
One site where FMC is listed as a PRP is the Portland Harbor Superfund Site (“Portland Harbor”), that includes the river and sediments of a 12 mile section of the lower reach of the Willamette River in Portland, Oregon that runs through an industrialized area. Portland Harbor is listed on the NPL. FMC formerly owned and operated a manufacturing site adjacent to this section of the river and has since sold its interest in this business. Currently, FMC and approximately
70
other parties are involved in a non-judicial allocation process to determine each party’s respective share of the cleanup costs. FMC and several other parties have been sued by the Confederated Bands and Tribes of the Yakama Nation for reimbursement of cleanup costs and the costs of performing a natural damage assessment. Based on the information known to date, we are unable to develop a reasonable estimate of our potential exposure of loss at this time. We intend to defend this matter.
On January 6, 2017, EPA issued its Record of Decision (“ROD”) for the Portland Harbor Superfund Site. Any potential liability to FMC will represent a portion of the costs of the remedy the EPA has selected for Portland Harbor. Based on the current information available in the ROD as well as the large number of responsible parties for the Superfund Site, we are unable to develop a reasonable estimate of our potential exposure for Portland Harbor at this time. We have no reason to believe that the ultimate resolution of our potential obligations at Portland Harbor will have a material adverse effect on our consolidated financial position, liquidity or results of operations. However, adverse results in the outcome of the EPA allocation could have a material adverse effect on our consolidated financial position, results of operations in any one reporting period, or liquidity.
Note 12: Income Taxes
On December 22, 2017, the Tax Cuts and Jobs Act (“the Act”) was enacted in the United States. The Act significantly revised the U.S. corporate income tax structure resulting in changes to the Company’s expected U.S. corporate taxes due for 2017 and in future periods. Effective January 1, 2018, the Act, among other things, reduced the U.S. federal corporate tax rate from 35 percent to 21 percent, created new provisions related to foreign sourced earnings, and eliminated the deduction for domestic production activities. The Act also required companies to pay a one-time transition tax ("transition tax") on the cumulative earnings and profits of foreign subsidiaries that were previously not repatriated and therefore not taxed for U.S. income tax purposes. Taxes due on the one-time transition tax are payable as of December 31, 2017 and will be paid to the tax authority over eight years.
For the year ended December 31, 2017, we recognized provisional expense of
$315.9 million
comprised of
$202.7 million
of expense related to the transition tax and
$113.2 million
of tax expense for the remeasurement of the Company’s U.S. net deferred tax assets. During 2018, in accordance with Staff Accounting Bulletin 118 ("SAB 118"), income tax effects of the Act were refined upon obtaining, preparing, or analyzing additional information during the measurement period. For the year ended December 31,
79
2018, we recorded an adjustment to our provisional expense in the amount of
$8.5 million
. At December 31, 2018, the Company had completed its accounting for the impacts of the enactment of the Act.
For tax years beginning after December 31, 2017, the Act introduced new provisions for U.S. taxation of certain global intangible low-taxed income (“GILTI”) and we made an accounting policy election to account for GILTI as it is incurred. Additionally, during the fourth quarter of 2017 we recorded an impairment charge to write down certain indefinite-lived intangible assets of the acquired DuPont Crop Protection Business as a result of the triggering event associated with the Act. The triggering event represented the expected tax rate increase from the GILTI minimum tax to be imposed on certain of our foreign subsidiaries where these intangible assets are recorded.
We have not provided income taxes for any additional outside basis differences inherent in our investments in subsidiaries because the investments and related unremitted earnings are essentially permanent in duration or we have concluded that no additional tax liability will arise upon disposal. Determining the amount of unrecognized deferred tax liability related to any remaining undistributed foreign earnings is not practicable due to the complexity of the hypothetical calculation.
Domestic and foreign components of income (loss) from continuing operations before income taxes are shown below:
|
|
Year Ended December 31,
|
||||||||||
|
(in Millions)
|
2018
|
2017
|
2016
|
||||||||
|
Domestic
|
$
|
(214.5
|
)
|
$
|
(155.9
|
)
|
$
|
(48.5
|
)
|
||
|
Foreign
|
958.2
|
|
336.7
|
|
229.3
|
|
|||||
|
Total
|
$
|
743.7
|
|
$
|
180.8
|
|
$
|
180.8
|
|
||
The provision (benefit) for income taxes attributable to income (loss) from continuing operations consisted of:
|
|
Year Ended December 31,
|
||||||||||
|
(in Millions)
|
2018
|
2017
|
2016
|
||||||||
|
Current:
|
|||||||||||
|
Federal
(1)
|
$
|
23.6
|
|
$
|
97.5
|
|
$
|
(24.6
|
)
|
||
|
Foreign
|
112.5
|
|
58.4
|
|
21.6
|
|
|||||
|
State
|
0.1
|
|
4.0
|
|
(0.2
|
)
|
|||||
|
Total current
|
$
|
136.2
|
|
$
|
159.9
|
|
$
|
(3.2
|
)
|
||
|
Deferred:
|
|||||||||||
|
Federal
(2)
|
$
|
(5.1
|
)
|
$
|
119.4
|
|
$
|
27.6
|
|
||
|
Foreign
|
(34.3
|
)
|
(14.8
|
)
|
9.5
|
|
|||||
|
State
|
(8.0
|
)
|
(0.4
|
)
|
16.2
|
|
|||||
|
Total deferred
|
$
|
(47.4
|
)
|
$
|
104.2
|
|
$
|
53.3
|
|
||
|
Total
|
$
|
88.8
|
|
$
|
264.1
|
|
$
|
50.1
|
|
||
80
____________________
|
(1)
|
The years ended December 31, 2018 and December 31, 2017
i
nclude the one-time impacts of the of the Act, primarily related to transition tax, further discussed above within Note 12.
|
|
(2)
|
The years ended December 31, 2018 and December 31, 2017
i
nclude the one-time impacts of the Act, primarily related to the measurement of the Company’s U.S. domestic net deferred tax assets, further discussed above within Note 12.
|
The effective income tax rate applicable to income from continuing operations before income taxes was different from the statutory U.S. federal income tax rate due to the factors listed in the following table:
|
|
Year Ended December 31,
|
||||||||||
|
(in Millions)
|
2018
|
2017
|
2016
|
||||||||
|
U.S. Federal statutory rate
(1)
|
$
|
156.2
|
|
$
|
63.3
|
|
$
|
63.3
|
|
||
|
Impacts of Tax Cuts and Jobs Act Enactment
(2)
|
8.5
|
|
315.9
|
|
—
|
|
|||||
|
Foreign earnings subject to different tax rates
(3)
|
(158.4
|
)
|
(79.0
|
)
|
(49.3
|
)
|
|||||
|
Capital loss on internal restructuring
|
—
|
|
(45.3
|
)
|
—
|
|
|||||
|
State and local income taxes, less federal income tax benefit
|
3.6
|
|
(1.5
|
)
|
16.0
|
|
|||||
|
Manufacturer's production deduction and miscellaneous tax credits
|
(3.7
|
)
|
(10.1
|
)
|
0.8
|
|
|||||
|
Tax on dividends, deemed dividends, and GILTI
(4)
|
41.5
|
|
10.6
|
|
2.1
|
|
|||||
|
Changes to unrecognized tax benefits
|
3.1
|
|
7.2
|
|
4.9
|
|
|||||
|
Nondeductible expenses
|
11.7
|
|
12.2
|
|
5.7
|
|
|||||
|
Change in valuation allowance
|
8.0
|
|
(32.0
|
)
|
7.9
|
|
|||||
|
Exchange gains and losses
(5)
|
3.6
|
|
29.4
|
|
(12.1
|
)
|
|||||
|
Other
|
14.7
|
|
(6.6
|
)
|
10.8
|
|
|||||
|
Total Tax Provision
|
$
|
88.8
|
|
$
|
264.1
|
|
$
|
50.1
|
|
||
____________________
|
(1)
|
The year ended December 31, 2018 includes twelve months of earnings associated with the operations of the DuPont Crop Protection Business acquired November 1, 2017. See Note 4 for additional information.
|
|
(2)
|
Includes the one-time impacts of the of the Act, primarily related to transition tax and the decrease to the U.S. tax rate, further discussed above within Note 12.
|
|
(3)
|
The year ended December 31, 2018 reflects the income mix associated with twelve months of foreign earnings of the DuPont Crop Protection business acquired November 1, 2017.
|
|
(4)
|
The year ended December 31, 2018 includes tax expense of
$36.4 million
associated with the GILTI provisions of the Act.
|
|
(5)
|
Includes the impact of transaction gains or losses on net monetary assets for which no corresponding tax expense or benefit is realized and the tax provision for statutory taxable gains or losses in foreign jurisdictions for which there is no corresponding amount in income before taxes.
|
Significant components of our deferred tax assets and liabilities were attributable to:
|
|
December 31,
|
||||||
|
(in Millions)
|
2018
|
2017
|
|||||
|
Reserves for discontinued operations, environmental and restructuring
|
$
|
151.0
|
|
$
|
101.6
|
|
|
|
Accrued pension and other postretirement benefits
|
3.0
|
|
19.3
|
|
|||
|
Capital loss, foreign tax and other credit carryforwards
|
6.0
|
|
4.0
|
|
|||
|
Net operating loss carryforwards
|
221.9
|
|
207.0
|
|
|||
|
Deferred expenditures capitalized for tax
|
15.2
|
|
4.0
|
|
|||
|
Other
|
149.8
|
|
153.3
|
|
|||
|
Deferred tax assets
|
$
|
546.9
|
|
$
|
489.2
|
|
|
|
Valuation allowance, net
|
(263.5
|
)
|
(272.0
|
)
|
|||
|
Deferred tax assets, net of valuation allowance
|
$
|
283.4
|
|
$
|
217.2
|
|
|
|
Intangibles and property, plant and equipment, net
|
341.0
|
|
137.9
|
|
|||
|
Deferred tax liabilities
|
$
|
341.0
|
|
$
|
137.9
|
|
|
|
Net deferred tax assets (liabilities)
|
$
|
(57.6
|
)
|
$
|
79.3
|
|
|
81
We evaluate our deferred income taxes quarterly to determine if valuation allowances are required or should be adjusted. GAAP accounting guidance requires companies to assess whether valuation allowances should be established against deferred tax assets based on all available evidence, both positive and negative, using a “more likely than not” standard. In assessing the need for a valuation allowance, appropriate consideration is given to all positive and negative evidence related to the realization of deferred tax assets. This assessment considers, among other matters, the nature and severity of current and cumulative losses, forecasts of future profitability, the duration of statutory carryforward periods, and tax planning alternatives. We operate and derive income from multiple lines of business across multiple jurisdictions. As each of the respective lines of business experiences changes in operating results across its geographic footprint, we may encounter losses in jurisdictions that have been historically profitable, and as a result might require additional valuation allowances to be recorded. We are committed to implementing tax planning actions, when deemed appropriate, in jurisdictions that experience losses in order to realize deferred tax assets prior to their expiration.
For the year ended
December 31, 2018
, our analysis of the realizability of U.S. state deferred tax assets and state conformity with the GILTI provisions of the Act resulted in change in our assertion as it pertains to the realizability of certain U.S. state deferred tax assets and we reduced the valuation allowance provided for on U.S. state deferred tax assets by
$11.6 million
.
At
December 31, 2018
, we had net operating loss and tax credit carryforwards as follows: U.S. state net operating loss carryforwards of
$25.7 million
(tax-effected) expiring in future tax years through
2038
, foreign net operating loss carryforwards of
$196.9 million
(tax-effected) expiring in various future years,
$0.7 million
of capital loss carryforwards expiring in 2020 and other tax credit carryforwards of
$3.2 million
expiring in various future years.
The increase in the net deferred tax liability associated with Intangibles and property, plant and equipment, net as of December 31, 2018 as compared to December 31, 2017, is driven by the completion of the purchase accounting for intangibles acquired with the DuPont Crop Protection Business in Singapore and Puerto Rico.
Uncertain Income Tax Positions
U.S. GAAP accounting guidance for uncertainty in income taxes prescribes a model for the recognition and measurement of a tax position taken or expected to be taken in a tax return, and provides guidance on derecognition, classification, interest and penalties, disclosure and transition.
We file income tax returns in the U.S. federal jurisdiction, and various states and foreign jurisdictions. The income tax returns for FMC entities taxable in the U.S. and significant foreign jurisdictions are open for examination and adjustment. As of
December 31, 2018
, the U. S. federal and state income tax returns are open for examination and adjustment for the years
2015
-
2018
and
1998
-
2018
, respectively. Our significant foreign jurisdictions, which total
16
, are open for examination and adjustment during varying periods from
2008
-
2018
.
As of
December 31, 2018
, we had total unrecognized tax benefits of
$79.1 million
, of which
$29.5 million
would favorably impact the effective tax rate from continuing operations if recognized. As of
December 31, 2017
, we had total unrecognized tax benefits of
$84.0 million
, of which
$22.5 million
would favorably impact the effective tax rate if recognized. Interest and penalties related to unrecognized tax benefits are reported as a component of income tax expense. For the years ended
December 31, 2018
,
2017
and
2016
, we recognized interest and penalties of
$0.9 million
,
$5.2 million
, and
$4.4 million
, respectively, in the consolidated statements of income (loss). As of
December 31, 2018
and
2017
, we have accrued interest and penalties in the consolidated balance sheets of
$14.0 million
and
$13.1 million
, respectively.
Due to the potential for resolution of federal, state, or foreign examinations, and the expiration of various jurisdictional statutes of limitation, it is reasonably possible that our liability for unrecognized tax benefits will decrease within the next 12 months by a range of
$10.1 million
to
$16.5 million
.
82
A reconciliation of the beginning and ending amount of unrecognized tax benefits is as follows:
|
(in Millions)
|
2018
|
2017
|
2016
|
||||||||
|
Balance at beginning of year
|
$
|
84.0
|
|
$
|
111.6
|
|
$
|
97.1
|
|
||
|
Increases related to positions taken in the current year
|
11.8
|
|
9.4
|
|
22.3
|
|
|||||
|
Increases and decreases related to positions taken in prior years
|
(1.8
|
)
|
(4.6
|
)
|
2.6
|
|
|||||
|
Decreases related to lapse of statutes of limitations
|
(13.5
|
)
|
(14.2
|
)
|
(10.2
|
)
|
|||||
|
Settlements during the current year
|
(1.4
|
)
|
(0.3
|
)
|
(0.2
|
)
|
|||||
|
Decreases for tax positions on dispositions
|
—
|
|
(17.9
|
)
|
—
|
|
|||||
|
Balance at end of year
(1)
|
$
|
79.1
|
|
$
|
84.0
|
|
$
|
111.6
|
|
||
____________________
|
(1)
|
At
December 31, 2018
,
2017
, and
2016
we recognized an offsetting non-current deferred asset of
$45.3 million
,
$59.8 million
, and
$74.4 million
respectively, relating to specific uncertain tax positions presented above.
|
Note 13: Debt
Debt maturing within one year:
Debt maturing within one year consists of the following:
|
December 31,
|
|||||||
|
(in Millions)
|
2018
|
2017
|
|||||
|
Short-term foreign debt
(1)
|
$
|
106.5
|
|
$
|
91.4
|
|
|
|
Commercial paper
(2)
|
55.2
|
|
—
|
|
|||
|
Total short-term debt
|
$
|
161.7
|
|
$
|
91.4
|
|
|
|
Current portion of long-term debt
|
386.0
|
|
101.2
|
|
|||
|
Short-term debt and current portion of long-term debt
|
$
|
547.7
|
|
$
|
192.6
|
|
|
____________________
|
(1)
|
At
December 31, 2018
, the average effective interest rate on the borrowings was
7.1%
.
|
|
(2)
|
At
December 31, 2018
, the average effective interest rate on the borrowings was
3.1%
.
|
Long-term debt:
Long-term debt consists of the following:
|
(in Millions)
|
December 31, 2018
|
December 31,
|
|||||||||
|
Interest Rate
Percentage
|
Maturity
Date
|
2018
|
2017
|
||||||||
|
Pollution control and industrial revenue bonds (less unamortized discounts of $0.2 and $0.2, respectively)
|
1.9% - 6.5%
|
2021 - 2032
|
$
|
51.6
|
|
$
|
51.6
|
|
|||
|
Senior notes (less unamortized discounts of $0.8 and $1.1, respectively)
|
3.95% - 5.2%
|
2019 - 2024
|
999.2
|
|
998.9
|
|
|||||
|
2014 Term Loan Facility
|
—%
|
2020
|
—
|
|
450.0
|
|
|||||
|
2017 Term Loan Facility
|
3.8%
|
2022
|
1,400.0
|
|
1,500.0
|
|
|||||
|
Revolving Credit Facility
(1)
|
5.1%
|
2022
|
—
|
|
—
|
|
|||||
|
FMC Lithium Revolving Credit Facility
(2)
|
5.2%
|
2023
|
34.0
|
|
—
|
|
|||||
|
Foreign debt
|
0 - 7.2%
|
2019 - 2024
|
89.1
|
|
106.9
|
|
|||||
|
Debt issuance cost
|
(8.9
|
)
|
(13.2
|
)
|
|||||||
|
Total long-term debt
|
$
|
2,565.0
|
|
$
|
3,094.2
|
|
|||||
|
Less: debt maturing within one year
|
386.0
|
|
101.2
|
|
|||||||
|
Total long-term debt, less current portion
|
$
|
2,179.0
|
|
$
|
2,993.0
|
|
|||||
____________________
83
|
(1)
|
Letters of credit outstanding under the Revolving Credit Facility totaled
$199.0 million
and available funds under this facility were
$1,245.8 million
at
December 31, 2018
.
|
|
(2)
|
As of
December 31, 2018
, there were
$10.3 million
letters of credit outstanding under our FMC Lithium Revolving Credit Facility.
|
2014 Term Loan Agreement Amendment
On September 28, 2018, we entered into Amendment No. 4 (“2014 Term Loan Amendment”) to that certain Term Loan Agreement, dated as of October 10, 2014. The 2014 Term Loan Amendment amends the 2014 Term Loan Agreement in order to permit our previously disclosed separation and spin-off of the FMC Lithium business, as set forth in the 2014 Term Loan Amendment. The 2014 Term Loan was subsequently paid down in full during the fourth quarter of 2018 using a portion of the proceeds from the Livent IPO.
2017 Term Loan Agreement Amendment
On September 28, 2018, we entered into Amendment No. 1 (“2017 Term Loan Amendment”) to that certain Term Loan Agreement, dated as of May 2, 2017. The 2017 Term Loan Amendment amends the 2017 Term Loan Agreement in order to permit our previously disclosed separation and spin-off of the FMC Lithium segment, as set forth in the 2017 Term Loan Amendment. Refer to the original terms of the 2017 Term Loan Agreement described below.
Revolving Credit Agreement Amendment
On September 28, 2018, we entered into Amendment No. 1 (“Revolving Credit Amendment”) to that certain Second Amended and Restated Credit Agreement, dated as of May 2, 2017. The Revolving Credit Amendment amends the Revolving Credit Agreement in order to permit the previously disclosed separation and spin-off of FMC Lithium, as set forth in the Revolving Credit Amendment. Refer to the original terms of the Revolving Credit Agreement described below.
FMC Lithium Revolving Credit Facility
On September 28, 2018, our Lithium segment entered into a credit agreement among its subsidiary, FMC Lithium USA Corp., as borrowers (the “Borrowers”), certain of FMC Lithium's wholly owned subsidiaries as guarantors, the lenders party thereto (the “Lenders”), Citibank, N.A., as administrative agent, and certain other financial institutions party thereto, as joint lead arrangers (the “Credit Agreement”). The Credit Agreement provides for a
$400 million
senior secured revolving credit facility,
$50 million
of which is available for the issuance of letters of credit for the account of the Borrowers, with an option, subject to certain conditions and limitations, to increase the aggregate amount of the revolving credit commitments to
$600 million
(the “FMC Lithium Revolving Credit Facility”). The issuance of letters of credit and the proceeds of revolving credit loans made pursuant to the FMC Lithium Revolving Credit Facility are available, and will be used, for general corporate purposes, including capital expenditures and permitted acquisitions, of the Borrowers and their subsidiaries.
Amounts under the FMC Lithium Revolving Credit Facility may be borrowed, repaid and re-borrowed from time to time until the final maturity date of the FMC Lithium Revolving Credit Facility, which will be the fifth anniversary of the FMC Lithium Revolving Credit Facility’s effective date. Voluntary prepayments and commitment reductions under the FMC Lithium Revolving Credit Facility are permitted at any time without any prepayment premium upon proper notice and subject to minimum dollar amounts.
Revolving loans under the Credit Agreement will bear interest at a floating rate, which will be a base rate or a Eurodollar rate equal to the London interbank offered rate for the relevant interest period, plus, in each case, an applicable margin based on the Lithium segment's leverage ratio, as determined in accordance with the provisions of the Credit Agreement. The base rate will be the greatest of: the rate of interest announced publicly by Citibank, N.A. in New York City from time to time as its “base rate”; the federal funds effective rate plus
0.5%
; and a Eurodollar rate for a one-month interest period plus
1%
. Each borrower on a joint and several basis is required to pay a commitment fee quarterly in arrears on the average daily unused amount of each Lender’s revolving credit commitment at a rate equal to an applicable percentage based on the Lithium segment’s leverage ratio, as determined in accordance with the provisions of the Credit Agreement. The applicable margin and the commitment fee are subject to adjustment as provided in the Credit Agreement.
The Borrowers’ present and future domestic material subsidiaries (the “Guarantors”) will guarantee the obligations of the Borrowers under the FMC Lithium Revolving Credit Facility. The obligations of the Borrowers and the Guarantors are secured by all of the present and future assets of the Borrowers and the Guarantors, including the Borrowers’ facility and real estate in Bessemer City, North Carolina, subject to certain exceptions and exclusions as set forth in the Credit Agreement and other security and collateral documents.
The Credit Agreement contains certain affirmative and negative covenants that are binding on the Borrowers and their subsidiaries, including, among others, restrictions (subject to exceptions and qualifications) on the ability of the Borrowers and their subsidiaries to create liens, to undertake fundamental changes, to incur debt, to sell or dispose of assets, to make investments, to make restricted
84
payments such as dividends, distributions or equity repurchases, to change the nature of their businesses, to enter into transactions with affiliates and to enter into certain burdensome agreements.
Term Loan Facility
On November 1, 2017, we borrowed
$1.5 billion
under our previously announced senior unsecured term loan facility ("2017 Term Loan Facility"). The proceeds of the borrowing were used to finance the Acquisition and will also be used to pay anticipated taxes associated with the gain on the sale of FMC Health and Nutrition and other transaction costs.
The scheduled maturity of the 2017 Term Loan Facility is on the fifth anniversary of this closing date. The 2017 Term Loan Facility will bear interest at a floating rate, which will be a base rate or a Eurocurrency rate equal to the London interbank offered rate for the relevant interest period, plus in each case an applicable margin, as determined in accordance with the provisions of the related agreement to the 2017 Term Loan Facility. The base rate will be the highest of: the rate of interest announced publicly by Citibank, N.A. in New York, New York from time to time as its “base rate”; the federal funds effective rate plus
1/2
of
one
percent; and the Eurocurrency rate for a one-month period plus
one
percent.
The 2017 Term Loan Facility contains financial and other covenants, including a maximum leverage ratio of
4.75
and minimum interest coverage ratio of
3.5
immediately following the DuPont Crop Protection Business Acquisition. The 2017 Term Loan Facility also contains a cross-default provision whereby a default under our other indebtedness in excess of
$50 million
, after grace periods and absent a waiver from the lenders, would be an event of default under the agreement of the 2017 Term Loan Facility and could result in a demand for payment of all amounts outstanding under this facility.
Revolving Credit Facility
On May 2, 2017, we entered into an amended and restated credit agreement (the "Revolving Credit Agreement"). The unsecured Revolving Credit Agreement provides for a
$1.5 billion
revolving credit facility, with an option, subject to certain conditions and limitations, to increase the aggregate amount of the revolving credit commitments to
$2.25 billion
(the "Revolving Credit Facility"). The current termination date of the Revolving Credit Facility is May 2, 2022.
Revolving loans under the Revolving Credit Facility will bear interest at a floating rate, which will be a base rate or a Eurocurrency rate equal to the London interbank offered rate for the relevant interest period, plus, in each case, an applicable margin, as determined in accordance with the provisions of the Revolving Credit Agreement. The base rate will be the highest of: the rate of interest announced publicly by Citibank, N.A. in New York, New York from time to time as its “base rate”; the federal funds effective rate plus
1/2
of
one
percent; and the Eurocurrency rate for a one-month period plus
one
percent. We are also required to pay a facility fee on the average daily amount (whether used or unused) at a rate per annum equal to an applicable percentage in effect from time to time for the facility fee, as determined in accordance with the provisions of the Revolving Credit Agreement. The initial facility fee is
0.15
percent per annum. The applicable margin and the facility fee are subject to adjustment as provided in the Revolving Credit Agreement.
The Revolving Credit Agreement contains customary financial and other covenants, including a maximum leverage ratio and minimum interest coverage ratio. The financial covenant levels have been amended in order to permit the debt incurred under the 2017 Term Loan Facility discussed above along with certain other changes to permit the expected transaction.
Fees incurred to secure the Revolving Credit Facility have been deferred and will be amortized over the term of the arrangement.
Maturities of long-term debt
Maturities of long-term debt outstanding, excluding discounts, at
December 31, 2018
, are
$386.0 million
in
2019
,
$2.2 million
in
2020
,
$200.7 million
in
2021
,
$1,501.8 million
in
2022
,
$34.1 million
in
2023
and
$450.1 million
thereafter.
Covenants
Among other restrictions, the Revolving Credit Facility and 2017 Term Loan Facility contain financial covenants applicable to FMC and its consolidated subsidiaries related to leverage (measured as the ratio of debt to adjusted earnings) and interest coverage (measured as the ratio of adjusted earnings to interest expense). Our actual leverage for the four consecutive quarters ended
December 31, 2018
was
2.3
which is below the maximum leverage of
4.5
. By the end of
2019
, the maximum leverage ratio will step down to
4.0
in accordance with the provisions of the Revolving Credit Facility and the 2017 Term Loan Facility. Our actual interest coverage for the four consecutive quarters ended
December 31, 2018
was
9.6
which is above the minimum interest coverage of
3.5
. We were in compliance with all covenants at
December 31, 2018
.
Among other restrictions, the FMC Lithium Revolving Credit Facility contains financial covenants applicable to FMC Lithium and its consolidated subsidiaries related to leverage (measured as the ratio of debt to adjusted earnings) and interest coverage
85
(measured as the ratio of adjusted earnings to interest expense). FMC Lithium was in compliance with all covenants at
December 31, 2018
.
Compensating Balance Agreements
We maintain informal credit arrangements in many foreign countries. Foreign lines of credit, which include overdraft facilities, typically do not require the maintenance of compensating balances, as credit extension is not guaranteed but is subject to the availability of funds.
Note 14: Pension and Other Postretirement Benefits
The funded status of our U.S. qualified and nonqualified defined benefit pension plans, our United Kingdom, Germany, France, and Belgium defined benefit pension plans, plus our U.S. other postretirement healthcare and life insurance benefit plans for continuing operations, together with the associated balances and net periodic benefit cost recognized in our consolidated financial statements as of December 31, are shown in the tables below.
We are required to recognize in our consolidated balance sheets the overfunded and underfunded status of our defined benefit postretirement plans. The overfunded or underfunded status is defined as the difference between the fair value of plan assets and the projected benefit obligation. We are also required to recognize as a component of other comprehensive income the actuarial gains and losses and the prior service costs and credits that arise during the period.
The following table summarizes the weighted-average assumptions used to determine the benefit obligations at December 31 for the U.S. Plans:
|
Pensions and Other Benefits
|
|||||
|
December 31,
|
|||||
|
2018
|
2017
|
||||
|
Discount rate qualified
|
4.35
|
%
|
3.68
|
%
|
|
|
Discount rate nonqualified plan
|
3.97
|
%
|
3.29
|
%
|
|
|
Discount rate other benefits
|
4.08
|
%
|
3.41
|
%
|
|
|
Rate of compensation increase
|
3.10
|
%
|
3.10
|
%
|
|
The following table summarizes the components of our defined benefit postretirement plans and reflect a measurement date of December 31:
86
|
Pensions
|
Other Benefits
(1)
|
||||||||||||||
|
December 31,
|
|||||||||||||||
|
(in Millions)
|
2018
|
2017
|
2018
|
2017
|
|||||||||||
|
Change in projected benefit obligation
|
|||||||||||||||
|
Projected benefit obligation at January 1
|
$
|
1,385.8
|
|
$
|
1,378.7
|
|
$
|
19.0
|
|
$
|
19.2
|
|
|||
|
Service cost
|
6.3
|
|
7.3
|
|
—
|
|
—
|
|
|||||||
|
Interest cost
|
44.5
|
|
44.8
|
|
0.7
|
|
0.7
|
|
|||||||
|
Actuarial loss (gain)
(2)
|
(89.9
|
)
|
82.2
|
|
0.6
|
|
1.7
|
|
|||||||
|
Amendments
|
—
|
|
—
|
|
(0.1
|
)
|
(0.1
|
)
|
|||||||
|
Acquisitions
(3)
|
—
|
|
7.6
|
|
—
|
|
—
|
|
|||||||
|
Foreign currency exchange rate changes and other
|
(0.4
|
)
|
3.4
|
|
—
|
|
—
|
|
|||||||
|
Plan participants’ contributions
|
—
|
|
—
|
|
0.7
|
|
0.7
|
|
|||||||
|
Special termination benefits
|
3.9
|
|
2.3
|
|
—
|
|
—
|
|
|||||||
|
Settlements
|
(4.4
|
)
|
(54.3
|
)
|
—
|
|
—
|
|
|||||||
|
Transfer of liabilities from continuing to discontinued operations
|
—
|
|
—
|
|
—
|
|
(0.9
|
)
|
|||||||
|
Curtailments
|
(0.9
|
)
|
(5.0
|
)
|
0.2
|
|
0.4
|
|
|||||||
|
Benefits paid
|
(83.6
|
)
|
(81.2
|
)
|
(2.2
|
)
|
(2.7
|
)
|
|||||||
|
Projected benefit obligation at December 31
|
$
|
1,261.3
|
|
$
|
1,385.8
|
|
$
|
18.9
|
|
$
|
19.0
|
|
|||
|
Change in plan assets
|
|||||||||||||||
|
Fair value of plan assets at January 1
|
$
|
1,339.9
|
|
$
|
1,253.5
|
|
$
|
—
|
|
$
|
—
|
|
|||
|
Actual return on plan assets
|
(18.0
|
)
|
165.2
|
|
—
|
|
—
|
|
|||||||
|
Foreign currency exchange rate changes
|
(0.2
|
)
|
3.2
|
|
—
|
|
—
|
|
|||||||
|
Company contributions
|
36.0
|
|
54.5
|
|
1.5
|
|
2.0
|
|
|||||||
|
Plan participants’ contributions
|
—
|
|
—
|
|
0.7
|
|
0.7
|
|
|||||||
|
Actual expenses
|
—
|
|
(1.0
|
)
|
—
|
|
—
|
|
|||||||
|
Settlements
|
(4.4
|
)
|
(54.3
|
)
|
—
|
|
—
|
|
|||||||
|
Benefits paid
|
(83.6
|
)
|
(81.2
|
)
|
(2.2
|
)
|
(2.7
|
)
|
|||||||
|
Fair value of plan assets at December 31
|
$
|
1,269.7
|
|
$
|
1,339.9
|
|
$
|
—
|
|
$
|
—
|
|
|||
|
Funded Status
|
|||||||||||||||
|
U.S. plans with assets
|
$
|
42.8
|
|
$
|
(6.6
|
)
|
$
|
—
|
|
$
|
—
|
|
|||
|
U.S. plans without assets
|
(24.6
|
)
|
(29.8
|
)
|
(18.9
|
)
|
(19.0
|
)
|
|||||||
|
Non-U.S. plans with assets
|
(1.9
|
)
|
(7.6
|
)
|
—
|
|
—
|
|
|||||||
|
All other plans
|
(7.9
|
)
|
(1.9
|
)
|
—
|
|
—
|
|
|||||||
|
Net funded status of the plan (liability)
|
$
|
8.4
|
|
$
|
(45.9
|
)
|
$
|
(18.9
|
)
|
$
|
(19.0
|
)
|
|||
|
Amount recognized in the consolidated balance sheets:
|
|||||||||||||||
|
Pension asset
(4)
|
$
|
42.8
|
|
$
|
—
|
|
$
|
—
|
|
$
|
—
|
|
|||
|
Accrued benefit liability
(5)
|
(34.4
|
)
|
(45.9
|
)
|
(18.9
|
)
|
(19.0
|
)
|
|||||||
|
Total
|
$
|
8.4
|
|
$
|
(45.9
|
)
|
$
|
(18.9
|
)
|
$
|
(19.0
|
)
|
|||
____________________
|
(1)
|
Refer to Note 10 for information on our discontinued postretirement benefit plans.
|
|
(2)
|
The actuarial gain in 2018 was primarily driven by the increase in discount rate on the U.S. qualified plan. Additionally, the Society of Actuaries released an updated mortality table projection scale for measurement of retirement program obligations. Adoption of this new projection scale has
decreased
the U.S. defined benefit obligations by approximately
$4 million
at December 31, 2018.
|
|
(3)
|
Refer to Note 4 for information on our acquired pension plans as part of the DuPont Crop Protection Acquisition.
|
|
(4)
|
Recorded as "Other assets including long-term receivables, net" on the consolidated balance sheets.
|
|
(5)
|
Recorded as "Accrued pension and other postretirement benefits, current and long-term" on the consolidated balance sheets.
|
The amounts in accumulated other comprehensive income (loss) that have not yet been recognized as components of net periodic benefit cost are as follows:
87
|
|
Pensions
|
Other Benefits
(1)
|
|||||||||||||
|
|
December 31,
|
||||||||||||||
|
(in Millions)
|
2018
|
2017
|
2018
|
2017
|
|||||||||||
|
Prior service (cost) credit
|
$
|
(1.1
|
)
|
$
|
(1.9
|
)
|
$
|
(0.1
|
)
|
$
|
(0.2
|
)
|
|||
|
Net actuarial (loss) gain
|
(370.6
|
)
|
(398.3
|
)
|
4.2
|
|
5.5
|
|
|||||||
|
Accumulated other comprehensive income (loss) – pretax
|
$
|
(371.7
|
)
|
$
|
(400.2
|
)
|
$
|
4.1
|
|
$
|
5.3
|
|
|||
|
Accumulated other comprehensive income (loss) – net of tax
|
(226.1
|
)
|
(248.4
|
)
|
2.6
|
|
3.5
|
|
|||||||
____________________
|
(1)
|
Refer to Note 10 for information on our discontinued postretirement benefit plans
.
|
The accumulated benefit obligation for all pension plans was
$1,248.8 million
and
$1,359.6 million
at
December 31, 2018
and
2017
, respectively.
|
(in Millions)
|
December 31
|
||||||
|
Information for pension plans with projected benefit obligation in excess of plan assets
|
2018
|
2017
|
|||||
|
Projected benefit obligations
|
$
|
39.1
|
|
$
|
1,385.8
|
|
|
|
Accumulated benefit obligations
|
39.2
|
|
1,359.6
|
|
|||
|
Fair value of plan assets
|
4.7
|
|
1,339.9
|
|
|||
|
(in Millions)
|
December 31
|
||||||
|
Information for pension plans with accumulated benefit obligation in excess of plan assets
|
2018
|
2017
|
|||||
|
Projected benefit obligations
|
$
|
39.1
|
|
$
|
39.2
|
|
|
|
Accumulated benefit obligations
|
39.2
|
|
37.5
|
|
|||
|
Fair value of plan assets
|
4.7
|
|
5.0
|
|
|||
Other changes in plan assets and benefit obligations for continuing operations recognized in other comprehensive loss (income) are as follows:
|
|
Pensions
|
Other Benefits
(1)
|
|||||||||||||
|
|
Year Ended December 31,
|
||||||||||||||
|
(in Millions)
|
2018
|
2017
|
2018
|
2017
|
|||||||||||
|
Current year net actuarial loss (gain)
|
$
|
(8.7
|
)
|
$
|
(2.6
|
)
|
$
|
0.8
|
|
$
|
2.1
|
|
|||
|
Current year prior service cost (credit)
|
—
|
|
—
|
|
(0.1
|
)
|
(0.1
|
)
|
|||||||
|
Amortization of net actuarial (loss) gain
|
(16.0
|
)
|
(16.4
|
)
|
0.5
|
|
1.0
|
|
|||||||
|
Amortization of prior service (cost) credit
|
(0.4
|
)
|
(0.5
|
)
|
0.1
|
|
0.1
|
|
|||||||
|
Recognition of prior service cost due to curtailment
|
(0.3
|
)
|
—
|
|
—
|
|
(0.3
|
)
|
|||||||
|
Transfer of actuarial (loss) gain from continuing to discontinued operations
|
—
|
|
—
|
|
(0.1
|
)
|
0.6
|
|
|||||||
|
Curtailment loss
(2)
|
(0.9
|
)
|
(5.0
|
)
|
—
|
|
—
|
|
|||||||
|
Settlement loss
|
(1.8
|
)
|
(47.3
|
)
|
—
|
|
—
|
|
|||||||
|
Foreign currency exchange rate changes on the above line items
|
(0.4
|
)
|
0.4
|
|
—
|
|
—
|
|
|||||||
|
Total recognized in other comprehensive (income) loss, before taxes
|
$
|
(28.5
|
)
|
$
|
(71.4
|
)
|
$
|
1.2
|
|
$
|
3.4
|
|
|||
|
Total recognized in other comprehensive (income) loss, after taxes
|
(22.3
|
)
|
(52.2
|
)
|
0.9
|
|
2.1
|
|
|||||||
____________________
|
(1)
|
Refer to Note 10 for information on our discontinued postretirement benefit plans.
|
|
(2)
|
During the years ended December 31, 2018 and 2017, due to the announced plans to separate FMC Lithium and divest FMC Health and Nutrition, respectively, we triggered a curtailment of our U.S. pension plans. As a result, we revalued our pension plans as of October 31, 2018 and March 31, 2017, respectively, in addition to the normal December 31st remeasurement, which resulted in adjustments to comprehensive income. The
$0.9 million
in 2018 reflects the adjustment to the continuing operations liability and other
|
88
comprehensive income based on the revaluation of the plan. The associated curtailment expense is recorded within "Non-operating pension and postretirement charges (income)". The
$5.0 million
in 2017 also reflects the adjustment to the continuing operations liability and other comprehensive income based on the revaluation of the plan. The associated curtailment expense was recorded under "Discontinued operations, net of income taxes", as discussed below.
The estimated net actuarial loss and prior service cost for our pension plans that will be amortized from accumulated other comprehensive income (loss) into our net annual benefit cost (income) during
2019
are
$18.4 million
and
$0.2 million
, respectively. The estimated net actuarial gain and prior service cost for our other benefits that will be amortized from accumulated other comprehensive income (loss) into net annual benefit cost (income) during
2019
will be
$(0.7) million
and
$0.1 million
, respectively.
The following table summarizes the weighted-average assumptions used for and the components of net annual benefit cost (income):
|
|
Year Ended December 31,
|
||||||||||||||||||||||
|
|
Pensions
|
Other Benefits
(1)
|
|||||||||||||||||||||
|
(in Millions, except for percentages)
|
2018
|
2017
|
2016
|
2018
|
2017
|
2016
|
|||||||||||||||||
|
Discount rate
|
3.68
|
%
|
4.22
|
%
|
4.50
|
%
|
3.41
|
%
|
3.77
|
%
|
3.97
|
%
|
|||||||||||
|
Expected return on plan assets
|
5.00
|
%
|
6.50
|
%
|
7.00
|
%
|
—
|
|
—
|
|
—
|
|
|||||||||||
|
Rate of compensation increase
|
3.10
|
%
|
3.60
|
%
|
3.60
|
%
|
—
|
|
—
|
|
—
|
|
|||||||||||
|
Components of net annual benefit cost:
|
|||||||||||||||||||||||
|
Service cost
|
$
|
6.3
|
|
$
|
7.3
|
|
$
|
8.0
|
|
$
|
—
|
|
$
|
—
|
|
$
|
—
|
|
|||||
|
Interest cost
|
44.5
|
|
44.8
|
|
49.8
|
|
0.7
|
|
0.7
|
|
0.8
|
|
|||||||||||
|
Expected return on plan assets
|
(63.0
|
)
|
(78.5
|
)
|
(85.5
|
)
|
—
|
|
—
|
|
—
|
|
|||||||||||
|
Amortization of prior service cost
|
0.4
|
|
0.5
|
|
0.7
|
|
(0.1
|
)
|
(0.1
|
)
|
—
|
|
|||||||||||
|
Amortization of net actuarial and other (gain) loss
|
16.0
|
|
16.4
|
|
39.2
|
|
(0.5
|
)
|
(0.9
|
)
|
(1.2
|
)
|
|||||||||||
|
Recognized (gain) loss due to special termination benefit
(2)
|
3.9
|
|
—
|
|
—
|
|
—
|
|
—
|
|
—
|
|
|||||||||||
|
Recognized (gain) loss due to curtailments
(2)
|
0.3
|
|
—
|
|
—
|
|
0.1
|
|
—
|
|
—
|
|
|||||||||||
|
Recognized (gain) loss due to settlement
|
1.8
|
|
35.7
|
|
20.3
|
|
—
|
|
—
|
|
—
|
|
|||||||||||
|
Net annual benefit cost (income)
|
$
|
10.2
|
|
$
|
26.2
|
|
$
|
32.5
|
|
$
|
0.2
|
|
$
|
(0.3
|
)
|
$
|
(0.4
|
)
|
|||||
___________________
|
(1)
|
Refer to Note 10 for information on our discontinued postretirement benefit plans.
|
|
(2)
|
For the year ended December 31, 2018, we recognized a
$4.3 million
loss due to curtailment and special termination benefits associated with the planned separation of FMC Lithium.
|
For the year ended December 31, 2017, we recognized a combined curtailment and termination benefits loss of
$3.9 million
associated with the disposal of our FMC Health and Nutrition Business, which was recorded within "Discontinued operations, net of income taxes" within the consolidated statements of income (loss).
For the year ended December 31, 2017, we recorded a settlement charge of
$35.7 million
. The settlement charge includes
$3.2 million
related to the non-qualified plan in the U.S. and a
$32.5 million
settlement charge related to the termination of the U.K. pension plan.
Our U.S. qualified defined benefit pension plan (“U.S. Plan”) holds the majority of our pension plan assets. The expected long-term rate of return on these plan assets was
5.0 percent
for the year ended
December 31, 2018
(except for the period between the November 1, 2018 remeasurement and December 31, 2018 during which it was
4.5 percent
),
6.5 percent
for the year ended
December 31, 2017
and
7.0 percent
for the year ended
December 31, 2016
. The expected long-term rate of return on these plan assets
decreased
by
1.5 percent
in
2018
compared to
2017
, due to a change in investment strategy. In developing the assumption for the long-term rate of return on assets for our U.S. Plan, we take into consideration the technical analysis performed by our outside actuaries, including historical market returns, information on the assumption for long-term real returns by asset class, inflation assumptions and expectations for standard deviation related to these best estimates. Given an actively managed investment portfolio, the expected annual rates of return by asset class for our portfolio, assuming an estimated inflation rate of approximately
2.3 percent
, is in line with our assumption for the rate of return on assets. The target asset allocation at
December 31, 2018
by asset category is
100 percent
fixed income investments.
Our U.S. qualified pension plan reached fully funded status during 2018. The primary investment strategy is a liability hedging approach with an objective of maintaining the funded status of the plan such that the funded status volatility is minimized and the
89
likelihood that we will be required to make significant contributions to the plan is limited. The portfolio is comprised of
100 percent
fixed income securities and cash. Investment performance and related risks are measured and monitored on an ongoing basis through monthly liability measurements, periodic asset liability studies, and quarterly investment portfolio reviews.
The following tables present our fair value hierarchy for our major categories of pension plan assets by asset class. See Note 18 for the definition of fair value and the descriptions of Level 1, 2 and 3 in the fair value hierarchy.
|
(in Millions)
|
12/31/2018
|
Quoted Prices
in Active
Markets for
Identical
Assets
(Level 1)
|
Significant
Other
Observable
Inputs
(Level 2)
|
Significant
Unobservable
Inputs
(Level 3)
|
|||||||||||
|
Cash and short-term investments
|
$
|
92.5
|
|
$
|
92.5
|
|
$
|
—
|
|
$
|
—
|
|
|||
|
Fixed income investments:
|
|||||||||||||||
|
Investment contracts
|
144.9
|
|
—
|
|
144.9
|
|
—
|
|
|||||||
|
U.S. Government Securities
|
469.9
|
|
465.1
|
|
4.8
|
|
—
|
|
|||||||
|
Mutual funds
|
55.7
|
|
55.7
|
|
|
|
—
|
|
|||||||
|
Corporate debt instruments
|
506.7
|
|
—
|
|
506.7
|
|
—
|
|
|||||||
|
Total assets
|
$
|
1,269.7
|
|
$
|
613.3
|
|
$
|
656.4
|
|
$
|
—
|
|
|||
|
(in Millions)
|
12/31/2017
|
Quoted Prices
in Active Markets for Identical Assets (Level 1) |
Significant
Other Observable Inputs (Level 2) |
Significant
Unobservable Inputs (Level 3) |
|||||||||||
|
Cash and short-term investments
|
$
|
123.0
|
|
$
|
123.0
|
|
$
|
—
|
|
$
|
—
|
|
|||
|
Equity securities:
|
|||||||||||||||
|
Common stock
|
194.1
|
|
194.1
|
|
—
|
|
—
|
|
|||||||
|
Mutual funds and other investments
|
27.3
|
|
27.3
|
|
—
|
|
—
|
|
|||||||
|
Fixed income investments:
|
|||||||||||||||
|
Investment contracts
|
150.8
|
|
—
|
|
150.8
|
|
—
|
|
|||||||
|
U.S. Government Securities and Mutual funds
|
805.6
|
|
805.6
|
|
—
|
|
—
|
|
|||||||
|
Investments measured at net asset value
(1)
|
39.1
|
|
|||||||||||||
|
Total assets
|
$
|
1,339.9
|
|
$
|
1,150.0
|
|
$
|
150.8
|
|
$
|
—
|
|
|||
____________________
|
(1)
|
Certain investments that are measured at fair value using the net asset value per share (or its equivalent) practical expedient have not been categorized in the fair value hierarchy. The fair value amounts presented in this table are intended to permit reconciliation of the fair value hierarchy to the amounts presented in the statement of financial position. These investments are redeemable with the fund at net asset value under the original terms of the partnership agreements and/or subscription agreements and operations of the underlying funds. However, it is possible that these redemption rights may be restricted or eliminated by the funds in the future in accordance with the underlying fund agreements. Due to the nature of the investments held by the funds, changes in market conditions and the economic environment may significantly impact the net asset value of the funds and, consequently, the fair value of the interests in the funds. Furthermore, changes to the liquidity provisions of the funds may significantly impact the fair value of the interest in the funds.
|
We made the following contributions to our pension and other postretirement benefit plans:
|
|
Year Ended December 31,
|
||||||
|
(in Millions)
|
2018
|
2017
|
|||||
|
U.S. qualified pension plan
|
$
|
30.0
|
|
$
|
44.0
|
|
|
|
U.S. nonqualified pension plan
|
6.0
|
|
9.4
|
|
|||
|
Non-U.S. plans
|
—
|
|
1.1
|
|
|||
|
Other postretirement benefits, net of participant contributions
|
1.5
|
|
2.0
|
|
|||
|
Total
|
$
|
37.5
|
|
$
|
56.5
|
|
|
90
In 2016, we made a
$21 million
payment into our U.K. pension plan in order to annuitize our remaining pension obligation. This action removed all future funding requirements for this plan. The assets of approximately
$45 million
supporting the remaining pension obligation were moved into an annuity at December 31, 2016 which qualified as a Level 3 investment in the fair value hierarchy. In October 2017, we completed the buy-out of the annuity, completing the plan termination and relieving us of the pension liability for the U.K. pension plan. The termination resulted in a settlement charge of
$32.5 million
.
We expect our voluntary cash contributions to our U.S. qualified pension plan to be approximately
$7 million
in
2019
.
The following table reflects the estimated future benefit payments for our pension and other postretirement benefit plans. These estimates take into consideration expected future service, as appropriate:
|
Estimated Net Future Benefit Payments
|
||||||||||||||||||
|
(in Millions)
|
2019
|
2020
|
2021
|
2022
|
2023
|
2024 - 2028
|
||||||||||||
|
Pension Benefits
|
$
|
90.1
|
|
$
|
86.5
|
|
$
|
87.0
|
|
$
|
86.5
|
|
$
|
85.6
|
|
$
|
415.8
|
|
|
Other Benefits
|
2.1
|
|
2.0
|
|
1.9
|
|
1.8
|
|
1.7
|
|
7.0
|
|
||||||
Assumed health care cost trend rates have an effect on the other postretirement benefit obligations and net periodic other postretirement benefit costs reported for the health care portion of the other postretirement plan. A one-percentage point change in the assumed health care cost trend rates would be immaterial to our net periodic other postretirement benefit costs for the year ended
December 31, 2018
, and our other postretirement benefit obligation at
December 31, 2018
.
FMC Corporation Savings and Investment Plan
. The FMC Corporation Savings and Investment Plan is a qualified salary-reduction plan under Section 401(k) of the Internal Revenue Code in which substantially all of our U.S. employees may participate by contributing a portion of their compensation. For eligible employees participating in the Plan, except for those employees covered by certain collective bargaining agreements, the Company makes matching contributions of
80 percent
of the portion of those contributions up to
five percent
of the employee’s compensation. Eligible employees participating in the Plan that do not participate in the U.S. qualified pension plan are entitled to receive an employer contribution of
five percent
of the employee’s eligible compensation. Charges against income for all contributions were
$15.2 million
in
2018
,
$9.7 million
in
2017
, and
$7.7 million
in
2016
.
Note 15: Share-based Compensation
Stock Compensation Plans
We have a share-based compensation plan, which has been approved by the stockholders, for certain employees, officers and directors. This plan is described later below.
Impacts of Livent Distribution
Pursuant to the employee matters agreement, effective as of the Distribution date, outstanding FMC equity awards held by a Livent employee will be converted into a Livent equity award. The number of Livent shares subject to each converted award (and in the case of stock options, the exercise price of the award) will be adjusted in a manner intended to preserve the aggregate intrinsic value of the original FMC equity awards as measured before and after the Distribution, subject to rounding. Each converted Livent equity award will remain subject to the same terms and conditions, including vesting and payment schedules, as were applicable immediately prior to the Distribution except that the converted Livent equity awards held by Livent employees will not be subject to any performance-based vesting conditions.
Each outstanding award of FMC RSUs and PRSUs granted prior to 2019 held by FMC employees will be converted into adjusted FMC RSUs and PRSUs and Livent RSUs and PRSUs, respectively, using the final distribution ratio of
0.935301
, which was determined as of the record date of February 25, 2018. Each outstanding awards of FMC RSUs granted in 2019 held by FMC employees will be converted into adjusted FMC RSUs, based on the relative value of FMC shares before and after the Distribution. Each outstanding award of FMC stock options, whether vested or unvested, held by a FMC employee will be converted into adjusted FMC stock options, based on the relative value of FMC shares before and after the Distribution. The above described adjustments are intended to preserve the aggregate intrinsic value of the original FMC awards as measured before and after the Distribution, subject to rounding. Each such adjusted FMC equity award will remain subject to the same terms and conditions, including vesting and payment schedules, as were applicable immediately prior to the Distribution.
FMC Corporation Incentive Compensation and Stock Plan
91
The FMC Corporation Incentive Compensation and Stock Plan (the “Plan”) provides for the grant of a variety of cash and equity awards to officers, directors, employees and consultants, including stock options, restricted stock, performance units (including restricted stock units), stock appreciation rights, and multi-year management incentive awards payable partly in cash and partly in common stock. The Compensation and Organization Committee of the Board of Directors (the “Committee”), subject to the provisions of the Plan, approves financial targets, award grants, and the times and conditions for payment of awards to employees. The total number of shares of common stock authorized for issuance under the Plan is
30.2 million
of which approximately
4.9 million
shares of common stock are available for future grants of share based awards under the Plan as of
December 31, 2018
. The FMC Corporation Non-Employee Directors’ Compensation Policy, administered by the Nominating and Corporate Governance Committee of the Board of Directors, sets forth the compensation to be paid to the directors, including stock options, stock appreciation rights, restricted stock, restricted stock units, performance-based restricted stock units, and cash awards to be made to directors under the Plan.
Stock options granted under the Plan may be incentive or nonqualified stock options. The exercise price for stock options may not be less than the fair market value of the stock at the date of grant. Awards granted under the Plan vest or become exercisable or payable at the time designated by the Committee, which has generally been
three
years from the date of grant. Incentive and nonqualified options granted under the Plan expire not later than
10 years
from the grant date.
Under the Plan, awards of restricted stock and restricted stock units may be made to selected employees. The awards vest over periods designated by the Committee, which has generally been
three
years, with vesting conditional upon continued employment. Compensation cost is recognized over the vesting periods based on the market value of the stock on the date of the award. Restricted stock units granted to directors under the Plan vest immediately if granted as part of, or in lieu of, the annual retainer; other restricted stock units granted to directors vest at the Annual Meeting of Shareholders in the calendar year following the May 1 annual grant date (but are subject to forfeiture on a pro rata basis if the director does not serve the full year except under certain circumstances).
At
December 31, 2018
and
2017
, there were restricted stock units representing an aggregate of
248,465
shares and
228,366
shares of common stock, respectively, credited to the directors’ accounts.
Livent Corporation Incentive Compensation and Stock Plan
Effective October 11, 2018, Livent registered shares of its common stock for issuance pursuant to awards under the Livent Corporation Incentive Compensation and Stock Plan (the "Livent Plan"). The Livent Plan provides for the grant of a variety of cash and equity awards to officers, directors, employees and consultants, including stock options, restricted stock, restricted stock units (including performance units), stock appreciation rights, and management incentive awards to Livent employees. The Compensation and Organization Committee of the Livent Board of Directors has the authority to amend the Livent Plan at any time, approve financial targets, award grants, establish performance objectives and conditions and the times and conditions for payment of awards. In connection with its IPO, Livent granted certain of their employees, directors and executives equity awards pursuant to the Livent Plan.
Stock Compensation
We recognized the following stock compensation expense:
|
Year Ended December 31,
|
|||||||||||
|
(in Millions)
|
2018
|
2017
|
2016
|
||||||||
|
Stock option expense, net of taxes of $1.3, $2.4 and $2.6
(1)
|
$
|
4.9
|
|
$
|
4.5
|
|
$
|
4.4
|
|
||
|
Restricted stock expense, net of taxes of $2.3, $3.5 and $3.8
(2)
|
8.4
|
|
6.4
|
|
6.5
|
|
|||||
|
Performance based expense, net of taxes of $1.2, $1.5 and $1.1
|
4.4
|
|
2.8
|
|
1.8
|
|
|||||
|
Livent Plan stock expense, net of taxes of $0.1, zero and zero
|
0.4
|
|
—
|
|
—
|
|
|||||
|
Total stock compensation expense, net of taxes of $4.9, $7.4 and $7.5
(3)
|
$
|
18.1
|
|
$
|
13.7
|
|
$
|
12.7
|
|
||
____________________
|
(1)
|
We applied an estimated forfeiture rate of
4.0%
per stock option grant in the calculation of the expense.
|
|
(2)
|
We applied an estimated forfeiture rate of
2.0%
of outstanding grants in the calculation of the expense.
|
|
(3)
|
This expense is classified as "Selling, general and administrative expenses" in our consolidated statements of income (loss). Total stock compensation expense, net of tax, not included in the above table of
$3.6 million
,
$4.4 million
, and
zero
for the years ended
|
92
December 31, 2018
,
2017
and
2016
, respectively, is included in "Discontinued operations, net of income taxes" in the consolidated statements of income (loss).
We received
$10.7 million
,
$22.5 million
and
$4.1 million
in cash related to stock option exercises for the years ended
December 31, 2018
,
2017
and
2016
, respectively. The shares used for the exercise of stock options occurring during the years ended
December 31, 2018
,
2017
and
2016
came from treasury shares.
For tax purposes, share-based compensation expense is deductible in the year of exercise or vesting based on the intrinsic value of the award on the date of exercise or vesting. For financial reporting purposes, share-based compensation expense is based upon grant-date fair value and amortized over the vesting period. Excess tax benefits represent the difference between the share-based compensation expense for financial reporting purposes and the deduction taken for tax purposes. The excess tax expense recorded in stockholders' equity for the year ended December 31, 2016 totaled
$0.4 million
. Beginning in 2017, these excess tax benefits were recorded directly to income tax expense which totaled
$3.8 million
and
$2.9 million
in 2018 and 2017, respectively.
Stock Options
The grant-date fair values of the stock options we granted in the years ended
December 31, 2018
,
2017
and
2016
were estimated using the Black-Scholes option valuation model, the key assumptions for which are listed in the table below. The expected volatility assumption is based on the actual historical experience of our common stock. The expected life represents the period of time that options granted are expected to be outstanding. The risk-free interest rate is based on U.S. Treasury securities with terms equal to the expected timing of stock option exercises as of the grant date. The dividend yield assumption reflects anticipated dividends on our common stock. Employee stock options generally vest after a
three
year period and expire
ten years
from the date of grant.
Black Scholes valuation assumptions for stock option grants:
|
2018
|
2017
|
2016
|
|||
|
Expected dividend yield
|
0.77%
|
1.15%
|
1.77%
|
||
|
Expected volatility
|
26.85%
|
27.04%
|
26.57%
|
||
|
Expected life (in years)
|
6.5
|
6.5
|
6.5
|
||
|
Risk-free interest rate
|
2.79%
|
2.10%
|
1.39%
|
||
The weighted-average grant-date fair value of options granted during the years ended
December 31, 2018
,
2017
and
2016
was
$25.70
,
$15.66
and
$8.54
per share, respectively.
The following summary shows stock option activity for employees under the Plan for the three years ended
December 31, 2018
:
93
|
(Shares in Thousands)
|
Number of Options Granted But Not Exercised
|
Weighted-Average Remaining Contractual Life
|
Weighted-Average Exercise Price Per Share
|
Aggregate Intrinsic Value (in Millions)
|
||||||||
|
December 31, 2015 (1,200 shares exercisable and 832 shares expected to vest or be exercised)
|
2,071
|
|
5.6 years
|
$
|
47.52
|
|
$
|
8.7
|
|
|||
|
Granted
|
933
|
|
37.39
|
|
||||||||
|
Exercised
|
(171
|
)
|
25.59
|
|
3.5
|
|
||||||
|
Forfeited
|
(84
|
)
|
51.17
|
|
||||||||
|
December 31, 2016 (1,292 shares exercisable and 1,373 shares expected to vest or be exercised)
|
2,749
|
|
6.1 years
|
$
|
45.34
|
|
$
|
37.6
|
|
|||
|
Granted
|
370
|
|
57.63
|
|
||||||||
|
Exercised
|
(590
|
)
|
39.93
|
|
20.1
|
|
||||||
|
Forfeited
|
(94
|
)
|
49.10
|
|
||||||||
|
December 31, 2017 (920 shares exercisable and 1,452 shares expected to vest or be exercised)
|
2,435
|
|
6.3 years
|
$
|
48.37
|
|
$
|
112.7
|
|
|||
|
Granted
|
250
|
|
85.19
|
|
||||||||
|
Exercised
|
(260
|
)
|
41.80
|
|
11.7
|
|
||||||
|
Forfeited
|
(61
|
)
|
52.51
|
|
||||||||
|
December 31, 2018 (1,044 shares exercisable and 1,287 shares expected to vest or be exercised)
|
2,364
|
|
6.0 years
|
$
|
52.87
|
|
$
|
52.5
|
|
|||
The number of stock options indicated in the above table as being exercisable as of
December 31, 2018
, had an intrinsic value of
$19.4 million
, a weighted-average remaining contractual term of
4.0 years
, and a weighted-average exercise price of
$55.43
.
As of
December 31, 2018
, we had total remaining unrecognized compensation cost related to unvested stock options of
$5.4 million
which will be amortized over the weighted-average remaining requisite service period of approximately
1.56 years
.
Restricted and Performance Based Equity Awards
The grant-date fair value of restricted stock awards and stock units under the Plan is based on the market price per share of our common stock on the date of grant, and the related compensation cost is amortized to expense on a straight-line basis over the vesting period during which the employees perform related services, which is typically
three years
except for those eligible for retirement prior to the stated vesting period as well as non-employee directors.
Starting in 2015, we began granting performance based restricted stock awards. The performance based share awards represent a number of shares of common stock to be awarded upon settlement based on the achievement of certain market-based performance criteria over a
three
year period. These awards generally vest upon the completion of a
three
year period from the date of grant; however, starting with the 2016 grants, certain performance criteria is measured on an annual basis. The fair value of the equity classified performance-based share awards is determined based on the number of shares of common stock to be awarded and a Monte Carlo valuation model.
94
The following table shows our employee restricted award activity for the three years ended
December 31, 2018
:
|
Restricted Equity
|
Performance Based Equity
|
||||||||||||
|
(Number of Awards in Thousands)
|
Number of
awards
|
Weighted-Average Grant Date Fair Value Per Share
|
Number of
awards |
Weighted-Average Grant Date Fair Value Per Share
|
|||||||||
|
Nonvested at December 31, 2015
|
376
|
|
$
|
57.36
|
|
32
|
|
$
|
81.06
|
|
|||
|
Granted
|
271
|
|
37.44
|
|
126
|
|
41.66
|
|
|||||
|
Vested
|
(120
|
)
|
56.12
|
|
—
|
|
—
|
|
|||||
|
Forfeited
|
(31
|
)
|
52.67
|
|
—
|
|
—
|
|
|||||
|
Nonvested at December 31, 2016
|
496
|
|
$
|
48.56
|
|
158
|
|
$
|
49.55
|
|
|||
|
Granted
|
121
|
|
57.66
|
|
105
|
|
66.93
|
|
|||||
|
Vested
|
(98
|
)
|
64.75
|
|
—
|
|
—
|
|
|||||
|
Forfeited
|
(30
|
)
|
47.60
|
|
(3
|
)
|
52.74
|
|
|||||
|
Nonvested at December 31, 2017
|
489
|
|
$
|
47.63
|
|
260
|
|
$
|
53.36
|
|
|||
|
Granted
|
137
|
|
84.94
|
|
133
|
|
88.65
|
|
|||||
|
Vested
|
(154
|
)
|
55.14
|
|
(58
|
)
|
81.15
|
|
|||||
|
Forfeited
|
(13
|
)
|
65.39
|
|
—
|
|
—
|
|
|||||
|
Nonvested at December 31, 2018
|
459
|
|
$
|
55.75
|
|
335
|
|
$
|
56.42
|
|
|||
As of
December 31, 2018
, we had total remaining unrecognized compensation cost related to unvested restricted awards of
$14.0 million
which will be amortized over the weighted-average remaining requisite service period of approximately
1.65 years
.
Note 16: Equity
The following is a summary of our capital stock activity over the past three years:
|
Common
Stock Shares
|
Treasury
Stock Shares
|
||||
|
December 31, 2015
|
185,983,792
|
|
52,328,015
|
|
|
|
Stock options and awards
|
—
|
|
(244,329
|
)
|
|
|
Repurchases of common stock, net
|
—
|
|
210,000
|
|
|
|
December 31, 2016
|
185,983,792
|
|
52,293,686
|
|
|
|
Stock options and awards
|
—
|
|
(640,450
|
)
|
|
|
December 31, 2017
|
185,983,792
|
|
51,653,236
|
|
|
|
Stock options and awards
|
—
|
|
(390,553
|
)
|
|
|
Repurchases of common stock, net
|
—
|
|
2,439,495
|
|
|
|
December 31, 2018
|
185,983,792
|
|
53,702,178
|
|
|
95
Accumulated other comprehensive income (loss)
Summarized below is the roll forward of accumulated other comprehensive income (loss), net of tax.
|
(in Millions)
|
Foreign currency adjustments
|
Derivative Instruments
(1)
|
Pension and other postretirement benefits
(2)
|
Total
|
|||||||||||
|
Accumulated other comprehensive income (loss), net of tax at December 31, 2015
|
$
|
(147.3
|
)
|
$
|
(6.2
|
)
|
$
|
(303.8
|
)
|
$
|
(457.3
|
)
|
|||
|
2016 Activity
|
|||||||||||||||
|
Other comprehensive income (loss) before reclassifications
|
$
|
(46.7
|
)
|
$
|
7.3
|
|
$
|
(26.9
|
)
|
$
|
(66.3
|
)
|
|||
|
Amounts reclassified from accumulated other comprehensive income (loss)
|
—
|
|
6.0
|
|
39.2
|
|
45.2
|
|
|||||||
|
Accumulated other comprehensive income (loss), net of tax at December 31, 2016
|
$
|
(194.0
|
)
|
$
|
7.1
|
|
$
|
(291.5
|
)
|
$
|
(478.4
|
)
|
|||
|
2017 Activity
|
|||||||||||||||
|
Other comprehensive income (loss) before reclassifications
|
$
|
173.9
|
|
$
|
(1.2
|
)
|
$
|
0.6
|
|
$
|
173.3
|
|
|||
|
Amounts reclassified from accumulated other comprehensive income (loss)
|
13.9
|
|
(0.7
|
)
|
51.6
|
|
64.8
|
|
|||||||
|
Accumulated other comprehensive income (loss), net of tax at December 31, 2017
|
$
|
(6.2
|
)
|
$
|
5.2
|
|
$
|
(239.3
|
)
|
$
|
(240.3
|
)
|
|||
|
2018 Activity
|
|||||||||||||||
|
Other comprehensive income (loss) before reclassifications
|
$
|
(95.3
|
)
|
$
|
13.7
|
|
$
|
4.2
|
|
$
|
(77.4
|
)
|
|||
|
Amounts reclassified from accumulated other comprehensive income (loss)
|
—
|
|
(7.7
|
)
|
16.5
|
|
8.8
|
|
|||||||
|
Accumulated other comprehensive income (loss), net of tax at December 31, 2018
|
$
|
(101.5
|
)
|
$
|
11.2
|
|
$
|
(218.6
|
)
|
$
|
(308.9
|
)
|
|||
____________________
|
(1)
|
See Note 18 for more information.
|
|
(2)
|
See Note 14 for more information.
|
96
Reclassifications of accumulated other comprehensive income (loss)
The table below provides details about the reclassifications from accumulated other comprehensive income (loss) and the affected line items in the consolidated statements of income (loss) for each of the periods presented.
|
Details about Accumulated Other Comprehensive Income Components
|
Amounts Reclassified from Accumulated Other Comprehensive Income (Loss)
(1)
|
Affected Line Item in the Consolidated Statements of Income (Loss)
|
||||||||||||
|
Year Ended December 31,
|
||||||||||||||
|
(in Millions)
|
2018
|
2017
|
2016
|
|||||||||||
|
Foreign currency translation adjustments:
|
||||||||||||||
|
Divestiture of FMC Health and Nutrition
(2)
|
$
|
—
|
|
$
|
(13.9
|
)
|
$
|
—
|
|
Discontinued operations, net of income taxes
|
||||
|
Derivative instruments:
|
||||||||||||||
|
Foreign currency contracts
|
$
|
18.9
|
|
$
|
(10.0
|
)
|
$
|
(11.2
|
)
|
Costs of sales and services
|
||||
|
Energy contracts
|
—
|
|
0.8
|
|
(2.3
|
)
|
Costs of sales and services
|
|||||||
|
Foreign currency contracts
|
(8.0
|
)
|
10.0
|
|
4.2
|
|
Selling, general and administrative expenses
|
|||||||
|
Other contracts
|
(0.4
|
)
|
—
|
|
—
|
|
Interest expense, net
|
|||||||
|
Total before tax
|
$
|
10.5
|
|
$
|
0.8
|
|
(9.3
|
)
|
||||||
|
(2.8
|
)
|
(0.1
|
)
|
3.3
|
|
Provision for income taxes
|
||||||||
|
Amount included in net income
|
$
|
7.7
|
|
$
|
0.7
|
|
(6.0
|
)
|
||||||
|
Pension and other postretirement benefits
(3)
:
|
||||||||||||||
|
Amortization of prior service costs
|
$
|
(0.3
|
)
|
$
|
(0.5
|
)
|
$
|
(0.8
|
)
|
Selling, general and administrative expenses
|
||||
|
Amortization of unrecognized net actuarial and other gains (losses)
|
(14.4
|
)
|
(14.4
|
)
|
(38.4
|
)
|
Selling, general and administrative expenses
|
|||||||
|
Recognized loss due to settlement/curtailment
|
(6.1
|
)
|
(51.2
|
)
|
(20.6
|
)
|
Selling, general and administrative expenses; Discontinued operations, net of income taxes
(4)
|
|||||||
|
Total before tax
|
$
|
(20.8
|
)
|
$
|
(66.1
|
)
|
$
|
(59.8
|
)
|
|||||
|
4.3
|
|
14.5
|
|
20.6
|
|
Provision for income taxes
|
||||||||
|
Amount included in net income
|
$
|
(16.5
|
)
|
$
|
(51.6
|
)
|
$
|
(39.2
|
)
|
|||||
|
Total reclassifications for the period
|
$
|
(8.8
|
)
|
$
|
(64.8
|
)
|
$
|
(45.2
|
)
|
Amount included in net income
|
||||
____________________
|
(1)
|
Amounts in parentheses indicate charges to the consolidated statements of income (loss).
|
|
(2)
|
The reclassification of historical cumulative translation adjustments was the result of the sale of our FMC Health and Nutrition and Omega-3 business. The loss recognized from this reclassification is considered permanent for tax purposes and therefore no tax has been provided. See Note 10 within these consolidated financial statements for more information. In accordance with accounting guidance, this amount was previously factored into the lower of cost or fair value test associated with the Omega-3 asset held for sale write-down charges.
|
|
(3)
|
Pension and other postretirement benefits amounts include the impact from both continuing and discontinued operations. For detail on the continuing operations components of pension and other postretirement benefits, see Note 14.
|
|
(4)
|
The loss due to curtailment for the
twelve
months ended
December 31, 2017
related to the disposal of FMC Health and Nutrition was recorded to "Discontinued operations, net of income taxes" on the condensed consolidated statements of income (loss).
|
Transactions with Noncontrolling Interest
As a result of the IPO and underwriters' exercise to purchase additional shares of common stock in the fourth quarter of 2018, our controlling interest in FMC Lithium is approximately
84
percent. See Note 1 for further information regarding the IPO.
As part of the DuPont Crop Protection Business Acquisition, we acquired an
80 percent
controlling interest in DuPont Agricultural Chemicals Limited, Shanghai, a joint venture registered in the People's Republic of China.
During the first quarter of 2017, we terminated our interest in a variable interest entity. See Note 8 for more information.
97
During the third quarter 2016, we terminated a joint venture in Argentina for which we had a controlling interest. See Note 8 for more information. During the fourth quarter 2016, we also acquired the remaining noncontrolling interest in a joint venture in China.
Dividends and Share Repurchases
On
January 17, 2019
, we paid dividends totaling
$53.2 million
to our shareholders of record as of
December 31, 2018
. This amount is included in “Accrued and other liabilities” on the consolidated balance sheets as of
December 31, 2018
. For the years ended
December 31, 2018
,
2017
and
2016
, we paid
$89.2 million
,
$88.8 million
and
$88.6 million
in dividends, respectively.
On December 3, 2018, our Board authorized the repurchase of up to
$1 billion
of our common shares. This repurchase program does not include a specific timetable or price targets and may be suspended or terminated at any time. Shares may be repurchased through open market or privately negotiated transactions at the discretion of management based on its evaluation of market conditions and other factors.
On November 5, 2018, we announced a plan to repurchase
$200 million
in shares by the end of 2018 under our previous share repurchase authorization that was approved in 2013. We completed the announced repurchase in its entirety and the remaining authority expired at the completion of the
$200 million
repurchase. In
2018
,
2.4 million
shares were repurchased under the publicly announced repurchase program. At
December 31, 2018
,
$1.0 billion
remained unused under our Board-authorized repurchase program. This repurchase program does not include a specific timetable or price targets and may be suspended or terminated at any time. Shares may be purchased through open market or privately negotiated transactions at the discretion of management based on its evaluation of market conditions and other factors. We also reacquire shares from time to time from employees in connection with the vesting, exercise and forfeiture of awards under our equity compensation plans.
Note 17: Earnings Per Share
Earnings per common share ("EPS") is computed by dividing net income by the weighted average number of common shares outstanding during the period on a basic and diluted basis.
Our potentially dilutive securities include potential common shares related to our stock options, restricted stock and restricted stock units. Diluted earnings per share (“Diluted EPS”) considers the impact of potentially dilutive securities except in periods in which there is a loss because the inclusion of the potential common shares would have an antidilutive effect. Diluted EPS excludes the impact of potential common shares related to our stock options in periods in which the option exercise price is greater than the average market price of our common stock for the period. For the year ended December 31, 2018, there were
0.2 million
potential common shares excluded from Diluted EPS. For the year ended December 31, 2017, we had a net loss from continuing operations attributable to FMC stockholders. As a result, all
1.5 million
potential common shares were excluded from Diluted EPS. For the year ended
December 31, 2016
, there were
0.6 million
potential common shares excluded from Diluted EPS.
Our non-vested restricted stock awards contain rights to receive non-forfeitable dividends, and thus, are participating securities requiring the two-class method of computing EPS. The two-class method determines EPS by dividing the sum of distributed earnings to common stockholders and undistributed earnings allocated to common stockholders by the weighted average number of shares of common stock outstanding for the period. In calculating the two-class method, undistributed earnings are allocated to both common shares and participating securities based on the weighted average shares outstanding during the period.
98
Earnings applicable to common stock and common stock shares used in the calculation of basic and diluted earnings per share are as follows:
|
(in Millions, Except Share and Per Share Data)
|
Year Ended December 31,
|
||||||||||
|
2018
|
2017
|
2016
|
|||||||||
|
Earnings (loss) attributable to FMC stockholders:
|
|||||||||||
|
Continuing operations, net of income taxes
|
$
|
645.5
|
|
$
|
(85.9
|
)
|
$
|
128.4
|
|
||
|
Discontinued operations, net of income taxes
|
(143.4
|
)
|
621.7
|
|
80.7
|
|
|||||
|
Net income (loss) attributable to FMC stockholders
|
$
|
502.1
|
|
$
|
535.8
|
|
$
|
209.1
|
|
||
|
Less: Distributed and undistributed earnings allocable to restricted award holders
|
(2.9
|
)
|
—
|
|
(0.4
|
)
|
|||||
|
Net income (loss) allocable to common stockholders
|
$
|
499.2
|
|
$
|
535.8
|
|
$
|
208.7
|
|
||
|
Basic earnings (loss) per common share attributable to FMC stockholders:
|
|||||||||||
|
Continuing operations
|
$
|
4.78
|
|
$
|
(0.64
|
)
|
$
|
0.96
|
|
||
|
Discontinued operations
|
(1.06
|
)
|
4.63
|
|
0.60
|
|
|||||
|
Net income (loss)
|
$
|
3.72
|
|
$
|
3.99
|
|
$
|
1.56
|
|
||
|
Diluted earnings (loss) per common share attributable to FMC stockholders:
|
|||||||||||
|
Continuing operations
|
$
|
4.75
|
|
$
|
(0.64
|
)
|
$
|
0.96
|
|
||
|
Discontinued operations
|
(1.06
|
)
|
4.63
|
|
0.60
|
|
|||||
|
Net income (loss)
|
$
|
3.69
|
|
$
|
3.99
|
|
$
|
1.56
|
|
||
|
Shares (in thousands):
|
|||||||||||
|
Weighted average number of shares of common stock outstanding - Basic
|
134,406
|
|
134,255
|
|
133,890
|
|
|||||
|
Weighted average additional shares assuming conversion of potential common shares
|
1,473
|
|
—
|
|
648
|
|
|||||
|
Shares – diluted basis
|
135,879
|
|
134,255
|
|
134,538
|
|
|||||
Note 18: Financial Instruments, Risk Management and Fair Value Measurements
Our financial instruments include cash and cash equivalents, trade receivables, other current assets, certain receivables classified as other long-term assets, accounts payable, and amounts included in investments and accruals meeting the definition of financial instruments. The carrying value of these financial instruments approximates their fair value. Our other financial instruments include the following:
|
Financial Instrument
|
Valuation Method
|
|
|
Foreign exchange forward contracts
|
Estimated amounts that would be received or paid to terminate the contracts at the reporting date based on current market prices for applicable currencies.
|
|
|
Commodity forward and option contracts
|
Estimated amounts that would be received or paid to terminate the contracts at the reporting date based on quoted market prices for applicable commodities.
|
|
|
Debt
|
Our estimates and information obtained from independent third parties using market data, such as bid/ask spreads for the last business day of the reporting period.
|
|
The estimated fair value of the financial instruments in the above table have been determined using standard pricing models which take into account the present value of expected future cash flows discounted to the balance sheet date. These standard pricing models utilize inputs derived from, or corroborated by, observable market data such as interest rate yield curves and currency and commodity spot and forward rates. In addition, we test a subset of our valuations against valuations received from the transaction's counterparty to validate the accuracy of our standard pricing models. Accordingly, the estimates presented may not be indicative of the amounts that we would realize in a market exchange at settlement date and do not represent potential gains or losses on these agreements. The estimated fair values of foreign exchange forward contracts and commodity forward and option contracts are included in the tables within this Note. The estimated fair value of debt is
$2,749.2 million
and
$3,250.6 million
and the carrying amount is
$2,726.7 million
and
$3,185.6 million
as of
December 31, 2018
and
December 31, 2017
, respectively.
99
We enter into various financial instruments with off-balance-sheet risk as part of the normal course of business. These off-balance sheet instruments include financial guarantees and contractual commitments to extend financial guarantees under letters of credit, and other assistance to customers. See Note 19 for more information. Decisions to extend financial guarantees to customers, and the amount of collateral required under these guarantees is based on our evaluation of creditworthiness on a case-by-case basis.
Use of Derivative Financial Instruments to Manage Risk
We mitigate certain financial exposures, including currency risk, commodity purchase exposures and interest rate risk through a program of risk management that includes the use of derivative financial instruments. We enter into foreign exchange contracts, including forward and purchased option contracts, to reduce the effects of fluctuating foreign currency exchange rates.
We formally document all relationships between hedging instruments and hedged items, as well as the risk management objective and strategy for undertaking various hedge transactions. This process includes relating derivatives that are designated as fair value or cash flow hedges to specific assets and liabilities on the balance sheet or to specific firm commitments or forecasted transactions. We also assess both at the inception of the hedge and on an ongoing basis, whether each derivative is highly effective in offsetting changes in fair values or cash flows of the hedged item. If we determine that a derivative is not highly effective as a hedge, or if a derivative ceases to be a highly effective hedge, we discontinue hedge accounting with respect to that derivative prospectively.
Foreign Currency Exchange Risk Management
We conduct business in many foreign countries, exposing earnings, cash flows, and our financial position to foreign currency risks. The majority of these risks arise as a result of foreign currency transactions. Our policy is to minimize exposure to adverse changes in currency exchange rates. This is accomplished through a controlled program of risk management that includes the use of foreign currency debt and forward foreign exchange contracts. We also use forward foreign exchange contracts to hedge firm and highly anticipated foreign currency cash flows, with an objective of balancing currency risk to provide adequate protection from significant fluctuations in the currency markets.
The primary currencies for which we have exchange rate exposure are the U.S. dollar versus the Brazilian Real, the Euro, the Chinese yuan, the Mexican peso and the Argentine peso.
Commodity Price Risk
We are exposed to risks in energy costs due to fluctuations in energy prices, particularly natural gas. We attempt to mitigate our exposure to increasing energy costs by hedging the cost of future deliveries of natural gas.
Interest Rate Risk
We use various strategies to manage our interest rate exposure, including entering into interest rate swap agreements to achieve a targeted mix of fixed and variable-rate debt. In the agreements we exchange, at specified intervals, the difference between fixed and variable-interest amounts calculated on an agreed-upon notional principal amount.
Concentration of Credit Risk
Our counterparties to derivative contracts are primarily major financial institutions. We limit the dollar amount of contracts entered into with any one financial institution and monitor counterparties’ credit ratings. We also enter into master netting agreements with each financial institution, where possible, which helps mitigate the credit risk associated with our financial instruments. While we may be exposed to credit losses due to the nonperformance of counterparties, we consider this risk remote.
Financial Guarantees and Letter-of-Credit Commitments
We enter into various financial instruments with off-balance-sheet risk as part of the normal course of business. These off-balance-sheet instruments include financial guarantees and contractual commitments to extend financial guarantees under letters of credit and other assistance to customers. See Notes 1 and 19 for more information. Decisions to extend financial guarantees to customers, and the amount of collateral required under these guarantees, is based on our evaluation of creditworthiness on a case-by-case basis.
100
Accounting for Derivative Instruments and Hedging Activities
Cash Flow Hedges
We recognize all derivatives on the balance sheet at fair value. On the date we enter into the derivative instrument, we generally designate the derivative as a hedge of the variability of cash flows to be received or paid related to a forecasted transaction (cash flow hedge). We record in AOCI changes in the fair value of derivatives that are designated as, and meet all the required criteria for, a cash flow hedge. We then reclassify these amounts into earnings as the underlying hedged item affects earnings. In contrast we immediately record in earnings changes in the fair value of derivatives that are not designated as cash flow hedges.
As of
December 31, 2018
, we had open foreign currency forward contracts in AOCI in a net after-tax gain position of
$10.4 million
designated as cash flow hedges of underlying forecasted sales and purchases. Current open contracts hedge forecasted transactions until
December 31, 2019
. At
December 31, 2018
, we had open forward contracts with various expiration dates to buy, sell or exchange foreign currencies with a U.S. dollar equivalent of approximately
$1,331.6 million
.
As of
December 31, 2018
, we had open interest rate contracts in AOCI in a net after tax
loss
position of
$0.2 million
designated as cash flow hedges of underlying floating rate interest payments on a portion of our variable-rate debt. At
December 31, 2018
we had interest rate swap contracts outstanding with a total aggregate notional value of
$200.0 million
.
As of
December 31, 2018
, we had no open commodity contracts in AOCI designated as cash flow hedges of underlying forecasted purchases. At
December 31, 2018
, we had
no
mmBTUs (millions of British Thermal Units) in aggregate notional volume of outstanding natural gas commodity forward contracts.
Approximately
$10.2 million
of net after-tax gains, representing open foreign currency exchange contracts, interest rate contracts, and commodity contracts, will be realized in earnings during the twelve months ending
December 31, 2019
if spot rates in the future are consistent with forward rates as of
December 31, 2018
. The actual effect on earnings will be dependent on the actual spot rates when the forecasted transactions occur. We recognize derivative gains and losses in the “Costs of sales and services” line in the consolidated statements of income (loss).
Derivatives Not Designated As Hedging Instruments
We hold certain forward contracts that have not been designated as cash flow hedging instruments for accounting purposes. Contracts used to hedge the exposure to foreign currency fluctuations associated with certain monetary assets and liabilities are not designated as cash flow hedging instruments, and changes in the fair value of these items are recorded in earnings.
We had open forward contracts not designated as cash flow hedging instruments for accounting purposes with various expiration dates to buy, sell or exchange foreign currencies with a U.S. dollar equivalent of approximately
$1,075.2 million
at
December 31, 2018
.
Fair Value of Derivative Instruments
The following tables provide the gross fair value and net balance sheet presentation of our derivative instruments as of
December 31, 2018
and
2017
.
|
December 31, 2018
|
|||||||||||||||||||
|
Gross Amount of Derivatives
|
|||||||||||||||||||
|
(in Millions)
|
Designated as Cash Flow Hedges
|
Not Designated as Hedging Instruments
|
Total Gross Amounts
|
Gross Amounts Offset in the Consolidated Balance Sheet
(3)
|
Net Amounts
|
||||||||||||||
|
Derivatives
|
|||||||||||||||||||
|
Foreign exchange contracts
|
$
|
18.3
|
|
$
|
1.5
|
|
$
|
19.8
|
|
$
|
(8.1
|
)
|
$
|
11.7
|
|
||||
|
Total derivative assets
(1)
|
$
|
18.3
|
|
$
|
1.5
|
|
$
|
19.8
|
|
$
|
(8.1
|
)
|
$
|
11.7
|
|
||||
|
Foreign exchange contracts
|
$
|
(9.2
|
)
|
$
|
(0.2
|
)
|
$
|
(9.4
|
)
|
$
|
8.1
|
|
$
|
(1.3
|
)
|
||||
|
Interest rate contracts
|
(0.2
|
)
|
—
|
|
(0.2
|
)
|
$
|
—
|
|
(0.2
|
)
|
||||||||
|
Total derivative liabilities
(2)
|
$
|
(9.4
|
)
|
$
|
(0.2
|
)
|
$
|
(9.6
|
)
|
$
|
8.1
|
|
$
|
(1.5
|
)
|
||||
|
Net derivative assets (liabilities)
|
$
|
8.9
|
|
$
|
1.3
|
|
$
|
10.2
|
|
$
|
—
|
|
$
|
10.2
|
|
||||
101
|
December 31, 2017
|
|||||||||||||||||||
|
Gross Amount of Derivatives
|
|||||||||||||||||||
|
(in Millions)
|
Designated as Cash Flow Hedges
|
Not Designated as Hedging Instruments
|
Total Gross Amounts
|
Gross Amounts Offset in the Consolidated Balance Sheet
(3)
|
Net Amounts
|
||||||||||||||
|
Derivatives
|
|||||||||||||||||||
|
Foreign exchange contracts
|
$
|
7.0
|
|
$
|
1.2
|
|
$
|
8.2
|
|
$
|
(1.5
|
)
|
$
|
6.7
|
|
||||
|
Total derivative assets
(1)
|
$
|
7.0
|
|
$
|
1.2
|
|
$
|
8.2
|
|
$
|
(1.5
|
)
|
$
|
6.7
|
|
||||
|
Foreign exchange contracts
|
$
|
(3.6
|
)
|
$
|
(0.2
|
)
|
$
|
(3.8
|
)
|
$
|
1.5
|
|
$
|
(2.3
|
)
|
||||
|
Total derivative liabilities
(2)
|
$
|
(3.6
|
)
|
$
|
(0.2
|
)
|
$
|
(3.8
|
)
|
$
|
1.5
|
|
$
|
(2.3
|
)
|
||||
|
Net derivative assets (liabilities)
|
$
|
3.4
|
|
$
|
1.0
|
|
$
|
4.4
|
|
$
|
—
|
|
$
|
4.4
|
|
||||
____________________
|
(1)
|
Net balance is included in “Prepaid and other current assets” in the consolidated balance sheets.
|
|
(2)
|
Net balance is included in “Accrued and other liabilities” in the consolidated balance sheets.
|
|
(3)
|
Represents net derivatives positions subject to master netting arrangements.
|
102
The following tables summarize the gains or losses related to our cash flow hedges and derivatives not designated as hedging instruments.
Derivatives in Cash Flow Hedging Relationships
|
Contracts
|
||||||||||||
|
(in Millions)
|
Foreign exchange
|
Energy
|
Other
|
Total
|
||||||||
|
Accumulated other comprehensive income (loss), net of tax at December 31, 2015
|
$
|
(6.1
|
)
|
$
|
(1.3
|
)
|
$
|
1.2
|
|
$
|
(6.2
|
)
|
|
2016 Activity
|
||||||||||||
|
Unrealized hedging gains (losses) and other, net of tax
|
$
|
6.1
|
|
$
|
1.2
|
|
$
|
—
|
|
$
|
7.3
|
|
|
Reclassification of deferred hedging (gains) losses, net of tax
|
||||||||||||
|
Effective Portion
(1)
|
$
|
5.1
|
|
$
|
1.5
|
|
$
|
(0.1
|
)
|
$
|
6.5
|
|
|
Ineffective Portion
(1)
|
(0.5
|
)
|
—
|
|
—
|
|
(0.5
|
)
|
||||
|
Total derivative instrument impact on comprehensive income, net of tax
|
$
|
10.7
|
|
$
|
2.7
|
|
$
|
(0.1
|
)
|
$
|
13.3
|
|
|
Accumulated other comprehensive income (loss), net of tax at December 31, 2016
|
$
|
4.6
|
|
$
|
1.4
|
|
$
|
1.1
|
|
$
|
7.1
|
|
|
2017 Activity
|
||||||||||||
|
Unrealized hedging gains (losses) and other, net of tax
|
$
|
(0.4
|
)
|
$
|
(0.8
|
)
|
$
|
—
|
|
$
|
(1.2
|
)
|
|
Reclassification of deferred hedging (gains) losses, net of tax
|
||||||||||||
|
Effective Portion
(1)
|
$
|
0.3
|
|
$
|
(0.6
|
)
|
$
|
(0.3
|
)
|
$
|
(0.6
|
)
|
|
Ineffective Portion
(1)
|
(0.1
|
)
|
—
|
|
—
|
|
(0.1
|
)
|
||||
|
Total derivative instrument impact on comprehensive income, net of tax
|
$
|
(0.2
|
)
|
$
|
(1.4
|
)
|
$
|
(0.3
|
)
|
$
|
(1.9
|
)
|
|
Accumulated other comprehensive income (loss), net of tax at December 31, 2017
|
$
|
4.4
|
|
$
|
—
|
|
$
|
0.8
|
|
$
|
5.2
|
|
|
2018 Activity
|
||||||||||||
|
Unrealized hedging gains (losses) and other, net of tax
|
$
|
14.2
|
|
$
|
—
|
|
$
|
(0.5
|
)
|
$
|
13.7
|
|
|
Reclassification of deferred hedging (gains) losses, net of tax
|
||||||||||||
|
Effective Portion
(1)
|
$
|
(8.1
|
)
|
$
|
—
|
|
$
|
0.5
|
|
$
|
(7.6
|
)
|
|
Ineffective Portion
(1)
|
(0.1
|
)
|
—
|
|
—
|
|
(0.1
|
)
|
||||
|
Total derivative instrument impact on comprehensive income, net of tax
|
$
|
6.0
|
|
$
|
—
|
|
$
|
—
|
|
$
|
6.0
|
|
|
Accumulated other comprehensive income (loss), net of tax at December 31, 2018
|
$
|
10.4
|
|
$
|
—
|
|
$
|
0.8
|
|
$
|
11.2
|
|
____________________
|
(1)
|
Amounts are included in “Cost of sales and services” and "Interest expense" on the consolidated statements of income (loss).
|
Derivatives Not Designated as Hedging Instruments
|
Location of Gain or (Loss)
Recognized in Income on Derivatives
|
Amount of Pre-tax Gain or (Loss)
Recognized in Income on Derivatives
(1)
|
|||||||||||
|
Year Ended December 31,
|
||||||||||||
|
(in Millions)
|
|
2018
|
2017
|
2016
|
||||||||
|
Foreign Exchange contracts
|
Cost of Sales and Services
|
$
|
(11.1
|
)
|
$
|
(12.2
|
)
|
$
|
(42.7
|
)
|
||
|
Total
|
$
|
(11.1
|
)
|
$
|
(12.2
|
)
|
$
|
(42.7
|
)
|
|||
____________________
|
(1)
|
Amounts in the columns represent the gain or loss on the derivative instrument offset by the gain or loss on the hedged item.
|
Fair Value Measurements
Fair value is the price that would be received to sell an asset or paid to transfer a liability in an orderly transaction between market participants at the measurement date. Market participants are defined as buyers or sellers in the principle or most advantageous market for the asset or liability that are independent of the reporting entity, knowledgeable and able and willing to transact for the asset or liability.
103
Fair Value Hierarchy
We have categorized our assets and liabilities that are recorded at fair value, based on the priority of the inputs to the valuation technique, into a three-level fair value hierarchy. The fair value hierarchy gives the highest priority to quoted prices in active markets for identical assets or liabilities (Level 1) and the lowest priority to unobservable inputs (Level 3). If the inputs used to measure the assets and liabilities fall within different levels of the hierarchy, the categorization is based on the lowest level input that is significant to the fair value measurement of the instrument.
Recurring Fair Value Measurements
The following tables present our fair value hierarchy for those assets and liabilities measured at fair value on a recurring basis in our consolidated balance sheets.
|
(in Millions)
|
December 31, 2018
|
Quoted Prices in Active Markets for Identical Assets
(Level 1)
|
Significant Other Observable Inputs
(Level 2)
|
Significant Unobservable Inputs
(Level 3)
|
|||||||||||
|
Assets
|
|||||||||||||||
|
Derivatives – Foreign exchange
(1)
|
$
|
11.7
|
|
$
|
—
|
|
$
|
11.7
|
|
$
|
—
|
|
|||
|
Other
(2)
|
17.7
|
|
17.7
|
|
—
|
|
—
|
|
|||||||
|
Total Assets
|
$
|
29.4
|
|
$
|
17.7
|
|
$
|
11.7
|
|
$
|
—
|
|
|||
|
Liabilities
|
|||||||||||||||
|
Derivatives – Foreign exchange
(1)
|
$
|
1.3
|
|
$
|
—
|
|
$
|
1.3
|
|
$
|
—
|
|
|||
|
Derivatives - Interest Rate
(1)
|
0.2
|
|
—
|
|
0.2
|
|
—
|
|
|||||||
|
Other
(3)
|
27.4
|
|
24.3
|
|
3.1
|
|
—
|
|
|||||||
|
Total Liabilities
|
$
|
28.9
|
|
$
|
24.3
|
|
$
|
4.6
|
|
$
|
—
|
|
|||
____________________
|
(1)
|
See the Fair Value of Derivative Instruments table within this Note for classifications on our consolidated balance sheets.
|
|
(2)
|
Consists of a deferred compensation arrangement, through which we hold various investment securities, recognized on our balance sheet. Both the asset and liability are recorded at fair value. Asset amounts included in “Other assets including long-term receivables, net” in the consolidated balance sheets.
|
|
(3)
|
Primarily consists of a deferred compensation arrangement recognized on our balance sheet. Both the asset and liability are recorded at fair value. Liability amounts included in “Other long-term liabilities” in the consolidated balance sheets.
|
|
(in Millions)
|
December 31, 2017
|
Quoted Prices in Active Markets for Identical Assets
(Level 1)
|
Significant Other Observable Inputs
(Level 2)
|
Significant Unobservable Inputs
(Level 3)
|
|||||||||||
|
Assets
|
|||||||||||||||
|
Derivatives – Foreign exchange
(1)
|
$
|
6.7
|
|
$
|
—
|
|
$
|
6.7
|
|
$
|
—
|
|
|||
|
Other
(2)
|
30.1
|
|
30.1
|
|
—
|
|
—
|
|
|||||||
|
Total Assets
|
$
|
36.8
|
|
$
|
30.1
|
|
$
|
6.7
|
|
$
|
—
|
|
|||
|
Liabilities
|
|||||||||||||||
|
Derivatives – Foreign exchange
(1)
|
$
|
2.3
|
|
$
|
—
|
|
$
|
2.3
|
|
$
|
—
|
|
|||
|
Other
(3)
|
46.6
|
|
38.8
|
|
7.8
|
|
—
|
|
|||||||
|
Total Liabilities
|
$
|
48.9
|
|
$
|
38.8
|
|
$
|
10.1
|
|
$
|
—
|
|
|||
____________________
|
(1)
|
See the Fair Value of Derivative Instruments table within this Note for classifications on our consolidated balance sheets.
|
|
(2)
|
Consists of a deferred compensation arrangement, through which we hold various investment securities, recognized on our balance sheet. Both the asset and liability are recorded at fair value. Asset amounts included in “Other assets including long-term receivables, net” in the consolidated balance sheets.
|
104
|
(3)
|
Primarily consists of a deferred compensation arrangement recognized on our balance sheet. Both the asset and liability are recorded at fair value. Liability amounts included in “Other long-term liabilities” in the consolidated balance sheets.
|
Nonrecurring Fair Value Measurements
The following tables present our fair value hierarchy for those assets and liabilities measured at fair value on a non-recurring basis in our consolidated balance sheets during the year ended
December 31, 2018
and
2017
. See Note 4 for the assets and liabilities measured on a non-recurring basis at fair value associated with our acquisitions.
|
(in Millions)
|
December 31, 2018
|
Quoted Prices in Active Markets for Identical Assets
(Level 1)
|
Significant Other Observable Inputs
(Level 2)
|
Significant Unobservable Inputs
(Level 3)
|
Total Gains (Losses) (Year Ended December 31, 2018)
|
||||||||||||||
|
Assets
|
|||||||||||||||||||
|
Impairment of intangibles
(1)
|
$
|
3.1
|
|
$
|
—
|
|
$
|
—
|
|
$
|
3.1
|
|
$
|
(1.8
|
)
|
||||
|
Total Assets
|
$
|
3.1
|
|
$
|
—
|
|
$
|
—
|
|
$
|
3.1
|
|
$
|
(1.8
|
)
|
||||
|
(1)
|
We recorded an impairment charge, related to our FMC Agricultural Solutions segment, to write down the carrying value of the generic brand portfolio of approximately
$2 million
to its fair value.
|
|
(in Millions)
|
December 31, 2017
|
Quoted Prices in Active Markets for Identical Assets
(Level 1)
|
Significant Other Observable Inputs
(Level 2)
|
Significant Unobservable Inputs
(Level 3)
|
Total Gains (Losses) (Year Ended December 31, 2017)
|
||||||||||||||
|
Assets
|
|||||||||||||||||||
|
Impairment of Crop Protection intangibles
(1)
|
$
|
1,136.1
|
|
$
|
—
|
|
$
|
—
|
|
$
|
1,136.1
|
|
$
|
(42.1
|
)
|
||||
|
Impairment of intangibles
(2)
|
4.3
|
|
—
|
|
—
|
|
4.3
|
|
(1.3
|
)
|
|||||||||
|
Total Assets
|
$
|
1,140.4
|
|
$
|
—
|
|
$
|
—
|
|
$
|
1,140.4
|
|
$
|
(43.4
|
)
|
||||
____________________
|
(1)
|
Represents impairment charge to write down certain indefinite-lived intangible assets of the acquired DuPont Crop Protection Business as a result of a triggering event for the United States' enactment of the Act. See Note 12 for further details on the tax legislation.
|
|
(2)
|
We recorded an impairment charge, related to our FMC Agricultural Solutions segment, to write down the carrying value of the generic brand portfolio of approximately
$1 million
to its fair value.
|
Note 19: Guarantees, Commitments and Contingencies
We continue to monitor the conditions that are subject to guarantees and indemnifications to identify whether a liability must be recognized in our financial statements.
The following table provides the estimated undiscounted amount of potential future payments for each major group of guarantees at
December 31, 2018
. These guarantees arise during the ordinary course of business from relationships with customers and nonconsolidated affiliates. Non-performance by the guaranteed party triggers the obligation requiring us to make payments to the beneficiary of the guarantee. Based on our experience these types of guarantees have not had a material effect on our consolidated financial position or on our liquidity. Our expectation is that future payment or performance related to the non-performance of others is considered unlikely.
|
(in Millions)
|
|||
|
Guarantees:
|
|||
|
Guarantees of vendor financing - short term
(1)
|
$
|
67.1
|
|
|
Other debt guarantees
(2)
|
4.2
|
|
|
|
Total
|
$
|
71.3
|
|
____________________
|
(1)
|
Represents guarantees to financial institutions on behalf of certain FMC Agricultural Solutions customers for their seasonal borrowing. The short-term amount is recorded on the consolidated balance sheets as “Guarantees of vendor financing.”
|
|
(2)
|
These guarantees represent support provided to third-party banks for credit extended to various FMC Agricultural Solutions customers and nonconsolidated affiliates. The liability for the guarantees is recorded at an amount that approximates fair value (i.e. representing
|
105
the stand-ready obligation) based on our historical collection experience and a current assessment of credit exposure. We believe the fair value of these guarantees is immaterial. The majority of these guarantees have an expiration date of less than
one
year.
Excluded from the chart above are parent company guarantees we provide to lending institutions that extend credit to our foreign subsidiaries. Since these guarantees are provided for consolidated subsidiaries the consolidated financial position is not affected by the issuance of these guarantees. Also excluded from the chart, in connection with our property and asset sales and divestitures, we have agreed to indemnify the buyers for certain liabilities, including environmental contamination and taxes that occurred prior to the date of sale or provided guarantees to third parties relating to certain contracts assumed by the buyer. Our indemnification or guarantee obligations with respect to these liabilities may be indefinite as to duration and may or may not be subject to a deductible, minimum claim amount or cap. As such, it is not possible for us to predict the likelihood that a claim will be made or to make a reasonable estimate of the maximum potential loss or range of loss. If triggered, we may be able to recover some of the indemnity payments from third parties. We have not recorded any specific liabilities for these guarantees.
Commitments
Leases
We lease office space, plants and facilities, and various types of manufacturing, data processing and transportation equipment. Leases of real estate generally provide for our payment of property taxes, insurance and repairs. During 2018, we migrated our Ewing R&D activities and employees into the newly acquired Stine facilities and exited the Ewing facilities. Refer to Note 8 for further details. As of
December 31, 2018
, we had
one
capital lease related to our research and technology center in China. Our capital lease asset balances (net of accumulated amortization of
$1.9 million
and
$2.3 million
), which are classified as buildings within our property, plant and equipment on our consolidated balance sheets, were
$13.0 million
and
$16.4 million
as of
December 31, 2018
and
2017
, respectively. Amortization of capital lease assets is included within depreciation expense. See Note 21 within these consolidated financial statements for obligations associated with our capital leases.
|
Year ended December 31,
|
|||||||||||
|
(in Millions)
|
2018
|
2017
|
2016
|
||||||||
|
Operating leases rent expense
|
$
|
41.1
|
|
$
|
27.6
|
|
$
|
21.2
|
|
||
|
Future Minimum Lease Payments
|
|||||||||||||||||||||||
|
(in Millions)
|
2019
|
2020
|
2021
|
2022
|
2023
|
Thereafter
|
|||||||||||||||||
|
Operating Leases
|
$
|
36.7
|
|
$
|
31.7
|
|
$
|
21.0
|
|
$
|
17.5
|
|
$
|
13.5
|
|
$
|
107.5
|
|
|||||
|
Capital Lease
|
2.9
|
|
2.9
|
|
3.1
|
|
3.1
|
|
3.1
|
|
4.3
|
|
|||||||||||
Purchase Obligations
Our minimum commitments under our take-or-pay purchase obligations associated with the sourcing of materials and energy total approximately
$1,254 million
. Since the majority of our minimum obligations under these contracts are over the life of the contract on a year-by-year basis, we are unable to determine the periods in which these obligations could be payable under these contracts. However, we intend to fulfill the obligations associated with these contracts through our purchases associated with the normal course of business.
Contingencies
Competition / antitrust litigation related to the discontinued FMC Peroxygens segment.
We are subject to actions brought by private plaintiffs relating to alleged violations of European and Canadian competition and antitrust laws, as further described below.
European competition action
. Multiple European purchasers of hydrogen peroxide who claim to have been harmed as a result of alleged violations of European competition law by hydrogen peroxide producers assigned their legal claims to a single entity formed by a law firm. The single entity then filed a lawsuit in Germany in March 2009 against European producers, including our wholly-owned Spanish subsidiary, Foret. Initial defense briefs were filed in April 2010, and an initial hearing was held during the first quarter of 2011, at which time case management issues were discussed. At a subsequent hearing in October 2011, the Court indicated that it was considering seeking guidance from the European Court of Justice (“ECJ”) as to whether the German courts have jurisdiction over these claims. After submission of written comments on this issue by the parties, on March 1, 2012, the judge announced that she would refer the jurisdictional issues to the ECJ, which she did on
106
April 29, 2013. On May 21, 2015, the ECJ issued its decision, upholding the jurisdiction of the German court. The case is now back before the German judge. We filed a motion to dismiss the proceedings in September 2015. We anticipate a response by the court in the first half of 2019. Since the case is in the preliminary stages and is based on a novel procedure - namely the attempt to create a cross-border “class action” which is not a recognized proceeding under EU or German law - we are unable to develop a reasonable estimate of our potential exposure of loss at this time. We intend to vigorously defend this matter.
Canadian antitrust actions
. In 2005, after public disclosures of the U.S. federal grand jury investigation into the hydrogen peroxide industry, which resulted in no charges brought against us, and the filing of various class actions in U.S. federal and state courts, which have all been settled, putative class actions against us and
five
other major hydrogen peroxide producers were filed in provincial courts in Ontario, Quebec and British Columbia under the laws of Canada. The other
five
defendants have settled these claims for a total of approximately
$20.6 million
. On September 28, 2009, the Ontario Superior Court of Justice certified a class of direct and indirect purchasers of hydrogen peroxide from 1994 to 2005. Our motion for leave to appeal the class certification decision was denied in June 2010. The case was largely dormant while the Canadian Supreme Court considered, in different litigation, whether indirect purchasers may recover overcharges in antitrust actions. In October 2013 the Court ruled that such recovery is permissible. Thereafter, the plaintiffs' moved to dismiss certain downstream purchasers (those who purchased products that contain hydrogen peroxide or were made using hydrogen peroxide) from the case and to reduce the class period to November 1, 1998 through December 31, 2003 - thereby eliminating six of the eleven years of the originally certified class period. The Court approved this request. Following an active period of discovery the plaintiffs approached FMC for settlement negotiations in July 2018. The plaintiffs and FMC subsequently reached agreement and signed a settlement agreement on September 27, 2018, providing for a payment of CAD
3.25 million
(
$2.5 million
) to plaintiffs. The settlement payment was made in the fourth quarter of 2018. This was recorded within "Discontinued operations, net of income taxes" on the consolidated statements of income (loss). Subject to court approval, which is expected, the settlement agreement fully and finally resolved the Canadian litigation.
Asbestos claims
. Like hundreds of other industrial companies, we have been named as one of many defendants in asbestos-related personal injury litigation. Most of these cases allege personal injury or death resulting from exposure to asbestos in premises of FMC or to asbestos-containing components installed in machinery or equipment manufactured or sold by discontinued operations.
We intend to continue managing these asbestos-related cases in accordance with our historical experience. We have established a reserve for this litigation within our discontinued operations and believe that any exposure of a loss in excess of the established reserve cannot be reasonably estimated. Our experience has been that the overall trends in asbestos litigation have changed over time. Over the last several years, we have seen changes in the jurisdictions where claims against FMC are being filed and changes in the mix of products named in the various claims. Because these claim trends have yet to form a predictable pattern, we are presently unable to reasonably estimate our asbestos liability with respect to claims that may be filed in the future.
Other contingent liabilities
. In addition to the matters disclosed above, we have certain other contingent liabilities arising from litigation, claims, products we have sold, guarantees or warranties we have made, contracts we have entered into, indemnities we have provided, and other commitments or obligations incident to the ordinary course of business. In Brazil, we are subject to claims from various governmental agencies regarding alleged additional indirect (non-income) taxes or duties as well as product liability matters related to our operations. These disputes take many years to resolve as the matters move through administrative or judicial courts. We have provided reserves for such Brazilian matters that we consider probable and for which a reasonable estimate of the obligation can be made in the amount of
$1.7 million
and
$2.2 million
as of
December 31, 2018
and
2017
, respectively. The aggregate estimated reasonably possible loss contingencies related to such Brazilian matters exceed amounts accrued by approximately
$77 million
at
December 31, 2018
. This reasonably possible estimate is based upon information available as of the date of the filing and the actual future losses may be higher given the uncertainties regarding the ultimate decision by administrative or judicial authorities in Brazil. Regarding other contingencies arising from operations, some of these contingencies are known - for example pending product liability litigation or claims - but are so preliminary that the merits cannot be determined, or if more advanced, are not deemed material based on current knowledge. Some contingencies are unknown - for example, claims with respect to which we have no notice or claims which may arise in the future, resulting from products we have sold, guarantees or warranties we have made, or indemnities we have provided. Therefore, we are unable to develop a reasonable estimate of our potential exposure of loss for these contingencies, either individually or in the aggregate, at this time. Based on information currently available and established reserves, we have no reason to believe that the ultimate resolution of our known contingencies, including the matters described in this Note, will have a material adverse effect on our consolidated financial position, liquidity or results of operations. However, there can be no assurance that the outcome of these contingencies will be favorable, and adverse
107
results in certain of these contingencies could have a material adverse effect on our consolidated financial position, results of operations in any one reporting period, or liquidity.
See Note 11 for the Pocatello tribal litigation, Middleport litigation, and Portland Harbor litigation for legal proceedings associated with our environmental contingencies.
Note 20: Segment Information
|
(in Millions)
|
Year Ended December 31,
|
||||||||||
|
2018
|
|
2017
|
|
2016
|
|||||||
|
Revenue
(1)
|
|
|
|
|
|
||||||
|
FMC Agricultural Solutions
|
$
|
4,285.3
|
|
|
$
|
2,531.2
|
|
|
$
|
2,274.8
|
|
|
FMC Lithium
|
442.5
|
|
|
347.4
|
|
|
264.1
|
|
|||
|
Total
|
$
|
4,727.8
|
|
|
$
|
2,878.6
|
|
|
$
|
2,538.9
|
|
|
Earnings before interest, taxes and depreciation and amortization (EBITDA)
|
|
|
|
|
|||||||
|
FMC Agricultural Solutions
|
$
|
1,217.8
|
|
|
$
|
576.1
|
|
|
$
|
480.7
|
|
|
FMC Lithium
|
195.7
|
|
|
141.9
|
|
|
85.0
|
|
|||
|
Corporate and other
|
(108.9
|
)
|
|
(95.1
|
)
|
|
(79.6
|
)
|
|||
|
Operating profit before the items listed below
|
$
|
1,304.6
|
|
|
$
|
622.9
|
|
|
$
|
486.1
|
|
|
Depreciation and amortization
|
(168.2
|
)
|
|
(113.0
|
)
|
|
(100.6
|
)
|
|||
|
Interest expense, net
|
(133.1
|
)
|
|
(79.1
|
)
|
|
(62.9
|
)
|
|||
|
Restructuring and other (charges) income
(2)
|
(63.7
|
)
|
|
(81.4
|
)
|
|
(95.0
|
)
|
|||
|
Non-operating pension and postretirement (charges) income
(3)
|
(3.8
|
)
|
|
(18.2
|
)
|
|
(23.4
|
)
|
|||
|
Transaction-related charges
(4)
|
(192.1
|
)
|
|
(150.4
|
)
|
|
(23.4
|
)
|
|||
|
(Provision) benefit for income taxes
|
(88.8
|
)
|
|
(264.1
|
)
|
|
(50.1
|
)
|
|||
|
Discontinued operations, net of income taxes
|
(143.4
|
)
|
|
621.7
|
|
|
81.0
|
|
|||
|
Net (income) loss attributable to noncontrolling interests
|
(9.4
|
)
|
|
(2.6
|
)
|
|
(2.6
|
)
|
|||
|
Net income (loss) attributable to FMC stockholders
|
$
|
502.1
|
|
|
$
|
535.8
|
|
|
$
|
209.1
|
|
____________________
|
(1)
|
Refer to Note 3 for further disaggregation of revenue in accordance with ASC 606.
|
|
(2)
|
See Note 8 for details of restructuring and other (charges) income. Below provides the detail the (charges) income by segment:
|
|
|
Year Ended December 31,
|
||||||||||
|
(in Millions)
|
2018
|
|
2017
|
|
2016
|
||||||
|
FMC Agricultural Solutions
|
$
|
(33.3
|
)
|
|
$
|
(49.9
|
)
|
|
$
|
(62.4
|
)
|
|
FMC Lithium
|
(2.3
|
)
|
|
(7.8
|
)
|
|
(0.6
|
)
|
|||
|
Corporate
|
(28.1
|
)
|
|
(23.7
|
)
|
|
(32.0
|
)
|
|||
|
Restructuring and other (charges) income
|
$
|
(63.7
|
)
|
|
$
|
(81.4
|
)
|
|
$
|
(95.0
|
)
|
|
(3)
|
Our non-operating pension and postretirement charges (income) are defined as those costs (benefits) related to interest, expected return on plan assets, amortized actuarial gains and losses and the impacts of any plan curtailments or settlements. These are excluded from our segments results and are primarily related to changes in pension plan assets and liabilities which are tied to financial market performance and we consider these costs to be outside our operational performance. We continue to include the service cost and amortization of prior service cost in our Adjusted Earnings results noted above. These elements reflect the current year operating costs to our businesses for the employment benefits provided to active employees.
|
|
(4)
|
Charges relate to the expensing of the inventory fair value step-up resulting from the application of purchase accounting, transaction costs, costs for transitional employees, other acquired employee related costs, integration related legal and professional third-party fees. Amounts represent the following:
|
108
|
|
Year Ended December 31,
|
||||||||||
|
(in Millions)
|
2018
|
|
2017
|
|
2016
|
||||||
|
Acquisition-related charges -
DuPont Crop
|
|
|
|
|
|
|
|
|
|||
|
Legal and professional fees
(1)
|
$
|
86.9
|
|
|
$
|
130.2
|
|
|
$
|
—
|
|
|
Inventory fair value amortization
(2)
|
69.6
|
|
|
20.2
|
|
|
—
|
|
|||
|
Acquisition-related charges -
Cheminova
(3)
|
|
|
|
|
|
|
|
|
|||
|
Legal and professional fees
(1)
|
—
|
|
|
—
|
|
|
23.4
|
|
|||
|
Separation-related charges -
FMC Lithium
|
|
|
|
|
|
|
|
|
|||
|
Legal and professional fees
(1)
|
35.6
|
|
|
—
|
|
|
—
|
|
|||
|
Total transaction-related charges
|
$
|
192.1
|
|
|
$
|
150.4
|
|
|
$
|
23.4
|
|
____________________
|
(1)
|
Represents transaction costs, costs for transitional employees, other acquired employees related costs, and transactional-related costs such as legal and professional third-party fees. These charges are recorded as a component of “Selling, general and administrative expense" on the consolidated statements of income (loss).
|
|
(2)
|
These charges are included in “Costs of sales and services” on the consolidated statements of income (loss).
|
|
(3)
|
Acquisition-related charges and restructuring charges to integrate Cheminova with FMC Agricultural Solutions were completed at the end of 2016.
|
|
(in Millions)
|
December 31,
|
||||||
|
2018
|
2017
|
||||||
|
Operating capital employed
(1)
|
|||||||
|
FMC Agricultural Solutions
|
$
|
6,326.3
|
|
$
|
6,216.3
|
|
|
|
FMC Lithium
|
537.7
|
|
393.9
|
|
|||
|
Total operating capital employed
|
$
|
6,864.0
|
|
$
|
6,610.2
|
|
|
|
Segment liabilities included in total operating capital employed
|
2,444.4
|
|
1,957.9
|
|
|||
|
Assets of discontinued operations held for sale
|
—
|
|
7.3
|
|
|||
|
Corporate items
|
665.9
|
|
630.9
|
|
|||
|
Total assets
|
$
|
9,974.3
|
|
$
|
9,206.3
|
|
|
|
Segment assets
(2)
|
|||||||
|
FMC Agricultural Solutions
|
$
|
8,660.4
|
|
$
|
8,094.0
|
|
|
|
FMC Lithium
|
648.0
|
|
474.1
|
|
|||
|
Total segment assets
|
$
|
9,308.4
|
|
$
|
8,568.1
|
|
|
|
Assets of discontinued operations held for sale
|
—
|
|
7.3
|
|
|||
|
Corporate items
|
665.9
|
|
630.9
|
|
|||
|
Total assets
|
$
|
9,974.3
|
|
$
|
9,206.3
|
|
|
____________________
|
(1)
|
We view operating capital employed, which consists of assets, net of liabilities, reported by our operations and excluding corporate items such as cash equivalents, debt, pension liabilities, income taxes and LIFO reserves, as our primary measure of segment capital.
|
|
(2)
|
Segment assets are assets recorded and reported by the segments and are equal to segment operating capital employed plus segment liabilities. See Note 1.
|
109
|
|
Year Ended December 31,
|
||||||||||||||||||||||||||||||||||
|
(in Millions)
|
Capital Expenditures
(1)
|
Depreciation and Amortization
|
Research and Development Expense
|
||||||||||||||||||||||||||||||||
|
2018
|
2017
|
2016
|
2018
|
2017
|
2016
|
2018
|
2017
|
2016
|
|||||||||||||||||||||||||||
|
FMC Agricultural Solutions
|
$
|
74.5
|
|
$
|
26.2
|
|
$
|
23.1
|
|
$
|
143.6
|
|
$
|
90.5
|
|
$
|
80.8
|
|
$
|
287.7
|
|
$
|
138.4
|
|
$
|
131.4
|
|
||||||||
|
FMC Lithium
|
73.6
|
|
47.4
|
|
24.4
|
|
18.0
|
|
15.2
|
|
14.8
|
|
3.8
|
|
3.1
|
|
3.1
|
|
|||||||||||||||||
|
Corporate
|
8.5
|
|
12.1
|
|
43.7
|
|
6.6
|
|
7.3
|
|
5.0
|
|
—
|
|
—
|
|
—
|
|
|||||||||||||||||
|
Total
|
$
|
156.6
|
|
$
|
85.7
|
|
$
|
91.2
|
|
$
|
168.2
|
|
$
|
113.0
|
|
$
|
100.6
|
|
$
|
291.5
|
|
$
|
141.5
|
|
$
|
134.5
|
|
||||||||
___________________
|
(1)
|
Cash spending associated with contract manufacturers in our FMC Agricultural Solutions segment, which are not included in the table above was
$17.8 million
,
$15.9 million
and
$10.4 million
for the years ended
December 31, 2018
.
2017
and
2016
, respectively.
|
Geographic Segment Information
|
(in Millions)
|
Year Ended December 31,
|
||||||||||
|
2018
|
2017
|
2016
|
|||||||||
|
Revenue from continuing operations (by location of customer)
|
|||||||||||
|
North America
(1)
|
$
|
1,175.2
|
|
$
|
708.1
|
|
$
|
623.0
|
|
||
|
Europe, Middle East, and Africa
|
1,040.5
|
|
583.4
|
|
558.5
|
|
|||||
|
Latin America
(1)
|
1,212.1
|
|
868.6
|
|
761.2
|
|
|||||
|
Asia Pacific
|
1,300.0
|
|
718.5
|
|
596.2
|
|
|||||
|
Total
|
$
|
4,727.8
|
|
$
|
2,878.6
|
|
$
|
2,538.9
|
|
||
____________________
|
(1)
|
In
2018
, countries with sales in excess of
10 percent
of consolidated revenue consisted of the U.S. and Brazil. Sales for the years ended
December 31, 2018
,
2017
and
2016
for the U.S. totaled
$1,074.2 million
,
$655.2 million
and
$596.4 million
and for Brazil totaled
$913.7 million
,
$598.5 million
and
$490.9 million
, respectively.
|
|
(in Millions)
|
December 31,
|
||||||
|
2018
|
2017
|
||||||
|
Long-lived assets
(1)
|
|||||||
|
North America
(2)
|
$
|
1,176.4
|
|
$
|
981.1
|
|
|
|
Europe, Middle East, and Africa
(2)
|
1,438.3
|
|
1,493.3
|
|
|||
|
Latin America
|
1,009.9
|
|
925.0
|
|
|||
|
Asia Pacific
|
2,046.3
|
|
1,901.5
|
|
|||
|
Total
|
$
|
5,670.9
|
|
$
|
5,300.9
|
|
|
____________________
|
(1)
|
Geographic segment long-lived assets exclude long-term deferred income taxes and assets of discontinued operations held for sale on the consolidated balance sheets.
|
|
(2)
|
The countries with long-lived assets in excess of
10 percent
of consolidated long-lived assets at
December 31, 2018
are Singapore, which totaled
$1,558.9 million
, the U.S., which totaled
$1,167.7 million
, and Denmark, which totaled
$1,044.2 million
, respectively. The long-lived assets over the threshold at
December 31, 2017
were Singapore, which totaled
$1,414.9 million
, the U.S., which totaled
$976.9 million
, and Denmark, which totaled
$1,096.2 million
, respectively.
|
110
Note 21: Supplemental Information
The following tables present details of prepaid and other current assets, other assets including long-term receivables, net, accrued and other liabilities and other long-term liabilities as presented on the consolidated balance sheets:
|
(in Millions)
|
December 31,
|
||||||
|
2018
|
2017
|
||||||
|
Prepaid and other current assets
|
|||||||
|
Prepaid insurance
|
$
|
8.1
|
|
$
|
8.2
|
|
|
|
Bank acceptance drafts
(1)
|
29.1
|
|
—
|
|
|||
|
Tax related items including value added tax receivables
|
219.3
|
|
127.3
|
|
|||
|
Refund asset
(2)
|
49.7
|
|
—
|
|
|||
|
Environmental obligation recoveries (Note 11)
|
6.2
|
|
7.0
|
|
|||
|
Derivative assets (Note 18)
|
11.7
|
|
6.7
|
|
|||
|
Argentina government receivable
(3)
|
3.2
|
|
3.2
|
|
|||
|
Acquisition related items
(4)
|
3.4
|
|
54.7
|
|
|||
|
Other prepaid and current assets
|
155.3
|
|
119.3
|
|
|||
|
Total
|
$
|
486.0
|
|
$
|
326.4
|
|
|
|
(in Millions)
|
December 31,
|
||||||
|
2018
|
2017
|
||||||
|
Other assets including long-term receivables, net
|
|||||||
|
Non-current receivables (Note 9)
|
$
|
84.5
|
|
$
|
106.7
|
|
|
|
Advance to contract manufacturers
|
85.2
|
|
79.1
|
|
|||
|
Capitalized software, net
|
63.2
|
|
26.6
|
|
|||
|
Environmental obligation recoveries (Note 11)
|
24.3
|
|
25.3
|
|
|||
|
Argentina government receivable
(3)
|
47.1
|
|
44.5
|
|
|||
|
Income taxes deferred charges
|
45.2
|
|
67.2
|
|
|||
|
Deferred compensation arrangements
|
17.7
|
|
30.1
|
|
|||
|
Pension and other postretirement benefits (Note 14)
|
42.8
|
|
—
|
|
|||
|
Other long-term assets
|
55.2
|
|
64.1
|
|
|||
|
Total
|
$
|
465.2
|
|
$
|
443.6
|
|
|
____________________
|
(1)
|
Bank acceptance drafts are a common Chinese finance note used to settle trade transactions. FMC Lithium accepts these notes from Chinese customers based on criteria intended to ensure collectability and limit working capital usage.
|
|
(2)
|
In accordance with the new revenue standard requirements, a sales return liability is recognized for the consideration paid by a customer to which FMC does not expect to be entitled, together with a corresponding refund asset to recover the product from the customer. Refer to Note 2 for further information.
|
|
(3)
|
We have various subsidiaries that conduct business within Argentina, primarily in our FMC Agricultural Solutions and FMC Lithium segments. At
December 31, 2018
and
2017
,
$38.0 million
and
$37.9 million
of outstanding receivables due from the Argentina government, which primarily represent export tax and export rebate receivables, were denominated in U.S. dollars. As with all outstanding receivable balances we continually review recoverability by analyzing historical experience, current collection trends and regional business and political factors among other factors.
|
|
(4)
|
Amount in 2017 represents
$32.9 million
of accounts payable of the legal entity stock sales as part of the DuPont Crop Protection Acquisition as well as
$21.8 million
of deferred goodwill as a result of the delayed sites. As part of the Transaction Agreement, the accounts payable will be settled subsequent to the closing date through reimbursement between FMC and DuPont. This amount represents the offsetting asset recorded for amounts due back from DuPont. The deferred goodwill will be recognized as the sites are transferred to FMC. See Note 4 for more details.
|
111
|
(in Millions)
|
December 31,
|
||||||
|
2018
|
2017
|
||||||
|
Accrued and other liabilities
|
|||||||
|
Restructuring reserves (Note 8)
|
$
|
20.8
|
|
$
|
6.5
|
|
|
|
Dividend payable (Note 16)
|
53.2
|
|
22.3
|
|
|||
|
Accrued payroll
|
95.5
|
|
92.4
|
|
|||
|
Environmental reserves, current, net of recoveries (Note 11)
|
63.5
|
|
72.0
|
|
|||
|
Derivative liabilities (Note 18)
|
1.5
|
|
2.3
|
|
|||
|
Acquisition related items
(1)
|
—
|
|
45.8
|
|
|||
|
Unfavorable contracts
(2)
|
103.1
|
|
65.7
|
|
|||
|
Other accrued and other liabilities
(3)
|
256.8
|
|
190.7
|
|
|||
|
Total
|
$
|
594.4
|
|
$
|
497.7
|
|
|
|
(in Millions)
|
December 31,
|
||||||
|
2018
|
2017
|
||||||
|
Other long-term liabilities
|
|||||||
|
Asset retirement obligations, long-term (Note 1)
|
$
|
2.7
|
|
$
|
1.9
|
|
|
|
Transition tax related to Tax Cuts and Jobs Act
(4)
|
145.6
|
|
186.5
|
|
|||
|
Contingencies related to uncertain tax positions (Note 12)
|
82.4
|
|
93.9
|
|
|||
|
Deferred compensation arrangements (Note 18)
|
24.3
|
|
38.8
|
|
|||
|
Self-insurance reserves (primarily workers' compensation)
|
4.6
|
|
6.1
|
|
|||
|
Lease obligations
|
17.3
|
|
22.5
|
|
|||
|
Reserve for discontinued operations (Note 10)
|
72.2
|
|
63.2
|
|
|||
|
Guarantees of vendor financing (Note 19)
|
—
|
|
0.2
|
|
|||
|
Unfavorable contracts
(2)
|
327.6
|
|
243.9
|
|
|||
|
Other long-term liabilities
|
72.4
|
|
61.1
|
|
|||
|
Total
|
$
|
749.1
|
|
$
|
718.1
|
|
|
____________________
|
(1)
|
Represents the accounts receivable of the legal entity stock sales as part of the DuPont Crop Protection Acquisition. As part of the Transaction Agreement, this balance will be settled subsequent to the closing date through reimbursement between FMC and DuPont. Amount represents the offsetting liability recorded for amounts due back to DuPont.
|
|
(2)
|
Primarily represents the technical insecticide product supply agreements with DuPont for use in their retained seed treatment business. Refer to Note 4 for more details.
|
|
(3)
|
Other accrued and other liabilities in 2018 includes the gross up of the estimated sales returns as part of our adoption of the new revenue standard. The impact of the adoption increased accrued and other liabilities by
$49.7 million
. Refer to Note 2 for further information.
|
|
(4)
|
Represents noncurrent portion of overall transition tax to be paid over
eight years
.
|
112
Note 22: Quarterly Financial Information (Unaudited)
|
(in Millions, Except Share and Per Share Data)
|
2018
|
2017
|
|||||||||||||||||||||||||||||
|
1Q
|
2Q
|
3Q
|
4Q
|
1Q
|
2Q
|
3Q
|
4Q
|
||||||||||||||||||||||||
|
Revenue
|
$
|
1,210.7
|
|
$
|
1,262.3
|
|
$
|
1,035.6
|
|
$
|
1,219.2
|
|
$
|
596.0
|
|
$
|
656.8
|
|
$
|
646.2
|
|
$
|
979.6
|
|
|||||||
|
Gross margin
|
554.7
|
|
544.1
|
|
446.2
|
|
541.9
|
|
216.2
|
|
234.4
|
|
265.9
|
|
384.8
|
|
|||||||||||||||
|
Income (loss) from continuing operations before equity in (earnings) loss of affiliates, non-operating pension and postretirement charges (income), interest expense, net and income taxes
|
366.1
|
|
174.7
|
|
141.8
|
|
197.9
|
|
65.4
|
|
65.0
|
|
74.1
|
|
73.5
|
|
|||||||||||||||
|
Income (loss) from continuing operations
(1)
|
263.1
|
|
138.5
|
|
79.5
|
|
173.8
|
|
45.0
|
|
48.7
|
|
70.9
|
|
(247.9
|
)
|
|||||||||||||||
|
Discontinued operations, net of income taxes
(2)
|
6.5
|
|
(6.0
|
)
|
(4.7
|
)
|
(139.2
|
)
|
(168.8
|
)
|
26.6
|
|
(15.1
|
)
|
779.0
|
|
|||||||||||||||
|
Net income (loss)
|
$
|
269.6
|
|
$
|
132.5
|
|
$
|
74.8
|
|
$
|
34.6
|
|
$
|
(123.8
|
)
|
$
|
75.3
|
|
$
|
55.8
|
|
$
|
531.1
|
|
|||||||
|
Less: Net income (loss) attributable to noncontrolling interests
|
2.4
|
|
2.8
|
|
2.0
|
|
2.2
|
|
0.4
|
|
0.6
|
|
0.6
|
|
1.0
|
|
|||||||||||||||
|
Net income (loss) attributable to FMC stockholders
|
$
|
267.2
|
|
$
|
129.7
|
|
$
|
72.8
|
|
$
|
32.4
|
|
$
|
(124.2
|
)
|
$
|
74.7
|
|
$
|
55.2
|
|
$
|
530.1
|
|
|||||||
|
Amounts attributable to FMC stockholders:
|
|||||||||||||||||||||||||||||||
|
Continuing operations, net of income taxes
|
$
|
260.7
|
|
$
|
135.7
|
|
$
|
77.5
|
|
$
|
171.6
|
|
$
|
44.5
|
|
$
|
48.2
|
|
$
|
70.4
|
|
$
|
(249.0
|
)
|
|||||||
|
Discontinued operations, net of income taxes
|
6.5
|
|
(6.0
|
)
|
(4.7
|
)
|
(139.2
|
)
|
(168.7
|
)
|
26.5
|
|
(15.2
|
)
|
779.1
|
|
|||||||||||||||
|
Net income (loss)
|
$
|
267.2
|
|
$
|
129.7
|
|
$
|
72.8
|
|
$
|
32.4
|
|
$
|
(124.2
|
)
|
$
|
74.7
|
|
$
|
55.2
|
|
$
|
530.1
|
|
|||||||
|
Basic earnings (loss) per common share attributable to FMC stockholders
(3)
:
|
|||||||||||||||||||||||||||||||
|
Continuing operations
|
$
|
1.93
|
|
$
|
1.00
|
|
$
|
0.57
|
|
$
|
1.28
|
|
$
|
0.33
|
|
$
|
0.36
|
|
$
|
0.52
|
|
$
|
(1.85
|
)
|
|||||||
|
Discontinued operations
|
0.05
|
|
(0.04
|
)
|
(0.03
|
)
|
(1.04
|
)
|
(1.26
|
)
|
0.20
|
|
(0.11
|
)
|
5.79
|
|
|||||||||||||||
|
Basic net income (loss) per common share
|
$
|
1.98
|
|
$
|
0.96
|
|
$
|
0.54
|
|
$
|
0.24
|
|
$
|
(0.93
|
)
|
$
|
0.56
|
|
$
|
0.41
|
|
$
|
3.94
|
|
|||||||
|
Diluted earnings (loss) per common share attributable to FMC stockholders
(3)
:
|
|||||||||||||||||||||||||||||||
|
Continuing operations
|
$
|
1.91
|
|
$
|
1.00
|
|
$
|
0.57
|
|
$
|
1.27
|
|
$
|
0.33
|
|
$
|
0.36
|
|
$
|
0.52
|
|
$
|
(1.85
|
)
|
|||||||
|
Discontinued operations
|
0.05
|
|
(0.04
|
)
|
(0.03
|
)
|
(1.03
|
)
|
(1.25
|
)
|
0.20
|
|
(0.11
|
)
|
5.79
|
|
|||||||||||||||
|
Diluted net income (loss) per common share
|
$
|
1.96
|
|
$
|
0.96
|
|
$
|
0.54
|
|
$
|
0.24
|
|
$
|
(0.92
|
)
|
$
|
0.56
|
|
$
|
0.41
|
|
$
|
3.94
|
|
|||||||
|
Weighted average shares outstanding:
|
|||||||||||||||||||||||||||||||
|
Basic
|
134.6
|
|
134.8
|
|
134.9
|
|
133.7
|
|
134.0
|
|
134.2
|
|
134.4
|
|
134.5
|
|
|||||||||||||||
|
Diluted
|
136.2
|
|
136.2
|
|
136.4
|
|
135.1
|
|
135.1
|
|
135.6
|
|
135.9
|
|
134.5
|
|
|||||||||||||||
____________________
|
(1)
|
The Company recorded a provisional income tax expense of
$315.9 million
as a result of the enactment of the Act during the fourth quarter of 2017. See Note 12 for more details.
|
|
(2)
|
In the first quarter of 2017, we recorded an impairment charge associated with our discontinued Omega-3 business. In the fourth quarter of 2017, we recorded a gain on sale of the FMC Health and Nutrition business. See Note 10 for more details.
|
|
(3)
|
The sum of quarterly earnings per common share may differ from the full-year amount.
|
113
Report of Independent Registered Public Accounting Firm
To the Stockholders and Board of Directors
FMC Corporation:
Opinion on the Consolidated
Financial Statements
We have audited the accompanying consolidated balance sheets of FMC Corporation and subsidiaries (the Company) as of December 31, 2018 and 2017, the related consolidated statements of income (loss), comprehensive income (loss), changes in equity, and cash flows for each of the years in the three‑year period ended December 31, 2018, and the related notes and financial statement schedule II - valuation and qualifying accounts and reserves (collectively, the consolidated financial statements). In our opinion, the consolidated financial statements present fairly, in all material respects, the financial position of the Company as of December 31, 2018 and 2017, and the results of its operations and its cash flows for each of the years in the three‑year period ended December 31, 2018, in conformity with U.S. generally accepted accounting principles.
We also have audited, in accordance with the standards of the Public Company Accounting Oversight Board (United States) (PCAOB), the Company’s internal control over financial reporting as of December 31, 2018, based on criteria established in
Internal Control - Integrated Framework (2013)
issued by the Committee of Sponsoring Organizations of the Treadway Commission, and our report dated February 28, 2019 expressed an unqualified opinion on the effectiveness of the Company’s internal control over financial reporting.
Basis for Opinion
These consolidated financial statements are the responsibility of the Company’s management. Our responsibility is to express an opinion on these consolidated financial statements based on our audits. We are a public accounting firm registered with the PCAOB and are required to be independent with respect to the Company in accordance with the U.S. federal securities laws and the applicable rules and regulations of the Securities and Exchange Commission and the PCAOB.
We conducted our audits in accordance with the standards of the PCAOB. Those standards require that we plan and perform the audit to obtain reasonable assurance about whether the consolidated financial statements are free of material misstatement, whether due to error or fraud. Our audits included performing procedures to assess the risks of material misstatement of the consolidated financial statements, whether due to error or fraud, and performing procedures that respond to those risks. Such procedures included examining, on a test basis, evidence regarding the amounts and disclosures in the consolidated financial statements. Our audits also included evaluating the accounting principles used and significant estimates made by management, as well as evaluating the overall presentation of the consolidated financial statements. We believe that our audits provide a reasonable basis for our opinion.
/
s
/ KPMG LLP
We have served as the Company's auditor since 1928.
Philadelphia, Pennsylvania
February 28, 2019
114
MANAGEMENT’S ANNUAL REPORT ON INTERNAL CONTROL OVER FINANCIAL REPORTING
Management is responsible for establishing and maintaining adequate internal control over financial reporting as defined in Exchange Act Rule 13a-15(f). FMC’s internal control over financial reporting is a process designed to provide reasonable assurance regarding the reliability of financial reporting and the preparation of financial statements for external purposes in accordance with U.S. generally accepted accounting principles. Internal control over financial reporting includes those written policies and procedures that:
|
•
|
pertain to the maintenance of records that, in reasonable detail, accurately and fairly reflect the transactions and dispositions of the assets of FMC;
|
|
•
|
provide reasonable assurance that transactions are recorded as necessary to permit preparation of financial statements in accordance with U.S. generally accepted accounting principles;
|
|
•
|
provide reasonable assurance that receipts and expenditures of FMC are being made only in accordance with authorization of management and directors of FMC; and
|
|
•
|
provide reasonable assurance regarding prevention or timely detection of unauthorized acquisition, use or disposition of assets that could have a material effect on the consolidated financial statements.
|
Internal control over financial reporting includes the controls themselves, monitoring and internal auditing practices and actions taken to correct deficiencies as identified.
Because of its inherent limitations, internal control over financial reporting may not prevent or detect misstatements. Also, projections of any evaluation of effectiveness to future periods are subject to the risk that controls may become inadequate because of changes in conditions, or that the degree of compliance with the policies or procedures may deteriorate.
We assessed the effectiveness of our internal control over financial reporting as of
December 31, 2018
. We based this assessment on criteria for effective internal control over financial reporting described in “Internal Control—Integrated Framework (COSO 2013)” issued by the Committee of Sponsoring Organizations of the Treadway Commission. Management’s assessment included an evaluation of the design of our internal control over financial reporting and testing of the operational effectiveness of our internal control over financial reporting. We reviewed the results of our assessment with the Audit Committee of our Board of Directors.
Based on this assessment, we determined that, as of
December 31, 2018
, FMC has effective internal control over financial reporting.
KPMG LLP, our independent registered public accounting firm, has issued an attestation report on the effectiveness of internal control over financial reporting as of
December 31, 2018
, which appears on the following page.
115
Report of Independent Registered Public Accounting Firm
The Board of Directors and Stockholders
FMC Corporation:
Opinion on Internal Control Over Financial Reporting
We have audited FMC Corporation and subsidaries’ (the Company) internal control over financial reporting as of December 31, 2018, based on criteria established in
Internal Control - Integrated Framework (2013)
issued by the Committee of Sponsoring Organizations of the Treadway Commission. In our opinion, the Company maintained, in all material respects, effective internal control over financial reporting as of December 31, 2018, based on criteria established in
Internal Control - Integrated Framework (2013)
issued by the Committee of Sponsoring Organizations of the Treadway Commission.
We also have audited, in accordance with the standards of the Public Company Accounting Oversight Board (United States) (PCAOB), the consolidated balance sheets of the Company as of December 31, 2018 and 2017, the related consolidated statements of income (loss), comprehensive income (loss), changes in equity, and cash flows for each of the years in the three-year period ended December 31, 2018, and related notes and financial statement schedule II - valuation and qualifying accounts and reserves (collectively, the consolidated financial statements), and our report dated February 28, 2019 expressed an unqualified opinion on those consolidated financial statements.
Basis for Opinion
The Company’s management is responsible for maintaining effective internal control over financial reporting and for its assessment of the effectiveness of internal control over financial reporting, included in the accompanying Management’s Annual Report on Internal Control Over Financial Reporting. Our responsibility is to express an opinion on the Company’s internal control over financial reporting based on our audit. We are a public accounting firm registered with the PCAOB and are required to be independent with respect to the Company in accordance with the U.S. federal securities laws and the applicable rules and regulations of the Securities and Exchange Commission and the PCAOB.
We conducted our audit in accordance with the standards of the PCAOB. Those standards require that we plan and perform the audit to obtain reasonable assurance about whether effective internal control over financial reporting was maintained in all material respects. Our audit of internal control over financial reporting included obtaining an understanding of internal control over financial reporting, assessing the risk that a material weakness exists, and testing and evaluating the design and operating effectiveness of internal control based on the assessed risk. Our audit also included performing such other procedures as we considered necessary in the circumstances. We believe that our audit provides a reasonable basis for our opinion.
Definition and Limitations of Internal Control Over Financial Reporting
A company’s internal control over financial reporting is a process designed to provide reasonable assurance regarding the reliability of financial reporting and the preparation of financial statements for external purposes in accordance with generally accepted accounting principles. A company’s internal control over financial reporting includes those policies and procedures that (1) pertain to the maintenance of records that, in reasonable detail, accurately and fairly reflect the transactions and dispositions of the assets of the company; (2) provide reasonable assurance that transactions are recorded as necessary to permit preparation of financial statements in accordance with generally accepted accounting principles, and that receipts and expenditures of the company are being made only in accordance with authorizations of management and directors of the company; and (3) provide reasonable assurance regarding prevention or timely detection of unauthorized acquisition, use, or disposition of the company’s assets that could have a material effect on the financial statements.
Because of its inherent limitations, internal control over financial reporting may not prevent or detect misstatements. Also, projections of any evaluation of effectiveness to future periods are subject to the risk that controls may become inadequate because of changes in conditions, or that the degree of compliance with the policies or procedures may deteriorate.
/s/ KPMG LLP
Philadelphia, Pennsylvania
February 28, 2019
116
FMC CORPORATION
SCHEDULE II - VALUATION AND QUALIFYING ACCOUNTS AND RESERVES
|
Provision (Benefit)
|
||||||||||||||||
|
(in Millions)
|
Balance,
Beginning
of Year
|
Charged to Costs and Expenses
|
Charged to Other Comprehensive Income
|
Net recoveries, write-offs and other
(1)
|
Balance,
End of
Year
|
|||||||||||
|
December 31, 2018
|
||||||||||||||||
|
Reserve for doubtful accounts
(2) (3)
|
$
|
85.8
|
|
71.3
|
|
—
|
|
(74.2
|
)
|
$
|
82.9
|
|
||||
|
Deferred tax valuation allowance
|
272.0
|
|
(6.7
|
)
|
(1.8
|
)
|
—
|
|
263.5
|
|
||||||
|
December 31, 2017
|
||||||||||||||||
|
Reserve for doubtful accounts
(2)
|
$
|
66.7
|
|
22.1
|
|
—
|
|
(3.0
|
)
|
$
|
85.8
|
|
||||
|
Deferred tax valuation allowance
|
289.6
|
|
(20.2
|
)
|
2.6
|
|
—
|
|
272.0
|
|
||||||
|
December 31, 2016
|
||||||||||||||||
|
Reserve for doubtful accounts
|
$
|
43.1
|
|
21.9
|
|
—
|
|
1.7
|
|
$
|
66.7
|
|
||||
|
Deferred tax valuation allowance
|
273.2
|
|
19.8
|
|
(3.4
|
)
|
—
|
|
289.6
|
|
||||||
____________________
|
(1)
|
Write-offs are net of recoveries.
|
|
(2)
|
Includes short-term and long-term portion.
|
|
(3)
|
Includes the charge and write-off of approximately
$42 million
associated with the stranded accounts receivables written off as part of the restructuring in India. The charge was recorded as a component of "Restructuring and other charges (income)" on the consolidated statements of income (loss). Refer to Note 8 for further information.
|
|
ITEM 9.
|
CHANGES IN AND DISAGREEMENTS WITH ACCOUNTANTS ON ACCOUNTING AND FINANCIAL DISCLOSURE
|
None.
ITEM 9A. CONTROLS AND PROCEDURES
(a) Evaluation of disclosure controls and procedures. Based on management’s evaluation (with the participation of the Company’s Chief Executive Officer and Chief Financial Officer), the Chief Executive Officer and Chief Financial Officer have concluded that, as of the end of the period covered by this report, the Company’s disclosure controls and procedures (as defined in Rules 13a-15(e) and 15d-15(e) under the Securities Exchange Act of 1934) are effective to provide reasonable assurance that information required to be disclosed by the Company in reports filed or submitted under the Securities Exchange Act of 1934 is recorded, processed, summarized and reported within the time periods specified in the SEC’s rules and forms and is accumulated and communicated to management, including our principal executive officer and principal financial officer, as appropriate to allow timely decisions regarding required disclosure.
Management’s annual report on internal control over financial reporting. Refer to Management’s Report on Internal Control Over Financial Reporting which is included in Item 8 of Part II of this Annual Report on Form 10-K and is incorporated by reference to this Item 9A.
Audit report of the independent registered public accounting firm. Refer to Report of Independent Registered Public Accounting Firm which is included in Item 8 of Part II of this Annual Report on Form 10-K and is incorporated by reference to this Item 9A.
(b) Change in Internal Controls. There have been no changes in internal controls over financial reporting that occurred during the quarter ended December 31, 2018 that materially affected or are reasonably likely to materially affect our internal control over financing reporting.
ITEM 9B. OTHER INFORMATION
None.
117
PART III
ITEM 10. DIRECTORS, EXECUTIVE OFFICERS AND CORPORATE GOVERNANCE
Information concerning directors, appearing under the caption “III. Board of Directors” in our Proxy Statement to be filed with the SEC in connection with the Annual Meeting of Stockholders scheduled to be held on
April 30, 2019
(the “Proxy Statement”), information concerning executive officers, appearing under the caption “Item 4A. Executive Officers of the Registrant” in Part I of this Annual Report on Form 10-K, information concerning the Audit Committee, appearing under the caption “IV. Information About the Board of Directors and Corporate Governance - Committees and Independence of Directors - Audit Committee” in the Proxy Statement, information concerning the Code of Ethics, appearing under the caption “IV. Information About the Board of Directors and Corporate Governance - Corporate Governance - Code of Ethics and Business Conduct Policy” in the Proxy Statement, and information about compliance with Section 16(a) of the Securities Exchange Act of 1934 appearing under the caption “VII. Other Matters - Section 16(a) Beneficial Ownership Reporting Compliance” in the Proxy Statement, is incorporated herein by reference in response to this Item 10.
ITEM 11. EXECUTIVE COMPENSATION
The information contained in the Proxy Statement in the section titled “VI. Executive Compensation” with respect to executive compensation, in the section titled “IV. Information About the Board of Directors and Corporate Governance—Director Compensation” and “—Corporate Governance—Compensation and Organization Committee Interlocks and Insider Participation” is incorporated herein by reference in response to this Item 11.
|
ITEM 12.
|
SECURITY OWNERSHIP OF CERTAIN BENEFICIAL OWNERS AND MANAGEMENT AND RELATED STOCKHOLDER MATTERS
|
The information contained in the section titled “V. Security Ownership of FMC Corporation” in the Proxy Statement, with respect to security ownership of certain beneficial owners and management, is incorporated herein by reference in response to this Item 12.
Equity Compensation Plan Information
The table below sets forth information with respect to compensation plans under which equity securities of FMC are authorized for issuance as of
December 31, 2018
. All of the equity compensation plans pursuant to which we are currently granting equity awards have been approved by stockholders.
(Shares in thousands)
|
Plan Category
|
Number of Securities to be issued upon exercise of outstanding options and restricted stock awards (A)
(2)
|
Weighted-average exercise price of outstanding options awards (B)
(1)
|
Number of Securities remaining available for future issuance under equity compensation plans (excluding securities reflected in column (A)) (C)
|
|||||||
|
Equity Compensation Plans approved by stockholders
|
3,406
|
|
$
|
52.87
|
|
4,900
|
|
|||
____________________
|
(1)
|
Taking into account all outstanding awards included in this table, the weighted-average exercise price of such stock options is
$52.87
and the weighted-average term-to-expiration is
6.0 years
.
|
|
(2)
|
Includes
2,364 thousand
stock options and
794 thousand
restricted stock awards granted to employees and
248 thousand
restricted stock units held by directors.
|
|
ITEM 13.
|
CERTAIN RELATIONSHIPS AND RELATED TRANSACTIONS, AND DIRECTOR INDEPENDENCE
|
The information contained in the Proxy Statement concerning our independent directors and related party transactions under the caption “IV. Information About the Board of Directors and Corporate Governance—Committees and Independence of Directors,” and the information contained in the Proxy Statement concerning our related party transactions policy, appearing under the caption “IV. Information About the Board of Directors and Corporate Governance—Corporate Governance—Related Party Transactions Policy,” is incorporated herein by reference in response to this Item 13.
118
ITEM 14. PRINCIPAL ACCOUNTANT FEES AND SERVICES
The information contained in the Proxy Statement in the section titled “II. The Proposals to be Voted On—Ratification of Appointment of Independent Registered Public Accounting Firm” is incorporated herein by reference in response to this Item 14.
PART IV
ITEM 15. EXHIBITS AND FINANCIAL STATEMENT SCHEDULES
|
(a)
|
Documents filed with this Report
|
1. Consolidated financial statements of FMC Corporation and its subsidiaries are incorporated under Item 8 of this Form 10-K.
2. The following supplementary financial information is filed in this Form 10-K:
|
|
Page
|
|
Financial Statements Schedule II – Valuation and qualifying accounts and reserves for the years ended December 31, 2018, 2017 and 2016
|
|
The schedules not included herein are omitted because they are not applicable or the required information is presented in the financial statements or related notes.
3. Exhibits – The following exhibits are filed as a part of, or incorporated by reference into, this Form 10-K:
|
(b)
|
Exhibits
|
|
Exhibit No.
|
Exhibit Description
|
|
|
(2
|
)
|
Plan of acquisition, reorganization, arrangement, liquidation or succession
|
|
*2.1a
|
|
|
|
*2.1b
|
|
|
|
*2.1c
|
|
|
|
(3
|
)
|
Articles of Incorporation and By-Laws
|
|
*3.1
|
|
|
|
*3.2
|
|
|
|
(4
|
)
|
Instruments defining the rights of security holders, including indentures.
FMC Corporation undertakes to furnish to the SEC upon request, a copy of any instrument defining the rights of holders of long-term debt of FMC Corporation and its consolidated subsidiaries and for any of its unconsolidated subsidiaries for which financial statements are required to be filed.
|
|
*4.1
|
|
|
|
*4.2
|
|
|
|
*4.3
|
|
|
|
*4.4
|
|
|
|
(10
|
)
|
Material contracts
|
119
|
*10.1
|
|
|
|
*10.1a
|
|
|
|
*10.1b
|
|
|
|
*10.1c
|
|
|
|
*10.1d
|
|
|
|
*10.1e
|
|
|
|
*10.1f
|
|
|
|
*10.1g
|
|
|
|
*10.1h
|
|
|
|
*10.1i
|
|
|
|
*10.1j
|
|
|
|
*10.1k
|
|
|
|
*10.2
|
|
|
|
†*10.3
|
|
|
|
†*10.3.a
|
|
|
120
|
†*10.3.b
|
|
|
|
†*10.4
|
|
|
|
†*10.5
|
|
|
|
†*10.6
|
|
|
|
†*10.7
|
|
|
|
†* 10.7.a
|
|
|
|
†* 10.7.b
|
|
|
|
†*10.7.c
|
|
|
|
†*10.7.d
|
|
|
|
†*10.7.e
|
|
|
|
†*10.7.f
|
|
|
|
†*10.7.g
|
|
|
|
†*10.8
|
|
|
|
†*10.8a
|
|
|
|
†*10.8b
|
|
|
|
†*10.8c
|
|
|
|
*10.8d
|
|
|
|
†*10.9
|
|
|
|
†*10.10
|
|
|
|
†*10.11
|
|
|
|
†*10.12
|
|
|
121
|
*10.13
|
|
|
|
*10.13.a
|
|
|
|
*10.13.b
|
|
|
|
*10.13.c
|
|
|
|
*10.13.d
|
|
|
|
*10.14
|
|
|
|
†*10.15
|
|
|
|
†*10.15.a
|
|
|
|
†*10.16
|
|
|
|
*10.17
|
|
|
|
*10.18
|
|
|
|
*10.19
|
|
|
|
*10.20
|
|
|
|
*10.21
|
|
|
|
†10.22
|
|
|
|
*10.23
|
|
|
|
†*10.24
|
|
|
|
†*10.25
|
|
|
|
†*10.26
|
|
|
|
†10.27
|
|
|
|
†10.28
|
|
|
|
21
|
|
|
|
23.1
|
|
|
|
31.1
|
|
|
|
31.2
|
|
|
122
|
32.1
|
|
|
|
32.2
|
|
|
|
101
|
|
Interactive Data File
|
* Incorporated by reference
† Management contract or compensatory plan or arrangement
123
|
ITEM 16.
|
FORM 10-K SUMMARY
|
Optional disclosure, not included in this Report.
124
SIGNATURES
Pursuant to the requirements of Section 13 or 15(d) of the Securities Exchange Act of 1934, the Registrant has duly caused this report to be signed on its behalf by the undersigned, thereunto duly authorized.
FMC CORPORATION
(Registrant)
|
By:
|
/S/ ANDREW D. SANDIFER
|
|
Andrew D. Sandifer
Executive Vice President and Chief Financial Officer
|
|
Date:
February 28, 2019
Pursuant to the requirements of the Securities Exchange Act of 1934, this report has been signed below by the following persons on behalf of the Registrant and in the capacities and on the date indicated.
|
Signature
|
Title
|
Date
|
|
/S/
ANDREW D. SANDIFER
Andrew D. Sandifer
|
Executive Vice President and
Chief Financial Officer
|
February 28, 2019
|
|
/S/ N
ICHOLAS
L. P
FEIFFER
Nicholas L. Pfeiffer
|
Vice President, Corporate Controller and
Chief Accounting Officer
|
February 28, 2019
|
|
/S/ P
IERRE
R. B
RONDEAU
Pierre R. Brondeau
|
Chief Executive
Officer and Chairman of the Board
|
February 28, 2019
|
|
/S/ G. P
ETER
D’A
LOIA
G. Peter D’Aloia
|
Director
|
February 28, 2019
|
|
/S/ E
DUARDO
E. C
ORDEIRO
Eduardo E. Cordeiro
|
Director
|
February 28, 2019
|
|
/S/ C. S
COTT
G
REER
C. Scott Greer
|
Director
|
February 28, 2019
|
|
/S/ D
IRK
A. K
EMPTHORNE
Dirk A. Kempthorne
|
Director
|
February 28, 2019
|
|
/S/ P
AUL
J. N
ORRIS
Paul J. Norris
|
Director
|
February 28, 2019
|
|
/S/ R
OBERT
C. P
ALLASH
Robert C. Pallash
|
Director
|
February 28, 2019
|
|
/S/ V
INCENT
R. V
OLPE
, J
R
.
Vincent R. Volpe, Jr.
|
Director
|
February 28, 2019
|
|
/S/
W
ILLIAM
H. P
OWELL
William H. Powell
|
Director
|
February 28, 2019
|
|
/S/
MARGARETH OEVRUM
Margareth Oevrum |
Director
|
February 28, 2019
|
|
/S/
K'L
YNNE
J
OHNSON
K'Lynne Johnson
|
Director
|
February 28, 2019
|
125
TABLE OF CONTENTS
Part IItem 1. BusinessItem 1A. Risk FactorsItem 1B. Unresolved Staff CommentsItem 2. PropertiesItem 3. Legal ProceedingsItem 4. Mine Safety DisclosuresItem 4A. Executive Officers Of The RegistrantPart IIItem 5. Market For The Registrant's Common Equity, Related Stockholders Matters and Issuer Purchases Of Equity SecuritiesItem 6. Selected Financial DataItem 7. Management's Discussion and Analysis Of Financial Condition and Results Of OperationsItem 7A. Quantitative and Qualitative Disclosures About Market RiskItem 8. Financial Statements and Supplementary DataNote 1: Principal Accounting Policies and Related Financial InformationNote 2: Recently Issued and Adopted Accounting Pronouncements and Regulatory ItemsNote 3: Revenue RecognitionNote 4: AcquisitionsNote 5: Goodwill and Intangible AssetsNote 6: InventoriesNote 7: Property, Plant and EquipmentNote 8: Restructuring and Other Charges (income)Note 9: ReceivablesNote 10: Discontinued OperationsNote 11: Environmental ObligationsNote 12: Income TaxesNote 13: DebtNote 14: Pension and Other Postretirement BenefitsNote 15: Share-based CompensationNote 16: EquityNote 17: Earnings Per ShareNote 18: Financial Instruments, Risk Management and Fair Value MeasurementsNote 19: Guarantees, Commitments and ContingenciesNote 20: Segment InformationNote 21: Supplemental InformationNote 22: Quarterly Financial Information (unaudited)Item 9. Changes in and Disagreements with Accountants on Accounting and Financial DisclosureItem 9A. Controls and ProceduresItem 9B. Other InformationPart IIIItem 10. Directors, Executive Officers and Corporate GovernanceItem 11. Executive CompensationItem 12. Security Ownership Of Certain Beneficial Owners and Management and Related Stockholder MattersItem 13. Certain Relationships and Related Transactions, and Director IndependenceItem 14. Principal Accountant Fees and ServicesPart IVItem 15. Exhibits and Financial Statement SchedulesItem 16. Form 10-k Summary